Analysis of the Household Demand for Dairy Products in Sri Lanka: An Almost Ideal Estimation...
315
KDU INTERNATIONAL RESEARCH CONFERENCE – 2014 Expanding Development Horizons through Education, Research and Innovation Proceedings Management, social sciences & humanities General Sir John Kotelawala Defence University PO Box 32 Ratmalana Sri Lanka www.kdu.ac.lk
Transcript of Analysis of the Household Demand for Dairy Products in Sri Lanka: An Almost Ideal Estimation...
KDU INTERNATIONAL RESEARCH CONFERENCE – 2014
Expanding Development Horizons through Education,
Research and Innovation
Proceedings
Management, social sciences & humanities
General Sir John Kotelawala Defence University PO Box 32 Ratmalana Sri Lanka
www.kdu.ac.lk
ii
@ General Sir John Kotelawala Defence University
All rights reserved
This book contains the proceedings and a peer reviewed selection of papers presented at the International Research Conference 2014 of General Sir John Kotelawala Defence University (KDU) held on 21and 21 August 2014 at Ratmalana, Sri Lanka.
No part of this publication may be reproduced, stored in a retrieval system, or transmitted, in any form or by any means including electronic, electrostatic, magnetic tape, mechanical, photocopying, recording or otherwise, without the prior permission in writing of the publisher.
The contents published in this book do not reflect or imply the opinion of General Sir John
Kotelawala Defence University or any other agency of the Ministry of Defence and Urban
Development of the government of Sri Lanka. They reflect and imply the opinions of the
individual authors and speakers.
Editor Dr. (Mrs) RMNT Sirisoma ISBN Number: ISBN 978-955-0301-11-9 Other Proceedings of the Conference
Law : ISBN 978-955-0301-09-6
Medicine : ISBN 978-955-0301-13-3
Engineering and Technical Sciences : ISBN 978-955-0301-14-0
Allied Health Sciences : ISBN 978-955-0301-10-2 Defence : ISBN 978-955-0301-12-6
Published by General Sir John Kotelawala Defence University PO Box 32 Ratmalana Sri Lanka Tel : +94 112 632068 E-mail : [email protected] Website : www.kdu.ac.lk
Published date
February 2015
iii
CONFERENCE SUPREMACY
Major General Milinda Peiris RSP USP ndc psc, Vice Chancellor
STEERING COMMITTEE PRESIDENT
Brig ALDM Gunasekara RSP USP psc, Deputy Vice Chancellor (Defence and Admin)
CONFERENCE CHAIR
Dr. (Mrs) RMNT Sirisoma
CO - SECRETARIES
Miss. Thilini Meegaswatta
Miss. ADP Perera
STEERING COMMITTEE MEMBERS
Snr. Prof. Susirith Mendis, Deputy Vice Chancellor (Academic)
Brig NK Wadugodapitiya RSP psc
Col PTR Makuloluwa
Lt Col MGWWWMCB Wickramasinghe RWP RSP psc
Lt Col YABM Yahampath RWP RSP psc
Lt Col TA Peiris
Snr. Prof. HYR Perera
Snr. Prof. TR Weerasooriya
Prof. YK Weerakoon Banda
Prof. AS Karunananda
Dr. SWP Mahanamahewa
Dr. RMNT Sirisoma
iv
EDITORIAL COMMITTEE
PRESIDENT
Senior Prof. Susirith Mendis
COMMITTEE MEMBERS
Lt Col MGWWWMCB Wickramasinghe RWP RSP psc
Lt. Col. Chaminda Liyanage
Maj HTHP Dayarathna
Maj JDPK Abeywickrama
Sqn Ldr NAI De Silva
Snr. Prof. RN Pathirana
Snr. Prof. HYR Perera
Prof. YK Weerakoon Banda
Prof. AS Karunananda
Prof. Jayantha Jayawardhane
Dr. SWP Mahanamahewa
Dr. RMNT Sirisoma
Mr. WAAK Amaratunga
Mr. Mangala Wijesinghe
Ms. Thilini Meegaswatte

v
TABLE OF CONTENT
Foreword viii
Welcome Address x
Keynote Address xiii
Plenary Session
Youth Bulge for Sustainable Development: An Emerging Challenge for the 21st Century Sri
Lanka
Professor Indralal De Silva, Senior Professor, Department of Demography, University of
Colombo
2
Managing Supply Chains - Beyond the Basics: Use of Operation Research Tools
Professor Saman Bandara, Professor, Department of Civil Engineering, University of Moratuwa
5
Expanding Educational Horizons for Sustainable Development
Professor Marie Perera, Professor, Faculty of Education, University of Colombo
7
Managerial Innovations of the State University System in Sri Lanka: An Exploratory Study
Professor RLS Fernando, Department of Public Administration, Faculty of Management
Studies and Commerce at the University of Sri Jayewardenepura
12
Technical Sessions Strategy for Winning Medals at Elite Competitions in Athletics for Sri Lanka
KJCS Fernando
16
A Customer Relationship Management System for the MICE Industry in Sri Lanka – “MICESL”
Gayanthi de Silva, Gayathri Ranasinghe
24
Employee Motivation and Productivity Improvement in Sri Lankan Apparel Manufacturing
Sector
MHR Sandeepanie, EG Ubayachandra
31
Implementation of the 360 Degree Performance Appraisal Feedback System in Private
Sector Organizations in Sri Lanka
MRD De Silva
40
Is Stress a Bad Factor in Employee Work Performance (EWP) in Sri Lankan Public Sector?
Tilak Wijesundara, WAND Wijesinghe, Rangika Chinthani
45
Analysis of the Household Demand for Dairy Products in Sri Lanka: An Almost Ideal
Estimation with a Censored Regression
LDM Nimanthika, Jagath C Edirisinghe
49
Poverty and Perception: Driving Sri Lankan children’s homes at multiple levels
Eshantha Ariyadasa
57
The Role of Education on Agricultural Productivity in Sri Lanka
UG Rajapaksha, WM Semasinghe, DAC Silva
66
Indo-Sri Lanka Bilateral Relations: Analytical review on Political & Cultural Relations since
2005
Hasith Kandaudahewa
80
vi
Impact of Drug Addiction & its Dangerous Outcomes & the Future of Sri Lanka (A Buddhist
Perspective)
Ven.Moragaswewe Vijitha
86
Determinants of child labour in Sri Lanka
Rumesh Weerakoon, MDJW Wijesinghe
89
Factors Affecting the Patients’ Decision in Selecting a Hospital in Medical Emergency
Aruna Jayakody
98
Sociological Study on the Female Stereotypes in Sri Lankan TV Commercials
Gihani De Silva, Watsala Narampanawa
104
Disciplinary Enculturation in Critical Thinking: Do we Adopt a Strategic Approach?
Maya Gunawardena
111
Tertiary English Education: Are We Producing Lifelong Learners?
UD Senaratne, IK Weerakoon
118
The Effectiveness in Implementation of the National Plan for a Trilingual Sri Lanka: In
Relation to the Role of English in School level.
Dinithi Anuththara Hennayake
123
Stakeholder Needs in English for Legal Purposes for Sri Lankan Undergraduates
Chamila Kothalawala, Thamara Kothalawala, Chathurani Rathnayaka
131
The contribution of caregivers in Christian and Buddhist Preschools in respect of early
childhood care in Sri Lanka
KV Sudarma Harischandra
138
Factors Affecting to Distract the University Students Education in Sri Lanka
Jayawardana Ranjan D
145
Impact of Music on Education of Primary Students in Colombo district
EMA Dharmarathna,VABP Jayarathna
151
Animal Figures found from Mosaic designs at Karagampitiya Subodharamaya
Piyumi Embuldeniya
160
Fashion Syntax: Concept of Context Dependence
PVM Karunaratne
166
Trucking Industry Perceptions of Congestion Problems and Potential Solutions to Container
Transportation in Sri Lanka
Lalith Edirisinghe, Jin Zhihong
172
Determinants of Air Passenger Demand in Sri Lanka; A Case Study Based on Bandaranayake
International Airport
WAM Dilhari, LU Ranwala
181
The Study on Factors Affecting the Decline Of Freight Movement: The case of Sri Lanka
Railways
AHM Sabeen Sharic, GTF De Silva
189
Importance of Ethical Leadership in Public and Private Enterprises of Sri Lanka in Developing
and Global Contexts
Deepanie Perera
193
Impact of Granting Micro Finance Facilities on the Living Standards of the Rural Poor in Sri
Lanka
Gunathma Gunawardena
199
vii
A Review on Geometric Brownian motion for forecasting the Daily Share Prices in CSE
RM Kapila Tharanga Rathnayaka, Wei Jianguo, SC Nagahawaththa
210
Environmental Disclosure Practices of Manufacturing Industry –Evidence from Listed
Companies in the Colombo Stock Exchange (CSE) in Sri Lanka
TKG Sameera, PR Weerathunga
216
Box-Jenkins Approach for Out-of-Sample Forecasting of Stock Price Index: Evidence from
Colombo Stock Exchange
DMKN Seneviratna, D Chen, SC Nagahawatta
224
Risk Analysis of Governance in Community Development Projects
DSPC Karunasekara
231
Perception on credit cards for e-payment in e-government Services, Sri Lanka
HMBP Ranaweera
238
Determinants of the Factors Affecting the Customer Satisfaction in Super Market Industry of
Sri Lanka
SP Pubudu Pathirana, LU Ranwala
246
Online Shopping Behaviour of Young Adults in Higher Education Sector: How Brand Matters
WM Ruvini M. Weerasinghe, Anuradha Peramunugamage
254
Investigation on Functions and Product Structure of Islamic Banking vs Conventional
Banking in Sri Lanka: A Case Study
II Wijethunga, EMNN Ekanayake
260
IB Adoption in Sri Lanka: Analysis of Demographic Variables of Banking Customers
JM Wasantha Premarathne
267
Poster Presentations
Socio - Economic Implications on Southern Highway Project Special Reference to Evicted
People
Pramoda Sarojini
276
Empowering people through education from the perspective of Millennium Development
Goals
Shashikamal Kodithuwakku
283
The Role of Education as a Source of Human Capital on Rural Poverty: A Review of Literature UG Rajapaksha, WM Semasinghe, DAC Silva
290
viii
FOREWORD
The 7th
KDU International Research conference 2014 on the theme Expanding Developmental Horizons
through Education, Research and Innovation was organized by General Sir John Kotelawala Defence University
on 21 and 22 August 2014. The expansion of KDU in education, research and innovation under the leadership
of the Vice Chancellor, Major General Milinda Peiris has brought up the university into a leading university in
the country. The university comprises of nine faculties including the faculty of post graduate studies and there
is a separate Dean for the enhancement of the research culture in the university. KDU has taken many steps to
boost the research culture of the university. The KDU International Research Conference (KDU-IRC) is one of
the prominent events organized in every year making a great platform to national and international
researchers to publish their research work.
The event included six plenary sessions under disciplinary sub categories, each organized under a sub theme
followed by technical sessions in each discipline. The inaugural session was attended by eminent personalities
such as Foreign Diplomats, Dr Sarath Amunugama, Senior Minister of International Monetary Cooperation &
Deputy Minister of Finance & Planning, Tri-Service Commanders, Additional Secretaries, Chairperson of the
University Grants Commission, Vice Chancellors and distinguished academics from other universities,
representatives from countries like China, India, and Pakistan, Bangladesh and Maldives, and senior tri-service
officers.
The inaugural session was followed by the plenary session on Defence held on the subtheme, Expanding
Developmental Horizons through Education, Research and Innovations. The session was chaired by Prof. Rohan
Gunaratne, Head of the International Centre for Political Violence and Terrorism Research (ICPVTR)] at
Nanyang Technological University, Singapore. The plenary session on Medicine on the theme of Meeting the
Health Needs of Sri Lanka through Education, Research and Innovation, was co-chaired by Professor Nimal
Senanayake, Emeritus Professor of Medicine, Consultant Physician/Neurologist and Professor Janaka de Silva ,
Senior Professor and Chair of Medicine, Faculty of Medicine, University of Kelaniya. The plenary session on
Allied Health Sciences was held on the theme of Education, Research and Innovation for expanding
Horizons of Allied Health Sciences , chaired by Prof Narada Warnasuriya, Senior Professor, Faculty of Medicine,
KDU and one of former vice chancellors of University of Jayawardanepura. The Engineering Plenary Session
held on the theme, Achieving Development Goals through Research & Innovation in Engineering was chaired
by Mr. W.J.L.S. Fernando, President, Institution of Engineers Sri Lanka. The plenary session on Law was
conducted on the sub theme, Law and Development in 21 century. It was chaired by His Lordship, Honorable
Mohan Peiris, the Chief Justice of Sri Lanka, The plenary session on Management, Social Sciences and
Humanities was held on the sub theme, Sustainable Development through Integration of Multidisciplinary
Knowledge, and the session was chaired by the Chairperson of the University Grants Commission of Sri Lanka,
Professor (Mrs) Kshanika Hirimburegama.
KDU research conference has become increasingly popular among researchers in diverse fields of expertise,
and it is inspiring to note that the response for our call for research papers was highly encouraging. This year,
the committee received more than three hundred submissions of abstracts, which enabled us to select just
above 175 high quality papers to be presented at the conference. All the submitted abstracts and papers were
selected through a genuine double-blind reviewing process conducted by qualified academic and professional
experts. We are grateful to the expert panel of reviewers, who took enormous effort to screen papers of high
quality to be presented at the conference.
Because of the large number of papers committee decided to publish proceedings in six separate books in
respective discipline. This book of proceedings contains all the plenary presentations either as full papers or as
transcripts and the technical session papers presented at the conference in respective discipline. This
publication is the finale of the success of the KDU International Research Conference 2014 and hence it is
necessary to express our gratitude to all those who contributed for its success in numerous ways. First and
foremost, I wish to extend my thanks and sincere gratitude to the Chairman of the Board of Management of
ix
KDU, Mr. Gotabaya Rajapaksa and all the members of the Board. The support and the guidance of the Board of
Management of KDU have extended to KDU are indeed immeasurable.
Organizing a gigantic task of this nature would be impossible without proper leadership and teamwork.
Therefore, I would like to express my sincere thanks to the Vice Chancellor, Major General Milinda Peiris, for
the excellent leadership provided during the conceptualization, planning and execution of the conference; and
to the Deputy Vice Chancellor (Defence and Administration) Brigadier Lal Gunasekara for his invaluable
contribution as the steering committee president that ensured the smooth execution of this event, and to the
Deputy Vice Chancellor (Academics) Senior Professor Susirith Mendis for his guidance in finalizing papers.
Furthermore, I wish to acknowledge the services rendered by all the Deans of the faculties, the Heads of
organizing committees and their teams, faculty representatives, Adjutant, CO Administration, Registrar,
Bursar, Deputy Registrar, Assistant Registrar of faculty of Management Social Sciences & Humanities and all
other academic and administrative staff members. They ensured the availability of some of the best national
and international experts as plenary speakers, coordinated the tedious and time consuming review process
thus ensuring better quality papers for publication and organized the event in a grand level.
I also thank the technical session rapporteurs who provided us with the summaries contained herein. In
addition I would like to thank the Conference Secretaries Thilini Meegaswatte and Dilani Perera on their
assistance during the organizing work of the conference.
Finally, I appreciate the role played by Wing Commander Jayalal Lokupathirage, the Head of the Department of
Aeronautical Engineering for his commitment in organizing and coordinating all printing work of the
conference including this book of proceedings.
Dr. RMNT Sirisoma
Editor
x
WELCOME ADDRESS
Major General Milinda Peiris RWP RSP USP ndc psc MPhil PGDM
Vice Chancellor, General Sir John Kotelawala Defence University
Distinguished members of the audience,
ladies and gentlemen, it is my greatest pleasure as
the Vice Chancellor of General Sir John Kotelawala
Defence University to deliver the welcome and
introductory address of the KDU international
Research Conference 2014.
First, I am greatly honoured and pleased to
welcome Hon Dr Sarath Amunugama, Senior
Minister of International Monetary Cooperation
and Deputy Minister of Finance and Planning, who
accepted our invitation to grace this occasion as the
chief guest and to deliver the keynote address on
our theme “Expanding Developmental Horizons
through Education, Research and Innovation.” Sir, I
am sure that your address will set the right tone for
the deliberations of this international research
conference, which will be of immense significance
for Sri Lanka as well as for other countries that seek
development through education, research and
innovation.
Next, I warmly welcome Commander of
the SL Army, Lt Gen Daya Ratnayake, Commander
of the SL Navy, Vice Admiral Jayantha Perera,
Commander of the SL Air Force, Air Marshal Kolitha
Gunatilleke, Additional Secretary Civil Security and
Development Mrs Damayanthi Jayarathne, Treasury
Representative Mr Mahinda Saliya, Your
Excellencies of the Diplomatic Corps, Senior
Officers, the Chairperson of the University Grants
Commission Prof Kshanika Hirimburegana, Vice
Chancellors, distinguished scholars and eminent
personalities especially those representing our
friendly countries such as the world renowned
scientist Prof (Dr) Atta-ur-Rahman from Pakistan,
Maj Gen PS Mander from the Indian Army, Maj Gen
MD Zahidur Rahman from Bangladsh Army, Maj
Gen SM Saffudeen Ahamad, Director General
Bangladesh Institute of International and Strategic
Studies (BIISS) and Dr Smruti Pattanaik (IDSA),
Institute of Defence Studies and Analysis of
India. And I warmly welcome all the presenters
and participants whose contribution will be crucial
for the success of the KDU Research Conference
2014.
Ladies and gentlemen, five years after the
dawn of peace, Sri Lanka is steadily marching
towards development and economic prosperity
under the stable and inspiring stewardship of His
Excellency the President Mahinda Rajapaksa. The
country is no more groping in the dark; instead it is
following the clear and sound vision encapsulated
in Mahinda Chinthana: The Way Forward, which
gives foremost priority for education, research and
innovation as essential elements for sustainable
development. It is in this backdrop that KDU has
deeply pondered over its role and function as a
university and taken many initiatives to introduce
some crucial and innovative changes in higher
education to complement the nation’s attempt to
expand developmental horizons through education,
research and innovation.
KDU has proved that nothing is impossible
if done in the right spirit, dedication and
commitment. So our innovations in the field of
education have paid dividends for the country. A
few years ago, the scope of KDU was to produce
graduated officers for the armed forces. In contrast,
today, its outlook has undergone a vast change, and
it proudly caters to the nation’s higher educational
needs by providing opportunities for civilian day
scholars to follow high quality degree programmes
in a disciplined environment. Today, we offer every
opportunity for Sri Lankan as well as foreign
students to become well-sought-after graduates in
diverse fields. The target is to produce practically
oriented, well disciplined, and patriotic graduates
with soft skills essential for enhanced
employability.
We have also undertaken a few mega
projects that directly impact the expansion of
educational opportunities in the country. The
establishment of the southern campus of KDU at
Sooriyawewa in Hambantota targeting the
introduction of some unique degree programmes in
xi
the fields of Built Environment, Spatial Sciences etc
is a major undertaking targeting expansion of
educational opportunities to the periphery thereby
ensuring parity in higher education in the country.
KDU hospital, the first ever university
hospital in Sri Lanka with facilities for military and
civil patient services, clinical trials and high-end
laboratory testing, will be ready by August 2015,
and it will provide assistance in healthcare for
nation building. The establishment of the Faculty of
Allied Health Sciences of KDU is yet another
innovation that helps Sri Lanka to produce nurses,
physiotherapists, and other allied health
professionals whose service in developing the
nation would be of considerable value.
Ladies and gentlemen, the conventional
wisdom informs us that education expands
horizons of knowledge which in turn facilitates
innovation, and thus the rationale for expanding
educational opportunities in a country. KDU having
clearly understood its responsibility in this regard
works as an agent of change in several significant
areas in tertiary education in Sri Lanka. Accordingly,
we have dedicated ourselves to linking education
with research and innovation through several
important projects, programmes and initiatives. For
instance, KDU is developing its scientific research
wing under KDU Institute for Combinatorial
Advanced Research & Education known as KDU-
CARE. The objective is to discover, implement and
operate state-of-the-art scientific technologies
which would enhance KDU’s scientific education
and medical research capabilities.
KDU-CARE is progressing well and by now
it has commenced 11 scientific projects as public
private partnerships. We are in the process of
establishing KDU-CARE Technology Park in KDU
Southern Campus in Hambantota. Moreover, 4
factories – 2 in Sooriyawewa, one in Sewanagala
and another in the hill country – will be set up in
the coming months. We have attracted significant
amount of funds as investments for these ventures.
For the first time in Sri Lanka we will be
constructing a Good Manufacturing Practices
(GMP) certified manufacturing plant for producing
antibodies and vaccines especially focusing on the
production of anti venom for Sri Lankan poisonous
snake bites. Further, we have introduced a Dean
Research position first time in Sri Lanka to
invigorate the research culture in the university.
We have established a 24’X7’ research laboratory
and a state-of-the-art advanced proteomics and
genomics laboratory to facilitate the conduct of
high-end research at KDU.
We have also introduced attractive
incentives to encourage conduct of research,
publications in high impact peer reviewed journals,
and applications for patents. We believe that these
measures we take today will definitely pay
dividends for Sri Lanka in the near future.
The initiative taken by the Faculty of
Graduate Studies to offer opportunities to read for
research degrees at Master’s and PhD levels and
KDU CARE are expected to generate high caliber
researchers required for the country and its
development.
Ladies and gentlemen, I make this an
opportunity to make the humble claim that, all in
all, KDU is playing a leading role in expanding higher
educational opportunities in Sri Lanka thereby
making a considerable contribution to make Sri
Lanka a knowledge hub in Asia as envisaged in
Mahinda Chinthana.
Ladies and gentlemen, I should also
express our grateful thanks to HE the President and
his government for their blessings and
encouragement for our initiatives; to the Secretary
Defence, Mr Gotabaya Rajapaksa who is the tower
of strength for KDU for his invaluable guidance in
his capacity as the Chairman of the Board of
Management, KDU; Commanders of the Army,
Navy and Air Force, Additional Secretary, Civil
Security and Development, and the Treasury
Representative as members of the Board of
Management for their diverse contributions for the
upliftment of KDU.
Ladies and gentlemen, KDU’s annual
international conference is a major contribution to
the creation and dissemination of knowledge. The
conference links other universities both local and
foreign, higher educational institutions,
professional bodies and the industry by providing a
platform for their academics and professionals for
presentation and publication of research in many
fields of specialization.
It is heartening to note that this year the
conference secretariat received an overwhelming
xii
number of abstracts out of which 195 were
selected for presentation through a thorough peer
reviewing process. Let us look forward to
participating in highly fruitful plenary and technical
sessions that will be held today and tomorrow at
KDU.
Finally, let me conclude by once again
welcoming all the dignitaries, intellectuals, and
participants foreign and local and wishing that the
deliberations of this conference would mark a
positive contribution for the betterment of Sri
Lanka, as well as the rest of the world. I conclude by
wishing that KDU international Conference will be a
fruitful and memorable one for all presenters and
participants alike.
Thank you.
xiii
KEYNOTE ADDRESS
Expanding Development Horizons through Education, Research, and Innovation: In Relation to Defence and Defence Universities
Dr. Sarath Amunugama
Senior Minister of International Monetary Cooperation and Deputy Minister of Finance and Planning, Ministry
of Finance, Sri Lanka
I am most grateful to the Vice Chancellor of KDU for
inviting me to be here this morning and to speak to
you on the subject of the development paradigm
and education and science and technology. As we
all know, this is a very important subject and we in
Sri Lanka have quite a lot of experience in terms of
innovation in education and trying to relate
education to development. I want to begin with
Millennium Development Goals. You know that
heads of state met several years ago at the United
Nations and identified 15 basic goals which the call
the Millennium Development Goals. Which were to
be achieved by 2015. That was the basis of what
was called the Washington Consensus. While the
developed countries would find funding for growth
in developing countries, the developing countries,
or the leaders of the developing countries has
pledged to make every effort to reach those
developmental goals among which were education
and health. I am happy to say that of all the
countries that were involved in this MDG exercise-
after all now we are all close to 2015 and we can
evaluate whether we have succeeded in reaching
those goals or not- Sri Lanka figures as a very good
performance; gets very high marks in that
scorebook for achieving the MDGs. So we have
something to offer and discuss, when it comes to
the contribution made by social welfare, by
education, by health, to the development paradigm.
We must look at some of the theoretical arguments
regarding what is called comparative advantage
that is in the globalized economy, when we think of
economic development or economic growth, we
have to analyze of all the factors and advantages
that a country has, how do we position it in terms of
comparative advantage. Different countries have
different advantages. So in order to stimulate
growth, we have to somehow identify those assets,
those characteristics which give us comparative
advantage as against rival economies or as against
other competing economies. Now I want to refer
(which I had also referred to at the last Defence
Seminar) to the work done in the World Bank by the
research division of the World Bank, where they are
talking of what is called new structural economics.
And what is the basis of that. The first is that today
we are in a globalized economy. We cannot think of
the national economy if we want to think of high
growth of making the country rich and acquiring
wealth that all the people in that country can
benefit from that acquisition of wealth, which is
reflected in technical terms as GDP growth. Now in
Sri Lanka, we have a very enviable record, because
after the end of the war a little over five years ago,
we have had a very attractive GDP growth between
7-8 percentage points, which compares very
favourably, not only with the earlier leaders of
global growth, namely China and India- but also
with the traditional developed countries. As you
know we are just emerging from a global downturn,
global economic crisis, which first hit America, then
the European Union countries, and subsequently
impacted on the economies of China, India,
Vietnam and so on, which were largely dependent
on trade with these advanced economies.
Now in that context, Sri Lanka has done extremely
well, averaging 7.5 to 8 percent growth and is now a
member of the consortium of countries which are
now driving global growth. The IMF and World Bank
have estimated global growth to be in the region of
4 percent. Here, we are consistently reaching 7 to 8
percent growth which is very high. Now how do we
maintain that, what is the basis of that. So one is
our integration with the global economy. That is
number one. Number two, is as I mentioned, to try
to see within that global economy, what are our
specific strengths and what is our comparative
advantage. Number three, is to see what is the role
xiv
of the state in this growth process, particularly in
relation to comparative advantage. Now in the past,
there have been different approaches. Some have
felt that only the state should be doing this in the
past. That was not much of a success, because you
saw that very many state ventures were not
profitable, it dragged down the economy, and then
there was a shift to the open economics. It
sometime went to the other extreme. For example,
even after the fall of the Soviet Union, Harvard
University Professors were prescribing how the
Russian economy should be tailored. It came to
such an almost ridiculous situation where free
market economies were prescribed for the whole
new Russian state because by that time the Soviet
Union had disintegrated, the blueprints were being
made in the Harvard University. So that is the other
extreme. But today, we are looking at the interface.
What is the role of the state, and what is the role of
the private sector, and how can they jointly look
into or assist in the growth process. So that is the
third element. What is the mix between the state
and the private sector? Now in the fourth area, we
are looking at some aspects of how the state can
make a distinct contribution together of course to
help the private sector come into the picture. And
that is called the provision of infrastructure, of two
classes. One is what is called hard infrastructure,
and the other is called the soft infrastructure. I am
just giving a very broad definition. Hard
infrastructure is that you cannot really think of
benefitting from the globalized economy, unless
you have roads, ports, airports, guaranteed energy.
All those basic ingredients that will make your
economy competitive. Now if you take South Asia,
in a way I am sorry to say that only Sri Lanka can
guarantee 24/7 power supply. All other countries in
our region have power shedding. You cannot get
power all the time. We too went through that
period some time ago when we had to tell the
investors you better bring your generators along.
That is not a very nice way of greeting an investor.
But today Sri Lanka has achieved a situation where
we are in a position to guarantee a continuous
supply of power and we are hoping that over a
period of time to make power cheaper. Then we
have invested very heavily on roads, ports and
airports, so one aspect which is not the focus of this
seminar but very important is the investment in
hard infrastructure that is contributing to our
growth and that is now universally recognized as a
very positive development in Sri Lanka in the Post-
War period. Because we lost the possibility of
expanding the physical infrastructure for thirty
years. When a country is engaged in a destructive
war which we won thanks to our President and to
our distinguished army and other services
represented here, where we were able to defeat
terrorism comprehensively and catch-up on that
thirty year lacuna. But that is not the subject of
discussion in this seminar.
In this seminar we are talking about soft
infrastructure. A country must also engage in
creating the soft infrastructure that is necessary for
growth. That is in this development paradigm of
comparative advantage and many other things. In
the earlier seminar I spoke about our global
positioning and our geostrategic position, so we
need not go into that today. So we are thinking of
our comparative advantage in a globalized economy
where the state and the private sector works
together and now when we think of infrastructure
we are going now into the area of soft
infrastructure which means a modern educational
system that can help in the growth process. So that
is where we have to look at the question of
education. Now, I think it is more than obvious to all
of us, and certainly what we learn from professional
educationists, is that we must move towards a
scientific culture. The modern world of today and of
the future will move towards a scientific culture. So
our educational system has to be geared to
providing the wherewithal and the investment to
create a scientific culture in our economy. If we are
not willing to do that and make the necessary
investments our growth process itself will be
impeded.
If you look at the Sri Lankan experience in education
you can see that we have been moving towards it,
but moving rather slowly. In the first phase Sri
Lanka has a very enviable record because from the
1930s we have been emphasizing the role of
education. Before independence in the State
Council high priority was placed on providing
education not only in the urban centres, which is
the normal fashion in which education develops in
most other countries, but education which spread
out also to the rural areas. We generally call all that
the Kanangara reforms or the Free Education
Reforms, Sri Lanka underwent very progressive
educational reforms in the late 1930s and early 40s
when what was called the Free Education System
was set up. There were three pillars to that
xv
educational system which we have now forgotten.
One is, education free of cost, where all Sri Lankans
had the ability to go to a school, a state funded
school, or private schools at that time which got
government assistance, like the Buddhist
Theosophical Society, and they could get expect to
get an education at least up to secondary level free
of charge. But that was only one ingredient in that
package the second ingredient was education in the
English language. That was part of the reforms.
Third, was what was called the Central College
System, where there were residential colleges
dotted throughout the country where bright
children could attend and in any large audience in
Sri Lanka you will have many people who have built
their career on that system.
However, at a certain stage pressure was created
on the educational system by population growth.
The present government has had to revamp that
whole educational system where you push the
educational system towards a science culture. That
is what you now call the Mahindodaya System
where the government is going to reorganize the
whole educational structure where the country will
be dotted with a large number of science colleges
with dual languages and a large investment in
Information Technology. This requires a large
investment which is going to take some time. This
requires a public-private partnership which delivers
the necessary services to the people. This entire
transformation has to be driven by a scientific
culture.
When we were young I think Daya and all will
remember, it was very difficult to get a telephone.
When you are a young officer it was almost
impossible to get a telephone, you have to go to so
and so and so on. But today within ten minutes you
will get the mobile phones. There are 220 lakhs of
telephone circulating in this country. There are 2.7
million 27 lakhs of motor cycle in this country, of
the population of 20 million population, one million
three wheelers. We have over five thousand trolleys
which have gone into rural areas and other area.
So, transformation is taken place which means a
new scientific technology. In the past people could
not get to even their bicycle repair? They had
travelled a special place to repair it. But today we
are introducing a new science and technology
oriented culture which will create so many job
opportunities.
If you look at the agricultural sector, we cannot get
people to go back to the same old system of
agriculture. You take buffalos or have a blown or
going in a spinlock I mean that is simply not
possible. And as a result what is happening is that
in real terms our agricultural is expanding, but in
terms of share of GDP it is being reduced. That is a
normal phenomenon. As country grows the
agriculture sector shrinks in relation to GDP. In real
terms it expands, but more wealth is being created
in the manufacturing and the service sector. Our
service sector very much like tourism, like
construction, like infrastructure development,
financial services are expanding in terrific way. We
want to make Sri Lanka a hub in Asia and that is our
next step. To make it a knowledge hub we have to
make it to a joint enterprise. Earlier the state had to
do everything but today state is not a position to
make all these investments. So it has to be shared.
I’ m very glad that the chairman of the UGC is also
here, because somewhere it has be shared, because
we have to confront that problem.
Lastly, many of our young people go to foreign
universities. Our education system is better than
the education systems of some of these countries.
Lots of middle class people are spending money to
send their children abroad. This is because the
state system has not expanded enough to include
these people. Now as we just heard from the Vice
Chancellor of this university there are other new
areas where we will have to expand our tertiary and
university education to gather this vast potential of
scientific oriented people who will otherwise be
utterly frustrated prevented from doing their higher
studies because of policy difficulties. So we have to
change the policy to make Sri Lanka an education
hub and that is the next step to be undertaken.
While we have a very innovative garment sector
and are going up to the top end of the garment
industry in the process of becoming a middle
income country we did not get the GSP +, the
preferential tariffs which were given to certain
countries, particularly by the European Union. The
US preferential tariffs still remain. But our garment
industry has adapted itself. It is very good example
of modern technology being used, high-end
scientific technology, and today, though of course it
is a component of a global textile industry. Ours is a
highly innovative up market garment industry. I
think all of you have visited some of our malls here,
I don’t want to mention names because that will
xvi
give an unfair commercial advantage, but you have
a lot of malls here and you can see the quality of
the products. The cost is very reasonable and the
product is of a high quality, that is the type of
garment industry that we have developed. It is a
US$ 10 billion enterprise. Then we also have
tourism. It is also growing very fast. By next year we
expect 2.5 million tourists to come in to this
country. These are all in the service sector which
requires new thinking, innovation, these are new
areas which will also impact our domestic sector.
Even in agriculture we cannot think of sustaining
agriculture unless we can modernize with new
equipment. Recently we had a discussion in
parliament about the eastern and northcentral
provinces, and about how they have brought in a
new harvester. Because earlier where they used
very simple mechanisms now with this new
mechanism they can do a much more efficient job.
So that sort of innovation is needed. Earlier we had
to bring workers from India to handle that machine
but now Sri Lankan young people in villages are able
to mange that large scale harvester. So that type of
scientific and technological culture has to be
created. Particularly in a small country where we
have to go for niche markets and innovate, we have
to create an educational system and space for a
general growth pattern for this new scientific
community. So I think that we are going through an
interim phase. We are completely revamping our
education system, still we are at the level of primary
education and basic education but as we go along it
will impact our secondary education, tertiary and
then university education and like that it will go
along. So once you set this new curriculum and new
structure, once you set it loosely, obviously it is
going to have an impact on higher classes in the
years to come. So we have to plan for that. So that
is what I see in the new development paradigm. A
key role will be played by science and technology
and by education because it will be a link to
whatever comparative advantage that comes to us
by the nature of our physical positioning, by the
nature of the markets, by the nature of human
capital, by the nature of government investments,
and all those other variables. Science and
technology will play a key role in positioning the
country in a competitive stance in a highly global
economic situation.
1
Plenary Sessions
Sustainable Development through Integration of Multidisciplinary Knowledge
2
PLENARY SESSION SUMMARY
Youth Bulge for Sustainable Development An Emerging Challenge for the 21st Century Sri Lanka
W Indralal De Silva
Senior Professor of Demography (Chair)
Department of Demography, University of Colombo &
Senior Research Fellow, National Centre for Advanced Studies - UGC
Senior Professor W. Indralal De Silva first spoke
about the Demographic Change in Sri Lanka, there
he has defined the term “youth bulge”. Senior
Professor mentioned that the term “youth bulge” is
used to describe a population in which the
proportion of the youth (age between 15- 29) is
significantly large compared to very young and the
old population in Sri Lanka, there he emphasized,
although Sri Lankan population is ageing as with
other developing nations, still Sri Lanka possesses of
youth. According to the survey results it is 23% in
2012 and it is estimated 21% in 2021).
“Youth Bulge” does not necessarily embark with
challenges and difficulties for a particular country,
especially for a developing nation, rather it can help
in development process of a nation where the
majority of the population can be involved with. It
can be achieved through youth development
directed to youth participation and finally nation
can achieve Youth-led development which is
depicted as follows.
Youth Development Youth
Participation Youth-led-
development
Further Professor mentioned that “youth bulge” can
lead to favorable demographic dividend which
provides a window of opportunity for economic
take-off. During the demographic dividend, the
dependency will be at minimum level as highest
proportion of population will be in working is that is
age between 15-59 or 16-64. Hence demographic
dividend would have a positive impact on economic
growth. But as professor explained demographic
dividend alone is not sufficient for an economic
take-off, it require other variables as;
1. Political Stability
2. Savings and investments
3. Productivity
4. Knowledge economy where business
involvement, information infrastructure,
innovation system and human resources
are in well order.
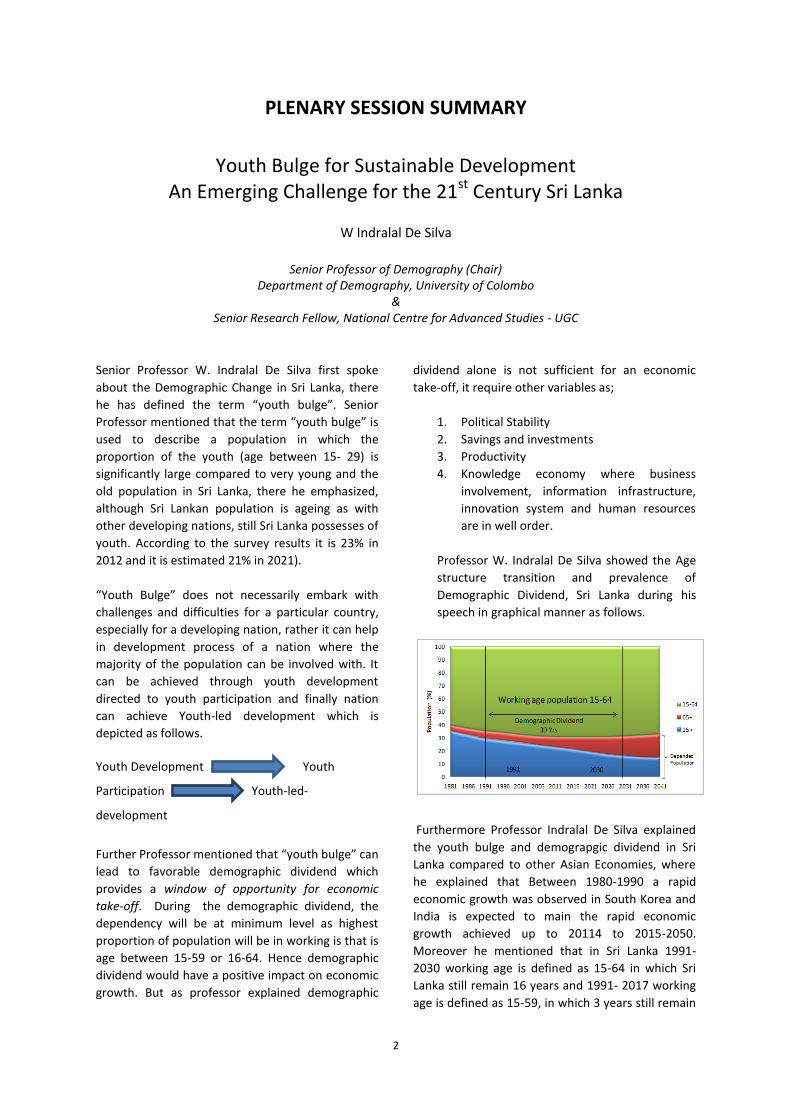
Professor W. Indralal De Silva showed the Age
structure transition and prevalence of
Demographic Dividend, Sri Lanka during his
speech in graphical manner as follows.
Furthermore Professor Indralal De Silva explained
the youth bulge and demograpgic dividend in Sri
Lanka compared to other Asian Economies, where
he explained that Between 1980-1990 a rapid
economic growth was observed in South Korea and
India is expected to main the rapid economic
growth achieved up to 20114 to 2015-2050.
Moreover he mentioned that in Sri Lanka 1991-
2030 working age is defined as 15-64 in which Sri
Lanka still remain 16 years and 1991- 2017 working
age is defined as 15-59, in which 3 years still remain
3
for the dividend, and that shows Sri Lanka is the
leader in South Asia due to the demographic
dividend.
Source : Youth Development Index Results Report, 2013
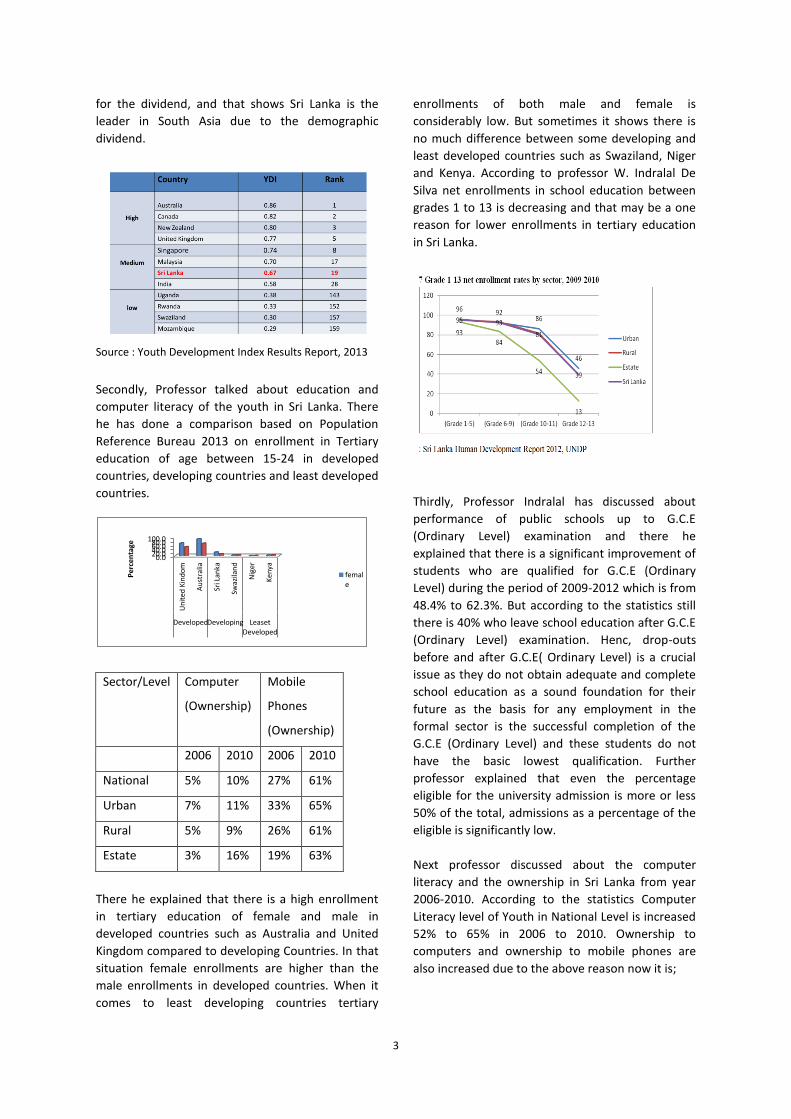
Secondly, Professor talked about education and
computer literacy of the youth in Sri Lanka. There
he has done a comparison based on Population
Reference Bureau 2013 on enrollment in Tertiary
education of age between 15-24 in developed
countries, developing countries and least developed
countries.
There he explained that there is a high enrollment
in tertiary education of female and male in
developed countries such as Australia and United
Kingdom compared to developing Countries. In that
situation female enrollments are higher than the
male enrollments in developed countries. When it
comes to least developing countries tertiary
enrollments of both male and female is
considerably low. But sometimes it shows there is
no much difference between some developing and
least developed countries such as Swaziland, Niger
and Kenya. According to professor W. Indralal De
Silva net enrollments in school education between
grades 1 to 13 is decreasing and that may be a one
reason for lower enrollments in tertiary education
in Sri Lanka.
Thirdly, Professor Indralal has discussed about
performance of public schools up to G.C.E
(Ordinary Level) examination and there he
explained that there is a significant improvement of
students who are qualified for G.C.E (Ordinary
Level) during the period of 2009-2012 which is from
48.4% to 62.3%. But according to the statistics still
there is 40% who leave school education after G.C.E
(Ordinary Level) examination. Henc, drop-outs
before and after G.C.E( Ordinary Level) is a crucial
issue as they do not obtain adequate and complete
school education as a sound foundation for their
future as the basis for any employment in the
formal sector is the successful completion of the
G.C.E (Ordinary Level) and these students do not
have the basic lowest qualification. Further
professor explained that even the percentage
eligible for the university admission is more or less
50% of the total, admissions as a percentage of the
eligible is significantly low.
Next professor discussed about the computer
literacy and the ownership in Sri Lanka from year
2006-2010. According to the statistics Computer
Literacy level of Youth in National Level is increased
52% to 65% in 2006 to 2010. Ownership to
computers and ownership to mobile phones are
also increased due to the above reason now it is;
0.0 20.0 40.0 60.0 80.0 100.0
Un
ited
Kin
do
m
Au
stra
lia
Sri L
anka
Swaz
ilan
d
Nig
er
Ken
ya
Developed Developing Leaset Developed
Per
cen
tage
female
Sector/Level Computer
(Ownership)
Mobile
Phones
(Ownership)
2006 2010 2006 2010
National 5% 10% 27% 61%
Urban 7% 11% 33% 65%
Rural 5% 9% 26% 61%
Estate 3% 16% 19% 63%
4
Finally professor discussed about ‘youth health’ and
‘migration desire of the youth’. There he made the
following comments:
Youth Health
1. 7% of teenage pregnancies, highest in
estate sector, <50% knowledgeable on
reproductive health
2. 63% of malnourished women are youth,
33% of female youth are anemic
3. Deaths due to suicides highest among
females of 20-29
4. 26.7% tobacco and 27.3% alcohol users
belongs to age 15-24
5. <50% knowledgeable on HIV/AIDS and
other Socially Transferable Deceases. Only
57% had some awareness on Socially
Transferable Deceases.
Migration desire of the youth
1. 51% of youth desire to migrate for work
2. 31% wish to migrate on more permanent
basis.
3. More men, Tamils & Muslims desire to
migrate than others.
At last professor has concluded his speech by
highlighting the following important points related
to “youth and youth bulge”In each country the
population size & age-sex structures are changing-
Youth Bulge. Demographic environment is
conducive for economic take-off. Presently lowest
level of dependency prevails. The take-off could
provide sustainable benefits to all segments of the
population, including Youth. Demographic dividend
alone would not sufficient enough for economic
take-off (Educated, healthy & productive Y). Hence,
Youth - It is an opportunity that should not be
missed

5
Managing Supply Chain beyond the Basics: Use of Operations Research Tools
Professor Saman Bandara
Department of Civil Engineering, University of Moratuwa
Transport and logistics is said to be the dominant
factor for the development of the country’s
economy and the welfare of the public. A
sustainable transport system yields considerable
economic and social benefits where as an
inefficient transport system with regard to capacity
or reliability results in more economic cost or
opportunity costs. In general, logistics cost can be
well understood in terms of inventory carrying cost,
transportation cost and logistics administration
cost.
Globally, the demand for energy seems to increase
1.5% annually. Transport itself takes 26% of the
global energy consumption where it is 50% in Sri
Lanka. Notably 60% of the fossil fuel is consumed
by transport sector. Hence efficient usage of energy
has become vital. Thus the overall energy efficiency
can be derived from the following formula.
Overall Energy Efficiency = Vehicle efficiency x
Travel efficiency x System efficiency
Hence the improvement of efficiency is felt well in
transport and logistics sector. It can be achieved by
reducing the demand for motorized trips, efficient
use of transport modes, and effective management
of traffic flow and effective use of individual
vehicles. Transport and logistical competency is
highly dependent on the coordination of these four
strategies thus the competitive advantage can be
thought of to achieve commercial success.
To improve efficiency and to integrate the above
mentioned strategies, there are theoretically
operation research tools that can be applied on
situations. But the reality is the industry does not
show much interest on these tools as they think
that they can solve the problems and run their daily
routine through experience. The commonly used
operation research tools are as follows:
Statistical analysis, Simulation, Linear programming,
Network models, Inventory theory, PERT/CPM,
Queuing theory, Non-linear programming, Dynamic
programming, Game theory, Decision theory, Risk
analysis
Going back to the industrial revolution era, all
resources were fully used to get the best use and
convenience of the mankind. But in the course of
time, it resulted in specialization through increased
division of labour and segmentation of
management responsibilities. And now it has
become well realized that resources are limited and
they need to be used in an efficient manner.
Starting at World War II, Operations Research was
highly used for the successful allocation of scarce
resources to required activities. This concept
captured the other industry as well after its
successful usage at this war. Two similar disciplines
were developed together as Operation Research,
which deals with management of operating systems
& System Engineering, which concentrate on
analysis and design of systems
A problem will appear in supply chain or any
business when there are some objectives to be
achieved. And there will be many ways to solve that
problem where as the feasible alternative will not
be apparent. What the Operations Research Tools
will do is that the objectives will be clearly defined,
the alternatives will be identified and these
alternatives will be tested against optimization.
In general the mathematical models will have set of
decision variables, objective function and set of
constraints. Following are some of the examples for
the mathematical models that are commonly used
to achieve the above mentioned purposes in the
organization.
Linear programming which is concerned with
allocating scarce or limited resources to known
activities with the goal of maximizing or minimizing
the value of a given objective function (often profit
or cost).

6
Dynamic programming which depends upon the
representation of a multi stage decision problem as
a sequence of single stage problems. This can be
represented in optimum allocation of available
resource.
Calculus is where problems with multiple variables
with or without constraints can be handled using
this technique.
Network analysis will help to deal with flow of the
network with respect to capacity constraints. It will
help to identify the shortest paths in the network
and minimum spanning tree which deals with the
construction of road or path at minimum cost while
ensuring all the places were visited once.
Therefore, the use of mathematical tools will help
bridge the scarce resources and efficient way of
usage of these resources which is a best way to
manage supply chain beyond the basics.
7
Expanding Educational Horizons for Sustainable Development
Prof. Marie Perera
Department of Humanities Education, University of Colombo, Sri Lanka [email protected]
I. INTRODUCTION
This paper is on Education for Sustainable
Development and it would focus on the following
sub topics.
Define Sustainable Development.
Define Education for Sustainable
Development
Goals of Education for Sustainability
The achievements in relation to the goals
Challenges and way forward
II. SUSTAINABLE DEVELOPMENT
There are many definitions on Sustainable
Development which shows that it encompasses a
wide spectrum of fields. However, even though
there is no consensus regarding what it is, there is
no uncertainty about its importance. For the
purpose of this paper, I would consider the original
definition of sustainability stated in the World
Commission Report commonly referred to as the
Brundtland Commission report.
"Sustainable development is development that
meets the needs of the present without
compromising the ability of future generations to
meet their own needs" (World Commission on
Environment and Development, 1987, p 43).
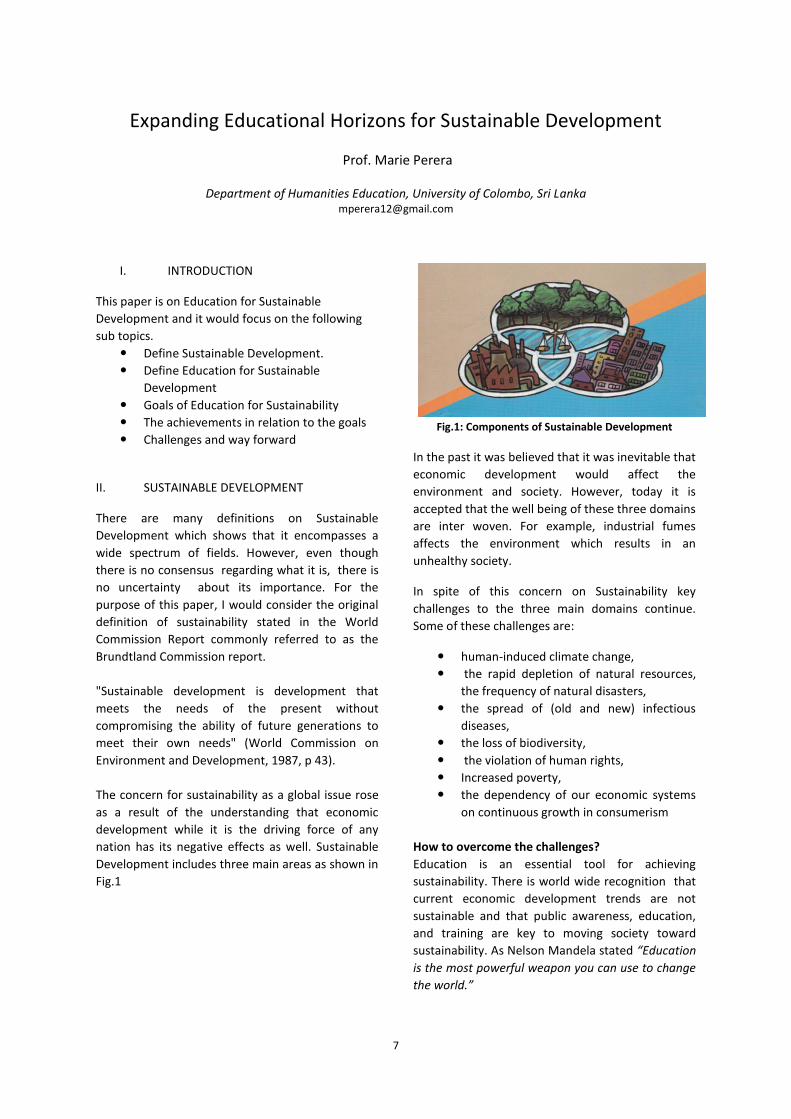
The concern for sustainability as a global issue rose
as a result of the understanding that economic
development while it is the driving force of any
nation has its negative effects as well. Sustainable
Development includes three main areas as shown in
Fig.1
Fig.1: Components of Sustainable Development
In the past it was believed that it was inevitable that
economic development would affect the
environment and society. However, today it is
accepted that the well being of these three domains
are inter woven. For example, industrial fumes
affects the environment which results in an
unhealthy society.
In spite of this concern on Sustainability key
challenges to the three main domains continue.
Some of these challenges are:
human-induced climate change,
the rapid depletion of natural resources,
the frequency of natural disasters,
the spread of (old and new) infectious
diseases,
the loss of biodiversity,
the violation of human rights,
Increased poverty,
the dependency of our economic systems
on continuous growth in consumerism
How to overcome the challenges?
Education is an essential tool for achieving
sustainability. There is world wide recognition that
current economic development trends are not
sustainable and that public awareness, education,
and training are key to moving society toward
sustainability. As Nelson Mandela stated “Education
is the most powerful weapon you can use to change
the world.”
8
The role of Education in Sustainable Development
was emphasized in a chapter on Education in
Agenda 21, which was adopted as a result of the
Earth Summit of 1992.
Recognizing the power of Education for sustainable
Development the UNO declared a decade 2005 -
2014 as the United Nations Decade of Education for
Sustainable Development. Hence it is fitting that the
theme of this conference which is held in 2014 -
the end of the decade is Expanding Developmental
horizons through Education , Research and
Innovations
Education for Sustainable Development
Education for Sustainable Development means
including key sustainable development issues into
teaching and learning; for example, climate change,
disaster risk reduction.
Education for Sustainable Development allows
every human being to acquire the knowledge, skills,
attitudes and values necessary to shape a
sustainable future. (http://www.unesco.org/)
According to the ESD description/definition as
provided in the original Decade of Education for
Sustainable Development Monitoring and
Evaluation guidelines document
Education for Sustainable Development (ESD) is a
learning process (or approach to teaching) based on
the ideas and principles that underlie sustainability
and is concerned with all levels and types of
education. ESD supports five fundamental types of
learning to provide quality education and foster
sustainable human development – learning to
know, learning to be, learning to live together,
learning to do and learning to transform one self
and society (p.26)
Thus is could be seen that ESD is a planned
systematic process of education. It emphasizes not
only knowledge, but attitudes, skills, and practice. It
is a learner centered approach where the types of
learning necessary have also been identified. ESD
has its own identified goals as well.
Goals of ESD
ESD) is a
According to Agenda 21 the goals of Education for
Sustainable Development are
1. Improve basic education,
2. Reorient existing education to address
sustainable development,
3. Develop public understanding, awareness,
4. Training
(Chapter 36 of Agenda 21)
When the above goals are considered the
improvement in basic education is apparent in most
of the countries. In Sri Lanka the net enrollment in
basic primary education is 96%. which is satisfactory
.
If one considers the number of ‘hits’ or websites
generated using the search engine, Google, as an
indicator of the presence of a phenomenon in
society and if the growth in these hits over time is
an indicator of an increase of this presence in
society, the following statistics is significant
regarding the second goal of ESD.
On March 29th 2005, the year of the start of the
DESD, a Google search for “Education for
Sustainable Development” yielded 89,000 websites.
On January 29th
2009, almost four years into the
DESD, the same search yields 215,000 of such
websites. This represents a ‘Google growth of 142
per cent.On August 20th
2014 almost a decade later
the same search yields 47,800,000
There are numerous programmes in Sri Lanka to
raise awareness among the public regarding
different aspects of Sustainable development.
Shramadana campaigns, tree planting programmes,
mosquito and dengue eradication are some such
programmes. These are organized by the public as
well as non governmental sector.
This paper concentrates on training in one sector –
namely the training of teachers. The National
Colleges of Education are the prime institutes for
training pre service teachers. They produce around
3000 teachers of various disciplines to the teacher
cadre. A training manual has been prepared to train
these trainees to integrate peace and sustainability
in to the curriculum and pedagogy.
The manual is the outcome of a UNESCO – New
Delhi Co – ordinated project supported by Japan
Funds –in-Trust Co-operation on Training of Trainers
on Post Conflict peace building to promote quality
and innovation in Teacher Education through ESD.
The manual consists of two parts. While part one
contains the theoretical basis for ESD, part 2
consists of an activity guide with 22 model activities
reflecting the three dimensions of Sustainable
Development - society, environment and economy.
9
One such activity based on the theme of ‘let’s
manage waste” is given in annexure 1.
The identified objectives of this activity relate to
knowledge, skills and practice. Further. five values
to be embedded through this activity are also
stated. Therefore, it could be claimed that this
activity confirms to the definition of Education for
sustainable development.
On paper it appears that Goals of ESD have been
achieved. Yet, have we really achieved ESD?
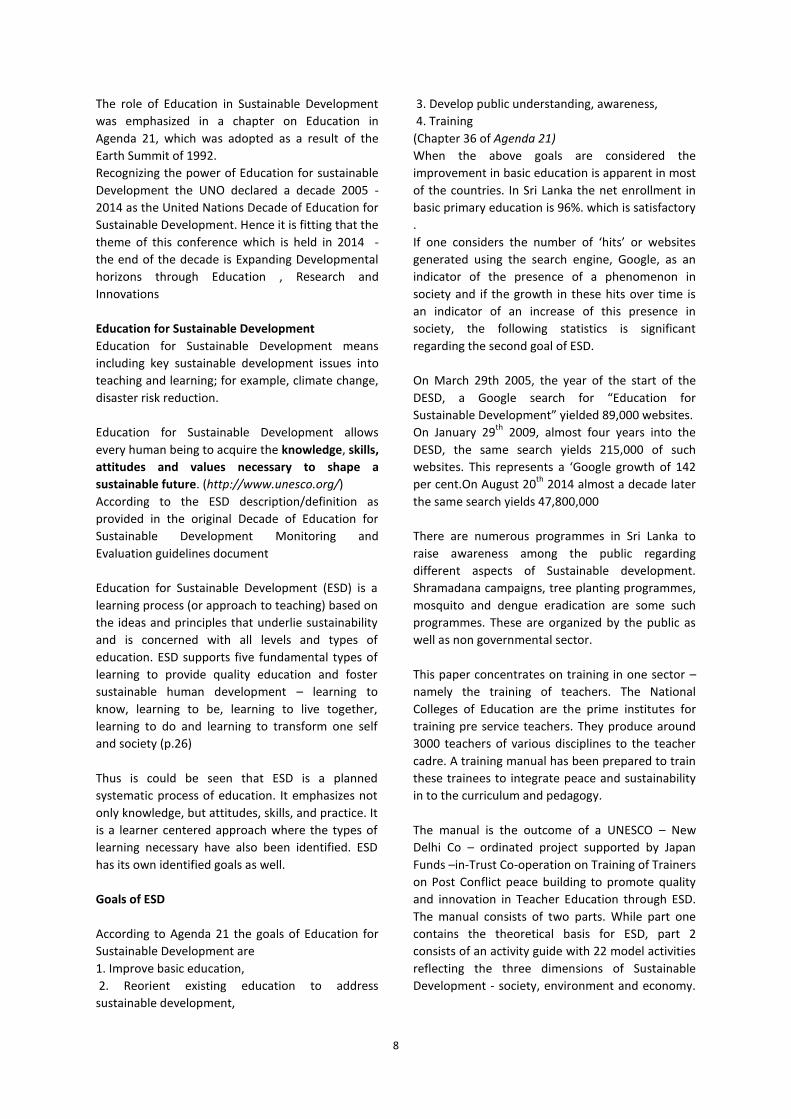
The Reality
The following photographs taken in the city of
Colombo illustrate the reality of ESD. Is this
sustainable development?
Photo 1: Garbage Bin near a hotel in the early morning.
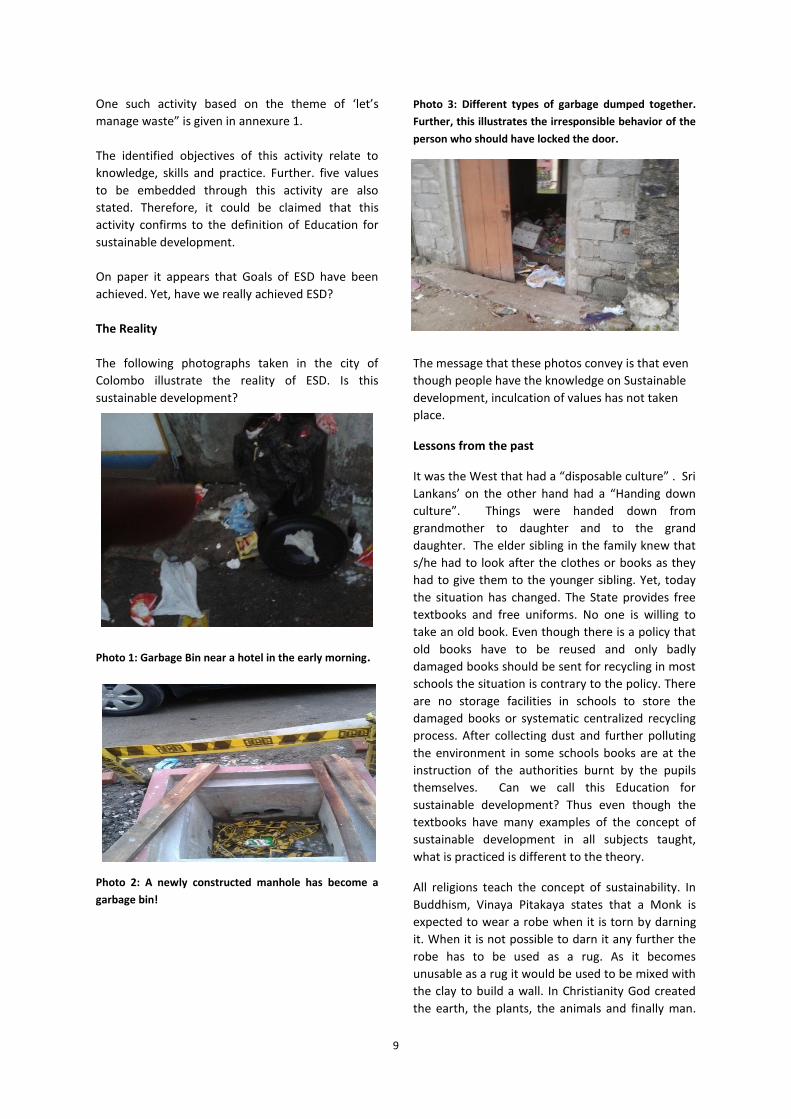
Photo 2: A newly constructed manhole has become a
garbage bin!
Photo 3: Different types of garbage dumped together.
Further, this illustrates the irresponsible behavior of the
person who should have locked the door.
The message that these photos convey is that even
though people have the knowledge on Sustainable
development, inculcation of values has not taken
place.
Lessons from the past
It was the West that had a “disposable culture” . Sri
Lankans’ on the other hand had a “Handing down
culture”. Things were handed down from
grandmother to daughter and to the grand
daughter. The elder sibling in the family knew that
s/he had to look after the clothes or books as they
had to give them to the younger sibling. Yet, today
the situation has changed. The State provides free
textbooks and free uniforms. No one is willing to
take an old book. Even though there is a policy that
old books have to be reused and only badly
damaged books should be sent for recycling in most
schools the situation is contrary to the policy. There
are no storage facilities in schools to store the
damaged books or systematic centralized recycling
process. After collecting dust and further polluting
the environment in some schools books are at the
instruction of the authorities burnt by the pupils
themselves. Can we call this Education for
sustainable development? Thus even though the
textbooks have many examples of the concept of
sustainable development in all subjects taught,
what is practiced is different to the theory.
All religions teach the concept of sustainability. In
Buddhism, Vinaya Pitakaya states that a Monk is
expected to wear a robe when it is torn by darning
it. When it is not possible to darn it any further the
robe has to be used as a rug. As it becomes
unusable as a rug it would be used to be mixed with
the clay to build a wall. In Christianity God created
the earth, the plants, the animals and finally man.
10
He was asked to look after the earth and all its in
habitants including the fauna and flora in both the
Quran and the Hindu Vedas there are many
references to the need to protect the environment.
Yet in spite of our cultural roots and religious beliefs
we are today moving towards a disposable culture
even surpassing the West. How then can we use
Education as a weapon to change the world?
The way forward
Many topics inherent in ESD are already part of the
formal education curriculum. But these topics are
not identified or seen to contribute to the larger
concept of sustainability. Identifying and
recognizing components of ESD in all subjects is a
key to moving forward. In this regard English
Language Lecturers can play a major role. As the
teaching approach is changing to Content and
Language Integrated Learning ( CLIL), the lecturers
can select content from any subject discipline which
can be connected to SD. Such a topic can facilitate
the teaching of all four language skills. However, as
already discussed knowledge alone is not sufficient.
To create an ESD curriculum, educational
communities will need to identify
knowledge,
issues,
Attitudes,
Skills
Central to sustainable development in each of the
three components - environment, economy, and
society. Figure 1 is one such example.
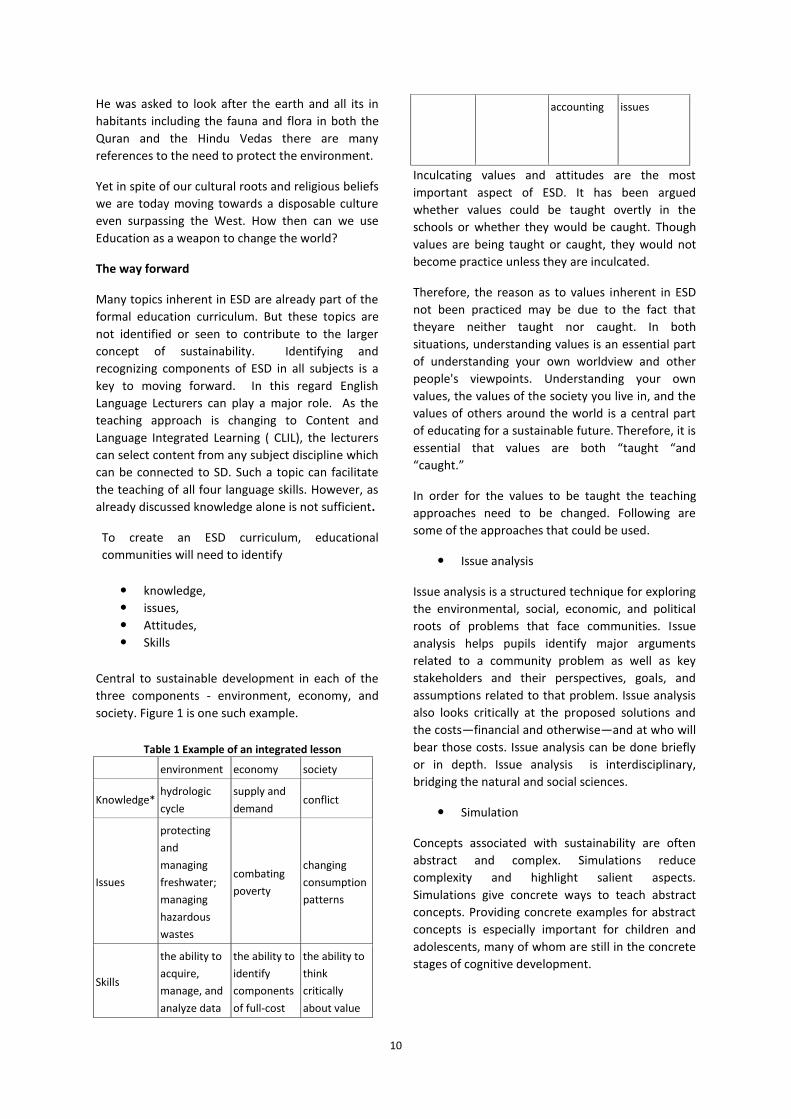
Table 1 Example of an integrated lesson
environment economy society
Knowledge* hydrologic
cycle
supply and
demand conflict
Issues
protecting
and
managing
freshwater;
managing
hazardous
wastes
combating
poverty
changing
consumption
patterns
Skills
the ability to
acquire,
manage, and
analyze data
the ability to
identify
components
of full-cost
the ability to
think
critically
about value
accounting issues
Inculcating values and attitudes are the most
important aspect of ESD. It has been argued
whether values could be taught overtly in the
schools or whether they would be caught. Though
values are being taught or caught, they would not
become practice unless they are inculcated.
Therefore, the reason as to values inherent in ESD
not been practiced may be due to the fact that
theyare neither taught nor caught. In both
situations, understanding values is an essential part
of understanding your own worldview and other
people's viewpoints. Understanding your own
values, the values of the society you live in, and the
values of others around the world is a central part
of educating for a sustainable future. Therefore, it is
essential that values are both “taught “and
“caught.”
In order for the values to be taught the teaching
approaches need to be changed. Following are
some of the approaches that could be used.
Issue analysis
Issue analysis is a structured technique for exploring
the environmental, social, economic, and political
roots of problems that face communities. Issue
analysis helps pupils identify major arguments
related to a community problem as well as key
stakeholders and their perspectives, goals, and
assumptions related to that problem. Issue analysis
also looks critically at the proposed solutions and
the costs—financial and otherwise—and at who will
bear those costs. Issue analysis can be done briefly
or in depth. Issue analysis is interdisciplinary,
bridging the natural and social sciences.
Simulation
Concepts associated with sustainability are often
abstract and complex. Simulations reduce
complexity and highlight salient aspects.
Simulations give concrete ways to teach abstract
concepts. Providing concrete examples for abstract
concepts is especially important for children and
adolescents, many of whom are still in the concrete
stages of cognitive development.
11
Picture Discussion
“A picture paints a thousand words” –
photos of critical issues would facilitate
issue analysis as was shown in this
presentation.
In order for values to be caught the most essential
factor is role models. As long as teachers and
parents are not role models in maintaining
sustainability and they contribute to the ‘disposable
culture” ESD will continue to be a challenge.
Therefore it is up to the teachers and parents as
Mahatma Gandhi said to “be the change that you
wish to see in the world”, If you think you are too
small to contribute to ESD remember this African
proverb,
“If you think you are too small to make a difference,
you have not spent a night with a mosquito”.
Unless and until you change, you have not achieved
the five fundamental types of learning to foster
sustainable development – learning to know,
learning to be, learning to live together, learning to
do and learning to transform one self and society.
REFERENCES
Framework for a DESD communication strategy in
support of the UN Decade of Education
for Sustainable Development,
http://unesdoc.unesco.org/images/0015/
001512/ 151243e
National Institute of Education, Training Manuel on
Education for Sustainable Development
O’DONOGHUE, M. (Ed.) 2008. Education for
Sustainable Development . “Images and
Objects” Active Methodology Toolkit. Norway
:THE CONSUMER CITIZENSHIP
NETWORK
UNESCO ( 2009) Review of Contexts and Structures
for Education for Sustainable
Development
http://www.esdtoolkit.org/discussion/go
als.htm
United Nations Decade of Education for
Sustainable Development (2005-2014)
Education for Sustainable Development
Lens: A Policy and Practice Review Tool
http://www.unesco.org/new/en/educatio
n/theme s/leading-the-international-
agenda/education-for-sustainable-
development/
United Nations Conference on Environment and
Development Report ( UNCED), Rio de Janeiro,
3-14 June 1992
World Commission on Environment and
Development (WCED) (1987). Our common
future. Oxford: Oxford University Press
12
Managerial Innovations of the State University System in Sri Lanka: An Exploratory Study
Professor RLS Fernando
Department of Public Administration, Faculty of Management Studies and Commerce,
University of Sri Jayewardenepura
In the first part of the presentation she emphasized
one of the intentions of the university system is to
produce employable graduates with the essential
knowledge, skills with positive attitudes in order to
provide human resources for the development
process of a country. In this context, the role of the
Sri Lankan government is noteworthy. The total
expenditure incurred for the education has been
provided from the General Treasury. Thus, the
education is imparted free of charge. This situation
has long been contributed for empowering nation’s
human resources.
The government allocates 2.08% of the GDP
(CBR:2009) to maintain the entire education
system. The expenditure on education has been
gradually reduced for the last several years ( the
government allocated only 2.59% and 2.27% of
GDP for the years of 2007 and 2008 respectively).
The lack of financial resources has been one of main
constraints being faced by State universities. This
situation has been negatively affected in improving
quality and relevance of the undergraduates. Under
this situation University authorities face much
difficulties in implementing their plans and
producing “Quality graduates”. Despite these
constraints the universities could not reduce or end
up the expected service delivery. Thus, this
research paper argues that the university
administration has to find alternatives to achieve its
intended objectives.
If academics perform in innovative ways in
managing their educational programs, that would
lead to improve the quality and the relevance of
their output leading to more effective and efficient
administration The importance of innovative
managers for the public sector organizations has
been highlighted by several western scholars.
Improving performance of the public service is the
key challenge faced by managers in the public
sector organizations. The main aim of the study
undertaken on “Managerial Innovations of the State
University System In Sri Lanka was to examine the
utility of innovation theory in the university
administration in Sri Lanka.
Then the research questions explained as: what
would count “innovation” in the university
administration? , what are the benefits of
managerial innovation in the university
administration, what are the main factors affecting
innovation in the university administration? and
what can be done to improve innovation in
university administration in Sri Lanka?.
Then she explained about the methodology of the
study. In the explanation she emphasized the study
carried out in a qualitative approach. The Sample
selected for the study comprised of 20
administrators and occupied purposive sampling
technique. The participants in this research were
the Coordinators, Heads and Deans of the Faculties
of the Universities in the Western province. Further,
the sample was selected based on the reputational
snowballing technique. Data collected through In-
depth interviews. Data analysis mainly based on
the Thematic and Content Analysis. In addition to
that descriptive analysis was undertaken with
substantial description to identify characteristics
and behavioral patterns of the administrators, and
their experiences related the objectives of the
study.
Theoretical Background of the research on
managerial innovation explained as “As generation,
acceptance and implementation of new ideas,
process, and products or services” (Thompson,
1965). Interest in managerial innovation in the
Public sector New Public Management,
Managerialism, Reinventing Government Principles,
Public Sector Management Reforms, Peter Drucker
(1994) emphasizes the importance of innovation in
the public sector for the success in their
organizations
13
Research on Managerial innovation in the Public
Sector Victor A. Thompson (1965),Lawrence B.
Mohr (1969),Donald C. Stone (1981), Robert K. Yin
(1977), Mohamed A. K. Mohamed (2002) ,
Sandford Borings(2001), Sudatta Ranasinghe (2002).
Fernando Lalitha S. (2004) &(2006) “..in order to
respond to the peoples’ demands under the
conditions of limited resources, the role and the
behavior of the managers in the public sector need
to be changed” .
Demographic Characteristics of the Sample consists
of 15 are male, 2 are Deans, 17 are Heads of
Dept.,10 are from the Faculty of Mgt Studies. &
Comm. , 4 of them are from the Faculty of
Engineering, 4 of them from Arts and Humanities,
Only 3 are Professors and 12 are sienior Lecturer
Grade 1,16 administrators are Ph.D holders, The
minimum age is 41 years and the maximum age is
57 years.
Professor Lalitha explained what is meant by
Managerial Innovation in the University
Administration according to her findings of the
study as, “Novel ways and means to manage the
resources in effective and efficient manner to
improve the quality of the graduates”,“Introducing
and implementing systems of management by using
new ideas for improving efficient and effective
degree programs”,“Improving the quality of the
graduates including their values to achieve
sustainable development of the society” and
“Initiating and implementing strategies and
activities to overcome constrains and also to
exploit opportunities existing in the environment ”
Innovative practices introduced by the participants
of the sample were to Introduce a ”Mentoring
Program” with the selected private sector
organizations. Students were trained under the
supervision of a CEO in the selected business
organizations to enhance the students’ required
skills and improving the relevance of the graduates
to the job market, introduced “Industry
consultation Board”. Several discussions were
undertaken with the selected managers of the
industries to get the ideas and comments for
designing and revising curriculum of the academic
programs, introduced a “self finance program” to
provide various services to the community and also
to generate income to the university, started
“Knowledge Centers” where students and the
teachers could get various benefits for their
teaching, learning and research, introduced a “Unit
for Statistical Case Studies” to learn and undertake
various projects for improving the statistical
knowledge of the students and to provide services
to others.
Then as another finding of her study she explained
the view of the participants about the benefits
obtained from innovative activities as reduced
students’ dropout ratio, improved the students’
various skills, creativity and decision making skills,
report writing capabilities, English and presentation
skills, earned more recognition from the other
departments of the university and also from the
outside the university, improved linkages between
the universities and the employers in the job
markets, so that the graduates were able to find job
opportunities without waiting longer time period
after their graduation improved the relationships
between the students and the lecturers, changed
the bad attitudes of the employers regarding the
university graduates in the job markets, improved
the students’ satisfaction and confidence with the
academic programs by improving students’ active
participation for the university activities, improved
physical and other resources of the department as
several innovative activities were generated
financial resources. Thus, both students and
lecturers were benefited.
Determinants of Managerial Innovation in the
University Administrators’ need to achieve
explained by different participants as “I need to do
something to my country as we are products of free
education”, “I want to do something to the country
as I received much from the free education in Sri
Lanka. By doing that I can get more self-
satisfaction”, Others’ motive is to solve students’
problems, improving the skills and the quality of the
graduates by introducing and implementing
different ideas and activities. Supportive internal
environment (support from the academic staff)
“New activities and innovative behavior can be
done with the support of the department”,
“Corporation among the staff is very important to
introduce new ideas and changes”, “Junior
academics’ support could be obtainable without
much difficulties than others”. Another significant
factor to enhance innovations is to obtain the
support from the external environment. Therefore,
other organizational supports are more helpful for
innovative activities. These supports could be
obtainable in various ways both financially and
physically. She emphasized that some departments
in universities offer various facilities and services

14
which are different from the normal activities as
various organizations in the private sector and
public sector supports them. Another utmost
important factor is the Skills of the Human
resources. As a result the support of the non
academic staff who must be competent and
experienced
During the policy implication for improving
innovative behavior of the University
Administration an emphasis should be given ion the
selection and the appointment of academics for
administrative positions who have positive attitudes
with more dedication towards public values. At the
recruitment of the academics, the above mentioned
matter should be equally applied. When obtaining
the external environment support, the mass media
has a significant role. By conducting awareness
programmes, public seminars, panel discussions,
research conferences, the awareness of the
innovative ideas and programmes could be
improved. In this way other organizational supports
could be obtainable. For improving innovative
culture in the university, administrators should find
various supports even from organizations outside.
Periodical training programs and workshops could
be arranged to improve the competence and skills
of the non academic staff.
In conclusion she explained that there is no
difference between managerial innovation in
universities and other public sector organizational
innovations. Universities are good places where
innovation is possible and already happening within
it. Much of innovative activities and ideas were
implemented without extra financial resources.
Innovation in the university administration means
introducing and implementing systems of
management which are different from the existing
practices and systems to improve efficient and
effective degree programs. Therefore improving the
quality and relevance of the educational programs
are prime benefits of the university administration
in Sri Lanka. The administrators’ motivation to
achieve is the significant determinant of the
managerial innovation in the university
administration. The supportive environment,
support of the external environment and
competent and skillful human resources are other
determinants. The highlighted policy measures are
essential to improve innovative behavior in the
state university administration in Sri Lanka.

15
Oral presentations

16
Strategy for Winning Medals at Elite Competitions in Athletics for Sri Lanka
Shemal Fernando
Sri Lanka Navy Headquarters, Colombo 1, Sri Lanka
Abstract— This paper is a critical evaluation
concerning numerous aspects of elite level athletics
in Sri Lanka. It is focused on identifying a strategy
for the development of athletics by adapting the
existing systems that have led other nations to win
medals. The literature shows that this subject is a
global sporting arms race, where a country has to
do something remarkably special to yield success. In
this paper, the SPLISS Model which is a conceptual
framework that can be used for comparison of elite
sports policies will be presented. The nine ‘pillars’ of
the model determine the gaps in scientific research
on the relationship between elite sport policies and
international sporting success. The method for data
collection was qualitative interviews and the
questions were highly structured to serve for a
deeper exploration of the underlying issues behind
the phenomenon. The data has been synthesized to
provide an easy understandable analysis and
displayed in the form of SWOT, to reflect and
include a comparison within and in between
interviews and combine separate descriptions to
formulate a coherent interpretation. Sri Lanka could
consider Asian Games Medals as the measure of
success. A Sri Lankan version of the Long Term
Athlete Development Model of Canada which is
designed and developed combining the best
research findings of latest sports science and best
practices from around the world is recommended
for all schools and universities in Sri Lanka, in order
to produce athletes who reach their full potential.
One of the possible means to achieve short-term
success is through ‘cross sport’ talent identification
and development. In the face of remarkable human
resources and infrastructure facilities, if Sri Lanka
properly concentrates on all pillars of the SPLISS
Model, the country could certainly count on winning
medals at elite competitions in the most important
sport of athletics.
Keywords — Athletics, Elite, SPLISS Model
I. INTRODUCTION
Sri Lanka is a country with a rich civilization, which
can look back on a long and glorious tradition in
athletics. It has taken part in all the Summer
Olympic Games, London 1948 through London
2012, with the sole exception of Montreal 1976
edition, but appears to be under performing at
international elite competitions. Sri Lanka has won
two medals - silver in 400m Hurdles by Duncan
White in London 1948 and silver in 200m by
Susanthika Jayasinghe in Sydney 2000 but failed to
produce even a finalist at any ‘Track and Field’
event at Athens 2004, Beijing 2008 and London
2012.
Lack of an effective framework for sustainable
development of elite athletes appears to be the
cause for Sri Lankans not reaching the Olympic
Podium despite existence of a good sports
development programme well executed across the
island nation through schools and clubs and funded
by the Government of Sri Lanka.
II. LITERATURE REVIEW
In order to identify strategic changes that need to
be introduced in Sri Lanka to achieve sustainable
performance at elite level, the required material for
formulating and developing the research was found
in already published material. By contrast, a
prospective literature research for pertinent
information on the topic of elite sports within Sri
Lanka has been depressing.
Identifying the composite and learned variety of
factors that lead to success is a challenge, which
resulted in an emerging interest in elite sports
systems, the desire to explain the success and to
examine why some nations perform better than
others in international competitions. This raised
some important questions and the researchers
around the globe investigating the phenomenon is
growing daily.
17
They all point out one essential finding - nations
need to be aware of the fact that sporting
ambitions cannot be met on a long-term basis
except with a systematic and strategic approach,
which requires the need to gain a deeper
understanding of the elite sports development in
different countries, pointing out the successful
ones.
Findings of these studies reveal that availability of
finance is a necessary condition. Hogan & Norton
(2000) even found a linear relationship between
money spent and medals won by Australia since
1980. However, it needs to be emphasized that the
financial investment is not a sufficient condition.
There is a growing body of research explaining that
success can be produced by investing strategically
and prioritizing the investments.
Although it would be impossible to create one
single model that would explain international
success, it became clear that many researchers and
policy makers around the world are addressing this
problem from the same perspective. This has
resulted in an increasingly homogenous elite sports
development system that is ostensibly based
around a near uniform model of elite sports
development with suitable local variations.
Over the last couple of decades, the macro-level
factors (economic welfare, geographic position,
climate, population size, religion etc.) influencing
international success have been the most discussed
ones in the studies on the Olympic Movement. The
aim of these studies was to focus on the
organizational context of nations that are largely
based on economic variables: Gross National
Product of a nation, or the political system, the
degree of urbanization and so on (Kiviaho &
Makela, 1978; Johnson & Ali, 2002).
The micro level-studies focus on genetic qualities
and the athletes close environment influences
(family, coach, friends, personal dedication,
motivation etc.) which led to the success. In
between the macro and the micro levels, there is
the middle level, which is called the meso-level.
The factors of this level are determined by sports
policies and politics. If we take into account all the
elements that determine elite sports success, these
are the only ones that can be directly influenced
and changed through policy and management and a
considerable amount of research has been done in
this area (Clumpner, 1994; Green & Houllihan,
2005).
Competition between nations has always been a
feature of the Olympic Games. Politicians and the
media continue to compare international success,
despite the International Olympic Committee’s
(IOC) protestation that the Olympic medal table is
not an order of merit. As a consequence of the
continuous escalating standards in international
sport, competition has become a competition
between ‘systems’ (Heinila, 1982).
The recent studies carried out in the United
Kingdom (UK) - a Meta-evaluation of the Legacies of
the Games the objectives of which include
ascertaining why Great Britain was so successful at
the elite level reveals that on elite sport the
majority of activity had been led by UK Sport, the
body responsible for supporting elite athletes which
is a change in policy from the old system.
The impact of its 2012-related activities, most of
which are ongoing core activities, which have been
modified in scale because of the London 2012
Games, included Mission 2012, Team 2012, Pitch2
Podium and Elite Coaching Apprenticeships,
illustrates the necessity for commitment to
boosting elite sport.
Going forward, the focus of the meta-evaluation
was on assessing the impact of additional
investments in elite sport linked to the Games, and
other catalytic effects, in terms of helping to
maintain and exceed the Beijing benchmark in the
short-term, and as a step on the road to build a
sustainable elite sporting system longer-term.
In Australia, a National Elite Sport Council (NESC)
had been established for this very purpose. NESC,
in its role as the national coordinating group, is
committed to fostering enhanced collaboration
and coordination among the Australian Institute of
Sports, state institutes and academies of sport. An
integral component of this programme is a
continued commitment to ensure that Australia
remains at the forefront of high performance sport
development.
The Long Term Athlete Development (LTAD) Model
developed in Canada (Balyi, 2001) highlights the
stages for the development of elite athletes. It is a
framework for an optimal training, competition

18
and recovery schedule for each stage of athletic
development. The principles of this research have
been adopted by Athletics Canada as the
framework for the proper management of youth
and adolescent growth and development
processes and identify critical periods of
accelerated adaptation to training.
The United States (US) Olympic Committee (2001)
surveyed US Olympic athletes from 1988 to 1996
and concluded that it took between 10 and 13 years
of training just to make the Olympic team and
between 13 and 15 years for those athletes who
won a medal. It concludes that though the intensity
required at the outset of the athlete development
continuum is not the same as the intensity required
at the end, the common thread among all stages of
development is the coach.
Another study is a paper by Mick Green and Ben
Oakley (2001) which explores the question of “Elite
Sport Development Systems and Playing to Win:
Uniformity and Diversity in International
Approaches”. This study points out the similarities
in approach and that they helped to form a basis
leading to the development of the efficiency of
different systems.
However, the key text identified is, “The Global
Sporting Arms Race: An international Comparative
Study on Sports Policy Factors Leading to
International Sporting Success”, the SPLISS by
Veerle De Bosscher, Jerry Bingham, Simon Shibli,
Maarten van Bottenburg and Paul de Knop. It
compares and analyzes sports structures, elite
sports policy and performance in six different
nations (Canada, Belgium, UK, Italy, Norway and the
Netherlands) and aims to provide a better
understanding of the factors which lead to
international sporting success.
All of the analyzed literature follows a premise that
performance in top-level sports is a mixture of all of
the classified factors (genetics, environmental and
physical circumstances in which people live), and
the sporting systems are a product of a specific
socio-cultural, economic and political background,
which needs to be taken into consideration when
analyzing the elite sporting system of a country.
The ‘Input’ represents the financial resources - the
expenditure on elite sport, the ‘Throughput’
represents the efficiency of sport policies - the best
way the inputs can be managed in order to produce
the desired results, while the ‘Outputs’ represents
the success, which is ordinarily measured by medals
won in relevant competitions. There is a distinction
between ‘Outputs’ (short term results of the
operation of the system) and ‘Outcomes’ (more
fundamental long term results/ impacts).
It is apparent that the specificity of the problem
makes it impossible to ‘copy - paste’ the system
that led to a success in one nation and make it work
in another. This is important as the findings of the
research will help the National Federation (NF) of
Athletics to determine the key matters that should
be focused on in order to develop an effective elite
sport policy and understand the future investments
we should concentrate on.
III. THEORETICAL FRAMEWORK
The theoretical framework that suited the research
was the SPLISS model (Figure 1).
Figure 1- SPLISS Model: 9 Pillars of Sports Policy Factors
Influencing International Success
The authors of the SPLISS international comparative
study endeavoured to explain the relationship
between elite sports policies, international sporting
success and to benchmark their nation against
competitors.
The literature review shows that this subject is a
global sporting arms race, where a country or
specific organization has to do something
remarkably special to yield success. Thus, this
research will look at developing a Strategic Plan that
will provide NF the competitive edge it covets.
By comparing the ‘Input’, ‘Throughput’ and ‘Output’
results of six different nations, the study attempts
to explain the relationship and to determine a
Nat
iona
l gov
erni
ng b
odie
s
Pillar 9
Scientific research
Talent development
INPUT
Talent identification system
Pillar 4: performance
Pillar 6
Training facilities
Pillar 7
Coaching provision & coach development
Pillar 8
(Inter)national competition
Pillar 10: Elite sport Environment Media & Sponsoring
Post career
Pillar 5: excellence
Athletic career support
Pillar 3: initiation
Foundation & participation
Organized sport (clubs)
Non organised sport and physical education in schools
De Bosscher et al., 2006
Improved climate

19
context within which an effective system can be
developed.
Therefore, the findings of the SPLISS study (with
suitable local variations of the nine pillars that may
be specific in a Sri Lankan context), will help the NF
of Athletics in Sri Lanka to develop the Strategic
Plan which will be the best pathway to international
sporting success.
The main focus will be to have views of all key
stakeholders from different perspectives. Thus, a
mixture of methods has been applied; document
analysis, statistics, qualitative interviews and focus
groups in order to collect a comprehensive volume
of information.
As reasoning derived data leads to generalization,
this involved an inductive, theory testing approach
based upon a thorough and information-rich review
of the principle sources in the existing literature,
followed by data collection and analysis.
Although the approach adopted in this research was
meant to be predominantly descriptive, the attempt
was to move beyond the descriptive level to the
subsequent analysis of all the contextual meso-level
factors that affect the elite sporting structure and
which are in direct correlation with the success or
the lack of success.
The ‘Nine Pillar’ Analytical Model derived from the
“SPLISS study of sport policy factors that lead to
international sporting success” provided the basis
for the research protocol and its simplified
analytical framework with minor changes specific to
Sri Lanka’s context. The interview protocol was
developed around 9 main themes that have been
previously identified in the literature.
It provided a comprehensive assessment of the NF
of Athletics in Sri Lanka and teased out the experts
critical opinion concerning the diverse aspects of
overall sports policy with particular focus on the 9
pillar factors that make the most significant
contribution to the sporting success and their main
strengths and weaknesses, opportunities and
threats (SWOT), as well as the suggestions for their
improvement.
The questions were highly structured, determined
before the interview and served for a deeper
exploration, understanding of the underlying issues
behind the phenomenon in question. All interviews
were recorded with consent and subsequently
transcribed either totally or partially.
The interviewees comprised of personalities from
the Ministry of Sports, Ministry of Higher Education,
National Olympic Committee (NOC) and NF of
Athletics as well as Olympians, administrators,
coaches, technical officials and past athletes who
have contributed towards athletics.
IV. CONCLUSIONS & RECOMMENDATIONS
This research recommends numerous aspects that
need to be projected under each pillar to achieve
sustainable development in order for Sri Lankan
athletes to be successful at elite competitions.
Also, it extends the knowledge about the NF of
Athletics and immensely help to clarify the
understanding about the position and shortcomings
that the NF is confronted with by illustrating the
major aspects displayed in the form of SWOT
analysis.
Pillar 1 - Financial Support
The results of the analysis proved that there is
sufficient financial support and commitment from
the Government of Sri Lanka for sustainable
development of athletics at elite level. The general
revenue includes several sources of income among
which the most important are the government,
sponsors, the International Federation and
marketing.
However, it is important to note that whilst the
availability of finance may be a necessary condition
for success, it will no longer be a sufficient condition
to succeed at elite level. The latter will be
influenced by the methods used to invest the
money. “More money in equals more medals out” is
no longer true (De Bosscher & De Knop, 2009).
However, it is of vital importance for the NF of
Athletics in Sri Lanka to focus on their ability to
attract enhanced financial income through
marketing and to work in close liaison with the IOC
and the International Athletics Association of
Federation (IAAF) in order to secure enhanced
berths in the sponsored programmes for athletes,
coaches and Technical Officials (TOs).
Pillar 2 - Integrated Approach to Policy
Development
The NF of Athletics is backed by an unique
administrative structure spread across the country.
20
It boosts efficient administration which effectively
contributes towards the development of athletics in
Sri Lanka. Furthermore, athletics is gifted with an
acceptable policy development process as well.
The primary responsibility towards the
development of sports lies with the Ministry of
Sports and the ardent desire of the government to
uplift athletics is very much evident from the pivotal
contributions made to develop the infrastructure
facilities especially since the end of the 30-year
humanitarian operation in 2009.
With the existing stable political situation, Sri Lanka
could do well in the development of athletics,
provided that the NF keeps on enhancing
coordination with the Ministries of Education and
Higher Education in order to ensure a continuous
influx of the cream of athletes through proper
coordination of their development to elite level.
Pillar 3 - Foundation and Participation in Sport
The two vital facts that have been considered under
this pillar are the number of registered athletes
which is in the region of 75,000 and the clubs and
associations affiliated to the NF which represents
the schools, universities, private and state sectors,
armed forces and all 25 administrative districts,
totalling to 39.
The country is blessed with a free education system
that affords 9 years of compulsory schooling for
every child, in over 1000 schools evenly spread to
cover all parts of the country. Further, a rich
tradition of Inter-House Athletics competitions
conducted annually with the active participation of
parents is an impetus.
This platform provides a wide basis at foundation
level supported by regular competitions from Under
9 to Under 23, organized by the NF of Athletics and
Sri Lanka Schools Athletics Association. Further, it is
mandatory for all schoolchildren to follow sport as a
core subject for GCE (O/L) Examination.
Pillar 4 - Talent Identification and Development
System
The positive and negative trends on this pillar
suggests that in the ever increasing competitive
environment, the influence that could be made by
talent identification and development is undisputed
and thus it is of vital importance for sustaining long-
term international competitiveness.
Further, the interviewees rated talent identification
and development as one of the most important
pillars that needs to be improved, when asked of
their priority, if they would have additional funds at
their disposal towards utilization for development
of athletics in Sri Lanka.
However, the need of the hour is to replace the
existing visual based talent identification system
with a scientifically proven system, with a
systematic and strategic approach towards talent
identification and development, as Sri Lanka seems
to be under performing in this pillar with the ever
increasing competitiveness.
Pillar 5 - Athletic and Post Career Support
It has now been recognized that professional
planning and education during the sports career,
significantly helps the athlete during and after their
career. However, the government or the NF of
Athletics have no specific programmes in place for
elite athletes but endeavour to facilitate the
transition by finding employment.
Though there is no general policy at the national
level, the experience demonstrates that the
schooling system is in most cases, supporting the
elite athletes by adapting the school programme to
their needs. Besides, the elite athletes who join the
Armed Forces are benefitted through optimum
facilities, along with a monthly salary and pension
benefits.
Although, post career programmes have not been
developed in Sri Lanka, it seems that athletes
regardless of the inadequate compensation during
their athletic career, do have an interest in pursuing
athletics as coaches, administrators or TOs or to
work with youth mainly because of their love
towards their sport.
Pillar 6 - Training Facilities
There is a network of training facilities throughout
the country and the athletes as well as coaches
have commented that the facilities available in the
country are adequate for elite athlete training. Also,
over the years, the elite athletes have been
afforded priority access to these facilities and other
privileges.
The decision by the government to develop
infrastructure at national level is commendable and
praised by the stakeholders. The state-of-art
training facilities being constructed in all nine
21
provinces and extending the provision of adequate
training facilities upto grass root level, has won the
admiration of all interviewees.
Pillar 7 - Coaching Provision and Coach
Development
In Sri Lanka, there is a reasonable number of
experienced coaches but all of them are volunteers.
Amongst them, 240 are IAAF qualified yet they do
not get adequate opportunities to develop their
coaching skills to become world class elite coaches.
This is a pillar where Sri Lanka is considerably weak
in terms of professionalism.
Our coaches serve athletics through the attachment
they have towards the sport and most of them are
former elite athletes. Yet, they lack professional
exposure to advanced technologies, opportunities
to learn the latest trends, facilities to improve
computer literacy and working knowledge in
English.
Pillar 8 - (Inter) national Competition
The NF of Athletics in Sri Lanka conduct the National
Championships annually. Further, athletes have
sufficient opportunities to take part in international
competitions. The country has hosted many
international competitions to the entire satisfaction
of the international fraternity and won the
admiration of all stakeholders.
Apart from the economic and cultural benefits,
hosting major international competitions is
considered one of the most important factors in the
overall development of the athletes pursuing
excellence, as ‘home advantage’ afford the athletes
to measure themselves against elite athletes and
showcase their abilities.
Pillar 9 - Scientific Research
This is the most negative pillar in the Sri Lankan
scenario, as the elite athlete development is not
supported at all by scientific research at any level.
In fact, recent trends in many countries, to increase
the investment in scientific research, suggest that
the sporting environment recognizes the
importance and benefits that could be derived
through scientific research.
It is evident that in order to change the current
scenario it would be necessary to enhance the link
between the NF of Athletics and the universities
and seek to promote applied research in sport.
Since scientific research is of vital importance for
the development of sports, Sri Lanka needs to
embark on a programme to avail itself of the
existing facilities.
How to benchmark with elite Athletes
Development Strategies used by other successful
countries?
Winning medals on the international sporting stage
is incredibly tough and the margins between
success and failure become smaller as the years roll
by and as countries strive for glory. In order to
ensure that Sri Lanka’s most talented athletes have
every chance of realizing their potential, it is
recommended to introduce a Sri Lankan version of
the World Class Performance Programme (WCPP)
which was meticulously utilized by Great Britain to
achieve optimum results at London 2012 Olympic
Games.
The WCPP’s, ‘Podium’ styled programme of
supporting athletes with realistic medal winning
capabilities within an Olympic cycle, could be a
short-term goal for Sri Lanka. Other distinct levels,
‘Development’ and ‘Talent’ mainly designed for
athletes demonstrating the ability to be competitive
in a period of time and athletes who have the
potential to progress through the world class
pathway, could be long-term perspectives.
What strategic changes need to be introduced to
achieve sustainable performance at elite level in
athletics in Sri Lanka?
Taking the traffic light summary as the yardstick, a
determined strategic approach need to be adopted
by the NF of Athletics in Sri Lanka, to improve on
the Pillar 9 (Scientific research) which blinks ‘Red’,
along with Pillar 4 (Talent identification and
development systems) and Pillar 7 (Coaching
provision and coach development) that blinks
‘Yellow’, to make them ‘Green’.
In order to develop a systematic and strategic
approach in a Sri Lankan context to achieve
sustainable performance at elite level, the NF of
Athletics should strive to boost up all 9 pillars of the
SPLISS model and make them ‘More Greener’, by
optimum utilization of the available financial and
other resources such as the immense volume of
volunteers who continue to contribute towards
development of athletics in Sri Lanka.
The first and foremost need for the NF of Athletics
in Sri Lanka would be to create a ‘Strategic Plan’ for
a 2-year period for the duration 2014 - 2016. The

22
planning process should be comprehensive and
should include a discussion of the operating
environment, the role of vision, mission and
objectives as well as developing plans to meet the
objectives. The ‘Strategic Plan’ once drawn up with
the active participation of all stakeholders, could be
a unifying tool for management and internal
communication.
In this regard, the ‘Strategic Plan’ developed by the
NESC of Australia in 1993 would be of vital
importance to benchmark the high performance
level to be achieved by Sri Lanka. The strategies
developed under the five ‘Key Result Areas’ of
Effective National Network, Leadership, World’s
Best Practice, Strategic Partnership and
International Perspective, could be of significance.
The NESC network is collectively responsible for the
provision of daily training and a high performance,
sport-servicing environment to elite athletes.
Introduction of a ‘Strategic Plan’ will involve
significant financial commitment mainly from the
government. The NF of Athletics has succeeded in
meeting this challenge upto now but will have to
ensure that the required funding is forthcoming
without any interruption. In this regard the policy
adopted by the New Zealand Olympic Committee to
fund only 6 sports that have the ability to produce
athletes who will finish in the top 16 is ideally suited
for implementation in Sri Lanka.
Sri Lanka has succeeded in winning a total of 27
medals which include 10 Gold, 6 Silver and 11
Bronze Medals at the Asian Games. During the last
25 years Sri Lanka has reached the Asian Games
podium only in the sprint events of 100m, 200m,
400m (both Men and Women), 100m Hurdles
(Women) and 4 x 400m Relay (Men). Accordingly,
these events could be identified as amongst the
high potential medal winning events for Sri Lanka.
It is recommended that Sri Lanka Athletics consider
Asian Games Medals as the measure of success
particularly considering the size of the likely medal
haul in a very successful Olympic Games for a
country like Sri Lanka. One of the possible ‘short
cuts’ to achieve short-term success is through ‘cross
sport’ talent identification and development. Here,
the time required to reach elite level may have
been accumulated in another sport and this was
successfully utilized by Great Britain in London 2012
Olympic Games.
In the face of remarkable human resources and
infrastructure facilities available in Sri Lanka, to the
advantage of athletics and the extremely
committed coaches, TOs and administrators, it is
not surprising to see why Athletics remains one of
the most popular sports disciplines in Sri Lanka and
if she would properly concentrate on the proposed
9 Pillars of the SPLISS Model, Sri Lanka could
certainly count on improved success at elite level in
the most important Olympic Sport of Athletics.
ACKNOWLEDGMENT
I would like to acknowledge the contributions made
by the Ministry of Sports, National Olympic
committee and Athletics Association of Sri Lanka for
the unstinted support extended.
REFERENCES
Athletics Association of Sri Lanka. (2014).
<http://www.srilankaathletics.com> Accessed 10 June
2014.
Australian Sports Commission. (2013).
<http://www.ausport.gov.au> National Elite Sports
Council. Accessed 12 January 2013.
Balyi I, Evely D, Gardiner A, Gmitroski W, Goulet M,
Gramantik L, et al. (2001). Athletics Canada: Long
Term Athlete Development.
De Bosscher V (2007), Sports Policy Factors Leading to
International Sporting Success, Published doctoral
thesis, Brussel: VUBPRESS. ISBN 978-905487-421-8.
De Bosscher V, De Knop P, Van Bottenburg, M & Shibli S
(2006). A conceptual framework for analyzing sports
policy factors leading to international sporting
success, European Sport Management Quarterly, 6(2),
185-215.
De Bosscher V, Bingham J, Shibli S, Van Bottenburg M, &
De Knop P (2008). The global Sporting Arms Race: An
international comparative study on sport policy
factors leading to international sporting success,
London: Meyer & Meyer, ISBN: 978-1-84126-228-4.
De Bosscher V, De Knop P, & Van Bottenburg M (2009).
An analysis of homogeneity and heterogeneity of elite
sports systems in six nations, International Journal of
Sports Marketing & Sponsorship, 10(2), 111-131.
Green M, & Oakley B (2001). Elite sport development
systems and playing to win: uniformity and diversity
23
in international approaches, Leisure Studies, 20(4),
247-267.
Hogan K & Norton K (2000). The ‘price’ of Olympic gold,
Journal of Science and Medicine in Sport, 3, 203-218.
International Association of Athletics Federations. (2013).
<http://www.iaaf.org> Accessed 11 January 2013.
Johnson K N & Ali A (2002).
<http://www.wellesley.edu/economics/wkpapers/we
llwp_0010.pdf> A tale of two seasons: participation
and medal counts at the summer and winter Olympic
Games. Wellesley College, Massachusetts. Accessed
15 August 2012.
Kiviaho P & Mäkelä P (1978). Olympic Success: A sum of
non-material and material factors, International
Review of Sport Sociology, 2, 5-17.
National Olympic Committee of Sri Lanka. (2013).
<http://www.srilankaolympic.org> Accessed 5
January 2013.
Olympic Games London 2012.
<http://www.london2012.com> Accessed 5 October
2012.
UK Sport. (2012). <http://www.uksport.gov.uk> Accessed
5 August 2012.
UK Sport. (2013). <http://www.uksport.gov.uk> World
Class Performance Programme. Accessed 15 January
2013.
BIOGRAPHY OF AUTHOR
Rear Admiral Shemal Fernando is a
Doctoral (PhD) Candidate at the
Kotelawala Defence University, Sri Lanka
and an IOC Scholar. His research interests
include High Performance and Elite Sport
Management. He has two Masters of Science in Defence
Management and Sports Management. At present, he
serves as the Director General Administration of the Sri
Lanka Navy.
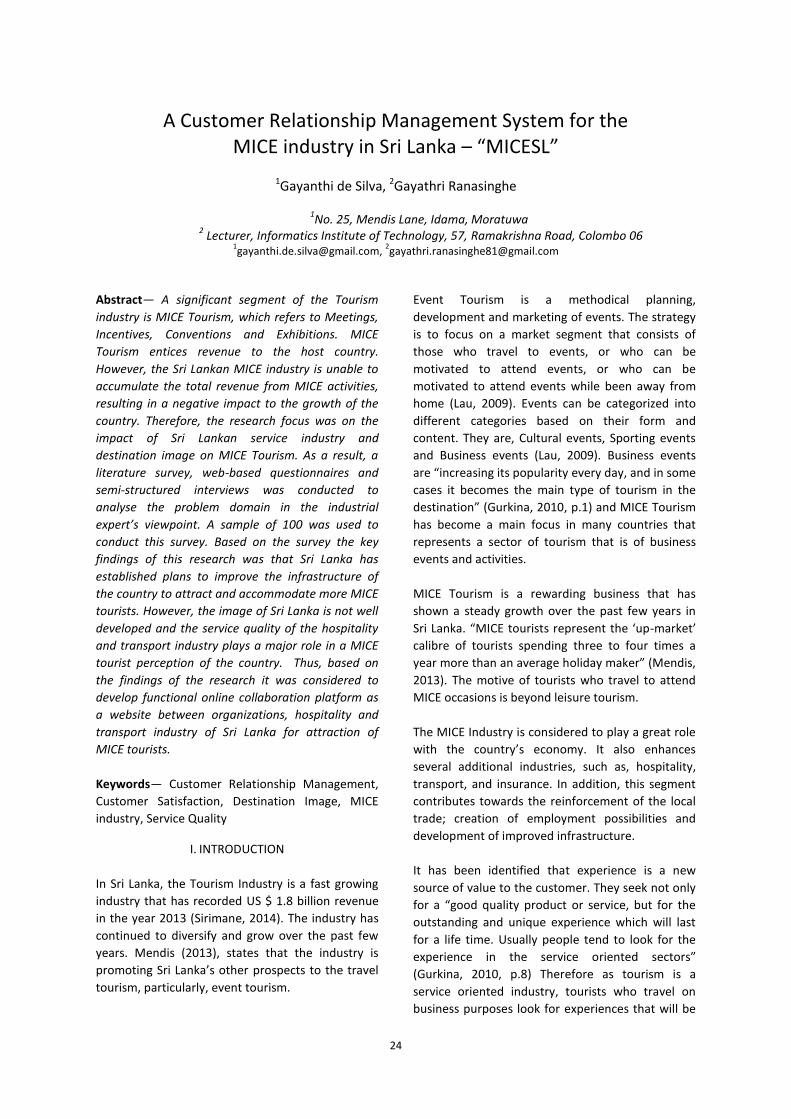
24
A Customer Relationship Management System for the MICE industry in Sri Lanka – “MICESL”
1Gayanthi de Silva, 2Gayathri Ranasinghe
1No. 25, Mendis Lane, Idama, Moratuwa
2 Lecturer, Informatics Institute of Technology, 57, Ramakrishna Road, Colombo 06
Abstract— A significant segment of the Tourism
industry is MICE Tourism, which refers to Meetings,
Incentives, Conventions and Exhibitions. MICE
Tourism entices revenue to the host country.
However, the Sri Lankan MICE industry is unable to
accumulate the total revenue from MICE activities,
resulting in a negative impact to the growth of the
country. Therefore, the research focus was on the
impact of Sri Lankan service industry and
destination image on MICE Tourism. As a result, a
literature survey, web-based questionnaires and
semi-structured interviews was conducted to
analyse the problem domain in the industrial
expert’s viewpoint. A sample of 100 was used to
conduct this survey. Based on the survey the key
findings of this research was that Sri Lanka has
established plans to improve the infrastructure of
the country to attract and accommodate more MICE
tourists. However, the image of Sri Lanka is not well
developed and the service quality of the hospitality
and transport industry plays a major role in a MICE
tourist perception of the country. Thus, based on
the findings of the research it was considered to
develop functional online collaboration platform as
a website between organizations, hospitality and
transport industry of Sri Lanka for attraction of
MICE tourists.
Keywords— Customer Relationship Management,
Customer Satisfaction, Destination Image, MICE
industry, Service Quality
I. INTRODUCTION
In Sri Lanka, the Tourism Industry is a fast growing
industry that has recorded US $ 1.8 billion revenue
in the year 2013 (Sirimane, 2014). The industry has
continued to diversify and grow over the past few
years. Mendis (2013), states that the industry is
promoting Sri Lanka’s other prospects to the travel
tourism, particularly, event tourism.
Event Tourism is a methodical planning,
development and marketing of events. The strategy
is to focus on a market segment that consists of
those who travel to events, or who can be
motivated to attend events, or who can be
motivated to attend events while been away from
home (Lau, 2009). Events can be categorized into
different categories based on their form and
content. They are, Cultural events, Sporting events
and Business events (Lau, 2009). Business events
are “increasing its popularity every day, and in some
cases it becomes the main type of tourism in the
destination” (Gurkina, 2010, p.1) and MICE Tourism
has become a main focus in many countries that
represents a sector of tourism that is of business
events and activities.
MICE Tourism is a rewarding business that has
shown a steady growth over the past few years in
Sri Lanka. “MICE tourists represent the ‘up-market’
calibre of tourists spending three to four times a
year more than an average holiday maker” (Mendis,
2013). The motive of tourists who travel to attend
MICE occasions is beyond leisure tourism.
The MICE Industry is considered to play a great role
with the country’s economy. It also enhances
several additional industries, such as, hospitality,
transport, and insurance. In addition, this segment
contributes towards the reinforcement of the local
trade; creation of employment possibilities and
development of improved infrastructure.
It has been identified that experience is a new
source of value to the customer. They seek not only
for a “good quality product or service, but for the
outstanding and unique experience which will last
for a life time. Usually people tend to look for the
experience in the service oriented sectors”
(Gurkina, 2010, p.8) Therefore as tourism is a
service oriented industry, tourists who travel on
business purposes look for experiences that will be
25
different however memorable. “Although
experiences are intangible, people will desire to get
them, due to the reason that those things and
memories stay with them through their lives.”
(Gurkina, 2010, p.1) Therefore, industries are
required to improve tourist expectation, to build a
creative image of the country and industry, “attract
more customers, and working on their satisfaction
and loyalty.” (Gurkina, 2010, p.1)
A. Research Aim
The main aim of the of this research is to identify
the barriers to the performance of MICE Tourism,
the service factors that affect the related industries
and the impact of MICE Tourism on Sri Lankan
Tourism Industry, in-order to design, develop and
evaluate a business solution supported by an
information systems (IS) solution, to promote Sri
Lankan MICE Tourism Industry.
The research attempts to study the following:
• The performance of MICE Tourism and its
effect to the Tourism Industry and
country’s development.
• Contribution of hospitality and transport
industries to MICE Tourism.
• The effect of destination image on MICE
Tourism.
II. LITERATURE REVIEW
In early days, the main focus on meetings was
discussions on common interests. However, due to
industrialization, the requirement for business
meetings increased rapidly. Yet with the expansion
of the government organizations, an increase in
multi-national organizations, development in
professional groups, need for management training
and continuing professional development and the
development of subject specialization, generated a
need for MICE industry to begin (Lau, 2009).
MICE tourism is a fast growing segment, in which
North America and Europe are leaders in the world
exhibition and convention market. However, Asia is
a strong growing region since the 1960s and
accounts for more 39% of business trips and takes
in 48% of business travellers (Lau, 2009). Therefore,
this industry is business oriented, which involves
mandatory travel. It is evident that the attendance
to MICE occasions of these tourists, involve the
industries such as tourism and hospitality.
1) Reasons to have MICE Tourism in Sri Lanka: Many
authors and reports state that Sri Lanka has a
variety of locations in which meetings, incentives,
conferences and exhibitions can be held. Jayasuriya
(2013), states that Sri Lanka is a favoured
“destination for incentive tours for many
multinational companies.” However, as a country,
Sri Lanka needs to invest on infrastructure
development in the hospitality and transport
industries, in-order to improve on MICE tourism.
B. Tourist’s Expectations
Tourist expectation is an important factor
considered since it can influence the tourist’s
decision making process and awareness of the
destination. Therefore, the service sector of a
country can play a major role to adjust customer
“perceptions to their expectations in order to justify
their beliefs or predictions, thus removing their
psychological conflicts” (Bosque, 2008, p.139).
There are three main factors that influence a tourist
expectation. They are;
• Past Experience
• Word of Mouth Communication
• Predetermined image of a tourist
destination
C. Service Quality
A sector that is positioned to benefit directly from
the anticipated boom in tourism is the Sri Lankan
Hotel Industry” (Illangasekera and Weeralingam,
2011). When considering the industrial structure,
the hospitality industry consists of many hotels and
other establishments such as guest houses and inns
that have been approved by the SLTDA. The 2012
annual report submitted by the Central Bank of Sri
Lanka, states that hotels and restaurants in Sri
Lanka have shown a growth of 22.3% in the year
2013 when compared with the growth rate of
20.2% in the year 2012 (Central Bank Sri Lanka,
2013).
In order to have a competitive advantage, hotels
are turning towards performance measurement and
management (Wadango et al., 2010). Therefore,
every hotel aims at customer satisfaction by
enhancing the value of its product and services in
which “the overall process by which consumers
assess the quality of a service or product is
considered to be very complicated” (Singh and
Grover et al., 2007, p.1724).

26
According to Kotler, a service can be defined as “any
act or performance that one party can offer to
another that is essentially intangible and does not
result in the ownership of anything” (Singh and
Grover et al., 2007, p.1724). The “overall process by
which consumers assess the quality of a service or
product is considered to be very complicated’
(Singh and Grover et al., 2007, p.1724). The quality
of service is an important factor for a successful
business. “In hotel industry, service quality, as an
extremely subjective category, is crucial to the
satisfaction of the client. It is therefore imperative
for managers in hotel industry to apply the
SERVQUAL model for the measurement of service
quality in their own hotel company, in order to
satisfy the guest’s expectations and ensure a
position on the growing global tourist market”
(Gržinić, 2007, p.95).
III. RESEARCH QUESTION
What is the connection if any between service
quality, destination image and towards customer
satisfaction of tourists as applicable in the context
of Sri Lankan MICE Tourism?
IV. THEORETICAL FRAMEWORK
Customer Satisfaction
Independent
Variable
Service Quality Destination
Image
Indicator
Tangibility
Reliability
Responsiveness
Assurance
Empathy
Table 1-Dimensions of Independent Variables
The theoretical framework relates to the
“philosophical basis on which the research takes
place” and it contains “implications for every
decision made in the research process” (McCann,
2006). Philosophies relating to a wide range of
tangibility, reliability, responsiveness, assurance and
empathy factors and destination image influencing
tourist expectations were studied. The theoretical
framework of this research is as follows.
Destination image is a “real service expectation
communicator.” When considering the high levels
of ambiguity, tourists consider their fixed “images
as a signal of the true capabilities” of the
destination. Bosque et al. (2006) states that earlier
studies have shown a positive relationship between
destination image and service industries such as,
hospitality, travel agencies and financial services.
“In tourism, destination image is a mental
representation of the place that helps individuals to
anticipate their destination experiences. Therefore,
image moulds the expectations that individuals
have of a tourist destination before the visit. The
more favourable the preconceived image of a
destination, the higher the tourist expectations.”
(Bosque et al. 2008, p.141)
Chingang Nde and Lukong (2010), states that
“services are mostly described as ‘intangible’ and
their output viewed as an activity rather than a
tangible object which is not clear because some
service outputs have some substantial tangible
components like physical facilities, equipment and
personnel.” “A service design which details a
service, service system and the service delivery
process must consider customers, staff, technology,
the physical environment, and the consumption
goods. In summary, it is eminent for service firms to
consider the physical aspects of quality in order to
offer high service quality.”
Customer satisfaction can be defined in terms, of
customer loyalty, customer relationship within an
organization. Customer satisfaction is highly
important in the service industry since it decides the
customers’ future behaviour. (Gurkina, 2013)
“A firm in order to compete successfully must have
an understanding of consumer perception of the
quality and the way service quality is influenced.”
(Seth, Deshmukh and Vrat, 2005, p. 915) In a service
industry it is difficult to measure quality because it
is intangible and subjective. Irrespective the
diversity of service settings, “there is a core of
concepts widely accepted as intrinsic to services.
The recognition of intangibility has brought up the
recognition that service quality perceptions result
from a comparison of customer expectations with
service performance. “(Senge and Oliva, 1993, p.
481)
V. CONCEPTUAL MODEL
Theory confirms that service quality factors and
destination image illustrated in Figure 1 influences
tourist expectations. This study further discus on
the applicability of tourist expectation related to
MICE Tourism and its performance.
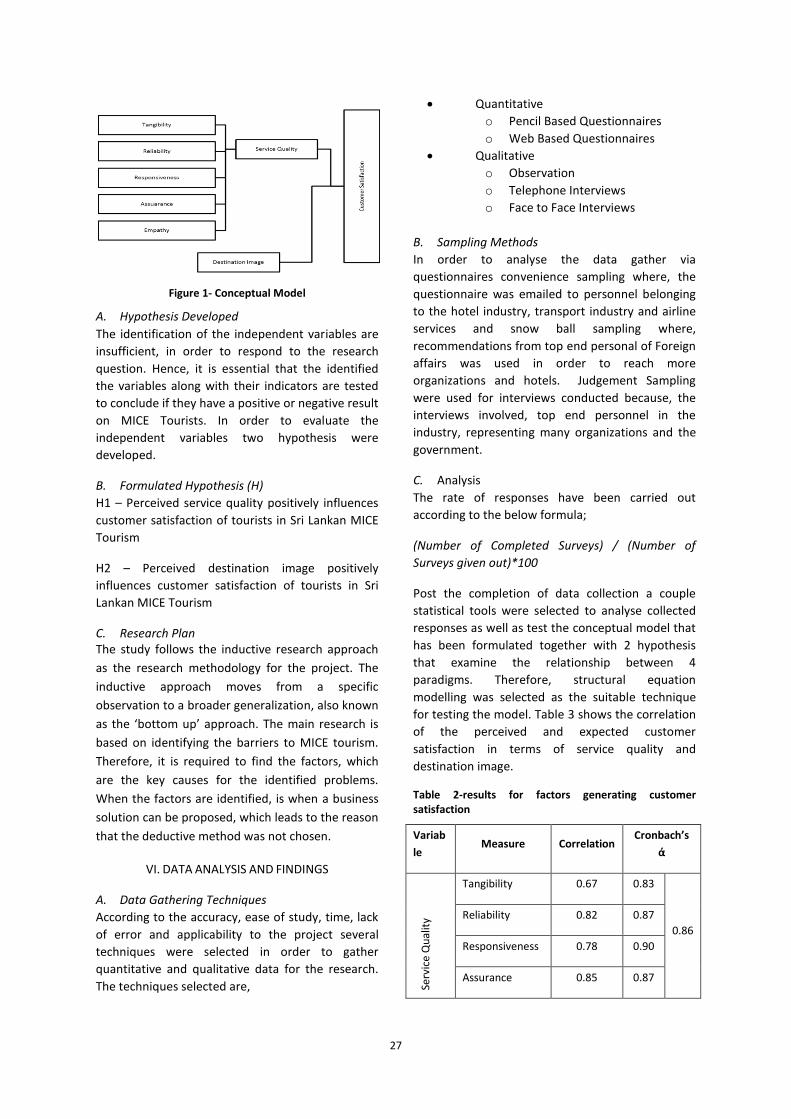
27
Figure 1- Conceptual Model
A. Hypothesis Developed
The identification of the independent variables are
insufficient, in order to respond to the research
question. Hence, it is essential that the identified
the variables along with their indicators are tested
to conclude if they have a positive or negative result
on MICE Tourists. In order to evaluate the
independent variables two hypothesis were
developed.
B. Formulated Hypothesis (H)
H1 – Perceived service quality positively influences
customer satisfaction of tourists in Sri Lankan MICE
Tourism
H2 – Perceived destination image positively
influences customer satisfaction of tourists in Sri
Lankan MICE Tourism
C. Research Plan The study follows the inductive research approach
as the research methodology for the project. The
inductive approach moves from a specific
observation to a broader generalization, also known
as the ‘bottom up’ approach. The main research is
based on identifying the barriers to MICE tourism.
Therefore, it is required to find the factors, which
are the key causes for the identified problems.
When the factors are identified, is when a business
solution can be proposed, which leads to the reason
that the deductive method was not chosen.
VI. DATA ANALYSIS AND FINDINGS
A. Data Gathering Techniques
According to the accuracy, ease of study, time, lack
of error and applicability to the project several
techniques were selected in order to gather
quantitative and qualitative data for the research.
The techniques selected are,
Quantitative
o Pencil Based Questionnaires
o Web Based Questionnaires
Qualitative
o Observation
o Telephone Interviews
o Face to Face Interviews
B. Sampling Methods
In order to analyse the data gather via
questionnaires convenience sampling where, the
questionnaire was emailed to personnel belonging
to the hotel industry, transport industry and airline
services and snow ball sampling where,
recommendations from top end personal of Foreign
affairs was used in order to reach more
organizations and hotels. Judgement Sampling
were used for interviews conducted because, the
interviews involved, top end personnel in the
industry, representing many organizations and the
government.
C. Analysis
The rate of responses have been carried out
according to the below formula;
(Number of Completed Surveys) / (Number of
Surveys given out)*100
Post the completion of data collection a couple
statistical tools were selected to analyse collected
responses as well as test the conceptual model that
has been formulated together with 2 hypothesis
that examine the relationship between 4
paradigms. Therefore, structural equation
modelling was selected as the suitable technique
for testing the model. Table 3 shows the correlation
of the perceived and expected customer
satisfaction in terms of service quality and
destination image.
Table 2-results for factors generating customer satisfaction
Variab
le Measure Correlation
Cronbach’s
ά
Serv
ice
Qu
alit
y
Tangibility 0.67 0.83
0.86
Reliability 0.82 0.87
Responsiveness 0.78 0.90
Assurance 0.85 0.87
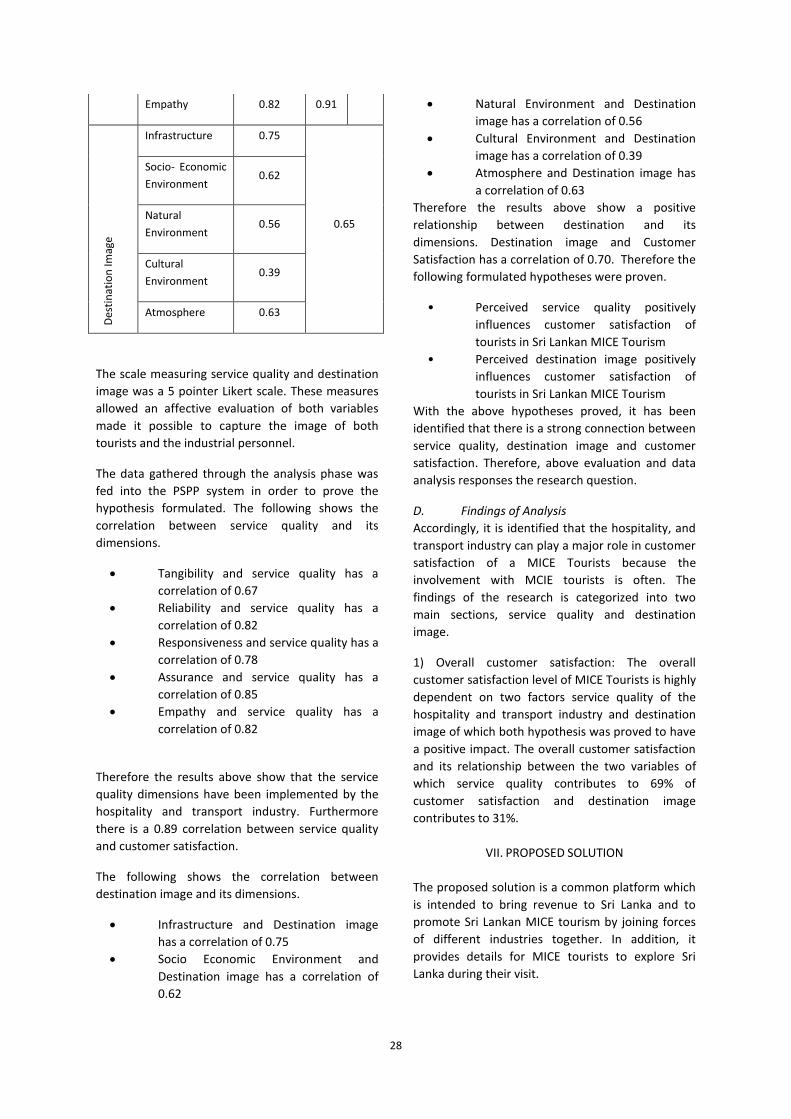
28
Empathy 0.82 0.91 D
esti
nat
ion
Imag
e
Infrastructure 0.75
0.65
Socio- Economic
Environment 0.62
Natural
Environment 0.56
Cultural
Environment 0.39
Atmosphere 0.63
The scale measuring service quality and destination
image was a 5 pointer Likert scale. These measures
allowed an affective evaluation of both variables
made it possible to capture the image of both
tourists and the industrial personnel.
The data gathered through the analysis phase was
fed into the PSPP system in order to prove the
hypothesis formulated. The following shows the
correlation between service quality and its
dimensions.
Tangibility and service quality has a
correlation of 0.67
Reliability and service quality has a
correlation of 0.82
Responsiveness and service quality has a
correlation of 0.78
Assurance and service quality has a
correlation of 0.85
Empathy and service quality has a
correlation of 0.82
Therefore the results above show that the service
quality dimensions have been implemented by the
hospitality and transport industry. Furthermore
there is a 0.89 correlation between service quality
and customer satisfaction.
The following shows the correlation between
destination image and its dimensions.
Infrastructure and Destination image
has a correlation of 0.75
Socio Economic Environment and
Destination image has a correlation of
0.62
Natural Environment and Destination
image has a correlation of 0.56
Cultural Environment and Destination
image has a correlation of 0.39
Atmosphere and Destination image has
a correlation of 0.63
Therefore the results above show a positive
relationship between destination and its
dimensions. Destination image and Customer
Satisfaction has a correlation of 0.70. Therefore the
following formulated hypotheses were proven.
• Perceived service quality positively
influences customer satisfaction of
tourists in Sri Lankan MICE Tourism
• Perceived destination image positively
influences customer satisfaction of
tourists in Sri Lankan MICE Tourism
With the above hypotheses proved, it has been
identified that there is a strong connection between
service quality, destination image and customer
satisfaction. Therefore, above evaluation and data
analysis responses the research question.
D. Findings of Analysis
Accordingly, it is identified that the hospitality, and
transport industry can play a major role in customer
satisfaction of a MICE Tourists because the
involvement with MCIE tourists is often. The
findings of the research is categorized into two
main sections, service quality and destination
image.
1) Overall customer satisfaction: The overall
customer satisfaction level of MICE Tourists is highly
dependent on two factors service quality of the
hospitality and transport industry and destination
image of which both hypothesis was proved to have
a positive impact. The overall customer satisfaction
and its relationship between the two variables of
which service quality contributes to 69% of
customer satisfaction and destination image
contributes to 31%.
VII. PROPOSED SOLUTION
The proposed solution is a common platform which
is intended to bring revenue to Sri Lanka and to
promote Sri Lankan MICE tourism by joining forces
of different industries together. In addition, it
provides details for MICE tourists to explore Sri
Lanka during their visit.
29
IX. CONCLUSION
In conclusion, it should be noted that the main
issues of MICE industry in Sri Lanka was service
quality and destination image. This could be
overcome by addressing the problem to the
industries and enabling them to solve their
problems and in addition the invention of the
virtual framework that will help organizations and
industry to build public image thereby, building the
destination image. From the perspective of Tourist
Board, it is a valuable opportunity for the industries
to perform their tasks to assist the growth of the
MICE industry.
With the relevant literature the author was able to
identify the solution to the encountered problem.
However, the feasibility of the solution was a great
concern in the industries viewpoint.
X. RECOMMENDATIONS
Based on the project carried out the author decided
to address some recommendations as further
enhancement of the project.
• Tourist Board of Sri Lanka could be the
initiative to promote MICESL website as
a better market place to gain users. It
will enhance the credibility of the source
and have stakeholder acceptance.
• It is a value addition to provide
industries with assist in service quality of
the market place.
• The country has to improve the
coordination between all the
stakeholders involved in business
tourism, both public and private ones.
ACKNOWLEDGEMENT
Firstly I would like to thank Informatics Institute of
Technology for giving me an opportunity to conduct
a research. I would also like to thank the industry
experts who offered their valuable time to assist me
with the industrial survey are also remembered
warmly.
The encouragement and assistance given to me by
colleagues at IIT and Mr. Ken de Joodt are also
sincerely remembered. I take this opportunity to
thank each and every one of them for helping me to
make the project a success.
REFERENCES
Central Bank of Sri Lanka, (2013). Annual Report 2013.
[online] Available at:
http://www.cbsl.gov.lk/pics_n_docs/10_pub/_docs
/efr/annual_report/AR2013/English/5_Chapter_01.
pdf [Accessed 03 Aug. 2014].
Chingang Nde, D. and Lukong, P. (2010). Using the
SERVQUAL Model to assess Service Quality and
Customer Satisfaction.: An Empirical Study of
Grocery Stores in Ume.
del Bosque, I., San Mart\'\in, H., Collado, J. and others,
(2008). A framework for tourist expectations.
International Journal of Culture, Tourism and
Hospitality Research, 3(2), pp.139--147.
Girod, A. (2009). An Analysis of the Development of MICE
industry. 1st ed. [ebook] Bournemouth University.
Available at:
http://www.du.se/PageFiles/18846/GirodAur%E9li
e.pdf [Accessed 7 May. 2014].
Gržinić, J. (2007). Concepts of service quality
measurement In hotel industry. pp.81-98.
Gurkina, A. (2013). Travel experience in hotels for MICE
Industry. pp.1-43.
Illangasekera, P. and Weeralingam, K. (2011). HOTEL
SECTOR REPORT. 1st ed. [ebook] Colombo 04: RAM
Ratings Lanka. Available at:
http://www.ram.com.lk/other_pdf/Hotel-Sector-
Report-2011-2.pdf [Accessed 5 Apr. 2014].
International Enterprise Singapore, (2001). The shows will
go on: findings confirm the economic benefits one
trade exhibition can bring to Singapore.
Jayasuriya, B. (2013). Why Sri Lanka For Meetings,
Incentives, Conferences and Events. [online]
Beyondboundariesglobal.com. Available at:
http://www.beyondboundariesglobal.com/why-sri-
lanka-for-mice [Accessed 23 Sep. 2013].
Kotler, P. (2000). Marketing Management Millennium
Edition. 10th ed. Pearson Custom Publishing.
Lau, C. (2009). Manual on Elective I – Meetings,
Incentives, Conventions and Exhibitions (MICE). 1st
ed. [ebook] Hong Kong: The Hong Kong Polytechnic
University, pp.1-145. Available at:
30
http://www.edb.gov.hk/attachment/en/curriculum
-development/kla/pshe/nss-curriculum/tourism-
and-hospitality-studies/mice%20english.pdf
[Accessed 12 Nov. 2013].
Mccann, P. (2006). 'Principals’ Understandings of Aspects
of the Law Impacting on the Administration of
Catholic Schools: some implications for leadership',
Australian Catholic University.
Mendis, C. (2013). Sri Lanka’s MICE and tourism
industry. Daily FT. [online] Available at:
http://www.ft.lk/2013/09/25/evolving-times-sri-
lankas-mice-and-tourism-industry/ [Accessed 29
Nov. 2013].
Middleton, V. (1994). Marketing in travel and tourism. 1st
ed. Oxford: Butterworth-Heinemann.
Rodriguez del Bosque, I., San Martin, H. and Collado, J.
(2006). The role of expectations in the consumer
satisfaction formation process: Empirical evidence
in the travel agency sector. Tourism management,
27(3), pp.410--419.
Senge, P. and Oliva, R. (1993). Developing a theory of
service quality/service capacity
interaction. SYSTEM, 93, p.477.
Seth, N., Deshmukh, S. and Vrat, P. (2005). Service quality
models: a review. International Journal of Quality
\& Reliability Management, 22(9), pp.913--949.
Singh, V., Grover, S. and Kumar, A. (2007). Service Quality
to Loyalty- Effect of function and facility. pp.1724-
1727.
Sirimane, S. (2014). Tourism earns US$ 1.8 b
revenue. Daily FT. [online] Available at:
http://www.dailynews.lk/?q=business/tourism-
earns-us-18-b-revenue [Accessed 3 Aug. 2014].
SLTDA, (2011). Annual Statistical report Of Sri Lanka
Tourism. Annual Statistical Reports. Sri Lanka
Tourism Development Authority, pp.5-67.
SLTDA, (2014). The Sri Lanka Tourism Development
Authority (SLTDA). [online] Available at:
http://www.sltda.lk/index.html [Accessed 21 Nov.
2013].
Statistical Pocket Book 2013. (2013). 1st ed. [ebook]
Department of Census and Statistics Sri Lanka,
pp.84-87. Available at:
http://www.statistics.gov.lk/Pocket%20Book/chap1
4.pdf [Accessed 29 Oct. 2013].
Stylidis, D. (2012). Tourism and Community Life: Building a
Conceptual Framework. pp.1-223.
Wadongo, B., Odhuno, E., Kambona, O. and Othuon, L.
(2010). Key performance indicators in the Kenyan
hospitality industry: a managerial
perspective. Benchmarking: An International
Journal, 17(6), pp.858--875.
Yang, L. and Gu, Z. (2012). Capacity optimization analysis
for the MICE industry in Las Vegas. International
Journal of Contemporary Hospitality Management,
24(2), pp.335--349.
BIOGRAPHY OF AUTHORS
Gayanthi de Silva is a student of
Informatics Institute of
Technology, completed a degree in
Bsc (Hons) Information Systems
and Business Management.
Gayathri Ranasinghe is a lecture at
Informatics Institute of
Technology, who supervised the
research project MICESL.

31
Employee Motivation and Productivity Improvement in Sri Lankan Apparel Manufacturing Sector
MHR Sandeepanie1, EG Ubayachandra2
1General Sir John Kotelawala Defence University, Sri Lanka
2University of Kelaniya, Sri Lanka
Abstract — Employee motivation is highly
significant for the organizational productivity.
Improved productivity in apparel manufacturing
sector is considered as one of the key input for the
development of Sri Lankan economy. Lower
productivity targets achievement, having higher
labour turnover rates and higher employee
absenteeism rates more than the standard set levels
and these are critical situations in Sri Lankan
apparel manufacturing industry. Employees are
regretting highly on their financial benefits and non
financial benefits, which are provided by their
organizations. This study was carried out on
employee motivation and productivity
improvement. Main question of this research was
that, what the effort made by authority to improve
productivity through a sound motivational
mechanism in Sri Lankan apparel manufacturing
industry? The aim was surveying the relationship
between motivation and productivity, and on the
other hand personal factors, organizational factors
and interaction factors affecting on employee
motivation. There were four objectives and research
was based on four hypotheses. Research approach
was deductive approach. Statistical population was
entire apparel manufacturing organizations in Sri
Lanka and the methodology has been questionnaire
based survey, observational methods and
interviewing techniques. Sample size was 500 and
subjects selected were the apparel employees; top,
middle and lower levels from ten large scale apparel
manufacturing organizations located within
Western province in Sri Lanka. Non random
stratified convenient judgement sampling technique
was applied. Reliability of data was checked by
Chronbach’s alpha. The data were analysed using
statistical methods of simple linear regression,
correlation and multiple regressions with the SPSS.
There is a strong positive relationship between
employee motivation and productivity, and also
different personal factors; such as perception of
behaviour, interest, needs as well as, different
organizational factors; feedback, co-workers, task
design, supervision and rewards significantly affect
employee motivation, while attitudes and
communication do not significantly affect on
employee motivation in Sri Lankan apparel
manufacturing sector. Further, there is an
interaction between two key employment
hierarchical levels; top level and middle, lower level
for different personal factors and organizational
factors. Ultimately, well planned rewarding
strategy, positive feedback with praising for
accomplishments, employee mentoring, training
and development and concerning the psychological
aspects are highly recommended to improve
productivity through a sound motivational
mechanism for Sri Lankan apparel manufacturing
industry.
Keywords: Motivation, Sri Lankan apparel
manufacturing industry, productivity
I. INTRODUCTION
The apparel manufacturing industry is one of the
most significant sectors of the economy in terms of
investment, revenue, trade and employment
generation in all over the world. The important
segments covered in apparel manufacturing
industry in the world include kids’ clothing, men’s
clothing, women’s clothing, bridal wear, men’s
wedding wear and intimate apparel. The apparel
export market is divided into two major categories;
knit and woven. In the knit apparel export market,
China is already ranked as the number one knit
apparel exporter in the world with the market share
of 39 % (The Sri Lankan Apparel, Garments without
Guilt, 2010). Apparel industry is one of the most
significant and dynamic contributors to the overall
economy of Sri Lanka. Presently, Sri Lankan apparel
manufacturing industry is facing number of
deteriorating problems in the process of achieving
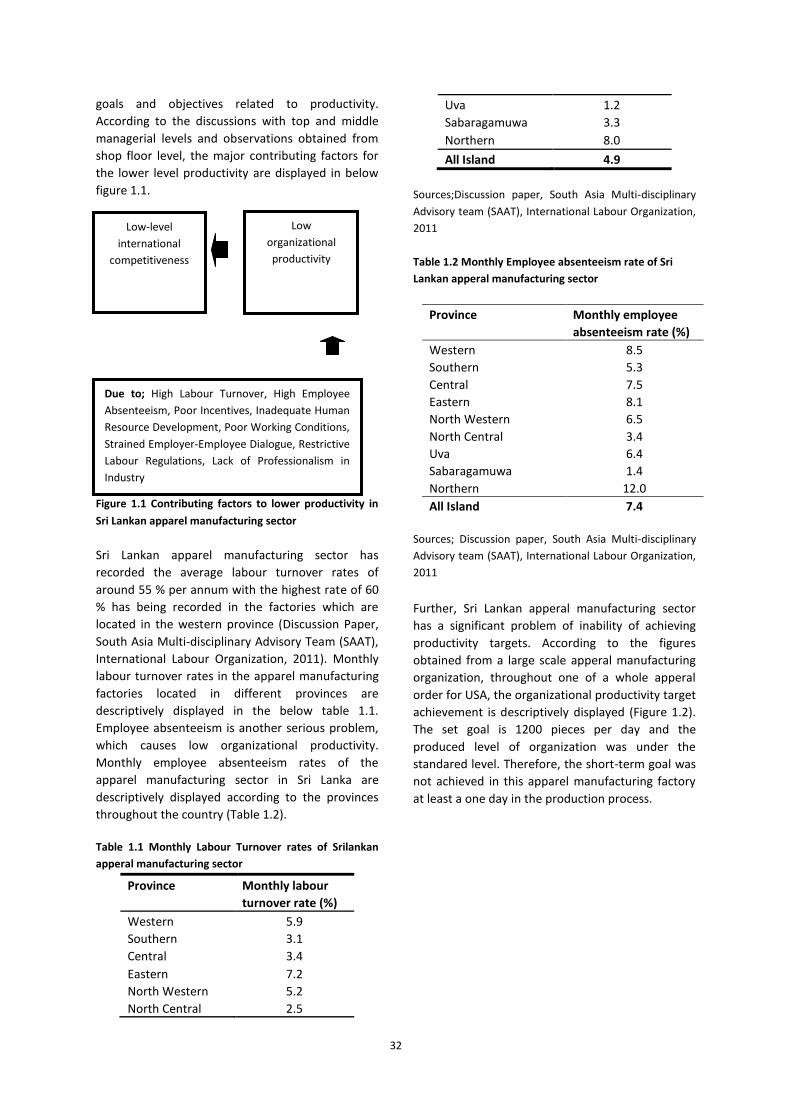
32
goals and objectives related to productivity.
According to the discussions with top and middle
managerial levels and observations obtained from
shop floor level, the major contributing factors for
the lower level productivity are displayed in below
figure 1.1.
Figure 1.1 Contributing factors to lower productivity in
Sri Lankan apparel manufacturing sector
Sri Lankan apparel manufacturing sector has
recorded the average labour turnover rates of
around 55 % per annum with the highest rate of 60
% has being recorded in the factories which are
located in the western province (Discussion Paper,
South Asia Multi-disciplinary Advisory Team (SAAT),
International Labour Organization, 2011). Monthly
labour turnover rates in the apparel manufacturing
factories located in different provinces are
descriptively displayed in the below table 1.1.
Employee absenteeism is another serious problem,
which causes low organizational productivity.
Monthly employee absenteeism rates of the
apparel manufacturing sector in Sri Lanka are
descriptively displayed according to the provinces
throughout the country (Table 1.2).
Table 1.1 Monthly Labour Turnover rates of Srilankan
apperal manufacturing sector
Province Monthly labour
turnover rate (%)
Western 5.9
Southern 3.1
Central 3.4
Eastern 7.2
North Western 5.2
North Central 2.5
Uva 1.2
Sabaragamuwa 3.3
Northern 8.0
All Island 4.9
Sources;Discussion paper, South Asia Multi-disciplinary
Advisory team (SAAT), International Labour Organization,
2011
Table 1.2 Monthly Employee absenteeism rate of Sri
Lankan apperal manufacturing sector
Sources; Discussion paper, South Asia Multi-disciplinary
Advisory team (SAAT), International Labour Organization,
2011
Further, Sri Lankan apperal manufacturing sector
has a significant problem of inability of achieving
productivity targets. According to the figures
obtained from a large scale apperal manufacturing
organization, throughout one of a whole apperal
order for USA, the organizational productivity target
achievement is descriptively displayed (Figure 1.2).
The set goal is 1200 pieces per day and the
produced level of organization was under the
standared level. Therefore, the short-term goal was
not achieved in this apparel manufacturing factory
at least a one day in the production process.
Province Monthly employee
absenteeism rate (%)
Western 8.5
Southern 5.3
Central 7.5
Eastern 8.1
North Western 6.5
North Central 3.4
Uva 6.4
Sabaragamuwa 1.4
Northern 12.0
All Island 7.4
Low
organizational
productivity
Low-level
international
competitiveness
Due to; High Labour Turnover, High Employee
Absenteeism, Poor Incentives, Inadequate Human
Resource Development, Poor Working Conditions,
Strained Employer-Employee Dialogue, Restrictive
Labour Regulations, Lack of Professionalism in
Industry
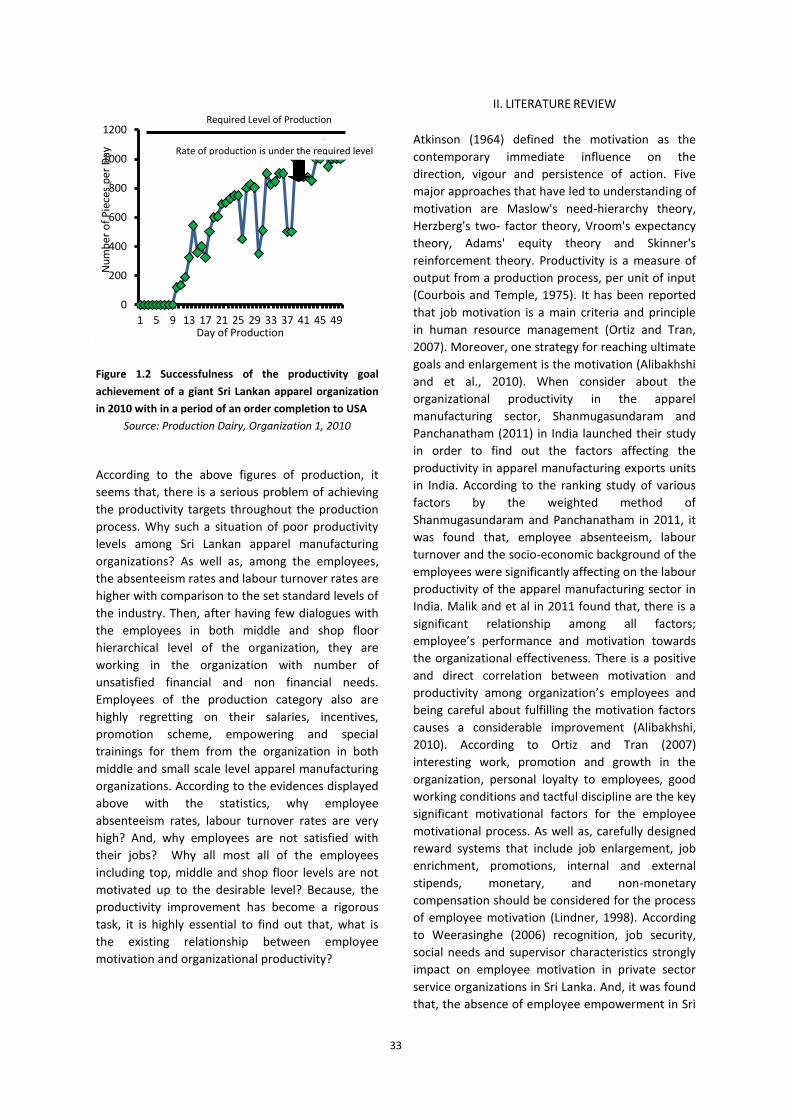
33
Figure 1.2 Successfulness of the productivity goal
achievement of a giant Sri Lankan apparel organization
in 2010 with in a period of an order completion to USA
Source: Production Dairy, Organization 1, 2010
According to the above figures of production, it
seems that, there is a serious problem of achieving
the productivity targets throughout the production
process. Why such a situation of poor productivity
levels among Sri Lankan apparel manufacturing
organizations? As well as, among the employees,
the absenteeism rates and labour turnover rates are
higher with comparison to the set standard levels of
the industry. Then, after having few dialogues with
the employees in both middle and shop floor
hierarchical level of the organization, they are
working in the organization with number of
unsatisfied financial and non financial needs.
Employees of the production category also are
highly regretting on their salaries, incentives,
promotion scheme, empowering and special
trainings for them from the organization in both
middle and small scale level apparel manufacturing
organizations. According to the evidences displayed
above with the statistics, why employee
absenteeism rates, labour turnover rates are very
high? And, why employees are not satisfied with
their jobs? Why all most all of the employees
including top, middle and shop floor levels are not
motivated up to the desirable level? Because, the
productivity improvement has become a rigorous
task, it is highly essential to find out that, what is
the existing relationship between employee
motivation and organizational productivity?
II. LITERATURE REVIEW
Atkinson (1964) defined the motivation as the
contemporary immediate influence on the
direction, vigour and persistence of action. Five
major approaches that have led to understanding of
motivation are Maslow's need-hierarchy theory,
Herzberg's two- factor theory, Vroom's expectancy
theory, Adams' equity theory and Skinner's
reinforcement theory. Productivity is a measure of
output from a production process, per unit of input
(Courbois and Temple, 1975). It has been reported
that job motivation is a main criteria and principle
in human resource management (Ortiz and Tran,
2007). Moreover, one strategy for reaching ultimate
goals and enlargement is the motivation (Alibakhshi
and et al., 2010). When consider about the
organizational productivity in the apparel
manufacturing sector, Shanmugasundaram and
Panchanatham (2011) in India launched their study
in order to find out the factors affecting the
productivity in apparel manufacturing exports units
in India. According to the ranking study of various
factors by the weighted method of
Shanmugasundaram and Panchanatham in 2011, it
was found that, employee absenteeism, labour
turnover and the socio-economic background of the
employees were significantly affecting on the labour
productivity of the apparel manufacturing sector in
India. Malik and et al in 2011 found that, there is a
significant relationship among all factors;
employee’s performance and motivation towards
the organizational effectiveness. There is a positive
and direct correlation between motivation and
productivity among organization’s employees and
being careful about fulfilling the motivation factors
causes a considerable improvement (Alibakhshi,
2010). According to Ortiz and Tran (2007)
interesting work, promotion and growth in the
organization, personal loyalty to employees, good
working conditions and tactful discipline are the key
significant motivational factors for the employee
motivational process. As well as, carefully designed
reward systems that include job enlargement, job
enrichment, promotions, internal and external
stipends, monetary, and non-monetary
compensation should be considered for the process
of employee motivation (Lindner, 1998). According
to Weerasinghe (2006) recognition, job security,
social needs and supervisor characteristics strongly
impact on employee motivation in private sector
service organizations in Sri Lanka. And, it was found
that, the absence of employee empowerment in Sri
0
200
400
600
800
1000
1200
1 5 9 13 17 21 25 29 33 37 41 45 49
Nu
mb
er o
f P
iece
s p
er D
ay
Day of Production
Required Level of Production
Rate of production is under the required level
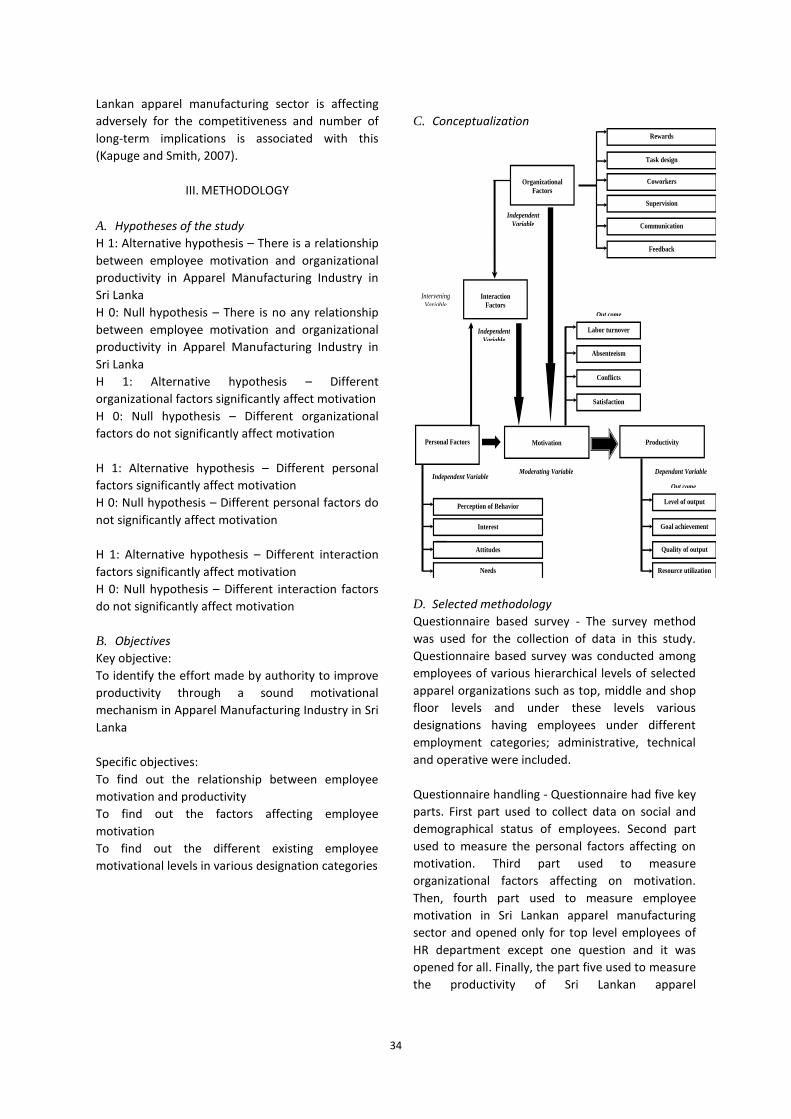
34
Lankan apparel manufacturing sector is affecting
adversely for the competitiveness and number of
long-term implications is associated with this
(Kapuge and Smith, 2007).
III. METHODOLOGY
A. Hypotheses of the study
H 1: Alternative hypothesis – There is a relationship
between employee motivation and organizational
productivity in Apparel Manufacturing Industry in
Sri Lanka
H 0: Null hypothesis – There is no any relationship
between employee motivation and organizational
productivity in Apparel Manufacturing Industry in
Sri Lanka
H 1: Alternative hypothesis – Different
organizational factors significantly affect motivation
H 0: Null hypothesis – Different organizational
factors do not significantly affect motivation
H 1: Alternative hypothesis – Different personal
factors significantly affect motivation
H 0: Null hypothesis – Different personal factors do
not significantly affect motivation
H 1: Alternative hypothesis – Different interaction
factors significantly affect motivation
H 0: Null hypothesis – Different interaction factors
do not significantly affect motivation
B. Objectives
Key objective:
To identify the effort made by authority to improve
productivity through a sound motivational
mechanism in Apparel Manufacturing Industry in Sri
Lanka
Specific objectives:
To find out the relationship between employee
motivation and productivity
To find out the factors affecting employee
motivation
To find out the different existing employee
motivational levels in various designation categories
C. Conceptualization
D. Selected methodology
Questionnaire based survey - The survey method
was used for the collection of data in this study.
Questionnaire based survey was conducted among
employees of various hierarchical levels of selected
apparel organizations such as top, middle and shop
floor levels and under these levels various
designations having employees under different
employment categories; administrative, technical
and operative were included.
Questionnaire handling - Questionnaire had five key
parts. First part used to collect data on social and
demographical status of employees. Second part
used to measure the personal factors affecting on
motivation. Third part used to measure
organizational factors affecting on motivation.
Then, fourth part used to measure employee
motivation in Sri Lankan apparel manufacturing
sector and opened only for top level employees of
HR department except one question and it was
opened for all. Finally, the part five used to measure
the productivity of Sri Lankan apparel
Motivation
Productivity
Personal Factors
Organizational
Factors
Interaction
Factors
Level of output
Goal achievement
Quality of output
Resource utilization
Rewards
Coworkers
Supervision
Task design
Labor turnover
Absenteeism
Satisfaction
Conflicts
Perception of Behavior
Communication
Feedback
Needs
Interest
Attitudes
Independent Variable
Independent
Variable
Moderating Variable Dependant Variable
Independent
Variable
Intervening
Variable
Out come
Out come
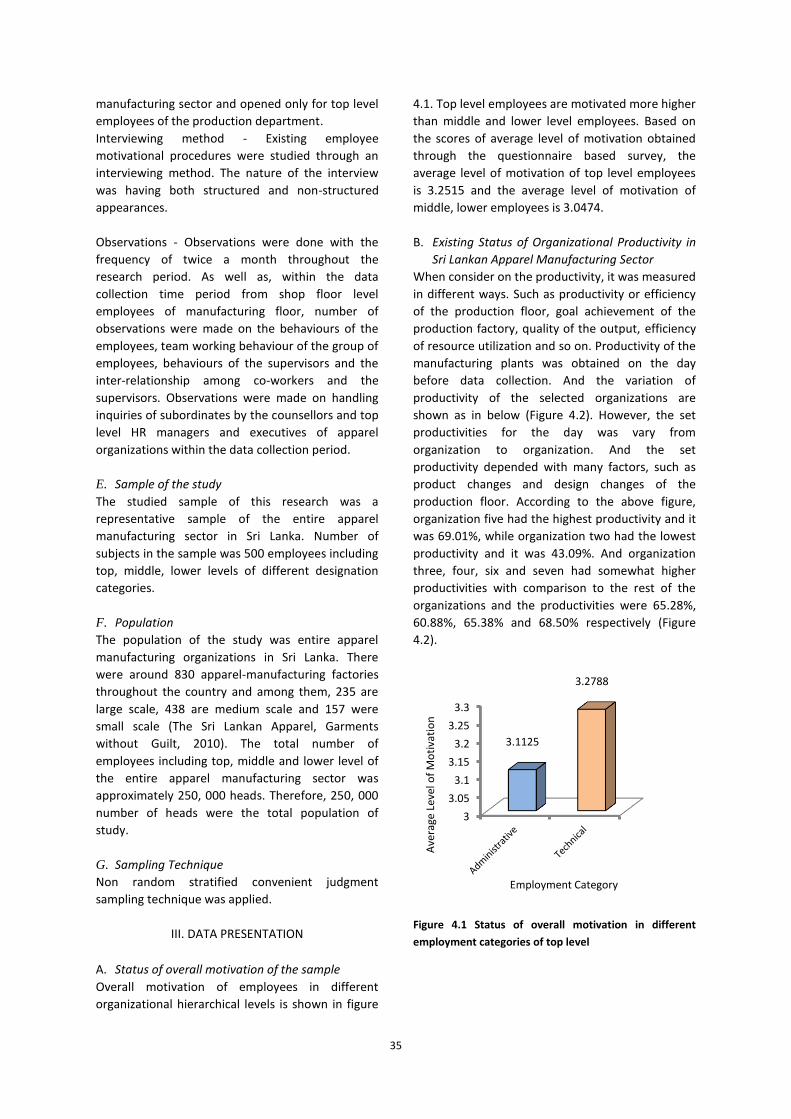
35
manufacturing sector and opened only for top level
employees of the production department.
Interviewing method - Existing employee
motivational procedures were studied through an
interviewing method. The nature of the interview
was having both structured and non-structured
appearances.
Observations - Observations were done with the
frequency of twice a month throughout the
research period. As well as, within the data
collection time period from shop floor level
employees of manufacturing floor, number of
observations were made on the behaviours of the
employees, team working behaviour of the group of
employees, behaviours of the supervisors and the
inter-relationship among co-workers and the
supervisors. Observations were made on handling
inquiries of subordinates by the counsellors and top
level HR managers and executives of apparel
organizations within the data collection period.
E. Sample of the study
The studied sample of this research was a
representative sample of the entire apparel
manufacturing sector in Sri Lanka. Number of
subjects in the sample was 500 employees including
top, middle, lower levels of different designation
categories.
F. Population
The population of the study was entire apparel
manufacturing organizations in Sri Lanka. There
were around 830 apparel-manufacturing factories
throughout the country and among them, 235 are
large scale, 438 are medium scale and 157 were
small scale (The Sri Lankan Apparel, Garments
without Guilt, 2010). The total number of
employees including top, middle and lower level of
the entire apparel manufacturing sector was
approximately 250, 000 heads. Therefore, 250, 000
number of heads were the total population of
study.
G. Sampling Technique
Non random stratified convenient judgment
sampling technique was applied.
III. DATA PRESENTATION
A. Status of overall motivation of the sample
Overall motivation of employees in different
organizational hierarchical levels is shown in figure
4.1. Top level employees are motivated more higher
than middle and lower level employees. Based on
the scores of average level of motivation obtained
through the questionnaire based survey, the
average level of motivation of top level employees
is 3.2515 and the average level of motivation of
middle, lower employees is 3.0474.
B. Existing Status of Organizational Productivity in
Sri Lankan Apparel Manufacturing Sector
When consider on the productivity, it was measured
in different ways. Such as productivity or efficiency
of the production floor, goal achievement of the
production factory, quality of the output, efficiency
of resource utilization and so on. Productivity of the
manufacturing plants was obtained on the day
before data collection. And the variation of
productivity of the selected organizations are
shown as in below (Figure 4.2). However, the set
productivities for the day was vary from
organization to organization. And the set
productivity depended with many factors, such as
product changes and design changes of the
production floor. According to the above figure,
organization five had the highest productivity and it
was 69.01%, while organization two had the lowest
productivity and it was 43.09%. And organization
three, four, six and seven had somewhat higher
productivities with comparison to the rest of the
organizations and the productivities were 65.28%,
60.88%, 65.38% and 68.50% respectively (Figure
4.2).
Figure 4.1 Status of overall motivation in different
employment categories of top level
3
3.05
3.1
3.15
3.2
3.25
3.3
3.1125
3.2788
Ave
rage
Lev
el o
f M
oti
vati
on
Employment Category

36
Figure 4.2 Comparison of the productivity of ten selected
organizations on day before data collection
V. DATA ANALYSIS
A. Testing of Hypothesis 01
According to the Simple Linear Regression method
the test statistics are as in below.
Variables Entered/Removedb
Variables
Entered
Variables
Removed Method
Motivationa . Enter
a. All requested variables entered.
Model Summary
Model R R Square
Adjusted R
Square
Std. Error of
the Estimate
1 .841a .708 .707 .2134920
a. Predictors: (Constant), Motivation
According to the model summery of regression
method as in above, correlation (R) was 0.841 and it
was a strong positive relationship. And R square,
which is the measure of the success of the model,
was 0.708. According to the R square value, 70.80 %
of the variance in productivity was accounted by
employee motivation
The significant value was 0.000 and it was lower
than 0.05 (p < 0.05) and null hypothesis was
rejected and alternative hypothesis was accepted.
So, there was a significant positive relationship
between employee motivation and organizational
productivity. Coefficientsa
Model
Unstandardized
Coefficients
Standardized
Coefficients
t Sig. B Std. Error Beta
1 (Constant) 1.453 .072 20.112 .000
Motivation .804 .023 .841 34.754 .000
a. Dependent Variable:
Productivity
Finally, according to the above Coefficient table,
Beta (Coefficient) was the b (slope) in the regression
equation. Beta was positive and showing positive
relationship. So, the higher the motivation,
productivity also was higher. The regression
equation is: Y = 1.453 + 0.8.4 X
B. Testing of Hypothesis 02
Multiple Linear Regression method was applied for
statistical analysis of hypothesis two. In model
summery the R square was 0.337. According to this
model, 33.70 % of variations in motivation were
explained by feedback, co-workers, task design,
communication, supervision and rewards.
The significant for the model was 0.000 and it was
lower than 0.05 (p < 0.05) and null hypothesis was
55.48
43.09
65.28 60.88
69.01 65.38 68.5
43.78 50.55 52.5
0
20
40
60
80
1 2 3 4 5 6 7 8 9 10
Pro
du
ctiv
ity
on
Day
bef
ore
Dat
a C
olle
ctio
n (
%)
Organization No.
ANOVAb
Model
Sum of
Squares df
Mean
Square F Sig.
1 Regression 55.052 1 55.052 1.208E3 .000a
Residual 22.698 498 .046
Total 77.750 499
a. Predictors:
(Constant),Motivation
b. Dependent Variable:
Productivity
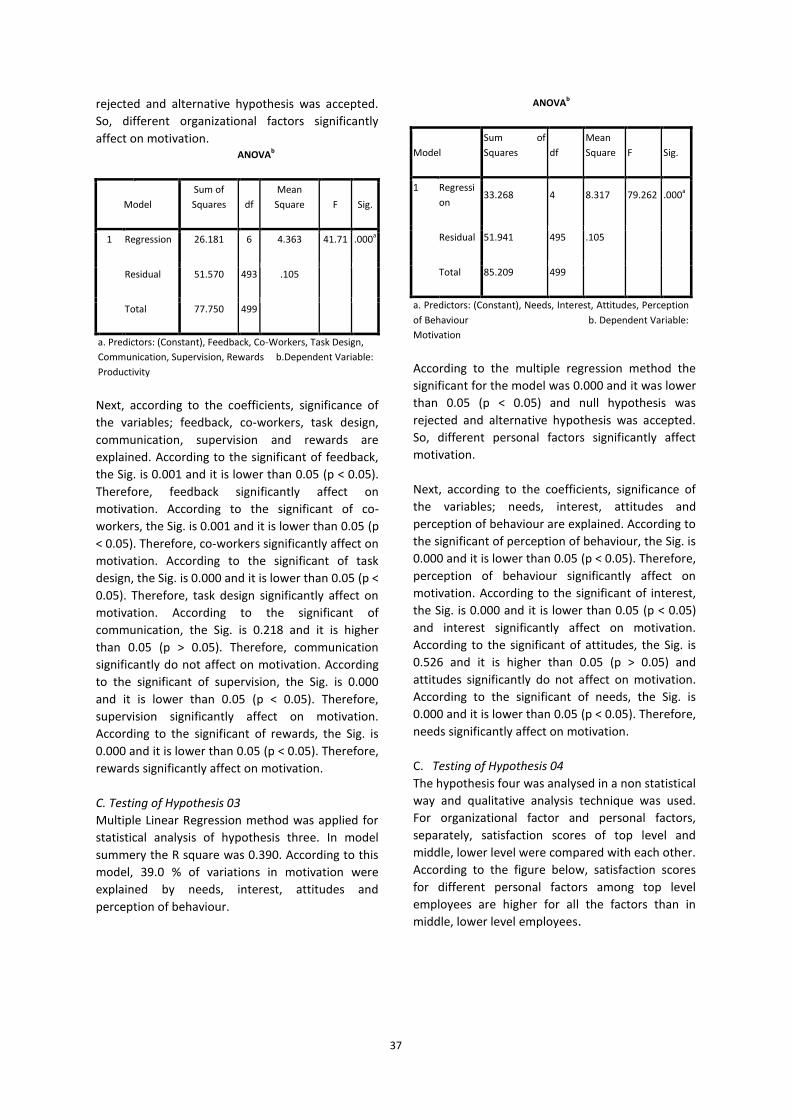
37
rejected and alternative hypothesis was accepted.
So, different organizational factors significantly
affect on motivation. ANOVAb
Model
Sum of
Squares df
Mean
Square F Sig.
1 Regression 26.181 6 4.363 41.71 .000a
Residual 51.570 493 .105
Total 77.750 499
a. Predictors: (Constant), Feedback, Co-Workers, Task Design,
Communication, Supervision, Rewards b.Dependent Variable:
Productivity
Next, according to the coefficients, significance of
the variables; feedback, co-workers, task design,
communication, supervision and rewards are
explained. According to the significant of feedback,
the Sig. is 0.001 and it is lower than 0.05 (p < 0.05).
Therefore, feedback significantly affect on
motivation. According to the significant of co-
workers, the Sig. is 0.001 and it is lower than 0.05 (p
< 0.05). Therefore, co-workers significantly affect on
motivation. According to the significant of task
design, the Sig. is 0.000 and it is lower than 0.05 (p <
0.05). Therefore, task design significantly affect on
motivation. According to the significant of
communication, the Sig. is 0.218 and it is higher
than 0.05 (p > 0.05). Therefore, communication
significantly do not affect on motivation. According
to the significant of supervision, the Sig. is 0.000
and it is lower than 0.05 (p < 0.05). Therefore,
supervision significantly affect on motivation.
According to the significant of rewards, the Sig. is
0.000 and it is lower than 0.05 (p < 0.05). Therefore,
rewards significantly affect on motivation.
C. Testing of Hypothesis 03
Multiple Linear Regression method was applied for
statistical analysis of hypothesis three. In model
summery the R square was 0.390. According to this
model, 39.0 % of variations in motivation were
explained by needs, interest, attitudes and
perception of behaviour.
ANOVAb
Model
Sum of
Squares df
Mean
Square F Sig.
1 Regressi
on 33.268 4 8.317 79.262 .000a
Residual 51.941 495 .105
Total 85.209 499
a. Predictors: (Constant), Needs, Interest, Attitudes, Perception
of Behaviour b. Dependent Variable:
Motivation
According to the multiple regression method the
significant for the model was 0.000 and it was lower
than 0.05 (p < 0.05) and null hypothesis was
rejected and alternative hypothesis was accepted.
So, different personal factors significantly affect
motivation.
Next, according to the coefficients, significance of
the variables; needs, interest, attitudes and
perception of behaviour are explained. According to
the significant of perception of behaviour, the Sig. is
0.000 and it is lower than 0.05 (p < 0.05). Therefore,
perception of behaviour significantly affect on
motivation. According to the significant of interest,
the Sig. is 0.000 and it is lower than 0.05 (p < 0.05)
and interest significantly affect on motivation.
According to the significant of attitudes, the Sig. is
0.526 and it is higher than 0.05 (p > 0.05) and
attitudes significantly do not affect on motivation.
According to the significant of needs, the Sig. is
0.000 and it is lower than 0.05 (p < 0.05). Therefore,
needs significantly affect on motivation.
C. Testing of Hypothesis 04
The hypothesis four was analysed in a non statistical
way and qualitative analysis technique was used.
For organizational factor and personal factors,
separately, satisfaction scores of top level and
middle, lower level were compared with each other.
According to the figure below, satisfaction scores
for different personal factors among top level
employees are higher for all the factors than in
middle, lower level employees.
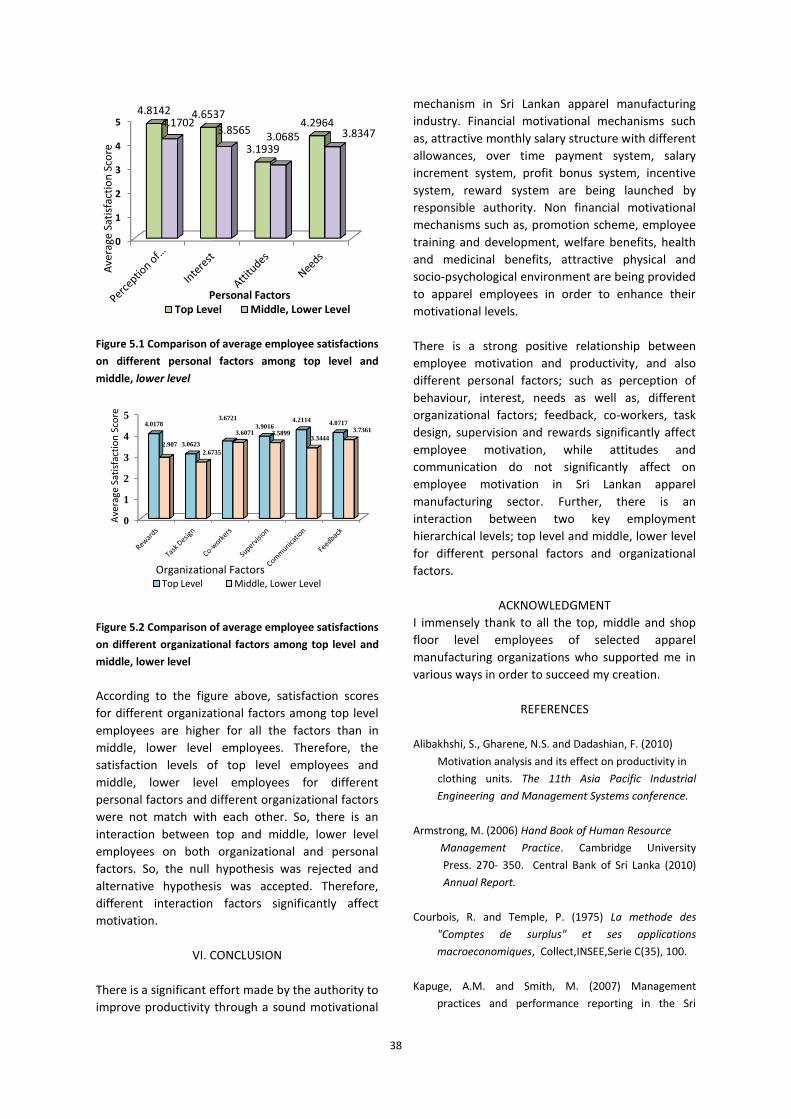
38
Figure 5.1 Comparison of average employee satisfactions
on different personal factors among top level and
middle, lower level
Figure 5.2 Comparison of average employee satisfactions
on different organizational factors among top level and
middle, lower level
According to the figure above, satisfaction scores
for different organizational factors among top level
employees are higher for all the factors than in
middle, lower level employees. Therefore, the
satisfaction levels of top level employees and
middle, lower level employees for different
personal factors and different organizational factors
were not match with each other. So, there is an
interaction between top and middle, lower level
employees on both organizational and personal
factors. So, the null hypothesis was rejected and
alternative hypothesis was accepted. Therefore,
different interaction factors significantly affect
motivation.
VI. CONCLUSION
There is a significant effort made by the authority to
improve productivity through a sound motivational
mechanism in Sri Lankan apparel manufacturing
industry. Financial motivational mechanisms such
as, attractive monthly salary structure with different
allowances, over time payment system, salary
increment system, profit bonus system, incentive
system, reward system are being launched by
responsible authority. Non financial motivational
mechanisms such as, promotion scheme, employee
training and development, welfare benefits, health
and medicinal benefits, attractive physical and
socio-psychological environment are being provided
to apparel employees in order to enhance their
motivational levels.
There is a strong positive relationship between
employee motivation and productivity, and also
different personal factors; such as perception of
behaviour, interest, needs as well as, different
organizational factors; feedback, co-workers, task
design, supervision and rewards significantly affect
employee motivation, while attitudes and
communication do not significantly affect on
employee motivation in Sri Lankan apparel
manufacturing sector. Further, there is an
interaction between two key employment
hierarchical levels; top level and middle, lower level
for different personal factors and organizational
factors.
ACKNOWLEDGMENT
I immensely thank to all the top, middle and shop
floor level employees of selected apparel
manufacturing organizations who supported me in
various ways in order to succeed my creation.
REFERENCES
Alibakhshi, S., Gharene, N.S. and Dadashian, F. (2010)
Motivation analysis and its effect on productivity in
clothing units. The 11th Asia Pacific Industrial
Engineering and Management Systems conference.
Armstrong, M. (2006) Hand Book of Human Resource
Management Practice. Cambridge University
Press. 270- 350. Central Bank of Sri Lanka (2010)
Annual Report.
Courbois, R. and Temple, P. (1975) La methode des
"Comptes de surplus" et ses applications
macroeconomiques, Collect,INSEE,Serie C(35), 100.
Kapuge, A.M. and Smith, M. (2007) Management
practices and performance reporting in the Sri
0
1
2
3
4
5 4.8142 4.6537
3.1939
4.2964 4.1702 3.8565
3.0685 3.8347
Ave
rage
Sat
isfa
ctio
n S
core
Personal Factors Top Level Middle, Lower Level
0
1
2
3
4
5 4.0178
3.0623
3.6721
3.9016 4.2114 4.0717
2.907
2.6735
3.6071 3.5899 3.3444
3.7361
Ave
rage
Sat
isfa
ctio
n S
core
Organizational Factors Top Level Middle, Lower Level
39
Lankan apparel sector, Managerial Auditing
Journal, 22(3), 303 – 318.
Lindner, J.R. (1998) Understanding Employee
Motivation, Journal of Extension 36(3).
Ortiz, Y.R. and Tran, N. (2007) Rewarding and
Recognizing Employees: How IT Professionals in
Sweden and in Finland are Motivated and Prefer
to be Rewarded. Blekinge Institute of Technology,
Master Thesis in Business Administration.
Shanmugasundaram, S. and Panchanatham, N. (2011)
Embracing Manpower for Productivity in Apparel
Industry, International Journal of Innovation,
Management and Technology 2(3).
South Asia Multi-disciplinary Advisory Team (SAAT) (2011)
International Labour Organization, Discussion Paper
The Sri Lankan Apperal (2010) Garments without Guilt.
Weerasinghe, R.N. (2006) The factors influencing
employee motivation in private sector service
organizations in Sri Lanka, ICBM-2006, University
of Sri Jayawardhanapura, Sri Lanka.
BIOGRAPHY OF AUTHORS
MHR Sandeepanie1
is an Assistant
Registrar of General Sir John
Kothelawala Defence University, Sri
Lanka. Her research interests include
Human Resource Management, Training
and Human Resource Development and Operational
Management. She is a Master of Business
Administration (MBA) holder of University of Kelaniya,
Sri Lanka and BSc (Special) (Hons) Graduate. She is a
National Diploma Holder of Institute of Personnel
Management, Sri Lanka and a Certified Trainer in
International Pedagogical ICT from UNIC, Denmark.
Professor EG Ubayachandra2 is a Senior
Lecturer of Department of Marketing,
University of Kelaniya, Sri Lanka. He is
the first Professor and the former head
of Department of Marketing, University
of Kelaniya. His current teaching areas are Economics
and Operational Management. His research interests
include Agricultural Marketing, Productivity and Quality
Improvement. He is a Master of Commerce (MCom)
holder of University of Kelaniya, Sri Lanka and BCom
(Special) (Hons) Graduate.
Photograph
Author 1
Photograph
Author 3
40
Implementation of the 360 Degree Performance Appraisal Feedback System in Private Sector Organizations in Sri Lanka
MRD De Silva
Department of Management and Finance,
General Sir John Kotelawala Defence University, Ratmalana 10390, Sri Lanka [email protected]
Abstract— Performance appraisal is very important
for effective management which helps to develop
the employees and leads to improve the
performance of organizations. The job performance
of employees in an organisation is measured and
evaluated through a performance appraisal system
over a period of time with set standards. Different
types of organizations are using different methods
of performance evaluation and 360 degrees
performance appraisal is one of them. Though, this
system is not popular in Sri Lanka, many
multinational organizations are using this method
for measuring employees’ performance. This
technique receives feedback of employees’
performance not only from their supervisor/s but
also from co-workers, subordinates, self, customers
etc. as a multiple source feedback. Many
organizations in Sri Lanka are managed as per the
hierarchy and the decisions are made by the top
level of the hierarchy. Most of the time,
subordinates are dissatisfied about their
performance rating which was given by their
supervisor due to the usage of a performance
feedback system that does not absorb the real
image of their performances. Therefore, the
research problem was whether the 360 degree
performance feedback system can be implemented
in Sri Lankan private sector organizations or not.
This paper attempts to discuss possible ways of
implementing this system in private sector
organizations in Sri Lanka. Quantitative as well as
qualitative data were utilized to achieve the
objectives. The sample includes 200 employees from
selected 10 medium and large scale organizations in
Colombo area. A random number table was utilized
to select 20 employees from each organisation.
Data presentation and analysis were based on
selected statistical measures (central tendency,
dispersion and skewness), diagrams and tables.
SPSS software was utilized to analyse the collected
data. The results depict that the 360 degree
performance feedback system is not utilised by the
private organisations in Colombo area mainly due to
the hierarchy of the organizational culture, not
suitable for their organisation, time consumption
and unawareness. However, the findings show
that there are some avenues to implement the 360
degree performance feedback system as an addition
to the existing conventional appraisal system.
Implementation of the 360 degree performance
appraisal feedback system in Sri Lankan private
sector organizations will help to develop the
organizations as well as to increase satisfaction
levels of employees.
Keywords — 360 degree feedback system,
Employee satisfaction, Organisation development,
Performance appraisal
I. INTRODUCTION
Performance appraisal of employees is necessary to
understand abilities of each employee’s
competencies, relative merit and worth for the
organisation. Each employee in an organisation is
interested in performance feedback in order to
know how well he or she performs in his or her
tasks. One of the most important ways that
employees can develop in an organisation is to
receive feedback ratings of their performance.
Traditionally, employees received feedback of their
performance only from their supervisor/s. In 360
degree feedback system, employees receive
multiple source feedback on their performances not
only from their supervisor/s but also from co-
workers, subordinates, the employees themselves,
customers, etc. Therefore, it is also known as multi
source feedback as it collects information of
employee’s performance from many angles. The
methodology behind the 360 degree feedback
system is to absorb the real image of the employee
performance by studying in depth information
about the current performance. It helps to reduce
bias rating as feedback are collected from many
sources and also an employee can identify how
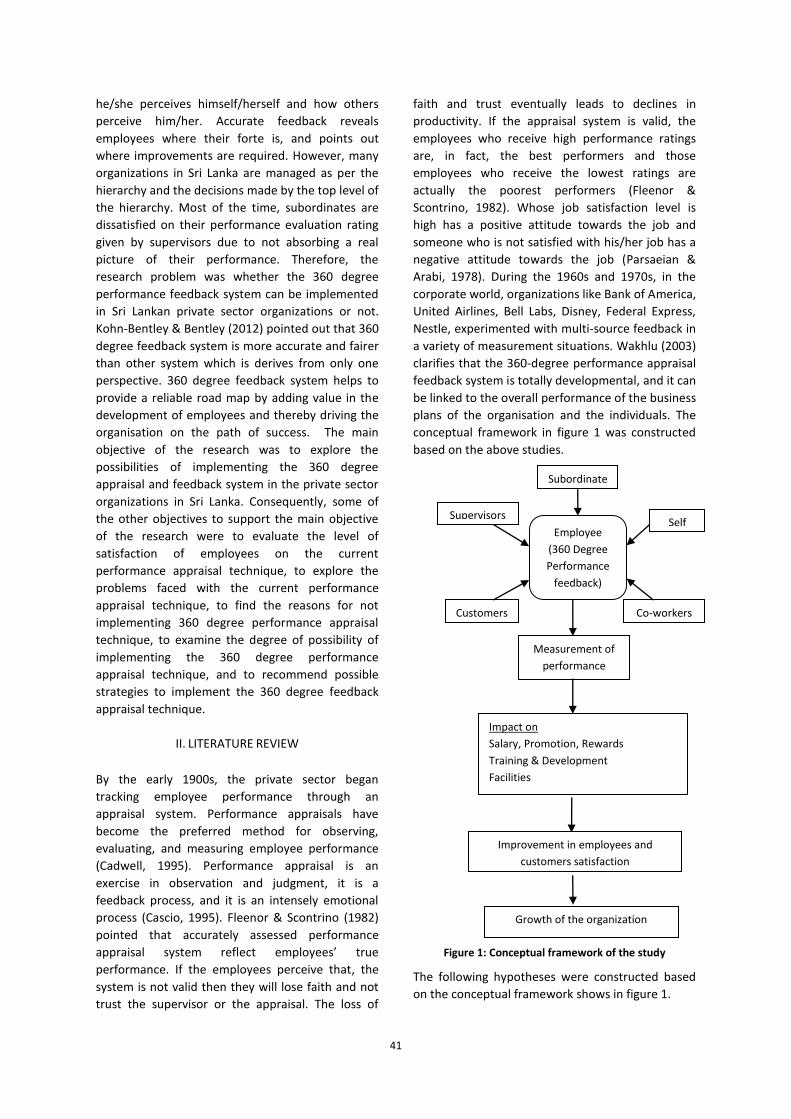
41
he/she perceives himself/herself and how others
perceive him/her. Accurate feedback reveals
employees where their forte is, and points out
where improvements are required. However, many
organizations in Sri Lanka are managed as per the
hierarchy and the decisions made by the top level of
the hierarchy. Most of the time, subordinates are
dissatisfied on their performance evaluation rating
given by supervisors due to not absorbing a real
picture of their performance. Therefore, the
research problem was whether the 360 degree
performance feedback system can be implemented
in Sri Lankan private sector organizations or not.
Kohn-Bentley & Bentley (2012) pointed out that 360
degree feedback system is more accurate and fairer
than other system which is derives from only one
perspective. 360 degree feedback system helps to
provide a reliable road map by adding value in the
development of employees and thereby driving the
organisation on the path of success. The main
objective of the research was to explore the
possibilities of implementing the 360 degree
appraisal and feedback system in the private sector
organizations in Sri Lanka. Consequently, some of
the other objectives to support the main objective
of the research were to evaluate the level of
satisfaction of employees on the current
performance appraisal technique, to explore the
problems faced with the current performance
appraisal technique, to find the reasons for not
implementing 360 degree performance appraisal
technique, to examine the degree of possibility of
implementing the 360 degree performance
appraisal technique, and to recommend possible
strategies to implement the 360 degree feedback
appraisal technique.
II. LITERATURE REVIEW
By the early 1900s, the private sector began
tracking employee performance through an
appraisal system. Performance appraisals have
become the preferred method for observing,
evaluating, and measuring employee performance
(Cadwell, 1995). Performance appraisal is an
exercise in observation and judgment, it is a
feedback process, and it is an intensely emotional
process (Cascio, 1995). Fleenor & Scontrino (1982)
pointed that accurately assessed performance
appraisal system reflect employees’ true
performance. If the employees perceive that, the
system is not valid then they will lose faith and not
trust the supervisor or the appraisal. The loss of
faith and trust eventually leads to declines in
productivity. If the appraisal system is valid, the
employees who receive high performance ratings
are, in fact, the best performers and those
employees who receive the lowest ratings are
actually the poorest performers (Fleenor &
Scontrino, 1982). Whose job satisfaction level is
high has a positive attitude towards the job and
someone who is not satisfied with his/her job has a
negative attitude towards the job (Parsaeian &
Arabi, 1978). During the 1960s and 1970s, in the
corporate world, organizations like Bank of America,
United Airlines, Bell Labs, Disney, Federal Express,
Nestle, experimented with multi-source feedback in
a variety of measurement situations. Wakhlu (2003)
clarifies that the 360-degree performance appraisal
feedback system is totally developmental, and it can
be linked to the overall performance of the business
plans of the organisation and the individuals. The
conceptual framework in figure 1 was constructed
based on the above studies.
Figure 1: Conceptual framework of the study
The following hypotheses were constructed based
on the conceptual framework shows in figure 1.
Growth of the organization
Improvement in employees and
customers satisfaction
Employee
(360 Degree
Performance
feedback)
Supervisors
Subordinate
s
Self
(Emplo
yee)
Co-workers
Customers
Impact on
Salary, Promotion, Rewards
Training & Development
Facilities
Measurement of
performance
rating
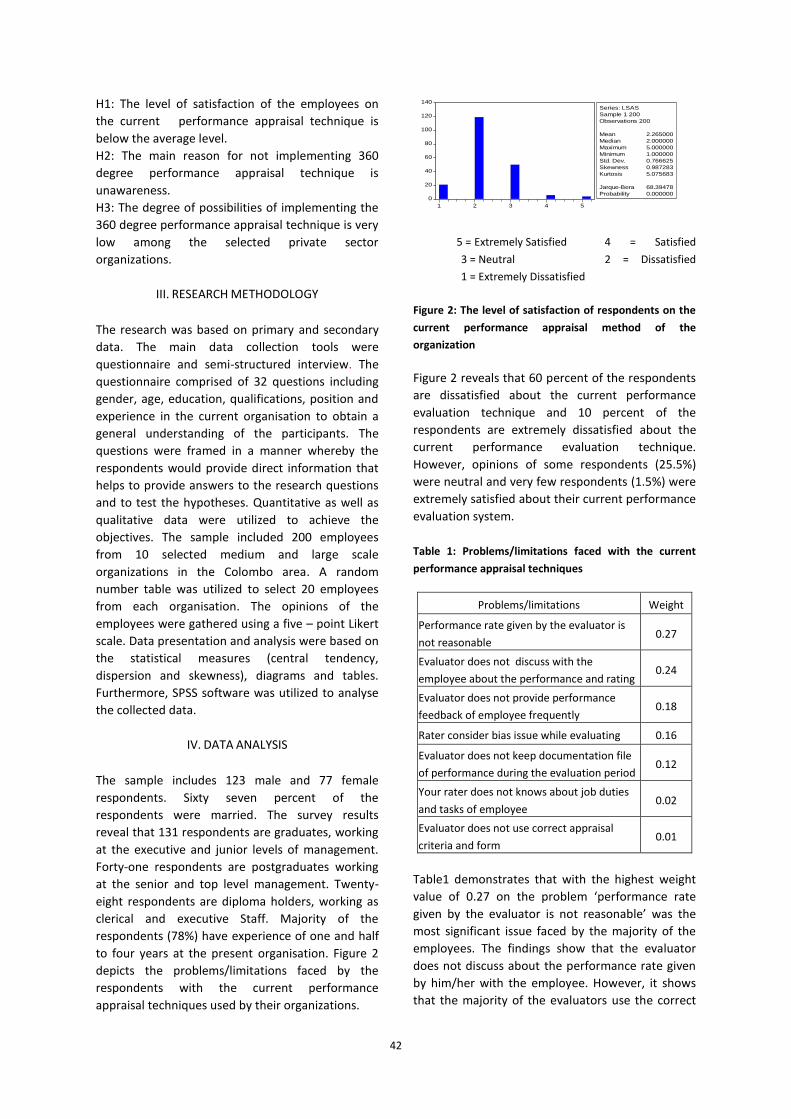
42
H1: The level of satisfaction of the employees on
the current performance appraisal technique is
below the average level.
H2: The main reason for not implementing 360
degree performance appraisal technique is
unawareness.
H3: The degree of possibilities of implementing the
360 degree performance appraisal technique is very
low among the selected private sector
organizations.
III. RESEARCH METHODOLOGY
The research was based on primary and secondary
data. The main data collection tools were
questionnaire and semi-structured interview. The
questionnaire comprised of 32 questions including
gender, age, education, qualifications, position and
experience in the current organisation to obtain a
general understanding of the participants. The
questions were framed in a manner whereby the
respondents would provide direct information that
helps to provide answers to the research questions
and to test the hypotheses. Quantitative as well as
qualitative data were utilized to achieve the
objectives. The sample included 200 employees
from 10 selected medium and large scale
organizations in the Colombo area. A random
number table was utilized to select 20 employees
from each organisation. The opinions of the
employees were gathered using a five – point Likert
scale. Data presentation and analysis were based on
the statistical measures (central tendency,
dispersion and skewness), diagrams and tables.
Furthermore, SPSS software was utilized to analyse
the collected data.
IV. DATA ANALYSIS
The sample includes 123 male and 77 female
respondents. Sixty seven percent of the
respondents were married. The survey results
reveal that 131 respondents are graduates, working
at the executive and junior levels of management.
Forty-one respondents are postgraduates working
at the senior and top level management. Twenty-
eight respondents are diploma holders, working as
clerical and executive Staff. Majority of the
respondents (78%) have experience of one and half
to four years at the present organisation. Figure 2
depicts the problems/limitations faced by the
respondents with the current performance
appraisal techniques used by their organizations.
5 = Extremely Satisfied 4 = Satisfied
3 = Neutral 2 = Dissatisfied
1 = Extremely Dissatisfied
Figure 2: The level of satisfaction of respondents on the
current performance appraisal method of the
organization
Figure 2 reveals that 60 percent of the respondents
are dissatisfied about the current performance
evaluation technique and 10 percent of the
respondents are extremely dissatisfied about the
current performance evaluation technique.
However, opinions of some respondents (25.5%)
were neutral and very few respondents (1.5%) were
extremely satisfied about their current performance
evaluation system.
Table 1: Problems/limitations faced with the current
performance appraisal techniques
Problems/limitations Weight
Performance rate given by the evaluator is
not reasonable 0.27
Evaluator does not discuss with the
employee about the performance and rating 0.24
Evaluator does not provide performance
feedback of employee frequently 0.18
Rater consider bias issue while evaluating 0.16
Evaluator does not keep documentation file
of performance during the evaluation period 0.12
Your rater does not knows about job duties
and tasks of employee 0.02
Evaluator does not use correct appraisal
criteria and form 0.01
Table1 demonstrates that with the highest weight
value of 0.27 on the problem ‘performance rate
given by the evaluator is not reasonable’ was the
most significant issue faced by the majority of the
employees. The findings show that the evaluator
does not discuss about the performance rate given
by him/her with the employee. However, it shows
that the majority of the evaluators use the correct
0
20
40
60
80
100
120
140
1 2 3 4 5
Series: LSAS
Sample 1 200
Observations 200
Mean 2.265000
Median 2.000000
Maximum 5.000000
Minimum 1.000000
Std. Dev. 0.766625
Skewness 0.987283
Kurtosis 5.075683
Jarque-Bera 68.39478
Probability 0.000000
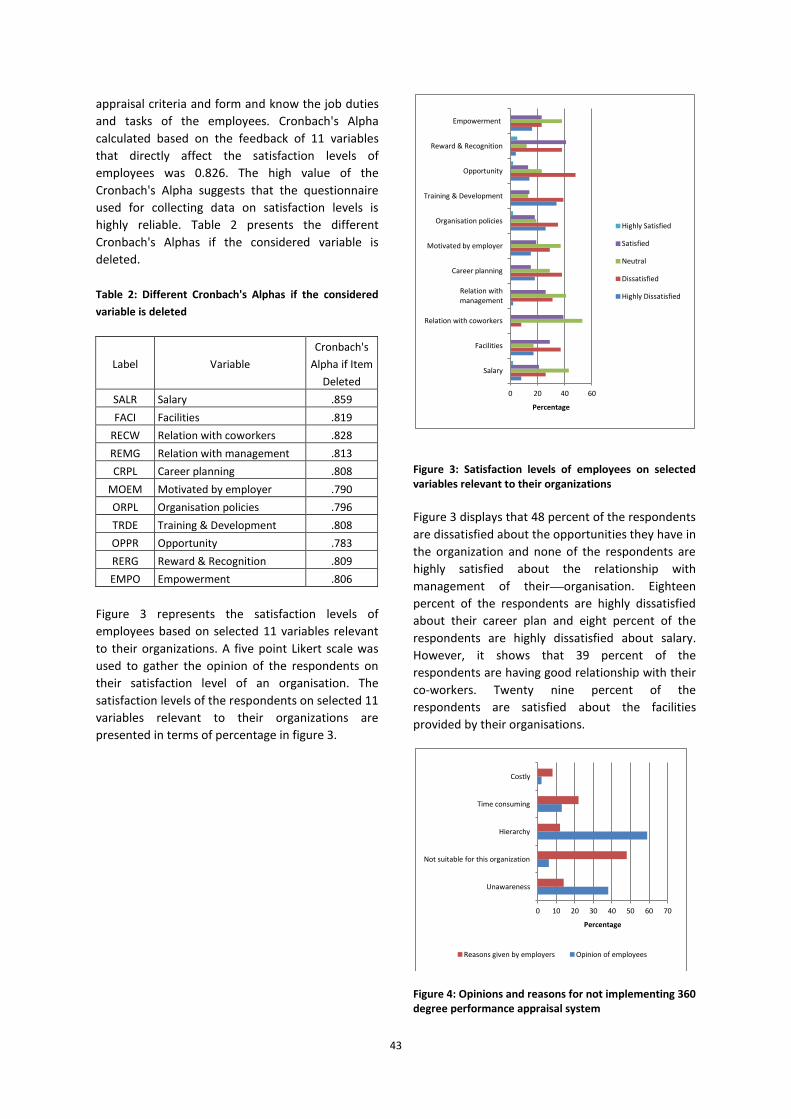
43
appraisal criteria and form and know the job duties
and tasks of the employees. Cronbach's Alpha
calculated based on the feedback of 11 variables
that directly affect the satisfaction levels of
employees was 0.826. The high value of the
Cronbach's Alpha suggests that the questionnaire
used for collecting data on satisfaction levels is
highly reliable. Table 2 presents the different
Cronbach's Alphas if the considered variable is
deleted.
Table 2: Different Cronbach's Alphas if the considered
variable is deleted
Label Variable
Cronbach's
Alpha if Item
Deleted
SALR Salary .859
FACI Facilities .819
RECW Relation with coworkers .828
REMG Relation with management .813
CRPL Career planning .808
MOEM Motivated by employer .790
ORPL Organisation policies .796
TRDE Training & Development .808
OPPR Opportunity .783
RERG Reward & Recognition .809
EMPO Empowerment .806
Figure 3 represents the satisfaction levels of
employees based on selected 11 variables relevant
to their organizations. A five point Likert scale was
used to gather the opinion of the respondents on
their satisfaction level of an organisation. The
satisfaction levels of the respondents on selected 11
variables relevant to their organizations are
presented in terms of percentage in figure 3.
Figure 3: Satisfaction levels of employees on selected variables relevant to their organizations
Figure 3 displays that 48 percent of the respondents
are dissatisfied about the opportunities they have in
the organization and none of the respondents are
highly satisfied about the relationship with
management of their organisation. Eighteen
percent of the respondents are highly dissatisfied
about their career plan and eight percent of the
respondents are highly dissatisfied about salary.
However, it shows that 39 percent of the
respondents are having good relationship with their
co-workers. Twenty nine percent of the
respondents are satisfied about the facilities
provided by their organisations.
Figure 4: Opinions and reasons for not implementing 360 degree performance appraisal system
0 20 40 60
Salary
Facilities
Relation with coworkers
Relation with management
Career planning
Motivated by employer
Organisation policies
Training & Development
Opportunity
Reward & Recognition
Empowerment
Percentage
Highly Satisfied
Satisfied
Neutral
Dissatisfied
Highly Dissatisfied
0 10 20 30 40 50 60 70
Unawareness
Not suitable for this organization
Hierarchy
Time consuming
Costly
Percentage
Reasons given by employers Opinion of employees

44
Figure 4 represents reasons for not implementing
360 degree performance appraisal feedback system
at their organizations. The opinion of 56 percent of
employees as the reason for not implementing 360
degree performance feedback system was due to
the hierarchy of the organisation culture. The
reason presented 35 percent of the employees was
unawareness on 360 degree performance feedback
system. According to the opinion of 46 percent of
employers, 360 degree performance feedback
system is not suitable for their organisation and 21
percent of employers have mentioned that this
system is time consuming.
V. CONCLUSION
The study reveals that most of the employees are
not fully satisfied with the existing performance
rating and evaluation technique. The 360 degree
performance feedback system is not utilised by the
private sector organisations in Colombo area due to
the hierarchy of the organisation culture,
unawareness, unsuitability for their organisation
and time consumption. However, 73 percent of the
respondents have demonstrated positive reactions
to the 360 degree feedback process and its
implementation. Hence, there is a possibility of
implementing the 360 degree performance
feedback system in the selected private sector
organisations. The implementation of the 360
degree performance feedback system in an
organisation will enhance the satisfaction level of
the employees and the growth of the organization.
Private sector organizations can implement the 360
degree feedback system as an addition to the
existing performance appraisal technique and
compare the results for further improvements.
REFERENCES
Angelo S. DeNisi and Avraham N. Kluger (2011)
Feedback effectiveness:Can 360-degree
appraisals be improved? The Academy of
Management. Vol. 14, No. 1. Available from:
http://www.jstor.org/stable/4165614
[ Accessed 23th January, 2013].
Asst.Prof,Nalla Malla Reddy (2012). Multi source feedback
based performance appraisal system using Fuzzy
logic decision support system. International Journal
on Soft Computing.
Vo l.3, No.1 Available from:
http://arxiv.org/ftp/arxiv/papers/1203/1203.1
882. [Accessed 4th May, 2014].
Dr. Satyawan Baroda, Chhavi Sharma, Jyoti Kandpal
(2012) Feedback Appraisals- An Innovative
approach of Performance Management System.
International Journal of Management & Information
Technology. Volume 1, No 2, ISSN: 2278-5612.
Available from: www.ijmit.com.
[Accessed 10 th November 2013].
John W , Jeffrey Michael. Using 360 – degree Feedback in
Organisations. Greenboro , North Carolina. Center
for Creative Leadership.
Mohammad, Goudarzi, Shirin (2013). 360 Degree
Feedback and Performance Evaluation Method
Based on the Managers and Executives Examining
their Relationship to Job Satisfaction. Journal of
Basic and Applied Scientific Research. ISSN 2090-
4304 .Available from : http://www.textroad.com
Richard Lepsinger, Anntoinette D.Lucia Ed. (2009).The art
and science of 360 degree feedback. San Francisco,
Jossey Bass publishing.
Savneet Kaur (2013) 360 Degrees Performance Appraisal-
Benefits & Shortcoming. International Journal of
Emerging Research in Management &Technology:
ISSN: 2278-9359(Volume-2, Issue-6).
Shilpa Wadhwa, Parul Wadhwa (2011). A Study of 360-
Degree Appraisal and Feedback System for Effective
Implementation in Indian Corporate Sector. VSRD
International Journal of Business & Management
Research. VSRD-IJBMR, Vol. 1 (4), 2011, 2231 248X.
Available from: www.visualsoftindia.com/
journal.html. [Accessed 04th October 2013].
BIOGRAPHY OF THE AUTHOR
Romita Devi De Silva is a lecturer at the
Department of Management and
Finance, General Sir John Kotelawala
Defence University, Sri Lanka. Her
research interests include performance
evaluation, services marketing and industrial relations.
She has produced several research publications locally
and internationally. Romita Devi De Silva has supervised
more than ten postgraduate and undergraduate
researches.
Photograph
Author 1
45
Is Stress a Bad Factor in Employee Work Performance (EWP) in Sri Lankan Public Sector?
Tilak Wijesundara
1, WAND Wijesinghe
2, Rangika Chinthani
3
1Department of Sociology, University of Ruhuna, Sri Lanka
2Department of Economics, University of Ruhuna, Sri Lanka
3Research Scholar, Department of Sciology, University of Ruhuna, Sri Lanka
Abstract- Stress experienced by employees has been
identified by plenty of scholars as a horrible
phenomenon that should be eliminated so that the
employee work performance (EWP) could be
enhanced. In other word, stress has mostly been
noted as a negative phenomenon as far as the EWP
is concerned. This notion of idea was tested in the
present enquiry by analyzing data obtained in Sri
Lankan public sector organizations. The study was
conducted in the months between July to December
2013 in association with Sri Lankan public sector
organizations covering three provinces (Western,
Southern, and North Central). The sample studied
was composed of 661 employees belonged to three
employee categories (managerial, clerical, and
below clerical) working in three organizational
categories (national, provincial, and district). The
methodology of the study was the survey method in
which a questionnaire was used as the key data
gathering tool. Data analysis process was occurred
by the use of computer based SPSS package (version
20), and one-way ANOVA system was used to
investigate co-relations among variables. The study
clearly identified those who had experienced some
level of stress reported over 30% work performance
as compared to those who experienced no stress.
According to the result of the hypothesis test, it was
found that there is no significant difference in mean
impact level due to stress among employees
belonged to diverse employee or organizational
categories. These findings are a clear indication to
suggest that stress caused by employees
(irrespective of their employee and organizational
categories) is no longer a horrible factor in taking
EWP into account, and what is the truth is the
opposite. Last but not the least, the findings of the
study makes a counter argument against the
dominant ideology, to state that some level of
stress experienced by employees is a positive factor
that enhances EWP.
Keywords: Stress, Employee Work Performance
(EWP), Findings
I. INTRODUCTION
Stress is a fact, and a normal part of everyday life
(Klinic Community Health Centre, 2010). Stress is
often described as a feeling of being overloaded,
wound up tight, tense, and worried. We all
experience stress at times. It can sometimes help to
motivate us to help to get a task finished, or
perform well. But stress can also be harmful if we
become over-stressed and it interferes with our
ability to get on with our normal life for too long
(Australian Psychological Society.2014). Stress has
also been most often linked to organization setup,
and plenty of studies have been focused on
organizational employees. What is equally
important is that most of studies have noted the
relationship between employee work performance
(EWP) and the level of their stress, to say that more
stress causes low EWP and vice-verse. Thus, stress
has mostly been noted as a negative phenomenon
as far as the EWP is concerned. This notion of idea
was tested in the present enquiry, and it was
intended to investigate whether this ideology
(concerning stress as a negative factor as far as the
EWP is concerned) would come into reality by
analyzing data obtained in Sri Lankan public sector
organizations. This purpose would be achieved by
addressing three research questions (as discussed
later).
II. SIGNIFICANCE OF THE STUDY
Even though organizational studies have been
plenty in the field of management, surprisingly few
studies are to be found organizational studies in
sociological perspective. Sociological inquiries in
this particular field would in fact bring a remarkable
insight particularly on social factors in

46
organizations, that on the other hand could be used
in order to enhance the employee work
performance in general and organizational
effectiveness in particular. Specifically, the study
brings some hidden factors of stress in employees.
Accordingly, this study unveils certain novel
pathways in the study of organizations, and
thereby, the study carries an enormous
significance.
III. RESEARCH QUESTIONS
The study tends to raise following three questions;
1. What sort of correlation does exist between
EWP and the level of stress faced by
employees in the context of organizations?
2. Whether there is a significant difference of the
level of stress faced by employees according
to organizational category?
3. Whether there is a significant difference of the
level of stress faced by employees according
to job category?
IV. METHODOLOGY
The study was conducted in the months between
July to December 2013 in association with Sri
Lankan public sector organizations covering three
provinces (Western, Southern, and North Central).
The sample studied was composed of 661
employees belonged to three employee categories
(managerial, clerical, and below clerical) working in
three organizational categories (national,
provincial, and district). The methodology of the
study was the survey method in which a
questionnaire was used as the key data gathering
tool (quantitative data). In addition, case study and
simple observation methods (Qualitative data)
were used in the study Data analysis process for
quantitative data was occurred by the use of
computer based SPSS package (version 20), and
one-way ANOVA system was used to investigate co-
relations among variables, whereas qualitative data
were thoroughly analyzed to come into logical
conclusions.
V. DATA ANALYSIS AND FINDINGS OF THE STUDY
I. EWP and the Level of Stress
The study clearly identified those who had
experienced some level of stress reported 31.19%
work performance as compared to those who
experienced no stress. According to case studies, it
was clearly found that almost all respondents
admitted the positive character of their stress..For
instance, most of them elaborated (See Box 1) that
their stress would enhance their work performance Box 1: Some Level of Stress is Better
Gunawardena, a development assistant belonged to clerical and parallel services in a district level organization stated the positive side of his stress in his work “In my point of view, stress helps me to perform my work tasks on time, with no delay. It seems that I tend to neglect even my day to day activities when I feel no stress, According to my knowledge, my colleagues too work better when they have some level of stress. So, I feel some level of stress is advantageous in personal and organizational level”
Source: Field Study 2013
II. The Level of Stress Faced by Employees According to Organizational Category and Job Category
Here, it was intended to make findings through one way ANOVA. The related assumptions are indicated as follows;
a. All three populations involved follow normal distribution
b. All populations have the same variance c. The samples are randomly selected and
independent of one another
According to our analysis, the above assumptions
were found to be true, and resembled to the data
in the study, and therefore continued with ANOVA.
VI. HYPOTHESIS APPLIED IN THE STUDY
For the level of stress faced by employees according to organizational category
Null hypothesis (H0) – The mean levels of the impact of work on the organization due to stress do not differ within the three levels of organizational categories.
Alternative hypothesis (Ha) – The mean levels of the impact of work on the organization due to stress differ for at least two of the three levels of organizational categories.
For the level of stress faced by employees according to job category
Null hypothesis (H0) – The mean levels of the
impact of work on the organization due to
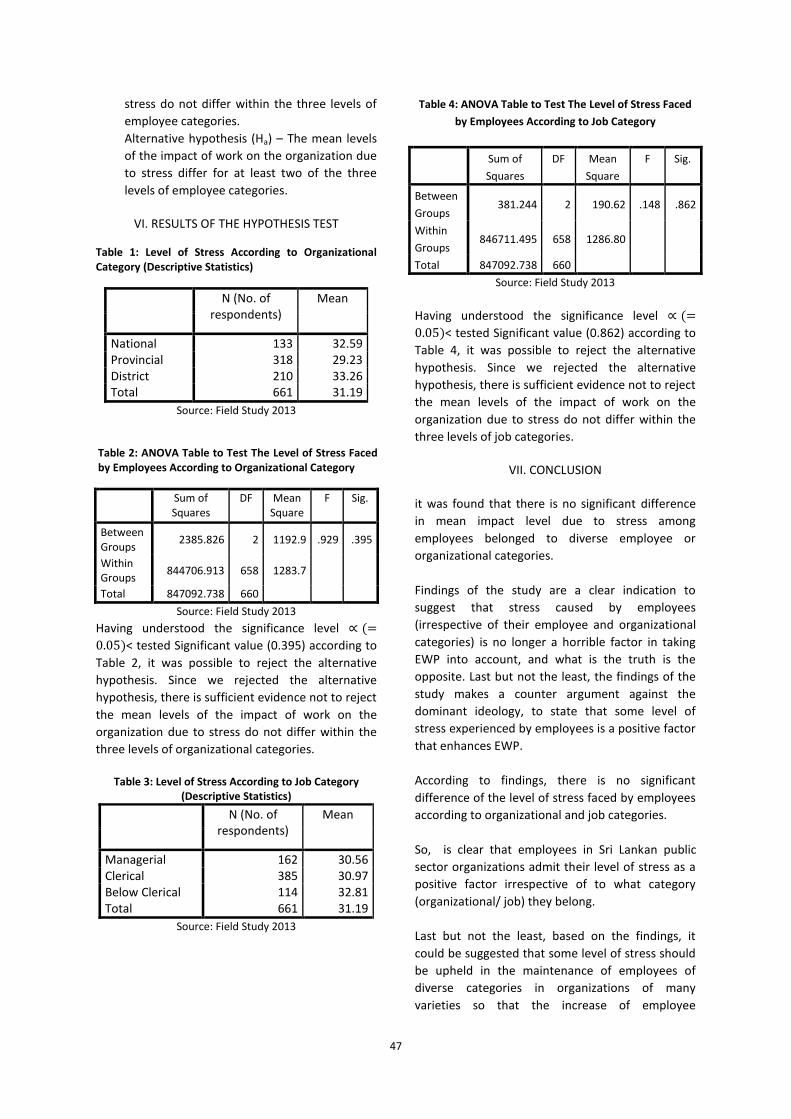
47
stress do not differ within the three levels of
employee categories.
Alternative hypothesis (Ha) – The mean levels
of the impact of work on the organization due
to stress differ for at least two of the three
levels of employee categories.
VI. RESULTS OF THE HYPOTHESIS TEST
Table 1: Level of Stress According to Organizational Category (Descriptive Statistics)
N (No. of respondents)
Mean
National 133 32.59 Provincial 318 29.23 District 210 33.26 Total 661 31.19
Source: Field Study 2013
Table 2: ANOVA Table to Test The Level of Stress Faced by Employees According to Organizational Category
Sum of Squares
DF Mean Square
F Sig.
Between Groups
2385.826 2 1192.9 .929 .395
Within Groups
844706.913 658 1283.7
Total 847092.738 660
Source: Field Study 2013
Having understood the significance level
< tested Significant value (0.395) according to
Table 2, it was possible to reject the alternative
hypothesis. Since we rejected the alternative
hypothesis, there is sufficient evidence not to reject
the mean levels of the impact of work on the
organization due to stress do not differ within the
three levels of organizational categories.
Table 3: Level of Stress According to Job Category
(Descriptive Statistics)
N (No. of respondents)
Mean
Managerial 162 30.56 Clerical 385 30.97 Below Clerical 114 32.81 Total 661 31.19
Source: Field Study 2013
Table 4: ANOVA Table to Test The Level of Stress Faced
by Employees According to Job Category
Sum of
Squares
DF Mean
Square
F Sig.
Between
Groups 381.244 2 190.62 .148 .862
Within
Groups 846711.495 658 1286.80
Total 847092.738 660
Source: Field Study 2013
Having understood the significance level
< tested Significant value (0.862) according to
Table 4, it was possible to reject the alternative
hypothesis. Since we rejected the alternative
hypothesis, there is sufficient evidence not to reject
the mean levels of the impact of work on the
organization due to stress do not differ within the
three levels of job categories.
VII. CONCLUSION
it was found that there is no significant difference
in mean impact level due to stress among
employees belonged to diverse employee or
organizational categories.
Findings of the study are a clear indication to
suggest that stress caused by employees
(irrespective of their employee and organizational
categories) is no longer a horrible factor in taking
EWP into account, and what is the truth is the
opposite. Last but not the least, the findings of the
study makes a counter argument against the
dominant ideology, to state that some level of
stress experienced by employees is a positive factor
that enhances EWP.
According to findings, there is no significant
difference of the level of stress faced by employees
according to organizational and job categories.
So, is clear that employees in Sri Lankan public
sector organizations admit their level of stress as a
positive factor irrespective of to what category
(organizational/ job) they belong.
Last but not the least, based on the findings, it
could be suggested that some level of stress should
be upheld in the maintenance of employees of
diverse categories in organizations of many
varieties so that the increase of employee
48
performance in general and the organizational
performance in particular.
REFERENCES
Job Stress: Causes, Impact, and Interventions in the
health and Community Services Sector (2006),
Commissioned Research Final report, Nov
2006, University of South Australia
LekaStavrla et al (2003) ‘Work Organization and Stress’
Systematic Problem Approaches for
Employers, Managers and Trade Union
Representatives ’, Protecting Workers’ health
Series No 3, World Health organization
Managing the Causes of Work-Related Stress: A Step by
Step Approach Using the management
Standards (2007), HSE Books
Stress Management- A Practical Guide, Concordia
University Health Services,
http://health.concordia.ca, accessed on 20th
June, 2014
‘Understanding and Managing Stress at Cornell’, Gannett
Health Services, Cornell University
‘Work-Related Stress’, Topic Inspection Pack (2011)
Human Factors, Ergonomics, and Psychological
Unit, HSE Books
BIOGRAPHY OFAUTHORS
Dr. Tilak Wijesundara,
B A (Hons) (Ruhuna Sri Lanka), MA (JNU, India), DL
Wuhan, China)
Senior Lecturer, Department of Sociology, University of
Ruhuna, Matara, Sri Lanka
Mr. W A N D Wijesinghe,
B Sc (Ruhuna, Sri Lanka), MCA (Bangalore, India)
Lecturer, Department of Economics, University of
Ruhuna, Matara, Sri Lanka
Mrs. K A R Chinthani,
B A (Ruhuna, Sri Lanka)
MPhil Candidate /Research Assistant (TURIS Project),
University of Ruhuna
49
Analysis of the Household Demand for Dairy Products in Sri Lanka:
An Almost Ideal Estimation with a Censored Regression
LDM Nimanthika1, JC Edirisinghe2
1 2
Department of Agribusiness Management, Faculty of Agriculture and Plantation Management,
Wayamba University of Sri Lanka, Makandura, Gonawila (NWP), Sri Lanka 1
Abstract — Being the leading segment in the
livestock sector in Sri Lanka, the dairy sector still is
incapable of meeting at least half of the domestic
requirement. Moreover, the annual per capita
consumption of milk remains lower than the
recommended level for an average Sri Lankan.
Hence, this study intends to present price and
expenditure elasticities, in order to discover the
consumption behaviour of five types of dairy
products. Further, this aims to determine the impact
of demographic factors which influence the dietary
choices of those dairy produce. This paper employed
the Linear Approximation of the Almost Ideal
Demand System (LA/AIDS) to estimate price and
expenditure elasticities, by utilizing the Household
Income and Expenditure Survey, 2006/07. The
infrequency of purchases, a typical problem
encountered in LA/AIDS estimation is circumvented
by using a probit regression in the first stage, to
capture the effect of demographic factors, in
consumption choice. Results reveal that, Sri Lankans
consume these milk produce regardless of the area
they live, size of the household, gender of the
household head, education level of the head and
spouse, prevalence of heart diseases and diabetes,
while incidence of having young children and blood
pressure will have a significant impact. All milk
products except milk powder are highly responsive
to their own prices. Fresh milk, milk powder and
infant milk powder are identified as necessities
whereas, the rest show luxurious behavior, with the
income. However, demand for dairy products will be
more influenced by price related policies than
income oriented policies. Because milk powder is
both price and income inelastic, and most are
imported, any restriction would massively affect the
demand for milk powder. Moreover, while
identifying consumers’ needs and wants through
various research studies, domestic production
should be promoted to meet the current demand.
Keywords— AIDS model, censoring, dairy products
I. INTRODUCTION
Dairy sector has been identified as the leading
sector amid other livestock sub sectors in Sri Lanka,
where the contribution of livestock sector to the
national GDP in 2011 was approximately one
percent (Department of Animal Production and
Health, 2011). However, only about 15-20% of the
domestic requirement has been realized at present
by the dairy industry, whereas achieving 50% self-
sufficiency in milk products by 2015 remains
confronting to the government (Ranaweera, 2009).
Conversely, out of milk and milk products available
for consumption, 71.2% have been imported into
the country, mostly in the form of powdered milk
(Department of Animal Production and Health,
2011), which has been become controversial due to
the existence of toxic chemical dicyandiamide
(DCD).
Additionally, the annual per capita consumption of
milk has been recorded as much lower than the
recommended level for an average Sri Lankan.
Consequently, increasing the consumption of milk
and/or milk products in the country has become
critical in order to meet the nutrient requirement
(Bogahawatte and Herath, 2006).
In identifying the most appropriate policy
interventions, food demand patterns of a particular
country enormously support to improve the
nutritional status of individuals and households.
Hence, the knowledge of the food consumption
behaviour is essential for sectoral and
macroeconomic policy analysis where estimation of
price and income elasticities of food is the key to
the analysis of food demand behaviour (Weliwita et
al., 2003).
Thus, this study intends to estimate price and
expenditure elasticities by incorporating an
economic framework to households in Sri Lanka, in
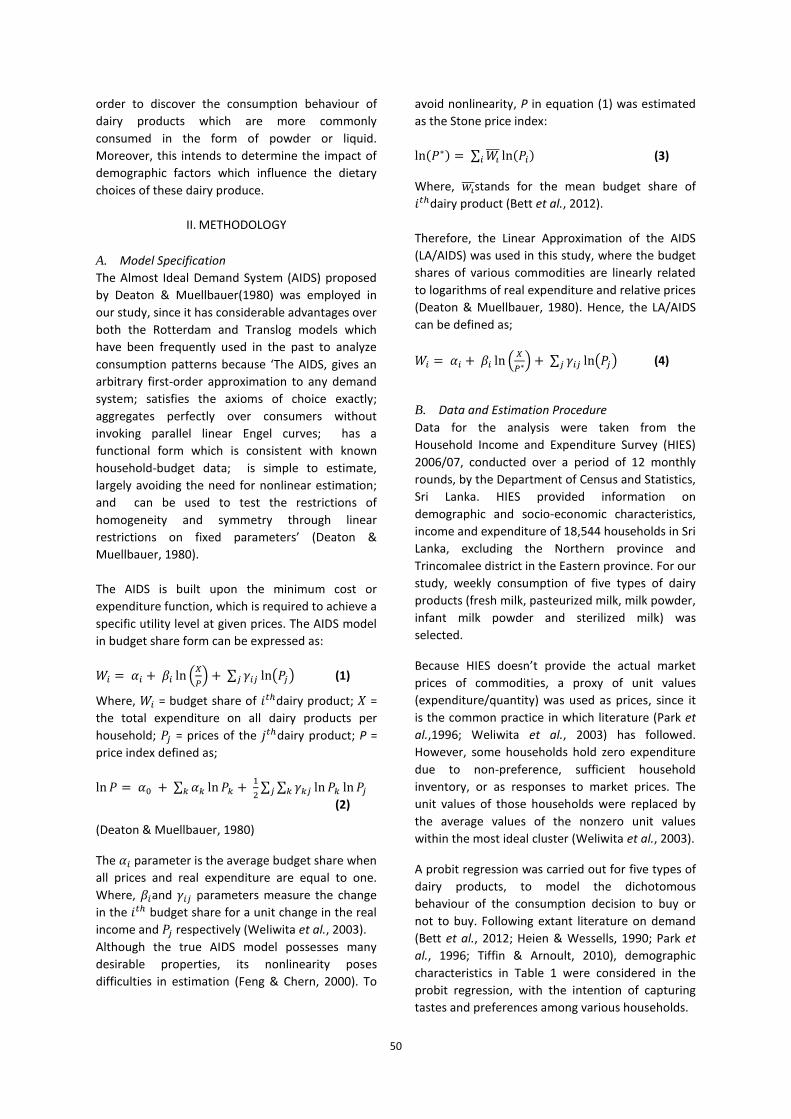
50
order to discover the consumption behaviour of
dairy products which are more commonly
consumed in the form of powder or liquid.
Moreover, this intends to determine the impact of
demographic factors which influence the dietary
choices of these dairy produce.
II. METHODOLOGY
A. Model Specification
The Almost Ideal Demand System (AIDS) proposed
by Deaton & Muellbauer(1980) was employed in
our study, since it has considerable advantages over
both the Rotterdam and Translog models which
have been frequently used in the past to analyze
consumption patterns because ‘The AIDS, gives an
arbitrary first-order approximation to any demand
system; satisfies the axioms of choice exactly;
aggregates perfectly over consumers without
invoking parallel linear Engel curves; has a
functional form which is consistent with known
household-budget data; is simple to estimate,
largely avoiding the need for nonlinear estimation;
and can be used to test the restrictions of
homogeneity and symmetry through linear
restrictions on fixed parameters’ (Deaton &
Muellbauer, 1980).
The AIDS is built upon the minimum cost or
expenditure function, which is required to achieve a
specific utility level at given prices. The AIDS model
in budget share form can be expressed as:
(1)
Where, = budget share of dairy product; =
the total expenditure on all dairy products per
household; = prices of the dairy product; P =
price index defined as;
(2)
(Deaton & Muellbauer, 1980)
The parameter is the average budget share when
all prices and real expenditure are equal to one.
Where, and parameters measure the change
in the budget share for a unit change in the real
income and respectively (Weliwita et al., 2003).
Although the true AIDS model possesses many
desirable properties, its nonlinearity poses
difficulties in estimation (Feng & Chern, 2000). To
avoid nonlinearity, P in equation (1) was estimated
as the Stone price index:
(3)
Where, stands for the mean budget share of
dairy product (Bett et al., 2012).
Therefore, the Linear Approximation of the AIDS
(LA/AIDS) was used in this study, where the budget
shares of various commodities are linearly related
to logarithms of real expenditure and relative prices
(Deaton & Muellbauer, 1980). Hence, the LA/AIDS
can be defined as;
(4)
B. Data and Estimation Procedure
Data for the analysis were taken from the
Household Income and Expenditure Survey (HIES)
2006/07, conducted over a period of 12 monthly
rounds, by the Department of Census and Statistics,
Sri Lanka. HIES provided information on
demographic and socio-economic characteristics,
income and expenditure of 18,544 households in Sri
Lanka, excluding the Northern province and
Trincomalee district in the Eastern province. For our
study, weekly consumption of five types of dairy
products (fresh milk, pasteurized milk, milk powder,
infant milk powder and sterilized milk) was
selected.
Because HIES doesn’t provide the actual market
prices of commodities, a proxy of unit values
(expenditure/quantity) was used as prices, since it
is the common practice in which literature (Park et
al.,1996; Weliwita et al., 2003) has followed.
However, some households hold zero expenditure
due to non-preference, sufficient household
inventory, or as responses to market prices. The
unit values of those households were replaced by
the average values of the nonzero unit values
within the most ideal cluster (Weliwita et al., 2003).
A probit regression was carried out for five types of
dairy products, to model the dichotomous
behaviour of the consumption decision to buy or
not to buy. Following extant literature on demand
(Bett et al., 2012; Heien & Wessells, 1990; Park et
al., 1996; Tiffin & Arnoult, 2010), demographic
characteristics in Table 1 were considered in the
probit regression, with the intention of capturing
tastes and preferences among various households.
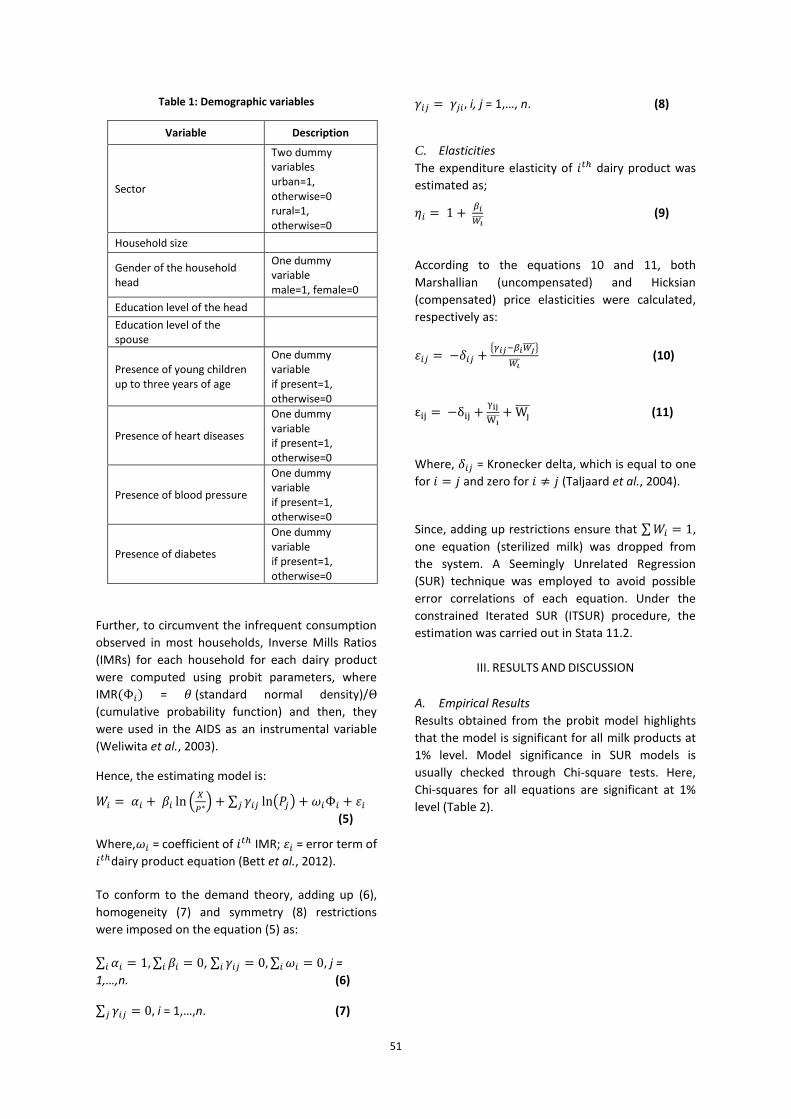
51
Table 1: Demographic variables
Variable Description
Sector
Two dummy variables urban=1, otherwise=0 rural=1, otherwise=0
Household size
Gender of the household head
One dummy variable male=1, female=0
Education level of the head
Education level of the spouse
Presence of young children up to three years of age
One dummy variable if present=1, otherwise=0
Presence of heart diseases
One dummy variable if present=1, otherwise=0
Presence of blood pressure
One dummy variable if present=1, otherwise=0
Presence of diabetes
One dummy variable if present=1, otherwise=0
Further, to circumvent the infrequent consumption
observed in most households, Inverse Mills Ratios
(IMRs) for each household for each dairy product
were computed using probit parameters, where
IMR( = (standard normal density)/
(cumulative probability function) and then, they
were used in the AIDS as an instrumental variable
(Weliwita et al., 2003).
Hence, the estimating model is:
(5)
Where, = coefficient of IMR; = error term of
dairy product equation (Bett et al., 2012).
To conform to the demand theory, adding up (6),
homogeneity (7) and symmetry (8) restrictions
were imposed on the equation (5) as:
, j =
1,…,n. (6)
i = 1,…,n. (7)
i, j = 1,…, n. (8)
C. Elasticities
The expenditure elasticity of dairy product was
estimated as;
(9)
According to the equations 10 and 11, both
Marshallian (uncompensated) and Hicksian
(compensated) price elasticities were calculated,
respectively as:
(10)
(11)
Where, = Kronecker delta, which is equal to one
for and zero for (Taljaard et al., 2004).
Since, adding up restrictions ensure that ,
one equation (sterilized milk) was dropped from
the system. A Seemingly Unrelated Regression
(SUR) technique was employed to avoid possible
error correlations of each equation. Under the
constrained Iterated SUR (ITSUR) procedure, the
estimation was carried out in Stata 11.2.
III. RESULTS AND DISCUSSION
A. Empirical Results
Results obtained from the probit model highlights
that the model is significant for all milk products at
1% level. Model significance in SUR models is
usually checked through Chi-square tests. Here,
Chi-squares for all equations are significant at 1%
level (Table 2).
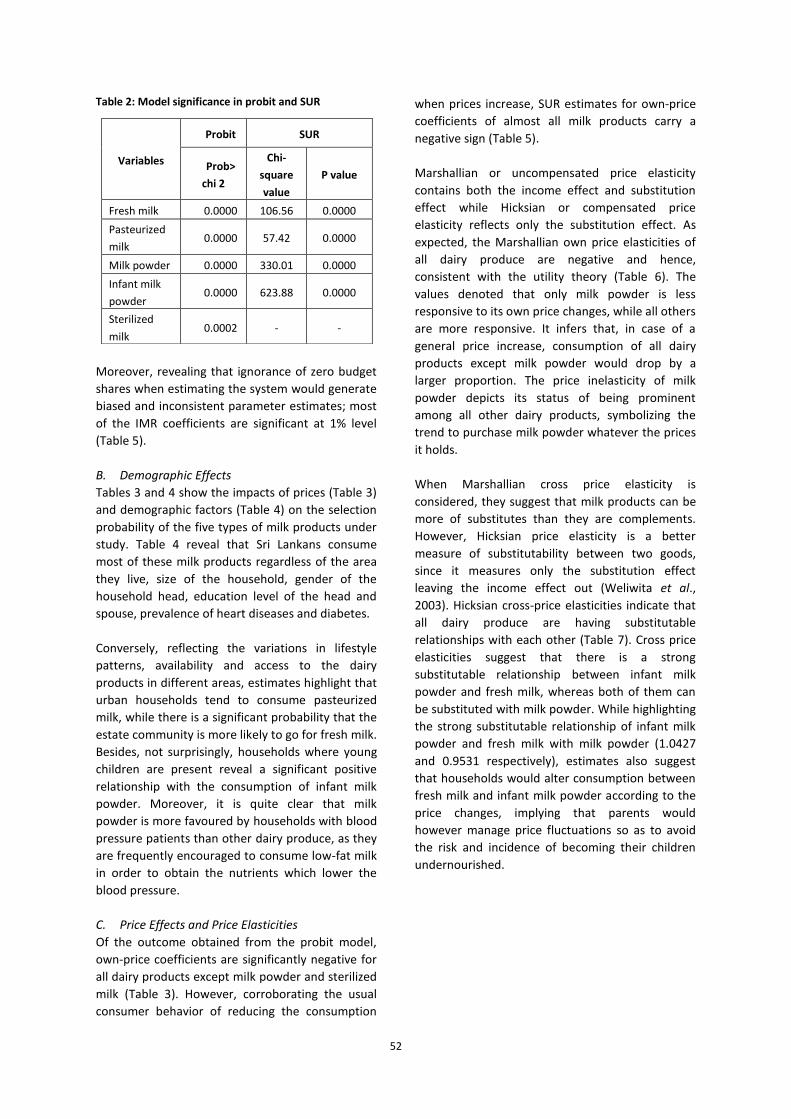
52
Table 2: Model significance in probit and SUR
Moreover, revealing that ignorance of zero budget
shares when estimating the system would generate
biased and inconsistent parameter estimates; most
of the IMR coefficients are significant at 1% level
(Table 5).
B. Demographic Effects
Tables 3 and 4 show the impacts of prices (Table 3)
and demographic factors (Table 4) on the selection
probability of the five types of milk products under
study. Table 4 reveal that Sri Lankans consume
most of these milk products regardless of the area
they live, size of the household, gender of the
household head, education level of the head and
spouse, prevalence of heart diseases and diabetes.
Conversely, reflecting the variations in lifestyle
patterns, availability and access to the dairy
products in different areas, estimates highlight that
urban households tend to consume pasteurized
milk, while there is a significant probability that the
estate community is more likely to go for fresh milk.
Besides, not surprisingly, households where young
children are present reveal a significant positive
relationship with the consumption of infant milk
powder. Moreover, it is quite clear that milk
powder is more favoured by households with blood
pressure patients than other dairy produce, as they
are frequently encouraged to consume low-fat milk
in order to obtain the nutrients which lower the
blood pressure.
C. Price Effects and Price Elasticities
Of the outcome obtained from the probit model,
own-price coefficients are significantly negative for
all dairy products except milk powder and sterilized
milk (Table 3). However, corroborating the usual
consumer behavior of reducing the consumption
when prices increase, SUR estimates for own-price
coefficients of almost all milk products carry a
negative sign (Table 5).
Marshallian or uncompensated price elasticity
contains both the income effect and substitution
effect while Hicksian or compensated price
elasticity reflects only the substitution effect. As
expected, the Marshallian own price elasticities of
all dairy produce are negative and hence,
consistent with the utility theory (Table 6). The
values denoted that only milk powder is less
responsive to its own price changes, while all others
are more responsive. It infers that, in case of a
general price increase, consumption of all dairy
products except milk powder would drop by a
larger proportion. The price inelasticity of milk
powder depicts its status of being prominent
among all other dairy products, symbolizing the
trend to purchase milk powder whatever the prices
it holds.
When Marshallian cross price elasticity is
considered, they suggest that milk products can be
more of substitutes than they are complements.
However, Hicksian price elasticity is a better
measure of substitutability between two goods,
since it measures only the substitution effect
leaving the income effect out (Weliwita et al.,
2003). Hicksian cross-price elasticities indicate that
all dairy produce are having substitutable
relationships with each other (Table 7). Cross price
elasticities suggest that there is a strong
substitutable relationship between infant milk
powder and fresh milk, whereas both of them can
be substituted with milk powder. While highlighting
the strong substitutable relationship of infant milk
powder and fresh milk with milk powder (1.0427
and 0.9531 respectively), estimates also suggest
that households would alter consumption between
fresh milk and infant milk powder according to the
price changes, implying that parents would
however manage price fluctuations so as to avoid
the risk and incidence of becoming their children
undernourished.
Variables
Probit SUR
Prob>
chi 2
Chi-
square
value
P value
Fresh milk 0.0000 106.56 0.0000
Pasteurized
milk 0.0000 57.42 0.0000
Milk powder 0.0000 330.01 0.0000
Infant milk
powder 0.0000 623.88 0.0000
Sterilized
milk 0.0002 - -
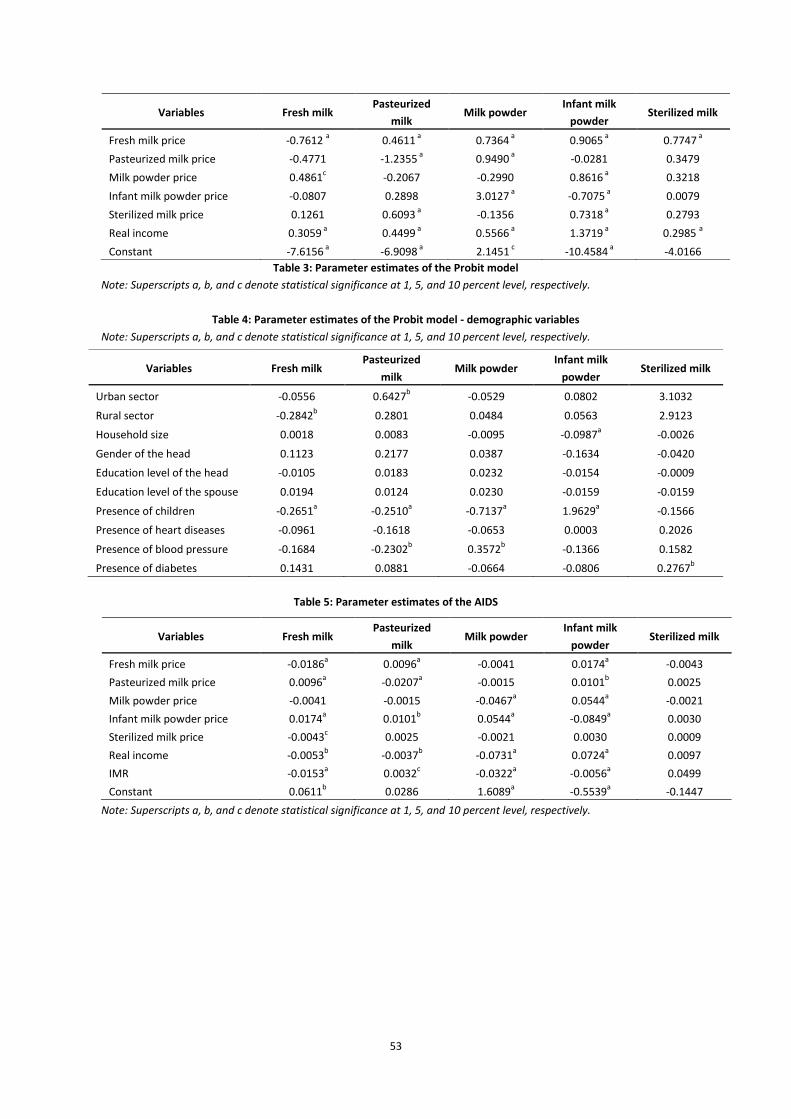
53
Table 3: Parameter estimates of the Probit model
Note: Superscripts a, b, and c denote statistical significance at 1, 5, and 10 percent level, respectively.
Table 4: Parameter estimates of the Probit model - demographic variables
Note: Superscripts a, b, and c denote statistical significance at 1, 5, and 10 percent level, respectively.
Table 5: Parameter estimates of the AIDS
Variables Fresh milk Pasteurized
milk Milk powder
Infant milk
powder Sterilized milk
Fresh milk price -0.0186a
0.0096a
-0.0041 0.0174a
-0.0043
Pasteurized milk price 0.0096a -0.0207
a -0.0015 0.0101
b 0.0025
Milk powder price -0.0041 -0.0015 -0.0467a 0.0544
a -0.0021
Infant milk powder price 0.0174a 0.0101
b 0.0544
a -0.0849
a 0.0030
Sterilized milk price -0.0043c 0.0025 -0.0021 0.0030 0.0009
Real income -0.0053b -0.0037
b -0.0731
a 0.0724
a 0.0097
IMR -0.0153a 0.0032
c -0.0322
a -0.0056
a 0.0499
Constant 0.0611b 0.0286 1.6089
a -0.5539
a -0.1447
Note: Superscripts a, b, and c denote statistical significance at 1, 5, and 10 percent level, respectively.
Variables Fresh milk Pasteurized
milk Milk powder
Infant milk
powder Sterilized milk
Fresh milk price -0.7612 a 0.4611
a 0.7364
a 0.9065
a 0.7747
a
Pasteurized milk price -0.4771 -1.2355 a
0.9490 a
-0.0281 0.3479
Milk powder price 0.4861c -0.2067 -0.2990 0.8616
a 0.3218
Infant milk powder price -0.0807 0.2898 3.0127 a
-0.7075 a
0.0079
Sterilized milk price 0.1261 0.6093 a
-0.1356 0.7318 a
0.2793
Real income 0.3059 a
0.4499 a
0.5566 a
1.3719 a
0.2985 a
Constant -7.6156 a
-6.9098 a
2.1451 c -10.4584
a -4.0166
Variables Fresh milk Pasteurized
milk Milk powder
Infant milk
powder Sterilized milk
Urban sector -0.0556 0.6427b -0.0529 0.0802 3.1032
Rural sector -0.2842b 0.2801 0.0484 0.0563 2.9123
Household size 0.0018 0.0083 -0.0095 -0.0987a -0.0026
Gender of the head 0.1123 0.2177 0.0387 -0.1634 -0.0420
Education level of the head -0.0105 0.0183 0.0232 -0.0154 -0.0009
Education level of the spouse 0.0194 0.0124 0.0230 -0.0159 -0.0159
Presence of children -0.2651a -0.2510
a -0.7137
a 1.9629
a -0.1566
Presence of heart diseases -0.0961 -0.1618 -0.0653 0.0003 0.2026
Presence of blood pressure -0.1684 -0.2302b 0.3572
b -0.1366 0.1582
Presence of diabetes 0.1431 0.0881 -0.0664 -0.0806 0.2767b
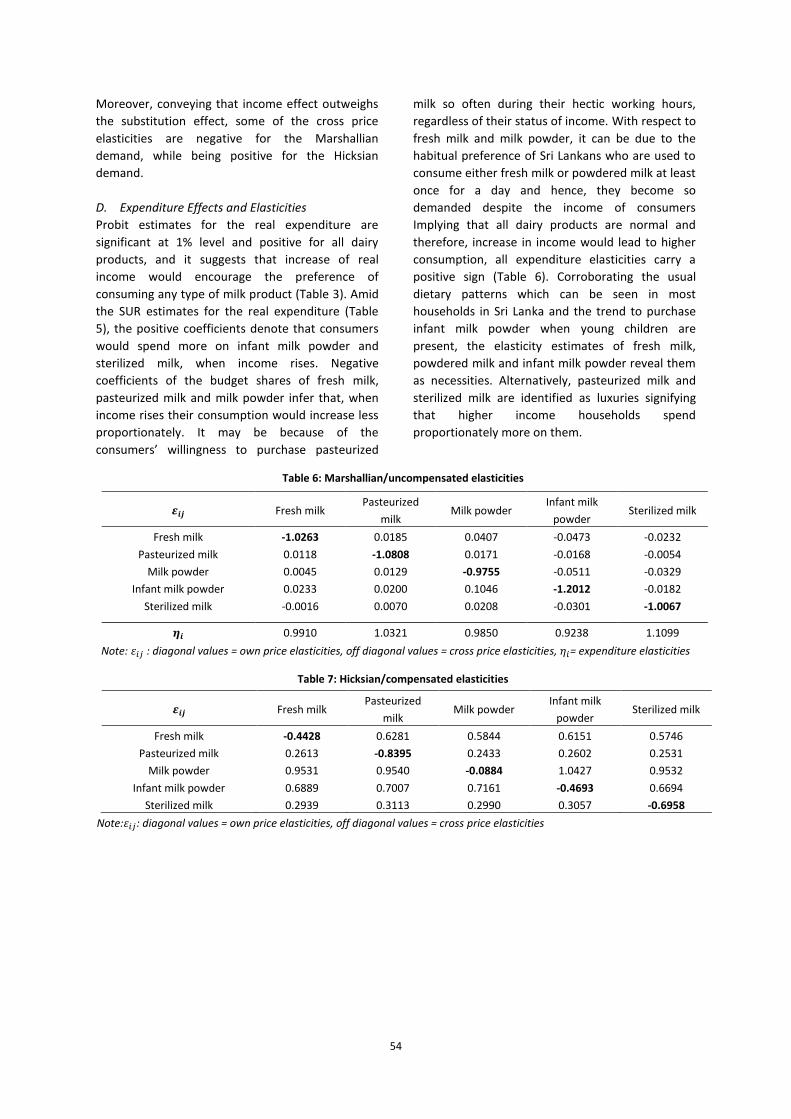
54
Moreover, conveying that income effect outweighs
the substitution effect, some of the cross price
elasticities are negative for the Marshallian
demand, while being positive for the Hicksian
demand.
D. Expenditure Effects and Elasticities
Probit estimates for the real expenditure are
significant at 1% level and positive for all dairy
products, and it suggests that increase of real
income would encourage the preference of
consuming any type of milk product (Table 3). Amid
the SUR estimates for the real expenditure (Table
5), the positive coefficients denote that consumers
would spend more on infant milk powder and
sterilized milk, when income rises. Negative
coefficients of the budget shares of fresh milk,
pasteurized milk and milk powder infer that, when
income rises their consumption would increase less
proportionately. It may be because of the
consumers’ willingness to purchase pasteurized
milk so often during their hectic working hours,
regardless of their status of income. With respect to
fresh milk and milk powder, it can be due to the
habitual preference of Sri Lankans who are used to
consume either fresh milk or powdered milk at least
once for a day and hence, they become so
demanded despite the income of consumers
Implying that all dairy products are normal and
therefore, increase in income would lead to higher
consumption, all expenditure elasticities carry a
positive sign (Table 6). Corroborating the usual
dietary patterns which can be seen in most
households in Sri Lanka and the trend to purchase
infant milk powder when young children are
present, the elasticity estimates of fresh milk,
powdered milk and infant milk powder reveal them
as necessities. Alternatively, pasteurized milk and
sterilized milk are identified as luxuries signifying
that higher income households spend
proportionately more on them.
Table 6: Marshallian/uncompensated elasticities
Note: : diagonal values = own price elasticities, off diagonal values = cross price elasticities, = expenditure elasticities
Table 7: Hicksian/compensated elasticities
Note: : diagonal values = own price elasticities, off diagonal values = cross price elasticities
Fresh milk Pasteurized
milk Milk powder
Infant milk
powder Sterilized milk
Fresh milk -1.0263 0.0185 0.0407 -0.0473 -0.0232
Pasteurized milk 0.0118 -1.0808 0.0171 -0.0168 -0.0054
Milk powder 0.0045 0.0129 -0.9755 -0.0511 -0.0329
Infant milk powder 0.0233 0.0200 0.1046 -1.2012 -0.0182
Sterilized milk -0.0016 0.0070 0.0208 -0.0301 -1.0067
0.9910 1.0321 0.9850 0.9238 1.1099
Fresh milk Pasteurized
milk Milk powder
Infant milk
powder Sterilized milk
Fresh milk -0.4428 0.6281 0.5844 0.6151 0.5746
Pasteurized milk 0.2613 -0.8395 0.2433 0.2602 0.2531
Milk powder 0.9531 0.9540 -0.0884 1.0427 0.9532
Infant milk powder 0.6889 0.7007 0.7161 -0.4693 0.6694
Sterilized milk 0.2939 0.3113 0.2990 0.3057 -0.6958
55
IV. CONCLUSIONS AND RECOMMENDATIONS
The demand for dairy products which are more
often consumed by Sri Lankans in the form of
liquid or powder was analyzed by employing the
LA/AIDS, while paying the particular attention to
the zero expenditure problem. The demographic
factors which influence the buying decision of
these milk products were captured through a
Probit regression.
Among the demographic factors we considered,
consumption choice of most of the dairy produce
will be decisively affected from presence of young
children and prevalence of blood pressure.
Nevertheless, preferences across households to
purchase milk products will be insignificantly
influenced by the area, household size, gender of
the household head, education level, existence of
heart diseases and diabetes.
As infant milk powder which is more preferred by
the households where young children are present,
being price elastic, government should be more
careful when establishing policies in order to
ensure adequate nutritional status of the younger
generation in Sri Lanka.
Furthermore, all dairy products except milk
powder are quite responsive to their own prices,
while pasteurized milk and sterilized milk respond
similarly for the income variations as well.
However, demand for dairy products will be more
influenced by price related policies than income
oriented policies.
Being a necessity and a price inelastic commodity,
milk powder holds the most prominent choice
among all other alternatives. As most of the
powdered milk available in the local market is
being imported; any restriction would massively
affect the demand for milk powder. Therefore, any
action imposed on powdered milk will have a
significant impact on Sri Lankans’ dietary choices
with respect to the dairy products. Additionally,
various research studies should be conducted to
capture consumers’ needs and wants properly and
also, domestic production should be encouraged
in order to maintain a continuous supply.
ACKNOWLEDGEMENT
Authors wish to express their gratitude to the
Department of Census and Statistics for providing
data for the research.
REFERENCES
Bett HK, Musyoka MP, Peters KJ, and Bokelmann W
(2012). Demand for meat in the rural and urban
areas of Kenya: a focus on the indigenous chicken.
Economics Research International, 2012, Article ID
401472.
Bogahawatte C and Herath J (2006). Factors affecting
Import Shares of Powdered Milk and other Milk
Products and their Implications in Sri Lanka. Sri
Lankan Journal of Agricultural Economics, 8(1), 21-
30.
Deaton A and Muellbauer J (1980). An Almost Ideal
Demand System. The American Economic Review,
70(3), 312-326.
Department of Animal Production and Health, 2011.
Annual Report 2011. [online]. Available at:
http://www.daph.gov.lk/web/images/Annual%20
Report%202011%20-%20new2.pdf. Accessed 25
Oct 2013.
Feng X and Chern WS (2000). Demand for healthy food
in the United States. Paper presented at the
Annual Meeting of American Agricultural
Economics Association, Tampa, Florida.
Heien D and Wessells CR (1990). Demand systems
estimation with microdata: a censored regression
approach. Journal of Business & Economic
Statistics, 8(3), 365-371.
Park JL, Holcomb RB, Raper KC, and Capps O (1996). A
demand systems analysis of food commodities by
U.S. households segmented by income. American
Journal of Agricultural Economics,78(2), 290-300.
Ranaweera NFC (2009). Sri Lanka: Opportunities for
Dairy Sector Growth. [online]. Available
at:http://www.fao.org/docrep/011/i0588e/i0588e
08.htm. Accessed 18 Oct 2013.
Taljaard PR, Alemu ZG, and van Schalkwyk HD (2004).
The Demand for Meat in South Africa: An Almost
Ideal Estimation. Agrekon, 43(4).
56
Tiffin R and Arnoult M (2010). The demand for a healthy
diet: estimating the almost ideal demand system
with infrequency of purchase. European Review of
Agricultural Economics, 37(4), 501-521. ISSN 0165-
1587. doi: 10.1093/erae/jbq038.
Weliwita A, Nyange D, and Tsujii H (2003). Food demand
patterns in Tanzania: a censored regression
analysis of microdata. Sri Lankan Journal of
Agricultural Economics, 5(1), 9-34.
BIOGRAPHY OF AUTHORS
1LDM Nimanthika is a Temporary
Assistant Lecturer at the Department of
Agribusiness Management in the
Faculty of Agriculture and Plantation
Management of Wayamba University
of Sri Lanka. She is interested in studying the
consumption behaviour of various food commodities,
and other areas related to Agricultural Economics.
2Jagath C Edirisinghe is a Senior
Lecturer at the Department of
Agribusiness Management in the
Faculty of Agriculture and Plantation
Management of the Wayamba
University of Sri Lanka. His research interests include
Agricultural Economics, Environmental Economics, and
Bayesian Econometrics. He gained his PhD on
Agricultural and Food Economics, from the University of
Reading in the United Kingdom.
57
Poverty and Perception: Driving Sri Lankan Children’s Homes at Multiple Levels
Eshantha Ariyadasa
Flinders University, Adelaide, Australia
[email protected], [email protected]
Abstract — In Sri Lanka, many children are housed
in institutions for economic, social and cultural
reasons, as well as the impacts of the civil war and
global climatic change. Children’s homes house
almost 20,000 children, a huge population who have
been denied basic human rights by being deprived
of parental care and labelled orphaned, abandoned
or destitute. These figures are disturbing in a multi-
religious and diversely cultured state where moral
rhetoric abounds, but concerns need to be
translated into practice.
This participatory action research was carried out
across all nine provinces in Sri Lanka, involving
policy makers and service providers responsible for
children without parental care. All commissioners of
the Provincial Departments of Probation and Child
Care Services were interviewed to ascertain their
role in the policy making process. Thirty managers
from different children’s homes were interviewed
concerning their service provision. All 298 probation
officers, 287 child rights promotion officers, and
matrons and wardens of all 416 children’s homes
were included in a questionnaire census approach.
Of these, approximately half responded. The
recruitment of these groups as participants for the
study was based on the aim of using their feedback
to produce a set of guidelines for the process of
policy making and governance of children’s homes.
The responses to the questionnaires and the
narratives of interviews were analysed on the basis
of the UN Guidelines for the Alternative Care of
Children and the General Standards for promoting
the quality of services in voluntary children’s homes
in Sri Lanka. The answers were separated into
several themes and rated to identify the core
themes.
This participatory action research has identified
many issues of policy implication and service
provision across agencies charged with care of
children. This paper investigates the impacts of
socio-economic and cultural environments on
children both before and during their
institutionalization.
Keywords: Participatory Action Research, children
without parental care, agencies.
I. INTRODUCTION
This paper is titled “Poverty and Perception: driving
Sri Lankan children’s homes at multiple levels”.
“Multiple levels” means the level of the service user
(the child & their family) and the level of the
management of the children’s home.
Roccella (2007) states that “Institutional care is at
present the most common – or, rather, the almost
sole – solution for children deprived of parental
care in Sri Lanka”. The direct impact of ‘poverty’
and/or the ‘effects of poverty’ have been identified
as the principal cause of a child’s entry into
institutional care system (Save the Children, 2005;
Roccella, 2007).
Roccella (2007) also reveals that the extreme
poverty of some households (approximately 50 per
cent of the total population of the institutionalized
children) leads to the institutionalisation of children
by their immediate or extended family. In fact in Sri
Lanka, the majority of children in institutional care
are there due to the direct and indirect effects of
poverty. These arguments well suits with the
empirical findings of this participatory action
research (PAR).
Taking the empirical and secondary findings into
consideration, this paper discusses two aspects of
institutional care of children in Sri Lanka. Firstly, it
reveals how the economic factor has affected
children’s institutionalization. Subsequently, this
paper identifies how peoples’ social and cultural
perspectives impact on children and their rights
during institutionalization.
58
II. OBJECTIVES
This paper addresses two research questions of the
PAR. The first section, “Poverty drives the
institutionalisation of children” analyses secondary
and empirical findings asking the question “How can
we prevent children being institutionalized and
sustain their lives in their natural birth
environments?” The second section on “Poverty or
its perception drives the management of children’s
homes” attempts to identify some of the human
rights issues of children’s homes. It analyses two
case studies provided by service providers and
addresses the specific question “How can we
safeguard the human rights of children in
institutional care?” (Ariyadasa, 2013).
III. METHODOLOGY
This research is characterised by the strong
involvement of members of the agencies that are
responsible for institutional care of children,
identifying it as Participatory Action Research
(Whyte, 1991). Whyte et al. (1989) explain that “In
participatory action research, some of the people in
the organization or community under study
participate actively with the professional researcher
throughout the research process from the initial
design to the final presentation of results and
discussion of their action implications. PAR thus
contrasts sharply with the conventional model of
pure research, in which members of organizations
and communities are related as passive subjects,
with some of them participating only to the extent
of authorizing the project, being its subjects, and
receiving the results”.
The research subjects of this PAR are
institutionalized children. However, there is not
enough information available about them directly.
Therefore, this PAR uses expert consultation as
sources of data by interviewing policy makers and
service providers responsible for institutional care
of children. Thus, this PAR also uses exploratory
research methods. According to Sarantakos (1998)
exploratory Research aims at explaining social
relations or events, advancing knowledge about the
structure, process and nature of social events,
linking factors and elements of issues into general
statements and building, testing or revising a
theory.
Exploration is a central element of qualitative
research and has been useful for developing an
accurate picture of the research subjects of this
PAR. “This type of research refers to a number of
methodological approaches, based on diverse
theoretical principles, employing methods of data
collection and analysis that are non-quantitative,
and aiming towards exploration of social relations,
and describes reality as experienced by the
respondents” (ibid). Nevertheless, this research
largely employs methods of data collection and
analysis that are non-quantitative aims for
exploration of social relations and describes reality
as explained by the respondents. Furthermore, this
PAR has collected questionnaire data through a
quantitative research approach to assist the
evaluation of qualitative data using statistical
analysis.
Thus in summary, this PAR largely employs
qualitative investigations to manipulate the
information collected during the study in order to
assess and evaluate the findings and arrive at some
valid, reasonable and relevant conclusions. In-depth
and narrative interviews have been employed for
data collection and thus, the responses of the
respondents are recorded on papers and
subsequently studied and analysed.
IV. POVERTY DRIVES THE INSTITUTIONALIZATION OF
CHILDREN
This section addresses two significant causes of
child institutionalisation. Firstly, ‘Poverty as a direct
reason for institutionalization’ is discussed against
UN Guidelines. Secondly, ‘Parents’ migration for
working abroad’ has been analysed as an adverse
effect of poverty that has led to children’s
institutionalisation.
A. Poverty as a direct reason for institutionalization
The UN Guidelines state that “Financial and
material poverty, or conditions directly and uniquely
imputable to such poverty, should never be the only
justification for the removal of a child from parental
care, for receiving a child into alternative care, or for
preventing his/her reintegration, but should be seen
as a signal for the need to provide appropriate
support to the family” (UN 2010). Thus, empirical
and secondary data which indicates poverty as a
major reason for the majority of children in
residential care cannot be justified in terms of the
policies outlined in the UN Guidelines.
Consequently, the UN Guidelines have influenced
59
UNICEF’s role to advocate for alternative remedies
for children:
1. Whose homes don’t or can’t provide
adequate care and support and,
2. Whose parents are desperate to provide
their children with opportunities they
themselves simply can’t provide.
Given that the best possible environment for
children is generally with their families, i.e. to try to
prevent children being separated from their homes
in the first place. Thus, the preferred solution to the
first situation according to UNICEF’s experience is
simple and cost-effective support provided in a
timely fashion to households. It may well reduce the
separation of children from their families and it will
further encourage children’s re-integration with
their families.
This PAR demonstrates that, on some occasions,
parents voluntarily request institutionalization of
their child. The UN Guidelines insist that separation
initiated by the child’s parents should be prevented
(UN 2010). It is necessary to ensure that all
households have access to basic food and medical
supplies, education, limit the residential care
options and restrict their use to those situations
where it is absolutely necessary.
In cases where families are incapable of taking
proper care of children as described in the second
situation, the preferred solution in UNICEF’s
experience is the introduction of the next best thing
to family care, i.e. the networks of foster families.
This is in accord with the UN Guidelines paragraphs
118 to 122 (UN 2010). UNICEF further suggests that
additional support from the State to these foster
families can form the backbone of an alternative
care system for children (UNICEF, 2012). For
instance, this system is practiced in South Australia
(S.A.). A family which agrees to host a child is
regularly acknowledged financially through the
relevant foster care agency which is financially
backed by the S.A. State government (Source: PAR
2013 by the author, Discussion with a foster care
agency).
South Australia no longer runs children’s homes as
an alternative care for children deprived of parental
care. The alternative care system that S.A. has
recognized as best next is the foster care system.
Thus, S.A. is compliant with UN Guidelines which
state that “the use of residential care should be
limited to cases where such a setting is specifically
appropriate, necessary and constructive for the
individual child concerned and in his/her best
interests” (UN 2010). Yet, the officials of foster care
agencies stress that S.A. is in dire need of more
foster care families to satisfy the present
requirement of children deprived of parental care.
They say that “On most occasions, the child and the
social worker have to stay in hotel rooms until they
find a permanent care solution. Sometimes, the
child travels to school for many weeks or months
from the hotel” (Source: PAR 2013 by the author,
Discussion with a foster care agency).
The UN Guidelines state that “while recognizing
that residential care facilities and family-based care
complement each other in meeting the needs of
children, where large residential care facilities
(institutions) remain, alternatives should be
developed in the context of an overall
deinstitutionalization strategy, with precise goals
and objectives, which will allow for their progressive
elimination…” (UN 2010). Care provided in any non-
family-based group setting, such as places of safety
for emergency care, transit centres in emergency
situations, and all other short- and long-term
residential care facilities, including group homes
represent residential care (ibid). In Sri Lanka the
foster care system is hardly practiced and therefore,
the alternative is mostly residential care.
Most of the residential care institutions house more
than 25 children (Source: PAR 2012 by the author).
Most institutions provide dormitory facilities.
Children’s homes that house over 100 children are
not uncommon. However, the UN Guidelines
explain that “facilities providing residential care
should be small and organized around the rights
and needs of the child, in a setting as close as
possible to a family or small group situation” (UN
2010).
B. An adverse effect of poverty: Seeking work as
domestic workers abroad
Sri Lankan women commonly work as domestic
labourers in Middle-Eastern countries to address
the issue of household poverty in Sri Lanka.
Basnayaka et al. (2012) explains that “Migration
occurs for various reasons such as education,
businesses, seeking refuge, training and
employment. But the truth behind the migration of
Sri Lankan women is mostly poverty and low
economic status of salary in Sri Lanka”.
60
Furthermore, Save the Children (2005) indicates
that well over 30 % of children’s institutionalization
has been due to a mother’s foreign employment.
My own experience as the manager of a children’s
home, collected as meeting records over five years,
highlights a common experience. The mother works
abroad often leaves her children behind in her
husband’s care. The deprivation of care is
undesirable and cannot be replaced by her
earnings, but this does provide a way to look after
the children’s physical needs. Mostly this cash falls
into the hands of the children’s father. The mother
expects her husband to use this money in a sensible
and efficient way such as feeding the children,
material support for the schooling of the children,
to address any health issues, savings and hopefully
to maintain and furnish their house. These are the
priorities that the mother wants to spend her
earnings on. Although she expects that the money
would bring comfort to her family, it often works in
the opposite way. This money is a fortune to her
husband. His lack of education on how to manage
the money and various unethical practices such as
addiction to drugs and/or alcohol, gambling and
buying sexual favours simply consume every penny
that his wife has sent to him.
Basnayake et al. (2012) describes this situation as
such: “The majority of migrant women belong to
disadvantaged communities where the traditional
livelihoods are not viable. The reasons for migration
are noted as being due to lack of access to regular
and substantial income and the inability to bear the
rising cost of living. In addition, some of the major
aspirations of the migrant women were to build
houses, collect dowry and to educate their children.
Among the specific problems of the women that
force them to migrate are high indebtedness,
domestic violence and the alcohol addiction of
spouses. Female headed households remain fair
segment of the migration population. The
complexity of the present day migration stream has
intensified with distinctions between migrant
workers, trainees, tourists, refugees and displaced
persons becoming increasingly blurred. Migrants in
this sense include both voluntary migrants and
forced migrants” (Source: The IOM/United Nations
World Migration Report 2010).
My own experience, and that of managers who I
interviewed as part of this study, highlight a sad but
not uncommon scenario. While the mother is
working abroad, the family dynamics become even
worse than the situation when the mother was at
home. There was some kind of a hold and a voice to
advocate the family business when the mother was
at home despite their financial difficulties. A father
may find loneliness without his wife is intense and
may turn to drink or drugs. He further finds that
the only thing that gives meaning to his life is her
money. He may well fall into bad company which
could jeopardise the children’s safety. School
dropouts, starvation, insecurity, health issues and
humiliation become daily burdens. Children become
denied most of their fundamental rights.
This situation was expressed by a commissioner of
provincial DPCCS as follows:
“After a mother leaves family behind for working
abroad, the circumstances now pave the way for the
children’s institutionalisation of that family. The
school or the community who witness the family
deterioration reports to the officials about the
threat to these children from their father’s acts and
behaviour. Or else, the father himself may want to
have his children institutionalized so that he can
engage in his wasteful ways. He contrives several
reasons for such a request. He claims that his wife
has gone abroad and he cannot go to work when
the children are at home as it would be a significant
risk to their security and safety. To justify his reason
he may further claim that his wife does not send him
any money and that he must find work for the
children’s sake.”
There are no mechanisms within the system to
prove that the father’s request is genuine. Thus,
officials tend to approve his request and send the
children into children’s homes. If the officials were
to make a comprehensive research of documents
and seek evidence from the different agencies and
the neighbourhood, there is a distinct possibility
that the appeal would be found to be false. The lack
of coordination between governmental
departments makes such attempts rare and
ultimately the children are admitted to children’s
homes. When children are institutionalized, the
responsibility is removed from the father leaving
him to behave in whatever the manner he chooses
which often leads the family towards a devastating
and catastrophic collapse.
61
Another commissioner’s comments on how the
system needs changes to address this issue are as
follows:
“In reality, the father could look after his family well
from the money his wife sends, but many use the
legal loopholes within the system to satisfy
undesirable behaviours. When the children are in
children’s homes the father does not have to spend
money on their needs. The children’s home and the
government provide enough for them. This
encourages him to spend and waste his wife’s
money. There is no proper tracking system to
identify how much money his wife sends to him. The
government recognises his poverty as a valid reason
for child’s institutionalization. Therefore, when
officials cannot trace a family’s income and if the
parent’s request for institutionalization of their child
under the poverty factor, the government accepts
the parents request even though it may not be in the
best interest of the child.”
V. POVERTY OR ITS PERCEPTION DRIVES THE
MANAGEMENT OF CHILDREN’S HOMES
“The governance of children’s homes for vulnerable
children in Sri Lanka has long been regarded as a
social welfare activity rather than a social
responsibility. For this reason, it has led to the
existence of many children’s homes lacking even the
basic amenities and a few homes with extraordinary
infrastructure and a far higher standard of
amenities” (Rocella 2007). In line with this
statement, firstly the socio-economic and cultural
perspectives of the tradition of ‘Dane’ were
discussed between policy makers and service
providers. The word Dane is largely used when
giving ‘alms’ to monks in the Buddhist culture. The
charitable giving of money, food, or goods to people
in need is also referred to as Dane.
Secondly, the paradox of relative and absolute
poverty with regard to the tradition of Dane and the
peoples’ attitudes towards the governance of
children’s homes is discussed using two case studies
provided by service providers.
A. The tradition of Dane: Socio-economic and
cultural perspectives
Many Sri Lankans believe that the tradition of
almsgiving to children homes helps one to achieve a
better future in this life and to create an even
better one in the next. This is the belief of the
Buddhist and Hindu religions which represents over
85% of Sri Lanka’s population. There are local and
foreign individuals and some companies who assist
children homes by providing or funding meals
and/or materials. For their contribution, they
choose their own birthdays or any other memorable
day to celebrate it at the children’s home. This
tradition has continued over generations and many
children homes have printed applications to
promote this custom. This is called ‘Dane’. This
concept of Dane was researched in this study by
keeping a special position in the research questions
to explore the positive and negative aspects of this
custom in terms of the institutionalized children and
their human rights.
According to service providers, whatever the belief
of the public, the positive aspect of Dane is that it
eases the ongoing maintenance cost of a children’s
home. The number of people gathering to
undertake an almsgiving varies from a few family
members to a larger community group. Thus, it
provides institutionalized children with a chance to
mix with the public. Six policy makers out of nine
consider the chance of mixing with the public as a
result of ‘Dane’ is a positive aspect. The policy
makers, who see it as positive, believe that by
keeping a children’s home with easy access to the
public, it protects the children from abuse. They
believe that the public can observe the children’s
well-being and report to officials if they find any
misbehaviour of the staff within the homes. This is
based on the assumption that those who observe
Dane do so for altruistic reasons. Furthermore, the
policy makers suggest that by keeping a contact list
of the public donors, the staff can record potential
personal donors and possible routes for future
support for socializing the children from their
children’s homes. The vast numbers of people that
can participate in Dane are often regarded as a
nuisance for the daily timetable of the home. Three
policy makers point out that the Dane is a huge
process. It consumes vital time that can be utilized
for the future prospects of the charges of the home
in many aspects. After the meal donation, children
have to sing songs and dance as a sign of gratitude
for the generous thoughts of the public. Most of the
time, while the public is around, children have to
sacrifice their evening rest, recreational activities,
school homework and sometimes most important
extra classes” (Source: PAR 2012 by the author,
Commissioners’ interviews, No. 6).

62
Another negative aspect of this tradition according
to the policy makers and policy officers is that the
public sees these institutionalized children as
helpless and hopeless. They have recognised that
the public have naturally become donors to these
institutions and provide facilities in terms of
materials (food, clothes, books, stationery etc.) to
satisfy children’s physical needs rather than
satisfying their psychological needs such as
recognition, respect, belonging, achievements and
confidence. However, policy makers urge that care
should be taken when organizing a Dane. There is a
real danger that children may come to believe that
this is their fate – to be fed and supported by others
and they have to live with it. This makes them more
vulnerable as it does not encourage them to
develop their own potential and stand with a
positive attitude to confront the challenges in their
lives (Source: PAR 2012, summary of the answers
from commissioners).
Six service providers out of the thirty interviewed
point out that when organizing a Dane, the public
tends to look for children’s homes that have fewer
facilities and more desperate children so they, the
donors, earn more virtues. This attitude is highly
contentious. When the staff of a children’s home
maximise infrastructure and keep their charges
happy by utilizing funds properly and promptly, it
adversely affects the public donations. Well
managed children’s homes from the general
public’s perspective need no further support. Their
decision for ‘Dane’ is mainly based on the infra-
structure facilities at homes and the appearance of
the children. These attitudes of the public inevitably
lead the managers of some children’s homes to
misuse public funds without utilizing them within
the homes. Paradoxically, the public unwittingly
encourages managers to showcase much less than
regular/perfect homes and to keep the children in
desperate conditions simply to attract more
funding. This unfortunate paradox of relative and
absolute need is well illustrated by the following
two case studies.
B. Paradox of relative and absolute need
1) Case study 1: One manager of an ‘A’ graded
children’s home explained this paradox by using his
example of ‘two different beggars’ as follows:
“Suppose you are travelling in a bus with a friend. At
one station, two female beggars get into the bus
and start begging simultaneously. One woman is
looking dirty and unkempt while holding an infant
with a running nose and unattended wounds. The
other woman is wearing relatively clean clothes and
her baby is hygienically attended. To which beggar
would you offer some money? Isn’t that the terrible
looking beggar with the child likely to get your
attention? Wouldn’t that be the reaction of most of
the other passengers as well? After the women left
the bus, wouldn’t you comment with your friend
justifying your action and that of the others, saying
that there is no need to offer money to a cleanly
dressed woman with a healthy looking baby? His
argument is quite obvious as the other woman is the
one that appears in every manner to deserve
support from the general public. We accept the
truth as what we see it, but the reality could be a
totally different story” (Source: PAR 2012 by the
author, Managers’ interviews No. 1).
When asked why he thought that the reality could
be a different story, the manager justified his
argument with:
“The woman may not wear clean clothes because
clean clothes look odd for a beggar. She does not
attend the running nose or the wounds of the baby,
because these characteristics influence the
passengers to offer money to the one they perceive
as needing most. In reality she should be able to
wear clean and tidy clothes from her earnings as a
beggar and of course attend her baby, but she does
not do so. She may be uneducated but she is well
versed in the peoples’ attitudes. She knows that
clean clothes or healthy looking babies either reduce
her earnings or bring no income at all. That is why
we hardly see well-dressed beggars on the streets.
Toned or deliberately dirty and/or dusty, rotten
clothes are beggars uniform. Miserable faces and
unattended wounds are their ornaments. Disabilities
are their unveiled blessings”.
In this description the manager sees the issue of
relative and absolute need through the common
eye and explains the current situation of the general
public’s attitude towards the children’s homes.
Public’s attitude is that the children’s homes are
usually poorly managed and difficult to run.
Furthermore, the public have very rarely
experienced thriving, well-educated, properly
behaved and well-nourished children in institutional
care. They presume that institutionalized children
are orphans, abandoned and destitute as
categorised by DPCCS (2010). Thus, the public is
reluctant to contribute to children’s homes that are
63
well managed and where the residential children
showcase similar life styles to those children living
in natural birth environments.
2) Case study 2: One service provider explains his
experience as follows:
“When I decided to take the risk of managing and
running an orphanage, I was quite sure about the
Dane from public donors. Especially the meal
donations, because I knew about a few children’s
home where you cannot easily reserve a date for a
meal donation. The meals for most of the year have
been reserved in those children’s homes. Therefore, I
relied upon public donations for meal costs even
before I started my orphanage. I thought, once
started, within two to three years, I would not need
to prepare many meals in my children’s home and I
could reduce the number of cooks from two to one. I
was totally mistaken. It has been six years since the
inception of my home, but I have not been able to
cut down even 25% of the meal cost from the public
funding” (Source: PAR 2012 by the author,
Managers’ interviews No. 8).
According to this manager, the public’s attitude
towards the children’s homes is an issue that has to
be addressed immediately. He explains the reasons
why he thinks meal donations are lacking in his
children’s home as follows:
“I constructed the children’s home from the
generous funding of an overseas organization. It
consists of most of the key infra-structure facilities
that a children’s home must have. We have
sufficient staff members and a manageable number
of children. It is situated in a rural village and the
children go to the village school. Our children wear
relatively good clothes and eat relatively good
meals compared with the children from the village.
That is one reason why we receive only a few meal
donations from the village where the children’s
home is situated. The other reason is a very crucial
one. It is known that the donors who come from
distant areas rarely continue their donations. When
they see the infrastructure and the satisfied faces of
the institutionalized children, they think that our
children’s home is a well-off one and needs no
constant support. We need their financial and
material support to keep the ongoing functioning of
the home as good as it is now. Many, who promised
regular donations, withdraw them and transfer
them to other children’s home, where they find less
facilities and miserable faces of charges. Public does
not understand that some managements of other
children’s homes pretend that they lack facilities
and use children to showcase the varying needs of
the home. Although I am still struggling with
financing strategies and process for my children’s
home, I cannot misuse children in my care to attract
public funding”.
The manager in case study 1 tries to compare the
life of a beggar with the characteristics of children’s
home. It is well expressed as both the above parties
(beggar and children’s home) depended upon public
donations. The manager in case study 2 tries to
explain that the good appearance of a children’s
home and a well-kept children paradoxically cause
the public to think that no funds are needed.
VI. CONCLUSION
The existing system for the alternative care of
children who are denied parental care Sri Lanka,
does not satisfy the policies expressed in the UN
Guidelines. Specifically, the common use of
children’s homes rather than a family environment
for alternative care is in contravention of these
guidelines.
Poverty and effects of poverty have significantly
contributed to children’s institutionalization in Sri
Lanka. The government should regulate a system
for children’s well-being from the inception of the
story of parents’ decisions to work abroad. This can
lead to an agreement between the parents and the
government to decide who is going to take over the
well-being of the child while the parent works
abroad. This type of mechanism avoids unnecessary
institutionalization and maintains family integrity.
Policy makers and service providers describe that
the custom of Dane has both positive and negative
aspects. Policy makers keen to identify negative
aspects as they assume that Dane could be
interpreted as teaching students to think in terms of
welfare and dependency rather than thinking about
their own rights and responsibilities. However,
service providers find Dane as positive in some
aspects, particularly as it eases the running cost of
the children’s homes.
Socio-economic and cultural perspectives of Sri
Lankan society have influenced the management of
children’s homes and the way the human rights of
64
the institutionalized children have been translated
into practice. Thus, institutionalized children are at
risk as a result of a range of socio-economic factors.
It has been a difficult task to erase the attitude of
society that these vulnerable children ought not to
be treated as ‘welfare cases’; they have rights.
While acknowledging the thoughts and deeds of the
public as donors, governance practices of homes
should be adapted to minimize the negative impacts
on the rights of children and their needs.
Since many children’s homes in Sri Lanka are funded
by donations from the public, there is an urgent
need for open debate to convince the public donors
of the relative and absolute reality of how their
funds should be utilized by the children’s homes.
Furthermore, service providers should encourage
and provide access for the general public to
participate (to some degree) in management to
maximise the public awareness of how their funds
being utilised. They should be convinced that their
continuous support assists not only the initial
generation of facilities but also to keep these
facilities functioning. Thus, they should continuously
support the home to maintain its status quo.
The public should assist social welfare organisations
that run children’s homes with no personal agenda,
but as a social responsibility to support
institutionalized children. This helps the children to
achieve their full potential with upward mobility,
and to integrate into society as effective, productive
and fully rounded citizens where they can also
contribute positively to the social and economic
development of Sri Lanka.
ACKNOWLEDGEMENT
This research is funded by the Australian
Government’s Endeavour Scholarships and
Fellowships. The ideas and philosophies presented
in this paper draw on the expertise of my
supervisors; Prof. Janet McIntyre, Dr Helen McLaren
and Dr Leonie Solomons. Insights and feedback
offered by Dr Greg Collings were invaluable. The
specific comments from the anonymous reviewers
also helped immensely to improve the manuscript.
The author would like to acknowledge their
contributions.
REFERENCES
Ariyadasa E (2013). Systemic Approaches to Persistent
Poverty and Disadvantage, Life chances of children
and young people in institutional care in Sri Lanka,
<http://journals.isss.org/index.php/proceedings57th/
article/viewFile/2088/699> Accessed 22 April 2014.
Basnayaka et al. (2011). Reports of the Sri Lankan Bureau
of Foreign Employment (SLBFE)
<http://www.kdu.ac.lk/faulty-of-defence-and-
stratergic-studies/images/SCRIPT.pdf> Accessed 30
April 2014.
Department of Census & Statistics, Sri Lanka (2010),
General Standards for the promotion of Quality of
Services in Voluntary Children’s Homes in Sri Lanka,
Statistics Statistical Abstract 2010. Sri Lanka.
DPCCS, (2010). Statistical Report 2010, Department of
Probation and Child Care Services, Colombo, Sri Lanka.
International Organization for Migration, (2014). The
Global Economic Crisis and Migration: Where do we
go from here?
<http://publications.iom.int/bookstore/index.php?ma
in_page=product_info&products_id=696&zenid=cooi
59v396i2fe6fkecheipfj5> Accessed 27 June 2014.
Roccella C (2007). Out of Sight, Out of Mind: Report on
Voluntary Residential Institutions for Children in Sri
Lanka – Statistical Analysis. Ministry of Child
Development and Women’s Empowerment, Sri Lanka
and UNICEF.
Sarantakos S (1998). Social Research, Macmillan Press
Ltd., London.
Save the Children, (2005). Home Truths: Children Rights in
Institutional care in Sri Lanka, Save the Children,
Colombo, Sri Lanka.
UNICEF, (2012). Education in emergencies and post-crisis
transition: 2011 Programme Report
<http://www.educationandtransition.org/wp-
content/uploads/2007/04/2011_SriLanka_EEPCT_rep
ort.pdf> Accessed 12 May 2014.
United Nations, (1989). Convention on the Rights of the
Child 44/25 of 20 November 1989, United Nations,
New York.
United Nations, (2010). Guidelines for the Alternative Care
of Children, A/Res/64/142. United Nations, New York.
Whyte WF Ed. (1991). Participatory action research,
Newbury Park, CA: Sage.
65
Whyte WF, Greenwood DJ & Lazes P (1989). Participatory
action research through practice to science in social
research, American Behavioural Scientist, 32(5), 513–
551.
BIOGRAPHY OF THE AUTHOR
Eshantha Ariyadasa is currently
studying for his PhD at Flinders
University, South Australia. Through
his research he plans to create
policy proposals which address the
issues of children’s rights and their
needs within children’s homes in Sri Lanka. He
participated in the World Conference of the
International Society for the System Scientists in
Vietnam in 2013. Eshantha pioneered the Sputnik
International Organization to promote world peace
through languages, sports and cultural education. He
is the founder of Sputnik Girls’ Children’s Home in Sri
Lanka.
66
The Role of Education on Agricultural Productivity in Sri Lanka
Rajapaksha, UG1, Semasinghe WM2, Silva DAC3
1Department of Management and Finance, Kotelawala Defence University, Ratmalana, Sri Lanka
2Department of Economics, University of Kelaniya, Kelaniya, Sri Lanka
3Department of Economics, University of Colombo, Sri Lanka
Abstract- Rural area is a geographic area located
outside cities and towns. In order to have a long
term sustainability in rural sector, education plays a
major role by empowering farmers with right
direction, right thinking patterns, right decision
making ability and right choices. Hence the
education would be a sustainable strategy to uplift
the rural sector with agricultural development.
However in order to enhance the productivity of the
rural sector, the role of education is crucial. The
pecuniary and non-pecuniary benefits of the
education have impacts on farmers for their shorter
and long-term pricing efficiency, scale efficiency,
allocative efficiency and technical efficiency to
increase the agricultural productivity. The objective
of the study is to examine the relationship of
education with the productivity’s sample of 409
families were taken and semi structured
questionnaire was used to collect the data. As a
data analytical tool, Structural equation method
was used with the support of SPSS AMOS (Version
21).
However study concludes that the household with
no schooling has an inverse relationship with the
productivity while the educational level of primary
level and secondary level have a positive influence
on the Total Factor Productivity of farming and
Total Factor Productivity of non-farming. In addition
to that the study indicates that the extension
services, social capital and other informal and non-
formal education streams also influence on
agricultural productivity positively.
Keywords: human development, labour
productivity, agricultural productivity, education,
human capital
I. INTRODUCTION
Agriculture and rural sector is inseparable; whereas
education, productivity and development are also
inseparable. Therefore when it turns to agricultural
development, as per Bhati (1995), there is a
correlation between agricultural productivity and
education because, the level of education works as
source of agricultural transmission or innovation.
Innovation, productivity and efficiency are by-
products of education of which should be used as a
source to generate income aspects in the rural
sector (Fuglie (2009). Not only it boosts the income
level due to innovation, but also can enjoy cost
advantage too due to farmer’s choice of best
combination of products (Hemachandra and
Kodithuwakku 2006). Therefore as Education makes
a man wholesome with abilities, skills and
knowledge to make a man developed is of which is
conceptually known as ‘human development’.
Human development can have a great impact on
productivity. Hence this study try to elaborate how
education as a source of human capital develop
agricultural productivity of farming and non-farming
A Background of the study
As it was evident that Education can provide a man
with Knowledge, Skill and Abilities that a man need
to capitalize to enjoy the real freedom of life
meaningfully in the present and the future. As
education enables a human being to improve their
decision making properly, promptly, accurately,
broadly, proactively not reactively on sustainable
manner, achieving the real freedom of life is not
impossible. In order to achieve the real freedom of
life as Sen Indicates, they need capabilities of which
is fostered by the pecuniary and non-pecuniary
benefits of the education. However, the pecuniary
benefits of education plays a huge role in the short
term than the non-pecuniary benefits of which
plays a role in strengthening long-term benefits.
Pecuniary benefits would be enhanced by the
productivity as a major pillar in ensuring the
maximum return to minimum efforts. However
productivity is a concept which can show as the
relationship of output in terms of its input. Hence
education has its implication on productivity in two
angles that is, as the impact of education on input
67
management and as impact of education on output
management. Therefore at the end it meets the
impact of education on productivity which comes
from many perspectives such as better decision
making upon; scale efficiency, pricing efficiency,
allocative efficiency, pricing efficiency and finally
economic efficiency.
B Research Objective
The main objective of the study is to examine the
role of education as a driving force to effect on
agricultural productivity in Sri Lanka.
II. EMPIRICAL REVIEWS
This section explains the empirical studies done on
how education has been viewed by the empirical
studies as the capability enhancement tools to
ensure better agricultural productivity on farm and
non-farm.
Oxaal (1997) indicates based on human capital
theory that education has ability to acquire better
skills in order to achieve higher productivity than
those who do not have education. Hence, education
can make people to be productive; to enhance their
learn-by-doing ability; to enhance their productive
thinking and etc. This goes faster pace than for
those with less or no education. The ‘learning-by-
doing ability’ and cognitive skills that a learner
receives from a better education would have an
impact on human development to bring the
productivity and to develop managerial skill of
which would be important in material management
in agriculture, crop management, diversification
management and non-agricultural production.
However regarding farmer’s productivity as
literature support that more than formal education,
(number of year in school) the other two forms of
education are important. As an example age,
experience, training & etc. are in major. Although
the study indicates that there is a positive
relationship between education and productivity,
the return to school of the study is higher than
other studies. Because the study reveal that return
to schooling is around 3.67% but as per Jamison &
Lan (1982) (As cited by Onphandala (2009), it is
around 2.87%which is below the normal trends.
However, when higher education achievement
reached by the farmers; the higher the return to
productivity they gained. But this study does not
show a higher education but still a higher return to
productivity is there which need to be revisited. As
Onphandala (2009) indicates that age of the farmer
show the negative impact on the productivity and
efficiency. But Edirisinghe et al (2008) indicates that
10% increase of age, increase the efficiency by
3.81%.
Fuglie (2009) in his study on’Sources of growth in
Indonesian agriculture’, expected see the
contribution of the spread of rural education and
literacy to agricultural growth. It refers both
agricultural productivity and education offers
growth. Usually, in the productivity concept, there
are two components such as Input and Output.
However, in the ‘inputs’ category in the
productivity, formal education plays a considerable
role in determining a better productivity. Because
education can provides a necessary knowledge to
select the best and feasible input mixture more
than with no education.
In the end Fuglie (2009) articulate that there is a link
between farmer education and agricultural
productivity in developing countries; and hence he
concludes that the contribution of improvements in
farmer education/human capital has a sustained
contribution to agricultural productivity growth.
Even Wong (2012) in his research on ‘Effects of
education on Sub Saharan Africa’ also supported
with Fuglies (2005) views. He indicates that
education is directly impact on labour quality before
other factors are affected. Even Bhati (1995) too
highlights that, ‘agricultural productivity and use of
modern inputs are positively related with
educational level of farm workers’. In addition to
that, Bhati (1995) concludes his study that ‘there is
a positive relationship between education and
agricultural productivity’.
Asadullah & Rahman (2009) in their study on ‘Farm
productivity and efficiency in rural Bangladesh:The
role of education revisited’ have aimed to see the
role of education in farm production in Bangladesh.
The research concludes with that the education first
ensures the efficiency of the farm operation and
then impact on income, output and productivity.
And the impact of neighbor’s education is found to
be insignificant to farmer’s productivity and income.
However, the study focus additionally that the
household head’s primary and secondary education
over and above zero years of education has a
significant impact on productivity and household
heads who complete secondary schooling also enjoy
significant efficiency. But the contribution for the
68
productivity status for those who have completed
tertiary education is minimal.
The study basically highlights that productivity is
significantly influenced by primary education but
not by secondary and tertiary education. This is not
what Pudasaini (1983), Yang (1997), Onphanhdala,
P. (2009) and Tabari & Reza (2012) have disclosed.
Without taking any of such categories, they
concluded that there is an impact of education on
productivity or farming. Although Asadullah &
Rahman (2009) articulates that secondary
education and tertiary education do not show a
considerable significance, Roy (1996) sees it in
different angle. Because efficiency in enhancing
managerial ability and efficiency in resource
management and etc would come due to
agricultural productivity, not due to achievement
from primary level education but from higher level
educational achievement. As Roy (1996) refers, the
innovative ways of thinking such as ‘declining soil
fertility and depletion of soil micro nutrients,
declining efficiency in use of fertilizer and other
inputs, irrigation water efficiency, efficiency delivery
system, change in the pest complex and increasing
intensity of pest outbreaks, seed quality, varietal
replacement at the farm level (varietal replacement
represents the pace at which farmers switch over to
newer varieties to capitalize on the successive
incremental gain in yield potential) all of these
changes would take place due to enrichment of
education (Roy, 1996). However the overall
conclusion made by Asadullah & Rahman (2009) is
that the education first ensures the efficiency of the
farm operation and then impact on income, output
and productivity. And the impact of neighbor’s
education is found to be insignificant to farmer’s
productivity and income.
Concluding, Kiresuri et al (2010) indicates that 10%
increase of education could increase the
productivity by 3.27%. On the other hand Januja et
al (2011) recognized enrolment ratio to secondary
education as an indicator of education showing
2.3682% or decrease of poverty due to 10%
increase of such enrolment. Pudasaini (1983)
recognize the importance of formal education and
non-formal education separately in effect to rural
and urban separately. The study indicated that due
to 10% increase of education and extension services
can effect on productivity by 0.22% and 2.12%
respectively to rural sector while it is for the urban
sector by 0.11% and 0.04% respectively. Edrisinghe
et al (2008) refers that education, herd planning
and veterinary attendance were recognized as
formal and informal education aspects and
indicates that 10% increase of education, herd
planning and veterinary attendance decreases the
inefficiency of production by 49.7%, 63.61% and
2.51% respectively. However the finding made by
Lin et al (2001) is controversial as the study says
that increase of education could results in
increasing the poverty too.
Next Djomo (2012) recognize education and training
separately and infer that 10% increase of such can
increase productivity by 0.2% and 1.11%
respectively. Umesh and Asogwa (2011) recognize
education and extension programme separately to
poverty with 0.013% and 0.015% of poverty
reduction due to 10% increase of such education.
Further Onphanhdala (2009) recognized that
0.716%, 1.9% and 2.5% increase of productivity
occurs due 10% increase of primary, Lower
secondary and higher secondary respectively.
Concluding the literature review, it appears that
there is no considerable studies have been done
regarding the impact of education agricultural
productivity in Sri Lanka. And further, even in the
education also most of the studies used only the
formal education, not informal or non-formal
education aspects. However the current study aims
to use all threefold of education to see their impact
upon Total Factor Productivity (TFP) to measure the
pricing, scale and allocative efficiency of rural
farmers in Sri Lanka.
III METHODOLOGY
A Introduction to methodology
The methodology consist of formulation of
conceptual framework based on the research
objectives and empirical reviews; formulation of
empirical model based on conceptual framework
and research objectives; justification of the
sampling area, data and variables; data collection
tools and data analysis.
B Development of Conceptual framework
However, as most of the studies concern that the
productivity and capability are influenced by
education or human capital; the impact of
education on poverty through productivity and
capability can be conceptually drawn as below in
the Figure 1.1.
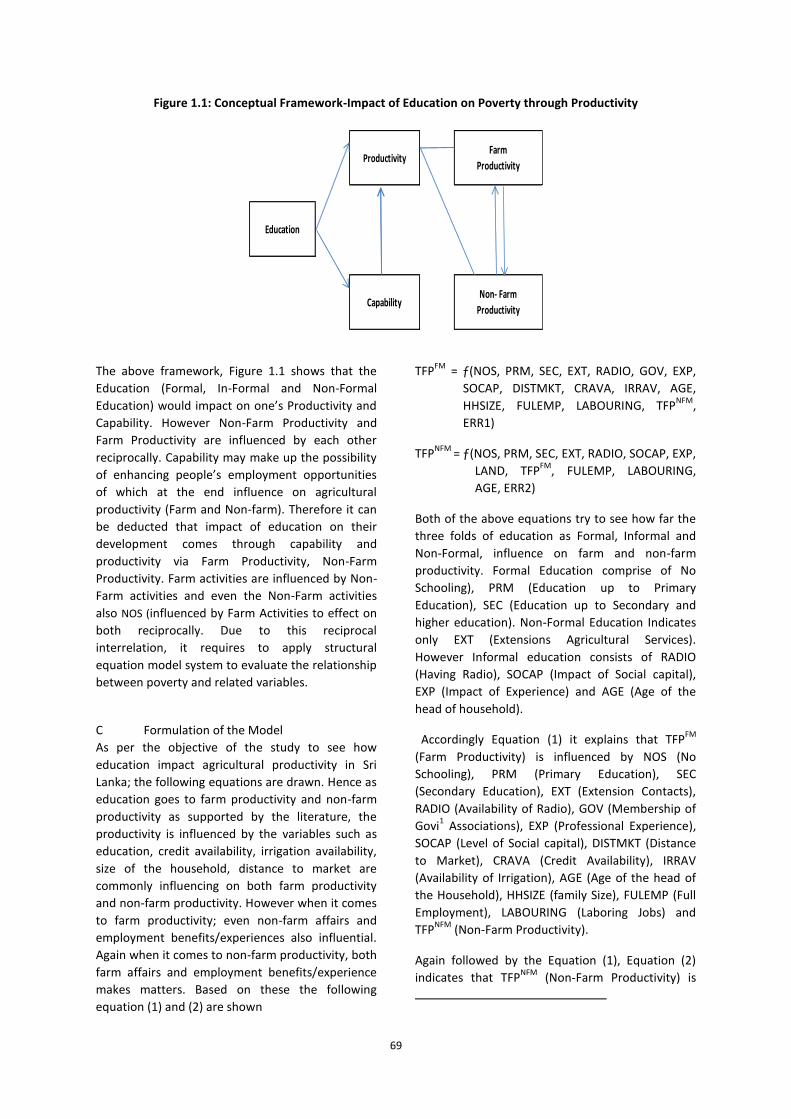
69
Figure 1.1: Conceptual Framework-Impact of Education on Poverty through Productivity
Productivity
Education
Capability
Farm
Productivity
Non- Farm
Productivity
The above framework, Figure 1.1 shows that the
Education (Formal, In-Formal and Non-Formal
Education) would impact on one’s Productivity and
Capability. However Non-Farm Productivity and
Farm Productivity are influenced by each other
reciprocally. Capability may make up the possibility
of enhancing people’s employment opportunities
of which at the end influence on agricultural
productivity (Farm and Non-farm). Therefore it can
be deducted that impact of education on their
development comes through capability and
productivity via Farm Productivity, Non-Farm
Productivity. Farm activities are influenced by Non-
Farm activities and even the Non-Farm activities
also NOS (influenced by Farm Activities to effect on
both reciprocally. Due to this reciprocal
interrelation, it requires to apply structural
equation model system to evaluate the relationship
between poverty and related variables.
C Formulation of the Model
As per the objective of the study to see how
education impact agricultural productivity in Sri
Lanka; the following equations are drawn. Hence as
education goes to farm productivity and non-farm
productivity as supported by the literature, the
productivity is influenced by the variables such as
education, credit availability, irrigation availability,
size of the household, distance to market are
commonly influencing on both farm productivity
and non-farm productivity. However when it comes
to farm productivity; even non-farm affairs and
employment benefits/experiences also influential.
Again when it comes to non-farm productivity, both
farm affairs and employment benefits/experience
makes matters. Based on these the following
equation (1) and (2) are shown
TFPFM
= ƒ(NOS, PRM, SEC, EXT, RADIO, GOV, EXP,
SOCAP, DISTMKT, CRAVA, IRRAV, AGE,
HHSIZE, FULEMP, LABOURING, TFPNFM
,
ERR1) (1)
TFPNFM
= ƒ(NOS, PRM, SEC, EXT, RADIO, SOCAP, EXP,
LAND, TFPFM
, FULEMP, LABOURING,
AGE, ERR2) (2)
Both of the above equations try to see how far the
three folds of education as Formal, Informal and
Non-Formal, influence on farm and non-farm
productivity. Formal Education comprise of No
Schooling), PRM (Education up to Primary
Education), SEC (Education up to Secondary and
higher education). Non-Formal Education Indicates
only EXT (Extensions Agricultural Services).
However Informal education consists of RADIO
(Having Radio), SOCAP (Impact of Social capital),
EXP (Impact of Experience) and AGE (Age of the
head of household).
Accordingly Equation (1) it explains that TFPFM
(Farm Productivity) is influenced by NOS (No
Schooling), PRM (Primary Education), SEC
(Secondary Education), EXT (Extension Contacts),
RADIO (Availability of Radio), GOV (Membership of
Govi1 Associations), EXP (Professional Experience),
SOCAP (Level of Social capital), DISTMKT (Distance
to Market), CRAVA (Credit Availability), IRRAV
(Availability of Irrigation), AGE (Age of the head of
the Household), HHSIZE (family Size), FULEMP (Full
Employment), LABOURING (Laboring Jobs) and
TFPNFM
(Non-Farm Productivity).
Again followed by the Equation (1), Equation (2)
indicates that TFPNFM
(Non-Farm Productivity) is
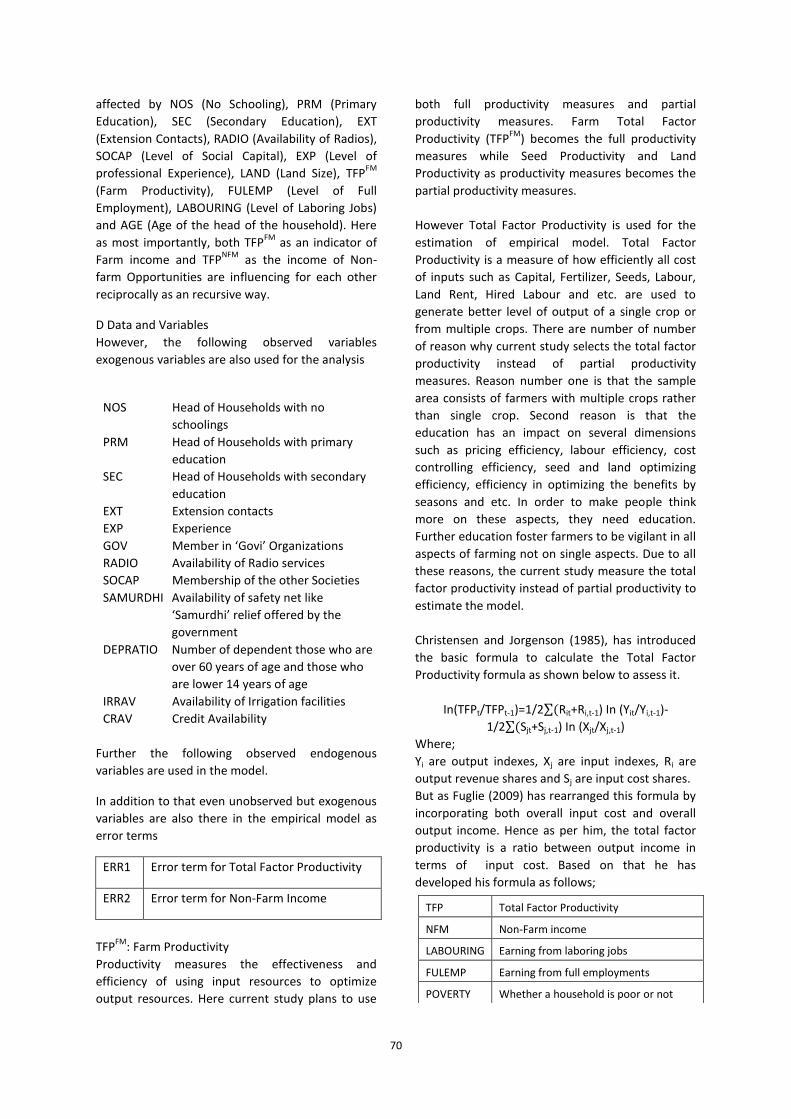
70
affected by NOS (No Schooling), PRM (Primary
Education), SEC (Secondary Education), EXT
(Extension Contacts), RADIO (Availability of Radios),
SOCAP (Level of Social Capital), EXP (Level of
professional Experience), LAND (Land Size), TFPFM
(Farm Productivity), FULEMP (Level of Full
Employment), LABOURING (Level of Laboring Jobs)
and AGE (Age of the head of the household). Here
as most importantly, both TFPFM
as an indicator of
Farm income and TFPNFM
as the income of Non-
farm Opportunities are influencing for each other
reciprocally as an recursive way.
D Data and Variables
However, the following observed variables
exogenous variables are also used for the analysis
NOS Head of Households with no
schoolings
PRM Head of Households with primary
education
SEC Head of Households with secondary
education
EXT Extension contacts
EXP Experience
GOV Member in ‘Govi’ Organizations
RADIO Availability of Radio services
SOCAP Membership of the other Societies
SAMURDHI Availability of safety net like
‘Samurdhi’ relief offered by the
government
DEPRATIO Number of dependent those who are
over 60 years of age and those who
are lower 14 years of age
IRRAV Availability of Irrigation facilities
CRAV Credit Availability
Further the following observed endogenous
variables are used in the model.
In addition to that even unobserved but exogenous
variables are also there in the empirical model as
error terms
ERR1 Error term for Total Factor Productivity
ERR2 Error term for Non-Farm Income
TFPFM
: Farm Productivity
Productivity measures the effectiveness and
efficiency of using input resources to optimize
output resources. Here current study plans to use
both full productivity measures and partial
productivity measures. Farm Total Factor
Productivity (TFPFM
) becomes the full productivity
measures while Seed Productivity and Land
Productivity as productivity measures becomes the
partial productivity measures.
However Total Factor Productivity is used for the
estimation of empirical model. Total Factor
Productivity is a measure of how efficiently all cost
of inputs such as Capital, Fertilizer, Seeds, Labour,
Land Rent, Hired Labour and etc. are used to
generate better level of output of a single crop or
from multiple crops. There are number of number
of reason why current study selects the total factor
productivity instead of partial productivity
measures. Reason number one is that the sample
area consists of farmers with multiple crops rather
than single crop. Second reason is that the
education has an impact on several dimensions
such as pricing efficiency, labour efficiency, cost
controlling efficiency, seed and land optimizing
efficiency, efficiency in optimizing the benefits by
seasons and etc. In order to make people think
more on these aspects, they need education.
Further education foster farmers to be vigilant in all
aspects of farming not on single aspects. Due to all
these reasons, the current study measure the total
factor productivity instead of partial productivity to
estimate the model.
Christensen and Jorgenson (1985), has introduced
the basic formula to calculate the Total Factor
Productivity formula as shown below to assess it.
In(TFPt/TFPt-1)=1/2 Rit+Ri,t-1) In (Yit/Yi,t-1)-
1/2 Sjt+Sj,t-1) In (Xjt/Xj,t-1)
Where;
Yi are output indexes, Xj are input indexes, Ri are
output revenue shares and Sj are input cost shares.
But as Fuglie (2009) has rearranged this formula by
incorporating both overall input cost and overall
output income. Hence as per him, the total factor
productivity is a ratio between output income in
terms of input cost. Based on that he has
developed his formula as follows;
TFP Total Factor Productivity
NFM Non-Farm income
LABOURING Earning from laboring jobs
FULEMP Earning from full employments
POVERTY Whether a household is poor or not
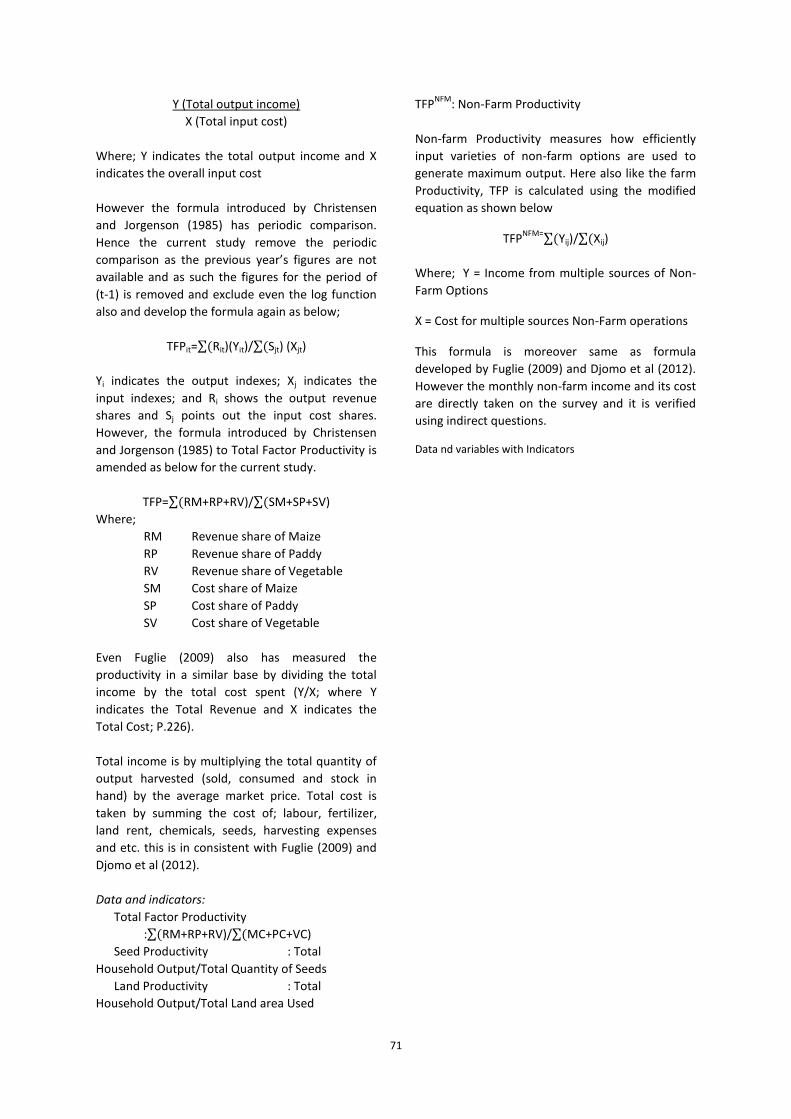
71
Y (Total output income)
X (Total input cost)
Where; Y indicates the total output income and X
indicates the overall input cost
However the formula introduced by Christensen
and Jorgenson (1985) has periodic comparison.
Hence the current study remove the periodic
comparison as the previous year’s figures are not
available and as such the figures for the period of
(t-1) is removed and exclude even the log function
also and develop the formula again as below;
TFPit= Rit)(Yit)/ Sjt) (Xjt)
Yi indicates the output indexes; Xj indicates the
input indexes; and Ri shows the output revenue
shares and Sj points out the input cost shares.
However, the formula introduced by Christensen
and Jorgenson (1985) to Total Factor Productivity is
amended as below for the current study.
TFP= RM+RP+RV)/ SM+SP+SV)
Where;
RM Revenue share of Maize
RP Revenue share of Paddy
RV Revenue share of Vegetable
SM Cost share of Maize
SP Cost share of Paddy
SV Cost share of Vegetable
Even Fuglie (2009) also has measured the
productivity in a similar base by dividing the total
income by the total cost spent (Y/X; where Y
indicates the Total Revenue and X indicates the
Total Cost; P.226).
Total income is by multiplying the total quantity of
output harvested (sold, consumed and stock in
hand) by the average market price. Total cost is
taken by summing the cost of; labour, fertilizer,
land rent, chemicals, seeds, harvesting expenses
and etc. this is in consistent with Fuglie (2009) and
Djomo et al (2012).
Data and indicators:
Total Factor Productivity
: RM+RP+RV)/ MC+PC+VC)
Seed Productivity : Total
Household Output/Total Quantity of Seeds
Land Productivity : Total
Household Output/Total Land area Used
TFPNFM
: Non-Farm Productivity
Non-farm Productivity measures how efficiently
input varieties of non-farm options are used to
generate maximum output. Here also like the farm
Productivity, TFP is calculated using the modified
equation as shown below
TFPNFM= Yij)/ Xij)
Where; Y = Income from multiple sources of Non-
Farm Options
X = Cost for multiple sources Non-Farm operations
This formula is moreover same as formula
developed by Fuglie (2009) and Djomo et al (2012).
However the monthly non-farm income and its cost
are directly taken on the survey and it is verified
using indirect questions.
Data nd variables with Indicators
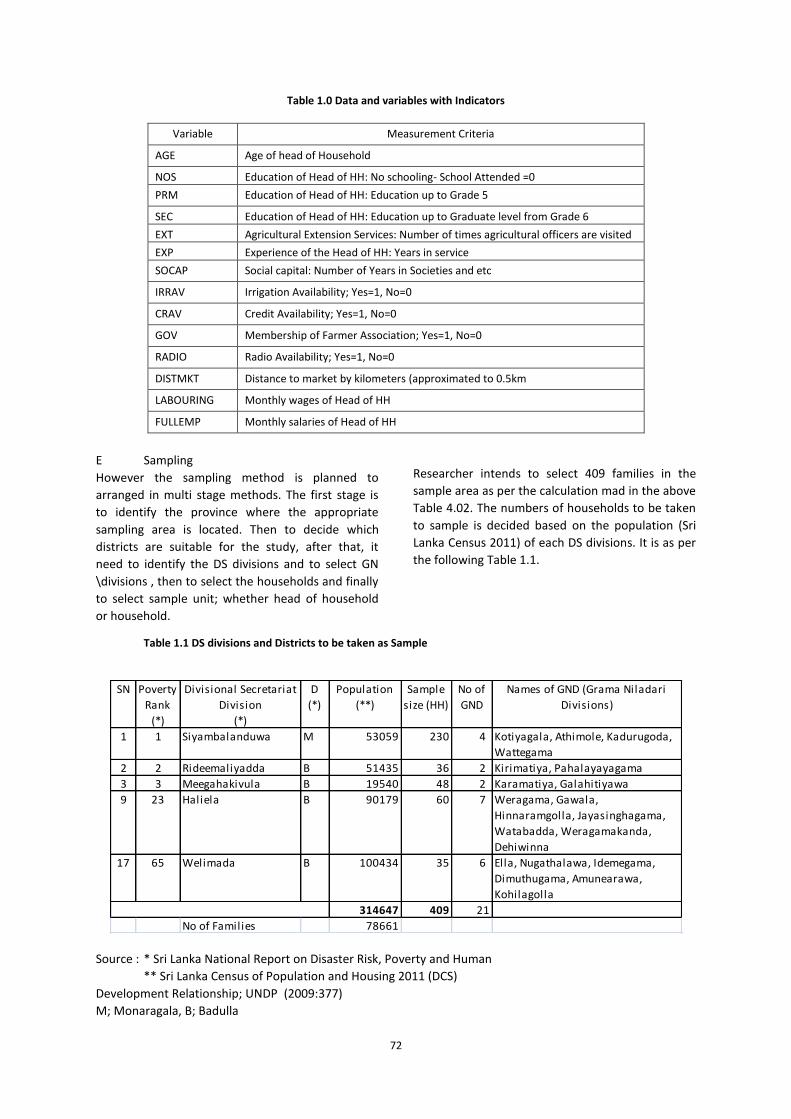
72
Table 1.0 Data and variables with Indicators
Variable Measurement Criteria
AGE Age of head of Household
NOS Education of Head of HH: No schooling- School Attended =0
PRM Education of Head of HH: Education up to Grade 5
SEC Education of Head of HH: Education up to Graduate level from Grade 6
EXT Agricultural Extension Services: Number of times agricultural officers are visited
EXP Experience of the Head of HH: Years in service
SOCAP Social capital: Number of Years in Societies and etc
IRRAV Irrigation Availability; Yes=1, No=0
CRAV Credit Availability; Yes=1, No=0
GOV Membership of Farmer Association; Yes=1, No=0
RADIO Radio Availability; Yes=1, No=0
DISTMKT Distance to market by kilometers (approximated to 0.5km
LABOURING Monthly wages of Head of HH
FULLEMP Monthly salaries of Head of HH
E Sampling
However the sampling method is planned to
arranged in multi stage methods. The first stage is
to identify the province where the appropriate
sampling area is located. Then to decide which
districts are suitable for the study, after that, it
need to identify the DS divisions and to select GN
\divisions , then to select the households and finally
to select sample unit; whether head of household
or household.
Researcher intends to select 409 families in the
sample area as per the calculation mad in the above
Table 4.02. The numbers of households to be taken
to sample is decided based on the population (Sri
Lanka Census 2011) of each DS divisions. It is as per
the following Table 1.1.
Table 1.1 DS divisions and Districts to be taken as Sample
SN Poverty
Rank
(*)
Divisional Secretariat
Division
(*)
D
(*)
Population
(**)
Sample
size (HH)
No of
GND
Names of GND (Grama Niladari
Divisions)
1 1 Siyambalanduwa M 53059 230 4 Kotiyagala, Athimole, Kadurugoda,
Wattegama
2 2 Rideemaliyadda B 51435 36 2 Kirimatiya, Pahalayayagama
3 3 Meegahakivula B 19540 48 2 Karamatiya, Galahitiyawa
9 23 Haliela B 90179 60 7 Weragama, Gawala,
Hinnaramgolla, Jayasinghagama,
Watabadda, Weragamakanda,
Dehiwinna
17 65 Welimada B 100434 35 6 Ella, Nugathalawa, Idemegama,
Dimuthugama, Amunearawa,
Kohilagolla
314647 409 21
No of Families 78661
Source : * Sri Lanka National Report on Disaster Risk, Poverty and Human
** Sri Lanka Census of Population and Housing 2011 (DCS)
Development Relationship; UNDP (2009:377)
M; Monaragala, B; Badulla

73
However the principle base of the selection of
number of households in each GN division is
depend on the guidance taken from the Grama
Niladarii and Samurdhi Officer
ii
F. Data Collection Tool
Semi-structured questionnaire method was widely
used.
G. Data Analysis
Meanwhile as the way farm activities
affect to non-farm activities, non-farm activities too
effects on farm activities as recursive relationships.
In parallel, employment remuneration too influence
on both farm activities and non-farm activities.
Therefore as the variables are interchangeably
influence on the other variables as a recursive
relationship, structural equation method is selected
as the evaluating model. Even Demi, Coleman-
Jensen and Snyder (2010), Pedro Flores-Jiménez,
Oswaldo Morales-Matamoros, Ricardo Tejeida-
Padilla (2011) and Robert Walker, Mark Tomlinson
and Glenn William also have used the structural
equation method on their studies to evaluate their
recursive relationships. However the current study
also uses the structural equation model to analyze
the empirical data collected followed by the
conceptual framework and empirical model. The
method of estimate is the Maximum Likelihood
(ML) Estimates because SPSS Amos doesn’t provide
most accurate information form the alternative
methods such as Generalized least squares method,
Unweighted least squares method, Sale-free least
squares method and Asymptotically distribution-
free method. However ML gives consistent
parameter estimates and as the calculation even
for the bigger sample size is not difficult, ML is used
here as the method of estimation.
However in order to find out the indirect
relationships, indirect effects and the their
significance and probability levels, the Bootrap
Techniques which is a inbuilt technique with SPSS
AMOS version 21 is used. Percentile Confidence
Level of 95% and 90% Confidence Level in the
Bootrap Technique is used instead Bias-Corrected
Confidence Level. Most of the studies on poverty
studies used the structural equation method to
analyses the research data.
H Model Fit
This study used the value of Chi-square (χ2),
RMSEA, GFI and CFI value as criterion to examine
the fit of the model.
IV DATA ANALYSIS
The following section covers the results of data
analysis from 409 households.
A Model Fit Summary
In order to see the fitness of the model, the
indexes such as Root Mean Square Residual
(CMIN/DF), Goodness of Fit Index (GFI), Adjusted
Goodness of fit Index (AGFI), Parsimony Goodness
of Fit Index (PGFI), Normed Fit Index (NFI), Relative
Fit Index (RFI), Tucker-Lewis Coefficient Index (TLI),
Comparative Fit Index (CFI), Parsimony Ratio
(PRATIO), Parsimony adjustment to the NFI (PNFI),
Parsimony adjustment to the CFI (PCFI),
Incremental Fit Index (IFI) are used as follows in the
Table 1.3
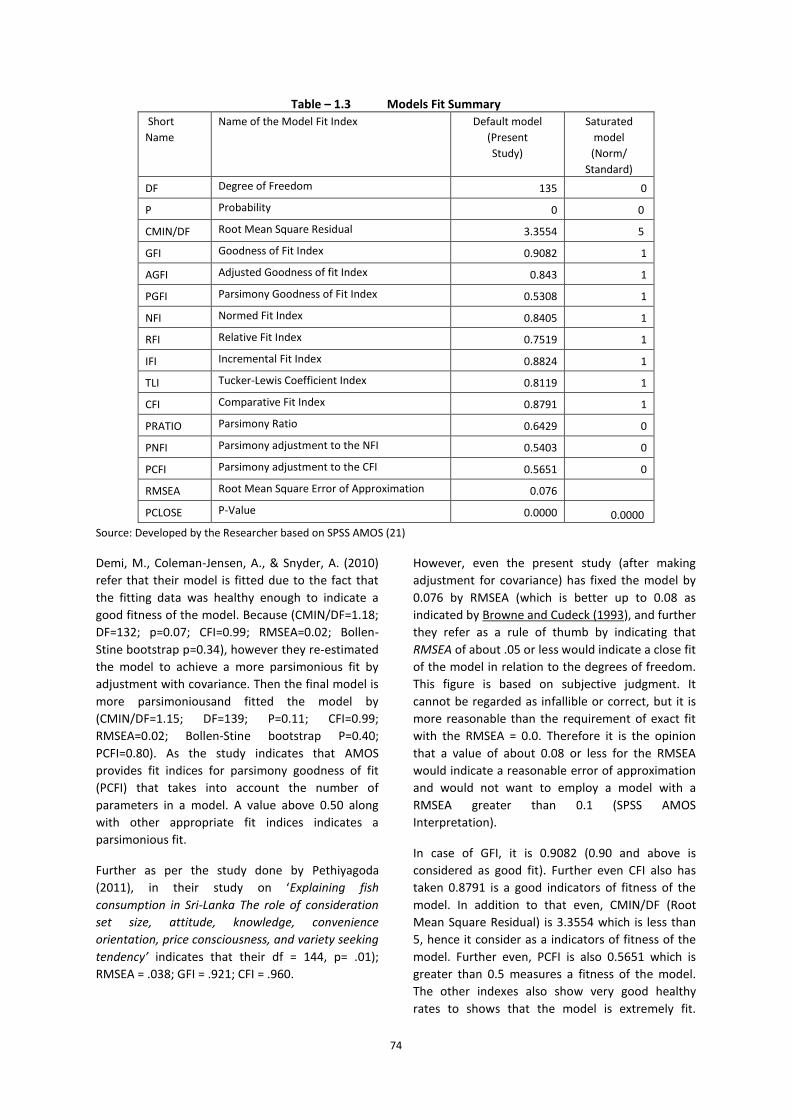
74
Table – 1.3 Models Fit Summary
Short
Name
Name of the Model Fit Index Default model
(Present
Study)
Saturated
model
(Norm/
Standard)
DF Degree of Freedom 135 0
P Probability 0 0
CMIN/DF Root Mean Square Residual 3.3554 5
GFI Goodness of Fit Index 0.9082 1
AGFI Adjusted Goodness of fit Index 0.843 1
PGFI Parsimony Goodness of Fit Index 0.5308 1
NFI Normed Fit Index 0.8405 1
RFI Relative Fit Index 0.7519 1
IFI Incremental Fit Index 0.8824 1
TLI Tucker-Lewis Coefficient Index 0.8119 1
CFI Comparative Fit Index 0.8791 1
PRATIO Parsimony Ratio 0.6429 0
PNFI Parsimony adjustment to the NFI 0.5403 0
PCFI Parsimony adjustment to the CFI 0.5651 0
RMSEA Root Mean Square Error of Approximation 0.076
PCLOSE P-Value 0.0000 0.0000
Source: Developed by the Researcher based on SPSS AMOS (21)
Demi, M., Coleman-Jensen, A., & Snyder, A. (2010)
refer that their model is fitted due to the fact that
the fitting data was healthy enough to indicate a
good fitness of the model. Because (CMIN/DF=1.18;
DF=132; p=0.07; CFI=0.99; RMSEA=0.02; Bollen-
Stine bootstrap p=0.34), however they re-estimated
the model to achieve a more parsimonious fit by
adjustment with covariance. Then the final model is
more parsimoniousand fitted the model by
(CMIN/DF=1.15; DF=139; P=0.11; CFI=0.99;
RMSEA=0.02; Bollen-Stine bootstrap P=0.40;
PCFI=0.80). As the study indicates that AMOS
provides fit indices for parsimony goodness of fit
(PCFI) that takes into account the number of
parameters in a model. A value above 0.50 along
with other appropriate fit indices indicates a
parsimonious fit.
Further as per the study done by Pethiyagoda
(2011), in their study on ‘Explaining fish
consumption in Sri-Lanka The role of consideration
set size, attitude, knowledge, convenience
orientation, price consciousness, and variety seeking
tendency’ indicates that their df = 144, p= .01);
RMSEA = .038; GFI = .921; CFI = .960.
However, even the present study (after making
adjustment for covariance) has fixed the model by
0.076 by RMSEA (which is better up to 0.08 as
indicated by Browne and Cudeck (1993), and further
they refer as a rule of thumb by indicating that
RMSEA of about .05 or less would indicate a close fit
of the model in relation to the degrees of freedom.
This figure is based on subjective judgment. It
cannot be regarded as infallible or correct, but it is
more reasonable than the requirement of exact fit
with the RMSEA = 0.0. Therefore it is the opinion
that a value of about 0.08 or less for the RMSEA
would indicate a reasonable error of approximation
and would not want to employ a model with a
RMSEA greater than 0.1 (SPSS AMOS
Interpretation).
In case of GFI, it is 0.9082 (0.90 and above is
considered as good fit). Further even CFI also has
taken 0.8791 is a good indicators of fitness of the
model. In addition to that even, CMIN/DF (Root
Mean Square Residual) is 3.3554 which is less than
5, hence it consider as a indicators of fitness of the
model. Further even, PCFI is also 0.5651 which is
greater than 0.5 measures a fitness of the model.
The other indexes also show very good healthy
rates to shows that the model is extremely fit.
75
Further having ‘P’ 0 also indicates a good fitness to
the model. Finally even Bollen-Stine bootstrap
P=0.34, also shows a better indicators of fitness.
As most of the indexes shown in the above Table
6.36, used to evaluate the model’s fitness is close to
0.9, and the SPSS AMOS indicates that the minimum
was achieved, it can be concluded that the model is
fit enough to continue for the estimation.
However, in order to see the real gravity of
education on rural poverty, it needs to look into P-
Values of which represents in the ‘Sig.’ column in
the Table 1.4. Column number four of the Table
1.4, indicates under the 95% confidence level
interval, which variables are significant or not. If the
significance value (Sig.) comes less than 5% or 0.05,
it concludes that particular independent variable is
more significant to change dependent variable.
Standardized Beta Coefficient as shown in the
following data tables, column number two
measures how far the changes in one unit of
independent variable or mediating variable shown
in the column number one in the table, would
change the status of poverty (as an example) being
the dependent variable. If the figure indicates a plus
(+) mark, it points out there is a positive relationship
with the dependent variable or if the figure
indicates a minus (-) mark, it points out there is a
negative/inverse relationship with the dependent
variable.
B Impact of Education on Agricultural
Productivity
However based on the coefficients of the
independent variables as shown in the below Table
1.4, it can be seen that Professional Experience
(EXP), extension contacts (EXT), Primary Education
(PRM), Secondary Education (SEC), Availability of
Land (LAND), Social Capital (SOCAP), Family Size
(HHSIZE), Irrigation Availability (IRRAV), Availability
of Radio (RADIO), Credit Availability (CRAV) and
Membership of Govi Associations (GOV) positively
correlates with the Total Factor (TFP) in order to
stabilize farm income. However only the variable
such as Professional Experience (EXP), Extension
contacts (EXT), Primary Education (PRM), Secondary
Education (SEC), Family Size (HHSIZE), Irrigation
Availability (IRRAV) and Credit Availability (CRAV)
are significantly and positively correlates with Farm
Total Factor Productivity (TFPFM
).
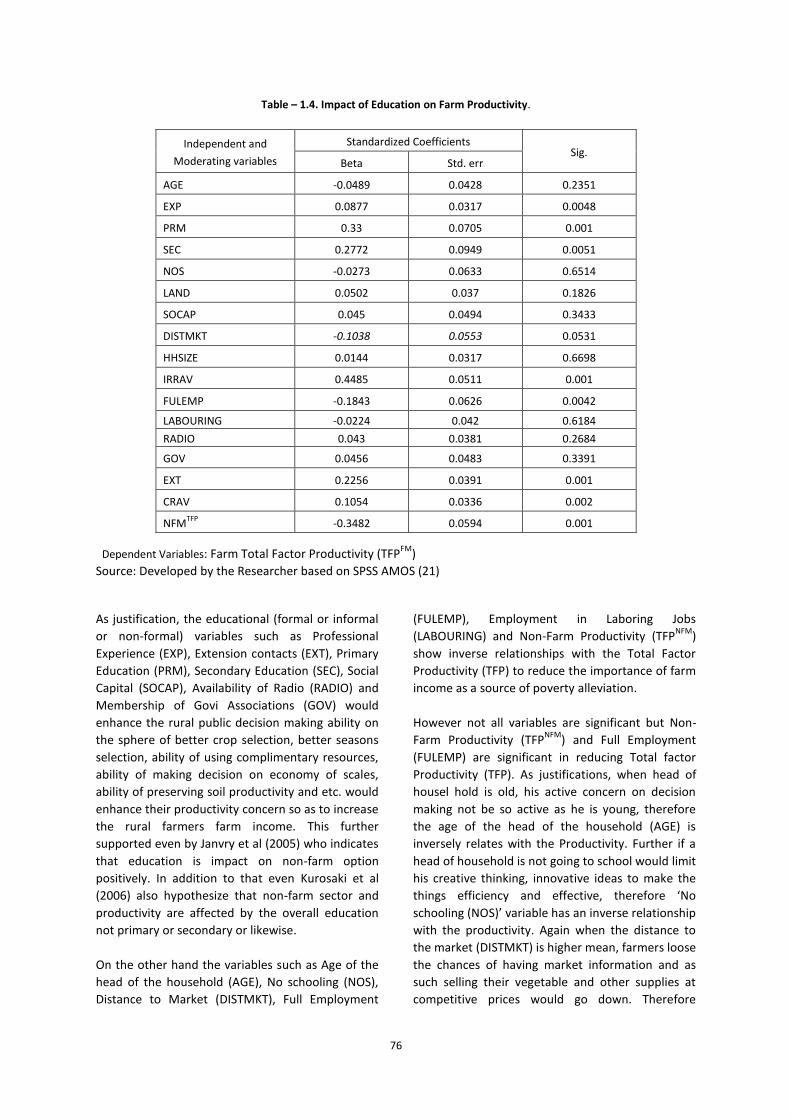
76
Table – 1.4. Impact of Education on Farm Productivity.
Dependent Variables: Farm Total Factor Productivity (TFPFM
)
Source: Developed by the Researcher based on SPSS AMOS (21)
As justification, the educational (formal or informal
or non-formal) variables such as Professional
Experience (EXP), Extension contacts (EXT), Primary
Education (PRM), Secondary Education (SEC), Social
Capital (SOCAP), Availability of Radio (RADIO) and
Membership of Govi Associations (GOV) would
enhance the rural public decision making ability on
the sphere of better crop selection, better seasons
selection, ability of using complimentary resources,
ability of making decision on economy of scales,
ability of preserving soil productivity and etc. would
enhance their productivity concern so as to increase
the rural farmers farm income. This further
supported even by Janvry et al (2005) who indicates
that education is impact on non-farm option
positively. In addition to that even Kurosaki et al
(2006) also hypothesize that non-farm sector and
productivity are affected by the overall education
not primary or secondary or likewise.
On the other hand the variables such as Age of the
head of the household (AGE), No schooling (NOS),
Distance to Market (DISTMKT), Full Employment
(FULEMP), Employment in Laboring Jobs
(LABOURING) and Non-Farm Productivity (TFPNFM
)
show inverse relationships with the Total Factor
Productivity (TFP) to reduce the importance of farm
income as a source of poverty alleviation.
However not all variables are significant but Non-
Farm Productivity (TFPNFM
) and Full Employment
(FULEMP) are significant in reducing Total factor
Productivity (TFP). As justifications, when head of
housel hold is old, his active concern on decision
making not be so active as he is young, therefore
the age of the head of the household (AGE) is
inversely relates with the Productivity. Further if a
head of household is not going to school would limit
his creative thinking, innovative ideas to make the
things efficiency and effective, therefore ‘No
schooling (NOS)’ variable has an inverse relationship
with the productivity. Again when the distance to
the market (DISTMKT) is higher mean, farmers loose
the chances of having market information and as
such selling their vegetable and other supplies at
competitive prices would go down. Therefore
Independent and
Moderating variables
Standardized Coefficients Sig.
Beta Std. err
AGE -0.0489 0.0428 0.2351
EXP 0.0877 0.0317 0.0048
PRM 0.33 0.0705 0.001
SEC 0.2772 0.0949 0.0051
NOS -0.0273 0.0633 0.6514
LAND 0.0502 0.037 0.1826
SOCAP 0.045 0.0494 0.3433
DISTMKT -0.1038 0.0553 0.0531
HHSIZE 0.0144 0.0317 0.6698
IRRAV 0.4485 0.0511 0.001
FULEMP -0.1843 0.0626 0.0042
LABOURING -0.0224 0.042 0.6184
RADIO 0.043 0.0381 0.2684
GOV 0.0456 0.0483 0.3391
EXT 0.2256 0.0391 0.001
CRAV 0.1054 0.0336 0.002
NFMTFP
-0.3482 0.0594 0.001
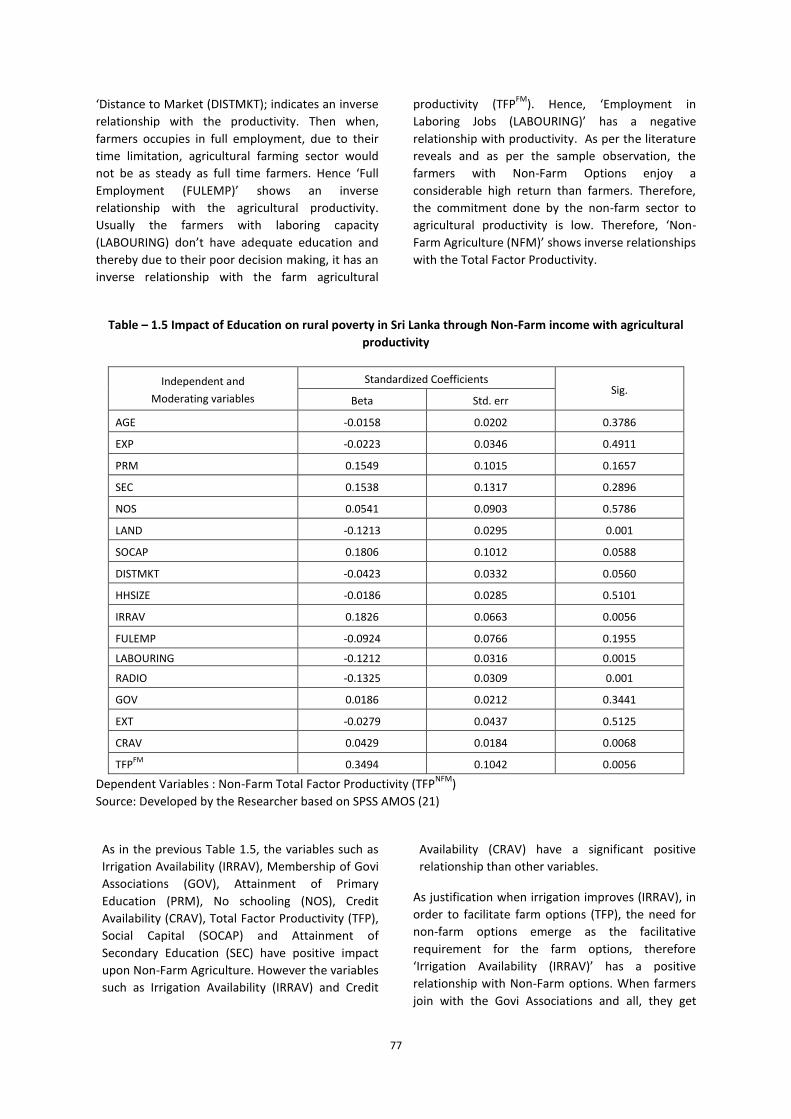
77
‘Distance to Market (DISTMKT); indicates an inverse
relationship with the productivity. Then when,
farmers occupies in full employment, due to their
time limitation, agricultural farming sector would
not be as steady as full time farmers. Hence ‘Full
Employment (FULEMP)’ shows an inverse
relationship with the agricultural productivity.
Usually the farmers with laboring capacity
(LABOURING) don’t have adequate education and
thereby due to their poor decision making, it has an
inverse relationship with the farm agricultural
productivity (TFPFM
). Hence, ‘Employment in
Laboring Jobs (LABOURING)’ has a negative
relationship with productivity. As per the literature
reveals and as per the sample observation, the
farmers with Non-Farm Options enjoy a
considerable high return than farmers. Therefore,
the commitment done by the non-farm sector to
agricultural productivity is low. Therefore, ‘Non-
Farm Agriculture (NFM)’ shows inverse relationships
with the Total Factor Productivity.
Table – 1.5 Impact of Education on rural poverty in Sri Lanka through Non-Farm income with agricultural
productivity
Independent and
Moderating variables
Standardized Coefficients Sig.
Beta Std. err
AGE -0.0158 0.0202 0.3786
EXP -0.0223 0.0346 0.4911
PRM 0.1549 0.1015 0.1657
SEC 0.1538 0.1317 0.2896
NOS 0.0541 0.0903 0.5786
LAND -0.1213 0.0295 0.001
SOCAP 0.1806 0.1012 0.0588
DISTMKT -0.0423 0.0332 0.0560
HHSIZE -0.0186 0.0285 0.5101
IRRAV 0.1826 0.0663 0.0056
FULEMP -0.0924 0.0766 0.1955
LABOURING -0.1212 0.0316 0.0015
RADIO -0.1325 0.0309 0.001
GOV 0.0186 0.0212 0.3441
EXT -0.0279 0.0437 0.5125
CRAV 0.0429 0.0184 0.0068
TFPFM
0.3494 0.1042 0.0056
Dependent Variables : Non-Farm Total Factor Productivity (TFPNFM
)
Source: Developed by the Researcher based on SPSS AMOS (21)
As in the previous Table 1.5, the variables such as
Irrigation Availability (IRRAV), Membership of Govi
Associations (GOV), Attainment of Primary
Education (PRM), No schooling (NOS), Credit
Availability (CRAV), Total Factor Productivity (TFP),
Social Capital (SOCAP) and Attainment of
Secondary Education (SEC) have positive impact
upon Non-Farm Agriculture. However the variables
such as Irrigation Availability (IRRAV) and Credit
Availability (CRAV) have a significant positive
relationship than other variables.
As justification when irrigation improves (IRRAV), in
order to facilitate farm options (TFP), the need for
non-farm options emerge as the facilitative
requirement for the farm options, therefore
‘Irrigation Availability (IRRAV)’ has a positive
relationship with Non-Farm options. When farmers
join with the Govi Associations and all, they get
78
then necessary guidance and motivation to go for
financially viable ventures such as dairy and
mushroom and etc. As a result of that ‘Membership
of Govi Associations (GOV)’ has a positive
relationship with the Non-farm Options. However
the impacts of formal education such as Attainment
of Primary Education (PRM) and Attainment of
Secondary Education (SEC) have a natural positive
impact towards the non-farm Total Factor
Productivity (TFPNFM
). Although it is up to
questionable reason, having gained no education at
all would find avenues to earn their livelihood from
the sources such as fishing, hunting and etc. shows
that ‘No schooling (NOS)’ and non-farm options are
correlated. Credit Availability (CRAV) can be a good
motivator to the rural sector to starts Non-farm
options with the capital capacities gained from the
credit facilities. Further the impacts of FarmTotal
Factor Productivity (TFPFM
) to non-farm options are
always positively correlates with non-farm options.
As educational variables even the Social Capital
(SOCAP) also have positive impact upon Non-Farm
Options Productivity (TFPNFM
).
But when the family size increases, it limits
resources availability and economic pressures
would constraints the non-farm options negatively.
Therefore Family Size (HHSIZE) has an inverse
relationship with non-farm options. When the head
of household is over, he does not see any interest of
new things such as non-farm options, therefore
‘Age of the head of the household (AGE)’ has an
inverse relationship with the non-farm options. The
factors such as Availability of Radio (RADIO),
Professional Experience (EXP), Extension Contacts
(EXT), Full Employment (FULEMP), and Employment
in Laboring Jobs (LABOURING), Availability of Land
(LAND) and Distance to Market (DISTMKT) have an
inverse relationship with the non-farm agricultural
productivity as they are more focused to farm
sector, employment and etc. not for non-farm
sector.
V CONCLUSION AND FINDINGS
Education is the stock of knowledge or skill that a
person hold within a period of time as per many
studies. Productivity is the indicator which shows
the output in terms of one unit of input. When
something is ‘Productive’ mean ‘output’ generated
from a one unit of ‘input’ is greater than one, if not
it is called as ‘un-productive’. Therefore in order to
arrive at a maximum amount of output from a
minimum level of input, education can be viewed as
a crucial indicator. Further education has the
possibility to develop people’s capability as well in
order to increase their economic strength
However, it is obvious that education makes the
people a resource, hence this resourceful people
can make the things productive. Then the
productivity emerges with plenty of advantages to
agricultural sector and then the rural sector.
Primarily, it gives a clear pathway to enhance the
rural capability by; cost advantages, higher income,
higher wages, adequate volume of marketable
surplus to higher income, enhancement of skills,
ability meet the growing agricultural demand of
people and so on.
The sample area and its 409 families have shown
real characteristics of rural sector. However their
dependency on agriculture, their sources of income
from farm, non-farm and employments are closely
linked with the education. As per the analysis, it was
evident, that education has a close relationship
with; consumption, agricultural productivity, non-
farm income, full employment and laboring jobs.
Education and consumption is positively correlated.
Primary education and secondary education are
positively correlated with the agricultural
productivity while No Schooling has an inverse
relationship with the farm productivity. Further
primary and secondary education are positively
related with non-farm productivity.
However the role of education is considerable in
making sure the maximum output for minimum
farm or non-farm inputs due to their better decision
making abilities, abilities in spotting opportunities
and abilities in taking making risk decisions through
environmental threats and etc. of which are
fostered by the education. Not only education
makes a key role in establishing productivity,
education level can make people to be more
capable than that of no-educated people. Further,
higher educated people are more capable than the
people with secondary education. Besides the
people with secondary education have more
capabilities than those with primary education. Not
only formal education can make the people to be
more productive and capable like this, even the
informal and non-formal education also help to
achieve a higher level of capability and productivity.
79
REFERENCE
Asadullah, M. N., & Rahman, S. (2009). Farm productivity
and efficiency in rural Bangladesh: the role of
education revisited. Applied economics, 41(1),
17-33.
Bhati, S.K. (1995). Basic aspects of rural development in
India. in SG Hundekar (eds), Management Of
Rural Sector, KM Rai Mittal for Mittal
publications, New Delhi, pp.23-40
Djomo, J. M. N., & Sikod, F. (2012). The Effects of Human
Capital on Agricultural Productivity and
Farmer’s Income in Cameroon. International
Business Research, 5(4), p149.
Edirisinghe, J. C., Edirisinghe, M. P., & Auwardt, D. M.
(2008). Reasons for variations in the levels of
efficiency in smallholder dairy milk production
in Sri Lanka: A Cross Sectional Data
Analysis. Journal of Food and Agriculture, 1(2),
30-39.
Edirisinghe,N (1990). Poverty in Sri Lanka: its extent,
distribution and characteristics of the poor.
Paper submitted to the World bank Sri Lanka:
Sri Lanka Poverty Alleviation and employment
project
Hemachandra, D., Kodithuwakku, S. (2006). Business
orientation among poor dry zone farmers in Sri
Lanka. Sri Lanka Journal Of Agricultural
Economics, 8, pp.31-49
Jimerson, Lorna (2005). Placism in NCLB—How rural
children are left behind. Equity & excellence in
education, 38(3), pp.211-219.
Kiresur, V. R., Melinamani, V. P., Kulkarni, V. S., Bharati,
P., & Yadav, V. S. (2010). Agricultural
Productivity, Rural Poverty and Nutritional
Security: A Micro Evidence of Inter-Linkages
from Karnataka State. Agricultural Economics
Research Review, 23, 29-40.
Onphanhdala, P. (2009). Farmer Education and
Agricultural Efficiency: Evidence from Lao
PDR. GSICS Working Paper Series, 20.
Oxaal, Z. (1997). Education and poverty: a general
analysis. Bridge, 53, pp.1-22
Pudasaini, S. P. (1983). The effects of education in
agriculture: Evidence from Nepal. American
Journal of Agricultural Economics, 65(3), 509-
515.
Roy, I. (1996). Stagnating productivity in crop agriculture:
the quest for sources of growth. Asia Pacific
Journal Of Rural Development, VI(2), pp.63-84
Tabari, N. A. Y., & Reza, M. (2012). Technology and
education effects on labor productivity in the
agricultural sector in Iran. European Journal of
Experimental Biology, 2(4), 1265-1272.
Umeh, J. C., & Asogwa, B. C. (2011). Econometric Model
of Poverty for the Farming Households in
Nigeria: A Simultaneous Equation Approach.
In 2011 2nd International Conference on
Agricultural and Animal Science (CAAS 2011),
Maldives. International Proceedings of
Chemical, Biological and Environmental
Engineering, November (pp. 25-26).
Wong, W. P. J. (2012). Effects of education on Sub
Saharan Africa.
BIOGRAPHY OF AUTHORS
1UG Rajapaksha is a lecturer of
Management and Finance of Sir John
Kotelawela defence University of Sri
Lanka. His research interests include
studies on Poverty.
2
Dr. WM Semasinghe is a senior lecturer
of Department of Economics of
University of Kelaniya, Sri Lanka. His
research interests include Poverty
Studies. He has produced more than 20
referred international and local Journal publications to
his credit.
3
Dr. DAC Silva is a senior lecturer of
Department of Economics of University
of Colombo, Sri Lanka. His research
interests include studies on Tourism.
80
Indo-Sri Lanka Bilateral Relations: Analytical review on Political & Cultural Relations Since 2005
Hasith Kandaudahewa
Department of International Relations, University of Colombo, Sri Lanka
Abstract— In ancient history, India and Sri Lanka
maintained close relationship with each other’s due
to closed geographical proximity. Meanwhile
religious and political ideology brought important
factors to determine bilateral relations between
both countries. In modern international relations
both countries maintain close relationship with each
other’s in Political and Cultural arena. Thru the
political and cultural interdependency India has
become a key player in regional and international
development scenario. Indo-Sri Lanka Political and
Cultural relations mark critical point since the
beginning of ethnic conflict in Sri Lanka. Sinhala
Tamil ethnic conflict which is protracted internal
war made more Indian involvement to Sri Lanka in
past three decades. Under His Excellency the
President Mahinda Rajapaksa, Indo-Sri Lanka
Bilateral Relations began into develop
interdependency with each other’s. Moreover India
becomes more influence party to determine
Northern and Eastern development over Sri Lankan
Tamil community during Eleam War IV and post
war era.
Keywords—Post-War Development, Political
Relations, Ethnic Sensitivity
I. INTRODUCTION
During the western colonization in Asian content,
India and Ceylon were under British Raj nearly
hundred and thirty years and got independence
during same time. During the colonial period both
countries faced political & cultural threat to their
own regimes due to British administrative
framework & missionary in Asia. During the post-
colonial era both countries maintained close
relationship within the international system due to
their bond to commonwealth organization and
ethnic sensitivity towards each other’s.
Since the independence, Dominion of Ceylon (DoC)
mainly focuses on regional powers to determine
Ceylon foreign Policy in Post-Independence era.
During the post-colonial era Ceylon-India maintain
close relationship within the international system
due to their alliance to The Commonwealth Nations
and ethnic sensitivity towards each other’s. Since
1980, Indo – Sri Lanka political and cultural
relations mark critical point due to beginning of
ethnic war in Sri Lanka. Sri Lankan ethnic conflict
which is protracted internal war made more Indian
involvement to Sri Lanka. In 1987 Indian
government intervention to Sri Lankan air space
created high pressure on both countries bilateral
relations and it has indicated Indian sensitivity
toward Sri Lankan Tamil community. As a result of
that, GoSL forcefully signed Indo-Sri Lanka Accord in
July 1987. There are two major implementations
under Indo-Sri Lanka accord. One is adjoin north
and eastern provinces and allow Indian
Peacekeeping Forces (IPKF) to enter Jaffna
Peninsula. Thru that, Indian government believed
separation of power will secure Tamil political
rights and eliminating LTTE in northern area will
secure peaceful living situations for Tamil
community in Sri Lanka.
II. INDO-SRI LANKA POLITICAL RELATIONS
Under His Excellency President Mahinda
Rajapaksha, Indo-Sri Lanka Bilateral Relations began
into develop interdependent with each other’s.
Manifesto of Presidential campaign called
“Mahinda Chinthana” mentioning about Sri Lankan
Foreign policy toward India was based on two
priorities. One is acceptance of Indian supremacy
over Sri Lankan ethnic conflict and other one is
friendly-cooperative approach to conduct bilateral
relations. To re-establish the faithful image of Sri
Lankan New Government President Mahinda
Rajapaksha decided to conduct his first visit to India
on December 27-30, 2005. During his visit he met
Indian President Abdul Kalam and he explained
importance of Indian role in establishing peace and
81
eliminating terrorism in South Asia (Daily News,
2005)
A. Political Relations 2005-2009
During 2005-2009 Indo-Sri Lanka political relations
relayed on Sri Lankan Internal war and Indian
response over that. Because of that Sri Lanka
developed close high-end political relations with
India during the period of North and Eastern
Humanitarian missions. Especially in the beginning
of Mavil Aru Humanitarian Mission. Sri Lanka sent
top diplomats to explain GoSL strategic plan to GoI
to avoid unnecessary regional influence. Especially
during 14th SAARC Summit in New Delhi on 2007
March 29th-to April 04th President Rajapaksha
explains his strategy based on Eastern Province
developments and establishing peace in Sri Lanka
to Indian Prime Minister Manmohan Singh. While
Northern and Eastern humanitarian missions and
Sri Lankan diplomatic mission continually share
recent update with Ministry of External Affairs in
India to get political and military advice till 2008.
Soon after the Northern victory Indian the Lok
Sabha and the Rajya Sabha conduct legislative
season to discuss Sri Lankan internal political issue
and due to Tamil Nadu pressure, Central Indian
Government decided to halt their military and
political support in top level and advice GoSL to
conduct missions in proper manner. Meanwhile
India request GoSL to resolve issues in thru
discussion and avoid unnecessary human sacrifice.
To response that President Rajapaksha during his
visit to India in October 27, 2007 clarifies Sri Lankan
government always use open discussion to resolve
ethnic issue (Hindustani Times, 2007). Moreover
During 15th SAARC Summit in Colombo President
Rajapaksha explain South Asian leaders about
necessity in eliminating terrorism in South Asian
region and Stand against for terrorist activities in
region (Piru, 2008).
During the last stage of war, Sri Lanka got more
pressure from western countries to move on peace
process rather engaging war with LTTE terrorist s.
But as always GoSL explain necessity in eliminating
terrorism to archive positive peace in conflict
affected area (Hansard, 2009). Moreover western
countries especially USA and UK requested India to
immediate mediation to last stage of war and
pressure GoSL to move toward peace talk process.
Meanwhile Indian External Affairs Minister Pranab
Mukherjee visit Sri Lanka as a Special Indian envoy
to discuss war strategies and explain GoSL solution
for ethnic war in Sri Lanka (mea.gov.in, 2009).
GoSL military victory over LTTE make more complex
situation between two parties. In military, Sri
Lankan armed forces showed their high capability in
counterterrorism activities and made indirect
challenge to Indian hegemonic power in region.
Because in between 1987-1990 powerful IPKF fail
to eliminate LTTE in Northern Province but twenty
years later GoSL armed forces archive target with
minimal casualties. Politically, it makes huge
internal and external pressures from western
alliance as well as Tamil diaspora based on Indian
actions over last stage of war.
B. Political Relations 2010-2014
During post internal war era, India continues its
political review on Sri Lanka and asks to move
forward on Political solution. The intention of
preventing negative impact, GoSL established
Lesson Learnt and Reconciliation Commission
(LLRC) appointed by President Mahinda Rajapaksha
to fact finding mission on Internal war and also
addressed international allegation about war
crimes. After two years, conducting a long mission,
LLRC released their report in public in December
2011 and GoSL prepared National Action Plan to
address LLRC recommendations with a lot of
international and regional pressure. Consequently,
GoSL proved international and regional community,
that it has a peace building plan to establish
positive peace in war affected areas and other parts
of the country (Piru, 2012). Meanwhile GoI
continue his support to GoSL over Resettlement
and Rehabilitation programme. Apart from that GoI
become a main facilitator to “Northern Spring”
(Uthuru Wasanthaya) and “Reawakening of the
East’ (Nagenahira Navodaya) programmes. In
addition to that President Rajapaksha during his
visit to India in June 2010, explained GoSL move
forward with LLRC recommendations but priority is
providing basic needs to internal refugees. India
donated USD 105 package for relief, rehabilitation,
and reconstruction to President Mahinda
Rajapaksha during his visit to India on 10-11 June
2010 (cgijaffna.org, 2014).
Furthermore, GoSL took actions to remove land
mines in Northern Province to make living more
comfortable. The homeland concept was strongly
affected on traditional people who believe their
land is everything for them and motivation form

82
South Indian politicians create mass impact on
resettlement plan. As a result of South Indian
pressure GoSL announced sensitive security areas
such as army camps and tactical areas can’t be
given for their original owners due to security
matters. Apart from that, due to lack of legal
evidence some people lost their lands and some of
them were taken over by the government to deploy
investment projects and handle ground facilities in
Northern Province. With the intention of avoiding
such kind of situation, GoSL established special land
despite resolving commissioner to speed up on
ownership matter and a resettlement issue which
was highly appreciated by Indian political leaders
lately (Piru, 2012).
Indo-Sri Lanka Political alliance marked a lapse
during 2011 war crimes allegations. Mainly South
Indian communities’ continually demanded
international investigations against GoSL and
pressured central government to stand against Sri
Lanka in international stage. Meanwhile in 2012,
USA and western countries brought a resolution
against Sri Lanka to United Nation Human Right
Council (UNHRC) and created a dialogue against Sri
Lanka in international stage. Consequently, UNHRC
conduct season about “Promoting reconciliation
and accountability in Sri Lanka” and open stage for
war crimes discussion. During the UNHRC 19th
Season Indian government politically moved with
Sri Lanka and it reduced the international pressure
on war crime investigation. Meanwhile India has
prominently become a major key player in
international stage during UNHRC. South Indian
involvement dramatically created a massive
damage for moral willingness for peace and
integration in Sri Lanka. Therefore multilateral
cooperation’s and INGO’s involved in internal issues
because it was affected to investment and cross
cultural integration as well as post war
reconstruction progress (Douglas Keh, 2012).
To ensure political security among Tamil
community and secure faith with Indian
government, GoSL lunched the All Party
Representative Committee (APRC) to provide a
better political solution. But at the beginning major
Tamil community representatives such as Tamil
National Alliance (TNA) withdrew form APRC
without granting proper chance of dialogue with
Tamil People. Moreover GoI request GoSL to
transfer power in to local authorities’ especially in
local government and held a Northern Provence
election to prove the government accountability.
To establish the democracy GoSL held a local
government election in northern and eastern
province to secure political rights. Completing first
half of grass root level democracy and peace
building, it created ad hoc for long hated political
insecurity and resolved major root cases for
conflict. Apart from that President Rajapaksha gave
his assurance to India about the implementation of
13 amendments without any doubt and gave
political solutions for Tamil minority (Piru, 2011).
Then he assured Indian government about
Northern Province elections in September 2013
(Asian tribune, 2013). Those actions helped to build
up positive attitude on democratic movement in Sri
Lanka. Unfortunately after announcing Northern
Province election, some political parties as well as
Buddhist monk organizations came forward to
remove 13 amendments and to remove land and
police power in provincial government which was
created under Indo-Sri Lanka Agreement in 1987.
The Situation became more critical when Sinhala
community rose against 13th
amendment because
they felt political insecurity among land and police
powers. On the other hand Tamil diaspora and
Indian political parties questioned about Sri Lankan
accountability to peace and international
community.
As a result of India became an aggressive regional
power to deter Sri Lankan position in international
stage. Especially Indian Congress Government
considers Tamil Nadu and Chinese involvement as a
defensive factor for Indo-Sri Lanka relations.
Therefor Sri Lankan Diplomatic missions conduct
negotiations with different layers of Indian
diplomats and re-established the faithful image of
GoSL to Indian Congress Government. Somehow in
2014 Indo-Sri Lanka bilateral relations make
positive impact on each other’s. Especially during
the UNHRC 25th
Regular Season when USA brought
strong proposal to UNHRC and requested to
conduct international independence investigations
on war crimes committed during the internal war.
On that time India was absent in position and
provided an opportunity to GoSL to adjust their
foreign and internal policy toward India.
During the 2014 Indian election campaign Sri
Lankan war crimes was a main theme to South
Indian politicians for grabbing ethnic votes for their
parties. But at the end of the election Indian
Congress Party was greatly defeated by Bharatiya

83
Janata Party and former Gujarat Chief Minister
Narendra Modi became the new Indian Prime
Minister for next four years with great foreign
policy. Recent regime change in India provides a
wide perspective to continue Indo-Sri Lanka
relations with deeper approach.
III. INDO-SRI LANKA CULTURAL RELATIONS
Indo-Sri Lanka cultural relations mainly ties with
Buddhist and Tamil culture developments.
Especially since 2005 both religious development
programmes runs thru diplomatic missions and
provide more political and administrative backup to
carry out them. For example SAARC cultural
programme and Education development process
was suddenly accelerated by both government and
developed cross culture activities for further
mediation process. Thru establishing South Asian
University, New Delhi in 2010 provided more
opportunities for SAARC as well as Sri Lankan
academic community to improve cultural as well as
educational ties with India. Moreover Indian
government provided security and facilities for Sri
Lankan pilgrims to India and secured their
economic interests as well. For example GoI
provided a cultural guide line to all Sri Lankans,
especially those who went to India thru South
Indian hubs during 2009-2014. Because on that
time South Indian politicians demanded another
bloodshed between ethnic communities in Sri
Lanka thru attaching Buddhist pilgrims in South
Indian areas (Priu, 2013).
As a result of bilateral request between Sri Lankan
and Indian executive authorities, GoI provided a
great opportunity to Sri Lankan Buddhist
community thru facilitating Exposition of Sacred
Kapilavastu Relics in August 2012 (High Commission
of India, 2012) thru that India has positively built up
their cultural relations from grass root level.
Moreover Indian government provided financial
assistance for Northern Province religious and
cultural centre rebuilding programmes especially
Tamil and Hindu populated areas. Under the Indian
Centre for Cultural Studies (ICCR) India promoted
Buddhist International Performing Arts Festival in
New Delhi in 2012 April and helped to build strong
cultural bond between two countries.
IV. CONTEMPORARY POLITICAL ISSUES
A. Resettlement and War Crimes
During last six years we can identify two major
political issues between Sri Lanka and India. First
one is relaying on IDP settlement and ethnic right
on Northern Tamil community. During the last
stage of internal war Sri Lankan defence forces
rescued 145,674 civilians and settled them over
government maintained IDP camps (Defence.lk,
2009). GoSL maintained IDP issues as their top
priority under certain limitations. Unfortunately
those limitations make uncomfortable situation to
GoI and they pressurize top level diplomats as well
as President Mahinda Rajapaksha regarding above
issues. After the internal war, many western
countries claim GoSL committed crimes against
humanity during the last stage of war. As a result of
that international community brought resolutions
called “Promoting reconciliation and accountability
in Sri Lanka” under UNHRC A/HRC/RES/19/2 and
UNHRC A/HRC/RES/22/2 (UNHRC Season 19, 22,
2012/13). In 2012 GoI support Sri Lankan
commitments over accountability in resettlement
but in 2012 Human Right season GoI decide to vote
against Sri Lanka. Indian support over UNHRC
resolution on Human Right issues has significantly
damage core value of bilateral relations between
two countries. Soon after UNHRC except top level,
all others local parties blame each other. Especially
Sri Lankan politicians and diplomatic community
claim India has violated Non Alignment policy and
those action is similar to Indian invade in Northern
Area on 1987.
Thru reviewing the Indian strategies for Sri Lankan
Internal issue between 2005-2009, we can identify
that India always supported for political solution
rather than military solutions for ethnic issue.
Moreover Indian Solution for Sri Lanka was greatly
influenced by Tamil Nadu politicians as well as
International Tamil Diaspora. Thru that GoI has
significantly accept non state actors influence on
foreign policy decision making process and
accepted the interdependency between state and
non-state actors.
B. Illegal fishing Issue
After the internal war, GoSL encouraged fishing in
Northern and Eastern areas. As a result of that
more local fishermen got involved with large scale
fishing and other naval natural resources gaining in
Mannar and Kachchativu areas as they are very rich

84
over natural sea resources. Due to minimal
pressure on border patrol, Indian fishermen reach
to Sri Lankan naval boarders to catch fish due to
rich natural resources. Those actions create
nending questions for both governments. After lot
of complains against Indian illegal fishing boats and
their large scale resource poaching GoSL decided to
take strong actions against those who are violating
the territorial boarders. Later Sri Lankan Navy
conducted the boarder petrol to catching illegal
fishing boats and charged several Indian nationals
over illegal border crossing. Meanwhile Tamil Nadu
state government pressured Indian central
government on above actions and demanded
immediate diplomatic actions against GoSL. In 2011
Hon. Rajitha Senarathna, Minister of Fisheries and
Aquatic Resources Development, Sri Lanka held
diplomatic talk with Indian Minister of Agriculture
and Fisheries, Sharad Pawar regarding illegal
attempts to Sri Lankan territorial water and avoid
unnecessary issues between both countries
(Sundaytimes, 2011). But Tamil Nadu Chief Minister
Jayalalithaa Jayaram requested central government
to immediately withdraw The 1974-1976 Traitorous
Agreements and claim their territorial right over
Gulf of Mannar, the Palk Bay, and Palk Strai. Thru
this Tamil Nadu became a key factor to determine
Indo-Sri Lanka bilateral relations as well as a spoiler.
Over this incident Indian External Affairs Minister
S.M. Krishna clarified Sri Lankan right over
Katchatheevu Island cannot be abrogated due to
the Indian respect over solemn agreement (Lok
Sabha, 2010).
This situation has grown during 2014 and Tamil
Nadu continually said Sri Lankan Navy has illegally
arrested Indian nationals in international water and
some of Indian fisherman was killed during the raid
(NDTV, 2013). Territorial claims over Mannar and
other northern areas deeply impact to the local and
international relations due to its sensitivity on
national and international economic as well as
politics.
In early 2014, President Mahinda Rajapaksha
decides to mediate international territorial claims
and try to provide high level political solutions for
these issues. Moreover Recent regime change in
India has provided a new approach to enter the top
level diplomatic talk between national leaders and
GoSL has officially decided to show positive
approach to Indian government thru releasing
Indian fisherman who’s currently under Sri Lankan
Navy arrest. This incident was carried out while
President Mahinda Rajapaksha visited New Indian
Prime Minister Sworn ceremony in New Delhi.
Thru examine the context we can properly identify
previous diplomatic negotiations failed due to two
reasons. One is involvement of low level diplomats
and other one is lack of confidence between two
parties. Especially during Indian Congress
government attitude toward Sri Lanka has
negatively grown up in political arena due to issues
in post war reconstruction progress and War crimes
over last stage of war. President Mahinda
Rajapaksha involvement has proven top level
discussion regarding the issue will provide more
secure base for both national interest over each
other’s.
V. CONCLUSION
In the conclusion researcher can mainly identify
Indo-Sri Lanka bilateral relations relay on state
actors as well as non-state actors such as Tamil
Nadu and Tamil Diaspora. Moreover the positive
steps taken by GoI and GOSL in a friendly approach
with each other and their expectations to take
more actions in near future should be highly
appreciated. Both parties’ unwillingness to be more
flexible on negotiation terms and their preference
to settle matters with win-win situation would
cause issues. The issue of their unwillingness to
negotiation could be avoided by following a co-
operative approach by both parties and respecting
each other’s ideas. However, it is proved that lack
of co-operation and confidence has become a
barrier for development for bilateral relations in
wide aspect.
REFERENCES
David, Anthony, 2012. President again pledges 13 Plus to
India. Sunday Times, 22 April. 12.
Gamini Keerawella. (1995). India's involvement in the Sri
Lankan Ethnic Conflict: objectives and modus
operandi 1980-1990. In: Mahindra Werake Security
Dilemma of a Small State. New Delhi: South Asian
Publishers. 276-314.
High Commission of India in Sri Lanka. 2013. India-Sri
Lanka Cultural Relations. [ONLINE] Available at:
http://www.hcicolombo.org/page/display/53/181.
[Accessed 18 June 14].
85
High Commission of India in Sri Lanka. 2014. India-Sri
Lanka Bilateral Relations. [ONLINE] Available at:
http://www.hcicolombo.org/page/display/24/181.
[Accessed 20 June 14].
IBN Live. 2009. India ready to mediate between Lanka,
LTTE. [ONLINE] Available at:
http://ibnlive.in.com/news/india-ready-to-
mediate-between-sri-lanka-and-ltte/85458-
3.html?from=rssfeed. [Accessed 17 June 14].
Priu, (2011). Commission of Inquiry on Lessons Learnt And
Reconciliation. Colombo: Government of Sri Lanka,
[ONLINE] Available at:
http://slembassyusa.org/downloads/LLRC-
REPORT.pdf . [Accessed 06 June 14].
Priu, (2013). National Plan of Action to Implement the
Recommendations of the LlRC. [ONLINE] Available
at:
http://www.priu.gov.lk/news_update/Current_Affa
irs/ca201207/20120726national_plan_action.htm.
[Accessed 06 June 14].
UNHRC, (2013). 22/.. Promoting reconciliation and
accountability in Sri Lanka. Available at:
http://daccess-dds-
ny.un.org/doc/RESOLUTION/LTD/G13/122/61/PDF/
G1312261.pdf?OpenElement [Accessed 06 June
14].
BIOGRAPHY OF AUTHORS
1 The Author is an Lecturer in
the Department of International
Relations, University of Colombo, Sri
Lanka. His research interests include
Foreign Policy and Post war analysis.
He has produced research papers based on Sri Lanka
Foreign policy and implementation of Positive Peace
Within ethnic communities. Moreover, he has more
than 10 referred international and local Journal
publications to his credit.
86
Impact of Drug Addiction & Its Dangerous Outcomes & the Future of Sri Lanka: A Buddhist Perspective
Ven: Moragaswewe Vijitha
Assistant Lecturer, Department of Pāli & Buddhist Studies, University of Peradeniya,
Abstract - Drug addiction has been considered as
one of the world’s largest enemies. As Buddhists,
we must be aware of this terrible situation with the
open-mind. True Buddhist never violates the Five
Precepts (pañcasīla). The last of the Five Precepts in
Buddhism advocates complete refraining from
taking intoxicating drinks and the other alcoholic
drugs. Total abstinence from taking intoxicants is
extremely significant for the mental and physical
health of society. Drug addiction like alcoholic
drinking, tobacco smoking like cigarettes, cigars and
pipe smoking, smoking cannabis (ganja), heroin
...Etc has become one of the most troubling social
problems in the modern Sri Lankan society.
Objectives of this article are to suggest the Buddhist
solutions to wipe out drug abuse. One of the main
factors that is retarding sustainable development
economic growth and the increase in poverty at the
grass roots level continues to be the use of drugs
mainly alcohol and cigarettes. Trend in Liquor
challenges the entire moral order of society if we are
planning for a prosperous country. The cost burden
to a country because of the consumption of alcohol
due to ill health, violence, accidents, loss of
productivity has made alcohol the number one
factor in the burden of disease of middle income
countries such as Sri Lanka. The data for study has
been collected from the primarily Buddhists
teachings and the relevant books and articles
written related the field and social experiences.
Buddhism is fully aware of the nature of social
problems, their causes, and the methods for
resolving them. Its social impact is tremendously
great. The Four Noble Truth can be applied as a
resolution for this dangerous issue. The Singālovāda,
Vanijjā, Parābhava Suttas talk about how it causes
for moral and cultural decline.
Keywords: Drug Addiction, Buddhism, Five
Precepts, Development, Sri Lanka
Nowadays, Sri Lanka, our mother land experiences
in dealing with drug addiction is the most troubling
social issues. The government of Sri Lanka and the
Ministry of Health have been taken various
measures to scale down the addiction of cigarettes,
arracks, opium, cannabis, heroin and certain
psychotropic substances, but not all these efforts
have been successful. There has been an increase in
the involvement of Sri Lankan nationals in
smuggling drugs across national boundaries. The
illicit trafficking of drugs have been increasing day
by day in Sri Lanka. The absence of a comprehensive
national policy on drug abuse has been a major
restriction on law enforcement could be the
foremost reason for this. Sri Lanka is lucky to have a
rich tradition of networks of religious institutions,
and these can be mobilized to discourage the use of
intoxicating drugs and alcohol. Under the drug
addicted surroundings, what happens to the future
of Sri Lanka and its future generation? My main
focus in this paper is giving the Buddhist approach
to scale down this terrible enemy. The data for this
study has been collected from the primarily
Buddhists teachings and the relevant books and
articles written related the field and social
experiences
The last of the Five Precepts in Buddhism advocates
total abstinence to drug addiction. Total abstinence
from taking intoxicants is extremely significant for
the mental and physical health of society. Buddhism
is fully aware of the nature of social problems, their
causes, and the methods for resolving them. Its
social impact is extremely enormous. The Four
Noble Truth of Buddhism can be applied as the best
resolution for this dangerous issue.
a. Suffering
- Disease
b. Cause of Suffering
- Diagnosis
c. Cessation of Suffering
- Prognosis
d. The Path leading to the cessation of
Suffering - Treatment
87
Although we are planning for a prosperous country,
trend in liquor production, which is very
disconnecting. The cost burden to a country
because of the consumption of alcohol due to ill
health, violence, accidents, loss of productivity has
made alcohol the number one factor in the burden
of disease of middle income countries such as Sri
Lanka. Consumption of the alcohol and tobacco are
being increased day by day in Sri Lanka. The
expenditure on alcohol and tobacco in a single year
is above Rs. 80 billion.
The application of the Pañcasīla concept of
Buddhism is tremendously more useful for today
than any days of the humane society. Its universal
acclaimability and acceptability is great. This
universal concept fully guides for good physical and
mental balance. This consists of the following initial
precepts.
a. Safeguards the security of all life including
human and animal.
b. Safeguards the right of ownership of justifiably
acquired private property.
c. Maintenance of healthy relations between
genders.
d. Upholding honesty in all social transactions.
e. Taking care of soundness of human judgment
by keeping away from intoxicants and drugs.
The fifth one, the precept of abstaining from the
use of drugs and intoxicants (surā-meraya-majja-
pamāda-ṭṭhānā veramaņī sikkhā-padaṃ) is quite
significant with regard to our context. The
Singālovāda Sutta of the Dīgha Nikāya emphasizes
the six evil consequences in addiction to intoxicants
and alcoholic drinks.
a. Loss of wealth (sandiṭṭhikā dhanaṅjāni)
b. Increase of quarrels (kalaha-ppavaḍḍhanī)
c. Susceptibility to disease (rogānaṃ āyatanaṃ)
d. Earning an evil reputation (akitti-sañjanaī)
e. Shameless exposure of body (kopīna-
niddaṃsanī)
f. Weakening of intellect (paññāya-dubbalīkaraņī)
(Cha kho me gahaputta ādinavā
surāmerayamajjapamādatthānānuyoge: sanditthikā
dhanajāni, kalahappavaddhati, rogānam āyanam,
akittisañjananī, kopīnanidansanī, paññāya
dubbalīkaranītveva chaṭṭham padam bhavati. Ime
kho gahapatiputta cha ādīnavā
surāmerayamajjapamādaṭṭhānuyoge-The
Singālovāda Sutta)
These six ways highlight and pay attention on the
three vital grounds that every man and woman has
severely undergo many pains in this life itself.
a) Declination of economic well-being (1)
b) Deterioration of good Health (3&6)
c) Harming Social status (2, 4 & 5)
In the Vanijjā Sutta, the Buddha speaks of five
prohibited trades in which one should never earn
money engaging those things. One of them is majja
vanijjā (Trade of drugs and alcoholic drinks). Even
in the Dhammapada, the text of the Khuddaka
Nikāya in the Theravāda Canon mentions that the
person who goes against the five precept destroys
this life completely.
yo pāņaṃ atipāteti musāvādañca bhāsati
loke adinnaṃ ādiyati paradārañca gacchati
surāmerayapānañca yo naro anuyuñjati
idhʼevʼ so lokasmiṃ mūlaṃ khaņati attano.
(The Dhammapada verse 246 and The Anguttara
Nikāya III)
The Dhammika Sutta of the Suttanipāta says that
not to resort the use of intoxicant drinks, the
householder should respect this principle, he should
not make others drink, nor approve the drinking
habit of others, knowing it to be a process of
maddening.
majjañ ca pānaṃ na samācareyya
dhammaṃ imaṃ rocaye yo gahaṭṭho
na pāyaye pivataṃ nānujaññā
ummādanaṃ taṃ iti naṃ viditvā.
The Parābhava Sutta points out that the person
who engages in the following wicked causes such as
to be a rake, a drunkard, a gambler, and to
squander all one earns where is a cause of oneʼs
downfall.
itthidhutto surāduttho akkhadhutto ca yo naro
laddhaṃ laddhaṃ vināseti taṃ parābhavato
mukhaṃ
To establish a peaceful and harmonious society,
Buddhism suggests that there should not have any
room for the use of alcoholic drinks and other so
called production. Buddhism introduces for good
governance the concept of the Wheel Turning
Monarch consisting with the just and righteous
principles (rājā cakkavattī dhammiko dhammarājā).
88
The nature of the Wheel Turning Monarch could be
found in the well-known Cakkavatthisīhanāda
Sutta. He sees nothing better than the five
precepts. He puts into action the acclaimability and
acceptability of the pañca sīla. There is no place for
spread of drugs and intoxicants in his realm at all.
The king completely prohibits the trade of drugs
and intoxicants . His realm never depends on
alcoholic production. Because he knows the danger
of this production and how to influence it for his
people and his kingdom. He commands other
rulers to implement this universal precept for the
purpose of enhancing norms and morals in the
world. (pāņo na haņtabbo adinnaṃ nādatabbaṃ
kāmesu micchā na caritabbaṃ musā na bhāsitabbā
majjaṃ na pātabbaṃ…The Dīgha Nikāya III, The
Cakkavattisīhanāda Sutta)
Though Sri Lanka is a Buddhist country prevailing
drugs and alcoholic production throughout the
Island is the worst factor. The Sri Lankan
government earns millions of dollars per a day
through the products in liquor. On the other hand it
spends double per a day for those who are suffering
from drink related illness. This harms our physical
and mental surroundings. Therefore, as the Sri
Lankans we must realize the danger of this bad
influence. Through the complete eradication of drug
addiction, production and distribution in Sri Lanka,
it could become the miracle of Asia and the world.
We, the future of Sri Lanka always hope a country
that completely free from drug addiction and
production.
REFERENCES
Prof. Dhammavihari Thera, (2006) Buddhist Ethics of
Pañcasīla, Buddhist Cultural Centre, 125, Anderson
Road, Nedimala, Dehiwala, Sri Lanka.
Sri Dhammananda, K. (1997) Human Life & Problems,
Buddhist Missionary Society, Buddhist Maha
Viharaya, 123, Jalan Berhala, Kuala Lumpur,
Malaysia.
Rahula, Walpola. (1996) What the Buddha Taught?,
Buddhist Cultural centre, 125, Anderson Road,
Nedimala, Dehiwala, Sri Lanka.
Vivaraņa- Ven. Koswatte Ariyavimala . (2009) Ed: Ven:
Mahamitawa Paññāratana & Ven: Ratmalwetiye
Samita, MĀGADHI, Publication Institution of Pali &
Buddhist Studies, Miriswatta, Puwakpitiya.
89
Determinants of Child Labour in Sri Lanka
Rumesh Werakoon1, MDJW Wijesinghe2
Department of Economics and Statistics, Sabaragamuwa University of Sri Lanka
[email protected], [email protected]
2
Abstract - Children are the key of future human
resources of any region. However some children
have to work entire day to satisfy the basic needs
and wants and their family as a labourer, called
child labour. The child employment is hard, cruel
and violates their rights of education, health
protection from work that is hazardous or
exploitative. In Sri Lanka one of out of every eight
children is economically active. A large number of
children in Sri Lanka work in unregistered sector.
The prime objective of the study is to identify the
determinants of child labour in Sri Lanka.120
questionnaires were used from both child labors and
non child labors from thePettah, Colombo district
using Convenience sampling method. Binary logistic
regression was used for analysis.
The study found that child labor is primarily caused
by low income level of household. Parents of child
labors are received lower level of income compared
with the parents of non-child labors. The income is
not enough to maintain family needs and wants. It
leads to exploitation of children’s time for
employment instead of schooling or education.
Education level of household heads also has
negative relationship on child labor. Lower levels of
education of parents have higher possibility to make
their children with employment. The education will
be the key of making skills and capacity of persons
and it is linked with income level of persons or
family. Lower level of education of the family will
make the worst form of attitudes on education. The
lacks of supports of household on education are
resulted to make low motivation of children’s study.
Thus the time of schooling will convert to
employment activities.Further magnitude of the
household is one of affected factor to engage
children in employment. Child labour rate is high
when the members of family more than
considerable amount compared with families that
have fewer members. Employment status of head of
the family makes negative impact on children’s
employment. Many of child labour can be seen
where the heads are self-employed workers or small
business holders. Many of temporary employment
opportunities are available in business or self-
employment sector. Thus children have opportunity
to engage with such kind of employment under the
permission of parents or not. The family with child
labour has lack of infrastructure compared with non
labour families. Thus the lower facilities availability
in household are affected to child employment.
Keywords: Child labour, Non child labour
I. INTRODUCTION
The world’s attention on child labor has been
increasing as there is a significant number of child
labor in both developed and developing countries
and their involvement in exploitative or dangerous
work is high. The ILO estimates that around 215
million of children are trapped in child labour. More
than a half of these children are involved in
hazardous pursuits that sometimes amount to
slavery, armed conflict, drug trafficking and other
illegal activities.According to the United Nation
connection on the Right of the article 1989, chid
labour defines as “any work that is likely to be
hazardous or to interfere with the child’s education
or to be harmful to the child’s health or physical,
mental, spiritual, moral or social development”. The
problem of child labour not only causesto damage
their physical and mental health but also their
education right, freedom, development of
childhood etc. Both developing countries and
developed countries are faced to the phenomenon
of child labour.The international Programme on
Elimination of Child Labour was launched under the
International Labour Organization to study child
labour and its ramifications in Sri Lanka. When
compared with developing countries in the world
Sri Lanka possesses relatively high human
development indexes and enjoys a higher level in
socio-economic standards due to various human
development programmes launched by successive
Sri Lankan governments since independence.
Among these, providing equal opportunities in
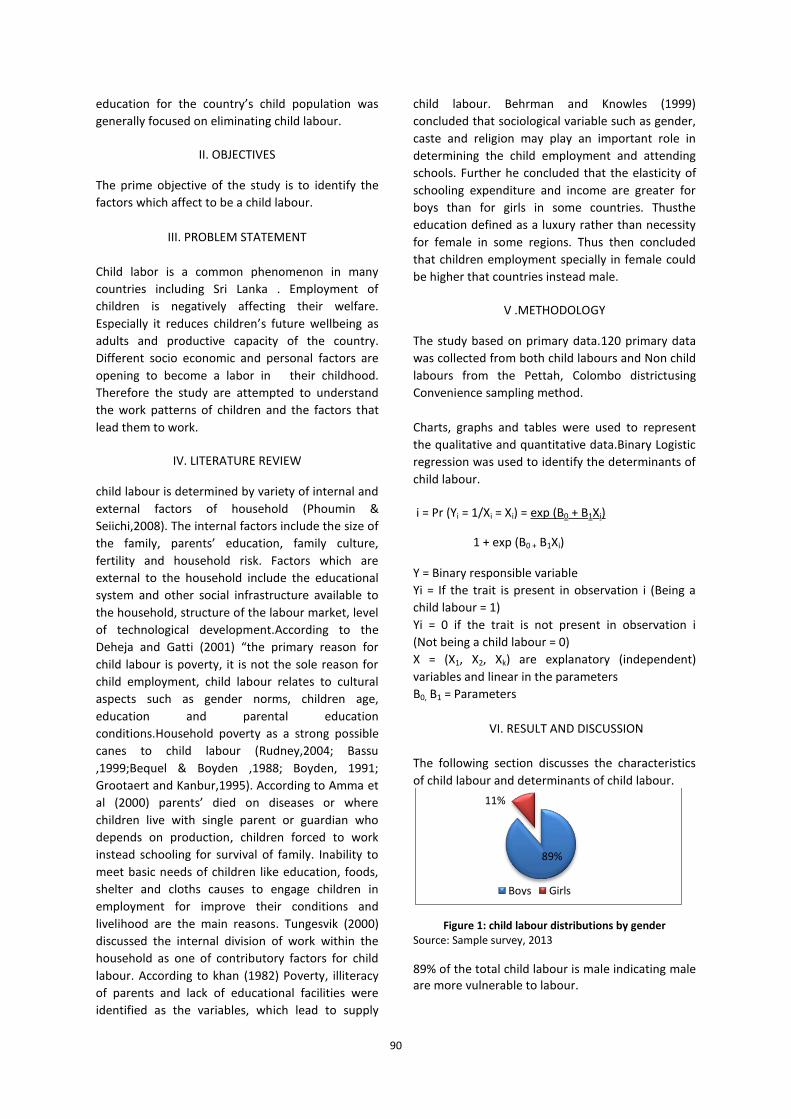
90
education for the country’s child population was
generally focused on eliminating child labour.
II. OBJECTIVES
The prime objective of the study is to identify the
factors which affect to be a child labour.
III. PROBLEM STATEMENT
Child labor is a common phenomenon in many
countries including Sri Lanka . Employment of
children is negatively affecting their welfare.
Especially it reduces children’s future wellbeing as
adults and productive capacity of the country.
Different socio economic and personal factors are
opening to become a labor in their childhood.
Therefore the study are attempted to understand
the work patterns of children and the factors that
lead them to work.
IV. LITERATURE REVIEW
child labour is determined by variety of internal and
external factors of household (Phoumin &
Seiichi,2008). The internal factors include the size of
the family, parents’ education, family culture,
fertility and household risk. Factors which are
external to the household include the educational
system and other social infrastructure available to
the household, structure of the labour market, level
of technological development.According to the
Deheja and Gatti (2001) “the primary reason for
child labour is poverty, it is not the sole reason for
child employment, child labour relates to cultural
aspects such as gender norms, children age,
education and parental education
conditions.Household poverty as a strong possible
canes to child labour (Rudney,2004; Bassu
,1999;Bequel & Boyden ,1988; Boyden, 1991;
Grootaert and Kanbur,1995). According to Amma et
al (2000) parents’ died on diseases or where
children live with single parent or guardian who
depends on production, children forced to work
instead schooling for survival of family. Inability to
meet basic needs of children like education, foods,
shelter and cloths causes to engage children in
employment for improve their conditions and
livelihood are the main reasons. Tungesvik (2000)
discussed the internal division of work within the
household as one of contributory factors for child
labour. According to khan (1982) Poverty, illiteracy
of parents and lack of educational facilities were
identified as the variables, which lead to supply
child labour. Behrman and Knowles (1999)
concluded that sociological variable such as gender,
caste and religion may play an important role in
determining the child employment and attending
schools. Further he concluded that the elasticity of
schooling expenditure and income are greater for
boys than for girls in some countries. Thusthe
education defined as a luxury rather than necessity
for female in some regions. Thus then concluded
that children employment specially in female could
be higher that countries instead male.
V .METHODOLOGY
The study based on primary data.120 primary data
was collected from both child labours and Non child
labours from the Pettah, Colombo districtusing
Convenience sampling method.
Charts, graphs and tables were used to represent
the qualitative and quantitative data.Binary Logistic
regression was used to identify the determinants of
child labour.
i = Pr (Yi = 1/Xi = Xi) = exp (B0 + B1Xi)
1 + exp (B0 + B1Xi)
Y = Binary responsible variable
Yi = If the trait is present in observation i (Being a
child labour = 1)
Yi = 0 if the trait is not present in observation i
(Not being a child labour = 0)
X = (X1, X2, Xk) are explanatory (independent)
variables and linear in the parameters
B0, B1 = Parameters
VI. RESULT AND DISCUSSION
The following section discusses the characteristics
of child labour and determinants of child labour.
Figure 1: child labour distributions by gender Source: Sample survey, 2013
89% of the total child labour is male indicating male are more vulnerable to labour.
89%
11%
Boys Girls
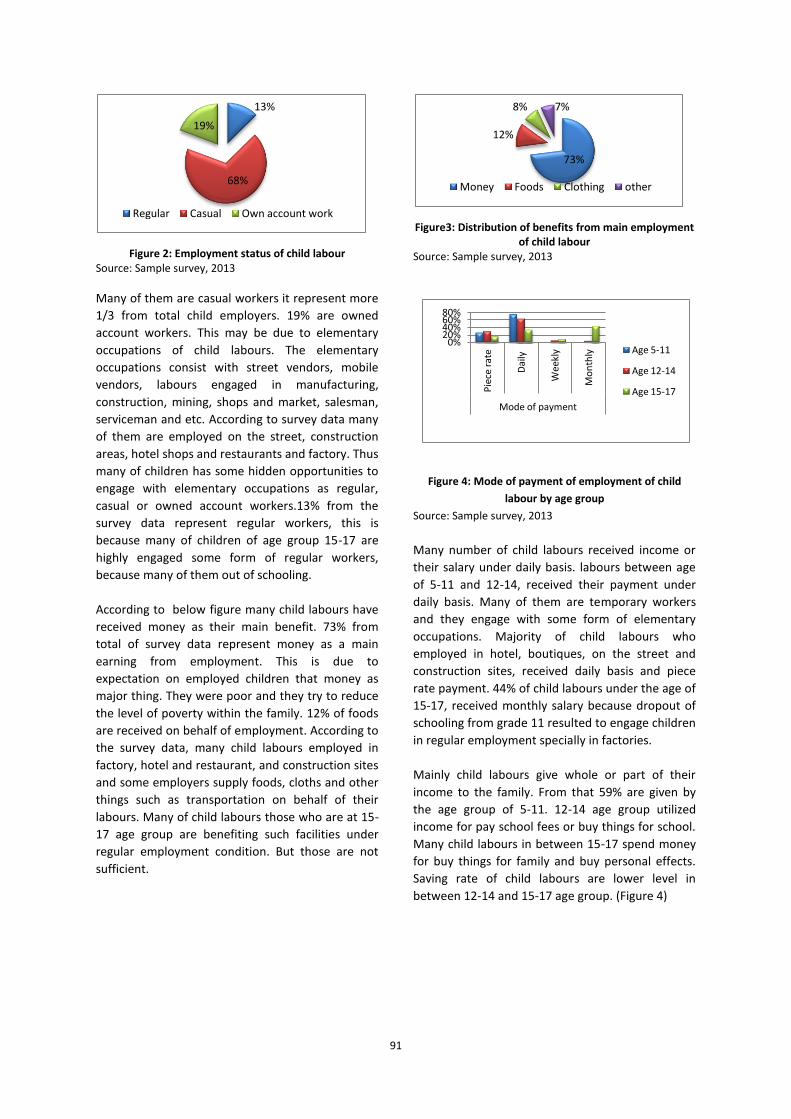
91
Figure 2: Employment status of child labour Source: Sample survey, 2013
Many of them are casual workers it represent more
1/3 from total child employers. 19% are owned
account workers. This may be due to elementary
occupations of child labours. The elementary
occupations consist with street vendors, mobile
vendors, labours engaged in manufacturing,
construction, mining, shops and market, salesman,
serviceman and etc. According to survey data many
of them are employed on the street, construction
areas, hotel shops and restaurants and factory. Thus
many of children has some hidden opportunities to
engage with elementary occupations as regular,
casual or owned account workers.13% from the
survey data represent regular workers, this is
because many of children of age group 15-17 are
highly engaged some form of regular workers,
because many of them out of schooling.
According to below figure many child labours have
received money as their main benefit. 73% from
total of survey data represent money as a main
earning from employment. This is due to
expectation on employed children that money as
major thing. They were poor and they try to reduce
the level of poverty within the family. 12% of foods
are received on behalf of employment. According to
the survey data, many child labours employed in
factory, hotel and restaurant, and construction sites
and some employers supply foods, cloths and other
things such as transportation on behalf of their
labours. Many of child labours those who are at 15-
17 age group are benefiting such facilities under
regular employment condition. But those are not
sufficient.
Figure3: Distribution of benefits from main employment of child labour
Source: Sample survey, 2013
Figure 4: Mode of payment of employment of child
labour by age group
Source: Sample survey, 2013
Many number of child labours received income or
their salary under daily basis. labours between age
of 5-11 and 12-14, received their payment under
daily basis. Many of them are temporary workers
and they engage with some form of elementary
occupations. Majority of child labours who
employed in hotel, boutiques, on the street and
construction sites, received daily basis and piece
rate payment. 44% of child labours under the age of
15-17, received monthly salary because dropout of
schooling from grade 11 resulted to engage children
in regular employment specially in factories.
Mainly child labours give whole or part of their
income to the family. From that 59% are given by
the age group of 5-11. 12-14 age group utilized
income for pay school fees or buy things for school.
Many child labours in between 15-17 spend money
for buy things for family and buy personal effects.
Saving rate of child labours are lower level in
between 12-14 and 15-17 age group. (Figure 4)
13%
68%
19%
Regular Casual Own account work
73%
12%
8% 7%
Money Foods Clothing other
0% 20% 40% 60% 80%
Pie
ce r
ate
Dai
ly
Wee
kly
Mo
nth
ly
Mode of payment
Age 5-11
Age 12-14
Age 15-17

92
Figure 5: Distribution of utilization of child labour
income by age group
Source: Sample survey, 2013
Figure 6: Distribution of working time by age
Source: Sample survey, 2013
The age level between 5 -11 and 12 -14 mostly
carries out their employment after the school time
(63.8%). This also due to compulsory education and
they are not permitted to do employment at whole
day or school time. Considering age group 15-17,
their main occupation characteristic on time is
differ from other two groups of age level. They
mostly engaged in period of 6am - 6pm and the
whole day employment engagement also at higher
level. Many of them are not attending school and
after the GCE (O/L) examination they try to do a job
on their different requirements. On the other hand
after the age of 14 years, consider that they are not
children, so such type of attitudes are negatively
affected to children and it may be result to change
the employment routing of children.The hour group
called ‘other’ indicates child labours those who has
not predetermined working schedule and they use
any time that they free for employment. It is also
represent higher level in age group 5-11 and 12-14
as a percentage of 16.2% and 17.4% respectively.
Income level negatively correlated with children’s
employment. Income reduction caused to increase
child employment. The higher amount of child
labours in between the income level of 0-10000 and
11000- 15000 its 93% and 69% from total. Income
level in between 21000 or more has lower
proportion to child labour. Due to lower education
level of household head, the percentage of child
labour has raised. Education level in between 1- 10
represented higher possibility to be a child as a
labour, it is about 88%. Education level of
household head represents a relationship with
income level of family. Lower level of income is
resulted lower level of education of head of
household.(Figure 7)
Figure 7: Comparison of child labour and non-child
labour on income level of family and education level of
household head
Source: Sample survey, 2013
Figure 8: Child labour and non-child labour on family infrastructure and attitudes of family on education
Source: Sample survey, 2013
Infrastructure facilities of household has inversely
related to child employment. Lower level of
facilities are available in household result to
increase the child employment. It has shown that
88% of child labours are not satisfied with their
family infrastructure. Further attitudes of family on
education also have negative relationship on child
labour. 66% of child labours’ families have bad
attitudes on education. Thus attitudes on education
0%
20%
40%
60%
80%
Giv
e al
l / …
Sch
oo
l fee
s / …
Bu
y th
ings
…
Bu
y p
erso
nal
…
Save
Oth
er
Utilization of income
Age 5-11
Age 12-14
Age 15-17
0%
20%
40%
60%
80%
6 am - 6 pm
After 6 pm
Whole day
After school
Other
Age 5-11
Age 12-14
Age 15-17
0%
20%
40%
60%
80%
100%
0 -
10
00
0
11
00
0 -
15
00
0
16
00
0 -
20
00
0
21
00
0 -
Mo
re
Bel
ow
gra
de
5
Gra
de
6 -
10
11
- P
asse
d O
/L
Pas
sed
A/L
an
d
Ab
ove
Income level of family Education of household head
Non child labour Child labour
Most agree
Agree Disagree Good Bad
Satisfaction on family infrastructure
Attitudes of family on education
Non child labour Child labour
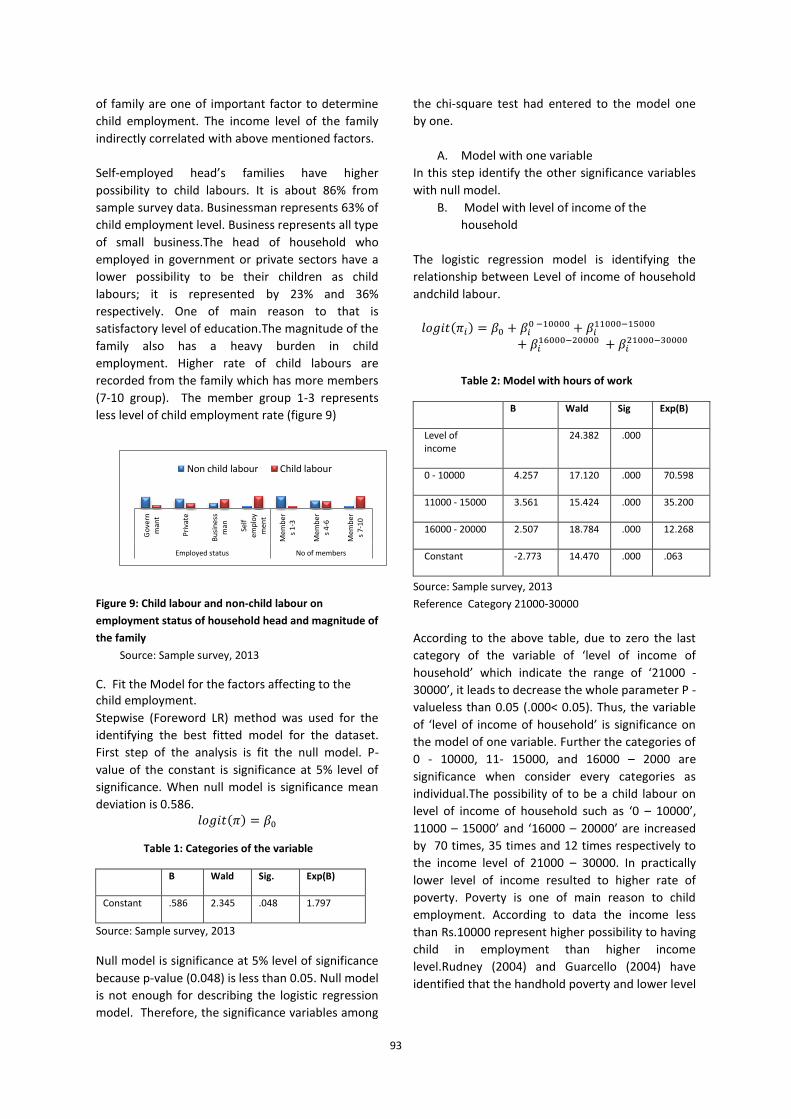
93
of family are one of important factor to determine
child employment. The income level of the family
indirectly correlated with above mentioned factors.
Self-employed head’s families have higher
possibility to child labours. It is about 86% from
sample survey data. Businessman represents 63% of
child employment level. Business represents all type
of small business.The head of household who
employed in government or private sectors have a
lower possibility to be their children as child
labours; it is represented by 23% and 36%
respectively. One of main reason to that is
satisfactory level of education.The magnitude of the
family also has a heavy burden in child
employment. Higher rate of child labours are
recorded from the family which has more members
(7-10 group). The member group 1-3 represents
less level of child employment rate (figure 9)
Figure 9: Child labour and non-child labour on
employment status of household head and magnitude of
the family
Source: Sample survey, 2013
C. Fit the Model for the factors affecting to the child employment.
Stepwise (Foreword LR) method was used for the
identifying the best fitted model for the dataset.
First step of the analysis is fit the null model. P-
value of the constant is significance at 5% level of
significance. When null model is significance mean
deviation is 0.586.
Table 1: Categories of the variable
B Wald Sig. Exp(B)
Constant .586 2.345 .048 1.797
Source: Sample survey, 2013
Null model is significance at 5% level of significance
because p-value (0.048) is less than 0.05. Null model
is not enough for describing the logistic regression
model. Therefore, the significance variables among
the chi-square test had entered to the model one
by one.
A. Model with one variable
In this step identify the other significance variables
with null model.
B. Model with level of income of the
household
The logistic regression model is identifying the
relationship between Level of income of household
andchild labour.
Table 2: Model with hours of work
B Wald Sig Exp(B)
Level of income
24.382 .000
0 - 10000 4.257 17.120 .000 70.598
11000 - 15000 3.561 15.424 .000 35.200
16000 - 20000 2.507 18.784 .000 12.268
Constant -2.773 14.470 .000 .063
Source: Sample survey, 2013
Reference Category 21000-30000
According to the above table, due to zero the last
category of the variable of ‘level of income of
household’ which indicate the range of ‘21000 -
30000’, it leads to decrease the whole parameter P -
valueless than 0.05 (.000< 0.05). Thus, the variable
of ‘level of income of household’ is significance on
the model of one variable. Further the categories of
0 - 10000, 11- 15000, and 16000 – 2000 are
significance when consider every categories as
individual.The possibility of to be a child labour on
level of income of household such as ‘0 – 10000’,
11000 – 15000’ and ‘16000 – 20000’ are increased
by 70 times, 35 times and 12 times respectively to
the income level of 21000 – 30000. In practically
lower level of income resulted to higher rate of
poverty. Poverty is one of main reason to child
employment. According to data the income less
than Rs.10000 represent higher possibility to having
child in employment than higher income
level.Rudney (2004) and Guarcello (2004) have
identified that the handhold poverty and lower level
Go
vern
man
t
Pri
vate
Bu
sin
ess
man
Self
em
plo
ym
ent
Mem
ber
s 1
-3
Mem
ber
s 4
-6
Mem
ber
s 7
-10
Employed status No of members
Non child labour Child labour
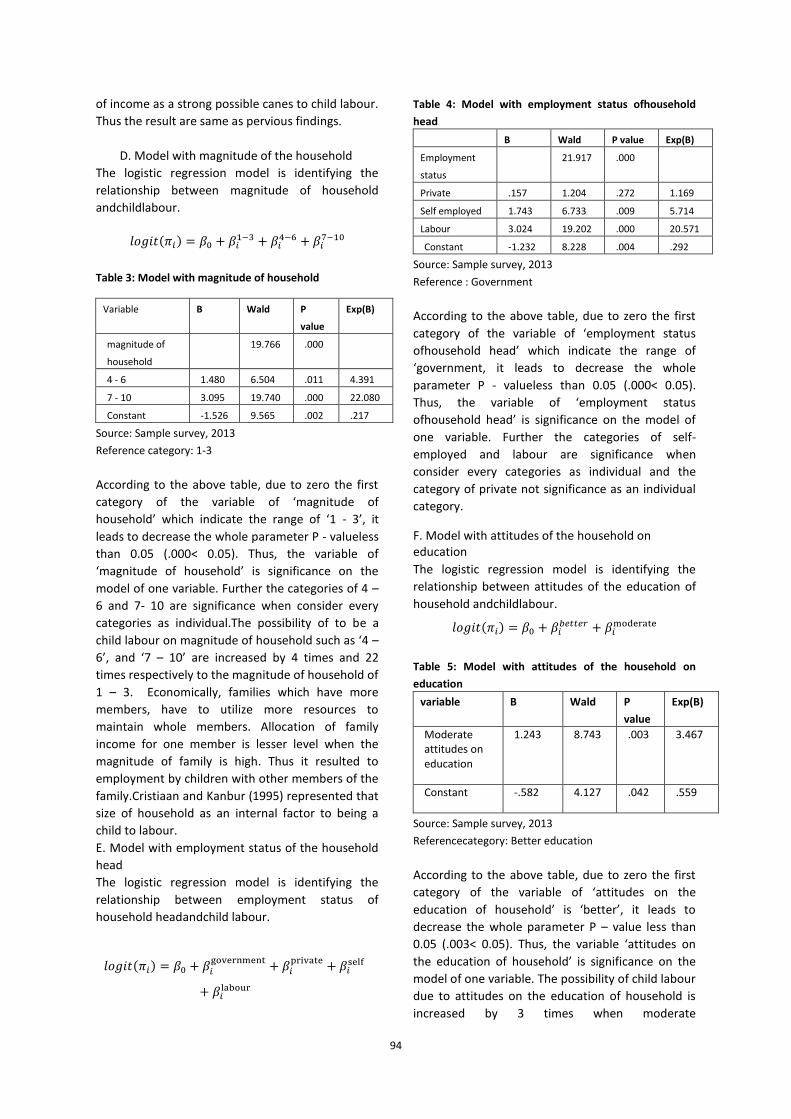
94
of income as a strong possible canes to child labour.
Thus the result are same as pervious findings.
D. Model with magnitude of the household
The logistic regression model is identifying the
relationship between magnitude of household
andchildlabour.
Table 3: Model with magnitude of household
Variable B Wald P
value
Exp(B)
magnitude of
household
19.766 .000
4 - 6 1.480 6.504 .011 4.391
7 - 10 3.095 19.740 .000 22.080
Constant -1.526 9.565 .002 .217
Source: Sample survey, 2013
Reference category: 1-3
According to the above table, due to zero the first
category of the variable of ‘magnitude of
household’ which indicate the range of ‘1 - 3’, it
leads to decrease the whole parameter P - valueless
than 0.05 (.000< 0.05). Thus, the variable of
‘magnitude of household’ is significance on the
model of one variable. Further the categories of 4 –
6 and 7- 10 are significance when consider every
categories as individual.The possibility of to be a
child labour on magnitude of household such as ‘4 –
6’, and ‘7 – 10’ are increased by 4 times and 22
times respectively to the magnitude of household of
1 – 3. Economically, families which have more
members, have to utilize more resources to
maintain whole members. Allocation of family
income for one member is lesser level when the
magnitude of family is high. Thus it resulted to
employment by children with other members of the
family.Cristiaan and Kanbur (1995) represented that
size of household as an internal factor to being a
child to labour.
E. Model with employment status of the household
head
The logistic regression model is identifying the
relationship between employment status of
household headandchild labour.
Table 4: Model with employment status ofhousehold
head
B Wald P value Exp(B)
Employment
status
21.917 .000
Private .157 1.204 .272 1.169
Self employed 1.743 6.733 .009 5.714
Labour 3.024 19.202 .000 20.571
Constant -1.232 8.228 .004 .292
Source: Sample survey, 2013
Reference : Government
According to the above table, due to zero the first
category of the variable of ‘employment status
ofhousehold head’ which indicate the range of
‘government, it leads to decrease the whole
parameter P - valueless than 0.05 (.000< 0.05).
Thus, the variable of ‘employment status
ofhousehold head’ is significance on the model of
one variable. Further the categories of self-
employed and labour are significance when
consider every categories as individual and the
category of private not significance as an individual
category.
F. Model with attitudes of the household on education
The logistic regression model is identifying the
relationship between attitudes of the education of
household andchildlabour.
Table 5: Model with attitudes of the household on
education
variable B Wald P
value
Exp(B)
Moderate attitudes on education
1.243 8.743 .003 3.467
Constant -.582 4.127 .042 .559
Source: Sample survey, 2013
Referencecategory: Better education
According to the above table, due to zero the first
category of the variable of ‘attitudes on the
education of household’ is ‘better’, it leads to
decrease the whole parameter P – value less than
0.05 (.003< 0.05). Thus, the variable ‘attitudes on
the education of household’ is significance on the
model of one variable. The possibility of child labour
due to attitudes on the education of household is
increased by 3 times when moderate

95
attitudes.According to the Lawuo (1978) identified
that attitudes on the education of household is core
factor to determine child employment. A negative
attitude on education has highly affected to be child
labour. Thus the finding of research is same as past
findings.
G. Model with Facilities available in the household
The logistic regression model is identifying the
relationship between facilities available in the
householdandchild labour.
Table 6: Model with facilities available in the household
B Wald P value Exp(B)
facilities
available in
the h/h
18.956 .000
Moderate 1.239 5.793 .016 3.453
Disagree 2.849 17.098 .000 17.267
Constant -.903 8.700 .003 .405
Source: Sample survey, 2013
Reference :Agree
According to the above table, due to zero the first
category of the variable of ‘facilities available in the
household’ is ‘better’, it leads to decrease the
whole parameter P – value less than 0.05 (.000<
0.05). Thus, the variable ‘facilities available in the
household’ is significance on the model of one
variable. The possibility of child labour due to
attitudes on the education of household is
increased by 3 times under moderate attitudes and
17 times due to disagree when the reference
category is zero.
I. Model with Education level of the household head
The logistic regression model is identifying the
relationship between Education level of the
household headandchildlabour.
Table 7: Model with education level of the household head
Source: Sample survey, 2013
Refernce : Passed A/L and Above
According to the above table, due to zero the last
category of the variable of ‘education level of the
household head’ is ‘Passed A/L and above’, it leads
to decrease the whole parameter P – value less
than 0.05 (.000< 0.05). Thus, the variable ‘Passed
A/L and above is significance on the model of one
variable. Further the categories of below 5, 6- 10
are significance and 11 – pass O/L is not significance
when consider every categories as individual.The
possibility of child labour due to education level of
the household head is increased by 58 times under
the education level of ‘below 5’. As well as under
the 6 -10 education level of the head of household,
it will be resulted to increase the child employment
by 23 times.
Model with more variables
In this step used whole variables which are
significance with null model.
J. Model with two variables
In this step study on models which more than one
variable that are significance with null model. First,
select the best model with two variables.‘Education
level of household head’s (a)’ and ‘income level of
household (b)’ are identified as the best model.
Table 8: Best model with two variables
variable B Wald Sig. Exp(
B)
Education level
of the H/H
18.215 .000
Below 5 3.713 10.481 .001 40.977
6 – 10 2.862 15.460 .000 17.496
11 – pass O/L 1.692 3.541 .060 5.428
Level of income 15.218 .002
B Wald P value Exp(B)
education
level of the
H/H
36.872 .000
Below 5 4.063 19.442 .000 58.125
6 – 10 3.168 16.498 .000 23.759
11 – pass
O/L
1.200 2.769 .096 3.321
Constant -2.048 14.855 .000 .129
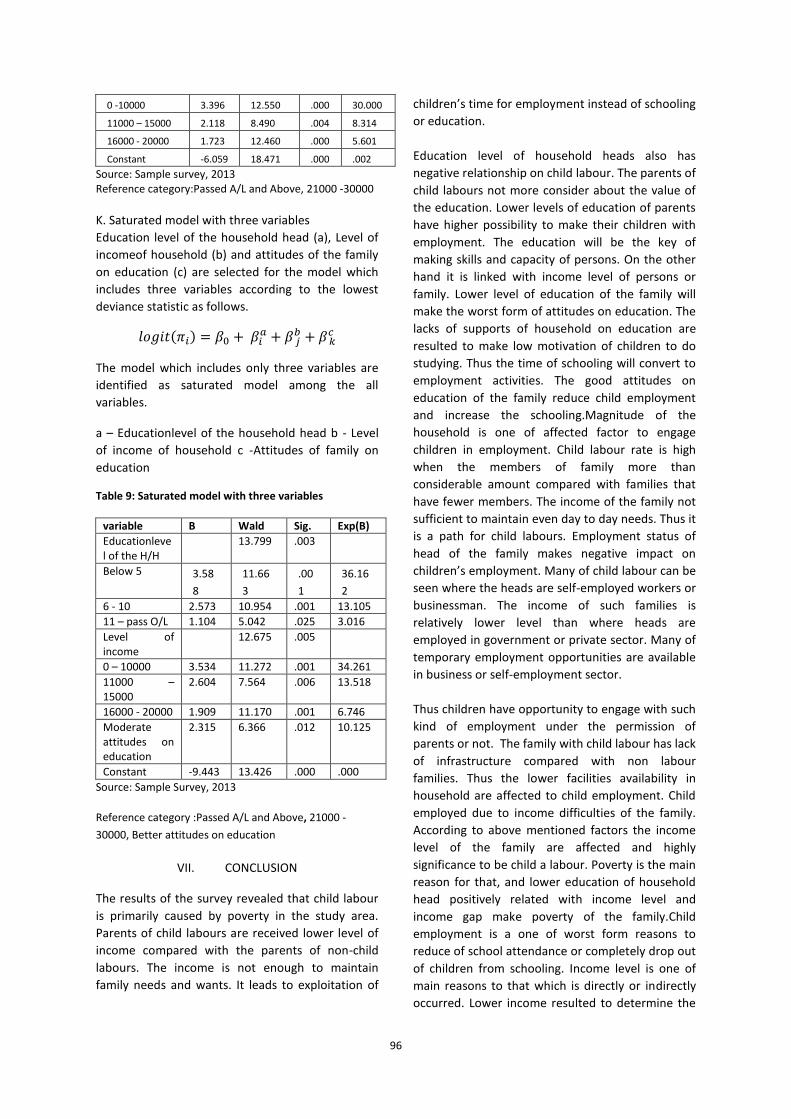
96
0 -10000 3.396 12.550 .000 30.000
11000 – 15000 2.118 8.490 .004 8.314
16000 - 20000 1.723 12.460 .000 5.601
Constant -6.059 18.471 .000 .002
Source: Sample survey, 2013 Reference category:Passed A/L and Above, 21000 -30000
K. Saturated model with three variables
Education level of the household head (a), Level of
incomeof household (b) and attitudes of the family
on education (c) are selected for the model which
includes three variables according to the lowest
deviance statistic as follows.
The model which includes only three variables are
identified as saturated model among the all
variables.
a – Educationlevel of the household head b - Level
of income of household c -Attitudes of family on
education
Table 9: Saturated model with three variables
variable B Wald Sig. Exp(B)
Educationlevel of the H/H
13.799 .003
Below 5 3.58
8
11.66
3
.00
1
36.16
2
6 - 10 2.573 10.954 .001 13.105
11 – pass O/L 1.104 5.042 .025 3.016
Level of income
12.675 .005
0 – 10000 3.534 11.272 .001 34.261
11000 – 15000
2.604 7.564 .006 13.518
16000 - 20000 1.909 11.170 .001 6.746
Moderate attitudes on education
2.315 6.366 .012 10.125
Constant -9.443 13.426 .000 .000
Source: Sample Survey, 2013
Reference category :Passed A/L and Above, 21000 -
30000, Better attitudes on education
VII. CONCLUSION
The results of the survey revealed that child labour
is primarily caused by poverty in the study area.
Parents of child labours are received lower level of
income compared with the parents of non-child
labours. The income is not enough to maintain
family needs and wants. It leads to exploitation of
children’s time for employment instead of schooling
or education.
Education level of household heads also has
negative relationship on child labour. The parents of
child labours not more consider about the value of
the education. Lower levels of education of parents
have higher possibility to make their children with
employment. The education will be the key of
making skills and capacity of persons. On the other
hand it is linked with income level of persons or
family. Lower level of education of the family will
make the worst form of attitudes on education. The
lacks of supports of household on education are
resulted to make low motivation of children to do
studying. Thus the time of schooling will convert to
employment activities. The good attitudes on
education of the family reduce child employment
and increase the schooling.Magnitude of the
household is one of affected factor to engage
children in employment. Child labour rate is high
when the members of family more than
considerable amount compared with families that
have fewer members. The income of the family not
sufficient to maintain even day to day needs. Thus it
is a path for child labours. Employment status of
head of the family makes negative impact on
children’s employment. Many of child labour can be
seen where the heads are self-employed workers or
businessman. The income of such families is
relatively lower level than where heads are
employed in government or private sector. Many of
temporary employment opportunities are available
in business or self-employment sector.
Thus children have opportunity to engage with such
kind of employment under the permission of
parents or not. The family with child labour has lack
of infrastructure compared with non labour
families. Thus the lower facilities availability in
household are affected to child employment. Child
employed due to income difficulties of the family.
According to above mentioned factors the income
level of the family are affected and highly
significance to be child a labour. Poverty is the main
reason for that, and lower education of household
head positively related with income level and
income gap make poverty of the family.Child
employment is a one of worst form reasons to
reduce of school attendance or completely drop out
of children from schooling. Income level is one of
main reasons to that which is directly or indirectly
occurred. Lower income resulted to determine the
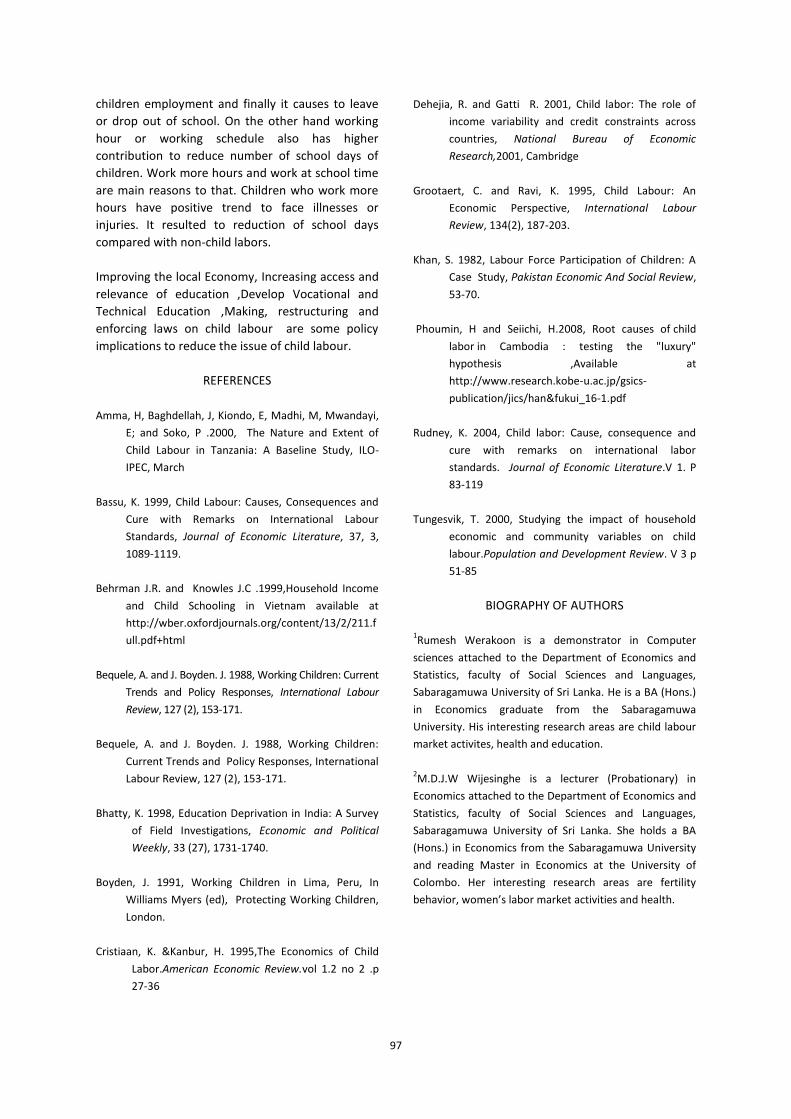
97
children employment and finally it causes to leave
or drop out of school. On the other hand working
hour or working schedule also has higher
contribution to reduce number of school days of
children. Work more hours and work at school time
are main reasons to that. Children who work more
hours have positive trend to face illnesses or
injuries. It resulted to reduction of school days
compared with non-child labors.
Improving the local Economy, Increasing access and
relevance of education ,Develop Vocational and
Technical Education ,Making, restructuring and
enforcing laws on child labour are some policy
implications to reduce the issue of child labour.
REFERENCES
Amma, H, Baghdellah, J, Kiondo, E, Madhi, M, Mwandayi,
E; and Soko, P .2000, The Nature and Extent of
Child Labour in Tanzania: A Baseline Study, ILO-
IPEC, March
Bassu, K. 1999, Child Labour: Causes, Consequences and
Cure with Remarks on International Labour
Standards, Journal of Economic Literature, 37, 3,
1089-1119.
Behrman J.R. and Knowles J.C .1999,Household Income
and Child Schooling in Vietnam available at
http://wber.oxfordjournals.org/content/13/2/211.f
ull.pdf+html
Bequele, A. and J. Boyden. J. 1988, Working Children: Current
Trends and Policy Responses, International Labour
Review, 127 (2), 153-171.
Bequele, A. and J. Boyden. J. 1988, Working Children:
Current Trends and Policy Responses, International
Labour Review, 127 (2), 153-171.
Bhatty, K. 1998, Education Deprivation in India: A Survey
of Field Investigations, Economic and Political
Weekly, 33 (27), 1731-1740.
Boyden, J. 1991, Working Children in Lima, Peru, In
Williams Myers (ed), Protecting Working Children,
London.
Cristiaan, K. &Kanbur, H. 1995,The Economics of Child
Labor.American Economic Review.vol 1.2 no 2 .p
27-36
Dehejia, R. and Gatti R. 2001, Child labor: The role of
income variability and credit constraints across
countries, National Bureau of Economic
Research,2001, Cambridge
Grootaert, C. and Ravi, K. 1995, Child Labour: An
Economic Perspective, International Labour
Review, 134(2), 187-203.
Khan, S. 1982, Labour Force Participation of Children: A
Case Study, Pakistan Economic And Social Review,
53-70.
Phoumin, H and Seiichi, H.2008, Root causes of child
labor in Cambodia : testing the "luxury"
hypothesis ,Available at
http://www.research.kobe-u.ac.jp/gsics-
publication/jics/han&fukui_16-1.pdf
Rudney, K. 2004, Child labor: Cause, consequence and
cure with remarks on international labor
standards. Journal of Economic Literature.V 1. P
83-119
Tungesvik, T. 2000, Studying the impact of household
economic and community variables on child
labour.Population and Development Review. V 3 p
51-85
BIOGRAPHY OF AUTHORS
1Rumesh Werakoon is a demonstrator in Computer
sciences attached to the Department of Economics and
Statistics, faculty of Social Sciences and Languages,
Sabaragamuwa University of Sri Lanka. He is a BA (Hons.)
in Economics graduate from the Sabaragamuwa
University. His interesting research areas are child labour
market activites, health and education.
2M.D.J.W Wijesinghe is a lecturer (Probationary) in
Economics attached to the Department of Economics and
Statistics, faculty of Social Sciences and Languages,
Sabaragamuwa University of Sri Lanka. She holds a BA
(Hons.) in Economics from the Sabaragamuwa University
and reading Master in Economics at the University of
Colombo. Her interesting research areas are fertility
behavior, women’s labor market activities and health.

98
Factors Affecting the Patients’ Decision in Selecting a Hospital in Medical Emergency
A Jayakody
General Sir John Kotelawala Defence University, Sri Lanka
Abstract - Selecting a hospital in a medical
emergency is a critical decision for any patient or
patient’s guardian. Though there are many
researches done on this subject in developed
countries, there have been no studies done in Sri
Lanka. As Sri Lanka did not have a structured
emergency medical care setup covering the entire
island, it was quite interesting to explore the factors
which influenced a patient or patient’s guardian in
selecting a hospital for a medical emergency.
Generally, private hospitals in Colombo have better
facilities for medical emergency patients than the
state sector hospitals. In spite of facilities provided,
many patients sought the services of state sector
hospitals in medical emergencies. This study was
done to establish the reasons for above mentioned
situations. The patients admitted for medical
emergencies to the National Hospital of Sri Lanka
(NHSL) and Lanka Hospitals (LH) were considered
for this study. Fifteen percent of the medical
emergency patients of NHSL and LH in the first week
of April 2014 were randomly selected for this study.
Based on the above percentages, data was
collected pertaining to 166 patients out of 1,036
emergency patients of NHSL and 40 patients out of
266 emergency patients of LH. The collected data
was analyzed using SPSS version 16. Nominal and
ordinal scale data were reported as absolute and
relative frequency. The study revealed that a
patient or patient’s guardian considered several
factors when selecting a hospital in medical
emergencies. The study explains that the most
important factor in choosing a hospital for medical
emergencies was the reputation of the hospital in
handling the medical emergencies. Further, non-
availability of health insurance coverage and un-
affordability for charges, were the other major
reasons for selecting NHSL in medical emergencies.
The study revealed that the patients preferred NHSL
than private hospitals in Colombo when there was a
medical emergency, due to the above mentioned
factors. Further, the medical emergency patients of
NHSL were satisfied with their treatment than the
patients of LH. If a private hospital in Colombo
expects attracting more medical emergency
patients, it should concentrate on the factors which
improve the reputation of its’ Emergency
Department (ED). This can be achieved through
research based interventions on the areas of
patients’ concerns in relation to the Emergency
Department of the hospital.
Keywords: patients’ decision, medical emergency,
reputation of Emergency Department
I. INTRODUCTION
Selecting a hospital in a medical emergency is a
critical decision as it has a direct bearing on the
clinical outcome of the patient. One state owned
hospital, namely National Hospital of Sri Lanka
(NHSL) and one private hospital, namely Lanka
Hospitals (LH), were selected for this study. These
two hospitals can be considered as the hospitals
that represented the salient features of the state
healthcare sector and the private healthcare sector
of Sri Lanka. More than 25% of inpatient admissions
of NHSL and LH were considered as medical
emergencies, and these patients were admitted
through the Emergency Departments of these two
hospitals. Generally, hospitals should have a
dedicated clinical setup to accommodate medical
emergency patients, as their requirements are very
different to any other patient group. These special
requirements include less waiting time, efficient ED
processes, availability of on-call medical specialists,
courtesy of physician and the standard nursing
services and ED environment.
When a patient selects a hospital for an elective
medical treatment, the patient or patient’s
guardian has the luxury of researching the
standards of medical care of hospitals and make a
rational selection. In a medical emergency, a
patient or patient’s guardian has a shorter duration
in making a decision for their choice of a hospital. A
dedicated Emergency Department setup in a
selected number of hospitals covering all
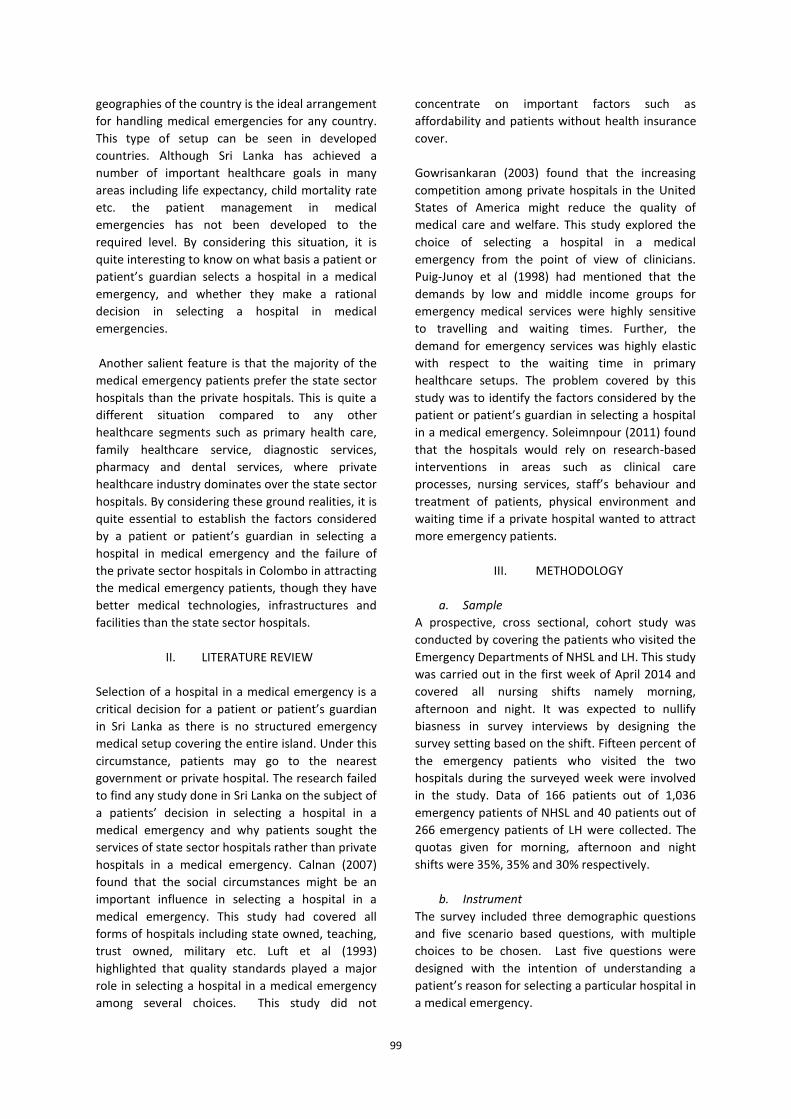
99
geographies of the country is the ideal arrangement
for handling medical emergencies for any country.
This type of setup can be seen in developed
countries. Although Sri Lanka has achieved a
number of important healthcare goals in many
areas including life expectancy, child mortality rate
etc. the patient management in medical
emergencies has not been developed to the
required level. By considering this situation, it is
quite interesting to know on what basis a patient or
patient’s guardian selects a hospital in a medical
emergency, and whether they make a rational
decision in selecting a hospital in medical
emergencies.
Another salient feature is that the majority of the
medical emergency patients prefer the state sector
hospitals than the private hospitals. This is quite a
different situation compared to any other
healthcare segments such as primary health care,
family healthcare service, diagnostic services,
pharmacy and dental services, where private
healthcare industry dominates over the state sector
hospitals. By considering these ground realities, it is
quite essential to establish the factors considered
by a patient or patient’s guardian in selecting a
hospital in medical emergency and the failure of
the private sector hospitals in Colombo in attracting
the medical emergency patients, though they have
better medical technologies, infrastructures and
facilities than the state sector hospitals.
II. LITERATURE REVIEW
Selection of a hospital in a medical emergency is a
critical decision for a patient or patient’s guardian
in Sri Lanka as there is no structured emergency
medical setup covering the entire island. Under this
circumstance, patients may go to the nearest
government or private hospital. The research failed
to find any study done in Sri Lanka on the subject of
a patients’ decision in selecting a hospital in a
medical emergency and why patients sought the
services of state sector hospitals rather than private
hospitals in a medical emergency. Calnan (2007)
found that the social circumstances might be an
important influence in selecting a hospital in a
medical emergency. This study had covered all
forms of hospitals including state owned, teaching,
trust owned, military etc. Luft et al (1993)
highlighted that quality standards played a major
role in selecting a hospital in a medical emergency
among several choices. This study did not
concentrate on important factors such as
affordability and patients without health insurance
cover.
Gowrisankaran (2003) found that the increasing
competition among private hospitals in the United
States of America might reduce the quality of
medical care and welfare. This study explored the
choice of selecting a hospital in a medical
emergency from the point of view of clinicians.
Puig-Junoy et al (1998) had mentioned that the
demands by low and middle income groups for
emergency medical services were highly sensitive
to travelling and waiting times. Further, the
demand for emergency services was highly elastic
with respect to the waiting time in primary
healthcare setups. The problem covered by this
study was to identify the factors considered by the
patient or patient’s guardian in selecting a hospital
in a medical emergency. Soleimnpour (2011) found
that the hospitals would rely on research-based
interventions in areas such as clinical care
processes, nursing services, staff’s behaviour and
treatment of patients, physical environment and
waiting time if a private hospital wanted to attract
more emergency patients.
III. METHODOLOGY
a. Sample
A prospective, cross sectional, cohort study was
conducted by covering the patients who visited the
Emergency Departments of NHSL and LH. This study
was carried out in the first week of April 2014 and
covered all nursing shifts namely morning,
afternoon and night. It was expected to nullify
biasness in survey interviews by designing the
survey setting based on the shift. Fifteen percent of
the emergency patients who visited the two
hospitals during the surveyed week were involved
in the study. Data of 166 patients out of 1,036
emergency patients of NHSL and 40 patients out of
266 emergency patients of LH were collected. The
quotas given for morning, afternoon and night
shifts were 35%, 35% and 30% respectively.
b. Instrument
The survey included three demographic questions
and five scenario based questions, with multiple
choices to be chosen. Last five questions were
designed with the intention of understanding a
patient’s reason for selecting a particular hospital in
a medical emergency.
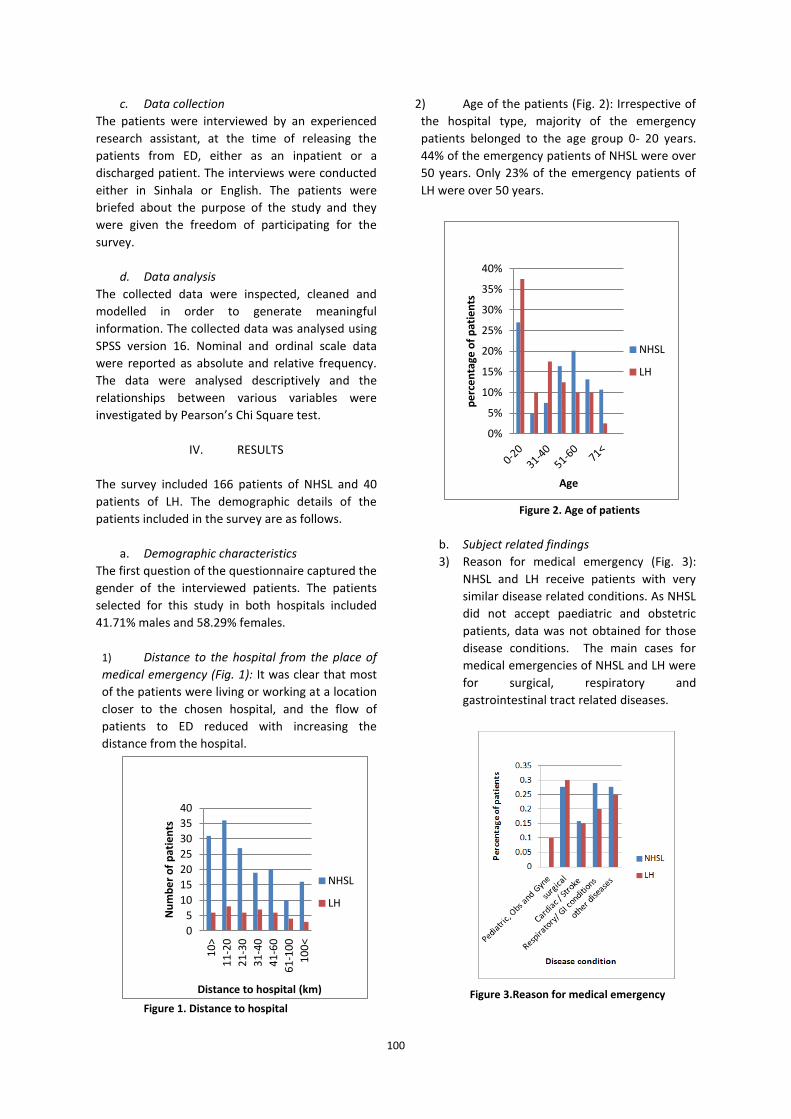
100
c. Data collection
The patients were interviewed by an experienced
research assistant, at the time of releasing the
patients from ED, either as an inpatient or a
discharged patient. The interviews were conducted
either in Sinhala or English. The patients were
briefed about the purpose of the study and they
were given the freedom of participating for the
survey.
d. Data analysis
The collected data were inspected, cleaned and
modelled in order to generate meaningful
information. The collected data was analysed using
SPSS version 16. Nominal and ordinal scale data
were reported as absolute and relative frequency.
The data were analysed descriptively and the
relationships between various variables were
investigated by Pearson’s Chi Square test.
IV. RESULTS
The survey included 166 patients of NHSL and 40
patients of LH. The demographic details of the
patients included in the survey are as follows.
a. Demographic characteristics
The first question of the questionnaire captured the
gender of the interviewed patients. The patients
selected for this study in both hospitals included
41.71% males and 58.29% females.
1) Distance to the hospital from the place of
medical emergency (Fig. 1): It was clear that most
of the patients were living or working at a location
closer to the chosen hospital, and the flow of
patients to ED reduced with increasing the
distance from the hospital.
Figure 1. Distance to hospital
2) Age of the patients (Fig. 2): Irrespective of
the hospital type, majority of the emergency
patients belonged to the age group 0- 20 years.
44% of the emergency patients of NHSL were over
50 years. Only 23% of the emergency patients of
LH were over 50 years.
Figure 2. Age of patients
b. Subject related findings
3) Reason for medical emergency (Fig. 3):
NHSL and LH receive patients with very
similar disease related conditions. As NHSL
did not accept paediatric and obstetric
patients, data was not obtained for those
disease conditions. The main cases for
medical emergencies of NHSL and LH were
for surgical, respiratory and
gastrointestinal tract related diseases.
Figure 3.Reason for medical emergency
0
5
10
15
20
25
30
35
40
10
>
11
-20
21
-30
31
-40
41
-60
61
-10
0
10
0<
Nu
mb
er
of
pat
ien
ts
Distance to hospital (km)
NHSL
LH
0%
5%
10%
15%
20%
25%
30%
35%
40%
pe
rce
nta
ge o
f p
atie
nts
Age
NHSL
LH
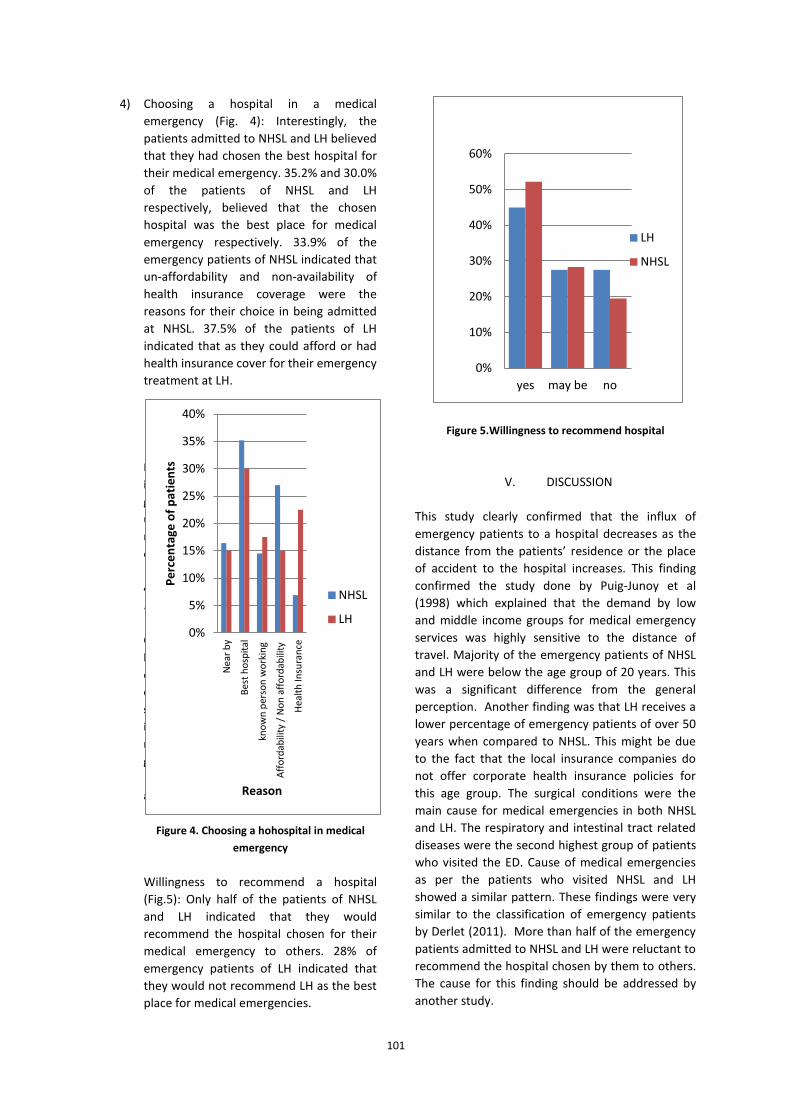
101
4) Choosing a hospital in a medical
emergency (Fig. 4): Interestingly, the
patients admitted to NHSL and LH believed
that they had chosen the best hospital for
their medical emergency. 35.2% and 30.0%
of the patients of NHSL and LH
respectively, believed that the chosen
hospital was the best place for medical
emergency respectively. 33.9% of the
emergency patients of NHSL indicated that
un-affordability and non-availability of
health insurance coverage were the
reasons for their choice in being admitted
at NHSL. 37.5% of the patients of LH
indicated that as they could afford or had
health insurance cover for their emergency
treatment at LH.
F
i
g
u
r
e
4
.
C
h
o
o
s
i
n
g
a
Figure 4. Choosing a hohospital in medical
emergency
Willingness to recommend a hospital
(Fig.5): Only half of the patients of NHSL
and LH indicated that they would
recommend the hospital chosen for their
medical emergency to others. 28% of
emergency patients of LH indicated that
they would not recommend LH as the best
place for medical emergencies.
Figure 5.Willingness to recommend hospital
V. DISCUSSION
This study clearly confirmed that the influx of
emergency patients to a hospital decreases as the
distance from the patients’ residence or the place
of accident to the hospital increases. This finding
confirmed the study done by Puig-Junoy et al
(1998) which explained that the demand by low
and middle income groups for medical emergency
services was highly sensitive to the distance of
travel. Majority of the emergency patients of NHSL
and LH were below the age group of 20 years. This
was a significant difference from the general
perception. Another finding was that LH receives a
lower percentage of emergency patients of over 50
years when compared to NHSL. This might be due
to the fact that the local insurance companies do
not offer corporate health insurance policies for
this age group. The surgical conditions were the
main cause for medical emergencies in both NHSL
and LH. The respiratory and intestinal tract related
diseases were the second highest group of patients
who visited the ED. Cause of medical emergencies
as per the patients who visited NHSL and LH
showed a similar pattern. These findings were very
similar to the classification of emergency patients
by Derlet (2011). More than half of the emergency
patients admitted to NHSL and LH were reluctant to
recommend the hospital chosen by them to others.
The cause for this finding should be addressed by
another study.
0%
5%
10%
15%
20%
25%
30%
35%
40%
Nea
r b
y
Bes
t h
osp
ital
kno
wn
per
son
wo
rkin
g
Aff
ord
abili
ty /
No
n a
ffo
rdab
ility
Hea
lth
Insu
ran
ce
Pe
rce
nta
ge o
f p
atie
nts
Reason
NHSL
LH
0%
10%
20%
30%
40%
50%
60%
yes may be no
LH
NHSL
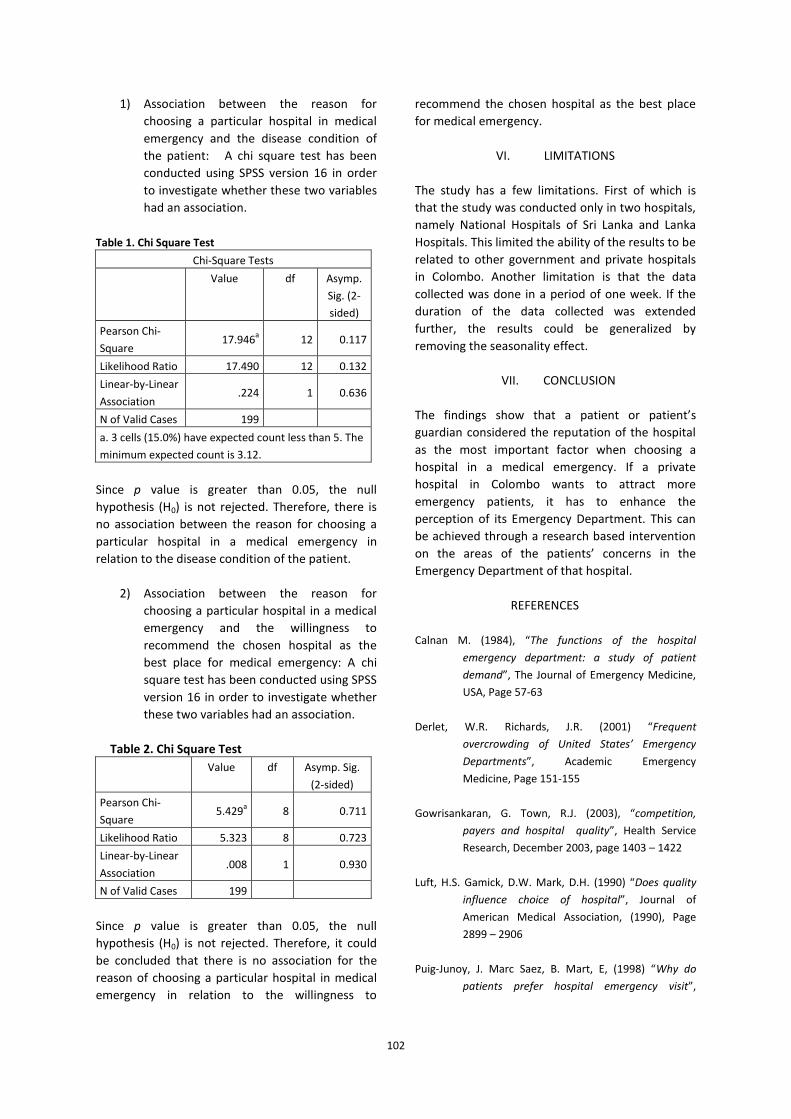
102
1) Association between the reason for
choosing a particular hospital in medical
emergency and the disease condition of
the patient: A chi square test has been
conducted using SPSS version 16 in order
to investigate whether these two variables
had an association.
Table 1. Chi Square Test
Chi-Square Tests
Value df Asymp.
Sig. (2-
sided)
Pearson Chi-
Square 17.946
a 12 0.117
Likelihood Ratio 17.490 12 0.132
Linear-by-Linear
Association .224 1 0.636
N of Valid Cases 199 a. 3 cells (15.0%) have expected count less than 5. The
minimum expected count is 3.12.
Since p value is greater than 0.05, the null
hypothesis (H0) is not rejected. Therefore, there is
no association between the reason for choosing a
particular hospital in a medical emergency in
relation to the disease condition of the patient.
2) Association between the reason for
choosing a particular hospital in a medical
emergency and the willingness to
recommend the chosen hospital as the
best place for medical emergency: A chi
square test has been conducted using SPSS
version 16 in order to investigate whether
these two variables had an association.
Table 2. Chi Square Test
Value df Asymp. Sig.
(2-sided)
Pearson Chi-
Square 5.429
a 8 0.711
Likelihood Ratio 5.323 8 0.723
Linear-by-Linear
Association .008 1 0.930
N of Valid Cases 199
Since p value is greater than 0.05, the null
hypothesis (H0) is not rejected. Therefore, it could
be concluded that there is no association for the
reason of choosing a particular hospital in medical
emergency in relation to the willingness to
recommend the chosen hospital as the best place
for medical emergency.
VI. LIMITATIONS
The study has a few limitations. First of which is
that the study was conducted only in two hospitals,
namely National Hospitals of Sri Lanka and Lanka
Hospitals. This limited the ability of the results to be
related to other government and private hospitals
in Colombo. Another limitation is that the data
collected was done in a period of one week. If the
duration of the data collected was extended
further, the results could be generalized by
removing the seasonality effect.
VII. CONCLUSION
The findings show that a patient or patient’s
guardian considered the reputation of the hospital
as the most important factor when choosing a
hospital in a medical emergency. If a private
hospital in Colombo wants to attract more
emergency patients, it has to enhance the
perception of its Emergency Department. This can
be achieved through a research based intervention
on the areas of the patients’ concerns in the
Emergency Department of that hospital.
REFERENCES
Calnan M. (1984), “The functions of the hospital
emergency department: a study of patient
demand”, The Journal of Emergency Medicine,
USA, Page 57-63
Derlet, W.R. Richards, J.R. (2001) “Frequent
overcrowding of United States’ Emergency
Departments”, Academic Emergency
Medicine, Page 151-155
Gowrisankaran, G. Town, R.J. (2003), “competition,
payers and hospital quality”, Health Service
Research, December 2003, page 1403 – 1422
Luft, H.S. Gamick, D.W. Mark, D.H. (1990) “Does quality
influence choice of hospital”, Journal of
American Medical Association, (1990), Page
2899 – 2906
Puig-Junoy, J. Marc Saez, B. Mart, E, (1998) “Why do
patients prefer hospital emergency visit”,
103
Health Care Management Magazine, Spain,
(1998) 39-52
Soleimnpour, H. Gholipouri, C (2011), Emergency
department patient satisfaction survey in
Imam Reza Hospital, Tabriz, Iran, International
Journal of Emergency Medicine 2011, Page
1186 – 1197
BIOGRAPHY OF AUTHOR
1Author is the General Manager of
Lanka Hospitals Diagnostics Private
Limited. He has been functioning as a
hospital administrator in public and
private sector hospitals locally and
abroad for 8 years. His research interests include the
price elasticity of healthcare services and customer
satisfaction of healthcare services. Currently he is
reading for his PhD at General Sir John Kotelawala
Defence University, Sri Lanka.
Photograph
Author 1

104
Sociological Study on the Female Stereotypes in Sri Lankan TV Commercials
Gihani De Silva1, Wathsala Narampanawa2
1Lecturer in Sociology, Dept of Social Sciences, FSSL, Sabaragamuwa University of Sri Lanka
2No16/1, Delgahaulla, Narampanawa Road, Panvila
Abstract— Common female stereotypes found in
the media have a powerful influence over how
society views women and how women view
themselves as a whole. A Stereotype is a rigid and
inflexible image of the characteristics a group. It
attributes these characteristics to all individuals
belonging to that group with positive and negative
impacts. Thus, the main objective of the present
study is to examine the impact of Sri Lankan TV
commercials on generating and reflecting the
female stereotypes in the society. This content
analysis is conducted by employing 100
advertisements selected under purposive sampling
method, which has telecasted in the ITN channel
from 01st
September - 30th
September 2012. The
study is limited to ITN, as commercials telecast in TV
channels generally similar in nature. Furthermore,
ITN has undergone some notable changes to
compete with other TV channels and gained much
attraction from audiences and came top of the rank
in the television awarding ceremonies within the
recent years.
According to the research findings, 69% of women in
the advertisements were attached to household
activities by impounded them in conservative
portrayals of the private sphere, while presenting
men as an incompetent for those. Female images in
the advertisements tend to undervalue women as
whole, and diminish them to sexual objects and
passive human beings by adding desirable physical
characteristics include being thin, long-legged, slim-
hipped in 71% of commercials. Furthermore,
purpose of commoditisation of the female body, it
has used 35% of Indian and 10% of European
advertisements. Traditional village beauty is
highlighted in the most local commercials. In 52% of
advertisements women were represented as
helpless beings depending on male power and
knowledge. This creates very low expectations,
especially for adolescents and their role models.
Accordingly, most of the advertisements clearly
reflecting the existing gender inequalities and
maintain the status quo. These negative stereotypes
inevitably affect our cultural values and norms
through the socialization process. Thus, it is needed
some unbiased practice and policy framework in
creating TV commercials in Sri Lanka.
Keywords— Stereotype, Commoditisation,
Socialization
I. INTRODUCTION
Female and Female body is used as medium to
persuade an audience to purchase products by the
contemporary television advertisements. According
to Poornima Pokharel, “advertisement is a form of
communication intended to convince viewers,
readers or listeners to purchase or take some action
upon products, ideals or services. Advertising
includes the name of a product, its narrative, how
that product could benefit the targeted consumer
along with its symbolic meanings”
(https://www.academia.edu/1929940/Stereotype_r
epresentation_of_female_body_in_advertisement...
......). The aim of the modern TV commercial is not
only the satisfaction of needs but also their
creation. For Ervin Goffman, advertisements offer
highly stylized versions of social mores, definitions,
attitudes, values and behavioural tendencies whose
meanings must be clear enough to be interpreted in
an instant (Shields, 2002: 37).
Thus, advertisers commonly use stereotypes for
conveying their messages to audiences very easily.
Stereotype is a shortcut with reference to the
world. In other words, stereotypes are effective
vehicles of representation as the media
communicate with their audiences through the
process of representation. By using familiar signs
and symbols, they create a representation of reality
(Marsha and Jones. 1999: 103). There are several
aspects of this process of representation. It always
portrays as natural, focus on groups and inevitably

105
ideological. In general terms stereotypes are
attached with negative meaning. Because, they are
often confused with prejudices, because, like
prejudices, a stereotype is based on a prior
assumption
(http://examples.yourdictionary.com/Stereotypeexa
mples.html). Stereotypes are created by the
continual, extended exposure of consumers to
patterns of imagery. Among the many stereotypes
used by the media, gender stereotyping comes to
the first place. This is a highly critical issue among
feminists who interest in the media studies.
However, using women or female images for the
TV commercials is not a wrong doing, but the way
of doing is problematic as it largely creates negative
impact. This is the reality one should undergo in an
investigation. We need to question whether these
female stereotypes represent the reality or not. It
has already proved by many researchers that, there
is a given agenda on representing women in the
media. This is none other but came through
evolution of societies in the era of capitalism and
the post modern societies in the long sweep of
history.
II. OBJECTIVES
According to the general assumption, women are
treated differently and not fairly in the media. It
reflects gender stereotypes, which have negative
impacts on society as a whole. The audience usually
accepts these stereotypical implications as natural.
Women are represented in stereotypical ways,
according to social ideologies and it has made the
society to consider it as natural. Therefore, these
complexities of representing women in the media
going to be questioned in this research paper. The
main objective of the present study is to examine
the impact of Sri Lankan TV commercials on
generating and reflecting the female stereotypes in
the society. To gain the main objective it is intended
to find out the stereotypical representation of
women in the TV commercials. And to study how
these stereotypical images portrayed conservative
gender inequalities.
III. RESEARCH METHODOLOGY
The content analysis method is used for this study.
Bernard Berelson defined Content Analysis as "a
research technique for the objective, systematic,
and quantitative description of manifest content of
communications" (Berelson 1952: 74). Content
analysis is a research tool focused on the actual
content and internal features of media. It is used to
determine the presence of certain words, concepts,
themes, phrases, characters, or sentences within
texts or sets of texts and to quantify this presence in
an objective manner
(https://www.ischool.utexas.edu/~palmquis/course
s/content.html).
100 advertisements telecasted in the ITN channel
from 01st
September - 30th
September 2012,
selected under purposive sampling method.
Specifically, ITN has selected as the television
channel, as ITN depicted of undergoing some
notable changes within recent years to compete
with other TV channels and came to top rank in the
television awarding ceremonies. In other words, it
has concerned about the attraction of the audience
when it was to select the TV channel. Advertisers
themselves concern about it, prior to putting their
advertisements in those respective channels.
However, most of the advertisements telecasted in
TV channels were similar. This content analysis is
conducted by creating manageable categories and
themes by observing the advertisements. For
instance, Language, facial expressions, symbolic
gestures, behaviours, clothing and adornments,
fashion ideas, tradition vs. modern, local and
foreign, music, etc. were used as categories and
women's role, women as sex objects, commodifing
female body etc. were used as the themes. It
helped to code the data and interpret the identified
patterns by doing so.
IV. DISCUSSION
When it comes to the findings of this study, women
are the central figures of most of the
advertisements. Although 56% of advertisements
were locally produced, most of them were
structurally looks like foreign. Because, it may be
that people as consumers may fond of using foreign
goods and services than local products. Total
foreign advertisements were 44% as shown in the
below figure. Inevitably these foreign
advertisements are affecting to our own cultural
values and norms, even in the case of gender.
However, using foreign commercials is considering
as the easiest and cheapest way of advertising.
Transnational co-operations (TNCs) and
Multinational co-operations (MNCs) are using these
foreign advertisements largely.

106
Figure1: Varieties of Advertisements
Source: Research data, 2012
Generally, young women in 18-35 age category
seems to use for most of the advertisements even it
was needed to portray a matured woman. 71% of
women were portrayed as married and housewives.
They portrayed as spending a happy time involving
in various domestic tasks including using washing
powder for washing clothes, making meals and
cleaning etc. Women are portrayed as good
wife/mother who serves for her nuclear family
mostly with handling domestic work. For instance,
in “Laogi” and “Nestomalt” advertisements
although women have done bulk of domestic work
she is to wait with a tea while husband comes home
after work. The female domestic consumers are
targeted by this type of stereotypical assumptions
as domestic labourers.. Further, Milk powder
advertisements (“Anchor”, “Raththi”), Baby
products (“Baby Cheramy”, “Pears baby” etc.)
comes under this ‘good wife: a happy housewife’
category. But it has never concern about the needs
of the housewife and the multiple roles played by
her.
Women are responsible for all domestic work. If she
fails to perform these entire tasks, often they
portrayed as helpless in sorrowful faces. In the
same occasion husband was representing as
incompetent with those. For an example in “Iodex”
advertisement, while wife is suffering from
backache, husband is not able to even fry an
omelette and help children to get ready to go to
school. “We have become used to seeing images of
women naturally working in the kitchen: more
recent adverts that have placed men in the kitchen
either serve to show how unnatural a setting it is for
them, or that men use domestic labour as a means
of obtaining rewards for women” (Marsha and
Jones, 1999: 103).
Thus, media act as an agent of gender role
socialization. Possible exception of family and peer
groups as the socialization agents, the media
probably the most powerful transmitters of gender
stereotypes. Because there is a relationship
between exposure to gender stereotypes in
advertising and the cultivation among viewers of
more traditional attitudes toward gender roles.
According to the cultivation analysis theory,
repeated exposure to media messages leads a
person to hold opinions or views of society that can
be discordant or distorted the reality (Katherine and
Mueller, 2010). Thus, children easily internalize these
media stereotypes of gender and perpetuate and it
affects the very role played by them in future life.
“Research suggests that while stereotypical
representations may not induce product purchase,
they do encourage viewers to internalize the
socially constructed image of femininity presented
in advertising, thus helping to define femininity and
acceptable female roles” (Lafky, Duffy,Steinmaus,
and Berkowitz 1996: 381). In other words, according
to feminists, the media act as key agents in
reinforcing and perpetuating a patriarchal society
(Marsha and Jones. 1999: 111). Thus, the below
figure is showing the female roles depicted by the
advertisements.
Figure 2: Roles of women in Advertisements Source: Research data, 2012
According to the above figure, women are more
likely to show in the home arena (private sphere),
unlike men, who are shown outdoors (public
sphere). Men generally advertise business products
or investments, whereas women are shown rather
in the commercials with cosmetics and domestic
products. Using Women for those types of products,
they are presented as passive, weak, shy, soft,
delicate, innocence, and with low esteem. In 52% of
advertisements women were represented as
helpless beings depending on male power and
55% 35%
10%
Sri lankan
Indian
Eropian
0% 20% 40% 60% 80%
Employed in Professions
Domestic
Activities
Unidentified
Series1 8% 71% 21%
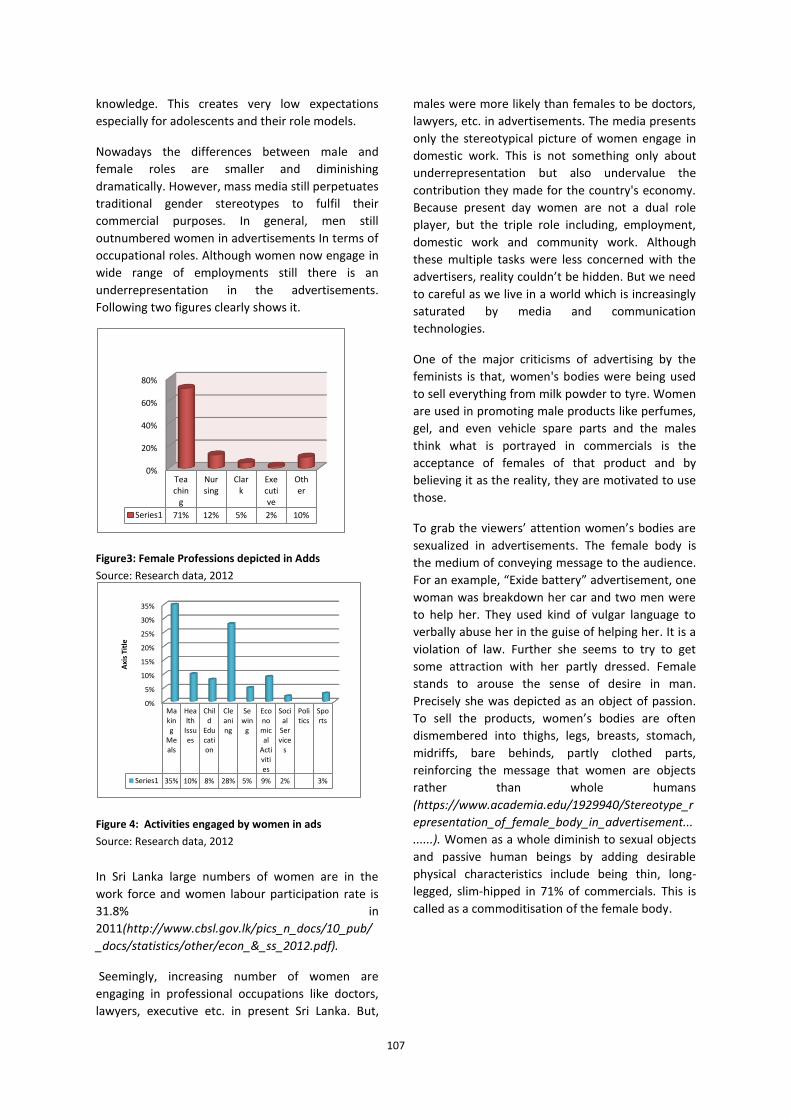
107
knowledge. This creates very low expectations
especially for adolescents and their role models.
Nowadays the differences between male and
female roles are smaller and diminishing
dramatically. However, mass media still perpetuates
traditional gender stereotypes to fulfil their
commercial purposes. In general, men still
outnumbered women in advertisements In terms of
occupational roles. Although women now engage in
wide range of employments still there is an
underrepresentation in the advertisements.
Following two figures clearly shows it.
Figure3: Female Professions depicted in Adds
Source: Research data, 2012
Figure 4: Activities engaged by women in ads
Source: Research data, 2012
In Sri Lanka large numbers of women are in the
work force and women labour participation rate is
31.8% in
2011(http://www.cbsl.gov.lk/pics_n_docs/10_pub/
_docs/statistics/other/econ_&_ss_2012.pdf).
Seemingly, increasing number of women are
engaging in professional occupations like doctors,
lawyers, executive etc. in present Sri Lanka. But,
males were more likely than females to be doctors,
lawyers, etc. in advertisements. The media presents
only the stereotypical picture of women engage in
domestic work. This is not something only about
underrepresentation but also undervalue the
contribution they made for the country's economy.
Because present day women are not a dual role
player, but the triple role including, employment,
domestic work and community work. Although
these multiple tasks were less concerned with the
advertisers, reality couldn’t be hidden. But we need
to careful as we live in a world which is increasingly
saturated by media and communication
technologies.
One of the major criticisms of advertising by the
feminists is that, women's bodies were being used
to sell everything from milk powder to tyre. Women
are used in promoting male products like perfumes,
gel, and even vehicle spare parts and the males
think what is portrayed in commercials is the
acceptance of females of that product and by
believing it as the reality, they are motivated to use
those.
To grab the viewers’ attention women’s bodies are
sexualized in advertisements. The female body is
the medium of conveying message to the audience.
For an example, “Exide battery” advertisement, one
woman was breakdown her car and two men were
to help her. They used kind of vulgar language to
verbally abuse her in the guise of helping her. It is a
violation of law. Further she seems to try to get
some attraction with her partly dressed. Female
stands to arouse the sense of desire in man.
Precisely she was depicted as an object of passion.
To sell the products, women’s bodies are often
dismembered into thighs, legs, breasts, stomach,
midriffs, bare behinds, partly clothed parts,
reinforcing the message that women are objects
rather than whole humans
(https://www.academia.edu/1929940/Stereotype_r
epresentation_of_female_body_in_advertisement...
......). Women as a whole diminish to sexual objects
and passive human beings by adding desirable
physical characteristics include being thin, long-
legged, slim-hipped in 71% of commercials. This is
called as a commoditisation of the female body.
0%
20%
40%
60%
80%
Teachin
g
Nursing
Clark
Executive
Other
Series1 71% 12% 5% 2% 10%
0%
5%
10%
15%
20%
25%
30%
35%
Making
Meals
Health
Issues
Child
Education
Cleaning
Sewin
g
Economical
Activities
Social
Service
s
Politics
Sports
Series1 35% 10% 8% 28% 5% 9% 2% 3%
Axi
s Ti
tle

108
Figure 5: Using women as Sex Objects
Source: Research data, 2012
According to the above figure there were a number
of more advertisements which used the female
body as a sexual object. For instance, “Zesta tea”
advertisements, here mainly used this erotic voice
to grab the attention of audiences. Mainly most of
the time women were attached to male figures.
Further, most of the Sri Lankan advertisers would
like to use the concept of village beauty of women.
But this village beauty is mixed and beautify with
modern western cosmetics. For an example, in
“Sunlight” advertisement, the girl in a chintz frock
who represented as coming from a village
background is not matched with her straitened and
partly coloured hair. This type of hybrid fashion
ideals, itself has an influence to the audience.
Advertisers not only create such styles by mixing up
Sri Lankan patterns but also the foreign. Youngsters
catch fashion ideas and many more things through
the media. The barrage of messages about
thinness, dieting and beauty tells ordinary women
that are always in need of adjustment. Thus, the
advertisement is propagating unattainable beauty
that is creating negative effects in the present
society
(https://www.academia.edu/1929940/Stereotype_r
epresentation_of_female_body_in_advertisement.).
They promote only young, beautiful and sexually
attractive women. Researchers had pointed out
that even those caused to some illness such as
eating disorders among adolescents in western
countries. Thus it proves that this is not something a
trouble encountered by the Sri Lankan audience,
but a common thing. Sut Jhally (2011) listed some
portrayals of women in advertising:
All these were targeted on the commoditisation of
the female body as depicting them as beautiful
object of products Women’s bodies have adorned a
wide array of products aimed at men. For instance,
“Bic Races” advertisement, “Black Night”
advertisement. Women in these advertisements
depicted as passive in decorative sexual role as they
are precisely presented as objects of the male gaze.
In addition, women were sometimes used to sell
products which their contribution should not need
directly. The below figure clearly shows it.
Figure 6: Women portrayed in directly unrelated
products
Data Source: Research data
Finally, uses of gender stereotypical images by the
advertisers caused to marginalize, discriminating
0% 20% 40% 60% 80%
Showing female body
Expression of sexual feelings
Using erotic voice
71%
48%
64%
21%
13%
8%
21%
14%
0% 5% 10% 15% 20% 25%
Vehicle Spare Parts
Building Constuction Substances
Fertilizers
Lotteries
Other
Series1
Touching self
Caressing an object
Lying on the floor
Sitting on a bed or chair
Eyes closed
Not alert
Confused
Vulnerable
Body contorted
Dressed like a child
Holding an object or a man for support
Sexy and sexually available
Seductive
Playful
Careless
109
and commodifying female. This is heavily criticized
by various feminist scholars. Portraying women as
almost dependent on male power is questioned by
them. It is just not reflecting the things taking place
in the society, but also they are creating new types
of gender inequalities for the purpose commercial
values. The time has come to rethink about the
conservative malpractices in the field of television
advertising as it has already encompassed the
peoples’ life by the media.
V. CONCLUSION
However, mass media not only gives people
information and entertainment, but, according to a
Canadian communication theorist Marshall
McLuhan, it also affects people’s lives by shaping
their opinions, attitudes and beliefs (1964)
(Malgorzata, 2011). Thus, advertising act as mirrored
images of the society. Therefore it merely not
reflecting but reinforcing the existing stereotypical
representation of the society. Commercials are the
vast source of gender stereotyping. In other words,
advertisements are “the reflection of the recipient”.
As advertising is gendered, they address our
physical senses of self, our knowledge of the world.
In that sense, it is just going beyond representation,
but moulding self identity.
Women are more often presented in commercials,
because they are seen as responsible for making
everyday purchases. The field of advertisement is
male dominated where female are victims of the
popular culture. Thus, women were depicted as
more dependent and as the weaker sex. This cause
to the underrepresentation and undervalue of the
precious and multiple tasks which is performed by
women in the society. The world is changing.
Conservative views are largely challenged by the
day today practices. This should clearly reflect by
the media. Keeping the old conservative practices is
kind of a threat to the social development, as we
are a developing nation. Therefore, it is better to
rethink of the good practice in creating gender
neutral television advertisement in Sri Lanka.
Although, the study is not going to demonstrate a
generalized picture of present television
commercials as a research limitation, precisely the
study is going to emphasis on implementing a policy
framework of unbiased gender practice for Sri
Lankan TV commercials which pertinent authorities
(government and nongovernment) should pay their
attention. Finally, we have to be very careful when
taking the foreign advertisements as there may be
contradictions with Sri Lankan cultural values and
norms. Thus, we do not need to import the foreign
things, but can come across the practice for gender
equality in media representation by turning back to
our native morals.
ACKNOWLEDGMENT
We would like to express our sincere gratitude to
the academic staff of the Department of Social
Sciences at Sabaragamuwa University of Sri Lanka
for encouraging on this research project. We are
very much grateful to the Centre for Women
Research (CENWOR) for providing valuable
secondary sources to conduct this content analysis
successfully. Finally we would like to give our thanks
to peers who have read this article and given
invaluable comments.
REFERENCES
Berelson, Bernard. (1952), Content Analysis in
Communication Research, New York: Free Press
Bermosk, Kendra. (2012), Representation of Woman in
Advertisements.http://www.bluffton.edu/courses/t
lc/BieseckerMastS/journal/representation_of_wom
an_in_adver. Accessed 20 December 2012.
Frith, Katherine and Barbara Mueller. (2010), Advertising
and Societies: Global Issues. New York: Peter Lang
Publishing.
Ingham, Helen. (1995), "The Portrayal of Women on
Television”.
http://www.iona.edu/academic/artsscience/depart
ment/masscom. Accessed 28 November 2012.
Jhally, Sut. (2011), The Codes of Gender", Media
Education Foundation
Jones, Marsha and Emma Jones. (1999), Mass Media,
London: McMillan Press.
Keilbourne, Jean. (1999), “Why Women And Girls must
fight The Addictive Power of Advertising”, Deadly
Persuasion. Free Press.
Lafky, Sue, Duffy, Margaret, Steinmaus, Mary, and Dan
Berkowitz. (1996), “Looking through gendered
lenses: female stereotypic in advertisements and
gender role exemptions”, J&MC Quarterly Vol. 73,
No. 2.
110
Madurawala, Sunimalee. (2012), “Women play a critical
role in the Sri Lankan economy”, http://www.ips.lk/talkingeconomics. Accessed 05
November 2012.
Pokharel,Poornima.(2013),
https://www.academia.edu/192994
0/Stereotype_representation_of_female_bod
y_in_adverti sement.........Accessed 10
September 2013.
Wolska, Malgorzata. 2011. Gender stereotypes in mass
media, Case study: analysis of the gender
stereotyping phenomenon in tv commercials.
Http://krytyka.org/gend er-stereotypes-in-mass-
media-case-study-analysis-of-the-gender-
stereotyping-phenomenon-in-tv-commercials/,
Accessed 12 December 2013.
Shields, Vickie Rutledge. (2002), Measuring Up: How
Advertising Affects Self-Image, Philadelphia:
University of Pennsylvania Press.
Steven J. Kirsh, (2010), Media and Youth: A
Developmental Perspective, Oxford: Willey
Blackwell.
<http://examples.yourdictionary.com/stereotype-
examples.ht ml>. Accessed 14 July 2013.
<https://www.ischool.utexas.edu/~palmquis/courses/con
tent.html>. Accessed June 16 2013
< http://www.cbsl.gov.lk/pics_n_docs/10_pub/_docs/statistics/other/econ_&_ss_2012.pdf >. Accessed August 01 2014
BIOGRAPHY OF AUTHORS
1Author is a lecturer of Sabaragamuwa
University of Sri Lanka. Her research
interests include media studies and
feminist studies. She has produced
more than 30 publications, including
Peer-Reviewed Journals and International Conference
Presentations & Published Abstracts to her credit. She
has obtained Gold Medal- N.D.S. Silva Memorial prize for
Sociology for the best performance at the final Degree
Examination in Arts held in 2007 from the University of
Colombo. At present she works as the coordinator of
Diploma in Social development and welfare in SUSL and
works as a visiting lecturer in External degree program
(EDPESU)
2Author has graduated from the
Sabaragamuwa University of Sri Lanka.
She obtained her BA special degree in
Sociology and Anthropology. Her
research interests include
communication studies and gender. She did her higher
studies in the Wattegama Balika Vidyalaya.
Photograph
Author 1
Photograph
Author 3
111
Disciplinary Enculturation in Critical Thinking: Do we adopt a Strategic Approach?
Maya Gunawardena
University of New South Wales, Canberra, Australia
Abstract — As critical thinking is a key of higher
education, academics in various disciplines in
Western universities strive to cultivate disciplinary
based critical thinking by introducing subject
specific knowledge and allowing students to apply
these skills in a broader physical and social context.
Such a task is equally challenging in postgraduate
and undergraduate courses. While some research
studies found students from Asian contexts
demonstrate poor critical thinking, some research
points to the cultural differences in thinking and
limited students’ limited skills to use English as the
academic lingua franca. Asian universities must
consult this debate to examine the validity of these
dichotomous views. The present study investigated
macro and micro strategies that academics adopt in
their teaching and assessment procedures to
enhance students’ critical thinking skills at an
Australian university in the schools of Physical
Sciences, Engineering, Humanities and Business.
The study included 20 in-depth interviews with
academics and the qualitative analysis of 20
summative and formative assessment tasks. The
study shows that critical thinking is an essential
component in transforming students to be
workplace ready in their fields. Thus, academics
adopt particularly designed pedagogical strategies
to cultivate critical thinking in their majors. The
study indicates several challenges in developing
disciplinary focused but holistic thinking with a
subtle shift between scaffolded activities and
independent learning. The study provides
implications for pedagogy and curriculum measures
for any higher education context.
Keywords: Critical thinking, pedagogy,
enculturation
I. INTRODUCTION
Critical thinking is an advanced cognitive skill that is
integral to human ability but people need to
cultivate this skill to face the world with an
understanding and a critical mind set. One could
advance their critical thinking skills during their
socialization process but the skills that people
unconsciously develop by interacting with the
environment are inadequate to address the
challenges in the modern society. Education
theories such as constructivism (Twomay Fosnot,
1989) advocate the importance of fostering critical
thinking in education curricula to equip students
with their reasoning and analytical skills. Richards
(2001) suggests that the responsibility of
developing critical thinking lies with the formal
education systems, particularly the higher
education to foster and nurture these skills. Most
formal educational programs, all over the world,
seem to offer opportunities to develop critical
thinking skills, by embedding critical thinking in
disciplinary specific teaching, such as engineering
(Niewoehner, 2006) and English language teaching
(Thompson, 1999). Recent English for Academic
Practice (EAP) research and practice have
recognized EAP as an appropriate venue for the
development of critical thinking skills while also
enhancing language learning (Thompson, 1999;
Paton, 2010). However, there is limited research on
how current higher educational programs
adequately facilitate students’ learning.
Moreover, research shows dichotomous views
about critical thinking skills of non-western learners
because of the culturally different pedagogies
(Durkin, 2010). Limited research addresses these
issues and Gunawardena & Petraki (2014) report
several challenges and tensions in embedding
critical thinking focused tasks in EAP teaching in Sri
Lanka. Their study shows that teachers need to be
equipped with skills in incorporating critical
thinking focused tasks in teaching EAP and other
disciplinary subjects. The empirical study, reported
in this paper, evaluates the pedagogical and
assessment strategies used for enhancing university
students’ critical thinking skills in four schools in
one university in Australia.
112
This paper will firstly discuss the importance of
critical thinking skills and the debate about
students’ skills about Western and non-western
contexts to illustrate the need for enhancement in
critical thinking practice. Secondly, it will describe
the process of data collection and analysis
conducted in this study. Finally, it will examine the
findings of this study providing implications for a
critical thinking based pedagogy. The paper will
then provide implications and recommendation for
Asian education followed by a brief conclusion to
this paper.
II. CRITICAL THINKING IN ACADEMIA
Critical thinking is considered an important general
skill for successful completion of a higher degree
course in the Western context as well as in the
Asian contexts (AQF and SQEF). However, critical
thinking is known as the preserve of the Western
education (Paten, 2010) and thus these views has
led to underestimate skills of Asian students
(Kumaravadivelu, 2003). Recent studies such as
Durkin (2010) based on Asian students indicate that
there is a significant deficit in attention to critical
thinking in Asian educational practices. As a result
of this, Asian students who study in Western
contexts get special attention and they are required
to complete special courses to gain knowledge and
skills in these areas. Durkin’s (2010) study
presupposed that Asian learners lack critical
thinking and explored how Asian Masters’ students
in the UK to adapt to Western education styles. To
address these plaguing criticisms, some contexts
such as Singapore and China have explicitly
embedded critical thinking focused tasks in their
courses.
Kumaravadivelu (2003) argues that critical thinking
debate has led to put Asian students into cultural
stereotypical basket. He emphasises the fact that
Asian students immensely suffer due to their
inadequate English competencies. Also this lack of
critical thinking may be a concern only for a few
students that is being exaggerated by Western
researchers or it is just a stereotypical labeling as
Kumarvadivelu claims. However, a study by
Gunawardena & Petraki (2014) identified several
challenges and tensions that Sri Lankan EAP
teachers encounter in embedding critical thinking
in their teaching. Therefore, teachers would indeed
benefit by examining other colleagues do in global
contexts to promote deep thinking skills of their
learners. This paper aims to provide several
suggestions for enhancing critical thinking in
academia.
One major issue that has resulted in a lack of
understanding of critical thinking is how academics
define critical thinking. It is used as a buzz word in
many courses in academia and academics have
their own perspectives about what critical thinking
is. As Ennis defines critical thinking is “reasonable
reflective thinking that is focused on deciding what
to believe or do” (1989, p. 10). Ennis highlights the
need for having reasonable or reliable premises for
a decision or a belief that one arrive at in a
particular context.
As Halpern (1997) defines critical thinking is a
cognitive skill used to “increase the probability of a
desirable outcome” and therefore it “Self-directed,
self-disciplined, self-monitored and self-corrective
thinking” Paul and Elder (2000). Critical Thinking
involves numerous cognitive skills and therefore,
students should these skills develop in their
learning. They should be able to examine an issue
or a concept through a critical eye and present a
balanced argument that is being viewed from
different perspectives without being biased on
what is given even in an academic text. Intellectuals
need to develop this skill in order to perform well
by recognizing pros and cons of an action or a deed
which will assure better practice. Therefore,
developing critical thinking has a practical relevance
and indeed useful for any one in any context.
Critical thinking is a relevant topic for investigation
and it is a skill that needs cultivation in any context.
Well-cultivated critical thinkers seem to act
appropriately and professionally when making
decisions and many developing countries need
highly efficient thinkers who make wise and apt
decisions for the betterment of the entire nations.
Sri Lanka is poor developing country which has a
higher literacy rates. Ongoing civil war had held it
back from its development in the past and now it is
regaining power relations in the international
community. Therefore, it is imperative to offer an
opportunity for a dialogue to encourage tertiary
education contexts pay explicit attention to
develop critical thinking skills of their students.
The important questions that emerge in this
discussion are how and when critical thinking is
113
taught in educational programs. As critical thinking
is an advanced skill, it may be highlighted in the
tertiary education than in all other contexts.
However, it is difficult to assume how other
educational contexts organize their teaching
without much prominent research about those
contexts.
Teaching approach to critical thinking and
assessment can occur differently in each discipline
of education. For example: 1) In mathematics: using
thinking to apply mathematical principles in
realistic situations and solve mathematical
problems. 2) In science: using critical scientific
thinking to solve scientific problems and being able
to analyze the validity of a theory. 3) In humanities:
ability to recognize and evaluate strengths and
problematic areas in relation to a particular concept
or an issue. However, only a few studies investigate
the pedagogy used in cultivating critical thinking.
Therefore, the study reported in this paper
examined pedagogical strategies and formative and
summative assessment tasks used by experienced
academics in a Western context to cultivate
students’ critical thinking. The findings will provide
other higher education contexts opportunities for
curriculum mapping and also it will provide a
platform for academics to evaluate and reflect on
their own pedagogy and assessment.
IV. RESEARCH QUESTIONS
The study basically focused on the following
research questions:
1. What instructional strategies are used for
CCT in academic disciplines?
2. What assessment strategies are used to
assess developing CT skills?
3. What challenges are encountered in CCT in
the higher education context?
V. METHODOLOGY OF THE STUDY
This paper reports on a mixed methods study that
adopted 20 semi-structured interviews with
experienced academics from four schools (Physical
Sciences, Engineering, Humanities and Business) in
a university in Australia. The major aim of the semi-
structured interviews was to enable academics to
describe their pedagogical interventions,
assessment procedures and their tensions and
challenges in regard to developing critical thinking,
particularly in their courses. The interviews were
audio recorded, transcribed and analysed using
semantic analysis. In addition, the critical thinking
focused assignments were analysed making
judgment of the cognitive and other related skills
involved in completing them.
Interviews are useful tools in qualitative research as
they are more grounded and they allow the
researcher to elicit human experience, viewpoints
and attitudes towards a certain social concept. As
Cohen et al. (2000) note, “interviews enable
participants - to discuss their interpretations of the
world in which they live, and to express how they
regard situations from their own point of view” (p.
367). Therefore, researchers can find out what
people commonly believe and they gain valuable
insights into the important issues regarding a
particular concept or topic. Interviews may be
invaluable in some research studies depending on
the specific research objectives. Interviews provide
access to what is inside a person’s head and make it
possible to measure what a person knows
(knowledge or information), what a person likes or
dislikes (values and preferences) and what a person
thinks (attitudes and beliefs). The study also
analysed 15 formative and summative assessment
tasks for arriving at conclusions.
VI. FINDINGS AND DISCUSSION
A. Instructional interventions for cultivating
critical thinking
This study reports various pedagogical strategies
used by academics to allow students an
opportunity for developing their critical inquiry.
Some widely adopted pedagogical strategies are
field trips, demos, debates in class, group
discussions, teacher student interaction/online
forums, guest lecturers/experts, problem solving
tasks, stimulus response videos and critical reading
tasks accompanied by critical reading questions.
These macro and micro tasks allow students to
engage in critical inquiry and challenge their own
thinking. One of the key elements in these tasks is
the level of student interaction that promotes
critical thinking. Academics in this study believed
that students’ exposure to a range of perspectives
about one particular topic is useful. These views
promote higher inquiry for learning. Thus, in
lectures academics do not provide static answers to
questions or theories. They often allow students to
critique based on the provided evidence and to
form their own theories. Thus, student generated
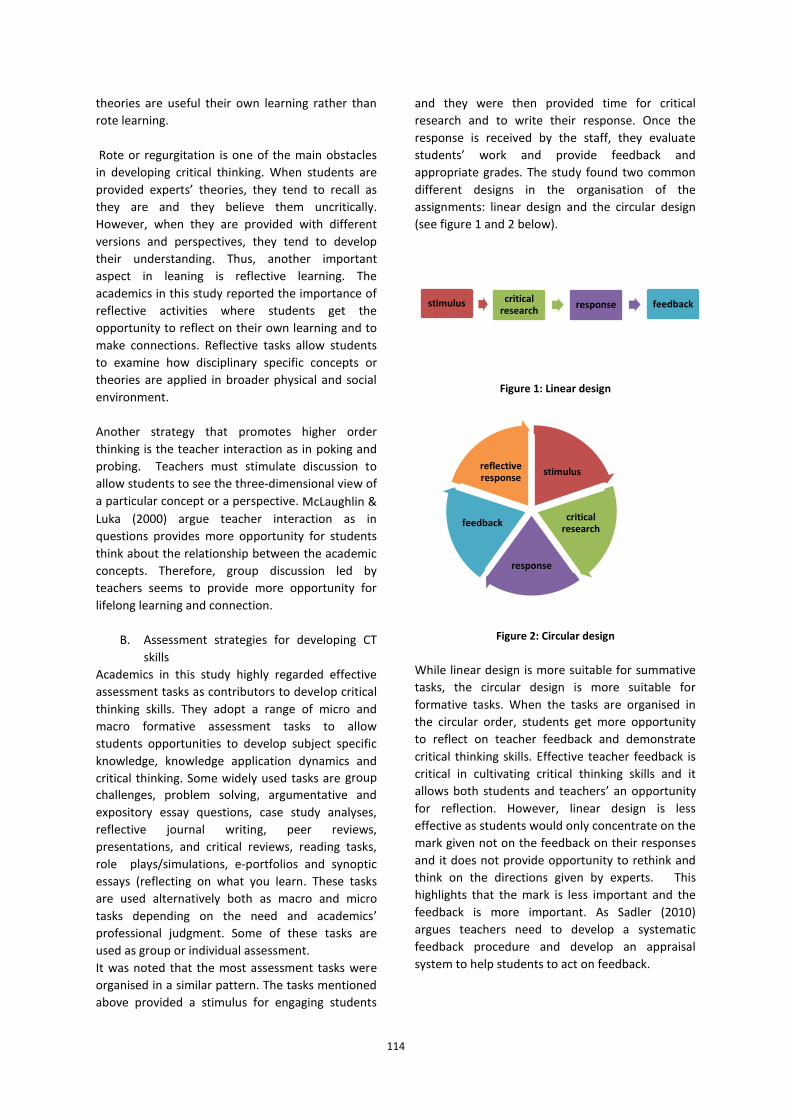
114
theories are useful their own learning rather than
rote learning.
Rote or regurgitation is one of the main obstacles
in developing critical thinking. When students are
provided experts’ theories, they tend to recall as
they are and they believe them uncritically.
However, when they are provided with different
versions and perspectives, they tend to develop
their understanding. Thus, another important
aspect in leaning is reflective learning. The
academics in this study reported the importance of
reflective activities where students get the
opportunity to reflect on their own learning and to
make connections. Reflective tasks allow students
to examine how disciplinary specific concepts or
theories are applied in broader physical and social
environment.
Another strategy that promotes higher order
thinking is the teacher interaction as in poking and
probing. Teachers must stimulate discussion to
allow students to see the three-dimensional view of
a particular concept or a perspective. McLaughlin &
Luka (2000) argue teacher interaction as in
questions provides more opportunity for students
think about the relationship between the academic
concepts. Therefore, group discussion led by
teachers seems to provide more opportunity for
lifelong learning and connection.
B. Assessment strategies for developing CT
skills
Academics in this study highly regarded effective
assessment tasks as contributors to develop critical
thinking skills. They adopt a range of micro and
macro formative assessment tasks to allow
students opportunities to develop subject specific
knowledge, knowledge application dynamics and
critical thinking. Some widely used tasks are group
challenges, problem solving, argumentative and
expository essay questions, case study analyses,
reflective journal writing, peer reviews,
presentations, and critical reviews, reading tasks,
role plays/simulations, e-portfolios and synoptic
essays (reflecting on what you learn. These tasks
are used alternatively both as macro and micro
tasks depending on the need and academics’
professional judgment. Some of these tasks are
used as group or individual assessment.
It was noted that the most assessment tasks were
organised in a similar pattern. The tasks mentioned
above provided a stimulus for engaging students
and they were then provided time for critical
research and to write their response. Once the
response is received by the staff, they evaluate
students’ work and provide feedback and
appropriate grades. The study found two common
different designs in the organisation of the
assignments: linear design and the circular design
(see figure 1 and 2 below).
Figure 1: Linear design
Figure 2: Circular design
While linear design is more suitable for summative
tasks, the circular design is more suitable for
formative tasks. When the tasks are organised in
the circular order, students get more opportunity
to reflect on teacher feedback and demonstrate
critical thinking skills. Effective teacher feedback is
critical in cultivating critical thinking skills and it
allows both students and teachers’ an opportunity
for reflection. However, linear design is less
effective as students would only concentrate on the
mark given not on the feedback on their responses
and it does not provide opportunity to rethink and
think on the directions given by experts. This
highlights that the mark is less important and the
feedback is more important. As Sadler (2010)
argues teachers need to develop a systematic
feedback procedure and develop an appraisal
system to help students to act on feedback.
stimulus critical research
response feedback
stimulus
critical research
response
feedback
reflective response

115
C. Challenges and tensions
While the academics in this study consider
developing students’ ability for critical thinking is
one of their major role, “They (critical thinkers)
blossom in any field” (P. 10.), “as they are holistic
thinkers” (P.10), they face several challenges in
their practice. One participant pointed out that
there is possibility for an academic to disregard this
skill but teach only the subject content:
That's why it's really important to teach it
(critical thinking) when you do have the
opportunity because you don't want a
student going through their entire
Engineering degree and not being able to
think critically, but it's theoretically possible
to do that. (P 1)
Therefore, it is important to pay explicit attention
to critical thinking skill and carefully organise
activities to engage students. The challenges were
categorised as shown in figure 3 and 4 below:
Figure 3: Teacher-related challenges
Figure 4: student-related challenges
The most common challenges (both teacher and
student related) that the majority face are giving
students sufficient and effective individual
feedback, students’ limited experience in directing
higher order thinking and their skills of in-depth
reading and effective writing in academia. The
discussion in the previous section has also noted
the need for holistic circular feedback to develop
critical thinking. This is a challenge that many
academics face in any context as a result of their
heavy workloads. This study suggests that there is
indeed a crucial need for developing effective
measures to provide feedback to our learners to
ensure that they understand and can act on
feedback.
Students’ limited experience in using higher order
thinking is another major challenge that needs
addressing. In the process of academic
enculturation, perhaps students need to be
scaffolded more, until eventually they develop
independent skills. This study saw the divided views
about scaffolding: some academics thought
scaffolding is not necessary for every student.
Therefore, they seem to provide guidance, if
necessary and required. Too much scaffolding can
obstruct independent thinking and creativity in
students’ learning. This is highly a professional
judgment and can depend on the intellectual level
of learners.
As generally agreed, students need to have
advanced skills in reading and writing to be able to
understand academic arguments and complex
theories to translate them into their own words
and communicate effectively in learning. The
students who do not have enough language skills
tend to plagiarise (Devlin and Gray, 2007) and will
not engage in deep learning. This illustrates the
higher levels of challenges that non native speaker
students who learn in English medium face in their
learning. If students are not prepared academics
encounter difficulties in scaffolding students
learning. As Vygotsky points out academics should
only provide effective scaffolding within the
proximal development zone (Wass et al., 2011).
Otherwise, students face difficulties in
comprehension.
D. Implications and recommendations
The study has revealed that choosing the
appropriate pedagogical intervention and
assessment are necessary for effective practice in
developing critical thinking. Research and practice
in higher education acknowledge that traditional
knowledge based acquisition strategies do not
contribute to cultivating adequate levels of critical
thinking skills (Sternberg, 1986). Barnett (1997)
claims that even though academics are in favour of
teacher
classroom
strategies
task design
assessement feedback

116
critical thinking, they have “no proper account of it”
(p. 2). While some explicitly teach critical thinking,
others expect students to nurture thinking
implicitly while taking opportunities provided in
their courses (Tapper, 2004). This study shows that
academics adopt numerous explicit strategies and
the reflective activities are the most useful ones to
help students make connections with their learning.
The current study highlighted that teachers do have
theories about their teaching and these theories
are generated with their experience in student
learning. This confirms Fox (1983) argument of the
contribution of teacher-initiated versus student-
initiated teaching theories. Fox’s classification
indicates that teachers do seem to develop their
pedagogy by working with students and reflecting
on the perceptions they develop over time about
student learning. However, education policy and
graduate attributes help them to initiate their
pedagogy.
VII. CONCLUSION
This paper has reported on the findings of a
qualitative study that inquired assessment and
pedagogical strategies used in cultivating critical
thinking skills in an Australian university. It has
analysed the strategies used in teaching and
assessment and it identifies several useful
strategies to develop critical thinking. The study
shows the importance of reflective exercises that
allow students to expand thinking by evaluating the
use of academic concepts in disciplines. It has also
discussed the importance of effective teacher
feedback to stimulate students’ critical thinking
skills.
The study indicates several teacher-related and
student-related challenges in academic practice.
Some academics seem to negotiate these
challenges but they require more systematic and
consistent support to negotiate such challenges.
These findings suggest that universities need to
move forward developing effective strategies for
pedagogy and assessment, particularly introducing
strategies for effective feedback. If a university
course is only comprised with knowledge based
testing, there is little possibility for course takers to
develop critical thinking. As critical thinking is the
long lasting legacy of higher education, course
convenors must pay full attention to develop
critical thinking in their courses and allow students
engage in thinking based tasks to offer opportunity
for learning transfer to occur across disciplines.
Local Universities must address the English
language deficit to help students to engage in deep
learning, if they choose to use English as the
academic lingua franca.
REFERENCE
Barnett, R. (1994). The Limits of Competence:
Knowledge, Higher Education and Society.
Buckingham: Society for Research into Higher
Education/Open University Press.
Cohen, L., Manion, L. & Morrison. K. (2000). Research
methods in education (5th
edition). New York:
Routledge.
Devlin, M. and Gray, K. (2007). In their own words: A
qualitative study of the reasons
Australian university student plagiarise. Higher
Education Research and Development 26(2),
181-198.
Durkin, K. (2008). The middle way: East Asian masters
students’ perceptions of critical
argumentation in U.K. universities. Journal of
Studies in International Education 12 (1), 38-
55.
Durkin, K. (2010). The adaptation of East Asian masters
students to western norms of critical thinking
and argumentation in the UK. Intercultural
Education, 19(1), 15-27.
Egege, S. & Kutieleh, K. (2004). Critical thinking: teaching
foreign notions to foreign students.
International Education Journal, 4 (4), 75–85.
Ennis, R.H. (1989). Critical Thinking and Subject
Specificity: Clarification and Needed Research.
Educational Researcher, 18 (3), 4-10.
Fox, D. (1983). Personal theories of teaching. Studies in
Higher Education, 8, 151-163.
Gunawardena, M. & Petraki, E. (2014). Critical thinking
in the EAP classroom: Tensions and challenges
in the Sri Lankan context. In Liyanage, I. &
Walker, T. Globalizing EAP practice:
Negotiating tensions and challenges (Eds).
Sense Publishers: Australia.
117
Halpern, D.H. (1997). Critical Thinking Across the
Curriculum. New Jersey: Lawrence Erlbaum
Associates.
Kumaravadivelu, B. (2003). Problematizing Cultural
Stereotypes in TESOL. TESOL Quarterly, 37 (4),
709-719.
Niewoehner, R.J. (2006). Applying a critical thinking
model for engineering education. World
Transactions on Engineering and Technology
Education, 5(2) 341-344.
McLoughlin, C. & Luca, J. (2000). Cognitive engagement
and higher order thinking through computer
conferencing : We know why but do we know
how? Teaching and learning forum proceeding
content:
Moore, T. (2011). Critical thinking and disciplinary
thinking: a continuing debate. Higher
Education Research & Development, 30 (3),
261-274.
Paton, M. (2010). Asian Students, Critical Thinking and
English as an Academic Lingua Franca. Analytic
Teaching and Philosophical Praxis, 32 (1), 27-
39.
Paul, R. & L. Elder (2000). Critical Thinking: Nine
Strategies for Everyday Life, Part I. Journal of
Developmental Education, 24 (1), 40-41.
Sadler, D. R. (2010). Beyond feedback: Developing
student capability in complex appraisal.
Assessment & Evaluation in Higher Education,
35 (5), 535-550.
Sternberg, R. J. (1986). Critical Thinking: Its Nature,
Measurement, and Improvement.
http://files.eric.ed.gov/fulltext/ED272882.pdf,
retrieved on 03.04.14.
Tapper, J. (2004). Student perceptions of how critical
thinking is embedded in a degree program.
Higher Education Research & Development, 23
(2), 199-222.
Thompson, C. (1999). Critical thinking: what is it and
how do we teach it in English for Academic
Purposes (EAP) programs? HERDSA Annual
International Conference, retrieved from:
http://www.herdsa.org.au/wp-
ontent/uploads/conference/1999/pdf/Thomp
son.PDF
Twomey, Fosnot, C. (1989). Enquiring teachers,
enquiring learners: A constructivist approach
for teaching. New York: Teachers College
Press.
Wass, R., Harland, T. & Mercer, A. (2011). Scaffolding
critical thinking in the zone of proximal
development. Higher Education Research &
Development, 30 (3), 317-328.
BIOGRAPHY OF THE AUTHOR
Dr. Maya Gunawardena is a lecturer in
the Learning and Teaching Group at
University of New South Wales,
Canberra, Australia. She currently
convenes writing courses for
undergraduate and HDR students. Her research
interests include academic writing, socio and applied
linguistics and teacher education. She has published in
the area of teaching pedagogy and language learning.
Maya has worked as a teacher educator and an
education consultant in Sri Lanka.
Photograph
Author 1
118
Tertiary Englisg Education: Are we Producing Lifelong Learners?
UD Senaratne1, IK Weerakoon2
1,2
Department of English Language Teaching, Sabaragamuwa University of Sri Lanka, Sri Lanka 1
Abstract—Given the importance of the English
language as a pre-eminent international language
today, the competency in the English language,
maintaining continuous passion to learn English,
and acquiring the skills associated with lifelong
learning of English have now become essential.
Thus, most Sri Lankan universities have also
acknowledged the need to offer an English course
for all the undergraduates and it is vital that the
undergraduates should develop into lifelong
learners of English who retain a passion for learning
English even after the completion of formal
examinations. Thus, this paper attempts to explore
whether the undergraduates in Faculty of Social
Sciences and Languages (FSSL) of Sabaragamuwa
University of Sri Lanka (SUSL) have the inclination to
become lifelong learners (LLL) of English after
completing their Core English Language (CEL) course
and whether there is any association between their
gender and their tendency to become lifelong
learners of English.
Using the simple random sampling 130 students of
SUSL were selected for this study. In addition to semi
structured interviews and class room observations,
data were collected mainly by questionnaires
designed on a five-point Likert-scale adopting items
from Macaskill & Taylor's questionnaires (2010).
Mean Comparison, Crosstabs and Pearson Chi-
square were computed for the purposes of analysis.
The study revealed that over 80% second-year
undergraduates of FSSL in SUSL had the propensity
for lifelong learning of English whereas 19%
undergraduates were not lifelong learners.
Moreover, no significant association could be seen
between their gender and the tendency to become
lifelong learners. Hence, as they have the most
required propensity to become lifelong learners of
English irrespective of their gender, the lecturers,
and the administrators should take every possible
step to make them enjoy learning English, get the
maximum benefit out of the CEL course, and help
them to sustain and develop the skills associated
with lifelong learning.
Keywords— Lifelong learners, Gender, Tertiary
English Education
I. INTRODUCTION
The concept of lifelong education was originated in
the seminal UNESCO Report Learning to Be (1972)
written by Edgar Faure et al. This report
underpinned that lifelong education is based on
four principles: vertical integration, horizontal
integration, democratization of knowledge and
learning society. Faure’s report paved the way for
the emergence of lifelong education which gave
prominence to the learner in the processes of
teaching/learning, as opposed to the conventional
views of the time. After two decades, lifelong
education was replaced by lifelong learning in the
UNESCO’s report Learning: The Treasure Within
(1996) which pointed out the need to rethink and
update the concept of lifelong education in order to
reconcile three forces: competition, which provides
incentives; co-operation which gives strength; and
solidarity, which unites. This paradigm shift was
indeed a significant milestone as it made a drastic
change pertaining to the spectrum of lifelong
learning. The contemporary definitions of lifelong
learning reiterate the enhancement of the lifelong
learners’ characteristics. Accordingly, learners with
self-directed learning, autonomous learning,
motivation to learn, and perceived competence are
considered lifelong learners. ( Kirby et al., 2010;
Macaskill &Taylor, 2010). Weert and Kendall (2004)
also pointed out several characteristics of lifelong
learning such as self-motivation, forms of
progression and personal achievements, learner-
centred and maintenance of portfolio of personal
achievements.
Given the importance of English as the most widely
spread international language, the importance of
having competency in it and maintaining continuous
passion to learn it, and acquiring the skills
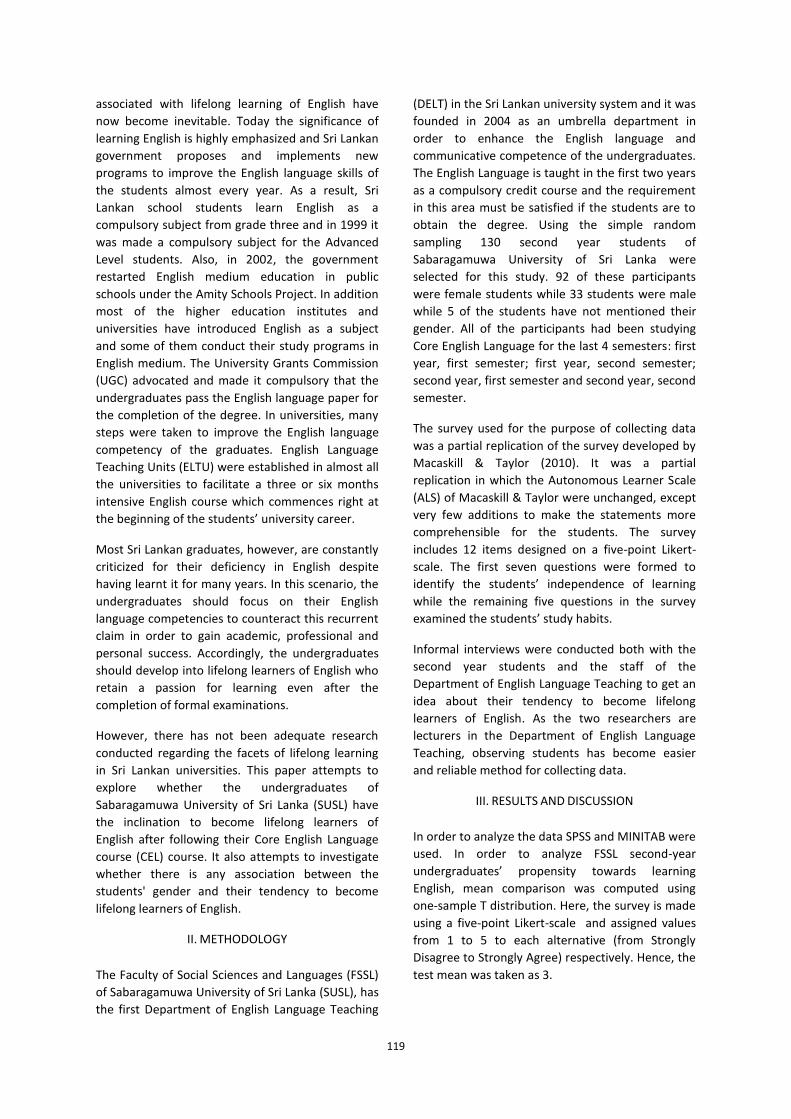
119
associated with lifelong learning of English have
now become inevitable. Today the significance of
learning English is highly emphasized and Sri Lankan
government proposes and implements new
programs to improve the English language skills of
the students almost every year. As a result, Sri
Lankan school students learn English as a
compulsory subject from grade three and in 1999 it
was made a compulsory subject for the Advanced
Level students. Also, in 2002, the government
restarted English medium education in public
schools under the Amity Schools Project. In addition
most of the higher education institutes and
universities have introduced English as a subject
and some of them conduct their study programs in
English medium. The University Grants Commission
(UGC) advocated and made it compulsory that the
undergraduates pass the English language paper for
the completion of the degree. In universities, many
steps were taken to improve the English language
competency of the graduates. English Language
Teaching Units (ELTU) were established in almost all
the universities to facilitate a three or six months
intensive English course which commences right at
the beginning of the students’ university career.
Most Sri Lankan graduates, however, are constantly
criticized for their deficiency in English despite
having learnt it for many years. In this scenario, the
undergraduates should focus on their English
language competencies to counteract this recurrent
claim in order to gain academic, professional and
personal success. Accordingly, the undergraduates
should develop into lifelong learners of English who
retain a passion for learning even after the
completion of formal examinations.
However, there has not been adequate research
conducted regarding the facets of lifelong learning
in Sri Lankan universities. This paper attempts to
explore whether the undergraduates of
Sabaragamuwa University of Sri Lanka (SUSL) have
the inclination to become lifelong learners of
English after following their Core English Language
course (CEL) course. It also attempts to investigate
whether there is any association between the
students' gender and their tendency to become
lifelong learners of English.
II. METHODOLOGY
The Faculty of Social Sciences and Languages (FSSL)
of Sabaragamuwa University of Sri Lanka (SUSL), has
the first Department of English Language Teaching
(DELT) in the Sri Lankan university system and it was
founded in 2004 as an umbrella department in
order to enhance the English language and
communicative competence of the undergraduates.
The English Language is taught in the first two years
as a compulsory credit course and the requirement
in this area must be satisfied if the students are to
obtain the degree. Using the simple random
sampling 130 second year students of
Sabaragamuwa University of Sri Lanka were
selected for this study. 92 of these participants
were female students while 33 students were male
while 5 of the students have not mentioned their
gender. All of the participants had been studying
Core English Language for the last 4 semesters: first
year, first semester; first year, second semester;
second year, first semester and second year, second
semester.
The survey used for the purpose of collecting data
was a partial replication of the survey developed by
Macaskill & Taylor (2010). It was a partial
replication in which the Autonomous Learner Scale
(ALS) of Macaskill & Taylor were unchanged, except
very few additions to make the statements more
comprehensible for the students. The survey
includes 12 items designed on a five-point Likert-
scale. The first seven questions were formed to
identify the students’ independence of learning
while the remaining five questions in the survey
examined the students’ study habits.
Informal interviews were conducted both with the
second year students and the staff of the
Department of English Language Teaching to get an
idea about their tendency to become lifelong
learners of English. As the two researchers are
lecturers in the Department of English Language
Teaching, observing students has become easier
and reliable method for collecting data.
III. RESULTS AND DISCUSSION
In order to analyze the data SPSS and MINITAB were
used. In order to analyze FSSL second-year
undergraduates’ propensity towards learning
English, mean comparison was computed using
one-sample T distribution. Here, the survey is made
using a five-point Likert-scale and assigned values
from 1 to 5 to each alternative (from Strongly
Disagree to Strongly Agree) respectively. Hence, the
test mean was taken as 3.
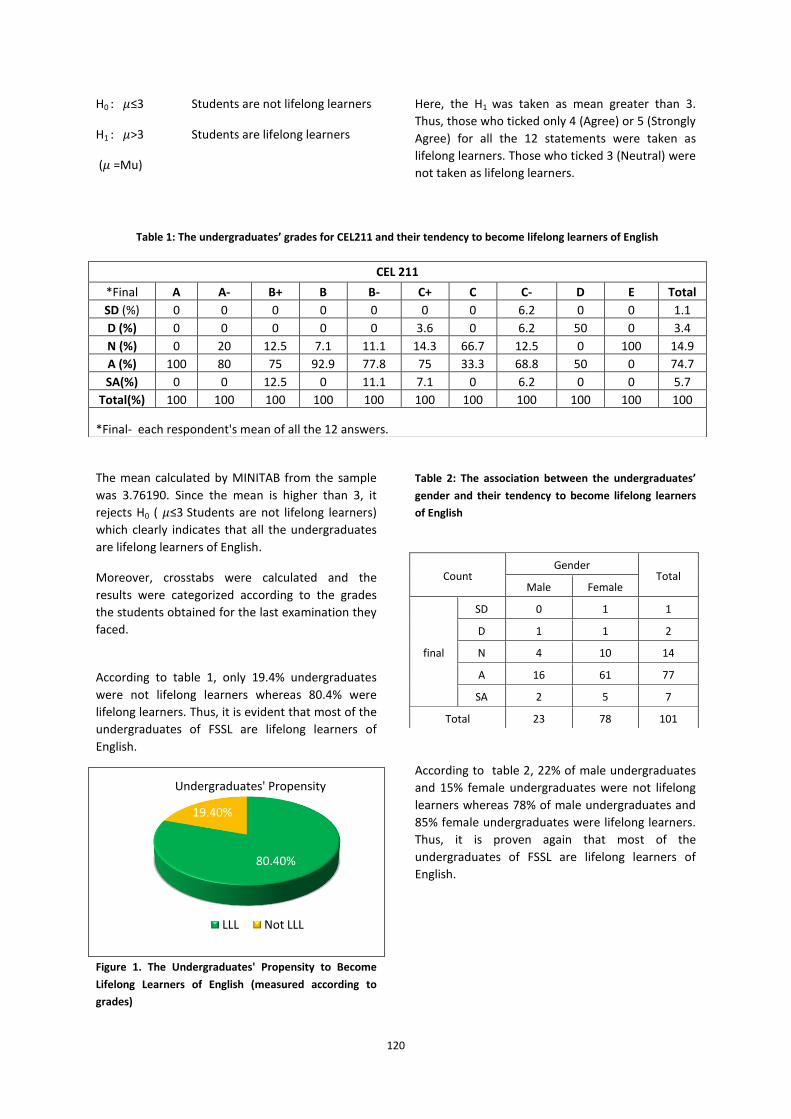
120
H0 : ≤3 Students are not lifelong learners
H1 : >3 Students are lifelong learners
( =Mu)
Here, the H1 was taken as mean greater than 3.
Thus, those who ticked only 4 (Agree) or 5 (Strongly
Agree) for all the 12 statements were taken as
lifelong learners. Those who ticked 3 (Neutral) were
not taken as lifelong learners.
The mean calculated by MINITAB from the sample
was 3.76190. Since the mean is higher than 3, it
rejects H0 ( ≤3 Students are not lifelong learners)
which clearly indicates that all the undergraduates
are lifelong learners of English.
Moreover, crosstabs were calculated and the
results were categorized according to the grades
the students obtained for the last examination they
faced.
According to table 1, only 19.4% undergraduates
were not lifelong learners whereas 80.4% were
lifelong learners. Thus, it is evident that most of the
undergraduates of FSSL are lifelong learners of
English.
Figure 1. The Undergraduates' Propensity to Become
Lifelong Learners of English (measured according to
grades)
Table 2: The association between the undergraduates’
gender and their tendency to become lifelong learners
of English
According to table 2, 22% of male undergraduates
and 15% female undergraduates were not lifelong
learners whereas 78% of male undergraduates and
85% female undergraduates were lifelong learners.
Thus, it is proven again that most of the
undergraduates of FSSL are lifelong learners of
English. 80.40%
19.40%
LLL Not LLL
Undergraduates' Propensity
Table 1: The undergraduates’ grades for CEL211 and their tendency to become lifelong learners of English
CEL 211
*Final A A- B+ B B- C+ C C- D E Total
SD (%) 0 0 0 0 0 0 0 6.2 0 0 1.1
D (%) 0 0 0 0 0 3.6 0 6.2 50 0 3.4
N (%) 0 20 12.5 7.1 11.1 14.3 66.7 12.5 0 100 14.9
A (%) 100 80 75 92.9 77.8 75 33.3 68.8 50 0 74.7
SA(%) 0 0 12.5 0 11.1 7.1 0 6.2 0 0 5.7
Total(%) 100 100 100 100 100 100 100 100 100 100 100
*Final- each respondent's mean of all the 12 answers.
Count Gender
Total Male Female
final
SD 0 1 1
D 1 1 2
N 4 10 14
A 16 61 77
SA 2 5 7
Total 23 78 101

121
Figure 2. The Undergraduates' Propensity to Become
Lifelong Learners of English (measured according to
gender)
Table 3: Chi-Square Tests
Value df Asymp. Sig.
(2-sided)
Pearson Chi-Square 1.713a 4 .788
Likelihood Ratio 1.779 4 .776
Linear-by-Linear
Association .103 1 .748
N of Valid Cases 101
a. 6 cells (60.0%) have expected count less than 5. The
minimum expected count is .23.
Moreover, it is clear that no association can be
found between the gender of the undergraduates
and their inclination to become lifelong learners of
English. This is further proved by the Chi-Square
Test (Refer table 3) in which the probability is
higher(.788) than the conventional 5% (P>0.05)
indicating statistically insignificant correlation
coefficient.
IV. CONCLUSION
The study revealed that over 80% second-year
undergraduates of FSSL in SUSL had the propensity
for lifelong learning of English whereas 19%
undergraduates were not lifelong learners.
Moreover, in terms of gender, 78% male
undergraduates and 85% female undergraduates
were lifelong learners. In addition, no significant
association could be seen between their gender
and tendency to become lifelong learners. Hence,
as they have the most required propensity to
become lifelong learners of English, the lecturers,
and the administrators should take every possible
step to make them enjoy learning English, get the
maximum benefit out of the CEL course, and make
them successful lifelong learners of English.
Therefore, the findings of this study will enlighten
the lecturers of the fact that SUSL undergraduates
have the necessary inclination towards lifelong
learning of English ; however, as lecturers, we need
to help the undergraduates to sustain and develop
skills associated with lifelong learning.
The findings of this study may provide insights into
the assumption of the lecturers at the University of
Sabaragamuwa that SUSL students are unsuccessful
in learning English and there is a high level of
absenteeism because they lack continuous passion
to learn English, which turned out to have no
scientific value since the findings of the present
research revealed that only 19 percent of the
participants did not have the inclination towards
lifelong learning of English. The findings of the
study also revealed that there was no significant
correlation between students’ gender and their
propensity to become lifelong learners which again
go against the opinion of the majority of academic
staff that female students are more enthusiastic
and in a continuous pursuit of knowledge than the
male students. Thus, if the students get absent very
often and perform poorly in the examinations
whilst the majority of students do have the
propensity to become lifelong learners, then the
university authorities should be self-analytical
about the teaching/learning environment of the
university, especially with regard to English. Hence,
a considerable attention should be paid for the
content of the CEL course, lecturers, teaching
methods, the materials used. This could suggest
that there is a requirement for a needs analysis
which helps to identify students’ needs so that the
necessary steps could be taken to remedy the
situation including developing materials that can
better meet the students’ needs and can increase
students’ attendance in the lectures and success
rates in English lessons
REFERENCES
Edgar Faure et al. (1972). Learning to Be. [Online].
Available FTP:
unesdoc.unesco.org/images/0000/000018/00180
1e.pdf. Accessed: 5th May 2014
78% 85%
22% 15% 0%
10%
20%
30%
40%
50%
60%
70%
80%
90%
Male Female
LLL
Not LLL
Undergraduates' Propensity
122
Jacques Delors et al. (1996). Learning: The Treasure
Within. [Online]. Available FTP:
unesdoc.unesco.org/images/0010/001095/10959
0eo.pdf. Accessed: 5th May 2014
Kirby, J. R. et al. (2010) Development of a Scale to
Measure Lifelong Learning. International Journal
of Lifelong Education. 29 (3). p. 291-302
Macaskill Ann & Taylor, Elissa. (2010) The Development
of a Brief Measure of Learner Autonomy in
University Students. Studies in Higher Education.
35 (3). P 351-359.
Weert, T. J. V. & Kendall, M. (eds.) (2004) Lifelong
Learning in the Digital Age. Boston: Kluwer
Academic.
BIOGRAPHY OF AUTHORS
1Author is a lecturer of English of Sabaragamuwa
University of Sri Lanka. Her research interests include
Applied Linguistics and Sociolinguistics.
2Author is a lecturer of English of University of
Sabaragamuwa, Sri Lanka. Her research interests include
English language teaching and Psycholinguistics.

123
The Effectiveness of the Implementation of the National Plan for a Trilingual Sri Lanka: In Relation to the Role of English in School Level
Dinithi Anuththara Hennayake
Sabaragamuwa University of Sri Lanka, Sri Lanka
Abstract—The 10 Year National Plan for a
Trilingual Sri Lanka (2012-2022) could be identified
as a high potential development project introduced
recently which upon being successfully
implemented and executed could result in many
benefits to the country as well as society. However,
given the fairly recent implementation, the
expected outcome and the overall effect of the
plan remain completely hypothetical. Therefore,
given the lack of analysis or rather any detailed
account on the Effectiveness of the Trilingual Plan,
it is the aim of this study to account for the
effectiveness of the Trilingual Plan at its current
phase in relation to the English language teaching
and learning in school level.
The study follows different methods of data analysis
and is largely quantitative in nature. Therefore, the
study is based on a field setting of various
government institutions, departments, and schools
which deal with the execution of the Trilingual Plan.
(E.g. - Ministry of National Languages and Social
Integration, Ministry of Education) The primary
sources of data collection are interviews and
questionnaires gathered mainly through the above
mentioned institutions. The secondary sources of
data collection are the various reports, articles,
books on the 10 Year National Plan for a Trilingual
Sri Lanka.
The study analyses the many strategies adopted by
the Plan to promote English Language in schools
and how they are implemented in a practical
scenario. And in analysing these strategies the study
looks into the challenges faced and drawbacks
shown during the execution which hinders the
implementation and tries to seek the methods which
can be incorporated in order to increase the
effectiveness of the Trilingual Plan.
Keywords - Ten Year National Plan for a Trilingual
Sri Lanka, English as a ‘life skill’, English language
teaching in schools
I. INTRODUCTION
With the year 2012 being declared as the Year of
Trilingual Sri Lanka, the Mahinda Chinthana
Programme initiated the Ten Year National Plan for
a Trilingual Sri Lanka in the said year. It sets the
foundation to all the citizens in the country to
acquire trilingual skills and competencies in the
languages of Sinhala, Tamil and English.
Preamble of the Trilingual Plan states that it aims to
create social integration through the spread of
languages, while the different groups of people
continue to maintain and foster the heritage and
ethos of their forefathers. The Trilingual initiative
intends to encourage all Sinhala speaking people to
learn the Tamil language and all the Tamil speaking
people to learn the Sinhala language. At the same
time the initiative intends to promote English as a
Life Skill to access knowledge developed outside the
country and increase employment opportunities
among people of all ages, gender and social
categories in the country, with the long term
objective of steering Sri Lanka towards economic
development.
A. English as a Life Skill
As mentioned above English is promoted as a ‘Life
Skill’ under the Trilingual Plan. The concept of
English as a Life Skill intends to promote English for
its utility value rather than for its social value. This
concept was initiated in 2009 with the President
Mahinda Rajapaksa coming into power. He declared
2009 as the Year of English and IT and introduced
the concept of “English as a Life Skill” by initiating
the Eighteen month Road Map to promote
Spoken/Communicative English in Sri Lanka. This
Road Map programme intended to give a new
perspective to English language in Sri Lanka. It
aimed to promote English as a skill for employment
and a vehicle reaching out to the external world of
knowledge and learning. (Kahandawaarachchi 2009)

124
In order to better understand this concept it is vital
to consider the Role of English in Sri Lanka prior to
the introduction of ‘English as a Life Skill’. In the
post colonized Sri Lanka, English language was used
as means of exhibiting the social hierarchy. In other
words, English became the symbol of the Elitism,
High class and Privilege. However amidst the Mass
class it also became a symbol of Social Oppression.
English was respected without any doubt while at
the same time it was feared with vehemence. Fear
stemmed from the dislike to make errors in English
because unlike in Sinhala and Tamil usage, English
was always coupled with the notion that it was a
language to be used in the correct manner or there
was a high chance of the user being ridiculed for a
mistake made in using a language foreign to him.
The said approach towards English was one of the
main reason for it to be a means of social
oppression and thus, attacked by the Mass class in
various forms, be it the referring to English as
'Kaduwa' or 'Kadda'(Sinhala word for sword) or the
outrage shown during the Youth unrest in 1980's.
Thus, under such circumstances any efforts made in
promoting the usage of English Language failed to
achieve its aim. Promotion of English for its correct
Rule Learning forced the learners to learn the rules
of English but when it came to using the language
they hesitated. They were so conscious of the rules,
pronunciation, syntax, etc of the language that
these inhibitions prevented the usage of the
language. The continuation of this process for many
decades made Sri Lanka a country where millions
were spent on learning English language to finally
fail at achieving its potential.
And therefore at a time like this a new concept was
introduced as ‘English in our way’, which intended
to highlight on the Sri Lankan English. Sri Lankan
English is one variety of English among many such
as British English, American English, Indian English,
etc. At the early Colonial era British English was ‘the
English Language’ because for many of the colonies
English was introduced by the British. But as time
passed many other varieties of English emerged
which are called ‘New English’, such as Indian
English, Australian English, South Asian English, etc.
And likewise there is Sri Lankan English (SLE), as
another variety of English.
So, the concept of ‘English in our way’ deals with
the said variety of Sri Lankan English. Although Sri
Lankan English had already existed prior to this
concept given the inevitable natural adaption
process of the foreign language to the Sri Lankan
culture, the accumulated attributes such as words,
dictions, pronunciation were not given due
attention or acceptance.
However when it comes to the promotion of English
as a Life Skill, the concept aims to make the Sri
Lankans accept the ‘Sri Lankaness’ of the English in
Sri Lanka. The acceptance of English language as a
part of the Sri Lankan identity would prevent the
negation of English by the majority of Sri Lanka
because the attitude towards the language would
change and thereby people would begin to see
English as a skill rather a liability.
Being implemented only in 2012 the Ten Year
National Plan could be called relatively new.
However despite being new, the National Plan has
high potential and upon successful implementation
would benefit Sri Lanka in the national arena as well
as in the international arena. Therefore, this study
which is based on the effectiveness of English
language teaching and learning in schools under the
National plan could be a good measure at predicting
the outcome of the plan at the end. Also this would
be a guide to decide on the drawbacks of the
programme upon its implementation and thereby
they could be dealt with to achieve the necessary
outcome.
By the current year of 2014 the National Plan is in
its Phase I which continues till 2016.
II. FINDINGS AND ANALYSIS
At the initial stages of promoting English as a Life
Skill, it was identified that one of the main
drawbacks of the policies that were implemented
till date (prior to the Road Map Programme in 2009)
was their inability to make the students use English
to converse. As Dr. Sunimal Fernando expresses
many times the programme identified this inability
and decided to deal with it accordingly. And as a
result the programme opted for a fresh approach,
namely a new point of view to look at the teaching
methods of English. Programmes were designed
especially to uplift the oral skills of the English
language user. While grammar, reading and writing
too would be improved under the new policies it
was the oral skills that were highlighted upon. This
was due to the common vision of the policymakers,
in which they recognized the importance of English
language in the International arena as a link
language.
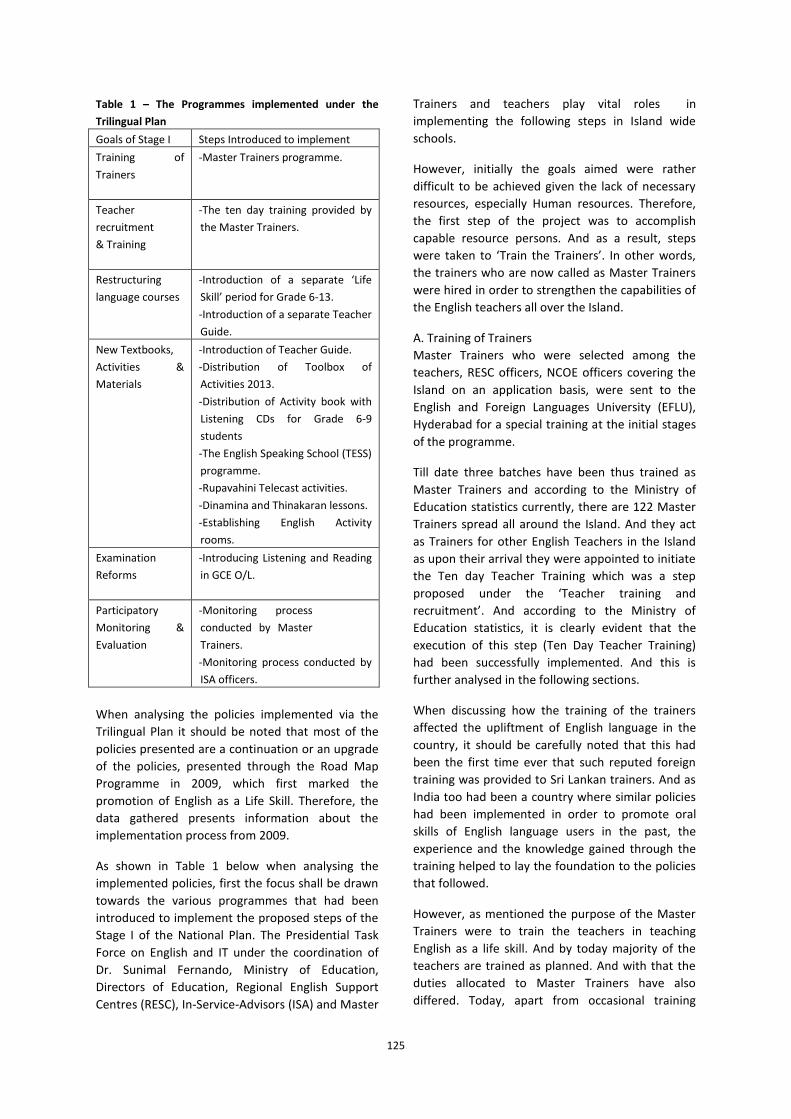
125
Table 1 – The Programmes implemented under the
Trilingual Plan
Goals of Stage I Steps Introduced to implement
Training of
Trainers
-Master Trainers programme.
Teacher
recruitment
& Training
-The ten day training provided by
the Master Trainers.
Restructuring
language courses
-Introduction of a separate ‘Life
Skill’ period for Grade 6-13.
-Introduction of a separate Teacher
Guide.
New Textbooks,
Activities &
Materials
-Introduction of Teacher Guide.
-Distribution of Toolbox of
Activities 2013.
-Distribution of Activity book with
Listening CDs for Grade 6-9
students
-The English Speaking School (TESS)
programme.
-Rupavahini Telecast activities.
-Dinamina and Thinakaran lessons.
-Establishing English Activity
rooms.
Examination
Reforms
-Introducing Listening and Reading
in GCE O/L.
Participatory
Monitoring &
Evaluation
-Monitoring process
conducted by Master
Trainers.
-Monitoring process conducted by
ISA officers.
When analysing the policies implemented via the
Trilingual Plan it should be noted that most of the
policies presented are a continuation or an upgrade
of the policies, presented through the Road Map
Programme in 2009, which first marked the
promotion of English as a Life Skill. Therefore, the
data gathered presents information about the
implementation process from 2009.
As shown in Table 1 below when analysing the
implemented policies, first the focus shall be drawn
towards the various programmes that had been
introduced to implement the proposed steps of the
Stage I of the National Plan. The Presidential Task
Force on English and IT under the coordination of
Dr. Sunimal Fernando, Ministry of Education,
Directors of Education, Regional English Support
Centres (RESC), In-Service-Advisors (ISA) and Master
Trainers and teachers play vital roles in
implementing the following steps in Island wide
schools.
However, initially the goals aimed were rather
difficult to be achieved given the lack of necessary
resources, especially Human resources. Therefore,
the first step of the project was to accomplish
capable resource persons. And as a result, steps
were taken to ‘Train the Trainers’. In other words,
the trainers who are now called as Master Trainers
were hired in order to strengthen the capabilities of
the English teachers all over the Island.
A. Training of Trainers
Master Trainers who were selected among the
teachers, RESC officers, NCOE officers covering the
Island on an application basis, were sent to the
English and Foreign Languages University (EFLU),
Hyderabad for a special training at the initial stages
of the programme.
Till date three batches have been thus trained as
Master Trainers and according to the Ministry of
Education statistics currently, there are 122 Master
Trainers spread all around the Island. And they act
as Trainers for other English Teachers in the Island
as upon their arrival they were appointed to initiate
the Ten day Teacher Training which was a step
proposed under the ‘Teacher training and
recruitment’. And according to the Ministry of
Education statistics, it is clearly evident that the
execution of this step (Ten Day Teacher Training)
had been successfully implemented. And this is
further analysed in the following sections.
When discussing how the training of the trainers
affected the upliftment of English language in the
country, it should be carefully noted that this had
been the first time ever that such reputed foreign
training was provided to Sri Lankan trainers. And as
India too had been a country where similar policies
had been implemented in order to promote oral
skills of English language users in the past, the
experience and the knowledge gained through the
training helped to lay the foundation to the policies
that followed.
However, as mentioned the purpose of the Master
Trainers were to train the teachers in teaching
English as a life skill. And by today majority of the
teachers are trained as planned. And with that the
duties allocated to Master Trainers have also
differed. Today, apart from occasional training
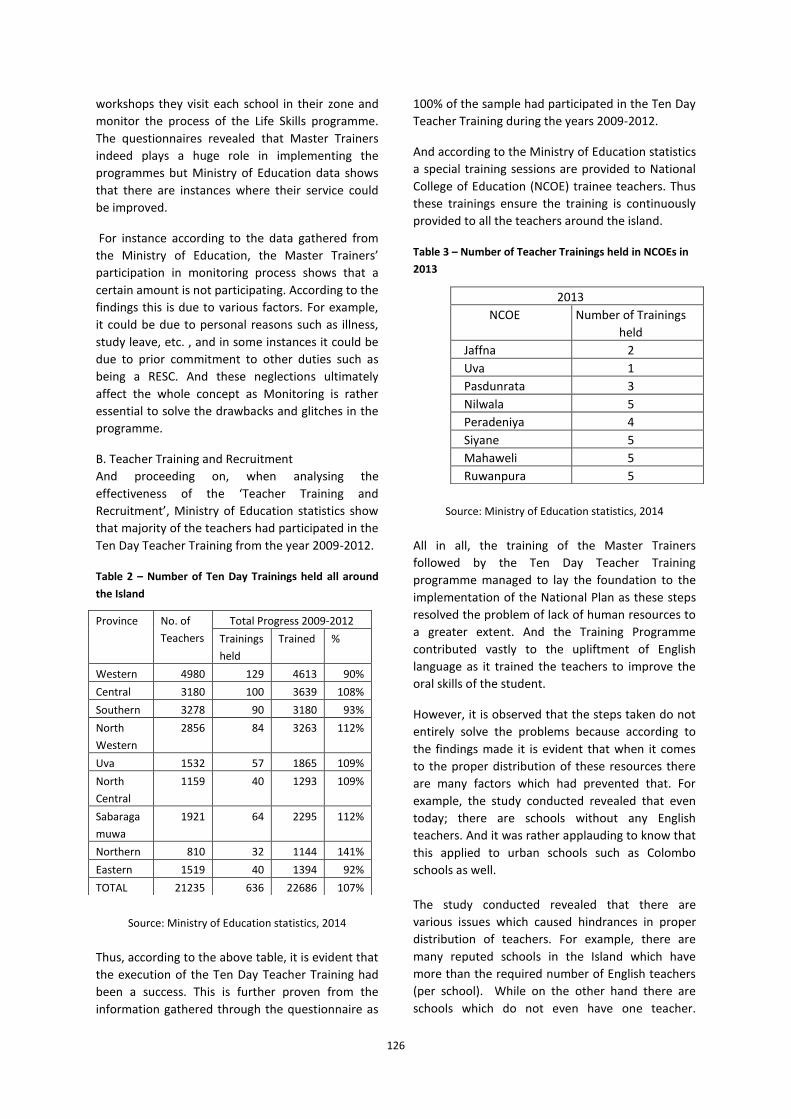
126
workshops they visit each school in their zone and
monitor the process of the Life Skills programme.
The questionnaires revealed that Master Trainers
indeed plays a huge role in implementing the
programmes but Ministry of Education data shows
that there are instances where their service could
be improved.
For instance according to the data gathered from
the Ministry of Education, the Master Trainers’
participation in monitoring process shows that a
certain amount is not participating. According to the
findings this is due to various factors. For example,
it could be due to personal reasons such as illness,
study leave, etc. , and in some instances it could be
due to prior commitment to other duties such as
being a RESC. And these neglections ultimately
affect the whole concept as Monitoring is rather
essential to solve the drawbacks and glitches in the
programme.
B. Teacher Training and Recruitment
And proceeding on, when analysing the
effectiveness of the ‘Teacher Training and
Recruitment’, Ministry of Education statistics show
that majority of the teachers had participated in the
Ten Day Teacher Training from the year 2009-2012.
Table 2 – Number of Ten Day Trainings held all around
the Island
Source: Ministry of Education statistics, 2014
Thus, according to the above table, it is evident that
the execution of the Ten Day Teacher Training had
been a success. This is further proven from the
information gathered through the questionnaire as
100% of the sample had participated in the Ten Day
Teacher Training during the years 2009-2012.
And according to the Ministry of Education statistics
a special training sessions are provided to National
College of Education (NCOE) trainee teachers. Thus
these trainings ensure the training is continuously
provided to all the teachers around the island.
Table 3 – Number of Teacher Trainings held in NCOEs in
2013
Source: Ministry of Education statistics, 2014
All in all, the training of the Master Trainers
followed by the Ten Day Teacher Training
programme managed to lay the foundation to the
implementation of the National Plan as these steps
resolved the problem of lack of human resources to
a greater extent. And the Training Programme
contributed vastly to the upliftment of English
language as it trained the teachers to improve the
oral skills of the student.
However, it is observed that the steps taken do not
entirely solve the problems because according to
the findings made it is evident that when it comes
to the proper distribution of these resources there
are many factors which had prevented that. For
example, the study conducted revealed that even
today; there are schools without any English
teachers. And it was rather applauding to know that
this applied to urban schools such as Colombo
schools as well.
The study conducted revealed that there are
various issues which caused hindrances in proper
distribution of teachers. For example, there are
many reputed schools in the Island which have
more than the required number of English teachers
(per school). While on the other hand there are
schools which do not even have one teacher.
2013
NCOE Number of Trainings
held
Jaffna 2
Uva 1
Pasdunrata 3
Nilwala 5
Peradeniya 4
Siyane 5
Mahaweli 5
Ruwanpura 5
Province
No. of
Teachers
Total Progress 2009-2012
Trainings
held
Trained %
Western 4980 129 4613 90%
Central 3180 100 3639 108%
Southern 3278 90 3180 93%
North
Western
2856 84 3263 112%
Uva 1532 57 1865 109%
North
Central
1159 40 1293 109%
Sabaraga
muwa
1921 64 2295 112%
Northern 810 32 1144 141%
Eastern 1519 40 1394 92%
TOTAL 21235 636 22686 107%
127
According to the observations made, political
influence, reputation of the school, benefits
available can be identified as the deciding factors of
the issue of distribution of teachers. And this has a
negative impact upon the effectiveness of the plan
because even though there is a high success rate in
Ten Day Teacher Training programmes the skills
gained through are not properly utilized. Thus, the
potential of the programme is impacted.
However despite the said drawbacks the
programme finally achieved the Human resources
they intended and then moved on to ‘Restructure
the language course’.
C. Restructure the language course
A separate period for Life Skills was introduced to
the school system of Grade 6-13 under the
Trilingual Plan. According to the questionnaires
distributed among the Western Province school
teachers and with the observations made by the
interviews conducted for the ISAs it was found that
the period though allocated in the school
timetables has few issues in execution.
Although a separate period is allocated it is not
included or tested in the exams. And also given the
various other implementations introduced after Life
skills programme such as the School Based
Assessments (SBA) focused upon the Results
upliftment in schools, teachers find it hard to
contribute their time and energy upon the Life Skills
period. Therefore, the proper attention that should
have been given to the Life Skills programmes is not
given thus, affecting the quality of the programme.
And although these programmes relate to
improving English language, it is not necessarily part
of Life Skill Programme. Rather they are part of the
school syllabi. In such a situation it can be seen that
there are conflicts between adhering to the goals in
the Life Skills programme and the goals in the
school syllabi. And given the exam-oriented school
system in Sri Lanka most of the time more weight is
given to the syllabi thus, affecting the
implementation of the National plan.
Apart from this complication, the questionnaires
also revealed that the teachers faced difficulties in
managing the classroom during the Life Skills
period. The Life Skill period which is especially
designed to enhance the English oral skills of the
student, expects the student’s active participation.
And many of the teachers who participated in the
questionnaire revealed that they find it difficult to
manage the classroom at certain times given the
limited space available in the classroom and the
loud noise of the students. A few teachers
explained how certain students still lack the
necessary courage to use English oral abilities in the
class. Apart from these reasons lack of proper
resources too seem to be an issue. The
questionnaires revealed that still there are schools
which have not got all the resources granted for the
Life Skills programme. Thus, activities which require
usage of the mentioned resources are hindered.
Another step introduced under the restructuring of
the language course is to introduce a separate new
teacher guide for Life Skills, promoting vocal
English. This teacher guide assisted the teacher to
monitor the progress of the students while
recommending the activities to be followed in the
class. The questionnaires provided revealed that
100% of the sample had obtained the Teacher
Guide thus, indicating that implementation of the
restructuring of language course is successful in that
aspect.
D. New textbooks, activities and materials
Now the discussion will shift towards the logistical
aspects of the project. Having restructured the
language courses the next aim of the programme
was to provide the necessary logistics to acquire the
full potential of the plan. Accordingly, the new
textbooks, activities and materials introduced were
to achieve this purpose. As mentioned in Table 1
under this category several new steps were
introduced which were designed to enhance the
oral English skills of the students.
All the materials are planned in such a manner that
the student even in the absence of guidance of a
teacher would be able to learn and practice English
oral skills. Especially, distribution of Toolbox of
activities which was introduced in 2013 and the
distribution of Activity book with Listening CDs for
Grade 6-9 students are rather commendable
approaches because they are designed specially to
cater to students in the absentia of the teacher. As
mentioned above, given the lack of teachers in
some schools these steps could have been rather
useful. But the lack of student enthusiasm, lack of
proper English language foundation, etc these steps
fail to fulfil the intended objectives.
Another step taken to achieve the goals of this
programme is the establishment of English Activity
128
Rooms. According to Ministry of Education, the
English Activity Rooms will contain Rs.300, 000
worth equipment such as Computers, Multimedia
facilities and DVD players. This step would
ultimately assist in resolving the issue of lack of
visual aids in teaching. Because as observed through
the questionnaires lack of visual aids had an impact
in classroom activities. Ministry of Education
expects to establish one Activity Room per one
division and accordingly has managed to establish
308 in 2011 and another 27 by the year 2013.
TESS (The English Speaking School) programme,
which marks a new English Teaching and testing
initiative for Sri Lankan school system, was officially
launched in March, 2014 and it is one of the newest
steps taken to implement the National Plan. The
programme was piloted in the Prince and Princess
of Wales Colleges, Moratuwa and the Mahinda
Rajapaksha College, Pitipana, Homagama. This
initiative thus laid the foundation to establish
language labs in Sri Lankan schools.
Also, according to Ministry of Education other than
TESS, 9 other Language labs will be established
throughout the Island covering each province. This
project is funded by the Indian government and the
Western Province language lab along with
Ruwanpura, Jaffna, Nilwala, Bingiriya Teacher
Training College language labs have already been
established. Adalachchanai and Pulathisipura
Language labs are currently under construction.
Here the aim is to achieve Language proficiency via
using technology but given the short time period
since its establishment the success of the
implementation cannot be measured without
further findings.
E. Examination Reforms
Examination reforms are another step proposed by
the National plan. And accordingly, it expects to
include oral and listening tests to the G.C.E.
Ordinary Level exam in the near future. These
reforms intend to achieve a better utilization of the
English language skills in the practical world and
thus could be rather beneficial upon
implementation in contributing towards the
upliftment of English language. Because then due to
the competitive environment more focus would be
given to improve oral English skills. And at the same
time teachers would pay more importance to Life
Skills period in schools.
However, despite the lucrative nature of the steps it
seems rather impossible to succeed due to various
issues. Although implementing this step would
mean Sri Lanka to be the only country that is testing
oral capabilities of English Language in a national
exam, in a practical sense Sri Lanka does not have
the necessary resources to conduct such an exam in
a yearly basis. The human resources, technology,
cost, etc would all be barriers that would prevent a
successful execution. Therefore this reform
particularly seems far reaching at the moment.
F. Participatory Monitoring and Evaluation
After the above steps the National plan has
suggested a participatory monitoring and evaluation
which would be accountable to the implementation
related issues. Generally, Master trainers conduct a
Participatory Monitoring and Evaluation under the
coordination of the Ministry of Education in schools
in their Zonal area. The monitoring process closely
looks for the students’ progress and accordingly
makes the evaluation.
According to the findings mentioned earlier as well
it is clear that there are certain drawbacks in the
Monitoring process conducted by the Master
Trainers. However, it should also be observed that
these drawbacks are twofold due to the fact that
not only the Master Trainers fail to conduct the
Participatory Monitoring and Evaluation, there is
also the problem of the teachers who given their
high workload, other commitments, etc often tend
to neglect the life skill activities.
However, at the end of the discussion it also ought
to be noted that the English Language performance
of the students have indeed risen since the first
implementation of the Life Skills Programme in
2009. Because the statistics show that the
performance of the English Language at the G.C.E.
Ordinary Level has shown an upwards trend in the
recent years. The pass percentage of English
Language was 30.6% in 2008 and it has risen to
44.57% in 2011.
III. CONCLUSION
This study was conducted in order to understand
the effectiveness of the implementation of the
Trilingual Plan in light of English language teaching
and learning, especially in school level. The study
was based upon the hypothesis that given the
potential of the Ten Year National Plan for a
Trilingual Sri Lanka (in relation to English language
129
teaching and learning at schools), the Plan could
bring out a positive outcome in the end and it
would be a rather effective promotion of
trilingualism in Sri Lanka.
However through the findings made during the
study, hypothesis stands to be false to a greater
extent. Although initially the plan had immense
potential in its policies, the findings show that two
years after implementation majority of the
programmes introduced seem to be either
inefficient or malfunctioned. When analysing these
inefficiencies in depth it pointed towards the roles
of various resource persons in making the
implementation a success. Accordingly, through the
data collected it is quite evident that the
Presidential Task Force under the supervision of Dr
Sunimal Fernando and the Ministry of Education
carried out their roles as the main executors of the
National plan in quite a commendable manner. The
vision they foresaw was to promote English as a life
skill focusing on the upliftment of English language
for its utility value. And the policies they planned
and executed were implemented to fulfil this vision.
The implementation was quite effective at this
stage. The executors were focused upon the
upliftment process and the Trilingual plan had the
government support and blessings. All of these
factors combined with the huge budget dedicated
for the cause raised the expectation level of the
project.
However, the next stages of implementation were
rather problematic. The policies introduced by the
Presidential Task Force along with the support of
the Ministry of Education were then passed onto
the Directors of Education in each province and
then to Zonal Directors for further
implementations. And then ISA, RECS officers and
Master Trainers took over from that point onwards
and they guided and monitored teachers to finally
deliver the lessons to the students. And although
majority of the policies were implemented during
the whole process, there were more powerful
factors which hindered the implementation
process. Unequal resource distributions, lack of
human resources, social and political factors
affecting the smooth running of the process are few
examples of such complications.
Thus, in concluding, this study revealed that the
Trilingual Policy is failing to achieve the intended
outcome at the end of the Stage I of the
programme (in relation to school level English
language) due to various challenges and drawbacks
occurred during the implementation process. And
these challenges and drawbacks prevent the
Trilingual Policy from gaining its full potential by
having a negative impact upon its effectiveness.
A. Recommendations
The suggested recommendations aim to cure the
challenges and drawbacks faced during the
implementation of the Stage I.
1) Coordination: A better coordination between the
resource persons at various stages of
implementation could provide better results. The
study revealed that in certain instances lack of
coordination was an issue. Various methods being
implemented into the school system often tend to
impact the effectiveness of the methods
implemented till then. But if they are properly
coordinated the results could be better.
2) Oral exams: As mentioned competitive exams
continue to be a part of the Sri Lankan education
system and therefore all (ISA, RECS Officers, Master
Trainers, teachers, students, etc) are focused upon
the results upliftment. However in the long run it is
often seen that having this technical knowledge is
rather worthless when compared with the utility
knowledge. Therefore a balance should be
achieved. And thus having oral exams could be a
good solution because that would create the
necessary buzz that is needed to promote English
oral skills.
3) Classroom Structure: The questionnaires
provided revealed that majority of the teachers
were not satisfied with the classroom environment
when conducting the Life Skills period. According to
them the issues such as loud noise, limited space,
and lack of resources affect the effectiveness of the
Trilingual policy. Therefore, few adjustments in the
classroom structure could be helpful.
These are few recommendations which can be
implemented to increase the effectiveness of the
Trilingual Plan.
ACKNOWLEDGMENT
I would like to express my appreciation to Mr.
Mahesh Hapugoda for his valuable and constructive
suggestions during the planning and development
of this research work. I would also like to thank
Dr.Sunimal Fernando and the members of Ministry
130
of Education who assisted me in collecting data. I
also express my gratitude to all the teachers, ISAs,
RESC officers who participated in the survey
conducted. Last but not the least, I express my
sincere gratitude to my family and friends because
completing this work would have been all the more
difficult were it not for the support and friendship
provided by them.
REFERENCES
BOOK
Mukerjee, J. (2012). English in South Asia-
Ambinormative Orientations and the Role of
Corpora: The State of Debate in Sri Lanka.1st
ed. Springer.
WEB PAGE
Amarasinghe, U. (2011). Trilingual Sri Lanka. Business
Today, [Online]. Available at:
http://businesstoday.lk/cover_page.php?articl
e=3273 [Last Accessed 05th
April 2014].
Kahandawaarachchi, T. (2009). English as a Life Skill-
Presidential Initiative- Taking English to the
Masses. Business Today, [Online]. Available
at:
http://www.businesstoday.lk/cover_page.php
?article=255&issue=198 . [Last accessed 12th
April 2014].
Meyler, M. (2010). Sri Lankan English: the state of the
debate. [Online] Available at:
http://groundviews.org/2010/04/27/sri-
lankan-english-the-state-of-the-debate/. [Last
Accessed April 5, 2014].
INTERVIEWS
Fernando, S. (2014). The Ten Year National Plan for a
Trilingual Sri Lanka in relation to the Role of
English.
Nanayakkara, P. (2014). How the Ministry of Education
contributes to the implementation of the Ten
Year National Plan for a Trilingual Sri Lanka in
relation to the role of English in school
education
GOVERNMENT PUBLICATION
Presidents Office, (2012). Ten Year National Plan for a
Trilingual Plan.
BIOGRAPHY OF AUTHOR
Author is a LLB graduate of University
of London, United Kingdom. She is
currently involved in her final year
studies of BA (Languages) at
Sabaragamuwa University of Sri Lanka.
She is also sitting for her Attorney-at-
Law exams. Her research interests include Education,
Modern Languages, Literature and International
Relations.
131
Stakeholder needs in English for Legal Purposes (ELP) for Sri Lankan Undergraduates
1CJ Kothalawala, 2 TD Kothalawala, 3RMCLK Rathnayaka
Faculty of Management, Social Sciences and Humanities, General Sir John Kotelawala Defence University [email protected],
Abstract— Studies on needs analysis in English for
Specific Purposes (ESP) have focused their attention
on identifying contradictory stakeholder needs. This
study is aimed at identifying needs of stakeholders
with regard to the preferred content of an English
for Legal Purposes Course (ELP) for Sri Lankan law
undergraduates. Needs of 104 stakeholders in two
university English courses (i.e. law undergraduates,
law lecturers, English lecturers, Heads of
Departments of Law and a Course Coordinator and
lawyers) were collected using questionnaires and
semi-structured interviews. Stakeholder needs were
identified in terms of necessary language skills
required in both learning and target situations. The
mean values of the law undergraduates’ responses
were calculated, and in order to measure whether
there is a significant difference in the mean values
of the undergraduates of each academic year One
Way ANOVA tests were carried out. Further, data
collected from open-ended items of the
questionnaire and semi-structured interviews were
analysed qualitatively by grouping related responses
and identifying patterns of stakeholders’ responses.
The results of this stakeholder needs analysis
include necessary language skills, preferred
activities and non-linguistic needs such as teaching
methodology, materials and assessment. This study
would provide an empirical basis for curriculum
planning for an ELP course and a foundation for
tailor-made language course for Sri Lankan law
undergraduates.
Keywords—stakeholders, needs analysis, linguistic
needs
I. INTRODUCTION
Needs analysis is a central device in curriculum
development in English for Specific Purposes (ESP).
It consists of the language performance of learners
in both productive and receptive skills to set course
goals. The views of stakeholders such as students,
teachers, heads of departments etc. are considered
important in identifying both linguistic and non-
linguistic needs of learners. The rapid evolvement of
needs analyses in the field of ESP has brought new
models which analyze a wide range of social issues
that affect a language teaching programme. In that
regard, characteristics of the environment in which
the courses are conducted and views of
stakeholders are considered as important factors in
current models of needs analysis. Stakeholders at
different levels, their power relations and how they
influence teaching and learning have been one of
the latest interests in needs analysis of ESP.
Though many Sri Lankan universities have made
undergraduate degree programmes more
vocationally oriented, there is no required expertise
to fulfil the needs of English for Specific Purposes
(Wickramasingha, 2009). Legal study programmes
have been conducted by many higher educational
institutions and universities in Sri Lanka since 1980s.
However, English for Legal Purposes (ELP) has not
been studied extensively by researchers in the Sri
Lankan context. In addition, there is a need to
develop teaching materials in ELP that fulfil both
learning and target needs of Sri Lankan law
undergraduates. Further, there are no published
studies on identifying stakeholder needs of ELP in
Sri Lanka. Therefore, this study aimed at identifying
specific English language requirements of law
undergraduates, perceived as important by
different stakeholders.
II. LITERATURE REVIEW
Recent studies on needs analysis needs i.e. Jass-
Aguilar (1999); Long, (2005); Cheng (2011); Belcher
&Lukkarila ( 2011); Paltridge & Starfield (2013) have
focused their attention on critically-aware
quantitative research that encourages awareness of
a need for a critically pragmatic ESP which discusses
contradictory stakeholder. Huhta, Vogt &Ulkki
(2013) argue that “a needs analysis for ESP should
be evidence-based where the evidence is supported
by ‘a thick description’ of the professional
workplace or training institution or one which
attempts to unpack the multiple factors that
collectively determine a more accurate
understanding of the context”. Benesch’s right
analysis (2001) is a radical departure from
132
conventional needs analysis which claims that each
academic institution offers its own opportunities for
negotiation and the reconciliation of different
stakeholder needs for a better language
programme.
Byleen and Altman (2007) consider stakeholder
needs analysis as “the collective experience and
wisdom” (cited in Rice, 2007). Similarly, Rawley and
Romer (2007) consider the importance of
collaboration of different perspectives of
stakeholders. Johns and Makalela (2012) describe
tensions and conflicts that occurred in the needs
analysis process carried out in a university of South
Africa as there were mismatch between the needs
of teachers and learners (cited in Carter-Thomas,
2012). Similarly, Cumaranatunge (1988) collected
data from multiple stakeholders with the use of
questionnaires, semi-structured interviews, field
study, informal interviews and participant
observation in order to design a learner-cantered
course that caters to Sri Lankan domestic aids in
West Asia (cited in Jasso- Aguilar 1999). The results
include the language used in the job, problems and
pressures faced by domestic aids in their job.
Amongst few researchers on stakeholder needs
analysis for English for Legal Purposes, Ahmad
(2009) studied the perception of judges in Pakistan
with reference to the linguistic adequacy of fresh
law graduates and their deficiencies of Legal
English.
A Hypothesis
It is important to identify needs of stakeholders
with regard to a preferred content of an ELP course
that includes both learning and target needs of law
undergraduates.
B Research Problem
What learning and target needs do stakeholders
perceive as important when designing English for
Legal Purposes course for law undergraduates?
III. METHODOLOGY
This survey research is based on obtaining the
needs of stakeholders who have a direct and
indirect influence of the selected two English
language programmes in two Sri Lankan
universities. A major difference of the two English
programmes include the fact that the English
programme in University A focuses on enhancing
learners’ all four skills of English as well as
vocabulary and grammar whereas the programme
in University B does not include activities to
improve speaking and listening skills. Unlike the
programme in University A, the programme in
University B is one credit course that offers a
certificate.
A. Sample Population of Stakeholders:
This study includes a sample of 104 stakeholders
who have a direct and indirect influence on the
selected English language teaching programmes: 2
Heads of Departments of law, 1 course coordinator
at the Department of Languages of University B, 12
law lecturers from both universities, 10 English
lecturers and instructors from both universities, 75
law undergraduates (35 from each university), and
four lawyers. Purposive sampling technique was
used to select stakeholders who were typical,
suitable and convenient to select. In order to have
the comprehensiveness of the sample, insiders from
two leading universities were selected.
B. Research Instruments:
A questionnaire and semi- structured interviews
were used to elicit factual, behavioural and
attitudinal data of the stakeholders. The
questionnaire was used with law undergraduates
and it included a range of topics such as necessities,
learning and target needs. The questionnaire for
law undergraduates was administrated to an
assembled group of undergraduates. The response
rate of the questionnaire was high as it was group
administrated face-to-face. Apart from that, semi-
structured interviews were conducted with law
lecturers, English instructors, the Heads,
Departments of Law, course Coordinators of English
language programme in University B, and the
lawyers.
C. Methods of Data Analysis
The mean values of the law undergraduates’
responses collected from questionnaires were
calculated and analyzed using the following decision
criteria.
Table 1: Decision Criteria
Mean Value Decision
Between 1-2.33 Low degree of preference
Between 2.34- 3.66 Moderate degree of
preference
Between 3.67-5 High degree of preference
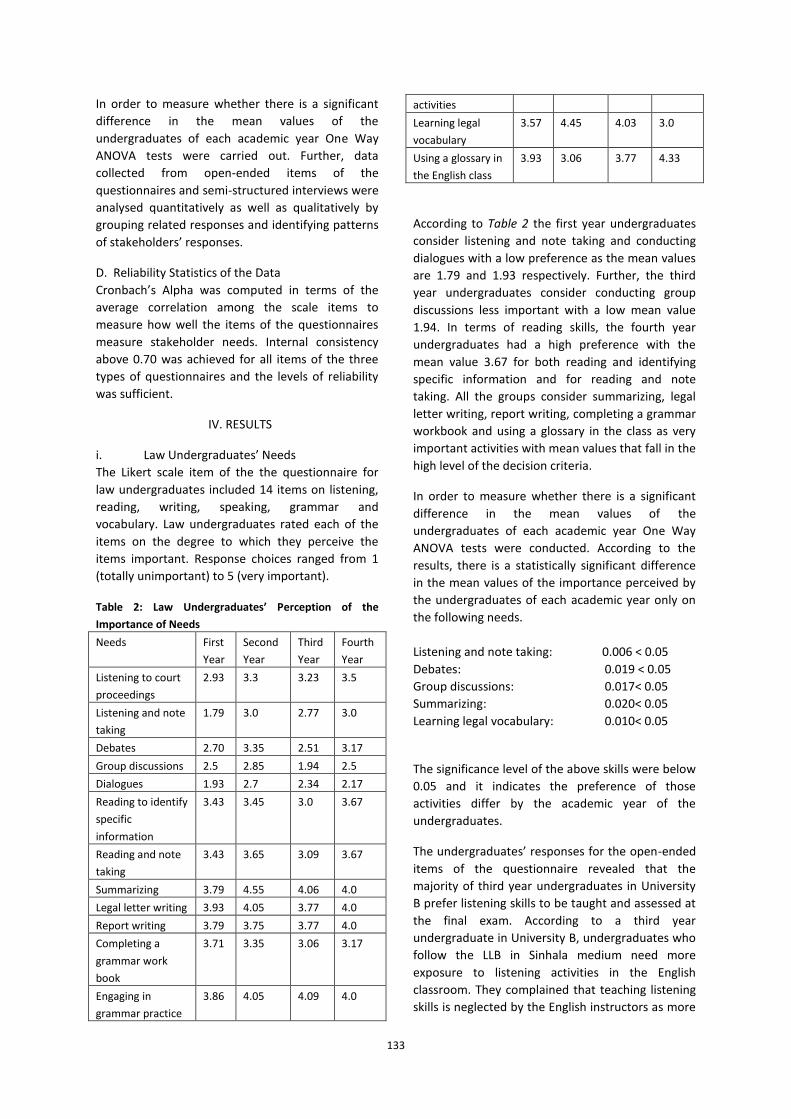
133
In order to measure whether there is a significant
difference in the mean values of the
undergraduates of each academic year One Way
ANOVA tests were carried out. Further, data
collected from open-ended items of the
questionnaires and semi-structured interviews were
analysed quantitatively as well as qualitatively by
grouping related responses and identifying patterns
of stakeholders’ responses.
D. Reliability Statistics of the Data
Cronbach’s Alpha was computed in terms of the
average correlation among the scale items to
measure how well the items of the questionnaires
measure stakeholder needs. Internal consistency
above 0.70 was achieved for all items of the three
types of questionnaires and the levels of reliability
was sufficient.
IV. RESULTS
i. Law Undergraduates’ Needs
The Likert scale item of the the questionnaire for
law undergraduates included 14 items on listening,
reading, writing, speaking, grammar and
vocabulary. Law undergraduates rated each of the
items on the degree to which they perceive the
items important. Response choices ranged from 1
(totally unimportant) to 5 (very important).
Table 2: Law Undergraduates’ Perception of the
Importance of Needs
Needs First
Year
Second
Year
Third
Year
Fourth
Year
Listening to court
proceedings
2.93 3.3 3.23 3.5
Listening and note
taking
1.79 3.0 2.77 3.0
Debates 2.70 3.35 2.51 3.17
Group discussions 2.5 2.85 1.94 2.5
Dialogues 1.93 2.7 2.34 2.17
Reading to identify
specific
information
3.43 3.45 3.0 3.67
Reading and note
taking
3.43 3.65 3.09 3.67
Summarizing 3.79 4.55 4.06 4.0
Legal letter writing 3.93 4.05 3.77 4.0
Report writing 3.79 3.75 3.77 4.0
Completing a
grammar work
book
3.71 3.35 3.06 3.17
Engaging in
grammar practice
3.86 4.05 4.09 4.0
activities
Learning legal
vocabulary
3.57 4.45 4.03 3.0
Using a glossary in
the English class
3.93 3.06 3.77 4.33
According to Table 2 the first year undergraduates
consider listening and note taking and conducting
dialogues with a low preference as the mean values
are 1.79 and 1.93 respectively. Further, the third
year undergraduates consider conducting group
discussions less important with a low mean value
1.94. In terms of reading skills, the fourth year
undergraduates had a high preference with the
mean value 3.67 for both reading and identifying
specific information and for reading and note
taking. All the groups consider summarizing, legal
letter writing, report writing, completing a grammar
workbook and using a glossary in the class as very
important activities with mean values that fall in the
high level of the decision criteria.
In order to measure whether there is a significant
difference in the mean values of the
undergraduates of each academic year One Way
ANOVA tests were conducted. According to the
results, there is a statistically significant difference
in the mean values of the importance perceived by
the undergraduates of each academic year only on
the following needs.
Listening and note taking: 0.006 < 0.05
Debates: 0.019 < 0.05
Group discussions: 0.017< 0.05
Summarizing: 0.020< 0.05
Learning legal vocabulary: 0.010< 0.05
The significance level of the above skills were below
0.05 and it indicates the preference of those
activities differ by the academic year of the
undergraduates.
The undergraduates’ responses for the open-ended
items of the questionnaire revealed that the
majority of third year undergraduates in University
B prefer listening skills to be taught and assessed at
the final exam. According to a third year
undergraduate in University B, undergraduates who
follow the LLB in Sinhala medium need more
exposure to listening activities in the English
classroom. They complained that teaching listening
skills is neglected by the English instructors as more

134
attention is paid on teaching reading and writing. In
addition, the majority of law undergraduates in
both universities mentioned that there is no
adequate audio-visual equipment to practice
listening skills. According to some undergraduates
in University A, the language laboratory could be
effectively used in specific time slots allocated for
listening.
Few undergraduates needed exposure to different
accents of English used in other countries. “I
suggest including more activities to improve
listening skills specially to understand the accents
used by foreigners” (A second year female
undergraduate, University A). “Provide exposure to
English outside Sri Lanka” ( A second year male
undergraduate, University A). The undergraduates’
responses for the open-ended items of the
questionnaire included that the fourth year
undergraduates prefer classroom practices and
assessments not restricted to reading and writing.
They preferred speaking skills to be assessed. “It
must not be a reading and writing skill class. It must
be a practical class”. Also, the majority of law
undergraduates in both universities need a separate
time slot for speaking activities. According to the
study conducted by Evans and Morrisons (2010),
the 28 first year undergraduates of their study
lacked confidence in their ability to communicate
clearly, fluently and accurately in English. Similar to
their study, the findings of this study depicted that
few of the first year undergraduates dislike
speaking activities due to the nervousness they feel
in public speaking.
“I am afraid of going in front of the class and
perform” (A first year female undergraduate in
University A).
“I am already a graduate. But still English is very
stranger for me. I hesitate to speak English among
friends. But I like very much speak English. I want to
be a very good knowledgeable person and talented
person by using English. Please get two hours class
in every weekend.”(A third year male
undergraduate in University B).
The majority of law undergraduates in University B
mentioned that the speaking activities are
inadequate. It is identified that all undergraduates
did not mention any negative criticism on reading
activities in responses to questionnaire. Some
undergraduates in University A preferred if they had
activities on reading legal cases and writing
analyses.
The undergraduates’ responses to questionnaires
depicted that some of them wish if they were given
model documents of legal genres for writing
activities. The majority of the third year
undergraduates in University B liked the legal letter
writing activities of their programme. Some second
year undergraduates of University A requested
more grammar practice activities.
“Though we practice grammar exercise from little
age, it is not that much familiar to us. Always there
will be some sort of grammar errors. So I prefer to
have a better way to learn grammar in class” (A
second year male undergraduate of University B).
In response to the open-ended questions, the
majority of undergraduates in University A
mentioned that they lack a sound knowledge of
legal vocabulary and it prevented them
comprehending legal text fully.
“I need to improve my legal vocabulary to perform
well in legal studies. It will help me in future to
perform legal documentation well.”
ii. Other Stakeholders’ Views on Needs
According to the Course Coordinator of the English
Programme in University B, the teaching materials
of the Program were designed many years ago by
the senior personnel consulting professors, and the
revisions to the curriculum had not been done in
the recent years. The course coordinator casually
informs the instructors about new activities to be
incorporated in to the existing curriculum. It is also
mentioned that listening and speaking skills are not
taught or evaluated in the Programme as it is based
on English for Academic Purposes.
“I would like to incorporate audio visual materials
into our programme, and revise the reading
materials”.
Further, according to the Course Coordinator of
University B, some teachers use a glossary of legal
vocabulary though it is not a prescribed book for
the course.
According to some law lecturers in University B
were critical of the teaching methodology used in
the English programme.

135
“The common complaint that undergraduates make
is that English lecturers are old and inactive in
teaching, so law undergraduates disliked attending
the classes”.
Similarly, some law lecturers in University A wanted
English instructors to make teaching effective and
interesting. According to the Head, Department of
Law in University B, the instructors in the English
programme have been unable to attract the law
undergraduates to the program as most of the
teachers in the programme are old instructors and
mostly retired school teachers. According to him,
undergraduates expect new audio-visual devices to
learn English as used in countries like Japan. New
technologies such as language laboratories should
be used by the instructors. According to the
responses of the lawyers the way lessons are
presented to ‘young’ undergraduates is a major
weakness of the English language programmes. In
that regard, new methodologies in teaching English
should have to be used by the instructors to
facilitate learning. Extra resources should be
included in the English language programme to
prepare undergraduates for a career in law.
According to the Course Coordinator of the English
programme in University B, the instructors are not
trained to teach Legal English. There are no
workshops conducted, and they are casually
instructed on how to teach. Since most instructors
have been trained to teach General English, there is
a teacher training programme conducted by the
Department. Any new teacher is trained at the
beginning in a legal writing workshop in which they
are informed on how to teach, nature of materials
and assessment criteria. On the other hand, data
collected from majority of English instructors
showed that they need specific training to teach
Legal English, provided by universities.
A. Learning Environment and Learners’ Motivation:
According to the Course Coordinator of English in
University B, since the English classes are held in a
school away from the university, the
undergraduates are reluctant to attend the classes.
“Most of the elder undergraduates such as
attorneys-at-law, officers of the Tri-Services and the
Parliament do not attend the English classes held at
a school outside the University premises”. One
undergraduate mentioned that “We don’t mind
studying in a shed within the university itself, we
don’t like to go to a school to study English.”
Undergraduates’ attendance in the English
programme in University B is very poor since
attending the English classes is not compulsory.
Though obtaining the certificate is a must,
undergraduates do not consider the programme
seriously. Therefore, many undergraduates do not
get the certificate. As the lecturer comments “What
I suggest to solve this problem is that at the
orientation programme law undergraduates should
be properly informed about the value of obtaining
the certificate.” The certificate is recognized by the
Law College of Sri Lanka when graduates are
enlisted for the final examination, which is a
requirement of all the graduates if they want to be
a law practitioner. However, many undergraduates
in University B do not read and understand the
course guide book, which is in English. Thus, law
undergraduates should be thoroughly instructed by
the relevant administrative staff members of the
university at the orientation itself.
C. Lack of Stakeholder Collaboration:
Though the idea of stakeholder collaboration in ESP
situations emerged in Western countries many
decades ago, still there is no collaboration in most
of ESP settings in the Sri Lankan universities. It has
made a negative impact on both teaching and
learning in the two universities.
The lack of cooperation and attentive listening to
each others’ requirements hampers teaching and
learning in the universities. Though both parties are
aware of the responsibilities of developing
undergraduates’ skills, no one seems interested in
minimizing the prevailing problems in the English
language teaching programmes in both universities.
In analyzing the contacts between the departments
selected in this study, it is noted that there are no
formal contacts of law lecturers with English
instructors in the Departments of Languages of both
universities to discuss matters pertaining to English
language skills of law undergraduates. There were
few instances when lecturers casually asked what
sort of topics that they would select when preparing
materials for reading comprehension. Sometimes,
they wanted to know the exact meaning of legal
jargons. There were no other forms of official
meetings held by the members of the two
departments.
According to the Head, Department of Legal
Studies, he meets the Course Coordinator of the
English programme occasionally- “only at the
136
examination centre”. Also, both departments do
not have official contacts and meetings to discuss
matters related to English language needs of law
undergraduates. The only mode of communication
is when teaching materials are prepared, law
lecturers have been contacted casually to get
clarifications of the difficult areas of the legal texts.
There should be cooperation between the
Departments of Law and the Departments of
Languages. The Head of the Department, University
B suggested that there should be cooperation
between the three main stakeholders:
undergraduates, lecturers in law and English
instructors. The English language programme
should not be isolated from the legal studies
programmes. It is important to link law degrees
with English language programme.
V. CONCLUSION
The results of this study are of two types. First,
stakeholder needs are seen in terms of language
that the law undergraduates have to use in a
particular communication situation. And the second
is a wide range of affective and cognitive variables
such as learners’ attitudes, motivation, awareness,
personality, wants, expectations and learning styles
which affect learning. The needs collected are
presented as skills, activities, methods, materials
used, assessment, time allocation, classroom
environment, equipment needed and stakeholder
collaboration. The results showed that majority of
stakeholders in this study perceived that law
undergraduates’ do not have proficiency in basic
English language skills. Therefore, it is utmost
important to uplift their standards with tailored fit
instructions in Legal English.
This study presents some controversial issues in
teaching English for Specific Purposes such as
collaboration of stakeholders in Sri Lanka. Besides,
this study provides insights into the possibilities of
stakeholder collaboration in Legal English
programmes at university level. The results of this
study show what needs to be included in the ELP
curriculum to meet the specific linguistic and
pragmatic needs of law undergraduates. The English
instructors should work in collaboration with
subject specialists in order to provide opportunities
for learners to engage in relevant communicative
activities which are authentic.
The data collection was limited only to the
stakeholders in two universities. However
generalizing the results of this survey is not limited
as it included a large number of stakeholders and
law undergraduates of two leading universities of
Sri Lanka.The future stakeholder needs analyses
should identify behaviour, interests, interactions,
influence and resources that each stakeholder
brings in order to design successful ELP courses in
Sri Lankan universities.
ACKNOWLEDGMENT
We would like to thank to Ms. KRM De Silva and
Prof. Nevil Warnakulasooriya for their guidance and
prompt feedback. Our thanks are due to Mr. WS
Wijesinhe, Mr. W M Amaradasa, Mr. Raja
Goonarathne, Ms. Sandya Hewameealla, Ms. Niluka
Damayanthi and Ms. KGSA Wijesinghe for their
support. Thanks are to all those who helped us in
any respect during the completion of this study.
REFERENCES
Ahmad, N. (2009). Judges Perception with
Reference to Linguistic Adequacy of
Lawyers. Pakistan Journal of Social Sciences
(PJSS), Vol 29(1).Ahmad, N. (2009).
<http://eprints.hec.gov.pk/2591/>Legal
English: A Case for ESP. PhD Thesis.Accessed
4 January.2013.
Benesch, S. (1999). Rights Analysis: Studying Power
Relations in an Academic Setting. English
for Specific Purposes,vol.18, (4).
Benesch, S. (2001). Critical English for Academic
Purposes: Theory, Politics and
Practice. Mahwah, NJ: Lawrence
Erlbaum.
Carter-Thomas, S. (2012). Review on New direction
in English for Specific Purposes
Research.
D. Belcher, A.M. Johns & B. Partridge(Eds.), English
for Specific Purposes. Vol 31,213-
230. Ann Arbor: University of Michigan
Press.
Dudley- Evans, T., & St. John, M.J. (1998).
Developments in ESP: A Multidisciplinary
Approach. Cambridge, England:
Cambridge University Press.
137
Evans, S & Morrisons, B .(2010). The First Term at
University: Implications for EAP.ELT Journal,
65(4).Oxford University Press.
Flowerdew, J., & Peacock, M. (2001). Issues in EAP:
A Piliminary Perspective.
Flowerdew, J & Peacock, M (Eds.), Research
Perspectives on English for Academic
Purposes. Cambridge, England:
Cambridge University Press.
John, M. (1978). Communicative Syllabus Design.
Cambridge, England: Cambridge
University Press.
Johns, A. M., & Dudley-Evans, T. (1991). English for
Specific Purposes: International in Scope,
Specific in Purpose. In S. Silberstein, (Ed.),
Celebrating 25 Years of the Discipline TESOL
Quarterly, 25, (pp 297–314). Illinois:
Pantagraph Printing.
Johns, M. A & Price-Machado, D. (2001). English for
Specific Purposes: Tailoring Courses to
Student Needs-and to the Outside World
in M. Celce- Muraria (Ed.), Teaching
English as a Second or Foreign
Language. Boston: Heinle & Heinle.
Mackay, R. & Mountford, A. (1978). What is Special
about ESP. English for Specific
Purposes (pp 106). London: Longman.
Rice, A. (Ed). (2007). Revitalizing an Established
Programme for Adult Learners. In K.
Graves (ED.), TESOL Language
Curriculum Series. Maryland: Capital
Communication Systems Inc.
Raheem ,R. Madawattegedara, V and Miththapala,
G.(2009).International Language
Performance and Local Performance:
the Case of the Post Graduate
Institute of English. OUSL Journal,
4, 3-16.
Wickramasingha,(2009).<http://www.kln.ac.lk/uok
r/ASAIHL/SubThemeC1.pdf>Rejuvenating
and Restructuring the Discipline of
English Studies in Sri Lanka: A Concept
Paper in Sub Theme C-Class for Non-
Professional Faculties. Accessed 16June
2013.
BIOGRAPHY OF AUTHORS
Chamila Kothalawala is a lecturer in
English at the Department of Languages
of General Sir John Kotelawala Defence
University, Sri Lanka. Her recent
research interests include curriculum
development and English for specific purposes.
Thamara Kothalawala is a lecturer of
English at the Department of Languages
of General Sir John Kotelawala Defence
University,Sri Lanka. Her research
interests include testing and evaluation
and material development.
Chathurani Rathnayaka is a lecturer in at
the Department of Management and
Finance of General Sir John Kotelawala
Defence University, Sri Lanka.
138
The Contribution of Caregivers in Christian and Buddhist Preschools in Respect of Early Childhood Care in Sri Lanka
KV Sudarma Harischandra
Principal, Depanama Dharmapala Vidyalaya. Pannipitiya
Abstract- Early childhood is considered as the most
important and decisive period in forming the
foundation of the holistic development of one’s
personal life. The type of ones future personality
depends on how he or she brought up during this
period. This study has been planned to be
conducted under three objectives. They were 1.
Investigating the need for early childhood care and
factors that fluency such care. 2. investigating the
contributors of in early childhood care development.
3. investigating the different among contribution of
caregivers Buddhist, Christian Preschools in respect
of strategies in early child care. The data was
obtained through: Visits and observations ,
Interviews , Study of documents conducted 32 early
childhood centers in Negombo and the
Maharagama area. ( Negambo- Christian 16,
Maharagama, Pannipitiya- Buddhist-16. (n=32). And
they were analyzed qualitative methods. In
Christian preschools, the guiding principle was that
each child was a precious gift of God. This belief
resulted in a play oriented curriculum that
maximized the choices available to children.
Teachers also attempted to encourage children’s
creativity and their ability to formulate thoughts
and express them to others. The Buddhist schools
were among the largest of any schools, some had
over 600 pupils. If the present economic
uncertainties continue, these schools will likely
continue to be a very appealing method for parents
interested in giving their children a head start in
school. Yet, in spite of factors that work to blur the
distinct philosophical contribution of the various
religions, researcher has seen concrete ways in
which the ideologies of Christianity and Buddhism
continue to influence Sri Lankan preschools. In the
past decade, researchers and policy experts have
been grappling with the feasibility of a global
definition of child care quality that could be applied
across all institutions in any community across the
country. The elements of "appropriate practice"
have been articulated by the Policy of western
province Pre School.
Key words - curriculum, Activities, preschool,
creativity
I. INTRODUCTION
Children are the foundation of sustainable
development. The early years of life are crucial not
only for individual health and physical development,
but also for cognitive and social –emotional
development. (unesco)
In the first years of life, children establish the
cognitive, emotional and social foundation upon
which they can build their futures. Early childhood is
the most significant developmental period of life. A
baby who is visually stimulated, continuously
engaged in interactive activities, hugged, cooed to
and comforted is more likely to fully develop
cognitive, language, emotional and social skills, all
of which are vital for success in school, in the
community and subsequently in life. (unesco)
children develop given the natural way life but a
certain proportion may experience delayed
development. For instance if we take a group of
children, not all of them will walk at the same age.
About 25% will walk at 11 months and another 50%
may walk at 15 months; the reason being that the
developmental phase of each child is different
across different domains. While one child’s physical
development may be manifested within the normal
range, another may show delayed language
development. What the developmental standards
aim to identify are age ranges within which children
should acquire a given skill.(Thalagala,2014)
In Sri Lanka, the attention was first focused on pre
school education with the introduction of
Kannangara’s reforms in 1943. As a result of 1972
new educational reforms, pre school education
spread widely as the age limit for school admission
was declared as 6 years. The number of pre school
in Sri Lanka 1920-05, 1940-08, 1950-09, 1960-30,
1969-35, 1970-55, 1971-98, 1972-89, 1973-61,

139
1974-63, 1975-162, 1976-271, 1977-266, 1978-380,
1979,264, (Survey of Pre school in Sri Lanka ,1979).
and the number increased to 16342 in
2009(Children Secretarial,2009). The establishment
and implementing of pre school different in Sri
Lanka. eg -A Provincial ECCD committee, with
representatives of the districts, zones, divisions,
NGOO, specialists in the field and community
representatives will assist the provincial ECCD Unit.
(Abhayadeva,2014) As well as deferent according to
religion. This paper focus that The contribution of
caregivers in Christian and Buddhist Preschools in
respect of early childhood care in Sri Lanka
Sri Lanka is one of the most religious countries in
the world, with a majority of the population
claiming affiliation with a religious group.
Buddhism, spread widely in Sri Lanka after the Rev
Mahinda Thero’s visit to Sri Lanka in 247 B.C.
Buddhism enriched the values, custom and rites,
tradition as well as education. After a colonial
period of relatively strict separation between
church and state, religious values are again
beginning to receive explicit recognition in some
public educational settings. One focus has been on
the manner in which the values inherent in the
religious doctrine are embodied in the expectations
for teachers, students, and parents, including such
issues as student comportment in and out of school,
teachers’ discipline practices, and the nature of
teachers’ communication with parents. Research in
pre schools suggests that children benefit when
parents and staff communicate with each other and
share such values as commitment to hard work and
respectful behavior toward adults(Harischandra,
2009). The literature on home schooling has also
begun to track the role of religious values in shaping
curriculum and pedagogical practices.
A studies of child care quality have included
religious affiliation as a variable, and so far the
findings have been rather contradictory. Work to
date has not closely investigated the goals and
expectations of staff at church-based schools, nor
have studies assessed aspects of children’s learning
and development that may be most relevant to the
goals of the schools. More research, particularly in
the form of qualitative investigations, is needed to
understand better, the ways in which the "rules for
living" espoused within various organizations are
instantiated in preschool organizations.
In the study reported here, a qualitative approach
was utilized to understand the goals, values, and
expectations of Sri Lanka early childhood education
programs affiliated with Christianity and Buddhism.
By talking at length with teachers of these
programs, researcher sought to understand how
their values were embodied in the practices and
curricula of the schools. These data underscore the
importance of understanding how collectively held
belief systems inform educational practice.
The system of early childhood education in Sri
Lanka is quite extensive. Over 90% of Sri Lankan
children attend at least 1 year of a licensed
preschool or child care center.(Harischandra,2009)
Public preschools are funded by private,
organization and state. but approximately 80% of
children attend private preschools, some of which
are affiliated with a religious organization
(Harischandra, 2009). Like that Temple and church.
All preschools and child care centers are subject to
oversight by the nine provincials , which develops
regulations pertaining to such issues as the
dimensions and basic facilities available and the
level of required teacher preparation. However,
preschool teachers have considerable latitude in
formulating their own programs, resulting in more
diversity in the areas of materials, activities, and
curriculum than is seen at any other stage in the Sri
Lankan educational system. Buddhism, and
Christianity, which have been intertwined with each
other for since 1972 in Sri Lanka, create a rich
tapestry of spiritual and philosophical thought that
has had a profound impact on the nature of
preschools (Harischandra,2009).
The theoretical basis of this study is located in the
literature at the intersection of anthropology and
psychology. In this literature, individuals involved
in the socialization and education of young children
are presumed to hold cultural models that guide
their actions.
Cultural models are "presupposed, taken-for-
granted models of the world that are widely shared
by members of a society and that play an enormous
role in their understanding of that world and their
behavior in frame experience, supplying
interpretations of that experience and inferences
about it, and goals for action" (Quinn & Holland,
1987, p. 10). Cultural models include beliefs or
conceptual schemas (e.g., "children should be seen
and not heard") as well as behavioral scripts (e.g.,

140
steps to take when a child acts in an aggressive
manner toward a peer) (D’Andrade, 1992; Holland,
Lachiotte, Skinner, & Cain, 1998). However, cultural
models are not necessarily associated with broad
social categories like nation or ethnicity (Kondo,
1990); they can be generated within smaller social
units as well Furthermore, for important topics like
rearing and educating children, a number of cultural
models are available in a given community. This
cultural "pool" of beliefs and practices may contain
elements that are in tension, or even in
fundamental conflict, with each other (Kojima,
1986, 1988). Within Sri Lanka preschools affiliated
with religious organizations, there may therefore be
sharply divergent models as to how human
relations should be organized and socialized in
young children.
II. METHODOLOGY
The contribution of caregivers in Christian and
Buddhist Preschools in respect of early childhood
care in Sri Lanka. This study has been planned to be
conducted under three objectives. They were 1.
Investigating the need for early childhood care and
factors that fluency such care. 2. investigating the
contributors in early childhood care development.
3. investigating the difference among contribution
of caregivers Buddhist, Christian Preschools in
respect of strategies in early child care.
A. Population and the Sample Method
Two area located in the Western province were
considered as the total population. The two area
which use Negombo and Maharagama were
considered as the target population. The Negombo -
Christian Pre schools and Maharagama,
Pannipitiya- Buddhist pre schools were selected for
the study using purposive sampling method. The
total sample included the teachers and children in
Negombo- Christian pre schools - 16, Maharagama,
Pannipitiya- Buddhist pre schools -16. (n=32).
B. Data collection methods and instruments
The data was obtained through Visits and
observations , Interviews , Study of documents.
conducted 32 early childhood centers. The visit to
each setting included an observation of
approximately 1 hour in a classroom serving early
child and an interview with the teacher and one or
more teachers. The open-ended interview, which
lasted from 1 to 3 hours, was designed to probe
cultural models regarding goals of the preschool
experience, theories about the role of the teacher
in facilitating learning, views about discipline and
control, details of the curriculum and activities, and
perceptions about the family and its relationship
with early childhood education.
The observations were used as a source of
examples to deepen these extended conversations.
All interviews were tape recorded; in addition,
detailed notes were kept during the interview.
Subsequent to the first round of data collection, a
deductive process of preliminary data analysis
occurred. Field notes and interview notes were
reviewed and analyzed using a preliminary coding
framework. Initial data displays were developed—
within-case displays were created to highlight the
key cultural models in each preschool, and cross-
case displays were used to highlight differences and
similarities across preschools . In the second round
of data collection, 4 pre schools were selected from
the pool of 32 preschools. The researcher spent at
least 5 days in each setting, observing in a pre
schools and conducting further interviews with
staff. A running record was kept during the
observations, with the focus being a description of
the teacher’s activities and utterances. And their
were analysis. A coding system was developed that
permitted sections of narrative to be tagged with
global categories such as goals, activities, teacher-
child relations, discipline, role of the parent, and
issues of individualism and group orientation.
The final stage of analysis involved a number of
activities. First, all passages associated with each of
the key codes were examined to obtain a sense of
the variation that existed within each code. Next,
the entire corpus of transcripts and field notes were
reviewed to learn how the categories fit together at
eachschool. A matrix was generated listing the
central findings pertaining to each category for each
preschool. Reactions and commentary from these
informants as well as field notes and written
material provided by the pre schools ( curriculum
guides, parent newsletters, and promotional
materials) were used to understand and
contextualize the interview data.
C. Limitations of the Study
This study is based upon a Negombo and
Maharagama. As well as there were Sinhala and
English medium. Not only that medium but also
religion. There were Christian and Buddhist.This
141
limitation, however, is somewhat mitigated by the
extensive analysis conducted by numerous
researchers to identify differences between the two
groups.
III. ANALYSIS
A. Christian Preschools
Teachers in each type of school articulated cultural
models that guided their school’s curriculum and
vision of appropriate practice. Although these
schools belonged a variety of denominations, both
Catholic and Protestant, they shared a number of
cultural models that informed their programs. The
amount of time devoted specifically to learn about
Christianity varied among the schools. Most schools
included a daily morning prayer and a prayer before
and after meals. Attending a church service of some
kind once a week was common. In more religion
based schools, there was a considerable time for
listening to Bible stories. At Christmas, they
engaged in a number of activities. The Christian
teachers built their programs around of the view
the God’s love is the primary message of
Christianity.
According to this central cultural model, children
are thought to be gifts of God, and each one should
therefore be highly appreciated.
This cultural model had two direct implications for
the daily routine at Christian preschools. One way
of respecting the individual was to allow the
children considerable freedom in deciding what
they wanted to do. Accordingly, free play formed
the basis of the curriculum in all the Christian
schools. For instance, as he came to realize the
fundamental importance of individual self-
determination which is prominent in Western
religious thought, more preschool, became more
and more convinced that it was essential to avoid
teacher-centered activities:
A second implication was that the teachers placed a
priority on encouraging children to articulate their
own ideas and to integrate their views with those of
their classmates. teachers at pre schools held a
class discussion after every art period to elicit
children’s opinions and ideas about the morning
activities.
Teachers in Christian preschools were particularly
concerned with the of children with disabilities
because they felt it was valuable for the normal
children to encounter someone who had
characteristics that differ quite saliently from their
own. Through daily interactions with children who
were different from them in some ways, the
students were taught to gain an appreciation for
each individual but also to learn how to form
relationships in spite of those differences. Perhaps
because of the connection that their religious
beliefs provided through Western thoughts and
values. this appropriation process results in an
orientation toward strengthening the individual’s
powers of self-expression, fostering self-knowledge,
teachers expect children to use these skills to build
relationships and form the ability to function well in
group settings.
B. Buddhist Preschools
From the front, the Jeeko Buddhist Preschool
(Pannipitiya-Paramadhamma) building looks more
like an insurance company than a preschool. The
imposing modern structure is three storey high,
with many windows building with darkened glass
prevents outsiders from seeing in. Yet, when one
moves through the entryway and passes through
the hall to the play area, tile roof of a traditional
Buddhist temple looms into view.
They felt that kindness and consideration should be
extended to all living things, including plant life as
well as humans. They emphasized this message in
the weekly sermon service at the temple, and they
provided practical experiences, like caring for the
plants of the preschool.
The emphasis on showing consideration for others
is consistent with Buddhist teachings on
compassion.
For Buddhists, both wisdom and compassion are
needed to help relieve the pain and suffering of the
mankind. The Buddhist teachers tried to be gentle
in their exhortations about prayer as the means for
developing a mind of appreciation. However, they
were also quick to point out that Buddhism called
for strength and determination as well as kindness:
One of the least desirable characteristics of the
unsocial zed person, according to the teachers , was
a tendency to act in a selfish, egocentric manner.
Therefore, the staff members at the Buddhist
preschools were careful to enforce desired behavior
firmly.

142
Opinions of the Christians, who emphasized the
idea that children are "precious gifts" from God. It is
interesting that Sri Lankan Christian early childhood
educators hold this benign view, while the
Buddhists articulate a more negative view of human
nature, one that is similar to that of conservative
Christian educators in the United States. The view
of many evangelical American Christians is that
adults must be vigilant to prevent children being
victimized of to the wickedness that is the legacy of
the original sin (Cleverly & Phillips, 1986).
Another strategy for avoiding individualism was to
feature large group activities as much as possible. In
a pamphlet for parents, the teacher makes an
argument for large class sizes: teachers believe that
most of mothers think that small class sizes, such as
5 or 10 children per teacher, are better for
children. teacher do not think so. Among 20 or 30
peers in a class, the children are more motivated to
learn by competing with each other. Therefore,
class sizes of 5 or 10 students are not good at all. Of
course, parental over too much interference is not
favorable is not good. Children aged 4 to 5 need a
group.(teacher’s idea)
Another component of the group orientation is
developing the child’s weak points rather than
allowing him or her to focus on strengths, again
illustrated in the parent brochure: "Young children
need balanced care that focuses on various aspects
of development such as music, intelligence,
creativity, and health (physical ability). In
Pannipitiya there are future artists and future
scholars. There are also future athletes, and yet it is
not a good idea to develop only their athletic
abilities. If you improve only the musical ability of a
child who is good at music, this child will have
unbalanced overall ability".(teachers idea)
Buddhists have traditionally focused on wisdom and
faith as the key to salvation, in contrast to the
Christian doctrine of love. Buddhism holds that
ignorance, in combination with desire, are the
forces that prevent people from moving beyond the
pain of life on earth. A primary strategy for attaining
knowledge is to study sacred texts.
The texts themselves are considered authoritative,
so the believer is a "hearer of the word." Expression
of Buddhist faith has traditionally focused on "pious
copying out of scripture," a practice that is still
considered meritorious (Dumoulin, 1994, p. 55).
In the Buddhist pre schools, students were strongly
encouraged to orient themselves toward external
sources of knowledge, including both texts and the
teacher. At Maharagama this approach was partly
illustrated by the children’s memorization of sacred
chants. In addition, they spend most of their day
sitting at desks receiving instruction from the
teacher. Literacy is a major focus of the curriculum,
including in reading and writing action . Children
engage in poetry reading and writing. They are
involved in activities for the purpose of "developing
their intelligence" in which a wide range of
materials are used to stimulate basic cognitive skills
such as visual perception and memory, as well as
such Piagetian principles and class inclusion. In
addition, children attend classes in art, dance,
English, instrumental music, and singing.
At Pannipitiya preschool, a more radical curriculum
emphasizes cognitive stimulation. Children are
exposed to complex visual and auditory patterns,
which they memorize, with no exploration of the
meaning of the stimuli. For example, in one
exercise, teachers clap out a complicated rhythm
for children to repeat. Children are shown flash
cards representing the flags of nations around the
world and call out the name of the appropriate
country.
What is common in the Buddhist preschools, then,
is an emphasis on the ultimate authority of text and
teacher as the source of knowledge. This view
contrasts with the Christian emphasis that
knowledge results from children’s individual
exploration in combination with teacher-guided
social interaction among peers. By relieving
oneself of physical discomfort, emotions, and
thoughts, one achieves unity of mind and body and
detachment from the self. Analysis of the moral
implications of the physical state is commonplace in
Sri Lanka, in Buddhist as well as secular contexts. In
many of the preschools, not just those that were
Buddhist, the children were constantly reminded to
sit up straight and keep their feet together. In the
Buddhist preschools, posture was just one of the
concerns teachers expressed about the knowledge
development of the children.
Because much of the day was occupied with
academic classes and music instruction, the children
at strict Buddhist preschools had little opportunity
to engage in language activity. When it did occur,
language exertion was reutilized and teacher
143
structured. language activities at Buddhist
preschools were sometimes designed to provide a
challenge that would help toughen the children.
The teachers in the Buddhist preschools were also
concerned about the spiritual and language physical
effects of receiving proper nutrition and exercise. A
notation on the brochure for Maharagama
preschool sums up the connection between
nutrition, group orientation, and spiritual
awareness. Some Buddhist schools were among
the largest of all schools ; some had over 600 pupils.
If the present economic uncertainties continue,
these schools will likely continue to be a very
appealing method for parents interested in giving
their children a head start in school.
The demands for obedience are at odds with a
powerful cultural model that sees children under 7
as little treasures that should be treated indulgently
a model that may have become even stronger in
recent times.
III. CONCLUSION
Sri Lankan society appear more willing to mix and
match religions. Buddhism when faced with death.
Yet, in spite of factors that work to blur the distinct
philosophical contribution of the various religions,
researcher has seen concrete ways in which the
ideologies of Christianity and Buddhism continue to
influence Sri Lankan preschools. The clear effects of
religious beliefs on the curricula and practices in
these preschools suggest that similar analyses of
western province pre schools are warranted. In the
past decade, researchers and policy experts have
been grappling with the feasibility of a global
definition of child care quality that could be applied
across all institutions in any community across the
country. The elements of "appropriate practice"
have been articulated by charter of western
province in Sri Lanka. This viewpoint tends to
privilege the "scientific" approach of raising
children, with little explicit recognition of the fact
that collectively based ideologies—including
religious beliefs—may proscribe values and
practices that conflict with the approach favored by
many researchers. currently, there is so little
information available about the philosophical bases,
and favored practices, of church-based schools that
it is impossible to speculate on the nature of
possible tensions. As early childhood educators
increasingly advocate moving toward
"partnerships" and "dialogues" between early
childhood educators and parents (Holloway &
Fuller, 1999)—with each contributing their
perspectives and knowledge to the conversation—
the exploration of the role of religious beliefs will be
increasingly imperative.
REFERENCES
Abhayadeva,Chitrangani (2013) Early Childhood Care
and Development in Sri Lanka Aviliable
from:http://www.nec.gov.lk/web/images
/research/general/Early_Childhood_Care
_an d_D evelopment.pdf
[Accessed: 6th May 2014].
Cleverly, John F., & Phillips, D. C. (1986). Visions of
childhood: Influential models from Locke
to Spock. New York: Teachers
College Press.
Dumoulin, Heinrich. (1994). Understanding
Buddhism: Key themes. New York:
Weatherhill.
D’Andrade, Roy G. (1992). Schemas and
motivation. In Roy G. D’Andrade &
Claudia Strauss (Eds.), Human motives
and cultural models (pp. 23- 44).
New York: Cambridge University
Press.
Harischandra, Sudarma.(2009) competencies of Pre
School children via Pre school education. (un
publish) faculty of education, Colombo:
University of Colombo.
Holloway, Susan D., & Fuller, Bruce. (1999). Families
and child care institutions: Divergent research
and policy viewpoints. In Suzanne W.
Helburn (Ed.), The silent crisis in U.S. child care. Annals
of the American Academy of Political and
Social Science (Vol. 563, pp. 98-115).
Thousand Oaks, CA: Sage
Publications.
Holland, Dorothy; Lachiotte, W., Jr.; Skinner, D.; & Cain,
C. (1998). Identity and agency in cultural
worlds. Cambridge, MA: Harvard University
Press.
144
Kannangara, C.W.W. (1943) Spécial Kannangara Report.
Kojima, Hideo. (1986). Japanese concepts of child
development from the mid-17th to mid-19th
century.International Journal of Behavioral
Development, 9(3), 315-329. EJ 344 351.
Kojima, Hideo. (1988). The role of belief-value systems
related to child-rearing and education: The
case of early modern to modern Japan. In
Durganand Sinha & Henry S. R. Kao
(Eds.), Social values and
development: Asian perspectives (pp.
227-253). Newbury Park, CA: Sage
Publications.
Ministry Of Education. (1972) Adyapanaye Nawamaga.
Colombo: Ministry of Education.
Quinn, Naomi, & Holland, Dorothy. (1987). Culture
and cognition. In Dorothy Holland & Naomi
Quinn (Eds.),Cultural models in language
and thought (pp. 3-40). New York: Cambridge
University Press
Randima, R.(2014) Aviliable from:
http://www.island.lk/index.php?page_cat=ar
ticle-details&page=article-
details&code_title=87511[Accessed: 6th May
2014].
Report on early childhood care and education in Sri
Lanka,(1986).Sessional paper no.11.
Sri Lanka , Cabinet Paper
No(04/1253/015/006-21
September 2004
University of Sri Lanka .(1979).Survey of pre schools in
Sri Lanka. University of Sri Lanka: External
Services agency. (Draft Report).
Unicef, (2014) earlychilhood. Aviliable
from:http://www.unicef.org/earlychilhood/[A
ccessed: 10th May 2014].
Unicef, (2014)education. Aviliable from:
http://www.unicef.org/education/bege
61627.html/[Accessed: 20th May 2014].
Wickramarathna, V.(1996). A situation analysis of pre
schools and their programs in Sri Lanka (Un
published) Ministry of transport
environment and women's affairs and unicef
BIOGRAPHY OF AUTHOR
K.V.Sudarma Harischandra
Senior Lecturer
Department of Teacher Education
National Institute of Education
Maharagama
Qualification
M.Ed - University of Peradeniya
M.Phil -(Education) University of Colombo
145
Factors Affecting to Distract the University Students’ Education in Sri Lanka
RD Jayawardana
297/5 Baseline Road Colombo 09, Sri Lanka
Abstract— The Government of Sri Lanka enrols and
provides free University education to approximately
20,000 students annually. Suitably qualified
students are admitted to 15 Universities, 03
Campuses and various other higher Government
affiliated education institutes. A majority of the
students admitted are suppressed by certain
internal, external and influential factors which alter
the attitude and the behaviour of the students
resulting an unhygienic environment to the
university life and the public. To counter this issue,
universities along with responsible ministries have
launched many programs facilitating financial
assistance and basic welfare measures to needy
students. More than 50% of the students admitted
yearly are benefited with these programs but to
date the students unrest have not been mitigated
nor a concrete solution have been established. The
recently introduced Leadership Training Program
conducted by Military Institutes enhance the
personality of Students but is not sufficient or the
best answer to the matter in question. This paper
identifies the factors affecting to distract the
university students’ education in Sri Lanka as a
National Issue and possible solutions to encounter
the situation.
Keywords— Distract University Education Sri Lanka
I. INTRODUCTION
Government Universities in Sri Lanka are institutes
which offers free university education in all
disciplines to local students who attain higher
aggregates and Z scores in the General Certificate of
Education (GCE) Advance Level (A/L). The free
education system was started since the
Independence to Sri Lanka and with the visionary of
Mr CWW Kannangara, a minister of education at
that time. According to Department of Census and
Statistics of Sri Lanka, as at year 2013, there will be
approximately 4,500,000 students enjoying the free
education in over 10600 government schools in Sri
Lanka. Out of above, over 250.000 students sits for
university entrance exam every year and
approximately 20,000 qualifies themselves to be
admitted to universities in different disciplines. The
qualified students have the option of entering to 15
state universities and 03 campuses which are
approved by the University Grant Commission
(UGC) according to their order of merit, Z score and
the stream of education. The students who do not
pass the margins of above category have the option
of admitting to various non UGC but public
institutes providing university or higher education.
These institutes are governed by ministries such as
Ministry of Defence and Ministry of Vocational and
Technical Training. Students who do not qualify for
both above have the option of entering to institutes
which are either foreign university affiliated,
independent, private, non-profit or profit venturing
and charters. The products of latter have a better
chance in completing the desired academic
qualifications in time which are job focus and be
admitted to private sector employments with a
higher salary offerings. This paper discuss on the
Factors Affecting to Distract the University Students
Education and focus on students in the UGC
approved universities
II. THEORETICAL BACKGROUND
According to the UNICEF Data of 2008, Sri Lanka has
an adult literacy of 92% and the youth literacy is in
between 97% to 99%. The reasons for this
achievement is, Sri Lanka being the only country in
the globe which provides education, reading
materials, uniforms and a reasonable day meal free
of charge to all students up to university entrance
exam level. As per the records of Department of
Census and Statistics, in 2012 the total population
of Sri Lanka was 20,328,000 and the total no. of
students up to A/L was 4,186,808 which the
percentage is 20.6%. According to the 2014 updated
official web page of Dept. of Census and Statistics,
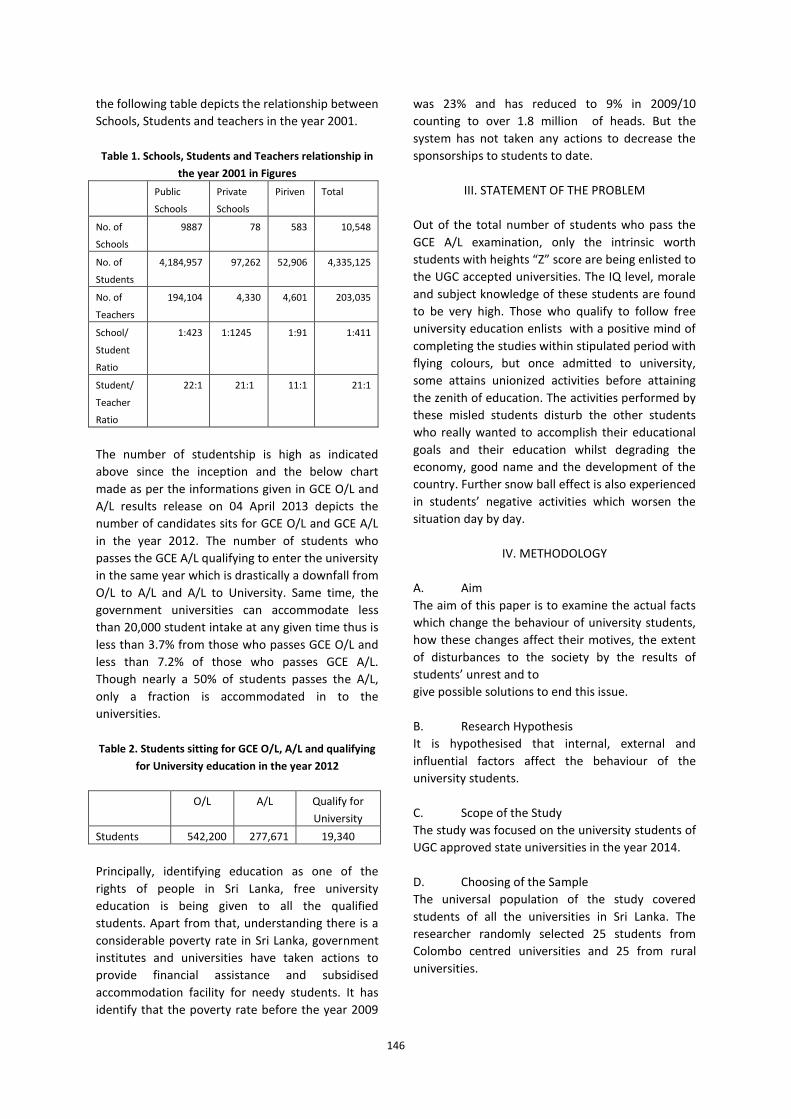
146
the following table depicts the relationship between
Schools, Students and teachers in the year 2001.
Table 1. Schools, Students and Teachers relationship in
the year 2001 in Figures
Public
Schools
Private
Schools
Piriven
Total
No. of
Schools
9887 78 583 10,548
No. of
Students
4,184,957 97,262 52,906 4,335,125
No. of
Teachers
194,104 4,330 4,601 203,035
School/
Student
Ratio
1:423 1:1245 1:91 1:411
Student/
Teacher
Ratio
22:1 21:1 11:1 21:1
The number of studentship is high as indicated
above since the inception and the below chart
made as per the informations given in GCE O/L and
A/L results release on 04 April 2013 depicts the
number of candidates sits for GCE O/L and GCE A/L
in the year 2012. The number of students who
passes the GCE A/L qualifying to enter the university
in the same year which is drastically a downfall from
O/L to A/L and A/L to University. Same time, the
government universities can accommodate less
than 20,000 student intake at any given time thus is
less than 3.7% from those who passes GCE O/L and
less than 7.2% of those who passes GCE A/L.
Though nearly a 50% of students passes the A/L,
only a fraction is accommodated in to the
universities.
Table 2. Students sitting for GCE O/L, A/L and qualifying
for University education in the year 2012
O/L A/L Qualify for
University
Students 542,200 277,671 19,340
Principally, identifying education as one of the
rights of people in Sri Lanka, free university
education is being given to all the qualified
students. Apart from that, understanding there is a
considerable poverty rate in Sri Lanka, government
institutes and universities have taken actions to
provide financial assistance and subsidised
accommodation facility for needy students. It has
identify that the poverty rate before the year 2009
was 23% and has reduced to 9% in 2009/10
counting to over 1.8 million of heads. But the
system has not taken any actions to decrease the
sponsorships to students to date.
III. STATEMENT OF THE PROBLEM
Out of the total number of students who pass the
GCE A/L examination, only the intrinsic worth
students with heights “Z” score are being enlisted to
the UGC accepted universities. The IQ level, morale
and subject knowledge of these students are found
to be very high. Those who qualify to follow free
university education enlists with a positive mind of
completing the studies within stipulated period with
flying colours, but once admitted to university,
some attains unionized activities before attaining
the zenith of education. The activities performed by
these misled students disturb the other students
who really wanted to accomplish their educational
goals and their education whilst degrading the
economy, good name and the development of the
country. Further snow ball effect is also experienced
in students’ negative activities which worsen the
situation day by day.
IV. METHODOLOGY
A. Aim
The aim of this paper is to examine the actual facts
which change the behaviour of university students,
how these changes affect their motives, the extent
of disturbances to the society by the results of
students’ unrest and to
give possible solutions to end this issue.
B. Research Hypothesis
It is hypothesised that internal, external and
influential factors affect the behaviour of the
university students.
C. Scope of the Study
The study was focused on the university students of
UGC approved state universities in the year 2014.
D. Choosing of the Sample
The universal population of the study covered
students of all the universities in Sri Lanka. The
researcher randomly selected 25 students from
Colombo centred universities and 25 from rural
universities.

147
E. Method of Data Collection
Since the research is a field study to find the factors
affecting to distract the university students
education in Sri Lanka and possible solutions to
rectify the same, required data were gathered
through a questionnaire disseminated to selected
sample. 02 weeks were given to respond and same
was further extended by additional 02 weeks to
collect maximum responses.
F. Data Analysis
Data were analysed manually.
G. Limitations.
Out of 50 questionnaires disseminated, only 38
responded even with extended time period given to
them to response. The freshers to universities were
keen in answer but senior students were reluctant
to respond.
V. PROBLEMS ENCOUNTERED BY STUDENTS ON
ENLISTMENT
The students entering to universities are not from a
homogeneous society but belongs to different
cultural, economic and social groups with a
common vision of a respectable degree within a
stipulated time period and an elevated lifestyle
after graduation. Since the day of admittance, many
of the students from the rural and or lower income
families faces many difficulties in their university
life. For this study, these difficulties are categorised
in to three factors namely internal, external and
influential factors. The internal factors are
congenital and the external factors associate with
the results of internal factors. Influential factors are
associate with the experience the students gain
during their university life. So much the efforts
made by authorities, at a later stage the students’
behaviour is changed with the influence of third
factor which above identified as Influential factor.
a. Internal Factors
This paper consider Language barrier,
inferior personality, lack of vision,
Depression, Home sickness, Poor Time
Management, and Social Status associate
with deprived socio-economical
background which inherited to students at
the time of enlistment are considered as
Internal Factors herein.
b. External Factors
Food, clothing and shelter are the main
cost factors of a student during university
period and ability in fulfilling these cost
factors motivates them to concentrate
towards study. Inadequate economic
strength to fulfil these requirements leads
male students to earn by way of working in
petrol pumps and security companies
performing night shifts whilst certain
female students reluctantly but compelled
to work in Spas and at times as sex
workers. These factors are identified as
External factors to this study.
c. Influential Factors
The new society, sub groups and the
culture students get in to, Political
affiliations and teachings, Uncertainty of
the future, Influence from senior students,
and fear and obligations have identified as
Influential factors in this study.
Outcome of Students’ Unrest
Students’ Behaviour
External Factors
Scholarships Accommodations
Loans
Internal Factors
Figure 1. A diagram of factors affecting students’
behaviour
The above diagram depicts that the student are
suppressed by internal and external factors and
directly affected by these factors. To smooth the
effects of these factors, universities along with the
government have launched programs which have
identified by students as not so effective or
insufficient. Anyhow these programs have a limited
effect at the beginning of the university life and at
threshold, students behaviour is being severely
affected by Influential Factors.
VI. STUDIES CONDUCTED IN OTHER COUNTRIES
Various countries have conducted studies to find
out deriving issues of students of those countries. It
was observed that some of the issues faced by
Students
148
those students are very much similar to what our
students face here. Anyhow it was pragmatic that
there are some factors which are non-similar to
University students of Sri Lanka. It was identified
that non-similar factors are mainly due to cultural
indifferences and the education system they are in.
Factors such as Alcoholism, Relationships, Parting,
eating disorders, Sexual Assaults and Harassments,
Childhood Issues and Traumatic Events are Cultural
bound and choosing a Major, Study, Job and
Wealth, Lack of Exercise, and Sleep Disorders are
Education System bound. Anyhow the outcomes of
the students due to all the factors in other countries
are not similar to Sri Lanka as many Universities in
the foreign soil provide University Education on
payment and many students have an obligation to
the education they have as it had been done on
their cost.
VII. EFFORT BY SRI LANKA GOVERNMENT TO
MITIGATE STUDENTS PROBLEMS
To cushion these Internal and External factors,
Universities along with certain Ministries have
made several efforts which the students highly
accepted at the beginning of their University Career
but highly challenge the same with time. Mahapola
Scholarships, Bursary Loans, Endowed Scholarships,
subsidised meals, accommodations and Leadership
Training are the key elements focused by the
Governments to date which believed to be main
factors of smoothing students’ problems.
Mahapola scholarship is awarded to 10,000
students yearly nearing 50% of the university
entrance with an annual cost of Rs. 25 Million.
Bursary too provides financial assistance to needy
students subjected to the approval of UGC.
Unfortunately respective authorities have less
aware of the Influential Factors thus have paid less
attention to cater this issue other than introducing
Leadership Training. The present Leadership
training have somewhat level the internal and
influential factors, but it itself cannot level entire
factors which affect students mental shift.
VIII. CREATION OF STUDENTS UNREST
Upon the attempts made by relevant authorities to
alleviate the students difficulties, students unrest
upsurge time to time with violent behaviour where
the established order take apposite actions in
means of legal or administrative. Students’ Unions
of the Universities have acknowledged these
actions as Students’ Human Rights violations which
they claim as per Students’ Human Right Report
2013, that there have been 524 cancellations of
classes, 104 external disciplinary inquiries, 67
Mahapola cancellations, 104 Law suits and 44
imprisonments of students in the past year.
IX. STUDENTS ALTERNATIVES / OPTIONS
From the researcher’s angle, it is obvious that the
Internal and External factors transform the
students’ attitude and behaviour. This
transformation is been strategically used by certain
Students Organizations in the universities to take
undue advantages in their favour whilst the
Government Organizations have partially
understood the factors affecting the students
behaviour thus given only a limited solutions to
demanding factors. The Sri Lankan Culture in the
Universities is to seek the possibility in winning
rights with unionized actions and this culture is
blessed by many students’ movements. No solid
solution to above identified Internal and External
factors leads to poster campaigns demonstrations
and sabotages actions.
X. AFFECTS TO ENVIRONMENT AND PUBLIC
University is supposed to be a Knowledge
Development Agency which enhance the
intellectual abilities of its customers, the students.
Some public view Universities in Sri Lanka as cost
centres up to a certain extent and a place which
gathers GCE A/L top rankers under one umbrella,
create unrest among them and generate social,
economic and political turbulence. According to the
majority of public view, the following have been
identified as possible negative outputs of UGC
approved and Government sponsored universities.
a. University Study is not Job Focus
b. Accumulation of non-job focus Graduates
inventory expecting Government Jobs.
c. Students expect maximum privileges
irrespective of the limits of free education.
d. University Students encounter authorities
over their expected facilities.
e. Students are being provoked by the actions of
the University Authorities.
f. Shutdown of universities disturbs studious and
motivated students’ education.
g. Publicity by media depicts a wrong
interpretation internationally.
149
h. Creation of Student heroes in the Universities
with blind followers.
i. The actions and reactions by and of students
and authorities create public discomfort.
j. State / Administrative actions to control
irruptions leads to greater events.
k. Loss of students’ lives.
l. Political instability and devastations like in
early 1970s.
XI. RECOMMENDATIONS
The researcher found out that there are three
factors affecting to distract the students’ education
in Sri Lanka and they are the main influences to
students’ unrest. Considering this matter as a
national issue, it is mandatory to have a concrete
solution to quieten these factors.
The researcher recommends the following as most
possible ripostes to end up the students’ unrest.
a. Quality of the education shall be improved
with latest technological aids and facilities
where students may grasp the essence of the
teachings.
b. University education shall be Job Oriented
giving students a clearly articulated and
focused future.
c. All the students are to be given Industry
Exposure with a on the job training according
to the stream they are in.
d. Students to be provided with Bank Loans
issued by State Banks with lower interest
rates.
e. The recoveries of the Bank Loans shall be
recovered once the students are passed out
from the universities.
f. Reasonable accommodation facilities to be
provided to needy students adequately.
g. The cost of the accommodation shall be
recuperated from bank loans if students wished
to do so and if so to be recovered once they are
in employment.
h. Effective students counselling system shall be
introduced within the universality.
i. Proper system should be introduced within the
universities to identify and guide students who
needs counselling.
j. Endeavours shall be taken to create a friendly
relationship between University Students and
the Lecturers.
k. A Student and Lecturer Union to be introduced
paving a path for more interactive sessions
between students and the lecturers.
l. The leadership shall focus on developing of Soft
Skills and creating a vision of the students.
m. Mahapola Scholarships and bursary must plan
before hand and the payments shall effect from
the first month of the enrolment.
n. Must introduce a forum to project their
problems.
o. Universities shall be able to provide efficient
and effective solutions to students’ vital
problems.
p. Universities must have an efficient job bank
with proper coordination with private sector
and guide students to possible jobs.
REFERENCES
CIA World Fact book. (2013). < http; // www.cia.gov>
Sri Lankan Statistics (2014). <http;
//www.statistics.gov.lk>
List of Universities in Sri Lanka (2014).
<en.wikipedia.org./wiki/List_of_Universities_i
n_Sri_Lanka>
Mahapola scholarships (2013).
<http;//www.lankauniversitynews.com/2013.
02/mahapola>
<http;//www.Students’ Human Right Report
Sri Lanka (2013).
List of Universities in Sri Lanka <Wikipedia.org/wild/list
of universities in srilanka>
School Census (2008). <http;//www.ststistics.gov.lk>
Jayasekara HMNR (2007). “Deriving Issues faced by
University Students”
Gates G. (2010). Education and Science .
garfieldgates.hubpages.com/hub/common-
problems
Hingson RW, Heeren T, Zacos RC, et.al. (2002).
“Magnitude of alcohol related mortality and
mobility among US College Students age 18 – 24.”
Stud Alcohol 2002, 63 (2) 136 – 144.
Colgate University (2013). Issues familiar to University
Students. http;//www.colgate.edu
Chin A. ((1993). “Issues Facing Asian – American Students
at Texas A&M University.”
150
University Counselling and Teaching Centre. 2010. “Issues
faced by students when transferring to Campus.
BIOGRAPHY OF AUTHOR
Author is a retired Group Captain in the
Sri Lanka Air force. During his military
career, he has served as the Chief
Instructor of Junior Command and Staff
College affiliated to University of
Kelaniya which awards Post Graduate
Diploma in Management to Tri Service
Officers. He is a National Diploma holder in Human
Resources Management of Institute of Personnel
Management, graduate of Kotelawala Defence
University and a Post Graduate of Rajarata University of
Sri Lanka. He is reading for MPhil / PhD at Kotelawala
Defence University. He is also a lecturer in Management
and Occupational Health and Safety (OHAS). His
research interests include Job Satisfaction and employee
retention. At present he works as the Head of Aviation
Security in a Private Airliner
151
Impact of Music on Education of Primary Students in Colombo District
EMA Dharmarathna1, VABP Jayarathna2
1
O/C, 4240, Troop Bravo, Intake 30, General Sir John Kotelawala Defence University, Ratmalana
2 O/C, 4248, Troop Delta, Intake 30, General Sir John Kotelawala Defence University, Ratmalana
Abstract— Education is the process of transferring
skills, knowledge and habits of people from one
generation to the next. Education is obtained
through the methods of learning and teaching, and
by life experiences. As Oxford University defines
music is, “Vocal or instrumental sounds combined in
such a way as to produce beauty of form, harmony,
and expression of emotion”. One’s learning which is
done in order to obtain education is affected by his
or her learning diversity. So, It is hypothesized that
music can be used as a tool of learning diversity
which will be reliable to make the education of a
primary student, more effective and meaningful.
Researches have been conducted about the
application of ‘music for education’. But they have
not researched its effect on primary students using
the concentration power of music for the
achievements of education.
The research was conducted as a quantitative
research. Two sets of samples which each consist of
50 students of grade five were taken from
Piliyandala Central College. It was decided to test
the IQ of students in order to measure their
performance. All of them were given an IQ paper
which matches the IQ level of their age, of half an
hour while one set is provided with a piece of
pleasurable music throughout the paper while the
other is not. Other than that, all the other factors
which will affect their concentration and
performance were kept equally to all the sets. This is
a working paper. So, the same experiment will be
conducted using the same samples twice a month
for three months providing them different IQ papers
After three months, the controlled group will be
changed. Those who were kept as the controlled
group will be given those pieces of music while they
face tests in the rest of three months of the
research. The other set will be then considered as
the controlled sample and they will not be given the
music. The tests will be conducted in the same
manner, for the next three months and then the test
papers will be collected and marked.
The expected differences of the scores obtained by
two classes were assumed as the reflection of music
which stimulate leaning.
Final statistical analysis using SPSS shows that the
average marks obtained by the two groups; those
who faced the test without any background music
and those who did with a background music, does
not have any significant difference. So the
hypothesis is disapproved under the provided
circumstances.
Keywords: Music, Education, primary level
students.
I. INTRODUCTION
When the concept of globe becomes narrow day by
day, people in every nook and corner of the world
join hands with each other. Whereas it can be
simply explained as communication, the number of
aspects of development and technology in the
world also expands rapidly along with it. Such;
communication, development and technology
began to grow even before the origin of present
mankind, Homo sapiens; but it happen very slowly,
through running towards an endless future at the
moment also rapidly. Along with the evolution of
communication, development and technology, they
all carry us towards a concept called civilization or
enculturation. Accordingly, the base which has
uplifted the standards of development,
communication and technology along with
civilization and enculturation beginning from the
historic ages, can be expressed as ‘Education’.
Education is defined as the wealth of knowledge
acquired by an individual after studying particular
subject matters or experiencing life lessons that

152
provide an understanding of something (Anon.,
2014). Furthermore, the education can be
categorized as formal, informal and non-formal.
Formal education is always organized and
structured, and has learning objectives. Informal
learning is never organized, has no set objective in
terms of learning outcomes and is never intentional
from the learner’s standpoint. Often it is referred to
as learning by experience or just as experience.
Non-formal learning is organized and can have
learning objectives (Dib, 1987).
Education has deep philosophical and psychological
background. In psychology it is widely spoken about
memory and the theories about education. It seems
too simple to say that educational psychology is the
psychology of learning and teaching. It is the
scientific study of human learning. But it further
involves with the study of how people learn;
including topics such as student outcomes, the
instructional process, individual differences in
learning, gifted learners and specially, learning
disabilities of people (Cherry, 2014).
According to the perspectives of psychology, the
process of learning can be categorized in to five
main groups as behaviorism, cognitivism,
constructivism, experientialism and Social and
contextual (Thompson, 2014). Each of them which
are developed in various eras of psychology
describe how people obtain education.
Bloom's Taxonomy (1956) describes the process of
education. There it discusses about three main
parts of education called Cognitive, Affective and
Psychomotor. Cognitive domain describes about the
process of education basically based on knowledge.
Knowledge is described as facts, information, and
skills acquired through experience or education; the
theoretical or practical understanding of a subject.
According to Bloom’s theory, the knowledge
gathered is compared and illustrated collating the
main ideas. The application of the acquired
knowledge, analyzing them, synthesizing new facts
using the given knowledge, and finally the
evaluation of them are analyzed by Bloom. Then the
affective domain describes the way that people try
to understand the pain and the pleasure of living
beings. He illustrates the last domain as
Psychomotor where it speaks about manipulating
tools which he describes as education (Armstrong,
2001).
For the purpose of education, people have to obtain
facts or information from the environment, as
described above. Firstly the information are sensed
by our sensory organs as skin, eyes, ears, nose or
tongue. Then the information is sent to the Central
Nervous System (CNS) though Peripheral nervous
system (PNS). CNS consists of Brain and Spinal cord.
Then, the information received to the CNS is
processed in short-term memory of the brain. Later,
they are transferred to the structural core of the
brain. There, the information received is compared
with existing memory and then stored. The parts of
the brain which are related to different senses are
illustrated in Figure 1. Brain consists of Stem,
Cerebrum and Cerebellum. The cerebellum can be
divided in to several lobes as the figure describes.
The brain acts as a dense network of fiber
pathways. It consists of 1010
(100 billions) of
neurons approximately (Ford, 2011).
Fig 1. A diagram of how the brain works (Gamon D and
Bragdon AD, 2003)
Researchers found that when two neurons
frequently interact, they form a bond that allows
them to transmit more easily and accurately. This
leads to more complete memories and easier
recall. Conversely, when two neurons rarely
interact, the transmission is often incomplete,
leading to either a faulty memory or no memory at
all. (Ford, 2011)”.
So the researches show that it is required to keep
practicing or revising something in order to keep in
memory. Complex set of organic compounds called
“Hormones” such as Adrenalin and Noradrenaline
function along with the co-ordination of Cerebellum
of the brain and stimulates thoughts and
perceptions of ours. The hormones which stimulate
digestion, functions of tissues, sleep, metabolism,

153
respiration, sensory perception and excretion of
human beings also help the process of education.
“Extensive evidence indicates that stress hormones
released from the adrenal glands are critically
involved in memory consolidation of emotionally
arousing experiences (Roozendaal, 2007)”.
Primary students who were selected as the target
group of the research shows a higher growth rate of
their brains related to the other age groups of the
students. The growth rate of the brain of human
beings depend on their age. The growth also
depends on gender, genetic factors, early life stress,
environment factors and the stimulants. The figure
3 shows how the brain develops even before the
birth, expands its size rapidly within first three to
four years. Then the growth rate of the brain slows
down. Neurone development of the embryo begins
shortly after conception.
Fig. 2 Human brains grow rapidly before birth through
the first year and into childhood
Thousands of neurotransmissions ensue at a time in
the brain. Ultimately it results electromagnetic
waves which are categorized as Delta, Theta, Alpha,
Beta, and Gamma according to their frequency
range, generated by the brain. Those frequency
stages are as tabled in Table 1.
Among these four stages, Alpha is the most
suitable stage of concentration in human mind for
education, for a learning environment of human.
Beta can be detected when people feel agitated,
tense and afraid. Theta results due to reduced
consciousness. Delta is transmitted in deep sleep.
Music is the art of the application of various sounds
under different formations and combinations. It is a
universal language which can be understood,
sensed and felt by anybody without any language
barriers. The cultural impacts such as religion,
language and origin or, geographical impacts such
as continent, country or province impact on the
differentiation of music in various locations of the
world. Music can be soothing or enervating. It
induces melancholy or euphoria. But as the ultimate
stimulation that can make our brains, music can be
apply as a tool of healing people. Music therapy is
the field which uses music for the purpose of
healing patients professionally. Table 1. Frequency Stages of Brain and their Function (Miller RA.1982)
In the same way, pleasurable music can be used to
enhance the outcome of education. By letting them
to listen to pleasurable music their concentration
can be taken to Alpha level. And also the selected
kind of music, relaxation music is expected to act on
them equally as students of grade 6 are not
expected to expose and get used to any special style
of music.
Even the primary students in Sri-Lanka (most
probably grade 5 students) tend to get tensioned a
lot due to the high competitiveness of the
scholarship exam that they have to face in grade
five (Amarasinghe, 2014). The time they should be
with their family members, friends or with nature is
stolen by the prevailing system of education. So the
stressed mentality that they are expected to have
while their studies can be settled down by the given
music. So, it will be more meaningful to introduce
this kind of pieces of music for children who are in
such stressed states and also passing their growing
ages in order to obtain more efficient results from
them.
“Inputs from the environment are not always a
good thing. Children born prematurely often
associate the initial noise and clatter around them
as painful. Research indicates that a quiet
environment allows these children to catch up as
STAGE FREQUENCY FUNCTION
Un
con
scio
us DELTA 0.5Hz - 4Hz Deep sleep
THETA 4Hz - 8Hz Drowsiness
Co
nsc
iou
s
ALPHA 8Hz – 13Hz Relaxed, but
alert
BETA 13Hz – 30Hz Highly alert and
focused
GAMMA 30Hz – 42Hz Supporting role
for the other stages

154
their neurons make (Semrud-Clikeman, 2014)” This
statement of American Psychological Association
proves the importance of “Calming music”.
The prevailing education system for primary
students in Colombo district is mainly enriched with
private sector, government sector and tuition. With
the development of technology, education and etc.,
the primary education has improved a lot. New
psychological theories are used in teaching students
along with new technology.
The government and private schools follow the
curricula which is designed by National Institute of
Education meanwhile International schools target
their curriculums for international level
examinations such as EDEXEL or Cambridge.
Western countries experience the value of ‘music
education’ of primary students. But in Sri Lanka, the
application of music should be applied as well as the
education of music.
II. RESEARCH OBJECTIVES
This research study aims to illustrate the capacity of
alpha music to enhance the academic performances
of primary students (in Colombo district) through
the level of concentration generated towards the
paper they answer.
It will also be a pathway to analyze the impact of
music on music students and other students and to
evaluate its application on fields other than
education.
III. RESEARCH HYPOTHESIS
H1: Alpha music which is provided to students (as
background music) while a test can enhance the
outcome of the process of education that the
students are involved in.
IV. LITERATURE REVIEW
Music is an aesthetic subject which entertains
human beings. Not only that, it is also a rich way of
communication and helps human beings to express
their ideas or emotions effectively. As most of the
aspects of music are not yet discovered, the
attention of scholars is paid towards various aspects
of music and its applications. Education is also a
wide scope where the scholars research about.
Accordingly, it is an important area where the aim
of scholars is towards this combination; the
application of music for educational Purposes.
Steele (2014) says that the latest studies seem to be
focused on the effects of classical music (or similar
easy listening tunes) on chickens. Furthermore, he
mentions that playing classical music to chickens in
the coop will result in calmer hens and therefore
greater productivity and larger eggs, since stressed
chickens often stop lying, slow their laying or lay
smaller eggs. With this empirical study, Steele
proves the ability of concentration power of music
which affected animals. He was able to observe
results of a higher output from the hens by
providing them pleasurable or classical music. In the
same manner, the concentration gained using music
is expected to act on human beings a lot in order to
enhance the performance of education. Scholars
have researched about access and retention of
marginalized populations within undergraduate
music education degree programs. The purpose of
this collective instrumental case study was to
examine the experiences of six undergraduates
from traditionally marginalized populations with
regard to their preparation for, admission to, and
retention within a music education degree program
(Kate R. Fitzpatrick et al, 2014). Here, the scholars
study about those who study music. But in this
research, the researchers study about non-music
educated primary students.
The effect of early music training on child cognitive
development is studied in another research which is
published in the journal of Applied Developmental
Psychology. Bilhartz et al. (1999) argues that their
hypothesis; “There is a significant link between
early music instruction and cognitive growth in
specific non-music abilities” has proved by their
studies. Furthermore they say that the findings of
their study proves the theory that children trained
to produce music vocally and on a glockenspiel-
sequential training that uses and develops
kinesthetic, aural, and visualization skills-become
better able to perform the abstract reasoning tasks
measured by the Stanford Binet Bead Memory
subtest.
As Gold, Frank, Bogret and Brattico (2013) argues,
mounting evidence links the enjoyment of music to
brain areas implicated in emotion and the
dopaminergic reward system. Furthermore they
argue that dopamine release in the ventral striatum
seems to play a major role in the rewarding aspect
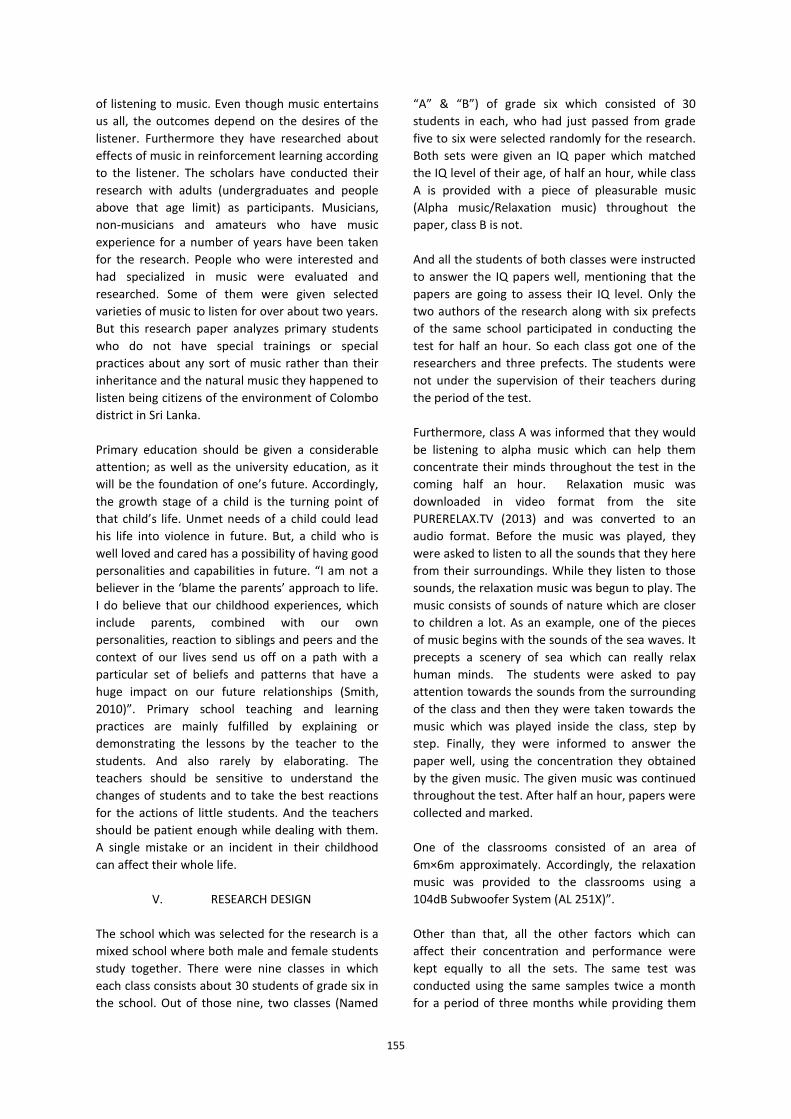
155
of listening to music. Even though music entertains
us all, the outcomes depend on the desires of the
listener. Furthermore they have researched about
effects of music in reinforcement learning according
to the listener. The scholars have conducted their
research with adults (undergraduates and people
above that age limit) as participants. Musicians,
non-musicians and amateurs who have music
experience for a number of years have been taken
for the research. People who were interested and
had specialized in music were evaluated and
researched. Some of them were given selected
varieties of music to listen for over about two years.
But this research paper analyzes primary students
who do not have special trainings or special
practices about any sort of music rather than their
inheritance and the natural music they happened to
listen being citizens of the environment of Colombo
district in Sri Lanka.
Primary education should be given a considerable
attention; as well as the university education, as it
will be the foundation of one’s future. Accordingly,
the growth stage of a child is the turning point of
that child’s life. Unmet needs of a child could lead
his life into violence in future. But, a child who is
well loved and cared has a possibility of having good
personalities and capabilities in future. “I am not a
believer in the ‘blame the parents’ approach to life.
I do believe that our childhood experiences, which
include parents, combined with our own
personalities, reaction to siblings and peers and the
context of our lives send us off on a path with a
particular set of beliefs and patterns that have a
huge impact on our future relationships (Smith,
2010)”. Primary school teaching and learning
practices are mainly fulfilled by explaining or
demonstrating the lessons by the teacher to the
students. And also rarely by elaborating. The
teachers should be sensitive to understand the
changes of students and to take the best reactions
for the actions of little students. And the teachers
should be patient enough while dealing with them.
A single mistake or an incident in their childhood
can affect their whole life.
V. RESEARCH DESIGN
The school which was selected for the research is a
mixed school where both male and female students
study together. There were nine classes in which
each class consists about 30 students of grade six in
the school. Out of those nine, two classes (Named
“A” & “B”) of grade six which consisted of 30
students in each, who had just passed from grade
five to six were selected randomly for the research.
Both sets were given an IQ paper which matched
the IQ level of their age, of half an hour, while class
A is provided with a piece of pleasurable music
(Alpha music/Relaxation music) throughout the
paper, class B is not.
And all the students of both classes were instructed
to answer the IQ papers well, mentioning that the
papers are going to assess their IQ level. Only the
two authors of the research along with six prefects
of the same school participated in conducting the
test for half an hour. So each class got one of the
researchers and three prefects. The students were
not under the supervision of their teachers during
the period of the test.
Furthermore, class A was informed that they would
be listening to alpha music which can help them
concentrate their minds throughout the test in the
coming half an hour. Relaxation music was
downloaded in video format from the site
PURERELAX.TV (2013) and was converted to an
audio format. Before the music was played, they
were asked to listen to all the sounds that they here
from their surroundings. While they listen to those
sounds, the relaxation music was begun to play. The
music consists of sounds of nature which are closer
to children a lot. As an example, one of the pieces
of music begins with the sounds of the sea waves. It
precepts a scenery of sea which can really relax
human minds. The students were asked to pay
attention towards the sounds from the surrounding
of the class and then they were taken towards the
music which was played inside the class, step by
step. Finally, they were informed to answer the
paper well, using the concentration they obtained
by the given music. The given music was continued
throughout the test. After half an hour, papers were
collected and marked.
One of the classrooms consisted of an area of
6m×6m approximately. Accordingly, the relaxation
music was provided to the classrooms using a
104dB Subwoofer System (AL 251X)”.
Other than that, all the other factors which can
affect their concentration and performance were
kept equally to all the sets. The same test was
conducted using the same samples twice a month
for a period of three months while providing them
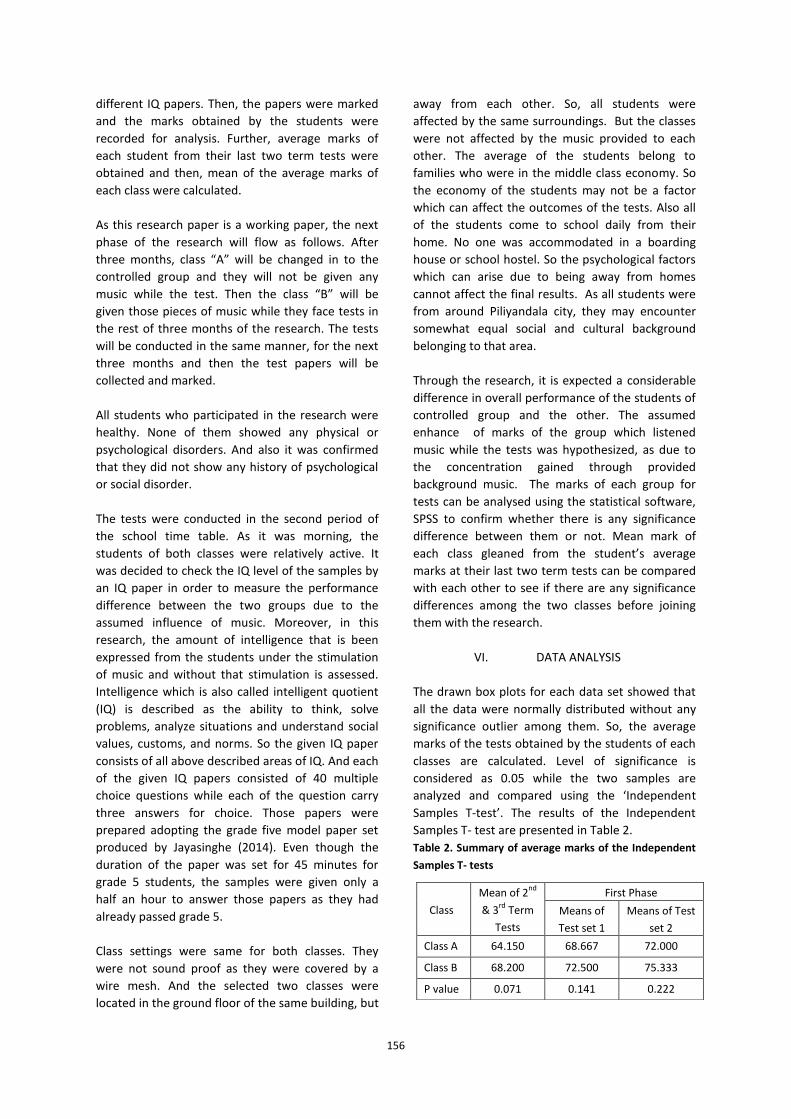
156
different IQ papers. Then, the papers were marked
and the marks obtained by the students were
recorded for analysis. Further, average marks of
each student from their last two term tests were
obtained and then, mean of the average marks of
each class were calculated.
As this research paper is a working paper, the next
phase of the research will flow as follows. After
three months, class “A” will be changed in to the
controlled group and they will not be given any
music while the test. Then the class “B” will be
given those pieces of music while they face tests in
the rest of three months of the research. The tests
will be conducted in the same manner, for the next
three months and then the test papers will be
collected and marked.
All students who participated in the research were
healthy. None of them showed any physical or
psychological disorders. And also it was confirmed
that they did not show any history of psychological
or social disorder.
The tests were conducted in the second period of
the school time table. As it was morning, the
students of both classes were relatively active. It
was decided to check the IQ level of the samples by
an IQ paper in order to measure the performance
difference between the two groups due to the
assumed influence of music. Moreover, in this
research, the amount of intelligence that is been
expressed from the students under the stimulation
of music and without that stimulation is assessed.
Intelligence which is also called intelligent quotient
(IQ) is described as the ability to think, solve
problems, analyze situations and understand social
values, customs, and norms. So the given IQ paper
consists of all above described areas of IQ. And each
of the given IQ papers consisted of 40 multiple
choice questions while each of the question carry
three answers for choice. Those papers were
prepared adopting the grade five model paper set
produced by Jayasinghe (2014). Even though the
duration of the paper was set for 45 minutes for
grade 5 students, the samples were given only a
half an hour to answer those papers as they had
already passed grade 5.
Class settings were same for both classes. They
were not sound proof as they were covered by a
wire mesh. And the selected two classes were
located in the ground floor of the same building, but
away from each other. So, all students were
affected by the same surroundings. But the classes
were not affected by the music provided to each
other. The average of the students belong to
families who were in the middle class economy. So
the economy of the students may not be a factor
which can affect the outcomes of the tests. Also all
of the students come to school daily from their
home. No one was accommodated in a boarding
house or school hostel. So the psychological factors
which can arise due to being away from homes
cannot affect the final results. As all students were
from around Piliyandala city, they may encounter
somewhat equal social and cultural background
belonging to that area.
Through the research, it is expected a considerable
difference in overall performance of the students of
controlled group and the other. The assumed
enhance of marks of the group which listened
music while the tests was hypothesized, as due to
the concentration gained through provided
background music. The marks of each group for
tests can be analysed using the statistical software,
SPSS to confirm whether there is any significance
difference between them or not. Mean mark of
each class gleaned from the student’s average
marks at their last two term tests can be compared
with each other to see if there are any significance
differences among the two classes before joining
them with the research.
VI. DATA ANALYSIS
The drawn box plots for each data set showed that
all the data were normally distributed without any
significance outlier among them. So, the average
marks of the tests obtained by the students of each
classes are calculated. Level of significance is
considered as 0.05 while the two samples are
analyzed and compared using the ‘Independent
Samples T-test’. The results of the Independent
Samples T- test are presented in Table 2.
Table 2. Summary of average marks of the Independent
Samples T- tests
Class
Mean of 2nd
& 3rd
Term
Tests
First Phase
Means of
Test set 1
Means of Test
set 2
Class A 64.150 68.667 72.000
Class B 68.200 72.500 75.333
P value 0.071 0.141 0.222

157
Above P values are named as, P1=0.071, P2=0.141
and P3=0.222. Means of 2nd
& 3rd
term tests of class
A and B are compared having hypothesizes as
below.
H1: There is a significance difference among two
groups (A and B) before they face tests.
H0: There is no any significance difference among
two groups (A and B).
P1 being higher than the level of significance (0.05)
proves that there is no difference between the
average marks of the students of class A & B,
initially before they participate in the research. It
shows that both classes are equal in their average
level of IQ initially. P2 and P3 show that exposure to
music during IQ tests during the research has made
no any significance difference on the performance
of two groups (A and B).
Furthermore, the followings are the assumptions
made in order to compare samples using
“Independent Samples T-test”. Dependent variable
(IQ level of students) is continuous (Scale is ratio).
And also the Independent variable has two
categories as class A (with music) and class B
(without music). The data observed from two
samples were totally independently from each
other. No any student represented both of the
classes at the same time throughout the whole test.
VII. OUTCOME
Hypothesis disproved. Exposure to music during the
tests has no any significance difference on the
performance in the IQ level of the students.
VIII. FURTHER RESEARCHABLE AREAS
During the research it was unable to conduct tests
having music, more than six times, twice a month
for a duration of three months. The difference of
the performance of two samples may be
measurable more accurately if the tests were
conducted throughout a period of few years. When
selecting the sample of the research, a mix school
was selected. But the percentage of gender within a
class was not taken in to consideration. But it is vital
to go on checking the impact of music for the
performance of the students considering the gender
difference of them as well as checking the
responses of the students with no gender
specification.
The students were checked providing IQ test only.
But the given music may affect specially on their
mathematical skills and reading skills. Or even they
may affect the chemical balance of the brains. Or
else the physical features such as blood pressure,
heart rate and etc. Those areas should also be
tested.
Western or Eastern classical music differ from
relaxation music. So their impact on humans also
vary. Music in the world which differs due to
language, land and religion may impact on various
sets of people in each and every nook and corner of
the world differently.
Attention of the study was towards healthy children
of 10 to 11 years of age. But it was not towards
children with special needs. As Sousa (2001) says,
those who suffer from mental or physical disorders,
reading, writing or another kind of educational
disorders which affect education may respond to
given music in different manners. And also,
students who have special abilities or skills respond
to music in a different manner. So both categories
should be considered for the study.
IX. CONCLUSION
In conclusion this paper is part of an ongoing
research in the area of music as a learning aid for
education. The initial phase of the study for the
base was conducted to empirically investigate
whether the music can enhance the outcome of
education of primary students. The test designed
and conducted disproved the laid hypothesis in this
paper. Yet it is required to carry the test for several
times to bring the solid demarcation for the findings
of the research.
ACKNOWLEDGMENT
The principal of Piliyandala Central College Capt.
Darshana Udawaththage should be thanked along
with the staff, especially Mrs. HD Sandya
Karunarathna. The Prefect board and all the
students of grade 6 of the school should be
remembered with immense pleasure. Furthermore,
Mr. P Dias of the Department of Statistics, Faculty
of Applied Sciences in the University of Sri
Jayawardhanapura should also be acknowledged.
Dr. Namali Sirisoma and Ms. Dushanthi Lokuge of
Department of Management and Finance, Dr.
Lakshika Liyanage of Department of Social Sciences
and Ms. Vasuki Jayasinghe of Department of

158
Languages of Faculty of Management, Social
Sciences and Humanities of General Sir John
Kotelawala Defense University should be also
thanked.
REFERENCES
Amarasinghe S (2014).
<http://www.island.lk/index.php? page_
cat=article-details&page=article-
details&code_title= 9 5455> The
Grade 5 Scholarship Exam and
psychological stress. What are the
alternatives? Accessed 10 July 2014.
Anon (2014).
<http://www.businessdictionary.com/defi
nition/ education.html>Education. Accessed
on 25 June 2014.
Armstrong P (2001).
<http://cft.vanderbilt.edu/guides-sub- page
s/blooms-taxonomy/> Centre for
teaching. Accessed 17 July 2014.
Carr K (2014).<http://humanorigins.si.edu/human-
characteris tics/brain> What does it
mean to be human?
Accessed 31 July 2014.
Cherry K (2014).
<http://psychology.about.com/od/educat
ional psychology/f/educational-
psychology.htm> What is Psychology?
Accessed 12 July 2014.
Ford D J (2011).
https://www.trainingindustry.com/conte
nt- development/articles/how-the-
brain-learns .aspx Content Development.
Accessed 06 July 2014.
Miller RA (1982).
<http://www.nwbotanicals.org/oak/newp
hysics/brainwave.htm> Neural Feedback
and Brainwave Training. Accessed 26
June 2014.
Logsdon A (2014)
<http://learningdisabilities.about.com/od
/glos sar1/a/i ntelligencetes.htm>
Understanding Intelligence Testing for
Children. Accessed 15 July 2014
Semrud-Clikeman M (2014).
<http://www.apa.org/education
/k12/brain-function.aspx#> Research in
Brain Function and Learning. Accessed
09 July 2014.
Smith A (2010).
<http://www.psychologytoday.com/blog/
healt- connections/201004/can-our-
childhood-really- predict-our-
future>Phycology Today. Accessed 15 July
2014.
Smithsonian (2014).
<http://humanorigins.si.edu/human- char
acteristics/brains> Brain. Accessed 10 July
2014.
Steele L (2014).
<http://www.backyardpoultrymag.com/does-
playing- classical-music-benefit-
yourchickens/?
blogger=lsteele,%202014>Does Playing
Classical Music Benefit your Chickens?
Accessed 13 July 2014.
Thompson K (2014).
<http://www.bioteams.com/2012/11/05/t
he_five_major.html> The five major theories
of how people "learn". Accessed 15 July
2014.
Treve Z (2012).
<http://www.unicef.org/infobycountry/tanzan
i a_65313.html> Locally sourced teaching aids
are engaging students and improving
education.Accessed 15 July 2014.
JOURNALS
Bilhartz TD, Bruhn RA, & Olson JE (1999). The Effect of
Early Music Training on Child Cognitive
Development [online] Journal of
Applied Developmental
Psychology,4(20),pp.61536<http://www.artse
dsear ch.org/summaries/the-effect-of-
early-music- trai ning -on-child-
cognitive-development >
Gold BP, Frank MJ, Bogert B and Brattico E (2013)
Pleasurable music affects reinforcement
learning according to the listener. [online]
Frontiers in

159
Psychology.4(August).<http://journal.frontiers
in.g/
Journal/10.3389/fpsyg.2013.00541/abstract >
BOOKS
Christa KM and Benno R (2007). Adrenal Stress
Hormones and Enhanced Memory for
Emotionally Arousing Experiences.
Neural Plasticity and Memory. From
Genes to Brain Imaging. Boca Raton,Florida:
crc press.
Gamman D and Bragdon AD (2003). Building Mental Music 2nd ed. Yarmouth.Brainwaves.
Sousa DA, (2007) .How the special needs brain learn.
Califonia: Crowin Press.
Dib CZ (1987). Formal, non-formal and informal e
education: concepts/applicability.
Oaxtepec, Cooperative Networks in
Physics Education, pp. 1,2,10.
Fitzpatrick KR, Jacqueline C. Henninger DM. Taylor,
(2014). Access and Retention of
Marginalized Populations within
Undergraduate Music Education Degree
Programs. Research in Music Education, 62(2),
pp. 105-127. VIDEOS
PURERELAX.TV (2013), Relaxation For Children - Music
for Learning, Quiet, Positive,
Harmony.video.26 June 2013. Viewed on
15 January 2014.
https://www.youtube.com/watch?v=VzrHvw
WjXEs
BIOGRAPHY OF AUTHORS
1Author is a second year Undergraduate
of Management and Technical Science
degree program conducted in Kotelawala
Defense University Sri Lanka. His research
interests include education, Psychology
and music.
2Author is a second year Undergraduate
of Management and Technical Science
degree program conducted in Kotelawala
Defense University Sri Lanka. His
research interests include education,
Psychology and Pharmacology.
160
Animal Figures found from Mosaic designs at Karagampitiya Subodharamaya
Piyumi Embuldeniya
Department of Archaeology, University of Kelaniya, Sri Lanka
Abstract— The main objective of this research
paper is to explicate about animal figures found in
Sri Lankan mosaic designs with special reference
to mosaics at Karagampitiya Subodharamaya. The
methodology of this research paper consists with
field research and library survey methods; field
research method was highly emphasized to collect
data. This temple has a great significance in terms
of archaeological, anthropological, historical and
art historical aspects. Karagampitiya
Subodharamaya is located at Karagampitiya village
in Dehiwala divisional secretariat which belongs to
Colombo district in Western province. It has an
extended history from the period of king
Parakramabahu VI (1412 - 1467 AD) and it
underwent several changes during the colonial
period of Sri Lanka. A piece of art work created by
placing coloured segments of tiles, porcelain, glass,
stones and coins in a pattern to create a picture is
called as Mosaic art. This art tradition has a ranged
history from BC and in the world Mosaic art,
developed in various periods according to the
subject and features. Floral figures, animal figures,
geometric shapes and some other objects which
were created with mosaic art tradition could be
seen at the Image house and at the Sathsathige.
Among these mosaic designs at the image house;
animal figures can be considered as a limited art
historical source due to the used features,
structures, colours and shapes. According to the
collected data, it could be identified that both real
and mythical animal figures; such as Tusker, Horse,
Lion, Bull, Rabbit, Goat, Unicorn, Fish, Peacock,
Parrot, Hen and Snake were designed using mosaic
designs. These animal figures could be categorized
as birds, quadruped, reptiles and fish. As per the
main objective; foreign influences and special
features of created animal figures, reasons for
designed animal figures, present situation and
reasons for weathering of mosaic designs are also
discussed in this research paper.
Keywords— Art History, Karagampitiya
Subodharamaya, Mosaic
I. INTRODUCTION
According to the main objective of this research
paper animal figures found from mosaic designs at
Karagampitiya Subodharamaya, are analysed in
detail. In this research; field research and library
survey methods were used to collect data.
However, as the methodology of this research; field
research method was highly emphasized. This
research paper discusses about the historical
background of Karagampitiya Subodharamaya,
historical background and development of mosaic
art, mosaic designs at Karagampitiya
Subodharamaya, animal figures found in mosaic
designs at Karagampitiya Subodharamaya and
special features of these animal figures.
Karagampitiya Subodharamaya is generally known
as “Karagampitiya Temple” because it is located at
Karagampitiya village.
The historical background indicates, that during the
Kotte period (1412 - 1467), King Parakramabahu VI,
gifted the village “Madimala” to the Natha devala
at Papiliyana. According to the legends, the western
section of the village Madimala was known as
“Karagampitiya” and the eastern section of
Madimala was known as “Nadimala”.
Karagampitiya village used to supply coconut and
fish to the Kotte Palace (Chutiwongs, 1990).
King Parakramabahu VI, built a devala at the
bottom of a Nā tree (Mesua ferrea) on the hillock of
Karagampitiya; to protect the fishermen from
foreign attacks and to have blessings of God. During
the Portuguese period, the devala was destroyed
and its stone pillars were used to build St.
Anthony’s Church at Mt. Lavinia. During the Dutch
period, a Dutch Church and a Resting place
(Ambalama) were built at Karagampitiya. The
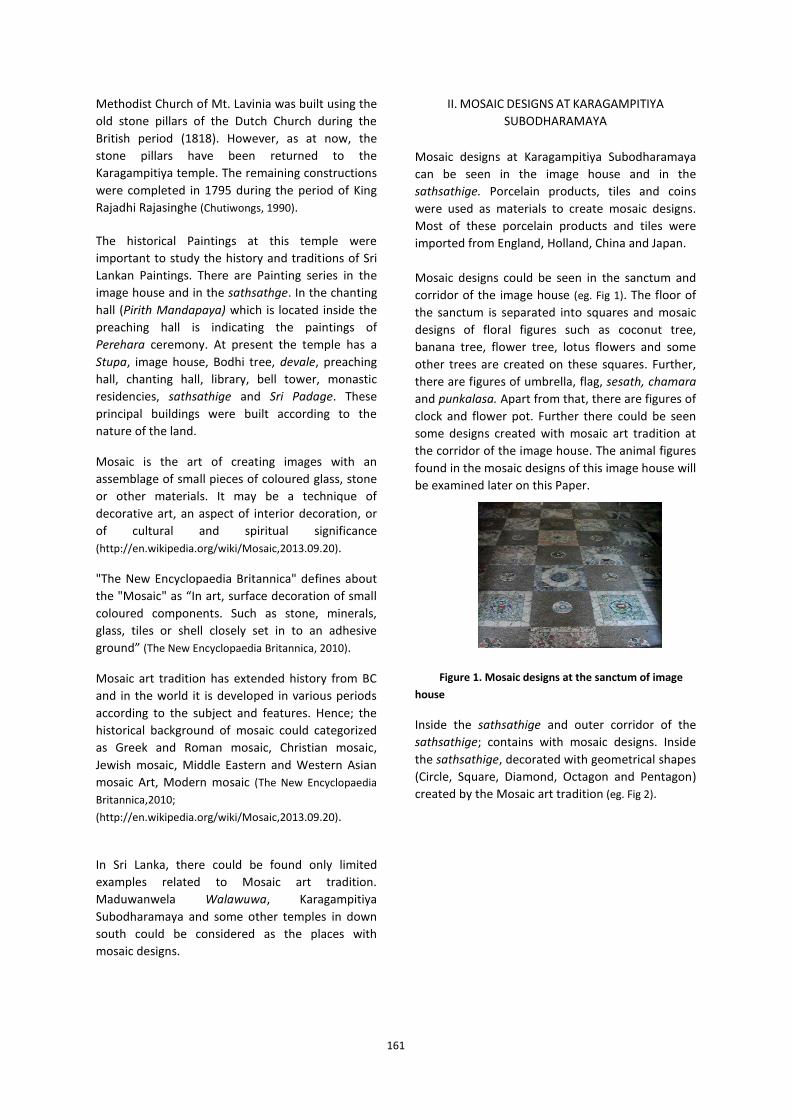
161
Methodist Church of Mt. Lavinia was built using the
old stone pillars of the Dutch Church during the
British period (1818). However, as at now, the
stone pillars have been returned to the
Karagampitiya temple. The remaining constructions
were completed in 1795 during the period of King
Rajadhi Rajasinghe (Chutiwongs, 1990).
The historical Paintings at this temple were
important to study the history and traditions of Sri
Lankan Paintings. There are Painting series in the
image house and in the sathsathge. In the chanting
hall (Pirith Mandapaya) which is located inside the
preaching hall is indicating the paintings of
Perehara ceremony. At present the temple has a
Stupa, image house, Bodhi tree, devale, preaching
hall, chanting hall, library, bell tower, monastic
residencies, sathsathige and Sri Padage. These
principal buildings were built according to the
nature of the land.
Mosaic is the art of creating images with an
assemblage of small pieces of coloured glass, stone
or other materials. It may be a technique of
decorative art, an aspect of interior decoration, or
of cultural and spiritual significance
(http://en.wikipedia.org/wiki/Mosaic,2013.09.20).
"The New Encyclopaedia Britannica" defines about
the "Mosaic" as “In art, surface decoration of small
coloured components. Such as stone, minerals,
glass, tiles or shell closely set in to an adhesive
ground” (The New Encyclopaedia Britannica, 2010).
Mosaic art tradition has extended history from BC
and in the world it is developed in various periods
according to the subject and features. Hence; the
historical background of mosaic could categorized
as Greek and Roman mosaic, Christian mosaic,
Jewish mosaic, Middle Eastern and Western Asian
mosaic Art, Modern mosaic (The New Encyclopaedia
Britannica,2010;
(http://en.wikipedia.org/wiki/Mosaic,2013.09.20).
In Sri Lanka, there could be found only limited
examples related to Mosaic art tradition.
Maduwanwela Walawuwa, Karagampitiya
Subodharamaya and some other temples in down
south could be considered as the places with
mosaic designs.
II. MOSAIC DESIGNS AT KARAGAMPITIYA
SUBODHARAMAYA
Mosaic designs at Karagampitiya Subodharamaya
can be seen in the image house and in the
sathsathige. Porcelain products, tiles and coins
were used as materials to create mosaic designs.
Most of these porcelain products and tiles were
imported from England, Holland, China and Japan.
Mosaic designs could be seen in the sanctum and
corridor of the image house (eg. Fig 1). The floor of
the sanctum is separated into squares and mosaic
designs of floral figures such as coconut tree,
banana tree, flower tree, lotus flowers and some
other trees are created on these squares. Further,
there are figures of umbrella, flag, sesath, chamara
and punkalasa. Apart from that, there are figures of
clock and flower pot. Further there could be seen
some designs created with mosaic art tradition at
the corridor of the image house. The animal figures
found in the mosaic designs of this image house will
be examined later on this Paper.
Figure 1. Mosaic designs at the sanctum of image
house
Inside the sathsathige and outer corridor of the
sathsathige; contains with mosaic designs. Inside
the sathsathige, decorated with geometrical shapes
(Circle, Square, Diamond, Octagon and Pentagon)
created by the Mosaic art tradition (eg. Fig 2).
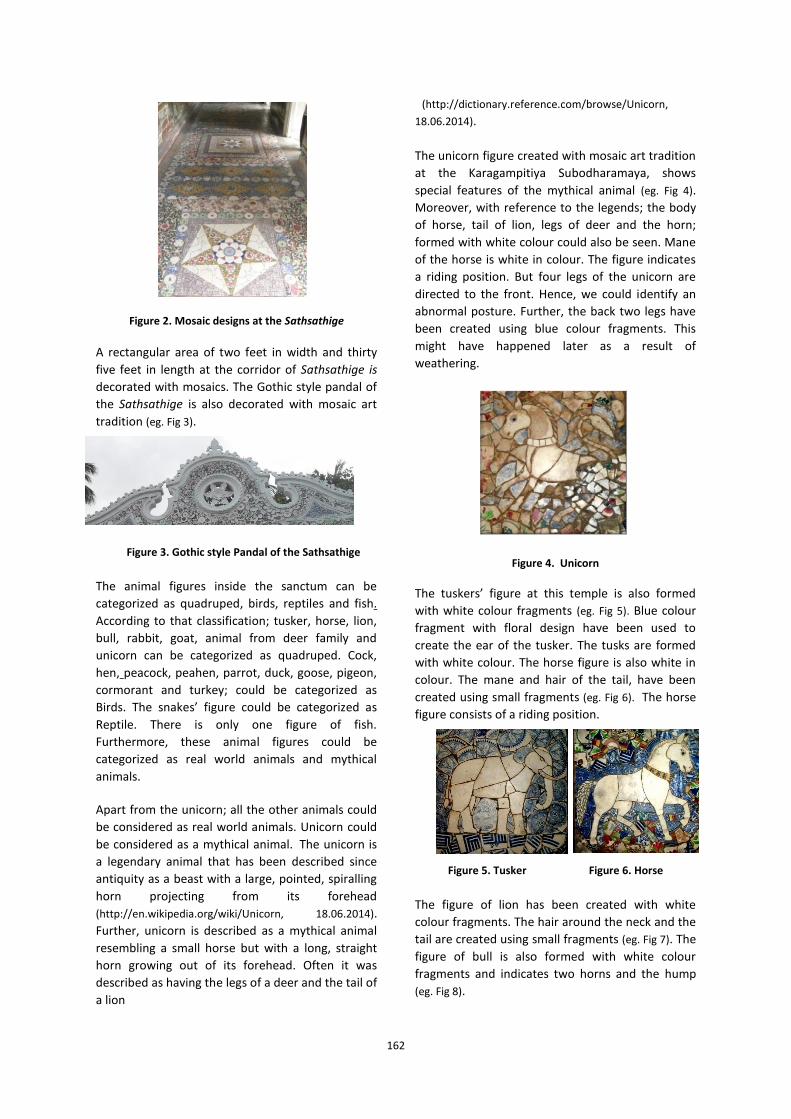
162
Figure 2. Mosaic designs at the Sathsathige
A rectangular area of two feet in width and thirty
five feet in length at the corridor of Sathsathige is
decorated with mosaics. The Gothic style pandal of
the Sathsathige is also decorated with mosaic art
tradition (eg. Fig 3).
Figure 3. Gothic style Pandal of the Sathsathige
The animal figures inside the sanctum can be
categorized as quadruped, birds, reptiles and fish.
According to that classification; tusker, horse, lion,
bull, rabbit, goat, animal from deer family and
unicorn can be categorized as quadruped. Cock,
hen, peacock, peahen, parrot, duck, goose, pigeon,
cormorant and turkey; could be categorized as
Birds. The snakes’ figure could be categorized as
Reptile. There is only one figure of fish.
Furthermore, these animal figures could be
categorized as real world animals and mythical
animals.
Apart from the unicorn; all the other animals could
be considered as real world animals. Unicorn could
be considered as a mythical animal. The unicorn is
a legendary animal that has been described since
antiquity as a beast with a large, pointed, spiralling
horn projecting from its forehead
(http://en.wikipedia.org/wiki/Unicorn, 18.06.2014).
Further, unicorn is described as a mythical animal
resembling a small horse but with a long, straight
horn growing out of its forehead. Often it was
described as having the legs of a deer and the tail of
a lion
(http://dictionary.reference.com/browse/Unicorn,
18.06.2014).
The unicorn figure created with mosaic art tradition
at the Karagampitiya Subodharamaya, shows
special features of the mythical animal (eg. Fig 4).
Moreover, with reference to the legends; the body
of horse, tail of lion, legs of deer and the horn;
formed with white colour could also be seen. Mane
of the horse is white in colour. The figure indicates
a riding position. But four legs of the unicorn are
directed to the front. Hence, we could identify an
abnormal posture. Further, the back two legs have
been created using blue colour fragments. This
might have happened later as a result of
weathering.
Figure 4. Unicorn
The tuskers’ figure at this temple is also formed
with white colour fragments (eg. Fig 5). Blue colour
fragment with floral design have been used to
create the ear of the tusker. The tusks are formed
with white colour. The horse figure is also white in
colour. The mane and hair of the tail, have been
created using small fragments (eg. Fig 6). The horse
figure consists of a riding position.
Figure 5. Tusker Figure 6. Horse
The figure of lion has been created with white
colour fragments. The hair around the neck and the
tail are created using small fragments (eg. Fig 7). The
figure of bull is also formed with white colour
fragments and indicates two horns and the hump
(eg. Fig 8).
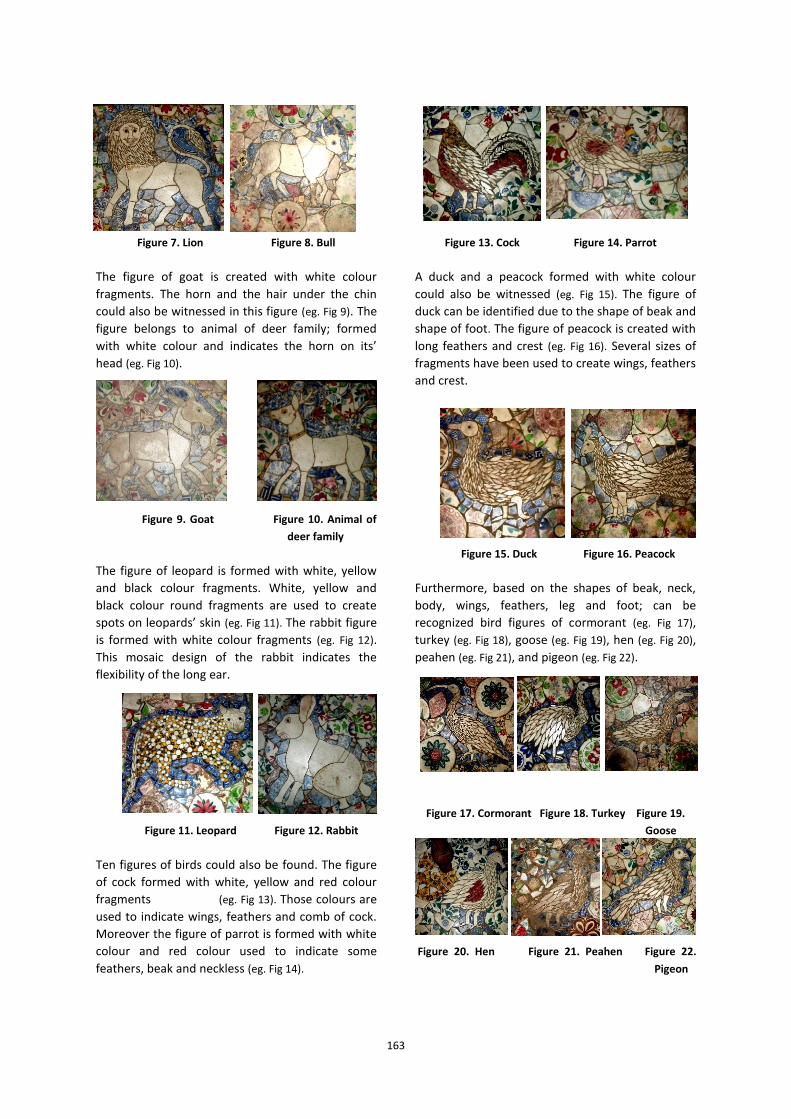
163
Figure 7. Lion Figure 8. Bull
The figure of goat is created with white colour
fragments. The horn and the hair under the chin
could also be witnessed in this figure (eg. Fig 9). The
figure belongs to animal of deer family; formed
with white colour and indicates the horn on its’
head (eg. Fig 10).
Figure 9. Goat Figure 10. Animal of
deer family
The figure of leopard is formed with white, yellow
and black colour fragments. White, yellow and
black colour round fragments are used to create
spots on leopards’ skin (eg. Fig 11). The rabbit figure
is formed with white colour fragments (eg. Fig 12).
This mosaic design of the rabbit indicates the
flexibility of the long ear.
Figure 11. Leopard Figure 12. Rabbit
Ten figures of birds could also be found. The figure
of cock formed with white, yellow and red colour
fragments (eg. Fig 13). Those colours are
used to indicate wings, feathers and comb of cock.
Moreover the figure of parrot is formed with white
colour and red colour used to indicate some
feathers, beak and neckless (eg. Fig 14).
Figure 13. Cock Figure 14. Parrot
A duck and a peacock formed with white colour
could also be witnessed (eg. Fig 15). The figure of
duck can be identified due to the shape of beak and
shape of foot. The figure of peacock is created with
long feathers and crest (eg. Fig 16). Several sizes of
fragments have been used to create wings, feathers
and crest.
Figure 15. Duck Figure 16. Peacock
Furthermore, based on the shapes of beak, neck,
body, wings, feathers, leg and foot; can be
recognized bird figures of cormorant (eg. Fig 17),
turkey (eg. Fig 18), goose (eg. Fig 19), hen (eg. Fig 20),
peahen (eg. Fig 21), and pigeon (eg. Fig 22).
Figure 17. Cormorant Figure 18. Turkey Figure 19.
Goose
Figure 20. Hen Figure 21. Peahen Figure 22.
Pigeon

164
The figure of snake represents the category of
reptiles. Blue, yellow and white colour fragments
have been used to form the snake figure in mosaic
art tradition (eg. Fig 23). The body of the snake has
been formed with dotted blue colour fragments, to
illustrate the texture of the real snake skin. Further,
it indicates the features of the snake head.
Moreover, a figure of fish has been formed with
white colour fragments (eg. Fig 24) and it indicates
the features of a real fish. Such as scales on skin,
operculum (gill cover), dorsal fin, pectoral fins, anal
fin, pelvic fins and caudal fin.
Figure 23. Snake
Figure 24. Fish
Therefore, based on these animal figures, we could
assume that they have unique features. All the
animal figures have been created with white colour
and the fragments consists with shapes of animal
body. Such as legs, heads and horns. Having
analyzed the animal figures in Art historical aspects
can be recognizes that the Artist used white colour
for animal body and used particular colours to
indicate special features of animals.
Eg: - Parrots’ necklace (eg. Fig 14), Leopards’ skin (eg.
Fig 11), feathers of birds (eg. Fig 13, 14, 20).
When concerning the figures of quadruped; it could
be witnessed that the artist has included lions’ and
horse hairs (eg. Fig 6, 7), bulls’ hump (eg. Fig 8),
leopards’ skin (eg. Fig 11), various shapes of legs and
feet, ears, eyes, mouths and tails, tuskers’ tusk,
bulls’, goats’ horn. Having analyzed the figures of
birds we could identified various types of beaks,
wings and feathers, various shapes of eyes, mouths,
legs, feet, comb (eg. Fig 13, 20), and crest (eg. Fig 16,
20). Including the particular features of animals in
these mosaic designs, were important in art
historical aspect. Generally the mosaic artist
created an outline around the animal figures by
using blue colour fragments (eg. Fig 5-12, 15-22, 24).
Because of that the animal figures were highlighted
from the background. Further, we could see
different shapes and different sizes of fragments
used to form the shape of quadrupeds’ body
structures and feathers of birds. Moreover, can be
seen the features of animal faces by engraving the
porcelain products (eg. Fig 6, 7, 11, 12, 17,
20, 23, 24). The mosaic artist has included a belt
around the necks of horse, goat and animal of deer
family (eg. Fig 6, 9, 10). That may indication of
domestication. However, could be seen a belt
around the neck of the unicorn (eg. Fig 4).
Apart from that, can be seen two special
components of mosaic design could be seen at the
two entrances of sanctum at the Image house. One
is consists of two lion figures and a figure of flower
pot (eg. Fig 25). Other one consists of two unicorn
figures and figure of a flower pot (eg. Fig 26). These
two components illustrates a combination of Sri
Lankan and foreign culture.
Figure 25. Mosaic design at the entrance of sanctum
Figure 26. Mosaic design at the entrance of sanctum
At present; the floor mosaics at Karagampitiya
Subodharamaya have been destroyed due to
165
lightning of oil lamps, carelessness, lack of proper
cleaning, new constructions and some human
activities. Thus, it is a paramount
importance that we implement proper methods to
protect this limited source. Commencing awareness
programs could be one solution to this problem.
Further, as a conservation method can be fixed a
hard glass cover could be fixed on the floor which is
decorated with mosaic art tradition.
III. CONCLUSION
Havin studied the animal figures at Karagampitiya
Subodharamaya; it could be identified there is a
great significance of these figures due to the
uniqueness of forming special features of animals,
managing various shapes, limited colours and
difference size fragments to create figures and the
limitation of animal figures formed by mosaic art
tradition in Sri Lanka. In my point of view there is a
combination of Sri Lankan and foreign cultures
which is confirmed by the figure of unicorn, which
mostly belongs to the legends in foreign cultures.
Apart from that, the animal figures formed at this
image house; can be considered as a continuous
process of using animal figures in Sri Lankan art
history. Furthermore, it could be assumed these
animal figures were used for fill the space at the
floor of image house. Moreover, mosaic designs at
Karagampitiya Subodharamaya have great
significance of art historical, archaeological and
historical aspects. Because of that, should have to
protect these limited art historical Source.
ACKNOWLEDGMENT I would like to convey my acknowledgment to the Department of Archaeology of University of Kelaniya, Karagampitiya Subodharama Viharaya and my Family.
REFERENCES
Bandaranayaka, S. (2006) The Rock and Wall Painting of
Sri Lanka. Stamford Lake Publication: Pannipitiya.
Chutiwongs, N. & Prematilleke, L. & Silva, R. (1990)
Paintings of
Sri Lanka – Karagampitiya. Archaeological Survey of
Sri Lanka Centenary Publication: Central Cultural
Fund, Colombo.
Dunbabin, K. M. D. (1999) Mosaic of the Greek and
Roman World. Cambridge University Press.
Hachlili, R. (2009) Ancient Mosaic Pavements.
Netherland.
Pelfrey, R. & Pelfrery, M. (1985) Art and Mass Media.
Harper & Row Publishers, Newyork.
The New Encyclopaedia Britanicca: Volume 8, (2010)
Encyclopaedia Britanicca Inc: Chicago.
Mosaic, <http://en.wikipedia.org/wiki/Mosaic> Accessed
20 September 2013.
The New Encyclopaedia Britannica, (2010)
<http://en.wikipedia.org/wiki/Mosaic> Accessed 20
September 2013.
<http://dictionary.reference.com/browse/Unicorn>
Accessed 18 June 2014).
<http://en.wikipedia.org/wiki/Unicorn> Accessed 18
June 2014).
Field Reseach- Karagampitiya Subodharamaya.
BIOGRAPHY OF AUTHOR
1Author is an Assistant Lecturer of
Department of Archaeology, University
of Kelaniya, Sri Lanka. Her
research interests include
Art history and Ancient Architecture of
Sri Lanka and Asia, Ethno - archaeology and
Archaeological Tourism.
Photograph
Author 1

166
Fashion Syntax: Concept of Contextual Dependence
Priyanka Virajini Medagedara Karunaratne
Senior Lecturer, Fashion Design & Product Development, Department of Textile & Clothing Technology, Faculty of Engineering, University of Moratuwa, Sri Lanka
Abstract— Fashion is a mode of language where
man’s has the ability to transcend his expression.
Like language in this sense, dress functions as a kind
if syntax, according to a set of more or less constant
rules depending on whether it is dealing with
traditional costume fashion. When article of
clothing (item) and new dress forms have many
possible meanings there is likely to be a certain
degree of ambiguity. Moreover among the articles
of clothing that are worn together many have
numerous possible meanings and they also interact
with one another to produce additional ambiguities.
A contextual perspective allows people to manage
and perceive appearances in everyday life, or the
historical contexts in which people find them. The
contextual approach enhances the people’s
understanding not only of appearance from
people’s viewpoints, but also how common such
viewpoints are within a culture. The process of
contextualizing allows people to see changes in the
meanings of dresses as contexts dissolve into one
another.The Kotte period of Sri Lanka marked the
culmination of emerging novel dress features. The
existing fashions were mixed and matched with
South Indian and traditional Sri Lankan items of
clothing. With the Portuguese invasion novel dress
fashions were introduced with new articles (items)
such as attached collar (tippet), buttons, cuffs, hats,
and new dress forms like trouser (pantaloon) coat
(cabaya) and jacket (hettaya). The royalties
adopted new dress features into their original
native dress. The objective of the present research is
to explore how the articles of clothing and new
dress forms mediated through fashion language
and created new and different meanings in different
contexts. The qualitative research method was
adopted for the research.The research reveals that
a fresh or new style may appear inappropriate
when it is first introduced, but its novelty is essential
to the arousal of interest in perceivers.
Keywords— Contextual perspective, fashion
language, social situation
I. INTRODUCTION
During the sixteenth century the Kotte era (1411-
1597AD) marked a new turning point in Sri Lankan
dress fashion. The Portuguese conquered the island
and established their power gradually throughout
the lowlands of Sri Lanka including Kotte. Their
influences in political, economic, cultural and social
strata were huge anddirectly affected the lives of
people of the society. By this time the royalty was
directly inspired by western sartorial trends and led
drastic changes in the way of practicing traditions
of Sri Lankan fashion forms.
The royalty had direct contacts with the Portuguese
Kings and diplomats and they embraced certain
items of dresses, mixed and mingled with their
traditional dress and created a novel dress. This
process of mingling, of mixing and matching of
several dress details is called hybridization and
showed a dramatic composition of western, south
Indian and Sri Lankan dress details. The royalty
inspired the Portuguese dress items such as
attached collar (tippet), buttons, cuffs, hats, and
new dress forms like trouser (pantaloon) coat
(cabaya) and jacket (hettaya).Besides they created
novel dress forms by mixing the new items into
their original native dress. The objective of the
present research is to identify what type of articles
of clothing did royalty inspired and embraced and
how did they created their new dress forms and
represented themselves in different occasions
which assigned different meanings in order to the
each contexts. The fashion language of the novel
dress forms brought a huge impact to the
successors of the royalty and for the elites who
served the King as fashion is trickled down from the
supreme to the rest of the strata of the society. The
historical narrations of Sri Lankan dress fashions of
the royalties show that the religion of the particular
society played a pivotal role in forming the ideology
of the wearer. However consequently with the
advent of the Portuguese to Ceylon in 1505 AD the

167
state religion was instrumental in changing the
ideology of the royalty after their conversion to
Christianity.
A qualitative method has been adopted for this
research. The conceptual frame work of the study is
based on the Semiotic model. The Semiotic model
seems to be a more plausible and relevant theory in
the matter of understanding how meanings are
generated. Semiotics is a model or theory of signs
and revealed meanings by social interaction.
Sequence of in-depth observational studies carried
out with temple murals, cloth paintings, wood and
stone carvings, sculptures and special ivory carvings
at Munich Treasury in Germany along with the
continuous literature review. In the research many
multiple observations were carried out. A protocol
or a particular system for recording information is
needed to note observations on the field. Therefore
observations are recorded as descriptive notes with
multiple descriptive sketches. Descriptive notes
include description of physical setting, important
features of the painting, or sculpture, several series
of sketches of distinctive details, parts, features,
forms and shapes of observed dresses and
personalities. Demographic information was also
included with dates, names of the places and field
settings.
For literature review used documented
manuscripts, chronicles, books, original records of
foreign travellers, published research pertaining to
the area and inscriptions used for gather and sort
data. The process of the research is inductive; the
researcher builds abstractions, concepts and
theories from details.
Validity of the data were confirmed with cross
checking literary sources along with random
interviews with selected scholars, artists , village
headmen, high priests of the selected temples with
gathered images. Data analysis was conducted as
an activity simultaneously with data collection, data
interpretation and writing narrative sub topics.
There are several simultaneous activities involved
in the research process. The analysis is based on
reduction (de- contextualizing) and interpretation
(re- contextualizing).
Among the period dress fashions selected dresses
such as Long coat (cabaya) collars (tippet) Short
jacket (hettaya) Short jacket with collar (manthe
hettaya) Long cloth (thuppotti) and Trouser
(pantaloon) were observed and analyzed. The
systematic pictorial analysis reveals many new
meanings created, which influenced transmission of
its “context”.
II. FASHION: A VISUAL COMPONENT
In cognitive sciences, the perspective of a social
significance is linked to taste and the sense.
Stereotypical repetition of types of behaviour and
images, filters, encrusted with sense and the senses
where signs, especially visual signs become
imperatives. Fashion is its visual component, is
communicated as the new, the unexpected, the
unpredictable, but also signifies possible meanings
to the society.
A. Fashion Syntax
Articles of clothing (items) have possible meanings.
Sometimes it relates or differences are brought in
ways in which items succeed each other or combine
together in a chain of discourse. This can be
considered as the difference between things that
may come before and after one another. When a
person chooses body adornments, attention is
usually paid to how well the person’s choice of
head dress, lower body dress, jewellery, for
example, considering the king’s attire, fit together
as an ensemble. Furthermore difference could be
seen between the crowns, lower body dress,
jewellery and accessories of the king’s attire. All
were necessary to form or signify the whole king’s
attire.It is also the difference between the lower
body dress, head dress, jewellery, and accessories
of other males’ dress. The king would normally
wear a crown, jewellery and lower garment. All
were necessary to form the signifying whole of the
ensemble.
Each area of the body from the top of the head to
the toes can be a location for the articulation of
styles of dress. According to the paradigmatic
relation similaritems of dresses can be classified
theoretically. The relationship between items in a
paradigm is ‘this or this or this’ also it runs
horizontally. (Barnard 2002, 90) At every location of
the body, the person has a choice regarding how to
articulate with styles of adornment, whether to
wear a crown or not, a necklace or not and so
on.This pattern embedded in sign and sign systems
is identified by Roland Barthes as categorical
opposition. The choices are regulated by the
paradigmatic relation of the society’s particular

168
dress code. As a system of signification all dress
codes regulate all fashion alternatives such as size,
shape, colour, and style. (Gottdiener 1995, 38)
III. CONTEXTUAL PERSPECTIVE AND APPEARANCE
VIEW POINTS
Contextual perspective allows people to manage
and perceive appearances in everyday life
considering the actual social situations or as
historical contexts within a culture.
A. Cultural View Points Regarding Appearance
During the Kotte Period
The King was the culminating point of the pyramid
in society and represented the state and the centre
of political life. Beside the term Rajan and all other
terms, titles for the King already existed in Sanskrit
literature in Sri Lanka. The concept of King is
distinguished by the term Maharaja (Great king) or
Rajadhirajaiii (Ruler of the
King)(Pathmanathan,1986/87)Mahipathi (Lord of
the earth) andDeva(god).The title corresponds to
‘Our Majesty’.(Geiger 1960) Over a long time
throughout history culture built certain stereotypes
for the King as a living God that affected the
cognition of people in society. The representation
of the god in sculpture or in paintings therefore
could be hypothesizedas the representation of a
King. Because the artists of the period had no such
imagination of how the god should be represented,
he saw the live model of the King who was
considered the Lord of the earth.
The King used sixty four royal ornaments which he
had to wear at his consecration and at important
state occasions. These ornaments were also
signifiers and signified royalty. The King used fine
silks. He used a silk cloth for the lower dress and
shawls for head covering. It was because of the
culturally built social code regarding silk and fine
cotton that people understoodroyaltyor luxurious
sophistication. Coomaraswamy states that the
Sinhalese cotton was of a very different quality; ‘no
muslin was made, but the best stuffs were thick,
soft and heavy like the finest linen’. (1984, 196)The
dresses of the King were of white colour. Besides,
he wore a shawl of white colour. According to
tradition he used a white silk cloth to wrap the
head before the coronation crown was placed by
the Purohitha Brahmin. Here colour became the
signifier and signified purity. Tradition and the
culture give value to the colour white. The pictorial
references show that the King dressed differently
according to the day and the place where he should
be represented.
Figure1 Figure2
The King is at the senate at the audience hall
D. The Portuguese Influenced life style: Kings
became Christians and adopted the western
lifestyle
Sometime later in 1557 AD Prince Dharmapala
(grandson of King Buwanekabahu VII of Kotte) and
his queen were baptized with the names of Dom as
Dom Joao PareiraPandar (1557AD) at the hands of
Joao de Villa de Conde and the queen as Dona
Catherina. The Portuguese names were the fashion
at court. Baptism became a rebirth under a foreign
name and every female royal convert was dubbed
as Dona. To denationalize the race was not the
missionary’s object, and yet such was the inevitable
consequence of the course he pursued, for with
baptism came a rebirth under a foreign name and
every royal convert was dubbed a Dom.
It is noticed that most of the early kings of the
Kandyan era were educated under Portuguese
Franciscans and baptized by them. King
Wimaladharmasooriya 1(1591-1604) was one of
them, son of a noble called Wirasundara Mudaliyar
who was known among the Portuguese by the
name of Dom Joao de Austria Mudaliyar. However
from his childhood he was known as Konappu
Bandara. He embraced Buddhism after he became
the King of the Kandyan Kingdom, as it was an
important qualification for the kingship.However
his personal desires and Western attitudes could
not be eliminated from his dress sense. His
enthusiasm for Western culture was clearly evident
through early travellers’ notes. (Hulugalle 1999)
The son of King Senarath (1604-1635)
(Wimaladharmasuriya’s brother) King Rajasinga11
(1635-1687) also grew up in the Portuguese

169
environment and his dress habits show how he
changed his mind with the impact of the
environment he had grown up in. Knox’s
statements are quite important to understand the
King’s dress habits displayed throughout his life
time. Knox says, ‘he was not wont to keep to one
fashion, but changes as his fancy leads him’.
Furthermore careful observations of Knox state, ‘his
apparel is very strange and wonderful, not after his
own country fashion, or any other, being made
after his own invention’. (Knox 1958)
Prince Vijayapala (a petty prince of Matale
District) was also one of an interesting royal
character who had completely turnedintoa western
life style. On his coronation he dressed as an
English gentleman.An eye –witness, Captain Joao
Rebeiro said, ‘he was dressed in high black shoes,
lined with white satin, white stockings, and a short
cloak lined with white with rich buttons of gold, a
round bonnet of black velvet, with buckles of the
finest diamonds, and at the base of the aigrette a
jewel of great value encircled by a large number of
the costliest pearls, with gold lace over a vest of
white tissue. Round his neck he worn an eagle set
in a scallop shell, adorned and made entirely of
rubies’. His long hair was curled at the ends, and his
beard was worn in the Portuguese fashion, with a
moustache which was not very full.
(Pieris1927)These evidences show how the early
Kings of the Kandyan era eagerly embraced alien
Western dress and novel items of dresses.
III. THEPROCESS OF CONTEXTUALIZING
The process of contextualizing allows people to see
changes in the meanings of dresses as contexts. In
everyday life it is seen that contexts are prone to
dissolve into one another because people love to
get dressed in a different way. By the time of
conversion of the Sinhala Kings to Christianity the
Portuguese introduced novel dress items to the
traditional dress arena. The long sleeved upper
body coat or cabaya, the long sleevedupper body
short jacket or hettaya, short jacket with a broad
tippet or round collar, or short jacket with a broad
neckline without a collar or décolleté , trousers or
pantaloons and many accessories such as buttons,
hats, shoes ,belts and stockings. During the Kotte
era western meanings of dresses (contexts) were
mixed with traditional so called Sri Lankan
meanings of dresses leading to novel
interpretations.
Prince Dharmapala’s Long coat + Long cloth
King Mayadunne and King Raigam Bandara’s
circular neck lined short jacket +aLong cloth
King Wimaladharmasuriya’sshort jacket with
atippet + a Long cloth
King Senarath’sshort jacket +Long cloth
Prince Dharmapala coroneted in Lisbon and he
adopted the Portuguese long sleeved long coat
instead of covering his bare upper body with an
abundance of jewellery. He well manipulated such
dress items like a long coat with anunsown
wrapped long cloth or redda for the lower body.
Here the context of a long coat mediated in a
totally different social environment which the
contexts (meanings of dresses) already developed.
However when the long coat integrated with the
long unstitched wrapped cloth context was valued
based on different aspects of society. Then the
context becomes critical in the interpretation of
appearance. It became related to social and
physical construction of the body. As this is
mentioned in the above successors of Prince
Dharmapala followed the same dress practice. The
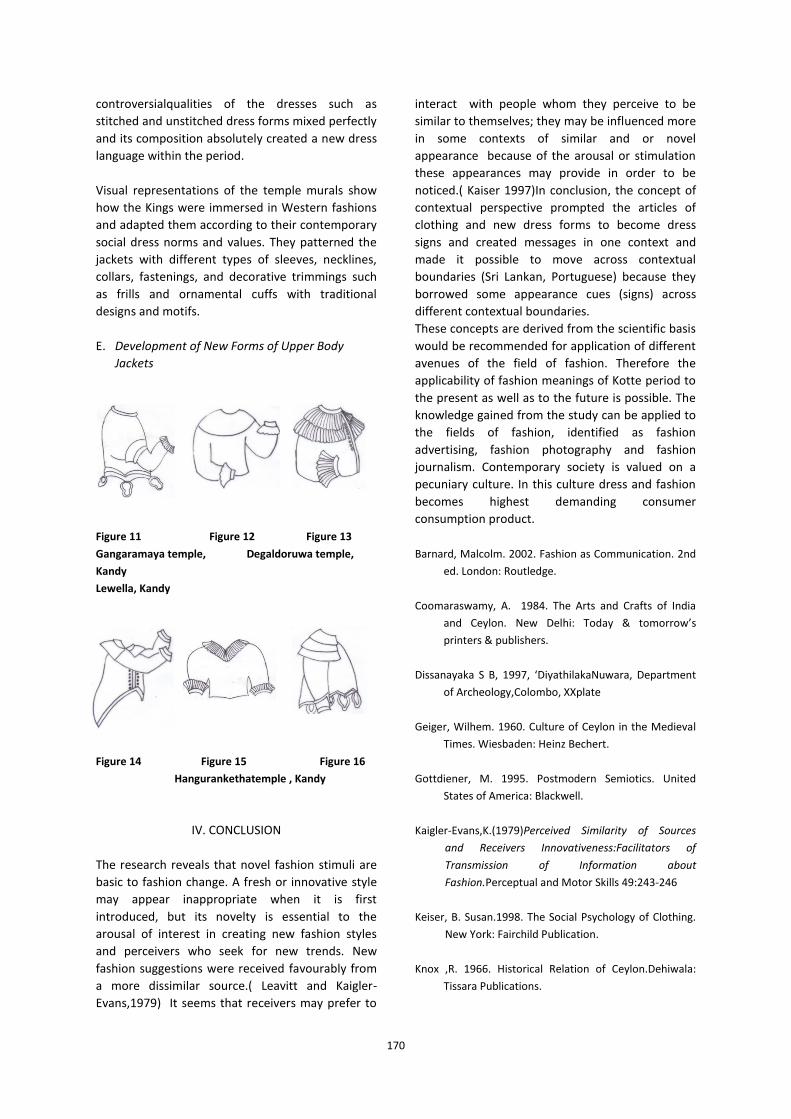
170
controversialqualities of the dresses such as
stitched and unstitched dress forms mixed perfectly
and its composition absolutely created a new dress
language within the period.
Visual representations of the temple murals show
how the Kings were immersed in Western fashions
and adapted them according to their contemporary
social dress norms and values. They patterned the
jackets with different types of sleeves, necklines,
collars, fastenings, and decorative trimmings such
as frills and ornamental cuffs with traditional
designs and motifs.
E. Development of New Forms of Upper Body
Jackets
Figure 11 Figure 12 Figure 13
Gangaramaya temple, Degaldoruwa temple,
Kandy
Lewella, Kandy
Figure 14 Figure 15 Figure 16
Hangurankethatemple , Kandy
IV. CONCLUSION
The research reveals that novel fashion stimuli are
basic to fashion change. A fresh or innovative style
may appear inappropriate when it is first
introduced, but its novelty is essential to the
arousal of interest in creating new fashion styles
and perceivers who seek for new trends. New
fashion suggestions were received favourably from
a more dissimilar source.( Leavitt and Kaigler-
Evans,1979) It seems that receivers may prefer to
interact with people whom they perceive to be
similar to themselves; they may be influenced more
in some contexts of similar and or novel
appearance because of the arousal or stimulation
these appearances may provide in order to be
noticed.( Kaiser 1997)In conclusion, the concept of
contextual perspective prompted the articles of
clothing and new dress forms to become dress
signs and created messages in one context and
made it possible to move across contextual
boundaries (Sri Lankan, Portuguese) because they
borrowed some appearance cues (signs) across
different contextual boundaries.
These concepts are derived from the scientific basis
would be recommended for application of different
avenues of the field of fashion. Therefore the
applicability of fashion meanings of Kotte period to
the present as well as to the future is possible. The
knowledge gained from the study can be applied to
the fields of fashion, identified as fashion
advertising, fashion photography and fashion
journalism. Contemporary society is valued on a
pecuniary culture. In this culture dress and fashion
becomes highest demanding consumer
consumption product.
Barnard, Malcolm. 2002. Fashion as Communication. 2nd
ed. London: Routledge.
Coomaraswamy, A. 1984. The Arts and Crafts of India
and Ceylon. New Delhi: Today & tomorrow’s
printers & publishers.
Dissanayaka S B, 1997, ‘DiyathilakaNuwara, Department
of Archeology,Colombo, XXplate
Geiger, Wilhem. 1960. Culture of Ceylon in the Medieval
Times. Wiesbaden: Heinz Bechert.
Gottdiener, M. 1995. Postmodern Semiotics. United
States of America: Blackwell.
Kaigler-Evans,K.(1979)Perceived Similarity of Sources
and Receivers Innovativeness:Facilitators of
Transmission of Information about
Fashion.Perceptual and Motor Skills 49:243-246
Keiser, B. Susan.1998. The Social Psychology of Clothing.
New York: Fairchild Publication.
Knox ,R. 1966. Historical Relation of Ceylon.Dehiwala:
Tissara Publications.
171
Pathmanathan, S,1986/87,Buddhism and Hinduism in Sri
Lanka: AD 1300- 1600, Kalyani, University of
Kelaniya, vol V/VI, p 102
Pieris P.E,1927, ‘The Prince Vijayapala of Ceylon’ (1634-
1654) from the original documents at Lisbon,
Colombo :CAC press,p.10
Silva, R. K. De and Beumer, W.G.M. 1988. Illustrations
and Views of Dutch Ceylon 1602-1796. London:
Serendib Publications.
BIOGRAPHY OF AUTHOR 1Author is a Senior lecturer of Fashion
Design and Product Development of
Textile and Clothing Technology,
University of Moratuwa.Sheobtained
her PhD in Integrated Design from the
Faculty of Architecture, University of Moratuwa in 2013
and credited as one of the first two PhD s in integrated
Design in Sri Lanka.She holds a BA (Hons) Fine Arts
Degree with a first class from the faculty of Arts,
University of Peradeniya in year 2000. She has
experience in lecturing for more than13 years. She
started her academic career as a temporary assistant
lecturer at the University of Peradeniya, visiting lecturer
at the faculty of Architecture, University of Moratuwa.
Sheis anartist who haswon several gold and silver
medalsatinternational and all island art competitions.
Note: The title rajiraja which came into vogue in the
island during the 12TH
century was applied to
Parakramabahu VI. In the case of Parakramabahu VI the
assumption of this epithet by him may have been
inspired by the revival of the power and influence of the
Sinhalese monarchy under him after a long period of
decline. He brought ‘the whole island under one
umbrella’ during his long eventful reign and this was
considered to be a remarkable achievement. To his
subjects the assumption of this epithet by
Parakramabahu VI may have implied his over lordship
over the kingdom and principalities which existed in the
Island at that time. The more prestigious Maharadhiraja
was commonly used in much of the Kotte period.
Photograph
Author 1
172
Trucking Industry Perceptions of Congestion Problems and Potential Solutions to Container Transportation in Sri Lanka
Lalith Edirisinghe1, Jin Zhihong2
1
Faculty of Management, CINEC Maritime Campus, Malabe, Sri Lanka; 2 College of Transportation Management, Dalian Maritime University
Abstract— Inland Container transportation is
coordinated and interacted between port terminals,
Container Freight Stations, exporters, consignees,
clearing agents, freight forwarders and primarily
container transport companies.
The key objectives of the study were to reveal the
perception of container transportation industrialists
with respect to road Congestion problems in Sri
Lanka; and propose recommendations to improve
the intermodal freight transportation.Therefore the
factors that make an impact on road congestion
namely, Road; Timing; Human; Vehicle; and
Weather were examined.
It was revealed from the study that the congestion
experienced by trucking companies is considerable
thus congestion mitigation measures are needed
especially in the urban areas. Better coordinating of
traffic Signals and implementing effective system to
attend emergency crews in clearing accidents
should be implemented. Visibility in the system with
respect to customs and other border management
agencies in order to install electronic clearance
stations at international border crossings would be
essential. Further research on dedicating a single
lane to truck traffic, having truck-only lanes on some
surface streets; truck-only streets for access to
ports, rail terminals, and airports; Eliminating some
on-street parking during certain periods would be
necessary prior implementation.
Keywords: Congestion, Containers, Transport,
Trucking, Intermodal, Freight
I. INTRODUCTION
Efficient maritime transportation is heavily
dependent on the smooth operation of land
transportation. Swift modal transfers are key to
successful inland operations. This paper focuses on
inland Container Transportation that are
coordinated and interacted between port terminals,
Container Freight Stations, exporters, consignees,
clearing agents, freight forwarders and primarily
container transport companies. The Government of
Sri Lanka (GoSL) has embarked on a development
agenda with the objective of converting the country
to a Naval, Aviation, Commercial, Energy and
Knowledge hub in Asia. Commercial Hub Regulation
of Sri Lanka and the Free-Port Concept proposes
the declaration of Colombo and Hambantota ports
and Mattala Air Port as Free ports; declaration of
Katunayake Exports Processing Zone (KEPZ) and
Koggala EPZ as Bonded areas for the purpose of
the Hub operation; and Mattala air port and
Mirijjawila EPZ will be declared as Bonded areas.
According to new developments that are based on
the Commercial Hub Regulation No. 1 of 2013 a
new enterprise which is engaged in business
activities referred to Commercial Hub Regulation be
subject to a synchronized operational procedure/s
that shall be introduced by the Department of
Customs, the Board of Investment of Sri Lanka and
Sri Lanka Ports Authority in respect of or Free Port
or the Bonded Area. (GoSL, 2013).
Accordingly, the inland transportation of containers
needs to be very efficient and effective to face the
future demand. Infrastructure is the necessary
condition for efficient cargo handling operations
and adequate infrastructure is needed to avoid
congestion (Acciaro & Mckinnon, 2013). Ports will
have to come up with viable alternatives to reduce
the impact of congestion and relieve local
communities from the negative externalities
generated by increasing cargo flows. (Acciaro &
Mckinnon, 2013). As consequent to containerization
more trucking companies commneced operations
increasing heavy and long vehicles on roads. As
traffic volumes increase the congestion grows on
highways and urban roadways.
Traffic Congestion particularly in and around ports
is a serious problem for trucking companies and
comes at a high cost. Traffic congestions in
173
metropolitan areas have developed to a major
problem in many countries (Kathawala & Tueck,
2008) and is increaing including environmental
degradation (Jacyna, 2013). The common complaint
by the trucking transporting companies in Sri Lanka
is the additional cost they incur on delays due to
road congestion. Sri Lanka incurs a huge economic
loss of around Rs. 40 billion annually due to road
traffic congestion and air pollution with too many
vehicles on a limited road network (Sirimanna,
2013). The timely actions in developing roads
should be highly commended because this situation
would have been even worse if such critical
decisions were not taken in the recent past. Sri
Lanka has made heavy emphasis on improving
infrastructure to facilitate the hub concept. Country
even now serves as an effective hub for maritime
goods transport. (Edirisinghe & Jayathilake, 2014)
However, equally the density of vehicles too has
increased over the years in response to country’s
development activities. Given the fact that country
is determined to capitalize its geographical
advantage to make the country the most preferred
hub in Asia it is important to study the performance
of trucking industry which could create a heavy
impact in this aspect. There is encouraging progress
made with respect to the road network in Sri Lanka
in the recent past. The Quality of roads has
improved from 55 out of 139 countries in 2012 to
49 out of 148 in 2014. (WEF, 2012-1014).Therefore
it is imperative that the said improvement should
be effectively managed to ease the road congestion
that appears to be making a negative impact to the
final outcome of improving mobility. Accordingly,
the objectives of the research are as follows.
(i) Reveal the perception of container
transportation industrialists with
respect to road Congestion problems
(ii) Propose recommendations to improve
the intermodal freight transportation
II. LITERATURE REVIEW
On road traffic congestion is a growing problem for
trucking companies operating in urban areas.
(Golob & Regan, 2003). Congestion costs to
businesses go beyond the mere vehicle and driver
costs of delay. (WHO, 2011) The other issue is that
delivery service operators become increasingly
challenged to maintain dependable and reliable
schedules. Those who depend on road transport
affected by the degree of unpredictability and
variation in delays associated with growing
congestion (Weisbrod & Fitzroy, 2011) As a
consequence the various techniques in supply chain
management such as JIT- Just in Time fail miserably.
WHO (2011) identifies four type of various costs
such as increased inventory costs, logistics costs,
and last-minute processing costs, and reliability
costs would be added as a result of congestion.
Growth of traffic congestion adds to total transport
costs for delivered products, causing firms to shift
location and shipment size configurations to re
optimize net revenues. (Weisbrod & Fitzroy, 2011).
As cited in Islam & Olsen, (2014) truck
transportation has received much greater attention
in recent times because of the continuous growth
occurring in the containerized trade, the
introduction of bigger ships and the rising level of
port competitiveness (Moura et al., 2002; Lannone,
2012). Road transportation plays a vital role in the
multimodal transport system. In the present
context in Sri Lanka goods movement is heavily
performed by means of inter-modal containers.
Inter-modal transportation is a specific type of
multi-modal transportation (Marchet, et al., 2012).
Traffic congestion is a condition on road networks
that occurs as use of roads increases thus the sharp
increase in vehicle importation in the past decade.
Operators have found the flexibility, cost, ease of
market entry and reliability of road transport much
more favourable than the other modes
(Department for Transport, 2011) However, road
congestion is a serious recurring problem to any
citizen in most of all courtiers. Congestion impacts
on supply chain flows created a risk for maintaining
regional competitiveness in a global economy
(Weisbrod & Fitzroy, 2011).
Traffic volumes and congestion affects supply
chains and truck-dependent businesses both of
which are of increasing importance for both public
policy and private sector operators (Weisbrod &
Fitzroy, 2011) this is a problem in most cities
around the world, especially in developing regions.
A large number of Sri Lankans spend more time on
the roads, paying more for fuel, as the number of
vehicles on the roads is rapidly increasing and it
takes longer to reach one’s destination. (Sirimanna,
2013). Effective traffic incident management is a
fundamental factor in road safety and congestion
control, decreasing the occurrence of secondary
incidents at scenes and minimizing the impact of
resultant traffic congestion and emissions.
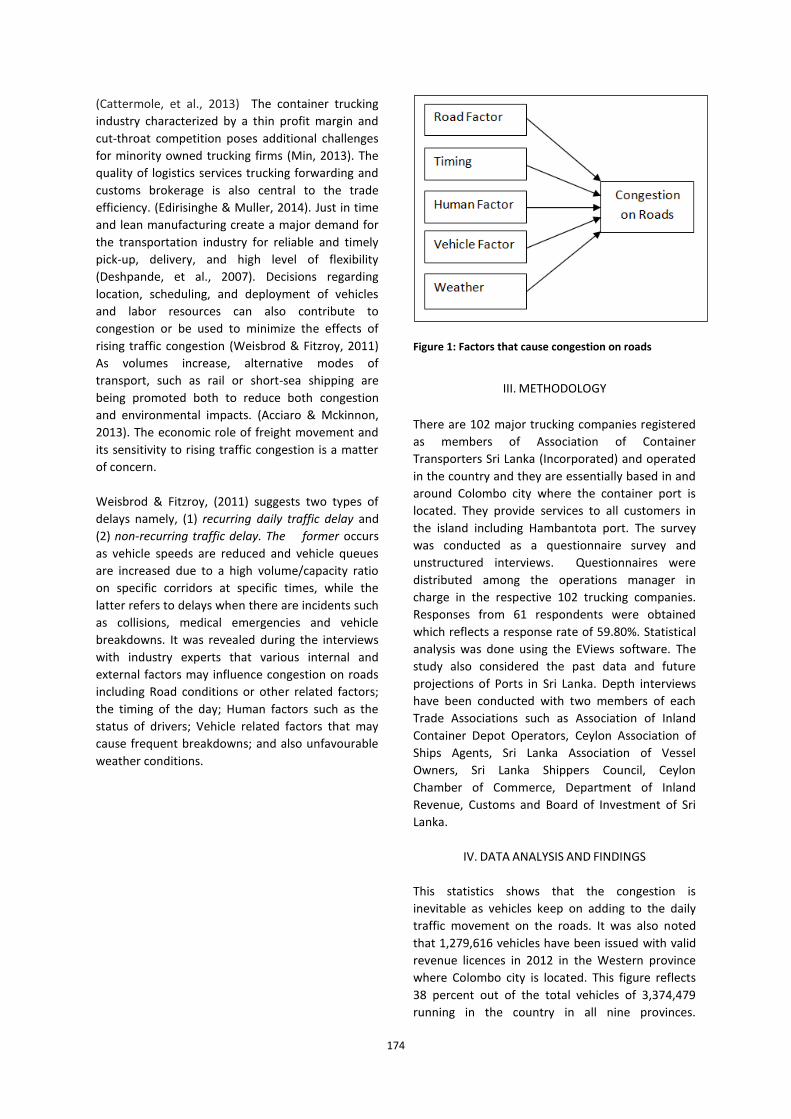
174
(Cattermole, et al., 2013) The container trucking
industry characterized by a thin profit margin and
cut-throat competition poses additional challenges
for minority owned trucking firms (Min, 2013). The
quality of logistics services trucking forwarding and
customs brokerage is also central to the trade
efficiency. (Edirisinghe & Muller, 2014). Just in time
and lean manufacturing create a major demand for
the transportation industry for reliable and timely
pick-up, delivery, and high level of flexibility
(Deshpande, et al., 2007). Decisions regarding
location, scheduling, and deployment of vehicles
and labor resources can also contribute to
congestion or be used to minimize the effects of
rising traffic congestion (Weisbrod & Fitzroy, 2011)
As volumes increase, alternative modes of
transport, such as rail or short-sea shipping are
being promoted both to reduce both congestion
and environmental impacts. (Acciaro & Mckinnon,
2013). The economic role of freight movement and
its sensitivity to rising traffic congestion is a matter
of concern.
Weisbrod & Fitzroy, (2011) suggests two types of
delays namely, (1) recurring daily traffic delay and
(2) non-recurring traffic delay. The former occurs
as vehicle speeds are reduced and vehicle queues
are increased due to a high volume/capacity ratio
on specific corridors at specific times, while the
latter refers to delays when there are incidents such
as collisions, medical emergencies and vehicle
breakdowns. It was revealed during the interviews
with industry experts that various internal and
external factors may influence congestion on roads
including Road conditions or other related factors;
the timing of the day; Human factors such as the
status of drivers; Vehicle related factors that may
cause frequent breakdowns; and also unfavourable
weather conditions.
Figure 1: Factors that cause congestion on roads
III. METHODOLOGY
There are 102 major trucking companies registered
as members of Association of Container
Transporters Sri Lanka (Incorporated) and operated
in the country and they are essentially based in and
around Colombo city where the container port is
located. They provide services to all customers in
the island including Hambantota port. The survey
was conducted as a questionnaire survey and
unstructured interviews. Questionnaires were
distributed among the operations manager in
charge in the respective 102 trucking companies.
Responses from 61 respondents were obtained
which reflects a response rate of 59.80%. Statistical
analysis was done using the EViews software. The
study also considered the past data and future
projections of Ports in Sri Lanka. Depth interviews
have been conducted with two members of each
Trade Associations such as Association of Inland
Container Depot Operators, Ceylon Association of
Ships Agents, Sri Lanka Association of Vessel
Owners, Sri Lanka Shippers Council, Ceylon
Chamber of Commerce, Department of Inland
Revenue, Customs and Board of Investment of Sri
Lanka.
IV. DATA ANALYSIS AND FINDINGS
This statistics shows that the congestion is
inevitable as vehicles keep on adding to the daily
traffic movement on the roads. It was also noted
that 1,279,616 vehicles have been issued with valid
revenue licences in 2012 in the Western province
where Colombo city is located. This figure reflects
38 percent out of the total vehicles of 3,374,479
running in the country in all nine provinces.
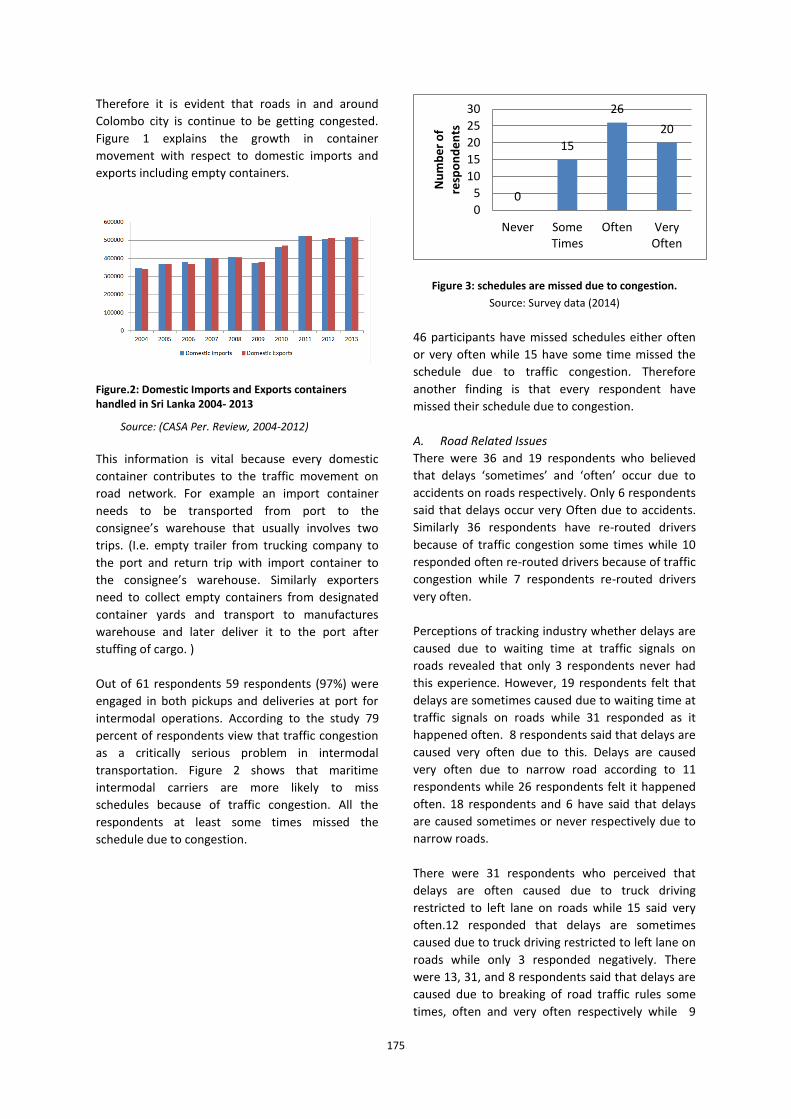
175
Therefore it is evident that roads in and around
Colombo city is continue to be getting congested.
Figure 1 explains the growth in container
movement with respect to domestic imports and
exports including empty containers.
Figure.2: Domestic Imports and Exports containers handled in Sri Lanka 2004- 2013
Source: (CASA Per. Review, 2004-2012)
This information is vital because every domestic
container contributes to the traffic movement on
road network. For example an import container
needs to be transported from port to the
consignee’s warehouse that usually involves two
trips. (I.e. empty trailer from trucking company to
the port and return trip with import container to
the consignee’s warehouse. Similarly exporters
need to collect empty containers from designated
container yards and transport to manufactures
warehouse and later deliver it to the port after
stuffing of cargo. )
Out of 61 respondents 59 respondents (97%) were
engaged in both pickups and deliveries at port for
intermodal operations. According to the study 79
percent of respondents view that traffic congestion
as a critically serious problem in intermodal
transportation. Figure 2 shows that maritime
intermodal carriers are more likely to miss
schedules because of traffic congestion. All the
respondents at least some times missed the
schedule due to congestion.
Figure 3: schedules are missed due to congestion.
Source: Survey data (2014)
46 participants have missed schedules either often
or very often while 15 have some time missed the
schedule due to traffic congestion. Therefore
another finding is that every respondent have
missed their schedule due to congestion.
A. Road Related Issues
There were 36 and 19 respondents who believed
that delays ‘sometimes’ and ‘often’ occur due to
accidents on roads respectively. Only 6 respondents
said that delays occur very Often due to accidents.
Similarly 36 respondents have re-routed drivers
because of traffic congestion some times while 10
responded often re-routed drivers because of traffic
congestion while 7 respondents re-routed drivers
very often.
Perceptions of tracking industry whether delays are
caused due to waiting time at traffic signals on
roads revealed that only 3 respondents never had
this experience. However, 19 respondents felt that
delays are sometimes caused due to waiting time at
traffic signals on roads while 31 responded as it
happened often. 8 respondents said that delays are
caused very often due to this. Delays are caused
very often due to narrow road according to 11
respondents while 26 respondents felt it happened
often. 18 respondents and 6 have said that delays
are caused sometimes or never respectively due to
narrow roads.
There were 31 respondents who perceived that
delays are often caused due to truck driving
restricted to left lane on roads while 15 said very
often.12 responded that delays are sometimes
caused due to truck driving restricted to left lane on
roads while only 3 responded negatively. There
were 13, 31, and 8 respondents said that delays are
caused due to breaking of road traffic rules some
times, often and very often respectively while 9
0
15
26
20
0
5
10
15
20
25
30
Never Some Times
Often Very Often
Nu
mb
er
of
resp
on
de
nts
176
respondents believed that delays are not caused
due to breaking of road traffic rules by drivers.
With respect to whether delays occur due to
Construction work on roads, no one responded
negatively. 31 respondents (51 %) said it occurs
sometimes. 6 responded often and 24 said that
delays occur very often due to Construction work
on roads. There were seven road related causes the
congestion has been identified in the survey. It was
noted that all seven causes have some kind of
contribution to the congestion according to the
responses as explained in the above analysis.
Four main and sensitive routes/areas namely,
Colombo-Negombo road; Colombo-Kandy road;
passage Between Colombo-Kandana; and Area
within Colombo city limits have been chosen to
study the density of congestion in each designated
area and how the trucking industry contrast and
perceives them.
Table 1: An assessment of routes in which the most
traffic congestion is occurred
Route Never Some
Times
Ofte
n
Very
Often
Colombo-Negombo
road
0 15 36 10
Colombo-Kandy road 0 19 35 7
Between Colombo-
Kandana
0 6 50 5
Within Colombo city
limits
3 7 42 9
It was revealed that traffic congestion often
experienced in all selected routes/areas.
Table 2: Statistical analysis of routes in which the most
traffic congestion is occurred
Variable Mean 95% Confidence
Interval for
Mean
Colombo-Negombo
Road
1.9180 1.7541-2,0820
Colombo-Kandy Road 1.8033 1.6425-1.9640
Between Colombo-
Kandana
1.9836 1.8740-2.0932
Within Colombo City
Limits
1.9344 1.7603-2.1086
It is plainly visible from table 2 that there is no
statistical significance in the observations under
four key areas as the Confidence Interval for mean
is overlapping. Accordingly it can be concluded that
these key areas/roads are often congested.
B. Time Related Issues
Respondents were asked the time duration that
most traffic congestion is occurred on roads in Sri
Lanka in general. The responses are provided in
table 3.
Table 3: Timings that the most traffic congestion is
occurred
Time slot Never Some
Times
Often Very
Often
6 am – 12 noon 3 12 31 15
12 noon- 6 pm 7 13 26 15
6 pm – 12 midnight 3 10 31 17
12 midnight- 6 am 47 11 3 0
Table 4: Statistical analysis of timings that the most
traffic congestion is occurred
Variable Mean 95% Confidence
Interval for
Mean
6 am – 12 noon 1.951 1.7447-2.1569
12 noon- 6 pm 1.803 1.5611-2.0454
6 pm – 12 midnight 2.016 1.8100-2.2228
12 midnight- 6 am 0.2787 0.13739-
0.41999
There is a statistical significance in the observations
in table 4. Accordingly, it can be concluded that
congestion occurs often or very often during three
time slots except 12 midnight- 6 am.
There were 25 respondents who said they never
wait for less congested times to arrange pickup and
delivery to their customers while 22 wait some
times. Only 3 respondents wait very often for less
congested times to arrange pickup and delivery and
11 respondents wait for less congested times often.
According to this finding it is clear that customers of
trucking companies were compelled to compromise
to some extent as the trucking companies have a
practice of waiting for less congested times to
arrange pickup and delivery to their customers. This
may not be a healthy situation unless the trucking
companies do this with the consent of their
customers.
C. Human Related (HR) Issues
With respect to human related issues 28
respondents said that congestion sometimes
occurred due to drivers’ inefficiency while it occurs
177
very often for 13 respondents. 15 said congestion
often occurred due to drivers’ inefficiency while
only 5 were negative.
Figure 4: Impact of HR related issues
Source: Survey data (2014)
According to 25 respondents congestion sometimes
occurred due to drivers need to take a rest and park
vehicles on roads. No one responded that they
faced this often and very often respectively.
Therefore it was found that there is a moderate
impact on the issues associated with respective
drivers of trucking companies.
D. Vehicle Related Issues
Figure 5: Impact of vehicle breakdown
Source: Survey data (2014)
36 respondents felt congestion was sometime
occurred due to vehicle breakdown while only 2
were negative. 16 and 7 respondents said
congestion occurred often and very often due to
vehicle breakdown respectively. This factor creates
a big impact on road congestion and unpredictable
too. It was revealed by some respondents that all
the major variation of travel time to regular
destination had some relevance to a vehicle
breakdown.
E. Issues Relevant to Weather
General perception of trucking companies is that
rainy weather may cause congestion and 42
respondents said delays were sometimes occurred
due to rain and floods while only one responded
negatively. 10 and 8 responded said that they faced
the issue often and very often respectively.
However, this is a natural phenomenon which is
something beyond control. Trucking companies
most of the time operates on strict and tight time
schedules particularly with respect to export
consignments. Therefore it is usually impossible to
avoid times that potentially cause congestion even
if accurate weather forecasts have been
announced.
F. Evaluation of Effectiveness of Recommended
Congestion Mitigation Proposals
The respondents were asked about their perception
towards nine potential congestion mitigation
proposals recommended by the researchers. The
proposals were based on the comments made by
respondents at the interviews with industry experts
mentioned previously.
Perception of the industrialists on proposed
solutions were measured using five point likert scale
from 1= Strongly disagree to 5= Strongly agree.
Total value of the response measured by the likert
scale then weighted and arranged according to the
descending order. Results are shown in table 5.
Table 5: Weightings of the perceptions of trucking
companies towards proposed solutions
Source: survey data (2014)
Never 3%
Some Times 59%
Often 26%
Very Often 12%
Solutions Weighting
1 Dedicating a single lane to truck
traffic wherever possible 0.1324536
2 Having truck-only streets for
access to ports 0.1304985
3 Better coordinating of traffic
Signals 0.1256109
4 Having an effective system to
attend emergency crews in
clearing accidents
0.1182796
5 Adding more expressways
wherever possible 0.1158358
6 Eliminating some on-street
parking during certain periods 0.115347
7 Installing electronic clearance
stations at international border
crossings
0.1124145
8 Having truck-only lanes on some
surface streets 0.1055718
9 Imposing a toll on all vehicles
travelling during rush hours 0.0439883
178
According to the analysis allocating a dedicated
single lane to truck traffic is the most preferred
solution perceived by the industry. Having truck-
only streets for access to ports was the second most
preferred option followed by better coordinating of
traffic Signals. It was then proposed by the industry
to have an effective system to attend emergency
crews in clearing accidents. There are two
expressways in operation in Sri Lanka as at 2014.
The trucking industry feels that adding more
expressways wherever possible could be a solution
to mitigate the congestion problem. Eliminating
some on-street parking during certain periods was
the next option followed by installing electronic
clearance stations at international border crossings
and having truck-only lanes on some surface
streets. Imposing a toll on all vehicles travelling
during rush hours was perceived by the industry as
the last option in mitigating congestion problems on
roads.
V. CONCLUSIONS
Congestion experienced by trucking companies is
considerable as 79 percent of respondents view
that traffic congestion as a critically serious problem
in intermodal transportation. The continued growth
of traffic and the rapid improvements owing to
implementation of the commercial hub concept
may create serious road congestion in future
particularly in urban areas. As a consequence the
maritime intermodal carriers are more likely to miss
schedules because of traffic congestion. Therefore,
congestion mitigation measures should be adopted
especially in the urban areas at this time to face
future challenges successfully.
Road related actions that need policy decision
should be seriously considered.
The study had considered five key variables that
may cause congestion. This includes road, time,
and weather related issues as external factors while
HR and vehicle issues represent internal factors of
trucking companies. The trucking industry perceives
that the congestion occurs often or very often
during 6am-12 midnight while 12 midnight- 6 am is
free from traffic congestion. It was revealed that
traffic congestion often experienced in Colombo-
Negombo road; Colombo-Kandy road; passage
Between Colombo-Kandana; and Area within
Colombo city limits. Based on industry perception
Colombo-Negombo Road particularly the distance
Between Colombo- Kandana should be improved
and eliminated the congestion. Similarly Colombo-
Kandy Road and all key roads leading to Port of
Colombo should be given priority for
improvements.
The actions with respect to development of road
infrastructure are already making positive
contribution to the country’s logistics performance.
Therefore, adding more expressways wherever
possible should be looked into. Further research
should be carried out prior to taking any policy
decisions with regard to certain sensitive proposals.
This includes, 1) dedicating a single lane to truck
traffic; 2) designating truck-only lanes on some
surface streets; 3)truck-only streets for access to
ports, rail terminals, and airports; 4) Eliminating
some on-street parking during certain periods. It
would be necessary to implement a system for
better coordinating of traffic Signals and an
effective system to attend emergency crews in
clearing accidents should be done.
Commercial Hub Regulation in Sri Lanka is subject
to a synchronized operational procedure/s that
shall be introduced by the Department of Customs,
the Board of Investment of Sri Lanka and Sri Lanka
Ports Authority. Therefore it would be necessary to
have more visibility in the logistics system with
respect to activities and process of customs and
other border management agencies in order to
install electronic clearance stations at international
border crossings. Further improvements in
maritime intermodal operations may require
creative public/private sector collaboration and
would help for “sustainable" growth of country’s
logistics performance. Increased use and reliability
of Container Status Inquiry systems (CSIS) that
supply carriers with information about movement
of trucks would be beneficial from the trucking
companies’ point of view.
ACKNOWLEDGMENT
The authors wish to express their gratitude to Dr A.
W. Wijeratne senior lecturer in statistics and
mathematics at the Department of Agribusiness
Management, Sabaragamuwa University of Sri
Lanka for his valuable inputs into the research.
REFERENCES
Acciaro, M., & Mckinnon, A. (2013, September). Efficient
hinterland transport infrastructure and
services for large container ports. Retrieved

179
January 20, 2014, from
www.internationaltransportforum.org/jtrc/Dis
cussionPapers/jtrcpapers.html
Cattermole, V., Horberry, T., & Cloete, S. (2013). Highway
traffic incident management: an
operator-centred investigation. International
Journal of Human Factors and Ergonomics , 2
(2/3), 159 - 174.
Department for Transport. (2011). Choosing and
Developing a Multi-modal Transport Solution.
London: Freight Best Practice Programme.
Deshpande, P. J., Yalcin, A., Zayas-Castro, J., & Herrera,
L. E. (2007). Simulating less-than-truckload
terminal operations. Benchmarking: An
International Journal , 14 (1), 92-101.
Edirisinghe, L., & Jayathilake, S. (2014). Frontier Logistics
performance in Sri Lanka-The role play of the
Customs. KDU International Research
Symposium 2013 - Sri Lanka as a Hub in Asia:
The way Forward (pp. 424-432). Ratmalana:
General Sir John Kotalawala Defense University.
Edirisinghe, L., & Muller, S. (2014). Converting Sri Lanka
into a Commercial Hub in Asia:An Assessment
of Postwar Progress with Insights to the Way
Forward- a case study. KDU International
Research Symposium 2013- Sri Lanka as a Hub
in Asia: The way Forward (pp. 486-492).
Ratmalana: General Sir John Kotalawala
Defense University.
Golob, T. F., & Regan, A. C. (2003). Traffic Congestion
and Trucking Managers' Use of Automated
Routing and Scheduling. Transportation
Research Part E: Logistics and Transportation
Review , 39, 61-78.
IBRD. (2013). Doing Business 2013. International Bank
for Reconstruction and Development / The
World Bank. Washington, DC 20433: The
World Bank and the International Finance
Corporation.
Islam, S., & Olsen, T. (2014). Truck-sharing challenges for
hinterland trucking companies A case of the
empty container truck trips problem. Business
Process Management Journal , 20 (2), 290-334.
Jacyna, M. (2013). Cargo flow distribution on the
transportation network of the national logistic
system. Int. J. of Logistics Systems and
Management , 15 (2/3), 197 - 218.
Kathawala, Y. A., & Tueck, B. (2008). The use of RFID for
traffic management. Int. J. of Technology,
Policy and Management , 8 (2), 111 - 125.
Marchet, G., Perotti, S., & Mangiaraci, R. (2012).
Modelling the impacts of ICT adoption for
inter-modal transportation. International
Journal of Physical Distribution & Logistics
Management , 42 (2), 110-127.
Min, H. (2013). Challenges and opportunities for minority
owned trucking firms: a case study. Int. J. of
Logistics Systems and Management , 16 (2),
136 - 146.
Road Development Authority. (2013). RDA. Retrieved
February 14, 2014, from
http://www.rda.gov.lk/supported/expressway
s/cke.htm
Sirimanna, B. (2013, July 28). Better public transport key
to reducing city traffic congestion, experts say.
The Sunday Times , p. Business times.
WEF. (2012). The Global Competitiveness Report 2012–
2013. Geneva: World Economic Forum.
Weisbrod, G., & Fitzroy, S. (2011). Traffic Congestion
Effects on Supply Chains: Accounting
forBehavioral Elements in Planning and
Economic Impact Models. In P. S. Renko (Ed.),
Supply Chain Management - New Perspectives
(pp. 337-354). Rijeka: InTech.
WHO. (2011). Transport (road transport): shared interests
in sustainable outcomes. Geneva: World
Health Organization.
World Bank. (2012). Connecting to Compete 2012.
Washington: The International Bank for
Reconstruction and Development/The World
Bank.
Zhihong, J., & Qi, X. (2012). The Realization of Decision
Support System for Cross-border
Transportation based on the Multidimensional
Database. Journal of Software , 7 (5), 974-981.
180
BIOGRAPHY OF AUTHORS
1 Lalith Edirisinghe is a doctoral
candidate in Transport Planning and
Logistics Management at the CINEC
Maritime Campus, Sri Lanka (SL),
affiliated to the Dalian Maritime
University, China. He received his Master’s Degree in
International Trade and Logistics at the University of Sri
Jayawardanepura-SL and University of Canberra–
Australia. He holds a Postgraduate Diploma in Business
Management (Distinction pass) and an Executive Diploma
in Marketing (Distinction pass) from the University of
Colombo SL. He counts 30 years experience in shipping
and presently works as the Head of School at CINEC
Maritime Campus- City Branch in Colombo. He is a
Chartered member of Institute of Logistics and Transport
and also a Chartered Marketer (2010/12). His research
interests include Maritime affairs, Logistics and Transport,
International trade, Border management and Marketing.
2 JIN Zhi-hong received his B.E. and
M.E. form Northeastern University
(China) in 1984 and 1987 respectively,
and his Ph.D. from Nagoya Institute of
Technology (Japan) in 2000. He was an
assistant professor from 1987 to 1993 at Northeastern
University in China, from 2000 to 2003 at Nagoya Institute
of Technology in Japan. Since 2003 he has been a
Professor at Dalian Maritime University (DMU) and dean
of College of Transportation Management of DMU. His
current research interests focus on logistics systemic
optimization, scheduling, and combinatorial optimization.
Photograph
Author 1
181
Determinants of Air Passenger Demand in Sri Lanka: A Case Study based on Bandaranayake International Airport
Wellappuli Arachchige Madusha Dilhari1, Lakshmi Udeshika Ranwala2
1
Prasad Villa, Godagama, Mathara, Sri Lanka 267/C, Wickckaramarachchi Mawatha, Yakkala, Sri Lanka
Abstract— Air transportation plays a significant role
in nations’ economy providing expeditious links to
the international markets. Globalization and
advanced technological applications have squeezed
the entire world, where by aviation industry further
diminishes the existing gap by physically linking two
locations. It is an all-time true that aviation provides
the speediest, most convenient and efficient travel,
with comparatively highest cost of all five modes.
But it is evidenced by the transport statistics that,
the demand for air transport is been increasing
yearly, even though the cost is a problematic
component. Since it is observed that, examining the
determinants of air transport demand would be
prudent and an effective effort in policy
implementations as well as in forecasting which
would be an essential requirement in corporate
planning process.
The objective of this research is to determine the
factors affecting air passenger travel demand in Sri
Lanka and was conducted based on Bandaranaike
International Airport (BIA). The focus of the research
was on Air Passenger demand at BIA and not the Air
Freight. Macroeconomic factors have been
considered as explanatory variables. Three
dependent variables as Air Passenger Arrivals,
Departures and Total Movement of air passengers
have been taken into consideration.
In analyzing the data set, uni-variate descriptive
analysis has been carried out and hypothesis testing
has been done using Pearson correlation coefficient.
In doing advanced statistical modelling, three
models have been fitted for total air passenger
volume, arrivals and departures separately. In the
process of constructing multiple linear regression
model Forward Selection Method has been used.
According to the empirical findings it is proved that
only five out of fourteen specified independent
variables, namely Tax Revenue, Average Exchange
Rate, Tourists Arrivals, Interest Rate and FDI have a
significant relationship with Total Air Passenger
Movements, Air Passenger Arrivals and Air
Passenger Departures and for only Air Passenger
Arrivals, Government debt has become a significant
factor.
Keywords— Air transportation, regression analysis,
Bandaranaike International Airport
I. INTRODUCTION
The strategic geographical location of Sri Lanka in
the Indian Ocean accredited it the eternal benefit of
serving as one of the most important aviation hub,
being close proximity to populous nations in the
world. Aviation industry is reaching its prosperous
stages with the booming of tourism industry after
three decades of conflict period. Hence the industry
focuses not only on facilitating transfer passengers
but also transit passengers.
Sri Lanka aviation industry experienced an
exceptional growth during last couple of years,
which encompasses developing and upgrading
Bandaranaike International Airport and encouraging
sea plane and domestic air plane services. BIA
witnessed the highest passenger numbers ever in
2012 (before Mattala Rajapaksa International
Airport (MRIA) came into operation), recording an
increase of 7% compared to the previous year. BIA
modernization programme expects to increase its
passenger handling capacity significantly in future.
It is expected to double the current passenger
numbers to 12 million passengers per annum, under
phase II of BIA expansion project.
Continuous focus on airport infrastructure
developments contributes to stimulate more
foreign investments to the country. Sri Lankan
182
Airlines, the national carrier has expanded their
fleet to cater the amplified demand from outbound
and inbound passenger traffic to and from Sri
Lanka. The capacity of the national carrier is
expected to expand in years to come.
The low cost carriers, who entered the market
recently, have induced more people to travel,
offering cost efficient deals, where many airlines
have to compete with them on attracting
customers. This depicts a positive sign since this
competition could lead to a better market place
with more options available for the customer to
choose from.
Nevertheless, fuelled by government long term
development projects apart from afore mentioned,
construction of new International airport in
Mattala, development and modernization of
fourteen domestic airports for internal aviation
paves the way to generate more employment
opportunities in aviation sector contributing
national economies. Even MRIA will fulfil a long
standing need of having a second international
airport eliminating the disadvantage the country
had by operating with a single international airport.
MRIA will be a greater contributor to the country’s
economy enabling international trade, travel and
tourism, vocational training and employment and
intended to integrate with Port of Hambantota to
support sea-air cargo transhipments.
Since it is in its early stages of operation, records on
passenger movements or related figures are not
readily available at the moment. However it is a
proven fact that both these international airports
are priceless gifts to Sri Lanka on its strategic
grounds which can amplify the economic growth of
the country. The main focus of the study is to analyze the factors
that affect Air Passenger demand at BIA and to
identify the most significant factors that have a
direct impact on the above. Macroeconomic factors
have been considered as explanatory variables.
Three dependent variables as Air Passenger Arrivals,
Departures and Total Movement of air passengers
consider under the study and are to be tested
against fourteen explanatory variables to see the
relationship those three dependent variables are
having with each of the explanatory variable.
II. LITERATURE REVIEW
Demirsoy (2012) conducted his research on two
major objectives as to investigate on the impact of
different factors on air passenger demand for
Turkish Air Transportation and to do a maturity
analysis of the domestic Turkish air transport
market. (Research explains whether Turkish
domestic air transport is likely to face maturity
soon) The research was lead on the basis of four
questions as to, “What are the main drivers of
domestic air transport demand in Turkey?”, “Can
economic growth or income rises in the country in
the country serve as a partial explanation of air
transport demand growth?”, “Are there any other
qualitative factors that are affecting passenger
demand?” and “How are deregulations influencing
the domestic market?”.
The researcher carried out a comprehensive regression analysis to determine the most influencing factors to Air Passenger demand where the dependent and independent variables in the regression model were based on the theoretical and empirical literature. Income, Population, Consumption, Expenditure, Rail-Road Passenger Numbers, High-Speed Rail-Road Passenger Numbers, Crude oil prices and several dummies have been taken as relevant independent variables and had created a preliminary model as;
Pax = f (I,P,C,E,R,HS,O,dummies) (1)
Where -Pax-Passenger Number/ I-income/ P-Population/ C-Consumption/ E-Expenditure/ R- Rail passenger Number/ HS- High Speed rail passenger number/ O-Oil Prices(units of the oil price)
The study of Abdullah et al (2000) describes
Domestic air travel in the Kingdom of Saudi Arabia
followed by a discussion of the determinants of air
travel demand in the country. An attempt was
made to develop several models of demand for
domestic air travel in the kingdom with different
combinations of variables using stepwise regression
technique.
Selection of dependent and independent variables
in the study were based on theoretical and
empirical literature. Oil Gross Domestic Product,
Private Non-Oil Gross Domestic Product,
Government Non-Oil Gross Domestic Product, Total
183
Oil Gross Domestic Product, Total Gross Domestic
Product, Consumer Price Index, Per Capita Income,
Import of Goods and Services, Exchange Rate,
Population Size, Total Expenditures, Private
Consumption Expenditures, Government
Consumption Expenditures, Total Consumption
Expenditures and Yield were the basic economic
and demographic factors.
As expressed by the author ,the most important
step in an attempt to study the relationship
between variables is to express this relationship in
mathematical form, that is
formulate and specify the model with which the
economic phenomenon can be explored
empirically. To eliminate the problem of
multicollinearity, test of correlation has been
conducted and only Total Non-Oil Gross Domestic
Product(X4), Consumer Price Index(X6), Import of
Goods and Services(X8), Per Capita Income(X7),
Population Size(X11), Total Expenditures(X12) and
Total Consumption Expenditures(X15) were
considered as relevant factors to the demand for
the domestic air travel in the Kingdom of Saudi
Arabia.
Authors used four different specifications of the
model to see forecasts performance of each model.
Group I: (X4, X6, X8, X11)
Group II:(X7, X6, X8)
Group III:(X12 , X6, X11) Group IV:(X15 , X6, X11)
A sequence of regression equations were calculated
using different combinations of variables in the
group through stepwise regression procedure for
selecting independent variables. Each step, an
independent variable was either added or removed
until the prediction of the dependent variable( Y)
does not improve significantly.
The model, which has the total expenditure and the
size of the population as the explanatory variables,
was the model to represent the demand for
domestic air travel in Saudi Arabia more precisely.
The model explains that population growth and
expenditures lead to increased domestic and
international demand for air transport.
The rest of the models examined suffer from multicollinearity
Y = -2.961205 + 0.027701 X12 + 0.368102 X11
Where Y : Number of passengers in
millions
X11: Population Size in millions
X12: Total Expenditures in billions
However, the model they built has several
deficiencies. Despite the fact that they considered
different models, they were not trying to create a
model with more explanatory variables.
Another Study conducted by Poore (1993) whereby
he conducted a hypothesis testing and forecasted
the future demand for air transportation by air
plane manufactures and aviation regulators, was
reasonable and represented an implicit trend in
actual experience. The tests compared forecasts
issued by Airbus Industry, Boeing and International
Civil Aviation Organization (ICAO) with actual data
and results with the actual results of a basic model
of demand Revenue passenger kilometres (RPK).The
model was a combination of two equations
describing RPK requires by high and low income
groups respectively. Changes in Income Per Capita
were found to be highly correlated to the Variations
in RPKs demanded by the high-income groups.
Changes in RPKs demanded by low-income groups
were related to changes in population size. The
model was consistent with the assumptions and
conditions appropriate for regression analysis.
III. METHODOLOGY
This research is based on a comprehensive data set
collected through secondary data sources and
secondary data has been used over primary data
since those data are readily available where it is
easy to obtain and are cheaper and those may
obtainable even when the primary data cannot be
obtained at all. The main data sources will be
Annual Reports of Airport and Aviation Sri Lanka
Pvt. Ltd, Publications of Central Bank of Sri Lanka,
Board of Investment and Department of Census and
Statistics, Sri Lanka, Sri Lanka Tourists Board,
International Air Transport Association and
International Civil Aviation Organization.
In analyzing this data set, uni-variate descriptive
analysis has been carried out. Hypothesis testing
has been carried out using Pearson correlation
coefficient as all independent and dependant
variable are continuous. In doing advanced
statistical modelling, three models have been fitted
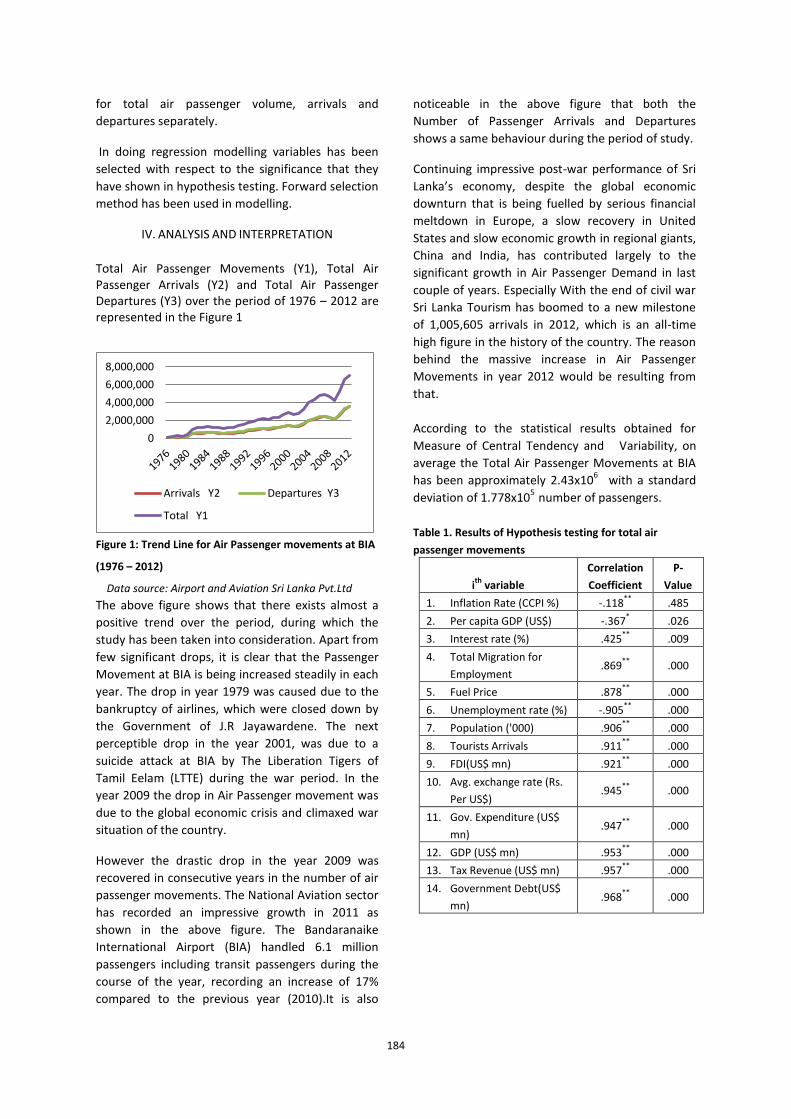
184
0
2,000,000
4,000,000
6,000,000
8,000,000
Arrivals Y2 Departures Y3
Total Y1
for total air passenger volume, arrivals and
departures separately.
In doing regression modelling variables has been
selected with respect to the significance that they
have shown in hypothesis testing. Forward selection
method has been used in modelling.
IV. ANALYSIS AND INTERPRETATION
Total Air Passenger Movements (Y1), Total Air Passenger Arrivals (Y2) and Total Air Passenger Departures (Y3) over the period of 1976 – 2012 are represented in the Figure 1
Figure 1: Trend Line for Air Passenger movements at BIA
(1976 – 2012)
Data source: Airport and Aviation Sri Lanka Pvt.Ltd
The above figure shows that there exists almost a
positive trend over the period, during which the
study has been taken into consideration. Apart from
few significant drops, it is clear that the Passenger
Movement at BIA is being increased steadily in each
year. The drop in year 1979 was caused due to the
bankruptcy of airlines, which were closed down by
the Government of J.R Jayawardene. The next
perceptible drop in the year 2001, was due to a
suicide attack at BIA by The Liberation Tigers of
Tamil Eelam (LTTE) during the war period. In the
year 2009 the drop in Air Passenger movement was
due to the global economic crisis and climaxed war
situation of the country.
However the drastic drop in the year 2009 was
recovered in consecutive years in the number of air
passenger movements. The National Aviation sector
has recorded an impressive growth in 2011 as
shown in the above figure. The Bandaranaike
International Airport (BIA) handled 6.1 million
passengers including transit passengers during the
course of the year, recording an increase of 17%
compared to the previous year (2010).It is also
noticeable in the above figure that both the
Number of Passenger Arrivals and Departures
shows a same behaviour during the period of study.
Continuing impressive post-war performance of Sri
Lanka’s economy, despite the global economic
downturn that is being fuelled by serious financial
meltdown in Europe, a slow recovery in United
States and slow economic growth in regional giants,
China and India, has contributed largely to the
significant growth in Air Passenger Demand in last
couple of years. Especially With the end of civil war
Sri Lanka Tourism has boomed to a new milestone
of 1,005,605 arrivals in 2012, which is an all-time
high figure in the history of the country. The reason
behind the massive increase in Air Passenger
Movements in year 2012 would be resulting from
that.
According to the statistical results obtained for
Measure of Central Tendency and Variability, on
average the Total Air Passenger Movements at BIA
has been approximately 2.43x10⁶
with a standard
deviation of 1.778x10⁵
number of passengers.
Table 1. Results of Hypothesis testing for total air
passenger movements
ith
variable
Correlation
Coefficient
P-
Value
1. Inflation Rate (CCPI %) -.118**
.485
2. Per capita GDP (US$) -.367* .026
3. Interest rate (%) .425**
.009
4. Total Migration for
Employment .869
** .000
5. Fuel Price .878**
.000
6. Unemployment rate (%) -.905**
.000
7. Population ('000) .906**
.000
8. Tourists Arrivals .911**
.000
9. FDI(US$ mn) .921**
.000
10. Avg. exchange rate (Rs.
Per US$) .945
** .000
11. Gov. Expenditure (US$
mn) .947
** .000
12. GDP (US$ mn) .953**
.000
13. Tax Revenue (US$ mn) .957**
.000
14. Government Debt(US$
mn) .968
** .000
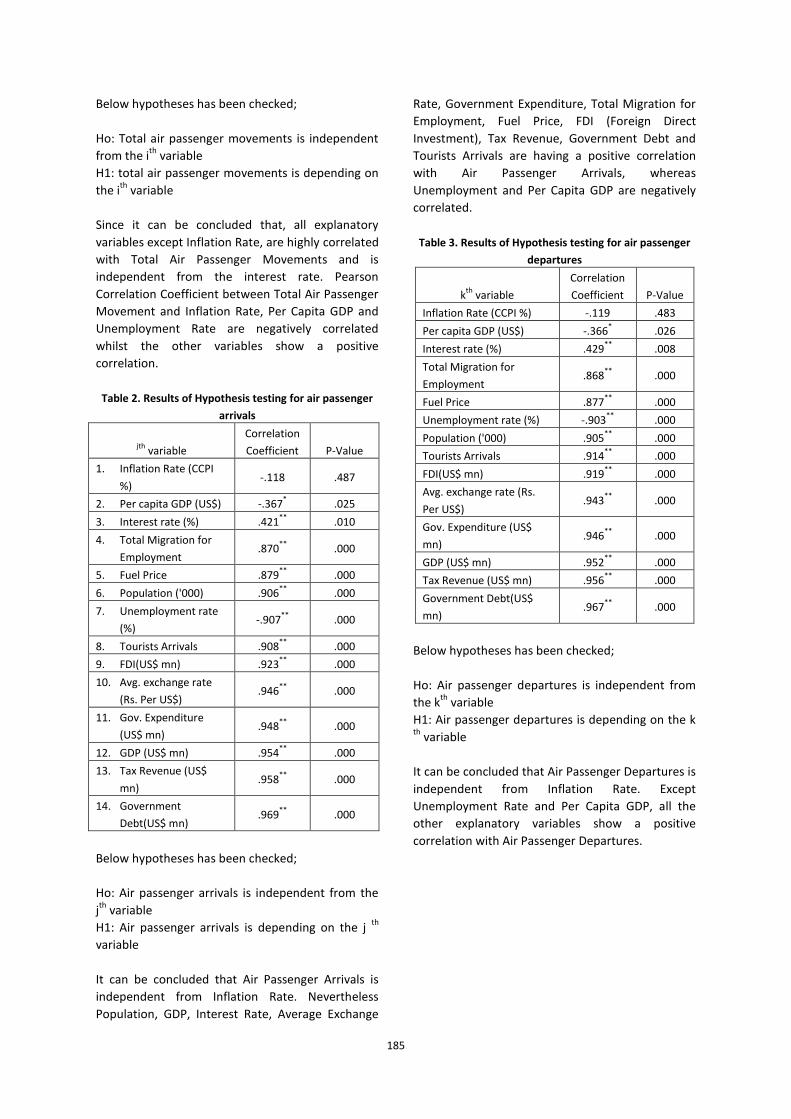
185
Below hypotheses has been checked;
Ho: Total air passenger movements is independent
from the ith
variable
H1: total air passenger movements is depending on
the ith
variable
Since it can be concluded that, all explanatory
variables except Inflation Rate, are highly correlated
with Total Air Passenger Movements and is
independent from the interest rate. Pearson
Correlation Coefficient between Total Air Passenger
Movement and Inflation Rate, Per Capita GDP and
Unemployment Rate are negatively correlated
whilst the other variables show a positive
correlation.
Table 2. Results of Hypothesis testing for air passenger
arrivals
jth variable
Correlation
Coefficient P-Value
1. Inflation Rate (CCPI
%) -.118 .487
2. Per capita GDP (US$) -.367* .025
3. Interest rate (%) .421**
.010
4. Total Migration for
Employment .870
** .000
5. Fuel Price .879**
.000
6. Population ('000) .906**
.000
7. Unemployment rate
(%) -.907
** .000
8. Tourists Arrivals .908**
.000
9. FDI(US$ mn) .923**
.000
10. Avg. exchange rate
(Rs. Per US$) .946
** .000
11. Gov. Expenditure
(US$ mn) .948
** .000
12. GDP (US$ mn) .954**
.000
13. Tax Revenue (US$
mn) .958
** .000
14. Government
Debt(US$ mn) .969
** .000
Below hypotheses has been checked;
Ho: Air passenger arrivals is independent from the
jth
variable
H1: Air passenger arrivals is depending on the j th
variable
It can be concluded that Air Passenger Arrivals is
independent from Inflation Rate. Nevertheless
Population, GDP, Interest Rate, Average Exchange
Rate, Government Expenditure, Total Migration for
Employment, Fuel Price, FDI (Foreign Direct
Investment), Tax Revenue, Government Debt and
Tourists Arrivals are having a positive correlation
with Air Passenger Arrivals, whereas
Unemployment and Per Capita GDP are negatively
correlated.
Table 3. Results of Hypothesis testing for air passenger
departures
kth
variable
Correlation
Coefficient P-Value
Inflation Rate (CCPI %) -.119 .483
Per capita GDP (US$) -.366* .026
Interest rate (%) .429**
.008
Total Migration for
Employment .868
** .000
Fuel Price .877**
.000
Unemployment rate (%) -.903**
.000
Population ('000) .905**
.000
Tourists Arrivals .914**
.000
FDI(US$ mn) .919**
.000
Avg. exchange rate (Rs.
Per US$) .943
** .000
Gov. Expenditure (US$
mn) .946
** .000
GDP (US$ mn) .952**
.000
Tax Revenue (US$ mn) .956**
.000
Government Debt(US$
mn) .967
** .000
Below hypotheses has been checked;
Ho: Air passenger departures is independent from
the kth
variable
H1: Air passenger departures is depending on the k th
variable
It can be concluded that Air Passenger Departures is
independent from Inflation Rate. Except
Unemployment Rate and Per Capita GDP, all the
other explanatory variables show a positive
correlation with Air Passenger Departures.
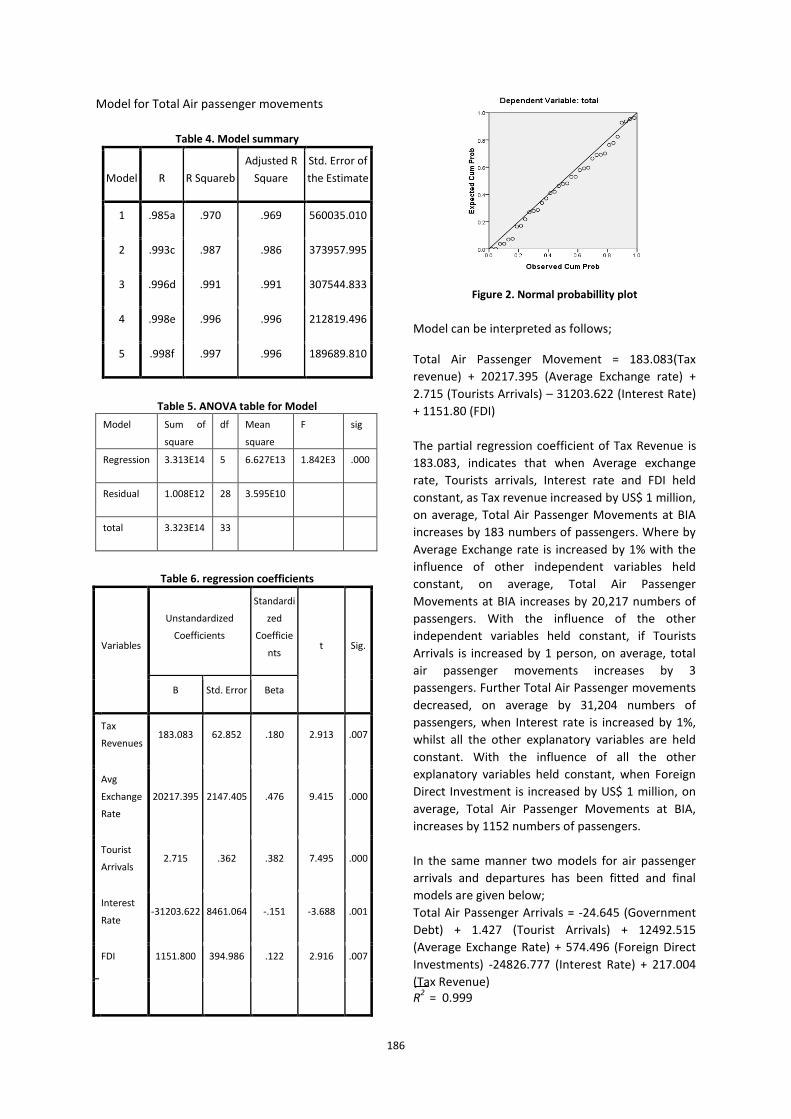
186
Model for Total Air passenger movements
Table 4. Model summary
Model R R Squareb
Adjusted R
Square
Std. Error of
the Estimate
1 .985a .970 .969 560035.010
2 .993c .987 .986 373957.995
3 .996d .991 .991 307544.833
4 .998e .996 .996 212819.496
5 .998f .997 .996 189689.810
Table 5. ANOVA table for Model
Model Sum of
square
df Mean
square
F sig
Regression 3.313E14 5 6.627E13 1.842E3 .000
Residual 1.008E12 28 3.595E10
total 3.323E14 33
Table 6. regression coefficients
Variables
Unstandardized
Coefficients
Standardi
zed
Coefficie
nts t Sig.
B Std. Error Beta
Tax
Revenues 183.083 62.852 .180 2.913 .007
Avg
Exchange
Rate
20217.395 2147.405 .476 9.415 .000
Tourist
Arrivals 2.715 .362 .382 7.495 .000
Interest
Rate -31203.622 8461.064 -.151 -3.688 .001
FDI 1151.800 394.986 .122 2.916 .007
Figure 2. Normal probabillity plot
Model can be interpreted as follows;
Total Air Passenger Movement = 183.083(Tax
revenue) + 20217.395 (Average Exchange rate) +
2.715 (Tourists Arrivals) – 31203.622 (Interest Rate)
+ 1151.80 (FDI)
The partial regression coefficient of Tax Revenue is
183.083, indicates that when Average exchange
rate, Tourists arrivals, Interest rate and FDI held
constant, as Tax revenue increased by US$ 1 million,
on average, Total Air Passenger Movements at BIA
increases by 183 numbers of passengers. Where by
Average Exchange rate is increased by 1% with the
influence of other independent variables held
constant, on average, Total Air Passenger
Movements at BIA increases by 20,217 numbers of
passengers. With the influence of the other
independent variables held constant, if Tourists
Arrivals is increased by 1 person, on average, total
air passenger movements increases by 3
passengers. Further Total Air Passenger movements
decreased, on average by 31,204 numbers of
passengers, when Interest rate is increased by 1%,
whilst all the other explanatory variables are held
constant. With the influence of all the other
explanatory variables held constant, when Foreign
Direct Investment is increased by US$ 1 million, on
average, Total Air Passenger Movements at BIA,
increases by 1152 numbers of passengers.
In the same manner two models for air passenger
arrivals and departures has been fitted and final
models are given below;
Total Air Passenger Arrivals = -24.645 (Government
Debt) + 1.427 (Tourist Arrivals) + 12492.515
(Average Exchange Rate) + 574.496 (Foreign Direct
Investments) -24826.777 (Interest Rate) + 217.004
(Tax Revenue) R
2 = 0.999
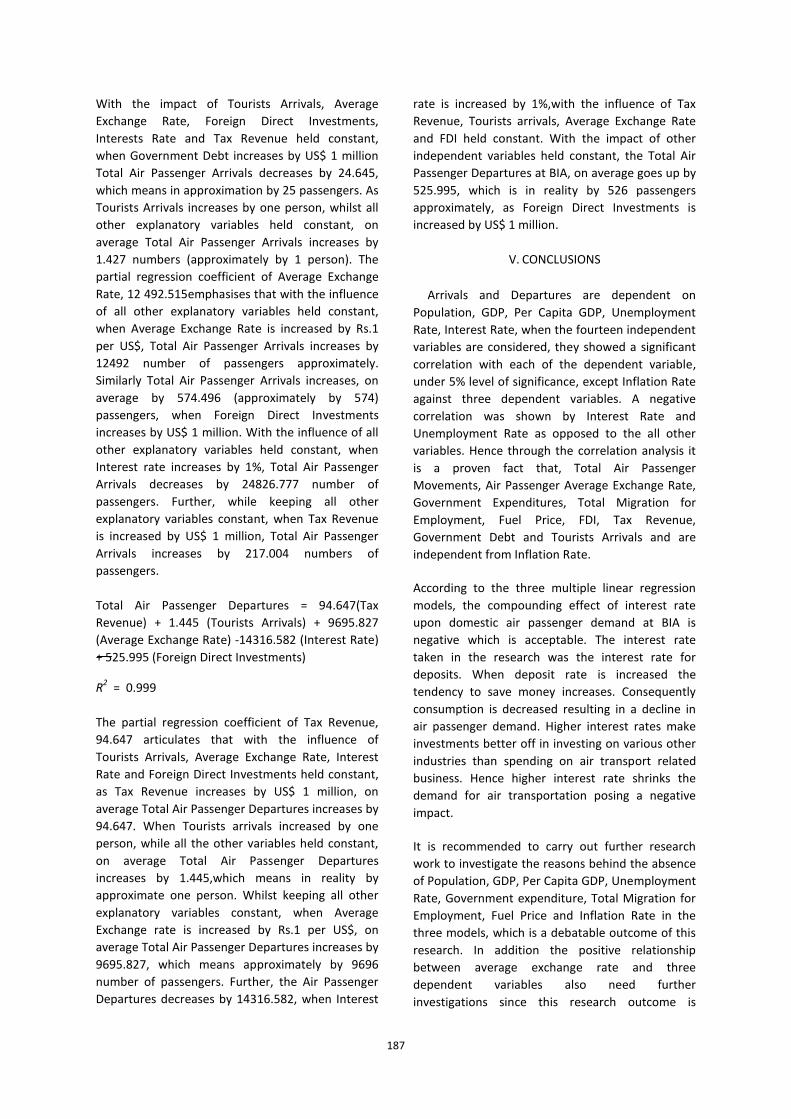
187
With the impact of Tourists Arrivals, Average
Exchange Rate, Foreign Direct Investments,
Interests Rate and Tax Revenue held constant,
when Government Debt increases by US$ 1 million
Total Air Passenger Arrivals decreases by 24.645,
which means in approximation by 25 passengers. As
Tourists Arrivals increases by one person, whilst all
other explanatory variables held constant, on
average Total Air Passenger Arrivals increases by
1.427 numbers (approximately by 1 person). The
partial regression coefficient of Average Exchange
Rate, 12 492.515emphasises that with the influence
of all other explanatory variables held constant,
when Average Exchange Rate is increased by Rs.1
per US$, Total Air Passenger Arrivals increases by
12492 number of passengers approximately.
Similarly Total Air Passenger Arrivals increases, on
average by 574.496 (approximately by 574)
passengers, when Foreign Direct Investments
increases by US$ 1 million. With the influence of all
other explanatory variables held constant, when
Interest rate increases by 1%, Total Air Passenger
Arrivals decreases by 24826.777 number of
passengers. Further, while keeping all other
explanatory variables constant, when Tax Revenue
is increased by US$ 1 million, Total Air Passenger
Arrivals increases by 217.004 numbers of
passengers.
Total Air Passenger Departures = 94.647(Tax
Revenue) + 1.445 (Tourists Arrivals) + 9695.827
(Average Exchange Rate) -14316.582 (Interest Rate)
+ 525.995 (Foreign Direct Investments)
R2 = 0.999
The partial regression coefficient of Tax Revenue,
94.647 articulates that with the influence of
Tourists Arrivals, Average Exchange Rate, Interest
Rate and Foreign Direct Investments held constant,
as Tax Revenue increases by US$ 1 million, on
average Total Air Passenger Departures increases by
94.647. When Tourists arrivals increased by one
person, while all the other variables held constant,
on average Total Air Passenger Departures
increases by 1.445,which means in reality by
approximate one person. Whilst keeping all other
explanatory variables constant, when Average
Exchange rate is increased by Rs.1 per US$, on
average Total Air Passenger Departures increases by
9695.827, which means approximately by 9696
number of passengers. Further, the Air Passenger
Departures decreases by 14316.582, when Interest
rate is increased by 1%,with the influence of Tax
Revenue, Tourists arrivals, Average Exchange Rate
and FDI held constant. With the impact of other
independent variables held constant, the Total Air
Passenger Departures at BIA, on average goes up by
525.995, which is in reality by 526 passengers
approximately, as Foreign Direct Investments is
increased by US$ 1 million.
V. CONCLUSIONS
Arrivals and Departures are dependent on
Population, GDP, Per Capita GDP, Unemployment
Rate, Interest Rate, when the fourteen independent
variables are considered, they showed a significant
correlation with each of the dependent variable,
under 5% level of significance, except Inflation Rate
against three dependent variables. A negative
correlation was shown by Interest Rate and
Unemployment Rate as opposed to the all other
variables. Hence through the correlation analysis it
is a proven fact that, Total Air Passenger
Movements, Air Passenger Average Exchange Rate,
Government Expenditures, Total Migration for
Employment, Fuel Price, FDI, Tax Revenue,
Government Debt and Tourists Arrivals and are
independent from Inflation Rate.
According to the three multiple linear regression
models, the compounding effect of interest rate
upon domestic air passenger demand at BIA is
negative which is acceptable. The interest rate
taken in the research was the interest rate for
deposits. When deposit rate is increased the
tendency to save money increases. Consequently
consumption is decreased resulting in a decline in
air passenger demand. Higher interest rates make
investments better off in investing on various other
industries than spending on air transport related
business. Hence higher interest rate shrinks the
demand for air transportation posing a negative
impact.
It is recommended to carry out further research
work to investigate the reasons behind the absence
of Population, GDP, Per Capita GDP, Unemployment
Rate, Government expenditure, Total Migration for
Employment, Fuel Price and Inflation Rate in the
three models, which is a debatable outcome of this
research. In addition the positive relationship
between average exchange rate and three
dependent variables also need further
investigations since this research outcome is
188
contradictory to general macroeconomic theories
that state, increase in average exchange rate results
in decrease in demand for services or products.
REFERENCES
Abed, S. Y., Ba-Fail, A. O. and Jasimuddin, S. M. 2001. An
econometric analysis of (Tunc,
2013)international air travel demand in
Saudi Arabia. Journal of Air Transport
Management, 7 (3), pp. 143--148.
Abed, S. Y., Ba-Fail, A. O. and Jasimuddin, S. M. 2001. An
econometric analysis of international air travel
demand in Saudi Arabia. 7 (3), pp. 143-148.
Available
at:http://econpapers.repec.org/article/eeejait
ra/v_3a 7_3ay_3a2001_3ai_3a3_3ap_3a143-
148.htm [Accessed: 5 September 2013].
Demirsoy, C. (2012). Analysis of stimulated domestic air
transport demand in Turkey. 1st ed.
Rotterdam: Erasmus University.
Stanley, S. and Farming, M. (1993). Australian Marine
Sciences Conference 1993. University of
Melbourne, Parkville, Vic. Contact: Dr
Gary CB Poore, Department of
Crustacea, Museum of Victoria, 71 Victoria
Crescent, Abbotsford, Vic 3067.
Phone:(03). Maritime Studies.
BIOGRAPHY OF AUTHORS
1W.A. Madusha Dilhariis a graduand of
BSc in International Transportation
Management and Logistics offered by
Dalian Maritime University and
facilitated by faculty of Management
CINEC Maritime Campus.
2Lakshmi Udeshika Ranwala is a
statistics lecturer and Course
coordinator for BSc ITML programme of
Faculty of Management, CINEC
Maritime Campus. Her research
interests include statistics modeling and Operational
research.
189
The Study on Factors Affecting the Decline of Freight Movement: The Case of Sri Lanka Railways (SLR)
AHM Sabeen Sharic 1, GTF De Silva 2
1Lecturer, Department of Management and Finance, General Sir John Kotelawala Defence University,
Ratmalana, Sri Lanka 2
Associate Professor, General Sir John Kotelawala Defence University, Ratmalana, Sri Lanka [email protected],
Abstract— The freight movement by the Sri Lanka
Railways has had a dramatic decline over the last
three decades. The freight market share of the Sri
Lanka Railways(SLR) has come down to 0.7% in the
recent past, which was 32% in 1979 showing a
drastic decline in the efficiency and competitiveness
of SLR in handling freight, relates the Draft National
Transport Policy of Sri Lanka.This study focuses on
the factors that might have affected this decline.
SLR has played a pivotal role for the development of
the economy of the country three decades ago as
most of the business relied on SLR. It is significant to
restore the lost business of SLR in terms of reviving
the economy of the country. With this in mind, this
study was carried out to identify the reasons that
would have resulted the failure of the freight
business of SLR.
Keywords: Sri Lanka Railways, Decline, Freight
Movement
I. INTRODUCTION
Sri Lanka Railways (SRL) is a government
department under the Ministry of Transport. It is a
major transport service provider and is the only rail
transport organization in the country. At its
inception, railway was carrying more freight than
passengers. But today, it is passenger oriented.
SLR’s market share for passenger transport is about
6% and about 0.7% for goods transport. It could be
observed that freight market share has had a great
decline over the last three decades. This study
focuses on identifying the factors that might have
contributed towards this freight decline by SLR. The
identified hypotheses are as follows: Substantial
development of motorized road transport ,lack of
inter modal infrastructure facilities connecting
railways, presence of freight forwarding firms , lack
of competition and private participation, lack of
container cargo segment, time delays and reduced
speed of the SLR, under investment in rolling stock ,
lack of customer oriented services , inefficient
pricing mechanism for road transport, lack of active
regulator, lack of technological aspect and lack of
safety.
II. LITERATURE REVIEW
Taylor (2000) says that the substantial development
that the roads have achieved in most of the
developing nations has led towards the decline of
usage of freight by railways. Baumoul (1977)
reports that lack of intermodal facilities connecting
railways in most rural areas reduces the interest of
the people to transport freight by railways. The
registration of freight forwarding firms in Sri Lanka
and its business activities have captured much of
the cargos of Sri Lanka railways, relates Sri Lanka
Freight forwarding Association (2010).
Having an active state regulator and the financial
support given by the regulator (government) is the
prime reason for the success of the Indian Railways
(INR) which provides much customer oriented
services for both passengers and freight. It can be
noted that 60% of the revenue is obtained by INR
through freight business, relates, Ministry of
Commerce and Industry, Government of India.
III. METHODOLOGY
After the problem was well defined and the
hypotheses were developed using study materials
based on foreign experiences, primary data was
collected from vegetable wholesalers in Pettah
market about what had restricted them to use
railways to transport their goods from the origin. A
visit was made to Pettah and the secretary of the
wholesalers Association of the Pettah market was
interviewed to get those primary data. A meeting
with two main officers of Sri Lanka Railways
(General Manager and Operations Manager)
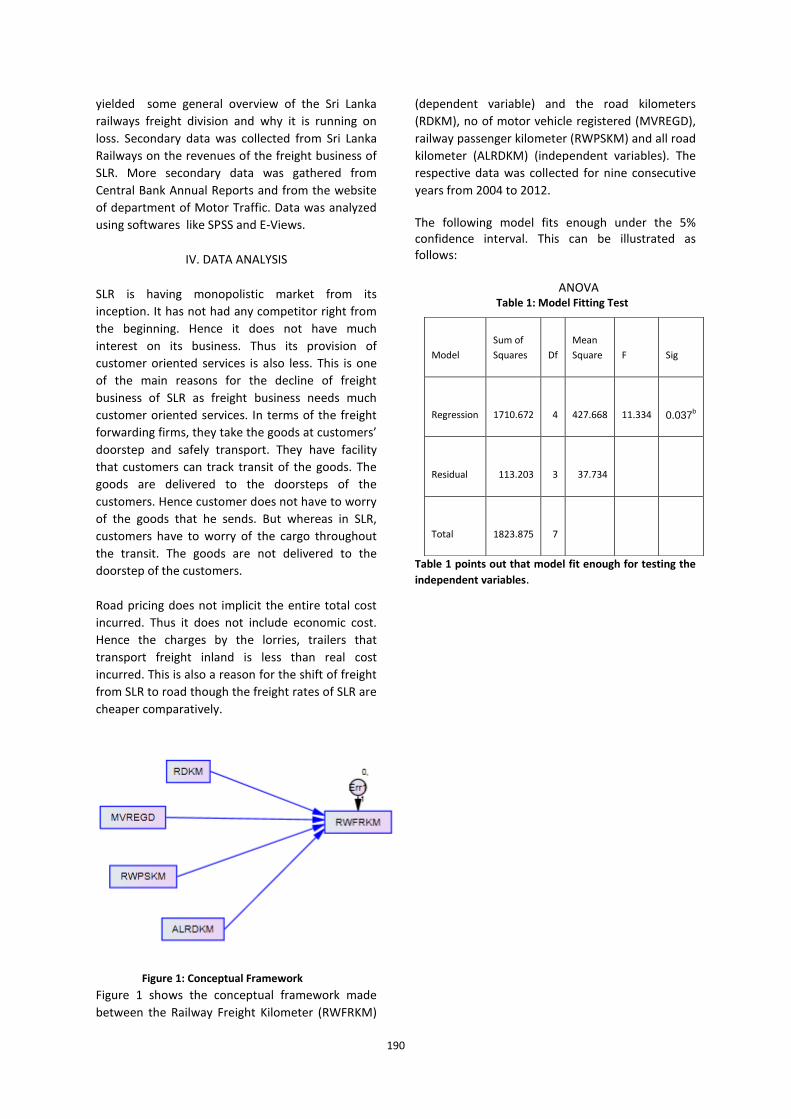
190
yielded some general overview of the Sri Lanka
railways freight division and why it is running on
loss. Secondary data was collected from Sri Lanka
Railways on the revenues of the freight business of
SLR. More secondary data was gathered from
Central Bank Annual Reports and from the website
of department of Motor Traffic. Data was analyzed
using softwares like SPSS and E-Views.
IV. DATA ANALYSIS
SLR is having monopolistic market from its
inception. It has not had any competitor right from
the beginning. Hence it does not have much
interest on its business. Thus its provision of
customer oriented services is also less. This is one
of the main reasons for the decline of freight
business of SLR as freight business needs much
customer oriented services. In terms of the freight
forwarding firms, they take the goods at customers’
doorstep and safely transport. They have facility
that customers can track transit of the goods. The
goods are delivered to the doorsteps of the
customers. Hence customer does not have to worry
of the goods that he sends. But whereas in SLR,
customers have to worry of the cargo throughout
the transit. The goods are not delivered to the
doorstep of the customers.
Road pricing does not implicit the entire total cost
incurred. Thus it does not include economic cost.
Hence the charges by the lorries, trailers that
transport freight inland is less than real cost
incurred. This is also a reason for the shift of freight
from SLR to road though the freight rates of SLR are
cheaper comparatively.
Figure 1: Conceptual Framework
Figure 1 shows the conceptual framework made
between the Railway Freight Kilometer (RWFRKM)
(dependent variable) and the road kilometers
(RDKM), no of motor vehicle registered (MVREGD),
railway passenger kilometer (RWPSKM) and all road
kilometer (ALRDKM) (independent variables). The
respective data was collected for nine consecutive
years from 2004 to 2012. The following model fits enough under the 5% confidence interval. This can be illustrated as follows:
ANOVA
Table 1: Model Fitting Test
Table 1 points out that model fit enough for testing the
independent variables.
Model
Sum of
Squares Df
Mean
Square F Sig
Regression 1710.672 4 427.668 11.334 0.037b
Residual 113.203 3 37.734
Total 1823.875 7
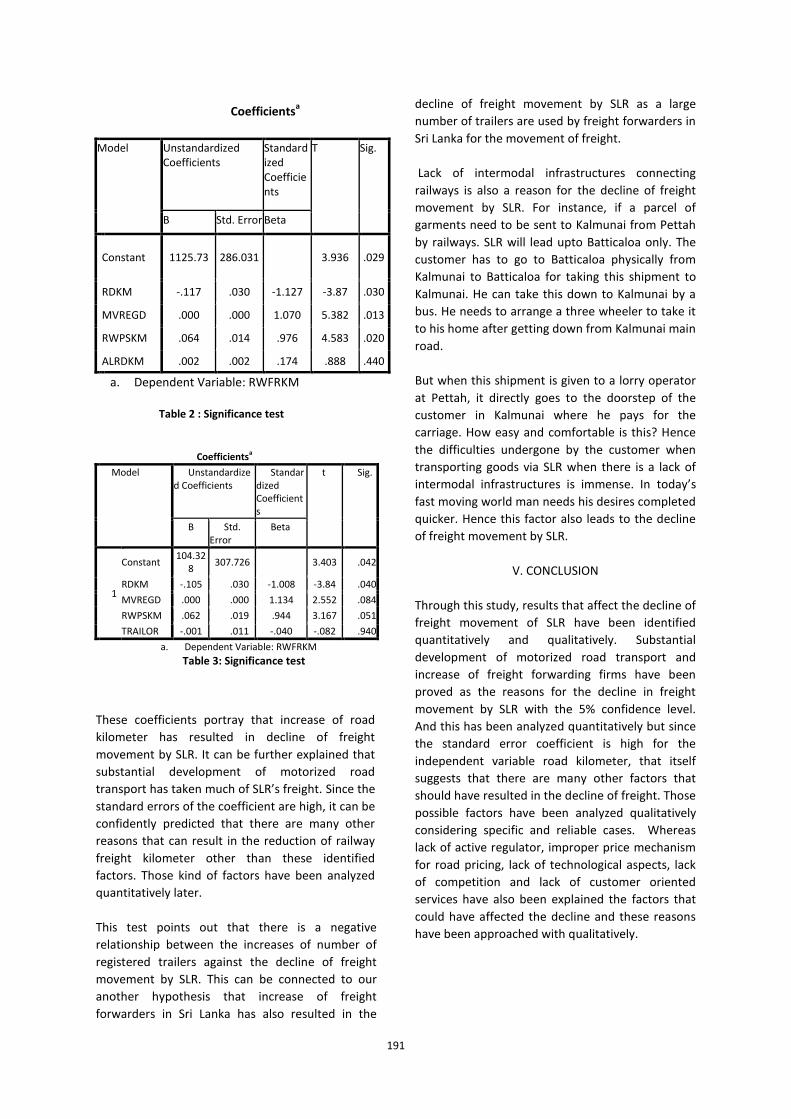
191
These coefficients portray that increase of road
kilometer has resulted in decline of freight
movement by SLR. It can be further explained that
substantial development of motorized road
transport has taken much of SLR’s freight. Since the
standard errors of the coefficient are high, it can be
confidently predicted that there are many other
reasons that can result in the reduction of railway
freight kilometer other than these identified
factors. Those kind of factors have been analyzed
quantitatively later.
This test points out that there is a negative
relationship between the increases of number of
registered trailers against the decline of freight
movement by SLR. This can be connected to our
another hypothesis that increase of freight
forwarders in Sri Lanka has also resulted in the
decline of freight movement by SLR as a large
number of trailers are used by freight forwarders in
Sri Lanka for the movement of freight.
Lack of intermodal infrastructures connecting
railways is also a reason for the decline of freight
movement by SLR. For instance, if a parcel of
garments need to be sent to Kalmunai from Pettah
by railways. SLR will lead upto Batticaloa only. The
customer has to go to Batticaloa physically from
Kalmunai to Batticaloa for taking this shipment to
Kalmunai. He can take this down to Kalmunai by a
bus. He needs to arrange a three wheeler to take it
to his home after getting down from Kalmunai main
road.
But when this shipment is given to a lorry operator
at Pettah, it directly goes to the doorstep of the
customer in Kalmunai where he pays for the
carriage. How easy and comfortable is this? Hence
the difficulties undergone by the customer when
transporting goods via SLR when there is a lack of
intermodal infrastructures is immense. In today’s
fast moving world man needs his desires completed
quicker. Hence this factor also leads to the decline
of freight movement by SLR.
V. CONCLUSION
Through this study, results that affect the decline of
freight movement of SLR have been identified
quantitatively and qualitatively. Substantial
development of motorized road transport and
increase of freight forwarding firms have been
proved as the reasons for the decline in freight
movement by SLR with the 5% confidence level.
And this has been analyzed quantitatively but since
the standard error coefficient is high for the
independent variable road kilometer, that itself
suggests that there are many other factors that
should have resulted in the decline of freight. Those
possible factors have been analyzed qualitatively
considering specific and reliable cases. Whereas
lack of active regulator, improper price mechanism
for road pricing, lack of technological aspects, lack
of competition and lack of customer oriented
services have also been explained the factors that
could have affected the decline and these reasons
have been approached with qualitatively.
Coefficientsa
Model Unstandardized Coefficients
Standardized Coefficients
T Sig.
B Std. Error Beta
Constant 1125.73 286.031
3.936 .029
RDKM -.117 .030 -1.127 -3.87 .030
MVREGD .000 .000 1.070 5.382 .013
RWPSKM .064 .014 .976 4.583 .020
ALRDKM .002 .002 .174 .888 .440
a. Dependent Variable: RWFRKM Table 2 : Significance test
Coefficientsa
Model Unstandardized Coefficients
Standardized Coefficients
t Sig.
B Std. Error
Beta
1
Constant 104.32
8 307.726
3.403 .042
RDKM -.105 .030 -1.008 -3.84 .040
MVREGD .000 .000 1.134 2.552 .084
RWPSKM .062 .019 .944 3.167 .051
TRAILOR -.001 .011 -.040 -.082 .940
a. Dependent Variable: RWFRKM
Table 3: Significance test

192
REFERENCES
Hyatt.D (2000), Railways of Sri Lanka. Comrac, London
and Colombo
Loubinoux .J (2005), Rail and Sustainable development,
Japan
Campos J (2000), Rail transport regulation, Spain
Ministry of Commerce and Industry,(2001) Railway India
Holt J (2003), The restructuring of railways, New York
BIOGRAPHY OF AUTHORS
1 Author is a lecturer in the Department
of Management and Finance in the
Faculty of Management Social Sciences
and Humanities in General Sir John
Kotelawala Defence University
2Professor G.T.F. De Silva, served
University of Moratuwa as Lecturer,
Head of the Department of
Mathematics and as Vice Chancellor. He
was the Director General of S.L.I.A.T.E
and Managing Director of Media Defined, the Sri Lankan
Branch of a USA Company working in e-Learning.
Currently he is attached to the Department of IT &
Mathematics at KDU. He holds DIC & M. Phil. in
Mathematics & Computing, D. Phil (H.C.) from University
of Moratuwa, MBCS, C. Eng and MBIS.
Photograph
Author 3
193
Importance of Ethical Leadership in Public and Private Enterprises of Sri Lanka in Developing and Global Contexts
Deepanie Perera
Target Resource (Pvt) Ltd., 31/10, D.M. Colombage Mawatha, Nawala, Nugegoda, Sri Lanka
A truth that's told with bad intent beats all the lies you can invent.
William Blake (1757–1827)
Abstract—This conference paper will attempt to
address key aspects of a resurgent and a
contemporary business issue – importance of
ethical leadership in private and public enterprises
of Sri Lanka in developing and global contexts. It
drew primary survey data as empirical evidence
from a developing economy (Sri Lanka), where 17
leaders and managers of Sri Lankan organisations
consisting of private and public enterprises were
interviewed face-to-face and researched recently,
as well as survey data drawn from secondary
research contrasted to compare with those of a
developed economy (Australia) carried out in a
recent identical doctoral research (2011/12) in
order to compound the importance when compared
with a developed economy and to establish the
difference if at all. Organisations and their leaders
often underestimate how closely they are being
watched by not only by their employees, but by the
general public at large – both within the country
and globally. The leaders actually do versus what
they ought to do (Brown, 2007) should not be two
things. The importance of this research is the
impact of ethical leadership on organisations and
their outcomes both in development and global
contexts. It affects on management in economic
development from a micro (organizational)
perspective to a more macro economical
perspective posing the central question how
important leading ethically is. Leading can be
defined as inspiring, motivating and directing. The
paper argues, significantly how both economies (Sri
Lanka and Australia) behave similarly in leading
ethically, but mechanisms that are in place to make
organizations accountable for ethical violations
which result in acts of misconduct and
mismanagement in Sri Lanka are either absent,
lacking or ineffective or all of the three; providing
motivation and scope for greater mobilization of
ethics in Sri Lanka. Ethical leadership is bound to
escalate stakeholders and the public to place the
country’s image with an improved and positive
perception globally and reap benefits of
development, according to a conceptual model
developed by the author.
Keywords— Ethical leadership, developing, global
I. INTRODUCTION
Ciulla (1998) proposed that ethics is at the ‘heart of
leadership’. With public sector and corporate
mismanagement and corruption in concerning
proportions globally (Global Corruption Barometer
2013 –
(http://www.slideshare.net/linkedin/influencer-
interviews-sir-martin-sorrell-founder-ceo-of-wpp),
the greed to making profits at any cost will
continue to reinforce the need for ethical
leadership as an antecedent, in a profound and a
pronounced manner.
Ethics from a management perspective is defined
as ‘The code of moral principles and values that
governs the behaviour of a person or a group with
respect to what is right or wrong’ (Samson and
Daft, 2009). As such, organisations or persons
conducting themselves ethically and are in
positions of power with followers looking up to
them will be considered ‘leading ethically’. When
the leader is unethical, followers who are
controlled by the position power of the leader and
don’t support such unethical behaviour, but are
forced to follow due to fears of losing their jobs or
potentially having their entire career debilitated is
known to have experienced an ‘ethical dilemma’
(alternative choices of behaviours have potentially
negative ethical consequences – Samson and Daft,
2009). For example if an employee is required to
pay a bribe to get something done on behalf of his
194
employer/organisation very much against his/her
personal wish, that person is considered to be
going through an ethical dilemma.
The impact of ethics as a variable on economic
development in the Sri Lankan context has not
been adequately researched, with the earliest
recorded research dating to as late as 1997 (Batten,
Hettihewa and Mellor, 1997).
Other than firm-specific factors, socio-cultural
factors too influence management’s perceptions of
unethical practice (Macdonald and Zepp, 1988;
Rashid, 1988).
The purpose of this paper is to examine the
importance of ethical leadership in private and
public enterprises of Sri Lanka in developing and
global contexts, the latter (global contexts)
compared with that of a developed economy
(Australia) through a recent doctoral research
carried out, to understand the cross-cultural
differences if any.
Both Sri Lanka and Australia have open economies
and similar populations (21 and 22 million
respectively) with vastly different socio-cultural
environments and economic development
indicators.
Questions concerning the following eight aspects
which impacted the two key variables - ethical
leadership and organisational excellence/country
standing were asked from the seventeen
participants who were interviewed face-to-face.
The following eight open ended questions were
drafted considering a fair representation of data
collection where all participants responded to same
questions. This approach made the research data
more reliable and valid.
1. What are individual’s personal values and
who/what influenced them the most?
2. What are the values of the organisation they
work for?
3. How the individual describes an ethical leader?
4. How the individual describes an unethical
leader?
5. Describe an ethical dilemma experienced by
the individual
6. If the organisation the individual is working for
has a written code of ethics
7. How important is ethical leadership for the
development of their organisation?
8. Participant’s views on the greatest challenges
impeding development facing Sri Lanka in a
global environment/context
The introduction of the paper will be followed by
research questions, a literature review, a
conceptual framework, research methodology,
results, discussion and the conclusion.
II. RESEARCH QUESTIONS
Answers as findings to the following research
questions were sought through data gathered via
responses to above questions.
A. Is there a correlation between ethical and
unethical leadership outcomes on
organisations?
B. Is there a positive correlation between ethical
leadership on organisational economic
development/performance?
C. Is ethical leadership influencing country’s
image in the global environment?
D. Is ethical leadership affecting a country’s
development?
III. FROM THE LITERATURE
According to Batten et al (1997) there are
significant variations in the factors affecting ethical
management practice between the two countries
(Sri Lanka and Australia), such as a code of ethics
and a forum to discuss ethics, whereby Australian
firms were ahead of Sri Lanka ones. However, the
results suggested that both countries had more
scope for the development of better ethical
management practice. The challenge here was the
very limited number of research and scholarly
articles available concerning ethics in Sri Lanka.
In a recent doctoral research by Crews (2011) on
‘What is ethical leadership? A study to define the
characteristics of ethical leadership: perspectives
from Australian public and private sectors’ where
78 senior executives from diverse industries across
Australia were interviewed on ethical leadership,
the following principal findings emerged:
“Participants’ recollections of ethical leadership
centred on three themes: value alignment,
governance and relationship-centredness. Ethical
leaders are perceived to be individuals who behave
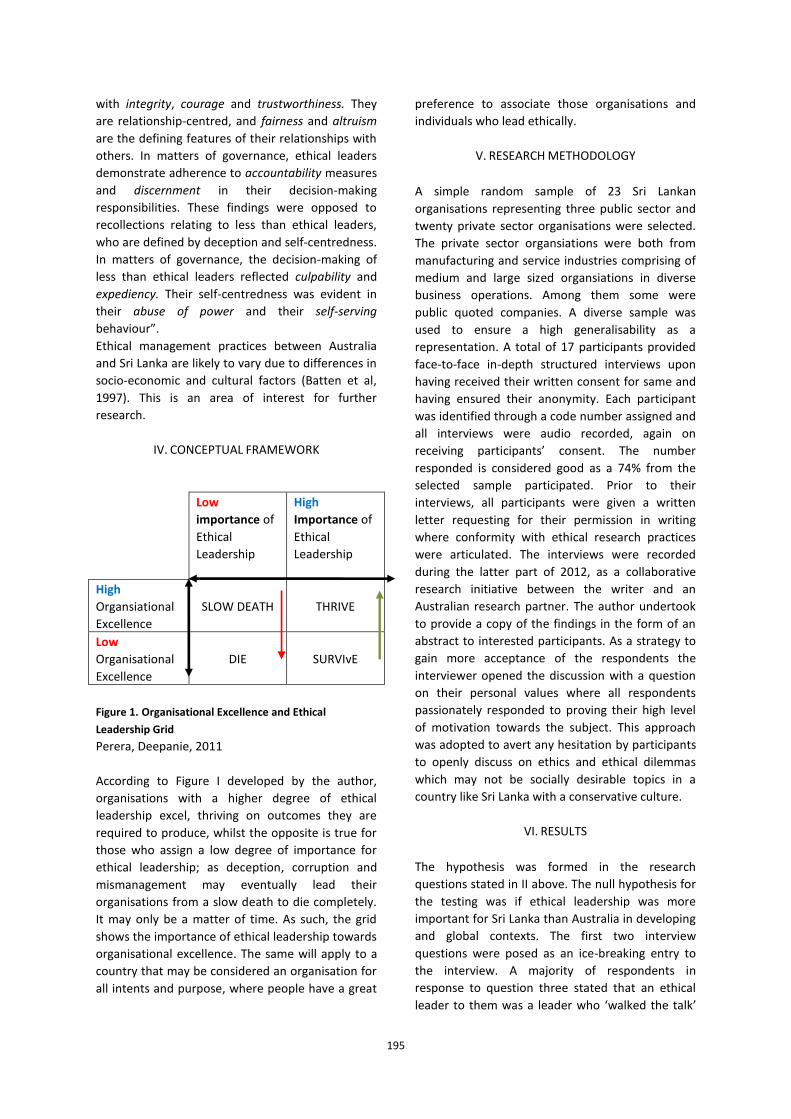
195
with integrity, courage and trustworthiness. They
are relationship-centred, and fairness and altruism
are the defining features of their relationships with
others. In matters of governance, ethical leaders
demonstrate adherence to accountability measures
and discernment in their decision-making
responsibilities. These findings were opposed to
recollections relating to less than ethical leaders,
who are defined by deception and self-centredness.
In matters of governance, the decision-making of
less than ethical leaders reflected culpability and
expediency. Their self-centredness was evident in
their abuse of power and their self-serving
behaviour”.
Ethical management practices between Australia
and Sri Lanka are likely to vary due to differences in
socio-economic and cultural factors (Batten et al,
1997). This is an area of interest for further
research.
IV. CONCEPTUAL FRAMEWORK
Low
importance of
Ethical
Leadership
High
Importance of
Ethical
Leadership
High
Organsiational
Excellence
SLOW DEATH
THRIVE
Low
Organisational
Excellence
DIE
SURVIvE
Figure 1. Organisational Excellence and Ethical
Leadership Grid Perera, Deepanie, 2011
According to Figure I developed by the author,
organisations with a higher degree of ethical
leadership excel, thriving on outcomes they are
required to produce, whilst the opposite is true for
those who assign a low degree of importance for
ethical leadership; as deception, corruption and
mismanagement may eventually lead their
organisations from a slow death to die completely.
It may only be a matter of time. As such, the grid
shows the importance of ethical leadership towards
organisational excellence. The same will apply to a
country that may be considered an organisation for
all intents and purpose, where people have a great
preference to associate those organisations and
individuals who lead ethically.
V. RESEARCH METHODOLOGY
A simple random sample of 23 Sri Lankan
organisations representing three public sector and
twenty private sector organisations were selected.
The private sector organsiations were both from
manufacturing and service industries comprising of
medium and large sized organsiations in diverse
business operations. Among them some were
public quoted companies. A diverse sample was
used to ensure a high generalisability as a
representation. A total of 17 participants provided
face-to-face in-depth structured interviews upon
having received their written consent for same and
having ensured their anonymity. Each participant
was identified through a code number assigned and
all interviews were audio recorded, again on
receiving participants’ consent. The number
responded is considered good as a 74% from the
selected sample participated. Prior to their
interviews, all participants were given a written
letter requesting for their permission in writing
where conformity with ethical research practices
were articulated. The interviews were recorded
during the latter part of 2012, as a collaborative
research initiative between the writer and an
Australian research partner. The author undertook
to provide a copy of the findings in the form of an
abstract to interested participants. As a strategy to
gain more acceptance of the respondents the
interviewer opened the discussion with a question
on their personal values where all respondents
passionately responded to proving their high level
of motivation towards the subject. This approach
was adopted to avert any hesitation by participants
to openly discuss on ethics and ethical dilemmas
which may not be socially desirable topics in a
country like Sri Lanka with a conservative culture.
VI. RESULTS
The hypothesis was formed in the research
questions stated in II above. The null hypothesis for
the testing was if ethical leadership was more
important for Sri Lanka than Australia in developing
and global contexts. The first two interview
questions were posed as an ice-breaking entry to
the interview. A majority of respondents in
response to question three stated that an ethical
leader to them was a leader who ‘walked the talk’
196
(does what he says), which in turn gave an entry
and a response of sorts to the next question too,
which was about an unethical leader. In describing
an unethical leader, respondents used words and
phrases like: deception, duplicity, hypocrisy,
corruption, misrepresentation, self-centeredness,
self-serving interests, leader with compromised
values, violation of organisational processes,
misuse of power, disrespectfulness, dishonesty and
the abuse of institutional resources for personal
gratification. In responding to question five, almost
all respondents took the most time and spoke with
much passion about their own experiences. Most
organisations did not have a written code of ethics;
the few (two) who had, complained that the code
was not enforced or a divide-and-rule practice
towards it prevailed in their organisations making
the process dysfunctional and ineffective. They also
claimed the code of ethics was a mere attempt to
impress upon regulators and compliance
requirements of clients, resulting in it not being an
instrument that was born through conviction.
All respondents said ethical leadership was highly
important for the development of their
organisations. Some went on to justify their
responses in detail, stating development and
sustainability will only stay if the leadership was
ethical, followed by ethical practices across the
organisation (complied by followers). As the last
question was broad in nature, diverse responses
were received. This was an intentional strategy
deployed to avoid any biases that the respondents
may have in slanting the responses more towards
ethics. Among a number of various responses such
as the lack of a strong nationalistic identity, lack of
visionary political leadership, support from the
developed world, lack of transparency as a nation,
corruption at all levels, skills gaps and skills building
challenges, a 37% responded that ethical leadership
both at political and institutional/organisational
levels were the greatest challenges impeding
development mostly economical, facing Sri Lanka in
a global environment/context.
When compared with the results of the doctoral
thesis through research carried out across 78
Australian organisations threw up similar results to
the one carried out in Sri Lanka; with the key
difference being the mechanisms available to
address unethical leadership issues were present in
a much higher degree in Australia than in Sri Lanka.
A number of general qualitative remarks and
comments (as already mentioned above) provided
by participants too were considered in analysing
results from the two researches.
VII. DISCUSSION
In responding to the four research questions above,
and on having analysed the same, it was clear there
was a positive correlation between ethical and
unethical leadership outcomes on organisations.
This finding also compounded the conceptual
framework (Figure 1) presented whereby when an
organisation has assigned a low importance to
ethical leadership, it had produced a low
organisational excellence, meaning the richness of
its’ outcomes were low. This is easy to comprehend
as customers, suppliers and other stakeholders
including employees won’t favour associating
organisations who don’t lead ethically. Further,
there is a positive correlation between ethical
leadership and organisational economic
development/performance. An unethically led
organisation may seemingly do well, but only until
the duplicity is exposed. Golden Key scandal is a
good example from Sri Lanka whilst the recent
withdrawal of GE motor vehicles sold globally since
2004 which were faulty and known by management
to be faulty is a good global example for unethical
behaviour of a global entity. Both Sri Lanka’s
political establishment and organisations that are
public and private will project a positive image of
the country in the global environment when they
are ethically led, suggesting a strong correlation
among the variables. In addressing the last question
whether ethical leadership is affecting a country’s
development, facts and points may be drawn from
the responses given to question ‘B’ above – as for
one foreign investment, aid and grants will arrive
under an environment of ethics and to sustain
macro socio-economic development ethics must
prevail demonstrating ethical leadership among
public and private enterprises. Some qualitative
responses to ‘C’ and ‘D’ above were image and
recognition, results oriented culture, independence
of the judiciary, socio-political and economic
stability, personal values, competitive business
environment, brain-gain, investment in developing
human capital, etc.
VIII. DIRECTIONS FOR FUTURE RESEARCH
A close scrutiny of all socio-economic development
parameters could be researched and mapped
197
directly to ethical leadership. Firm specific
parameters such as the size, turnover, industry,
even taking different professions (finance,
marketing, human resource management, etc.) and
industries, etc. as empirical studies may be
surveyed to examine ethics in specific professions,
industries, markets and even demographically;
which certainly would be useful for not only a
developing country like Sri Lanka but to all who
wish to attain and sustain good results through
ethical leadership. As Peter Drucker (1954) said
what gets measured, gets managed.
IX. CONCLUSION
The purpose of this study was to research the
importance of ethical leadership in private and
public enterprises of Sri Lanka in developing and
global contexts. The findings through a research
among 17 leaders and managers of public and
private sector enterprises interviewed were
compared against a doctoral research from a
developed country - Australia, carried out in 2011
using a much larger sample. The two variables
measured were importance of ethical leadership
and organisational excellence. The findings were
based on a conceptual model (Figure 1) developed
by the author where organisations assigning a high
importance to ethical leadership thrived on the
organisational excellence variable, where the
opposite (slow death to die) was true for those with
a low importance given to ethical leadership.
Though the findings were rather similar whereby
both countries assigning a high degree of
importance to ethical leadership, the difference
was by and large in the mechanisms available, such
as a written code of conduct, a forum for ethical
issues were essentially what Sri Lankan
organisations lacked; likely to be assigned due to
being a developing country as mentioned by a
number of respondents. This position also
reinforced the importance of ethical leadership in a
developing and in a global context for Sri Lanka due
to a reasons mentioned such as image and
recognition, results oriented culture, independent
judiciary, socio-political and economic stability,
personal values, competitive business environment,
brain-gain, investment in developing human capital,
etc. that must be realised, suggesting to confirm
the research subject of this paper – the importance
of ethical leadership in public and private
enterprises of Sri Lanka in developing and global
contexts. The findings also provided answers to the
four research questions raised, and discussed under
VII above. In conclusion, this paper suggests that
ethical leadership is highly important for Sri Lanka
in both contexts – developing and global, and it was
proved there is a positive correlation between the
two variables tested i.e.: ethical leadership and
organisational excellence.
ACKNOWLEDGMENT
I wish to extend a sincere thank you to all the
respondents who participated in this research, who
with no reservation shared their ideas, views and
experiences. I wish to extend a special thank you to
‘KDU International Conference’ Chair – 2014 Dr.
Namali Sirisoma for all the guidance, patience and
co-ordination, along with her staff, management,
officials and academic members of Sir John
Kotelawala Defence University. My heartfelt
appreciation extends to my fellow PhD students
and professionals who shared views, ideas and
information towards intellectually stimulated
discussions from time to time, and my patient and
extremely supportive family without whom this
research and the writing would not have
materialised.
REFERENCES
Australian Bureau of Statistics, http://www.abs.gov.au/
Batten, J., S. Hettihewa and R. Mellor (1997). The
Ethical Management Practices of Australian
Firms,
Journal of Business Ethics, forthcoming.
Ciulla, Joanne (1998). “Leadership Ethics – Ethics and
Leadership Effectiveness”
Crews, Julie, (2011). “What is ethical leadership? A
study to
define the characteristics of ethical leadership:
perspectives from Australian public and private
sectors”. Doctoral thesis, University of Curtin,
Australia.
http://espace.library.curtin.edu.au/R/?func=dbi
n-jump-
full&object_id=171314&local_base=GEN01-
ERA02
Drucker, P. - http://www.druckerinstitute.com/peter-
druckers- life-and- legacy/
Macdonald, G. and R. A. Zepp (1988). “Ethical
198
Perceptions of Hong Kong Chinese Business
Mangers”, Journal of Business Ethics 7.
Rashid, M. Z. A. (1990). “The Influence of Socio-
Cultural Factors on Perceived Unethical
Management Practices”, Malaysian
Management
Review
Samson, D & Daft, R.L. (2009). Management, Third Asia
Pacific Edition, Australia, Cengage Learning
Sri Lanka Department of Census and Statistics –
www.statistics.gov.lk
BIOGRAPHY OF AUTHOR
1Author Is founder director and chief
executive officer of Target Resource
(Pvt.) Ltd., (www.targetresource.org)
and consultant for the Ministry of Public
Management Reforms of Sri Lanka. She
is a former course director of the MBA
in Human Resource Management of the Open
University of Sri Lanka. Her corporate career spanning
over two decades saw her work for top multinationals
and blue-chip organizations. She is a senior visiting
lecturer to a number of state universities and private
institutions, trainer, consultant, speaker, career and
performance coach and researcher. She may be reached
199
Impact of Granting Micro Finance Facilities on the Living Standards of the Rural Poor in Sri Lanka
Gunathma Gunawardena
International College of Business and Technology – Sri Lanka
Abstract— This paper establishes facts to evaluate
the impact of microfinance credit schemes in
operation, on the actual living standards of
beneficiaries of such schemes. In Sri Lanka, micro
finance credit facilities are being granted to the
rural poor intending the alleviation of poverty and
achieving higher living standards. To accomplish
same, the Government has tied up with numerous
financial institutions and non-governmental
organizations through which a substantial amount
of capital has been granted to the poor despite the
high levels of risk associated with same. Irrespective
of the long history and the large number of
institutions involved, only limited knowledge is
available of its impact on living standards. No
proper paper mechanism is in place for such post –
credit evaluation. This study intends to fill this gap.
The study is carried out in the purposively selected
geographical areas of Monaragala and Kegalle,
among borrowers under various micro finance
schemes. For the clarity of the population it has
been confined to beneficiaries of facilities granted
through licensed commercial banks. The study
establishes three independent variables namely;
timely utilization of micro finance funds, utilization
of micro finance funds for intended purposes and
the risk management ability of borrowers.
Dependent variables in assessing the living
standards are identified as the household assets,
household savings and the household expenditure.
Study has utilized primary and secondary data.
Primary data are gathered through a structured
questionnaire administered to a stratified random
sample. The questionnaire was designed to reveal
general demographic details of the respondents,
enabling more clarified analysis. Secondary data are
extracted through documentary sources.
It is concluded, as evidenced in data, all factors
identified relating to the micro finance schemes
indicates a positive impact of varying degrees on
the living standards of the beneficiaries cum
borrowers, with the management of risk showing
the weakest impact.
Keywords— Micro Finance, Standard of Living,
Rural poor
I. INTRODUCTION
“Finance” plays a vital role in the economy of a
country, which is well recognized. It covers from
small to large scale funding for households and
enterprises. Wijewardena (2007) states that
Microfinance, its small and unseen brethren, too
plays the same vital role, and perhaps much more,
with respect to its clientele. The term
“Microfinance”, specifies small scale loan or credit
facilities, which are offered to the poorest people,
in order to ease poverty. Microfinance, covers a
wide array of services, viz., credit, deposit, money
transfer, insurance, market information etc.
Microfinance presents a potent instrument for
alleviating poverty and increasing living standards
of the rural poor.
Few writers, who are pessimistic in their views,
have identified microfinance to be in par with
microcredit. Microfinance is much more than
microcredit. These two words are used
interchangeably in studies, but micro finance
concerns itself with such key areas as
empowerment of the poor, market developments
and access, use of information profitably etc, in
addition to the provision of miscellaneous financial
services. Given the wider coverage of microfinance,
the poor are in a position to derive benefits from
microfinance, not only in generating an income, but
in betterment of their standards.
Microfinance not only grants credit facilities to the
poor, but also the financial literacy and training,
technological know-how, programmes to develop
skills, savings and insurance. In Sri Lanka there had

200
been numerous micro credit schemes introduced
by the government over the past decades to
alleviate poverty. Some of them are
“Janasaviya”,”Suduneluma” and at present the
Samurdhi Bank and societies.
Microfinance is expected to cater to a specific
clientele, the poor, who are normally defined very
broadly as those incapable of meeting even the day
today basic requirements needed for a decent
human life. This group is not homogeneous but
depicts a wide diversity. Examination of the
microfinance system in the country reveals that the
country still lacks a well defined articulate strategy
of assessing the impact of these schemes on the
living standards. In this context, the system has
largely been left to itself, and has stood the test of
time. Hence, it is of importance that the country
has a proper mechanism in place to identify the
true impact of the micro facilities granted on the
target constituent. This paper intends to present
the perspective of evaluating the impact of such
facilities, and provide a basic structure for the wide
evaluation of such schemes.
The geographical areas of Monaragala and Kegalle
has been purposively selected to obtain the sample
due to the fact that it contains a large number of
populations who are considered to be under or at
par with the poverty lines, and the majority of
lending institutions have focused in lending within
the said geographical area. Atapattu (2009) , in his
study on “Status of Micro Finance in Sri Lanka”
states that the poverty levels in Sri Lanka are
heterogeneous, which differs widely between
Provinces and Districts. It further indicates that
according to the data published by the department
of Census and statistics in 2002, at the two
extremes is Colombo District with 6% of the
population living in poverty and Monaragala and
Kegalle Districts which registers between 30% - 37%
of the population living in poverty. This
demonstrates the importance of disaggregating
poverty statistics in Sri Lanka in order to get an
accurate picture of where the poverty 'pockets' lie.
Due to this factor, the sample selected is
considered as representing the generalized
characteristics of the rural poor of the country.
Since the introduction of formally accepted micro
finance module by Prof. M Yunus in the seventies,
the use of micro credit as a tool of poverty
alleviation has been accepted around the world.
But the empirical evidence on the impact of micro
facilities on standards of living using cross sectional
data sets is very mixed. While some studies have
found that the access to this type of facilities has a
positive, large and a permanent effect on living
standards, other studies have found that poverty is
not reduced through micro facilities (Chawdry,
2007). These latter studies stated that through
micro credit, the poor become poorer, due to the
additional burden of debt. The drawback associated
with impact assessment studies using one – period
– cross- sectional data is that the result of such
studies could get biased due to the problem of self
selection. This study attempts to avoid such
weakness by attempting to assess the impact of
micro finance on living standards by gathering data
prior to the disbursement of facilities. In the study
more reliable estimations on the impact are
expected by analyzing the same individual twice.
Available secondary data on the living standards of
the sample is used to compare the living standards
of the same individuals after obtaining the micro
finance facilities. The study has considered
individuals who have availed themselves of such
facilities between year 2010 – 2012 (inclusive of
both years) in identifying the population and the
sample due to the consideration that the effect of
such schemes will take place with a minimum lapse
of one year from the date of grant.
Considering the above this research was carried out
with the intention of answering the research
question of “What is the impact of micro finance
facilities on the living standards of the rural poor in
Sri Lanka”?,
II. THEORETICAL BACKGROUND
A. Micro Finance
Microfinance is the branch of finance, which helps
the poorer segment of the society to keep afloat
and helps them to gradually and progressively cross
the poverty line and get them cohesively integrated
into the rest of the society. The development of
micro finance has taken a steep rise with the
introduction of the Grameen Model by
Prof.Mohamed Yunus in Bangaladesh in 1976.
Charitonenko and Rahman (2009) have
emphasized the significant factors of Grameen
model which has added value to the lives of people.
Despite the rates of interest payable, (whereas the
rates of interest are comparatively high than
average lending) this acts as an effective
201
mechanism to disseminate precious information on
ways to improve the health, education, legal rights,
sanitation and other living standards, which are of
relevant concerns for the poor.
As Banuri (2006) pointed out microfinance is the lending of extremely small amounts of capital to
poor entrepreneurs in order to create a mechanism
to alleviate poverty by providing the poor and
destitute with resources that are available to the
wealthy, albeit at a smaller scale”. He identifies that
through alleviation of poverty the benefactors of
such schemes would achieve high standards of
living.
Adding to that, some writers (Murray & Boros,
2002; Ledgerwood,1998) stated in their books that
microfinance consists of several main
characteristics inclusive of advancement of living
conditions. The fact that the micro finance facilities
are collateral free, presents the lenders with an
additional risk of default, emphasizing the fact that
a proper mechanism of post – credit evaluation is
needed to be adopted. Due to the presence of the
default factor, the finance facilities does not work
on a perfect market equilibrium like other
commodities, with a positively corresponding
demand and supply regimes.
Further, Wijewardena (2007) has stated that
microfinance is to be reorganized as an important
element in poverty alleviation system since its vital
role in the overall financial system has created a
systematic impact. Hence same need to be
explicitly incorporated into the national
development strategies. He further states that the
failure of any national level micro finance scheme
would bring a social cost to the society. Every level
of the society has to be growing for a national
development thus a “system that benefits a
sizeable segment of the society” is important to be
analysed for its actual impact.
Microfinance schemes, if left un- assessed, would
work as a safety net- a normal strategy used to
capture the poorest segment of the society, prior to
them making a free fall to the ground. The
objective is to provide some relief, to meet the very
basic requirements (Brau, 2004). Adding to the
above view of Brau (2004) it could be noted that
the weaknesses in this type of strategies are well
known. Economists have long named this problem
as the “moral hazard” problem. It encourages poor
people to remain in the safety net forever. They
have no incentive to move out of the net, because
moving out would mean their having to work hard
for a living. As a result, he increases the chance of
the occurrence of the event which the helper
desires to prevent. The consequence is that it
imposes an additional burden on the helper. As a
result, neither the helper nor the helped would be
able to get out of the vicious circle in which the
both parties would get trapped.
The moral hazard behaviour by people who get free
goods is not a new phenomenon. It had been
known for many centuries. The Buddha has
preached in one of the discourses titled “Chakka
Vatti Seehanaada Sutta” how the king of a country
was duped by the people who were given free
capital to commence self-employment projects.
Above theoretical background explicitly states that
schemes which are targeting the alleviation of
poverty have to be well monitored and evaluated in
achieving its original objectives.
Some literature which is available in the area does
not give conclusive evidence of the impact of micro
finance schemes on the living standards. According
to Thilakarathne and Wickramasinghe (2005) in a
study conducted on the impact of micro finance
scheme on the household income, covering 17
districts of Sri Lanka (except North and East), over
50% of the households have confirmed that there
had been a significant improvement in their income
levels, while a considerable amount had stated that
they have not experienced a major improvement in
the level of income. However the above research
states that micro finance has played a vital role in
increasing the level of income which is important
for a developing country like Sri Lanka. It further
states that micro finance is designed towards
improving the standards of living and even a least
improvement on the income of the selected
segment of low income earned people will bring
higher benefits rather than for people with good
income levels, as it will have a major impact on the
level of consumption, child education, savings,
health, and many other aspects of living standards.
B. Status of Microfinance and Poverty in Sri Lanka
A sectorally disaggregated view given in available
sources shows the highest levels of poverty
occurring in the provinces of Southern, Uva and
Sabaragamuwa. Overall, rural areas are poorest -
90% of the poor live in rural areas, but this statistic
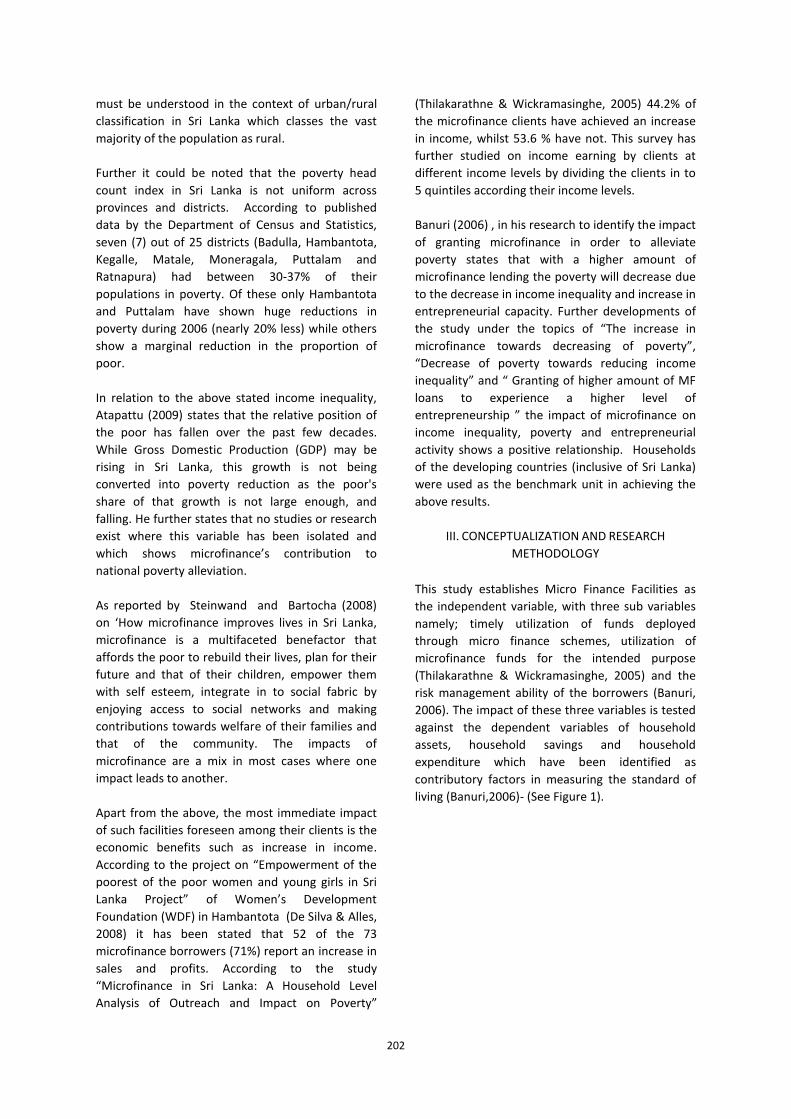
202
must be understood in the context of urban/rural
classification in Sri Lanka which classes the vast
majority of the population as rural.
Further it could be noted that the poverty head
count index in Sri Lanka is not uniform across
provinces and districts. According to published
data by the Department of Census and Statistics,
seven (7) out of 25 districts (Badulla, Hambantota,
Kegalle, Matale, Moneragala, Puttalam and
Ratnapura) had between 30-37% of their
populations in poverty. Of these only Hambantota
and Puttalam have shown huge reductions in
poverty during 2006 (nearly 20% less) while others
show a marginal reduction in the proportion of
poor.
In relation to the above stated income inequality,
Atapattu (2009) states that the relative position of
the poor has fallen over the past few decades.
While Gross Domestic Production (GDP) may be
rising in Sri Lanka, this growth is not being
converted into poverty reduction as the poor's
share of that growth is not large enough, and
falling. He further states that no studies or research
exist where this variable has been isolated and
which shows microfinance’s contribution to
national poverty alleviation.
As reported by Steinwand and Bartocha (2008)
on ‘How microfinance improves lives in Sri Lanka,
microfinance is a multifaceted benefactor that
affords the poor to rebuild their lives, plan for their
future and that of their children, empower them
with self esteem, integrate in to social fabric by
enjoying access to social networks and making
contributions towards welfare of their families and
that of the community. The impacts of
microfinance are a mix in most cases where one
impact leads to another.
Apart from the above, the most immediate impact
of such facilities foreseen among their clients is the
economic benefits such as increase in income.
According to the project on “Empowerment of the
poorest of the poor women and young girls in Sri
Lanka Project” of Women’s Development
Foundation (WDF) in Hambantota (De Silva & Alles,
2008) it has been stated that 52 of the 73
microfinance borrowers (71%) report an increase in
sales and profits. According to the study
“Microfinance in Sri Lanka: A Household Level
Analysis of Outreach and Impact on Poverty”
(Thilakarathne & Wickramasinghe, 2005) 44.2% of
the microfinance clients have achieved an increase
in income, whilst 53.6 % have not. This survey has
further studied on income earning by clients at
different income levels by dividing the clients in to
5 quintiles according their income levels.
Banuri (2006) , in his research to identify the impact
of granting microfinance in order to alleviate
poverty states that with a higher amount of
microfinance lending the poverty will decrease due
to the decrease in income inequality and increase in
entrepreneurial capacity. Further developments of
the study under the topics of “The increase in
microfinance towards decreasing of poverty”,
“Decrease of poverty towards reducing income
inequality” and “ Granting of higher amount of MF
loans to experience a higher level of
entrepreneurship ” the impact of microfinance on
income inequality, poverty and entrepreneurial
activity shows a positive relationship. Households
of the developing countries (inclusive of Sri Lanka)
were used as the benchmark unit in achieving the
above results.
III. CONCEPTUALIZATION AND RESEARCH
METHODOLOGY
This study establishes Micro Finance Facilities as
the independent variable, with three sub variables
namely; timely utilization of funds deployed
through micro finance schemes, utilization of
microfinance funds for the intended purpose
(Thilakarathne & Wickramasinghe, 2005) and the
risk management ability of the borrowers (Banuri,
2006). The impact of these three variables is tested
against the dependent variables of household
assets, household savings and household
expenditure which have been identified as
contributory factors in measuring the standard of
living (Banuri,2006)- (See Figure 1).
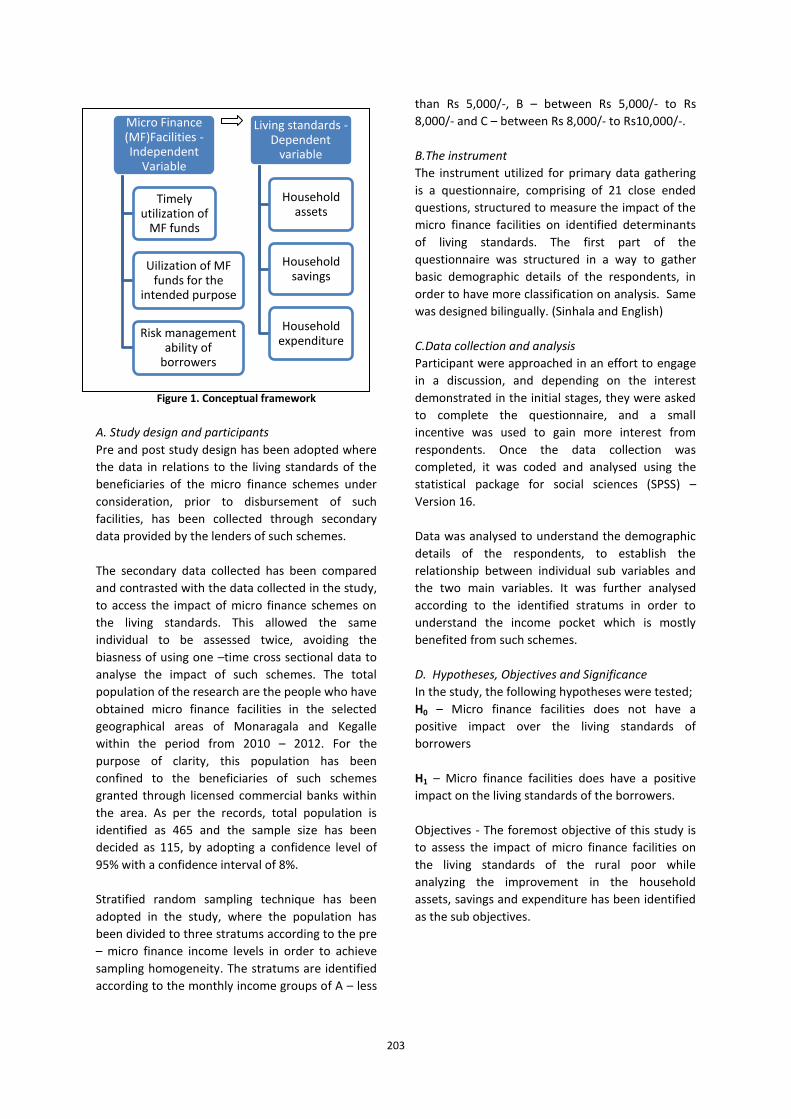
203
Figure 1. Conceptual framework
A. Study design and participants
Pre and post study design has been adopted where
the data in relations to the living standards of the
beneficiaries of the micro finance schemes under
consideration, prior to disbursement of such
facilities, has been collected through secondary
data provided by the lenders of such schemes.
The secondary data collected has been compared
and contrasted with the data collected in the study,
to access the impact of micro finance schemes on
the living standards. This allowed the same
individual to be assessed twice, avoiding the
biasness of using one –time cross sectional data to
analyse the impact of such schemes. The total
population of the research are the people who have
obtained micro finance facilities in the selected
geographical areas of Monaragala and Kegalle
within the period from 2010 – 2012. For the
purpose of clarity, this population has been
confined to the beneficiaries of such schemes
granted through licensed commercial banks within
the area. As per the records, total population is
identified as 465 and the sample size has been
decided as 115, by adopting a confidence level of
95% with a confidence interval of 8%.
Stratified random sampling technique has been
adopted in the study, where the population has
been divided to three stratums according to the pre
– micro finance income levels in order to achieve
sampling homogeneity. The stratums are identified
according to the monthly income groups of A – less
than Rs 5,000/-, B – between Rs 5,000/- to Rs
8,000/- and C – between Rs 8,000/- to Rs10,000/-.
B.The instrument
The instrument utilized for primary data gathering
is a questionnaire, comprising of 21 close ended
questions, structured to measure the impact of the
micro finance facilities on identified determinants
of living standards. The first part of the
questionnaire was structured in a way to gather
basic demographic details of the respondents, in
order to have more classification on analysis. Same
was designed bilingually. (Sinhala and English)
C.Data collection and analysis
Participant were approached in an effort to engage
in a discussion, and depending on the interest
demonstrated in the initial stages, they were asked
to complete the questionnaire, and a small
incentive was used to gain more interest from
respondents. Once the data collection was
completed, it was coded and analysed using the
statistical package for social sciences (SPSS) –
Version 16.
Data was analysed to understand the demographic
details of the respondents, to establish the
relationship between individual sub variables and
the two main variables. It was further analysed
according to the identified stratums in order to
understand the income pocket which is mostly
benefited from such schemes.
D. Hypotheses, Objectives and Significance
In the study, the following hypotheses were tested;
H0 – Micro finance facilities does not have a
positive impact over the living standards of
borrowers
H1 – Micro finance facilities does have a positive
impact on the living standards of the borrowers.
Objectives - The foremost objective of this study is
to assess the impact of micro finance facilities on
the living standards of the rural poor while
analyzing the improvement in the household
assets, savings and expenditure has been identified
as the sub objectives.
Micro Finance (MF)Facilities - Independent
Variable
Timely utilization of
MF funds
Uilization of MF funds for the
intended purpose
Risk management ability of
borrowers
Living standards - Dependent
variable
Household assets
Household savings
Household expenditure

204
IV. DATA PRESENTATION AND ANALYSIS
A. Demographics
The selected sample consisted of 82% of males, and
the majority of the sample (53%) had between 3-4
members in their families. 54% of the sample
population has stated that they have been engaged
in the similar employment for the past 6-10 years,
while 43% has declared that the period of their
current employment is more than 10 years. And the
majority of them are engaged in agricultural and
trading activities.
B. Analysis of relationship between independent
and dependent variables
1) Timely utilization of funds: The correlation for
this variable stands at 0.387, which shows an
average positive relationship according to the
Pearson correlation analysis. The correlation is
significant at 0.01. ( See Table 1)
Table 1. Correlations between Standard of living and
Timely utilization of funds
St_of_living Timely
_Utiliz
St_of_living
Pearson
Correlation 1 .387
**
Sig. (2-tailed) .000
N 115 115
Timely_Utiliz
Pearson
Correlation .387
** 1
Sig. (2-tailed) .000
N 115 115
**. Correlation is significant at the 0.01 level (2-
tailed).
It is evident through the collected data that the
timely utilization of funds deployed through micro
finance facilities is positively impacting the living
standards of the rural poor.
The R2 linear value of the above two variables has
been identified as 0.150 as illustrated in the below
graph.
Figure 2. Linear regression between timely utilization of
funds and the response variable ( living standards)
2) Utilization of funds for the intended purpose: The
correlation for this variable stands at 0.558,
indicating a strong positive relationship between the
said variable and the standard of living. ( See Table
2)
Through the below data analysis, it is evident that
there is a strong “positive relationship” between
the two variables, indicating that it has a positive
impact in improving living standards.
Table 2. Correlations between Standard of living and
utilization of funds for the intended purpose
St_of_living Intended
purpose
St_of_livi
ng
Pearson
Correlation 1 .558
**
Sig. (2-tailed) .000
N 115 115
Intended
purpose
Pearson
Correlation .558
** 1
Sig. (2-tailed) .000
N 115 115
**. Correlation is significant at the 0.01 level (2-
tailed).
Upon reviewing the ideas expressed by the lenders
of these schemes, it denotes that they consider the
fact “utilization of money for the intended
purpose” as a requirement in considering further
credit facilities. This could have been the
contributory factor for the positive relationship but
the study has not collected necessary data in order
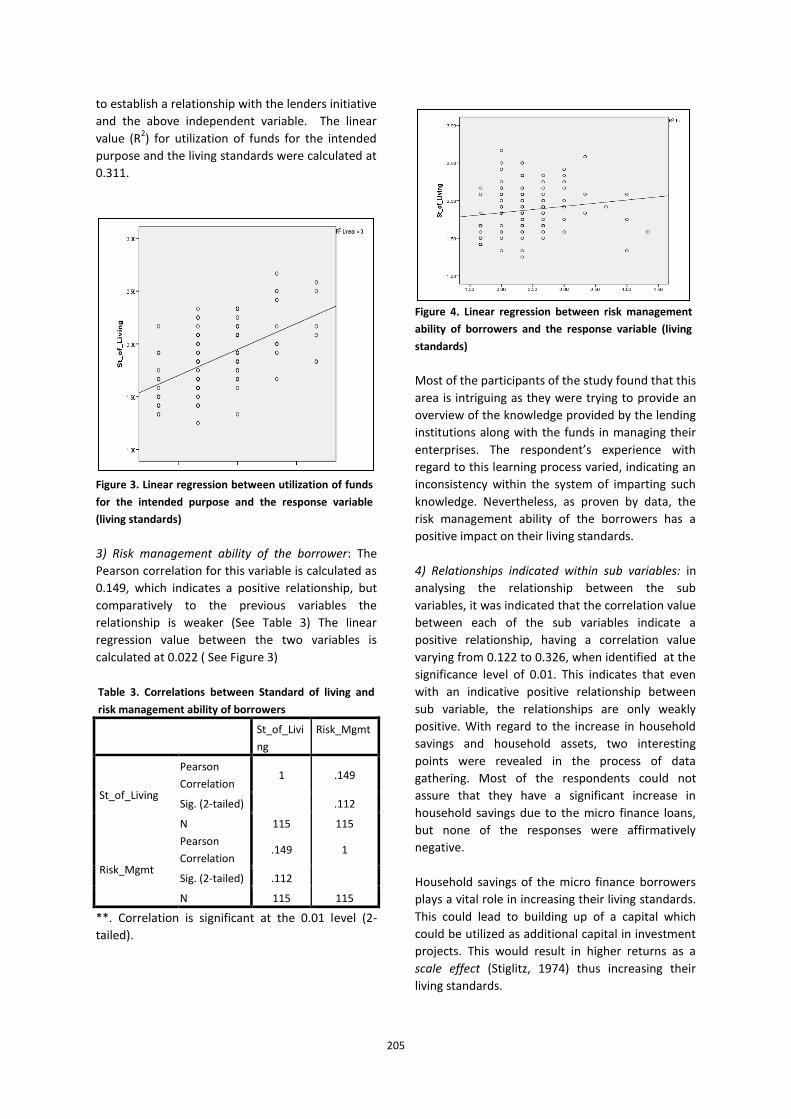
205
to establish a relationship with the lenders initiative
and the above independent variable. The linear
value (R2) for utilization of funds for the intended
purpose and the living standards were calculated at
0.311.
Figure 3. Linear regression between utilization of funds
for the intended purpose and the response variable
(living standards)
3) Risk management ability of the borrower: The
Pearson correlation for this variable is calculated as
0.149, which indicates a positive relationship, but
comparatively to the previous variables the
relationship is weaker (See Table 3) The linear
regression value between the two variables is
calculated at 0.022 ( See Figure 3)
Table 3. Correlations between Standard of living and
risk management ability of borrowers
St_of_Livi
ng
Risk_Mgmt
St_of_Living
Pearson
Correlation 1 .149
Sig. (2-tailed) .112
N 115 115
Risk_Mgmt
Pearson
Correlation .149 1
Sig. (2-tailed) .112
N 115 115
**. Correlation is significant at the 0.01 level (2-
tailed).
Figure 4. Linear regression between risk management
ability of borrowers and the response variable (living
standards)
Most of the participants of the study found that this
area is intriguing as they were trying to provide an
overview of the knowledge provided by the lending
institutions along with the funds in managing their
enterprises. The respondent’s experience with
regard to this learning process varied, indicating an
inconsistency within the system of imparting such
knowledge. Nevertheless, as proven by data, the
risk management ability of the borrowers has a
positive impact on their living standards.
4) Relationships indicated within sub variables: in
analysing the relationship between the sub
variables, it was indicated that the correlation value
between each of the sub variables indicate a
positive relationship, having a correlation value
varying from 0.122 to 0.326, when identified at the
significance level of 0.01. This indicates that even
with an indicative positive relationship between
sub variable, the relationships are only weakly
positive. With regard to the increase in household
savings and household assets, two interesting
points were revealed in the process of data
gathering. Most of the respondents could not
assure that they have a significant increase in
household savings due to the micro finance loans,
but none of the responses were affirmatively
negative.
Household savings of the micro finance borrowers
plays a vital role in increasing their living standards.
This could lead to building up of a capital which
could be utilized as additional capital in investment
projects. This would result in higher returns as a
scale effect (Stiglitz, 1974) thus increasing their
living standards.
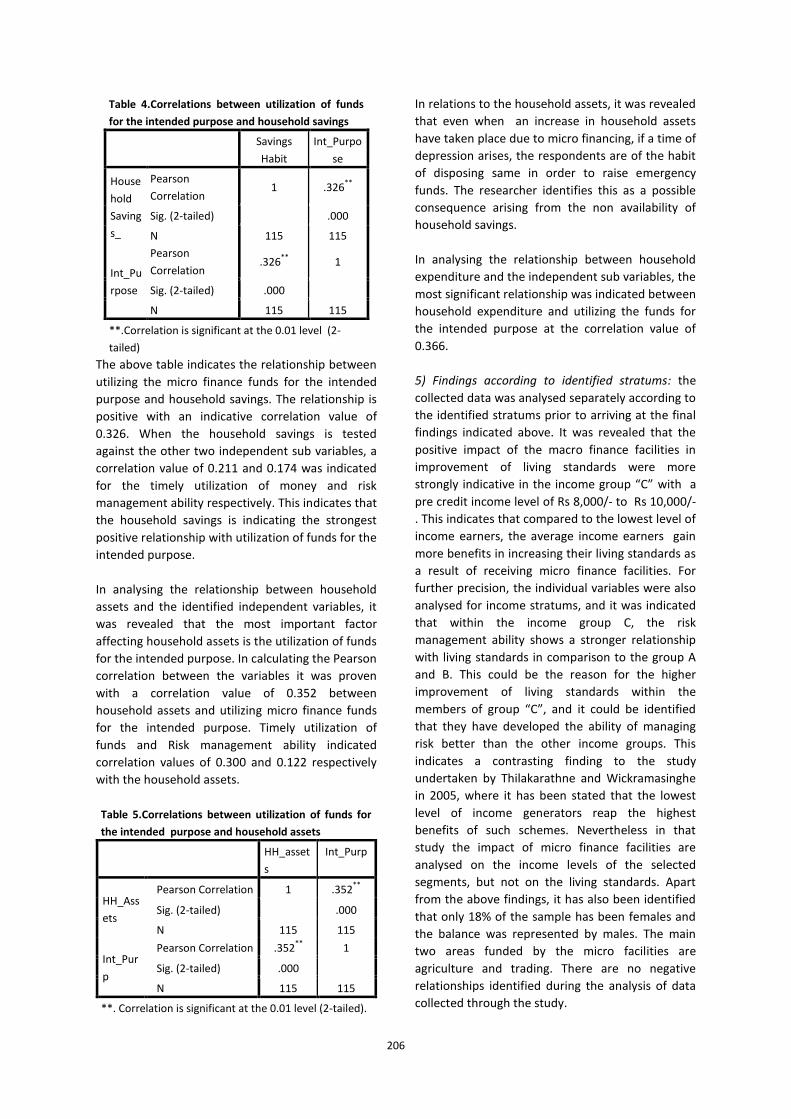
206
Table 4.Correlations between utilization of funds
for the intended purpose and household savings
Savings
Habit
Int_Purpo
se
House
hold
Saving
s_
Pearson
Correlation 1 .326
**
Sig. (2-tailed) .000
N 115 115
Int_Pu
rpose
Pearson
Correlation .326
** 1
Sig. (2-tailed) .000
N 115 115
**.Correlation is significant at the 0.01 level (2-
tailed)
The above table indicates the relationship between
utilizing the micro finance funds for the intended
purpose and household savings. The relationship is
positive with an indicative correlation value of
0.326. When the household savings is tested
against the other two independent sub variables, a
correlation value of 0.211 and 0.174 was indicated
for the timely utilization of money and risk
management ability respectively. This indicates that
the household savings is indicating the strongest
positive relationship with utilization of funds for the
intended purpose.
In analysing the relationship between household
assets and the identified independent variables, it
was revealed that the most important factor
affecting household assets is the utilization of funds
for the intended purpose. In calculating the Pearson
correlation between the variables it was proven
with a correlation value of 0.352 between
household assets and utilizing micro finance funds
for the intended purpose. Timely utilization of
funds and Risk management ability indicated
correlation values of 0.300 and 0.122 respectively
with the household assets.
Table 5.Correlations between utilization of funds for
the intended purpose and household assets
HH_asset
s
Int_Purp
HH_Ass
ets
Pearson Correlation 1 .352**
Sig. (2-tailed) .000
N 115 115
Int_Pur
p
Pearson Correlation .352**
1
Sig. (2-tailed) .000
N 115 115
**. Correlation is significant at the 0.01 level (2-tailed).
In relations to the household assets, it was revealed
that even when an increase in household assets
have taken place due to micro financing, if a time of
depression arises, the respondents are of the habit
of disposing same in order to raise emergency
funds. The researcher identifies this as a possible
consequence arising from the non availability of
household savings.
In analysing the relationship between household
expenditure and the independent sub variables, the
most significant relationship was indicated between
household expenditure and utilizing the funds for
the intended purpose at the correlation value of
0.366.
5) Findings according to identified stratums: the
collected data was analysed separately according to
the identified stratums prior to arriving at the final
findings indicated above. It was revealed that the
positive impact of the macro finance facilities in
improvement of living standards were more
strongly indicative in the income group “C” with a
pre credit income level of Rs 8,000/- to Rs 10,000/-
. This indicates that compared to the lowest level of
income earners, the average income earners gain
more benefits in increasing their living standards as
a result of receiving micro finance facilities. For
further precision, the individual variables were also
analysed for income stratums, and it was indicated
that within the income group C, the risk
management ability shows a stronger relationship
with living standards in comparison to the group A
and B. This could be the reason for the higher
improvement of living standards within the
members of group “C”, and it could be identified
that they have developed the ability of managing
risk better than the other income groups. This
indicates a contrasting finding to the study
undertaken by Thilakarathne and Wickramasinghe
in 2005, where it has been stated that the lowest
level of income generators reap the highest
benefits of such schemes. Nevertheless in that
study the impact of micro finance facilities are
analysed on the income levels of the selected
segments, but not on the living standards. Apart
from the above findings, it has also been identified
that only 18% of the sample has been females and
the balance was represented by males. The main
two areas funded by the micro facilities are
agriculture and trading. There are no negative
relationships identified during the analysis of data
collected through the study.
207
6) Hypotheses testing: According to the data
gathered and analysed, hypotheses testing proves
that the null hypotheses of “Micro finance facilities
does not have a positive impact over the living
standards of borrowers” could be rejected and the
alternative hypotheses of “Microfinance facilities
does have a positive impact on the living standards
of the borrowers” is accepted.
V. CONCLUSION
As per the statistically analysed data gathered
through the research, it is evident that the variables
identified as contributory factors of micro finance
facilities; timely utilization of micro finance funds,
utilization of funds for the intended purpose and
the risk management ability of the borrower, is
proven to have a positive impact on the living
standards of the rural poor. Among the identified
factors, utilization of funds for the intended
purpose deployed through such facilities has
indicated the highest positive correlation value with
the living standards. This is indicated in relation to
all three dependent variables identified namely;
household saving, household assts and household
expenditure. Although a positive relationship has
been established, the increase in the household
savings and the household assets indicated a
weaker relationship with the independent variables
when compared to household expenditure, thus
indicating the increase in the income of the
borrowers has been utilized for spending rather
than savings.
The improvement of the living standard by availing
of micro finance funds is mostly evident in the pre –
credit income group of Rs 8,000/- to Rs 10,000/-
per month. It further indicates that, although micro
finance desires the improvement of the living
standards of the lowest income level; the required
development is lacking at the bottom layer of the
development pyramid; the lowest income pocket.
Further, the demographic analysis indicates that
the micro finance method adopted by the Sri
Lankan commercial banks, do not consider a gender
preference, which is not in accord with the
Grameen model developed by Prof. Mohammed
Yunus giving priority to women borrowers.
In analysing data it was revealed that 64% of the
clients reported a financial relationship between 6 -
10 years with their respective lenders. This
indicates that the majority of the micro finance
borrowers are engaged in the borrowing activities
for a longer period of time, indicating that they
have reaped repeated benefits out of the schemes
and their repayments have been in order, as it is
evident that the lenders have willingly continued
the relationships.
In analysis of the individual variable the weakest
positive relationship was indicated with the
independent variable of risk management ability of
the borrowers. This emphasises the fact that
though the auxiliary service of micro financing,
steps should be taken to educate borrowers on risk
management capabilities and adaptation of risk
mitigating methods.
It could be concluded that there certainly exists a
positive impact of the micro level development
initiatives in the form of micro finance facilities
granted by the commercial banking system
organizations on the upliftment of the living
standard of the rural poor in Sri Lanka.
ACKNOWLEDGMENT
Author of this research paper wishes to express her
deep gratitude to Professor K Siddhisena , Dr Lalith
Senaweera and Dr Kajendra Kanagasabai for their
patient guidance, enthusiastic encouragement and
useful critique in constructing this research study.
A special appreciation is extended to the staff of
International College of Business and Technology –
Sri Lanka for the support provided in numerous
ways.
Author also would like to extend her great
appreciation to the staff of licensed commercial
banks in the districts of Monaragala and Kegalle,
their corresponding staff at main offices and the
Grama Seva Niladhari’s of the said districts for their
valuable contribution made towards the collection
of data.
REFERENCES
Adams A (1984).Undermining Rural Development with
Cheap Credit: Westview Special Studies in
Social, Political and Economic Development series,
Boulder, Colo. and London: Westview Press,
p.1-7.
Armendariz DA, Beatriz, and Morduch J (2005). The
Economics of Microfinance: MIT Press
208
Atapaththu A (2009). State of microfinance in Sri Lanka
[online].Available:http://www.inm.org.bd/publi
cation/state-of-micro-/Sri %20Lanka.pdf.
Accessed 15th Dec 2013
Banerjee, AV (2003). Advances in Economics and
Econometrics: Theory and Applications, Eighth
World Congress, Volume III, Cambridge, U.K.:
Cambridge University Press
Banuri S (2006).Impact of Microfinance on poverty,
Income inequality and Entrepreneurship: Texas
school of Economics, Politics and Policy
Sciences 2nd ed., Economics and Public Policy: Velgas
Brau J C W (2004)”.Microfinance: A comprehensive view
of the Existing Literature”. Journal of
Entrepreneurial Finance and Business Venture,
Vol 9,p 1-26
Conning J and Udry C (2005).Rural Financial Markets in
Developing Countries, Centre Discussion Paper
No 914, Economic Growth Centre, Yale
University
Charitanoko M A and Rahaman M (2009). “Impact of
microfinance on living standards,
empowerment and poverty alleviation of poor
people: Case study on microfinance on
Bangladesh” Master’s Thesis, Umae School of
Business, Bangladesh
Chawdry T T (2007). Impact measurement of micro
finance: Journal of innovation economics and
management Vol 2013/1, p 149-171
Chawdry T T and Nabeel F (2013). Micro insurance in
Pakistan, progress, Problems and Prospects:
The Lahore journal of Economics Vol 18, p
335-374
De Silva D and Alles S (2008). Empowerment of the
poorest of the poor women and young girls in
Sri Lanka , Women Development Foundation,
Sri Lanka
De Soto H (2000), The Mystery of Capital: Why Capitalism
Succeeds in the West and fails almost
everywhere else. 3ed., New York: Basic Books
Department of Census and Statistics, (2013)
<http://www.statistics.gov.lk/page.asp?page=
Population%20and%20Housing> Poverty
statistics. Accessed 27 February 2013
Ghate P (1992), "Informal finance: Some findings from
Asia", in, Oxford; New York; Toronto and Hong
Kong: Oxford University Press for the Asian
Development Bank
.
Gurley, John G and Edward S S (1960). “Money in a
theory of finance”. Washington Brookings
Institution. MF Rep. 82-89
Hoff, Karla, and Stiglitz JE.( 1997), "Moneylenders and
Bankers: Price-Increasing Subsidies in a
Monopolistically Competitive Market", Journal
of Development Economics . Vol 52 (2): p 429-
462.
Hoff and Stiglitz J E (1993), The Economics of Rural
Organization: Theory, practice, and policy.
Oxford; New York; Oxford University Press for
the World Bank.
Ledgerwood J (1998). Sustainable Banking with Poor
People, Microfinance Handbook. 4th ed., Stig E
Washington: The International Bank for
Reconstruction and Development (World bank)
McKinnon R (1973). Money and Capital in Economic
Development. Washington, DC: Brookings
Institution.
Modoran C and Grashof L (2009). Microfinance
institutions in Sri Lanka
[online]Available:http://www.microfinancegate
way.org/p/site/m/template.rc/1.9.40794.Acces
sed:22February 2014
Morduch J (1995), "Income Smoothing and Consumption
Smoothing", Journal of Economic Perspectives 9
(3):p 103-114.
Murray L and Boros UM(2002). [Online]. Available:
<http://www.fao.org/docrep/012/ak208e00.pd
f.>.013. Accessed 15 January 2013
Park A R C (2000) .Microfinance with Chinese
Characteristics
[Online]Available:http://ihome.ust.lk/albertpar
k /papers/china_microfinance.pdf.
Accessed 26 November 2013
Rajan, Raghuram, and Zingales Z (2003), Saving
capitalism from the capitalists : unleashing the
209
power of financial markets to create wealth and
spread opportunity. 1st ed. Book,Whole vols.
New York: Crown Business
Stainwand D and Bartocha D (2008). “How microfinance
improves lives in Sri Lanka” GTZ Spotlight of the
year let, Vol 1, 2-62pp.Sep
Stiglitz J E (1974) .Financial Markets and Development in
Oxford Review of Economic Policy Vol 5 No 4
Thilakarathne G M and Wickramasinghe U (2005).
“Microfinance in Sri Lanka, A household level
analysis of Outreach and impact on Poverty”4th
PEP Research network, Colombo, Sri Lanka Rep.
65-02
Timberg TA and Aiyar CV (1984), "Informal Credit Markets
in India", Economic Development and
Cultural Change 33 (1):43-59.
Townsend RM. (1995), "Financial Systems in Northern
Thai Villages", Quarterly Journal of
Economics110 (4):1011-1046.Stiglitz, JE
Udry C (1991). Rural Credit in Northern Nigeria.
Department of Economics, New Haven: Yale
University
Wijewardena W A (2007). Microfinance a potent
Instrument for poverty alleviation, ser Lecture
Notes in Micro Finance. College of Agricultural
Banking, Reserve Bank of India,Pune , vol 2
Wijewardena W A (2007). Microfinance policy and
regulatory framework: Experience and
perspective of South Asian region- Sri Lanka,
Bangladesh, Nepal and India- Research thesis,
Central Bank of Sri Lanka
BIOGRAPHY OF THE AUTHOR
Author is a lecturer of Financial
Management attached to the
International College of Business and
Technology – Sri Lanka and its affiliated
universities of Cardiff Metropolitan
University – UK, Sunderland University
– UK and Middlesex University – UK. She is a fellow
member of Institute of Bankers of Sri Lanka (IBSL) and
Institute of Certified Professional Managers (CPM). Her
research interest includes Banking and finance and credit
market operations. Author has supervised more than 50
masters’ theses and is presently reading for the Doctor of
Philosophy degree. At present she works as a faculty
member of International College of Business and
Technology – Sri Lanka.
210
A Review on Geometric Brownian Motion for Forecasting the Daily Share Prices in CSE
RM Kapila Tharanga Rathnayaka1, Wei Jianguo 2, SC Nagahawatta 3
1&2
School of Economics, Wuhan University of Technology, Wuhan, P.R. China 1
Department of Physical Sciences & Technology, Faculty of Applied Sciences, Sabaragamuwa University of Sri
Lanka, Belihuloya, Sri Lanka. 3Faculty of Engineering, University of Ruhuna, Sri Lanka
Abstract— Capital Investments in stock market is
the easiest and fastest way for building healthy
financial foundation for our future life. As a result,
stock markets have become more institutionalized in
the past few decades and have been advanced as
the main forms of investments for numerous
organizations as well as individuals for arranging
large investment funds to the general public.
Present study mainly focuses an attempt to develop
a suitable model based on Geometric Brownian
Motion (GBM) to estimate the short-term share
price behaviours in the Colombo Stock Exchange
(CSE), Sri Lanka based on daily price indices data
from January to December, 2013. Furthermore, a
time series technique such as ARIMA was used to
compare the results.
Keywords— GBM, ARIMA and MAPE
I. INTRODUCTION
Data analysing and forecasting in the financial
sector has been regarded as one of the biggest
challenges in the modern economy today.
Especially, economical decisions should be taken for
predicting future results might involve numerous
economic policies as well as economical behaviours.
During the last few decades, equality markets all
over the World have been advanced as main forms
of investment for numerous organizations and
individuals arraying for large investments funds. As
a result, huge companies as well as cooperation’s
have been offering shares to general public and
raise their money needed for restructuring,
expansion for new operations. It is common
phenomenon that, if the company has obtained the
capital needed, the shareholders will take benefit
through dividends paid by companies. So, the
shareholders have alternatives for transferring or
selling their ownerships as their requirements.
When the company is running well, the price of
their stocks would also be going up and make a
profit for the investors.
According to the previous studies, stability of the
stock market and the economic growth and
development of the country are highly associated to
one another. Furthermore, Government rules and
regulations, numerous macro-economic and micro
economic conditions, political and financial stability
of the country are also significant predictors of the
volatility of the market fluctuations.
Balaban et.al (1996) have examined the
informational efficiency of the Turkish Stock Market
by using the daily closing prices of equally weighted
composite index from 1985 to 1995. Various macro-
economic variables such as interest rates, money
supply aggregates and currency rates were used as
predators of the information effeminacy of the
market. Their findings suggested that interest rates
and money supply aggregates have significant
influence over the market fluctuations. Poshakwale
et al. (1998) also conducted a similar type of case
study to evaluate the market efficiency in the
Bombay Stock Exchange within a six-year period
from 1987 to 1994. Non parametric techniques
were deeply applied for evaluating the skewness
properties of the frequency distributions in the
price levels of BSE. The results indicated that
Bombay market (BSE) was not in a weak form
efficient.
The unbalanced behaviors pose a high risk for the
investments. However, higher risk always brings
higher returns. The difference between risk and
return indicates whether the investment is good or

211
bad (Tan, 2012). Gupta et al. (2007) attempted to
find out the short-run and long-runs relationships
between stock market validity with respect to the
macro and macro-economic variables. Randomly
selected six market indices and related macro
factors such as inflation, exchange rates, money
supply and interest rates were used. Study result
shows the strong co-relation between
macroeconomic variables on the stock market
indices as well as stock’s volumes (Campbell, 1997).
Colombo Stock Exchange (CSE) is one of the most
modernized stock exchange in South Asia with a
fully automated trading platform. Moreover, it has
been one of the best preform stock exchange in the
world with market capitalization over US$23 billion
with average daily turnover rising over US$18
billion. Because of the political stability of the
country, many local and foreign investors have been
investing huge capitals after the end the civil war in
the north part of country in 2009 (Samarathunga,
2008). However, comparing with other stock
exchanges, very few studies can be seen in
relevance to the CSE.
Using the market and sector indices, Samarakoon
et.al (1996) has investigated the market behaviors
of the short term (daily, weekly, monthly and
quarterly) predictability of the stock returns with
respect to the inflation rates in Sri Lanka from 1985
to 1995. According to their study, inflation rates can
be categorized in to four categories namely
contemporaneous, lagged, expected and
unexpected inflations. The results suggest that both
lagged inflation and expected inflation are
significantly and positively correlated with stock
returns. However, unexpected inflations are found
to be negatively related to stock returns.
A review of extant literature suggests that more
empirical studies are required to investigate the
behaviour of stock prices. Athapathu et al. (2011)
has done a similar type of study and examined the
relationship between the stock market performance
and economic growth using the data for the period
spanning from 1997 to 2008. Results of Granger
causality and Vector Error correction reveal that
there is a long run equilibrium relationship between
the economic growth and stock market
performance in Sri Lanka (abeysekara, 2001).
There are Two price indices mainly manipulation in
the CSE namely All Share Price Index (ASPI) and the
S&P Sri Lanka 20 Price Index (S&P SL20)
(Rathnayaka, 2013). The S&P SL20 is the principal
stock index, which is computed by using the best
performing 20 companies’ stock prices. This study
basically aims to understand the trends and cyclic
patterns in the CSE in order to predict the future
behaviors.
The rest of the paper is organized as follows. Next
section briefly explains the methodological
approach used in the study and Section three
presents the outcome of statistical analysis and
discusses the result of the study. Final section
concludes the study alone with proposing avenues
for future research
II. METHODOLOGY
The study was carried out on the basis of secondary
data, which were obtained from CSE, annual reports
of Central Bank of Sri Lanka and different types of
background readings and other relevant sources.
Daily trading data (more than 240 daily
observations) from January 2013 to 2013 December
were extracted and tabulated.
Data analysis consists of several phases. In the first
phase, stock market validations were identified
using traditional auto regressive methods such as
ARMA and ARIMA models. In the second stage,
proposed GBM algorithm was used to predict future
predictions. Finally, similarities and discrepancies
between the traditional time series approaches and
our proposed model was discussed based on the
MAD and MAPE testing accuracies techniques.
F. ARIMA Model Approach
The Autoregressive integrated moving average
(ARIMA) model has been successfully applied today
in wide areas for predicting future movements in
the non-stationary data patterns. ARIMA model is a
generalization of an Autoregressive moving average
model. Basically, it consists three parts. They are;
the auto regressive parameter (p), the number of
differencing passes (d) and moving average
parameter (q) (Seneviratne, 2013; Breckling, 1989).
The moving average process in equation 01 and
auto regressive process in equation 02 can be
written as follows ;
qtqtttt ZZZZX ......,2211 (1)
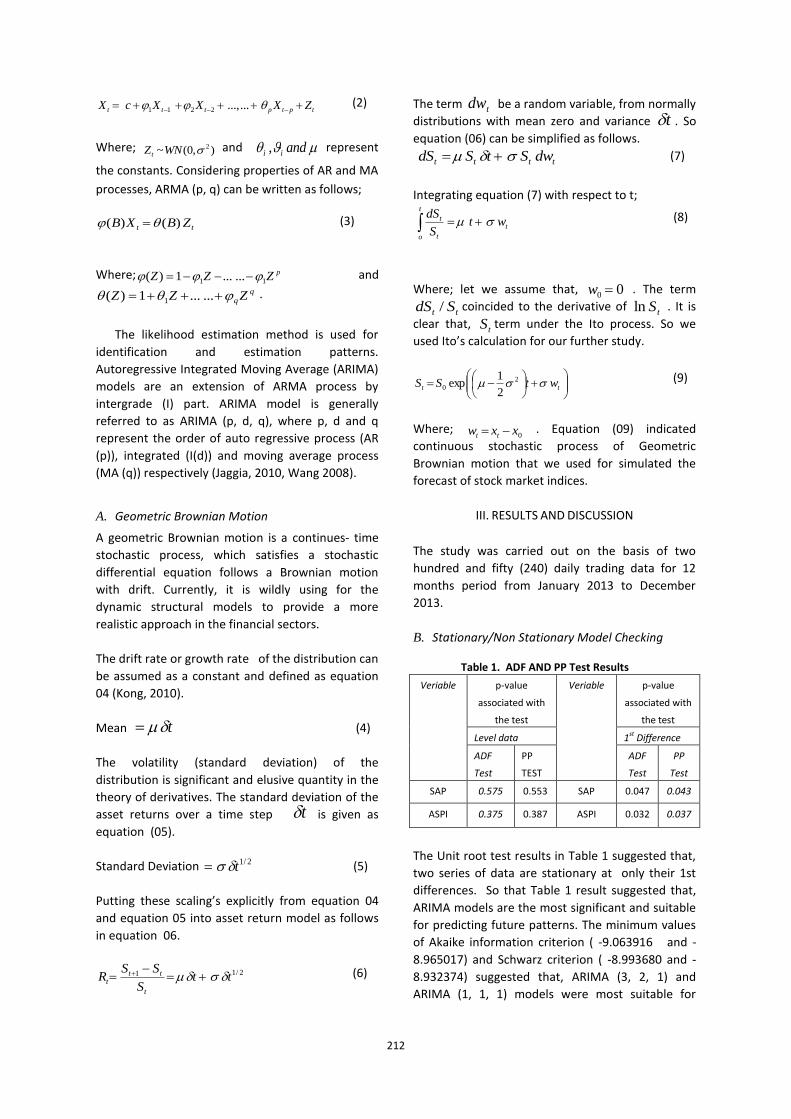
212
tptpttt ZXXXcX ......,2211 (2)
Where; ),0(~ 2WNZt and andii , represent
the constants. Considering properties of AR and MA
processes, ARMA (p, q) can be written as follows;
tt ZBXB )()( (3)
Where; pZZZ 11 ......1)( and
q
q ZZZ ......1)( 1 .
The likelihood estimation method is used for
identification and estimation patterns.
Autoregressive Integrated Moving Average (ARIMA)
models are an extension of ARMA process by
intergrade (I) part. ARIMA model is generally
referred to as ARIMA (p, d, q), where p, d and q
represent the order of auto regressive process (AR
(p)), integrated (I(d)) and moving average process
(MA (q)) respectively (Jaggia, 2010, Wang 2008).
A. Geometric Brownian Motion
A geometric Brownian motion is a continues- time
stochastic process, which satisfies a stochastic
differential equation follows a Brownian motion
with drift. Currently, it is wildly using for the
dynamic structural models to provide a more
realistic approach in the financial sectors.
The drift rate or growth rate of the distribution can
be assumed as a constant and defined as equation
04 (Kong, 2010).
Mean t (4)
The volatility (standard deviation) of the
distribution is significant and elusive quantity in the
theory of derivatives. The standard deviation of the
asset returns over a time step t is given as
equation (05).
Standard Deviation 2/1t (5)
Putting these scaling’s explicitly from equation 04
and equation 05 into asset return model as follows
in equation 06.
2/11 ttS
SSR
t
ttt
(6)
The term tdw be a random variable, from normally
distributions with mean zero and variance t . So
equation (06) can be simplified as follows.
tttt dwStSdS (7)
Integrating equation (7) with respect to t;
t
t
o t
t wtS
dS
(8)
Where; let we assume that, 00 w . The term
tt SdS / coincided to the derivative of tSln . It is
clear that, tS term under the Ito process. So we
used Ito’s calculation for our further study.
tt wtSS 2
02
1exp (9)
Where; 0xxw tt . Equation (09) indicated
continuous stochastic process of Geometric
Brownian motion that we used for simulated the
forecast of stock market indices.
III. RESULTS AND DISCUSSION
The study was carried out on the basis of two
hundred and fifty (240) daily trading data for 12
months period from January 2013 to December
2013.
B. Stationary/Non Stationary Model Checking
Table 1. ADF AND PP Test Results
Veriable p-value
associated with
the test
Veriable p-value
associated with
the test
Level data 1st Difference
ADF
Test
PP
TEST
ADF
Test
PP
Test
SAP 0.575 0.553 SAP 0.047 0.043
ASPI 0.375 0.387 ASPI 0.032 0.037
The Unit root test results in Table 1 suggested that,
two series of data are stationary at only their 1st
differences. So that Table 1 result suggested that,
ARIMA models are the most significant and suitable
for predicting future patterns. The minimum values
of Akaike information criterion ( -9.063916 and -
8.965017) and Schwarz criterion ( -8.993680 and -
8.932374) suggested that, ARIMA (3, 2, 1) and
ARIMA (1, 1, 1) models were most suitable for

213
predicting future patterns of ASPI and SAP
respectively.
Table 2. Forecasting Results: ASPI
Dates
(2013)
ASPI
Actual
Values
ARIMA
(3,1,2)
Residual GBM Resid
ual
2 / 12 5774.1 5778.333 -4.23301 5775.09 -0.99
3/ 12 5773.12 5778.171 -5.05082 5774.1 -0.98
4/ 12 5782.92 5773.992 8.92762 5779.12 3.8
5/ 12 5780.58 5782.96 -2.37962 5782.92 -2.34
6/ 12 5810.24 5784.109 26.1307 5799.58 10.66
9/ 12 5821.3 5815.916 5.38385 5820.24 1.06
10/ 12 5778.52 5823.213 -44.6932 5782.3 -3.78
11/ 12 5787.81 5777.016 10.7942 5788.52 -0.71
12/ 12 5793.19 5785.472 7.71754 5789.81 3.38
13/ 12 5795.66 5792.56 3.09982 5793.19 2.47
17/ 12 5811.88 5804.433 7.44728 5815.66 -3.78
18/ 12 5811.76 5810.181 1.57897 5811.88 -0.12
19/ 12 5867.00 5814.031 52.9686 5861.76 5.24
20/ 12 5857.36 5881.598 -24.2376 5861.1 -3.74
23/ 12 5846.42 5853.232 -6.81201 5847.36 -0.94
24/ 12 5845.93 5851.719 -5.78936 5846.42 -0.49
26/ 12 5848.49 5841.222 7.26788 5845.93 2.56
27/ 12 5876.66 5850.191 26.4687 5878.49 -1.83
30/ 12 5899.2 5886.164 13.0364 5896.66 2.54
31/ 12 5912.78 5901.099 11.6813 5909.2 3.58
MAPE (%) 0.236 0.047
MAD 13.785 2.7495
Table 3. Forecasting Results: SAP
Dates
(2013)
SAP
Actual
Values
ARIMA
(1,1,1)
Residual GBM Residu
al
2 / 12 3174.63 3174.223 -8.34272 3166.63 0.03
3/ 12 3165.88 3164.691 -3.75091 3160.88 -1.01
4/ 12 3160.94 3159.549 5.50052 3163.94 -1.00
5/ 12 3165.05 3164.439 -2.8191 3165.05 0.00
6/ 12 3161.62 3160.824 22.26554 3179.62 2.01
9/ 12 3183.09 3184.72 9.57968 3194.09 -1.01
10/ 12 3194.3 3196.716 -20.0963 3179.3 1.00
11/ 12 3176.62 3176.656 5.61381 3179.62 -3.00
12/ 12 3182.27 3182.902 6.53806 3188.27 0.00
13/ 12 3189.44 3190.681 -5.0113 3187.44 2.00
17/ 12 3185.67 3186.247 7.62313 3192.67 0.00
18/ 12 3193.87 3195.176 -3.4656 3193.87 0.00
19/ 12 3191.71 3192.502 31.95834 3223.71 2.01
20/ 12 3224.46 3228.459 -0.28891 3227.46 -3.00
23/ 12 3228.17 3231.613 -7.37322 3224.17 1.00
24/ 12 3224.24 3226.474 -1.34358 3224.24 .000
26/ 12 3225.13 3226.941 -3.82114 3225.13 0.00
27/ 12 3223.12 3224.311 16.31873 3239.12 0.00
30/ 12 3240.63 3243.362 24.08805 3268.63 -1.01
31/ 12 3267.45 3272.312 -8.44217 3263.45 -1.00
MAPE (%) 0.0517 0.029
MAD 1.6648 0.951
The forecasting result’s with error analysis results in
Table 2 and Table 3 show that, proposed GMB and
ARIMA models are highly accurate (less than 10%)
with lowest MAPE error values.
Figure 1. ASPI and SAP forecasted results
Moreover, results clearly show that proposed GBM
forecasting model (GBM- ASPI: 0.047%, GBM_SAP:
0.029%) is more significant than traditional ARIMA
methods (ARIMA(3,2,1): 0.236%, ARIMA (1,1,1) :
0.0517% ) for forecasting short time predictions.
According to the Figure 1 ASPI and SAP plots also
suggested that, proposed GBM model is more
suitable for forecasting stock market indices than
tradition forecasting approaches.
IV. CONCLUSIONS
Behavioral analysis of the stock market fluctuations
are an important research direction today.
Miscellaneous kind of research works based on
financial markets around the world can be seen in
the literature. The current study is mainly deals
with the design and methodology used in explaining
the predictive ability and profitability of technical
trading strategies in the Colombo Stock Exchange,
Sri Lanka.
In the past few decades research works show
that, time series approaches such as ARMA and
ARIMA were widely used for data forecasting.
However after 2000, computational algorithms have
been successfully applied to real-world problems.
As a result, different type of computational
methods such as Geometric Brownian Motion,
Neural network models have been developed.
In the current study, two types of statistical
techniques were widely used to discuss our result.
214
They are: GBM and ARIMA approach. The minimum
values of Akaike information criterion and Schwarz
criterion suggested that, ARIMA (3, 2, 1) and ARIMA
(1, 1, 1) models are most suitable for predicting
short-term patterns of ASPI and SAP price indices
respectively. Furthermore, the mean absolute
percentage error (MAPE) result reveal that (ARIMA
(3, 2, 1) : 0.00236 and GBM :0.00047/ ARIMA (1, 1,
1) : 0.000517 and GBM : 0.00029), this new
proposed model is more significant and gives the
best solution to predict short term predictions in
high volatility fluctuations.
REFERENCES
Abeysekera, S.P. (2001). Efficient market hypothesis and
the emerging capital market in Sri Lanka: Evidence
from the Colombo Stock Exchange - A note. Journal
of Business Finance and Accounting, 28, 249-261.
HBS, Athapathu A.R., Jayasinhe. P., (2011), Stock market
performance and economic growth: The case of Sri
Lanka,
archive.cmb.ac.lk/research/bitstream/70130/2288/
1/10.pdf, 1-10.
Balaban, E., Kunter K., (1996), Financial Market Efficiency
In A Developing Economy: The Turkish Case. The
Central Bank Of The Republic Of Turkey, Research
Department, Discussion Paper No: 9611.
Breckling J., (1989). The Analysis of Directional Time
Series: Applications to Wind Speed and Direction,
ser. Lecture Notes in Statistics. Berlin, Germany:
Springer, vol. 61.
Campbell, J.Y., Lo A.W. and MacKinlay A.C., (1997). The
Econometrics of Financial Markets. Princeton
University Press, Princeton, NJ. (Chapter 6).
Pallegedara, A (2012). Dynamic relationships between
stock market performance and short term interest
rate empirical evidence form Sri Lanka, MPRA,
40773, 2012.
Poshakwale, S and Wood, D (1998). Conditional Variance
and Non-linearity in the Polish Emerging Market,
Westport: Quorum Books.
Ratnayaka R.M. K.T, Seneviratna D. M. K. N. and Wang Z.,
(2014). An Investigation of Statistical Behaviors of
the Stock Market Fluctuations in the Colombo Stock
Market: ARMA & PCA Approach, Journal of
Scientific Research & Reports, SCIENCEDOMAIN
international, 130-138, 2014.
www.sciencedomain.org.
S. Jaggia., (2010). “Forecasting with ARMA models”, CS-
BIGS 4(1): 59-65.
Samarakoon, L.P. (1996). Predictability of short-horizon
returns in Sri Lankan stock market. Sri Lankan
Journal of Management,1, 207-224.
Samarathunga D., (2008). Stock market efficiency and
integration: A study of eight economies in the Asia-
Pacific Region, Central Bank of Sri Lanka, 83 (1&2),
95-117.
Samarathunga, D. (2008). Stock market efficiency and
integration: A study of eight economies in the Asia-
Pacific Region. Central Bank of Sri Lanka, Staff
studies, 83 (1&2), 95-117.
Seneviratne D.M.K.N and Jianguo W. , (2013). Analyzing
the causal relationship between stock prices and
selected macroeconomic variables:evidence from
Sri Lanka, ZIJBEMR, Vol.3 (9),1-10.
Tan C.S., Yong C.K. and Tay Y.H.,(2012). Modeling
Financial Ratios of Malaysian Plantation Stocks
using Bayesian networks, IEEE conference on
sustainable utilization and development in
Engineering and technology, Kuala Lamoure,
Malaysia, 7-12.
Wang .J. (2008). “Statistical Analysis and data analysis of
stock market by interacting particle model ”,
Journal of Computers, 3, 11-17.
Wang J., and Deng S., (2008). Fluctuations of interface
statistical physics models applied to a stock market
model, Nonlinear Analysis: Real World Applications,
vol. 9, 718-723.
Z. Kong and J.J Li,(2010). “Studies of Discriminant
analysis and Logistic regression model application in
Credit Risk for China’s Listed Companies”,
Management Studies and Engineering, 4, 24-32.
215
BIOGRAPHY OF AUTHORS
1
I am R.M.K.T Rathnayaka, working as a
Lecturer in the Department of Physical
Sciences and Technology, Faculty of
Applied Sciences, Sabaragamuwa
University of Sri Lanka. Currently I am
reading my Doctoral Degree in Financial Engineering at
Wuhan University of Technology, China. I’m highly
interested in research in the fields of Financial
Mathematics, Time series Modeling and Graph Theory.
2Wei Jianguo is a professor and Ph. D
supervisor, majoring in Management
Science and Engineering. He is a vice
dean of School of Economics and
member of Higher Education Committee
of Chinese Quantitative Economics Institution. His
current research areas cover capital market and
investment in securities, financial organization
management and high-tech industrial economics.
Furthermore, he has long been engaged in teaching and
researching on finance, investment and high-tech
industrial economics. He has also participated in and
presided over 3 projects of National Natural Science
Foundation and 5 provincial/ministerial projects and
enterprise projects. Meanwhile, he has published more
than 80 papers in both national and international key
journals together with 4 text books.
216
Environmental Disclosure Practices of Manufacturing Industry –Evidence from Listed Companies in Colombo Stock Exchange (CSE) in
Sri Lanka
TKG Sameera1, PR Weerathunga2
1,2
Department of Accountancy and Finance, Faculty of Management Studies, Rajarata University of Sri Lanka,
Mihintale, Sri Lanka 1
[email protected], 2 [email protected]
Abstract— This study examines the level of
Environmental Disclosures by the companies listed
in Colombo Stock Exchange (CSE) in Sri Lanka and
their association with some specific attributes of the
companies. For this purposes, a sample of 36
companies listed in Colombo Stock Exchange under
Manufacturing Sector were selected. The level of
Environmental Disclosure by each company is
measured using Environmental Disclosure Index
(EDI). EDI consists of 19 items of disclosure under
four categories. Further, content analysis is used to
analyze the level of Environmental Disclosure. The
greatest score of 3 is awarded if the item related to
Environmental Disclosure Index is disclosed
quantitatively and specifically. A score of 2 is
assigned to non-quantitative but specific
information and score of 1 is given to general
qualitative information. The association between
companies-specific attributes and level of
Environmental Disclosure is examined using
Ordinary Least Squire Regression Model. The
calculated EDI reveals that the level of
Environmental Disclosure by Sri Lankan
manufacturing companies is at a very low level.
Further, the regression results show that the level of
Environmental Disclosure is significantly associated
with Environment Concern (EC) and ISO14001
certification (ISO). It is also found that the
Shareholder Power (SP), Government Power (GP),
Return on Assets (ROA), Size and age are not
significantly associated with the level of
Environmental Disclosure.
Keywords—Environmental Disclosure,
Manufacturing Sector, Disclosure Index
I. INTRODUCTION
Traditionally business entities are considered to be
responsible for their financial performance.
Therefore, the conventional financial reporting was
confined to the provision of information on various
facets of financial performance of business entities
to the shareholders. However these views about
the responsibility of the entities are changing today.
It is commonly accepted today that they are
responsible for a broader group of stakeholders for
their social and environmental performances as
well as their financial performances (Senarathne,
2008). During the past two decades, with the
expansion of industrial activities may adversely
effect on natural environment. Thus, societal
concern for environment matters and demand for
environmental information has dramatically
increased (Christopher, 1997). Therefore, in these
days, most of the large companies are aware of the
environment as a business issues (Descano, 1999)
and they have recognized the value of social
responsibility in addition to their primary objective
of maximizing profit (Villiers and Vorster, 1997). On
the other hand, as societal concern of the
environment grows, many companies are becoming
more responsive to stakeholders’ demand for
information of corporate social responsibility.
According to a study of the Institute for
Environmental management and the accounting
firm KPMG, 35% of the world’s 250 largest
corporations now issue environmental reports
(Kolk, 2000).
Environmental reporting which is a relatively recent
development in accounting can be treated as the
media to communicate the environmental impact of
business entities for their stakeholders. Therefore
with regards to the environment, there is a "social
contract" between the accounting entity and
society at large, and stakeholders have a “right” to
know information on the environmental impact of
the organization’s activities (Deegan, 2000). Guthrie
& Parker, (1989); Gibson & Guthrie, (1995) also
217
reviewed the environmental reporting practices
adopted by Australian corporations and they have
concluded that the proportion of corporations
which disclose environmental information is
increasing across the time, along with the amount
of environmental disclosure incorporated within
annual reports. Gray & Kouhy,(1995); Chan & Milne,
(1999) support previous researchers’ findings and
state that, over recent years, the reporting of firms’
impact on the physical environment has
dramatically increased. Further Kolk (2000) says
that, at present, environmental reporting is
becoming more and more common in business.
In addition to that environmental reporting is used
to legitimize the current activity of the business
entities (Gray, 1993), to make adjustments to the
national accounts in order to produce a better
instrument for steering the economy (Willums,
2000), to expand corporate accounts to reflect the
company's handling of its environmental and social
assets (Willums, 2000), to provide information
relating to environmental risk impact of activities to
shareholders, lenders and others in the investment
community (CICA, 1993), to identify cost savings
and new business opportunities (Kolk,2000), to
create positive public relationship and to make a
company more attractive to customers and
investors (Kolk, 2000) to provide information about
sustainability (Gray, 2000), Therefore it is cleared a
number of research studies emphasis the need for a
broader range of social and environmental
information to stakeholders.
However, social and environmental reporting
practices in developing countries lag behind that of
the more developed countries and it has a long way
to go in order to meet the increasing demand for
environmental information and related
international standards (Lodhia, 2000; Belal, 1997;
Siddiqui, 2001). It believes that the lack of adequate
resources and qualified personnel has contributed
to ad-hoc and patchy environmental practices in
these countries (Shiraz, 1998). However,
environmental reporting awards schemes have
been introduced in Asian countries to promote
environmental report preparers and to improve
quality of environmental reporting practices in the
region (SEAJ, 2002).
According to the above facts, it is cleared that
stakeholders’ attitudes towards to the
environmental protection has increased during the
recent years. Thus our intention is to explore the
extent of environmental-related disclosure
practices of companies in manufacturing industry in
Sri Lanka and examine the association between
specific attributes including shareholder power,
creditor power, government power, environmental
concern, ISO 14001 certification award, finance
performances, company size, company age and the
level of environmental disclosures.
II. SRI LANKAN LITERATURE REVIEW HIGHLIGHTS
During the last few years in Sri Lanka, there was
significant increase in stakeholders’ (society’s)
awareness of ecological, social and environmental
matters, which have been reflected in the
proliferation of non-governmental organizations
(NGOs) and other social movements. After
introducing liberalize open-economic policies in Sri
Lanka the late 1970s, many foreign business entities
including multi-national companies, and local
manufacturing companies have emerged. However
such expansion of industrial activities have really
contributed to the economic growth of the country,
while operations of these factories largely cause
damage to the physical environment and
ecological balance of the country in numerous ways
such as discharging waste material, polluted water
and chemicals etc. into the environment.
A survey report of the Central Environmental
Authority (CEA) of Sri Lanka (1992) shows, that
there were 119 highly polluted factories in Colombo
and Gampaha districts. Further in 1992 the Central
Environmental Authority (CEA), Sri Lanka revels that
business organizations have ‘responsibility’ to
comply with the environment which it operates and
society has ‘right’ to demand information of social
resources which business organizations consume in
the operation process, neither they take measures
to prevent such environment pollution nor
adequately report the damages they cause to the
environment within their annual reports or as
special reports. Thus they do not concern about
environmental damage as it does not appear as a
cost to the organization and, there is neither
statutory nor professional requirements for
environmental reporting in Sri Lanka (Rajapakse,
2003). Consequently, environmental reporting in Sri
Lanka is predominantly voluntary, which is also the
case in many other developed & developing
countries .However, stakeholders’ awareness of
environmental impact on industrialization of Sri
218
Lanka has increased during last few years
(Rajapakse, 2003).
However, there is no comprehensive study has been
conducted to date to materialize the extent of
environmental reporting practices in broader
contexts in Sri Lanka. Therefore the main objective
of is to examine the level of environmental
reporting disclosures of manufacturing sector in Sri
Lanka during the selected period.
III. HYPOTHESES DEVELOPMENT
Hypotheses were formulated based on the nature
of the relationship to be prevailed between level of
environmental disclosures and selected attributes.
There could be positive, negative or neutral
relationship between the variables, which would be
testing in this study. The weight of the arguments
about potential positive relationship between level
of environmental disclosures and selected
attributes is high. Hence in the current study it
hypothesizes that the impact of level of
environmental disclosures and selected attributes
are to be positive. Hypotheses develop under
selected attributes are as follows.
Shareholder Power (SP) Christopher & Hassan, (1996) stated that
shareholder power (SP) can be measured by
examining the degree of ownership concentration.
Most of the foregoing studies suggested that there
is a positive relationship between the number of
shareholders and disclosure practices in the Annual
Reports (e.g. Mckinnon & Dalimunthe, 1993;
Malone, Fries and Jones, 1993). These studies imply
that wider ownership diffusion is associated with
better disclosures. Thus, following hypothesis is
developed suggesting the positive relationship.
H1: The level of corporate environmental
disclosures is positively associated with No of
Shareholders.
Creditor Power (CP)
According to the Roberts, (1992) the creditor power
(CP) depends upon the degree to which the firm
relies on debt financing. Thus average debt equity
ratio is used to measure the creditor power of the
firm. Prior studies suggest that the more the firm
relies on debt financing, the more likely it will
provide more disclosures (Clarkson, Li & Richardson,
2004). Hence, H2 states that:
H2: The level of corporate environmental
disclosures is positively associated with Creditor
Power (CP)
Government Power (GP)
Elijido-Ten, (2008); suggested that companies
belonging to environmentally sensitive industries
(ESI) are likely to face more stringent government
regulation as these firms are more likely to damage
the environment through the use of hazardous
substances. Therefore, it is evidence that ESI-firms
tend provide more environmental disclosures
possibly to get the government approvals for their
operations.(Chan & Kent, 2003).The following
hypothesis is therefore developed suggesting
positive relationship
H3: the level of corporate environmental
disclosures of the firms in environmentally sensitive
industries is higher than the firms in non-sensitive
industries.
Environmental Concern (EC)
Firms with environmental committees and/or
environmental concern in their vision/mission
statement are considered be as environmental
Concern business entities.
H4- the level of corporate environmental
disclosures of the firms with environment concern,
is higher than the firms without such concern
ISO14001 Certification (ISO)
Business entities are produce CSR information as a
partial requirement in order to obtain ISO 14000 for
environmental management, which also helps to
improve public image. Therefore following
hypothesis is developed:
H5: The level of corporate environmental
disclosures of the firms that are having ISO 14001
certificate, is higher than the firms that do not have
such certification.
Financial Performances
According to Elijido-Ten, (2008); economic
performance of the firm is an important factor to
consider in determining whether environmental
issues will be on the priority list. Further, he argues
that the periods of low economic performance, the
firm’s economic objectives will be given more
attention than environmental concerns. Therefore,
it is predicted that the economic performance of
the firm is directly related to environmental
disclosures. This study uses Return on assets (ROA)
219
to measure firm financial performance. ROA is
calculated as net profit divided by total assets. The
sixth hypothesis is formed as follows:
H6: The level of corporate environmental
disclosures is positively associated with Finance
performances of the firm.
Firm Age
Owusu-Ansah, (1998); pointed out that the extent
of a company’s disclosure may be influenced by its
age, stage of development and growth. Further
researcher state that three factors that may
contribute to this phenomenon. Firstly, younger
companies may suffer competition, secondly, the
cost and the ease of gathering, processing, and
disseminating the required information may be a
contributory factor, and finally, younger companies
may lack a track record on which to rely for public
disclosure. However, it is not possible to reach a
conclusion that long-established firms can disclose
more information than newly-established firms.
Therefore following hypothesis is developed:
H7: The level of corporate environmental disclosure
is positively associated with firm age
Firm Size
Firm size is used to represent the firm capacity to be
involved in social and environmental programs and
to report such activities. Most researchers in this
area find a close relationship between company size
and the extent of disclosure, both in developing and
developed countries. (example, Singhvi and Desai,
1971; Hossain, 2001). In this body of a research, a
positive relationship has been found between
company size and the extent of disclosure. A
number of reasons have been advanced in the
literature in an attempt to justify this relationship
on prior grounds. For example, Singhvi and Desai
(1971) offered three justifications for the variations
in the extent of financial disclosure in firms of
different sizes. Firstly, the cost of accumulating
certain information is greater for small firms than
for large firms. Secondly, larger firms have a greater
need for disclosure because their securities are
typically distributed via a more diverse network of
exchanges, and thirdly, management of a smaller
corporation is likely to believe more strongly than
the management of a larger corporation, that the
full disclosure of information could endanger its
competitive position. Thus, the following hypothesis
is established.
H8: The level of corporate environmental disclosure
is positively associated with firm size
IV. RESEARCH DESIGN
Sample and Data
The sample of this study is included 36 companies
listed on Colombo Stock Exchange as at 01st
January 2012 under manufacturing category. To
determine the level of Environmental disclosure by
each company, it is examined the annual reports of
the financial year 2010/2011
Model development
The following Ordinary Least Square (OLS)
regression model is conducted to identify the
association between firms‟ specific attributes, viz.
Shareholder Power (SP), Creditor Power (CP),
Government Power (GP), Environmental Concern
(EC), ISO14001certification (ISO), Return on Assets
(ROA), Size (Lsiz), Age (Age) and level of
environmental disclosure.
Y = β0 + β1 SP + β2CP +β3GP + β4EC + β5ISO +
β6ROA + β7LSIZ +βAGE +e
Where; Y = total disclosure score received for each
firm
β0 =the intercept;
e = the error term
IV. RESULTS AND ANALYSIS
Level of disclosure
Descriptive statistics are shown in Table 1.
Shareholder power (SP) has a minimum of 12.29%,
maximum of 97.63% and a mean(median) of 72.04%
(74.79%) representing that majority of the firms in
the sample have high ownership concentration. The
creditor power (CP) has wide range from a low of -
5436.35% to high of 192.98%. The mean of creditor
power is shown negative figure as -129.30% which
is due to an outlier, while median of 12.67% of
creditor power is indicating low level gearing of
firms in the manufacturing sector. It is clear that
majority of the manufacturing firms in Sri Lanka are
less geared. More than 80% of firms in the sample
are in environmentally sensitive industry (GP = 1)
but only three firms in the sample show
environmental concern (EC) in their Vision, Mission
statement or have an environment committee.
About 12% of firms have received ISO 14001
certification, however the companies with ISO

220
14001 certification have not shown considerable
environmental concern. The minimum return on
assets (ROA) is 45.35% while maximum is 44.48%.
The age of the sample firms are range from a
minimum of 10 years to maximum of 71 years with
the mean of 31.03 years
Table 01: Descriptive Statistics
Note- Total Score (TS), Shareholder Power (SP),
Creditor Power (CP), Government Power (GP),
Environmental Concern (EC), ISO14001certification
(ISO), Return on Assets (ROA), Assets Log Size (ALS),
Age (Age)
Regression Result
We performed an Ordinary Least Square (OLS)
regression model for all variables, the results of
which are presented in Table 2. The multiple
regression model is significant at 5% level. The
adjusted coefficient of determination (Adjusted R
squared) indicates that 45% of the variation in the
dependent variable is explained by variations in the
independent variables. The coefficient representing
environmental concern (EC) and ISO 14001
certification (ISO) are statistically significant
between 1% to 5% level, while the coefficients for
shareholder power, creditor power, government
power, return on assets, size and age are not
statistically significant at 10%.
Table 02: Model Summery
Multiple R R Square Adjusted R Square
0.763324998 0.58266505 0.459010253
Discussion of Regression Results
As depict in table 03, the shareholder power and
creditor power variables are not significant. A
similar result was found in Evangeline Elijido-Ten
(2003). This implies that the level of disclosure is
not affected by the shareholder power and creditor
power of the manufacturing firms. The firms with
environmental concern in their vision/mission
statement and/or environmental committee tend to
disclosure more information about environmental
activities in their annual reports. Further firms with
ISO certification disclosure more environmental
information than firms with no such certification.
These results are in line with the result from
previous research as mentioned. Size by assets is
not statistically related to the level of information
disclosed by the sample of manufacturing firms in
their annual reports. Age and Return on Assets are
not significant. This also implies that the level of
environmental disclosure is not affected by the age
of the firms or the number of years it has in
business and profitability of firms.
Table 03: Results Regression Model
Variable Coefficients SE T Stat P-value
Intercept 7.1000 7.4316 0.9554 0.34787
SP 0.0007 0.0588 0.0127 0.98993
CP 0.0008 0.0011 0.7384 0.46667
GP (1.2013) 2.1285 (0.5644) 0.57715
EC 7.3539 3.5417 2.0764 0.04750**
ISO 14.7764 2.9620 4.9886 0.00003**
ROA (0.0570) 0.0714 (0.7973) 0.43225
ALS (0.0867) 0.7809 (0.1111) 0.91239
Age (0.0572) 0.0763 (0.7502) 0.45962
** Significant at 5% level
VI. CONCLUSION AND LIMITATION
This study has examined the level of environmental
disclosures of Sri Lankan manufacturing firm.
Further it is investigated whether level of
environmental disclosures are affected by the firms’
specific attributes such as shareholder power,
creditor power, government power, environment
concern, ISO 14001 certification, return on assets,
size and age. The result indicated that the level of
environmental disclosures by Sri Lankan
manufacturing firm is at a very low level.
From the analysis described in the previous section,
it is apparent that environmentally sensitivity does
not affect the level of environmental disclosure by
Sri Lankan manufacturing firms. This is unlike with
previous studies. Many previous studies have found
that there is association between the level of
environmental disclosure and environmentally
sensitivity. This study also provides evidence of the
lack of environmental disclosures in the absence of
mandatory requirements to do so. This should give
Variable Mean Median SD Min Max
TS 5.97 3.50 7.60 - 31.00
SP 72.04 74.79 16.92 12.29 97.63
CP (129.30) 12.67 910.74 (5,436.35) 192.98
GP 0.69 1.00 0.47 - 1.00
EC 0.08 - 0.28 - 1.00
ISO 0.14 - 0.35 - 1.00
ROA 6.85 6.71 14.85 (45.35) 44.48
ALS 8.54 8.91 1.26 5.74 9.89
Age 31.03 28.50 13.79 10.00 71.00
221
an implication to the accounting regulatory body in
considering mandatory environmental disclosures.
Some limitations of this study are also inevitable. A
one year period of observation might not be
sufficient to get a comprehensive picture of the
level of environmental disclosures by the
manufacturing firm in Sri Lanka. Other variables
which may effect to the level of environmental
disclosure, such as media coverage, firm reputation
and auditor, have not been included in the model.
Media coverage variable is particularly widely used
in the previous literature. By adding more
independent variables, we would probably be able
to increase the power of the regression model and
hence a better explanation to the level of
environmental disclosures. This study limits its data
source to corporate annual reports in calculating
environmental disclosure level, whereas
environmental information may be disclosed by
companies in other media, such as press releases,
websites, and separate environmental reports. We
expect that these information sources may not be
significant in Sri Lankan context, and therefore
excluding them from analysis would not result in
some data selection bias.
REFERENCES
Belal, A.R. (1997) Green Reporting Practices in Bangladesh
, The Bangladesh Accountant, January- March.
Chan, C., and Kent, P. (2003). Application of stakeholder
theory to the quantity and quality of Australian
voluntarycorporate environmental disclosures.
Paper presented to Accounting and Finance
Association of Australia andNew Zealand (AFAANZ),
July, Brisbane.
Chan, C.C.C. & Milne, M.J. (1999) Investors reactions to
corporate environmental saints and sinners: an
experimental analysis, Accounting and Business
Researc,265-279.
Christopher, F. (1997), Environmental Reporting and
changing cooperate environmental performance,
Accounting Forum, 74 –94.
Christopher, T. & Hassan, S. (1996) “Determinants of
voluntary cash flow reporting: Australian evidence”,
Accounting Research Journal, 113-124.
CICA ,(1993). Report on Environmental Performance, The
Canadian Institute of Chartered Accountants, July.
Clarkson, P., Li, Y., and Richardson, G.(2004).The market
valuation of environmental capital expenditures by
pulp and paper companies. The Accounting Review,
79:2, 329-353.
Deegan, C. (2000).Financial Accounting Theory, McGraw-
Hill, NSW, Australia.
Descano, L. (1999), Sustainability: The Investment
Perspective, Australian CPA, 24-25.
De Villiers, C. J. & Vorster, Q., (1997). Green Reporting In
South Africa. Department of Accounting, University
of Pretoria.
Elijido-Ten, E. (2008). Voluntary Environmental
Disclosures of Malaysian Listed Companies: An
Application of Stakeholder Theory .15-16.
Gibson, R. & J. Guthrie, J., (1995). “Recent Environmental
Disclosures in Annual Reports of Australian public
and private sector Organizations. Accounting
Forum, 111-141.
Gray, R., R. Kouhy, et al. (1995). “'Corporate Social and
Environmental Reporting. A review the literature
and longitudinal study of UK disclosure'.”
Accounting, Auditing and Accountability Journal,
47-77.
Guthrie, J. & Parker, L. D., (1989). Corporate Social
Reporting: A Rebuttal Of Legitimacy Theory.
Accounting and Business Research, 343- 52.
Gray, R., Bebbihgton, J. (1993), Accounting for
Environment, Paul Chapman, London Willums,J.O.,
(2000). The Sustainable Business Challenge.
Sheffield, Green Leaf Publishing.
Gray, R. (2000). ESRC Global Environmental Accounting
Change Programme: Social and Environmental
Accounting Research.
Gray, R. H. (1993). Current Practice in Environmental
Reporting. Social and EnvironmentaAccounting, 6-
9.
Gray, R. H. (1993). Accounting for the Environment.
London, Paul Chapman Publishing.
222
Hossain, M. (2001).The Disclosure of Information in the
Annual Reports of Financial Companies in
Developing Countries: the Case of Bangladesh.
Unpublished MPhil thesis, The University of
Manchester, UK.
Kolk, A. (2000), Green Reporting, Harvard business
Review, 15-16.
Lodhia,S.K. (2000), Social and Environmental Reporting in
Fiji: A Review of Recent Corporate Annual Reports,
Social and Environmental Accounting Journal, 1518.
Malone, D., Fries, C., and Jones, T. (1993). An empirical
investigation of the extent of corporate financial
disclosure in the oil and gas industry. Journal of
Accounting, Auditing and Finance, 249-273.
McKinnon, J.L., and Dalimunthe, L. (1993). Voluntary
disclosure of segment information by Australian
diversified companies. Accounting and Finance, 33-
50.
Owusu-Ansah, S. (1998). The Impact of Corporate
Attributes on the Extent of Mandatory Disclosure
and Reporting by Listed Companies in Zimbabwe.
International Journal of Accounting, 605-631
SEAJ, (2002c), Environmental Reporting Awards Schemes
in Asia, The Journal of the Centre for Social and
Environmental Accounting Research, 36
Senatatne, S. (2008). Corporate Social Responsibility
Reporting system in Sri Lanka. Conference on
Fundamental & Operational Research for
Development. Colombo: National Center for
Advanced Studies in Humanities and Social
Sciences.
Shiraz, A., (1998). Social Reporting Nice idea, But..........
Australian CPA, 58-59.
Siddiqui, J. (2001), Environmental Non-Accountability in
Bangladesh?: The Striking case of the Magurchara
Gas Field Disaster, Social and Environmental
Accounting Journal, 12-13.
Singhvi, S. S., and Desai, H. B. (1971), an Empirical
Analysis of Quality of Corporate Financial
Disclosure. The Accounting Review, January, 129-
138.
Rajapakse, B. (2001), Environmental Reporting
Expectation Gap: Evidence from Private Sector
Organization in Sri Lanka, IWE Journal, 3, 99-117.
Rajapakse, B. (2003), Environmental Reporting:
significance and issues, evidence from Sri Lanka,
13th international congress on Social and
Environmental Research, Dundee University, UK
Rajapakse, B.(2005) " Trend of Social and Environmental
Reporting Practices in Developing Countries:
Evidence from Sri Lanka" University of Colombo.
Roberts, R.W. (1992). Determinants of corporate social
responsibility disclosure: An application of
stakeholder theory. Accounting, Organizations and
Society, 595-612.
The Company Act No. 17 of 1982 (Sri Lanka)
The National Environmental Act No. 47 of 1980 and
its amendments (Sri Lanka) Clarkson, P., Li, Y., and
Richardson, G. (2004), the market valuation of
environmental capital expenditures by pulp and
paper companies, The Accounting Review, 79:2,
329-353.
Chan, C., and Kent P. (2003), Application of stakeholder
theory to the quantity and quality of Australian
voluntary corporate environmental disclosures,
Paper presented to Accounting and Finance
Association of Australia and New Zealand
(AFAANZ), July, Brisbane.
Deegan, C., and Gordon, B. (1996).A study of the
environmental disclosure practices of Australian
corporations. Accounting and Business Research,
26:3, 187-199.
Deegan, C., and Rankin, M. (1996).Do Australian
companies report environmental news objectively,
an analysis of environmental disclosures by firms
prosecuted successfully by the Environmental
Protection Authority. Accounting, Auditing and
Accountability Journal, 9:2, 50-67
Al-Tuwaijri, S.A., Christensen, T.E., and Hughes, K.E.
(2004).The relations among environmental
disclosure, environmental performance, and
economic performance: a simultaneous equations
approach. Accounting, Organizations and Society,
29:5-6, 447-471.
223
BIOGRAPHY OF AUTHORS
1Author is a lecturer of Accounting
and Finance of Rajarata University of
Sri Lanka. His research interests
include Finance, Accounting and
Management. He has produced 2
international publications to his credit.
2Author is a lecturer of Accounting and
Finance of Rajarata University of Sri
Lanka. His research interests include
Finance, Accounting and Management.
He has produced 2 international and
local Journal publications to his credit
224
Box-Jenkins Approach for Out-of-Sample Forecasting of Stock Price Index: Evidence from Colombo Stock Exchange
DMKN Seneviratna 1, D Chen2, SC Nagahawaththa3
1,2
School of Economics, Wuhan University of Technology, Wuhan, P.R. China 3Faculty of Engineering, University of Ruhuna, Sri Lanka
Abstract— Univariate time series analysis under the
time domain has become a widely used data
analysis technique from the past. The methods
belong to time series could be used to identify the
temporal structure of data and forecasting. Among
them Box and Jenkins approach has been used in
the research studies and could be rendered as the
commonly used method. Accordingly, they have
introduced a model to predict the future behaviour
through an auto-projective method that uses the
past behaviour of the series.
The purpose of this study is to obtain accurate out-
of-sample forecasts for stock price indices using an
ARIMA model. The daily All Share Price Indices
(ASPI) were used over the period from 2nd January
2012 to 31st December 2013 in Colombo Stock
Exchange (CSE), Sri Lanka. This study used Box-
Jenkins method with four main concepts of model
identification, estimation, diagnostic checking and
forecasting.
Basically, the concept of information criteria was
used for the model identification process. The
corresponding model Parameters were estimated at
the training data sample using the least square
method. Moreover, residual plots and residual tests
were used to check the model diagnosis. Finally,
different error approaches such as mean absolute
error (MAE), root mean square error (RMSE), and
mean absolute percent error (MAPE) were used to
evaluate the forecast performances of the selected
models through different time horizons.
Two models were chosen according to the results of
Akaike’s information criterion (AIC), Schwarz’s
Bayesian information criterion (SBIC), and Hannan-
Quinn criterion (HQIC.) The out-of-sample
forecasting indicates that the selected two models
are appropriate for one step ahead forecasting than
the long time horizon. The aggregate results
depicted that; ARMA (1, 1, 0) is the optimal model
and can produce more accurate result than ARIMA
(4, 1, 5) for ASPI data within the considered time
period.
Keywords— Box-Jenkins method, ARIMA,
Forecasting
I. INTRODUCTION
In contrast to the structural models, time series
models are different in the model building process
by capturing important behaviours of observed
data. Beyond that, univariate time series modelling
is quite important when the explanatory variables
are not available. Among the many methods of
forecasting a time series, Box and Jenkins approach
has been widely used in research studies and could
be rendered as the commonly used method.
According to the approach, they introduced a model
to predict the future behaviour through an auto-
projective method which uses the past behaviour of
the series. The corresponding basic model is simply
known as ARMA; Autoregressive Moving Average
(Box & Jenkins, 1970). It’s an important class of
model is known as ARIMA; Autoregressive
Integrated Moving Average after converting level
data into its first difference series.
As a linear statistical model, ARIMA is important to
capture the linear features of the past and current
observations. According to that, the future value of
the series is assumed to be a linear combination of
three components: auto-regression (AR),
integration (I), and moving average (MA). The
corresponding model can be denoted as ARIMA (p,
d, q), where p is the number of auto-regression
terms, d is the number of non-seasonal differences,
and q is the number of lagged forecast errors (Box &
Jenkins, 1970; Wang et al., 2012).
Many studies have used ARIMA models to analyse
time series data and shown that they obtained the
best results comparative to some of the other
225
traditional models. For instance, Ho et al. (1998)
investigated repairable system reliability forecasting
based on the ARIMA models under the Box-Jenkins
methodology. They followed the ARIMA model and
the comparison has been made with the traditional
Duane model. The corresponding results pointed
that ARIMA model is a viable alternative based on
its predictive performance. Sharma et al. (2009)
adopted Box-Jenkins method for forecasting the
ambient air quality data of Delhi City. In their study,
several models were developed based on ARIMA
and the evaluation statistics showed that the
suggested Box-Jenkins approach is satisfactory in
the forecasting process. Moreover, they mentioned
that the developed models could be used to provide
short-term, real-time forecasts of extreme air
pollution concentrations.
Jayasinghe and A. Kankanamge (2011) attempted to
forecast ASPI using univariate time series
techniques with a time trend component. ARMA (1,
1) was selected as the optimal model with the
quadratic time trend. Based on one week ahead
forecasting results, they showed that a simple
ARMA model with a time trend component can be
used to produce a reasonably good forecast among
many other time series models. In addition
Rathnayaka et al. (2014) did a sector vise data
analysis on basis of ARMA models. Among the
several, ARMA (1, 1) and ARMA (1, 0) were selected
as best fitted models for different set of sectors.
Some researchers have concentrated to identify the
patterns in the stock prices and forecasting. For
example, Herrmann (1980) used the Box-Jenkins
approach to determine whether or not the buffer
stock policy under the 1980 International Cocoa
Agreement stabilized world market prices. Under
his methodology, ARIMA models were estimated
and used in the forecasting process to fulfil their
expectations. Besides, some researchers have
attempted to make comparisons of the forecasting
ability of ARIMA with the other models. For
instance, one study was done by Koch et al. (1994)
for forecasting stock returns in Japanese, UK and US
markets during the Crash of October 1987. In this
case, an ARIMA model was used along with a
simultaneous equation model. The empirical results
pointed out that neither type of models accurately
forecasts the sharp changes in the market indices
around the crash. Another comparison was made by
Stevenson (2007) by examining ARIMA models in
the context of rent forecasting data for the British
office markets. Based on the results, the study
depicted that the ARIMA models are useful in
anticipating broad market trends, but there are
substantial differences in the forecast obtained
using alternative specifications.
On basis of the previous studies, it can be concluded
that an ARIMA model is useful to find the important
features of the observed data as well as suitable to
make the best forecasts for some sort of time series
data. Beyond that, more steps and methods might
be required to analyse particular situations. In our
study, we attempt to find a suitable ARIMA model
for out-of-sample forecasting. The recently
published daily All Share Price Indices (ASPI) data
are considered over the period from 02nd January
2012 to 31st December 2013. The present study
uses Box-Jenkins (1970) method in accordance with
four concepts that the model identification,
estimation, diagnostic checking and forecasting.
Initially, the selected sample is categorized as
training and testing according to the ratio 0.85:0.15
and the training data sample is used for the process
of model building. Then, the out-of sample
forecasting is carried out to all the selected models.
Finally, the optimal model is selected based on the
performance of mean absolute error (MAE), root
mean square error (RMSE), and mean absolute
percent error (MAPE).
The paper is organized as follows. Next section
briefly describes the basic concepts of the Box-
Jenkins methodology for ARIMA forecasting. Section
three employs ASPI data to check the
appropriateness of ARIMA forecasting through the
empirical results. The conclusion and future
research directions are rendered in the final section.
II. BOX-JENKINS METHODOLOGY
The methodology consists of four components:
model identification, parameter estimation,
diagnostic checking and forecasting.
A. Model Identification
In the model identification process, an important as
well as the initial step is to determine the stationary
of the series. If not, the results of the study might
be spurious based on the influence of its chaotic
behaviours. It can be two types which are trend
stationary and difference stationary based on the
process of converting a non-stationary series into a

226
stationary series. However, the types of stationarity
can be tested by using the behaviour of a
correlogram (acf plot), which is based on
autocorrelation. As well as unit root tests based on
the unit root such as Augmented Dickey-Fuller
(ADF), Phillips-Perron (PP) and Kwiatkowski-Phillips-
Schmidt-Shin (KPSS).
1) Autoregressive Integrated Moving Average Model
(ARIMA): If a time series does not show any other
seasonal or cyclical behaviour, the stationary series
can be used to determine the order of the
autoregressive terms (AR) and moving average
terms (MA). For this, we can use both
autocorrelation function (acf) and partial
autocorrelation function (pacf) by judging the
corresponding acf and pacf plots. In addition,
alternative techniques such as information criteria
can be used along with the graphical plots. There
are mainly three information criteria such as
Akaike’s information criterion (AIC), Schwarz’s
Bayesian information criterion (SBIC), and Hannan-
Quinn criterion (HQIC).
Based on the Preliminary analysis, if we select a
model as ARIMA (p, d, q), then the stationary,
invertible, mixed autoregressive moving average
process can be written by the equations 1 as
follows:
p
itajtajitvitv
1 (1)
Where tv is the dth
difference of the original series, sa' are independent random variables, s' and
s' are structural constants for the system (Box &
Jenkins, 1970; Box & Pierce, 1970).
B. Parameter Estimation of ARIMA Model
After specifying the suitable model, Parameter
estimation methods can be applied to estimate the
Parameters. Several estimation methods are
available in the literature such as least square
method and maximum likelihood method (Maddala,
2001).
C. Diagnostic Checking
The adequacy of the constructed model can be
figured out based on the residuals. Initially, the
residuals should be checked for the evidence of
autocorrelations using its acf and pacf plots for
white noise. Then, the tests of residuals are able to
use for diagnostics. Under the residual diagnostics,
Box-Pierce or Q statistic, Box-Ljung (or Modified
Box-Pierce) statistic, Durbin-Waston statistic and
Lagrange Multiplier tests have been presented in
the theory (Brooks, 2008; Maddala, 2001).
D. Forecasting Performance
Forecasting is the final step of the Box-Jenkins
method. It can be functioned for one-step ahead or
multi-step ahead forecasting horizons. The
evaluation of the forecasting values is based on the
common performance measures such as mean
absolute error (MAE), root mean squared error
(RMSE), and mean absolute percent error (MAPE)
given by the equations 3, 4 and 5 as follows:
T
ttYtY
TMAE
1)(̂)(
1 (3)
T
ttYtY
TMSE
1
2))(̂)((1
(4)
T
ttYtYtY
TMAPE
1)(/))(̂)((
1 (5)
Where )(tY and )(̂tY are actual and predicted
values at time ,t T is the number of observations.
Since all the measures are rendered as the deviation
between actual and predicted values, the model
with the better forecasting results can be chosen
based on the minimum values of MAE, MSE and
MAPE.
III. EXPERIMENTATION DESIGN AND EMPIRICAL
RESULTS
A. Data
The purpose of this study is to find a suitable ARIMA
model for out-of-sample forecasting using short
time period of historical data. For this, we use
recent daily ASPI index in Colombo Stock Exchange
(CSE), Sri Lanka over the period from 2nd January
2012 to 31st December 2013. The sample consists
of 484 values and the first 411 values (about 85% of
the sample) are allocated as in-sample (training
sample) and the remaining 73 values are considered
as the out-of-sample (testing sample). To enhance
the accuracy of the results of the analysis, we use
logarithms of the original data series based on the
homoscedasticity. The corresponding time series
plot of logarithm ASPI (run sequence plot) is shown
in Fig. 1.
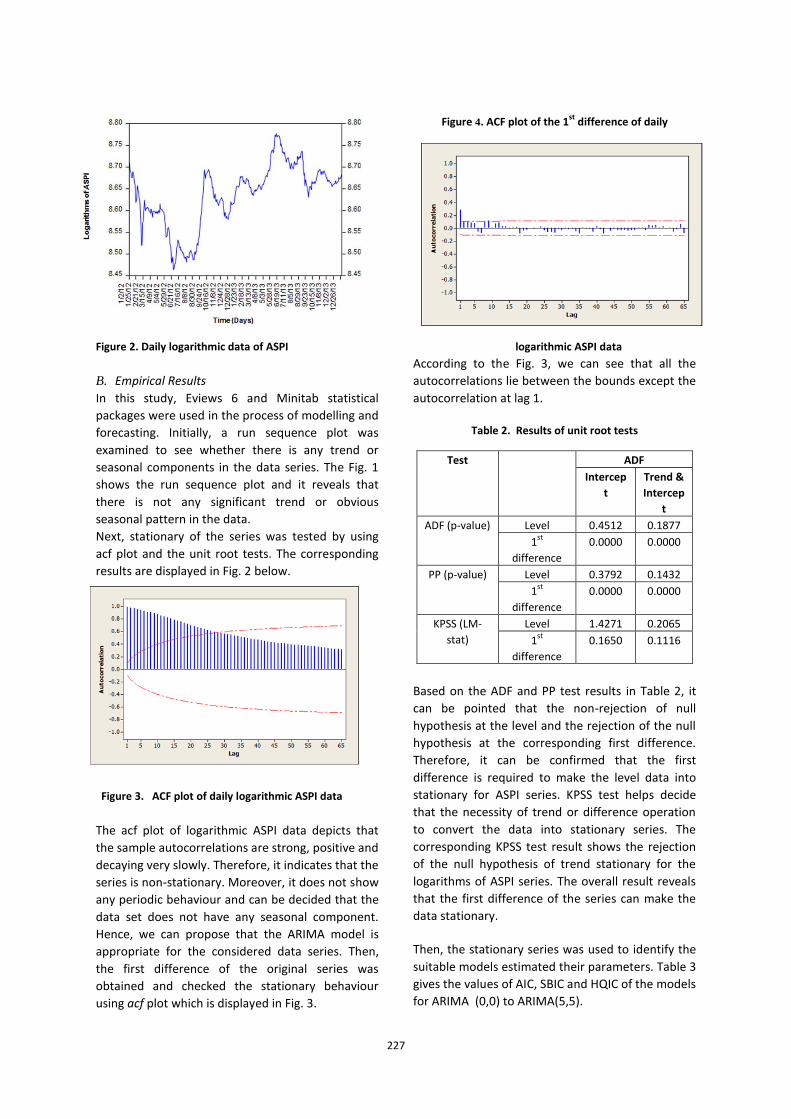
227
Figure 2. Daily logarithmic data of ASPI
B. Empirical Results
In this study, Eviews 6 and Minitab statistical
packages were used in the process of modelling and
forecasting. Initially, a run sequence plot was
examined to see whether there is any trend or
seasonal components in the data series. The Fig. 1
shows the run sequence plot and it reveals that
there is not any significant trend or obvious
seasonal pattern in the data.
Next, stationary of the series was tested by using
acf plot and the unit root tests. The corresponding
results are displayed in Fig. 2 below.
Figure 3. ACF plot of daily logarithmic ASPI data
The acf plot of logarithmic ASPI data depicts that
the sample autocorrelations are strong, positive and
decaying very slowly. Therefore, it indicates that the
series is non-stationary. Moreover, it does not show
any periodic behaviour and can be decided that the
data set does not have any seasonal component.
Hence, we can propose that the ARIMA model is
appropriate for the considered data series. Then,
the first difference of the original series was
obtained and checked the stationary behaviour
using acf plot which is displayed in Fig. 3.
Figure 4. ACF plot of the 1st
difference of daily
logarithmic ASPI data
According to the Fig. 3, we can see that all the
autocorrelations lie between the bounds except the
autocorrelation at lag 1.
Table 2. Results of unit root tests
Test ADF
Intercep
t
Trend &
Intercep
t
ADF (p-value) Level 0.4512 0.1877
1st
difference
0.0000 0.0000
PP (p-value) Level 0.3792 0.1432
1st
difference
0.0000 0.0000
KPSS (LM-
stat)
Level 1.4271 0.2065
1st
difference
0.1650 0.1116
Based on the ADF and PP test results in Table 2, it
can be pointed that the non-rejection of null
hypothesis at the level and the rejection of the null
hypothesis at the corresponding first difference.
Therefore, it can be confirmed that the first
difference is required to make the level data into
stationary for ASPI series. KPSS test helps decide
that the necessity of trend or difference operation
to convert the data into stationary series. The
corresponding KPSS test result shows the rejection
of the null hypothesis of trend stationary for the
logarithms of ASPI series. The overall result reveals
that the first difference of the series can make the
data stationary.
Then, the stationary series was used to identify the
suitable models estimated their parameters. Table 3
gives the values of AIC, SBIC and HQIC of the models
for ARIMA (0,0) to ARIMA(5,5).
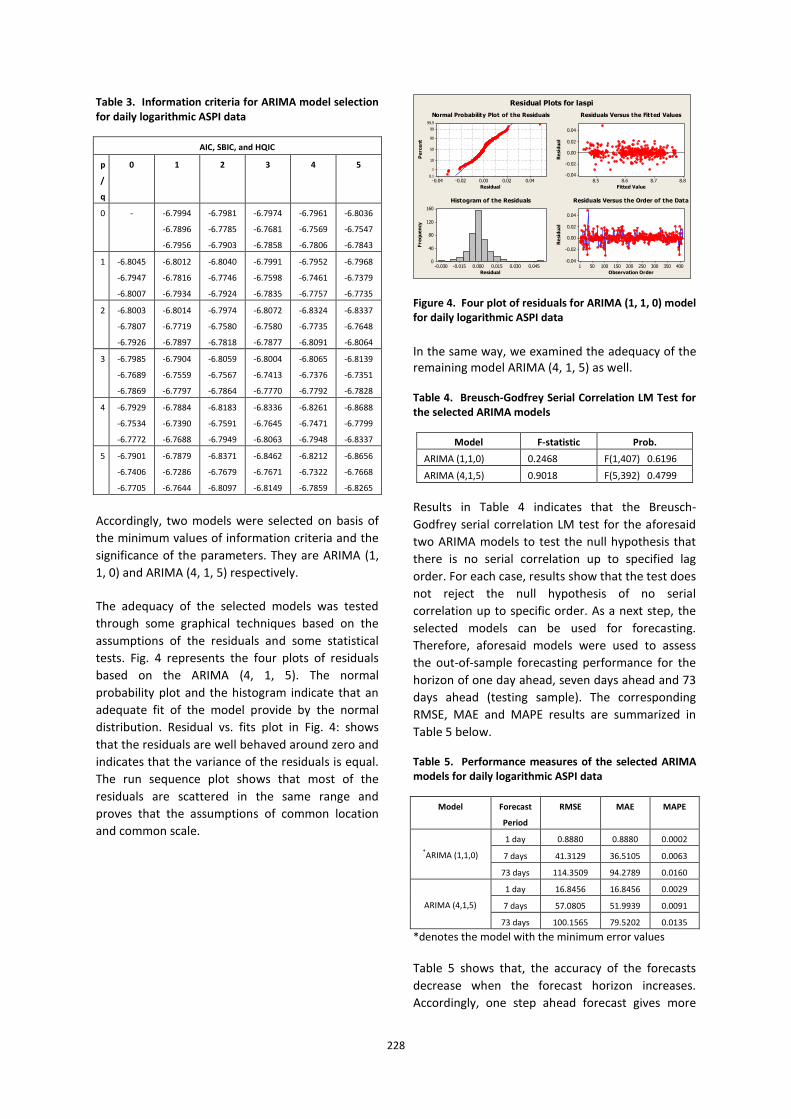
228
Table 3. Information criteria for ARIMA model selection for daily logarithmic ASPI data
AIC, SBIC, and HQIC
p
/
q
0 1 2 3 4 5
0 - -6.7994
-6.7896
-6.7956
-6.7981
-6.7785
-6.7903
-6.7974
-6.7681
-6.7858
-6.7961
-6.7569
-6.7806
-6.8036
-6.7547
-6.7843
1 -6.8045
-6.7947
-6.8007
-6.8012
-6.7816
-6.7934
-6.8040
-6.7746
-6.7924
-6.7991
-6.7598
-6.7835
-6.7952
-6.7461
-6.7757
-6.7968
-6.7379
-6.7735
2 -6.8003
-6.7807
-6.7926
-6.8014
-6.7719
-6.7897
-6.7974
-6.7580
-6.7818
-6.8072
-6.7580
-6.7877
-6.8324
-6.7735
-6.8091
-6.8337
-6.7648
-6.8064
3 -6.7985
-6.7689
-6.7869
-6.7904
-6.7559
-6.7797
-6.8059
-6.7567
-6.7864
-6.8004
-6.7413
-6.7770
-6.8065
-6.7376
-6.7792
-6.8139
-6.7351
-6.7828
4 -6.7929
-6.7534
-6.7772
-6.7884
-6.7390
-6.7688
-6.8183
-6.7591
-6.7949
-6.8336
-6.7645
-6.8063
-6.8261
-6.7471
-6.7948
-6.8688
-6.7799
-6.8337
5 -6.7901
-6.7406
-6.7705
-6.7879
-6.7286
-6.7644
-6.8371
-6.7679
-6.8097
-6.8462
-6.7671
-6.8149
-6.8212
-6.7322
-6.7859
-6.8656
-6.7668
-6.8265
Accordingly, two models were selected on basis of
the minimum values of information criteria and the
significance of the parameters. They are ARIMA (1,
1, 0) and ARIMA (4, 1, 5) respectively.
The adequacy of the selected models was tested
through some graphical techniques based on the
assumptions of the residuals and some statistical
tests. Fig. 4 represents the four plots of residuals
based on the ARIMA (4, 1, 5). The normal
probability plot and the histogram indicate that an
adequate fit of the model provide by the normal
distribution. Residual vs. fits plot in Fig. 4: shows
that the residuals are well behaved around zero and
indicates that the variance of the residuals is equal.
The run sequence plot shows that most of the
residuals are scattered in the same range and
proves that the assumptions of common location
and common scale.
Residual
Pe
rce
nt
0.040.020.00-0.02-0.04
99.9
99
90
50
10
1
0.1
Fitted Value
Re
sid
ua
l
8.88.78.68.5
0.04
0.02
0.00
-0.02
-0.04
Residual
Fre
qu
en
cy
0.0450.0300.0150.000-0.015-0.030
160
120
80
40
0
Observation Order
Re
sid
ua
l
400350300250200150100501
0.04
0.02
0.00
-0.02
-0.04
Normal Probability Plot of the Residuals Residuals Versus the Fitted Values
Histogram of the Residuals Residuals Versus the Order of the Data
Residual Plots for laspi
Figure 4. Four plot of residuals for ARIMA (1, 1, 0) model for daily logarithmic ASPI data
In the same way, we examined the adequacy of the remaining model ARIMA (4, 1, 5) as well. Table 4. Breusch-Godfrey Serial Correlation LM Test for the selected ARIMA models
Model F-statistic Prob.
ARIMA (1,1,0) 0.2468 F(1,407) 0.6196
ARIMA (4,1,5) 0.9018 F(5,392) 0.4799
Results in Table 4 indicates that the Breusch-
Godfrey serial correlation LM test for the aforesaid
two ARIMA models to test the null hypothesis that
there is no serial correlation up to specified lag
order. For each case, results show that the test does
not reject the null hypothesis of no serial
correlation up to specific order. As a next step, the
selected models can be used for forecasting.
Therefore, aforesaid models were used to assess
the out-of-sample forecasting performance for the
horizon of one day ahead, seven days ahead and 73
days ahead (testing sample). The corresponding
RMSE, MAE and MAPE results are summarized in
Table 5 below. Table 5. Performance measures of the selected ARIMA models for daily logarithmic ASPI data
Model Forecast
Period
RMSE MAE MAPE
*ARIMA (1,1,0)
1 day 0.8880 0.8880 0.0002
7 days 41.3129 36.5105 0.0063
73 days 114.3509 94.2789 0.0160
ARIMA (4,1,5)
1 day 16.8456 16.8456 0.0029
7 days 57.0805 51.9939 0.0091
73 days 100.1565 79.5202 0.0135
*denotes the model with the minimum error values
Table 5 shows that, the accuracy of the forecasts
decrease when the forecast horizon increases.
Accordingly, one step ahead forecast gives more
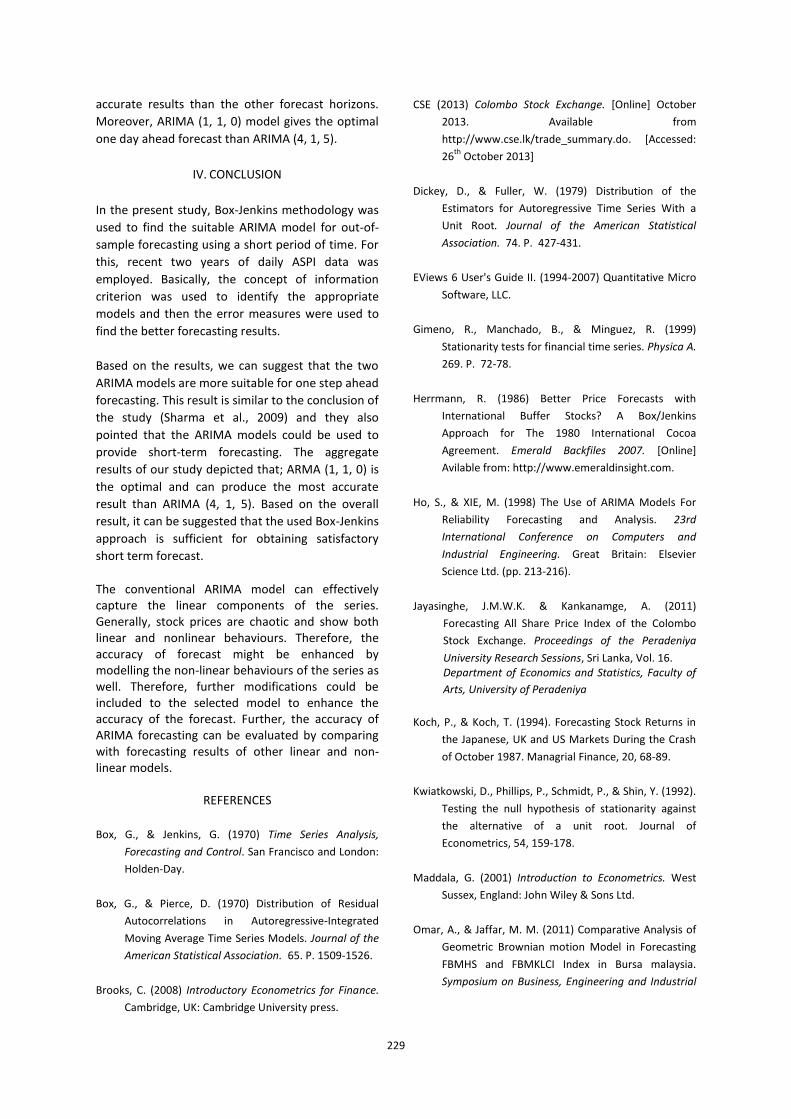
229
accurate results than the other forecast horizons.
Moreover, ARIMA (1, 1, 0) model gives the optimal
one day ahead forecast than ARIMA (4, 1, 5).
IV. CONCLUSION
In the present study, Box-Jenkins methodology was
used to find the suitable ARIMA model for out-of-
sample forecasting using a short period of time. For
this, recent two years of daily ASPI data was
employed. Basically, the concept of information
criterion was used to identify the appropriate
models and then the error measures were used to
find the better forecasting results.
Based on the results, we can suggest that the two
ARIMA models are more suitable for one step ahead
forecasting. This result is similar to the conclusion of
the study (Sharma et al., 2009) and they also
pointed that the ARIMA models could be used to
provide short-term forecasting. The aggregate
results of our study depicted that; ARMA (1, 1, 0) is
the optimal and can produce the most accurate
result than ARIMA (4, 1, 5). Based on the overall
result, it can be suggested that the used Box-Jenkins
approach is sufficient for obtaining satisfactory
short term forecast.
The conventional ARIMA model can effectively capture the linear components of the series. Generally, stock prices are chaotic and show both linear and nonlinear behaviours. Therefore, the accuracy of forecast might be enhanced by modelling the non-linear behaviours of the series as well. Therefore, further modifications could be included to the selected model to enhance the accuracy of the forecast. Further, the accuracy of ARIMA forecasting can be evaluated by comparing with forecasting results of other linear and non-linear models.
REFERENCES
Box, G., & Jenkins, G. (1970) Time Series Analysis,
Forecasting and Control. San Francisco and London:
Holden-Day.
Box, G., & Pierce, D. (1970) Distribution of Residual
Autocorrelations in Autoregressive-Integrated
Moving Average Time Series Models. Journal of the
American Statistical Association. 65. P. 1509-1526.
Brooks, C. (2008) Introductory Econometrics for Finance.
Cambridge, UK: Cambridge University press.
CSE (2013) Colombo Stock Exchange. [Online] October
2013. Available from
http://www.cse.lk/trade_summary.do. [Accessed:
26th
October 2013]
Dickey, D., & Fuller, W. (1979) Distribution of the
Estimators for Autoregressive Time Series With a
Unit Root. Journal of the American Statistical
Association. 74. P. 427-431.
EViews 6 User's Guide II. (1994-2007) Quantitative Micro
Software, LLC.
Gimeno, R., Manchado, B., & Minguez, R. (1999)
Stationarity tests for financial time series. Physica A.
269. P. 72-78.
Herrmann, R. (1986) Better Price Forecasts with
International Buffer Stocks? A Box/Jenkins
Approach for The 1980 International Cocoa
Agreement. Emerald Backfiles 2007. [Online]
Avilable from: http://www.emeraldinsight.com.
Ho, S., & XIE, M. (1998) The Use of ARIMA Models For
Reliability Forecasting and Analysis. 23rd
International Conference on Computers and
Industrial Engineering. Great Britain: Elsevier
Science Ltd. (pp. 213-216).
Jayasinghe, J.M.W.K. & Kankanamge, A. (2011)
Forecasting All Share Price Index of the Colombo
Stock Exchange. Proceedings of the Peradeniya
University Research Sessions, Sri Lanka, Vol. 16. Department of Economics and Statistics, Faculty of
Arts, University of Peradeniya
Koch, P., & Koch, T. (1994). Forecasting Stock Returns in
the Japanese, UK and US Markets During the Crash
of October 1987. Managrial Finance, 20, 68-89.
Kwiatkowski, D., Phillips, P., Schmidt, P., & Shin, Y. (1992).
Testing the null hypothesis of stationarity against
the alternative of a unit root. Journal of
Econometrics, 54, 159-178.
Maddala, G. (2001) Introduction to Econometrics. West
Sussex, England: John Wiley & Sons Ltd.
Omar, A., & Jaffar, M. M. (2011) Comparative Analysis of
Geometric Brownian motion Model in Forecasting
FBMHS and FBMKLCI Index in Bursa malaysia.
Symposium on Business, Engineering and Industrial
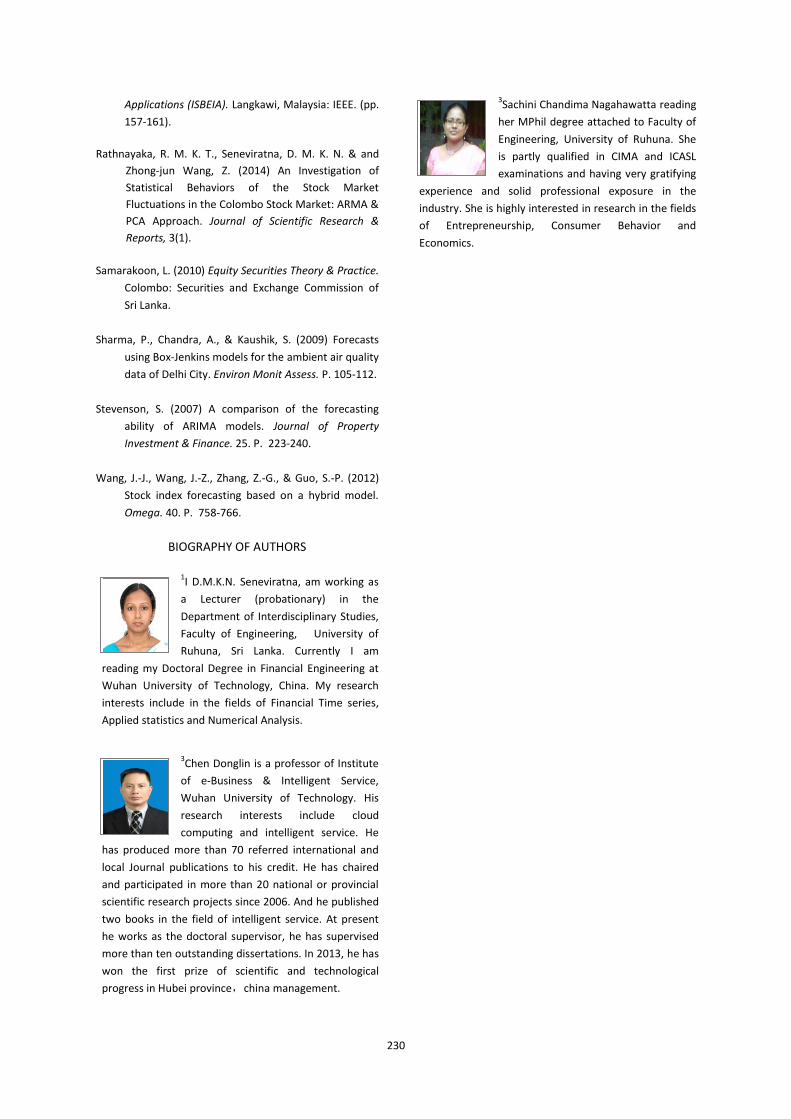
230
Applications (ISBEIA). Langkawi, Malaysia: IEEE. (pp.
157-161).
Rathnayaka, R. M. K. T., Seneviratna, D. M. K. N. & and
Zhong-jun Wang, Z. (2014) An Investigation of
Statistical Behaviors of the Stock Market
Fluctuations in the Colombo Stock Market: ARMA &
PCA Approach. Journal of Scientific Research &
Reports, 3(1).
Samarakoon, L. (2010) Equity Securities Theory & Practice.
Colombo: Securities and Exchange Commission of
Sri Lanka.
Sharma, P., Chandra, A., & Kaushik, S. (2009) Forecasts
using Box-Jenkins models for the ambient air quality
data of Delhi City. Environ Monit Assess. P. 105-112.
Stevenson, S. (2007) A comparison of the forecasting
ability of ARIMA models. Journal of Property
Investment & Finance. 25. P. 223-240.
Wang, J.-J., Wang, J.-Z., Zhang, Z.-G., & Guo, S.-P. (2012)
Stock index forecasting based on a hybrid model.
Omega. 40. P. 758-766.
BIOGRAPHY OF AUTHORS
1I D.M.K.N. Seneviratna, am working as
a Lecturer (probationary) in the
Department of Interdisciplinary Studies,
Faculty of Engineering, University of
Ruhuna, Sri Lanka. Currently I am
reading my Doctoral Degree in Financial Engineering at
Wuhan University of Technology, China. My research
interests include in the fields of Financial Time series,
Applied statistics and Numerical Analysis.
3Chen Donglin is a professor of Institute
of e-Business & Intelligent Service,
Wuhan University of Technology. His
research interests include cloud
computing and intelligent service. He
has produced more than 70 referred international and
local Journal publications to his credit. He has chaired
and participated in more than 20 national or provincial
scientific research projects since 2006. And he published
two books in the field of intelligent service. At present
he works as the doctoral supervisor, he has supervised
more than ten outstanding dissertations. In 2013, he has
won the first prize of scientific and technological
progress in Hubei province,china management.
3Sachini Chandima Nagahawatta reading
her MPhil degree attached to Faculty of
Engineering, University of Ruhuna. She
is partly qualified in CIMA and ICASL
examinations and having very gratifying
experience and solid professional exposure in the
industry. She is highly interested in research in the fields
of Entrepreneurship, Consumer Behavior and
Economics.
Photograph
Author 1
Photograph
Author 3
Photograph
Author 3

231
Risk Analysis of Governance in Community Development Projects
DSPC Karunasekara
Department of Commerce & Financial Management, Faculty of Commerce & Management Studies,University of Kelaniya,Sri Lanka.
Abstract - Governance in a community development
project could be referred as a process of decision
making in order to achieve expectations, and
management goals. The good governance ensures
transparency in decision making and accountability.
Governance in community development projects
must achieve their set objectives which focus on the
government is national development policy agenda.
These projects had been identified five risk areas:
financial, institutional, procurement, grievance and
communication. This study analyzed the risk areas
of “Gemidiriya” project in order to bridge the
prevailing gap in empirical information. The study
aims at administrative risk areas of community
development projects, determining the success level
of governance while identifying the relationship
between risk areas assigning values to qualitative
features to give a quantitative facet. Primary data
were collected from a sample of 150 employees of
the community development and livelihood
improvement project through a field survey by the
researcher playing the role of participant as
observer. The study used the stratified random
sampling method as the population of 500
employees had been divided into more relevant and
significant strata based on their position. Reliability
of the questions was listed and that was high
(0.87).The structured interviewed type of
questionnaire were administered for nearly three
months to collect data. The correlation analysis
showed that there was a strong positive relationship
between financial risks and procurement risks.
Overall, finance risks and procurement risks were
above the expected level but communication,
grievance and institutional risks were below the
expected level due to weakness in disclosure
policies, poor communication progress and absence
of proper grievance handling mechanism. It is
recommended that the necessity of trained staff
whom should also have a sound working
environment free from political intervention. The
appraisals and compliance handling should be done
by an independent team.
Keywords: Governess, Risks, Community
development
I. INTRODUCTION
Community development projects mainly focus on
economic and social empowerment while
supporting to eradicate poverty. These projects are
closely supervised by the Ministry of Economic
Development and mainly funded by the World
Bank.
Divineguma is one of the such community
development projects started with the initial
funding assistance of US$51 to empower the
beneficiary communities providing resources,
enabling them to make their own decisions and
improving their competencies through skills,
technology and information in order to improve the
economic and social well- being of under privileged
societies. This project was implemented under
three phases. In the first phase, 1000 villages were
expected to be covered by 1034 village
organizations in about 816 Grama Niladhari
divisions. It could be noted that this project was
managed by decentralized system as these projects
were supervised at the village level by the village
organizations consisting a few office representatives
of these villages.
Governance and accountability mechanism were
implemented in these projects from the lessons
learnt from the previous community development
projects in order to achieve the objectives of
Second Community development and Livelihood
project. According to the Annual Report in 2011
issued by the Ministry of Economic Development, a
specific assessment of the governance identified the
following five risk areas.
a. Malfunctions in Project management level
Governance system (Institutional).
b. Financial management weaknesses
(Finance).
232
c. Irregularities in procurement and assets
management (Procurement).
d. Weaknesses in disclosure policies and
procedures poor communications (Communication).
e. Ineffective complaint and grievance
redress mechanism (Grievance).
A. Problem Statement
Even though Governance and Accountability
Mechanism had been already established, there
was no reported evidence on the stated five risk
areas. One of the major problems in community
development programs is that there are many
assessments, feasibility studies and planning in
community development projects, but at the time
of implementing, there is no specific evaluation
process adopted to find the validity of the project.
Among the identified risks only two risks: Finance
and Procurement, have been achieved the targets
but not the rest of three. Therefore, this paper finds
out reasons why the other three risks were below
the expected level. The main objectives of the study
are;
1. To examine problem areas in the
governance of the project.
2. To identify the relationship between each
other risk areas.
This paper will help the project representatives,
Government of Sri Lanka and the World Bank to
minimize the inefficiencies in the process of
governance while showing the reasons for the other
three risks areas were below the expected level.
This knowledge and guidance will be able to use for
the forthcoming community development projects
in the country.
II. LITERATURE REVIEW
The prevailing government emphasis good
governance practices giving more opportunities to
the general public to involve in decision making
process in community development projects like
Gemidiriya. As found evidences from literature, it
could be noted that active participation of
stakeholders of these projects are essential to
address the burning issues of these communities.
Thus, stakeholders should be empowered through
good governance establishing decentralized
institutions at the village level increasing the
engagement level of the villagers in these projects.
A. Governance
The concept of "governance" is as old as human
civilization. Governance simply means the process
of decision making and the process by which
decisions are implemented (or not implemented).
Governance can be used in several contexts such as
corporate governance, international governance,
national governance and local governance
(UNESCAP, 2013). Governance could be defined as
a process of making decisions which define the
expectations, systems and management, in this
case, of a neighborhood (Kumara & Karunasekara-
2014). It is influenced by authorized institutions in
order to deliver services to an area and should also
be shaped by communities. Governance can be a
collective activity that is entered into by those
whose lives are affected by the decisions that are
made. Not only this, but through their positive
contributions to the life of their community, people
living there are able to shape the community in a
way that suits them.
Bergh (2004) indicates that decentralization is a
major point of discussion on the topic of good
governance. From the point of view of ‘good
governance’ devolution has many functions such as
being a mode of administration that advocates
bottom-up planning which captures, internalizes
and addresses local needs and concerns. As such, it
promotes responsiveness and accountability of
policy makers to local needs and people. The
administrative dimension undertakes to transfer the
responsibility of functions from a central agency to
one or more of its lower levels such as a state
corporation.
Even though governance is very helpful for the
success of any organization from small local
organizations to large international organizations
(Kumara, and Karunasekara, 2014) it is a group
decision-making that addresses shared problems.
Thus, governance considers on future directions
and long-term strategic consideration which
addresses the issues of policy in relation to internal
programming (Tandon, R, 1991). Governance is a
decision making processes, policy formulation and
implementation capacity, development of
personnel, information flows and the nature and
style of leadership (Ogundia ,I, 2010).
Contemporary theories on governance make a
fundamental distinction between governance and
government. Further, the fundamental point is if it
is appropriate to even propose a universal of
governance principle. Some argue that emphasis
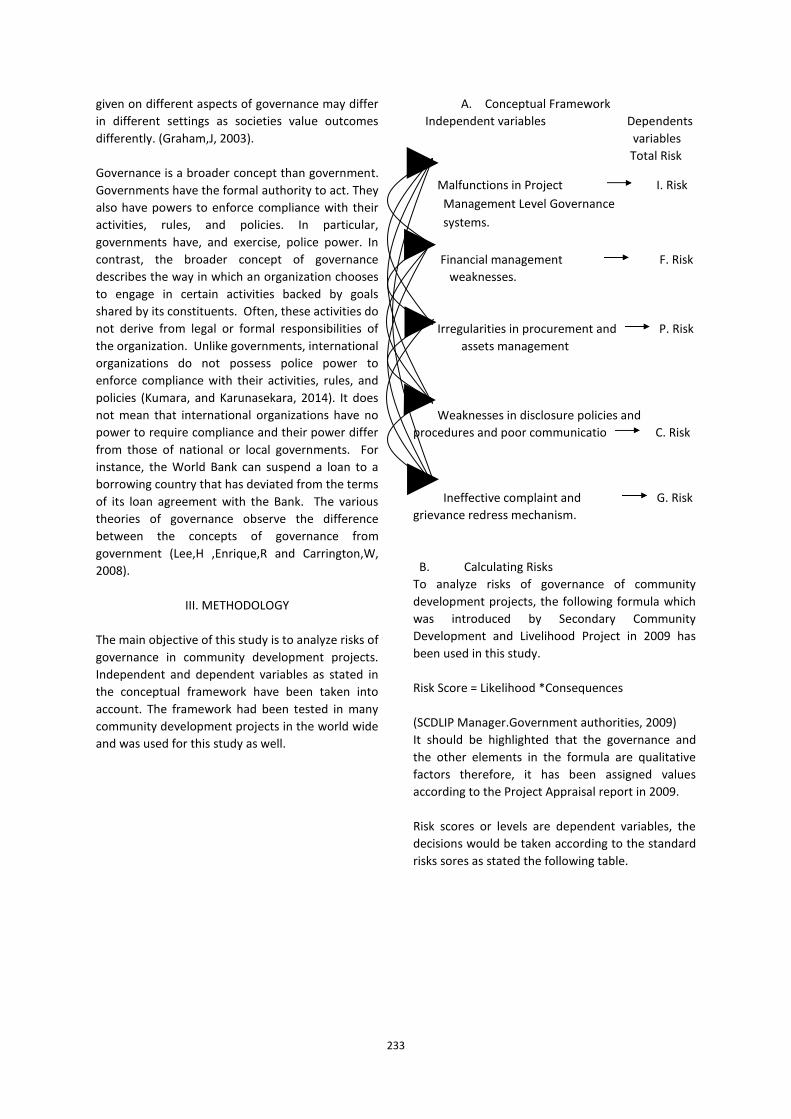
233
given on different aspects of governance may differ
in different settings as societies value outcomes
differently. (Graham,J, 2003).
Governance is a broader concept than government.
Governments have the formal authority to act. They
also have powers to enforce compliance with their
activities, rules, and policies. In particular,
governments have, and exercise, police power. In
contrast, the broader concept of governance
describes the way in which an organization chooses
to engage in certain activities backed by goals
shared by its constituents. Often, these activities do
not derive from legal or formal responsibilities of
the organization. Unlike governments, international
organizations do not possess police power to
enforce compliance with their activities, rules, and
policies (Kumara, and Karunasekara, 2014). It does
not mean that international organizations have no
power to require compliance and their power differ
from those of national or local governments. For
instance, the World Bank can suspend a loan to a
borrowing country that has deviated from the terms
of its loan agreement with the Bank. The various
theories of governance observe the difference
between the concepts of governance from
government (Lee,H ,Enrique,R and Carrington,W,
2008).
III. METHODOLOGY
The main objective of this study is to analyze risks of
governance in community development projects.
Independent and dependent variables as stated in
the conceptual framework have been taken into
account. The framework had been tested in many
community development projects in the world wide
and was used for this study as well.
A. Conceptual Framework
Independent variables Dependents
variables
Total Risk
Malfunctions in Project I. Risk
Management Level Governance
systems.
Financial management F. Risk
weaknesses.
Irregularities in procurement and P. Risk
assets management
Weaknesses in disclosure policies and
procedures and poor communicatio C. Risk
Ineffective complaint and G. Risk
grievance redress mechanism.
B. Calculating Risks
To analyze risks of governance of community
development projects, the following formula which
was introduced by Secondary Community
Development and Livelihood Project in 2009 has
been used in this study.
Risk Score = Likelihood *Consequences
(SCDLIP Manager.Government authorities, 2009)
It should be highlighted that the governance and
the other elements in the formula are qualitative
factors therefore, it has been assigned values
according to the Project Appraisal report in 2009.
Risk scores or levels are dependent variables, the
decisions would be taken according to the standard
risks sores as stated the following table.

234
Table 01: Standard risk scores
Source- Project Appraisal Report-2009
The weightage of the other two elements are as
follows.
Table-02: Weightage of the elements
Source- Project Appraisal Report-2009
C. Population And Sample
It was taken almost three months to collect data
from the relevant project staff using a structured
questionnaire. Primary data were collected from a
sample of 150 employees of the community
development and livelihood improvement project
through a field survey by the researcher playing the
role of participant as observer. The study used the
stratified random sampling method as the
population of 500 employees had been divided into
more relevant and significant strata based on their
position.
D. Success Level Of Govenance
The figure 1 shows that the level of success against
the employee category. Employees were
categorized from the top to bottom management
level.( I-IV: Top/ V-IX: Middle/X-XIII-Lower). The 3rd
category employees show the highest progress level
in procurement and the least progress level in
grievance redress system. Even though progress
level of finance and procurement were at
satisfactory level in all employee categories, it was
not in the 3rd
and the 11th
employee category.
Figure 1: Success level of governance vs Employees
Category
Source- Project Appraisal Report-2009
The figure 2 shows that only risks areas namely
finance and procurement have been achieved the
expected level of the donor of the project (The
World Bank). This study finds out the reasons for
not achieving the expected level by the rest of the
three risks areas. Level of success in institutional,
communication and grievance redress system of
employees in all categories were lower than the
expected level.
Figure 2: Policy Maker Success level of governance
Source- Project Appraisal Report-2009
Risk, Assessment
Scores Received
Decision
Less than 06 Risk is Low
Between 08 – 12 Risk is Moderate
Between 14 – 20 Risk is High
More than 20 Risk is Top
Decision Weightage
Likelihood Consequence
Very high 5 5
High 4 4
Medium 3 3
Low 2 2
Very low 1 1
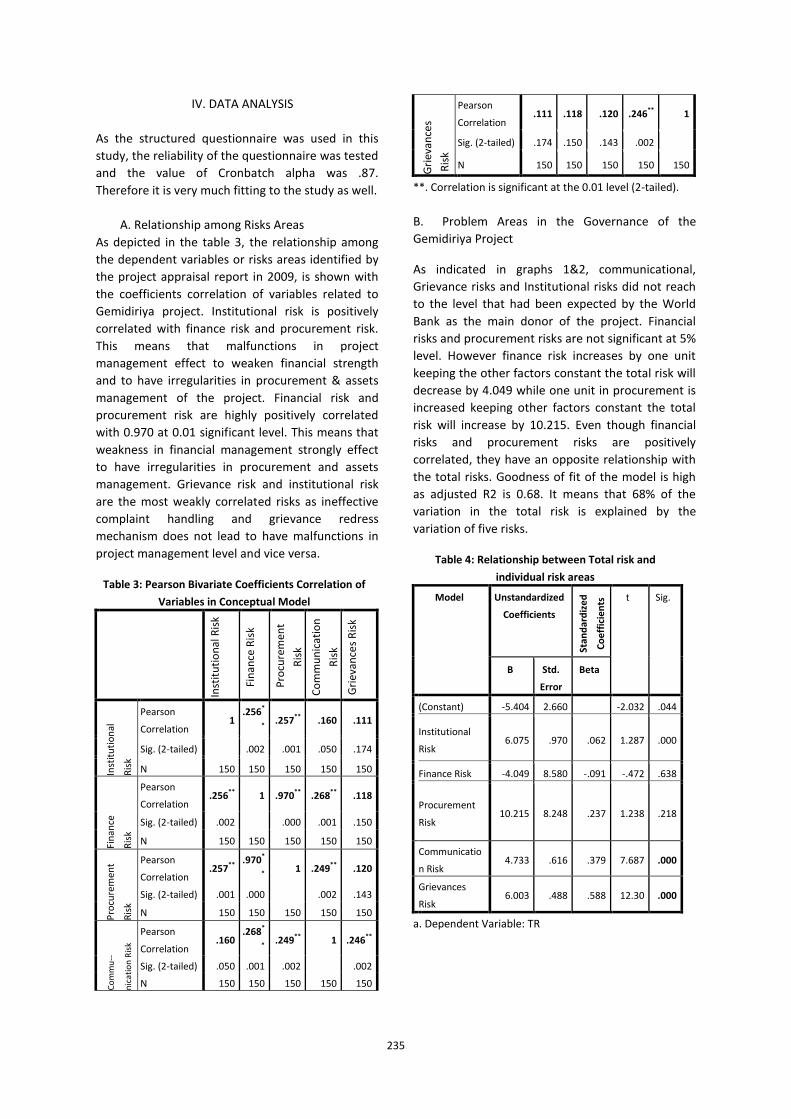
235
IV. DATA ANALYSIS
As the structured questionnaire was used in this
study, the reliability of the questionnaire was tested
and the value of Cronbatch alpha was .87.
Therefore it is very much fitting to the study as well.
A. Relationship among Risks Areas
As depicted in the table 3, the relationship among
the dependent variables or risks areas identified by
the project appraisal report in 2009, is shown with
the coefficients correlation of variables related to
Gemidiriya project. Institutional risk is positively
correlated with finance risk and procurement risk.
This means that malfunctions in project
management effect to weaken financial strength
and to have irregularities in procurement & assets
management of the project. Financial risk and
procurement risk are highly positively correlated
with 0.970 at 0.01 significant level. This means that
weakness in financial management strongly effect
to have irregularities in procurement and assets
management. Grievance risk and institutional risk
are the most weakly correlated risks as ineffective
complaint handling and grievance redress
mechanism does not lead to have malfunctions in
project management level and vice versa.
Table 3: Pearson Bivariate Coefficients Correlation of
Variables in Conceptual Model
Inst
itu
tio
nal
Ris
k
Fin
ance
Ris
k
Pro
cure
men
t
Ris
k
Co
mm
un
icat
ion
Ris
k
Gri
evan
ces
Ris
k
Inst
itu
tio
nal
Ris
k
Pearson
Correlation 1
.256*
* .257** .160 .111
Sig. (2-tailed) .002 .001 .050 .174
N 150 150 150 150 150
Fin
ance
Ris
k
Pearson
Correlation .256** 1 .970** .268** .118
Sig. (2-tailed) .002 .000 .001 .150
N 150 150 150 150 150
Pro
cure
men
t
Ris
k
Pearson
Correlation .257**
.970*
* 1 .249** .120
Sig. (2-tailed) .001 .000 .002 .143
N 150 150 150 150 150
Co
mm
u--
nic
atio
n R
isk
Pearson
Correlation .160
.268*
* .249** 1 .246**
Sig. (2-tailed) .050 .001 .002 .002
N 150 150 150 150 150
Gri
evan
ces
Ris
k
Pearson
Correlation .111 .118 .120 .246** 1
Sig. (2-tailed) .174 .150 .143 .002
N 150 150 150 150 150
**. Correlation is significant at the 0.01 level (2-tailed).
B. Problem Areas in the Governance of the
Gemidiriya Project
As indicated in graphs 1&2, communicational,
Grievance risks and Institutional risks did not reach
to the level that had been expected by the World
Bank as the main donor of the project. Financial
risks and procurement risks are not significant at 5%
level. However finance risk increases by one unit
keeping the other factors constant the total risk will
decrease by 4.049 while one unit in procurement is
increased keeping other factors constant the total
risk will increase by 10.215. Even though financial
risks and procurement risks are positively
correlated, they have an opposite relationship with
the total risks. Goodness of fit of the model is high
as adjusted R2 is 0.68. It means that 68% of the
variation in the total risk is explained by the
variation of five risks.
Table 4: Relationship between Total risk and
individual risk areas
Model Unstandardized
Coefficients
Stan
dar
diz
ed
Co
eff
icie
nts
t Sig.
B Std.
Error
Beta
(Constant) -5.404 2.660 -2.032 .044
Institutional
Risk 6.075 .970 .062 1.287 .000
Finance Risk -4.049 8.580 -.091 -.472 .638
Procurement
Risk 10.215 8.248 .237 1.238 .218
Communicatio
n Risk 4.733 .616 .379 7.687 .000
Grievances
Risk 6.003 .488 .588 12.30 .000
a. Dependent Variable: TR

236
Table 5: Model Summary
Mode
l
R R
Square
Adjusted
R Square
Std. Error of the
Estimate
1 .833a .694 .683 8.198
a. Predictors: (Constant), G Risk, I Risk, F Risk, C Risk,
P Risk
V. CONCLUSION AND RECOMMENDATION
As the project functioned under a decentralized
management system, most of the project funds had
flown directly from the Foundation to the Village
Organizations comprising the villagers who were
empowered to decide on use of these funds for
their benefit. Therefore, the citizens themselves
were responsible for using the project resources for
improving their livelihood, and the state
accountable for delivery of services to citizens was
marginal. Resource use efficiency was monitored by
Social Audit and Procurement Committees. The
participatory processes and social accountability did
not eliminate the risks of political intervention and
collusion in the use of project funds and community
resources. Even though it was stated on governing
values to have good practices in the areas of project
management, community organizing and corruption
control this was not practiced. The study found that
members on the staff of the project were not
caliber enough to do their duties and
responsibilities, full of stress , poor quality of staff
training , supervision staff not visiting the field
and/or submitting inaccurate reports; poor target
setting ,communications between HQ and field
office are not effective, frequent changes in rules
and procedures and bureaucratic interference in
project functioning. Therefore institutional risks
were below the expected level. Thus, the appraisal
and compliance handling teams of the projects
should be separated from the facilitation teams
ensuring independent checking on compliance with
the village level governance systems. The other two
risks below the expected level were communication
risks and grievances risks. The study was able to find
that there was no proper mechanism to resolve
conflicts and to handle grievances. Thus, there
should be a system for independent inquiry,
reporting and lessons drawing and dissemination
process. This complaints and grievance process is
supported by formal and informal sanctions against
individual wrongdoing and neglect of duties and
against communities for nonperformance.
ACKNOWLEDGMENT
Authors wishes to acknowledge the support given
by the staff of the project and my colleagues, in
data collection and providing information.
REFERENCES
Bergh, I.S (2004), Policy incoherence in the Good
Governance Agenda, 12th
General
Conference, Geneva. June 2008.
Creswell, J. (2003). Research Design: Qualitative,
Quantitative and Mixed Method
Approach 2nd ed. . Calif: Sge.: Thousand
Oaks,.
Granham,J. (2003). Governance principles for
protected areas in. the 21st
century.Institute On Governane, In
Collaboration with Parks Canada&
Canadian International Development Agency.
Durban South Africa: Institute On
Governane.
Internal Audit Report. (2012). 1st Quater Internal
Audit Report of Second Community
Development & Livelihood Immprovement
Project. Colombo: Management Frontiers
Chartered Accountants of Colombo Sri Lanka.
Kandhro,S. (2011, March). Roles of E-Government
in Enhancing Good Governance Of Public
C Sectors Organizations In Pakistan. Roles
of E-Government in
Enhancing Good Governance Of Public C
Sectors Organizations In Pakistan , 1-86.
Kauzya, J–M. (2007) Political Decentralisation in Africa:
Experiences of Uganda, Rwandaand
South Africa, UN Department of
Economic and Social Affairs, New York,
December.
Kumara, M.M.S. and Karunasekara,D.S.P.C. (2014).
Effectiveness of Governance and
Accountability Machanism Second
communty development and livelihood
improverment project. ICCM: University of
Jaffna-Srilanka.
Lee,H ,Enrique,R and Carrington,W. (2008,
December). Governance and Accountability:The
Regional Development Banks.
237
Governance and
Accountability: The Regional Development
Banks The University of Iowa College of
Law University of Iowa Legal Studies
Research Paper Number
08-47 , 1-75.
Ogundia ,I. (2010, April 10). Democracy and good
governance: Nigeria’s dilemma. African
Journal of Political Science and
International Relations Vol. 4(6), pp. 201-
208, June 2010 , 1-208.
SCDLIP Managers, The Govermment Authorities &
The World Bank Implementation Support
Missions. (2009). Governance and
Accountability Machanism for Sri Lanka -
Community Development & Livelihood
Improvement APL-2. Gemidiriya
Foundation, Government. Colombo in Sri
Lanka:SCDLIPManagers.
Tandon, R. (1991). Governance and Accountability
in Non Government
Organizations.Hyderabad: Board Games.
The World Bank. (2009). Project Appraisal
Document on a Proposed Credit Second
Community Development & Livelihood
Improverment Project in Support of the
Sconde PHASE Adaptable Program Loan.
Colombo:Democratic Sociialist Republic Of
Sri Lanka.
World Bank Support Mission. (2012). Aide
Memoire: Second Community
Development & Livelihood Improvement
Project. Colombo: Worl Bank Support Mission.
BIOGRAPHY OF AUTHOR
Author is a product of Bandarawaththa
Parakkrama Maha Vidyalaya- Gamapaha
and now is working a professional
researcher in the field of tourism. His
research interests include
entrepreneurship, project management, tourism and
International Business. He has produced nearly 10
referred international and local Journal publications to his
credit. He is a member of Association of Business
Executives and Association of Charted Management
Association in the UK. Author is reading his PhD at
university of Kelaniya, Sri Lanka.

238
Perception on Credit Cards for E-Payments in E-Government Service in Sri Lanka
HMBP Ranaweera
Huazhong University of Science and Technology, Wuhan, PR China School of Public Administration, Department of Business Management, Rajarata University of Sri Lanka
Abstract— In competitive and complicated context,
people look for quick, short and quality services.
Government as well needs to provide competitive
services by integrating new technologies. In an e-
government, a solid and trusted environment is a
pre-requisite to ensure the trustworthiness of the
payee for the paying bills especially utilities, in
foster payment especially through electronic media.
The expansion of the Internet has facilitated the
attractiveness of this payment instrument. E-
commerce and e-government have created new
financial needs that in many cases cannot be
effectively fulfilled by traditional payment systems.
There are plenty of electronic payment systems.
Among them, credit card has popularized for paying
bills in Sri Lanka.
The research question is ‘Are there any potential to
use these trends as an imperative means for e-
payments in an e-government services in Sri Lanka?’
The paper aims to examine perception of credit
cardholders on using credit cards for e-payment in
e-government services through an exploratory
inquiry. The literature related to the present
investigation is used to develop a framework for the
study. Data was collected from a sample of 150
credit card holders in Colombo district and used
quantitative method. Result reveals that
behavioural elements of credit card holder’s
perception on credit card for e-payment have
significant influence on their perception about e-
payment through credit cards. Sri Lanka is moving
toward greater e-government adoption
interestingly. Accordingly e-payment means also
should be taken into consideration, majority of
online population in Sri Lanka is yet considered
“infants” with a shallow level of Internet knowledge,
and this builds up fear of using e-payment. Results
of the present study evident that there is a positive
trend towards the perception of using credit cards
as a mean for e-payment in e-government services.
There are substantial potentials to encourage and
further improvements of e-government concept in
Sri Lanka.
Keywords— Credit card, e-government, e-payment,
perception
I. INTRODUCTION
Technology is advancing swiftly, especially in the
field of Information and Communication Technology
(ICT). This technological advancement has changed
the way people live, life pattern and customs such
as work, behaviour, talk and all (Gunawardana,
2007; Christos et al. 2013; Syamsuddin, 2011). In
this kind of competitive and complicated context,
people look for quick, short and quality services.
In such a context, government as well needs to
provide competitive services by integrating new
technologies. When a government uses ICT related
applications including World Wide Web applications
to offer its services to people, the government
becomes to an e-government (Yildiz, 2007). In an e-
government, a solid and trusted environment is a
pre-requisite to ensure the trustworthiness of the
payee for paying bills especially utilities such as
electricity, water, rates, telephone etc., in fostering
payment especially through electronic media.
The expansion of the Internet has facilitated the
attractiveness of this payment instrument, for
instance electronic commerce (e-commerce) and e-
government have created new financial needs that
in many cases cannot be effectively fulfilled by
traditional payment systems (Sumanjeet, 2009;
Ozkan et al. 2010). Teoh et al. (2013) and
Muhayiddin et al. (2011) highlighted that electronic
payment means are much safe than traditional
means. Electronic payment can be defined as the
method used to pay for the purchases of goods and
services over the Internet (Amiirah, 2013).
Pasupathinathan (2013) noted that electronic
payment instruments can be categorized into main
239
three parts namely cash, cheque and card. Credit
cards are fallen to card payment mechanism. There
are plenty of electronic payment systems such as
Payment Service Provider (PSP), Square, Google
Wallet, Dwolla, Amazon Payments, 2CheckOut,
PayPal, Skrill (before Moneybookers), WePay, V.me
by Visa, Intuit GoPayment, Serve from American
Express, Samurai by Feefighters, Authorize.Net,
Worldpay, Eway, Icepay, Braintree, Stripe, Credit
card, Charge card, Debit card, e-money, e-cheque.
Among them, credit card has popularized for paying
bills in Sri Lanka, at the same time credit card has
become imperative means of payments among the
public in an e-government services (Teoh et al.
2013). Central Bank of Sri Lanka (2013) has
emphasized that usage of credit card has increased
gradually in last decades.
At the end of 2013 total number of card holders in
Sri Lanka was 926,949. Total value of transactions
was 30,694 Million. At the same time the number of
transactions has increased by 10.7 percent and
value of credit card transactions recorded a growth
9.4 percent in 2013 in compared with 2012.
Accordingly, Central Bank (2013) revealed that the
use of credit cards in Sri Lanka has increased due to
rapid lifestyle changes and the soaring cost of living,
the demand for credit cards and the number of
transactions has increased gradually.
This growth will be largely attributing to the
improving credit card payment infrastructure in the
country, with most of the merchants accepting
credit card payments at POS terminals. These cards
are positioned in a manner which gives an
impression that the cards can be acquired by people
from not only the upper class but also the middle
income categories. Today credit card industry is
highly competitive and almost all the banks are
offering credit cards along with Visa International or
Master Card.
Sari and Rofaida (2011) state that the respondents
for their study have shown a positive attitude
towards credit card usage. Perception means the
way people think about or understand someone or
something and it has several aspects (Schiffman et
al. 2006). So that customer perception is a main
aspect of demand of credit card. A negative
perception leads to reduce the card demand. The
positive attitudes can help to influence the
intention to use (Davis, 1989). Recent studies have
suggested that various factors impact over
perception about credit card payment for e-
government services. However, such an
investigation in Sri Lanka is yet very limited and in
its infancy. Thus, this paper aims to examine the
perception of credit cardholders on credit cards for
e-payment in e-government services through an
exploratory inquiry. More specially, following
objectives frames the present inquiry.
1. To identify the antecedent conditions to
the perception on credit card for e-
payment in an e-government environment.
2. To provide some motivating and
encouraging factors for policy makers to go
further enhancements towards the
concept of e-government in Sri Lanka.
This paper is organized into six sections, including
the foregoing introduction. Section II explores
relevant literature support. Section III presents
research methodology. Section IV is devoted to
explain result and discussion. Conclusion is offered
in section V and finally section VI focuses to
limitations and future research directions.
II. LITERATURE AND HYPOTHESES
“On February 28, 1950 A Diners club card, the first
multiuse credit card was issued. This marked the
beginning of the era of plastic money” (Sudhagar,
2012). As markets mature, credit cards tend to
replace cash and checks as the most common
payment mechanism. For the first time credit card
was introduced to Sri Lanka by commercial banks in
1989. A credit card is a plastic card with a magnetic
strip containing data, and is a financial instrument
allowing the holder to pay for goods or services on
credit and in lieu of cash. Dwarkadas (2011) has
defined credit card like “plastic money”. It is a
convenient solution for money. Ausubel (1991)
emphasized that “Credit cards, including store cards
and bankcards, serve two distinct functions for
consumers: a means of payment and a source of
credit”. Danes and Hira (2009) described that credit
cards should be used for convenience reasons. The
importance of credit cards, both as a payment and
short-term financing medium to today’s consumers
is no longer debatable, because of the convenience
(Chakravorti et al. 2001).
Wickramasinghe and Gurugamage (2009)
attempted to understand the credit card use
patterns in Sri Lanka. Wickramasinghe and
Gurugamage (2012) attempted to identify and
assess the effects of credit card users' demographic
240
and socio-economic characteristics, knowledge
about credit cards, and perceived lifestyle outcomes
of the credit card usage on credit card usage
practices. In their study, they have not discussed
about the perception. According to the Technology
Acceptance Model (TAM), presented by Davis et al.
(1989), they identified that there is a significant
relationship between attitudes and intention to use.
Thus based on that theory it was able to identify
other scholars who have proven the same
association. Lin and Wang (2013) have proven that
there is a positive association between attitudes
and behavioural intentions. Sari and Rofaida (2011)
emphasize that there is a positive attitude towards
credit cards usage, with high influence of subjective
norm, high behaviour control, high intention to use
credit cards and card holders used credit cards
wisely. So that cardholders’ positive attitudes are
highly related with cardholder perception. Hence
there is a positive and significant effect between
behavioural attitudes toward the intention to use
credit card. Mansfied et al. (2013); Sudhagar (2012)
have mentioned that there is a positive relationship
with attitude and perception towards the credit
card use. Afakli (2007) also has proven the same
relationship. Grounded on the aforementioned
arguments, the following hypotheses can be
proposed.
H1 - there is a positive relationship between
cardholder’s attitudes and credit card holder’s
perception towards e-payment.
Afakli (2007) in his study states that credit card
demand and its usage are depended on consumer
perception. According to Clyde (2008), cardholder
perception basically determines demand for credit
card. At the same time he noted that perception
can be altered by providing extra facilities and
benefits. So that, most of institutions tend to
provide more facilities to their customers.
Moreover, popularity of brand name is one of major
factors that determine the demand. Interest rates
applied for credit cards also affect to change the
card holder demand. Huang and Tan (2007) stated
that the interest rate and demand for credit card
are positively correlated. However Ausubel (1991)
suggests that consumers may not even consider the
interest rate when making purchases because they
do not intend to borrow for an extended period
when they make purchases. However interest rate
highly affects to change of credit card demand.
Amin (2007) suggests that perceived usefulness,
perceived ease of use, perceived credibility and the
amount of information on mobile credit cards are
important determinants to make demand and those
encourage customers' intentions to use mobile
credit card for e-payments. On a basis of the above
evidences, this study proposes:
H2 - there is a positive relationship between
cardholder’s demand and credit cardholder’s
perception towards e-payment.
Khalid et al. (2013) emphasize that the adoption
and usage of credit cards is found to be significantly
influenced by demographic factors and leads to
holder’s perception. Gan et al. (2005) has also
noted the same. Their research found that the
higher income earners, the better educated, older
adults, females, married, have more intention to
have and use credit card than the other groups.
They have considered demographic characteristics.
Jusoh et al. (2012) analysis the demographic
variables which affect to credit cards perception
and attitudes. According to their study the result of
t-test has shown that there are no significant
differences in credit card practices between male
and female working adults. Furthermore one-way
ANOVA revealed that there is significant difference
in credit card practices with education levels. Arias
et al. (2010) described that women, in general,
understand credit and know the interest rates of
their credit cards with much greater frequency than
men and this leads to perception to use credit
cards. Drawing a conclusion from the above
arguments, this study proposes the following
hypothesis.
H3 - there is a positive relationship between
cardholder’s demographic characteristics and credit
card holder’s perception towards e-payment.
Based on the previous studies, it can be identified
that there is a significant relationship between
satisfaction and perception of credit cardholders.
According to Sudhagar (2012) indicates that the
facilities offered by card issuing organizations highly
impact to cardholders’ satisfaction and this
satisfaction influence the cardholders’ perception
for e-payments. Teoh et al. (2013) highlighted the
benefits gained by using cards make more
satisfaction. Similarly, Dwarkadas (2011) mentioned
that services like wider acceptability, discount on
purchase and quick processing, popularity and
convenience services of bill payments opting have
to be increased for further satisfaction. Holder
satisfaction affects the card holder’s perception for
e-payments. If credit card holders have experience

241
on credit cards, they tend to use credit cards more
often without hesitation and fear, so that this again
encourages cardholder’s perception (Sudhagar,
2012). Based on the above evidences, followings
hypotheses are proposed:
H4 - there is a positive relationship between
cardholder’s satisfaction and credit cardholder’s
perception towards e-payment.
H5 - there is a positive relationship between
cardholder’s experience and credit cardholder’s
perception towards e-payment.
III. METHODOLOGY
An extensive review of the literature dealing with
the present investigation suggests that
demographics factors, credit card experience,
satisfaction, attitudes and demand towards the
services have a significant influence over the
perception on credit card for e-payment. As an
outcome of this review, the conceptual framework
and five hypotheses was derived. Figure 01
illustrates the hypothesized relationships between
the variables. 150 credit cardholders who were
selected from ten commercial banks in Sri Lanka
provided the data for the specific structure
questionnaire used in the survey. The questionnaire
basically contains questions relating demographic
information as well as five point likert type
questions which focused on key research variables.
Figure 01 – Conceptual framework
The total number of commercial banks located in
Colombo District is 24 as on February 2013 (Central
Bank of Sri Lanka, 2013). There are 554 commercial
bank branches belongs to various banks. Out of 554
bank branches, 10 were selected for the study by
using convenient sampling method. Then 15
respondents were taken from each selected 10
branches (15*10=150), so that sample size was 150.
Following Table 01 shows the sample framework.
Table 01 – Sample framework
Bank Ownership
State Private
BOC 2 -
Peoples Bank 2 -
Commercial Bank - 1
Sampath Bank - 1
HNB - 1
NDB - 1
Nation Trust Bank - 1
HSBC - 1
Total 4 6
Of 150 respondents, 77 were male and 73 were
female. With respect to the age of the respondents,
the majority (30.7 percent) is in 25-30 age groups.
Each category, however, includes considerable
number of respondents and it makes favourable
ground for analysing the main research variables on
the different age groups. The respondents were
identified according to their occupation.
Accordingly, the majority was Government
employees (34 percents) while only 9.3 percent
were professional. The highest formal qualification
acquired by the respondent’s shows that 39.3
percent have studied up to high school while 32
percent, 5.3 percent and 3 present have acquired
higher qualifications, basic degree, post graduate
qualification and PhD respectively.
Table 02 – Demographics Characteristics
Demographic Categories Frequency Total
Gender Male
Female 77 73
150
Age
18-25 25-30 30-40 40-50
Above 50
25 46 42 18 19
150
Occupation
Govt. employed
Private Self
employed Student
Professional
51 46 21 18 14
150
Education
High School Graduate
Post Graduate Diploma
PhD
59 48 8
30 5
150
To ensure the internal consistency of the survey
questionnaire, reliability test was performed with
Cronbach’s alpha. As Table 03 shows, each variable
H
5
H
4
H
1 H
2
H
3
Credit card
Experience
co Satisfaction for credit
cards
Attitudes toward credit
cards
Demand for credit
cards
Demographic
factors
Perception on
credit card for
e-payment
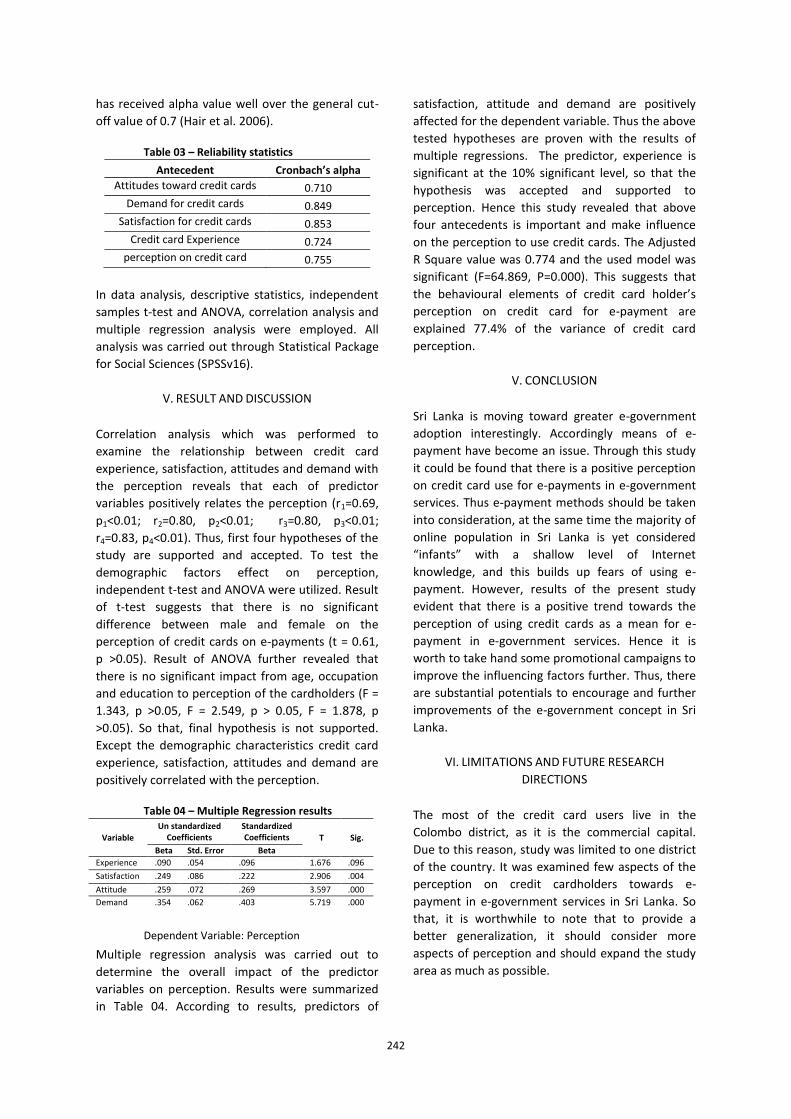
242
has received alpha value well over the general cut-
off value of 0.7 (Hair et al. 2006).
Table 03 – Reliability statistics
Antecedent Cronbach’s alpha
Attitudes toward credit cards 0.710
Demand for credit cards 0.849
Satisfaction for credit cards 0.853
Credit card Experience 0.724
perception on credit card 0.755
In data analysis, descriptive statistics, independent
samples t-test and ANOVA, correlation analysis and
multiple regression analysis were employed. All
analysis was carried out through Statistical Package
for Social Sciences (SPSSv16).
V. RESULT AND DISCUSSION
Correlation analysis which was performed to
examine the relationship between credit card
experience, satisfaction, attitudes and demand with
the perception reveals that each of predictor
variables positively relates the perception (r1=0.69,
p1<0.01; r2=0.80, p2<0.01; r3=0.80, p3<0.01;
r4=0.83, p4<0.01). Thus, first four hypotheses of the
study are supported and accepted. To test the
demographic factors effect on perception,
independent t-test and ANOVA were utilized. Result
of t-test suggests that there is no significant
difference between male and female on the
perception of credit cards on e-payments (t = 0.61,
p >0.05). Result of ANOVA further revealed that
there is no significant impact from age, occupation
and education to perception of the cardholders (F =
1.343, p >0.05, F = 2.549, p > 0.05, F = 1.878, p
>0.05). So that, final hypothesis is not supported.
Except the demographic characteristics credit card
experience, satisfaction, attitudes and demand are
positively correlated with the perception.
Table 04 – Multiple Regression results
Dependent Variable: Perception
Multiple regression analysis was carried out to
determine the overall impact of the predictor
variables on perception. Results were summarized
in Table 04. According to results, predictors of
satisfaction, attitude and demand are positively
affected for the dependent variable. Thus the above
tested hypotheses are proven with the results of
multiple regressions. The predictor, experience is
significant at the 10% significant level, so that the
hypothesis was accepted and supported to
perception. Hence this study revealed that above
four antecedents is important and make influence
on the perception to use credit cards. The Adjusted
R Square value was 0.774 and the used model was
significant (F=64.869, P=0.000). This suggests that
the behavioural elements of credit card holder’s
perception on credit card for e-payment are
explained 77.4% of the variance of credit card
perception.
V. CONCLUSION
Sri Lanka is moving toward greater e-government
adoption interestingly. Accordingly means of e-
payment have become an issue. Through this study
it could be found that there is a positive perception
on credit card use for e-payments in e-government
services. Thus e-payment methods should be taken
into consideration, at the same time the majority of
online population in Sri Lanka is yet considered
“infants” with a shallow level of Internet
knowledge, and this builds up fears of using e-
payment. However, results of the present study
evident that there is a positive trend towards the
perception of using credit cards as a mean for e-
payment in e-government services. Hence it is
worth to take hand some promotional campaigns to
improve the influencing factors further. Thus, there
are substantial potentials to encourage and further
improvements of the e-government concept in Sri
Lanka.
VI. LIMITATIONS AND FUTURE RESEARCH
DIRECTIONS
The most of the credit card users live in the
Colombo district, as it is the commercial capital.
Due to this reason, study was limited to one district
of the country. It was examined few aspects of the
perception on credit cardholders towards e-
payment in e-government services in Sri Lanka. So
that, it is worthwhile to note that to provide a
better generalization, it should consider more
aspects of perception and should expand the study
area as much as possible.
Variable
Un standardized Coefficients
Standardized Coefficients T Sig.
Beta Std. Error Beta
Experience .090 .054 .096 1.676 .096
Satisfaction .249 .086 .222 2.906 .004
Attitude .259 .072 .269 3.597 .000
Demand .354 .062 .403 5.719 .000
243
REFERENCE
Afakli, OV. (2007). “Motivating factors of credit card
usage and ownership: Evidence from northern
Cyprus”, Journal of Investment Management and
Financial Innovations, Vol. 4, Issue 4, 133-143 pp.
Ahmed, A., Amanullah, A. and Hamid, M. (2009).
“Consumer Perception and Attitude towards Credit
Card Usage: A Study of Pakistani Consumers”,
Journal of Comparative International Management,
Vol. 12, No.01, 47-57 pp.
Amin, H. (2007). “An analysis of mobile credit card usage
intentions”, Information Management & Computer
Security, Vol. 15 Issue: 04, 260-269 pp.
Arias, JC., Mille, R. (2010). “Market Analysis of Student’s
Attitudes about Credit Cards”, Business Intelligence
Journal, Vol. 3 No.01, 23-36 pp.
Ausubel, LM. (1991). “The Failure of Competition in the
Credit Card Market”, The American Economic
Review, Vol. 81, 50–81 pp.
Amiirah, B. (2013). “Electronic Payment Systems”,
Available from
http://www.studymode.com/essays/Electronic-
Payment-Systems-1518237.html, Accessed 03 Sep
2013.
Central Bank of Sri Lanka (2011). “Annual Report: Credit
Card Operations by Licensed Commercial Banks”,
Central Bank of Sri Lanka, 165-186 pp.
Central Bank of Sri Lanka (2013). “Payments Bulletin”, Vol.
13, No. 03.
Central Bank of Sri Lanka (2012). “Annual Report”, Central
Bank of Sri Lanka.
Chakravorti, S. and Emmons, WR. (2001). “who pays for
credit cards?, Emerging Payments Occasional Paper
Series”, Federal Reserve Bank of Chicago.
Clyde, I. (2008). “The impact of credit card advertising on
consumer decision-making and behavior”,
Department of Justice – Consumer Affairs Victoria.
Christos, G., Xenia, Z., Antonis, R., Panagiotis, K., Jain, A.,
Gangadharan, G. R., & Yehia, T. (2013). “Applying
Open Innovation Strategies to eGovernment for
Better Public Services”, In J. Gil-Garcia (Ed.), E-
Government Success Factors and Measures:
Theories, Concepts, and Methodologies, 308-331 pp.
Danes, SM., and Hira, TK. (2009). “Knowledge, Beliefs, and
Practices in the Use of Credit Cards”, Home
Economics Research Journal, Vol. 18, Issue 3, 223–
235 pp.
Davis, FD., Bagozzi, RP., and Warshaw, P R. (1989). "User
Acceptance of Computer Technology: A Comparison
of Two Theoretical Models”, Management Science,
Vol. 35, 982-1003 pp.
Dwarkadas, JR. (2011). “Consumers perspectives towards
Credit Card”, International Referred Research
Journal, Vol. 03, Issue 31, 47-49 pp, ISSN- 0974-2832.
Fishbein, M., and Ajzen, I. (1975). “Belief, Attitude,
Intention, and Behavior: An Introduction to Theory
and Research”, MA: Addison-Wesley.
Gan, LL., Maysami, RC. and Koh, HC. (2005). “Profiles,
Use, and Perceptions of Singapore Multiple Credit
Cardholders”, Economic Growth Centre, Working
Paper Series.
Gil-Garcia, JR., and Pardo, TA. (2005). “E-government
success factors: Mapping practical tools to
theoretical foundations”, Government Information
Quarterly, vol. 22, 187-216 pp.
Gunawardana, KD. (2007). “Current Status of Information
Technology and Its Issues in Sri Lanka”, International
Journal of The Computer, the Internet and
Management Vol. 15, No. 03, 1-25 pp.
Hair, J., Black, W., Babin, B., Anderson, R. & Tatham, R.
(2006), Multivariate Data Analysis, 6 edn, Pearson
Educational International -Prentice Hall, Upper
Saddle River- New Jersey.
Huang, and Tan, (2007). “Estimating the Demand for
Credit Card: A Regression Discontinuity Approach”,
Available from https://editorialexpress.com/cgi-
bin/conference/download.cgi?db_name=IIOC2008&
paper_id=355, Accessed 26 April 2014.
Jusoh, ZM., and Lin, LY. (2012). “Personal Financial
Knowledge and Attitude towards Credit Card
Practices among Working Adults in Malaysia”,
International Journal of Business and Social Science,
Vol. 03, No. 07, 176-185 pp.
Jansorn, T., Kiattisin, S., and Leelasantitham, A. (2013).
“Study of acceptance factors for electronic payment
244
services”, Proceedings of International Conference
on Information and Social Science and International
Symposium on Marketing, Logistics, and Business.
Khalid, J., Butt, HS., Murtaza, M. and Khizar, U. (2013).
“Perceived barriers in the adoption & usage of credit
cards in pakistan banking industry”, International
Review of Management and Business Research, Vol.
2 Issue.01.
Kurtuluş, k. and Nasir, S. (2006). “Consumer Behavior of
Credit Card Users In An Emerging Market”, 6th
Global
Conference on Business and Economics, Gutman
Conference Center, USA , ISBN: 0-9742114-6-X.
Lin, S. and Wang, E. (2013). “Application of technology
acceptance model to investigate influential factors
on students' intention to use carbon footprint
calculator”, Proceedings of International Conference
on Information and Social Science and International
Symposium on Marketing, Logistics, and Business.
Mansfied, MP., Pinto, MB., and Robb, CA. (2013).
“Consumers and Credit cards: A review of the
empirical literature”, Journal of Management and
Marketing Research, Vol 12, 1-26 pp.
Maya, and Rofi, SR. (2011). “Affecting the Behaviour of
University Community to Use Credit Card”,
International Research Journal of Business Studies,
Vol. 04, No. 03, 217 – 228 pp.
Merikle, PM., and Joordens, S. (1997). “Parallels between
Perception without Attention and Perception
without Awareness”, Consciousness and Cognition,
Vol. 06, 219–236 pp.
Muhayiddin, M., Ahmed, E., and Ismail, H. (2011).
“Technology Acceptance of a Gold Dinar Based
Electronic Payment System”, iBusiness, Vol. 03 No.
03, 295-301 pp, doi: 10.4236/ib.2011.33039.
Ozkan, S., Bindusara, G. and Hackney, R. (2010).
“Facilitating the adoption of e-payment systems:
theoretical constructs and empirical analysis”,
Journal of Enterprise Information Management, Vol.
23, No. 03, 305-325 pp.
Pasupathinathan, V. (2013). “Notes on Electronic Payment
Systems”, ipsa scientia potestas est, Available from
http://vkrishnan.com/research/epayments.html
Accessed on 29 April 2014.
Sudhagar, S. (2012). “A Study on Perception and
Awareness on Credit Cards among Bank Customers
in Krishnagiri District”, IOSR Journal of Business and
Management, Vol. 02, Issue 03, 14-23 pp, ISSN: 2278
- 487X.
Sari, M., Rofaida, R. (2011). “Factors Affecting the
Behavior of University Community to Use Credit
Card”, International Research Journal of Business
Studies, Vol. 04, No 03, ISSN: 2089-6271, 217 – 228
pp.
Syamsuddin, I. (2011). “Evaluation of e-government
initiatives in developing Countries: an itposmo
approach”, ECISI Journals, International Research
Journal of Applied and Basic Sciences. Vol. 02, No.
12, 439-446 pp., Available from
http://www.ecisi.com.
Schiffman, Kanuk, and Das, (2006). “Chapter 5 Consumer
Perception - Consumer Behaviour”, Canadian
Edition, Pearson Education Canada Inc.
Sumanjeet, S. (2009), “Emergence of payment system in
the age of electronic commerce: the state of art”,
Available from
http://globip.com/pdf_pages/globalinternational-
vol2-article2.pdf, Accessed 12 Jan 2014.
Teoh, WMY., Chong, SC., Lin, B., Chua, JW. (2013).
“Factors affecting consumers ‘perception of
electronic payment an empirical analysis”, Internet
Research, Emerald Group Publishing Limited, Vol. 23,
No.0 4, 465-485 pp.
Wickramasinghe, V., Gurugamage, A. (2009). “Consumer
credit card ownership and usage practices: empirical
evidence from Sri Lanka”, International Journal of
Consumer Studies, Vol. 33 436-47 pp.
Wickramasinghe, V. and Gurugamage, A. (2012). “Effects
of social demographic attributes, knowledge about
credit cards and perceived lifestyle outcomes on
credit card usage”, International Journal of Consumer
Studies, Vol. 36, 80–89 pp. doi: 10.1111/j.1470-
6431.2010.00993.x.
Yildiz, M. (2007). “E-government research: Reviewing the
literature, limitations, and ways forward”,
Government Information Quarterly, Vol. 24, 646-665
pp.

245
BIOGRAPHY OF AUTHOR
HMBP Ranaweera is doctoral candidate
in e-government, School of Public
Administration, Huazhong University of
Science and Technology, Wuhan, PR
China. He holds MBA from Rajarata
University of Sri Lanka and Bachelor in Estate Management
and Valuation from University of Sri Jayewardenepura, Sri
Lanka. His research interests are in the field of Information
System, Management Information System and e-
government.
246
Determinants of the Factors Affecting the Customer Satisfaction in Super Market Industry in Sri Lanka
SP Pubudu Pathirana1, Lakshmi Udeshika Ranwala2
1
204, Siyane Road, Gampaha, Sri lanka 267/C
, Wickramarachchi Mawatha, Yakkala, Sri lanka
Abstract— customer satisfaction and service quality
are crucial factors when defining organizational
success. The winning approach in brining success is
to serve the best quality to the customers. The
current situation requires improvements of
customer satisfaction of the supermarket industry
of Sri Lanka have come under limelight due to the
competition where super markets are trying to gain
competitive advantage through the human factor.
Excellent customer satisfaction does not only mean
higher profits but also acts as a challenge for the
employees to perform to their maximum abilities to
meet the competition. By serving customers with
the best quality products, organizations can
maintain and expand their customer base and this
will cause an increase in customers’ confidence and
competitive advantages among the market leaders.
This study examines the effects of various factors of
the supermarket industry which affects customer
satisfaction.
The purpose of the study is to determine the factors
affecting customer satisfaction in the super market
Industry in Sri Lanka. Learning of this study would
help to identify the areas which are need to be
improved in order to improve overall customer
satisfaction and service quality in order to gain
customer satisfaction.
In this research paper, the relevant data were
gathered through a self-administered questionnaire
from 300 respondents. Univariate descriptive
analysis has been carried out. Chi-square test and
Fisher’s Exact test has been carried out in doing
hypothesis testing. Multinormial logistic regression
approach has been used in data related to customer
satisfaction.
It of great importance to understand how to satisfy
customers as it seems to be the key success factor in
modern organizations. Service quality, knowledge
of the staff, support given by the staff,
recommendations and the attire of the staff
variables were significant in the model. The
recommendations are given to improve the service
quality in order to increase the customer
satisfaction which helps the super markets to
attract more customers in future.
Keywords— Customer satisfaction, Multinormial
logistic regression approach, univariate analysis,
Super Market Industry
I. INTRODUCTION
Sweeping the traditional retailing and grocery
concept, super markets are emerging with the
concept of “Mega Stores” by providing all the goods
shopper demands in one store at attractive
discounted prices (Stanton 2007). “The emergence
of supermarkets, urbanization, income increase,
high quality bulk procurement, and increased
female participation in labor force have created a
new demand pattern, shifting the focus towards
continuous supply of high quality, value added
products with improved processing, packaging and
labeling” (Samarthuga A 2006 15).
Cargills Food City, Keells Super and Arpico are the
three leading super market chains of the country
and they have started expanding aggressively.
Other than these three there are Sunup (Laugfs)
super, Sentra, Sathosa and small super markets
which are owned by entrepreneurs.
Currently supermarkets contribute to twelve
percent of the Sri Lankan economy by providing a
unique contribution to the national development.
516 supermarkets are being operated in the
country which can be categorized as supermarkets,
hypermarkets and convenience stores. Cargills Food
City operates 213 supermarkets, Arpico Super
Centre functions 10 hyper markets, and Keells
super has 48 super markets and the Sathosa
247
controls a convenience store network of 250 stores.
(Sri Lanka's Supermarket Trade to Grow at an
unprecedented level | News360.lk)
Super market segment plays a key role in the lives
of the people in many ways. Maintaining
sustainable supply chain to achieve service quality
and customer satisfaction has become overall goal
of the super market industry.
II. LITERATURE REVIEW
Howardell’s stated that ‘customers want it all
and they want it now’ (Howardell, 2003). This
statement clearly describes the competitive nature
of supermarkets. Due to the increasing nature of
supermarket industry there are plenty of
supermarkets within a selected geographical area.
Super markets are located within walking distance
which reminds the urgency of maintaining service
quality and customer satisfaction. If supermarkets
fail to satisfy customers and to deliver quality
service then it will automatically shift customers to
their competitors (Codrington, 2002). It reveals that
super markets are highly depending on the two
factors which are called service quality and
customer satisfaction. It is apparently difficult to
survive in the supermarket industry without
satisfying those two key factors.
Several studies highlight five important dimensions
of service quality in retail sector which have a direct
impact on profit. They are Physical aspect,
reliability, personal interaction, problem solving
and ps. Physical appearance of the store, facility
and well managed layout helps to gain competitive
edge and to influence customer satisfaction
(Dabholkar et al, 1996). According to (Abu 2004)
and (Fisher et al, 2006) well figured supermarket
layout is easily navigating customers with less
search time resulting customer satisfaction which
leads to the customer retention. Reliability simply
implies keeping promises where supermarket’s
main intention is to make available products when
required (Dabholkar et al (1996). Michel (2001)
stated that supermarkets should response
customer’s problems on time and must handle
return items in a correct manner while having
continuous system to identify customer related
problems on stores. Store policy which includes
loyalty programs, credit facilities, operating hours,
parking facilities and other additional services have
a direct impact on service quality of the
supermarket. According to all these facts it reveals
that supermarket with high level of service quality
maintain customer satisfaction while poor level of
service quality resulting dissatisfied customers.
Therefore supermarkets must highly value loyal
customers those who are intentionally choose their
stores over their competitors irrespective of the
promotions or offerings at the competitor’s
premises (Levy and Weitz 2001). Understanding of
consumer behavior is really complex and
comprehensive processes that involve an
evaluation of service quality and consumer
satisfaction (Cronin et al. 2000). Even though
customer satisfaction and service quality have an
influence on store loyalty (Bennett and Rundle-
Thiele 2004), those two factors are not sufficient to
ensure the loyalty (Alonso 2000).
So it is the responsibility of supermarkets to
identify what customer wants and deliver it to them
with more value which they did not expect, to have
loyalty customers forever. Zairi (2000) point out
many studies shows repeat purchases and loyalty
are two main benefits offered by satisfied
customers to the supermarket industry and also
they attained to recommend super market to
others when they are satisfied with the services
Furthermore this statement is sustained by La
Barbera & Mazarsky (1983) who also viewed
customer satisfaction have an considerable impact
on customer repurchase intentions whereas
dissatisfaction led customers to discontinuation of
purchase. Additionally dissatisfied customers are
resulting discontinue purchasing of goods and
services and engage in a negative word of mouth
(Hoyer & MacInnis, 2001).
Customer’s impression on the supermarket will
depend on the level of quality service that they
provided. Reputation of the supermarket will
depend on numerous factors. According to Berman
and Evans (2005) overall image of the supermarket
is influenced by store location, merchandise and
physical attributes, pricing, firm’s placing, shopping
experience, customer service, target market,
promotion tools (such as advertising, public
relations, personal selling, sales promotion) and
community service. Further he point out that a
retailer's image depends heavily on its
‘atmosphere’ or the psycho-logical feeling a
customer gets when in that retail outlet.

248
III. METHODOLOGY
In this research paper, the relevant data were
gathered through a self-administered questionnaire
from 300 respondents.
Descriptive analysis has been carried out to check
the relationship between response variable and
other explanatory variables.
Hypothesis testing has been carried out using
fisher’s exact test as it is more practical for small
sample sizes. Due to the difficulty faced in
maintaining minimum expected cell count in
performing Chi square test, Fisher’s exact test has
been carried out for some of the variables.
Multinomial logistic regression model has been
used to build a statistical model. In doing regression
modelling variables has been selected with respect
to the significance that they have shown in
hypothesis testing. Forward selection method has
been used in modelling.
Goodness of fit test and Pseudo R-square test has
been carried out for model diagnoses to detect the
adequacy of the model.
Likelihood ratio test has been used in checking the
significance of the explanatory variables in the
model and Odds ratio has been used in interpreting
the model. In statistics, a likelihood ratio test is
used to link the fit of two models. Omnibus test is a
statistical test that is designed to distinguish any of
a broad range of departures from a specific null
hypothesis.
IV. ANALYSIS AND INTERPRETATION
As per the result obtained, out of 300 respondents
46.7 percent are Cargills Food city customers where
24 percent use Keells super while 21.3 percent
shopped Arpico super centers. Only 7 percent of
respondents visit Laugf sun up. Remaining 1
percent of people responded as other super market
consumers.
Figure 1 : Preferences percentage for Super markets in
Colombo district
Below hypotheses has been checked using Fisher’s
exact test;
Ho: overall customer satisfaction of supermarket is
independent from the ith
variable
H1: overall customer satisfaction is depending on
the ith
variable
Table 1. Results of Hypothesis testing
i Variable name Test
statistic p- value
1. Staff appears to know about the
products 83.536 .000
2. Individual attention 69.854 .000
3. Availability of products 62.456 .000
4. Reputation 58.367 .000
5. Recommend the supermarket 53.286 .000
6. Competitive prices 48.57 .000
7. Overall service quality 45.568 .000
8. Fresh vegetables and fruits 37.403 .000
9. Appropriate info on sales
promotions 37.314 .000
10. Staff always helpful 30.101 .000
11. Products are appropriately
displayed 29.867 .000
12. Punctual info on sales
promotions 29.714 .000
13. Sell quality products 26.802 .000
46.7
24
21.3
7
0
5
10
15
20
25
30
35
40
45
50
CA
RG
ILLS
FO
OD
C
ITY
KEE
LLS
SUP
ER
AR
PIC
O
SUP
ERC
EN
TRES
LAU
GFS
SU
NU
P
OTH
ER
per
cen
tage
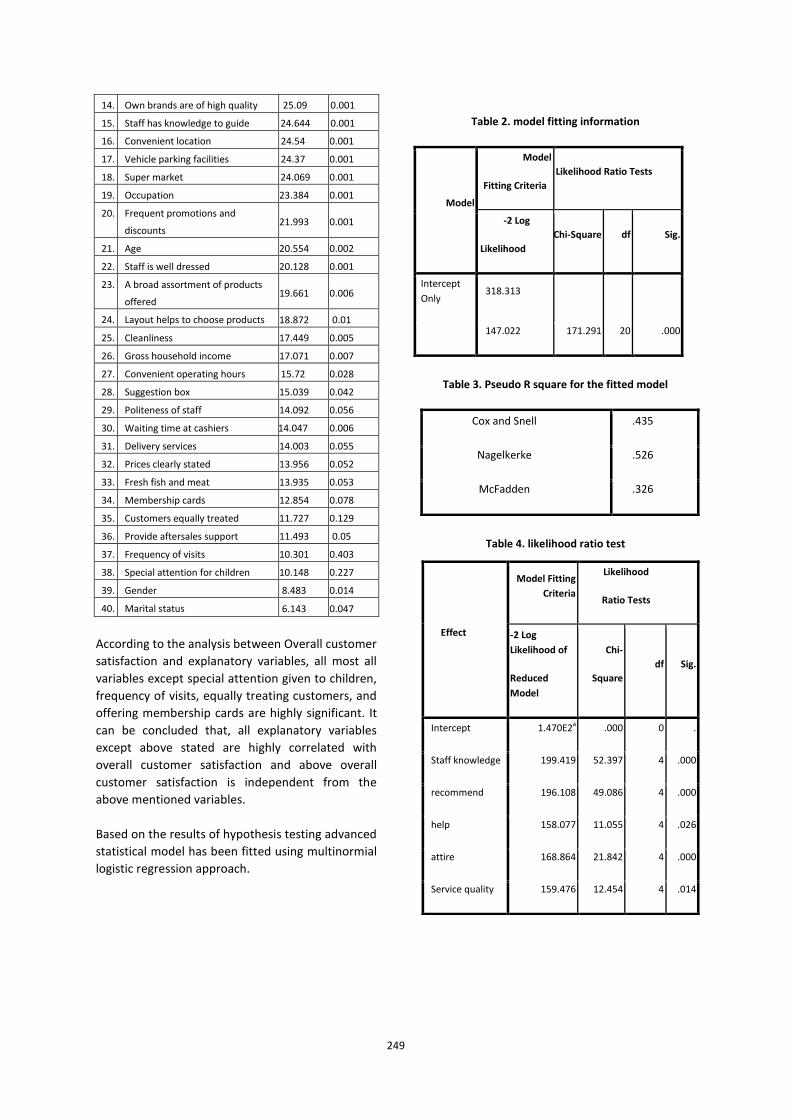
249
14. Own brands are of high quality 25.09 0.001
15. Staff has knowledge to guide 24.644 0.001
16. Convenient location 24.54 0.001
17. Vehicle parking facilities 24.37 0.001
18. Super market 24.069 0.001
19. Occupation 23.384 0.001
20. Frequent promotions and
discounts 21.993 0.001
21. Age 20.554 0.002
22. Staff is well dressed 20.128 0.001
23. A broad assortment of products
offered 19.661 0.006
24. Layout helps to choose products 18.872 0.01
25. Cleanliness 17.449 0.005
26. Gross household income 17.071 0.007
27. Convenient operating hours 15.72 0.028
28. Suggestion box 15.039 0.042
29. Politeness of staff 14.092 0.056
30. Waiting time at cashiers 14.047 0.006
31. Delivery services 14.003 0.055
32. Prices clearly stated 13.956 0.052
33. Fresh fish and meat 13.935 0.053
34. Membership cards 12.854 0.078
35. Customers equally treated 11.727 0.129
36. Provide aftersales support 11.493 0.05
37. Frequency of visits 10.301 0.403
38. Special attention for children 10.148 0.227
39. Gender 8.483 0.014
40. Marital status 6.143 0.047
According to the analysis between Overall customer
satisfaction and explanatory variables, all most all
variables except special attention given to children,
frequency of visits, equally treating customers, and
offering membership cards are highly significant. It
can be concluded that, all explanatory variables
except above stated are highly correlated with
overall customer satisfaction and above overall
customer satisfaction is independent from the
above mentioned variables.
Based on the results of hypothesis testing advanced
statistical model has been fitted using multinormial
logistic regression approach.
Table 2. model fitting information
Model
Model
Fitting Criteria
Likelihood Ratio Tests
-2 Log
Likelihood
Chi-Square df Sig.
Intercept
Only 318.313
Final 147.022 171.291 20 .000
Table 3. Pseudo R square for the fitted model
Table 4. likelihood ratio test
Cox and Snell .435
Nagelkerke .526
McFadden .326
Effect
Model Fitting
Criteria
Likelihood
Ratio Tests
-2 Log
Likelihood of
Reduced
Model
Chi-
Square
df Sig.
Intercept 1.470E2a .000 0 .
Staff knowledge 199.419 52.397 4 .000
recommend 196.108 49.086 4 .000
help 158.077 11.055 4 .026
attire 168.864 21.842 4 .000
Service quality 159.476 12.454 4 .014

250
Table 5. parameter estimates for satisfied group
description B Std.
error
Wald df Sig
Intercept 4.305 1.345 10.254 1 .001
Staff knowledge=1 -1.612 .699 5.313 1 .021
Staff knowledge=2 34.454 .468 5.420E3 1 .000
Staff knowledge=3 0b . . 0 .
Recommendation=1 -21.199 2446.313 .000 1 .993
Recommendation=2 -4.169 .777 28.789 1 .000
Recommendation=3 0b . . 0 .
Help=1 -2.411 1.062 5.156 1 .023
Help=2 -.967 1.127 .736 1 .391
Help=3 0b . . 0 .
Attire=1 .079 2.052 .001 1 .969
Attire=2 37.640 6556.323 .000 1 .995
Attire=3 0b . . 0 .
Service quality=1 1.641 .951 2.977 1 .084
Service quality=2 -.356 .943 .142 1 .706
Service quality=3 0b . . 0 .
Table 6.parameter estimates for neutral group
description B Std.
error
Wald df Sig
Intercept 3.031 1.326 5.226 1 .022
Staff knowledge=1 .519 .714 .527 1 .468
Staff knowledge=2 34.845 .000 . 1 .
Staff knowledge=3 0b . . 0 .
Recommendation=1 -18.723 2446.313 .000 1 .994
Recommendation=2 -2.316 .705 10.794 1 .001
Recommendation=3 0b . . 0 .
Help=1 -2.556 1.055 5.873 1 .015
Help=2 -1.528 1.112 1.889 1 .169
Help=3 0b . . 0 .
Attire=1 -20.506 .000 . 1 .
Attire=2 35.554 6556.323 .000 1 .996
Attire=3 0b . . 0 .
Service quality=1 1.007 .902 1.247 1 .264
Service quality=2 -.127 .870 .021 1 .884
Service quality=3 0b . . 0 .
According to the table 2, in this analysis p-value of
the model chi square is less than 0.05. Hypothesis
of the model is as stated below.
Ho: There is no difference between the model
without independent variables and the model with
independent variables
H1: There exist difference between the model
without independent variables and the model with
independent variables
As the test is significant, the existence of a
relationship between the independent variables
and the dependent variable was supported.
Fitted model can be stated as follows for the
satisfied group;
Log (p1/p3) = 4.305 – 1.612 (Staff knowledge = 1) +
34.454 (staff knowledge = 2) – 21.199
(recommended = 1) – 4.169 (recommended = 2) -
2.411 (help = 1) - 0.967 (help = 2) + 0.079 (attire =
1) + 37.640 (attire = 2) + 1.641 (service quality = 1) –
0.356 (service quality = 2)
Fitted model can be stated as follows for the
neutral group;
Log (p2/p3) = 3.031 – 0.519 (Staff knowledge = 1) +
34.845 (staff knowledge = 2) – 18.723
(recommended = 1) – 2.316 (recommended = 2) -
2.556 (help = 1) – 1.528 (help = 2) – 20.506 (attire =
1) + 35.554 (attire = 2) + 1.007 (service quality = 1) –
0.127 (service quality = 2)
Model can be interpreted as follows;
When compared to customers those who are
satisfied about the knowledge of the staff;
-Satisfaction levels of customers those who
said staff knowledge is at satisfactory level is
more likely to be satisfied about supermarkets.
-Satisfaction level of customers those who said
staff knowledge is at dissatisfactory level is less
likely to be satisfied about supermarkets.
When compared to the customers those who are
recommending supermarkets;
-Satisfaction level of customers those who
neither recommended nor not recommended
are less likely to be satisfied about
supermarkets.
-Satisfaction levels of customers those who not
recommended supermarkets are less likely to
be satisfied about supermarkets.
When compared to the customers those who are
satisfied about the support given by the staff;
-Satisfaction level of customers those who are
neutral about the support given by the staff are
less likely to be satisfied about the
supermarkets.
251
-Satisfaction level of customers those who said
dissatisfied about the support given by the
staff are less likely to be satisfied about the
supermarkets.
When compared to the customers those who are
satisfied about the attire of the staff;
-Satisfaction level of customers those who are
neutral about the attire of the staff are less
likely to be satisfied about the supermarkets.
-Satisfaction level of customers those who said
dissatisfied about the attire of the staff are less
likely to be satisfied about the supermarkets.
When compared to the customers those who are
satisfied about the service quality;
-Satisfaction level of customers those who are
neutral about the service quality are less likely
to be satisfied about the supermarkets.
-Satisfaction level of customers those who are
dissatisfied about the service are less likely to
be satisfied about the supermarkets.
V. GENERAL DISCUSSION AND CONCLUSIONS
According to the Pearson chi square test for
association and Fisher’s exact test for association,
some of the explanatory factors were identified as
significant and proved there is a relationship
between customer satisfaction and those
explanatory variables. Convenient location,
individual attention on customers, staff knowledge
about the products, availability of desired products,
reputation of the super market, competitive prices
of goods, service quality, fresh vegetables and fruits
offered by super market, providing appropriate
information on sales promotion, helpful staff,
appropriately displaying products on shelves, give
punctual information on sales promotion, sell
quality products, offer high quality of own brands,
vehicle parking facilities, cleanliness, available
broad assortment of products, convenient
operating hours, handling customer complaint in
efficient manner, frequent promotions, attire of the
staff (well dressed), age, income and occupation of
the respondents and layout of the supermarkets
are identified as significant factors.
Multinomial logistic regression model has identified
five factors which are highly significant namely
“staff knowledge about the products and guide
people, attire of the staff, helpful staff, service
quality and recommendation or the positive word
of mouth about the super market”. Recommendation is the positive word of mouth.
According to the results recommendation has a
significant impact on the overall customer
satisfaction. If one customer recommend his/her
preferred super market to his/her friend it indicates
the loyalty and their satisfaction towards the super
market. Bad word of mouth leads to the loss of the
business. There for super markets must ensure to
keep promises to their customers for sustainable
future
Staff knowledge about the products, their attire
(well-dressed staff) and helpfulness of staff are also
most significant factors that affect to the customer
satisfaction. These factors indicate the standard of
the supermarket which people are highly concern.
Staff needs to be educated about the products as
well as the good manners to attract customers in
professional way. Now a day’s customers are more
interested in looking user friendly environment for
shopping purposes. It helps customers to save their
valuable time. But staff should not be annoying to
customers. Most of the respondents stated in
questionnaires staff appears annoying to customers
due to their over helpfulness and also some staff
members force customers to buy products
according to staff guidance. Therefor super markets
need to be considering these factors when training
their employees.
The research findings depict that, service quality,
availability of products, price tags are clearly
indicates, provide appropriate and punctual
information on sales promotions, availability of
parking facilities, good reputation, cleanliness,
convenient location and operation hours, Staff
knowledge about the products, their attire (well-
dressed staff) and helpfulness of staff and
recommendation are the most significant.
However layout of the super market, after sales
support, delivery services, special attention for
children (game zones), and freshness of meats, and
fish, membership cards, waiting time, gender,
marital status, income and operating hours may
either have no direct impact upon the customer
satisfaction which need to be found out by future
research work.

252
Finally the research study supported to outline the
pros and cons of super markets for consumers, for
industry and for the country in a detailed manner.
Customers are the most benefitted segment from
the super markets. Due to convenient operating
hours customers are able to save their valuable
time. They do not want to keep separate time for
shopping with this concept. It allows them to shop
even after their works. And also prices offered by
super markets are affordable for middleclass
people too. Earlier there had been a period which
super markets were limited to high class people.
But with the changes of the industry that concept
also has been changed by providing opportunity to
each and every one.
REFERENCES
Abu, N. K. 2004. Service quality dimensions: a study on
various sizes of grocery retailers--a conceptual
paper. Journal of Proceeding of IBBC 2004, pp.
633--642.
Abubakar, B., Mavondo. and Clulow, V. 2001. Customer
satisfaction with supermarket retail shopping.
Anantadjaya, S., Walidin, A., Sari, E. and Nawangwulan, I.
2007. Consumer Behavior, Supply Chain
Management and Customer Satisfaction: An
Investigative Study in Small and Medium
Enterprises.
Beneke, J., Hayworth, C., Hobson, R. and Mia, Z. 2012.
Examining the effect of retail service quality
dimensions on customer satisfaction and
loyalty: The case of the supermarket shopper.
Acta Commercii, 12 (1), pp. 27—43
Chen, Y., Spohrer, J. and Lelescu, A. 2008. Three factors
to sustainable service system excellence: A case
study of service systems. 2 pp. 119--126.
Chernetskaya, J. and Xiao, J. 2010. Measuring Retail
Service Quality in Sport Stores by Using RSQS
Model: A case study of Stadium in Helsinki.
Chou, C. 2004. Development of a comprehensive supply
chain performance measurement system: a
case study in the grocery retail industry.
Dooley, F. J., Roucan, M. and King, R. P. 2004. ECR and
the Importance of Collaboration for
Supermarkets. (20368).
Du Plooy, A., De Jager, J. and Van Zyl, D. 2013. Drivers of
perceived service quality in selected informal
grocery retail stores in Gauteng, South Africa.
Southern African Business Review, 16 (1), pp.
94--121.
Gunasekaran, A., Patel, C. and Mcgaughey, R. E. 2004. A
framework for supply chain performance
measurement. International journal of
production economics, 87 (3), pp. 333--347.
Haque, M. and Islam, R. 2013. Effects of Supply Chain
Management Practices on Customer
Satisfaction: Evidence from Pharmaceutical
Industry of Bangladesh. Global Business &
Management Research, 5.
Iimraipur, O. 2012. OPEP: Effect Of Supply Chain
Management On Customer Satisfaction.
[Online] Available at:
http://opepiimraipur.blogspot.com/2012/08/ef
fect-of-supply-chain-management-on.html
[Accessed: 5 Nov 2013].
Kheng, L. L., Mahamad, O., Ramayah, T. and Mosahab, R.
2010. The impact of service quality on
customer loyalty: A study of banks in Penang,
Malaysia. International Journal of Marketing
Studies, 2 (2), p. 57.
Kimani, S. W., Kagira, E. K., Kendi, L. and Wawire, C. M.
2012. Shoppers Perception of Retail Service
Quality: Supermarkets versus Small
Convenience Shops (Dukas) In Kenya. Journal of
Management and Strategy, 3 (1), p. 55.
Muji'C, N. and LegVcevi'C, J. 2006. A Framework for
Determining and Prioritizing Critical Factors in
Delivering Quality Services.
Perera, N. 2004. MEASURING SERVICE QUALITY IN
DEVELOPING RETAIL STRATEGIES FOR SUPER
MARKETS IN SRI LANKA. [Report] Colombo.
Singh, S. K. and Singh, N. A Chronological Study of Service
Quality Research on Retail Sector.
BIOGRAPHY OF AUTHORS
1S.P. Pubudu Pathirana is a graduand
of BSc in International Transportation
Management and Logistics offered by
Dalian Maritime University and
facilitated by faculty of Management
CINEC Maritime Campus.

253
2Lakshmi Udeshika Ranwala is a
statistics lecturer and Course
coordinator for BSc ITML
programme of Faculty of
Management, CINEC Maritime
Campus. Her research interests
include statistics modeling and
Operational research.
254
Online Shopping Behaviour of Young Adults in Higher Education Sector: How Brand Matters
WM Ruvini M Weerasinghe1, Anuradha Peramunugamage2
1
Department of Interdisciplinary studies, Faculty of Information Technology, University of Moratuwa, Katubedda, Moratuwa, Sri Lanka
2Faculty of Engineering, University of Moratuwa, Katubedda, Moratuwa, Sri Lanka
Abstract— The purpose of this study is to find out
the online shopping behaviour of Sri Lankan young
adults with special emphasis on brand loyalty.
Building and maintaining brand loyalty is a vital
part of establishing sustainable competitive
advantage. Consumers become committed to a
particular brand and make repeat purchases over
time if they are loyal to that brand. In online
shopping environment, consumers have no physical
touch to the products and services but prices among
different brands can be easily compared with each
other. For this study, a structured questionnaire was
used to gather data from 100 young adults from the
University of Moratuwa, Sri Lanka. Four products
that young adults frequently purchase were
selected. This paper assesses the relationship
between brand loyalty and brand satisfaction. A
clear relationship could be established between
proposed factors of brand loyalty and brand
satisfaction. Further, this study attempts to
establish a relationship between the average price
paid and brand loyalty. However, a clear
relationship could not be established between
them. In addition, the relative importance of
“brand” when purchasing the selected products
online is assessed.
Keywords— online shopping, brand loyalty, brand
satisfaction, young adults
I. INTRODUCTION
Online shopping can be identified as one of the
most rapidly growing forms of trade in Sri Lanka.
Traditionally, consumers go to stores to inspect the
goods before they buy them. In online shopping,
customers need not go to stores, but they can
make choices on the basis of what they see on the
computer screen. Even though there are some
limitations in online shopping such as security
problems, shipping costs, defective items etc., it
saves time; price comparisons can be done; and
also shoppers can purchase the goods at any time
of the day. Growing numbers of consumers shop
online to purchase goods and services, gather
product information or even browse for enjoyment.
Online shopping environments are therefore
playing an increasing role in the overall relationship
between marketers and their consumers
(Demangeot & Broderick, 2007).
A. Online Shopping
Online shopping holds a great potential for youth
marketers. According to Vrechopoulos et al. (cited
in Alam et al. 2008) the young are the main buyers
who buy products online. Another study by Sorce et
al. (2005) have found that young consumers search
for more products online and they are more likely
to agree that online shopping is more convenient.
Alam, et. al (2008) have said that since the young
consumers are playing an increasing role in online
shopping and if the online retailers know the
factors affecting online shopping, they can develop
their marketing strategies to convert potential
buyers to actual ones. Therefore, it is worth
studying the role played by the brand loyalty when
young adults shop online.
B. Brand Loyalty in Online Shopping
A consumer is considered as a brand loyal
whenever a consumer perceives that a brand is
offering him the right product features and the
desired level of quality and hence repeatedly makes
a conscious or subconscious repurchase of that
particular brand (Agraval & Siddharth, 2010). Since
the consumers cannot touch and feel the product
online, they should be very careful when
purchasing goods online. One solution is to gain the
consumer’s confidence through brand loyalty. In
contrast, consumers could easily compare the
prices across the shops/brands in online shopping.
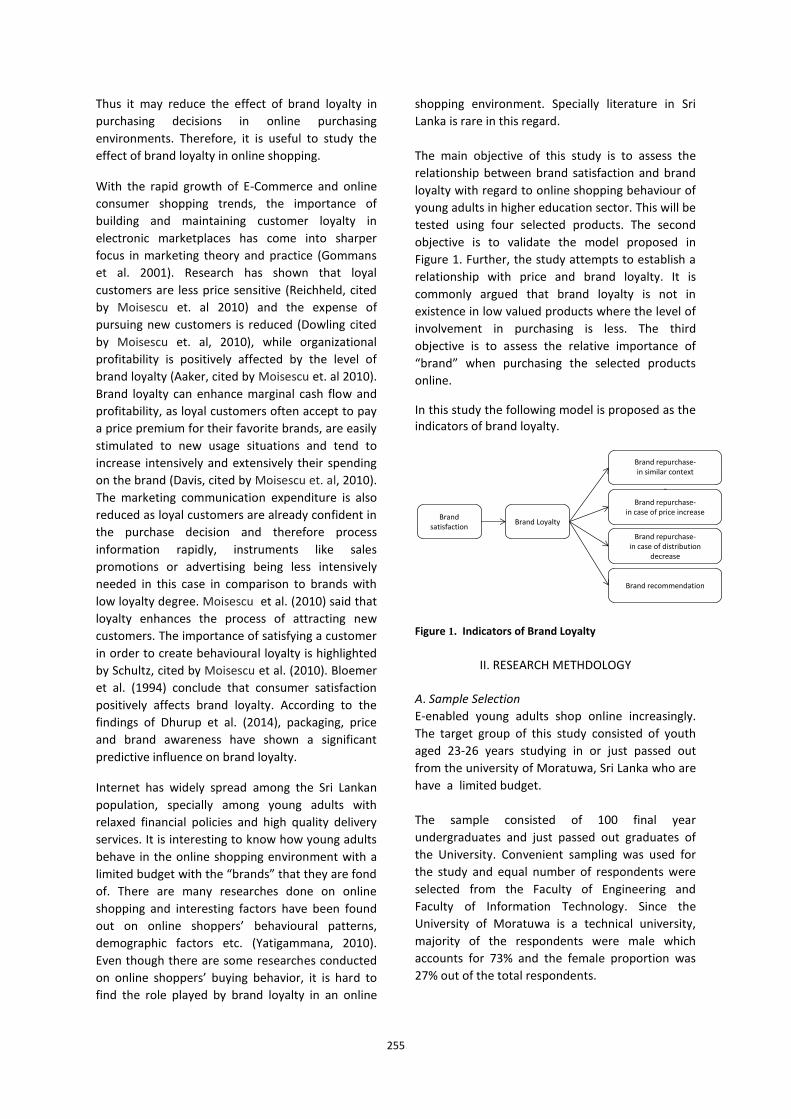
255
Thus it may reduce the effect of brand loyalty in
purchasing decisions in online purchasing
environments. Therefore, it is useful to study the
effect of brand loyalty in online shopping.
With the rapid growth of E-Commerce and online
consumer shopping trends, the importance of
building and maintaining customer loyalty in
electronic marketplaces has come into sharper
focus in marketing theory and practice (Gommans
et al. 2001). Research has shown that loyal
customers are less price sensitive (Reichheld, cited
by Moisescu et. al 2010) and the expense of
pursuing new customers is reduced (Dowling cited
by Moisescu et. al, 2010), while organizational
profitability is positively affected by the level of
brand loyalty (Aaker, cited by Moisescu et. al 2010).
Brand loyalty can enhance marginal cash flow and
profitability, as loyal customers often accept to pay
a price premium for their favorite brands, are easily
stimulated to new usage situations and tend to
increase intensively and extensively their spending
on the brand (Davis, cited by Moisescu et. al, 2010).
The marketing communication expenditure is also
reduced as loyal customers are already confident in
the purchase decision and therefore process
information rapidly, instruments like sales
promotions or advertising being less intensively
needed in this case in comparison to brands with
low loyalty degree. Moisescu et al. (2010) said that
loyalty enhances the process of attracting new
customers. The importance of satisfying a customer
in order to create behavioural loyalty is highlighted
by Schultz, cited by Moisescu et al. (2010). Bloemer
et al. (1994) conclude that consumer satisfaction
positively affects brand loyalty. According to the
findings of Dhurup et al. (2014), packaging, price
and brand awareness have shown a significant
predictive influence on brand loyalty.
Internet has widely spread among the Sri Lankan
population, specially among young adults with
relaxed financial policies and high quality delivery
services. It is interesting to know how young adults
behave in the online shopping environment with a
limited budget with the “brands” that they are fond
of. There are many researches done on online
shopping and interesting factors have been found
out on online shoppers’ behavioural patterns,
demographic factors etc. (Yatigammana, 2010).
Even though there are some researches conducted
on online shoppers’ buying behavior, it is hard to
find the role played by brand loyalty in an online
shopping environment. Specially literature in Sri
Lanka is rare in this regard.
The main objective of this study is to assess the
relationship between brand satisfaction and brand
loyalty with regard to online shopping behaviour of
young adults in higher education sector. This will be
tested using four selected products. The second
objective is to validate the model proposed in
Figure 1. Further, the study attempts to establish a
relationship with price and brand loyalty. It is
commonly argued that brand loyalty is not in
existence in low valued products where the level of
involvement in purchasing is less. The third
objective is to assess the relative importance of
“brand” when purchasing the selected products
online.
In this study the following model is proposed as the indicators of brand loyalty.
Figure 1. Indicators of Brand Loyalty
II. RESEARCH METHDOLOGY
A. Sample Selection
E-enabled young adults shop online increasingly.
The target group of this study consisted of youth
aged 23-26 years studying in or just passed out
from the university of Moratuwa, Sri Lanka who are
have a limited budget.
The sample consisted of 100 final year
undergraduates and just passed out graduates of
the University. Convenient sampling was used for
the study and equal number of respondents were
selected from the Faculty of Engineering and
Faculty of Information Technology. Since the
University of Moratuwa is a technical university,
majority of the respondents were male which
accounts for 73% and the female proportion was
27% out of the total respondents.
Brand LoyaltyBrand
satisfaction
Brand recommendation
Brand repurchase-in similar context
0
Brand repurchase-in case of distribution
decrease
Brand repurchase-in case of price increase
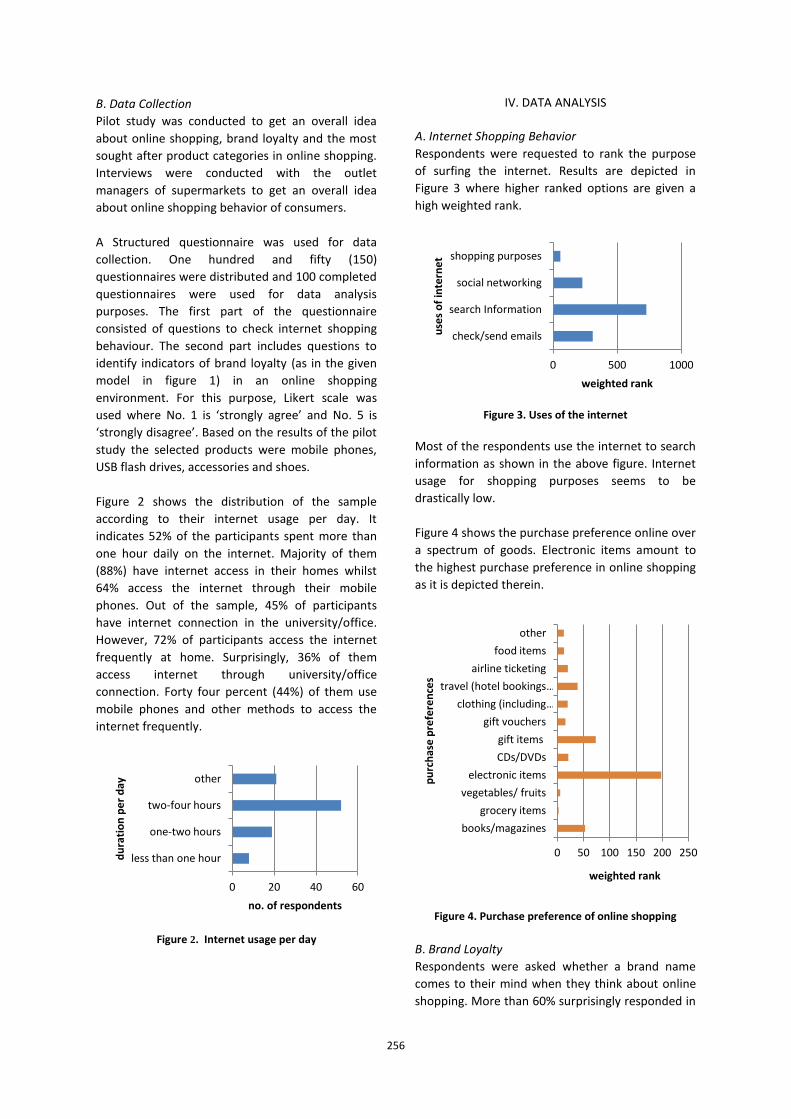
256
B. Data Collection
Pilot study was conducted to get an overall idea
about online shopping, brand loyalty and the most
sought after product categories in online shopping.
Interviews were conducted with the outlet
managers of supermarkets to get an overall idea
about online shopping behavior of consumers.
A Structured questionnaire was used for data
collection. One hundred and fifty (150)
questionnaires were distributed and 100 completed
questionnaires were used for data analysis
purposes. The first part of the questionnaire
consisted of questions to check internet shopping
behaviour. The second part includes questions to
identify indicators of brand loyalty (as in the given
model in figure 1) in an online shopping
environment. For this purpose, Likert scale was
used where No. 1 is ‘strongly agree’ and No. 5 is
‘strongly disagree’. Based on the results of the pilot
study the selected products were mobile phones,
USB flash drives, accessories and shoes.
Figure 2 shows the distribution of the sample
according to their internet usage per day. It
indicates 52% of the participants spent more than
one hour daily on the internet. Majority of them
(88%) have internet access in their homes whilst
64% access the internet through their mobile
phones. Out of the sample, 45% of participants
have internet connection in the university/office.
However, 72% of participants access the internet
frequently at home. Surprisingly, 36% of them
access internet through university/office
connection. Forty four percent (44%) of them use
mobile phones and other methods to access the
internet frequently.
Figure 2. Internet usage per day
IV. DATA ANALYSIS
A. Internet Shopping Behavior
Respondents were requested to rank the purpose
of surfing the internet. Results are depicted in
Figure 3 where higher ranked options are given a
high weighted rank.
Figure 3. Uses of the internet
Most of the respondents use the internet to search
information as shown in the above figure. Internet
usage for shopping purposes seems to be
drastically low.
Figure 4 shows the purchase preference online over
a spectrum of goods. Electronic items amount to
the highest purchase preference in online shopping
as it is depicted therein.
Figure 4. Purchase preference of online shopping
B. Brand Loyalty
Respondents were asked whether a brand name
comes to their mind when they think about online
shopping. More than 60% surprisingly responded in
0 20 40 60
less than one hour
one-two hours
two-four hours
other
no. of respondents
du
rati
on
pe
r d
ay
0 500 1000
check/send emails
search Information
social networking
shopping purposes
weighted rank
use
s o
f in
tern
et
0 50 100 150 200 250
books/magazines
grocery items
vegetables/ fruits
electronic items
CDs/DVDs
gift items
gift vouchers
clothing (including …
travel (hotel bookings …
airline ticketing
food items
other
weighted rank
pu
rch
ase
pre
fere
nce
s
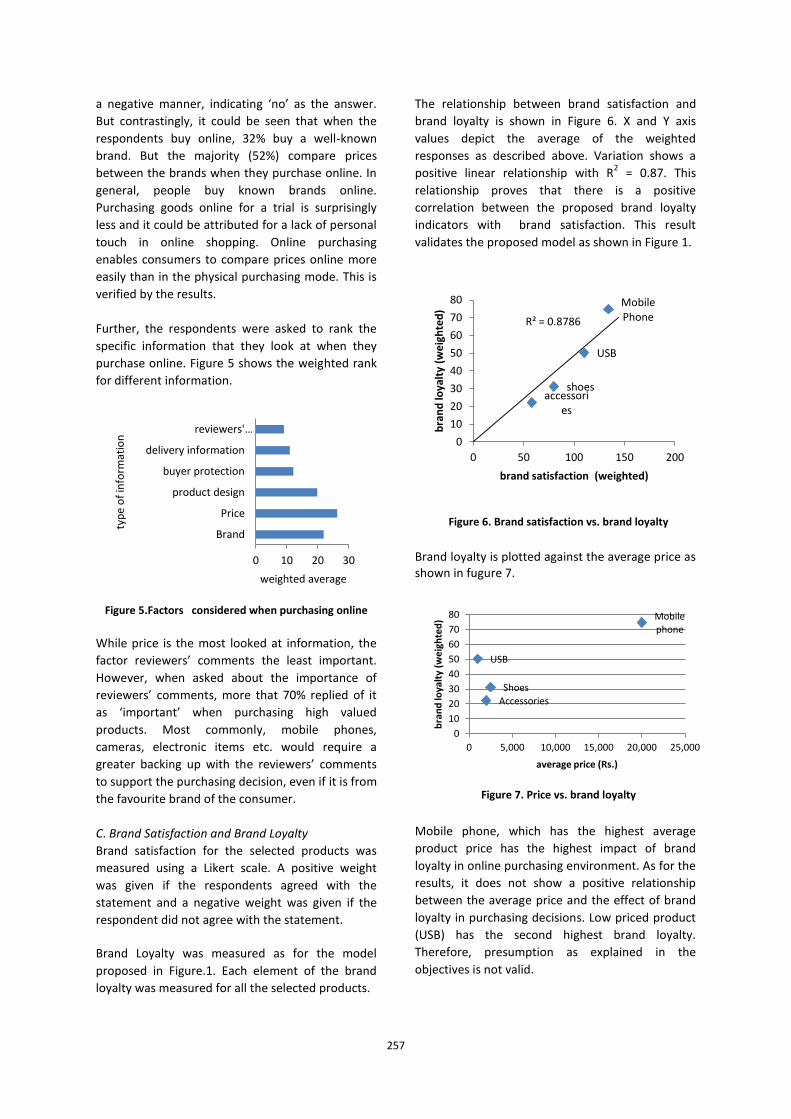
257
a negative manner, indicating ‘no’ as the answer.
But contrastingly, it could be seen that when the
respondents buy online, 32% buy a well-known
brand. But the majority (52%) compare prices
between the brands when they purchase online. In
general, people buy known brands online.
Purchasing goods online for a trial is surprisingly
less and it could be attributed for a lack of personal
touch in online shopping. Online purchasing
enables consumers to compare prices online more
easily than in the physical purchasing mode. This is
verified by the results.
Further, the respondents were asked to rank the
specific information that they look at when they
purchase online. Figure 5 shows the weighted rank
for different information.
Figure 5.Factors considered when purchasing online
While price is the most looked at information, the
factor reviewers’ comments the least important.
However, when asked about the importance of
reviewers’ comments, more that 70% replied of it
as ‘important’ when purchasing high valued
products. Most commonly, mobile phones,
cameras, electronic items etc. would require a
greater backing up with the reviewers’ comments
to support the purchasing decision, even if it is from
the favourite brand of the consumer.
C. Brand Satisfaction and Brand Loyalty
Brand satisfaction for the selected products was
measured using a Likert scale. A positive weight
was given if the respondents agreed with the
statement and a negative weight was given if the
respondent did not agree with the statement.
Brand Loyalty was measured as for the model
proposed in Figure.1. Each element of the brand
loyalty was measured for all the selected products.
The relationship between brand satisfaction and
brand loyalty is shown in Figure 6. X and Y axis
values depict the average of the weighted
responses as described above. Variation shows a
positive linear relationship with R2 = 0.87. This
relationship proves that there is a positive
correlation between the proposed brand loyalty
indicators with brand satisfaction. This result
validates the proposed model as shown in Figure 1.
Figure 6. Brand satisfaction vs. brand loyalty
Brand loyalty is plotted against the average price as shown in fugure 7.
Figure 7. Price vs. brand loyalty
Mobile phone, which has the highest average
product price has the highest impact of brand
loyalty in online purchasing environment. As for the
results, it does not show a positive relationship
between the average price and the effect of brand
loyalty in purchasing decisions. Low priced product
(USB) has the second highest brand loyalty.
Therefore, presumption as explained in the
objectives is not valid.
0 10 20 30
Brand
Price
product design
buyer protection
delivery information
reviewers' …
weighted average
typ
e o
f in
form
atio
n
Mobile Phone
USB
accessories
shoes
R² = 0.8786
0
10
20
30
40
50
60
70
80
0 50 100 150 200
bra
nd
loya
lty
(we
igh
ted
)
brand satisfaction (weighted)
Mobile phone
USB
Accessories
Shoes
0
10
20
30
40
50
60
70
80
0 5,000 10,000 15,000 20,000 25,000
bra
nd
loya
lty
(we
igh
ted
)
average price (Rs.)
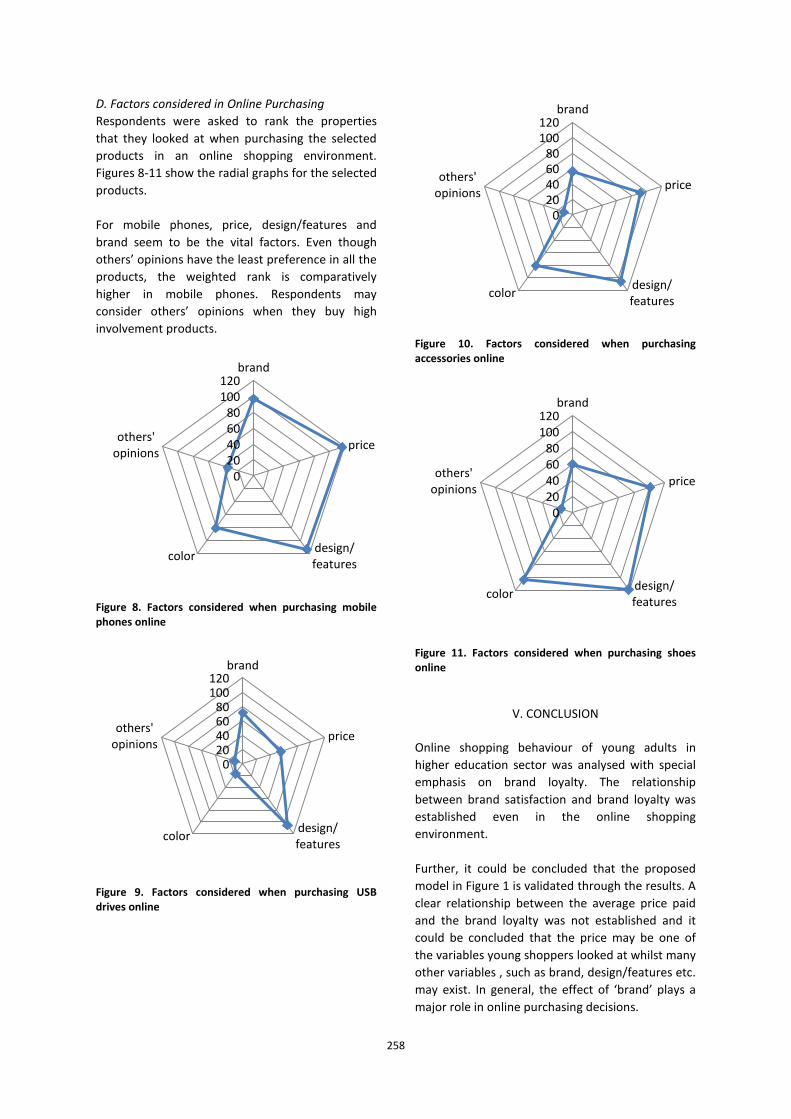
258
D. Factors considered in Online Purchasing
Respondents were asked to rank the properties
that they looked at when purchasing the selected
products in an online shopping environment.
Figures 8-11 show the radial graphs for the selected
products.
For mobile phones, price, design/features and
brand seem to be the vital factors. Even though
others’ opinions have the least preference in all the
products, the weighted rank is comparatively
higher in mobile phones. Respondents may
consider others’ opinions when they buy high
involvement products.
Figure 8. Factors considered when purchasing mobile phones online
Figure 9. Factors considered when purchasing USB drives online
Figure 10. Factors considered when purchasing accessories online
Figure 11. Factors considered when purchasing shoes online
V. CONCLUSION
Online shopping behaviour of young adults in
higher education sector was analysed with special
emphasis on brand loyalty. The relationship
between brand satisfaction and brand loyalty was
established even in the online shopping
environment.
Further, it could be concluded that the proposed
model in Figure 1 is validated through the results. A
clear relationship between the average price paid
and the brand loyalty was not established and it
could be concluded that the price may be one of
the variables young shoppers looked at whilst many
other variables , such as brand, design/features etc.
may exist. In general, the effect of ‘brand’ plays a
major role in online purchasing decisions.
0 20 40 60 80
100 120
brand
price
design/ features
color
others' opinions
0 20 40 60 80
100 120
brand
price
design/ features
color
others' opinions
0 20 40 60 80
100 120
brand
price
design/ features
color
others' opinions
0 20 40 60 80
100 120
brand
price
design/ features
color
others' opinions

259
The findings of this study provide interesting
insights for marketing managers who are interested
in promoting online shopping. As the Internet usage
grows worldwide, managers need to understand
their consumers and the distinguishing
characteristics between Internet shoppers and non-
shoppers globally. This distinction will enable
managers to tailor the online experience in ways
that will actually make Internet shoppers purchase
and repurchase from their websites while enabling
these websites to appeal to non-shoppers as well.
An additional goal of such an understanding should
be to encourage non-shoppers to shop online.
REFERENCES
Agraval, A., & Siddharth, S.(2010). Retaining Brand
Loyalty. Available from
http://www.tutorialspoint.com/white-
papers/146.pdf
Alam, S. S., Bakar, Z., Ismail, H. B., & Ahsan, M. N. (2008).
Young consumers online shopping: an empirical
study. Journal of Internet Business, 5(1), 81-98.
Bloemer, J. M., & Kasper, H. D. (1994). The impact of
satisfaction on brand loyalty: urging on classifying
satisfaction and brand loyalty. Journal of Consumer
Satisfaction, Dissatisfaction and Complaining
Behavior, 7, 152-60.
Demangeot, C., & Broderick, A. J. (2007). Conceptualising
consumer behaviour in online shopping
environments. International Journal of Retail &
Distribution Management, 35(11), 878-894.
Dhurup, M., Mafini, C. & Dumasi, T. (2014), ‘The impact
of packaging, price and brand awareness on brand
loyalty: Evidence from the paint retailing industry’,
available from
http://dx.doi.org/10.4102/ac.v14i1.194
Gommans, M., Krishnan, K. S., & Scheffold, K. B. (2001).
From brand loyalty to e-loyalty: a conceptual
framework. Journal of Economic and Social
research,3(1), 43-58.
Moisescu, O. I., & Allen, B. (2010). The Relationship
Between The Dimensions Of Brand Loyalty. An
Empirical Investigation Among Romanian Urban
Consumers. Management & Marketing, 5(4).
Sorce, P., Perotti, V., & Widrick, S. (2005). Attitude and
age differences in online buying. International
Journal of Retail & Distribution Management, 33(2),
122-132.
Yatigammana M.R.K.N.( 2010),Analysis of online
shopping of Sri Lanka- Evidence from the western
Province, Paper presented at International
Research Conference on Management & Finance-
2010,University of Colombo, Sri Lanka.
BIOGRAPHY OF AUTHORS
1Author is a lecturer, attached to the
Department of Interdisciplinary Studies,
Faculty of Information Technology,
University of Moratuwa, Sri Lanka. She
graduated from the University of
Colombo, Sri Lanka with a Bachelor of Business
Administration Special Degree in Marketing. Her research
interests include branding, consumer behaviour and
human resource management.
2Author is a programmer cum system
analyst attached to the Undergraduate
Studies Division, Faculty of Engineering,
University of Moratuwa, Sri Lanka. She
graduated from Sri Lanka Institute of
Information Technology with a BSc. Degree in
Information Technology and a MSc. in Information
Management. Her research interests include
Management Information Systems, e-learning and
consumer behavior.
260
Investigation on Functions and Product Structure of Islamic Banking vs. Conventional Banking in Sri Lanka: a Case Study
II Wijethunga1, EMNN Ekanayake2
1,2Department of Finance, Faculty of Management and Finance, University of Colombo, Sri Lanka
Abstract - Islamic banks (IBs) were originated to
satisfy the financial needs of Muslim community by
rejecting interest and following Profit-Loss sharing
paradigm while conforming to Shariah principles. IB
is increasingly gaining attention across the global
financial environment due to its unique framework
relative to Conventional banks (CBs). But the public
still lack the comprehensive knowledge about how
actually IBs differ from CBs. Hence, there is a lack of
participation of the public with the IBs for banking
transactions. The objective of the study is to explore
‘how’ and ‘why’ IBs differ from CBs with giving
special reference to the functions and products.
Hence, this research would fill the knowledge and
empirical gap in the Sri Lankan context.
The study adopts interpretative methodology and
multiple case study strategy. Primary and secondary
data were collected through interviews,
observations, reports and websites.
Major findings of the study concluded that IBs and
CBs enclose differences as well as similarities in their
framework. The major differences were identified
connecting to the framework of IBs as they need to
follow interest free paradigm, Profit and Loss
Sharing (PLS) paradigm and Shariah principles in
performing the banking functions comparing to
interest based CBs. However, still both IBs and CBs
function as financial intermediary carrying out
similar functions. Similarly in terms of product and
services, IBs offer similar saving and financing
solutions to banking customers as of CBs, but still
their products tend to be unique as they adhere to
above principles and variety of Shariah product
concepts such as Mudharaba in forming savings
accounts and Mudarabah, Musyarakah, etc in
offering financing products. Likewise similarities and
differences can be observed in investments and
financing structure between two systems.
Thus it is evident that IBs and CBs enclose
differences as well as similarities in their product
and working structure. Accordingly the major
principles of interest free paradigm, Profit and Loss
Sharing paradigm and Shariah principles have
influenced for the emergence of unique structure
that differentiate an IB from general CBs though few
similarities can be observed between two systems.
Thus these results are consistent with the findings of
other researchers in the similar areas.
Keywords: Islamic bank, Conventional bank,
Functions, product structure
I. INTRODUCTION
Islamic Banking was originated to satisfy the
financial needs of Muslim community. This has
gained much attention with its unprecedented
growth and expansion in last decades. With its
growing awareness and success, Islamic bank made
its entry to the Sri Lankan banking industry in 2009.
Islamic banks (IBs) deem to be very unique than
conventional banks (CBs) since they reject interest
and follow interest free framework while
conforming to Shariah principles. This case study
was carried out with an objective to
comprehensively understand the Islamic banking
system and its concepts. The study attempts to
ascertain to what extent Islamic banks differ from
conventional banks and its application of Shariah
principles in Sri Lankan context with especial
reference to functions and products of the two
banking systems.
II. METHODOLOGY
This study has selected two banks, selected Islamic
Bank (IB1) and selected Conventional Bank (CB1)
accordingly, each representing IBs and CBs.
Interpretative methodology and multiple case study
strategy have been employed to analyze the data.
Primary and secondary data were collected through
interviews, observations, reports and websites. This
study was conducted in a structured way to ensure
the validity and the reliability of the findings.
261
A. Research Purpose and Research Approach
The purpose of the current research is to gain a
better understanding of the concept IB and its
application in the Sri Lankan context as well as to
identify how and to what extent it differs from CBs.
As IB is a new concept to the financial market of Sri
Lanka, it requires comprehensive understanding
about the subject. Therefore, the qualitative
approach has been used in this study to go
profound into the research area and to achieve the
objectives of the present study. Hence the study will
be an exploratory research.
B. Research Philosophy and the Strategy
The research philosophy the study adopts is
interpretative methodology and multiple case study
strategy. Accordingly, two case studies are
conducted to address the research questions as it
allows an easy foundation to compare and validate
the results as well as to conduct a cross-case
analysis (Yin, 1994; Merriam, 1998).
Two banks were selected from the banking sector
as the study focuses on the banking system of the
county.
C. Data Collection
Data are primarily collected by following in-depth
face to face focused interviews employing an
interview guide. Further, within the scope of
research, the current study has further used
internet and observation as sources of data
collection. The documentation was also used in
order to supplement evidences from other sources.
For example, data available in bank information
materials as annual reports, articles and brochures
were collected to acquire an overall view of the
present situation of banks.
III. RESULTS AND DISCUSSION
A. Functions
CB1 as well as IB1 perform multiple functions such
as deposit mobilization, agency services and general
utility services to meet the needs of banking
customers. The primary function of CB1 is to accept
deposits and advance loans on the basis of different
interest rates. Hence, CB1 highly depends on
interest rates. As to the informant, CB1 continually
adopts low cost deposit mobilization strategies in
order to continue their growth. Additionally they
perform variety of other functions based on agency
services and general utility services by facilitating
various fee based products and services to them.
Similarly, IB1 also performs variety of functions to
provide diversity of unique financial solutions to its
customers. Their main function is also to ensure
deposit mobilization by pooling funds from savers
and lending them to investors to invest in
productive ventures to generate profits.
Additionally IB1 is identified to perform functions to
provide agency services and general utility services
to its customers.
However, though IB1 perform identical functions as
CB1 (Table 1) , their functions are unique than CB1
as IB1 function in accordance with Shariah
principles and interest free framework, whilst CB1
operate within the framework of interest and they
do not follow religious laws as Shariah.
This argument was brought in to light by the
informant of IB1:
“As a Shariah compliant bank, we also offer the
same functions as CBs but by following the
principles of Shariah. Therefore our functions
are unique and designed based on the
stipulated Shariah guidelines and principles
than other CBs”.
Therefore, IB1 functions are designed under
interest free framework to mutually share risk as
well as rewards with customers, with an aim to
avoid speculation and to ensure ethical
investments. However, both the banks place a
major emphasis on deposit mobilization than the
other functions as they earn higher income by
advancing loans. Hence, these findings of the study
are consistent with the findings of Ahamad et al.
(2010), Al-Jarhi and Iqbal (2001), Ahmad et al.
(2010) and Bahari (2009) as they also have
identified that the main functions of IBs and CBs
involve deposit mobilization, agency function and
utility functions.
Table1.Main Functions of IB1 and CB1
Main
Functions
IB1 CB1
Deposit
mobilization
Accept deposits
Advancing Loans
Accept deposits
Advancing
Loans
Agency
functions
Collection of
cheques
Execution of
standing orders
Collection of
cheques
Execution of
standing orders
Offer general
utility services
Collection of utility
bills
Collection of
utility bills
262
Foreign exchange
and treasury
services
ATM card services
Foreign
exchange and
treasury
services
ATM and credit
card services
Source: Researcher’s own construction (based on the
functions of two banks)
Therefore, the findings confirm that IBs perform
identical functions as CBs, but still their functions
are unique than of CBs, as IBs are required to follow
Shariah principles and Islamic law as a Shariah
compliant bank. Very interestingly these findings
are supported by Paino et al. (2011), Mouawad
(2009), Hanif (2011) and Benamraou (2008) as they
have also discovered that the functions of IBs are
similar to that of CBs, but differences can be
foreseen in the operation of two systems as IBs are
Shariah followers and function within interest free,
when CBs are interest based and not operate under
religious laws as Shariah
IB1 exists to achieve the objectives such as socio-
economic justice, fairness and equality, whereas
main consideration of CB1 is to maximize returns.
As a result, IB1 functions are designed by adhering
to Islam values and Shariah principles in order to
meet these goals unlike CBs. These results are
consistent with Paino et al. (2011), Ahmed (1987),
Uzair (1976) and Hanif (2011). But the the study
contradicts with the findings of Mouawad (2009) as
he has emphasized that IBs and CBs have exact
same operations, as the practices of IB is also driven
towards profit maximization than social benefits as
CBs.
Furthermore, IB1 is required to develop a
customized information system that supports
interest free products, Profit and Loss Sharing (PLS)
paradigm and Shariah principles in performing
these functions. Hence, they do not adopt the
current banking software systems as CB1, as those
softwares’ are developed based on interest
products.
B. Product Structure
CB1 offers current accounts, savings accounts and
investment accounts to the banking customers
based on interest. On the other, IB1 offer savings
accounts and investment accounts based on PLS
ratios, while current accounts are offered with a
guarantee for principal deposit amount and it is not
covered by PLS paradigm. However unlike CB1, IB1
follows Shariah product concepts Mudharaba in
forming savings accounts and investment accounts.
The PLS ratio for the deposit accounts in IB1 is pre-
decided. But the actual profits and loss shared with
customers depend on the monthly earnings of IB1.
Therefore, the profit rates to customers of IB1 are
subject to change according to the monthly profits
of the bank and thus monthly rewards to customers
depend on that calculated monthly rate. Further
when compared to CB1, IB1 offers more profit rates
to saving accounts depositors and less profit rates
to investment account holders than CB1.
When looking at savings, It is identified that
resident customers of IB1 get more percentage of
profits, while IB1 gets more profit ratio than
customers pertaining to foreign accounts. However,
the resident customers get higher interest than
foreign account holders in CB1. Generally the
customers of IB1 as well as CB1 get higher returns
when the period of investment increases than the
bank pertaining to investment accounts.
Additionally, the term deposits tend to dominate in
CB1 while savings deposits dominate in IB1. Hence,
these results are confirmed by Alam (2000), Al-
Shami (2009), Karim (1996), Hanif (2011), Haron
(1998), Chong and Liu (2009), Olson and Zoubi
(2008), Benamraoui (2008) and Ariff (1995). They
found that IBs offer current, savings and investment
accounts as CBs, but with subject to Islam law and
Shariah principles. They further discovered that IBs
follow the Mudharaba in forming deposit accounts
The two banking streams offer identical financing
options, term financing, trade financing, house
financing and lease financing options against
collateral. But still many differences have been
identified between two banks with regard to
financing options as IB1 follows Shariah product
concepts such as Mudarabah, Musyarakah,
Murabaha, DiminsihingMusharaka, Ijara, Wakala,
Import Murabaha and Import Musawamma as well
as PLS paradigm in offering financing solutions to its
customers. Hence under PLS ratio, IB1 and its
borrowers share the profits on an agreed ratio and
the losses are shared according to their capital
contribution. On the other hand CB1 offers
financing options based on interest.
Further, IB1 does not offer financing solution or
invest in organizations that operate in unethical or
socially harmful industries such as liquor, gambling
and tobacco irrespective of their profitability. In the
case of CB1, they do not face such restrictions and

263
hence lend to borrowers who have the
creditworthiness. In a case of default or delaying
the loan instalments, CB1 charges an extra interest
from the borrowers and this charge is considered as
an income for them. But in the case of IB system,
IB1 does not charge an extra amount for the delay
but they have the opportunity to charge a penalty if
only it is stated in the agreement. But IB1 cannot
include it as income and instead the amount is
transferred to a separate charitable fund. Mostly,
term financing facilities tend to dominate in two
banks among other financial options. (Figure 1)
These findings are consistent with the findings of
Alam (2000), Karim (1996), Wilson (1987) and Haron
(1998)
Figure 1. Deposit Composition – IB1 and CB1
Source: Researcher’s own construction (based on the
annual reports of 2011 of two banks)
As CB1, IB1 offers other fee based products such as
treasury products to customers but following
Shariah principles. Further, CB1 tends to offer fund
transfers, pay and standing orders, safe deposits
lockers and pawing facilities while IB1 only offers
fund transfers, pay and standing orders and they do
not offer safe deposits lockers and pawing facilities
to its customers at present.
When considering the investment in two streams,
IB1 only invest in the securities and the
organizations that are ethical and interest free.
However, CB1 is not subject to such restrictions and
they have the opportunity to invest in the sectors
and securities that they intend to invest. Further,
IB1 holds deposits with other CBs, but under its
Islamic window. Thus IB1 only places deposits with
Islamic financial institutions and they cannot invest
as intended like CB1. Investment sectors of the two
banks are tending to differ, but they both cater to
agriculture, manufacturing, construction, traders,
infrastructure as well as financial and business
services sectors. Traders dominate CB1 followed by
construction sector, while traders dominate in IB1,
followed by manufacturing and agriculture sector.
(Figure 2)
Figure 2. Exposure of Financing of Banks in Common
Sectors – IB1 and CB1
Source: Researcher’s own construction (based on the
annual reports of 2011 of the two banks)
It is evident that IB1 and CB1 offer identical
products to customers, but still there are
differences among two systems due to the fact that
unlike to CB1, IB1 follow Shariah principles, Islamic
law and Shariah product concepts in providing these
products. As a result though the products and
services of IB1 have identical features as of CB1, the
philosophy and the operations of two banks are
deemed to be different from one another.
IV. CONCLUSION
Findings concluded that the Islamic banks and the
conventional banks enclose differences as well as
similarities in their framework specifically pertaining
to the aspects functions and products structure.
This is mainly driven by the major principles of
interest free paradigm, Profit and Loss Sharing
paradigm and Shariah principles for the emergence
of unique structure that differentiate an IB from
general CBs. Differences have been highlighted
more than similarities between these two systems
which confirmed that Islamic banking is not a mere
copy of conventional banking as follows.
Functions: CBs as well as IBs perform multiple
functions such as deposit mobilization, agency
services and general utility services to meet the
needs of banking customers. Though IBs perform
264
identical functions as CBs, their functions are
unique than CBs as IBs function in accordance with
Shariah principles and interest free framework,
whilst CBs operate within the framework of interest
and they do not follow any religious law as Shariah.
However, both systems place a major emphasis on
deposit mobilization than other functions as they
earn higher income by advancing loans. IBs exist to
achieve the objectives such as socio-economic
justice, fairness and equality, whereas CBs main
consideration is to maximize returns. Furthermore,
IBs are required to develop a customized
information system that supports interest free
products, PLS paradigm and Shariah principles in
performing these functions. Hence, they do not
adopt current banking software systems as CBs, as
those softwares’ are developed based on interest
products.
Products and services: Both CBs as well as IBs offer
current, savings and investment accounts to baking
customers based on interest and latter on PLS ratios
which are pre-decided. But the actual profits and
loss shared depend on the monthly earnings of IBs.
Therefore, profit rates to customers of IBs are
subject to change according to its monthly profits
Unlike CBs, IBs follow Shariah product concepts
Mudharaba in forming savings and investment
accounts. Thus IBs offer more profits rates to saving
accountholders and less profit to investment
account holders. Further, the term deposits tend to
dominate in CB sector, while savings deposits
dominate in IB sector.
The two banking streams offer identical financing
options, term financing, trade financing, house
financing and lease financing options against
collateral. But still many differences have been
identified between two banks as IB follows Shariah
product concepts such as Mudarabah, Musyarakah,
Murabaha, Diminsihing Musharaka, Ijara, Wakala,
Import Murabaha and Import Musawamma as well
as PLS paradigm in offering financing solutions to its
customers. Hence, under PLS ratio, IBs and
borrowers share the profits on an agreed ratio and
the losses according to capital contribution. In
contrast CBs offer financing options based on
interest.
Further, IBs do not offer financing solution or
invest in organizations that operate in unethical or
socially harmful industries such as liquor, gambling
and tobacco irrespective of their profitability. In the
case of CBs, they do not face such restrictions and
lend to borrowers who have creditworthiness. In a
case of default or delaying the loan instalments, CBs
charge an extra interest from the borrowers and it
will be an income for them. But in IB system, they
cannot charge an extra amount for the delay but
they have the opportunity to charge a penalty if
only it is stated in the agreement. But IBs cannot
include it as income and instead it is transferred to
a separate charitable fund. Mostly, term financing
tend to dominate in two banking systems among
other financial options.
When considering the investment in two streams,
IBs only invest in the organizations that are ethical
and interest free. However, CBs are not subject to
such restrictions and have the opportunity to invest
in the sectors that they intend to invest. Further IBs
only place deposits with Islamic FIs and they cannot
invest as intended like CBs. Investment sectors of
two streams are tend to differ, but they both cater
to agriculture, manufacturing, construction, traders,
infrastructure as well as financial and business
services sectors. Traders dominate CB sector
followed by construction sector, while traders
dominate in IBs, followed by manufacturing and
agriculture sector.
The explanations for differences between two
banking systems have been majorly driven by the
Islam law and the application of Shariah principles.
Islamic banks adhere to Islamic laws and Shariah
principles in addition to standard banking rules in
performing banking activities while conventional
banks only follow standard banking regulations.
At present, Islamic banking system is still in its initial
stage in Sri Lanka and is required to take steps in
developing the system parallel to conventional
banking system as it is beneficial to the customers
as well as to the economy in a way of employment
and earning generation. This study suggests
important implications to academicians,
researchers, policy makers, bankers, and customers
to explore the potential benefits of Islamic Banking.
Based on the findings, this study indicates the
following avenues for further research. First since
the present study focus on only on functions and
product structure, the future researchers can
extend the study by adding more variables of their
interest and carryout a comparison between IBs and
CBs. Another opportunity for future research exists
as a similar study can be conducted in other

265
financial sectors to identify the similarities and the
differences in their operations such as comparing
conventional and Islamic leasing companies,
insurance companies etc. This study is conducted
based only one IB and only one CB. However it
would be more worthwhile if a comparison is made
with more IBs and CBs in SL. Hence future
researchers can undertake a study to compare IBs
with Islamic windows of CBs. On the other hand
they can carry out similar research by including
Islamic windows of CBs too.
REFERENCES
Aggarwal, R. K., & Yousef, T. (2000). Islamic Banks and
Investment Financing. Journal of Money, Banking
and Credit, 32(1), 93-120.
Ahmad, A., Awan, R. U., & Malik, M. I. (2011).An overview
of the operations/products offered by Islamic banks
in Pakistan.African Journal of Business Management,
5(11), 4185-4190.
Ahmad, A., Humayoun, A. A., & Hassan, U. U. (2010).An
Analysis of Functions Performed by Islamic Bank: A
Case of Pakistan. European Journal of Social Sciences,
17(1), 7-11.
Ahmad, A., Rehman, K., &Saif, M. I. (2010).Islamic Banking
Experience of Pakistan: Comparison between Islamic
and Conventional Banks. International Journal of
Business and Management, 5(2), 137-144.
Akram, M., Rafique, M., &Alam, H. M. (2011).Prospects of
Islamic Banking: Reflections from Pakistan.Australian
Journal of Business and Management Research, 1(2),
125-134.
Alam, M. N. (2011). Islamic Banking in Bangladesh: A Case
Study of IBBL. International Journal of Islamic
Financial Service, 1(4), 10-29.
Ariff, M. (1988). Islamic Banking. Asian- Pacific Economic
Literature, 2(2), 48-64.
Ariff, M. (2006). Islamic banking, a variation of
conventional banking. Monash Business Review, 3(1),
1-8.
Azhar, S. R., & Bakar, M. A. (2003). Performance of Islamic
and mainstream banks in Malaysia. International
Journal of Social Economics, 30(12), 1249-1265.
Bader, M. K. I., Mohamad, S., Ariff, M., & Hassan, T.
(2008). Cost, revenue and profit efficiency of Islamic
versus conventional banks: International evidence
using data envelopment analysis. Islamic economic
studies, 15(2), 23-76.
Bahari, Z. B. (2009). The Changes of Product Structure in
Islamic Banking: Case Study of Malaysia. Conference
on Islamic Perspectives on Management and
Finance.Leicester University.
Benamraoui, A. (2008). Islamic banking: the case of
Algeria. International Journal of Islamic and Middle
Eastern Finance and Management, 1(2), 113 – 131.
CB1. Annual Report 2011.
CB1. Retrieved on May 15, 2012, from
http://www.CB1.net/
Chong, B. S., & Liu, M. (2008).Islamic banking: Interest-
free or interest-based? Pacific-Basin Finance Journal,
17(1), 125-144.
Dar, H. (2003). Islamic Banking. Retrieved August 20,
2012,from
http://www.docstoc.com/docs/36527104/Murinde-
Mullineux---Handbook-of-International-Banking-
_2003_
Gerrad, P., & Cunningham, J.B., (1997). Islamic banking: a
study in Singapore. International Journal of Bank
Marketing, 15(6), 204-216.
Hanif, M. (2011).Differences and Similarities in Islamic
and Conventional Banking. International Journal of
Business and Social Science, 2(2), 166-175.
Haron, S. (1998).A Comparative Study of Islamic Banking
Practices.Islamic Economics, 10(1), 23-50.
Hassan, M. K. (1999). Islamic banking in theory and
practice: The experience of Bangladesh. Managerial
Finance, 25(5), 60-113.
Hayat, R., & Kraeussl, R. (2011). Risk and return
characteristics of Islamic equity funds. Emerging
Markets Review, 12(2), 189-203.
Hern, B., Piesse, J., & Strange, R. (2010). Islamic finance
and market segmentation: Implications for the cost
of capital. International Business Review, 21(1), 102-
113.

266
IB1. Annual Report 2011.
IB1. Retrieved May 15, 2012, from
http://www.IB1.lk/index.php/en/
Iqbal, M. (2001). Islamic and conventional banking in the
nineties: A comparative Study. Islamic Economic
Studies, 8(2), 1−27.
Iqbal, Z., & Mirakhor, A. (2007). An Introduction to Islamic
Finance: Theory and Practice. Singapore: Wiley
Publications.
Kahf, M. (2004). Success Factors of Islamic Banks: Based
on a study of the actual conduct of some Islamic
Banks. Islamic Banking and Finance conference.
Brunei Symposium
Kazarian, E.G. (1993). Islamic Versus Traditional Banking:
Financial Innovation in Egypt Boulder, CO: Westview
Press.
Khan, F. (2010). How ‘Islamic’ is Islamic Banking? Journal
of Economic Behavior and Organization, 76(3), 805-
820.
Kohn, L. T. (1997). Methods in Case Study Analysis.
Technical Publication, 2, 1-8.
Samad, A. (2004). Performance of Interest-Free Islamic
Banks Vis-À-Vis Interest-Based Conventional Banks of
Bahrain. Journal of Economics and Management,
12(2), 1-15.
Samad, A., & Hassan, M. K. (1999). The performance of
Malaysian Islamic bank during 1984–1997: An
Exploratory Study. International Journal of Islamic
Financial Services, 10(1), 7-26.
Samad, A., Gadner, N. D., & Cook, B. J. (2005). Islamic
Banking and Finance in Theory and Practice: The
Experience of Malaysia and Bahrain. American
Journal of Islamic Social Sciences, 22(2), 69-86.
Sundararajan, V., & Errico, L. (2002). Islamic Financial
Institutions and Products in the Global Financial
System: Key Issues in Risk Management and
Challenges Ahead. Retrieved August 20, 2012, from
http://kantakji.com/fiqh/Files/Markets/y144.pdf
Warde, I. (2000). Islamic Finance in the Global Economy.
Edinburgh, Scotland: Edinburgh University Press.
Wilson, R. (1987). Islamic Banking in Jordan. Islamic
Banking: The Jordanian Experience. Arab Law
Quarterly, 2(3), 207-229.
Yin, R. K. (1994). Case Study Research, Design and
Methods. (2nd
ed.). Thousand Oaks: Sage
Publications.
Zaher T. S., & Hassan, M.K. (2001). A Comparative
Literature Survey of Islamic Finance and Banking.
Financial Markets, Institutions and Investments, 1(4),
155-199.
Zainol, Z., Shaari, R., & Ali, H. M. (2008). A Comparative
Analysis of Bankers’ Perceptions on Islamic Banking.
International Journal of Business and Management,
3(4), 157- 168.
Zineldin, M. (1990). The Economics of Money and
Banking: A Theoretical and empirical study of Islamic
Interest-Banking. Retrieved November 27, 2012,
from
http://www.kau.edu.sa/Files/320/Researches/51076
_21210.pdf
Zucker, D. M. (2009). How to Do Case Study Research.
Retrieved March 15, 2012, from
http://scholarworks.umass.edu/cgi/viewcontent.cgi?
article=1001&context=nursing_faculty_pubs
BIOGRAPHY OF AUTHORS
1
Ishanthi Iresha Wijethunga, Author, is
a lecturer of Department of Finance,
Faculty of Management and Finance,
University of Colombo, Sri Lanka. Her
research interests include Financial
Markets, Banking, Corporate Finance
and Stock Market. This would be the second local journal
publications to her credit as a new researcher.
2
Nishani Ekanayake, Author, is a
senior lecturer of Department of
Finance, Faculty of Management and
Finance, University of Colombo, Sri
Lanka. Her research interests include
Financial Markets, Banking, Micro
Finance and Non -Bank financial institutions. This would
be the third local journal publications to her credit. She
has supervised over 10 research students.

267
IB Adoption in Sri Lanka: Analysis of Demographic Variables of Banking Customers
JM Wasantha Premarathne
Department of Management and Finance, Kotelawala Defence University, Sri Lanka
Abstract — Contemporary concepts of information
and communication technology and
implementation strategies to banking services have
become a significant matter to all banks in Sri
Lanka. The advancement in technology has played
an important role in improving service delivery
standards in the banking industry. At present, Sri
Lanka has a liberalized telecommunications market
that has huge impacts on the economic and social
development of the country. The Sri Lankan
government has initiated several projects,
emphasizing the need in rural areas and to provide
unrestricted sources of information to all its citizens.
When compared with the development of
information and communication technology in the
country, the demand for Internet Banking facilities
is not at a significant level. Therefore, the main
objective of this research study was to analyse the
demographic factors of IB users and IB non-users in
Sri Lanka. This study incorporates both primary and
secondary data. Primary data were collected by
utilizing semi-structured interviews and a customer
survey of the selected banks in Sri Lanka: private
bank (Sampath Bank), government bank (Bank of
Ceylon) and a foreign bank in Sri Lanka (HSBC). The
questionnaire was mailed and handed over to the
customers of each bank along with a postage-paid
return envelope and a cover letter explaining the
purpose of the study. A total of 253 questionnaires
were received resulting in a response rate of about
forty two percent. However, only 240
questionnaires were useable as in the remaining
questionnaires, substantial portions were not filled
in. Therefore, the samples include 120 IB users and
120 IB non-users. The convenience sampling
method was employed to select the sample of IB
and IB non-customers for this study. Analyses of the
ungrouped binary data were based on a binary
Logistic Model and Statistical Measurements:
Central Tendency, Dispersion and Skewness. Data
were analyzed using Eviews version 5 application to
strengthen the accuracy of results. McFadden R2
(R2McF), P, and Likelihood Ratio (LR) Statistic tests
were utilized for testing the goodness of fit,
statistical significance of the parameters and for
testing the overall significance of the model. In
addition, the Jarque-Bera (JB) test was used for
testing Normality. The findings of this study have
important implications for researchers in the field of
IB, banks that are currently offering IB services as
well as banks that are planning to offer such
services. The outcomes of this research can be
applied to developing countries in the region in
general.
Keywords— Internet Banking, Demographic
Analysis, Banking in Sri Lanka
I. INTRODUCTION
The term Internet Banking (IB) refers to the use of
Internet technology to offer banking facilities to
remote clients. Pikkarainen et al (2004) defined
Internet Banking as an ‘Internet portal, through
which customers can use different kinds of banking
services ranging from bill payment to making
investments’. According to the Oxford English
Dictionary (2014), electronic banking is banking
transactions carried out electronically without
involving the physical deposit or receipt of cash or
checks; maintenance of a bank account by means of
computer and telecommunications equipment and
software. E-banking is providing the customers
their banking information via diversified delivery
channels that can be accessed through different
technological devices i.e. a computer or a cell
phone with built in browser utility or telephone or
any other digital technology. The above two
definitions show that IB is a sub category of E-
banking. The usage of the Internet is rapidly
increasing in Sri Lanka. However, the usage of IB is
very slow compared to the increase of Internet
users (Weerasekara, 2011). Despite the recent
improvements in IB, there are still some
constraints, mainly security related issues and some
other factors, which contribute to the hesitations of
268
individuals’ IB adoption (Arslan, 2012). The main
objective of this research study was to analyse the
effect of demographic variables of banking
customers on IB adoption in Sri Lanka.
The findings of the present study were subjected to
few limitations: (i) Due to the initiation stage of
Internet Banking services available in Sri Lanka,
many customers are not aware of and/or do not
understand the nature of Internet-based banking
services. Many customers were not able to
determine the level of the Internet Banking service
available. (ii) The sample used for the study was
from specific geographical areas of Sri Lanka. Thus,
generalization of the findings of this study is limited
to some extent. (iii) Some of the variables of
the model were taken from the literature review
and others were taken from personal reflection. It
is possible, however, that other variables that were
not retained could have had a significant impact on
the adoption of Internet Banking. (iv) The
‘Questionnaire II’ was designed for respondents
who had not adopted Internet Banking. Therefore,
the respondents had found certain questions
difficult to understand due to the lack of technical
knowledge. (v) The proposed binary logistic model
does not utilize interactive variables as additional
variables.
II. LITERATURE REVIEW
Kim, et al (2005) investigate determinants of
Internet Banking adoption based on individuals’
demographic and financial characteristics and use
of other electronic banking technologies. They
examined the influence of adoption of Internet
Banking on the likelihood of using cheques vs.
direct bill payments as payment instruments. They
showed that consumers’ demographic and financial
characteristics and use of other electronic banking
technologies play a significant role in the decision
to adopt Internet Banking. Khan & Emmambokus
(2011) assessed the factors that contribute to the
adoption of Internet Banking in Mauritius. They
concluded that factors such as age, income, service
usefulness, risk factor, checking account frequency
and Internet location are the main determinants for
a person to adopt online banking. However, in
developing countries, demographics such as
gender, area of residence and marital status have
been insignificant. Khan & Emmambokus (2011)
suggest that banks should implement more
marketing strategies to enhance Internet Banking
usage and educate the public, especially low and
middle-income earners and older aged people
more about the benefits of this service. The
researchers used a logistic regression model based
on a sample survey to analyze the factors that
influence Internet Banking. By using the surveyed
data of 1240 customers, the researchers concluded
that six explanatory variables namely age, income,
risk, usefulness of Internet Banking, frequency of
checking bank accounts and Internet location are
significant. Factors such as age, income, service
usefulness, risk factor, checking account frequency
and Internet location are the main determinants for
a person to opt for online banking. Chang (2006)
found that traditional demographic variables such
as sex, education, marital status, personal income
level, housing type and residential location are not
relevant indicators of whether Internet Banking will
be taken up or not with the exception of age.
Demographics do provide an indication of when
Internet Banking will be taken up. Males, and in
particular those over 45, are more likely to be early
adopters than females. The main factors affecting
the adoption of IB were explored by Singhal &
Padhmanabhan (2008) based on respondents’
perception on various Internet applications. The
study tries to examine whether there is any relation
with the demographic variables and respondents’
perception about IB; and, whether the user and
non-user perception differs. Margaret & Ngoma
(2013) tested whether there is a relationship
between the socio-demographic characteristics of
consumers and internet banking adoption in
Zimbabwe. The research highlighted that a positive
relationship exists between internet banking
adoption and educational level, income, age,
gender and occupation. Onyia & Tagg (2011)
examine the influence of seven demographic
variables: age, gender, level of education, marital
status, employment status, income level and area
of residence on retail banking customers’
behaviours toward IB adoption in Nigeria. A sample
of 500 customers was surveyed. The study
concludes that gender, level of education, and
employment status are the major demographic
affecters of Nigerian banking customers’ attitudes
to IB adoption.
The following hypotheses were derived from the
empirical studies.
H1: Age significantly affects acceptance of IB
H2: Gender significantly affects acceptance of IB
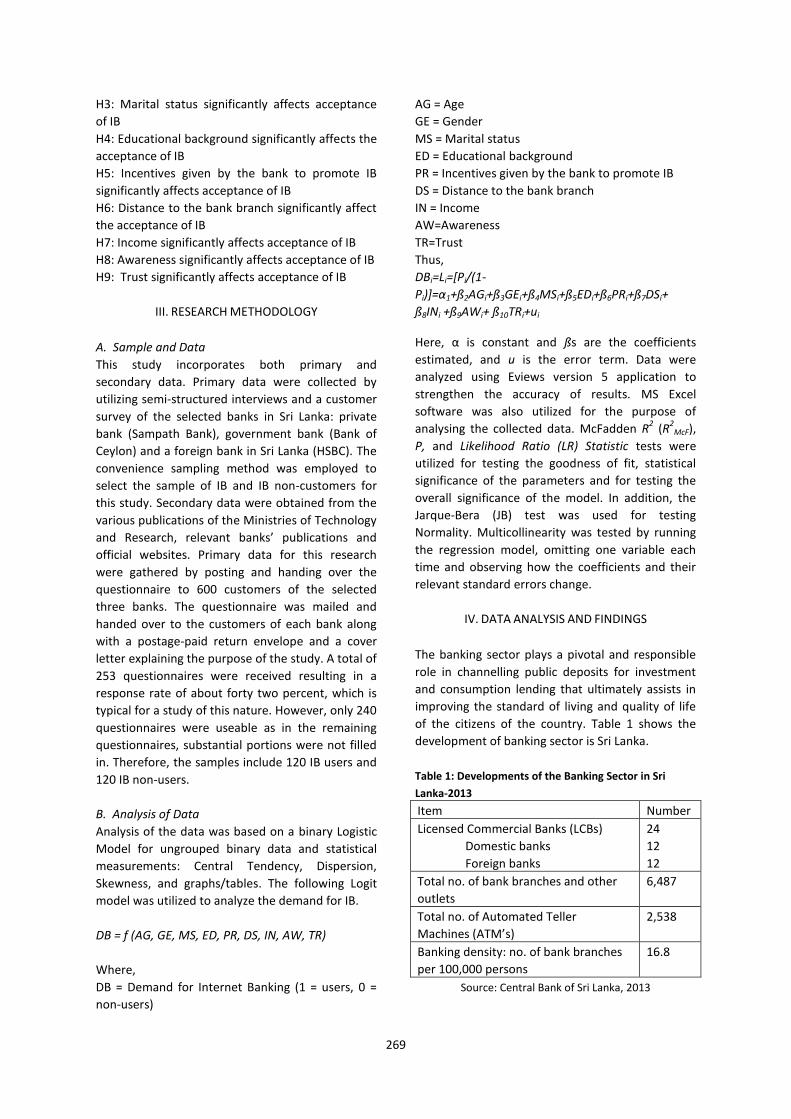
269
H3: Marital status significantly affects acceptance
of IB
H4: Educational background significantly affects the
acceptance of IB
H5: Incentives given by the bank to promote IB
significantly affects acceptance of IB
H6: Distance to the bank branch significantly affect
the acceptance of IB
H7: Income significantly affects acceptance of IB
H8: Awareness significantly affects acceptance of IB
H9: Trust significantly affects acceptance of IB
III. RESEARCH METHODOLOGY
A. Sample and Data
This study incorporates both primary and
secondary data. Primary data were collected by
utilizing semi-structured interviews and a customer
survey of the selected banks in Sri Lanka: private
bank (Sampath Bank), government bank (Bank of
Ceylon) and a foreign bank in Sri Lanka (HSBC). The
convenience sampling method was employed to
select the sample of IB and IB non-customers for
this study. Secondary data were obtained from the
various publications of the Ministries of Technology
and Research, relevant banks’ publications and
official websites. Primary data for this research
were gathered by posting and handing over the
questionnaire to 600 customers of the selected
three banks. The questionnaire was mailed and
handed over to the customers of each bank along
with a postage-paid return envelope and a cover
letter explaining the purpose of the study. A total of
253 questionnaires were received resulting in a
response rate of about forty two percent, which is
typical for a study of this nature. However, only 240
questionnaires were useable as in the remaining
questionnaires, substantial portions were not filled
in. Therefore, the samples include 120 IB users and
120 IB non-users.
B. Analysis of Data
Analysis of the data was based on a binary Logistic
Model for ungrouped binary data and statistical
measurements: Central Tendency, Dispersion,
Skewness, and graphs/tables. The following Logit
model was utilized to analyze the demand for IB.
DB = f (AG, GE, MS, ED, PR, DS, IN, AW, TR)
Where,
DB = Demand for Internet Banking (1 = users, 0 =
non-users)
AG = Age
GE = Gender
MS = Marital status
ED = Educational background
PR = Incentives given by the bank to promote IB
DS = Distance to the bank branch
IN = Income
AW=Awareness
TR=Trust
Thus,
DBi=Li=[Pi/(1-
Pi)]=α1+ß2AGi+ß3GEi+ß4MSi+ß5EDi+ß6PRi+ß7DSi+
ß8INi +ß9AWi+ ß10TRi+ui
Here, α is constant and ßs are the coefficients
estimated, and u is the error term. Data were
analyzed using Eviews version 5 application to
strengthen the accuracy of results. MS Excel
software was also utilized for the purpose of
analysing the collected data. McFadden R2 (R
2McF),
P, and Likelihood Ratio (LR) Statistic tests were
utilized for testing the goodness of fit, statistical
significance of the parameters and for testing the
overall significance of the model. In addition, the
Jarque-Bera (JB) test was used for testing
Normality. Multicollinearity was tested by running
the regression model, omitting one variable each
time and observing how the coefficients and their
relevant standard errors change.
IV. DATA ANALYSIS AND FINDINGS
The banking sector plays a pivotal and responsible
role in channelling public deposits for investment
and consumption lending that ultimately assists in
improving the standard of living and quality of life
of the citizens of the country. Table 1 shows the
development of banking sector is Sri Lanka.
Table 1: Developments of the Banking Sector in Sri
Lanka-2013
Item Number
Licensed Commercial Banks (LCBs)
Domestic banks
Foreign banks
24
12
12
Total no. of bank branches and other
outlets
6,487
Total no. of Automated Teller
Machines (ATM’s)
2,538
Banking density: no. of bank branches
per 100,000 persons
16.8
Source: Central Bank of Sri Lanka, 2013
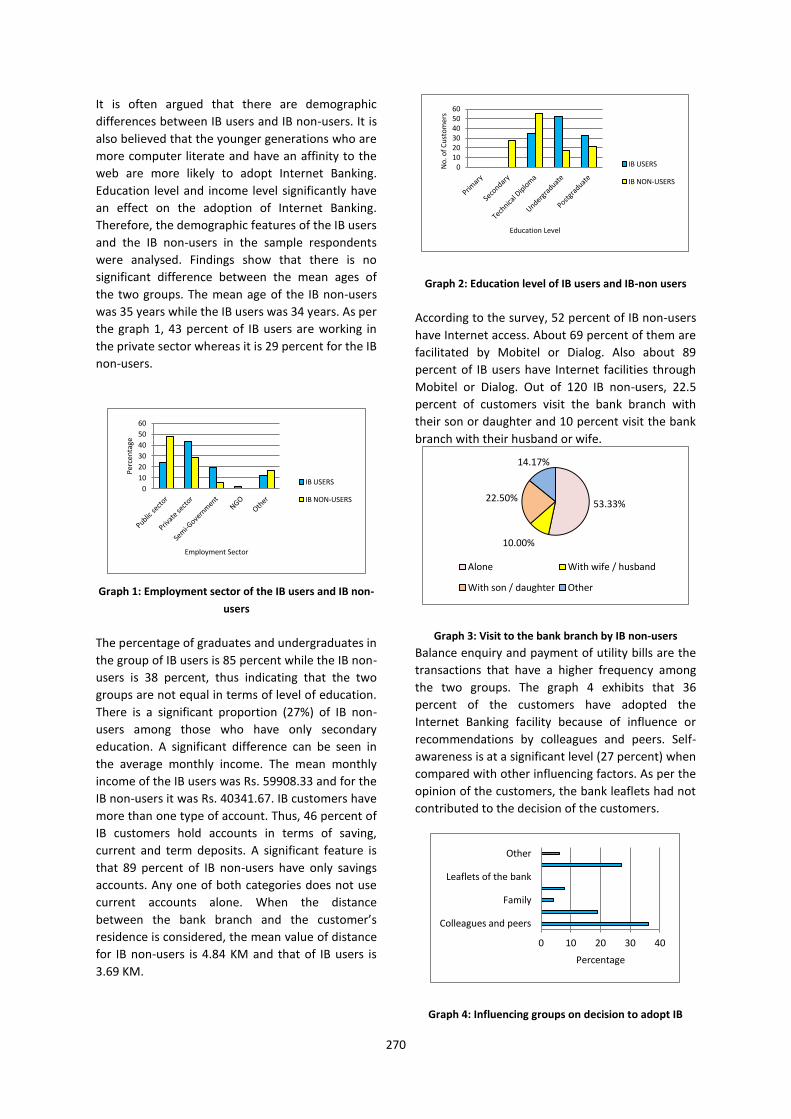
270
It is often argued that there are demographic
differences between IB users and IB non-users. It is
also believed that the younger generations who are
more computer literate and have an affinity to the
web are more likely to adopt Internet Banking.
Education level and income level significantly have
an effect on the adoption of Internet Banking.
Therefore, the demographic features of the IB users
and the IB non-users in the sample respondents
were analysed. Findings show that there is no
significant difference between the mean ages of
the two groups. The mean age of the IB non-users
was 35 years while the IB users was 34 years. As per
the graph 1, 43 percent of IB users are working in
the private sector whereas it is 29 percent for the IB
non-users.
Graph 1: Employment sector of the IB users and IB non-
users
The percentage of graduates and undergraduates in
the group of IB users is 85 percent while the IB non-
users is 38 percent, thus indicating that the two
groups are not equal in terms of level of education.
There is a significant proportion (27%) of IB non-
users among those who have only secondary
education. A significant difference can be seen in
the average monthly income. The mean monthly
income of the IB users was Rs. 59908.33 and for the
IB non-users it was Rs. 40341.67. IB customers have
more than one type of account. Thus, 46 percent of
IB customers hold accounts in terms of saving,
current and term deposits. A significant feature is
that 89 percent of IB non-users have only savings
accounts. Any one of both categories does not use
current accounts alone. When the distance
between the bank branch and the customer’s
residence is considered, the mean value of distance
for IB non-users is 4.84 KM and that of IB users is
3.69 KM.
Graph 2: Education level of IB users and IB-non users
According to the survey, 52 percent of IB non-users
have Internet access. About 69 percent of them are
facilitated by Mobitel or Dialog. Also about 89
percent of IB users have Internet facilities through
Mobitel or Dialog. Out of 120 IB non-users, 22.5
percent of customers visit the bank branch with
their son or daughter and 10 percent visit the bank
branch with their husband or wife.
Graph 3: Visit to the bank branch by IB non-users
Balance enquiry and payment of utility bills are the
transactions that have a higher frequency among
the two groups. The graph 4 exhibits that 36
percent of the customers have adopted the
Internet Banking facility because of influence or
recommendations by colleagues and peers. Self-
awareness is at a significant level (27 percent) when
compared with other influencing factors. As per the
opinion of the customers, the bank leaflets had not
contributed to the decision of the customers.
Graph 4: Influencing groups on decision to adopt IB
0
10
20
30
40
50
60
Pe
rcen
tage
Employment Sector
IB USERS
IB NON-USERS
0 10 20 30 40 50 60
No
. of
Cu
sto
mer
s
Education Level
IB USERS
IB NON-USERS
53.33%
10.00%
22.50%
14.17%
Alone With wife / husband
With son / daughter Other
0 10 20 30 40
Colleagues and peers
Family
Leaflets of the bank
Other
Percentage
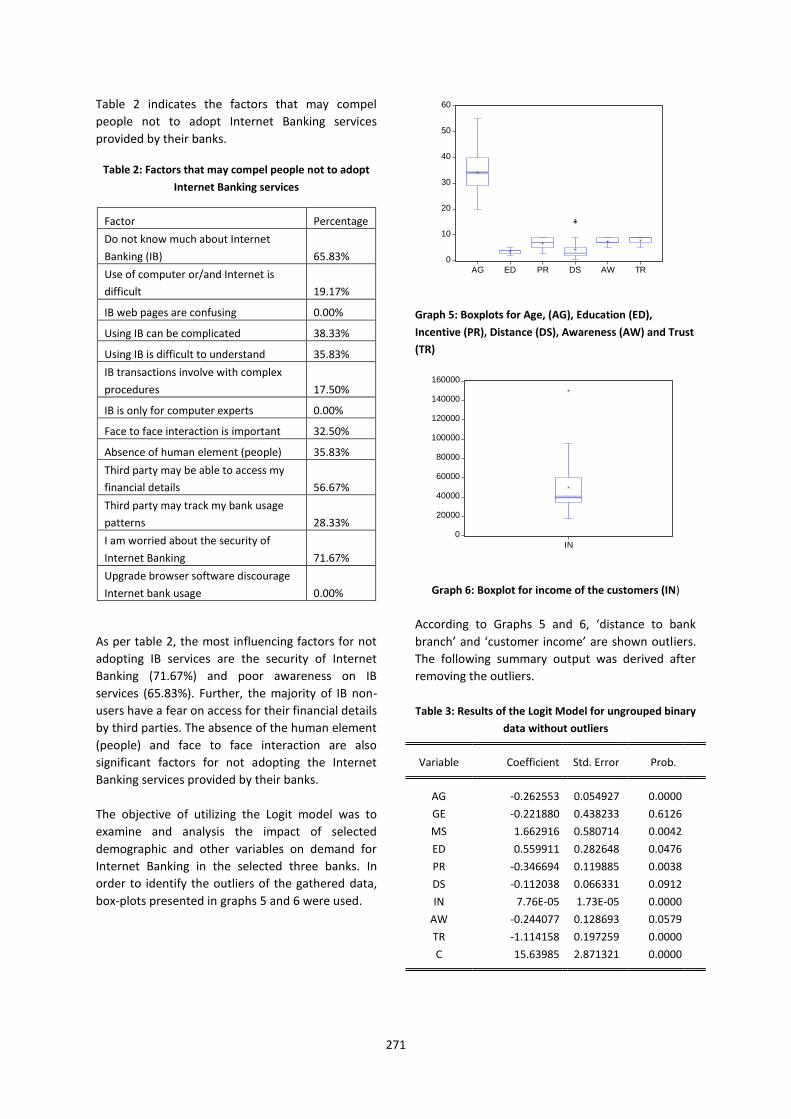
271
Table 2 indicates the factors that may compel
people not to adopt Internet Banking services
provided by their banks.
Table 2: Factors that may compel people not to adopt
Internet Banking services
Factor Percentage
Do not know much about Internet
Banking (IB) 65.83%
Use of computer or/and Internet is
difficult 19.17%
IB web pages are confusing 0.00%
Using IB can be complicated 38.33%
Using IB is difficult to understand 35.83%
IB transactions involve with complex
procedures 17.50%
IB is only for computer experts 0.00%
Face to face interaction is important 32.50%
Absence of human element (people) 35.83%
Third party may be able to access my
financial details 56.67%
Third party may track my bank usage
patterns 28.33%
I am worried about the security of
Internet Banking 71.67%
Upgrade browser software discourage
Internet bank usage 0.00%
As per table 2, the most influencing factors for not
adopting IB services are the security of Internet
Banking (71.67%) and poor awareness on IB
services (65.83%). Further, the majority of IB non-
users have a fear on access for their financial details
by third parties. The absence of the human element
(people) and face to face interaction are also
significant factors for not adopting the Internet
Banking services provided by their banks.
The objective of utilizing the Logit model was to
examine and analysis the impact of selected
demographic and other variables on demand for
Internet Banking in the selected three banks. In
order to identify the outliers of the gathered data,
box-plots presented in graphs 5 and 6 were used.
Graph 5: Boxplots for Age, (AG), Education (ED),
Incentive (PR), Distance (DS), Awareness (AW) and Trust
(TR)
Graph 6: Boxplot for income of the customers (IN)
According to Graphs 5 and 6, ‘distance to bank
branch’ and ‘customer income’ are shown outliers.
The following summary output was derived after
removing the outliers.
Table 3: Results of the Logit Model for ungrouped binary
data without outliers
Variable Coefficient Std. Error Prob.
AG -0.262553 0.054927 0.0000
GE -0.221880 0.438233 0.6126
MS 1.662916 0.580714 0.0042
ED 0.559911 0.282648 0.0476
PR -0.346694 0.119885 0.0038
DS -0.112038 0.066331 0.0912
IN 7.76E-05 1.73E-05 0.0000
AW -0.244077 0.128693 0.0579
TR -1.114158 0.197259 0.0000
C 15.63985 2.871321 0.0000
0
10
20
30
40
50
60
AG ED PR DS AW TR
0
20000
40000
60000
80000
100000
120000
140000
160000
IN
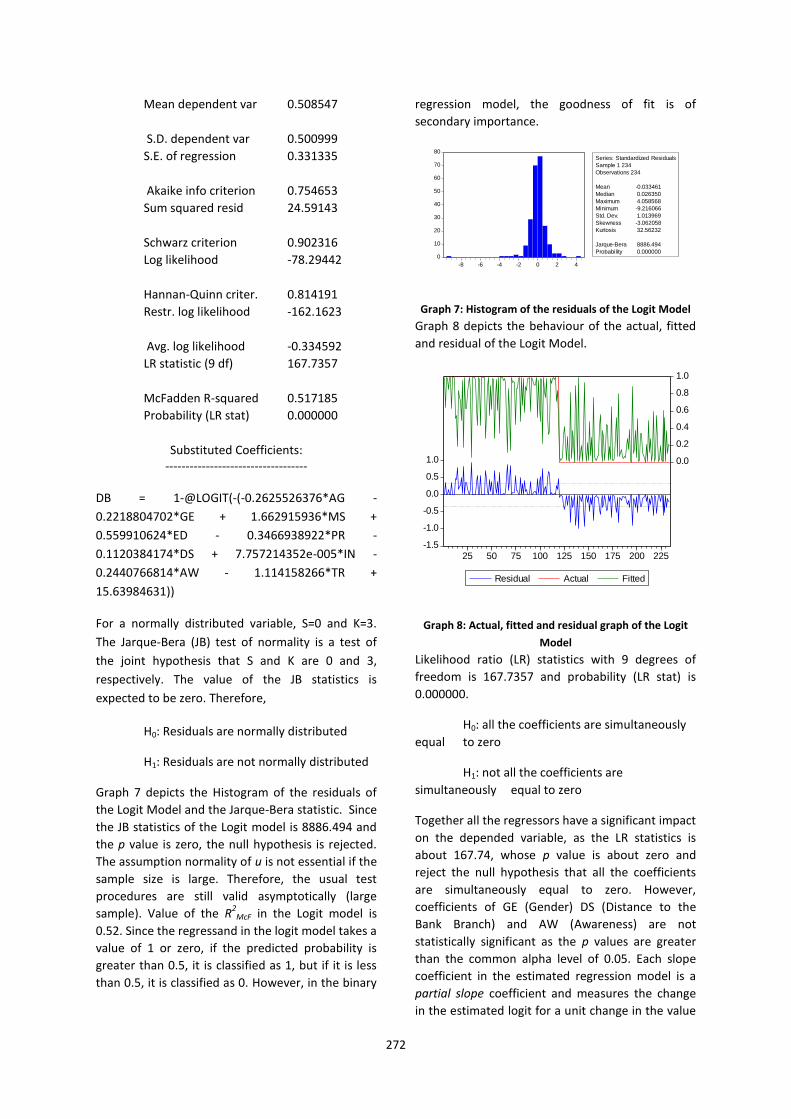
272
Mean dependent var 0.508547
S.D. dependent var 0.500999
S.E. of regression 0.331335
Akaike info criterion 0.754653
Sum squared resid 24.59143
Schwarz criterion 0.902316
Log likelihood -78.29442
Hannan-Quinn criter. 0.814191
Restr. log likelihood -162.1623
Avg. log likelihood -0.334592
LR statistic (9 df) 167.7357
McFadden R-squared 0.517185
Probability (LR stat) 0.000000
Substituted Coefficients: -----------------------------------
DB = 1-@LOGIT(-(-0.2625526376*AG -
0.2218804702*GE + 1.662915936*MS +
0.559910624*ED - 0.3466938922*PR -
0.1120384174*DS + 7.757214352e-005*IN -
0.2440766814*AW - 1.114158266*TR +
15.63984631))
For a normally distributed variable, S=0 and K=3.
The Jarque-Bera (JB) test of normality is a test of
the joint hypothesis that S and K are 0 and 3,
respectively. The value of the JB statistics is
expected to be zero. Therefore,
H0: Residuals are normally distributed
H1: Residuals are not normally distributed
Graph 7 depicts the Histogram of the residuals of
the Logit Model and the Jarque-Bera statistic. Since
the JB statistics of the Logit model is 8886.494 and
the p value is zero, the null hypothesis is rejected.
The assumption normality of u is not essential if the
sample size is large. Therefore, the usual test
procedures are still valid asymptotically (large
sample). Value of the R2
McF in the Logit model is
0.52. Since the regressand in the logit model takes a
value of 1 or zero, if the predicted probability is
greater than 0.5, it is classified as 1, but if it is less
than 0.5, it is classified as 0. However, in the binary
regression model, the goodness of fit is of
secondary importance.
Graph 7: Histogram of the residuals of the Logit Model
Graph 8 depicts the behaviour of the actual, fitted
and residual of the Logit Model.
Graph 8: Actual, fitted and residual graph of the Logit
Model
Likelihood ratio (LR) statistics with 9 degrees of
freedom is 167.7357 and probability (LR stat) is
0.000000.
H0: all the coefficients are simultaneously
equal to zero
H1: not all the coefficients are
simultaneously equal to zero
Together all the regressors have a significant impact
on the depended variable, as the LR statistics is
about 167.74, whose p value is about zero and
reject the null hypothesis that all the coefficients
are simultaneously equal to zero. However,
coefficients of GE (Gender) DS (Distance to the
Bank Branch) and AW (Awareness) are not
statistically significant as the p values are greater
than the common alpha level of 0.05. Each slope
coefficient in the estimated regression model is a
partial slope coefficient and measures the change
in the estimated logit for a unit change in the value
0
10
20
30
40
50
60
70
80
-8 -6 -4 -2 0 2 4
Series: Standardized Residuals
Sample 1 234
Observations 234
Mean -0.033461
Median 0.026350
Maximum 4.058568
Minimum -9.216066
Std. Dev. 1.013969
Skewness -3.062058
Kurtosis 32.56232
Jarque-Bera 8886.494
Probability 0.000000
-1.5
-1.0
-0.5
0.0
0.5
1.0 0.0
0.2
0.4
0.6
0.8
1.0
25 50 75 100 125 150 175 200 225
Residual Actual Fitted
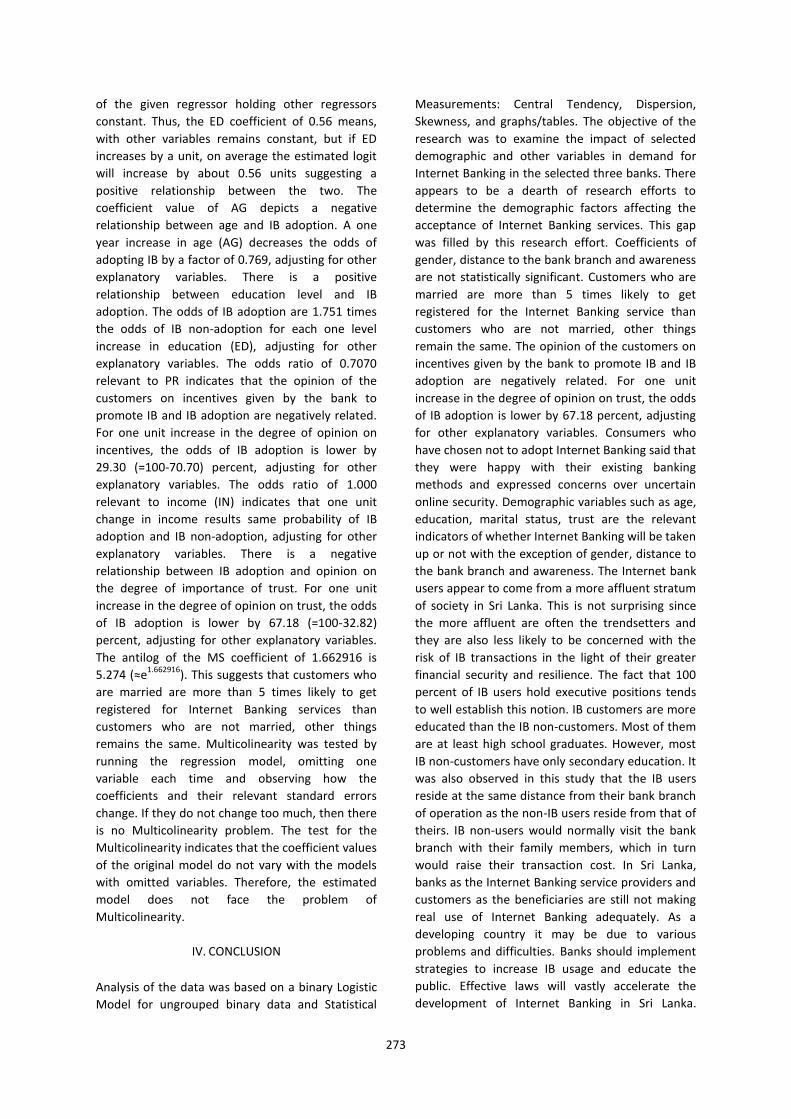
273
of the given regressor holding other regressors
constant. Thus, the ED coefficient of 0.56 means,
with other variables remains constant, but if ED
increases by a unit, on average the estimated logit
will increase by about 0.56 units suggesting a
positive relationship between the two. The
coefficient value of AG depicts a negative
relationship between age and IB adoption. A one
year increase in age (AG) decreases the odds of
adopting IB by a factor of 0.769, adjusting for other
explanatory variables. There is a positive
relationship between education level and IB
adoption. The odds of IB adoption are 1.751 times
the odds of IB non-adoption for each one level
increase in education (ED), adjusting for other
explanatory variables. The odds ratio of 0.7070
relevant to PR indicates that the opinion of the
customers on incentives given by the bank to
promote IB and IB adoption are negatively related.
For one unit increase in the degree of opinion on
incentives, the odds of IB adoption is lower by
29.30 (=100-70.70) percent, adjusting for other
explanatory variables. The odds ratio of 1.000
relevant to income (IN) indicates that one unit
change in income results same probability of IB
adoption and IB non-adoption, adjusting for other
explanatory variables. There is a negative
relationship between IB adoption and opinion on
the degree of importance of trust. For one unit
increase in the degree of opinion on trust, the odds
of IB adoption is lower by 67.18 (=100-32.82)
percent, adjusting for other explanatory variables.
The antilog of the MS coefficient of 1.662916 is
5.274 (≈e1.662916
). This suggests that customers who
are married are more than 5 times likely to get
registered for Internet Banking services than
customers who are not married, other things
remains the same. Multicolinearity was tested by
running the regression model, omitting one
variable each time and observing how the
coefficients and their relevant standard errors
change. If they do not change too much, then there
is no Multicolinearity problem. The test for the
Multicolinearity indicates that the coefficient values
of the original model do not vary with the models
with omitted variables. Therefore, the estimated
model does not face the problem of
Multicolinearity.
IV. CONCLUSION
Analysis of the data was based on a binary Logistic
Model for ungrouped binary data and Statistical
Measurements: Central Tendency, Dispersion,
Skewness, and graphs/tables. The objective of the
research was to examine the impact of selected
demographic and other variables in demand for
Internet Banking in the selected three banks. There
appears to be a dearth of research efforts to
determine the demographic factors affecting the
acceptance of Internet Banking services. This gap
was filled by this research effort. Coefficients of
gender, distance to the bank branch and awareness
are not statistically significant. Customers who are
married are more than 5 times likely to get
registered for the Internet Banking service than
customers who are not married, other things
remain the same. The opinion of the customers on
incentives given by the bank to promote IB and IB
adoption are negatively related. For one unit
increase in the degree of opinion on trust, the odds
of IB adoption is lower by 67.18 percent, adjusting
for other explanatory variables. Consumers who
have chosen not to adopt Internet Banking said that
they were happy with their existing banking
methods and expressed concerns over uncertain
online security. Demographic variables such as age,
education, marital status, trust are the relevant
indicators of whether Internet Banking will be taken
up or not with the exception of gender, distance to
the bank branch and awareness. The Internet bank
users appear to come from a more affluent stratum
of society in Sri Lanka. This is not surprising since
the more affluent are often the trendsetters and
they are also less likely to be concerned with the
risk of IB transactions in the light of their greater
financial security and resilience. The fact that 100
percent of IB users hold executive positions tends
to well establish this notion. IB customers are more
educated than the IB non-customers. Most of them
are at least high school graduates. However, most
IB non-customers have only secondary education. It
was also observed in this study that the IB users
reside at the same distance from their bank branch
of operation as the non-IB users reside from that of
theirs. IB non-users would normally visit the bank
branch with their family members, which in turn
would raise their transaction cost. In Sri Lanka,
banks as the Internet Banking service providers and
customers as the beneficiaries are still not making
real use of Internet Banking adequately. As a
developing country it may be due to various
problems and difficulties. Banks should implement
strategies to increase IB usage and educate the
public. Effective laws will vastly accelerate the
development of Internet Banking in Sri Lanka.
274
Effective privacy protection laws considering the
Internet environment will help to build trust and
consumer confidence.
REFERENCES
Arslan, A. (2012) The effect of socio-economic and
demographic factors of Turkish
provinces on the number of active
customers using internet banking.
International Journal of Human Sciences,
9(2), pp. 288-302.
Chang, Y.T. (2006) Dynamics of Internet Banking:
Lessons from Korea. CCP Working Paper
06-3, The ESRC Centre for Competition
Policy (CCP), University of East Anglia.
Khan, N.M. & Emmambokus, N. (2011) Customer
Adoption of Internet Banking in
Mauritius. International Journal of Business
Research and Management, 2(2), pp. 53-58.
Kim, B.M., Widdows, R. & Yilmazer, T. (2006) The
Determinants of Consumers’ Adoption of
Internet Banking: Factors Determining
Consumer Adoption of Internet Banking.
[Online] Available form:
http://papers.ssrn.com/sol3/papers.cfm?abstr
act_id=1 021484 [Accessed 21st March 2013].
Margaret, M. & Ngoma, M.F. (2013) Socio-demographic
factors influencing adoption of internet banking
in Zimbabwe. Journal of Sustainable
Development in Africa, 15 (8), pp. 145-154.
Onyia, O.P. & Tagg, S.K.(2011) Effects of demographic
factors on bank customers’ attitudes
and intention toward Internet banking
adoption in a major developing
African country. Journal of Financial Services
Marketing, 16 (3/4), pp. 294–315.
Oxford English Dictionary (2013) Oxford English
Dictionary Online. Oxford, Oxford
University Press. [Online] Available from:
http://dictionary.oed.com/ [Accessed 10th
December 2013].
Pikkarainen, T., Pikkarainen, K., Karjaluoto, H., & Pahnila,
S. (2004) Consumer a cceptance of
Online banking: An extension of the technology
acceptance model. Internet Research,
14(3), 224–235.
Singhal, D. & Padhmanabhan, V. (2008) A Study on
Customer Perception Towards I
nternet Banking: Identifying Major
Contributing Factors. The Journal of Nepalese
Business Studies, 1(1), pp.101-111.
Weerasekara, S (2011) An Empirical Study on Slow and
Limited Adoption of Internet Banking By Sri
Lankan Customers. International Conference
on Industrial and Information
Systems(ICIIS), (6), pp. 404- 409.
BIOGRAPHY OF THE AUTHOR
Author is a senior lecturer in the field
of International Economics and Supply
Chain Management at Kotalawala
Defence University, Sri Lanka. His
research interests include Internet
Banking, Inflation and Outsourcing. He has presented
more than 10 research studies at international
conferences. He is a member of the editorial board of
International Journal of liberal arts and social science.
The author has supervised more than 10 master's theses.
275
Poster presentations
276
Socio - Economic Implications on Southern Highway Project Special Reference to Evicted People
Pramoda Sarojini
Sri Lanka Foundation, No.100, Independence Square, Colombo 07
Abstract — In developing countries, development
related population displacement has grown rapidly
over the past few decades due to the compelling
need for infrastructure as a result of fast growing
population densities. Those displaced due to
development projects are resettled by project
planners, but have to face specific socio economic
issues in their newly relocated areas.
This study focuses on identifying social, cultural and
economic implications of evicted persons. The
Southern Highway, the main development project
was selected to examine this problem.
Both primary and secondary data sources were used
to achieve the objective of this research. To collect
the primary data from the units of sample the
researcher used structured interviews and semi
structured interviews. Guideline questionnaire
along with the IRR Model was used to conduct the
interviews. Other than this, researcher was able to
carry out number of observations as prior to
prepare the questionnaire as well as to check its
accuracy of the answers given by the respondents.
Study Population of this study was 40 families which
consist of 70 families who were living in that period.
Study samples have identified eight risks;
Homelessness, Landlessness, Unemployment,
Marginalization, Food insecurity, Increased
morbidity and Mortality, Loss of common property
and Services and Social disarticulation. In relation to
that, the issues faced by resettled community can be
divided three categories based on depth of
problems.
Most affected problems were Physical
Marginalization and Psychological Marginalization,
Loss of Social and Cultural Value of ancestral home,
Social Insecurity, Social Stress, Social
Disarticulation, Landlessness, Deprivation of Social
Capital. Breakdown the livelihoods, Loss of access to
common property were the marginally effected
problems and less effected problems were food
insecurity and morbidity.
The broad ranges of problems are not only the
economic risks, but also the social and cultural
problems also contribute. Those are inter-related
problems and doesn’t affect to the community
equally therefore the dimensions of issues are
differentiating from one another. One might think
that the severances are high with the economic risks,
but on the contrary social risks are severe than the
economic ones. Due to the development projects, the
environment in which the people lived in was
subjected to harsh changes, the people lost their
familiar environment and this can’t be evaluated
through the scales of economy.
Keywords: Involuntary resettlement, involuntary
displacement, risks, evicted people.
I. INTRODUCTION
Resettlement is a response to displacement, or
involuntary movement. Displacement is a forced
migration, where people move because of an
external shock-whether it is a development project,
a natural disaster or civil conflict. As same as
Development induced displacement and
resettlement (DIDR) occurs as a result of human
driven economic activities, mainly related to large
scale infrastructure projects such as irrigation,
power, and roads. Resettlement is a socio
cultural/economic process that happens initially to
people rather than their physical environment
(Muggah, 2008).
Involuntary resettlement is often a consequence of
planned change generated by major development
projects or programs. As a result of acquiring land
for development projects, people are evacuated
from their homes.
277
The main cause of involuntary resettlement is
acquisition of their land and water resources for
major development. According to that Southern
Transport Development Project (STDP) was the first
controlled access expressway to be built in Sri
Lanka. It was constructed from Makumbura in
Kottawa of the Western Province to Matara in the
Southern Province covering a total distance of 128
kilo-meters.
Consistent with the position Report issued by the
STDP to the project coordinating committee 10,271
lots were acquired for the Express Right Way. An
estimated 1, 3338 families have been displaced due
to land acquisition displaced households as well as
livelihoods (Ministry of Land, 2003).
The objective of this study was to identify social,
cultural and economic implications of evicted
people due to STDP.
II. THEORITICAL FRAMEWORK
The Model of Risks and Risk Avoidance (IRR Model)
was applied to examine the issues being faced by
the evicted community. This Model developed
during the nineties by Michel M. Cernea Sociologist
in cooperation with the World Bank.
IRR model has four functions. A) Predictive
functions B) diagnostic functions C) Planning and
problem resolving function D) Research function.
Cernea has pointed out eight risks affecting
displaced people. Such as; landlessness,
joblessness, homelessness, social marginalization,
increased mortality and morbidity, food insecurity,
loss of access to common property and social
disarticulation.
III. RESEARCH METHODOLOGY
Both primary and secondary data sources were
used to achieve the objective of this research. To
collect the primary data from the units of sample
the researcher used structured interviews and semi
structured interviews. Guideline questionnaire
along with the IRR Model was used to conduct the
interviews. This questionnaire was designed by the
researcher especially for the research objective.
Other than this, researcher was able to carry out
number of observations as prior to prepare the
questionnaire as well as to check its accuracy of the
answers given by the respondents.
The highest number of people has been evacuated
from Galle district than other districts and even
number of affected AGA divisions were reported
from Galle district. ie.Bentota, Elpitiya,
Karandeniya, Baddegama, Bope, Poddala,
Akmeemana, Emaduwa and Galle Kadawathsathara
hence, Karandeniya AGA division was selected from
Galle district to get study population. Karandeniya
AGA Division, which consisted different socio-
economic features, was selected to get study
sample. There were two resettlement locations in
Karandeniya AGA Division, which are
Pathirajawatte and Vilson estate. Among these
two, evicted people are living in Pathirajawatte
resettlement scheme was study sample for data
collection.
A sample 40 evicted families was selected using
systematic random sampling which could be
including entire population to the sample. Sample
frame was collected from the resettlement office in
Galle. According to that researcher was able to
select 40 families one after other.
Since this was mainly based on qualitative data,
Anthropac method used to analyze the data and
Relevant theory applied to describe field data.
IV. RESULTS
The analysis was based on empirical evidence
focused on IRR Model. According to that it can be
divided into three categories based on severity of
the issues.
A. Highest Social issues
(a) Physical Marginalization and Psychological
Marginalization
(b) Loss of Social and Cultural Value of
ancestral home
(c) Social Insecurity
(d) Social Stress
(e) Social Disarticulation
(f) Landlessness
(g) Deprivation of Social Capital
B. Marginal Social issues
(a) Breakdown the livelihoods
(b) Loss of access to common property
C. Lower Social issues
(a) Food insecurity
(b) Morbidity
278
Sample revealed several social implications.
Physical Marginalization and Psychological
Marginalization, Social and Cultural value of
ancestral home, Social Insecurity, Social Stress,
Social Disarticulation, Landlessness, Deprivation of
Social Capital are the most significant implications
of the community. These issues are interlinked and
influence each other: Some play a primary role and
others play a derivative role.
Physical Marginalization and Psychological
Marginalization
The main social issue was marginalisation among
the evicted community under STDP project. The
facets of marginalisation are multiple. The cultural
status of displacers is belittled when they go to new
relocation areas, where they are regarded as
"strangers" and denied opportunities and
entitlements. Psychological marginalization and its
consequences are typically overlooked in the
resettlement. For an example one elderly person
said that, the high way is on his land (“Oya para
thiyenne ape idame”). This statement has indicated
that how much psychologically the person is
affected by losing his land. Yet, cultural and
behavioural impairments, anxiety and decline in
self-esteem, have been widely reported from
people. Further, they are labelled as “Pàrata
Yatauna Aya” and “Àpu Aya” which in turn affects
them psychologically. Though they have been
received economical compensation the loss of their
ancestral home (Maha Gedara) has caused loss of
social and cultural value of “home.”
When they relocate in new locations, they have
been selected in dispersed manner. Therefore
neighbourous relationships have been pulled apart
and it has affected their social security too. The
people, who lived in the former village as
neighbours and relatives, have been randomly
resettled in the new locations. Such type of
selection has caused to raise other social issues
among them. It cumulates physical exclusion from a
geographic territory with economic and social
exclusion out of the set of functioning social
networks.
Loss of Social and Cultural Value of
ancestral home
The compensation provided for the demolished
shelters are made by not assessing a forecasted
market value rather than its replacement value, the
risk of homelessness has increased. The Sri Lankan
Society basically built its homes of the offspring
around the ancestral home called “Maha Gedara.”
Most people who were affected by the highway
have lived their whole life near their ancestral
homes. Though they have been offered
compensation for their houses, the loss of their
Maha Gedara has caused loss of social and cultural
value of “home.”
Social insecurity
Social insecurity is the harshest problem, which was
raised due to the random settlement. For an
example insecurity among children was discovered
by the research ie. When children came back from
school to their homes, the parents used to let them
stay at a neighbour’s place until they came after
work. But when they were re-settle in new
community this option was practically difficult to
carry out.
Social Stress and Morbidity
Research has documented that more vulnerable
groups, such as the elderly, suffer increased
morbidity and mortality rates as an effect of losing
their prior homes. Exposure to the "social stress"
inherent in forced relocation was highlighted as
having differential consequences on mental health
across age, gender, and marital and occupational
status.
Social Disarticulation
Social disarticulation is another severe problem
facing them. The dis-integration of social support
networks has far–reaching consequences. It
compounds individual losses with a loss of social
capital, dismantled patterns of social organization
are hard to rebuild. Such loss is higher in projects
that relocate people in a dispersed manner rather
than in groups and social units. The research has
found various manifestations of social
disarticulation, such as growing alienation,
loosening of intimate bonds, weakening of control
on interpersonal behaviour and lower cohesions in
family ties.
Dismantled social networks that once mobilized
people to act around common interests and to
meet their most pressing needs are difficult to
rebuild. This loss is greater in projects which
relocate families in a dispersed manner, severing
their prior ties with neighbours, rather than
relocating them in groups and social units. This
study found various manifestations of social

279
disarticulation within the kinship system, such as
the loosening of intimate bonds, growing alienation
and anomie, the weakening of control on
interpersonal behaviour, and lower cohesion in
family structures. Resettlers' relationships with
non-displaced kinsmen were eroded and
interaction between individual families was
reduced. As a result, participation in group activities
decreased; Weddings and Arms giving were
discontinued; and common burial grounds became
shapeless and disordered.
Landlessness
People’s productive systems, commercial activities
and livelihoods are constructed. This is the principle
form of de-capitalization and pauperization of
displaced people, as they lose both natural and
man- made capital.
Offering a small plot of land i.e. 20 perches and
having to travel a long distance to utilize the
previous unaffected lands in the native village are
the results of landlessness. Compensation
distributed among them was not adequate to
acquire another plot of land in the same area
where they lived-in earlier. In addition, the cultural
symbolic value of the land was destroyed when
land was acquired by the government for
development projects i.e. loss of land inheritance.
When land is acquired, the small businesses which
were running along that land were not evaluated
properly, hence when these people are resettled in
other locations; their businesses face grave
difficulties. For an example, take a small wood
workshop business being done by a person. When
he is resettled at a new location he will have to face
the competition with other similar type of
businesses in that locality thereby hindering his
economic prospects. Further, these types of
businesses contribute to the unemployment in that
area and when the business is re-located to a new
area, the unemployment increases in the previous
area.
Deprivation of Social Capital
The disintegration of social support networks has
far –reaching consequences. It compounds
individual losses with a loss of social capital;
dismantled pattern of social organizations are hard
to rebuild. Such loss is higher with the evicted
people since they have relocated in dispersed
manner rather than in groups and social units. This
sociological study found various manifestations of
social disarticulation, such as growing alienation,
the loosening of intimate bonds, weakening of
interpersonal behaviour, and lower cohesion in
family structures.
Breakdown the livelihoods
The risk of losing wage employment is very high
both in rural and urban displacements for those
employed in enterprises, services or agriculture.
Research findings point out two ways in losing jobs.
a) They have lost access to land owned by
others which are cropped, either leased or shared,
b) Inability to find job opportunities from the
new urban areas.
Though the project committees have proposed job
replacement systems, they have not been
implemented. Most of the communities who were
affected are rural communities, which is 93%. Since
belonging to a rural community, the whole living
system was based on land based production and
self-employment through these production
systems. These land based production systems are
collapsed when the resettled people are unable to
find adequate lands which sustain cultivation in the
resettled areas.
Loss of access to common property
Middle income farm households do not become
landless, but became smallholders. Marginalisation
and lack of access to common resources are the
marginal risks in the community. The causes of
marginalisation occur when the infrastructure &
services are discontinued after completion of the
particular project and these programs discontinue
integrating with the host community. For an
examples play ground, some roads still have not
been completed in the new location. The
participation and vote of the affected people are
not considered when re-establishing common
resources such as wells, play grounds, etc. Hence
the resettled people have to travel long distances
from their resettled homes to gain access to those
facilities thus weakening the common access to
these resources.
Food Insecurity
Cernea describe in her theory, forced uprooting
increases the risk that people will fall into
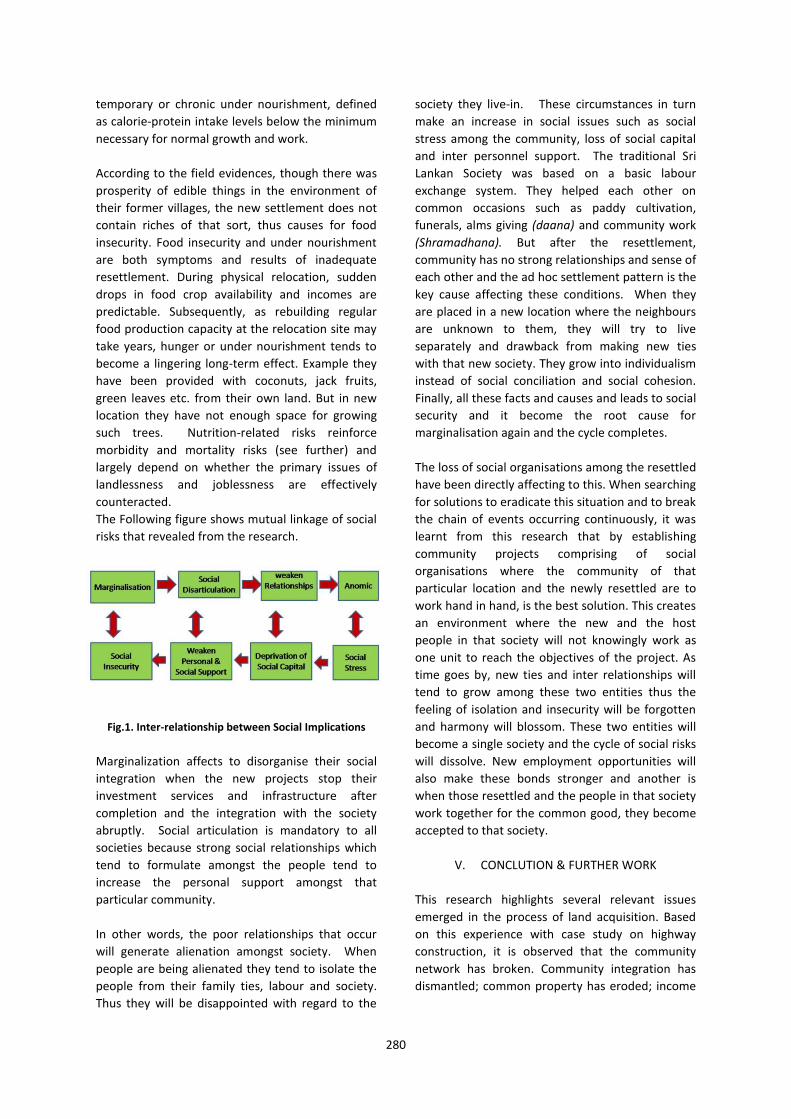
280
temporary or chronic under nourishment, defined
as calorie-protein intake levels below the minimum
necessary for normal growth and work.
According to the field evidences, though there was
prosperity of edible things in the environment of
their former villages, the new settlement does not
contain riches of that sort, thus causes for food
insecurity. Food insecurity and under nourishment
are both symptoms and results of inadequate
resettlement. During physical relocation, sudden
drops in food crop availability and incomes are
predictable. Subsequently, as rebuilding regular
food production capacity at the relocation site may
take years, hunger or under nourishment tends to
become a lingering long-term effect. Example they
have been provided with coconuts, jack fruits,
green leaves etc. from their own land. But in new
location they have not enough space for growing
such trees. Nutrition-related risks reinforce
morbidity and mortality risks (see further) and
largely depend on whether the primary issues of
landlessness and joblessness are effectively
counteracted.
The Following figure shows mutual linkage of social
risks that revealed from the research.
Fig.1. Inter-relationship between Social Implications
Marginalization affects to disorganise their social
integration when the new projects stop their
investment services and infrastructure after
completion and the integration with the society
abruptly. Social articulation is mandatory to all
societies because strong social relationships which
tend to formulate amongst the people tend to
increase the personal support amongst that
particular community.
In other words, the poor relationships that occur
will generate alienation amongst society. When
people are being alienated they tend to isolate the
people from their family ties, labour and society.
Thus they will be disappointed with regard to the
society they live-in. These circumstances in turn
make an increase in social issues such as social
stress among the community, loss of social capital
and inter personnel support. The traditional Sri
Lankan Society was based on a basic labour
exchange system. They helped each other on
common occasions such as paddy cultivation,
funerals, alms giving (daana) and community work
(Shramadhana). But after the resettlement,
community has no strong relationships and sense of
each other and the ad hoc settlement pattern is the
key cause affecting these conditions. When they
are placed in a new location where the neighbours
are unknown to them, they will try to live
separately and drawback from making new ties
with that new society. They grow into individualism
instead of social conciliation and social cohesion.
Finally, all these facts and causes and leads to social
security and it become the root cause for
marginalisation again and the cycle completes.
The loss of social organisations among the resettled
have been directly affecting to this. When searching
for solutions to eradicate this situation and to break
the chain of events occurring continuously, it was
learnt from this research that by establishing
community projects comprising of social
organisations where the community of that
particular location and the newly resettled are to
work hand in hand, is the best solution. This creates
an environment where the new and the host
people in that society will not knowingly work as
one unit to reach the objectives of the project. As
time goes by, new ties and inter relationships will
tend to grow among these two entities thus the
feeling of isolation and insecurity will be forgotten
and harmony will blossom. These two entities will
become a single society and the cycle of social risks
will dissolve. New employment opportunities will
also make these bonds stronger and another is
when those resettled and the people in that society
work together for the common good, they become
accepted to that society.
V. CONCLUTION & FURTHER WORK
This research highlights several relevant issues
emerged in the process of land acquisition. Based
on this experience with case study on highway
construction, it is observed that the community
network has broken. Community integration has
dismantled; common property has eroded; income
281
sources have lost; community insecurity and
marginalization are arising in the new location.
The IRR model captured a broad range of issues and
it is evident that not only the economic issues, but
the social and cultural issues also contribute. Those
are inter-related issues and do not affect the
community equally. Therefore the dimensions of
issues are differentiating from one another. One
might think that the severances is high with the
economic issues, but on the contrary, the social
issues are severe than the economic ones. Due to
the development projects, the environment in
which the people lived in was subjected to harsh
changes, the people lost their familiar environment
and this can’t be evaluated through the scales of
economy.
This can be accomplished through targeted
strategies such as;
a. Implementing the involuntary resettlement
policy issued by Asian Development Bank.
b. When implementing resettlement plan points
given in Social Impact Assessment (SIA) report
to be considered.
c. Involving the community for the risk analysis
and give considerable amount of importance
their ideas when making decisions.
d. Establishing new social institutions and
integration programs.
e. Building good relationship between community
and project implementation officers.
Identification and anticipation of trends and risks
offers an opportunity to take policy and project
actions that could counter the risks.
Finally, some recommendations can be acquaint
minimising social issues in the resettlement. Two
basic strategies may be pursed in the resettlement
plan for economically and socially re-establishing
those newly resettled persons. One is land –based
strategies and other one is non-land based
strategies. Those displaced people are from urban
or semi urban settings, they usually depend on non-
land based livelihoods. ie. The service sector,
industrial employment, self employment etc. but
sometimes if they possess also some farming lands.
The approach to their situation should take into
account, in addition to their need for new housing
plots, their access to employment opportunities
and when warranted, to some land for farming or
gardening.
In the same time when people resettle, community
preference should be obtain by project planner to
relocate them. The majority preference of those
displaced to move in group as cultural/social units.
i.e. as entire kin group, extended family, ethnic
group, neighbourhood, whole hamlet or village unit
etc also bears upon their potential to get socially
organized economically productive quickly at the
new location. This preference must be supported as
long as it does not adversely affect the choice of
feasible re-development options or genuine
preference of some for individual self relocation.
Such support for relocation as cultural units would
protect an important social resource the viable
patterns of group organization which can act
immediately at the new location cushion disruption
caused by resettlement.
The consequences of development project and the
associated resettlement have a very strong impact
on virtually all areas of life both of individuals and
of larger communities.
ACKNOWLEDGEMENT
I am pleased to thankfully acknowledge the
valuable comments and suggestions received
during the completion of this research Department
of Sociology, University of Peradeniya As well as I
like to acknowledge the respondents of the
community for spending their valuable time with
me during data collection period.
REFERENCES
Asian Development Bank (ADB) (1998). Handbook on
Resettlement: A guide to good Practice, Office
of Environment, and Social development, ADB,
Manila
Cernea, Michael M. (1997). Involuntary Resettlement in
Development Project, Policy Guidelines in
World Bank, the World Bank Publications
Cernea, Michael M. (1986).Involuntary Resettlement in
Bank-Assisted Projects; a Review of Application
of Bank Policies and Procedures in 1979-1985,
Agriculture and Rural Department, Washington
DC; World Bank.
Cernea, Michael M. (1999). The Economics of Involuntary
Resettlement: Question and Challenges,
Washington DC; World Bank.

282
Cernea, Michael M. (1986). Involuntary Resettlement in
Bank-Assisted Projects; a Review of Application
of Bank Policies and Procedures in 1979-1985,
Agriculture and Rural Department, Washington
DC; World Bank.
Cernea, Michael M. (1988a). Involuntary Resettlement
in Development Projects: Policy Guidelines in
World Bank financed projects, World Bank
Technical Paper, Washington DC; World Bank.
Cernea, Michael M. (1988b). Impoverishment or Social
Justice? A Model for Planning Resettlement,
H.M. Mathur and D. Marsden (eds)
Development projects and impoverishment
risks; resettling project affected people in India,
Oxford; London.
Cernea, Michael M. (1999). The Economics of Involuntary
Resettlement: Question and Challenges,
Washington DC; World Bank.
Fernando., Fernando. (2009). Forced to move, Cepa,
Colombo.
Jayawardhana, Shirani. (2011). Right of Way, a Journey
of Resettlement, Colombo; CEPA.
Mathur, H.M. (1995). Development, Displacement and
Resettlement; focus on Asian experience, Kay
printers, Delhi
McDowell, Christopher. (1996). Understanding
Impoverishment: The consequences of
Development Induced Displacement, London;
British Library Publication.
Ministry of Land, (2003). Process Manual for
Implementation of the National Involuntary
Resettlement Policy, Colombo; Ministry of Land.
Muggah, Robert. (2008). Relocation Failures in Sri Lanka;
A short History of Internal, Zed books Ltd,
London.
Stanley, Jason. (2004). Development Induced
Displacement and Resettlement, World Bank
Publications.
BIOGRAPHY OF AUTHOR
The author is a Lecturer in Sociology,
presently employed at the Sri Lanka
Foundation Institute. She was graduated
with a first class honours from the
University of Peradeniya and has
followed a Master of Sociology in same
university. Her research interests include Resettlement,
Displacement, Development, Medical Sociology and Rural
Sociology. She has produced several researches, journals
and publications to her credit.
283
Empowering People through Education from the Perspective of Millennium Development Goals
Shashikamal Kodithuwakku,
Department of International Relations, Faculty of Arts, University of Colombo, Sri Lanka
Abstract— Education plays a significant role in
people’s empowerment which ultimately leads to
sustainable development in any country. Therefore,
this crucial position held by the education has
become a universal acceptance. Further, as
revealed by the South Asian Development Report, if
the men and women are not empowered by the
education and the health, the sustainability won’t
be a reality (2004).Moreover, it has emphasized the
education as one of essential components of growth
process.
Generally, the term empowerment refers to a multi-
dimensional social process that enhance diverse of
human capabilities. Further it is relevant to all the
aspects that boost competences of human beings
which are crucial for the development. Empowering
people can be varied from the individual level to the
community level. Even more it can go beyond the
community level reaching up to the international
level. Therefore, it is imperative to study how
people can be empowered through the education
since education is recognized as a key player of the
human empowerment.
Main objective of this study is to explore the
potential of education to empower people as
human development is considered as one of central
pillars of development. Concurrently, this study
aims to examine the applicability of the
Millennium Development Goals to such scenario
focusing on its most apposite segments. Mainly
this research would be an archival research which
would base on secondary sources. Additionally, the
study would focus on the United Nations reports
and statistics.
This research finds that education is an
indispensable factor regarding empowering people
.Further; this research reveals that human
empowerment is a multi-commitment task which is
directly applicable to development process.
Concurrent to that, this research has highlighted the
relevance of the Millennium Development Goals to
the implementation of empowering people through
education. Moreover, this study finds that
empowering people through education can
generate apparatus required for the development
process leading to profound social changes at both
personal and societal level.
Keywords—Education, Sustainable Development,
Millennium Development Goals
I. INTRODUCTION
The Millennium Development Goals (MDGs) was
set by the United Nations in the year 2000, with the
aim of achieving eight major development goals by
the year 2015. This crystallized the growing
consensus which emerged during the 1990’s,
namely the poverty reduction and the provision of
basic social services need to be at the centre of
development policy. From these eight goals
achieving Universal primary Education is the second
and one of the key Goals in the Millennium
Development Goals. Out of the eight Millennium
Development Goals, two are directly related to
education, they are: (central role of education in
the MDG)
In general way millennium development goals can
be considered as universal framework for
development. It is adopted by all the members of
UN in 2000. Mainly it provides a holistic approach
for developing countries to achieve the goals of
sustainable development. Further United Nations
has intensified the significance of education for
sustainable development. As revealed by new
research, learning failures have high costs for
countries. (MDG global monitory report, 2007).
Therefore it is obvious that MDG’s are directly
linked with promoting education. Similarly
education can considered as one of central pillars of
empowering people with essential skills and
capabilities. Moreover, the educational
284
development will increase the opportunities for
individuals while make them more independent. In
this scenario, Millennium Development can
accelerate the development of other areas
focussing on educational enhancement.
Achieving MDG 2, universal primary education by
2015 will allow every child to complete full course
of primary education creating a sound background
for sustainable development. In addition to that,
this achievement would lead to one of
indispensable requirements of development.
As MDG 3 the promotion of gender equality and
the empowerment of women with, specifically, the
elimination of gender disparities at primary and
secondary school levels by 2005 and across all
education levels by 2015. Further this increase the
participation in development endeavours
irrespective of factors such as gender disparities.
This indicates that Education plays a significant role
empowering people which ultimately lead to
sustainable development. Therefore education has
become a Universal acceptance. In the South Asian
Development Report it has being revealed that if
men and women are not empowered by education
and health, the sustainability won’t be a reality
(2004).It has also emphasized that education as one
of the essential components of growth process.
One of the ways of achieving universal primary
education for all boys and girls by the year 2015,
can be done through empowerment of women,
training teachers to be gender sensitive, promoting
the value of educating girls, making the schools
safe, postponement of early marriage and
childbearing, allowing pregnant teenagers to
continue studying and return to school after
delivery, offering scholarships and providing
universal access to reproductive health.(master
plan for development,
http://www.unfpa.org/public/home/sitemap/icpd/
MDGs/MDGs-ICPD)
According to United Nations reports, it is clearly
indicated that number of children out of school in
2007 was 28% low than in 2000 (MDG Summit
2010). According to these statistics, it is obvious
that achieving primary education can impact
positively empowering people. Further, some of the
world poorest countries have significantly increased
enrolments in education and harrowed the gender
gap related to educational opportunities while
extending the opportunities for disadvantaged
groups (MDG Summit, 2010).
This kind of assessment on MDG’s related to
education clearly shows, how member countries
are committed to achieve millennium development
goals.
Main objective of this study is to explore the
potential of education to empower people as
human development is considered as one of central
pillars of development. Concurrently, this study
aims to examine the applicability of the
Millennium Development Goals to such scenario
focusing on its most apposite segments. Mainly
this research would be an archival research which
would base on secondary sources. Additionally, the
study would focus on the United Nations reports
and statistics.
II. EMPOWERMENT THROUGH EDUCATION
What is Empowerment? According to the Oxford
Dictionary it means that to make (someone)
stronger and more confident, especially in
controlling their life and claiming their rights.
Generally, the term empowerment refers to a
multi-dimensional social process that enhance
diverse of human capabilities. It is also relevant in
all aspects that gain confidence of human beings to
be competent enough so that it would be a crucial
aspect for the development process. As defined by
the World Bank “ Empowerment is the process of
enhancing the capacity of individuals or groups to
make choices and to transform those choices into
desired actions and outcomes”.
(http://web.worldbank.org/WBSITE/EXTERNAL/TOP
ICS/EXTPOVERTY/EXTEMPOWERMENT/0,,contentM
DK:20272299~pagePK:210058~piPK:210062~theSit
ePK:486411,00.html).
According to this definition, empowering of people
refers to a process that transform people’s choices
into appropriate proceeding and endings that
comply with the social needs and development.
Further, it can be elaborated as an expansion of
assets and capabilities of poor people to participate
in negotiate with, influence, control, and hold
accountable institutions that affect their lives (The
World Bank’s 2002). Therefore, it is important to
understand that people’s empowering increase
assets and capabilities of individuals in order to
make their purposive choices in to a reality.
285
Empowering persons can be varied from the
individual level to the community level and also it
can further go internationally. Therefore the key
tool for empowerment is through education and
that is the central pillar of development. And it can
also be said that Education is an indispensable
factor regarding empowering people. It is revealed
that human empowerment is a multi-commitment
task which is directly applicable to development
process. And therefore it becomes one of the key
component goals in the perspective of the
Millennium Development Goals.
Developing regions have made impressive strides in
expanding access to primary education, with the
adjusted net enrolment rate growing from 83% in
2000 to 90% in 2011.Over the same period, the
number of children out of school worldwide
declined by almost half from 102 million to 57
million. But the progress of this in the beginning has
considerably slowed down. Between 2008 and
2011, the number of out-of school children of
primary school age fell by only 3 million. That
means that, at the current rate, the world is
unlikely to meet the target of universal primary
education by 2015.(The Millennium Development
goal report, 2013)
Household poverty is the single most important
factor keeping children out of school. This was
analysed by a survey in 63 developing countries
between 2005 and 2011.Children and adolescents
from the poorest are at least three times as likely to
be out of school as their richest counterparts. Rural
children are nearly twice as likely to be out of
school as urban children. Across these countries
girls are more likely to be out of school than boys
among both primary and lower secondary age
groups. The gender gap in school attendance
widens in lower secondary education, even for girls
living in better off households. (The Millennium
Development goal report, 2013)
The education can plays a crucial role regading
the Poverty eradication through empowerment
based on knowledge/education. In the field of
education, lifelong learning is crucial in order to
eradicate poverty: in some cases, families that live
just over the poverty line (and apparently are not
poor) turn suddenly into poverty for the crisis
effects (loss of jobs).
(http://www.un.org/esa/socdev/publications/FullSu
rveyEmpowerment.pdf.) According to this, it is
imperative to mention that, education provides a
broader range of opportunities to empower people.
For this reason, lifelong learning can be considered
as one of effective tool to enable the “new poor” to
find other solutions in order to avoid poverty and to
“empower themselves”.
(http://www.un.org/esa/socdev/publications/FullSu
rveyEmpowerment.pdf.)
In this scenario, it is apparent that proper
educational system provides the basis to economic
opportunities; similarly this instance portrays
people can have the chance to achieve a better life
through a better education system, that could
transfer their knowledge into possible ways
through which they can gain what they need.
Indeed, proper education would allow them to get
access to many opportunities. This multiple
opportunities would reduce the risk of being
unemployed or being vulnerable in terms of
economic needs. It is very important to mention, in
the event of such loosing economic opportunities,
proper education may provide numerous choices to
overcome the issue. In the same manner, this
would support individuals to make effective
discissions as their empowered with an
appropriate educational system.
Therefore, the contribution of education is
crucial to create new opportunities to empower
people. For instance, poverty is one of major
obstacles to empower people and it decreases the
choices and opportunities for people. Further,
poverty can be a cause of some other social issues
that would negatively impact on people
empowering. Therefore, education can provide new
alternatives, skills and capabilities that combat with
poverty. “Education helps, provide people with
choices and gives them the ability to improve
themselves and their surrounding society.”
(http://www.un.org/esa/socdev/publications/FullSu
rveyEmpowerment.pdf.) Hence, the considerable
allocation given by the MDGs for education can be
justified as education is a core pillar of
empowering people. Further, other aspects of
people’s empowering also will depend on the
success of the education system.
The following table further illustrates how
education can arbitrate the circumstances that
directly negatively impact on the people
empowering.
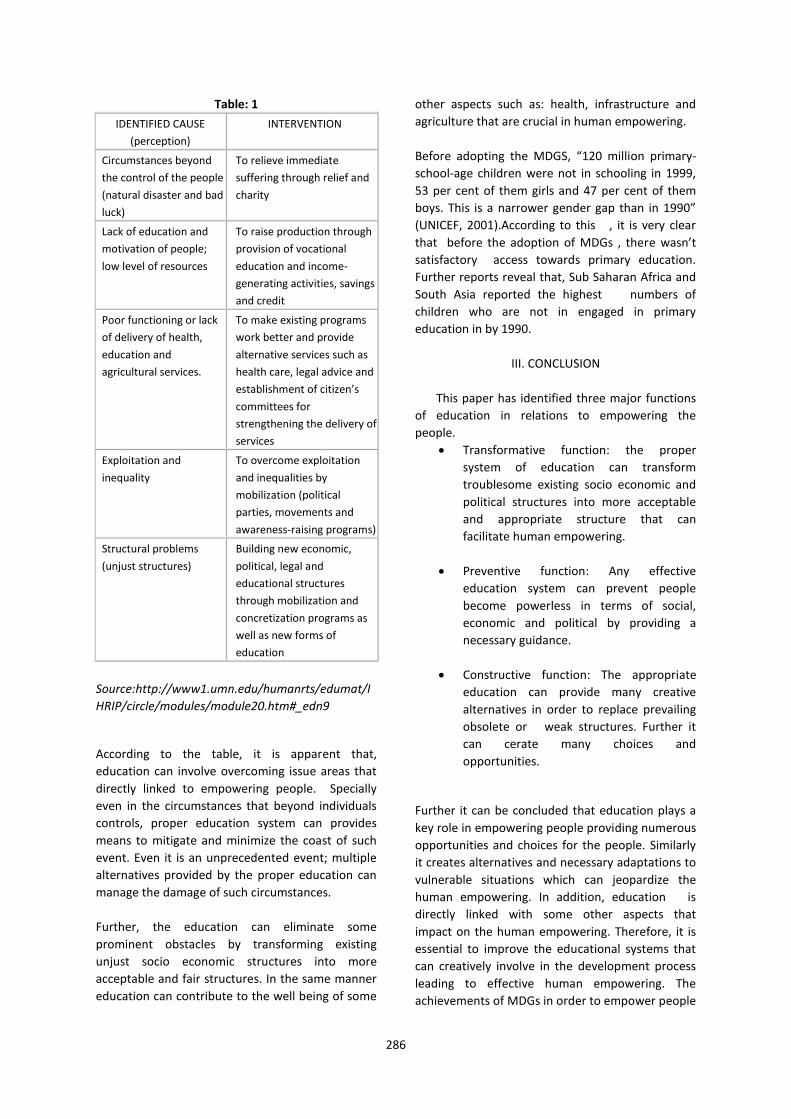
286
Table: 1
IDENTIFIED CAUSE
(perception)
INTERVENTION
Circumstances beyond
the control of the people
(natural disaster and bad
luck)
To relieve immediate
suffering through relief and
charity
Lack of education and
motivation of people;
low level of resources
To raise production through
provision of vocational
education and income-
generating activities, savings
and credit
Poor functioning or lack
of delivery of health,
education and
agricultural services.
To make existing programs
work better and provide
alternative services such as
health care, legal advice and
establishment of citizen’s
committees for
strengthening the delivery of
services
Exploitation and
inequality
To overcome exploitation
and inequalities by
mobilization (political
parties, movements and
awareness-raising programs)
Structural problems
(unjust structures)
Building new economic,
political, legal and
educational structures
through mobilization and
concretization programs as
well as new forms of
education
Source:http://www1.umn.edu/humanrts/edumat/I
HRIP/circle/modules/module20.htm#_edn9
According to the table, it is apparent that,
education can involve overcoming issue areas that
directly linked to empowering people. Specially
even in the circumstances that beyond individuals
controls, proper education system can provides
means to mitigate and minimize the coast of such
event. Even it is an unprecedented event; multiple
alternatives provided by the proper education can
manage the damage of such circumstances.
Further, the education can eliminate some
prominent obstacles by transforming existing
unjust socio economic structures into more
acceptable and fair structures. In the same manner
education can contribute to the well being of some
other aspects such as: health, infrastructure and
agriculture that are crucial in human empowering.
Before adopting the MDGS, “120 million primary-
school-age children were not in schooling in 1999,
53 per cent of them girls and 47 per cent of them
boys. This is a narrower gender gap than in 1990”
(UNICEF, 2001).According to this , it is very clear
that before the adoption of MDGs , there wasn’t
satisfactory access towards primary education.
Further reports reveal that, Sub Saharan Africa and
South Asia reported the highest numbers of
children who are not in engaged in primary
education in by 1990.
III. CONCLUSION
This paper has identified three major functions
of education in relations to empowering the
people.
Transformative function: the proper
system of education can transform
troublesome existing socio economic and
political structures into more acceptable
and appropriate structure that can
facilitate human empowering.
Preventive function: Any effective
education system can prevent people
become powerless in terms of social,
economic and political by providing a
necessary guidance.
Constructive function: The appropriate
education can provide many creative
alternatives in order to replace prevailing
obsolete or weak structures. Further it
can cerate many choices and
opportunities.
Further it can be concluded that education plays a
key role in empowering people providing numerous
opportunities and choices for the people. Similarly
it creates alternatives and necessary adaptations to
vulnerable situations which can jeopardize the
human empowering. In addition, education is
directly linked with some other aspects that
impact on the human empowering. Therefore, it is
essential to improve the educational systems that
can creatively involve in the development process
leading to effective human empowering. The
achievements of MDGs in order to empower people
287
through education are satisfactory with some
exceptions. Still there are some regions such as Sub
–Saharan Africa and South Asia to improve the
situation complying with the second MDG:
achieving universal primary education.
Moreover, this paper reveals frequent
emergence of a large number of non-traditional
security threats in the world such as: natural
disasters, trans-boundary terrorism, political
instabilities, use of advanced and sophisticated
weaponries and other prominent non-military
issues have a great negative impact on achieving
universal primary education. In the same manner it
has impact on eliminating the gender gap in
primary and secondary education. Indeed, this
phenomenon has congested some of the genuine
commitments of achieving universal primary
education.
Therefore, this study suggests the genuine
needs of countries are essential to make MDGs a
reality. Concurrently states should incorporate
effective mechanisms to enhance the access to
education, specially focusing on the primary
education. Further, some other aspects which can
have a great negative influence on the education
and the people empowering should be addressed
via guanine commitments of states. Mainly non-
military threats that would jeopardize the
educational development and human empowering
should be addressed through effective means.
Concurrent to that, a proper assessment regarding
the progress of achieving primary education is
needed to bridge the existing lacuna in educational
progress of some regions.
This research finally intends to focus on the
recommendations in order to empower the people
through education by referring the millennium
development goals.
International Mechanism that can monitor
the MDG, no :P 2 which focus on primary
education should be establish in order to
make necessary recommendation and
guide lines.
All states should comply with the MDG,
No: 2 in cooperating achieving primary
education agenda in to their national
policy making procedures.
All states should be committed towards
international mechanism that empowers
people through education having
necessary adaptation.
The other external issues that can obstruct
empowering people should be addressed
in very effective manner.
Necessary cooperation between state and
non-state actors should be initiated to
empower people.
States should emphasize the significance
of education to empowering Individuals.
This perception should be promoted
among the communities to have genuine
commitments towards empowering
people.
Empowering people cannot be achieved
only through the millennium development
goals since it require the support from
other aspects as well. Therefore converged
approach is needed to empower human
beings in effective manner.
REFERENCES
VandemoortJan,(2002)www.socialwatch.org/sites/defau
lt/files/.../VANDERMOORTELE.pdf,Are the
MDGs Feasible?, accessed 20th, June, 2014
Fighting Corruption in the Education sector, Methods,
Tools and Good Practices (2011),
wwwcorruptionintheeducationsector.ht....und
p.org/...corruption/fighting_, United Nations
Development Program. Accessed 14th June
2014.
Gender and the Millennium Development Goals, (2005).
Human Development Report,(2011). Sustainability and
Equity A better future for all.
hdr.undp.org/en/content/human-
development-report-2011, Accessed, 15th
JUNE 2014.
The Millennium Development Goal Report, (2013),
www.un.org/millenniumgoals/.../report-
2013/mdg-report-2013-english.p
Accessed,15th June 2014
The central role Goals, in the Education in the
Millennium Development (2010).
http://www.millennium-project.org/,
Accessed, 16th June 2014.
288
BIOGRAPHY OF THE AUTHOR
Author is an assistant lecturer
attached to the Department of
International Relations, Faculty of Arts,
and University of Colombo, Sri Lanka.
His research interests include foreign
policy, human security and
international organizations. Currently, he reads for
Master of Arts in International Relations offered by the
Department of International Relations, University of
Colombo. He has authored several research articles on
different areas related to International Relations.
289
The Role of Education as a Source of Human Capital on Rural Poverty: A Review of Literature
Rajapaksha UG1, Semasinghe WM2, Silva DAC3
1Department of Management and Finance, Kotelawala Defence University, Ratmalana, Sri Lanka
2Department of Economics, University of Kelaniya, Kelaniya, Sri Lanka
Department of Economics, University of Colombo [email protected],
Abstract - Rural area is a geographic area located
outside cities and towns. In order to have long term
sustainability in rural sector, education as a source
of human capital formation plays a major role by
empowering the rural people to a right direction in a
productive manner for right decision making ability.
Hence the education would be a sustainable
strategy to uplift the rural sector with agricultural
development. Although for last few decades, many
subsidiary programs were introduced in order to
alleviate rural poverty, still rural sector has poverty.
However, there is a structural change in the rural
sector due to either subsidies or free education
system. Hence, the objective of this review is to
explore how educations as a source of human
capital would impact on to expand the living
standards of the rural sector as identified by
literature. For over past two-three decades, large
number of studies has been documented in relation
to this theme. In the present study substantial
amount of published articles were referred in order
to grasp the real gravity of the agricultural
development in the light of education as a desk
research.
The objectives guiding the analysis of
literature are to; understand the relationship
between education and human capital
development; human capital and human
development; human capital and rural agricultural
productivity; and human capital as a source of
human capital to alleviate rural poverty. This review
is instigated by searching key academic databases
using relevant search questions. The literature
suggests that there is an inverse relationship
between human capital and rural poverty
Keywords: human development, labour
productivity, agricultural productivity, education,
poverty
I. CONCEPT OF EDUCATION
Education is an ongoing process which occurs over a
period of time to improve the living conditions of
people. In this effort, like other people in the
society even the improvement of the farmer’s;
knowledge, skills, attitudes in agricultural
technology, farming activities and methods of
agricultural marketing (Rohana et al 2006) etc. are
also pioneered by education as the real corner
stone’s of rural economy. Therefore education plays
a major role in improving such knowledge, skills and
attitudes of rural farmers in order to empower
them as a human capital or as a productive
resource. That’s why even human capital theory
also try to relate education as an investment as a
source of non-farm opportunities to improve the
ability of investment decisions (Weber et al., 2007)
and to develop entrepreneurial skills and other non-
agricultural abilities to determine the ability of
spotting opportunities and capitalizing education
with them (Silva and Kodithuwakku,2005);
(Ucbasaran et al. 2000) as a continual effort.
As per the literature, education sharpens
the people with skills, knowledge and abilities.
These skills, knowledge and abilities have the
possibility to make creativity and innovativeness
aroused. As the way education creates or enhances
one’ ability, know-how (Gibbs, 2003), human
growth (Barro and lee, 1993), human development
(Bhushan and Arya, 2008), skills enhancement (both
cognitive and non-cognitive) and productivity.
Gibbs (2003) articulates that pursuing a
good education goes hand in hand with knowing
how. With such know-how, people can improve
their strategic thinking to do these things efficiently
and effectively to improve their socio-economic
growth rate. In support of this, even Barro and lee
(1993) in a study of 129 countries concludes that
290
education level has a strong explanatory capacity in
so far as they highlight the direct positive effects
education on growth rates (Bhushan and Arya
2008). As Bhushan and Arya (2008) point out that
education improves ones’; explanatory capacity,
cognitive skills/qualities that can helps to improve
one’s creativity and innovativeness. Such creativity
and innovativeness are the main ingredients of
human capital development of which would be
instrumental and materially important in the
working place and business. However, as Oxaal
(1997) affirms based on human capital theory that
education was valued by employers not because of
its cognitive skills nature, but because of its non-
cognitive qualities and attributes. And further Oxaal
(1997) points out that the non-cognitive traits can
be encouraged by the education to effect on the
attributes required by employees at unskilled,
middle and higher levels of the employment
because non-cognitive skills can enhance the
creativity of a person at any time. Therefore, Oxaal
(1997) concerns that the non-cognitive skills are
mostly accepted by the employers as it are the
basement of creativity and human productivity.
Due to the problem of lack of educational resources
in many rural communities, it places the
responsibility of building the human capital
necessary to fulfill local employment needs into
rural schools (Flora, Flora, &Fey, 2008); (Ann and
Coleman 2010). But failures within it influence the
human development task in the rural sector to
desperate. Due to their inability to cater education
to rural sector adequately, most certainly they lose
the chance of obtaining both cognitive skills and
non-cognitive skills of which are reckoned as major
pillars in human capital development as indicated
by Bhushan and Arya (2008). However such
prevailing poor facilities in the rural sector and the
schools (Oxaal, 1997), causes people to be more
desperate in thinking creatively and acting
innovatively. Therefore, creativity and human
development which are backed by the education
has become a necessity in order to develop the
rural sector socially and economically viable in such
a way that has been done in the urban and sub-
urban sector. Although better education enhances
the peoples’ creativity, Oxaal (1997) believes that
some profiles reaches to peak and then decline
beyond a certain age suggests that the skills created
by education are prone to be obsolescence and that
their productive value declines when technology
has outpaced them. This is further up to a
contradiction. Because, age is not an obstacle to
develop human as technology is a result of
education and; and even such technology is also a
result of a creativity derived from a better
education, hence age is not an obstacle to coincide
with technology. That’s why education is needed as
a continuous process to cater the changing world
requirement.
II. EDUCATION: THEORIES OF LEARNING
As per the Text Book of “Introduction to Human
Resource Training and Development” published by
Open University of Sri Lanka, it indicates that
education or learning can pass four categories as
Reinforcement Theory, Cybernetic and Information
Theory (Communication), Cognitive Theory and
Experimental Learning Theory. These theories are
more toward informal education rather than formal
education. In case of human capital formation,
more than the formal education, the involvement of
informal education is higher as per Weir (1999).
A Reinforcement Theory
The term reinforcement can be explained in its
positive sense. “It means commending learners
when they have accomplished a task successfully,
thus motivating them to continue with their
learning. Positive feedback and knowledge of
results are important to ensure that effective
learning takes place.”
B Cybernetic and Information Theory
(Communication)
If a task can be divided in to a number of small
parts, learning can be easy. As an example if a
workshop can be conducted in several sessions to
enable the employees to obtain better results, the
communication could be easy and effective.
C Cognitive Theory
This theory indicates that the way how people learn
to recognize and define problems and experiment
to arrive at solutions. This theory indicates that
people can identify and explore the things by
themselves and hence the possibilities that they can
retain such skills or knowledge is longer and it is
possible to use it whenever required.
D Experimental Learning Theory
People would like to experiments and learn the
things but there are four different aspects of
291
learning as activities, reflectors, theorists and
pragmatists
The Actual Experience (Converge)
Some people want to try and do something new,
although they fail it. Still they get knowledge as a
way of learning. However these people are called to
activities. Activities enjoy new experiences and
opportunities from which they can learn.
Observations and Reflections on that Experience
(Assimilates)
Some people want to gather data, observe them,
think and assimilate before they do something.
They are called reflectors. They would like to
explore what happened, where the things went
wrong, and they review the results and learning.
Conclusions from Experience
They prefer to make their judgment of which they
lean. They are called theorists. Theorists like to
explore methodically. They look through the
problems in a step logical way and ask questions.
They tend to be analytical.
Planning the Next Steps
These people need to put whatever they learn in to
practice, to act quickly and confidently and to see
the result. They are called pragmatists. They don’t
want theories but the results. They like to
experiment and search for new ideas which they
can tryout. To learn like this, people need better
education. Even the rural farmers who are
successful sometimes must have become activities,
reflectors, theorists and pragmatists in their life
times for many times. This is type of informal
educational aspects. This brings new insights in to
the production section, agricultural sector and their
non-farm opportunities. Therefore, the Knowledge,
Skills and Abilities derived by them from three folds
of education, makes matters in stabilizing the
agricultural productivity being the core concern of
the study.
E Education as a Strategy against Poverty
“Education means acquiring knowledge and skills.
Weir (1999) in the study of ‘The Effects of Education
on Farmer Productivity in Rural Ethiopia’ identifies
that education is in three folds; ie Formal, Non-
Formal and Informal. Formal schooling is usually the
term education. Furhter as Chandrakumara (2009)
indicates that human capital also is a result of
formal, informal and non-formal education. Non-
formal education includes agricultural extension,
apprenticeships and training programmes. Informal
education means wide range of experiences,
including ‘learning by doing’ and migration or other
activities which provide exposure to new ideas and
facilitate learning. While formal education enhance
people’s cognitive skills and abstract reasoning
ability along with changes in attitudes, non-formal
education foster specific information needed for a
particular task or type of work. But informal
education direct people to form attitudes, beliefs
and habits. Formal education, usually known as
schooling, is the process of transferring knowledge
and skills from one generation to the next” (Janjua
et al 2011:156).
As a tool of non-formal education, in case of
agricultural extension, Rohana andBandara (2006)
indicates that the impact of role of agricultural
extension is basically focus on farmers’ income,
through agricultural productivity. As they defined
the agricultural extension is, “an ongoing, non-
formal educational process which occurs over a
period of time and it leads to improve the living
conditions of farmers and their family members by
increasing the profitability of their farming
activities. In this activity, to achieve above goals, it
expects the improvement of the farmer’s
knowledge, skills and change of their attitudes in
agricultural technology, farming activities and
agricultural marketing”(pp.14). However,
agricultural extension assist, guide and direct
farmers to identify both farming and non-farming
activities which can increase their net income
(Rohana et al. 2006). For knowledge empowerment
of the farmers or in order to form their human
capital aspect, agricultural extension plays a huge
role, specially, for the purpose of attaining higher
agricultural productivity. Although the Agricultural
extension serves as an educational empowerment
tool, it serves as a social economic process as well
for economic development and social development
of the farmers.
As the benefits of education, Chandrakumara (2009)
extends his concerns that schoolings brings only
private benefits such as employability or
productivity but also it extends its benefits to
society as external benefits (Weir 1999). Further
Weir (1999) and Janjua et al (2011) indicate there
are two types of benefits of education; Internal
Return (Private Return) and External Return (Social
Return) as Chandrakumara refers. As per Weir
292
(1999) and Janjua et al (2011), the internal return
refers the benefits of investment in schooling which
may flow to a person who has acquired the
education in order to enhance his income-
generation ability. External benefit means the
benefit accrued to other members of that person’s
household or village for the purpose of diffusion of
new farm inputs and productivity-enhancing
techniques. However Chandrakumara (2009:02)
refers that social benefit as ‘externalities or spillover
effect on the entire society’. However Janujua
(2007) and Weir (1999) categorize decision making,
employment, job satisfaction, income, health and
well-being as private returns. And decision making,
family environment, social network, peace and
stability, labour force, economic growth as social
benefit.
In addition to that Chandrakumara (2009) indicates
that school has pecuniary and non-pecuniary
benefits to the people those who are having better
education or better human capital. In support of
that even Zuluaga (2007) concludes that both of
pecuniary and non-pecuniary benefits come due to
education but not due to schooling as
Chandrakumara (2009) indicates. Zuluaga (2007)
articulates that pecuniary benefits such as income
of individuals where non-pecuniary benefits are
non-financial benefits of behavior or abilities or
attitudinal changes of individuals flow to an
individual’s due as the returns to education.
FurtherTabari& Reza (2012) indicate that education
can impact; to increase labour productivity, to
increase higher efficiency, to have high technology
orientations and to go against the law of
diminishing returns, to carry out the invention,
exploration and innovation and then to increase the
productivity, to have an optimal allocation scarce
resources.
III EDUCATION AS A SOURCE OF HUMAN
CAPITAL
As introduced by Schultz in his book of
‘Investment in Human Capital’ the term human
capital was recognized as the stock of knowledge,
skills and abilities that are derived from education.
Schultz (1961) classified human capital as the
accumulation of skills and knowledge that a people
acquire during a span of time period. As Schultz
(1961) identified the development of human capital
can be categorized in to 5 areas; (1) investment in
health and services (2) employment in on the job-
training (3) empowerment in education level (4)
extension programmes (5) migration due to
changing job opportunities. As all these areas give
the knowledge, experience and skills to human
capital, obviously the education can make a human
as a capital or as a resource or as an asset basically
due to their better skills, talents, abilities, capacities
by which it can achieve various initiatives such as
employment opportunities / non-farm
opportunities, farm opportunities and etc. On the
other hand, all these five areas bring education to
individuals from the tri-sources of formal, non-
formal and in-formal. Therefore, human capital and
education cannot be departed because human
capital is a further extension of education. However,
Tilak (2001) indicate that the knowledge which is
imparted through education has the possibility to
increases the productivity of the people and there
by their earnings.
Flora et al (2005) on their study on, ‘Community
capitals: poverty reduction and rural development in
dry areas’ defined human capital as; ‘the native
intelligence, skills, abilities, education, self-esteem
and health of individuals within a community’.
Tabari& Reza (2012) define that human capital as an
accumulation of; science, knowledge, migration,
experience, ability, health, regularity and discipline
that is stored by education and health workforce in
order to increase work efficiency in production. As
both of the studies indicate, the concept of human
capital is used to increase the productivity of the
workforce and then to increase income levels.
Further they consider that the costs of health and
migration can also be considered as a part of
investment in human capital, as health and
migration can bring new insights in to a society.
However Janjua and Kamal (2011) and Rosen (1989)
point out that the stock of people with knowledge
and skills is called as human capital, and Janjua and
Kamal (2011) refer that the basic source for
acquisition of human capital is formal education.
As per Wong (2012) in his article on ‘Effects of
Education on Sub Saharan Africa’ he has used
macro-mincer equation model as the empirical
model with human capital stock (H) as has been
shown below. The formula for the Human Capital
as;
H=ex(s)
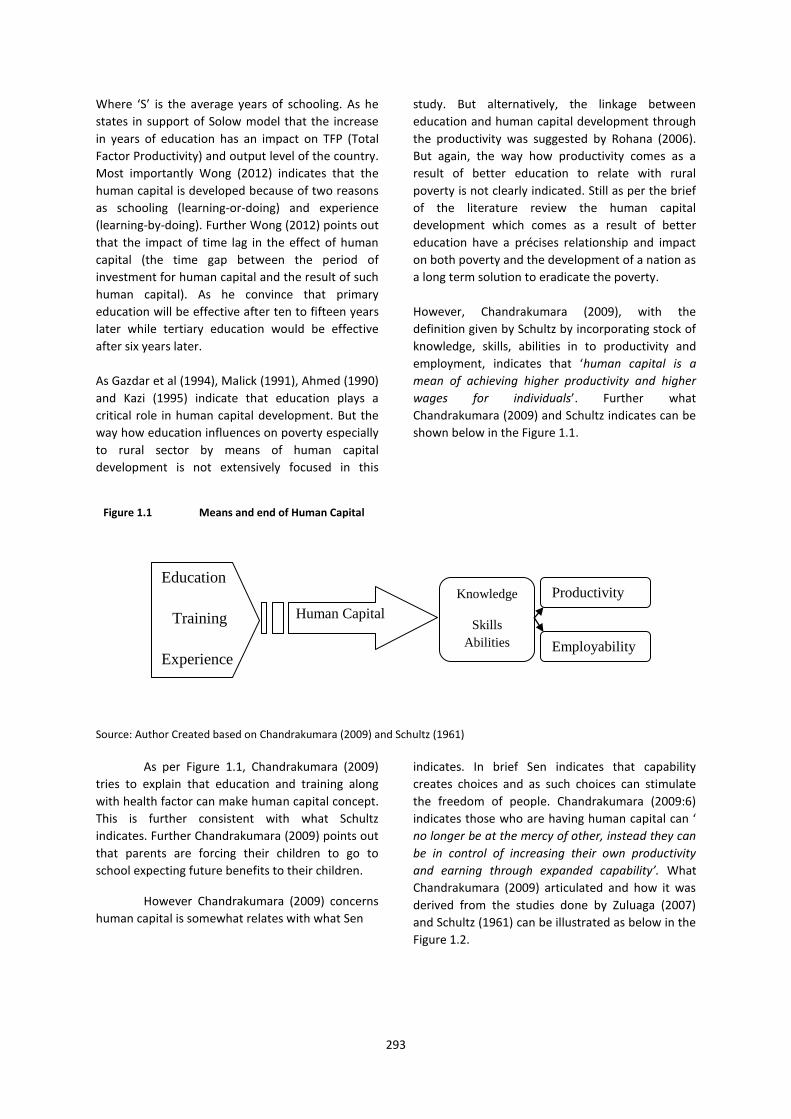
293
Where ‘S’ is the average years of schooling. As he
states in support of Solow model that the increase
in years of education has an impact on TFP (Total
Factor Productivity) and output level of the country.
Most importantly Wong (2012) indicates that the
human capital is developed because of two reasons
as schooling (learning-or-doing) and experience
(learning-by-doing). Further Wong (2012) points out
that the impact of time lag in the effect of human
capital (the time gap between the period of
investment for human capital and the result of such
human capital). As he convince that primary
education will be effective after ten to fifteen years
later while tertiary education would be effective
after six years later.
As Gazdar et al (1994), Malick (1991), Ahmed (1990)
and Kazi (1995) indicate that education plays a
critical role in human capital development. But the
way how education influences on poverty especially
to rural sector by means of human capital
development is not extensively focused in this
study. But alternatively, the linkage between
education and human capital development through
the productivity was suggested by Rohana (2006).
But again, the way how productivity comes as a
result of better education to relate with rural
poverty is not clearly indicated. Still as per the brief
of the literature review the human capital
development which comes as a result of better
education have a précises relationship and impact
on both poverty and the development of a nation as
a long term solution to eradicate the poverty.
However, Chandrakumara (2009), with the
definition given by Schultz by incorporating stock of
knowledge, skills, abilities in to productivity and
employment, indicates that ‘human capital is a
mean of achieving higher productivity and higher
wages for individuals’. Further what
Chandrakumara (2009) and Schultz indicates can be
shown below in the Figure 1.1.
Figure 1.1 Means and end of Human Capital
Source: Author Created based on Chandrakumara (2009) and Schultz (1961)
As per Figure 1.1, Chandrakumara (2009)
tries to explain that education and training along
with health factor can make human capital concept.
This is further consistent with what Schultz
indicates. Further Chandrakumara (2009) points out
that parents are forcing their children to go to
school expecting future benefits to their children.
However Chandrakumara (2009) concerns
human capital is somewhat relates with what Sen
indicates. In brief Sen indicates that capability
creates choices and as such choices can stimulate
the freedom of people. Chandrakumara (2009:6)
indicates those who are having human capital can ‘
no longer be at the mercy of other, instead they can
be in control of increasing their own productivity
and earning through expanded capability’. What
Chandrakumara (2009) articulated and how it was
derived from the studies done by Zuluaga (2007)
and Schultz (1961) can be illustrated as below in the
Figure 1.2.
Education
Training
Experience
Health
Human Capital
Knowledge
Skills
Abilities
Productivity
Employability
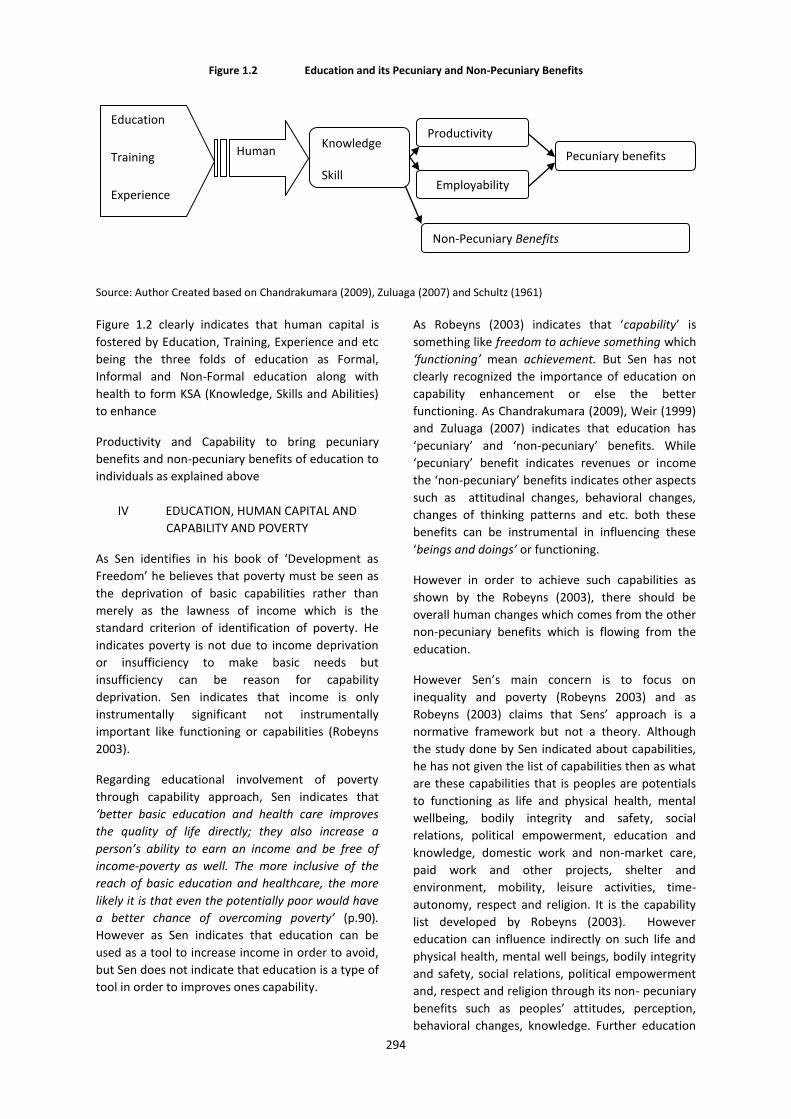
294
Figure 1.2 Education and its Pecuniary and Non-Pecuniary Benefits
Source: Author Created based on Chandrakumara (2009), Zuluaga (2007) and Schultz (1961)
Figure 1.2 clearly indicates that human capital is
fostered by Education, Training, Experience and etc
being the three folds of education as Formal,
Informal and Non-Formal education along with
health to form KSA (Knowledge, Skills and Abilities)
to enhance
Productivity and Capability to bring pecuniary
benefits and non-pecuniary benefits of education to
individuals as explained above
IV EDUCATION, HUMAN CAPITAL AND
CAPABILITY AND POVERTY
As Sen identifies in his book of ‘Development as
Freedom’ he believes that poverty must be seen as
the deprivation of basic capabilities rather than
merely as the lawness of income which is the
standard criterion of identification of poverty. He
indicates poverty is not due to income deprivation
or insufficiency to make basic needs but
insufficiency can be reason for capability
deprivation. Sen indicates that income is only
instrumentally significant not instrumentally
important like functioning or capabilities (Robeyns
2003).
Regarding educational involvement of poverty
through capability approach, Sen indicates that
‘better basic education and health care improves
the quality of life directly; they also increase a
person’s ability to earn an income and be free of
income-poverty as well. The more inclusive of the
reach of basic education and healthcare, the more
likely it is that even the potentially poor would have
a better chance of overcoming poverty’ (p.90).
However as Sen indicates that education can be
used as a tool to increase income in order to avoid,
but Sen does not indicate that education is a type of
tool in order to improves ones capability.
As Robeyns (2003) indicates that ‘capability’ is
something like freedom to achieve something which
‘functioning’ mean achievement. But Sen has not
clearly recognized the importance of education on
capability enhancement or else the better
functioning. As Chandrakumara (2009), Weir (1999)
and Zuluaga (2007) indicates that education has
‘pecuniary’ and ‘non-pecuniary’ benefits. While
‘pecuniary’ benefit indicates revenues or income
the ‘non-pecuniary’ benefits indicates other aspects
such as attitudinal changes, behavioral changes,
changes of thinking patterns and etc. both these
benefits can be instrumental in influencing these
‘beings and doings’ or functioning.
However in order to achieve such capabilities as
shown by the Robeyns (2003), there should be
overall human changes which comes from the other
non-pecuniary benefits which is flowing from the
education.
However Sen’s main concern is to focus on
inequality and poverty (Robeyns 2003) and as
Robeyns (2003) claims that Sens’ approach is a
normative framework but not a theory. Although
the study done by Sen indicated about capabilities,
he has not given the list of capabilities then as what
are these capabilities that is peoples are potentials
to functioning as life and physical health, mental
wellbeing, bodily integrity and safety, social
relations, political empowerment, education and
knowledge, domestic work and non-market care,
paid work and other projects, shelter and
environment, mobility, leisure activities, time-
autonomy, respect and religion. It is the capability
list developed by Robeyns (2003). However
education can influence indirectly on such life and
physical health, mental well beings, bodily integrity
and safety, social relations, political empowerment
and, respect and religion through its non- pecuniary
benefits such as peoples’ attitudes, perception,
behavioral changes, knowledge. Further education
Education
Training
Experience
Health
Human
Capital
Knowledge
Skill
Abilities
Productivity
Employability
Pecuniary benefits
Non-Pecuniary Benefits
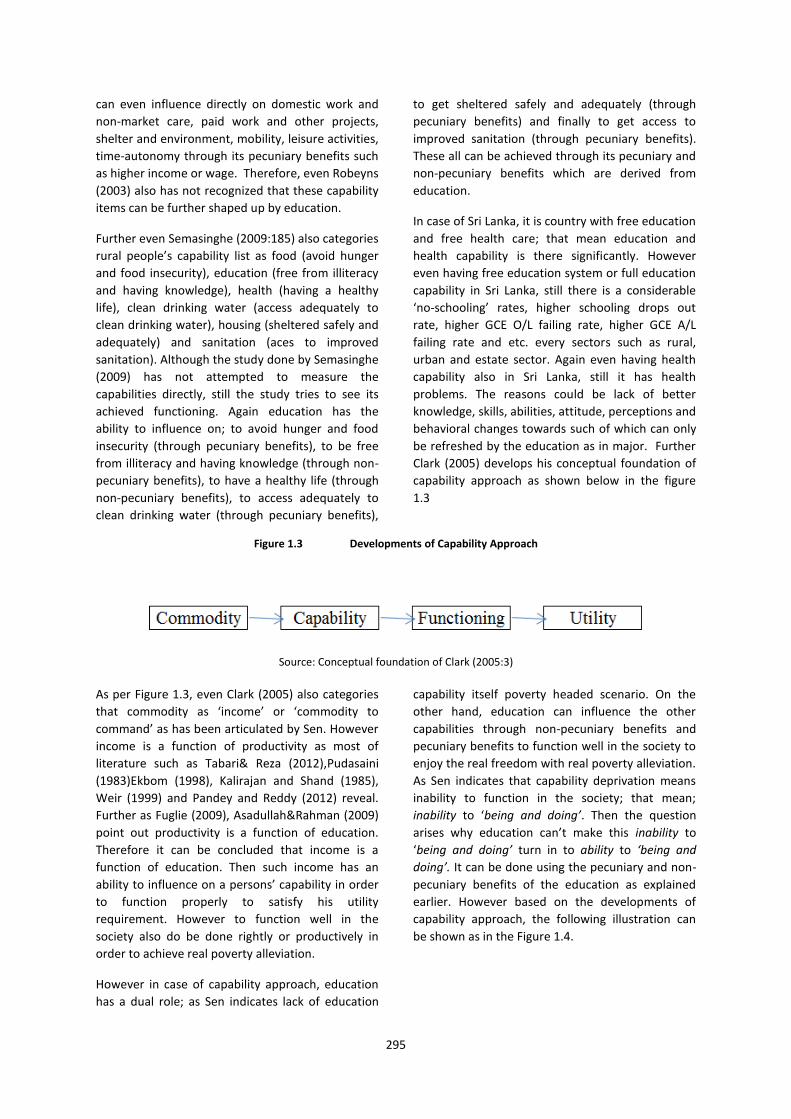
295
can even influence directly on domestic work and
non-market care, paid work and other projects,
shelter and environment, mobility, leisure activities,
time-autonomy through its pecuniary benefits such
as higher income or wage. Therefore, even Robeyns
(2003) also has not recognized that these capability
items can be further shaped up by education.
Further even Semasinghe (2009:185) also categories
rural people’s capability list as food (avoid hunger
and food insecurity), education (free from illiteracy
and having knowledge), health (having a healthy
life), clean drinking water (access adequately to
clean drinking water), housing (sheltered safely and
adequately) and sanitation (aces to improved
sanitation). Although the study done by Semasinghe
(2009) has not attempted to measure the
capabilities directly, still the study tries to see its
achieved functioning. Again education has the
ability to influence on; to avoid hunger and food
insecurity (through pecuniary benefits), to be free
from illiteracy and having knowledge (through non-
pecuniary benefits), to have a healthy life (through
non-pecuniary benefits), to access adequately to
clean drinking water (through pecuniary benefits),
to get sheltered safely and adequately (through
pecuniary benefits) and finally to get access to
improved sanitation (through pecuniary benefits).
These all can be achieved through its pecuniary and
non-pecuniary benefits which are derived from
education.
In case of Sri Lanka, it is country with free education
and free health care; that mean education and
health capability is there significantly. However
even having free education system or full education
capability in Sri Lanka, still there is a considerable
‘no-schooling’ rates, higher schooling drops out
rate, higher GCE O/L failing rate, higher GCE A/L
failing rate and etc. every sectors such as rural,
urban and estate sector. Again even having health
capability also in Sri Lanka, still it has health
problems. The reasons could be lack of better
knowledge, skills, abilities, attitude, perceptions and
behavioral changes towards such of which can only
be refreshed by the education as in major. Further
Clark (2005) develops his conceptual foundation of
capability approach as shown below in the figure
1.3
Figure 1.3 Developments of Capability Approach
Source: Conceptual foundation of Clark (2005:3)
As per Figure 1.3, even Clark (2005) also categories
that commodity as ‘income’ or ‘commodity to
command’ as has been articulated by Sen. However
income is a function of productivity as most of
literature such as Tabari& Reza (2012),Pudasaini
(1983)Ekbom (1998), Kalirajan and Shand (1985),
Weir (1999) and Pandey and Reddy (2012) reveal.
Further as Fuglie (2009), Asadullah&Rahman (2009)
point out productivity is a function of education.
Therefore it can be concluded that income is a
function of education. Then such income has an
ability to influence on a persons’ capability in order
to function properly to satisfy his utility
requirement. However to function well in the
society also do be done rightly or productively in
order to achieve real poverty alleviation.
However in case of capability approach, education
has a dual role; as Sen indicates lack of education
capability itself poverty headed scenario. On the
other hand, education can influence the other
capabilities through non-pecuniary benefits and
pecuniary benefits to function well in the society to
enjoy the real freedom with real poverty alleviation.
As Sen indicates that capability deprivation means
inability to function in the society; that mean;
inability to ‘being and doing’. Then the question
arises why education can’t make this inability to
‘being and doing’ turn in to ability to ‘being and
doing’. It can be done using the pecuniary and non-
pecuniary benefits of the education as explained
earlier. However based on the developments of
capability approach, the following illustration can
be shown as in the Figure 1.4.
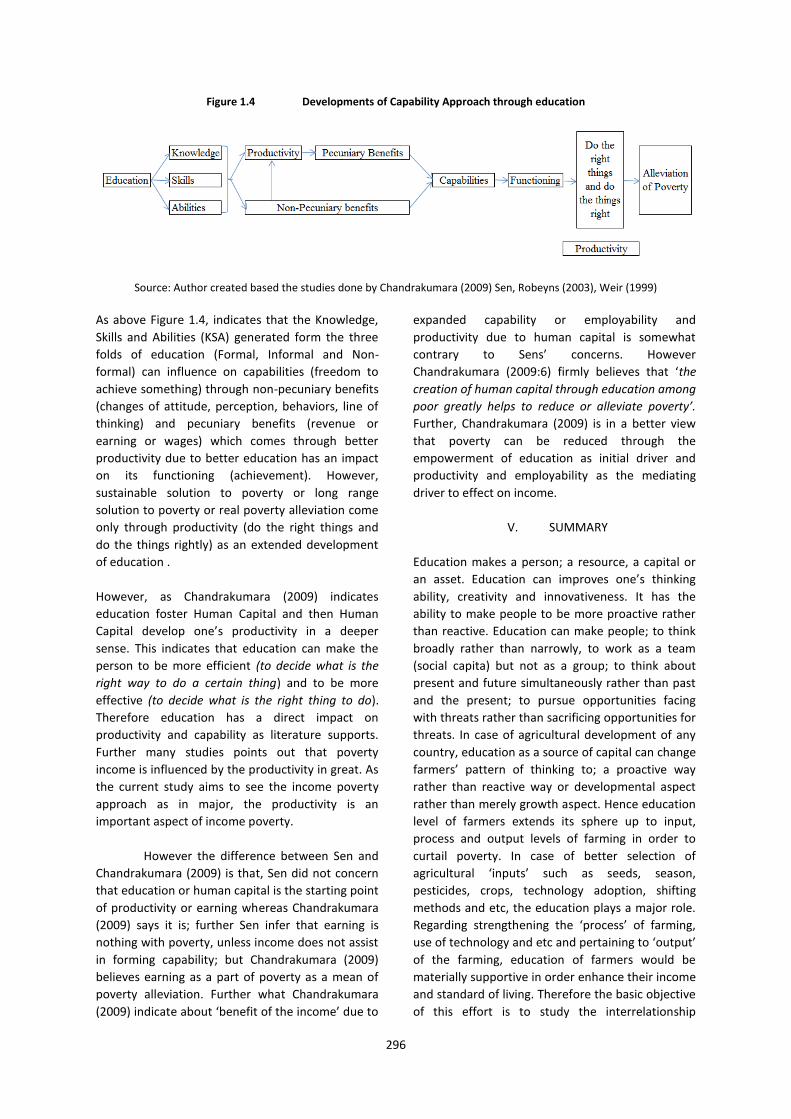
296
Figure 1.4 Developments of Capability Approach through education
Source: Author created based the studies done by Chandrakumara (2009) Sen, Robeyns (2003), Weir (1999)
As above Figure 1.4, indicates that the Knowledge,
Skills and Abilities (KSA) generated form the three
folds of education (Formal, Informal and Non-
formal) can influence on capabilities (freedom to
achieve something) through non-pecuniary benefits
(changes of attitude, perception, behaviors, line of
thinking) and pecuniary benefits (revenue or
earning or wages) which comes through better
productivity due to better education has an impact
on its functioning (achievement). However,
sustainable solution to poverty or long range
solution to poverty or real poverty alleviation come
only through productivity (do the right things and
do the things rightly) as an extended development
of education .
However, as Chandrakumara (2009) indicates
education foster Human Capital and then Human
Capital develop one’s productivity in a deeper
sense. This indicates that education can make the
person to be more efficient (to decide what is the
right way to do a certain thing) and to be more
effective (to decide what is the right thing to do).
Therefore education has a direct impact on
productivity and capability as literature supports.
Further many studies points out that poverty
income is influenced by the productivity in great. As
the current study aims to see the income poverty
approach as in major, the productivity is an
important aspect of income poverty.
However the difference between Sen and
Chandrakumara (2009) is that, Sen did not concern
that education or human capital is the starting point
of productivity or earning whereas Chandrakumara
(2009) says it is; further Sen infer that earning is
nothing with poverty, unless income does not assist
in forming capability; but Chandrakumara (2009)
believes earning as a part of poverty as a mean of
poverty alleviation. Further what Chandrakumara
(2009) indicate about ‘benefit of the income’ due to
expanded capability or employability and
productivity due to human capital is somewhat
contrary to Sens’ concerns. However
Chandrakumara (2009:6) firmly believes that ‘the
creation of human capital through education among
poor greatly helps to reduce or alleviate poverty’.
Further, Chandrakumara (2009) is in a better view
that poverty can be reduced through the
empowerment of education as initial driver and
productivity and employability as the mediating
driver to effect on income.
V. SUMMARY
Education makes a person; a resource, a capital or
an asset. Education can improves one’s thinking
ability, creativity and innovativeness. It has the
ability to make people to be more proactive rather
than reactive. Education can make people; to think
broadly rather than narrowly, to work as a team
(social capita) but not as a group; to think about
present and future simultaneously rather than past
and the present; to pursue opportunities facing
with threats rather than sacrificing opportunities for
threats. In case of agricultural development of any
country, education as a source of capital can change
farmers’ pattern of thinking to; a proactive way
rather than reactive way or developmental aspect
rather than merely growth aspect. Hence education
level of farmers extends its sphere up to input,
process and output levels of farming in order to
curtail poverty. In case of better selection of
agricultural ‘inputs’ such as seeds, season,
pesticides, crops, technology adoption, shifting
methods and etc, the education plays a major role.
Regarding strengthening the ‘process’ of farming,
use of technology and etc and pertaining to ‘output’
of the farming, education of farmers would be
materially supportive in order enhance their income
and standard of living. Therefore the basic objective
of this effort is to study the interrelationship
297
between education and agricultural productivity
through human development.
Education as a source of human capital makes the
people a resource, hence this resourceful people
can make the things productive. Then the
productivity emerges with plenty of advantages to
agricultural sector and then the rural sector.
Primarily, it gives a clear pathway to succeed
agricultural sector through; cost advantages, higher
income, higher wages, adequate volume of
marketable surplus to higher income, enhancement
of skills, ability meet the growing agricultural
demand of people and so on. Hence agricultural
development is a function of higher income, higher
income is a function of productivity; productivity is
a function of human capital development; human
capital development is a function of education.
Therefore Agricultural development is a function of
education. The human resource reflected by
educated farmers has been said to be a very
important in determining the effects of agricultural
growth on poverty reduction. Being the end result
of education to a farmer, the agricultural
productivity, it helps to enable farmers to develop
rural sector through socially and economically
through agricultural growth. Hence the starting
point of agricultural growth is the development of
education.
Agriculture and rural sector is inseparable; whereas
education, productivity and development are also
inseparable. Therefore when it turns to agricultural
development, there is a correlation between
agricultural productivity and education as a source
of human capital. While education up to the
secondary level of farmer has a significant impact
on the improvement of agricultural productivity, the
level of education works as source of agricultural
transmission or innovation. This innovation along
productivity forms the ‘input’ part of production
process, in a meaningful and sustainable way in
order to form a strong bond in the agricultural
sector to boost their income sources than the
poverty line. Therefore, the ‘input’ being a measure
of total factor productivity (TFP) relating output in
production gives a superior indicator of a sector’s
efficiency. Innovation, productivity and efficiency
are by-products of education of which should be
used as a source to generate income aspects in the
rural sector. Not only it boosts the income level due
to innovation, but also can enjoy cost advantage too
due to farmer’s choice of best combination of
products.
REFERENCES
Ahmed, M.U. (1993). Development of rural industries and
transformation of china's rural economy. Asia
Pacific Journal of Rural Development, III(1),
pp.1-19
Asadullah, M. N., &Rahman, S. (2009). Farm productivity
and efficiency in rural Bangladesh: the role of
education revisited. Applied economics, 41(1),
17-33.
Barro, R. J., & Lee, J. W. (1993).International comparisons
of educational attainment. Journal of monetary
economics, 32(3), pp.363-394.
Bhushan, S., Arya, V. (2008).Link between human
resource development, growth and poverty.
SAARC Journal, 4(1), pp.31-39
Chandrakumara, D.P.S, (2009). Education, Human capital
and Development. Colombo: National Library of
Sri Lanka
Ekbom, A. (1998, June). Some determinants to
agricultural productivity: An application to the
Kenyan highlands. In World Conference of
Environmental Economics, Venice, Italy (pp. 25-
27).
Flora, C. B. (1992). Rural Communities: Legacy & Change.
Westview Press, 5500 Central Avenue, Boulder,
CO 80301-2847.
Flora, Cornelia Butler, and ArionThiboumery. "Community
capitals: poverty reduction and rural
development in dry areas." Annals of Arid
Zone 44.3/4 (2005): 239.
Gazdar, H., Howes, S., and Zaidi, S., (1994), Poverty in
Pakistan: Measurement trends and patterns,
Mimeographed paper for the World Bank
Gibbs, R.M., (2003). Reconsidering the southern black
belt.The Review Of Regional Studies, 33(3),
pp.254-263
Introduction to Human Resource Training and
Development, Open University of Sri Lanka
298
Kalirajan, K. P., &Shand, R. T. (1985). Types of education
and agricultural productivity: A quantitative
analysis of Tamil Nadu rice farming. The Journal
of Development Studies, 21(2), 232-243.
Kalirajan, K.P. And R.T.Shand (1986). Types Of Education
And Agricultural Productivity; A Quantitiative
Analysis Of Tamil Nadu Rice Farming. The
Journal Of Development Studies ,(), pp. 232-242
Kazi, S. (1995).Rural women, poverty and development in
Pakistan.Asia Pacific Journal Of Rural
Development, 5(1), pp.78-91
Oxaal, Z. (1997). Education and poverty: a general
analysis. Bridge, 53, pp.1-22
Pandey, L., & Reddy, A. A. (2012). Farm productivity and
rural poverty in Uttar Pradesh: A regional
perspective. Agricultural Economics Research
Review,25(1), 25-35.
Pudasaini, S. P. (1983). The effects of education in
agriculture: Evidence from Nepal. American
Journal of Agricultural Economics, 65(3), 509-
515.
Rohana, P. Mahaliyanaarachchi, R.M.A.S. Bandara (2006).
Commercialization of agriculture and role of
agricultural extension.Sabaragamuwa
University Journal, 6(1), pp.13-22
Rosen, S. (1989) “Comment on ‘The Accumulation of
Human and Non-Human Capital, 1948–1984’ ”,
in Lipsey, R.E. and Tice, H.S. (eds), The
Measurement of Savings, Investment, and
Wealth, University of Chicago Press, Chicago.
Schultz, T.W. (1961), Investing in People; TheAmertican
Economic Review, 51 (1):1-17
Silva, L.R., Kodithuwakku, K.A.S.S. (2005).Pluriactivity and
socio-economic success of rural households. Sri
Lanka Journal Of Agricultural Economics, 7,
pp.86-108
Tabari, N. A. Y., & Reza, M. (2012).Technology and
education effects on labor productivity in the
agricultural sector in Iran. European Journal of
Experimental Biology, 2(4), 1265-1272.
Weber,B. Marre, A, Fisher, M., Gibbs, R., Cromartie, J.
(2007). Education's effect on poverty: the role
of migration. Review Of Agricultural Economics,
29(3), pp.437-445
WEIR, S. (1999).‘The Effects of Education on Farmer
Productivity in Rural Ethiopia’, WPS99-7.
Wong, W. P. J. (2012). Effects of education on Sub
Saharan Africa.
Zuluaga, B. (2007). Different channels of impact of
education on poverty: An analysis for
Colombia. Available at SSRN 958684.
BIOGRAPHY OF AUTHORS
1UG Rajapaksha is a lecturer of
Management and Finance of Sir John
Kotelawela defence University of Sri
Lanka. His research interests include
studies on Poverty.
2
Dr. WM Semasinghe is a senior lecturer
of Department of Economics of
University of Kelaniya, Sri Lanka. His
research interests include Poverty
Studies. He has produced more than 20
referred international and local Journal publications to
his credit.
3
Dr. DAC Silva is a senior lecturer of
Department of Economics of University of
Colombo, Sri Lanka. His research interests
include studies on Tourism.
299
LIST OF REVIEWERS
Dr. Aminda Methsila Perera
Dr. C. Amarasekara
Dr. L.S. Liyanage
Dr. M.M. Jayawardane
Dr. Nalin Abeysekera
Dr. Namali Sirisoma
Dr. Shavika Damunupola Amarasekara
Dr. W.L.P. Perera
Mr. K.P. Nishantha
Mr. Kithsiri Amarathunga
Mr. Wasantha Premarathne
Ms. Aloka Ekanayake
Ms. Bimali Indrarathne
Prof. E.A. Gamini Fonseka
Prof. Weerakoon Banda