Analysis of the evolution of microbial communities associated with different cultures of rotifer...
7
Analysis of the evolution of microbial communities associated with different cultures of rotifer strains belonging to different cryptic species of the Brachionus plicatilis species complex Zizhong Qi a,b , Kristof Dierckens b , Tom Defoirdt b,c , Patrick Sorgeloos b , Nico Boon c , Zhenmin Bao a, ⁎, Peter Bossier b a Key Laboratory of Marine Genetics and Gene Resource Exploitation of Ministry of Education (MaGGR), Ocean University of China, Qingdao 266003, China b Laboratory of Aquaculture and Artemia Reference Center, Ghent University, Gent, Belgium c Laboratory of Microbial Ecology and Technology (LabMET), Ghent University, Gent, Belgium abstract article info Article history: Received 24 July 2008 Received in revised form 16 March 2009 Accepted 19 March 2009 Keywords: Microbial community Rotifer Brachionus plicatilis Denaturing gradient gel electrophoresis The evolution of the composition of microbial communities associated with cultures of 3 different strains belonging to different cryptic species of the rotifer Brachionus plicatilis was monitored during four subsequent cycles of batch cultivation using denaturing gradient gel electrophoresis, cluster analysis, multidimensional scaling and principal component analysis. The data suggest that the evolving microbial communities are different with different B. plicatilis strain cultures. Moreover, large changes in rotifer growth rate were found to be associated with large changes in the microbial community composition, suggesting that there might be a causal link. Finally, Lorenz curves and Gini-coefficient analysis revealed that good performing B. plicatilis cultures showed a more even microbial community structure. © 2009 Elsevier B.V. All rights reserved. 1. Introduction Rotifers (Brachionus spp.) have been used as a live food for feeding larval marine fishes for over 30 years (Yúfera, 2001). Today, more than 60 marine fish species and 18 crustacean species require adequate and reliable production of high-quality, nutritious rotifers. The success of rotifer mass cultures is determined not only by reproduction rate and density, but also by their nutritional composition and their associated microbiota (Dhert, 1996; Dhert et al., 2001). Batch cultivation, due to its simplicity is probably the most common type of rotifer production in marine fish hatcheries (Lubzens et al., 2001). Initially, rotifers are introduced at low density into tanks or ponds. The culture strategy consists of either the maintenance of a constant culture volume with an increasing rotifer density or the maintenance of a constant rotifer density by increasing the culture volume. Rotifers are fed with microalgae, bakers' yeast or an artificial diet. A total harvest of the rotifers is applied with part of the rotifers used as food for fish larvae and part used as inoculum for the next culture (Lubzens et al., 1987). Using an artificial diet (e.g. Culture Selco®), the density at harvest time is about 600 rotifers ml -1 after four days of culture starting from 200 to 250 rotifers ml -1 (Suantika et al., 2000). Although they are frequently used, batch culture systems generate highly variable conditions that can have an influence on growth performance that also affects the composition of associated microbial communities (Rombaut et al., 2001). Bacteria are always associated with mass production of rotifers and may cause unexpected mortality or suppressed growth of rotifers. Moreover, since they are used as the first food of larvae, rotifers are often suspected as vectors of potential harmful bacteria to the cultured animals (Dhert et al., 2001). Using conventional culture-based methods, the dominant bacterial groups in rotifer cultures were classified as Pseudomonas, Vibrio and Aeromonas spp. (Nicolas et al., 1989; Skjermo and Vadstein, 1993; Verdonck et al.,1997). Large variations in the number of rotifer-associated (1.8–7.6 × 10 3 CFU rotifer -1 ) and free- living bacteria (0.6–25 × 10 7 CFU ml -1 ) have been observed (Skjermo and Vadstein, 1993). Rombaut et al. (2001) described the evolving microbial community present in rotifer batch and recirculation systems by means of the molecular biological technique DGGE. The authors found that in a recirculation system, subsequent to a high-variable period, a climax community was established, which remained more or less stable and was characterized by the dominance of one bacterial genus, i.e. Marinomonas. In contrast to the recirculation system, the profiles of the microbial community present in the batch system were more susceptible to variation. Especially in relation to microbial communities associated with live food, it is important to study microbial communities associated with closely related hosts. A recent study found that different cryptic B. plicatilis strains exist within aquaculture hatcheries (Papakostas Aquaculture 292 (2009) 23–29 ⁎ Corresponding author. Tel.: +86 532 82031960; fax: +86 532 82031960. E-mail address: [email protected] (Z. Bao). 0044-8486/$ – see front matter © 2009 Elsevier B.V. All rights reserved. doi:10.1016/j.aquaculture.2009.03.030 Contents lists available at ScienceDirect Aquaculture journal homepage: www.elsevier.com/locate/aqua-online
-
Upload
independent -
Category
Documents
-
view
3 -
download
0
Transcript of Analysis of the evolution of microbial communities associated with different cultures of rotifer...

Aquaculture 292 (2009) 23–29
Contents lists available at ScienceDirect
Aquaculture
j ourna l homepage: www.e lsev ie r.com/ locate /aqua-on l ine
Analysis of the evolution of microbial communities associated with different culturesof rotifer strains belonging to different cryptic species of the Brachionus plicatilisspecies complex
Zizhong Qi a,b, Kristof Dierckens b, Tom Defoirdt b,c, Patrick Sorgeloos b, Nico Boon c,Zhenmin Bao a,⁎, Peter Bossier b
a Key Laboratory of Marine Genetics and Gene Resource Exploitation of Ministry of Education (MaGGR), Ocean University of China, Qingdao 266003, Chinab Laboratory of Aquaculture and Artemia Reference Center, Ghent University, Gent, Belgiumc Laboratory of Microbial Ecology and Technology (LabMET), Ghent University, Gent, Belgium
⁎ Corresponding author. Tel.: +86 532 82031960; faxE-mail address: [email protected] (Z. Bao).
0044-8486/$ – see front matter © 2009 Elsevier B.V. Adoi:10.1016/j.aquaculture.2009.03.030
a b s t r a c t
a r t i c l e i n f oArticle history:Received 24 July 2008Received in revised form 16 March 2009Accepted 19 March 2009
Keywords:Microbial communityRotiferBrachionus plicatilisDenaturing gradient gel electrophoresis
The evolution of the composition of microbial communities associated with cultures of 3 different strainsbelonging to different cryptic species of the rotifer Brachionus plicatilis was monitored during foursubsequent cycles of batch cultivation using denaturing gradient gel electrophoresis, cluster analysis,multidimensional scaling and principal component analysis. The data suggest that the evolving microbialcommunities are different with different B. plicatilis strain cultures. Moreover, large changes in rotifer growthrate were found to be associated with large changes in the microbial community composition, suggestingthat there might be a causal link. Finally, Lorenz curves and Gini-coefficient analysis revealed that goodperforming B. plicatilis cultures showed a more even microbial community structure.
© 2009 Elsevier B.V. All rights reserved.
1. Introduction
Rotifers (Brachionus spp.) have been used as a live food for feedinglarval marine fishes for over 30 years (Yúfera, 2001). Today, more than60marine fish species and 18 crustacean species require adequate andreliable production of high-quality, nutritious rotifers. The success ofrotifer mass cultures is determined not only by reproduction rate anddensity, but also by their nutritional composition and their associatedmicrobiota (Dhert, 1996; Dhert et al., 2001).
Batch cultivation, due to its simplicity is probably the mostcommon type of rotifer production in marine fish hatcheries (Lubzenset al., 2001). Initially, rotifers are introduced at low density into tanksor ponds. The culture strategy consists of either the maintenance of aconstant culture volume with an increasing rotifer density or themaintenance of a constant rotifer density by increasing the culturevolume. Rotifers are fed with microalgae, bakers' yeast or an artificialdiet. A total harvest of the rotifers is applied with part of the rotifersused as food for fish larvae and part used as inoculum for the nextculture (Lubzens et al., 1987). Using an artificial diet (e.g. CultureSelco®), the density at harvest time is about 600 rotifers ml−1 afterfour days of culture starting from 200 to 250 rotifers ml−1 (Suantikaet al., 2000).
: +86 532 82031960.
ll rights reserved.
Although they are frequently used, batch culture systems generatehighly variable conditions that can have an influence on growthperformance that also affects the composition of associated microbialcommunities (Rombaut et al., 2001). Bacteria are always associated withmass production of rotifers and may cause unexpected mortality orsuppressed growth of rotifers. Moreover, since they are used as the firstfood of larvae, rotifers are often suspected as vectors of potential harmfulbacteria to the cultured animals (Dhert et al., 2001). Using conventionalculture-based methods, the dominant bacterial groups in rotifer cultureswere classified as Pseudomonas, Vibrio and Aeromonas spp. (Nicolas et al.,1989; Skjermo and Vadstein,1993; Verdonck et al.,1997). Large variationsin the number of rotifer-associated (1.8–7.6×10³ CFU rotifer−1) and free-living bacteria (0.6–25×107 CFUml−1) have been observed (Skjermo andVadstein, 1993). Rombaut et al. (2001) described the evolving microbialcommunity present in rotifer batch and recirculation systems bymeans ofthe molecular biological technique DGGE. The authors found that in arecirculation system, subsequent to a high-variable period, a climaxcommunitywas established, which remainedmore or less stable andwascharacterized by the dominance of one bacterial genus, i.e.Marinomonas.In contrast to the recirculation system, the profiles of the microbialcommunity present in the batch system were more susceptible tovariation.
Especially in relation to microbial communities associated withlive food, it is important to study microbial communities associatedwith closely related hosts. A recent study found that different crypticB. plicatilis strains exist within aquaculture hatcheries (Papakostas
24 Z. Qi et al. / Aquaculture 292 (2009) 23–29
et al., 2006). It is likely that many previous studies were done withunknown and different strains of the B. plicatilis complex or evenmixtures of species. Therefore, the characterization of microbialcommunities of rotifer cultures needs to be done with clear knowl-edge of the rotifer species.
To address the questions whether cultures of different cryptic B.plicatilis strains have different associated microbial communities, andhow the microbial communities are evolving in consecutive batchcultures, DGGE fingerprints of PCR-amplified 16S rRNA gene frag-ments were made and analyzed with a series of ecological tools.
2. Materials and methods
2.1. Rotifer strains
Experiments were performed with 3 different cryptic B. plicatilisstrains, namely B. plicatilis sensu strictu, B. plicatilis Cayman and B.plicatilis Nevada. Before the start of the experiment, rotifer strainswere kept in non-sterile cultures at the Laboratory of Aquaculture andArtemia Reference Center (Gent, Belgium). The rotifer stocks wereregular examined by microscopy for the presence of ciliates and otherprotists and maintained at controlled culture conditions: 28 °C, lightintensity 2000 lx, salinity 25 g l−1, and fed with yeast-based CultureSelco® following the culture procedure described by Dhert (1996).
2.2. Preparation of microbial communities (MCs)
MCs were prepared following the methods described by Tinh et al.(2006). Briefly, MCs were isolated from normal performing rotifer B.plicatilis sensu strictu cultures. For isolation of MCs, the culture watercollected from rotifer culture was filtered through 250 μm and 60 μmmeshes to remove big food particles and all rotifers, respectively, andwas subsequently centrifuged at 1600 g for 5 min to remove the algalcells, thus only retaining the MCs in the supernatant. These MCs werepreserved for further experiments in 1 ml eppendorfs containing 20%glycerol and 80% bacterial suspension and kept at −80 °C. Beforestarting each experiment, the Eppendorf tubes were thawed. Subse-quently, 50 μl of the MC suspensionwas spread plated on Marine Agar(MA). After 24 h of incubation at 28 °C, the bacteriawere harvested byswabbing the MA plate and suspending in autoclaved Nine SaltSolution (NSS). Cell density of the suspensions was calculatedaccording to the McFarland standard (BioMerieux, Marcy L'Etoile,France), based on optical density measurements (OD550=1.000corresponds to 1.2×10⁹ cells ml−1). Subsequently, the appropriatevolume to be added to each treatment was calculated in order to havea density of 106 cells ml−1 in the rotifer culture water at the start ofeach experiment independent of the Brachionus strains.
2.3. Experimental set-up of rotifer batch cultures
The separate runs of experiments of each rotifer strain wereperformed in 50 ml sterile falcon tubes (TRP®, γ-irradiated) with fourreplicates for rotifer B. plicatilis Nevada and three replicates for B.plicatilis sensu strictu and B. plicatilis Cayman. Rotifers were harvestedby filtration from stock cultures, rinsed three times with 0.22 μm-filtered and autoclaved natural seawater (FASW) to remove most ofthe bacterial load, and distributed into falcon tubes containing 32.5 mlof 25 g l−1 FASW, to have a density of 30 rotifers ml−1 at the start ofeach experiment. The MCs were added once to each tube to have adensity of 106 cells ml−1 at the start of experiment. The falcon tubeswere put on a rotor (4 rpm) which was placed inside a temperature-controlled room (28 °C, light intensity 2000 lx). Each experiment wasrun for 4 batch cycles and each cycle consisted of a 3-day cultureperiod. At the end of each batch, rotifers were harvested, rinsed andre-distributed at a density of around 30 rotifers ml−1 in fresh FASWbefore starting the next batch culture.
2.4. Rotifer diet
The rotifer diet consisted of a commercial diet Culture Selco3000®, CS 3000 (INVE), Belgium. The rotifers were fed daily followinga standard feeding regime for Culture Selco 3000® according tomanufacturer's instructions below:
CS 3000 = 0:0168D0:415V
where: CS 3000 = the weight of experimental diet (g); D = rotiferdensity (individuals ml−1); V = culture water volume (L).
2.5. Sampling, counting and growth data analysis
Three samples of 0.5 ml were taken from the rotifer cultures. Therotifers in each sample were killed by adding three drops of lugol, andwere counted. Empty and transparent lorica belonging to dead rotiferswere not taken into consideration.
The specific growth rate was calculated using the followingequation described by Rombaut et al. (2001): μ=(lnNt− lnN0)/ t,where: μ=specific growth rate; Nt=rotifer density after cultureperiod t (individuals ml−1); N0=initial rotifer density (individualsml−1); t=culture period (day).
Data of the growth rates on day 3 were evaluated using Levene'stest for homogeneity of variances and Shapiro–Wilk's test fornormality. As data were normal-distributed and homoscedastic, thegrowth rates on day 3 for batch 1 and batch 4were compared betweenexperiments using one-way ANOVA, followed by Tukey test. All thetests were performed using the computer program SPSS release 12.0(SPSS, USA).
2.6. Microbial analyses
2.6.1. Sampling procedureOne-milliliter culture water with rotifers was collected from the
rotifer culture after inoculation at the start of experiment. Sampleswere centrifuged at 5000 g for 5 min and stored at −20 °C.
2.6.2. DNA extractionTotal DNA from the samples was obtained by a modified DNA
extraction method as described previously by Rombaut et al. (2001).To obtain bacterial DNA, the samples were centrifuged for 30 min at5000 g. The pellet was dissolved in 0.2 ml Milli-Q water, transferred to0.4 ml of 10 mM Tris–HCl (pH 9) and 0.3 g of glass beads (0.10–0.11 mm diameter) was added. This mixture was homogenised threetimes for 30 s using a bead beater at 2000 rpm (B. Braun BiotechInternational, Melsungen, Germany). After this, 16 μl of 50 mg ml−1
lysozyme was added, and then the suspension was incubated at 37 °Cfor 15 min on a shaker (200 rpm). Chemical lysis of the bacterial cellswas achieved by adding 30 μl of 20% SDS after which the suspensionwas slowly mixed for 5–10 min. Subsequently, 0.1 ml of 8 Mammonium acetate was added. DNA was obtained from the lysatesusing standard phenol–chloroform extraction and isopropanol pre-cipitation procedures (Boon et al., 2000). The total DNA extracted wasquantified by a spectrophotometer ND-1000 at 280 nm (NanoDropTechnologies, Wilmingon, USA).
2.6.3. Amplification of 16S rRNA genesDNA extracted from samples was amplified with primers gc338f
and 518r spanning the V3 region of the 16S rRNA gene (Muyzer et al.,1993) using a 9600 thermal cycler (Perkin-Elmer, Norwalk, CT, USA).PCR amplification was carried out in 24 μl reaction volumes to which1 μl of DNA extract was added.
The PCR master mix contained 0.5 μM of each primer, 200 μM ofeach deoxynucleoside triphosphate, 1.5 mM MgCl2, 10 μl of thermo-philic DNA polymerase 10× reaction buffer (MgCl2-free), 2.5 U of Taq
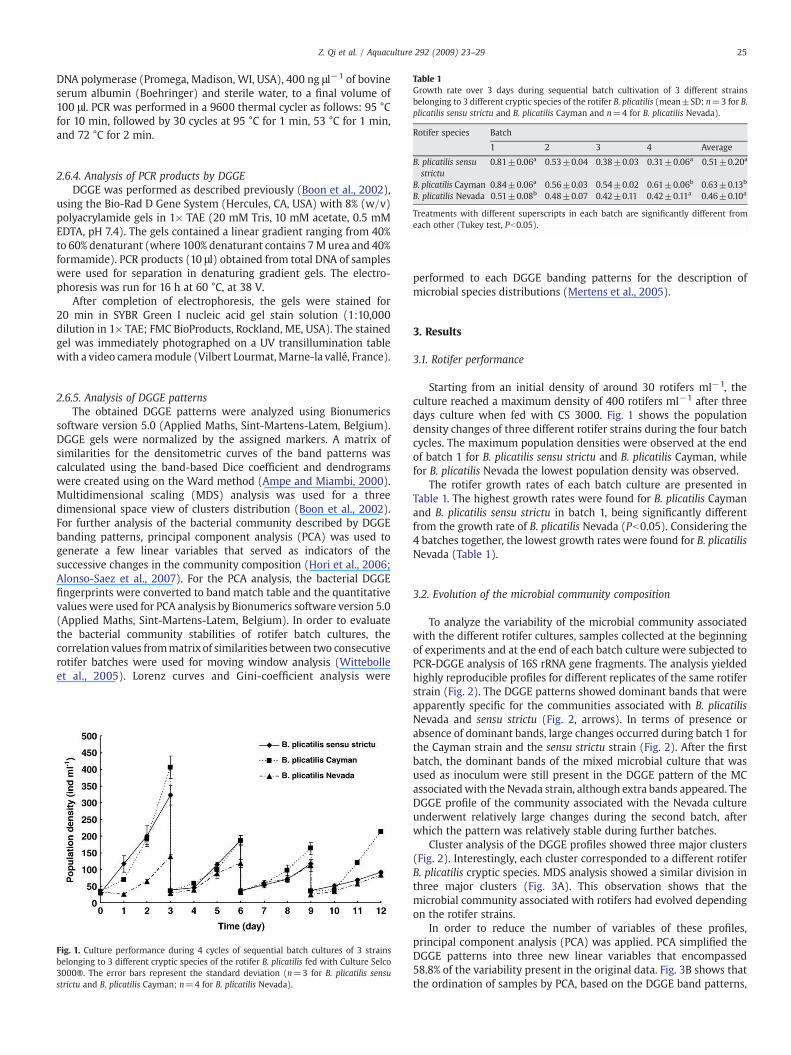
Table 1Growth rate over 3 days during sequential batch cultivation of 3 different strainsbelonging to 3 different cryptic species of the rotifer B. plicatilis (mean±SD; n=3 for B.plicatilis sensu strictu and B. plicatilis Cayman and n=4 for B. plicatilis Nevada).
Rotifer species Batch
25Z. Qi et al. / Aquaculture 292 (2009) 23–29
DNA polymerase (Promega, Madison, WI, USA), 400 ng μl−1 of bovineserum albumin (Boehringer) and sterile water, to a final volume of100 μl. PCR was performed in a 9600 thermal cycler as follows: 95 °Cfor 10 min, followed by 30 cycles at 95 °C for 1 min, 53 °C for 1 min,and 72 °C for 2 min.
1 2 3 4 Average
B. plicatilis sensustrictu
0.81±0.06a 0.53±0.04 0.38±0.03 0.31±0.06a 0.51±0.20a
B. plicatilis Cayman 0.84±0.06a 0.56±0.03 0.54±0.02 0.61±0.06b 0.63±0.13b
B. plicatilis Nevada 0.51±0.08b 0.48±0.07 0.42±0.11 0.42±0.11a 0.46±0.10a
Treatments with different superscripts in each batch are significantly different fromeach other (Tukey test, Pb0.05).
2.6.4. Analysis of PCR products by DGGEDGGE was performed as described previously (Boon et al., 2002),
using the Bio-Rad D Gene System (Hercules, CA, USA) with 8% (w/v)polyacrylamide gels in 1× TAE (20 mM Tris, 10 mM acetate, 0.5 mMEDTA, pH 7.4). The gels contained a linear gradient ranging from 40%to 60% denaturant (where 100% denaturant contains 7M urea and 40%formamide). PCR products (10 μl) obtained from total DNA of sampleswere used for separation in denaturing gradient gels. The electro-phoresis was run for 16 h at 60 °C, at 38 V.
After completion of electrophoresis, the gels were stained for20 min in SYBR Green I nucleic acid gel stain solution (1:10,000dilution in 1× TAE; FMC BioProducts, Rockland, ME, USA). The stainedgel was immediately photographed on a UV transillumination tablewith a video cameramodule (Vilbert Lourmat, Marne-la vallé, France).
2.6.5. Analysis of DGGE patternsThe obtained DGGE patterns were analyzed using Bionumerics
software version 5.0 (Applied Maths, Sint-Martens-Latem, Belgium).DGGE gels were normalized by the assigned markers. A matrix ofsimilarities for the densitometric curves of the band patterns wascalculated using the band-based Dice coefficient and dendrogramswere created using on the Ward method (Ampe and Miambi, 2000).Multidimensional scaling (MDS) analysis was used for a threedimensional space view of clusters distribution (Boon et al., 2002).For further analysis of the bacterial community described by DGGEbanding patterns, principal component analysis (PCA) was used togenerate a few linear variables that served as indicators of thesuccessive changes in the community composition (Hori et al., 2006;Alonso-Saez et al., 2007). For the PCA analysis, the bacterial DGGEfingerprints were converted to band match table and the quantitativevalues were used for PCA analysis by Bionumerics software version 5.0(Applied Maths, Sint-Martens-Latem, Belgium). In order to evaluatethe bacterial community stabilities of rotifer batch cultures, thecorrelation values frommatrix of similarities between two consecutiverotifer batches were used for moving window analysis (Wittebolleet al., 2005). Lorenz curves and Gini-coefficient analysis were
Fig. 1. Culture performance during 4 cycles of sequential batch cultures of 3 strainsbelonging to 3 different cryptic species of the rotifer B. plicatilis fed with Culture Selco3000®. The error bars represent the standard deviation (n=3 for B. plicatilis sensustrictu and B. plicatilis Cayman; n=4 for B. plicatilis Nevada).
performed to each DGGE banding patterns for the description ofmicrobial species distributions (Mertens et al., 2005).
3. Results
3.1. Rotifer performance
Starting from an initial density of around 30 rotifers ml−1, theculture reached a maximum density of 400 rotifers ml−1 after threedays culture when fed with CS 3000. Fig. 1 shows the populationdensity changes of three different rotifer strains during the four batchcycles. The maximum population densities were observed at the endof batch 1 for B. plicatilis sensu strictu and B. plicatilis Cayman, whilefor B. plicatilis Nevada the lowest population density was observed.
The rotifer growth rates of each batch culture are presented inTable 1. The highest growth rates were found for B. plicatilis Caymanand B. plicatilis sensu strictu in batch 1, being significantly differentfrom the growth rate of B. plicatilis Nevada (Pb0.05). Considering the4 batches together, the lowest growth rates were found for B. plicatilisNevada (Table 1).
3.2. Evolution of the microbial community composition
To analyze the variability of the microbial community associatedwith the different rotifer cultures, samples collected at the beginningof experiments and at the end of each batch culture were subjected toPCR-DGGE analysis of 16S rRNA gene fragments. The analysis yieldedhighly reproducible profiles for different replicates of the same rotiferstrain (Fig. 2). The DGGE patterns showed dominant bands that wereapparently specific for the communities associated with B. plicatilisNevada and sensu strictu (Fig. 2, arrows). In terms of presence orabsence of dominant bands, large changes occurred during batch 1 forthe Cayman strain and the sensu strictu strain (Fig. 2). After the firstbatch, the dominant bands of the mixed microbial culture that wasused as inoculum were still present in the DGGE pattern of the MCassociatedwith the Nevada strain, although extra bands appeared. TheDGGE profile of the community associated with the Nevada cultureunderwent relatively large changes during the second batch, afterwhich the pattern was relatively stable during further batches.
Cluster analysis of the DGGE profiles showed three major clusters(Fig. 2). Interestingly, each cluster corresponded to a different rotiferB. plicatilis cryptic species. MDS analysis showed a similar division inthree major clusters (Fig. 3A). This observation shows that themicrobial community associated with rotifers had evolved dependingon the rotifer strains.
In order to reduce the number of variables of these profiles,principal component analysis (PCA) was applied. PCA simplified theDGGE patterns into three new linear variables that encompassed58.8% of the variability present in the original data. Fig. 3B shows thatthe ordination of samples by PCA, based on the DGGE band patterns,

Fig. 2. DGGE profiles and clustering analysis of the bacterial community associated with rotifer cultures based on total DNA extracts from sequential batches of 3 different strainsbelonging to 3 different cryptic species of the rotifer B. plicatilis (s.s = B. plicatilis sensu strictu; Nevada= B. plicatilis Nevada; Cayman= B. plicatilis Cayman; R1, R2, R3= replicates 1,2 and 3; start of experiment = samples collected after inoculations). The arrows indicate dominant bands that are specific for the communities associated with B. plicatilis Nevadaand sensu strictu and that were not present in the patterns of the inoculum. Clustering of the patterns (using the Ward method based on Dice coefficients) is shown on the left (scale0–100 corresponds to similarity levels ranging from 0% to 100%). Few data (Nevada batch 1 R2, s.s. batch1 R1, Cayman batch 4 R1 and R2) are not presented due to no PCR results.
26 Z. Qi et al. / Aquaculture 292 (2009) 23–29
agreed with the clustering results. Indeed, three different clusterswere obtained, which correspond to the three different rotifer strains.
Finally, in order to track the successive dynamic changes within theMCof each species frombatch 1 to batch 4,movingwindows analysiswasapplied on the DGGE profiles. The analysis resulted in different curves forthe three rotifer species (Fig. 4). For the species B. plicatilis sensu strictuand Cayman, relatively large changes of DGGE patterns occurred duringbatch 1, with the similarity between the patterns obtained before batch 1and after batch 1 being lower than 50%. DGGE patterns of the Nevadastrain in batch 1 also changed, but to a smaller extent (70% similaritybetweenpatterns obtained before and after batch 1). For all rotifer strains,the similarity between subsequent DGGE analyses increased withincreasing batch cultures to 80% or more similarity between subsequentprofiles. This suggests that the microbial communities associated withthe rotifers became relatively stable after several subsequent batchesand onlyminor shifts in the community composition occurred during thelast batches.
3.3. Microbial species distribution evenness and variations
The microbial species distribution analysis was based on themethod of Lorenz curves. Lorenz curves were plotted according to thenumbers of bands and their intensities present in the DGGE pattern.Fig. 5 shows graphs of changing Lorenz curves of each culture unit insubsequent batch cultures. For MC in rotifer strain B. plicatilis sensustrictu cultures, it shows an overall tendency of less bending curveswith increasing batch number compared to the curve of the initial MC.The flattest curve for B. plicatilis sensu strictu indicates the nearly evendistribution of microbial species at the end of batch 3 (Fig. 5 s.s end ofbatch 3 R1). This decreasing tendency in the bending of curves is alsopresent for the rotifer strain B. plicatilis Cayman, but to a lesser extend,since the curves are closer and cross each other (Fig. 5 Cayman R1, R2and R3). On the contrary, overall highly bended Lorenz curves arefound in the rotifer strain B. plicatilis Nevada cultures, indicating anuneven distribution.

Fig. 3. Multidimensional scaling (A) and principal component analysis (B) of the DGGE profiles of the bacterial communities associated with 3 different strains belonging to 3different cryptic species of the rotifer B. plicatilis. Circle A corresponds to samples of the start of the experiment, Circle B corresponds to samples from Brachionus plicatilis Nevadacultures, circle C corresponds to samples from Brachionus plicatilis Cayman cultures and circle D corresponds to samples from Brachionus plicatilis sensu strictu cultures.
27Z. Qi et al. / Aquaculture 292 (2009) 23–29
To assess changes in evenness of microbial species distribution,Gini coefficients were calculated (Fig. 6) and the results show thedifferent change tendencies of microbial species distributions amongthe three rotifer strain cultures. In the first batch the increasing Ginicoefficients indicated a more evenly distribution of microbial species.However during the consequent three batches, the three rotifer straincultures were ending in different ways in terms of microbial speciesdistribution as reflected by Gini coefficient changes. In general, highGini coefficients were found in the cultures of rotifer strains B.plicatilis sensu strictu and B. plicatilis Cayman, whereas low Ginicoefficients were found for the B. plicatilis Nevada.
4. Discussion
Despite technological improvements of batch culture of Brachionusincluding turbidity regulation and optimization of diets (Dhert et al.,2001; Yoshimura et al., 2003), the problem of “bad performances” isstill common in hatcheries. As a consequence, in practice, hatcherieshave to set-up many tanks running batch cultures simultaneously inorder to obtain sufficient amounts of live feed. Such practices increaseoverall cost and decrease efficiency in terms of labor and utilization ofinfrastructure (Dhert et al., 2001). Many factors have been linked torotifer growth performance, such as nutrition, the presence ofmicroalgae, cryptic rotifer species and different microorganisms. Thebacterial communities associated with rotifers might be one of themost important factors. High rotifer densities demanding high feedinglevels and producing high concentrations of waste products thuscreate a high load of organic material that is utilized as feed source bybacteria. These intensive rearing conditions allow heterotrophicbacteria to grow fast (Skjermo et al., 1997; Verschuere et al., 1997;Skjermo and Vadstein, 1999). Conventional microbial techniques haverevealed high loads of potentially pathogenic bacteria, such as vibrios,in conventional rotifer batch cultures. Also highly variable microbialcommunities are found after rotifer disinfection (Rombaut et al.,1999). Consequently, there is currently an interest inmanipulating thecomposition of the microbial community aiming at more reliablerotifer culture performances (Dhert et al., 2001). In this study, weanalyzed the correlation between the culture performances ofdifferent Brachionus plicatilis strains and the microbial communitiesthat were associated with the rotifers. Our results indicate that themicrobial community composition shows large differences betweendifferent rotifer strains although all were inoculated with the samemixed bacterial community. Smaller differences in the microbial
community composition were observed between replicates of thesame rotifer strain.
From our results, we can conclude that shifts occur in themicrobialcommunities associated with rotifers during batch cultivation, and thechanges in the microbial community composition were found to bedifferent for the different rotifer cryptic species. Interestingly, thesechanges were also associated with different culture performances. Bycomparing rotifer growth performances and stability of the microbialcommunity, we found that large changes in growth rate wereassociated with large changes in the MC composition (Fig. 1, batches1 to 2; Fig. 4 batch 1). The rotifer growth rate of the Cayman strainreached stability from batch 2 onwards and this was accompanied bythe stabilization of the microbial community (Fig. 4A). This was alsomanifested in the Moving Window Analysis (Fig. 4A), where lowsimilarities were observed in the patterns obtained before and afterthe first batch of the Cayman strain. Also, the smaller decrease inculture performances observed in later batches was accompanied bysmaller changes in the microbial community composition. Cultureperformances of the Nevada strain, on the other hand, were morestable as was the composition of the microbial community stability.Hence, our results suggest that the performance of rotifer cultures isstrongly influenced by the associated microbial community. Thisconclusion corroborates previous reports mentioning that theintroduction of microorganisms can significantly change the perfor-mance of rotifer cultures (Rombaut et al., 1999).
Skjermo and Vadstein (1993) found that the use of enrichmentdiets caused a shift in the bacterial composition to a microbialcommunity totally different from the initial community and reasonedthat this was partly due to a bloom of fast-growing, opportunisticbacteria, which were favored by the high substrate levels in theculture. Also in our study, significant changes were observed in themicrobial community associated with rotifers upon feeding them anartificial diet. However, the shifts we observed were unlikelydetermined solely by the diets. Indeed, although the microbialcommunities changed during culturing of the rotifers, the dominantbands that appeared and/or disappeared were different for thedifferent rotifer strains. This implies that the rotifer strain could havestrong effects on the determination of the composition of themicrobial community.
Recently, axenically grown B. plicatilis sensu strictu were used byTinh et al. (2006) as a test model to reveal the role of “endogenousmicrobiota” which were isolated from cultures of the same rotiferspecies. When yeast strains were given as food, rotifer growth

Fig. 4. Moving window analysis of the DGGE patterns of the bacterial communitiesassociated with 3 different strains belonging to 3 different cryptic species of the rotiferB. plicatilis. The variability between two consecutive batches was calculated based onthe Dice coefficients. For each batch, the similarity between the profiles of the batch ofinterest and the previous batch is plotted (for the first batch, this is the similaritybetween the profile after the batch and the initial community that was inoculated).Bar=SD.
Fig. 5. Lorenz curves of the microbial community associated with rotifer cultures. (s.s =B. plicatilis sensu strictu; Nevada = B. plicatilis Nevada; Cayman = B. plicatilis Cayman;R1, R2, R3=replicates 1, 2 and 3; start of experiment = samples collected afterinoculations.
Fig. 6. Gini coefficients of rotifer cultures samples at the end of each batch based onLorenz curves (start = samples collected after inoculations, bar = SD).
28 Z. Qi et al. / Aquaculture 292 (2009) 23–29
performance was dependent on the origin of the MCs. When a MCisolated from a crashed rotifer culture was added, however, it did nothave any negative effect in the rotifer growth test, suggesting that theMC associated with the crashed rotifer culture was not responsible forthe crash. Hino (1993) suggested that changes in the composition ofthe microbial community, and not the microbiota that are present atthat specific moment, are the cause of the collapse of rotifer cultures.In accordance to this, in this study, we found that the cultures showingthe largest changes in microbial community composition also had thelargest decreases in growth performance.
Most of the microbial community studies concentrate on compar-ing species richness (i.e. the number of distinct species). However,community diversity is more than richness. It also includes evennessand dynamics (Marzorati et al., 2008). Lorenz curves and Ginicoefficient describe the distribution of the different species within acommunity and has shown to be a good estimator of microbial species
evenness (Mertens et al., 2005; Halet et al., 2006; Wittebolle et al.,2008, 2009). In our study, differences in the shapes of Lorenz curvesand Gini coefficients were found among three different strains ofrotifer B. plicatilis batch cultures. The lower evenness (average Ginicoefficient=0.63) from batches 2 to 4 in B. plicatilis Nevada cultureindicated that a smaller fraction of the different microbial speciespresent was dominating the community. Interestingly, this fewdominant microbial species corresponded to low rotifer growthrates (Table 1). On the contrary, an increasing trend of evenness ofmicrobial species was found for the strain B. plicatilis Cayman whenthe rotifer growth rates were steady around 0.57 from batches 2 to 4.High rotifer densities were always associated with high Ginicoefficients in all cultures at the end of batch 1 (Figs. 1 and 6). Thusit seems that for a B. plicatilis culture with high population densities, ahigh evenness is required.
The DGGE fingerprinting technique has shown to be an interestingtool for the study of microbial communities in aquaculture systems.This technique, combinedwith other physiological/chemical analyses,can be useful in unraveling the ecological functions of bacterialcommunities in rotifer culture systems. It has been shown that crypticspecies differ in ecological preferences and life cycle parameters(Serra et al., 1998; Ortells et al., 2003) and the same might be true forthe microbiota that are associated with the rotifers. In this study, wefound that different cultures of rotifer strains belonging to threedifferent cryptic species of the rotifer B. plicatilis carried differentmicrobial communities. Asmicrobial communities associatedwith therotifers are transferred with the rotifers to the larval fish cultures, itwould be interesting to verify if the larval fish performance (which ishighly influenced by microorganisms) can be modulated by choosingthe proper rotifer strain cultures.
29Z. Qi et al. / Aquaculture 292 (2009) 23–29
In our study, consecutive batch cultures displayed differentdominant DGGE bands, indicating a dynamic evolution of the bacterialcommunity after inoculation. It is likely that some bacterial species ofthe inoculum were favored in the rotifer batch cultures. It is alsopossible that rotifer-associated bacteria still present after washing,may have re-established themselves during the cultures. Therefore,the role of bacteria closely associatedwith rotifers should be evaluatedcarefully as drivers for the evolution of whole microbial community.
Acknowledgements
The first author acknowledges an ICP PhD scholarship from theFlemish Interuniversity Council (VLIR), Belgium. This work was sup-ported by a National Natural Science Foundation of China project (No.30500377) and an EU research project (ROTIGEN, Q5RS-2002-01302).
References
Alonso-Saez, L., Aristegui, J., Pinhassi, J., Gomez-Consarnau, L., Gonzalez, J.M., Vaque, D.,Agusti, S., Gasol, J.M., 2007. Bacterial assemblage structure and carbon metabolismalong a productivity gradient in the NE Atlantic Ocean. Aquat. Microb. Ecol. 46,43–53.
Ampe, F., Miambi, E., 2000. Cluster analysis, richness and biodiversity indexes derivedfrom denaturing gradient gel electrophoresis fingerprints of bacterial communitiesdemonstrate that traditional maize fermentations are driven by the transformationprocess. Int. J. Food Microbiol. 60 (1), 91–97.
Boon, N., Marlé, C., Top, E.M., Verstraete, W., 2000. Comparison of the spatialhomogeneity of physico-chemical parameters and bacterial 16S rRNA genes insediment samples from a dumping site for dredging sludge. Appl. Microbiol.Biotechnol. 53, 742–747.
Boon, N., Windt, W., Verstraete, W., Top, E.M., 2002. Evaluation of nested PCR-DGGE(denaturing gradient gel electrophoresis) with group-specific 16S rRNA primers forthe analysis of bacterial communities from different wastewater treatment plants.FEMS Microbiol. Ecol. 39, 101–112.
Dhert, P., 1996. Rotifers. In: Lavens, P., Sorgeloos, P. (Eds.), Manual on the production anduse of live food for aquaculture FAO Fisheries Technical Paper, vol. 361, pp. 61–100.
Dhert, P., Rombaut, G., Suantika, G., Sorgeloos, P., 2001. Advancement of rotifer cultureand manipulation techniques in Europe. Aquaculture 200, 129–146.
Halet, D., Boon, N., Verstraete, W., 2006. Community dynamics of methanotrophicbacteria during composting of organic matter. J. Biosci. Bioeng. 101, 297–302.
Hino, A., 1993. Present culture systems of the rotifer (Brachionus plicatilis) and thefunction of micro-organisms. In: Lee, C.S., Su, M.S., Liao, I.L. (Eds.), Proceedings ofFinfish Hatchery in Asia 91, 17–19 December 1991, Tungkang, Taiwan. TungkangMarine Laboratory Conference Proceedings, vol. 3, pp. 51–59.
Hori, T., Haruta, S., Ueno, Y., Ishii, M., Igarashi, Y., 2006. Direct comparison of single-strand conformation polymorphism (SSCP) and denaturing gradient gel electro-phoresis (DGGE) to characterize a microbial community on the basis of 16S rRNAgene fragments. J. Microbiol. Methods 66, 165–169.
Lubzens, E., Rothbard, S., Blumenthal, A., Kolodny, G., Perry, B., Olund, B., Wax, Y.,Farbstein, H., 1987. Possible use of Brachionus plicatilis (O.F. Muller) as food forfreshwater Cyprinid larvae. Aquaculture 60, 143–155.
Lubzens, E., Zmora, O., Barr, Y., 2001. Biotechnology and aquaculture of rotifers.Hydrobiologia 446, 337–353.
Marzorati, M., Wittebolle, L., Boon, N., Daffonchio, D., Verstraete, W., 2008. How to getmore out of molecular fingerprints: practical tools for microbial ecology. Environ.Microbiol. 10, 1571–1581.
Mertens, B., Boon, N., Verstraete, W., 2005. Stereospecific effect of hexachlorocyclohexaneon activity and structure of soil methanotrophic communities. Environ. Microbiol. 7,660–669.
Muyzer, G., de Waal, E.C., Uitterlinden, A.G., 1993. Profiling of complex microbialpopulations by denaturing gradient gel electrophoresis analysis of polymerasechain reaction-amplified genes coding for 16S rRNA. Appl. Environ. Microbiol. 59,695–700.
Nicolas, J.L., Robic, E., Ansquer, D., 1989. Bacterial flora associated with a trophic chainconsisting of microalgae, rotifers and turbot larvae: influence of bacteria on larvalsurvival. Aquaculture 83, 237–248.
Ortells, R., Gomez, A., Serra, M., 2003. Coexistence of cryptic rotifer species: ecologicaland genetic characterisation of Brachionus plicatilis. Freshw. Biol. 48, 2194–2202.
Papakostas, S., Dooms, S., Christodoulou, M., Triantafyllidis, A., Kappas, I., Dierckens, K.,Bossier, P., Sorgeloos, P., Abatzopoulos, T.J., 2006. Identification of cultured Brachionusrotifers based on RFLP and SSCP Screening. Mar. Biotechnol. 8, 547–559.
Rombaut, G., Dhert, P., Vandenberghe, J., Verschuere, L., Sorgeloos, P., Verstraete, W.,1999. Selection of bacteria enhancing the growth rate of axenically hatched rotifers(Brachionus plicatilis). Aquaculture 176, 195–207.
Rombaut, G., Suantika, G., Boon, N., Maertens, S., Dhert, P., Top, E., Sorgeloos, P.,Verstraete, W., 2001. Monitoring of the evolving diversity of the microbialcommunity present in rotifer culture. Aquaculture 198, 237–252.
Serra, M., Gomez, A., Carmona, M.J., 1998. Ecological genetics of Brachionus sympatricsibling species. Hydrobiologia 387, 373–384.
Skjermo, J., Vadstein, O., 1993. Characterization of the bacterial flora of mass cultivatedBrachionus plicatilis. Hydrobiologia 255, 185–191.
Skjermo, J., Vadstein, O., 1999. Techniques for microbial control in the intensive rearingof marine larvae. Aquaculture 177, 333–343.
Skjermo, J., Salvesen, I., Oie, G., Olsen, Y., Vadstein, O., 1997. Microbiallymaturedwater: atechniques for selection of a non-opportunistic bacterial flora in water that mayimprove performance of marine larvae. Aquac. Int. 5, 13–28.
Suantika, G., Dhert, P., Nurhudah, M., Sorgeloos, P., 2000. High-density production of therotifer Brachionus plicatilis in a recirculation system: consideration of water quality,zootechnical and nutritional aspects. Aquac. Eng. 21, 201–213.
Tinh, N.T.N., Phuoc, N.N., Dierckens, K., Sorgeloos, P., Bossier, P., 2006. Gnotobioticallygrown rotifer Brachionus plicatilis sensu strictu as a tool for evaluation of microbialfunctions and nutritional value of different food types. Aquaculture 253, 421–432.
Verdonck, L., Grisez, L., Sweetman, E., Minkoff, G., Sorgeloos, P., Ollevier, F., Swings, J.,1997. Vibrios associated with routine productions of Brachionus plicatilis. Aqua-culture 149, 203–214.
Verschuere, L., Dhont, J., Sorgeloos, P., Verstraete, W., 1997. Monitoring biolog patternsand r/K-strategists in the intensive culture of Artemia juveniles. J. Appl. Microbiol.83, 603–612.
Wittebolle, L., Boon, N., Vanparys, B., Heylen, K., De Vos, P., Verstraete, W., 2005. Failure ofthe ammonia oxidation process in two pharmaceutical wastewater treatment plantsis linked to shifts in the bacterial communities. J. Appl. Microbiol. 99, 997–1006.
Wittebolle, L., Vervaeren, H., Verstraete, W., Boon, N., 2008. Quantifying communitydynamics of nitrifiers in functionally stable reactors. Appl. Environ. Microbiol. 74,286–293.
Wittebolle, L., Marzorati, M., Clement, L., Balloi, A., Daffonchio, D., Heylen, K., De Vos, P.,Verstraete, W., Boon, N., 2009. Initial community evenness favours functionalityunder selective stress. Nature. 458, 623–626.
Yoshimura, K., Tanaka, K., Yoshimatsu, T., 2003. A novel culture system for the ultra-high-density production of the rotifer, Brachionus rotundiformis—a preliminaryreport. Aquaculture 227, 165–172.
Yúfera, M., 2001. Studies on Brachionus (Rotifera): an example of interaction betweenfundamental and applied research. Hydrobiologia 446, 383–392.