Analysis of the cyclic short-term variation of indoor power line channels
12
IEEE JOURNAL ON SELECTED AREAS IN COMMUNICATIONS, VOL. 24, NO. 7, JULY 2006 1327 Analysis of the Cyclic Short-Term Variation of Indoor Power Line Channels Francisco Javier Cañete Corripio, José Antonio Cortés Arrabal, Luis Díez del Río, and José Tomás Entrambasaguas Muñoz Abstract—The purpose of this paper is to analyze the properties of indoor power line communications channels when they are used for broadband transmission. It will be shown that these channels exhibit a short-term variation, due to the fact that high-frequency parameters of electrical devices depend on the instantaneous amplitude of mains voltage. This phenomenon leads to a channel model proposal based on a linear periodically time-varying system and cyclostationary random noise. A measurement system, de- signed to capture these time variations in real power networks, and some of the most significant results obtained with it, are presented. In addition, a statistical analysis of the measurements performed in several indoor power line scenarios is included, so that the relevance of time variations in actual channels can be evaluated. Index Terms—Broadband communication, cyclostationary noise, frequency response, home appliances measurement, linear periodically time-varying (LPTV) systems, power line communi- cation (PLC), time-varying channels. I. INTRODUCTION N OWADAYS, the study of indoor power lines as broad- band communication channels is generating remarkable interest. This is mainly caused by the economical advantage of using them as part of the new last-mile technology over low-voltage distribution lines and, specially, by an increasing demand for in-home networking capabilities. Traditional measurements and models for this channel assume an linear time-invariant (LTI) nature in which changes in the response occur only as a result of the connection or disconnection of electrical appliances to the grid, which represent long-term variations [1]–[4]. However, due to the periodic time-variant behavior of some devices, synchronous to the mains frequency, the channel exhibits a periodic time-varying response and cy- clostationary noise components. The main goal of this paper is the characterization of the high-frequency properties of indoor power lines, putting emphasis on their short-time variation. Thus, this work tries to complement previous ones that analyze channel performance obviating this aspect [2], [3], [5]–[7]. This paper is organized as follows. First of all, the low-voltage distribution network structure and its main features are con- cisely outlined. In Section III, a behavioral model for electrical Manuscript received April 19, 2005; revised December 13, 2005 and February 20, 2006. This work was supported in part by the Spanish Ministry of Educación y Ciencia under Project TIC2003-06842. The authors are with the Department of Ingeniería de Comunicaciones, Uni- versity of Málaga, Málaga 29071, Spain (e-mail: [email protected]; jaca@ic. uma.es; [email protected]; [email protected]). Digital Object Identifier 10.1109/JSAC.2006.874402 devices connected to the power grid is proposed, with linear time-varying loads and cyclostationary noise generators. Mea- surement results from electrical appliances that show this vari- ation are also included. In Section IV, channel slow-time varia- tion is discussed and a measurement system designed according to it, with signal processing algorithms able to extract cyclic properties, is described. Some representative measurement re- sults of actual channels are also presented. In Section V, an analogous study is provided for the received noise. Afterwards, a statistical analysis that assesses the incidence of channel time variations in real scenarios is presented in Section VI. Finally, some conclusions about indoor PLC channels time-varying be- havior and its impact on real transmission systems are given. II. INDOOR POWER NETWORKS STRUCTURE The indoor part of the low-voltage distribution network may be seen as a structure composed of the wiring and the devices connected to it. The wires are generally deployed by means of several branch circuits that extend from the service panel to the different outlets (connection terminals), where electrical de- vices can be plugged. The wiring layout can be described by the relative position and length of the different line sections. Channel characteristics can be estimated under the assumption that indoor power lines are a series of interconnected transmis- sion lines, terminated in diverse loads that model the connected devices. Every device connected to the power network represents a terminal load that can be modeled by means of some kind of impedance function. Besides that passive feature, they also behave as generators that introduce broadband noise in the network. Actually, these can be considered the most important sources of the noise that reaches any point of the grid. Once the devices have been modeled as loads associated to a certain outlet, the transmission and reception points completely deter- mine the channel response. Even more, if devices behavior is known, it is possible to generate feasible PLC channels from actual devices measurements and a good characterization of the wiring [3]. It is appropriate to consider an additional term of noise at the receiver, apart from the one produced by the network de- vices, due to disturbances originated outside (coupled to the wires from radio stations or wireless systems emitting in the band of interest, or conducted from the service panel and due to devices in other power networks). This noise term is composed of stationary or cyclostationary components and other impulsive ones (clearly nonstationary and probably associated to transi- tions when connecting or disconnecting devices). The impulsive 0733-8716/$20.00 © 2006 IEEE
-
Upload
independent -
Category
Documents
-
view
2 -
download
0
Transcript of Analysis of the cyclic short-term variation of indoor power line channels
IEEE JOURNAL ON SELECTED AREAS IN COMMUNICATIONS, VOL. 24, NO. 7, JULY 2006 1327
Analysis of the Cyclic Short-Term Variation ofIndoor Power Line Channels
Francisco Javier Cañete Corripio, José Antonio Cortés Arrabal, Luis Díez del Río, andJosé Tomás Entrambasaguas Muñoz
Abstract—The purpose of this paper is to analyze the propertiesof indoor power line communications channels when they are usedfor broadband transmission. It will be shown that these channelsexhibit a short-term variation, due to the fact that high-frequencyparameters of electrical devices depend on the instantaneousamplitude of mains voltage. This phenomenon leads to a channelmodel proposal based on a linear periodically time-varying systemand cyclostationary random noise. A measurement system, de-signed to capture these time variations in real power networks,and some of the most significant results obtained with it, arepresented. In addition, a statistical analysis of the measurementsperformed in several indoor power line scenarios is included, sothat the relevance of time variations in actual channels can beevaluated.
Index Terms—Broadband communication, cyclostationarynoise, frequency response, home appliances measurement, linearperiodically time-varying (LPTV) systems, power line communi-cation (PLC), time-varying channels.
I. INTRODUCTION
NOWADAYS, the study of indoor power lines as broad-band communication channels is generating remarkable
interest. This is mainly caused by the economical advantageof using them as part of the new last-mile technology overlow-voltage distribution lines and, specially, by an increasingdemand for in-home networking capabilities. Traditionalmeasurements and models for this channel assume an lineartime-invariant (LTI) nature in which changes in the responseoccur only as a result of the connection or disconnection ofelectrical appliances to the grid, which represent long-termvariations [1]–[4]. However, due to the periodic time-variantbehavior of some devices, synchronous to the mains frequency,the channel exhibits a periodic time-varying response and cy-clostationary noise components. The main goal of this paper isthe characterization of the high-frequency properties of indoorpower lines, putting emphasis on their short-time variation.Thus, this work tries to complement previous ones that analyzechannel performance obviating this aspect [2], [3], [5]–[7].
This paper is organized as follows. First of all, the low-voltagedistribution network structure and its main features are con-cisely outlined. In Section III, a behavioral model for electrical
Manuscript received April 19, 2005; revised December 13, 2005 and February20, 2006. This work was supported in part by the Spanish Ministry of Educacióny Ciencia under Project TIC2003-06842.
The authors are with the Department of Ingeniería de Comunicaciones, Uni-versity of Málaga, Málaga 29071, Spain (e-mail: [email protected]; [email protected]; [email protected]; [email protected]).
Digital Object Identifier 10.1109/JSAC.2006.874402
devices connected to the power grid is proposed, with lineartime-varying loads and cyclostationary noise generators. Mea-surement results from electrical appliances that show this vari-ation are also included. In Section IV, channel slow-time varia-tion is discussed and a measurement system designed accordingto it, with signal processing algorithms able to extract cyclicproperties, is described. Some representative measurement re-sults of actual channels are also presented. In Section V, ananalogous study is provided for the received noise. Afterwards,a statistical analysis that assesses the incidence of channel timevariations in real scenarios is presented in Section VI. Finally,some conclusions about indoor PLC channels time-varying be-havior and its impact on real transmission systems are given.
II. INDOOR POWER NETWORKS STRUCTURE
The indoor part of the low-voltage distribution network maybe seen as a structure composed of the wiring and the devicesconnected to it. The wires are generally deployed by means ofseveral branch circuits that extend from the service panel tothe different outlets (connection terminals), where electrical de-vices can be plugged. The wiring layout can be described bythe relative position and length of the different line sections.Channel characteristics can be estimated under the assumptionthat indoor power lines are a series of interconnected transmis-sion lines, terminated in diverse loads that model the connecteddevices.
Every device connected to the power network representsa terminal load that can be modeled by means of some kindof impedance function. Besides that passive feature, they alsobehave as generators that introduce broadband noise in thenetwork. Actually, these can be considered the most importantsources of the noise that reaches any point of the grid. Oncethe devices have been modeled as loads associated to a certainoutlet, the transmission and reception points completely deter-mine the channel response. Even more, if devices behavior isknown, it is possible to generate feasible PLC channels fromactual devices measurements and a good characterization of thewiring [3].
It is appropriate to consider an additional term of noise atthe receiver, apart from the one produced by the network de-vices, due to disturbances originated outside (coupled to thewires from radio stations or wireless systems emitting in theband of interest, or conducted from the service panel and due todevices in other power networks). This noise term is composedof stationary or cyclostationary components and other impulsiveones (clearly nonstationary and probably associated to transi-tions when connecting or disconnecting devices). The impulsive
0733-8716/$20.00 © 2006 IEEE
1328 IEEE JOURNAL ON SELECTED AREAS IN COMMUNICATIONS, VOL. 24, NO. 7, JULY 2006
components are out of the scope of this work because they havebeen already studied in depth [9].
In addition, devices properties in the high-frequency rangechange when they are turned on/off, which cause long-termchannel variations since they occur within a time scale ofminutes or hours [3]. Actually, such channel dynamics can bemodeled as if a new power line network structure appears everytime some appliance changes its working state. In this paper,it is assumed that there are no changes in the devices workingstate, so the power line network structure is “static.” We areinterested only in short-term channel variations [10].
III. DEVICES CHARACTERIZATION
There exists a large diversity of devices that can be connectedto indoor power networks. If working state changes are putaside, the voltage to current relation in some devices is linearand time-invariant (LTI), and so their load can be completelycharacterized by an impedance, usually frequency-dependent.However, there are many other devices with a behavior that isfar from being LTI. In the same way, the noise generated bysome devices is stationary and can be characterized by a certainpower spectral density (PSD), while others not.
In PLC transmission systems there is a high separation, bothin frequency and voltage level, of the two waveform compo-nents at any device: the AC waveform, sinusoidal with 50 Hzand 230 (in Europe), and the communication signal (witha voltage usually below 1 V and higher frequency). Performedmeasurements corroborate, as expected, that home applianceshigh-frequency properties exhibit an appreciable nonlinear be-havior only determined by the AC waveform, since the com-munication signal level is negligible. This leads to a devicesmall-signal model whose parameters depend on the instanta-neous value of mains voltage, and hence, are periodic in time.It comprises a cyclostationary noise source, characterized by itsshort-term instantaneous power spectral density [11],and a linear periodically time-varying (LPTV) load, character-ized by its short-term impedance .
A. Devices Load Impedance Measurements
In order to analyze the behavior of the appliances, it isessential to synchronize the measurement system with mainsvoltage. The basic elements employed to measure loadsimpedance values are a vectorial network analyzer, a couplingcircuit (to protect this instrument from the mains), and a triggercircuit [12]. The latter is required to control the analyzer fre-quency sweep with mains voltage (conventional measurementsuse a self-triggered sweep mode). Impedance values of tens ofcommon electrical appliances have been measured with thisarrangement.
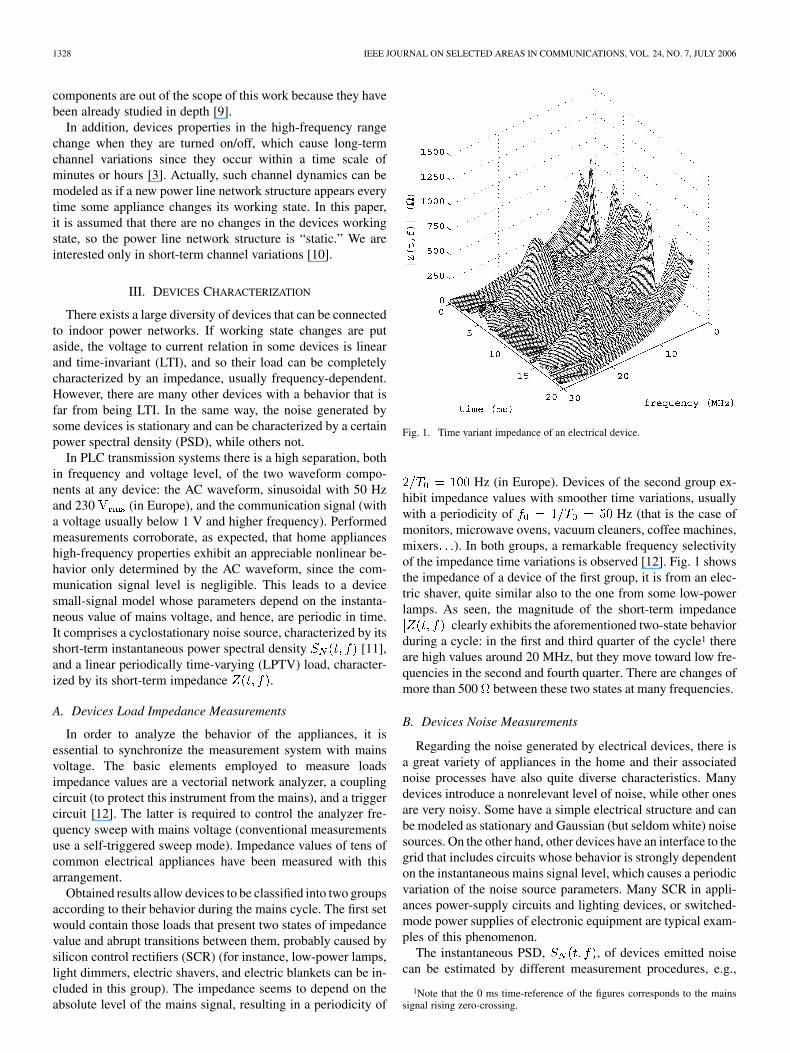
Obtained results allow devices to be classified into two groupsaccording to their behavior during the mains cycle. The first setwould contain those loads that present two states of impedancevalue and abrupt transitions between them, probably caused bysilicon control rectifiers (SCR) (for instance, low-power lamps,light dimmers, electric shavers, and electric blankets can be in-cluded in this group). The impedance seems to depend on theabsolute level of the mains signal, resulting in a periodicity of
Fig. 1. Time variant impedance of an electrical device.
Hz (in Europe). Devices of the second group ex-hibit impedance values with smoother time variations, usuallywith a periodicity of Hz (that is the case ofmonitors, microwave ovens, vacuum cleaners, coffee machines,mixers ). In both groups, a remarkable frequency selectivityof the impedance time variations is observed [12]. Fig. 1 showsthe impedance of a device of the first group, it is from an elec-tric shaver, quite similar also to the one from some low-powerlamps. As seen, the magnitude of the short-term impedance
clearly exhibits the aforementioned two-state behaviorduring a cycle: in the first and third quarter of the cycle1 thereare high values around 20 MHz, but they move toward low fre-quencies in the second and fourth quarter. There are changes ofmore than 500 between these two states at many frequencies.
B. Devices Noise Measurements
Regarding the noise generated by electrical devices, there isa great variety of appliances in the home and their associatednoise processes have also quite diverse characteristics. Manydevices introduce a nonrelevant level of noise, while other onesare very noisy. Some have a simple electrical structure and canbe modeled as stationary and Gaussian (but seldom white) noisesources. On the other hand, other devices have an interface to thegrid that includes circuits whose behavior is strongly dependenton the instantaneous mains signal level, which causes a periodicvariation of the noise source parameters. Many SCR in appli-ances power-supply circuits and lighting devices, or switched-mode power supplies of electronic equipment are typical exam-ples of this phenomenon.
The instantaneous PSD, , of devices emitted noisecan be estimated by different measurement procedures, e.g.,
1Note that the 0 ms time-reference of the figures corresponds to the mainssignal rising zero-crossing.
CAÑETE CORRIPIO et al.: ANALYSIS OF THE CYCLIC SHORT-TERM VARIATION OF INDOOR POWER LINE CHANNELS 1329
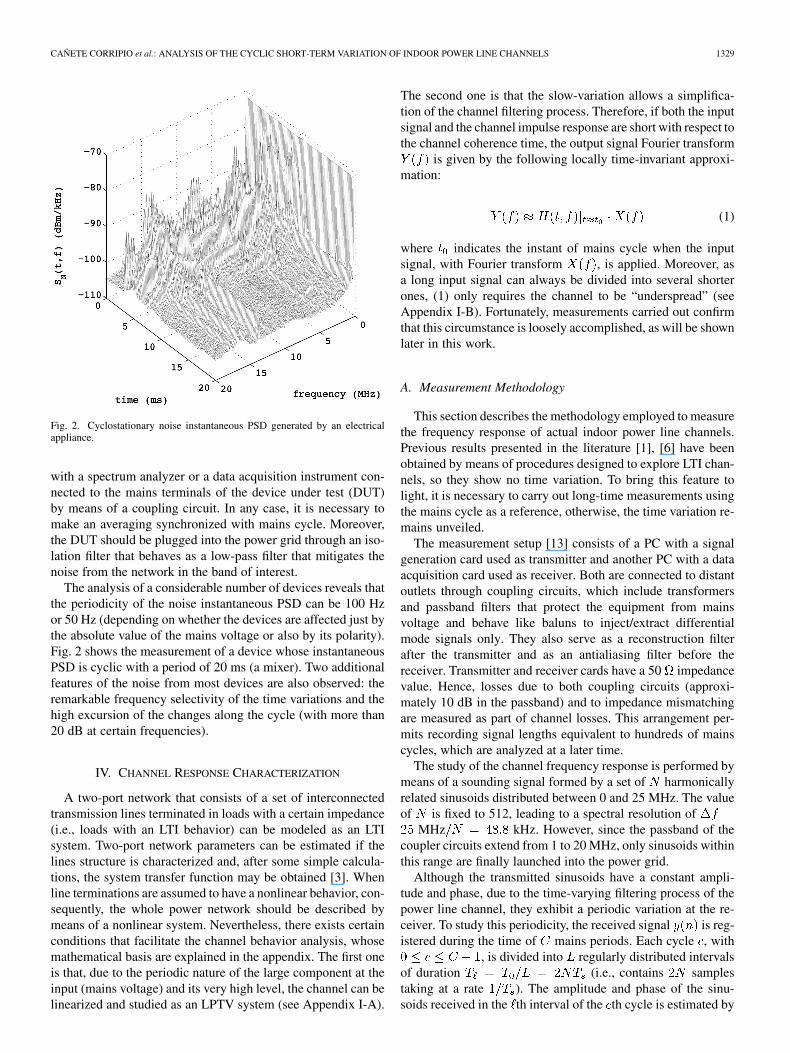
Fig. 2. Cyclostationary noise instantaneous PSD generated by an electricalappliance.
with a spectrum analyzer or a data acquisition instrument con-nected to the mains terminals of the device under test (DUT)by means of a coupling circuit. In any case, it is necessary tomake an averaging synchronized with mains cycle. Moreover,the DUT should be plugged into the power grid through an iso-lation filter that behaves as a low-pass filter that mitigates thenoise from the network in the band of interest.
The analysis of a considerable number of devices reveals thatthe periodicity of the noise instantaneous PSD can be 100 Hzor 50 Hz (depending on whether the devices are affected just bythe absolute value of the mains voltage or also by its polarity).Fig. 2 shows the measurement of a device whose instantaneousPSD is cyclic with a period of 20 ms (a mixer). Two additionalfeatures of the noise from most devices are also observed: theremarkable frequency selectivity of the time variations and thehigh excursion of the changes along the cycle (with more than20 dB at certain frequencies).
IV. CHANNEL RESPONSE CHARACTERIZATION
A two-port network that consists of a set of interconnectedtransmission lines terminated in loads with a certain impedance(i.e., loads with an LTI behavior) can be modeled as an LTIsystem. Two-port network parameters can be estimated if thelines structure is characterized and, after some simple calcula-tions, the system transfer function may be obtained [3]. Whenline terminations are assumed to have a nonlinear behavior, con-sequently, the whole power network should be described bymeans of a nonlinear system. Nevertheless, there exists certainconditions that facilitate the channel behavior analysis, whosemathematical basis are explained in the appendix. The first oneis that, due to the periodic nature of the large component at theinput (mains voltage) and its very high level, the channel can belinearized and studied as an LPTV system (see Appendix I-A).
The second one is that the slow-variation allows a simplifica-tion of the channel filtering process. Therefore, if both the inputsignal and the channel impulse response are short with respect tothe channel coherence time, the output signal Fourier transform
is given by the following locally time-invariant approxi-mation:
(1)
where indicates the instant of mains cycle when the inputsignal, with Fourier transform , is applied. Moreover, asa long input signal can always be divided into several shorterones, (1) only requires the channel to be “underspread” (seeAppendix I-B). Fortunately, measurements carried out confirmthat this circumstance is loosely accomplished, as will be shownlater in this work.
A. Measurement Methodology
This section describes the methodology employed to measurethe frequency response of actual indoor power line channels.Previous results presented in the literature [1], [6] have beenobtained by means of procedures designed to explore LTI chan-nels, so they show no time variation. To bring this feature tolight, it is necessary to carry out long-time measurements usingthe mains cycle as a reference, otherwise, the time variation re-mains unveiled.
The measurement setup [13] consists of a PC with a signalgeneration card used as transmitter and another PC with a dataacquisition card used as receiver. Both are connected to distantoutlets through coupling circuits, which include transformersand passband filters that protect the equipment from mainsvoltage and behave like baluns to inject/extract differentialmode signals only. They also serve as a reconstruction filterafter the transmitter and as an antialiasing filter before thereceiver. Transmitter and receiver cards have a 50 impedancevalue. Hence, losses due to both coupling circuits (approxi-mately 10 dB in the passband) and to impedance mismatchingare measured as part of channel losses. This arrangement per-mits recording signal lengths equivalent to hundreds of mainscycles, which are analyzed at a later time.
The study of the channel frequency response is performed bymeans of a sounding signal formed by a set of harmonicallyrelated sinusoids distributed between 0 and 25 MHz. The valueof is fixed to 512, leading to a spectral resolution of
MHz kHz. However, since the passband of thecoupler circuits extend from 1 to 20 MHz, only sinusoids withinthis range are finally launched into the power grid.
Although the transmitted sinusoids have a constant ampli-tude and phase, due to the time-varying filtering process of thepower line channel, they exhibit a periodic variation at the re-ceiver. To study this periodicity, the received signal is reg-istered during the time of mains periods. Each cycle , with
, is divided into regularly distributed intervalsof duration (i.e., contains samplestaking at a rate ). The amplitude and phase of the sinu-soids received in the th interval of the th cycle is estimated by
1330 IEEE JOURNAL ON SELECTED AREAS IN COMMUNICATIONS, VOL. 24, NO. 7, JULY 2006
computing the -point discrete Fourier transform (DFT) of thesignal , with
(2)
which, provided that the slow-variation assumption in (1) ap-plies, can also be expressed as
(3)
is a sampled version of the frequency response, where and
are the time index and frequency index, respectively.is the Fourier series coefficient of the sinusoid transmitted atfrequency and is the DFT of the noisereceived during the th interval of the th cycle.
An estimate of the frequency response has been ob-tained by performing a synchronized averaging of (3)
(4)
with fixed to 234, to 976 and, hence, a of, approximately,20.5 s.
Additional synchronization correction algorithms have beenemployed to compensate for the frequency mismatch betweenthe transmitter and the receiver clocks and for the accumulatedjitter of the mains, which cannot be neglected when averagingover hundreds of cycles.
The methodology described up to now assumes a linear be-havior of the channel for the communication signal. To corrobo-rate this premise, it must be ensured that the possible harmonicsand intermodulation products generated by the channel duringthe th interval will have different phase in each processed cycle.Since this end cannot be guaranteed by transmitting constantphase sinusoids, the sounding signal and receiver algorithmshave been changed to create a discrete multitone (DMT) system[14]. The number of carriers has been fixed to 512 and the cyclicprefix length has been varied to obtain DMT symbols lengths,
, in the range from 21.48 s to 27.50 s (short enough tocomply with the slow-variation assumption). The comparison ofthe frequency responses estimated with both methods confirmsthe linear behavior of the channel for the communication signal.
Measurements have been carried out in three different sce-narios: in a university building (in laboratories and offices,where there are mainly PCs), in an apartment of about 80 m ,and in a detached house of about 300 m . The number of reg-istered channels, chosen between different outlets at random,exceed 50, with a similar number of them at the mentionedlocations. The devices plugged in the power network outletsduring the measurements were not intentionally selected; theywere in their habitual location and no additional device with aspecial time-varying behavior was included.
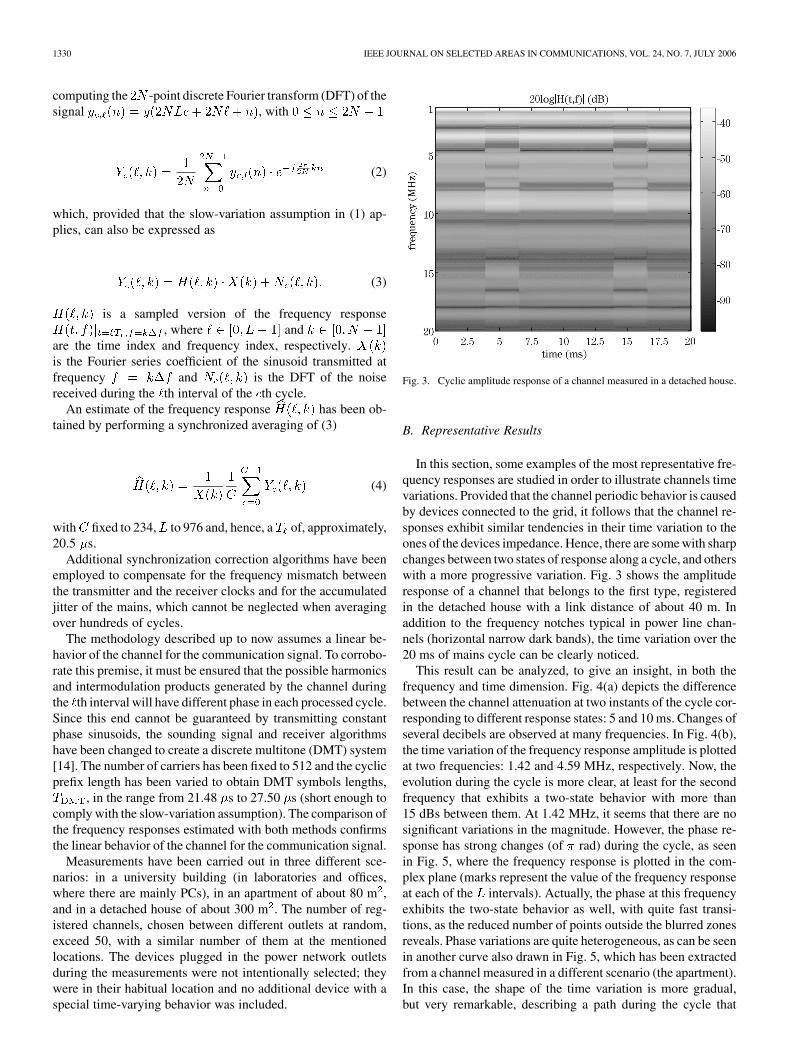
Fig. 3. Cyclic amplitude response of a channel measured in a detached house.
B. Representative Results
In this section, some examples of the most representative fre-quency responses are studied in order to illustrate channels timevariations. Provided that the channel periodic behavior is causedby devices connected to the grid, it follows that the channel re-sponses exhibit similar tendencies in their time variation to theones of the devices impedance. Hence, there are some with sharpchanges between two states of response along a cycle, and otherswith a more progressive variation. Fig. 3 shows the amplituderesponse of a channel that belongs to the first type, registeredin the detached house with a link distance of about 40 m. Inaddition to the frequency notches typical in power line chan-nels (horizontal narrow dark bands), the time variation over the20 ms of mains cycle can be clearly noticed.
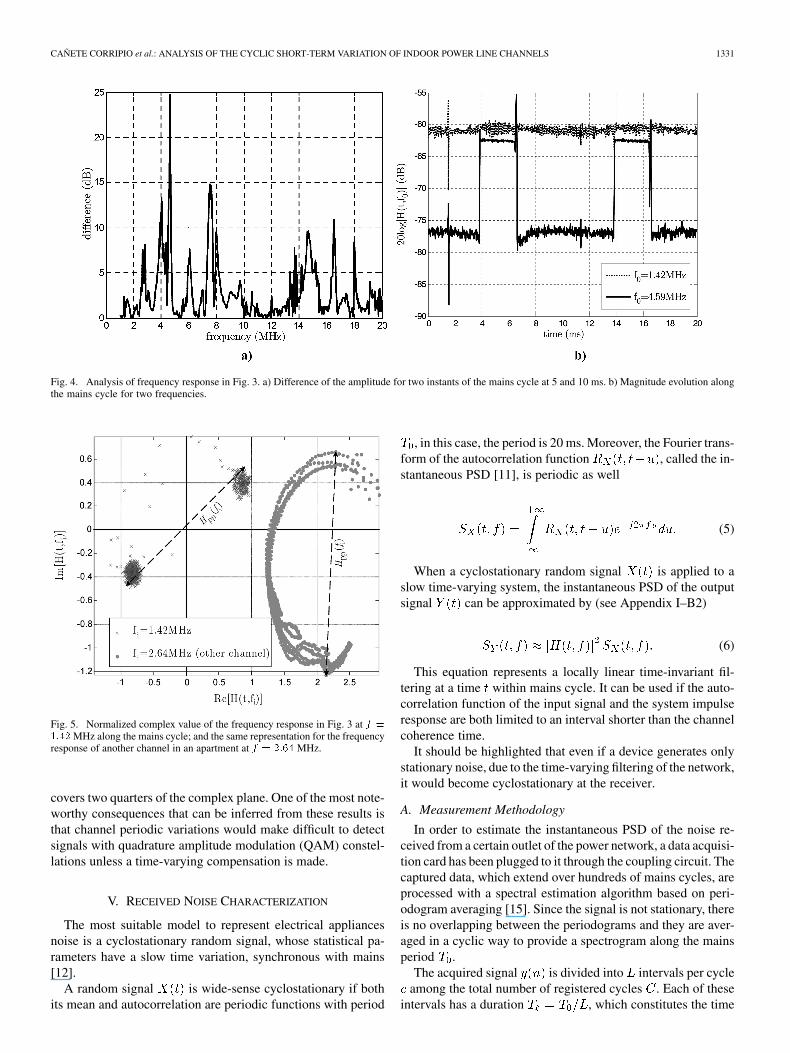
This result can be analyzed, to give an insight, in both thefrequency and time dimension. Fig. 4(a) depicts the differencebetween the channel attenuation at two instants of the cycle cor-responding to different response states: 5 and 10 ms. Changes ofseveral decibels are observed at many frequencies. In Fig. 4(b),the time variation of the frequency response amplitude is plottedat two frequencies: 1.42 and 4.59 MHz, respectively. Now, theevolution during the cycle is more clear, at least for the secondfrequency that exhibits a two-state behavior with more than15 dBs between them. At 1.42 MHz, it seems that there are nosignificant variations in the magnitude. However, the phase re-sponse has strong changes (of rad) during the cycle, as seenin Fig. 5, where the frequency response is plotted in the com-plex plane (marks represent the value of the frequency responseat each of the intervals). Actually, the phase at this frequencyexhibits the two-state behavior as well, with quite fast transi-tions, as the reduced number of points outside the blurred zonesreveals. Phase variations are quite heterogeneous, as can be seenin another curve also drawn in Fig. 5, which has been extractedfrom a channel measured in a different scenario (the apartment).In this case, the shape of the time variation is more gradual,but very remarkable, describing a path during the cycle that
CAÑETE CORRIPIO et al.: ANALYSIS OF THE CYCLIC SHORT-TERM VARIATION OF INDOOR POWER LINE CHANNELS 1331
Fig. 4. Analysis of frequency response in Fig. 3. a) Difference of the amplitude for two instants of the mains cycle at 5 and 10 ms. b) Magnitude evolution alongthe mains cycle for two frequencies.
Fig. 5. Normalized complex value of the frequency response in Fig. 3 at f =
1:42MHz along the mains cycle; and the same representation for the frequencyresponse of another channel in an apartment at f = 2:64 MHz.
covers two quarters of the complex plane. One of the most note-worthy consequences that can be inferred from these results isthat channel periodic variations would make difficult to detectsignals with quadrature amplitude modulation (QAM) constel-lations unless a time-varying compensation is made.
V. RECEIVED NOISE CHARACTERIZATION
The most suitable model to represent electrical appliancesnoise is a cyclostationary random signal, whose statistical pa-rameters have a slow time variation, synchronous with mains[12].
A random signal is wide-sense cyclostationary if bothits mean and autocorrelation are periodic functions with period
, in this case, the period is 20 ms. Moreover, the Fourier trans-form of the autocorrelation function , called the in-stantaneous PSD [11], is periodic as well
(5)
When a cyclostationary random signal is applied to aslow time-varying system, the instantaneous PSD of the outputsignal can be approximated by (see Appendix I–B2)
(6)
This equation represents a locally linear time-invariant fil-tering at a time within mains cycle. It can be used if the auto-correlation function of the input signal and the system impulseresponse are both limited to an interval shorter than the channelcoherence time.
It should be highlighted that even if a device generates onlystationary noise, due to the time-varying filtering of the network,it would become cyclostationary at the receiver.
A. Measurement Methodology
In order to estimate the instantaneous PSD of the noise re-ceived from a certain outlet of the power network, a data acquisi-tion card has been plugged to it through the coupling circuit. Thecaptured data, which extend over hundreds of mains cycles, areprocessed with a spectral estimation algorithm based on peri-odogram averaging [15]. Since the signal is not stationary, thereis no overlapping between the periodograms and they are aver-aged in a cyclic way to provide a spectrogram along the mainsperiod .
The acquired signal is divided into intervals per cycleamong the total number of registered cycles . Each of these
intervals has a duration , which constitutes the time
1332 IEEE JOURNAL ON SELECTED AREAS IN COMMUNICATIONS, VOL. 24, NO. 7, JULY 2006
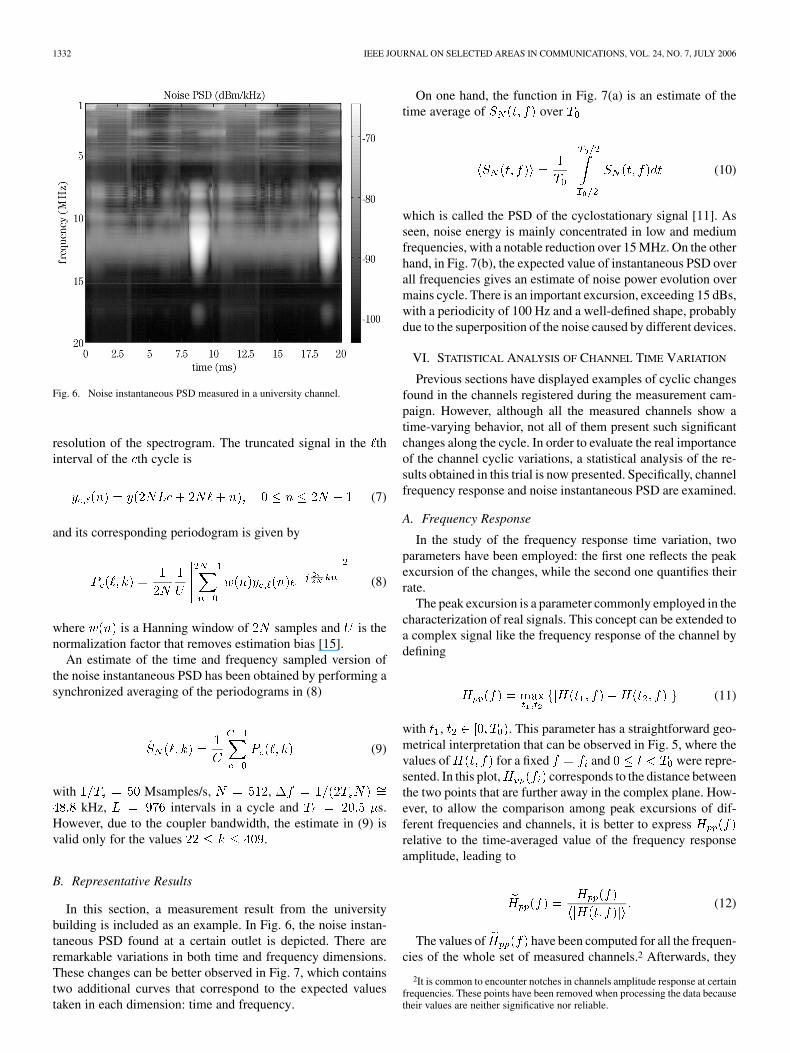
Fig. 6. Noise instantaneous PSD measured in a university channel.
resolution of the spectrogram. The truncated signal in the thinterval of the th cycle is
(7)
and its corresponding periodogram is given by
(8)
where is a Hanning window of samples and is thenormalization factor that removes estimation bias [15].
An estimate of the time and frequency sampled version ofthe noise instantaneous PSD has been obtained by performing asynchronized averaging of the periodograms in (8)
(9)
with Msamples/s, ,kHz, intervals in a cycle and s.
However, due to the coupler bandwidth, the estimate in (9) isvalid only for the values .
B. Representative Results
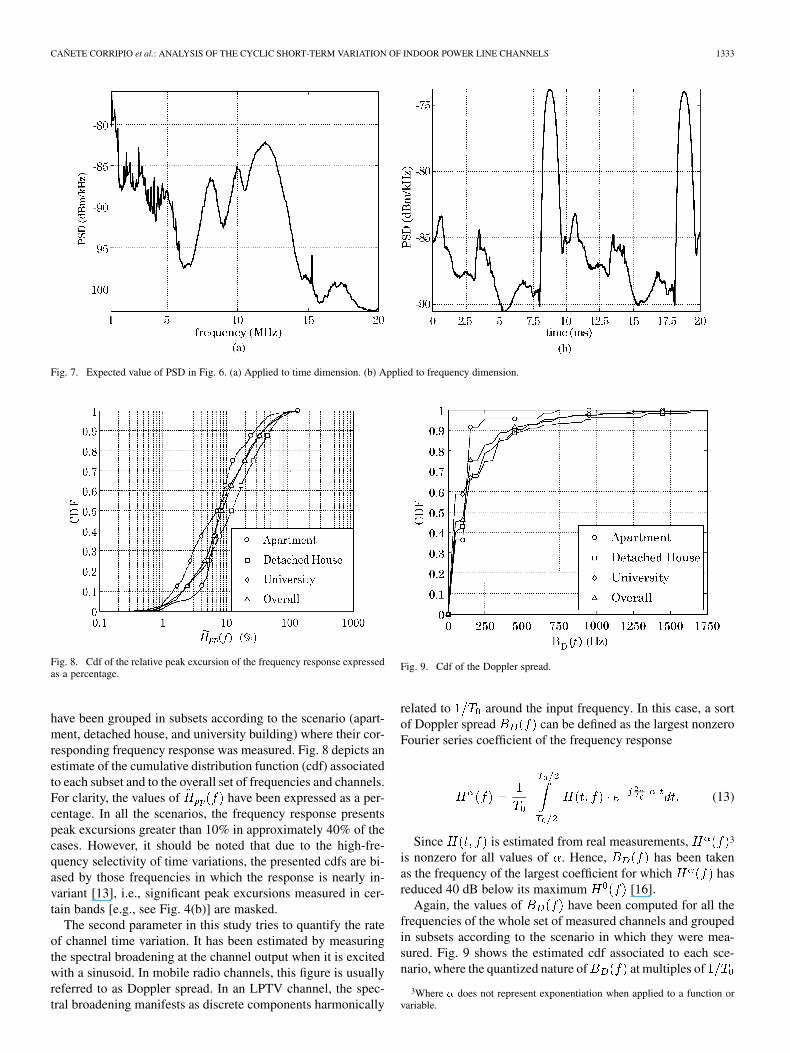
In this section, a measurement result from the universitybuilding is included as an example. In Fig. 6, the noise instan-taneous PSD found at a certain outlet is depicted. There areremarkable variations in both time and frequency dimensions.These changes can be better observed in Fig. 7, which containstwo additional curves that correspond to the expected valuestaken in each dimension: time and frequency.
On one hand, the function in Fig. 7(a) is an estimate of thetime average of over
(10)
which is called the PSD of the cyclostationary signal [11]. Asseen, noise energy is mainly concentrated in low and mediumfrequencies, with a notable reduction over 15 MHz. On the otherhand, in Fig. 7(b), the expected value of instantaneous PSD overall frequencies gives an estimate of noise power evolution overmains cycle. There is an important excursion, exceeding 15 dBs,with a periodicity of 100 Hz and a well-defined shape, probablydue to the superposition of the noise caused by different devices.
VI. STATISTICAL ANALYSIS OF CHANNEL TIME VARIATION
Previous sections have displayed examples of cyclic changesfound in the channels registered during the measurement cam-paign. However, although all the measured channels show atime-varying behavior, not all of them present such significantchanges along the cycle. In order to evaluate the real importanceof the channel cyclic variations, a statistical analysis of the re-sults obtained in this trial is now presented. Specifically, channelfrequency response and noise instantaneous PSD are examined.
A. Frequency Response
In the study of the frequency response time variation, twoparameters have been employed: the first one reflects the peakexcursion of the changes, while the second one quantifies theirrate.
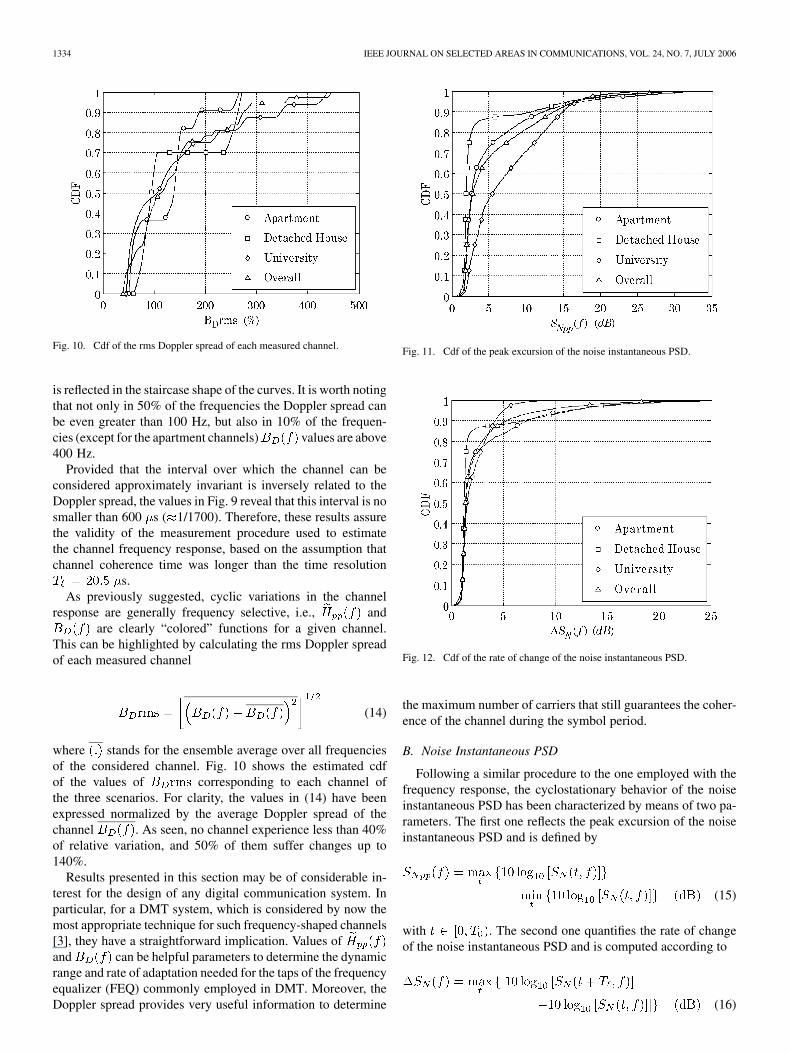
The peak excursion is a parameter commonly employed in thecharacterization of real signals. This concept can be extended toa complex signal like the frequency response of the channel bydefining
(11)
with , . This parameter has a straightforward geo-metrical interpretation that can be observed in Fig. 5, where thevalues of for a fixed and were repre-sented. In this plot, corresponds to the distance betweenthe two points that are further away in the complex plane. How-ever, to allow the comparison among peak excursions of dif-ferent frequencies and channels, it is better to expressrelative to the time-averaged value of the frequency responseamplitude, leading to
(12)
The values of have been computed for all the frequen-cies of the whole set of measured channels.2 Afterwards, they
2It is common to encounter notches in channels amplitude response at certainfrequencies. These points have been removed when processing the data becausetheir values are neither significative nor reliable.
CAÑETE CORRIPIO et al.: ANALYSIS OF THE CYCLIC SHORT-TERM VARIATION OF INDOOR POWER LINE CHANNELS 1333
Fig. 7. Expected value of PSD in Fig. 6. (a) Applied to time dimension. (b) Applied to frequency dimension.
Fig. 8. Cdf of the relative peak excursion of the frequency response expressedas a percentage.
have been grouped in subsets according to the scenario (apart-ment, detached house, and university building) where their cor-responding frequency response was measured. Fig. 8 depicts anestimate of the cumulative distribution function (cdf) associatedto each subset and to the overall set of frequencies and channels.For clarity, the values of have been expressed as a per-centage. In all the scenarios, the frequency response presentspeak excursions greater than 10% in approximately 40% of thecases. However, it should be noted that due to the high-fre-quency selectivity of time variations, the presented cdfs are bi-ased by those frequencies in which the response is nearly in-variant [13], i.e., significant peak excursions measured in cer-tain bands [e.g., see Fig. 4(b)] are masked.
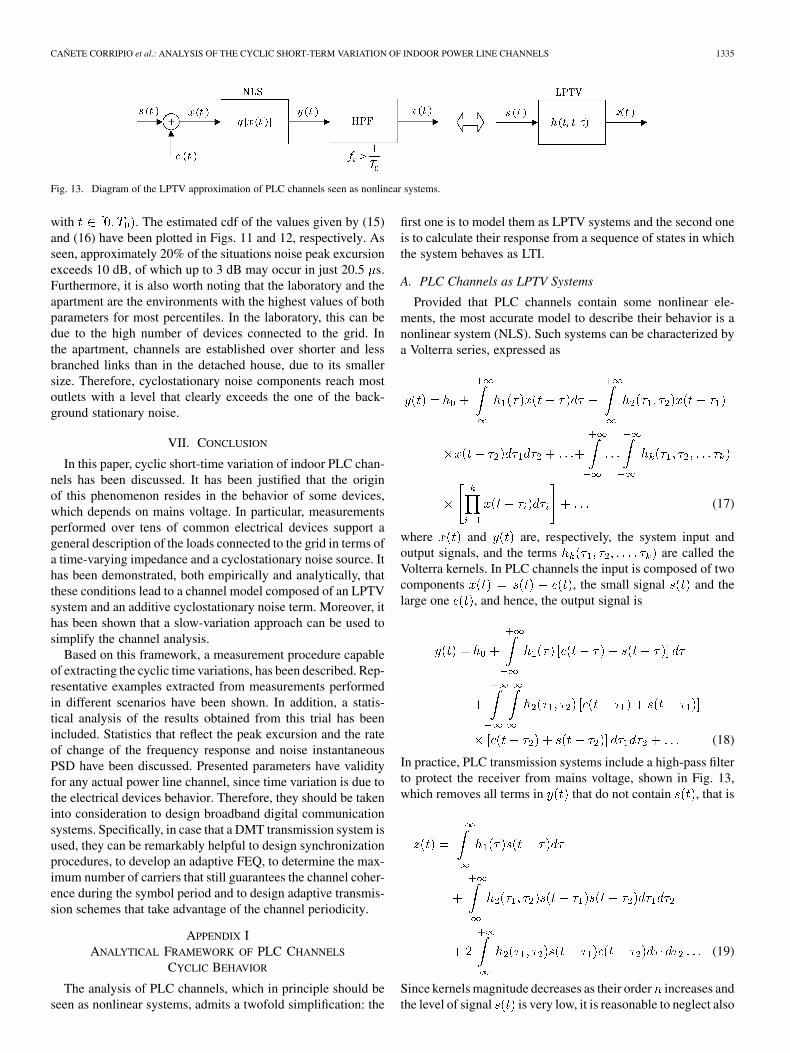
The second parameter in this study tries to quantify the rateof channel time variation. It has been estimated by measuringthe spectral broadening at the channel output when it is excitedwith a sinusoid. In mobile radio channels, this figure is usuallyreferred to as Doppler spread. In an LPTV channel, the spec-tral broadening manifests as discrete components harmonically
Fig. 9. Cdf of the Doppler spread.
related to around the input frequency. In this case, a sortof Doppler spread can be defined as the largest nonzeroFourier series coefficient of the frequency response
(13)
Since is estimated from real measurements, 3
is nonzero for all values of . Hence, has been takenas the frequency of the largest coefficient for which hasreduced 40 dB below its maximum [16].
Again, the values of have been computed for all thefrequencies of the whole set of measured channels and groupedin subsets according to the scenario in which they were mea-sured. Fig. 9 shows the estimated cdf associated to each sce-nario, where the quantized nature of at multiples of
3Where � does not represent exponentiation when applied to a function orvariable.
1334 IEEE JOURNAL ON SELECTED AREAS IN COMMUNICATIONS, VOL. 24, NO. 7, JULY 2006
Fig. 10. Cdf of the rms Doppler spread of each measured channel.
is reflected in the staircase shape of the curves. It is worth notingthat not only in 50% of the frequencies the Doppler spread canbe even greater than 100 Hz, but also in 10% of the frequen-cies (except for the apartment channels) values are above400 Hz.
Provided that the interval over which the channel can beconsidered approximately invariant is inversely related to theDoppler spread, the values in Fig. 9 reveal that this interval is nosmaller than 600 s ( 1/1700). Therefore, these results assurethe validity of the measurement procedure used to estimatethe channel frequency response, based on the assumption thatchannel coherence time was longer than the time resolution
s.As previously suggested, cyclic variations in the channel
response are generally frequency selective, i.e., andare clearly “colored” functions for a given channel.
This can be highlighted by calculating the rms Doppler spreadof each measured channel
(14)
where stands for the ensemble average over all frequenciesof the considered channel. Fig. 10 shows the estimated cdfof the values of corresponding to each channel ofthe three scenarios. For clarity, the values in (14) have beenexpressed normalized by the average Doppler spread of thechannel . As seen, no channel experience less than 40%of relative variation, and 50% of them suffer changes up to140%.
Results presented in this section may be of considerable in-terest for the design of any digital communication system. Inparticular, for a DMT system, which is considered by now themost appropriate technique for such frequency-shaped channels[3], they have a straightforward implication. Values ofand can be helpful parameters to determine the dynamicrange and rate of adaptation needed for the taps of the frequencyequalizer (FEQ) commonly employed in DMT. Moreover, theDoppler spread provides very useful information to determine
Fig. 11. Cdf of the peak excursion of the noise instantaneous PSD.
Fig. 12. Cdf of the rate of change of the noise instantaneous PSD.
the maximum number of carriers that still guarantees the coher-ence of the channel during the symbol period.
B. Noise Instantaneous PSD
Following a similar procedure to the one employed with thefrequency response, the cyclostationary behavior of the noiseinstantaneous PSD has been characterized by means of two pa-rameters. The first one reflects the peak excursion of the noiseinstantaneous PSD and is defined by
(15)
with . The second one quantifies the rate of changeof the noise instantaneous PSD and is computed according to
(16)
CAÑETE CORRIPIO et al.: ANALYSIS OF THE CYCLIC SHORT-TERM VARIATION OF INDOOR POWER LINE CHANNELS 1335
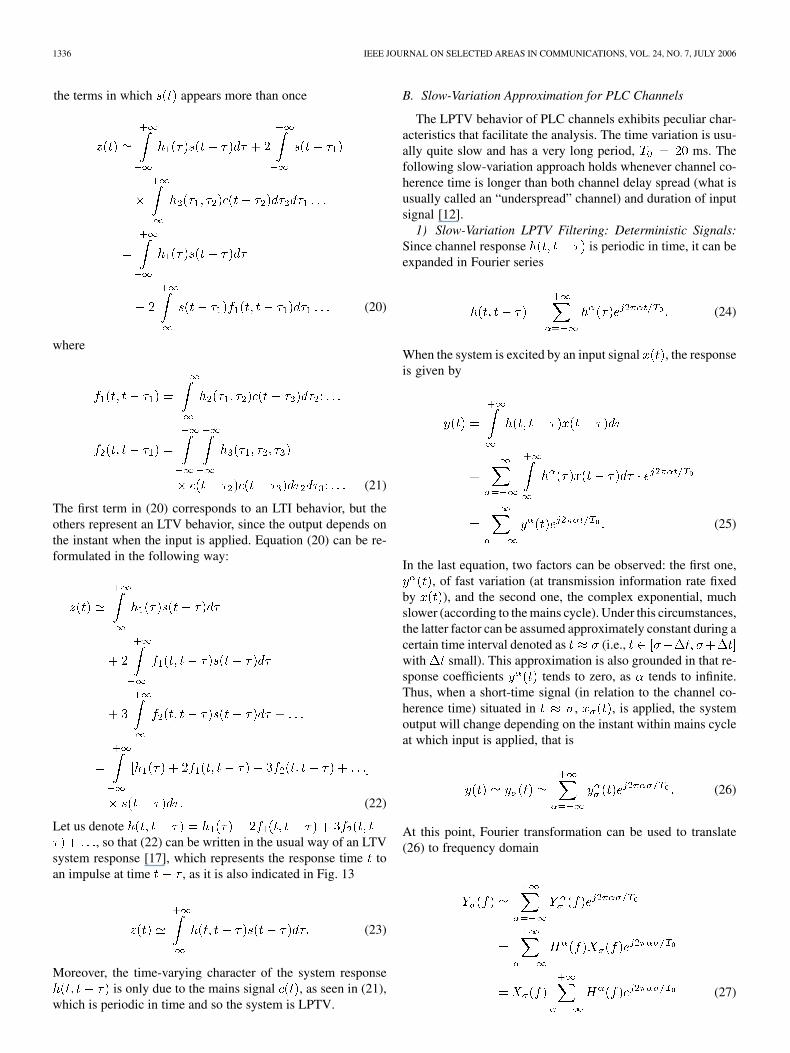
Fig. 13. Diagram of the LPTV approximation of PLC channels seen as nonlinear systems.
with . The estimated cdf of the values given by (15)and (16) have been plotted in Figs. 11 and 12, respectively. Asseen, approximately 20% of the situations noise peak excursionexceeds 10 dB, of which up to 3 dB may occur in just 20.5 s.Furthermore, it is also worth noting that the laboratory and theapartment are the environments with the highest values of bothparameters for most percentiles. In the laboratory, this can bedue to the high number of devices connected to the grid. Inthe apartment, channels are established over shorter and lessbranched links than in the detached house, due to its smallersize. Therefore, cyclostationary noise components reach mostoutlets with a level that clearly exceeds the one of the back-ground stationary noise.
VII. CONCLUSION
In this paper, cyclic short-time variation of indoor PLC chan-nels has been discussed. It has been justified that the originof this phenomenon resides in the behavior of some devices,which depends on mains voltage. In particular, measurementsperformed over tens of common electrical devices support ageneral description of the loads connected to the grid in terms ofa time-varying impedance and a cyclostationary noise source. Ithas been demonstrated, both empirically and analytically, thatthese conditions lead to a channel model composed of an LPTVsystem and an additive cyclostationary noise term. Moreover, ithas been shown that a slow-variation approach can be used tosimplify the channel analysis.
Based on this framework, a measurement procedure capableof extracting the cyclic time variations, has been described. Rep-resentative examples extracted from measurements performedin different scenarios have been shown. In addition, a statis-tical analysis of the results obtained from this trial has beenincluded. Statistics that reflect the peak excursion and the rateof change of the frequency response and noise instantaneousPSD have been discussed. Presented parameters have validityfor any actual power line channel, since time variation is due tothe electrical devices behavior. Therefore, they should be takeninto consideration to design broadband digital communicationsystems. Specifically, in case that a DMT transmission system isused, they can be remarkably helpful to design synchronizationprocedures, to develop an adaptive FEQ, to determine the max-imum number of carriers that still guarantees the channel coher-ence during the symbol period and to design adaptive transmis-sion schemes that take advantage of the channel periodicity.
APPENDIX IANALYTICAL FRAMEWORK OF PLC CHANNELS
CYCLIC BEHAVIOR
The analysis of PLC channels, which in principle should beseen as nonlinear systems, admits a twofold simplification: the
first one is to model them as LPTV systems and the second oneis to calculate their response from a sequence of states in whichthe system behaves as LTI.
A. PLC Channels as LPTV Systems
Provided that PLC channels contain some nonlinear ele-ments, the most accurate model to describe their behavior is anonlinear system (NLS). Such systems can be characterized bya Volterra series, expressed as
(17)
where and are, respectively, the system input andoutput signals, and the terms are called theVolterra kernels. In PLC channels the input is composed of twocomponents , the small signal and thelarge one , and hence, the output signal is
(18)
In practice, PLC transmission systems include a high-pass filterto protect the receiver from mains voltage, shown in Fig. 13,which removes all terms in that do not contain , that is
(19)
Since kernels magnitude decreases as their order increases andthe level of signal is very low, it is reasonable to neglect also
1336 IEEE JOURNAL ON SELECTED AREAS IN COMMUNICATIONS, VOL. 24, NO. 7, JULY 2006
the terms in which appears more than once
(20)
where
(21)
The first term in (20) corresponds to an LTI behavior, but theothers represent an LTV behavior, since the output depends onthe instant when the input is applied. Equation (20) can be re-formulated in the following way:
(22)
Let us denote, so that (22) can be written in the usual way of an LTV
system response [17], which represents the response time toan impulse at time , as it is also indicated in Fig. 13
(23)
Moreover, the time-varying character of the system responseis only due to the mains signal , as seen in (21),
which is periodic in time and so the system is LPTV.
B. Slow-Variation Approximation for PLC Channels
The LPTV behavior of PLC channels exhibits peculiar char-acteristics that facilitate the analysis. The time variation is usu-ally quite slow and has a very long period, ms. Thefollowing slow-variation approach holds whenever channel co-herence time is longer than both channel delay spread (what isusually called an “underspread” channel) and duration of inputsignal [12].
1) Slow-Variation LPTV Filtering: Deterministic Signals:Since channel response is periodic in time, it can beexpanded in Fourier series
(24)
When the system is excited by an input signal , the responseis given by
(25)
In the last equation, two factors can be observed: the first one,, of fast variation (at transmission information rate fixed
by ), and the second one, the complex exponential, muchslower (according to the mains cycle). Under this circumstances,the latter factor can be assumed approximately constant during acertain time interval denoted as (i.e.,with small). This approximation is also grounded in that re-sponse coefficients tends to zero, as tends to infinite.Thus, when a short-time signal (in relation to the channel co-herence time) situated in , , is applied, the systemoutput will change depending on the instant within mains cycleat which input is applied, that is
(26)
At this point, Fourier transformation can be used to translate(26) to frequency domain
(27)
CAÑETE CORRIPIO et al.: ANALYSIS OF THE CYCLIC SHORT-TERM VARIATION OF INDOOR POWER LINE CHANNELS 1337
where coefficients are related to the Fourier transform ofthe input signal by, [see (25)]
(28)
Finally, by taking into account the Fourier series of the LPTVsystem frequency response
(29)
the frequency-domain relation of the slow-variation LPTV fil-tering process is obtained
(30)
The input signal can always be made as short as desired,simply putting a long-time signal as the combination of severalshorter ones and recombining the outputs to these. Hence, thenecessary condition for (29) to hold is that the system remainsinvariant during the effective length of its impulse response.
2) Slow-Variation LPTV Filtering: Random Signals: A cy-clostationary signal has a periodic instantaneous PSD,
, defined in (5), which can be expanded in Fourier seriesof coefficients . In PLC channels, cyclostationary noisehas a period equal to the one of the LPTV channel, , whatsimplifies the analysis.
When an LPTV system is excited by a cyclostationary signalof its same period, the output is also cyclostationary and its in-stantaneous PSD has the following coefficients [11], [12]:
(31)
In practice, due to the system slow-variation, the factors in (30)can be approximated as
(32)
This expression holds true unless integers values , andtake extremely high values. Even if this happens, it is compen-sated by the fact that strongly decreases as increases,so only low-order coefficients are significant. The first two ap-proximations in (32) state that the channel frequency selectivityis smaller than a frequency shift corresponding to the signifi-cant harmonics of (the frequency-domain counterpart ofthe slow-variation condition), while the latter one implies that
the autocorrelation of must be of short duration comparedwith the channel coherence time.
As a consequence of (32), (31) can be simplified
(33)
where the second factor is a convolution sum in the coefficientsdomain that has been represented by to reformulate (33)
(34)
Finally, by using the synthesis equation of the Fourier series forthe input and output instantaneous PSD and channel frequencyresponse (29), this relation turns into
(35)
REFERENCES
[1] H. Philipps, “Performance measurements of power-line channels athigh frequencies,” in Proc. Int. Symp. Power Line Commun. Appl.,1998, pp. 229–237.
[2] K. Dostert, Powerline Communications. Englewood Cliffs, NJ: Pren-tice-Hall, 2001.
[3] F. J. Cañete, J. A. Cortés, L. Díez, and J. T. Entrambasaguas, “Mod-eling and evaluation of the indoor power line channel,” IEEE Commun.Mag., vol. 41, pp. 41–47, April 2003.
[4] D. Liu, E. Flint, B. Gaucher, and Y. Kwark, “Wide band AC powerline characterization,” IEEE Trans. Consum. Electron., vol. 45, pp.1087–1097, Nov. 1999.
[5] H. Philipps, “Modeling of power line communication channels,” inProc. Int. Symp. Power Line Commun. Appl., 1999, pp. 14–21.
[6] M. Zimmermann and K. Dostert, “A multipath model for the powerlinechannel,” IEEE Trans. Commun., pp. 553–559, Apr. 2002.
[7] I. C. Papaleonidopoulos, C. N. Capsalis, C. G. Karagiannopoulos, andN. J. Theodorou, “Statistical analysis and simulation of indoor single-phase low voltage power-line communication channels on the basis ofmultipath propagation,” IEEE Trans. Consum. Electron., vol. 49, pp.89–99, Feb. 2003.
[8] G. Marubayashi and S. Tachikawa, “Spread spectrum transmission onresidential power line,” in Proc. IEEE 4th Int. Symp. Spread SpectrumTech. Appl., 1996, vol. 3, pp. 1082–1086.
[9] M. Zimmermann and K. Dostert, “Analysis and modeling of impulsivenoise in broad-band powerline communications,” IEEE Trans. Electro-magn. Compat., pp. 249–258, Feb. 2002.
[10] F. J. Cañete, J. A. Cortés, L. Díez, J. T. Entrambasaguas, and J. L.Carmona, “Fundamentals of the cyclic short-time variation of indoorpower-line channels,” in Proc. Int. Symp. Power Line Commun. Appl.,2005, pp. 157–161.
[11] W. A. Gardner, Introduction to Random Processes. New York:MacMillan, 1986.
[12] F. J. Cañete, “Caracterización y modelado de redes eléctricas interiorescomo medio de transmisión de banda ancha,” Ph.D. dissertation, Univ.Málaga, Málaga, Spain, 2004, ISBN: 84-689-1003-1.
[13] J. A. Cortés, F. J. Cañete, L. Díez, and J. T. Entrambasaguas, “Charac-terization of the cyclic short-time variation of indoor power-line chan-nels response,” in Proc. Int. Symp. Power Line Commun. Appl., 2005,pp. 326–330.
[14] O. Edfors, M. Sandell, J. J. Van de Beek, D. LandstrümLandstrom, andF. Sjöberg, An introduction to orthogonal-frequency division multi-plexing Div. Signal Process., Luleå Univ. Technology, Lulea, Sweden,Res. Rep. 1996:16, Sep. 1996.
1338 IEEE JOURNAL ON SELECTED AREAS IN COMMUNICATIONS, VOL. 24, NO. 7, JULY 2006
[15] A. Oppenheim and R. Schafer, Discrete-Time Signal Processing. En-glewood Cliffs, NJ: Prentice Hall, 1989.
[16] S. J. Howard and K. Palavan, “Doppler spread measurements of indoorradio channel,” Electron. Lett., vol. 26, no. 2, pp. 107–10, Jan. 1990.
[17] R. E. Crochiere and L. R. Rabiner, Multirate Digital Signal Pro-cessing. Englewood Cliffs, NJ: Prentice-Hall, 1983.
Francisco Javier Cañete Corripio received theM.S. and Ph.D. degrees in telecommunicationengineering from the University of Málaga, Málaga,Spain, in 1996 and 2004, respectively.
In 1996, he was with the Instrument and ControlDepartment, Empresa Nacional de Ingeniería y Tec-nología (INITEC) in the design of power plants. In1997, he was with the Alcatel España R&D Depart-ment in the design of wireless local loop systems.Since 1998, he has been with the Communication En-gineering Department, University of Málaga. From
2000 to 2001, he also collaborated with the Nokia System Competence Team inMálaga. His research activity is focused on digital signal processing for digitalcommunications and his interests include channel modeling and transmissiontechniques for wireless systems and power line communication systems.
José Antonio Cortés Arrabal was born in Málaga,Spain, in 1974. He received the M.S. degree intelecommunication engineering from the Universityof Málaga in 1998. He is currently working towardsthe Ph.D. degree at the Communication EngineeringDepartment, University of Málaga.
From 2000 to 2002, he collaborated with theNokia System Competence Team in Málaga. His re-search interests include digital signal processing forcommunications, mainly focused on synchronizationand transmission techniques for high-speed power
line communications.
Luis Díez del Río received the M.S. and Ph.D.degrees in telecommunications engineering from thePolytechnic University of Madrid, Madrid, Spain, in1989 and 1995, respectively.
In 1984, he joined Fujitsu-España R&D Center,where he worked in the development of modems.From 1987 to 1997, he was with the Departmentof Signals, Systems and Radiocommunication,Polytechnic University of Madrid. Since 1997, hehas been with the Communication EngineeringDepartment, University of Málaga, Málaga, Spain.
His research interests include digital communication, a field in which he hasworked for many years. His experience includes most of its applications, i.e.,voice band, DSL and cable modems, satellite, mobile, and power line com-munications, etc., as well as technical aspects, i.e., synchronization, adaptivesignal processing, modulation, coding, and multiple access.
José Tomás Entrambasaguas Muñoz received theM.S. and Ph.D. degrees in telecommunication engi-neering from the Polytechnic University of Madrid,Madrid, Spain, in 1975 and 1990, respectively.
From 1975 to 1978, he was with E.T.S. Inge-nieros de Telecomunicación, Polytechnic Universityof Madrid. From 1978 to 1993, he was with Fu-jitsu-España R&D Center, working mainly in thedevelopment of packet switching systems, datatransmission systems, and technology for computerlocal area networks. In 1993, he joined the Uni-
versity of Málaga, Málaga, Spain, where he is now Professor and Head ofthe Communication Engineering Department. His current research interestsinclude digital signal processing techniques applied to wireless and power linecommunications, and methodologies for development and testing of complexcommunications systems.