Analysis of Teeline Shorthand Recognition using Machine ...
6
International Journal of Innovative Technology and Exploring Engineering (IJITEE) ISSN: 2278-3075 (Online), Volume-9 Issue-4, February 2020 2133 Retrieval Number: D1569029420/2020©BEIESP DOI: 10.35940/ijitee.D1569.029420 Journal Website: www.ijitee.org Published By: Blue Eyes Intelligence Engineering & Sciences Publication Analysis of Teeline Shorthand Recognition using Machine Learning and Deep Learning Techniques. Shivaprakash, Vishwanath C Burkpalli, B. S. Anami Abstract: In order to take notes of the speech delivered by the VIPs in the short time short hand language is employed. Mainly there are two shorthand languages namely Pitman and Teeline. An automatic shorthand language recognition system is essential in order to make use of the handheld devices for speedy conversion to the original text. The paper addresses and compares the recognition of the Teeline alphabets using the Machine learning (SVM and KNN) and deep learning (CNN) techniques. The dataset has been prepared using the digital pen and the same is processed and stored using the android application. The prepared dataset is fed to the proposed system and accuracy of recognition is compared. Deep learning technique gave higher accuracy compared to machine learning techniques. MATLAB 2018b platform is used for implementation of the experimental setup. Keywords: Teeline shorthand, Deep learning, classifiers, Matlab, accuracy. I. INTRODUCTION TO THE TEELINE SHORTHAND LANGUAGE. The shorthanded Teeline system was developed in 1968 by Professor James Hill. The challenges of detecting short-hand languages are question of pattern recognition, as they include different shapes, patterns and orientations when building the language. The National Council for the Training of Journalists has approved this Teeline shorthand, which certifies the training of journalists in the United Kingdom. The geometrical style for generation of the Teeline and sample of Teeline shorthand letters are referred from [14]. The Pitman recognition carried out using the knowledge- based approaches. They generated the English letters based on the strokes generated when writing the symbols for Pitman. The stages in their paper include stroke recognition, validation of the strokes and generate the English letters. The number of process included are as follows, Thinning (the binary image are considered, the neighbouring eight pixels are removed based on the transitions and algorithm), Trimming and filling (The continuous zeros in the row or column are remove.) to recognize the letter. [15] Revised Manuscript Received on February 28, 2020. * Correspondence Author Mr. Shivaprakash*, Department of Computer Science and Engineering Government Engineering College, Devagiri, Haveri, India [email protected] Dr. Vishwanath C Burkpalli, Department of Information Science and Engineering P.D.A. College of Engineering Gulbarga, India [email protected] Dr. B. S. Anami, Principal, K.L.E. Institute of Technology Hubli, India [email protected] © The Authors. Published by Blue Eyes Intelligence Engineering and Sciences Publication (BEIESP). This is an open access article under the CC- BY-NC-ND license http://creativecommons.org/licenses/by-nc-nd/4.0/ The proposed system is capable of taking Teeline alphabet picture as the reference and performs the prediction using machine learning techniques and Deep learning methods to produce English alphabets. Section 2 describes the methods involved in the experiment, Section 3 explains the experimental procedure, section 4 describes about the accuracy of the system (result analysis) and next section is about the conclusion and future scope. II. ARCHITECTURE OF THE NETWORK Working of the network is divided into three sections. Section 2.1 defines about the theory related to CNN in brief manner. Section 2.2 deals with the properties of CNN and the function of layers. 2.4 and 2.5 Describes about the two machine learning approaches for detecting Teeline short hand language. 2.1. Theoretical Background Neural network computer models have been around for a long time, McCulloch and Pitts first model proposed [3]. Neural networks consist of a number of layers, each of which is connected to the other network layers. In neural activation and in terms of the strength of the connection between each neuron pair a feed-forward neural network or FFNN can be considered [4]. The FFNN sample is as shown in Figure 3 and may refer to [14] for more detail. Figure 3: Typical Network [5]. Convolutional Neural Networks (CNN) is a multi-layer perceptron (MLP) model influenced by biology. The network, namely the convolution layer, the hidden layers and the output layer, constitutes the three types of layers. Hidden layers include relu, maxpooling, fully eleven layers of batch normalization, excluding input and output layers. 2.2. Working of CNN algorithm This segment discusses the barely working algorithm. A comprehensive edition can be found in [7].
-
Upload
khangminh22 -
Category
Documents
-
view
6 -
download
0
Transcript of Analysis of Teeline Shorthand Recognition using Machine ...

International Journal of Innovative Technology and Exploring Engineering (IJITEE) ISSN: 2278-3075 (Online), Volume-9 Issue-4, February 2020
2133 Retrieval Number: D1569029420/2020©BEIESP DOI: 10.35940/ijitee.D1569.029420 Journal Website: www.ijitee.org
Published By: Blue Eyes Intelligence Engineering & Sciences Publication
Analysis of Teeline Shorthand Recognition using Machine Learning and Deep Learning
Techniques. Shivaprakash, Vishwanath C Burkpalli, B. S. Anami
Abstract: In order to take notes of the speech delivered by the VIPs in the short time short hand language is employed. Mainly there are two shorthand languages namely Pitman and Teeline. An automatic shorthand language recognition system is essential in order to make use of the handheld devices for speedy conversion to the original text. The paper addresses and compares the recognition of the Teeline alphabets using the Machine learning (SVM and KNN) and deep learning (CNN) techniques. The dataset has been prepared using the digital pen and the same is processed and stored using the android application. The prepared dataset is fed to the proposed system and accuracy of recognition is compared. Deep learning technique gave higher accuracy compared to machine learning techniques. MATLAB 2018b platform is used for implementation of the experimental setup.
Keywords: Teeline shorthand, Deep learning, classifiers, Matlab, accuracy.
I. INTRODUCTION TO THE TEELINE SHORTHAND LANGUAGE.
The shorthanded Teeline system was developed in 1968 by Professor James Hill. The challenges of detecting short-hand languages are question of pattern recognition, as they include different shapes, patterns and orientations when building the language. The National Council for the Training of Journalists has approved this Teeline shorthand, which certifies the training of journalists in the United Kingdom. The geometrical style for generation of the Teeline and sample of Teeline shorthand letters are referred from [14]. The Pitman recognition carried out using the knowledge-based approaches. They generated the English letters based on the strokes generated when writing the symbols for Pitman. The stages in their paper include stroke recognition, validation of the strokes and generate the English letters. The number of process included are as follows, Thinning (the binary image are considered, the neighbouring eight pixels are removed based on the transitions and algorithm), Trimming and filling (The continuous zeros in the row or column are remove.) to recognize the letter. [15] Revised Manuscript Received on February 28, 2020. * Correspondence Author
Mr. Shivaprakash*, Department of Computer Science and Engineering Government Engineering College, Devagiri, Haveri, India [email protected]
Dr. Vishwanath C Burkpalli, Department of Information Science and Engineering P.D.A. College of Engineering Gulbarga, India [email protected]
Dr. B. S. Anami, Principal, K.L.E. Institute of Technology Hubli, India [email protected]
© The Authors. Published by Blue Eyes Intelligence Engineering and Sciences Publication (BEIESP). This is an open access article under the CC-BY-NC-ND license http://creativecommons.org/licenses/by-nc-nd/4.0/
The proposed system is capable of taking Teeline alphabet picture as the reference and performs the prediction using machine learning techniques and Deep learning methods to produce English alphabets. Section 2 describes the methods involved in the experiment, Section 3 explains the experimental procedure, section 4 describes about the accuracy of the system (result analysis) and next section is about the conclusion and future scope.
II. ARCHITECTURE OF THE NETWORK
Working of the network is divided into three sections. Section 2.1 defines about the theory related to CNN in brief manner. Section 2.2 deals with the properties of CNN and the function of layers. 2.4 and 2.5 Describes about the two machine learning approaches for detecting Teeline short hand language.
2.1. Theoretical Background
Neural network computer models have been around for a long time, McCulloch and Pitts first model proposed [3]. Neural networks consist of a number of layers, each of which is connected to the other network layers. In neural activation and in terms of the strength of the connection between each neuron pair a feed-forward neural network or FFNN can be considered [4]. The FFNN sample is as shown in Figure 3 and may refer to [14] for more detail.
Figure 3: Typical Network [5].
Convolutional Neural Networks (CNN) is a multi-layer perceptron (MLP) model influenced by biology. The network, namely the convolution layer, the hidden layers and the output layer, constitutes the three types of layers. Hidden layers include relu, maxpooling, fully eleven layers of batch normalization, excluding input and output layers.
2.2. Working of CNN algorithm
This segment discusses the barely working algorithm. A comprehensive edition can be found in [7].

Analysis of Teeline Shorthand Recognition using Machine Learning and Deep Learning Techniques.
2134 Retrieval Number: D1569029420/2020©BEIESP DOI: 10.35940/ijitee.D1569.029420 Journal Website: www.ijitee.org
Published By: Blue Eyes Intelligence Engineering & Sciences Publication
The input to the network is a 2D image and the same is fed to the input later. The output layers provide the output based on the weights collected during the training phase. These weights are stored in the intermediate layer titled as hidden layer. As previously stated, the network has sub-samples and a range of convolution layers. Together with these layers, the input image data is approximated.
Figure 4: Graphical flow of layers showing connection
In the CNN algorithm, the entire visual field is replicated by each sparse filter. Feature maps are formed by these units, weight vector and bias are shared by them. Three hidden units of same feature map is represented by Figure (4). These are identical and are constrained with the weights of same colours are shared.
Figure 5: Convolution Layer Working
The first layer of the CNN network is the convolution network. In figure 5 the structure of the layer is shown. It consists of a function expression, bias terms and a convolution mask. Together, the output of these layers is generated. For compressive study refer [14]. Fig. 5 shows a 3x3 mask of 28x28 input feature map which performs convolution over it. Then bias is added and Relu activation function is applied on the matrix [7].
2.3 Layer of Sub sampling
The convolution layer precedes the sub-sample layer. The number of planes is the same as the convolution layer. This reduces the size of the feature map. Averaging takes place after the image is divided into 2x2 blocks. Not the exact relationship, but the information on characteristics between the layers is retained in the sub-sampling.
Figure 6: Sub-Sampling layer working [7].
2.4 K- Nearest Neighbourhood (KNN)
The K-Nearest Neighbourhood algorithm (KNN) is a supervised machine learning algorithm that can be used to solve problems both in classification and regression. It assumes that similar things exist in close proximity. In other words, similar things are near to each other.
Figure 7: Similar data feature points which are scatter
around.
Fig.7 shows how preferably the similar data feature points usually occur nearer to each other. The KNN algorithm relies on this assumption that the algorithm is true to be efficient. KNN incorporates the concept of algebra, which we might have studied in our youth (sometime distance, range of closeness, or proximity) —joining the similar points in the newspaper. There are other ways to calculate distance, and one way may be preferable depending on the problem need to be solved. However, a popular and familiar choice is the straight-line distance (also called the Euclidean distance).
2.5 Support Vector Machine (SVM)
In linear model classification and for regression problems Support Vector Machine (SVM ) can be employed. It can address linear and non-linear problems which suits well for many practical issues. SVM's idea is simple: the algorithm generates a line or hyperplane that separates the data into sections as shown in Fig. 8.

International Journal of Innovative Technology and Exploring Engineering (IJITEE) ISSN: 2278-3075 (Online), Volume-9 Issue-4, February 2020
2135 Retrieval Number: D1569029420/2020©BEIESP DOI: 10.35940/ijitee.D1569.029420 Journal Website: www.ijitee.org
Published By: Blue Eyes Intelligence Engineering & Sciences Publication
Figure 8: SVM model for Classification Problem
III.EXPERIMENTAL SETUP
3.1 Preparing Dataset
The input to the network is the images. The letters are written using the digital pen later those pixels are extracted and images of them are generated from the Android application as shown in the Fig. 9, the original image dimension is 2000*2100. First stage of the preparation is to reduce the dimension from 2000*2100 to 28*28. The main reason for reduction is to reduce the computation. For ex: 2000*2100 = 4200000 pixels need to be processed per image and 5240 images each for alphabets are considered, hence 4200000 * 5240 it needs high configuration system, on the other hand for 28*28 image, only 784 (24*24) pixels per image need to be processed hence computation cost reduces.
Figure 9: Front end of the Android Application
Second stage is to convert the using the MATLAB inbuilt command the colour image is converted to grayscale image. In the third stage the grayscale image is converted to binary image. The last stage of data preparation is to invert the binary image for obtaining the clear boundary of the symbols or alphabets. Through reduced image representation the image pyramid is a data structure to support efficient scaled convolution. Sample density and resolution are decreased in regular steps in which consists of a sequence of copies of an image [9]. 3.2 Testing and Network training The purpose of the training the network is to reduce the error between the actual output and the predicted machine output. The error function is same for weights as well as bias terms and is as defined by the equation below.
In the above equation is the actual output of the network, K is the number of input image and the output vectors desired. xK be the kth training image and dk corresponding output vector. The error sensitivities compute the error gradients, which are defined as the weighted sum input to a neuron to the error function partial derivative. Once E(t) the error gradient is derived, the energy function for minimizing in training the network can be applied. Here SGDM (stochastic gradient descent with momentum) is used. Based on local gradient information a direct adaptation that is performed in the learning scheme [10]. The setup of the network is as shown in figure.10.
Figure 10: CNN layer of the implementation
3.3 Feature Description
The ten features are extracted from each image which are as follows, Maximum Feret Diameter, Diameter Endpoints, Diameter orientation, and Minimum Diameter, Triangular points, Diameter orientation, Orthogonal Diameter, Orthogonal Diameter Lower points, Orthogonal Higher points, area bounding boxes are taken for the twenty seven words. The ten features are extracted using the feret properties on the black and white images. The process of collection is shown in the below figure,

Analysis of Teeline Shorthand Recognition using Machine Learning and Deep Learning Techniques.
2136 Retrieval Number: D1569029420/2020©BEIESP DOI: 10.35940/ijitee.D1569.029420 Journal Website: www.ijitee.org
Published By: Blue Eyes Intelligence Engineering & Sciences Publication
Figure 11 a) Original Image b) Max Feret Diameter and
Min Feret diameter c) Max Feret Diameter and Orthogonal Feret diameter d) Minimum Area-Bounding.
The Feret properties of an object are measured by using boundary points on the antipodal vertices of the convex hull that encloses that object. Given the endpoint coordinates of the maximum (or minimum) Feret diameter,
the maximum (or minimum) Feret angle is measured as
3.4 Testing Architecture for Support Vector Machine (SVM) The one vs one method is employed for the training process. This method is going to train a separate classifier for each different pair of labels. It is less sensitive to the problems of the imbalanced datasets. The disadvantage is that the computation cost is considerably high. Considering the ten features as described in section 3.3. The training set of images is 5400*12 (i.e. 5400 input image each image has 12 features) and the number of classes are 27. The testing image has a feature size of 1*12. Testing image collects twelve features and those are passed to the Support Vector Machines (SVM). It predicts the English alphabet. Section 4 describes the results of the SVM. 3.4 K- Nearest Neighbourhood (KNN) The exhaustive approach is used to identify the difference between the test data and the training data. The Euclidean distance is taken into consideration while performing exhaustive method. The value K indicates how many nearest pixels are considered while calculating the distance. For the experiment the value of K taken are three and five. The results of the nearest neighbourhood with various values of K are discussed in section 4.
IV. RESULT AND DISCUSSION
This section presents the result of the classification accuracy using the CNN algorithm, on the prepared dataset using online android application. The dataset is divided into training, testing and validation in 60%, 20% and 20% respectively for conducting the experiment. The results are
presented in the form of graphs which includes accuracy, Mean Square Error and confusion matrix. The Graphs show the change of MSE with respect to the training epochs. MSE metric is the most widely used and simplest metric quality used. Between original image the mean of squared difference and trained approximation. A better trained image will result in lower MSE with the original image. As the value for Mean Squared Error (MSE) tends to decrease, the variation in the final reconstructed output and the original image is very less. MSE indicates the close proximity between underlying true image and the final reconstructed output. The idea here is to use enough number of epochs that would result in low MSE, high classification accuracy and with least duration for training the network. The network is tested on various new images, in turn for each new image is tested for different epochs, different iterations. In the section IV presents the results of the algorithm. 3.5 Images employed for classification The data used in the experiment are generated from the android application which has been shown in Fig. 7. The 200 different images for each character of Teeline are collected and further these are divided into testing and training images for network. The images have the dimension 28*28*3. Some of the sample images are shown in Figure 12.
Figure 12: Samples of Database
The Figure 13 a), b) and c) shows the variations of the losses for epochs 1, 2, 3 and 4 respectively. From the graphs it is observed that the losses go on decreasing once the epochs are increased from 1 to 4. The epochs can be varied in the range in between 1 to 4.
Figure 13 a): Losses for the one epochs
Figure 13 b): Losses for the two epochs

International Journal of Innovative Technology and Exploring Engineering (IJITEE) ISSN: 2278-3075 (Online), Volume-9 Issue-4, February 2020
2137 Retrieval Number: D1569029420/2020©BEIESP DOI: 10.35940/ijitee.D1569.029420 Journal Website: www.ijitee.org
Published By: Blue Eyes Intelligence Engineering & Sciences Publication
Figure 13 c): Losses for the three epochs
Figure 13 d): Losses for the four epochs
The same observation is also obtained from the classification accuracy values where; accuracy improves as it moves from 1 to 4 epochs. The computation time goes on increasing once it reaches the 4 hence the best suited results can be obtained from epochs 3.
Table 1: Accuracy variation with respect to change in epochs number
Epochs Accuracy (%) 1 39 2 83 3 92
The confusion matrix of epochs one, two and three is shown in Figure 14 a), Figure 14 b) and Figure 14 c) respectively.
Figure 14 a): Confusion Matrix for one epoch
Figure 14 b): Confusion Matrix for two epochs
Figure 14 c): Confusion Matrix for three epochs
The training phase of the different epochs in the Figure 15 a), 15 b) and 15 c) are shown below,
Figure 15 a): Training Iterations for the epochs one
Figure 15 b): Training Iterations for the epochs two
Figure 15 c): Training Iterations for the epochs three
3.6 Classification using the Machine learning methods.
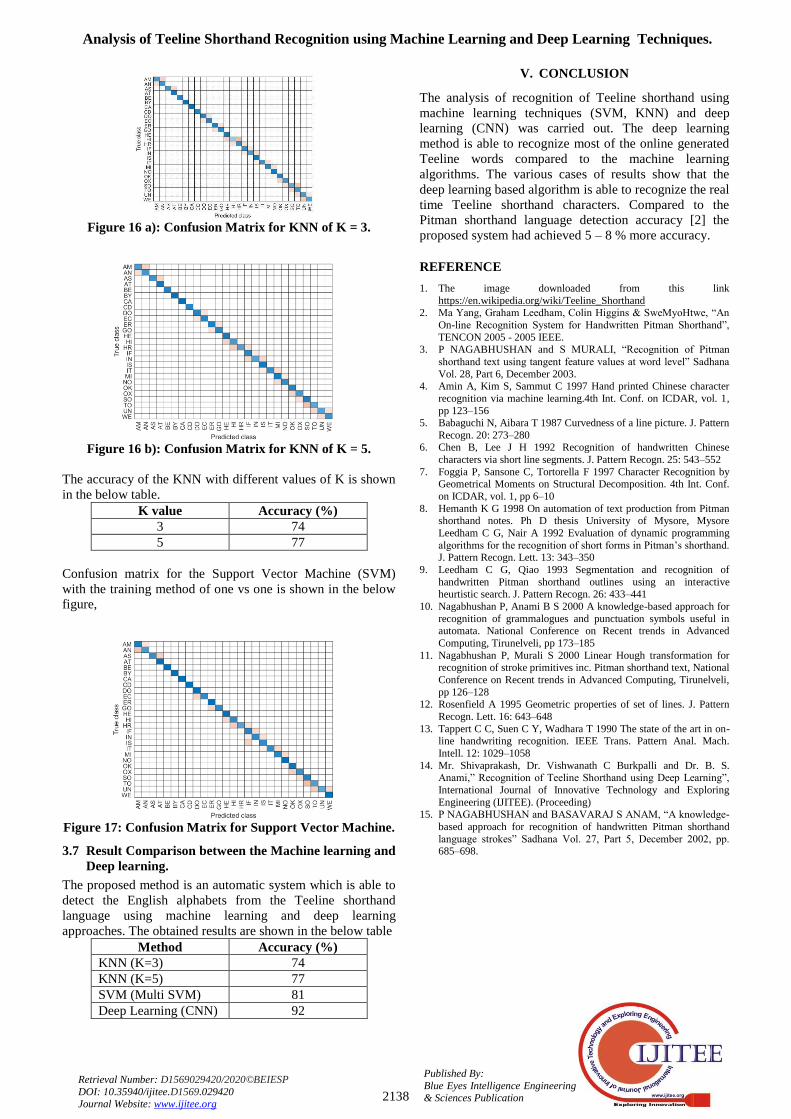
The predictions of the English alphabets and characters from the Teeline shorthand language is performed using SVM and KNN. The results are shown in this section The Figure 16 a) shows the confusion matrix for the KNN obtained for the nearest neighbourhood value of three. Figure 16 b) shows the confusion matrix for the KNN by considering five nearest features to perform the decision.
Analysis of Teeline Shorthand Recognition using Machine Learning and Deep Learning Techniques.
2138 Retrieval Number: D1569029420/2020©BEIESP DOI: 10.35940/ijitee.D1569.029420 Journal Website: www.ijitee.org
Published By: Blue Eyes Intelligence Engineering & Sciences Publication
Figure 16 a): Confusion Matrix for KNN of K = 3.
Figure 16 b): Confusion Matrix for KNN of K = 5.
The accuracy of the KNN with different values of K is shown in the below table.
K value Accuracy (%) 3 74 5 77
Confusion matrix for the Support Vector Machine (SVM) with the training method of one vs one is shown in the below figure,
Figure 17: Confusion Matrix for Support Vector Machine.
3.7 Result Comparison between the Machine learning and Deep learning.
The proposed method is an automatic system which is able to detect the English alphabets from the Teeline shorthand language using machine learning and deep learning approaches. The obtained results are shown in the below table
Method Accuracy (%) KNN (K=3) 74 KNN (K=5) 77 SVM (Multi SVM) 81 Deep Learning (CNN) 92
V. CONCLUSION
The analysis of recognition of Teeline shorthand using machine learning techniques (SVM, KNN) and deep learning (CNN) was carried out. The deep learning method is able to recognize most of the online generated Teeline words compared to the machine learning algorithms. The various cases of results show that the deep learning based algorithm is able to recognize the real time Teeline shorthand characters. Compared to the Pitman shorthand language detection accuracy [2] the proposed system had achieved 5 – 8 % more accuracy.
REFERENCE
1. The image downloaded from this link https://en.wikipedia.org/wiki/Teeline_Shorthand
2. Ma Yang, Graham Leedham, Colin Higgins & SweMyoHtwe, “An
On-line Recognition System for Handwritten Pitman Shorthand”,
TENCON 2005 - 2005 IEEE. 3. P NAGABHUSHAN and S MURALI, “Recognition of Pitman
shorthand text using tangent feature values at word level” Sadhana
Vol. 28, Part 6, December 2003. 4. Amin A, Kim S, Sammut C 1997 Hand printed Chinese character
recognition via machine learning.4th Int. Conf. on ICDAR, vol. 1, pp 123–156
5. Babaguchi N, Aibara T 1987 Curvedness of a line picture. J. Pattern Recogn. 20: 273–280
6. Chen B, Lee J H 1992 Recognition of handwritten Chinese characters via short line segments. J. Pattern Recogn. 25: 543–552
7. Foggia P, Sansone C, Tortorella F 1997 Character Recognition by Geometrical Moments on Structural Decomposition. 4th Int. Conf. on ICDAR, vol. 1, pp 6–10
8. Hemanth K G 1998 On automation of text production from Pitman shorthand notes. Ph D thesis University of Mysore, Mysore Leedham C G, Nair A 1992 Evaluation of dynamic programming algorithms for the recognition of short forms in Pitman’s shorthand. J. Pattern Recogn. Lett. 13: 343–350
9. Leedham C G, Qiao 1993 Segmentation and recognition of handwritten Pitman shorthand outlines using an interactive heurtistic search. J. Pattern Recogn. 26: 433–441
10. Nagabhushan P, Anami B S 2000 A knowledge-based approach for recognition of grammalogues and punctuation symbols useful in automata. National Conference on Recent trends in Advanced Computing, Tirunelveli, pp 173–185
11. Nagabhushan P, Murali S 2000 Linear Hough transformation for recognition of stroke primitives inc. Pitman shorthand text, National Conference on Recent trends in Advanced Computing, Tirunelveli, pp 126–128
12. Rosenfield A 1995 Geometric properties of set of lines. J. Pattern Recogn. Lett. 16: 643–648
13. Tappert C C, Suen C Y, Wadhara T 1990 The state of the art in on-line handwriting recognition. IEEE Trans. Pattern Anal. Mach. Intell. 12: 1029–1058
14. Mr. Shivaprakash, Dr. Vishwanath C Burkpalli and Dr. B. S. Anami,” Recognition of Teeline Shorthand using Deep Learning”,
International Journal of Innovative Technology and Exploring Engineering (IJITEE). (Proceeding)
15. P NAGABHUSHAN and BASAVARAJ S ANAM, “A knowledge-based approach for recognition of handwritten Pitman shorthand language strokes” Sadhana Vol. 27, Part 5, December 2002, pp. 685–698.