Analysis of Socioeconomic Benefits of Water Supply Projects ...
11
FUTY Journal of the Environment Vol. 14 No. 2 June, 2020 135 Analysis of Socioeconomic Benefits of Water Supply Projects in Jos Metropolis, Nigeria Ali, A. Y. Department of Environmental Management Faculty of Environmental Sciences, Bingham University, Karu, Nigeria Correspondence email: [email protected] Abstract Increasing demands for water resulting from economic growth, climate change, pollution and concomitant population growth, therefore work to increase pressure on available resources and also increase the cost of water treatment, This study examines the socioeconomic benefits of water supply projects like dams, reservoirs, overhead tanks, underground pipelines and water treatment plants in Jos metropolis to individual water users in Jos metropolis. The socioeconomic benefits were also identified and examined in relation to the gains achieved by the Plateau State Water Board subscribers in Jos metropolis, Nigeria. The study found out that the water supply projects are executed for social, political and to some extent economic reasons and are not sustainable due to the inability of Plateau State Water Board (PSWB) to charge commercial rates and enumerated the benefits of these water supply projects to households to include reduced distance to water sources, time savings and reduction in diseases rate, among other things. It concluded that some level of commitment should be achieved to enable the PSWB become sustainable to be able to replicate these projects in unserved locations of Jos metropolis. Recommendations such as full capacity utilization of state owned water supply utilities, provision of alternative areas for farming purposes, recreation and fishing to the inhabitants of water supply project areas, among others were proffered. Keywords: Socioeconomic, Benefits, Jos metropolis, Plateau State, Water Supply. INTRODUCTION Water is used for domestic purposes (potable water), industry (utility water) and agriculture (irrigation): flood control, power production; inland water transport and recreation (Ali, 2018). This opinion hinges on water role in improving the health of the users by reducing the debilitating effects of water borne diseases. Many environmentalists are of the opinion that water supply projects are executed to provide flood protection and full charges should be paid by users to ensure conservation and protection of water resources (AfDB, 2010). The other school of thought views water as social, economic and environmental good because their projects are built for multipurpose uses. While water is provided to protect the environment through flood control, its supply to the users can serve the purposes of enhancing their health, by reducing the prevalence of water borne diseases and also generate revenue to the service providers so as to enhance the viability and financial sustainability of these projects (Ali, 2018). The benefits of investing in water supply projects and services encompasses the social, environmental and economic, these are benefits to government, individuals and households and even the environment. The benefits from improved water supply according to Araral and Holamo (2007) include time saved in fetching water, cost savings on non-incremental water consumption, reduced incidence of water borne diseases, flood control, employment opportunities, decreased distance to water source, and increase in water consumption per capita and time and travel costs, flood control among others. Government has a responsibility to the citizens to put in place the social infrastructure like roads, schools, health infrastructure and
-
Upload
khangminh22 -
Category
Documents
-
view
0 -
download
0
Transcript of Analysis of Socioeconomic Benefits of Water Supply Projects ...

FUTY Journal of the Environment Vol. 14 No. 2 June, 2020
135
Analysis of Socioeconomic Benefits of Water Supply Projects in Jos
Metropolis, Nigeria
Ali, A. Y.
Department of Environmental Management
Faculty of Environmental Sciences, Bingham University, Karu, Nigeria
Correspondence email: [email protected]
Abstract
Increasing demands for water resulting from economic growth, climate change, pollution and
concomitant population growth, therefore work to increase pressure on available resources
and also increase the cost of water treatment, This study examines the socioeconomic benefits
of water supply projects like dams, reservoirs, overhead tanks, underground pipelines and
water treatment plants in Jos metropolis to individual water users in Jos metropolis. The
socioeconomic benefits were also identified and examined in relation to the gains achieved by
the Plateau State Water Board subscribers in Jos metropolis, Nigeria. The study found out that
the water supply projects are executed for social, political and to some extent economic reasons
and are not sustainable due to the inability of Plateau State Water Board (PSWB) to charge
commercial rates and enumerated the benefits of these water supply projects to households to
include reduced distance to water sources, time savings and reduction in diseases rate, among
other things. It concluded that some level of commitment should be achieved to enable the
PSWB become sustainable to be able to replicate these projects in unserved locations of Jos
metropolis. Recommendations such as full capacity utilization of state owned water supply
utilities, provision of alternative areas for farming purposes, recreation and fishing to the
inhabitants of water supply project areas, among others were proffered.
Keywords: Socioeconomic, Benefits, Jos metropolis, Plateau State, Water Supply.
INTRODUCTION
Water is used for domestic purposes (potable water), industry (utility water) and agriculture
(irrigation): flood control, power production; inland water transport and recreation (Ali, 2018). This opinion hinges on water role in improving the health of the users by reducing the
debilitating effects of water borne diseases. Many environmentalists are of the opinion that
water supply projects are executed to provide flood protection and full charges should be paid
by users to ensure conservation and protection of water resources (AfDB, 2010). The other
school of thought views water as social, economic and environmental good because their
projects are built for multipurpose uses. While water is provided to protect the environment
through flood control, its supply to the users can serve the purposes of enhancing their health,
by reducing the prevalence of water borne diseases and also generate revenue to the service
providers so as to enhance the viability and financial sustainability of these projects (Ali, 2018).
The benefits of investing in water supply projects and services encompasses the social,
environmental and economic, these are benefits to government, individuals and households and
even the environment. The benefits from improved water supply according to Araral and
Holamo (2007) include time saved in fetching water, cost savings on non-incremental water
consumption, reduced incidence of water borne diseases, flood control, employment
opportunities, decreased distance to water source, and increase in water consumption per capita
and time and travel costs, flood control among others. Government has a responsibility to the
citizens to put in place the social infrastructure like roads, schools, health infrastructure and
FUTY Journal of the Environment Vol. 14 No. 2 June, 2020
136
services, water supply projects and services at the cost that can deliver enormous benefits to
individuals and the entire citizenry. Some of the benefits to government of improved water
supply projects and services are not limited to reduced burden and cost of epidemics and
diseases, flood control, water supply reliability but to increase government revenue generation
among others.
Cessti and Malik (2012) examined the indirect economic impacts of three dams: Bhakra dam
in India, Aswan High dam in Egypt and Sobradinho in Brazil, these authors used different input
and output models and calculated scenarios to find the value addition or income multiplier
values with and without a dam. They found that the net income was positive multiplier in all
cases as agricultural productivity and size increased, stable electricity was made available to
rural households and flood control was implemented. These lead to increased incomes
particularly for the poorest households. However, by only assessing changes in incomes, the
multiplier effects on income do not necessarily capture the full range of benefits and costs that
dams bring (Wong, 2012).
The existence of dams for water supply in most communities has brought about very good road
networks, electricity, and development of security operatives to guard against vandalization of
equipment and installations built by government at the dam sites. The completion of these
projects lead to associated positive benefits of increased access to potable water supply to
households. Apart from these, Kaliel (2001) pointed out that water projects will be life
sustaining and income generating and will also give jobs to increase the income of the people.
Water supply projects reduces health problems, the time spent each day fetching water as the
average distance to water for the population served has reduced substantially, builds human
capital at both government and community levels, which can then contribute to the success of
other projects, and it has contributed to the development of some private sector enterprises (Hill
and Mtawali, 1989). Hutton (2017) in assessing investments in water and sanitation
investments identified lower morbidity and mortality, improvement in general wellbeing and
standard of living, reduction in water borne diseases and general healthy living as benefits of
investing in water supply and sanitation projects and sector. This study therefore examines the
socioeconomic benefits of water supply projects in Jos metropolis, Plateau State, Nigeria.
MATERIALS AND METHODS
Jos metropolis is located between latitudes [9o 54’ - 10o 10’N] and longitudes [8o 48’ - 9o 30’
E]. The study area comprises Jos South and Jos North local government areas with their
headquarters in Bukuru and Jos respectively. The area is situated within the northern senatorial
zone of Plateau state, and is bounded by Barkin-Ladi and Jos East to the east, Riyom to the
south and Bassa local government areas to the west (see Figure 1). The areal extent from north
to south is 104km while from east to west is about 80km on an elevation of 1,250m above sea
level with Shere hills having the highest peak of 1,777m above sea level with an area of 1002.19
Km2 (Mohammed et al, 2010).
Most rivers in northern Nigeria owe their origins to the Jos Plateau due to its height above other
regions in the northern Nigeria and is the source of Kaduna, Gongola, Korot, Shimanker,
N’gell, Kassa, Delimi, Hadeija-Jama’are, Wase and Tenti rivers. The volume of these rivers
are high during the rainy season and low during dry seasons due to the nature of rainfall and
other climatic elements of the area (Bingel, 1978; Jiya and Musa, 2012). The presence of these
rivers, streams, dams, hand dug wells, ponds and springs constitute very good water resource
base for the area. Some of the rivers that the government has dammed and is harnessing for
potable water supply to the populace are Nupis, Shen, Gwash, Rafin-Sanyi, Agog rivers and
FUTY Journal of the Environment Vol. 14 No. 2 June, 2020
137
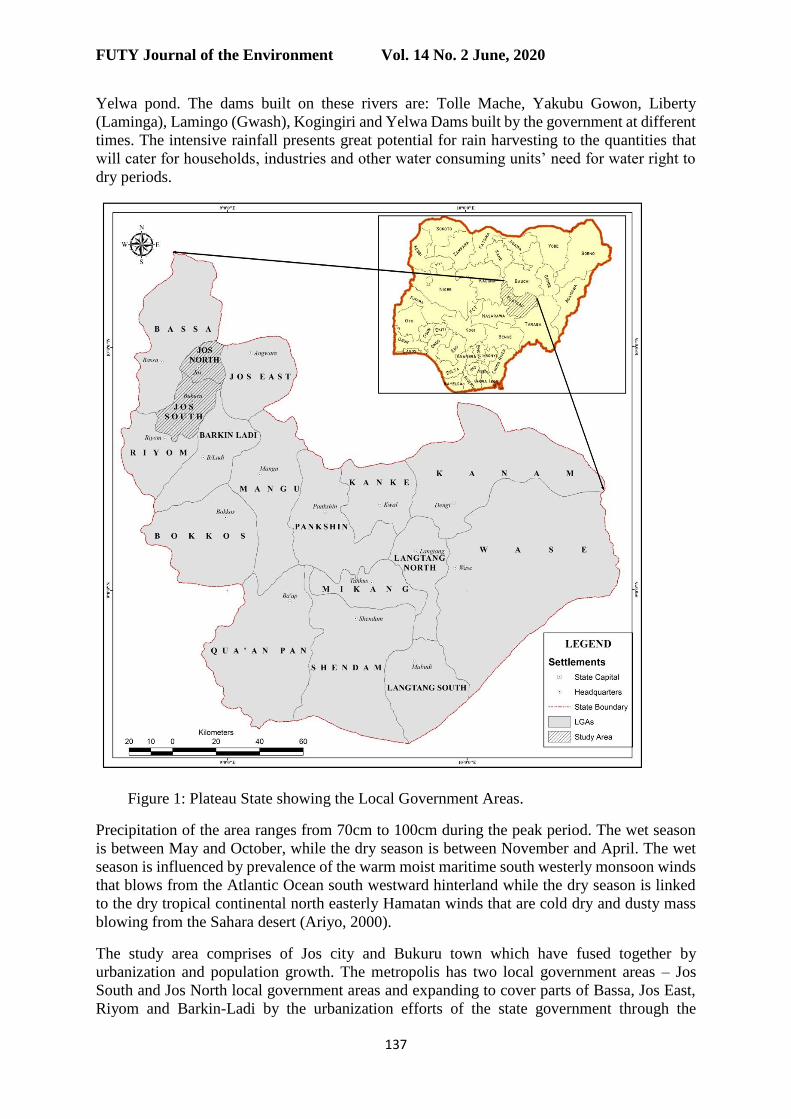
Yelwa pond. The dams built on these rivers are: Tolle Mache, Yakubu Gowon, Liberty
(Laminga), Lamingo (Gwash), Kogingiri and Yelwa Dams built by the government at different
times. The intensive rainfall presents great potential for rain harvesting to the quantities that
will cater for households, industries and other water consuming units’ need for water right to
dry periods.
Figure 1: Plateau State showing the Local Government Areas.
Precipitation of the area ranges from 70cm to 100cm during the peak period. The wet season
is between May and October, while the dry season is between November and April. The wet
season is influenced by prevalence of the warm moist maritime south westerly monsoon winds
that blows from the Atlantic Ocean south westward hinterland while the dry season is linked
to the dry tropical continental north easterly Hamatan winds that are cold dry and dusty mass
blowing from the Sahara desert (Ariyo, 2000).
The study area comprises of Jos city and Bukuru town which have fused together by
urbanization and population growth. The metropolis has two local government areas – Jos
South and Jos North local government areas and expanding to cover parts of Bassa, Jos East,
Riyom and Barkin-Ladi by the urbanization efforts of the state government through the
FUTY Journal of the Environment Vol. 14 No. 2 June, 2020
138
implementation of the Greater Jos Master Plan. Jos has a heterogeneous population with
Berom, Anaguta, Afizere, with few of Jere and Buji in Bassa and Jos North Local Government
Areas.
The population of the metropolis is put at 1,255, 914 based on the 2020 population projection
(National Population Commission, 2006). It has a density of about 391 persons per square
kilometre and is the most densely populated and urbanized place in Plateau State.
Data on water supply projects like dams, pipelines, reservoirs, treatment plants, their capacities,
year of construction and their locations were obtained from Plateau State Water Board. Others
from Federal Ministry of Water Resources’ reports complemented by field works. Data on
benefits to individual water service subscribers on the other hand were determined through the
use of questionnaires on the target respondents. A survey of the water supply projects of
Laminga (Liberty), Lamingo (Gwash) dam, Yakubu Gowon dam, Yelwa dam, Tolle mache
and Kogingiri dams and other potential project sites within the study area were undertaken on
19th June 2019. Similarly, a visit to different parts of Jos North and Jos South Local
Government Areas including the Plateau State Water Board headquarters which constitute the
area where the water users are resident was equally undertaken. Jos city was found to be
segmented into 21 districts with details of all the 23,453 households connected to the pipe
borne water system as at end December 2014.
Sampling Techniques and Procedures
The area has been designated into 21 water supply districts (Bukuru A - C) and (Jos A - S) by
Plateau State Water Board, with each district having varied number of residents that are
connected to piped water system. The sample size of 378 was determined using the educational
and psychological measurement table of Krejcie and Morgan (1970) at 95% confidence level
with a degree of accuracy of 5%. Due to large sample population, the researcher adopted a
systematic sampling approach in the selection of some districts for questionnaire
administration. The districts were first listed alphabetically and after selecting the first district,
each 3rd district was selected and this brought the number to seven districts with a connection
population of 8,402. Also, to further arrive at the number of respondents in each of the seven
districts, the population of piped connections of each of the districts was divided by total 8,402
and multiplied by 378 as depicted in Table 1.
Table 1: Sample Population in the Selected Districts in Jos Metropolis
S/N Name of District No of Piped Connections Sample
1. Bukuru A (Fire service) 1266 57
2. Bukuru D (Metred) 487 22
3. Jos C (Lamingo) 1521 68
4. Jos F (Central) Naraguta Area 2334 105
5. Jos J (Laranto) 957 43
6. Jos M (Ali Kazaure) 597 27
7. Jos Q (Rikkos) 1240 56
Total 8402 378
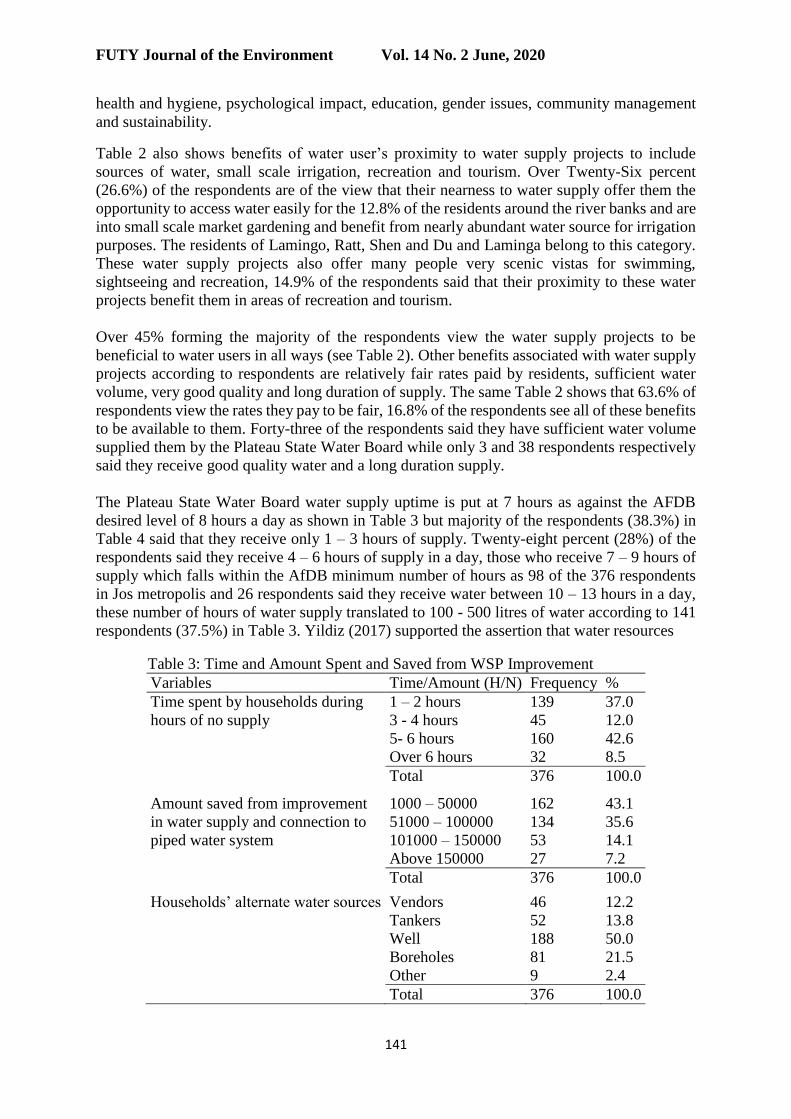
The sample size as determined by Krejcie and Morgan (1970) has the following formula:
𝑛 =𝑋2∗𝑁∗𝑃(1−𝑃)
(𝑀𝐸2∗(𝑁−1))+(𝑋2∗𝑃∗(1−𝑃)
Where;

FUTY Journal of the Environment Vol. 14 No. 2 June, 2020
139
n= sample size
X2= Chi square for the specified confidence level at 1 degree of freedom
N= Population size
P= Population proportion (.50 in the table)
ME= Desired margin of error (Expressed as a proportion)
In this study, only descriptive statistical tools were used in data presentation and analysis. The
examples of descriptive statistics used in analysing the results are frequency tables, maps and
bar graphs and pie charts.
RESULTS AND DISCUSSION
The benefits of water supply and the projects are enjoyed by both government and the water
subscribers (users) in the area. The benefits accruing to users of water bother on connection
fees, water rates and fees affordability, social, economic and other unquantifiable social,
economic and environmental benefits, while the benefits on the part of government bother on
revenue generation, ability to fulfil social and political obligation to the citizenry among other
ones. Associated with water supply projects are also social and economic benefits to users like
improved health of residents, improved volume of water supply and its sufficiency over a
period of time.
Most potable water users in Jos metropolis connected to the piped water supply system agreed
that they witness an improvement in health status of their family members after connection.
Over 68% of the respondents shared this view while over 31% on the other hand said there is
no improvement in health status of their family members after connection as different views
were expressed by residents for connecting to PSWB pipe line system. This view agrees with
the result of Ali (2018) which showed that majority of water subscribers with Jos area had
connections with the public water supply source and multitudes of other alternate sources.
Figure 3: Information on water, a) Volume of water received, b) Water sufficiency.
About thirty-four percent (34%) of the respondents said they receive 600 – 1000 litres of water
in a day, 1100- 1600 litres was received by 59 respondents and 46 of these respondents receive
between 1700 – 2000 litres and only 3 said they enjoyed over 2000 litres of water in a day from
pipe borne water system (see Figure 3a). On the sufficiency in the volume of water supplied,
over 41% of the respondents said the volume is sufficient for their potable needs as they store
up more in their overhead tanks for use during hours of supply down time.
This study disagrees slightly with the findings of Ali et al. (2020) in which majority of
respondents said they need between 81-100 litres of water for potable uses, those who claimed

FUTY Journal of the Environment Vol. 14 No. 2 June, 2020
140
that 10-50 litres of water is sufficient for their daily potable uses constitute 24.44% of the
respondents, 22.22% said they need between 71-80 litres in a day and 21.11% depend on 51-
70 litres per capita per day while over 101 litres is utilized by just 13 number of respondents
from all districts in Jos North Local Government Area (LGA). Due to water scarcity, the people
of the area have adapted to the use of managing with the available quantities from both main
and alternate sources
Over thirty-Eight percent (38.8%) of the respondents in Figure 3b said that the volume of water
supplied is sufficient for their needs for drinking, cooking, washing and gardening all year
round, 31.6% said that the insufficiency of water is just during dry seasons and 13.3% are
saying that water is not available to them always, these people maybe those in rocky and
highland areas where wells don’t succeed and pipe borne water is not always available. Sixteen
percent of the respondents on their part did not say anything as those interviewed said that
water supply conditions are not permanent as sometimes they get water and some other times
they don’t.
Table 2: Socioeconomic Benefits of water Supply Projects
Variables Benefits Freq %
Benefits of pipe borne water Improved health of household members 90 23.9
Time saving 191 50.8
Reduced distance to water points 60 16.0
All of the above 35 9.3
Total 376 100.0
Proximity benefits Source of water 100 26.6
Small scale irrigation 48 12.8
Recreation and tourism 56 14.9
All of the above 172 45.7 Total 376 100.0
Other benefits Relatively fair rates 239 63.6
Sufficient water volume 43 11.4
Very good quality 3 .8
Long duration of supply 28 7.4
All the above 63 16.8
Total 376 100.0
Duration (hours) of water supply 1 – 3 144 38.3
4 – 6 108 28.7
7 – 9 98 26.1
10 – 13 26 6.9
Total 376 100.0
About 24% of the respondents are of the view that pipe borne water brought about enormous
benefits to their households in area of improvement in health status of their members. Majority
of the respondents constituting 50.8% as shown in Table 2 said pipe borne water connection
saves them the so many hours wasted daily in sourcing for water. Sixteen percent (16%) of the
residents expressed the view that they are saved from covering a very long distances to get
water when they were not yet connected while 35 of the 376 respondents said that they are
connected to the pipe born water due to all the reasons. WaterAid (2008) identifies multiple
impact areas of their water and sanitation projects: livelihoods and incomes, socio-cultural life,
FUTY Journal of the Environment Vol. 14 No. 2 June, 2020
141
health and hygiene, psychological impact, education, gender issues, community management
and sustainability.
Table 2 also shows benefits of water user’s proximity to water supply projects to include
sources of water, small scale irrigation, recreation and tourism. Over Twenty-Six percent
(26.6%) of the respondents are of the view that their nearness to water supply offer them the
opportunity to access water easily for the 12.8% of the residents around the river banks and are
into small scale market gardening and benefit from nearly abundant water source for irrigation
purposes. The residents of Lamingo, Ratt, Shen and Du and Laminga belong to this category.
These water supply projects also offer many people very scenic vistas for swimming,
sightseeing and recreation, 14.9% of the respondents said that their proximity to these water
projects benefit them in areas of recreation and tourism.
Over 45% forming the majority of the respondents view the water supply projects to be
beneficial to water users in all ways (see Table 2). Other benefits associated with water supply
projects according to respondents are relatively fair rates paid by residents, sufficient water
volume, very good quality and long duration of supply. The same Table 2 shows that 63.6% of
respondents view the rates they pay to be fair, 16.8% of the respondents see all of these benefits
to be available to them. Forty-three of the respondents said they have sufficient water volume
supplied them by the Plateau State Water Board while only 3 and 38 respondents respectively
said they receive good quality water and a long duration supply.
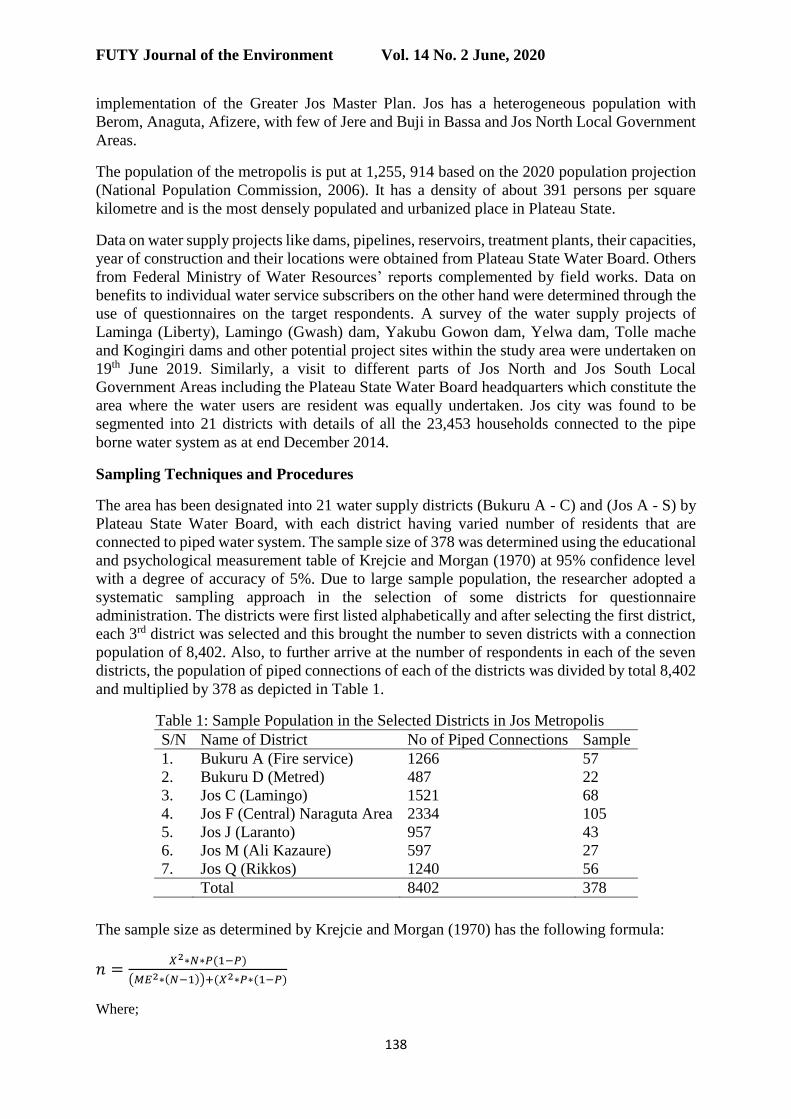
The Plateau State Water Board water supply uptime is put at 7 hours as against the AFDB
desired level of 8 hours a day as shown in Table 3 but majority of the respondents (38.3%) in
Table 4 said that they receive only 1 – 3 hours of supply. Twenty-eight percent (28%) of the
respondents said they receive 4 – 6 hours of supply in a day, those who receive 7 – 9 hours of
supply which falls within the AfDB minimum number of hours as 98 of the 376 respondents
in Jos metropolis and 26 respondents said they receive water between 10 – 13 hours in a day,
these number of hours of water supply translated to 100 - 500 litres of water according to 141
respondents (37.5%) in Table 3. Yildiz (2017) supported the assertion that water resources
Table 3: Time and Amount Spent and Saved from WSP Improvement
Variables Time/Amount (H/N) Frequency %
Time spent by households during
hours of no supply
1 – 2 hours 139 37.0
3 - 4 hours 45 12.0
5- 6 hours 160 42.6
Over 6 hours 32 8.5
Total 376 100.0
Amount saved from improvement
in water supply and connection to
piped water system
1000 – 50000 162 43.1
51000 – 100000 134 35.6
101000 – 150000 53 14.1
Above 150000 27 7.2
Total 376 100.0
Households’ alternate water sources Vendors 46 12.2
Tankers 52 13.8
Well 188 50.0
Boreholes 81 21.5
Other 9 2.4
Total 376 100.0
FUTY Journal of the Environment Vol. 14 No. 2 June, 2020
142
development projects enable developments in a wide range of areas from agriculture to tourism,
energy to health sector. Thus they can be considered as an engine for a country's development.
Keeping on in operation of this engine, especially under the changing climate conditions is
directly related to ensuring water security.
Thirty-two (32) respondents said the volume supplied from the system is just sufficient for their
household needs and 11.4% receive very insufficient quantum of water in Table 3, 43.1% said
that their connection to the piped water system of Plateau State Water Board has enabled them
to save up N1, 000 – N50, 000 being amount spent on providing water for diverse household
uses from vendors, tankers, boreholes and streams located from their dwelling places. Over
35% said they save between N251, 000 – N100, 000 yearly on buying of water. Fifty-three of
these respondents who probably use plenty water daily or with larger household size said that
their savings from connection to the pipe borne water ranges from N101,000 to N150,000 per
annum while 7.2% saved above N150,000. Katko and Hukka (2017) agreed that good access
to water supply projects and services bring about enormous socioeconomic benefits to the
population.
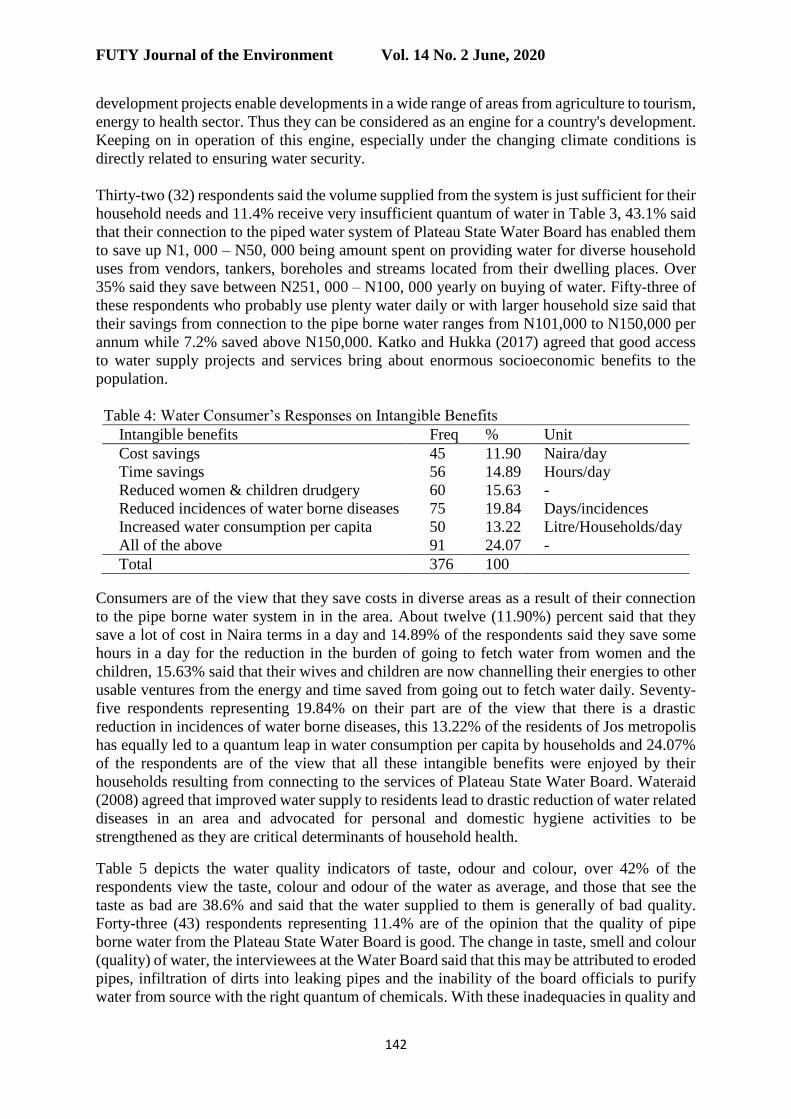
Table 4: Water Consumer’s Responses on Intangible Benefits
Intangible benefits Freq % Unit
Cost savings 45 11.90 Naira/day
Time savings 56 14.89 Hours/day
Reduced women & children drudgery 60 15.63 -
Reduced incidences of water borne diseases 75 19.84 Days/incidences
Increased water consumption per capita 50 13.22 Litre/Households/day
All of the above 91 24.07 -
Total 376 100
Consumers are of the view that they save costs in diverse areas as a result of their connection
to the pipe borne water system in in the area. About twelve (11.90%) percent said that they
save a lot of cost in Naira terms in a day and 14.89% of the respondents said they save some
hours in a day for the reduction in the burden of going to fetch water from women and the
children, 15.63% said that their wives and children are now channelling their energies to other
usable ventures from the energy and time saved from going out to fetch water daily. Seventy-
five respondents representing 19.84% on their part are of the view that there is a drastic
reduction in incidences of water borne diseases, this 13.22% of the residents of Jos metropolis
has equally led to a quantum leap in water consumption per capita by households and 24.07%
of the respondents are of the view that all these intangible benefits were enjoyed by their
households resulting from connecting to the services of Plateau State Water Board. Wateraid
(2008) agreed that improved water supply to residents lead to drastic reduction of water related
diseases in an area and advocated for personal and domestic hygiene activities to be
strengthened as they are critical determinants of household health.
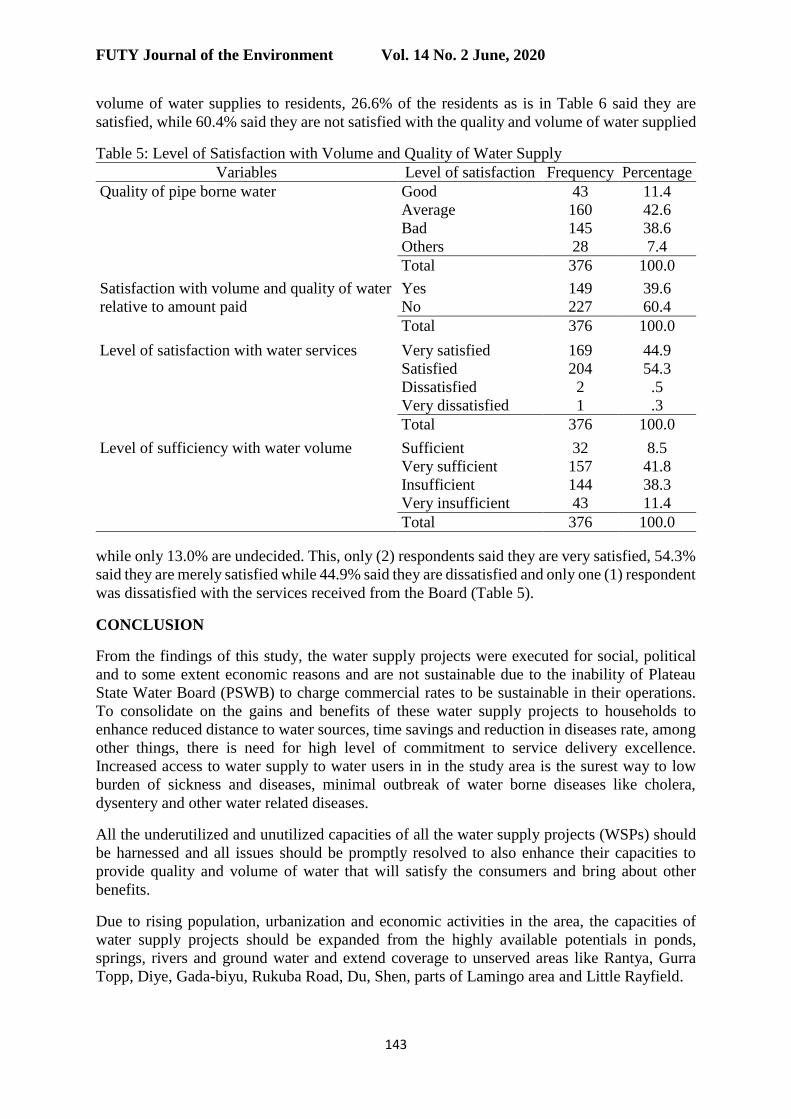
Table 5 depicts the water quality indicators of taste, odour and colour, over 42% of the
respondents view the taste, colour and odour of the water as average, and those that see the
taste as bad are 38.6% and said that the water supplied to them is generally of bad quality.
Forty-three (43) respondents representing 11.4% are of the opinion that the quality of pipe
borne water from the Plateau State Water Board is good. The change in taste, smell and colour
(quality) of water, the interviewees at the Water Board said that this may be attributed to eroded
pipes, infiltration of dirts into leaking pipes and the inability of the board officials to purify
water from source with the right quantum of chemicals. With these inadequacies in quality and
FUTY Journal of the Environment Vol. 14 No. 2 June, 2020
143
volume of water supplies to residents, 26.6% of the residents as is in Table 6 said they are
satisfied, while 60.4% said they are not satisfied with the quality and volume of water supplied
Table 5: Level of Satisfaction with Volume and Quality of Water Supply
Variables Level of satisfaction Frequency Percentage
Quality of pipe borne water Good 43 11.4
Average 160 42.6
Bad 145 38.6
Others 28 7.4
Total 376 100.0
Satisfaction with volume and quality of water
relative to amount paid
Yes 149 39.6
No 227 60.4
Total 376 100.0
Level of satisfaction with water services Very satisfied 169 44.9
Satisfied 204 54.3
Dissatisfied 2 .5
Very dissatisfied 1 .3
Total 376 100.0
Level of sufficiency with water volume Sufficient 32 8.5
Very sufficient 157 41.8
Insufficient 144 38.3
Very insufficient 43 11.4
Total 376 100.0
while only 13.0% are undecided. This, only (2) respondents said they are very satisfied, 54.3%
said they are merely satisfied while 44.9% said they are dissatisfied and only one (1) respondent
was dissatisfied with the services received from the Board (Table 5).
CONCLUSION
From the findings of this study, the water supply projects were executed for social, political
and to some extent economic reasons and are not sustainable due to the inability of Plateau
State Water Board (PSWB) to charge commercial rates to be sustainable in their operations.
To consolidate on the gains and benefits of these water supply projects to households to
enhance reduced distance to water sources, time savings and reduction in diseases rate, among
other things, there is need for high level of commitment to service delivery excellence.
Increased access to water supply to water users in in the study area is the surest way to low
burden of sickness and diseases, minimal outbreak of water borne diseases like cholera,
dysentery and other water related diseases.
All the underutilized and unutilized capacities of all the water supply projects (WSPs) should
be harnessed and all issues should be promptly resolved to also enhance their capacities to
provide quality and volume of water that will satisfy the consumers and bring about other
benefits.
Due to rising population, urbanization and economic activities in the area, the capacities of
water supply projects should be expanded from the highly available potentials in ponds,
springs, rivers and ground water and extend coverage to unserved areas like Rantya, Gurra
Topp, Diye, Gada-biyu, Rukuba Road, Du, Shen, parts of Lamingo area and Little Rayfield.
FUTY Journal of the Environment Vol. 14 No. 2 June, 2020
144
The government should provide alternative compensational fishing grounds, settlements,
recreational areas and farmlands to the original owners of the land in form of either money or
land to enable them harness socioeconomic benefits that are associated with water supply
project execution.
References
Ali, A.Y. (2018). Cost benefit analysis of water supply projects in Jos metropolis, Nigeria. PhD
Thesis, Department of Geography and Planning, University of Jos, Nigeria.
Ali, A.Y, Vivan, E.L Obasi, M.T, Yusuf, I.D and Sabo, D.D. (2020). Covid 19 and the
intensity of water use in Jos North, Plateau State, Nigeria International Webinar, Covid-
19 Pandemic from the Eyes of Geography: Global, National and Regional Perspectives,
Department of Geography, Gauhati University, Guwahati, Assam, India.
AfDB (2010). Guidelines for User Fees and Cost Recovery for Rural, Non-networked, Water
and Sanitation Delivery. Water Partnership Program. The African Development Bank,
Tunisia.
Araral, E. and Holmemo, C. (2007). Measuring the costs and Benefits of Community Driven
Development: The Kalahi CIDSS Project, Social Development Papers, Philippines Paper
No. 102
Ariyo, J. A. (2000). Plateau State in Mamman, A. B et.al (eds) Nigeria: A People united, A
Future Assured, Survey of States, Gabumo Publishing Company Ltd, Abuja Vol II.
Bingel, A.D. (1978). Jos: Origins and Growth of the Town 1900 to 1972. University of Jos,
Department of Geography Publication No 1, Nigeria 1978.
Cessti, R. and Malik, R. K. (2012). Indirect economic Input of Dams, Impacts of Large Dams:
A Global Assessment in Tortajada, C, Dogan, A and Asit, B eds. Springer, New York.
Esteves, J. M. & Cumming, O. (2016). The Impact of WASH on Key Social and Health
Outcomes Review of Evidence. Sanitation and Hygiene Applied Research for Equity.
Unicef UNI79307/Pietrasik.
Federal Republic of Nigeria (2009).Legal Notice on Publication of 2006 Census Final Results,
Official Gazette, Vol. 96 Government Notice No.2, Federal Government Printer, Abuja-
Nigeria.
Jiya, S. N. & Musa, H.D. (2013). Impacts of derived Tin Mining Activities on Land use/land
cover in Bukuru Plateau State, Nigeria. Journal of Sustainable development. 5 (5) 90-96.
Kaliel, M. B. (2001). Water Resources Management and the National Water Supply and
Sanitation Programme, Being a Lecture Delivered to the Participants of Senior Executive
Course No. 23 of National Institute for Policy and Strategic Studies, Kuru.
Katko, T.S and Hukka, J.J. (2017). Social and Economic Importance of Water Services in the
Built Environment: Need for more structured thinking. Proceedings of 8th Nordic
Conference on Construction Economics and Organization. www.sciencedirect.com
Krejcie, R.N. and Morgan, D.W. (1970). Determining Sample Size for Research Activities.
Academy Press, New York.
Mallo, S. J. (2007), Minerals and Mining on the Jos Plateau. ACON Publishers, Jos Nigeria.
Mohammed, S. O, Gajere, E. N, Adigun, A. B. & Folayan, O.O. (2010). A Study of the
Relationship between Land use Surface Temperature and Land use/Land cover
Characteristics using Remote Sensing and GIS Techniques in Jos Metropolis. Nigerian
Journal of Space Research. 9 (.77-88).
National Population Commission (2006).Population and Housing Census of the Federal
Republic of Nigeria, Volume 2, Federal Government Printers, Lagos.
Schoeniech, K. (1992).The Geomorphological History of the Jos Plateau. Jos Plateau
Environmental Resources Development Programme Interim Report No. 30
FUTY Journal of the Environment Vol. 14 No. 2 June, 2020
145
Vivan, E. L, Ali, A. Y. and Adamu, I. C. (2015). Effects of Human Activities on Water Quality
of Lamingo Dam: Implication for Water Production. International Journal of
Interdisciplinary Research and Innovations, 2(4), 94-104. www.researchpublish.com.
Wateraid (2008). Valuating Economic and Social Impacts of Improved Water and Sanitation
Services. School of International and Public Affairs, SIPA EDP/HR Workshop 2007-
2008, Draft Report.
Wong, E.S. (2013). Damning the Dams: A Study of Cost-Benefit Analysis in Large Dams
through the Lens of India’s Sardar Sarovar Project. A Bachelor of Arts Project Submitted
to Scripps College.
Yildiz, D. (2017). Water Resource and Development under the Climate Change Effects. World
Water Diplomacy & Science News- 2017-10006.
© 2020 by the authors. License FUTY Journal of the Environment, Yola,
Nigeria. This article is an open access distributed under the terms and conditions
of the Creative Commons Attribution (CC BY) license
(http://creativecommons.org/licenses/by/4.0/).