Analysis of Ride Through Capability Of Low-Wattage Fluorescent Lamps During Voltage Sags
9
Analysis of Ride Through Capability Of Low-Wattage Fluorescent Lamps During Voltage Sags H. Shareef, A. Mohamed, N. Marzuki Abstract – This paper presents a comparative investigation on the sensitivity of various low- wattage fluorescent lamps (FLs) used in residential and commercial lighting, during voltage sags. Based on recent testing standards and utilizing a modern industrial power corrupter and advanced photometer, extensive tests were conducted for many FLs with different ballast types. For predefined malfunction criterion of zero illuminance condition, sag depth and duration are varied to construct individual voltage immunity curves. The different ballast technologies adopted in driving the FLs seem to play a vital role in riding through in the event of voltage sag. The experimental results of tested FLs show that the lamp with electromagnetic ballast is more sensitive to voltage sags than that of the lamps equipped with electronic ballasts. Finally a method to improve the sensitivity of electronically ballasted FLs to voltage sags is implemented. This technique increases the holdup time of the dc bus voltage by connecting additional dc capacitance at the rectifier output of the ballast circuit. Details results of three 18 Watt FLs with different ballast types are presented for illustration purpose. Copyright © 2006 Praise Worthy Prize S.r.l. - All rights reserved Keywords: Fluorescent lamps, Voltage sags, Voltage tolerance curves, Ride through capability, Ballast, CFL I. Introduction A great amount of the electrical energy produced in the world is consumed as artificial illumination. Recently, power companies and governments have been encouraging consumers to replace conventional incandescent lamps with more efficient fluorescent lighting. Thus, different forms of fluorescent lamps (FLs) are increasingly being used in domestic and commercial buildings because of the desire to reduce electricity usage. Aside from energy efficiency, FLs like incandescent lamps are susceptible to power system disturbances such as voltage sag. Voltage sag is a sudden decrease in voltage amplitude followed by a return to its initial level after a short time [1]. Voltage sags may cause lamps to extinguish or twinkle that will likely cause nuisance and damage in some cases. However, there is little available information related to light flicker or interruption in low-wattage FLs due to voltage sags. Experiments conducted on most common two categories of lightning loads namely fluorescent lamps and helium lamps can be found in [2]. For both the fluorescent and helium lamps, it was concluded that the reduction in the intensity of lamp depends only on sag depth. However, this conclusion was made on the basis of visual inspection. It was also reported that for sag depth of 60%, and 20 cycles, the fluorescent lamps start to switch off but no tests caused helium lamps to malfunction. Nothing was mentioned about short duration sags which are less than 5 cycles. These tests were conducted only for 120V/60 Hz system. The effects of voltage sags on several 150-W high pressure sodium (HPS) lamps combined with two different types of electronic ballast have been studied by another team of researchers [3]. It was notified that the two electronic HPS ballasts allowed the lamp to ride through for at least one cycle of power loss unlike the lamp with electromagnetic ballast. The best immunity level was found to be 57% of nominal rms voltage. A similar conclusion was made in [4] for HPS lamps with lead type ballasts. Moreover, it also simulated the effects of flicker due to resistance spot welders, elevators, arc furnaces, or cycloconverters. Different types of gas discharge lamp namely mercury, HPS and metal halide rated from 70 to 250 watts were exposed to voltage sags in [5]. The study concluded that the mercury and HPS lamps are less sensitive to voltage sags than the metal halide ones. There are many published works that give detailed information on sensitivity of light flicker for different types of lamps. The study goals are generally to obtain luminance flux variation in lamps and characterization, where the supply voltage has the periodic and continuous rms distortions in itself, which makes the lights to flicker [6], [7]. This paper aims on testing and analyzing the tolerance level of low-wattage fluorescent lamps to voltage sags in the 240V/50Hz mains supply. So far it
Transcript of Analysis of Ride Through Capability Of Low-Wattage Fluorescent Lamps During Voltage Sags

Analysis of Ride Through Capability Of Low-Wattage Fluorescent Lamps During Voltage Sags
H. Shareef, A. Mohamed, N. Marzuki Abstract – This paper presents a comparative investigation on the sensitivity of various low-wattage fluorescent lamps (FLs) used in residential and commercial lighting, during voltage sags. Based on recent testing standards and utilizing a modern industrial power corrupter and advanced photometer, extensive tests were conducted for many FLs with different ballast types. For predefined malfunction criterion of zero illuminance condition, sag depth and duration are varied to construct individual voltage immunity curves. The different ballast technologies adopted in driving the FLs seem to play a vital role in riding through in the event of voltage sag. The experimental results of tested FLs show that the lamp with electromagnetic ballast is more sensitive to voltage sags than that of the lamps equipped with electronic ballasts. Finally a method to improve the sensitivity of electronically ballasted FLs to voltage sags is implemented. This technique increases the holdup time of the dc bus voltage by connecting additional dc capacitance at the rectifier output of the ballast circuit. Details results of three 18 Watt FLs with different ballast types are presented for illustration purpose. Copyright © 2006 Praise Worthy Prize S.r.l. - All rights reserved Keywords: Fluorescent lamps, Voltage sags, Voltage tolerance curves, Ride through capability, Ballast, CFL
I. Introduction A great amount of the electrical energy produced in
the world is consumed as artificial illumination. Recently, power companies and governments have been encouraging consumers to replace conventional incandescent lamps with more efficient fluorescent lighting. Thus, different forms of fluorescent lamps (FLs) are increasingly being used in domestic and commercial buildings because of the desire to reduce electricity usage. Aside from energy efficiency, FLs like incandescent lamps are susceptible to power system disturbances such as voltage sag. Voltage sag is a sudden decrease in voltage amplitude followed by a return to its initial level after a short time [1]. Voltage sags may cause lamps to extinguish or twinkle that will likely cause nuisance and damage in some cases. However, there is little available information related to light flicker or interruption in low-wattage FLs due to voltage sags.
Experiments conducted on most common two categories of lightning loads namely fluorescent lamps and helium lamps can be found in [2]. For both the fluorescent and helium lamps, it was concluded that the reduction in the intensity of lamp depends only on sag depth. However, this conclusion was made on the basis of visual inspection. It was also reported that for sag depth of 60%, and 20 cycles, the fluorescent lamps start to switch off but no tests caused helium lamps to
malfunction. Nothing was mentioned about short duration sags which are less than 5 cycles. These tests were conducted only for 120V/60 Hz system.
The effects of voltage sags on several 150-W high pressure sodium (HPS) lamps combined with two different types of electronic ballast have been studied by another team of researchers [3]. It was notified that the two electronic HPS ballasts allowed the lamp to ride through for at least one cycle of power loss unlike the lamp with electromagnetic ballast. The best immunity level was found to be 57% of nominal rms voltage. A similar conclusion was made in [4] for HPS lamps with lead type ballasts. Moreover, it also simulated the effects of flicker due to resistance spot welders, elevators, arc furnaces, or cycloconverters. Different types of gas discharge lamp namely mercury, HPS and metal halide rated from 70 to 250 watts were exposed to voltage sags in [5]. The study concluded that the mercury and HPS lamps are less sensitive to voltage sags than the metal halide ones.
There are many published works that give detailed information on sensitivity of light flicker for different types of lamps. The study goals are generally to obtain luminance flux variation in lamps and characterization, where the supply voltage has the periodic and continuous rms distortions in itself, which makes the lights to flicker [6], [7].
This paper aims on testing and analyzing the tolerance level of low-wattage fluorescent lamps to voltage sags in the 240V/50Hz mains supply. So far it
H. Shareef, A. Mohamed, N. Marzuki
has not been documented in the literature as to how FLs behave when subjected to voltage sags. Extensive laboratory tests are conducted for this purpose with FLs having two different types of ballasts. These tests are carried out to observe the light intensity variation of the FLs during voltage sags. In addition, a method is implemented to improve the sensitivity of the electronically ballasted FLs to voltage sags.
II. Fluorescent Lamp Operation The operating principle of FLs is the same whether
the form is a straight tube, circular, or convoluted as in compact fixtures. When a voltage is applied across the ends of a sealed glass tube containing mercury vapour, it causes the vapour to ionize. This vapour radiates light in the ultra violet region of the spectrum, which is converted to visible light by a fluorescent coating on the inside of the lamp. However, it requires a high voltage pulse across the tube to start the process and some form of limiter to prevent the current increasing to a level where the lamp can be destroyed. The current limiter is commonly known as ballast.
II.1. Electromagnetic Ballast
The traditional ballast used to light fluorescent lamps contains an inductor connected in series with the lamp, and a starter [8]. The starter triggers the tube when it is first turned on, by easing the current flow through the inductor and the filaments of the tube at the first place. When the starter bimetal strip reopens, the high circuit impedance and consequent sharp reduction in inductor current causes enough overvoltage to ionize the gas in the tube. However, this solution has significant weaknesses which include a high power loss in the inductor core, light flickering and a very low power factor due to high inductive reactance.
II.2. Electronic Ballast
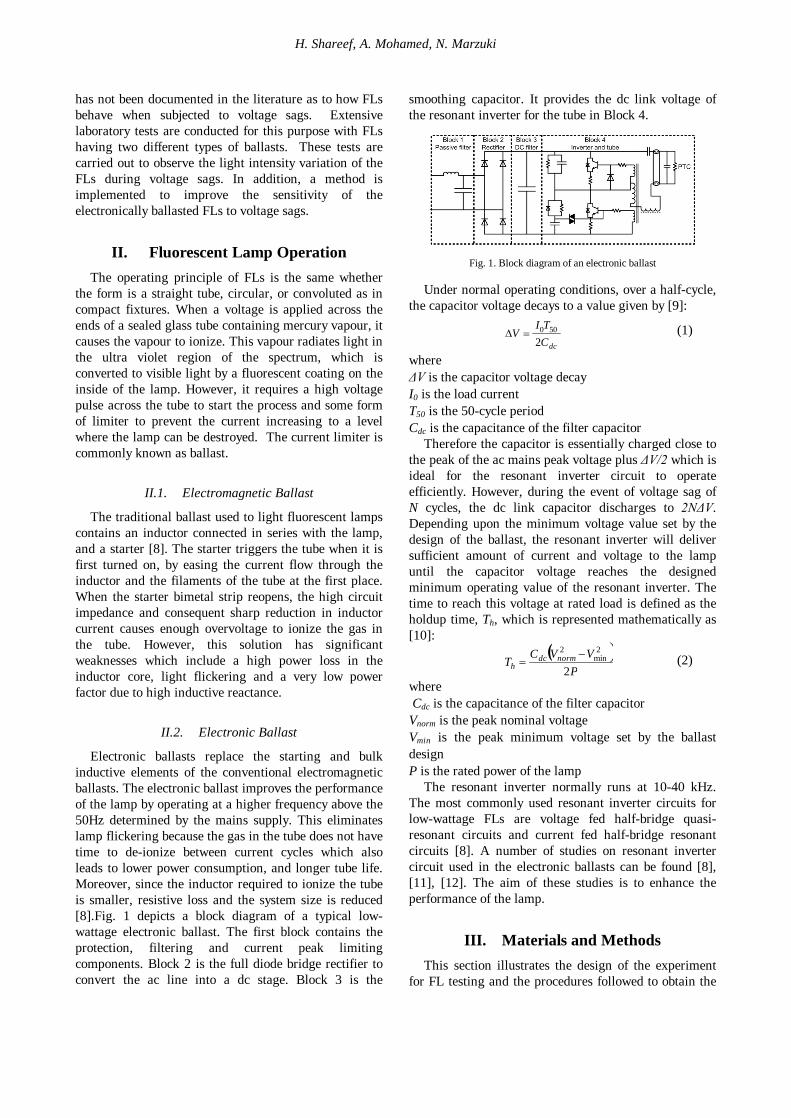
Electronic ballasts replace the starting and bulk inductive elements of the conventional electromagnetic ballasts. The electronic ballast improves the performance of the lamp by operating at a higher frequency above the 50Hz determined by the mains supply. This eliminates lamp flickering because the gas in the tube does not have time to de-ionize between current cycles which also leads to lower power consumption, and longer tube life. Moreover, since the inductor required to ionize the tube is smaller, resistive loss and the system size is reduced [8].Fig. 1 depicts a block diagram of a typical low-wattage electronic ballast. The first block contains the protection, filtering and current peak limiting components. Block 2 is the full diode bridge rectifier to convert the ac line into a dc stage. Block 3 is the
smoothing capacitor. It provides the dc link voltage of the resonant inverter for the tube in Block 4.
Fig. 1. Block diagram of an electronic ballast Under normal operating conditions, over a half-cycle,
the capacitor voltage decays to a value given by [9]:
dcCTI
V2
500 (1)
where ΔV is the capacitor voltage decay I0 is the load current T50 is the 50-cycle period Cdc is the capacitance of the filter capacitor
Therefore the capacitor is essentially charged close to the peak of the ac mains peak voltage plus ΔV/2 which is ideal for the resonant inverter circuit to operate efficiently. However, during the event of voltage sag of N cycles, the dc link capacitor discharges to 2NΔV. Depending upon the minimum voltage value set by the design of the ballast, the resonant inverter will deliver sufficient amount of current and voltage to the lamp until the capacitor voltage reaches the designed minimum operating value of the resonant inverter. The time to reach this voltage at rated load is defined as the holdup time, Th, which is represented mathematically as [10]:
P
VVCT normdch 2
2min
2 (2)
where Cdc is the capacitance of the filter capacitor Vnorm is the peak nominal voltage Vmin is the peak minimum voltage set by the ballast design P is the rated power of the lamp
The resonant inverter normally runs at 10-40 kHz. The most commonly used resonant inverter circuits for low-wattage FLs are voltage fed half-bridge quasi-resonant circuits and current fed half-bridge resonant circuits [8]. A number of studies on resonant inverter circuit used in the electronic ballasts can be found [8], [11], [12]. The aim of these studies is to enhance the performance of the lamp.
III. Materials and Methods This section illustrates the design of the experiment
for FL testing and the procedures followed to obtain the
H. Shareef, A. Mohamed, N. Marzuki
results on the performance of FLs during voltage sags. results on
the performance of FLs during voltage sags.
III.1. Experimental Setup
The methodology that is used in the testing is generally based on the guideline published in the IEC Standard 61000-4-11 [13]. Many FLs with different ballast types are tested to study the effect of voltage sags on the performance of the lamps. However, the sensitivity of only three 18 Watt FLs are highlighted in this paper. The specifications of these three FLs are shown in Table 1.
TABLE I
TYPE OF FLUORESCENT LAMPS SELECTED FOR ILLUSTRATION
Lamp ID Description
Rated Power (W)
Rated Frequency
(Hz)
Rated Voltage
(V)
FLM Straight tube with electromagnetic
ballast 18 W 50 Hz 220-
240 V
FLE Straight tube with electronic ballast 18 W 50 Hz 220-
240 V
CFL
Convoluted tube with electronic ballast with
all in one compact fixture
18 W 50 Hz 220- 240 V
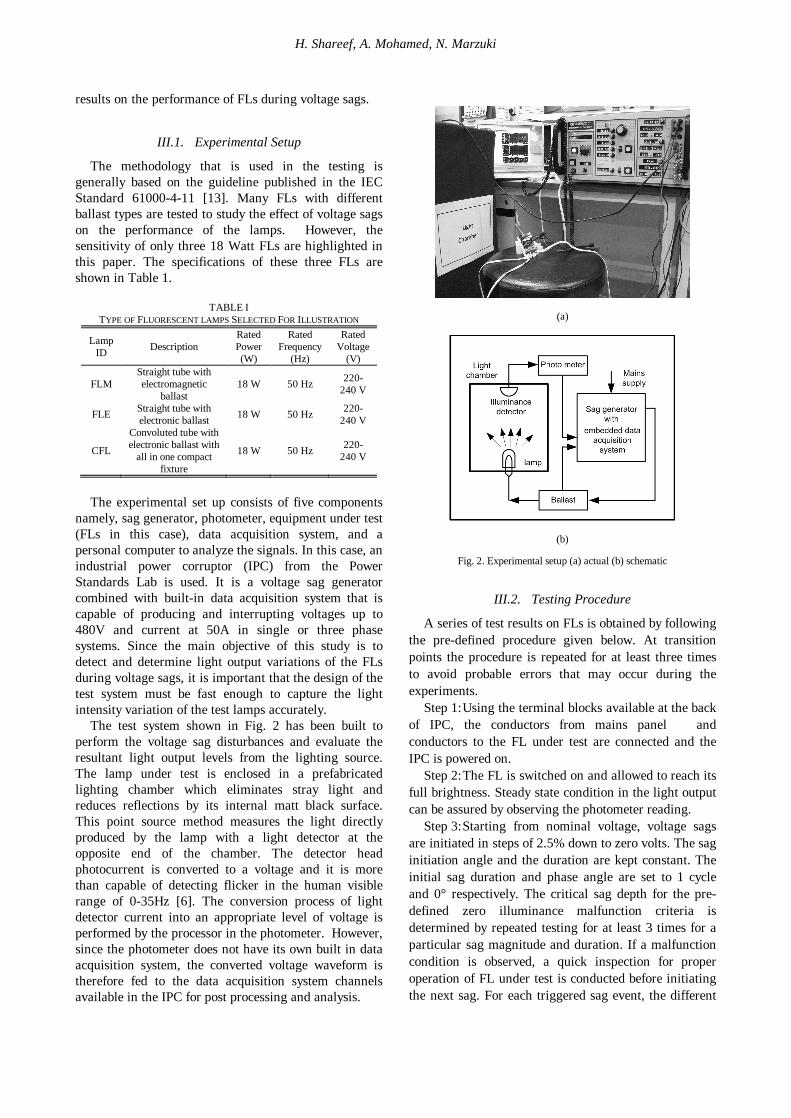
The experimental set up consists of five components
namely, sag generator, photometer, equipment under test (FLs in this case), data acquisition system, and a personal computer to analyze the signals. In this case, an industrial power corruptor (IPC) from the Power Standards Lab is used. It is a voltage sag generator combined with built-in data acquisition system that is capable of producing and interrupting voltages up to 480V and current at 50A in single or three phase systems. Since the main objective of this study is to detect and determine light output variations of the FLs during voltage sags, it is important that the design of the test system must be fast enough to capture the light intensity variation of the test lamps accurately.
The test system shown in Fig. 2 has been built to perform the voltage sag disturbances and evaluate the resultant light output levels from the lighting source. The lamp under test is enclosed in a prefabricated lighting chamber which eliminates stray light and reduces reflections by its internal matt black surface. This point source method measures the light directly produced by the lamp with a light detector at the opposite end of the chamber. The detector head photocurrent is converted to a voltage and it is more than capable of detecting flicker in the human visible range of 0-35Hz [6]. The conversion process of light detector current into an appropriate level of voltage is performed by the processor in the photometer. However, since the photometer does not have its own built in data acquisition system, the converted voltage waveform is therefore fed to the data acquisition system channels available in the IPC for post processing and analysis.
(a)
(b)
Fig. 2. Experimental setup (a) actual (b) schematic
III.2. Testing Procedure
A series of test results on FLs is obtained by following the pre-defined procedure given below. At transition points the procedure is repeated for at least three times to avoid probable errors that may occur during the experiments.
Step 1: Using the terminal blocks available at the back of IPC, the conductors from mains panel and conductors to the FL under test are connected and the IPC is powered on.
Step 2: The FL is switched on and allowed to reach its full brightness. Steady state condition in the light output can be assured by observing the photometer reading.
Step 3: Starting from nominal voltage, voltage sags are initiated in steps of 2.5% down to zero volts. The sag initiation angle and the duration are kept constant. The initial sag duration and phase angle are set to 1 cycle and 0° respectively. The critical sag depth for the pre-defined zero illuminance malfunction criteria is determined by repeated testing for at least 3 times for a particular sag magnitude and duration. If a malfunction condition is observed, a quick inspection for proper operation of FL under test is conducted before initiating the next sag. For each triggered sag event, the different
H. Shareef, A. Mohamed, N. Marzuki
voltage and current waveforms supplied to the FL under test are recorded along with real time light output measurements. Observations such as visible or audible influence on the FL are also noted.
Step 4: The duration of sag is adjusted in steps of 1 cycle and the measurements outlined in Step 3 are repeated.
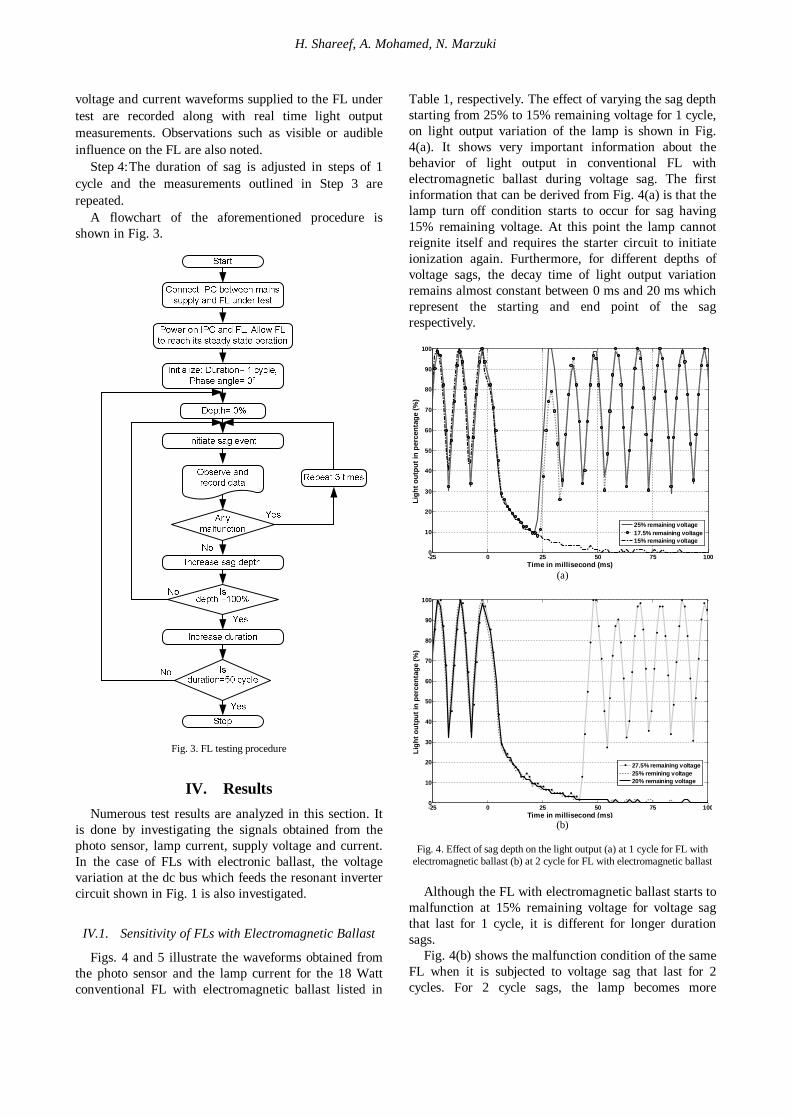
A flowchart of the aforementioned procedure is shown in Fig. 3.
Fig. 3. FL testing procedure
IV. Results Numerous test results are analyzed in this section. It
is done by investigating the signals obtained from the photo sensor, lamp current, supply voltage and current. In the case of FLs with electronic ballast, the voltage variation at the dc bus which feeds the resonant inverter circuit shown in Fig. 1 is also investigated.
IV.1. Sensitivity of FLs with Electromagnetic Ballast
Figs. 4 and 5 illustrate the waveforms obtained from the photo sensor and the lamp current for the 18 Watt conventional FL with electromagnetic ballast listed in
Table 1, respectively. The effect of varying the sag depth starting from 25% to 15% remaining voltage for 1 cycle, on light output variation of the lamp is shown in Fig. 4(a). It shows very important information about the behavior of light output in conventional FL with electromagnetic ballast during voltage sag. The first information that can be derived from Fig. 4(a) is that the lamp turn off condition starts to occur for sag having 15% remaining voltage. At this point the lamp cannot reignite itself and requires the starter circuit to initiate ionization again. Furthermore, for different depths of voltage sags, the decay time of light output variation remains almost constant between 0 ms and 20 ms which represent the starting and end point of the sag respectively.
-25 0 25 50 75 1000
10
20
30
40
50
60
70
80
90
100
Time in millisecond (ms)
Ligh
t out
put i
n pe
rcen
tage
(%)
25% remaining voltage17.5% remaining voltage15% remaining voltage
(a)
-25 0 25 50 75 1000
10
20
30
40
50
60
70
80
90
100
Time in millisecond (ms)
Ligh
t out
put i
n pe
rcen
tage
(%)
27.5% remaining voltage25% remining voltage20% remaining voltage
(b)
Fig. 4. Effect of sag depth on the light output (a) at 1 cycle for FL with
electromagnetic ballast (b) at 2 cycle for FL with electromagnetic ballast Although the FL with electromagnetic ballast starts to
malfunction at 15% remaining voltage for voltage sag that last for 1 cycle, it is different for longer duration sags.
Fig. 4(b) shows the malfunction condition of the same FL when it is subjected to voltage sag that last for 2 cycles. For 2 cycle sags, the lamp becomes more
H. Shareef, A. Mohamed, N. Marzuki
sensitive to the depth of the sag. It can be seen from Fig. 4(b) that the lamp starts to extinguish for all sags that is deeper than 25% remaining voltage.
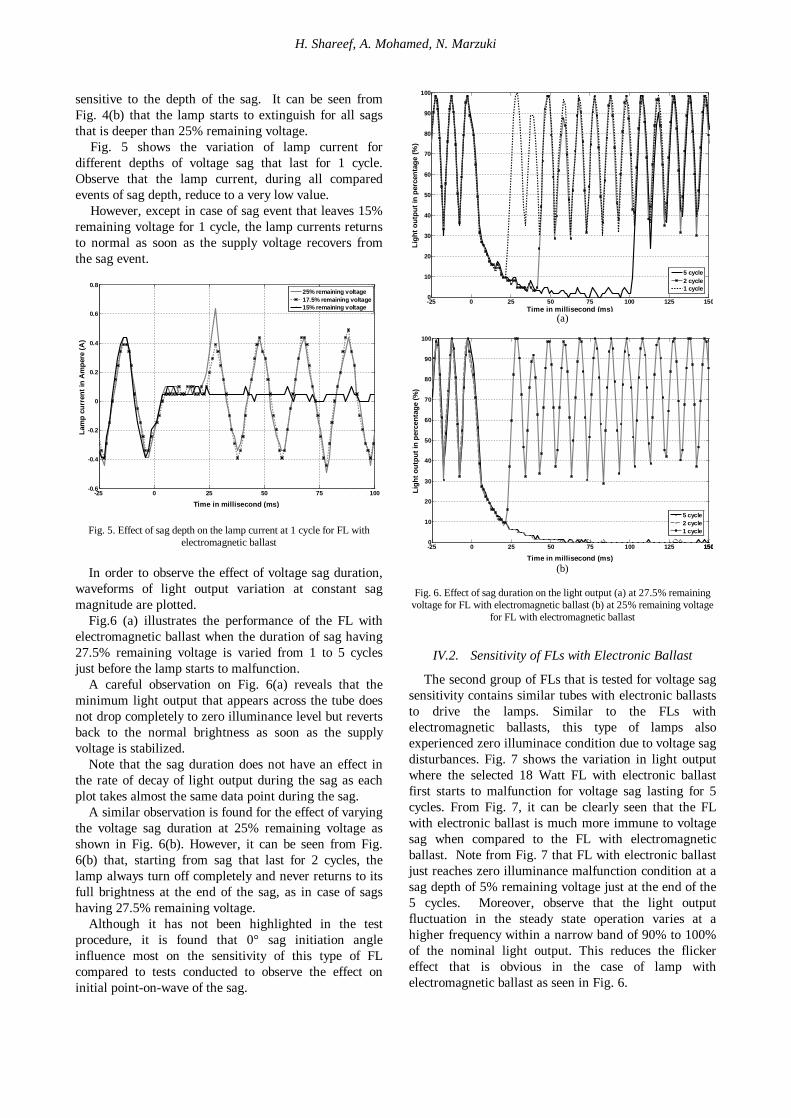
Fig. 5 shows the variation of lamp current for different depths of voltage sag that last for 1 cycle. Observe that the lamp current, during all compared events of sag depth, reduce to a very low value.
However, except in case of sag event that leaves 15% remaining voltage for 1 cycle, the lamp currents returns to normal as soon as the supply voltage recovers from the sag event.
-25 0 25 50 75 100-0.6
-0.4
-0.2
0
0.2
0.4
0.6
0.8
Time in millisecond (ms)
Lam
p cu
rren
t in
Am
pere
(A)
25% remaining voltage17.5% remaining voltage15% remaining voltage
Fig. 5. Effect of sag depth on the lamp current at 1 cycle for FL with electromagnetic ballast
In order to observe the effect of voltage sag duration,
waveforms of light output variation at constant sag magnitude are plotted.
Fig.6 (a) illustrates the performance of the FL with electromagnetic ballast when the duration of sag having 27.5% remaining voltage is varied from 1 to 5 cycles just before the lamp starts to malfunction.
A careful observation on Fig. 6(a) reveals that the minimum light output that appears across the tube does not drop completely to zero illuminance level but reverts back to the normal brightness as soon as the supply voltage is stabilized.
Note that the sag duration does not have an effect in the rate of decay of light output during the sag as each plot takes almost the same data point during the sag.
A similar observation is found for the effect of varying the voltage sag duration at 25% remaining voltage as shown in Fig. 6(b). However, it can be seen from Fig. 6(b) that, starting from sag that last for 2 cycles, the lamp always turn off completely and never returns to its full brightness at the end of the sag, as in case of sags having 27.5% remaining voltage.
Although it has not been highlighted in the test procedure, it is found that 0° sag initiation angle influence most on the sensitivity of this type of FL compared to tests conducted to observe the effect on initial point-on-wave of the sag.
-25 0 25 50 75 100 125 1500
10
20
30
40
50
60
70
80
90
100
Time in millisecond (ms)
Ligh
t out
put i
n pe
rcen
tage
(%)
5 cycle2 cycle1 cycle
(a)
-25 0 25 50 75 100 125 1501500
10
20
30
40
50
60
70
80
90
100
Time in millisecond (ms)
Ligh
t out
put i
n pe
rcen
tage
(%)
5 cycle2 cycle1 cycle
(b)
Fig. 6. Effect of sag duration on the light output (a) at 27.5% remaining
voltage for FL with electromagnetic ballast (b) at 25% remaining voltage for FL with electromagnetic ballast
IV.2. Sensitivity of FLs with Electronic Ballast
The second group of FLs that is tested for voltage sag sensitivity contains similar tubes with electronic ballasts to drive the lamps. Similar to the FLs with electromagnetic ballasts, this type of lamps also experienced zero illuminace condition due to voltage sag disturbances. Fig. 7 shows the variation in light output where the selected 18 Watt FL with electronic ballast first starts to malfunction for voltage sag lasting for 5 cycles. From Fig. 7, it can be clearly seen that the FL with electronic ballast is much more immune to voltage sag when compared to the FL with electromagnetic ballast. Note from Fig. 7 that FL with electronic ballast just reaches zero illuminance malfunction condition at a sag depth of 5% remaining voltage just at the end of the 5 cycles. Moreover, observe that the light output fluctuation in the steady state operation varies at a higher frequency within a narrow band of 90% to 100% of the nominal light output. This reduces the flicker effect that is obvious in the case of lamp with electromagnetic ballast as seen in Fig. 6.

H. Shareef, A. Mohamed, N. Marzuki
Another way to confirm the malfunction condition of FL that uses electronic ballast is to analyze the variations in the rectifier dc output or dc bus voltage and lamp current. These waveforms are shown in Fig. 8 for different depth of voltage sag lasting for 5 cycles. Observe that for sag depth of 5% remaining voltage, the dc bus voltage maintains almost at a constant voltage level just after 80 ms unlike for voltage sags that is shallower. This indicates that the lamp does not draw sufficient current for its proper operation.
-25 0 25 50 75 100 125 150 1750
10
20
30
40
50
60
70
80
90
100100
Time in millisecond (ms)
Varia
tion
of li
ght o
utpu
t in
perc
enta
ge (%
)
20% remaining voltage10% remaining voltage5% remaining voltage
Fig. 7. Effect of sag depth on the light output at 5 cycles for FL with electronic ballast
-25 0 25 50 75 100 1250
50
100
150
200
250
300
350350
Time in millisecond (ms)
Rec
tifie
r dc
outp
ut in
Vol
ts (V
)
20% remaining voltage15% remaining voltage10% remaining voltage5% remaining voltage
Fig. 8. Effect of sag depth on the dc bus voltage and lamp current at 5 cycles for FL with electronic ballast
To analyze the effect of variation of sag duration on
the performance of the lamp at sag depth of 10% remaining voltage, Fig. 9 is plotted. From Fig. 9 it can be noted that the light output variation does not drop down to zero completely even if the sag duration is varied between 3 to 6 cycles and therefore the lamp is considered to operate properly. Here again it can be observed that the decay rate of light output variation during the sag, remains almost the same. For example, all sag events cause the light output of this FL to drop up to 18% of full brightness at 60 ms as shown in Fig. 9.
-25 0 25 50 75 100 125 150 175 200 225 250 2750
10
20
30
40
50
60
70
80
90
100100
Time in millisecond (ms)
Ligh
t out
put i
n pe
rcen
tage
(%)
10 cycle6 cycle5 cycle3 cycle
Fig. 9. Effect of sag duration on the light output at 10% remaining voltage for FL with electronic ballast
-25 0 25 50 75 100 125 1500
50
100
150
200
250
300
350350
Time in millisecond (ms)
Rec
tifie
r dc
outp
ut in
Vol
ts (V
)
6 cycle5 cycle3 cycle
(a)
-25 0 25 50 75 100 125 1500
Time in millisecond (ms)
-25 0 25 50 75 100 125 150150-0.5
-0.25
0
0.25
0.5
0.75
1
1.25
Lam
p cu
rren
t in
Am
pere
(A)
6 cycle5 cycle3 cycle
(b)
Fig. 10. Effect of sag duration at 5% remaining voltage for FL with
electronic ballast on (a) the dc bus voltage (b) lamp current
Fig. 10 shows the waveforms of ballasts’ rectifier dc output variation and the lamp current during voltage sag that leaves 5% remaining voltage for different durations. It is interesting to note that the rectifier dc output at the ballast also experiences a similar pattern of decay time to that of light output variation during the voltage sag.

H. Shareef, A. Mohamed, N. Marzuki
From Fig .10, it can be seen that after 80 ms, the dc bus voltage of the ballast is not sufficient for proper current flow in the tube. At this point, the voltage ripples that appear at the dc bus during the normal operations disappear as if it sees that the resonant inverter is open circuited.
IV.3. Sensitivity of CFLs with Electronic Ballast
A similar test results are shown below for the 18 Watt compact fluorescent lamp (CFL). It is found that the CFL is much more sensitive to voltage sags than that of the FL with electronic ballast that is presented before. In this case, the knee points appear at 15% and 17.5% remaining voltage for 2 cycles and 3 cycles, respectively. Fig. 11 shows the rectifier dc output and the lamp current waveforms at the ballast circuit for different depths of voltage sag that last for 3 cycles. Observe that when the sag depth is 15% remaining voltage the CFL starts to malfunction just after 35 ms while in case of sag depth of 17.5% remaining voltage it appears to malfunction at 45 ms. The improper functioning of the ballast circuit can also be seen from the current waveforms shown in Fig.11, where the lamp current starts to decrease significantly.
-25 0 25 50 750
50
100
150
200
250
300
350
Time in millisecond (ms)
Rec
tifie
r dc
outp
ut in
Vol
ts (V
)
-25 0 25 50 75-2
-1.5
-1
-0.5
0
0.5
1
1.5
22
Lam
p cu
rren
t in
Am
pere
(A)
20% remaining voltage17.5% remaining voltage15% remaining voltage5% remaining voltage
20% remaining voltage17.5% remaining voltage15% remaining voltage5% remaining voltage
Rectifier dc output
Lamp current
Fig. 11. Effect of sag depth on the dc bus voltage and lamp current at 3 cycles for CFL with electronic ballast
Initial point-on-wave and phase jump found not to
influence the susceptibility of electronically ballasted FLs due to the energy stored in the dc link capacitor in the ballast circuit.
From the extensive tests and analysis, it may be concluded that the malfunction of FLs with electronic ballast, in the event of voltage sag, depends upon the energy stored in the dc link capacitor and the minimum voltage for which the ballast is designed to function properly.
V. Discussions The overall immunity level of the three 18 Watt FLs
to voltage sags are presented in Fig. 12 as typical voltage
tolerance curves along with the SEMI F47 and ITIC power acceptability standard. The upper region of these curves represents proper operation region while the lower region indicates zero illiminance conditions for FLs’ operation.
From Fig. 12, the FL with electromagnetic ballast is found to be the most sensitive lamp selected. The lamp turn off condition is initiated for voltage sags as short as 1 cycle.
For long duration sags, starting from 2 cycles, FL with electromagnetic ballast failed to light up if the encountered sag depth is above 25% remaining voltage. CFL is also sensitive to voltage sag.
The main difference in case of CFL is that it is a little more immune to sags in terms of both sag magnitude and duration. It can produce some light output for all sag depths greater than 15% remaining voltage. FL with electronic ballast happened to be the most immune lamp to voltage sags. It is found to malfunction for sag magnitude beginning from 5% and for all durations greater than 5 cycles as shown in Fig. 12.
Furthermore, it is important to note that the FL with electromagnetic ballast and CFL do not satisfy the design goals of SEMI F47 and ITIC standards. Table 2 shows the average malfunction condition for FLs tested during this work. It shows that FLs with electronic ballasts are more immune to power quality disturbances such as voltage sag.
0 2 4 6 8 10 12 14 16 18 20 22 24 26 28 30 32 34 36 38 40 42 44 46 48 505005
101520253035404550556065707580859095
100100
Time in cycles
Rem
aini
ng v
olta
ge in
per
cent
age
(%)
ITICSEMI F47FL with magnetic ballastFL with electronic ballastCFL with electronic ballast
Fig. 12. Voltage tolerance curves of various FLs
TABLE II LOWEST AVERAGE MALFUNCTION CONDITION FOR ALL FLS TESTED
No of Samples FL Ballast type
Average malfunction
depth
Average malfunction
duration
10 Electromagnetic 27.50%
remaining voltage
1.20 cycles
11 Electronic 21.36%
remaining voltage
2.13 cycles
From the tests, it is evident that the dc bus voltage of
electronic ballasts plays a vital role in maintaining

H. Shareef, A. Mohamed, N. Marzuki
proper operation of the lamps and hence its sensitivity to voltage sags.
It is noted that the dc link capacitors used in electronic ballasted FLs are different from each other. For straight tube lamp with electronic ballast and CFL used in the previous illustrations have dc link capacitance value of 9.4 µF/ 400V and 3.3 µF/ 400V, respectively although their power rating is same. According to equation (2) the holdup time, Th, can be increased by increasing the capacitance of the dc link capacitor, Cdc. Therefore, one way to improve the voltage sag ride through capability of FLs with electronic ballasts is to add more capacitance to the dc bus which is at rectifier dc output.
In order to increase holdup time and delay the rate of voltage decay at the rectifier output, a 6.8 µF/ 400V capacitor is used. The value of the additional capacitor is chosen randomly to illustrate its effect. It is then connected in parallel to the existing capacitor in the original ballast design of FL with electronic ballast and CFL.
Once connected the experiment procedure presented in Section 3 is repeated. Fig. 13(a) shows the effect of increasing the capacitance value at the rectifier dc output for 18 Watt FL with electronic ballast. By comparing the time where it starts to switch off as in the original case and with added capacitor for sag depths of 5% remaining voltage, it can be noted that the time to reach the turn off condition can be delayed. With the addition of these capacitors, it can now ride through for any sag or interruption whose duration is less than or equal to 6 cycles.
A similar observation is found in the case of CFLs. Fig. 13(b) shows the effect of adding the same 6.8µF/ 400V capacitor at rectifier dc output of ballast circuit in 18 Watt CFL in the same fashion described before. It can be observed from Fig. 13(b) that by adding the capacitor, CFL is now immune to any sag duration or interruption for 5 cycles.
Therefore, from this analysis and comparisons, it is possible to conclude that by adding extra capacitance at the rectifier dc output of the electronic ballasts, voltage sag ride through capability of these FLs can be improved.
Another effect of increasing the dc link capacitor of the ballast is the reduction of light output fluctuation in steady state operation of the lamp. A simple comparison of the waveforms before and after the addition of dc bus capacitor shown in Fig. 13(b) clearly shows this improvement.
However this improvement in immunity level of the FLs does not come without any drawback. This modification in the ballast circuit cause high inrush current during the recovery period of the sag event. Fig. 14 shows the current drawn from the mains by the 18 Watt CLF during a voltage sag that leaves 5% remaining voltage for 6 cycles.
-25 0 25 50 75 100 125 150 175 2000
10
20
30
40
50
60
70
80
90
100100
Time in millisecond (ms)
Ligh
t out
put i
n pe
rcen
tage
(%)
6 cycle (original)6 cycle (capacitor)
(a)
-25 0 25 50 75 100 125 1500
10
20
30
40
50
60
70
80
90
100100
Time in millisecond (ms)
Ligh
t out
put i
n pe
rcen
tage
(%)
5% remaining voltage (original)5% remaining voltage (capacitor)
(b)
Fig. 13. Effect of increasing dc link capacitance at the rectifier dc output (a) for FL with electronic ballast (b) for CFL
-25 0 25 50 75 100 125 150 175 200200-1
-0.5
0
0.5
1
1.5
2
2.5
Time in millisecond (ms)
Supp
ly c
urre
nt in
Am
pere
s (A
)
5% remaining voltage (original)5% remaining voltage (capacitor)_
Fig. 14. Effect of increasing dc link capacitance on the inrush current
VI. Conclusion An extensive experimental study has been performed
to determine the effect of voltage sag on low-wattage fluorescent lamps with various ballast types. From the results of the test data, it may be concluded that the voltage tolerance level of the FLs used in the test varies over a wide range. When the voltage immunity levels of the tested FLs are compared, the lamps with electromagnetic ballasts are more sensitive to voltage

H. Shareef, A. Mohamed, N. Marzuki
sags than the FLs equipped with electronic ballasts. This is due to the fact that current and voltage in a FL with electromagnetic ballast undergoes zero crossing every half cycle which is determined by the mains supply unlike in FLs with electronic ballasts.
By observing variations in the light output of the lamps, it is possible to conclude that the light intensity of the lamp not only depends on the voltage sag depth but also on the duration of the sag event depending upon the design of the ballast used in the lamp. Moreover, investigations of rectifier dc output and lamp current of FLs with electronic ballasts show the exact timing where the ballast stop functioning properly. The experimental results on different FLs with electronic ballasts also show that the installation of additional capacitors at the dc link can enhance FLs’ immunity level to voltage sag. However it is not recommended to install a large capacitor at the dc bus of the electronic ballast for the purpose of enhancing voltage sag ride through capabilities without incorporating proper inrush current control circuitry.
Acknowledgements This work was carried out with the financial support
from the Universiti Kebangsaan Malaysia under the research grant UKM-GUP-BTT-07-25-151.
References [1] J. Barros, R.I. Diego, Effects of Nonsinusoidal Supply on Voltage
Tolerance of Equipment, IEEE Power Engineering. Review, vol. 22 n. 1, July 2002, pp. 46 – 47.
[2] S. Saksena, B. Shi, G. Karady, Effects of voltage sags on household loads, General Meeting on POWER AND ENERGY SOCIETY - Conversion and Delivery of Electrical Energy in the 21st Century, June 12-16, 2005, USA, pp.2456-2461.
[3] F.J. Díaz, F. J. Azcondo, F. Ortiz, A. Ortiz, M. Mañana, C. Renedo, Effects of voltage sags on different types of ballasts for 150-W HPS lamps, The 9th International Conference on POWER QUALITY AND UTILIZATION, October 9-11, 2007, Barcelona, Spain.
[4] D.S. Dorr, A. Mansoor, A.G. Morinec, J. C. Worley, Effects of Power Line Voltage Variations on Different Types of 400-W High-Pressure Sodium Ballasts, IEEE Transactions On Industry Applications, vol. 33 n. 2, March/April 1997, pp. 472 – 476.
[5] P. Pohjanheimo, M. Lehtonen, Equipment sensitivity to voltage sags – test results for contactors, PCs and gas discharge lamps, The10th International Conference on HARMONICS AND QUALITY OF POWER, October 6 – 9, 2002, Rio de Janeiro, Brazil, pp.559-563.
[6] L.P. Frater, N.R. Watson, Light flicker sensitivity of high efficiency compact fluorescent lamps, AUSTRALASIAN UNIVERSITIES POWER ENGINEERING CONFERENCE (AUPEC 07), December 9 -12. 2007, Perth, Australia.
[7] S. Chen, C.M. Lo, M. K. Foo, K.T. How, Testing of fluorescent lamps for its flickering susceptibility towards interharmonic voltages, The 8th International conference on POWER ENGINEERING, (IPEC 07), December 3 -6, 2007, Singapore, pp. 326-331.
[8] A. Vitanza, R. Scollo, A. Hayes, Electronic Fluorescent Lamp Ballast, STMicroelectronics Application Note AN527/1294, 1999.
[9] N.K. Medora, A. Kusko, M. Thompson, Impact of line voltage sag on switch mode power supply operation, The 3rd IEEE
Conference on INDUSTRIAL ELECTRONICS AND APPLICATIONS, June 3-5, 2008, Singapore, pp. 2178-2183.
[10] J. Fernandez, M. Sebastian, M. Hernando, P. Villegas, J.Garcia, Helpful Hints to Select a Power-Factor-Correction Solution for Low- and Medium-Power Single-Phase Power Supplies, IEEE Transaction on Industrial Electronics, vol. 52 n. 1, February 2005, pp. 46-55.
[11] V.G. Krizhanovski, D.V. Chernov, M.K. Kazimierczuk, Low-Voltage Electronic Ballast Based on Class E Oscillator, IEEE Transactions on Power Electronics, vol. 22 n. 3, May 2007, pp. 863-870.
[12] A.R. Seidel, F.E.Bisogno, T.B. Marchesan, R.Nd. Prado, A Practical Comparison Among High-Power-Factor Electronic Ballasts with Similar Ideas, IEEE Transactions on Industry Applications, vol. 41 n. 6, November/December 2005, pp.1574- 1583.
[13] IEC 61000-4-11, Ed 2, Testing and Measurement Techniques – Voltage Dips, Short Interruptions, and Voltage Variation Immunity Tests, International Electrotechnical Commission, 1994.
Authors’ information
H. Shareef received his BSc with honours from IIT, Bangladesh, MS degree from METU, Turkey, and PhD degree from UTM, Malaysia, in 1999, 2002 and 2007, respectively. His current research interests are power system deregulation, power quality and power system distribution automation. He is currently a senior lecturer at the Department of Electrical, Electronic and Systems Engineering,
Universiti Kebangsaan Malaysia.
A. Mohamed received her B.Sc from University of London in 1978 and M.Sc and Ph.D from Universiti Malaya in 1988 and 1995, respectively. She is a professor at the Department of Electrical, Electronic and Systems Engineering, Universiti Kebangsaan Malaysia. Her main research interests are in power system security, power quality and artificial intelligence. She is a senior member of
IEEE.
N. Marzuki received his B.Sc from University of Malaya in 1998. Since June, 2007, he has been a Masters student at Universiti Teknologi Malaysia. He has been working with SIRIM Berhad for more than eleven years. His current research interest is, power quality and equipment sensitivity.