
Analysis of Performance in a Rotary Compressor
10
Purdue University Purdue e-Pubs International Compressor Engineering Conference School of Mechanical Engineering 1982 Analysis of Performance in a Rotary Compressor H. Wakabayashi J. Yuuda T. Aizawa M. Yamamura Follow this and additional works at: hps://docs.lib.purdue.edu/icec is document has been made available through Purdue e-Pubs, a service of the Purdue University Libraries. Please contact [email protected] for additional information. Complete proceedings may be acquired in print and on CD-ROM directly from the Ray W. Herrick Laboratories at hps://engineering.purdue.edu/ Herrick/Events/orderlit.html Wakabayashi, H.; Yuuda, J.; Aizawa, T.; and Yamamura, M., "Analysis of Performance in a Rotary Compressor" (1982). International Compressor Engineering Conference. Paper 385. hps://docs.lib.purdue.edu/icec/385
-
Upload
khangminh22 -
Category
Documents
-
view
0 -
download
0
Transcript of Analysis of Performance in a Rotary Compressor
Purdue UniversityPurdue e-Pubs
International Compressor Engineering Conference School of Mechanical Engineering
1982
Analysis of Performance in a Rotary CompressorH. Wakabayashi
J. Yuuda
T. Aizawa
M. Yamamura
Follow this and additional works at: https://docs.lib.purdue.edu/icec
This document has been made available through Purdue e-Pubs, a service of the Purdue University Libraries. Please contact [email protected] foradditional information.Complete proceedings may be acquired in print and on CD-ROM directly from the Ray W. Herrick Laboratories at https://engineering.purdue.edu/Herrick/Events/orderlit.html
Wakabayashi, H.; Yuuda, J.; Aizawa, T.; and Yamamura, M., "Analysis of Performance in a Rotary Compressor" (1982). InternationalCompressor Engineering Conference. Paper 385.https://docs.lib.purdue.edu/icec/385
ANALYSIS OF PERFORMANCE IN A ROTARY COMPRESSOR
Hisao Wakabayashi, Engineer, R & D Jiro Yuuda, Chief Engineer, R & D Takeshi Aizawa, Manager, R & D Michie Yamamura, Senior Chief Engineer, Compressor
Matsushita Electric Industrial Co., Ltd. 2275 Noji, Kusatsu City, Shiga, Japan
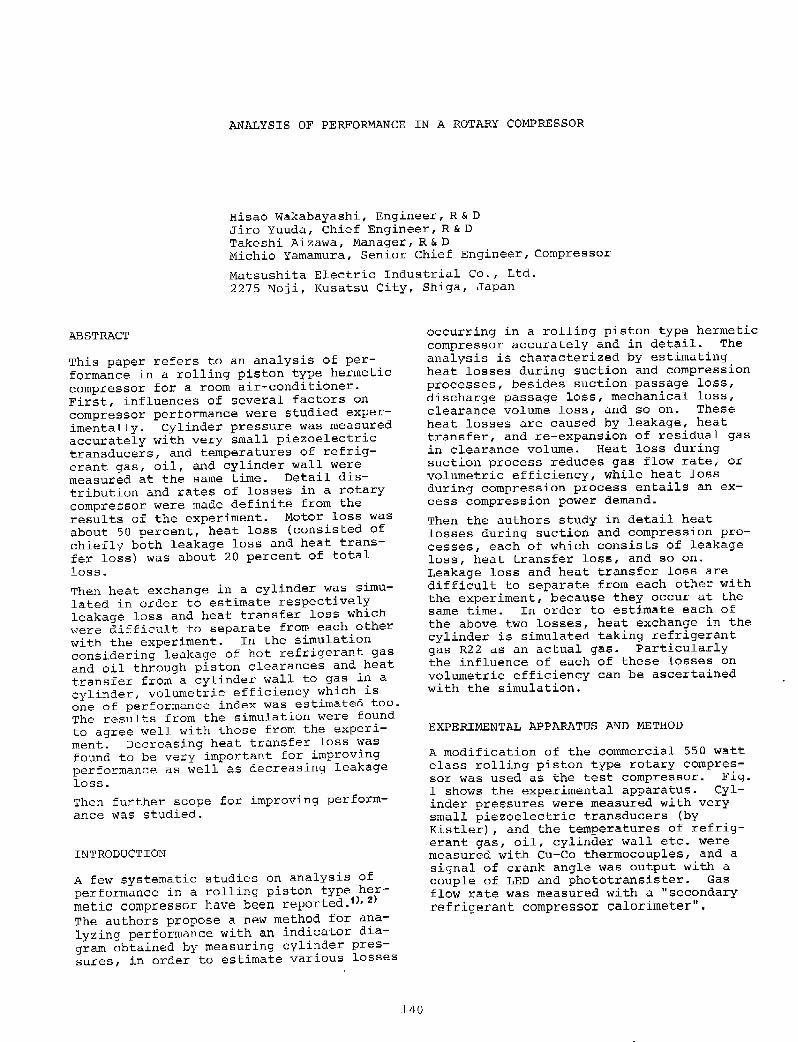
ABSTRACT
This paper refers to an analysis of performance in a rolling piston type hermetic compressor for a room air-conditioner. First, influences of several factors on compressor performance were studied experimentally. Cylinder pressure was measured accurately with very small piezoelectric transducers, and temperatures of refrigerant gas, oil, and cylinder wall were measured at the same time. Detail distribution and rates of losses in a rotary compressor were made definite from the results of the experiment. Motor loss was about 50 percent, heat loss (consisted of chiefly both leakage loss and heat transfer loss) was about 20 percent of total loss.
Then heat exchange in a cylinder was simulated in order to estimate respectively leakage loss and heat transfer loss which vrere diffic-u.l t to separate from each other with the experiment. In the simulation considering leakage of hot refrigerant gas and oil through piston clearances and heat transfer from a cylinder wall to gas in a cylinder, volumetric efficiency which is one of performance index was estimated too. The results from the simulation were found to agree well with those from the experiment. Decreasing heat transfer loss was found to be very important for improving performance as well as decreasing leakage loss.
Then further scope for improving performance was studied.
INTRODUCTION
A few systematic studies on analysis of performance in a rolling piston type hermetic compressor have been reported .1>, l!)
The authors propose a new method for analyzing performance with an indicator diagram obtained by measuring cylinder pressures, in order to estimate various losses
140
occurring in a rolling piston type hermetic compressor accurately and in detail. The analysis is characterized by estimating heat losses during suction and compression processes, besides suction passage loss, discharge passage loss, mechanical loss, clearance volume loss, and so on. These heat losses are caused by leakage, heat transfer, and re-expansion of residual gas in clearance volume. Heat loss during suction process reduces gas flow rate, or volumetric efficiency, while heat loss during compression process entails an excess compression power demand.
Then the authors study in detail heat losses during suction and compression processes, each of which consists of leakage loss, heat transfer loss, and so on. Leakage loss and heat transfer loss are difficult to separate from each other with the experiment, because they occur at the same time. In order to estimate each of the above two losses, heat exchange in the cylinder is simulated taking refrigerant gas R22 as an actual gas. Particularly the influence of each of these losses on volumetric efficiency can be ascertained with the simulation.
EXPERIMENTAL APPARATUS AND METHOD
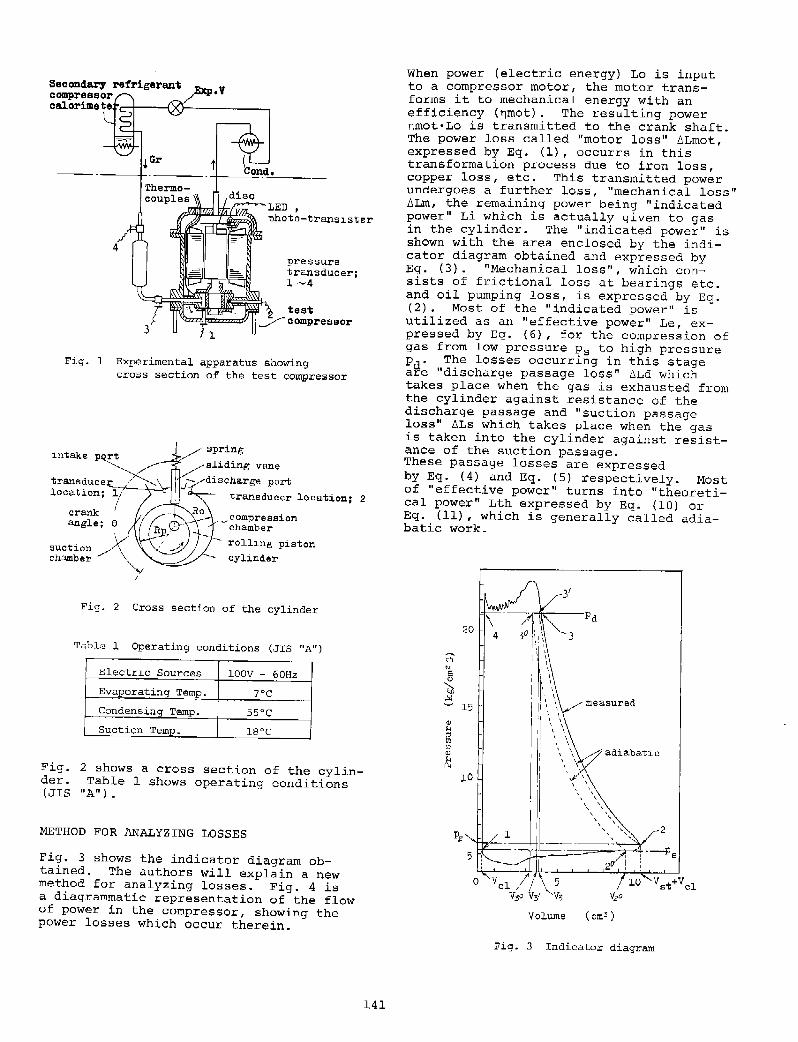
A modification of the commercial 550 watt class rolling piston type rotary compressor was used as the test compressor. Fig. l shows the experimental apparatus. Cylinder pressures were measured with very small piezoelectric transducers (by Kistler) , and the temperatures of refrigerant gas, oil, cylinder wall etc. were measured with Cu-Co thermocouples, and a signal of crank angle was output with a couple of LED and phototransister. Gas flow rate was measured with a "secondary refrigerant compressor calorimeter".
Secondary refrigerant Exp.V compressor ~ calorimete X)-------------,
• photo-transister
pressure transducer; l ~4
test .._:;..---compressor
Fig. 1 Experimental apparatus showing cross section of the test compressor
intake pq_rt
transduce~~ location; 1.1
J~ discharge port
I crank angle; e
suction/,.\ chamber ""
'Y I
transducer ~ocation; 2
__ .compression chamber
roll:~_ng piston
cylinder
Fig. 2 Cross section of the cylinder
Tiible 1 Operating conditions (JIS "A")
Electric Sources lOOV - 60Hz
Evaporating Temp. 7"C
Condensing Temp. SS"C
Suction Temp. 18"C
Fig. 2 shows a cross section of the cylinder. Table 1 shows operating conditions (JIS "A").
METHOD FOR ANALYZING LOSSES
Fig. 3 shows the indicator diagram obtained. The authors will explain a new method for analyzing losses. Fig. 4 is a diagrammatic representation of the flow of power in the compressor, showing the power losses which occur therein.
141
When power (electric energy) La is input to a compressor motor, the motor transforms it to mechanical energy with an efficiency (nmot) . The resulting power nmot•Lo is transmitted to the crank shaft. The power loss called "motor loss" llLmot, expressed by Eq. (1), occurrs in this transformation process due to iron loss, copper loss, etc. This transmitted power undergoes a further loss, "mechanical loss" llLm, the remaining power being "indicated power" Li which is actually given to gas in the cylinder. The "indicated power" is shown with the area enclosed by the indicator diagram obtained and expressed by Eq. (3). "Mechanical loss", which consists of frictional loss at bearings etc. and oil pumping loss, is expressed by Eq. (2). Most of the "indicated power" is utilized as an "effective power" Le, expressed by Eq. (6), for the compression of gas from low pressure Ps to high pressure pd. The losses occurring in this stage are "discharge passage loss" 6Ld which takes place when the gas is exhausted from the cylinder against resistance of the discharge passage and "suction passage loss" llLs which takes place when the gas is taken into the cylinder against resistance of the suction passage. These passage losses are expressed by Eq. (4) and Eq. (5) respectively. Most of "effective power" turns into "theoretical power" Lth expressed by Eq. (10) or Eq. (11) , which is generally called adiabatic work.
3'
pd 20
t; 'e ()
~ I
.l<l ' \
measured ' 15 I
I
' "' ' ' ' ' .. ' ' ::! I \
" ' \
" ' \ adiabatic (!)
' ~ \ ' F4
10
Volume ( cm3 )
Fig. 3 Indicator diagram

(w) (l)
·---
• ..Ji..A 60
(w)
(w)
(w)
(w)
(2)
(3)
(4)
( 5)
(6)
(7)
['.:::::==::::} LILhc= Le- [k~1 -p2-(Vst+Vc1) ·t(:pd/p2 ~ -1}
+(Vst+Vc1) • (p2
-:p8
)
-Vc1·(:pd-Psl}~·A (w) (8)
L1 Lhs= Le-Lth-ALhc-JLc1 ( w) ( 9)
Theoret~ cal power; Lth
(w) (10)
or, === k ~ ~ ~ 106
~k 1 -:p •V • G • (pd/:p ) -1·---·A - s s s s 3b00
where, k; N; A;
G • s' VcJ.'_,
(w) (ll)
adiabatic exponent compressor speed (rpm) coefficient of conversion (=g.8o7~lo-2(w/(kg·cm/s) l adiabatic enthalpy head (kcal/kg) specific volume of suction gas
(m'/kg) measured gas flow rate (kg/h)
J.. Vel· ( pd/p
8)"'
Fig. 4 Flow of power in the compressor
The lo~ses incidental to this change from "effective power" to "theoretical power" are "clearance volume loss" t,Lcl, "heat loss during compression process" t.Lhc and "heat loss during suction process" t.Lhs. The "clearance volume loss" expressed by Eq. (7) is caused by re-expansion of residual high pressure gas in clearance volume. Now, the heat losses during compression and suction processes will be explained below.
142
First, the "theoretical power" expressed by Eq. (10) or Eq. (11) can be diagrammatically represented in Fig. 3. The term of Vs·Gs in Eq. (11) represents actual gas flow rate per hour. Then, actual suction gas volume per rev. of the crank shaft Vs can be expressed as follows:
(12)
Then, actual suction gas volume vs corresponds to cylinder volume v 20 in Fig. 3.
v2
o = Vs +Vel [cm 3] (13)
The adiabatic process can be expressed as " follows:
(14)
If the compression process starting from point 2° is adiabatic, the end of the process will be at point 3°. Cylinder volume v 3 o at point 3° can be calculated by the following Eq. (15) .
(15)
Then, the area enclosed by points 1, 2°, 3° and 4 means "theoretical power". Meanwhile, cylinder pressure in suction chamber changes every moment, and then suction process ends at point 2 and compression process starts at the same 'time. If the compression process starting from point 2 is adiabatic, the end of that process will be at point 3'. Then, cylinder volume v 3 , at point 3' can be calculated by the following Eq. (16).
k k v
3,=V
2•(P
2/Pd) = (Vst+Vcl)•(P
2/Pd) (16)
The measured pressure curve 2 - 3 was above the adiabatic pressure curve 2 - 3' . For, since the pressure and temperature of gas in the cylinder were relatively low in an early stage of compression process, hot gas and oil leaked into the cylinder from high pressure side, and also, heat was transferred to gas in the cylinder from hot surfaces of cylinder wall, rolling piston, etc. Therefore, the excess power corresponding to the area enclosed by points 2, 3' and 3 was consumed during compression process. The authors defined this excess power as "heat loss during compression process" t.Lhc which is expressed by Eq. (8).
The area enclosed by points 2°, 3°, 3~ and 2 was considered to be a loss occurring during suction process up to starting of compression process. The authors considered that the area consisted of "clearance volume loss" and "heat loss during suction process". Then, "heat loss during suction process", caused by leakage
and heat transfer during suction process, is expressed by Eq. (9). This heat loss, as well as "clearance volume loss", reduced volumetric efficiency.
DEFINITION OF EFFICIENCIES
Various efficiencies expressing compressor performance were defined as follows: motor efficiency nmot mechanical efficiency nm = Li/ (flmot •Lo) compression efficiency: nc = Lth/Li compressor efficiency : ncomp = Lth/Lo
= nmot·nm·nc
RESULTS OF THE ANALYSIS
(17)
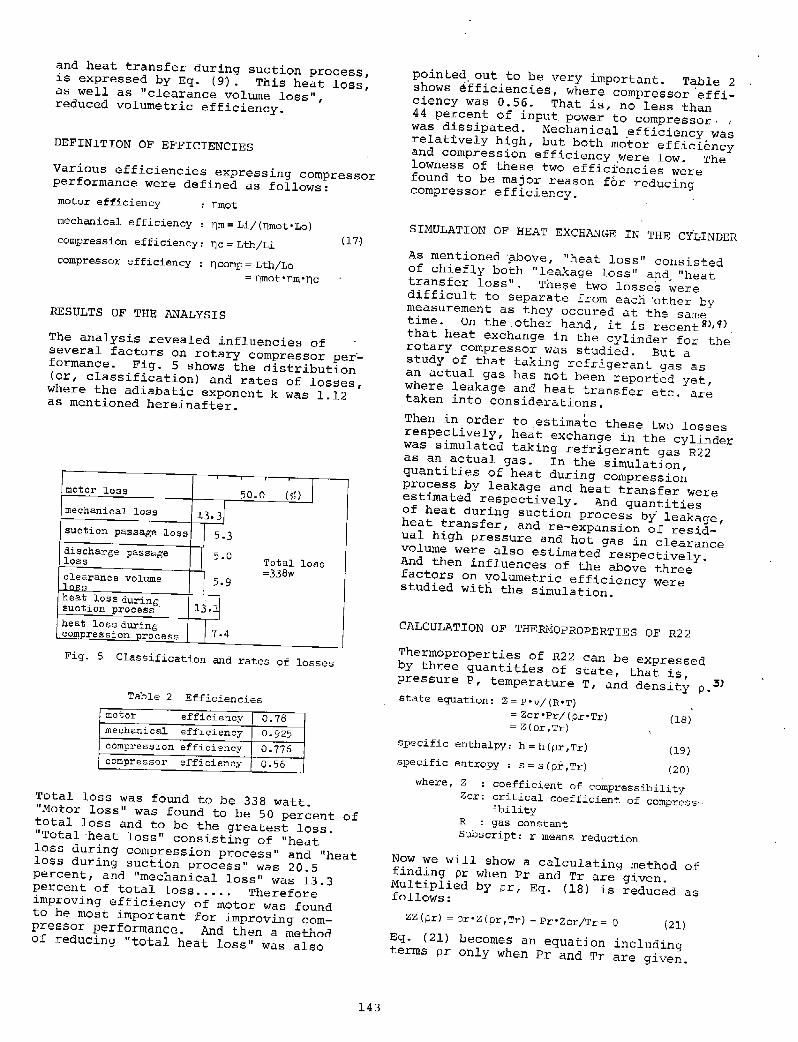
The analysis revealed influencies of several factors on rotary compressor per~ formance. Fig. 5 shows the distribution (or, classification) and rates of losses, where the adiabatic exponent k was 1.12 as mentioned hereinafter.
motor loss 50.0 (70 J mechanical loss 13.31 suction passage J.oss 5.3 discharge passage 5-0 Total loss loss
=338w clearance volume 5-9 _!nss heat loss during suction process · lJ.~ heat loss during J 7-4 compression process
Fig. 5 Classification and rates of losses
Table 2 Efficiencies motor efficiency 0.78 mechanical efficiency 0.925 compressJ.on efficiency 0.776 compressor efficiency 0.56
Total loss was found to be 338 watt. "Motor loss" was found to be SO percent of total loss and to be the greatest loss. "Total heat loss" consisting of "heat loss during compression process" and "heat loss during suction process" was 20.5 percent, and "mechanical loss" was 13.3 percent of total loss .•... Therefore improving efficiency of motor was found to be most important for improving compressor performance. And then a method of reducing "total heat loss" was also
143
pointed out to be very important. Table 2 shows ~fficiencies, where compressor ·efficiency was 0.56. That is, no less than 44 percent of input power to compressor· , was dissipated. Mechanical .efficiency was relatively high, but both motor efficiency and compression efficiency .were low. The lowness of these two efficiencies were found to be major reason for reducing compressor efficiency.
SIMULATION OF HEAT EXCHANGE IN THE CYLINDER A~ mentioned ftbove, "heat loss" consisted of chiefly both "leakage loss" and, "heat transfer loss". These two losse~ were difficult to separate from each ·other by measurement as they occured at the same time. On the .other hand, it is recentSl,'l) that heat exchange in the cylinder for the rotary compressor was studied. But a study of that taking refrigerant gas as an actual gas has not been reported yet, where leakage and heat transfer etc. are taken into considerations. Then in order to estimate these two losses respectively, heat exchange in the cylinder was simulated taking refrigerant gas R22 as an actual gas. In the simulation, quantities of heat during compression process by leakage and heat transfer were estimated respectively. And quantities of heat during suction process by leakage, heat transfer, and re-expansion of residual high pressure and hot gas in clearance volume were also estimated respectively. And then influences of the above three factors on volumetric efficiency were studied with the simulation.
CALCULATION OF THERMOPROPERTIES OF R22
Thermoproperties of R22 can be expressed by three quantities of state, that is, pressure P, temperature T, and density p.3J state equation: Z= P•v/(R•T)
= Zcr •Prj (pr•Tr) = z (pr ,Tr)
specific enthalpy: h =- h (pr,Tr) specific entropy : s-= s (pr ,Tr)
(18)
(19)
(20) where, Z coefficient of compressibility
Zcr: critical coefficient of compressibility
R gas constant Subscript: r means reduction
Now we will show a calculating method of finding pr when Pr and Tr are given. Multiplied by pr, Eq. (18) is reduced as follows:
zz (prJ = pr-Z (pr ,Tr) - Pr•Zcr/Tr = 0 (21) Eq. (21) becomes an equation including terms pr only when Pr and Tr are given.
Then we solved Eq. (21) by Newton-Raphson
Method and found only one root of.pr.
Adiabatic exponent; k changes with pressure
and temperature in general. Then adiabatic
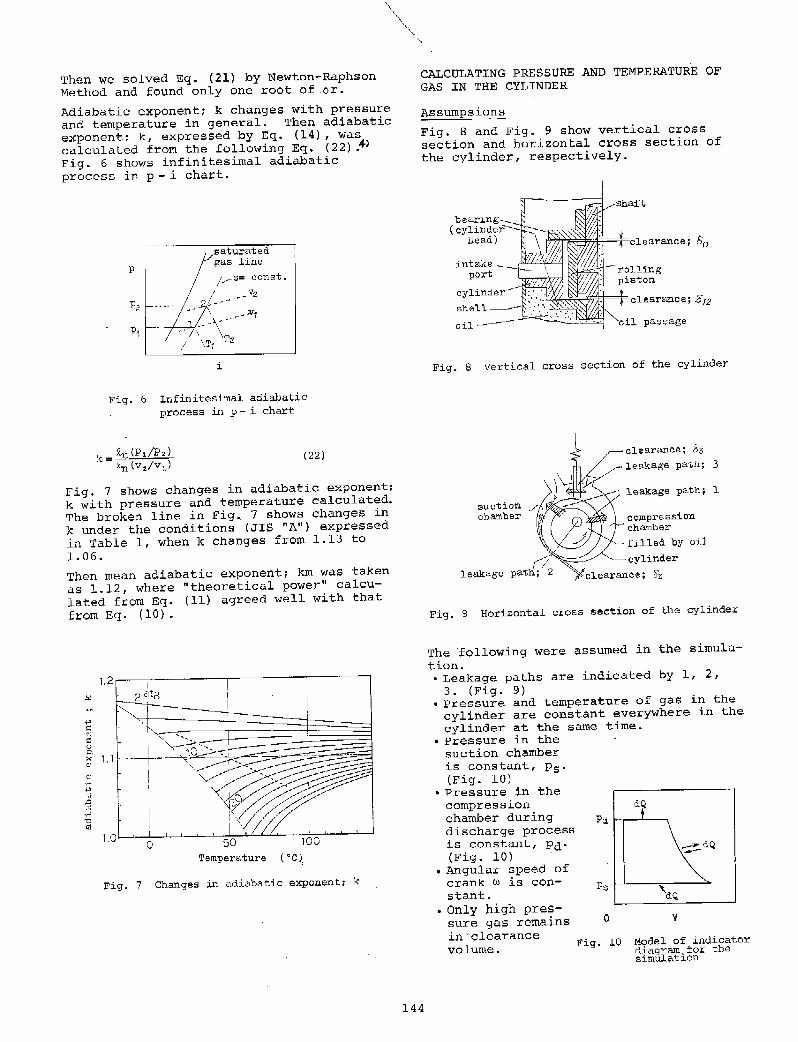
exponent: k, expressed by Eq. (14), was calculated from the following Eq. (22) .-f> Fig. 6 shows infinitesimal adiabatic process in p- i chart.
p
saturated gas line
vs= canst .
. -"-- v2
i
Fig. 6 Infinitesimal adiabatic
process in p- i chart
(22)
rig. 7 shows changes in adiabatic exponent;
k with pressure and temperature calculated.
The broken line in Fig. 7 shows changes in
k under the conditions (JIS "A") expressed
in Table l, when k changes from 1.13 to
l. 06.
Then mean adiabatic exponent; km was taken
as 1.12, where "theoretical power" calcu
lated from Eq. (11) agreed well with that
from Eq. (10).
1,2
~
,~
,:: Q)
,:: 0
"" >< 1.1 Q)
C) .,.. +j .0 :'l ·rl '1:! Cll
1.0 0 50 100
Temperature ("Cl
Fig. 7 Changes in adiabatic exponent; k
144
CALCULATING PRESSURE AND TEMPERATURE OF GAS IN THE CYLINDER
Assumpsions
Fig. 8 and Fig. 9 show vertical cross
section and horizontal cross section of the cylinder, respectively.
oil passage
Fig. 8 Vertical cross section of the cylinder
suction chamber
clearance; 83 ·leakage path; 3
- leakage path; 1
compression chamber
filled by oil
~cylinder
Fig. 9 Horizontal cross section of the cylinder
The following were assumed in the simula
tion. o Leakage paths are indicated by l, 2,
3. (Fig. 9) o Pressure and temperature of gas in the
cylinder are constant everywhere in the cylinder at the same time.
o Pressure in the suction chamber is constant, Ps· (Fig. 10)
o Pressure in the compression chamber during discharge process is constant, Pd· (Fig. 10) .
o Angular speed of crank w is constant.
o Only high pres-
Ps
sure gas remains 0 in'clearance volume. Fig. 10
dQ
"'dQ
v
Model of indicator diagram for the simulation
• surface temperatures of the cylinder wall and rolling piston are constant everywhere and always.
Equations
Calculating method for pressure and temperature of gas in the cylinder during compression process are mentioned below. Eq. of ADAIR et alS~as applied to heat transfer from surfaces of the cylinder wall, rolling piston, etc. in the simulation, because any sui table equations 6l, '1} of heat transfer in the cylinder for a rotary compressor was not found.
Nuc(8) == 0.053•Rec(8) 0"8 •Prc(8) 0
•6
ctc(8) =Nuc(8J•A.c(8)/Dec(8)
where, Nuc(8): Nusselt Number Rec(8): Reynolds Number Dec(8): equivalent diameter
A.c(8): thermal conductivity ctc(8): heat transfer coefficient
(23)
(24)
Heat transfer coefficient ac(S) was calculated by Eq. (24). Then quantity of heat dQch(S) by heat transfer during infinitesimal time was expressed as follows:
dQch(8) = ctc(8) •Fc(8) •{Tcw-Tc(8) }•d8/w where, Fc(8): area of cylinder surface
Tcw: temperature of cylinder
(25)
Meanwhile it was considered that oil solved by refrigerant gas flew radially through leakage path 1, and refrigerant gas flew through leakage paths 2 and 3 (Fig. 8, Fig. 9). Then leakage flow during infinitesimal time was expressed as follows: Path l;
{ '1). 10) dWcl(8) = (o 3+0 3 ) • lf• Pd-Pc( 8)} ._?lf-8•d8/W (26) · ll 12 6•£n(Rp/Rpi)·~l 21f
where, ~1: viscosity of oil
r7hen X g represents a solubility of gas in leaked oil, oil leakage flow and gas leakage flow were expressed as follows: oil leakage flow; dGcl1 (8) = p •dWcl (8) • (1-Xg) gas leakage flow; dGcgl (8) = p •dWcl (8) •Xg
Path 2; dGcg2 (8) = c2 •A2 (8) •yc (8) •we (8) •d8/w (27) Path 3; dGcg3 (8) = c3 A3 (8) •yc (8) •we (8) •d8/w (28)
where, p density of oil solved by refrigerant gas
Yc(8): density of gas in the compression chamber
wc(9l: velocity of gas through leakage paths 2, 3
c2,c3: coefficient of flow A2C8l,A3(8): leakage path area
145
Temperature of leaked gas after expansion Tcg was calculated when the leaked gas was assumed to expand adiabatically to cylinder pressure at that time. Quantity of heat dQcl(8) by leakage given to gas in the cylinder was expressed by the sum of dQcll (8) and dQclg(8), when dQcll(8) and dQclg (8) represent quantities of heat, of leaked oil only and leaked gas only respectively.
dQcll(8) = dGcll (8) •Cl•{Tl-Tc(8)} dQclg (8) = {dGcg2 ( 8) +dGcg3 ( 8)} •Cpc (8) • {Tcg-Tc (8)}
dQcl(8) = dQcl1(8)+dQclg(8)
where, Cl: specific heat of oil Tl: temperature of oil
(29)
Cpc(8): specific heat of gas in the compression chamber
Consequently total quantity of heat dQc(6) was expressed as follows:
dQc(8) = dQch (8) + dQcl (8)
Then a specific entropy of gas in the cylinder after infinitesimal time was expressed as follows:
sc(8+d8) = sc(8)+dsc(8)
(30)
= sc (8) +dQc (8) /{ (Gc (8) •Tc (8)} (31) Density of gas in the cylinder after infinitesimal time was expressed as follows:
pc(8+d8) = {Gc(8)+dGc(0)}/Vc(8+d8) (32) where, dGc (8) = dGcn (8) -dGcg2 (8) -dGcg3 (8)
Then temperature of gas in the cylinder Tc(8+d8) was calculated by substituting both Eq. (31) and Eq. (32) to Eq. (20). And then pressure of gas in the cylinder Pc(8+d8) was calculated from the state equation Eq. (18).
Thus instantaneous pressure and temperature of gas in the cylinder were calculated. Changes in pressure and temperature of gas in the suction chamber was also calculated as similarly above. And then volumetric efficiency was calculated as follows:
volumetric efficiency; nv"' Gact/Gth ( 33) where, Gth: theoretical gas flow rate
=Vst•60•N•l0- 6/vs [kg/h] Gact: actual gas flow rate estimated
by the simulation [kg/hl
RESULTS OF THE SIMULATION
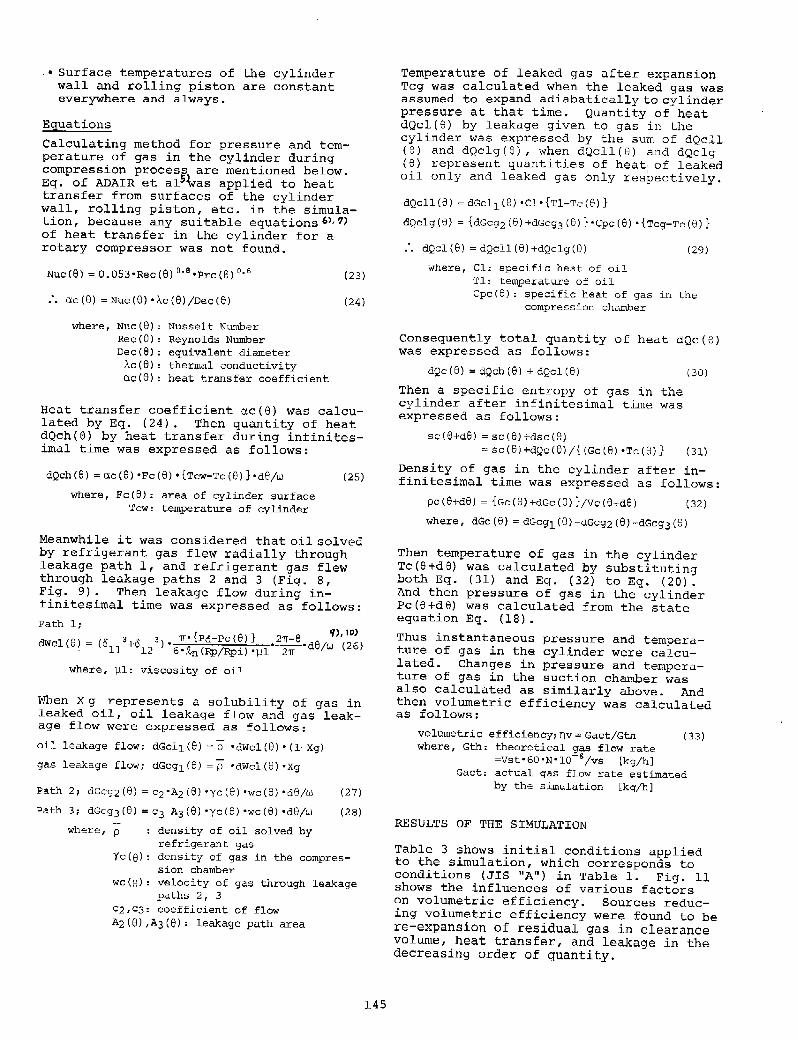
Table 3 shows initial conditions applied to the simulation, which corresponds to conditions (JIS "A") in Table 1. Fig. 11 shows the influences of various factors on volumetric efficiency. Sources reducing volumetric efficiency were found to be re-expansion of residual gas in clearance volume, heat transfer, and leakage in the decreasing order of quantity.
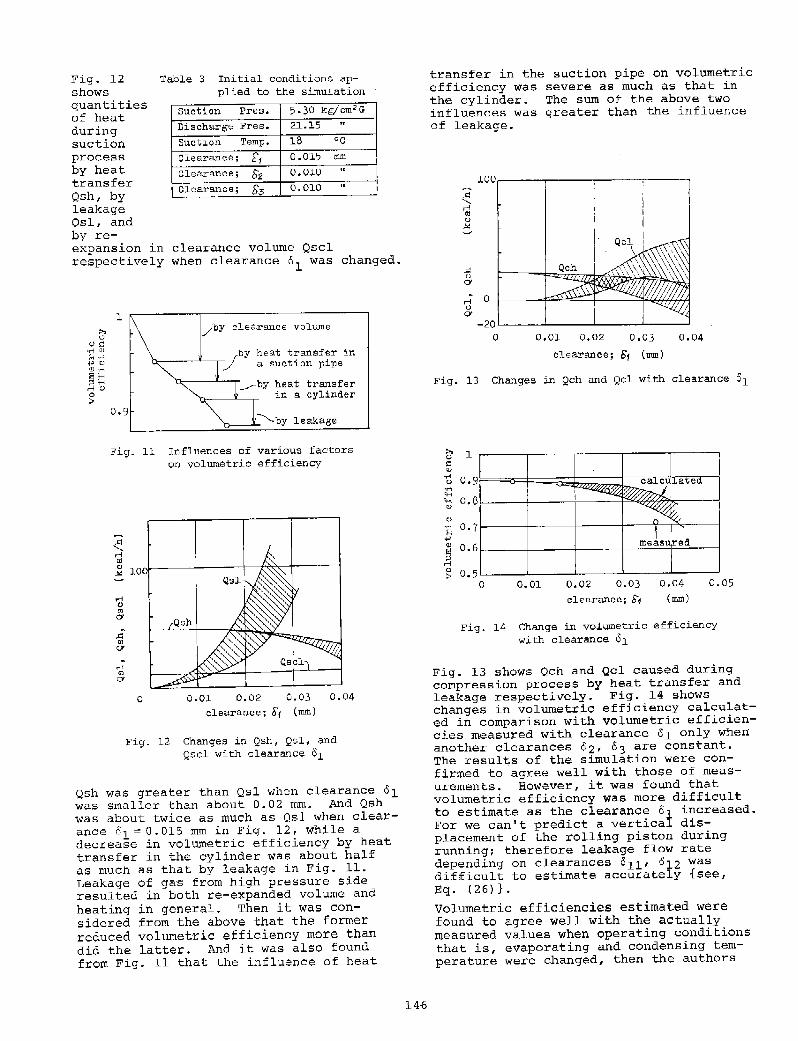
Fig. 12 shows quantities of heat during suction process by heat transfer Qsh, by leakage Qsl, and by re-
Table 3 Initial conditions applied to the simulation
Suction Pres. 5.30 kg/cm 2 G
Discharge Pres. 21.15 .. Suction Temp. 18 oc Clearance; b1 0.015 = Clearance; S2 0.010 .. Clearance; So 0.010 ..
expansion in clearance volume Qscl respectively when clearance o1
was changed.
1
0.9
Fig. ll
0
~by clearance volume
_ /by heat transfer in / a suction pipe
transfer a cylinder
-..,___by leakage
Influences of various factors on volumetric efficiency
0-01 0.02 clearance; [;f
0.03
<=l
Fig. 12 Changes in Qsh, Qsl, and Qscl with clearance 61
Qsh was greater than Qsl when clearance 61 was smaller than about 0.02 mm. And Qsh was about twice as much as Q.sl when clearance 61 == 0.015 mm in Fig. 12, while a decrease in volumetric efficiency by heat transfer in the cylinder was about half as much as that by leakage in Fig. 11. Leakage of ga·s from high pressure side resulted in both re-expanded volume and heating in general. Then it was considered from the above that the former reduced volumetric efficiency more than did the latter. And it was also found from Fig. 11 that the influence of heat
14-6
transfer in the suction pipe on volumetric efficiency was severe as much as that in the cylinder. The sum of the above two influences was greater than the influence of leakage.
100,-----,------,------.------,
;;:: ()
CY
rl 0 ()
CY
-20 0 0.01 0.02 0.03 0.04
clearance; 61 (=)
Fig. 13 Changes in Qch and Qcl with clearance 61
l
()
·~ 0-7~-----+------~------+----~~~~--~ .., j 0 :> 0.5L-----~----~----~----~----~
0 0.01 0.02 0.03
clearance; fi1
0.04 (mm)
0.05
Fig. 14 Change in volumetric efficiency with clearance 61
Fig. 13 shows Qch and Qcl caused during compression process by heat transfer and leakage respectively. Fig. 14 shows changes in volumetric efficiency calculated in comparison with volumetric efficiencies measured with clearance 61 only when another clearances 02, 63 are constant. The results of the simulation were confirmed to agree well with those of measurements. However, it was found that volumetric efficiency was more difficult to estimate as the clearance o1 increased. For we can't predict a vertical displacement of the rolling piston during running; therefore leakage flow rate depending on clearances 611, 612 was difficult to estimate accurately {see, Eq. (26)}.
Volumetric efficiencies estimated were found to agree well with the actually measured values when operating conditions that is, evaporating and condensing temperature were changed, then the authors
could verify the simulation.
CONCLUSIONS
• Classification and rates of losses for a rolling piston type hermetic compressor were revealed with the new method for analyzing losses.
• Quantities of heat by heat transfer and leakage were estimated respectively with the simulation, where the former was about twice as much as the latter when clearance o1 = 0.015 mm.
• The reduction of heat transfer as well as leakage must be studied more frequently for improving performance.
STUDY OF A SCOPE FOR IMPROVING PERFORMANCE
The following points for improving performance were studied experimentally using results of the analysis and simulation; suction passage including suction pipe, discharge passage, clearances in leakage paths, and compressor cooling.
Reducing clearance volume contributed greatly to improving performance. Reducing the clearance o1 between cylinder head and rolling piston end contributed a little to improving performance even if the clearance changes smaller than 0. 01- 0. 02 mm. Reducing temperature of the cylinder by oil-cooling was found to contribute greatly to improving performance. For example, reducing temperature of a cylinder by as much as l0°C improved Energy Efficiency Ratio (E.E.R) by as much as 4 percent. The above effect was caused by a decrease of heat loss.
Now we can offer a high-efficiency rotary compressor, E.E.R of which is 2.24 [Kcal/ h•w) corresponding to 10.3 [BTU/h·w) of operating conditions (ASHRAE "T"), by the above efforts and by improving performance of motor.
ACKNOWLEDGEMENT
The autors thank Prof. K. IMAICHI at OSAKA Univ. and Prof. T. SHIMIZU at SHIZUOKA Univ. for their useful advices.
NOMENCLATURE
8 : crank angle P, P(8): cylinder pressure [kgjcm2 G) V, V(8): cylinder volume [cm 3 ]
Vst cylinder stroke volume [cm 3 ] Vel clearance volume [cm 3 ]
Ps suction pressure [kg/cm 2 G] Pd discharge pressure [kg/cm 2 G] vs specific volume of suction gas
[m 3 /kg]
147
Rc cylinder radius [em] Rp outer radius of a rolling piston [em) Rpi inner radius of a rolling piston [em] La power input to a compressor [w] k adiabatic exponent (=1.12) w angular speed of crank [1/sec] Li indicated power [w) Le effective power [w] Lth theoretical power [w) 6Lmot: motor loss [w] 6Lm mechanical loss [w] 6Ld : discharge passage loss [w] 6Ls : suction passage loss [w] 6Lcl: clearance volume loss [w) 6Lhs: heat loss in suction process [w) 6Lhc: heat loss in compression process [w] Gs measured gas flow rate [kg/h) Olr 02, 03: clearance in leakage path 1,
2, and 3 respectively dG leaked gas or oil flow in infini
tesimal time [kg] dQ quantity of heat exchanged in in
finitesimal time [kcal] Q quantity of heat exchaned per hour
[kcal/h]
Subscripts
c : compression s : suction cr: critical state r reduced (e.g. Tr = T/Tcr, Pr = P /Per, ... ) g gas 1 oil, or leakage h heat transfer cl: clearance volume
REFERENCES
1) I. Chu et al: "Analysis of the rolling piston type rotary compressor", '78 Purdue Camp. Tech. Conf.
2) T. Shimizu: "Volumetric efficiency for rotary compressors", Rei to vol. 50.
3) J.A.R: "Thermoproperties of R22" 4) A. Shutz: "Real adiabatic expornent of
different refrigerants", Sulzer Tech. Review 1976-4.
5) R.P. Adair et al: "Instantaneous heat transfer to the cylinder wall in reciprocating compressors", '72 Purdue Comp. Tech. Conf.
6) R. Prakash et al: "Mathematical modeling and simulation of refrigerating compressors", '74 Purdue Camp. Tech. Conf.
7) s.w. Broek et al: "Modeling of cylir,der heat transfer large effort, little effect ?", '80 Purdue Camp. Tech. Conf.
8) H. Ikura: "Analysis of performance by heat balance for rotary compressors", JSME No. 793-5 (1979).
9) S. Aburaya: "A study of simulation model for rotary compressors", JSME No. 803-5 (1980).
10) N. Soda: "Bearings"
ROLLING PISTON TYPE ROTARY COMPRESSOR
PERFORMANCE ANALYSIS
Takashi Matsuzaka Shigemi Nagatomo
Toshiba Major Appliance Products Engineering Laboratory, Kawasaki City, Japan
ABSTRACT
Analyses of loss factors which affect the rolling piston type rotary compressor efficiency have been theoretically and experimentally performed. Especially, it has been clarified that discharge port shape affects over-compression loss and re-expansion loss, and that mechanical loss can be significantly reduced by selecting the most suitable basic compressor dimensions.
Maximum compressor efficiency has been theoretically and experimentally evaluated, and it has been clarified that the efficience will be 74% on the basis of the recent highest engineering level regarding compressor design and manufacturing. A highly-efficient compressor was produced base on the experiments, and has been tested. Compressor efficiency was 72.4%, comprising volumetric efficiency of 93%, compression efficiency of 94.8%, mechanical efficiency of 93.3% and motor efficiency of 88%.
INTRODUCTION
The features of the rolling piston type rotary compressor are high efficiency, low noise, high reliability, light weight, small-sized formation and others. Therefore, this type of compressor has been widely utilized for domestic air conditioners and refrigerating units recently, and this type of compressor satisfies the requirements of energy saving and conservation of resources which are present severe requirements.
some research results have already been reported regarding this compressor (1) (2) (3) (4) (5), but synthetic performance research from the viewpoint of maximum compressor efficiency has not yet been
performed. The main objectives of this paper are as follows. 1. Primary loss factors will be recognized, and will be theoretically and quantitatively clarified. 2. The value of maximum compressor efficiency will be deduced on the basis of the present highest compressor design engineering. 3. A highly-efficient compressor will be produced by way of experiment, and will be tested. The 3/4 horsepower, rolling piston type, high-pressure type rotary compressor was utilized for this research. Experiments were performed at 2,900 rpm and 3,500 rpm, but the maximum compressor efficiency is discussed based only on 2,900 rpm.
149
In this paper, the rolling piston type rotary compressor construction and features are explained, and thereafter, it is theoretically and experimentally shown that the optimum discharge port shape corresponds to maximum compressor efficiency, and that mechanical lo•s depends closely on the basic dimensions of the compressor components. Furthermore, the theoretical compressor efficiency and experimental performance of the highly-efficient compressor presently under trial production are shown.
DESCRIPTION OF THE ROTARY COMPRESSOR
1. Construction Features
The basic construction of the rotary compressor is shown in Fig. 1. The hermetic type rotary compressor, with the compression mechanism and the motor housed in the same shell, is widely utilized. The compression mechanism, with the cylinder in the center, is placed in the lower section, and a two-pole induction motor which drives the mechanism is placed in the upper