Analysis of particles size distributions in Mg(OH)2 precipitation ...
24
1 Analysis of particles size distributions in Mg(OH) 2 precipitation from highly concentrated MgCl 2 solutions G. Battaglia 1 , S. Romano 1 , A. Raponi 2 , D. Marchisio 2 , M. Ciofalo 1 , A. Tamburini 1 , A. Cipollina 1* , G. Micale 1 1 Università degli studi di Palermo, Dipartimento di Ingegneria, Viale delle Scienze, 90128 Palermo 2 Department of Applied Science and Technology, Institute of Chemical Engineering, Politecnico di Torino, Torino, 10129, Italy * corresponding author: [email protected] Abstract Magnesium is a raw material of great importance, which attracted increasing interest in the last years. A promising route is to recover magnesium in the form of Magnesium Hydroxide via precipitation from highly concentrated Mg 2+ resources, e.g. industrial or natural brines and bitterns. Several production methods and characterization procedures have been presented in the literature reporting a broad variety of Mg(OH) 2 particle sizes. In the present work, a detailed experimental investigation is aiming to shed light on the characteristics of produced Mg(OH) 2 particles and their dependence upon the reacting conditions. To this purpose, two T-shaped mixers were employed to tune and control the degree of homogenization of reactants. Particles were analysed by laser static light scattering with and without an anti-agglomerant treatment based on ultrasounds and addition of a dispersant. Zeta potential measurements were also carried out to further assess Mg(OH) 2 suspension stability. Keywords Magnesium hydroxide; nanoparticles; mixing; precipitation; reactive crystallization; mineral recovery. This is a pre-print version of the paper: Analysis of particles size distributions in Mg(OH) 2 precipitation from highly concentrated MgCl 2 solutions. Submitted for publication to the Powder Technology.
-
Upload
khangminh22 -
Category
Documents
-
view
2 -
download
0
Transcript of Analysis of particles size distributions in Mg(OH)2 precipitation ...
1
Analysis of particles size distributions in Mg(OH)2 precipitation from
highly concentrated MgCl2 solutions
G. Battaglia1, S. Romano1, A. Raponi2, D. Marchisio2, M. Ciofalo1, A. Tamburini1, A.
Cipollina1*, G. Micale1
1Università degli studi di Palermo, Dipartimento di Ingegneria, Viale delle Scienze, 90128
Palermo
2Department of Applied Science and Technology, Institute of Chemical Engineering, Politecnico
di Torino, Torino, 10129, Italy
* corresponding author: [email protected]
Abstract
Magnesium is a raw material of great importance, which attracted increasing interest in the last
years. A promising route is to recover magnesium in the form of Magnesium Hydroxide via
precipitation from highly concentrated Mg2+ resources, e.g. industrial or natural brines and
bitterns. Several production methods and characterization procedures have been presented in
the literature reporting a broad variety of Mg(OH)2 particle sizes. In the present work, a detailed
experimental investigation is aiming to shed light on the characteristics of produced Mg(OH)2
particles and their dependence upon the reacting conditions. To this purpose, two T-shaped
mixers were employed to tune and control the degree of homogenization of reactants. Particles
were analysed by laser static light scattering with and without an anti-agglomerant treatment
based on ultrasounds and addition of a dispersant. Zeta potential measurements were also
carried out to further assess Mg(OH)2 suspension stability.
Keywords
Magnesium hydroxide; nanoparticles; mixing; precipitation; reactive crystallization; mineral
recovery.
This is a pre-print version of the paper: Analysis of particles size distributions in
Mg(OH)2 precipitation from highly concentrated MgCl2 solutions. Submitted for
publication to the Powder Technology.
2
1. Introduction
The growing energy, water and raw materials demand is the challenge that humankind is
facing every day. In the novel and promising concept of circular economy, what has always
been a waste becomes a valuable resource to be re-used and valorised.
Since ancient times, table salt has been harvested from the sea through saltworks. The
process leads also to highly concentrated mineral solutions (bitterns), free of calcium, as a by-
product. Bitterns represent a treasure chest of some crucial elements, e.g. magnesium (Mg),
lithium (Li) and other trace elements (TE) [1].
Magnesium concentration is typically of 1.1 to 1.7 g/L in seawater and it can reach a value
up to 60 g/L in bitterns. The magnesium market has risen sharply in recent years and is foreseen
to considerably grow in the future [2]. Magnesium has also been listed among the 30 Critical
Raw Materials for the European Union, due to the geographical distribution of its producers,
which are mainly located in the USA, China and Russia [3].
Magnesium is widely employed in the form of magnesium hydroxide (Mg(OH)2) and
magnesium oxide (MgO). Mg(OH)2 and MgO belong to a group of compounds with large
numbers of favourable properties and possible practical applications [4]. Magnesium
hydroxide is used as a flame-retardant filler in composite materials as it undergoes endothermic
dehydration at high temperature, as an acidic waste neutralizer, as a pharmaceutical excipient,
as a preservative in the pulp and paper industry, as a fertiliser additive, as a component in
ethanol chemical sensors and as the most important precursor for the preparation of magnesium
oxide, which is largely employed as a catalyst [4,5]. Mg(OH)2 nanostructures have been
obtained through several methods e.g. by microwave or ultrasonic/hydrothermal treatment
[6,7], precipitation [1,8–12], precipitation with the aid of assistant additives [13], micro-
emulsion method [14], bubbling set-up [15], hydrothermal process [16] and by means of a
novel ionic exchange membrane crystallizer [17,18].
The recovery of magnesium from highly concentrated solutions represents a complex task.
Turek et al. [11] successfully treated hard coal mine brine, which contained 2.84 g/L of
magnesium, by extracting magnesium hydroxide through reactive precipitation. Cipollina et al.
[1] produced high purity magnesium hydroxide from real bitterns collected from the saltworks
operating in the district of Trapani (Italy). Yousefi et al. [10] synthetized magnesium hydroxide
using poly(ethylene glycol, PEG 4000) as a surfactant; they applied a chemical precipitation
method to an impure brine of the Khur Potash Complex’s evaporation ponds (Isfahan, Iran).
Vassallo et al. [19] presented a novel pilot plant for the selective recovery and removal of
3
magnesium and calcium from retentate brines of a nanofiltration unit processing spent brines
from the industrial water production plant of Evides Industriewater B.V. More than 90% of
magnesium ions contained in the treated brine were recovered with magnesium hydroxide
purities above 90%.
The above-cited authors investigated some effects of operating conditions on the final
magnesium hydroxide features, such as sedimentation times or solids purity. However, the
authors did not study the interaction between mixing and precipitation (or reactive
crystallization) occurring during the whole process, which, in fact, significantly affect the
characteristics of the produced particles.
The reactive crystallisation process of Mg(OH)2 is a complex mix of phenomena, involving
mixing at all scales, including at the molecular scale (i.e. micro-mixing), chemical reaction and
homogeneous and heterogeneous nucleation, molecular growth, aggregation and
agglomeration. As mentioned, in the case of very fast crystallization kinetics, mixing has a
crucial role in the control of the final produced particle characteristics and notable the size
distribution. Magnesium hydroxide production from a highly concentrated solution represents
an example of an extremely fast crystallization process. Many studies dealt with the
characterization of the crystallization kinetics of Mg(OH)2 [20–24]. Different experimental
apparatuses were used, e.g. T-mixers [20] or stirred reactors [21,22]; the induction time (the
period of time that elapses between the moment when supersaturated solutions are formed and
the moment when precipitate appears) was found to be at most of the order of few seconds even
when the magnesium concentration was as low as ~0.03 g/L [22].
Only a few works addressed the effect of mixing on the magnesium hydroxide
precipitation processes from concentrated solutions. Shirure et al. [25] investigated the
precipitation of magnesium hydroxide from magnesium chloride solutions (up to 24 g/L) using
narrow channels T and Y- shaped mixers. The authors reported that at higher reactant flow
rates, smaller Mg(OH)2 particles were produced. The surfactant Tween 20 was added to the
Mg(OH)2 suspensions before particle size distributions (PSDs) measurements and the volume-
average particle size was found to be from 5 μm to 30 μm. Song et al. [26] synthetized
magnesium hydroxide particles with high purity by using MgCl2 solutions (~40 g/L) and NaCl
solution as assistant additive, in a glass reactor under vigorous stirring. In this case, PSDs were
measured by static light scattering granulometry analysis without using surfactants and
particles of the order of micrometres were reported. In addition, significant
aggregate/agglomerates were observed by SEM images. Tai et al. [27] studied the precipitation
4
of magnesium hydroxide nanoparticles from highly concentrated magnesium chloride
solutions (up to 20 g/L) using a spinning disk reactor. The spinning disk reactor allowed a very
good degree of mixing (a mixing time below 1 ms) leading to the synthesis of lamellar
magnesium hydroxide particles of 50-80 nm length and 10 nm in thickness. In this case, the
authors used a sonicator and poly(acrylic acid, sodium salt) (PAA) and sodium
hexametaphosphate as dispersants. Particles were measured using a dynamic light scattering
technology yielding number-average particle size from 40.0 to 47.5 nm. Shen et al [28]
developed a novel impinging stream-rotating packed bed reactor. In order to determine the
particle size and distribution, the prepared samples were dispersed in distilled water by
sonication for 10 min using a 2% sodium hexametaphosphate solution as a dispersant. Wide
size distributions were found at low liquid flow rates and rotating packed bed speed, while
PSDs narrowed when the liquid flow rates and the rotating packed bed speed increased (e.g.
the increase of the fluid flow rate of a Mg2+ 18 g/L solution yielded a decrease of the volume-
average size from 104 to 58.4 nm when the rotating packed bed velocity was 800 rpm).
The broad dispersed Mg(OH)2 particle dimensions reported in the above-cited works mark
the need for a deeper insight into the phenomena taking place during Mg(OH)2 precipitation,
including the un-doubtful interaction between precipitation and mixing, the effect of
ultrasounds and/or dispersant addition. To this aim, a comprehensive experimental study is
here presented on the interaction between reactants mixing and Mg(OH)2 precipitation from
highly concentrated synthetic MgCl2 solutions (Mg2+ 24 g/L). Two circular cross-sectional T-
shaped mixers, having a diameter of 2 mm or 3 mm, were employed to tune and control the
degree of reactants homogenization. PSDs were accessed using static light scattering technique,
with and without ultrasounds treatment and addition of PAA as a dispersant. Also zeta potential
measurements were conducted at different pH values in order to better investigate the tendency
of particles to agglomerate.
To describe the state of particle assemblage, unfortunately, a broad disagreement is
observed among different authors and sources on the definition of terms “agglomerates” and
“aggregates” [29]. In the present paper the following definitions will be used:
• primary particles are single crystals or crystals composed of crystallites (or grain);
• aggregates are made of primary particles, which are united by strong chemical bonds
that cannot be broken by fluid shear stresses and sonication;
• agglomerates are made of more or less loose arrangements of primary particles,
aggregates or a mixture of the two held together by crystalline bridges or sometimes
5
by electrostatic forces. Agglomerates are weaker than aggregates and can be separated
by physical treatment such as sonication.
2. Materials and methods
2.1 Reactive crystallization stage
2.1.1 Experimental set up and Mg(OH)2 reaction
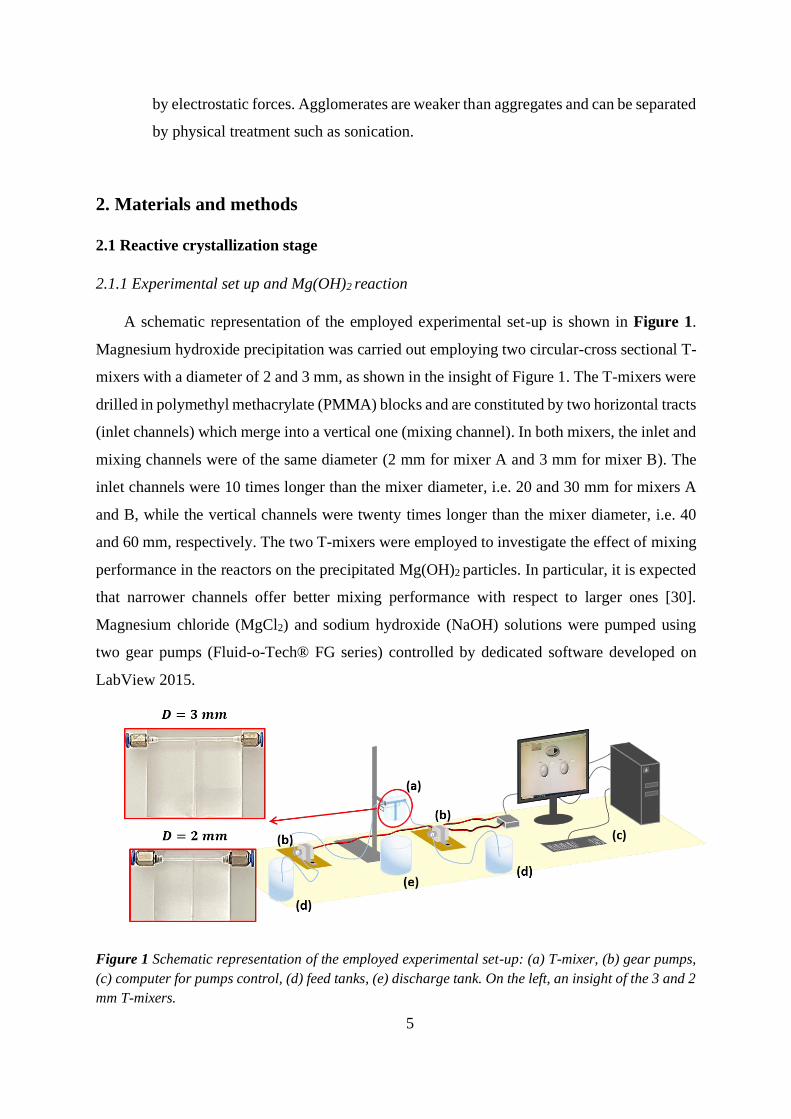
A schematic representation of the employed experimental set-up is shown in Figure 1.
Magnesium hydroxide precipitation was carried out employing two circular-cross sectional T-
mixers with a diameter of 2 and 3 mm, as shown in the insight of Figure 1. The T-mixers were
drilled in polymethyl methacrylate (PMMA) blocks and are constituted by two horizontal tracts
(inlet channels) which merge into a vertical one (mixing channel). In both mixers, the inlet and
mixing channels were of the same diameter (2 mm for mixer A and 3 mm for mixer B). The
inlet channels were 10 times longer than the mixer diameter, i.e. 20 and 30 mm for mixers A
and B, while the vertical channels were twenty times longer than the mixer diameter, i.e. 40
and 60 mm, respectively. The two T-mixers were employed to investigate the effect of mixing
performance in the reactors on the precipitated Mg(OH)2 particles. In particular, it is expected
that narrower channels offer better mixing performance with respect to larger ones [30].
Magnesium chloride (MgCl2) and sodium hydroxide (NaOH) solutions were pumped using
two gear pumps (Fluid-o-Tech® FG series) controlled by dedicated software developed on
LabView 2015.
Figure 1 Schematic representation of the employed experimental set-up: (a) T-mixer, (b) gear pumps,
(c) computer for pumps control, (d) feed tanks, (e) discharge tank. On the left, an insight of the 3 and 2
mm T-mixers.
6
Gear pumps are typically used for industrial applications, since they can be operated
continuously, however they are not pulsation-free. The majority of the experiments reported
here were conducted at high pump rotational speed, thus the effect of pulsation on the mixing
of the reactants is expected to be negligible [31].
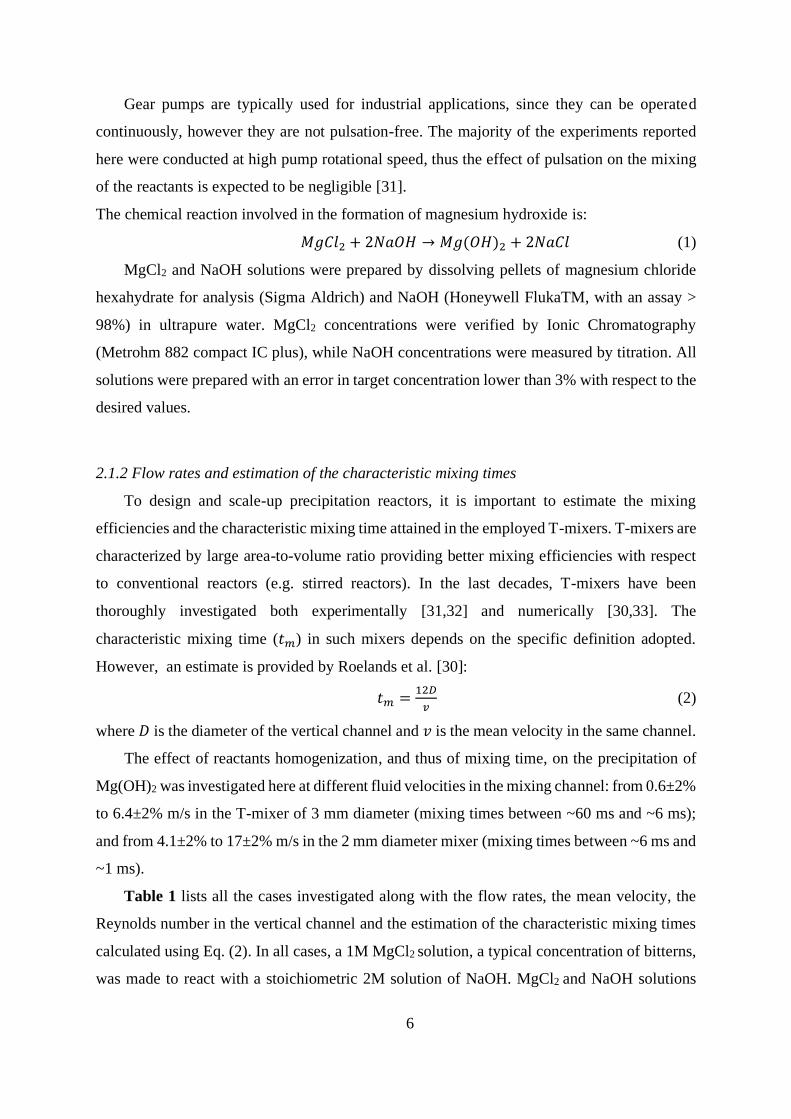
The chemical reaction involved in the formation of magnesium hydroxide is:
𝑀𝑔𝐶𝑙2 + 2𝑁𝑎𝑂𝐻 → 𝑀𝑔(𝑂𝐻)2 + 2𝑁𝑎𝐶𝑙 (1)
MgCl2 and NaOH solutions were prepared by dissolving pellets of magnesium chloride
hexahydrate for analysis (Sigma Aldrich) and NaOH (Honeywell FlukaTM, with an assay >
98%) in ultrapure water. MgCl2 concentrations were verified by Ionic Chromatography
(Metrohm 882 compact IC plus), while NaOH concentrations were measured by titration. All
solutions were prepared with an error in target concentration lower than 3% with respect to the
desired values.
2.1.2 Flow rates and estimation of the characteristic mixing times
To design and scale-up precipitation reactors, it is important to estimate the mixing
efficiencies and the characteristic mixing time attained in the employed T-mixers. T-mixers are
characterized by large area-to-volume ratio providing better mixing efficiencies with respect
to conventional reactors (e.g. stirred reactors). In the last decades, T-mixers have been
thoroughly investigated both experimentally [31,32] and numerically [30,33]. The
characteristic mixing time (𝑡𝑚) in such mixers depends on the specific definition adopted.
However, an estimate is provided by Roelands et al. [30]:
𝑡𝑚 =12𝐷
𝑣 (2)
where 𝐷 is the diameter of the vertical channel and 𝑣 is the mean velocity in the same channel.
The effect of reactants homogenization, and thus of mixing time, on the precipitation of
Mg(OH)2 was investigated here at different fluid velocities in the mixing channel: from 0.6±2%
to 6.4±2% m/s in the T-mixer of 3 mm diameter (mixing times between ~60 ms and ~6 ms);
and from 4.1±2% to 17±2% m/s in the 2 mm diameter mixer (mixing times between ~6 ms and
~1 ms).
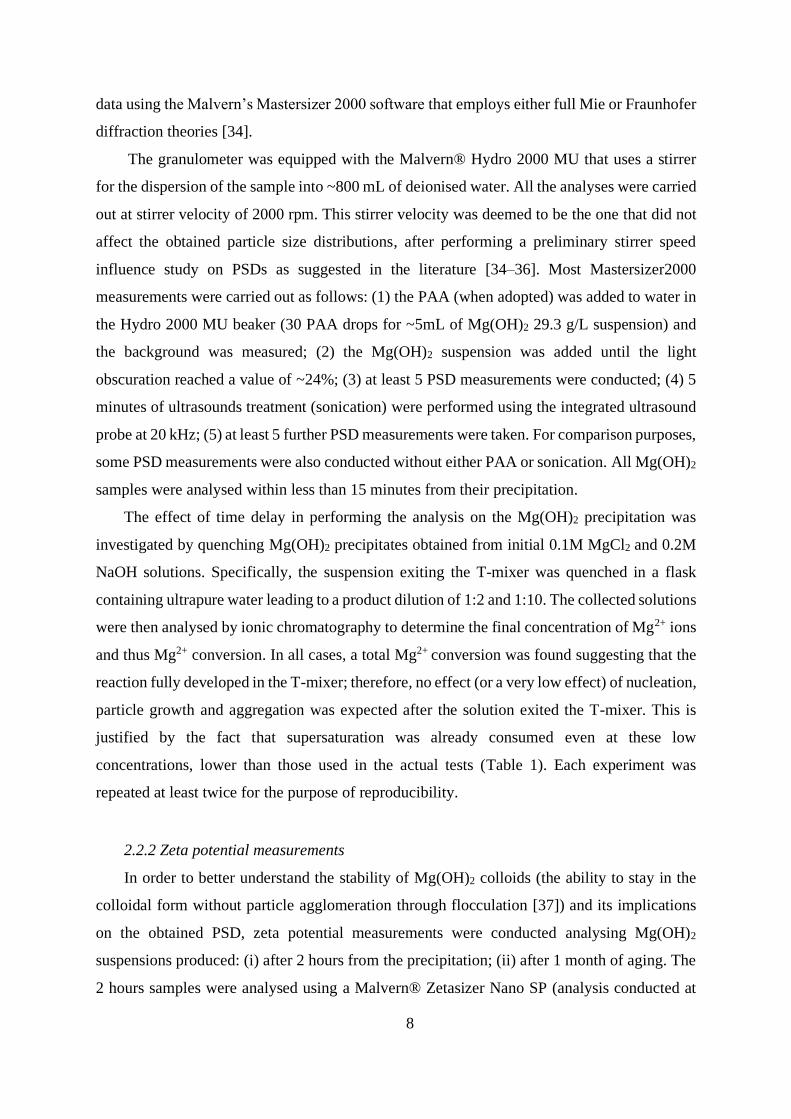
Table 1 lists all the cases investigated along with the flow rates, the mean velocity, the
Reynolds number in the vertical channel and the estimation of the characteristic mixing times
calculated using Eq. (2). In all cases, a 1M MgCl2 solution, a typical concentration of bitterns,
was made to react with a stoichiometric 2M solution of NaOH. MgCl2 and NaOH solutions
7
were fed at the same fluid flow rates, each half of the flow rate in the mixing channel. All tests
were conducted at 25°C.
Table 1 Geometrical and operating conditions of experimental tests. In all cases a 1M MgCl2 solution
was made to react with a stoichiometric 2M solution of NaOH. The flow rates, the mean velocity and
the Reynolds numbers are calculated in the mixing channel.
Case Mixer Diameter
𝑫 (mm)
Flow rate
(mL/min)
Mean velocity
𝒗 (m/s)
Reynolds
number
Estimated mixing
time (ms)
#1 3 260 ± 2% 0.6 ± 2% 2030 60
#2 3 460 ± 2% 1.1± 2% 3590 33
#3 3 1400 ± 2% 3.3± 2% 10970 10
#4 3 2720 ± 2% 6.4± 2% 21300 5.6
#5 2 780 ± 2% 4.1± 2% 9170 5.7
#6 2 1600 ± 2% 8.5± 2% 18830 2.9
#7 2 2320 ± 2% 12± 2% 27250 2.0
#8 2 3203 ± 2% 17± 2% 37660 1.4
The Reynolds number was calculated as follows:
𝑅𝑒 =𝜌𝑣𝐷
𝜇 (3)
where 𝜌 and 𝜇 are the density and the viscosity of pure water at 25°C (997 kg/m3 and 0.89·10-
3 Pa·s, respectively), 𝑣 is the mean fluid velocity in the vertical (mixing) channel and 𝐷 is the
channel diameter. The range of the investigated flow rates results in a range of Reynolds
numbers from 2,000 to 38,000.
The suspensions’ pH was measured immediately after the outlet of the mixing channel. In
all tests here presented, the measured pH values ranged between 10.3 and 10.6 (equilibrium
pH of 10.48).
2.2 Product characterization stage
2.2.1 Particle Size distribution measurements
Mg(OH)2 particle size distributions (PSDs) were measured using a Malvern® Mastersizer
2000 granulometer with and without ultrasounds treatment and addition of a poly(acrylic acid,
sodium salt), (PAA, MW 1200, Sigma-Aldrich, Inc.) as a dispersant.
The Mastersizer 2000 is a static light scattering equipment that uses a blue (488.0 µm
wavelength LED) and red (633.8 µm wavelength He-Ne laser) light dual-wavelength, single-
lens detection system. The light intensity adsorbed by particles is measured as obscuration and
refers to the amount of the analysed sample. PSDs are obtained by processing light scattering
8
data using the Malvern’s Mastersizer 2000 software that employs either full Mie or Fraunhofer
diffraction theories [34].
The granulometer was equipped with the Malvern® Hydro 2000 MU that uses a stirrer
for the dispersion of the sample into ~800 mL of deionised water. All the analyses were carried
out at stirrer velocity of 2000 rpm. This stirrer velocity was deemed to be the one that did not
affect the obtained particle size distributions, after performing a preliminary stirrer speed
influence study on PSDs as suggested in the literature [34–36]. Most Mastersizer2000
measurements were carried out as follows: (1) the PAA (when adopted) was added to water in
the Hydro 2000 MU beaker (30 PAA drops for ~5mL of Mg(OH)2 29.3 g/L suspension) and
the background was measured; (2) the Mg(OH)2 suspension was added until the light
obscuration reached a value of ~24%; (3) at least 5 PSD measurements were conducted; (4) 5
minutes of ultrasounds treatment (sonication) were performed using the integrated ultrasound
probe at 20 kHz; (5) at least 5 further PSD measurements were taken. For comparison purposes,
some PSD measurements were also conducted without either PAA or sonication. All Mg(OH)2
samples were analysed within less than 15 minutes from their precipitation.
The effect of time delay in performing the analysis on the Mg(OH)2 precipitation was
investigated by quenching Mg(OH)2 precipitates obtained from initial 0.1M MgCl2 and 0.2M
NaOH solutions. Specifically, the suspension exiting the T-mixer was quenched in a flask
containing ultrapure water leading to a product dilution of 1:2 and 1:10. The collected solutions
were then analysed by ionic chromatography to determine the final concentration of Mg2+ ions
and thus Mg2+ conversion. In all cases, a total Mg2+ conversion was found suggesting that the
reaction fully developed in the T-mixer; therefore, no effect (or a very low effect) of nucleation,
particle growth and aggregation was expected after the solution exited the T-mixer. This is
justified by the fact that supersaturation was already consumed even at these low
concentrations, lower than those used in the actual tests (Table 1). Each experiment was
repeated at least twice for the purpose of reproducibility.
2.2.2 Zeta potential measurements
In order to better understand the stability of Mg(OH)2 colloids (the ability to stay in the
colloidal form without particle agglomeration through flocculation [37]) and its implications
on the obtained PSD, zeta potential measurements were conducted analysing Mg(OH)2
suspensions produced: (i) after 2 hours from the precipitation; (ii) after 1 month of aging. The
2 hours samples were analysed using a Malvern® Zetasizer Nano SP (analysis conducted at
9
the Advanced Technologies Network Center of the University of Palermo), while the 1 month
samples were analysed using a Malvern® Zetasizer Nano ZS90 (analysis conducted at
Politecnico di Torino). All samples were diluted to a Mg(OH)2 concentration of 0.3 g/L and
drops of 1M NaOH solution were added to adjust the suspensions pH to the desired one. No
PAA was used. Each experiment was repeated at least twice for the purpose of reproducibility.
2.2.3 SEM analysis
The morphology of the Mg(OH)2 particles produced for Case #7 was analysed by Scanning
Electron Microscope (SEM FEI Quanta 200 FEG). Mg(OH)2 suspensions were filtered by
using a Büchner system and a vacuum pump. The cake was washed to remove the reaction
produced NaCl that remains trapped in the wet cake, and then dried for 24h in an oven at 120°C.
3. Results and Discussion
3.1 Influence of the reactants mixing on the produced Mg(OH)2 particles
In this section, the influence of mixing on the produced Mg(OH)2 particles was assessed
by comparing the PSDs obtained for the eight experimental conditions reported in Table 1. For
the chosen concentrations of 1M MgCl2 and 2M NaOH the minimum degree of mixing (the
highest mixing time, see Eq. (2)) beyond which mixing has no further influence on particle
formation was determined. As discussed in Section 2, PSDs were measured with and without
ultrasounds treatment and addition of PAA in the characterization stage in order to assess the
Mg(OH)2 particle assemblage state.
3.1.1 Mg(OH)2 PSDs without ultrasounds treatment and no addition of PAA
PSDs measurements were first performed without ultrasounds treatment and addition of
PAA. The characteristic diameters dkm of the measured PSDs were calculated to study the
effect of fluid flow regimes on the Mg(OH)2 precipitation process. dkm denotes the ratio
between the k-th and the m-th moments of the PSD:
𝑑𝑘𝑚 = [∫ 𝑑𝑘𝑛(𝑑)d𝑑
∞0
∫ 𝑑𝑚𝑛(𝑑)d𝑑∞
0
]
1
𝑘−𝑚
(4)
where 𝑛(𝑑) is the number particle distribution function, such that 𝑛(𝑑)d𝑑 is the number of
particles having diameter between 𝑑 and 𝑑 + d𝑑. Thus, d10 is the number-average particle size
more affected by small particles as they outnumber larger ones. Instead, d43 is the volume
10
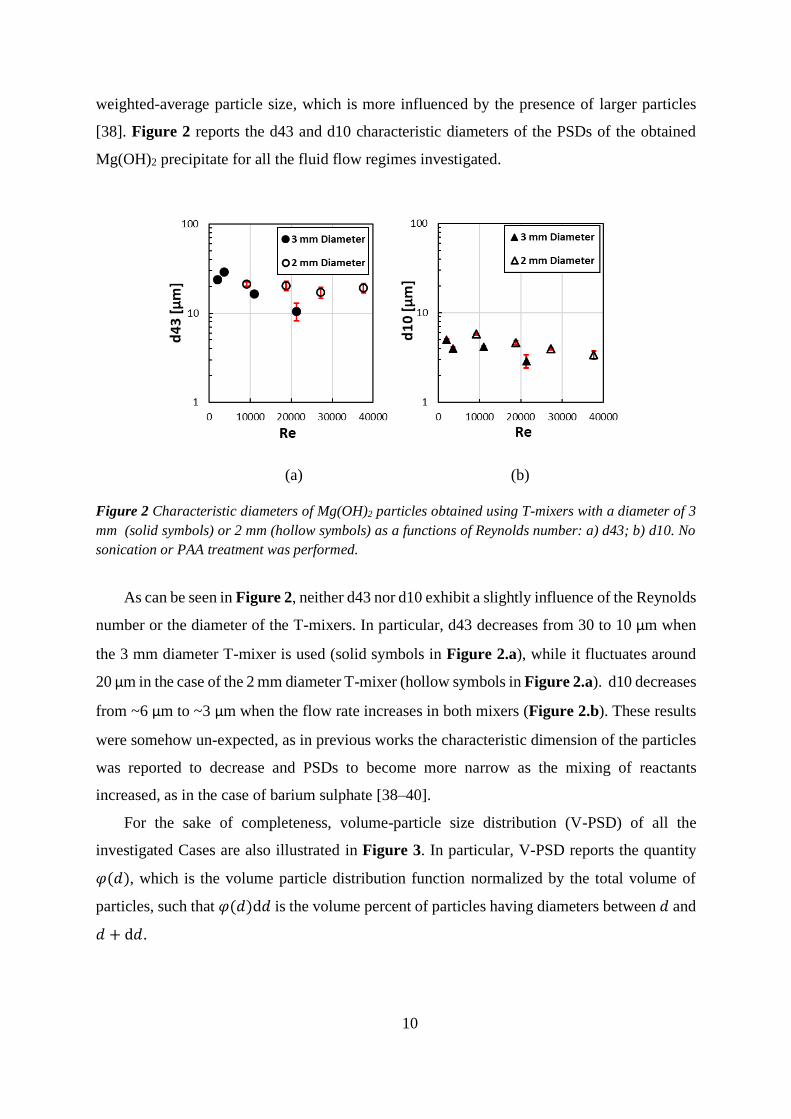
weighted-average particle size, which is more influenced by the presence of larger particles
[38]. Figure 2 reports the d43 and d10 characteristic diameters of the PSDs of the obtained
Mg(OH)2 precipitate for all the fluid flow regimes investigated.
(a) (b)
Figure 2 Characteristic diameters of Mg(OH)2 particles obtained using T-mixers with a diameter of 3
mm (solid symbols) or 2 mm (hollow symbols) as a functions of Reynolds number: a) d43; b) d10. No
sonication or PAA treatment was performed.
As can be seen in Figure 2, neither d43 nor d10 exhibit a slightly influence of the Reynolds
number or the diameter of the T-mixers. In particular, d43 decreases from 30 to 10 μm when
the 3 mm diameter T-mixer is used (solid symbols in Figure 2.a), while it fluctuates around
20 μm in the case of the 2 mm diameter T-mixer (hollow symbols in Figure 2.a). d10 decreases
from ~6 μm to ~3 μm when the flow rate increases in both mixers (Figure 2.b). These results
were somehow un-expected, as in previous works the characteristic dimension of the particles
was reported to decrease and PSDs to become more narrow as the mixing of reactants
increased, as in the case of barium sulphate [38–40].
For the sake of completeness, volume-particle size distribution (V-PSD) of all the
investigated Cases are also illustrated in Figure 3. In particular, V-PSD reports the quantity
𝜑(𝑑), which is the volume particle distribution function normalized by the total volume of
particles, such that 𝜑(𝑑)d𝑑 is the volume percent of particles having diameters between 𝑑 and
𝑑 + d𝑑.
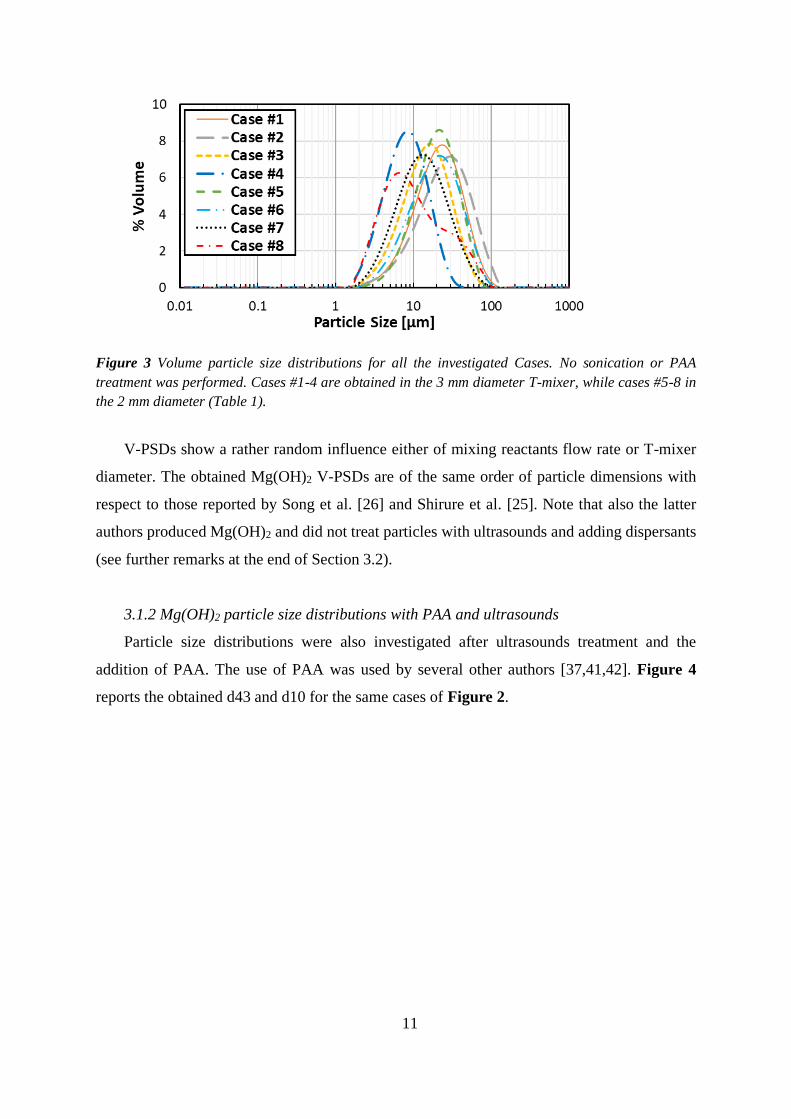
11
Figure 3 Volume particle size distributions for all the investigated Cases. No sonication or PAA
treatment was performed. Cases #1-4 are obtained in the 3 mm diameter T-mixer, while cases #5-8 in
the 2 mm diameter (Table 1).
V-PSDs show a rather random influence either of mixing reactants flow rate or T-mixer
diameter. The obtained Mg(OH)2 V-PSDs are of the same order of particle dimensions with
respect to those reported by Song et al. [26] and Shirure et al. [25]. Note that also the latter
authors produced Mg(OH)2 and did not treat particles with ultrasounds and adding dispersants
(see further remarks at the end of Section 3.2).
3.1.2 Mg(OH)2 particle size distributions with PAA and ultrasounds
Particle size distributions were also investigated after ultrasounds treatment and the
addition of PAA. The use of PAA was used by several other authors [37,41,42]. Figure 4
reports the obtained d43 and d10 for the same cases of Figure 2.
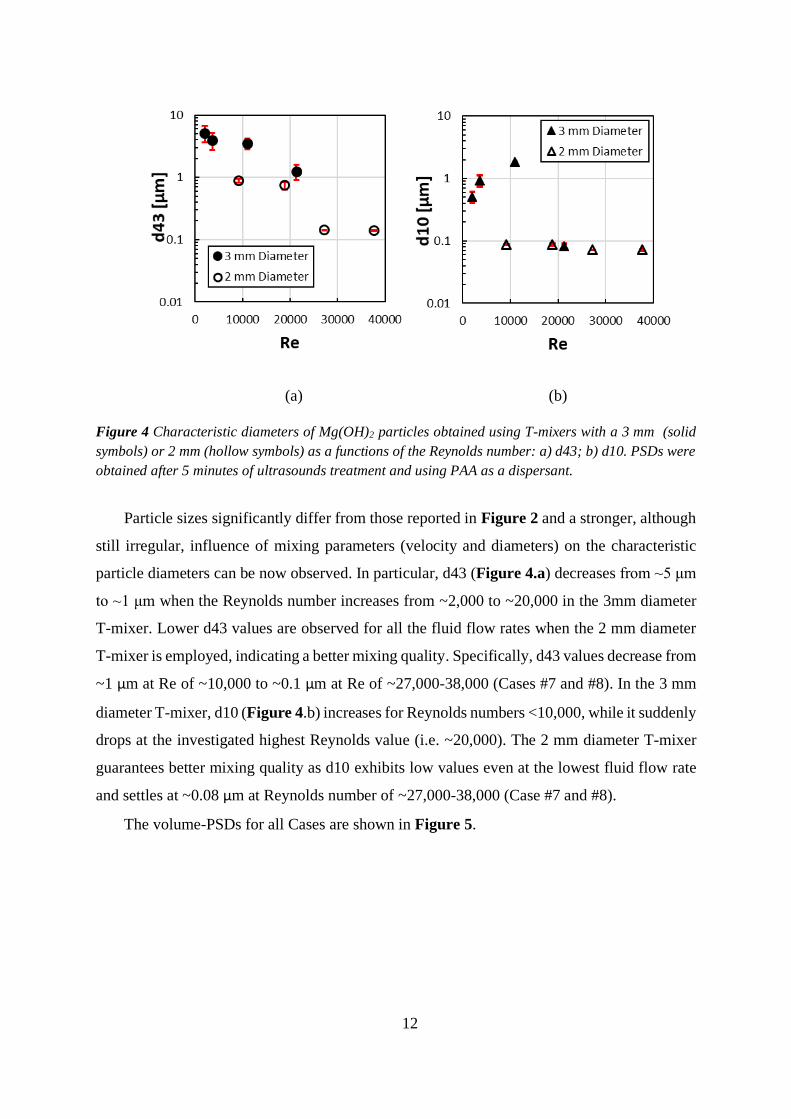
12
(a) (b)
Figure 4 Characteristic diameters of Mg(OH)2 particles obtained using T-mixers with a 3 mm (solid
symbols) or 2 mm (hollow symbols) as a functions of the Reynolds number: a) d43; b) d10. PSDs were
obtained after 5 minutes of ultrasounds treatment and using PAA as a dispersant.
Particle sizes significantly differ from those reported in Figure 2 and a stronger, although
still irregular, influence of mixing parameters (velocity and diameters) on the characteristic
particle diameters can be now observed. In particular, d43 (Figure 4.a) decreases from ~5 μm
to ~1 μm when the Reynolds number increases from ~2,000 to ~20,000 in the 3mm diameter
T-mixer. Lower d43 values are observed for all the fluid flow rates when the 2 mm diameter
T-mixer is employed, indicating a better mixing quality. Specifically, d43 values decrease from
~1 μm at Re of ~10,000 to ~0.1 μm at Re of ~27,000-38,000 (Cases #7 and #8). In the 3 mm
diameter T-mixer, d10 (Figure 4.b) increases for Reynolds numbers <10,000, while it suddenly
drops at the investigated highest Reynolds value (i.e. ~20,000). The 2 mm diameter T-mixer
guarantees better mixing quality as d10 exhibits low values even at the lowest fluid flow rate
and settles at ~0.08 μm at Reynolds number of ~27,000-38,000 (Case #7 and #8).
The volume-PSDs for all Cases are shown in Figure 5.
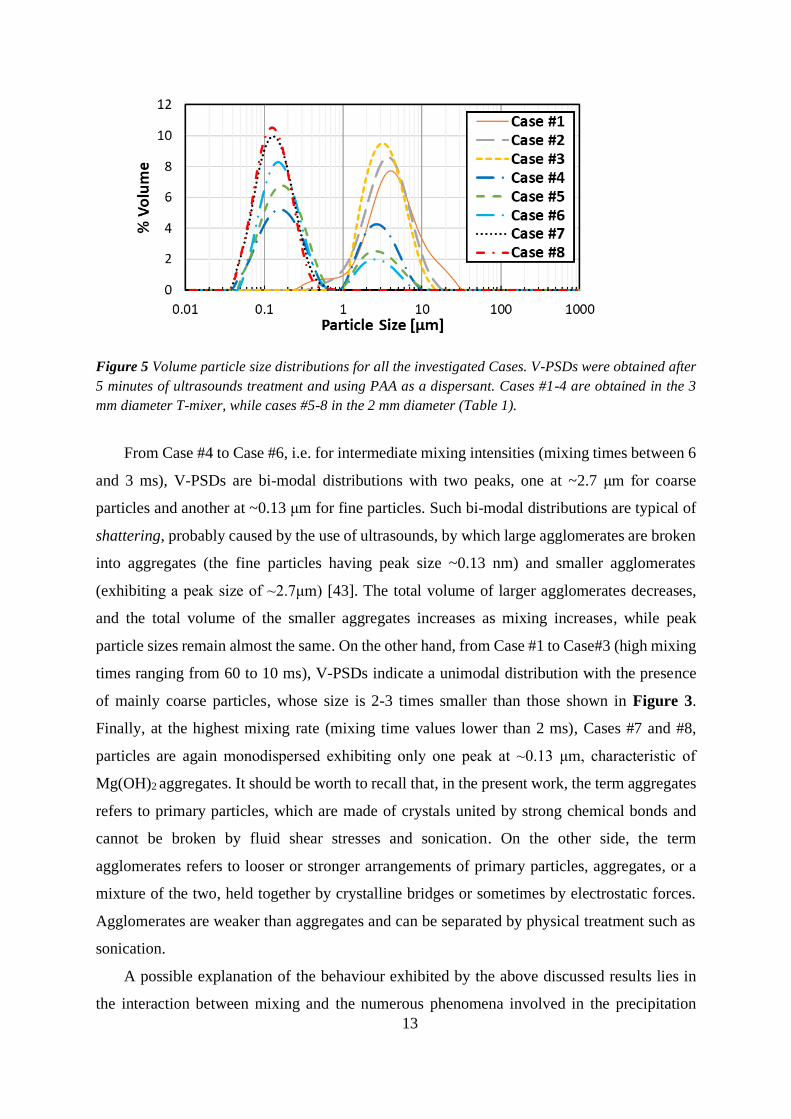
13
Figure 5 Volume particle size distributions for all the investigated Cases. V-PSDs were obtained after
5 minutes of ultrasounds treatment and using PAA as a dispersant. Cases #1-4 are obtained in the 3
mm diameter T-mixer, while cases #5-8 in the 2 mm diameter (Table 1).
From Case #4 to Case #6, i.e. for intermediate mixing intensities (mixing times between 6
and 3 ms), V-PSDs are bi-modal distributions with two peaks, one at ~2.7 μm for coarse
particles and another at ~0.13 μm for fine particles. Such bi-modal distributions are typical of
shattering, probably caused by the use of ultrasounds, by which large agglomerates are broken
into aggregates (the fine particles having peak size ~0.13 nm) and smaller agglomerates
(exhibiting a peak size of ~2.7μm) [43]. The total volume of larger agglomerates decreases,
and the total volume of the smaller aggregates increases as mixing increases, while peak
particle sizes remain almost the same. On the other hand, from Case #1 to Case#3 (high mixing
times ranging from 60 to 10 ms), V-PSDs indicate a unimodal distribution with the presence
of mainly coarse particles, whose size is 2-3 times smaller than those shown in Figure 3.
Finally, at the highest mixing rate (mixing time values lower than 2 ms), Cases #7 and #8,
particles are again monodispersed exhibiting only one peak at ~0.13 μm, characteristic of
Mg(OH)2 aggregates. It should be worth to recall that, in the present work, the term aggregates
refers to primary particles, which are made of crystals united by strong chemical bonds and
cannot be broken by fluid shear stresses and sonication. On the other side, the term
agglomerates refers to looser or stronger arrangements of primary particles, aggregates, or a
mixture of the two, held together by crystalline bridges or sometimes by electrostatic forces.
Agglomerates are weaker than aggregates and can be separated by physical treatment such as
sonication.
A possible explanation of the behaviour exhibited by the above discussed results lies in
the interaction between mixing and the numerous phenomena involved in the precipitation
14
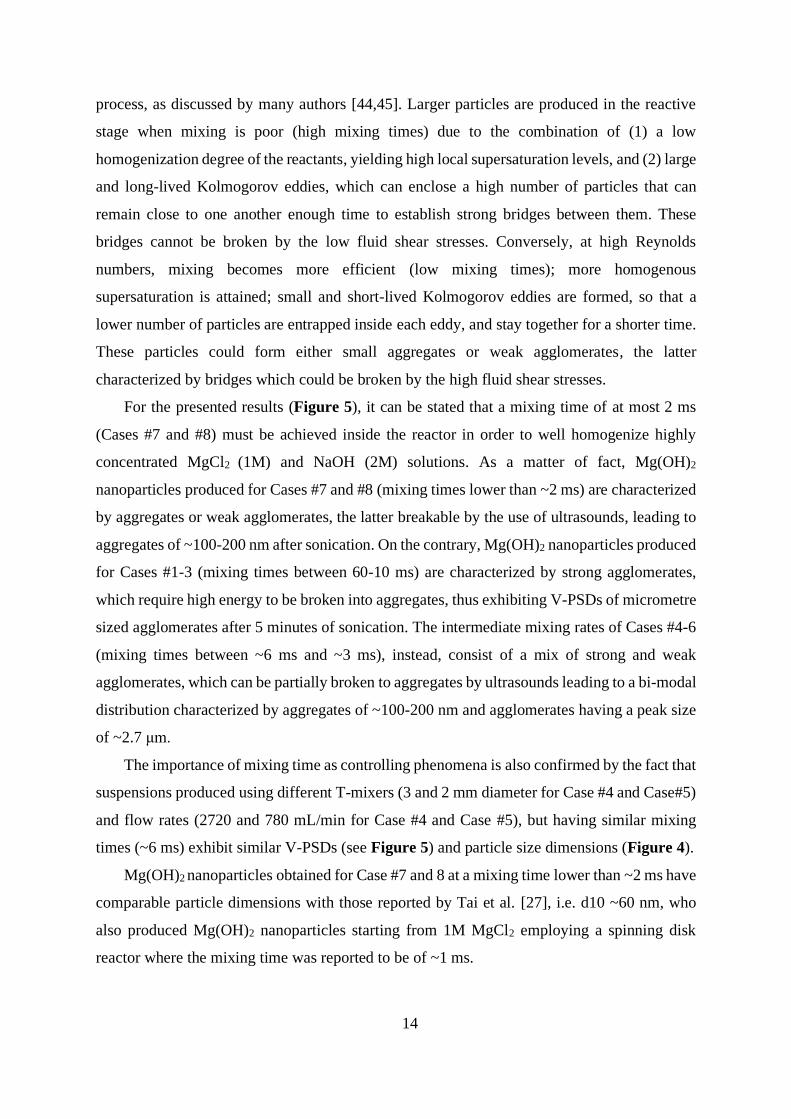
process, as discussed by many authors [44,45]. Larger particles are produced in the reactive
stage when mixing is poor (high mixing times) due to the combination of (1) a low
homogenization degree of the reactants, yielding high local supersaturation levels, and (2) large
and long-lived Kolmogorov eddies, which can enclose a high number of particles that can
remain close to one another enough time to establish strong bridges between them. These
bridges cannot be broken by the low fluid shear stresses. Conversely, at high Reynolds
numbers, mixing becomes more efficient (low mixing times); more homogenous
supersaturation is attained; small and short-lived Kolmogorov eddies are formed, so that a
lower number of particles are entrapped inside each eddy, and stay together for a shorter time.
These particles could form either small aggregates or weak agglomerates, the latter
characterized by bridges which could be broken by the high fluid shear stresses.
For the presented results (Figure 5), it can be stated that a mixing time of at most 2 ms
(Cases #7 and #8) must be achieved inside the reactor in order to well homogenize highly
concentrated MgCl2 (1M) and NaOH (2M) solutions. As a matter of fact, Mg(OH)2
nanoparticles produced for Cases #7 and #8 (mixing times lower than ~2 ms) are characterized
by aggregates or weak agglomerates, the latter breakable by the use of ultrasounds, leading to
aggregates of ~100-200 nm after sonication. On the contrary, Mg(OH)2 nanoparticles produced
for Cases #1-3 (mixing times between 60-10 ms) are characterized by strong agglomerates,
which require high energy to be broken into aggregates, thus exhibiting V-PSDs of micrometre
sized agglomerates after 5 minutes of sonication. The intermediate mixing rates of Cases #4-6
(mixing times between ~6 ms and ~3 ms), instead, consist of a mix of strong and weak
agglomerates, which can be partially broken to aggregates by ultrasounds leading to a bi-modal
distribution characterized by aggregates of ~100-200 nm and agglomerates having a peak size
of ~2.7 μm.
The importance of mixing time as controlling phenomena is also confirmed by the fact that
suspensions produced using different T-mixers (3 and 2 mm diameter for Case #4 and Case#5)
and flow rates (2720 and 780 mL/min for Case #4 and Case #5), but having similar mixing
times (~6 ms) exhibit similar V-PSDs (see Figure 5) and particle size dimensions (Figure 4).
Mg(OH)2 nanoparticles obtained for Case #7 and 8 at a mixing time lower than ~2 ms have
comparable particle dimensions with those reported by Tai et al. [27], i.e. d10 ~60 nm, who
also produced Mg(OH)2 nanoparticles starting from 1M MgCl2 employing a spinning disk
reactor where the mixing time was reported to be of ~1 ms.
15
3.2 Zeta Potential measurements
In Section 3.1 it was shown that particle size distributions significantly vary when
suspensions are treated by using ultrasounds and adding PAA as a dispersant. In order to better
understand these results, the effect of superficial electric charge of Mg(OH)2 particles was
examined by performing Zeta-potential measurements. The stability of Mg(OH)2 suspensions
was also investigated over time performing the analysis (i) after 2 hours and (ii) after 1 month
of aging from the precipitation. Zeta-potential depends on the particle properties, the
suspension conditions (e.g. pH), and the theoretical model applied, e.g. the Smoluchowski
approximation employed here to derive Zeta-potential values from the electrophoretic mobility
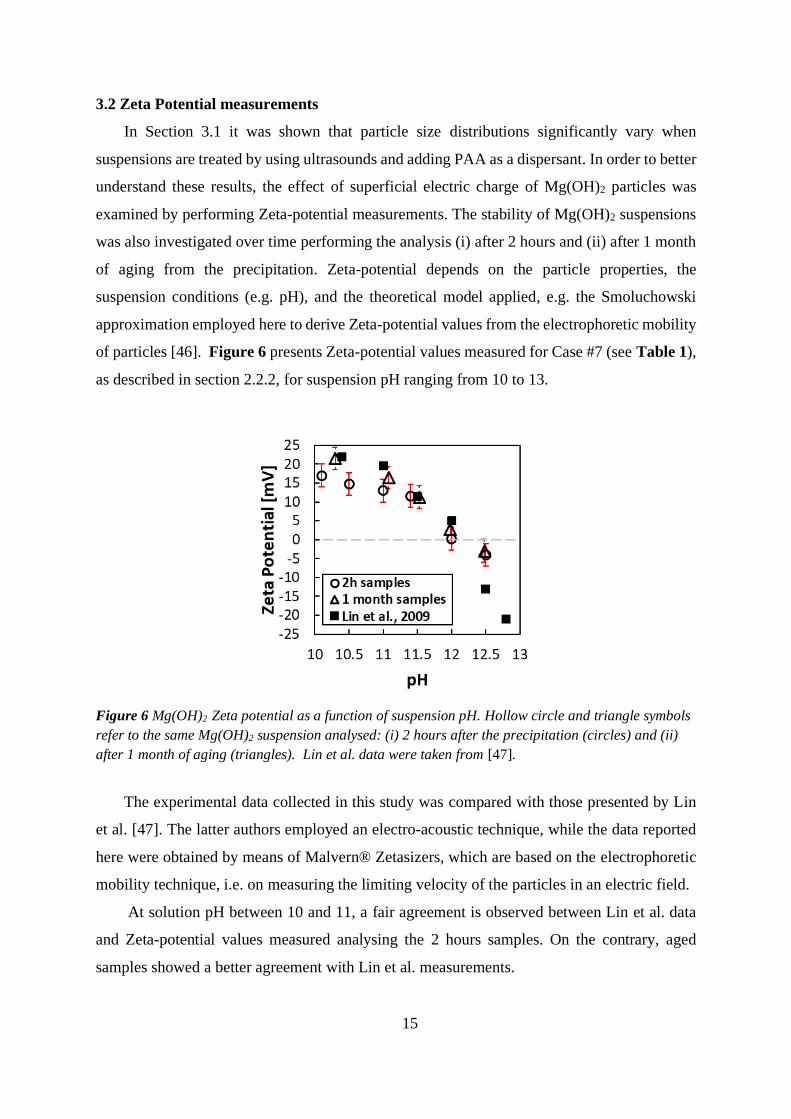
of particles [46]. Figure 6 presents Zeta-potential values measured for Case #7 (see Table 1),
as described in section 2.2.2, for suspension pH ranging from 10 to 13.
Figure 6 Mg(OH)2 Zeta potential as a function of suspension pH. Hollow circle and triangle symbols
refer to the same Mg(OH)2 suspension analysed: (i) 2 hours after the precipitation (circles) and (ii)
after 1 month of aging (triangles). Lin et al. data were taken from [47].
The experimental data collected in this study was compared with those presented by Lin
et al. [47]. The latter authors employed an electro-acoustic technique, while the data reported
here were obtained by means of Malvern® Zetasizers, which are based on the electrophoretic
mobility technique, i.e. on measuring the limiting velocity of the particles in an electric field.
At solution pH between 10 and 11, a fair agreement is observed between Lin et al. data
and Zeta-potential values measured analysing the 2 hours samples. On the contrary, aged
samples showed a better agreement with Lin et al. measurements.
16
Specifically, Zeta-potential values measured for the 2 hours samples were found to vary
from ~ 18 mV to ~ 13 mV, while Zeta-potential values reported by Lin et al. and those
measured for the aged samples decreased from ~23 mV to ~17 mV. Some difficulties were
encountered for measurements in high pH suspensions due to their high conductivity values,
so that pH values higher than 12.5 could not be investigated. Lin et al, however, reported Zeta-
potential values of ~ -15mV at pH ~12.5 and ~ -20mV at pH ~ 13. The isoelectric point (the
point of zero Zeta-potential, where colloids have the largest tendency to agglomerate) of
Mg(OH)2 particles is detected at a pH value of ~ 12 for both 2h samples and aged samples, in
good agreement with Lin et al. and with values reported in literature [42,48,49].
Zeta-potential values measured for samples produced after 2 hours from precipitation and
those aged for 1 month show that Mg(OH)2 suspensions are characterized by the same stability
characteristics over time. In particular, from Figure 6, it can be clearly seen that the Zeta-
potential of the Mg(OH)2 particles lies in the range of ±30 mV, which represents a zeta potential
region were particles are not stable and tend to agglomerate rather than staying apart [46].
These Zeta-potential values explain the behaviour shown in Section 3.1. Specifically, in the
absence of PAA, Mg(OH)2 particles agglomerate due to their low zeta potential values. On the
other hand, the presence of PAA stabilizes the Mg(OH)2 suspension [37,41]. The
thermodynamically stable coiled structure of PA− can entrap Mg(OH)2 nanoparticles
preventing their agglomeration [37]. Thus, V-PSDs obtained in the absence of sonication and
no PAA addition, as in Figure 3, do not exhibit a significant influence of mixing in the reactive
crystallization stage because they mainly regard the size distribution of large and weak
agglomerates with typical peak dimensions in the 8-20 μm range. On the contrary, V-PSDs
obtained by applying sonication and PAA treatment (Figure 5) exhibit a much larger influence
of the mixing intensity experienced in the reactive crystallization stage; for low mixing, V-
PSDs exhibit agglomerates smaller than those in Figure 3, but still characterized by peak size
of 2-3μm, while, for high mixing, they only consist of aggregates with a typical size of 100-
200 nm.
3.3 Tyndall effect and Mg(OH)2 particles morphology
The reduction of the particles sizes presented in Figure 4 with respect to those reported in
Figure 3 was also confirmed by a visual inspection of the Mg(OH)2 suspension contained in
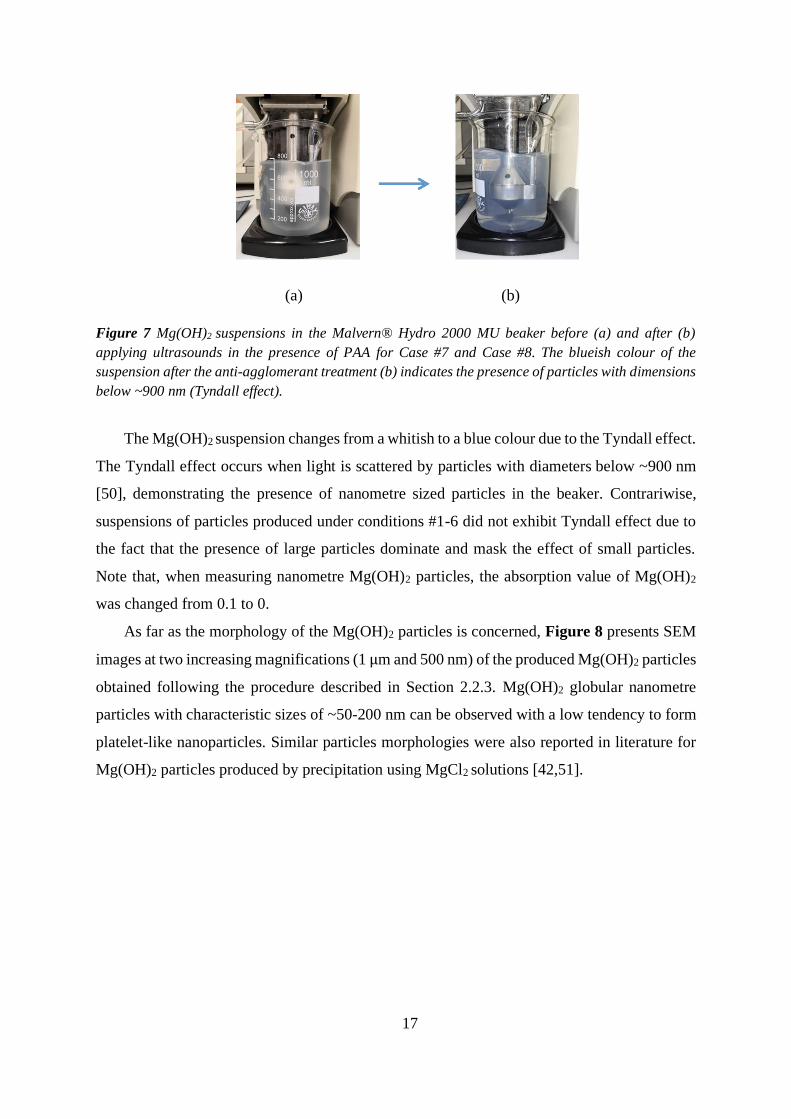
the Hydro 2000 MU beaker, as shown in Figure 7 for Case #7 and Case #8.
17
(a) (b)
Figure 7 Mg(OH)2 suspensions in the Malvern® Hydro 2000 MU beaker before (a) and after (b)
applying ultrasounds in the presence of PAA for Case #7 and Case #8. The blueish colour of the
suspension after the anti-agglomerant treatment (b) indicates the presence of particles with dimensions
below ~900 nm (Tyndall effect).
The Mg(OH)2 suspension changes from a whitish to a blue colour due to the Tyndall effect.
The Tyndall effect occurs when light is scattered by particles with diameters below ~900 nm
[50], demonstrating the presence of nanometre sized particles in the beaker. Contrariwise,
suspensions of particles produced under conditions #1-6 did not exhibit Tyndall effect due to
the fact that the presence of large particles dominate and mask the effect of small particles.
Note that, when measuring nanometre Mg(OH)2 particles, the absorption value of Mg(OH)2
was changed from 0.1 to 0.
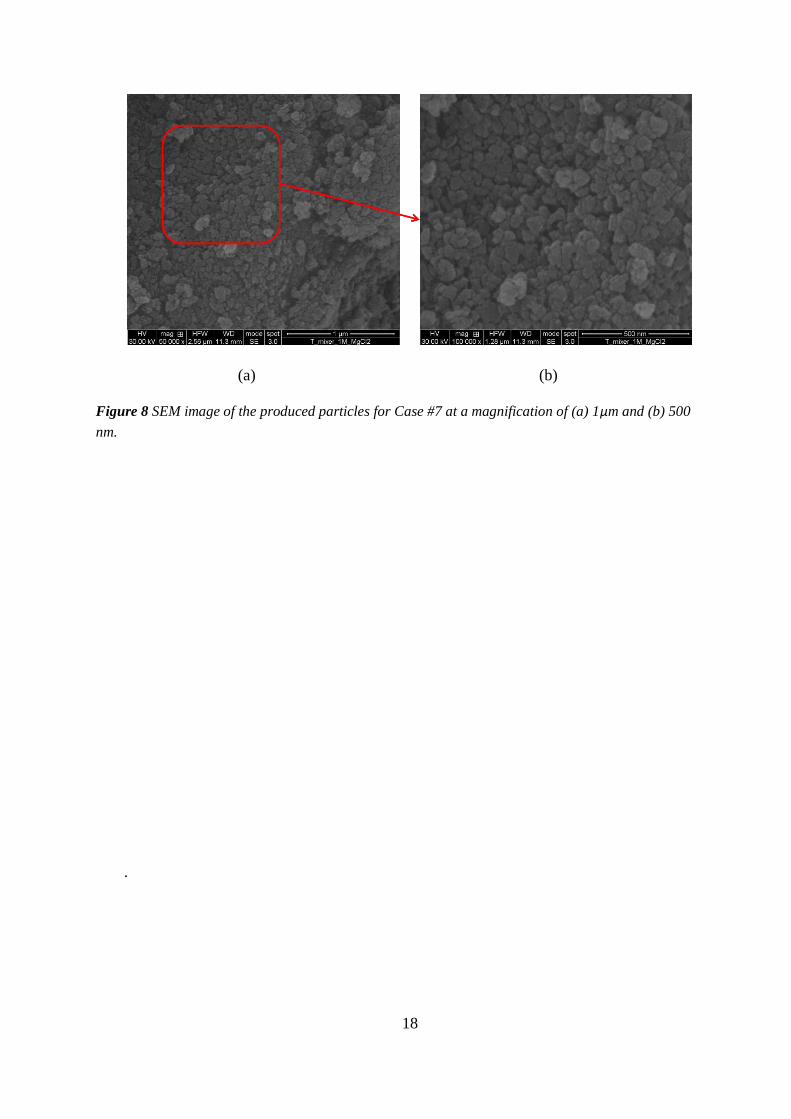
As far as the morphology of the Mg(OH)2 particles is concerned, Figure 8 presents SEM
images at two increasing magnifications (1 μm and 500 nm) of the produced Mg(OH)2 particles
obtained following the procedure described in Section 2.2.3. Mg(OH)2 globular nanometre
particles with characteristic sizes of ~50-200 nm can be observed with a low tendency to form
platelet-like nanoparticles. Similar particles morphologies were also reported in literature for
Mg(OH)2 particles produced by precipitation using MgCl2 solutions [42,51].
18
(a) (b)
Figure 8 SEM image of the produced particles for Case #7 at a magnification of (a) 1μm and (b) 500
nm.
.
19
Conclusions
The precipitation process of magnesium hydroxide from 1M MgCl2 solutions was
experimentally investigated focusing on the effect of reactants mixing on particle size
distribution by a clearly methodical analytical procedure for the characterization of the
produced Mg(OH)2 particles. Two circular cross-sectional T-shaped mixers of 2 and 3 mm
diameter were employed. Eight different cases were investigated with variable flow rates and
channel diameter, in the range of Reynolds numbers between 2,000 and 38,000, thus leading
to mixing times ranging from 60 to 1.5 ms. Produced particles were analysed via a light
scattering technique within 15 mins from precipitation, with and without sonication
(ultrasounds treatment) and poly(acrylic acid sodium salt) (PAA) addition.
It was found that in the absence of PAA and ultrasounds treatment particles could not be
well characterized since similar V-PSDs exhibiting large agglomerates with peak sizes of 8-20
μm were detected for all the cases investigated. On the contrary, by using PAA and sonication,
the effect of reactants mixing was clearly shown and the particles assemblage state well
characterized. Specifically, for intermediate mixing regimes, V-PSDs were found to be bi-
modal with two peaks, one at ~2.7 μm characteristic of small Mg(OH)2 agglomerates and
another at ~0.13 μm characteristic of Mg(OH)2 aggregates. At low mixing rates, V-PSDs
indicated a unimodal distribution with the presence of only agglomerates exhibiting a peak of
~2.7 μm, while at the highest mixing, when mixing time reaches values below 2 ms, particles
were again monodispersed, exhibiting only one peak size of ~0.13 μm, representative of
Mg(OH)2 aggregates.
The similar V-PSDs obtained without any particle treatment were consistent with the low
measured zeta potential values of the Mg(OH)2 particles, which were found to lie in the range
of ±30 mV, marking a high tendency of particles to agglomerate due to electrostatic forces.
Acknowledgments
This project has received funding from the European Union’s Horizon 2020 research and
innovation programme under Grant Agreement No. 869467 (SEArcularMINE). This output
reflects only the author’s view. The European Health and Digital Executive Agency (HaDEA)
and the European Commission cannot be held responsible for any use that may be made of the
information contained therein. Authors are grateful to Simone Bonafede for having contributed
to this work during his master thesis.
20
Author statement
Giuseppe Battaglia: Conceptualization, Methodology, Formal analysis, Data curation,
Validation, Investigation, Writing - Original Draft, Visualisation.
Salvatore Romano: Conceptualization, Methodology, Formal analysis, Data curation,
Validation, Investigation, Writing – Review & Editing, Visualisation.
Antonello Raponi: Conceptualization, Methodology, Investigation.
Daniele Marchisio: Conceptualization, Methodology, Supervision, Writing – Review &
Editing, Project administration.
Michele Ciofalo: Methodology, Formal analysis, Writing – Review & Editing.
Andrea Cipollina: Conceptualization, Methodology, Writing – Review & Editing,
Supervision, Project administration, Funding acquisition.
Alessandro Tamburini: Methodology, Formal analysis, Resources, Supervision.
Giorgio Micale: Conceptualization, Resources, Supervision, Project administration,
Funding acquisition.
Declaration of Competing Interest
The authors declare that they have no known competing financial interests or personal
relationships that could have appeared to influence the work reported in this paper.
References
[1] A. Cipollina, M. Bevacqua, P. Dolcimascolo, A. Tamburini, A. Brucato, H. Glade, L. Buether,
G. Micale, Reactive crystallisation process for magnesium recovery from concentrated brines,
Desalin. Water Treat. 55 (2015) 2377–2388. https://doi.org/10.1080/19443994.2014.947771.
[2] Magnesium Metal Outlook to 2030, 13th Edition, (2021) 1–7. https://roskill.com/market-
report/magnesium-metal/.
[3] Critical Raw Materials Resilience: Charting a Path towards greater Security and Sustainability,
(2020). https://eur-lex.europa.eu/legal-
content/EN/TXT/PDF/?uri=CELEX:52020DC0474&from=EN.
[4] A.A. Pilarska, Ł. Klapiszewski, T. Jesionowski, Recent development in the synthesis,
modification and application of Mg(OH)2 and MgO: A review, Powder Technol. 319 (2017)
373–407. https://doi.org/10.1016/j.powtec.2017.07.009.
[5] G. Balducci, L. Bravo Diaz, D.H. Gregory, Recent progress in the synthesis of nanostructured
magnesium hydroxide, Royal Society of Chemistry, 2017. https://doi.org/10.1039/c7ce01570d.
21
[6] H.Y. Zahran, S.S. Shneouda, I.S. Yahia, F. El-Tantawy, Facile and rapid synthesis of nanoplates
Mg(OH)2 and MgO via Microwave technique from metal source: structural, optical and
dielectric properties, J. Sol-Gel Sci. Technol. 86 (2018) 104–111.
https://doi.org/10.1007/s10971-018-4613-2.
[7] W. Shu-Yu, H. Wen-Zhi, L. Chang, L. Guang-Ming, Z. Fei-Er, Characterizations and
preparation of Mg(OH)2 nanocrystals through ultrasonic–hydrothermal route, Res. Chem.
Intermed. 42 (2016) 4135–4145. https://doi.org/10.1007/s11164-015-2264-2.
[8] J. Zheng, W. Zhou, Solution-phase synthesis of magnesium hydroxide nanotubes, Mater. Lett.
127 (2014) 17–19. https://doi.org/10.1016/j.matlet.2014.04.076.
[9] A. Alamdari, R.M. Rahimpour, N. Esfandiari, E. Nourafkan, Kinetics of magnesium hydroxide
precipitation from sea bittern, Chem. Eng. Process. Process Intensif. 47 (2008) 215–221.
https://doi.org/10.1016/j.cep.2007.02.012.
[10] S. Yousefi, B. Ghasemi, M. Tajally, PEG-assisted synthesis and formation mechanism of
Mg(OH)2 nanostructures using natural brine, Appl. Phys. A Mater. Sci. Process. 126 (2020).
https://doi.org/10.1007/s00339-020-03814-w.
[11] M. Turek, W. Gnot, Precipitation of Magnesium Hydroxide from Brine, Ind. Eng. Chem. Res.
34 (1995) 244–250. https://doi.org/10.1021/ie00040a025.
[12] A. Pilarska, M. Wysokowski, E. Markiewicz, T. Jesionowski, Synthesis of magnesium
hydroxide and its calcinates by a precipitation method with the use of magnesium sulfate and
poly(ethylene glycols), Powder Technol. 235 (2013) 148–157.
https://doi.org/10.1016/j.powtec.2012.10.008.
[13] J.P. Hsu, A. Nacu, Preparation of submicron-sized Mg(OH)2 particles through precipitation,
Colloids Surfaces A Physicochem. Eng. Asp. 262 (2005) 220–231.
https://doi.org/10.1016/j.colsurfa.2005.04.038.
[14] H. Wu, B. Luo, C. Gao, L. Wang, Y. Wang, Q. Zhang, Synthesis and size control of
monodisperse magnesium hydroxide nanoparticles by microemulsion method, J. Dispers. Sci.
Technol. 41 (2020) 585–591. https://doi.org/10.1080/01932691.2019.1594887.
[15] X. Li, C. Ma, J. Zhao, Z. Li, S. Xu, Y. Liu, Preparation of magnesium hydroxide nanoplates
using a bubbling setup, Powder Technol. 198 (2010) 292–297.
https://doi.org/10.1016/j.powtec.2009.11.024.
[16] D. Wang, C. Song, Z. Hu, Synthesis of Mono-Dispersed Mg(OH)2 Nanoflakelets, J. Dispers.
Sci. Technol. 29 (2008) 1010–1012. https://doi.org/10.1080/01932690701810011.
[17] D. La Corte, F. Vassallo, A. Cipollina, M. Turek, A. Tamburini, G. Micale, A novel ionic
exchange membrane crystallizer to recover magnesium hydroxide from seawater and industrial
brines, Membranes (Basel). 10 (2020) 1–14. https://doi.org/10.3390/membranes10110303.
[18] F. Vassallo, C. Morgante, G. Battaglia, D. La Corte, M. Micari, A. Cipollina, A. Tamburini, G.
22
Micale, A simulation tool for ion exchange membrane crystallization of magnesium hydroxide
from waste brine, Chem. Eng. Res. Des. (2021). https://doi.org/10.1016/j.cherd.2021.07.008.
[19] F. Vassallo, D. La Corte, N. Cancilla, A. Tamburini, M. Bevacqua, A. Cipollina, G. Micale, A
pilot-plant for the selective recovery of magnesium and calcium from waste brines, Desalination.
517 (2021). https://doi.org/10.1016/j.desal.2021.115231.
[20] S. Bhandarkar, R. Brown, J. Estrin, Studies in rapid precipitation of hydroxides of calcium and
magnesium, J. Cryst. Growth. 97 (1989) 406–414. https://doi.org/10.1016/0022-
0248(89)90222-4.
[21] D.J. Gunn, M.S. Murthyt, M.S. Murthy, Kinetics and mechanisms of precipitations, Chem. Eng.
Sci. 27 (1972) 1293–1313. https://doi.org/10.1016/0009-2509(72)80105-2.
[22] Q. Yuan, Z. Lu, P. Zhang, X. Luo, X. Ren, T.D. Golden, Study of the synthesis and
crystallization kinetics of magnesium hydroxide, Mater. Chem. Phys. 162 (2015) 734–742.
https://doi.org/10.1016/j.matchemphys.2015.06.048.
[23] A.E. Nielsen, O. Söhnel, Interfacial tensions electrolyte crystal-aqueous solution, from
nucleation data, J. Cryst. Growth. 11 (1971) 233–242. https://doi.org/10.1016/0022-
0248(71)90090-X.
[24] A. Packter, The Rapid Precipitation of Magnesium Hydroxide from Aqueous Solutions:
Analysis of Nucleation and Crystal Growth Kinetics, Final Nucleus Numbers and Primary
Crystal Sizes, Cryst. Res. Technol. 20 (1985) 329–336.
https://doi.org/10.1002/crat.2170200307.
[25] V.S. Shirure, A.S. Pore, V.G. Pangarkar, Intensification of precipitation using narrow channel
reactors: Magnesium hydroxide precipitation, Ind. Eng. Chem. Res. 44 (2005) 5500–5507.
https://doi.org/10.1021/ie049248d.
[26] X. Song, S. Sun, D. Zhang, J. Wang, J. Yu, Synthesis and characterization of magnesium
hydroxide by batch reaction crystallization, Front. Chem. Sci. Eng. 5 (2011) 416–421.
https://doi.org/10.1007/s11705-011-1125-9.
[27] C.Y. Tai, C. Te Tai, M.H. Chang, H.S. Liu, Synthesis of magnesium hydroxide and oxide
nanoparticles using a spinning disk reactor, Ind. Eng. Chem. Res. 46 (2007) 5536–5541.
https://doi.org/10.1021/ie060869b.
[28] H. Shen, Y. Liu, B. Song, Preparation and characterization of magnesium hydroxide
nanoparticles in a novel impinging stream-rotating packed bed reactor, J. Chem. Eng. Japan. 49
(2016) 372–378. https://doi.org/10.1252/jcej.15we093.
[29] G. Nichols, S. Byard, M.J. Bloxham, J. Botterill, N.J. Dawson, A. Dennis, V. Diart, N.C. North,
J.D. Sherwood, A review of the terms agglomerate and aggregate with a recommendation for
nomenclature used in powder and particle characterization, J. Pharm. Sci. 91 (2002) 2103–2109.
https://doi.org/10.1002/jps.10191.
23
[30] M. Roelands, J. Derksen, J. ter Horst, H. Kramer, P. Jansens, An analysis of mixing in a typical
experimental setup to measure nucleation rates of precipitation processes, Chem. Eng. Technol.
26 (2003) 296–303. https://doi.org/10.1002/ceat.200390045.
[31] C. Lindenberg, J. Schöll, L. Vicum, M. Mazzotti, J. Brozio, Experimental characterization and
multi-scale modeling of mixing in static mixers, Chem. Eng. Sci. 63 (2008) 4135–4149.
https://doi.org/10.1016/j.ces.2008.05.026.
[32] S. Romano, G. Battaglia, S. Bonafede, D. Marchisio, M. Ciofalo, A. Tamburini, A. Cipollina,
G. Micale, Experimental Assessment of the Mixing Quality in a Circular Cross-sectional T-
shaped Mixer for the Precipitation of Sparingly Soluble Compounds, in: Chem. Eng. Trans.,
2021: pp. 1165–1170. https://doi.org/10.3303/CET2186195.
[33] D. Bothe, C. Stemich, H.J. Warnecke, Fluid mixing in a T-shaped micro-mixer, Chem. Eng. Sci.
61 (2006) 2950–2958. https://doi.org/10.1016/j.ces.2005.10.060.
[34] F. Storti, F. Balsamo, Particle size distributions by laser diffraction: Sensitivity of granular
matter strength to analytical operating procedures, Solid Earth. 1 (2010) 25–48.
https://doi.org/10.5194/se-1-25-2010.
[35] M. Ryzak, A. Bieganowski, Methodological aspects of determining soil particle-size distribution
using the laser diffraction method, J. Plant Nutr. Soil Sci. 174 (2011) 624–633.
https://doi.org/10.1002/jpln.201000255.
[36] M. Sperazza, J.N. Moore, M.S. Hendrix, High-resolution particle size analysis of naturally
occurring very fine-grained sediment through laser diffractometry, J. Sediment. Res. 74 (2004)
736–743. https://doi.org/10.1306/031104740736.
[37] M.M.M.G.P.G. Mantilaka, H.M.T.G.A. Pitawala, D.G.G.P. Karunaratne, R.M.G. Rajapakse,
Nanocrystalline magnesium oxide from dolomite via poly(acrylate) stabilized magnesium
hydroxide colloids, Colloids Surfaces A Physicochem. Eng. Asp. 443 (2014) 201–208.
https://doi.org/10.1016/j.colsurfa.2013.11.020.
[38] D.L. Marchisio, L. Rivautella, A.A. Barresi, Design and scale-up of chemical reactors for
nanoparticle precipitation, AIChE J. 52 (2006) 1877–1887. https://doi.org/10.1002/aic.10786.
[39] M. Kucher, D. Babic, M. Kind, Precipitation of barium sulfate: Experimental investigation about
the influence of supersaturation and free lattice ion ratio on particle formation, Chem. Eng.
Process. Process Intensif. 45 (2006) 900–907. https://doi.org/10.1016/j.cep.2005.12.006.
[40] H.C. Schwarzer, W. Peukert, Combined experimental/numerical study on the precipitation of
nanoparticles, AIChE J. 50 (2004) 3234–3247. https://doi.org/10.1002/aic.10277.
[41] K. Tong, X. Song, G. Xiao, J. Yu, Colloidal processing of Mg(OH)2 aqueous suspensions using
sodium polyacrylate as dispersant, Ind. Eng. Chem. Res. 53 (2014) 4755–4762.
https://doi.org/10.1021/ie5002857.
[42] C. Henrist, J.P. Mathieu, C. Vogels, A. Rulmont, R. Cloots, Morphological study of magnesium
24
hydroxide nanoparticles precipitated in dilute aqueous solution, J. Cryst. Growth. 249 (2003)
321–330. https://doi.org/10.1016/S0022-0248(02)02068-7.
[43] N.G. Özcan-Taşkin, G. Padron, A. Voelkel, Effect of particle type on the mechanisms of break
up of nanoscale particle clusters, Chem. Eng. Res. Des. 87 (2009) 468–473.
https://doi.org/10.1016/j.cherd.2008.12.012.
[44] A. Mersmann, Crystallization Technology Handbook, CRC Press, 2010.
[45] P.H. Karpiński, J. Bałdyga, Precipitation Processes, in: Handb. Ind. Cryst., Cambridge
University Press, 2019: pp. 216–265. https://doi.org/10.1017/9781139026949.008.
[46] G. V. Lowry, R.J. Hill, S. Harper, A.F. Rawle, C.O. Hendren, F. Klaessig, U. Nobbmann, P.
Sayre, J. Rumble, Guidance to improve the scientific value of zeta-potential measurements in
nanoEHS, Environ. Sci. Nano. 3 (2016) 953–965. https://doi.org/10.1039/c6en00136j.
[47] J.X. Lin, L. Wang, Adsorption of dyes using magnesium hydroxide-modified diatomite, Desalin.
Water Treat. 8 (2009) 263–271. https://doi.org/10.5004/dwt.2009.786.
[48] G.A. Parks, The Isoelectric Points of Solid Oxides, Solid Hydroxides, and Aqueous Hydroxo
Complex Systems, Chem. Rev. 65 (1965) 177–198. https://doi.org/10.1021/cr60234a002.
[49] V.A. Phillips, J.L. Kolbe, H. Opperhauser, Effect of pH on the growth of Mg(OH)2 crystals in
an aqueous environment at 60°C, J. Cryst. Growth. 41 (1977) 228–234.
https://doi.org/10.1016/0022-0248(77)90050-1.
[50] G.S. Smith, Human color vision and the unsaturated blue color of the daytime sky, Am. J. Phys.
73 (2005) 590–597. https://doi.org/10.1119/1.1858479.
[51] X. Pan, Y. Wang, Z. Chen, D. Pan, Y. Cheng, Z. Liu, Z. Lin, X. Guan, Investigation of
antibacterial activity and related mechanism of a series of nano-Mg(OH)2, ACS Appl. Mater.
Interfaces. 5 (2013) 1137–1142. https://doi.org/10.1021/am302910q.