Experimental Response of a Rotor Supported on Flexure Pivot ...
Upload
khangminh22Category
view
0download
0
NASA/TM-2001-211227
ARL-TR-2568
Analysis of Ninety Degree Flexure Testsfor Characterization of Composite
Transverse Tensile Strength
T. Kevin O'Brien
U.S. Army Research Laboratory
Vehicle Technology Directorate
Langley Research Center, Hampton, Virginia
Ronald KruegerICASE
NASA Langley Research CenterHampton, Virginia
October 2001

The NASA STI Program Office ... in Profile
Since its founding, NASA has been dedicated tothe advancement of aeronautics and spacescience. The NASA Scientific and Technical
Information (STI) Program Office plays a keypart in helping NASA maintain this importantrole.
The NASA STI Program Office is operated byLangley Research Center, the lead center forNASA's scientific and technical information. The
NASA STI Program Office provides access to theNASA STI Database, the largest collection ofaeronautical and space science STI in the world.The Program Office is also NASA's institutionalmechanism for disseminating the results of itsresearch and development activities. These
results are published by NASA in the NASA STIReport Series, which includes the followingreport types:
TECHNICAL PUBLICATION. Reports ofcompleted research or a major significantphase of research that present the results ofNASA programs and include extensivedata or theoretical analysis. Includescompilations of significant scientific andtechnical data and information deemed to
be of continuing reference value. NASAcounterpart of peer-reviewed formalprofessional papers, but having less
stringent limitations on manuscript lengthand extent of graphic presentations.
TECHNICAL MEMORANDUM. Scientific
and technical findings that are preliminaryor of specialized interest, e.g., quick releasereports, working papers, andbibliographies that contain minimalannotation. Does not contain extensive
analysis.
CONTRACTOR REPORT. Scientific and
technical findings by NASA-sponsoredcontractors and grantees.
CONFERENCE PUBLICATION. Collected
papers from scientific and technicalconferences, symposia, seminars, or othermeetings sponsored or co-sponsored byNASA.
SPECIAL PUBLICATION. Scientific,technical, or historical information from
NASA programs, projects, and missions,often concerned with subjects havingsubstantial public interest.
TECHNICAL TRANSLATION. English-language translations of foreign scientificand technical material pertinent to NASA'smission.
Specialized services that complement the STIProgram Office's diverse offerings includecreating custom thesauri, building customizeddatabases, organizing and publishing researchresults ... even providing videos.
For more information about the NASA STI
Program Office, see the following:
• Access the NASA STI Program Home Pageat http://www.sti.nasa.gov
• E-mail your question via the Internet [email protected]
• Fax your question to the NASA STI HelpDesk at (301) 621-0134
• Phone the NASA STI Help Desk at(301) 621-0390
Write to:
NASA STI Help DeskNASA Center for AeroSpace Information7121 Standard Drive
Hanover, MD 21076-1320
NASA/TM-2001-211227
ARL-TR-2568
Analysis of Ninety Degree Flexure Testsfor Characterization of Composite
Transverse Tensile Strength
T. Kevin O'Brien
U.S. Army Research Laboratory
Vehicle Technology Directorate
Langley Research Center, Hampton, Virginia
Ronald KruegerICASE
NASA Langley Research Center
Hampton, Virginia
National Aeronautics andSpace Administration
Langley Research CenterHampton, Virginia 23681-2199
October 2001
The use of trademarks or names of manufacturers in the report is for accurate reporting and does not constitute an
and°fficialspaceend°rsement'AdministrationeitherortheeXpressedu.S. Army.°rimplied, of such products or manufacturers by the National Aeronautics
Available from:
NASA Center for AeroSpace Information (CASI)7121 Standard Drive
Hanover, MD 21076-1320
(301) 621-0390
National Technical Information Service (NTIS)
5285 Port Royal Road
Springfield, VA 22161-2171
(703) 605-6000
Analysis of Ninety Degree Flexure Tests
for Characterization of Composite
Transverse Tensile Strength
T. Kevin O'Brien 1 and Ronald Krueger 2
1 U.S. Army Research Laboratory, Vehicle Technology Directorate2ICASE
NASA Langley Research Center, Hampton, Virginia, U.S.A.
SUMMARY: Finite element (FE) analysis was performed on 3-point and 4-point
bending test configurations of ninety degree oriented glass-epoxy and graphite-epoxy
composite beams to identify deviations from beam theory predictions. Both linear andgeometric non-linear analyses were performed using the ABAQUS ® finite element code.
The 3-point and 4-point bending specimens were first modeled with two-dimensional
elements. Three-dimensional finite element models were then performed for selected 4-
point bending configurations to study the stress distribution across the width of the
specimens and compare the results to the stresses computed from two-dimensional plane-
strain and plane-stress analyses and the stresses from beam theory. Stresses for all
configurations were analyzed at load levels corresponding to the measured transverse
tensile strength of the materials.
For 3-point bend test configurations, both the linear and geometric non-linear 2D plane-
strain and plane-stress analyses yielded similar results. The maximum tensile stresses
under the center load nose calculated from the FE analysis were slightly lower than
stresses predicted by beam theory. The difference (maximum of 4%) was greatest for the
shortest span analyzed.
For 4-point bend test configurations, both the plane-stress and plane-strain 2D linear
analysis results agreed closely with beam theory except right below the load points.
However, 2D geometric non-linear analyses deviated slightly from beam theory
throughout the inner span as well as below the load points. Plane-stress results deviated
from beam theory more than plane-strain results. The maximum tensile stresses between
the inner span load points were slightly greater than the beam theory result. This
difference was greatest (maximum of 4%) for configurations with the shortest spans
between inner and outer load points. A contact analysis was also performed in order to
investigate the influence of modeling the roller versus modeling the support as a simple
boundary condition at one nodal point. A configuration with the shortest span between
inner and outer load points was modeled for the 24-ply and 36-ply IM7/8552 layups and
the 24-ply $2/8552 layup. Generally, for all configurations investigated, the discrepancy
between the FE and beam theory results became smaller (max. 2%) when the rollers were

modeledin conjunctionwithcontactanalysis.Hence,thebeamtheoryyieldsareasonablyaccuratevaluefor themaximumtensilestressin bendingcomparedto 2DFEanalysis.
The3D linearFEanalysisof the4-pointconfigurationsagreedcloselywithbeamtheory,exceptrightbelowtheloadpoints.The3D linearFEresultsat thespecimenedgeagreedwith 2Dplane-stressresults,andthe3D linearFEresultsin thecenterof thespecimenagreedwith 2D plane-strainresults.The 3D geometricnon-linearanalysesdeviatedslightlyfrombeamtheorythroughouttheinnerspanaswell asunderloadpoints.The3Dgeometricnon-linearFE resultsat the specimenedgeagreedwith the 2D plane-stressresults.For the 12.7mm (0.50 in.) wide IM7/8552specimens,the3D geometricnon-linear FE resultsin the centerof the specimenagreedwith 2D plane-strainresults.However,for the6.35mm (0.25in.) wide $2/8552specimens,the 3D geometricnon-linearFEresultsin thecenterwerelessthan2Dplane-strainresults,indicatingthatthesespecimenswerenotwideenoughto achievefull constraint.
Theutility of theFE resultsis primarily for guidancein thechoiceof beamthickness,width,andconfiguration.Forthe3-pointbendconfiguration,longerspansarepreferredto minimize the error in beamtheorydatareduction.Similarly, for the 4-point bendconfigurations,a longerspanbetweentheinnerandouterloadnoses,atleastequalto thespanbetweenthe inner loadnoses,resultsin lesserror comparedto beamtheory. Inaddition,theseFEresultsindicatethatthespanbetweentheinner loadnosesshouldnotbe too long to avoidobtaininga non-uniformmaximumstressbetweenthe inner loadnoses.Finally, the 3D analysisindicatesthat specimensshouldbe sufficientlywide toachieveafully constrainedstateof plane-strainatthecenterof thespecimenwidth.
KEYWORDS: transversetensilestrength,matrixcracking,finite elementanalysis,glassepoxy,graphiteepoxy,bendingtests
INTRODUCTION
Matrix ply cracking is a common initial damagemechanismin fiber reinforcedcomposites.Matrixply crackingaloneis seldomcatastrophicfor laminatessubjectedtomembraneloading.However,for compositestructuresthat undergobending,or otherout-of-planeloading,theformationof matrixcracksmayleadto immediatecatastrophicdelaminationformation and growth [1,2]. Hence, accuratecharacterizationof thetransversetensilestrengthof compositematerialsis neededto accuratelypredictmatrixply crackingin thesestructures.
Previously,90 degreeunidirectionalglass-epoxylaminates [3] and carbon-epoxylaminates[4] were testedin threeand four point bendingto characterizecompositetransversetensilestrength.Theinfluenceof edgeflawsdueto machining,andsurfaceflawsdueto manufactureandhandling,wereassessedby testingspecimensin their as-manufacturedand machinedcondition.In addition, specimenswith polishededges,and/orbottomfailuresurfaces,weretested.Subsequent3-pointand4-pointbendtestsofglass-epoxylamina and carbon-epoxylamina [5] were also performedundercyclic

loading.In eachof thesestudies,themaximumtensilestressat failureundermonotonicandcyclicloadingwasdeterminedusingbeamtheoryexpressions.
Thegoalof this investigationwasto studyunderwhichconditionssimplebeamtheoryyieldedsufficientlyaccurateresultswhenusedto calculatethestressesin the3-pointand4-pointbendingspecimens.For the entireinvestigation,theABAQUS®finite elementsoftwarewas used.For comparison,both linear and geometricnonlinearanalysisprocedureswere used.The three-pointand four-pointbendingspecimenswere firstmodeledentirelywith two-dimensionalelements.Then,three-dimensionalfinite elementmodelswereusedto studythestressdistributionacrossthewidth of thespecimensandcomparethe resultsto the stressescomputedfrom two-dimensionalplane-strainandplane-stressanalysesandthestressesfromsimplebeamtheory.
Materials
FE analyses were performed on two materials, $2/8552 glass-epoxy [3,5] and IM7/8552
carbon-epoxy [4,5]. Material properties used in the analysis are given in Table 1. The
$2/8552 specimens were cut from a 24-ply panel. The average panel thickness was 5.56
mm, corresponding to an average ply thickness of 0.231 mm. The IM7/8552 specimens
were cut from both 24-ply and 36-ply panels. The average panel thickness was 3.29 mm
for the 24-ply panel and 4.94 mm for the 36-ply panel, corresponding to an average plythickness of 0.137 mm.
Specimen Configurations
Three-point bending tests were evaluated in three configurations (A, B, and C)
corresponding to span lengths of 25.4, 50.8, and 76.2 mm (figure l(a)). Four point
bending tests were evaluated using the four configurations (A1, A2, B2, B3) shown in
figure l(b).
Beam Theory
For the three point bending configurations shown in figure 1(a), with span length, s, and
width, b, the tensile bending stress distribution at the bottom of the beam is shown in
figure2a. Specimen strengths were determined in references 3&4 from the beam theory
expression for the maximum tension stress, Omax, under the center load nose using the
maximum load at failure, Pc, and the average specimen thickness, t_vg,
3PcSI_max -- 2 (1)
2bt avg
For the four point bending tests shown in figure 1(b), with outer span, s, inner span, s-g,
and width, b, the tensile bending stress distribution at the bottom of the beam is shown in
figure 2b. Specimen strengths were determined in references 3&4 from the beam theory

expressionfor themaximumuniformtensionstress,(Ymax,betweentheinnerloadpointsusingthemaximumloadat failure,Pc,andtheaveragespecimenthickness,t_vg,
(2)
Finite Element (FE) Analysis Formulation
Two typical two-dimensional finite element models of the specimens, boundary
conditions and loads applied in the simulations are shown in Figure 3. A typical three-
dimensional finite element model of the specimens used in the simulations is shown inFigure 4. For both the 2D and 3D analyses, the ABAQUS ® input file was generated
automatically using a FORTRAN routine (see Appendix 1). This user-written routine
required only the input of the geometrical data, the material property data given in Table
I, and the mesh parameters shown in Figure 3. The use of this routine allowed the quick
generation of a large number of models for the different specimen configurations and
simplified the otherwise tedious mesh generation and refinement.
The two-dimensional specimen cross sections were modeled using eight-noded
quadrilateral plane-strain (CPE8R) or plane-stress (CRS8R) elements using quadratic
shape functions and a reduced (2x2) integration scheme. These elements were selected to
avoid shear locking in bending, which is common in first-order, fully integrated elements,
such as CPE4 and CPS4 [6]. The numerical formulation of first order elements gives rise
to shear strains that do not really exist. Therefore, these elements are too stiff in bending,
and many elements over the thickness are required to obtain acceptable results. Elements
where a lower-order, reduced integration are used to form the element stiffness, such as
the CPE8R and CPS8R elements used in this study, usually require fewer elements
through the thickness, provide more accurate results in bending, and yield reduced
running times. Loads were prescribed at single nodal points in the models. However, for
configuration B2 that exhibited the greatest deviation from beam theory, rollers were also
included in the model at the outside load points (see Appendix 2).
For the 3D analyses, specimens were modeled with ABAQUS ® solid, twenty-noded,
C3D20R hexahedral elements using quadratic shape functions and a reduced (2x2x3)
integration scheme. The C3D20R element utilizes reduced integration to form the
element stiffness, and hence, provides accurate results in bending which yield reduced
running times compared to other 3D elements [6,7].
Computation of Stresses
Averaged stresses at nodes were computed along the bottom (tension) surface of the
beam specimens where the highest tensile stresses occur. The results were extracted foradditional post-processing directly from the ABAQUS ® binary result file using a user
written FORTRAN routine (See Appendix 1) [6,7].

Two Dimensional FE Analysis Results
Three Point Bending
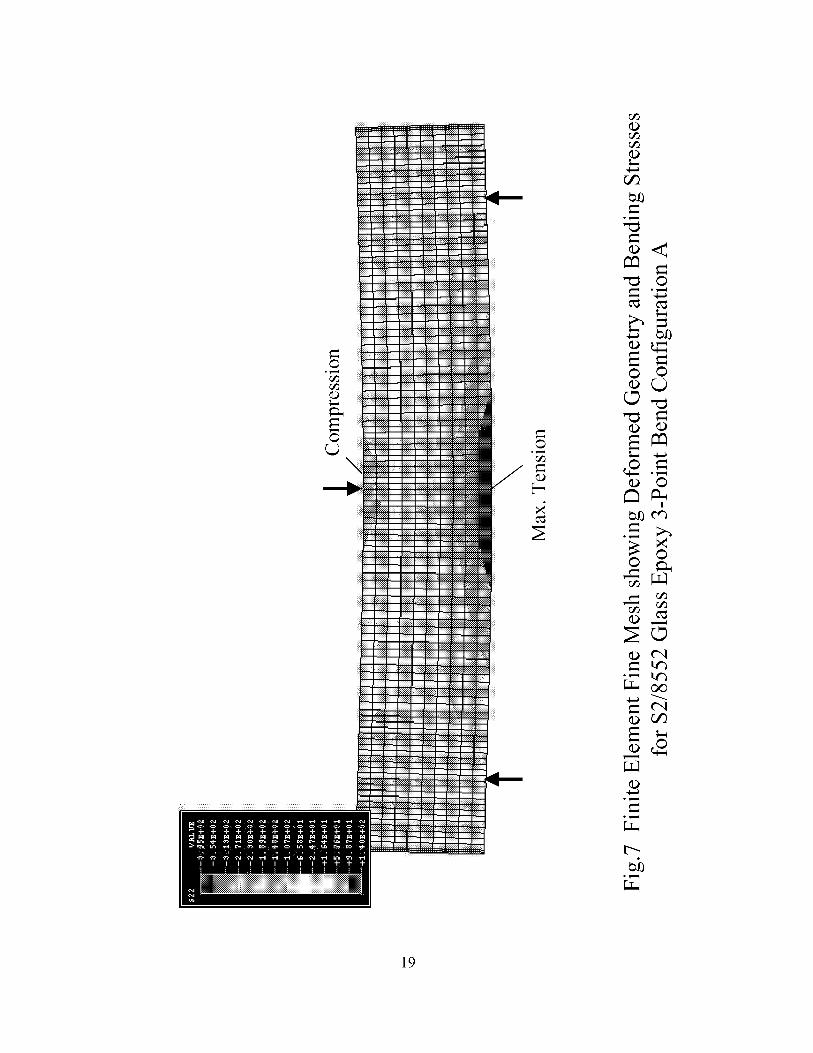
Figure 5 shows the finite element mesh for the $2/8552 glass epoxy material, 3-point
bend configuration A (figurela). The mesh is shown in the deformed position at the
failure load with the stress contours superimposed illustrating the compression stress near
the point of load application at the top of the beam and the high tensile stresses at thebottom of the beam under the center load nose. Tension stress results at the bottom of the
beam will be quantified in later figures. Similar meshes were generated for the other 3-
point bend configurations in figure 1a using the technique described earlier.
The open symbols in figure 6 show the stresses calculated from the 2D, plane-strain,
linear finite element analysis, ¢JVE,normalized by the maximum tension stress calculated
from the beam theory, ¢JBT ((_max in equation 1). For comparison, the normalized stress
distribution from beam theory is superimposed on the finite element results. This
comparison indicates that the peak tensile stress calculated from the finite element
analysis is slightly (4%) less than the beam theory prediction. Similar results were
obtained for the 2D plane-stress linear finite element analysis, as well as the 2D
geometric non-linear plane-strain and plane-stress FE analyses. In order to establish the
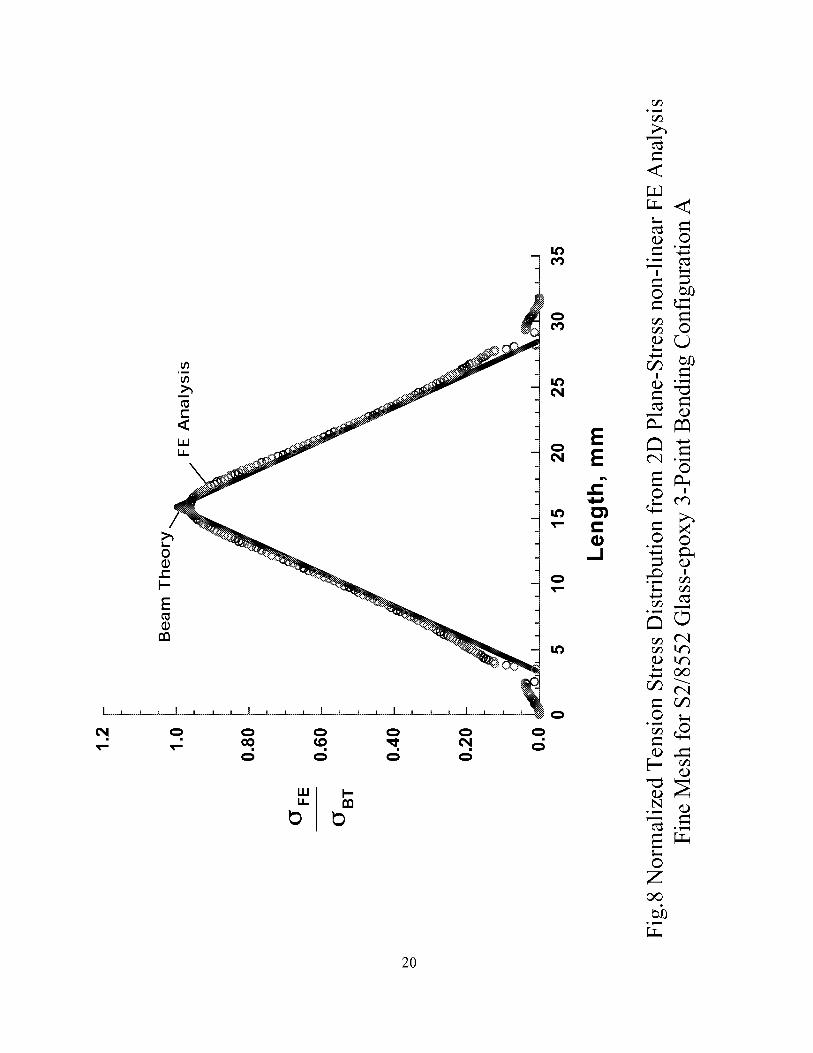
accuracy of this comparison, the 2D geometric non-linear analysis was also performed
using a refined mesh as shown in figure 7. This analysis yielded more stress results in the
critical area under the load nose. However, this refined mesh yielded essentially no
change in the maximum stress calculated directly under the load nose, which was also
less than the beam theory (figure 8).
Figure 9 summarizes the peak stress comparisons for the 24-ply $2/8552 glass-epoxy 3-
point bend configurations in terms of percent Ao, where
A_ - I BT - (YVE xl00 (3)
I_BT
As shown in figure 9, the greatest difference between all the 2D FE analyses and the
beam theory was about 4% for the shortest span, configuration A. The longer span
configurations had difference between 1% and 2%.
Figure 10 summarizes the peak stress comparisons for the 24-ply IM7/8552
carbon-epoxy 3-point bend configurations. The greatest difference between all the 2D FE
analyses and the beam theory was about 2% for the shortest span, configuration A. The
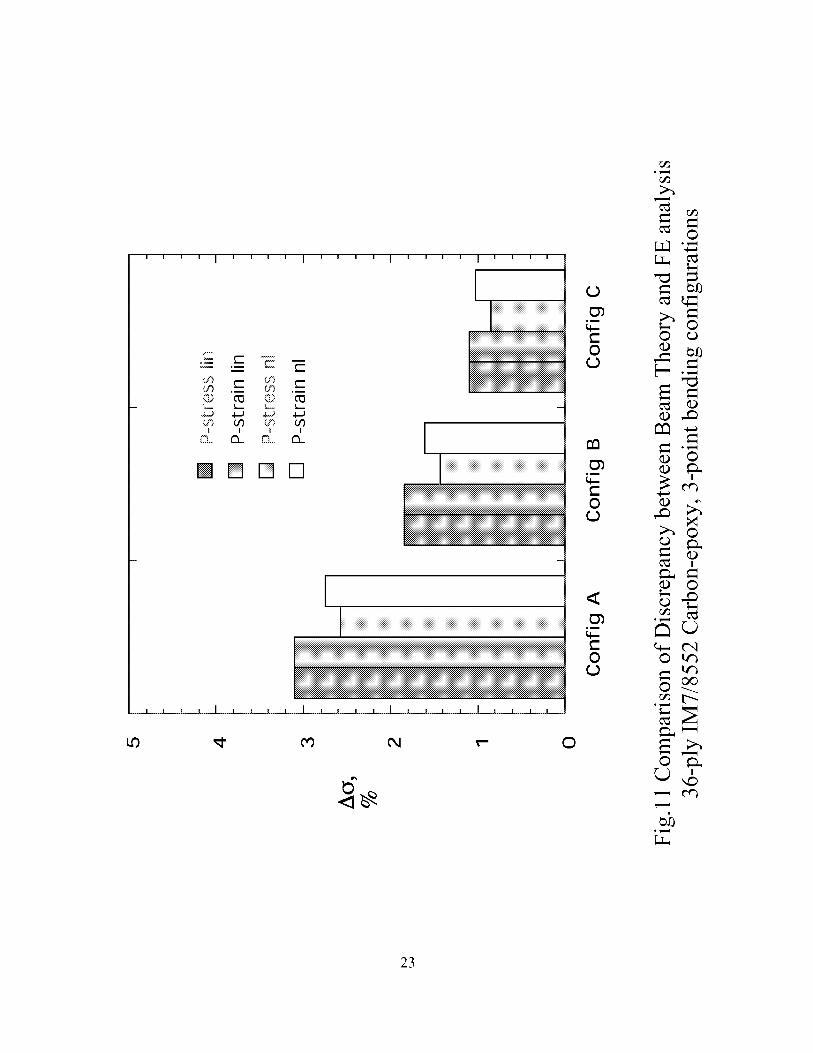
longer span configurations had differences of 1% or less. Figure 11 summarizes the peak
stress comparisons for the 36-ply IM7/8552 carbon-epoxy 3-point bend configurations.
The greatest difference between all the 2D FE analyses and the beam theory was about
3% for the shortest span, configuration A. The longer span configurations had differencebetween 1% and 2%.

Theresultsfrom figures10-11indicatethatthebeamtheoryresultsbecomelessaccuratefor thickerbeamsof agivenspan,andfor shorterspansof thesamebeamthickness.Thisis thesametrendexpectedfor thesignificanceof transverseshearingdeformationin 3-point bendingof beams.This shearingdeformationis notreflectedin thebeamtheoryequations1and2.
Four Point Bending
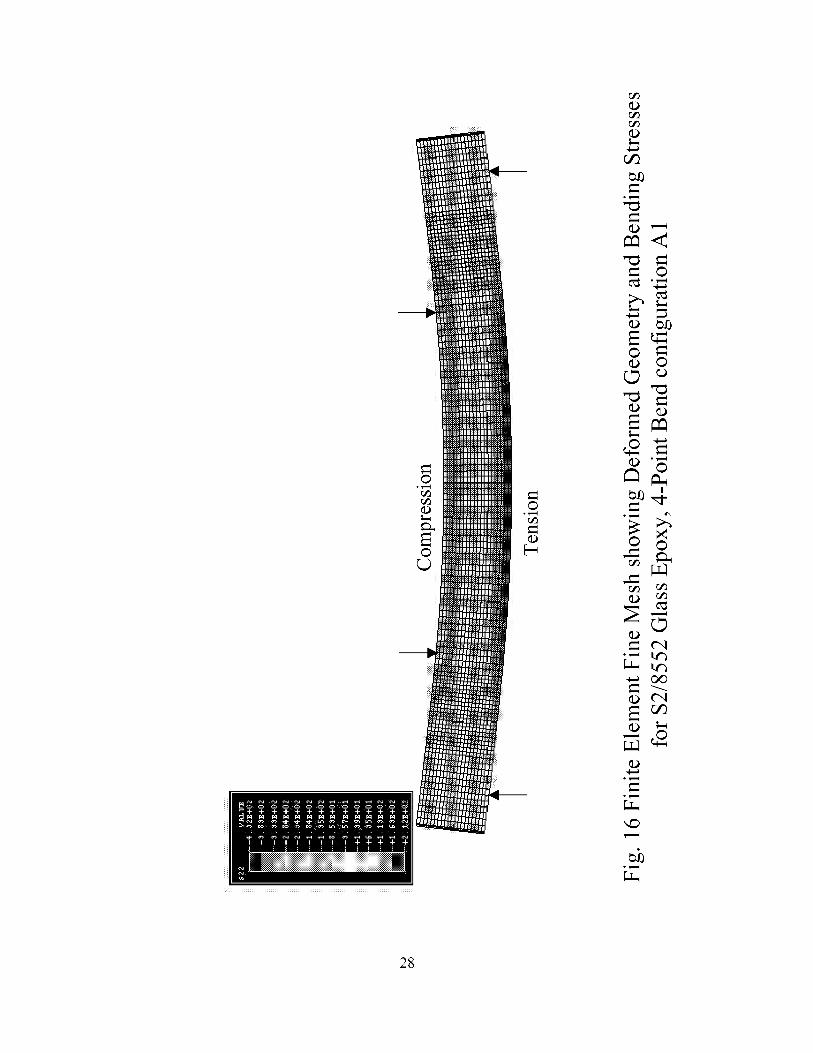
Figure 12 shows the finite element mesh for the $2/8552 glass-epoxy material, 4-point
bend configuration A1 (figurelb). The mesh is shown in the deformed position at the
failure load with the stress contours superimposed illustrating the compression stress
between the two inner load noses at the top of the beam and the high tensile stresses atthe bottom of the beam under the inner load noses. Tension stress results at the bottom of
the beam will be quantified in later figures. Similar meshes were generated for the other
4-point bend configurations in figure lb using the technique described earlier.
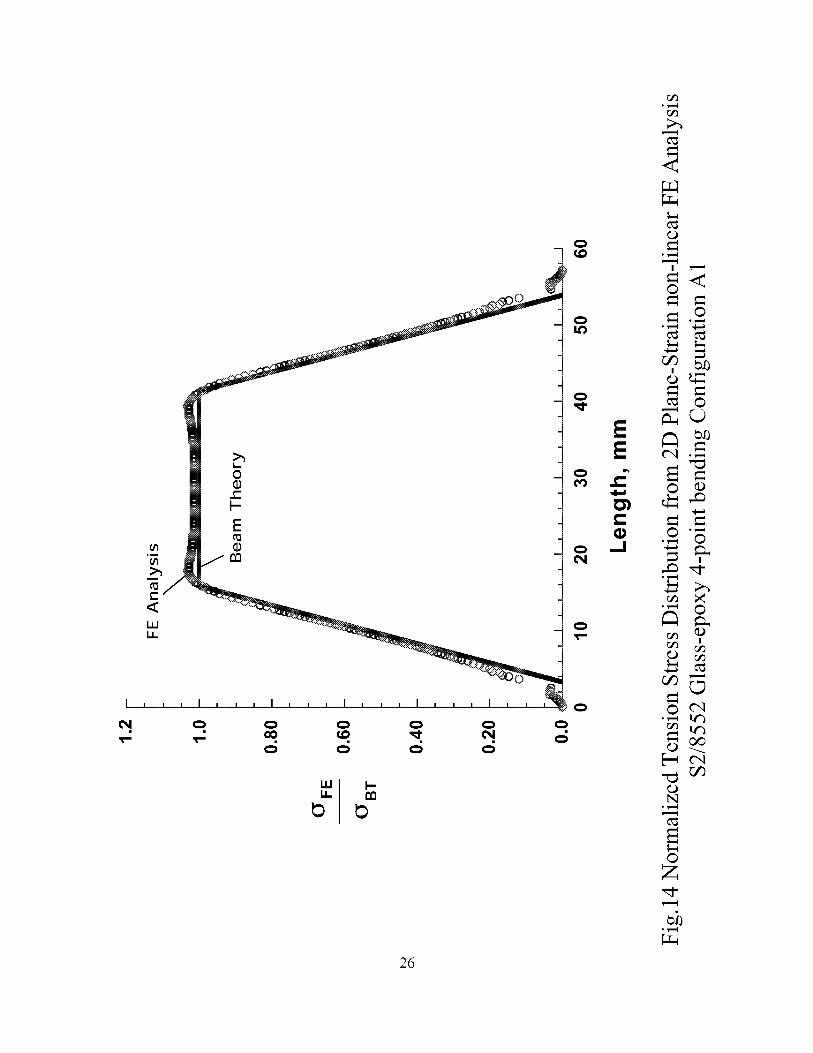
The open symbols in figure 13 show the stresses calculated from the 2D plane-strain,
linear finite element analysis, (YvE, normalized by the maximum tension stress calculated
from the beam theory, (YBT (Gmax in equation 2). For comparison, the normalized stress
distribution from beam theory is superimposed on the finite element results. This
comparison indicates that the peak tensile stress calculated from the finite element
analysis is slightly less than the beam theory prediction just below the load nose as
observed in the 3-point bend case. However, the 4-point bend FE results become slightly
greater than the beam theory stress just inside the load nose before assuming the beam
theory result in the majority of the span between the inner load noses. Similar results
were obtained for the 2D plane-stress, linear finite element analysis. The 2D plane-strain
geometric non-linear FE analysis yielded a similar FE stress distribution, except the
plateau in the majority of the span between the inner load noses was larger (1.5%) than
the beam theory result (figure 14). The 2D plane-stress, geometric non-linear FE analysis,
yielded a similar FE stress distribution, but with an even greater discrepancy (2.5%) from
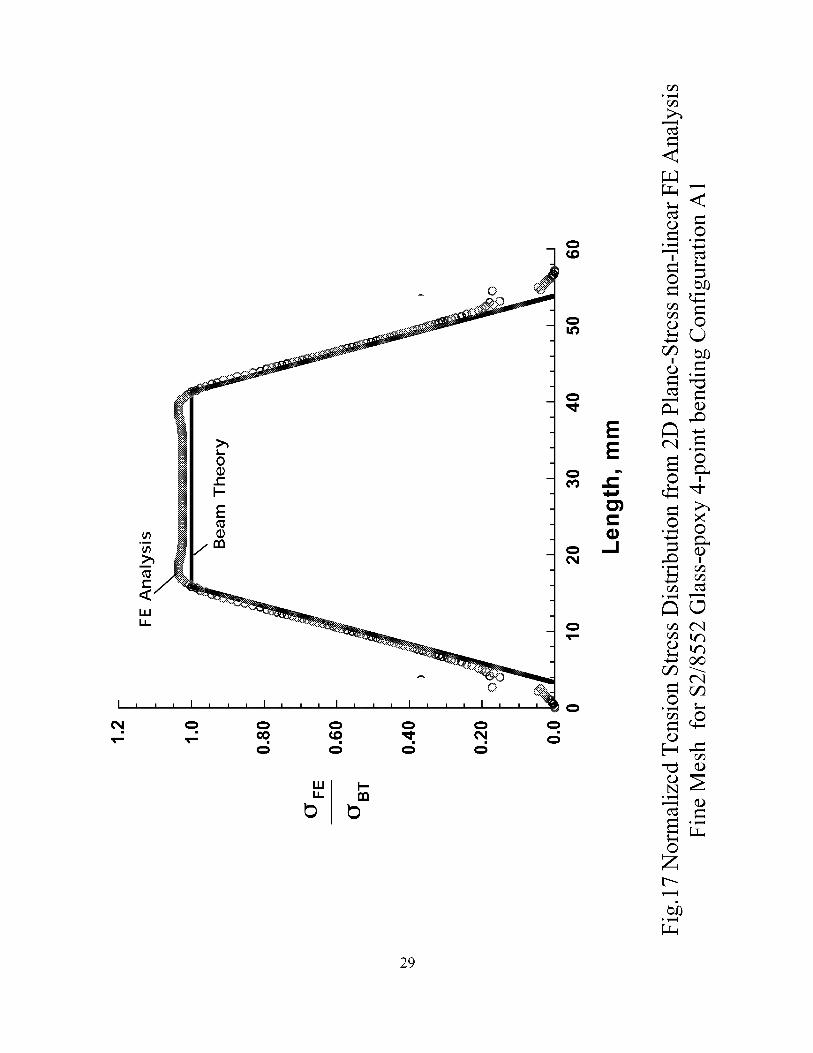
the beam theory between the two center load noses (figure 15). In order to establish the
accuracy of this comparison, the 2D geometric non-linear analysis was also performed
using a refined mesh as shown in figure 16. This yielded more stress results between the
inner load noses, but there was essential no change in the plateau of the distribution
between the inner load noses (figure 17). Figures 18 a-d compare the 2D geometric non-
linear plane-strain and plane-stress results in terms of percent Ao (equation 3) between
the inner load noses for the four $2/8552 glass-epoxy 4-point bend configurations
(figurelb). For all four configurations, the plane-stress results differ from the beam
theory predictions by 0.5 to 1.5% more than the plane-strain results.
The 2D plane-stress geometric non-linear FE results in terms of percent Ao (equation 3)
between the inner load noses are summarized for all four $2/8552 glass epoxy 4-point
bend configurations in figure 19. For the plateau in the majority of the span between the
inner load noses, the greatest discrepancy between the FE and beam theory results occurs
for configurations B2 (4%) and A1 (2.5%). These two configurations have the shortest
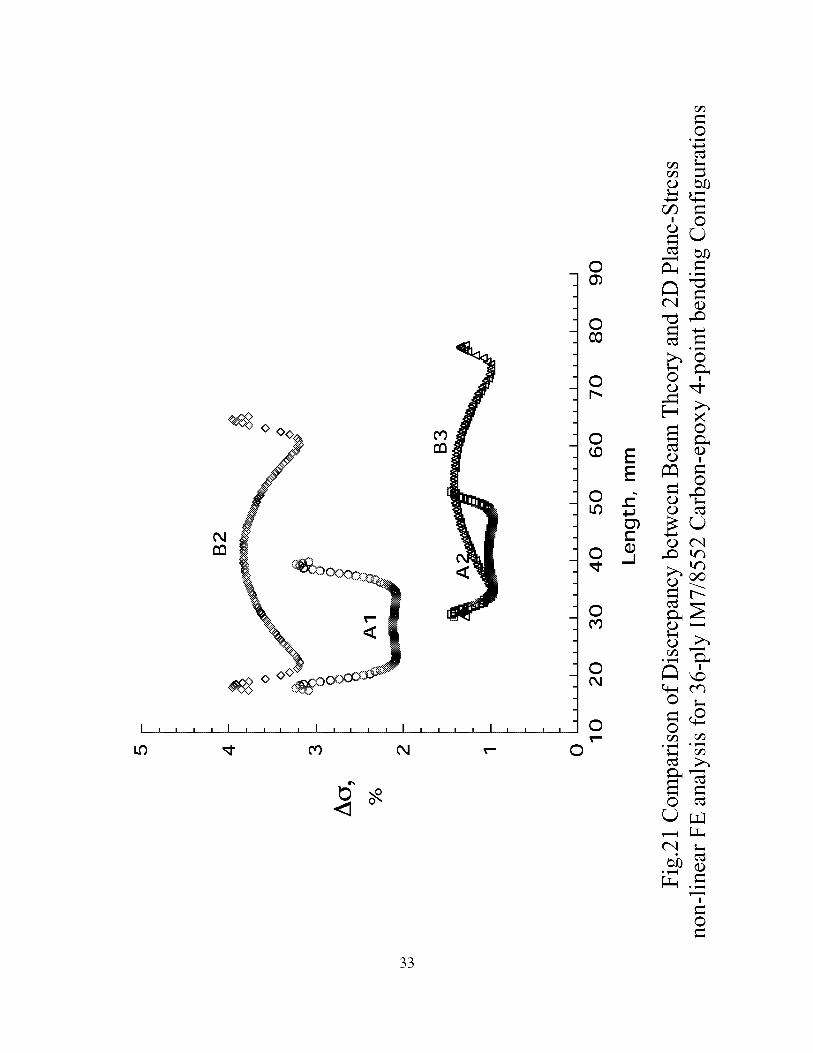
spanbetweentheinner andouterloadnoses(12.7mm). Figure19alsoillustratesthenon-uniformstressdistributionbetweentheinner loadnosesfor thetwo configurations,B2 andB3, with thegreatestinnerspan,s-g= 50.8mm. Thesesametrendswerenotedfor the24-ply(figure20) and36-ply(figure21) IM7/8552carbon-epoxy,4-pointbendconfigurations.Thethinner24-plylaminatehadslightlylowerdiscrepancies(only3%forconfigurationB2, for example)than the thicker36-ply laminateof thesamematerial.However,the non-uniformstressdistributionbetweenthe inner load noseswasmorepronouncedin thethinnerlaminates.
Contact Analysis
A contact analysis was performed in order to investigate the influence of modeling the
roller versus modeling the support as a simple boundary condition at one nodal point (see
appendix 2). It was expected that accounting for the roller would change the contact
location and result in a shorter span, s, of the specimen and thus result in a different stress
distribution along the bottom surface of the specimen. The roller support was modeled
and corresponding contact analysis was performed for specimen configuration B2, only,
because discrepancy in stresses between the finite element and the beam theory results
were most pronounced for this configuration as shown in Figures 19-21. The B2
configuration was modeled for the 24-ply and 36-ply IM7/8552 layups and the 24-ply
$2/8552 layup. As shown in the appendix, for all configurations investigated the
discrepancy between the FE and beam theory results became smaller (max. 3%) when the
rollers were modeled in conjunction with contact analysis instead of simple supported
boundary conditions. Hence, the beam theory yields a reasonably accurate value for the
maximum tensile stress in bending compared to 2D FE analysis.
Three Dimensional FE Analysis results
The $2/8552 glass-epoxy material, 4-point bend configuration B2 (figurelb) was chosen
for the 3D analysis since it exhibited the greatest deviation from beam theory in the 2D
non-linear analysis. Figure 22 shows the finite element mesh for a 6.35mm wide $2/8552
glass-epoxy, 4-point bend configuration B2. The mesh is shown in the deformed position
at the failure load. The 3D model had the same in-plane mesh refinement as the 2D
analyses, but with ten elements across the specimen width.
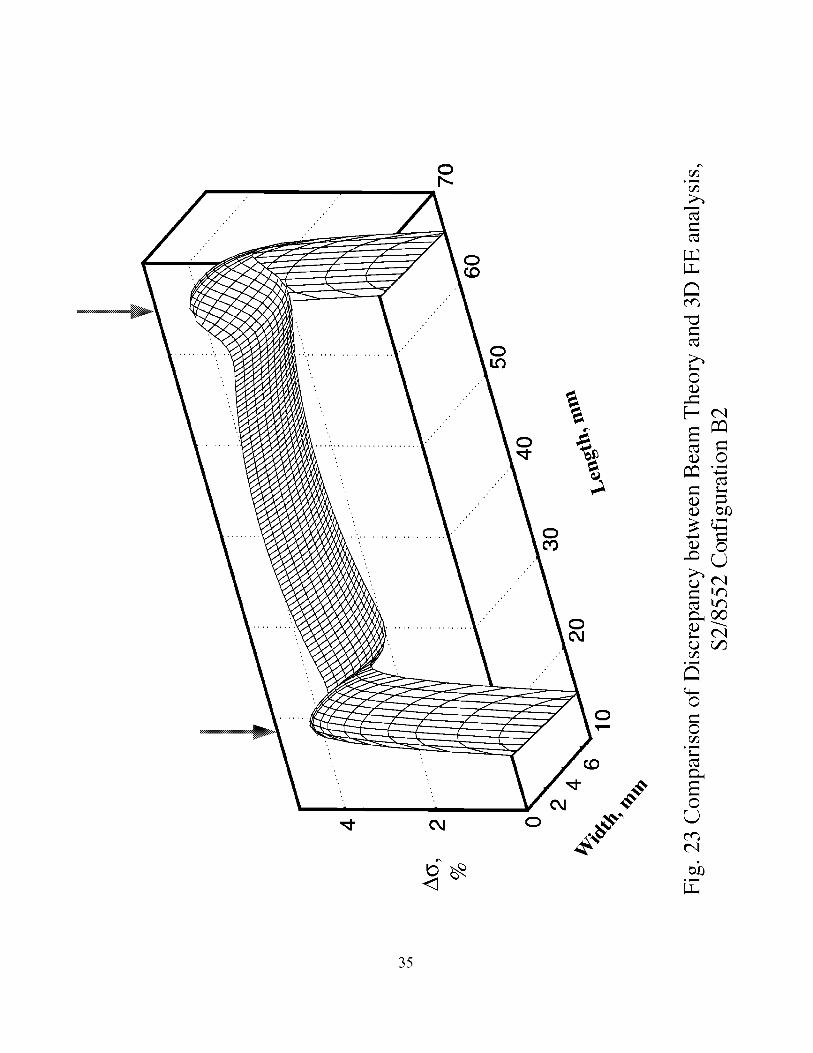
Figure 23 shows the 3D geometric non-linear FE stress results in terms of percent Ao
(equation3) between the inner load noses and across the specimen width. Near the load
noses, the stresses peak near the center of the specimen width. However, between the
load noses the stress peaks near the edges of the specimen. Ideally, the stresses
calculated near the specimen edges should be in good agreement with the 2D plane-stress
results and the stresses calculated near the center of the specimen should be in good
agreement with the 2D plane-strain results. Figure 24a compares the 3D stresses at the
specimen edge to the 2D plane-stress results for both the linear and geometric non-linear
cases. Good agreement was found in both cases, with only the non-linear case showing
the significant deviation from the beam theory result between the inner load noses. Figure
24b compares the 3D stresses at the center of the specimen width to the 2D plane-strain
resultsfor boththelinearandgeometricnon-linearcases.Goodagreementwasfoundforthe linearcase,with no significantdeviationfrom thebeamtheoryresultbetweentheinnerloadnoses.However,the3Dnon-linearcaseindicatedagreaterdeviationfromthebeamtheoryresultbetweentheinner loadnoses(4%)thandidthe2Dplane-strainresult(3%).This indicatedthat thesebeamswerenot quite wide enoughto achievea fullyconstrained(plane-strain)conditionatthespecimencenter.
Toinvestigatetheinfluenceof specimenwidthfurther,a 3Danalysiswasalsoperformedfor a 12.7mmwide, 24-ply, IM7/8552carbon-epoxy,4-pointbend configurationA1(figurelb). Thisconfigurationwasusedin reference5 to characterizetransversetensionfatiguelife. Figure25 showsthefiniteelementmeshfor the24-ply,IM7/8552graphite-epoxymaterial,4-pointbendconfigurationA1. Themeshis shownin the deformedpositionatthefailure load.The3Dmodelhadthesamein-planemeshrefinementasthe2Danalyses,butwith tenelementsacrossthespecimenwidth.
Figure26showsthe3Dgeometricnon-linearFEstressresultsin termsof percentAo(equation3)betweentheinnerloadnosesandacrossthespecimenwidth.Figure27acomparesthe3Dstressesatthespecimenedgeto the2Dplane-stressresultsfor boththelinearandgeometricnon-linearcases.Goodagreementwasfoundinbothcases,withonlythenon-linearcaseshowingaslightdeviation(1.5%) fromthebeamtheoryresultbetweentheinnerloadnoses.Figure27bcomparesthe3Dstressesatthecenterof thespecimenwidthtothe2Dplane-strainresultsforboththelinearandgeometricnon-linearcases.Goodagreementwasfoundfor thelinearcase,withnosignificantdeviationfromthebeamtheoryresultbetweentheinnerloadnoses.Furthermore,for this12.7mmwidespecimen,therewasalsogoodagreementbetweenthe2Dnon-linearplane-strainsolutionandthe3Dnon-linearsolutionatthecenterof thespecimenwidth,indicatingthatafullyconstrained(plane-strain)conditionhadbeenachievedatthespecimencenter.Boththe2Dand3Dnon-linearanalysesresultsindicatedaslight(1.5%)deviationfromthebeamtheoryatthespecimencenter.
Analysis of Results
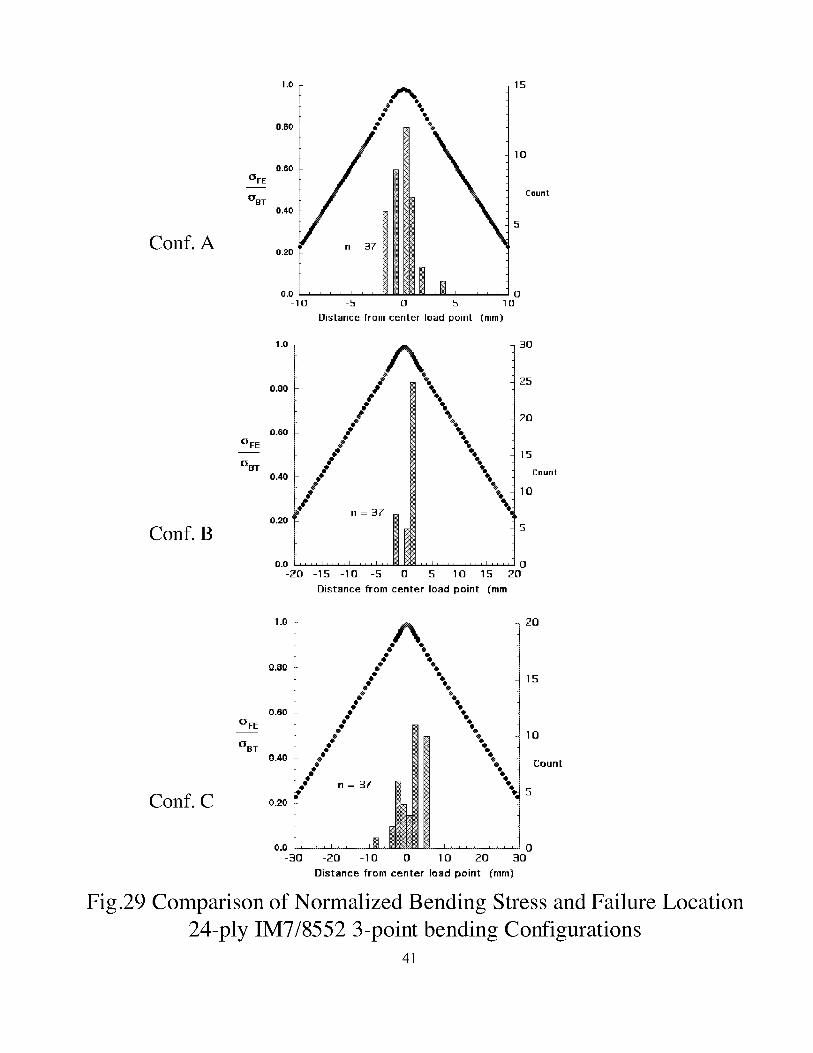
Figures 28-30 compare the 2D stress analysis results for 3-point bend configurations A,
B, and C for the $2/8552, 24-ply IM7/8552, and 36-ply IM7/8552 materials, respectively,
to the histogram of failure locations measured for these materials [4]. The histograms
show the location and frequency of failures for the number of replicates tested of a given
configuration. These figures indicate that most failures occur near the center of the span,
but not always directly below the central load nose where the tensile stress is a maximum
(figure 2a). As noted in references 3-5, all failures do not occur directly below the load
nose because the failure is sensitive to the presence of flaws in the specimen
microstructure. Both the beam theory and the finite element analysis assume that the
material is uniform and homogeneous throughout. Hence, it would be meaningless to
reduce the data based on the FE stress at a given span location relative to the center loadnose because the failure is due to the local stresses associated with micro-structural flaws.
Rather, in order to characterize the strength and the associated volume dependence, data

are fit to either a normalor Weibull distributionrankedaccordingto the calculatedmaximumstressatfailurefromthebeamtheory[4,5].
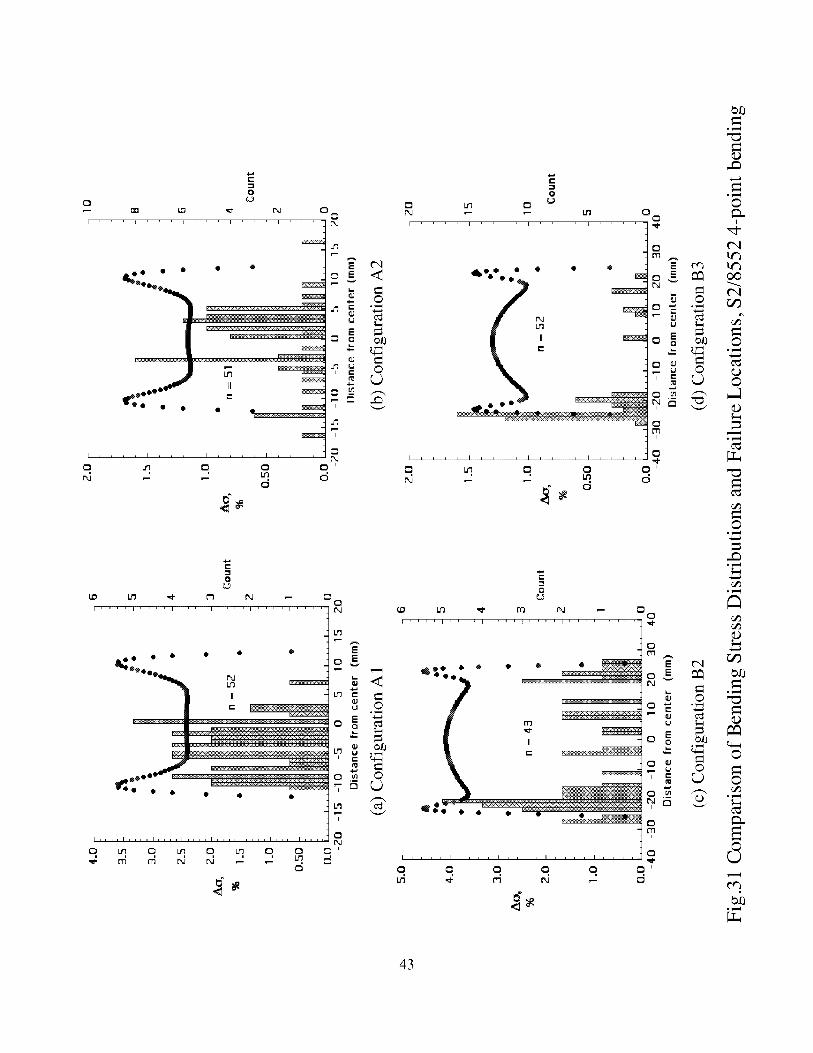
Figures31a-dcomparethe2D stressanalysisresultsfor 4-pointbendconfigurationsA1,A2, B2, andB3,respectively,for the $2/8552glassepoxymaterialto thehistogramoffailure locationsmeasuredfor thesematerials[3,4]. Thesefiguresindicatethat mostfailuresoccurnearthecenterof the span,betweenthe inner two loadnoseswherethetensilestressis a maximum(figure 2b). Theremainingfailuresoccurbelow the innerloadnosesaswasobservedin the3-pointbendspecimens.
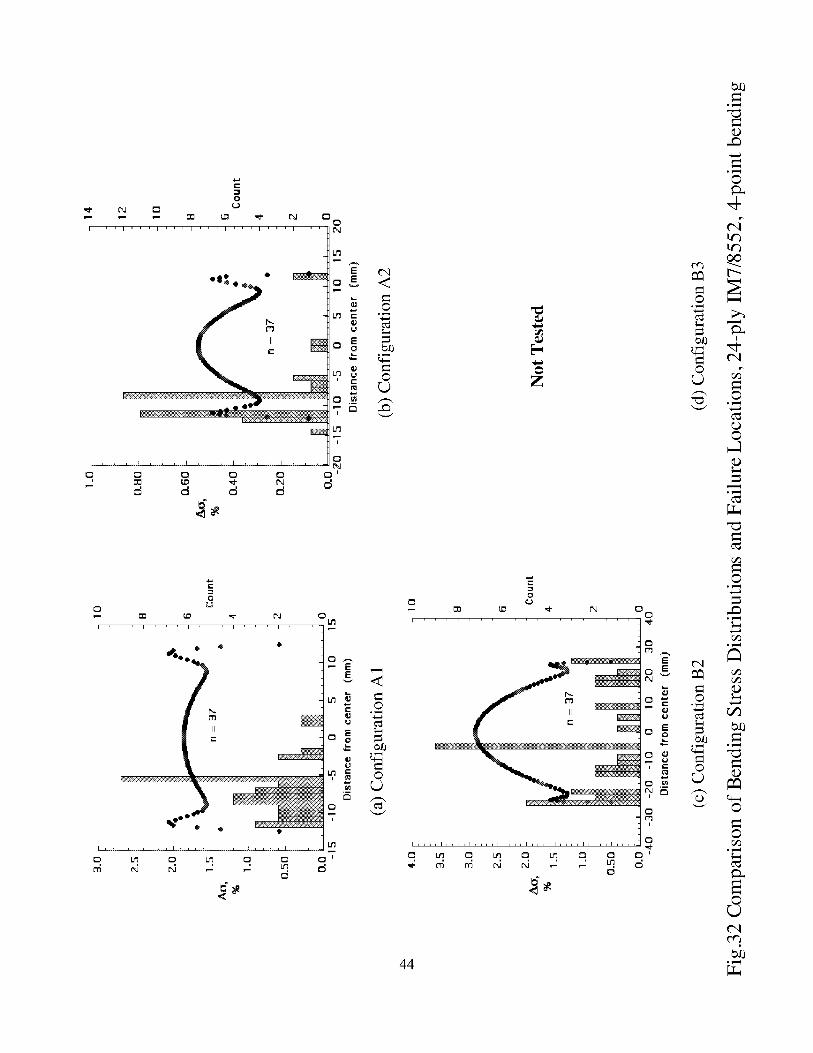
Figures32a-ccomparethe2Dstressanalysisresultsfor 4-pointbendconfigurationsA1,A2, and B2, respectively,for the 24-ply IM7/8552 carbon-epoxymaterial to thehistogramof failure locationsmeasuredfor thesematerials[4]. Figures33 a-dcomparethe 2D stressanalysisresultsfor 4-pointbend configurationsA1, A2, B2, and B3,respectively,for the36-ply IM7/8552carbon-epoxymaterialto thehistogramof failurelocationsmeasuredfor thesematerials[4]. Unlike the glass-epoxymaterial,a greaterpercentageof failuresoccurbelow the inner loadnosesfor all the configurations.Inreference4, thiswasattributedto the largevariabilityin specimenthicknessobservedinthegraphitematerial,whichisnotaccountedfor in eitherthebeamtheoryor FEanalysis,but leadsto a biasedloading towards one, or the other, inner load nosesin theexperiments.
Theutility of theFE resultsis primarily for guidancein thechoiceof beamthickness,width,andconfiguration.Forthe3-pointbendconfiguration,longerspansarepreferredto minimize the error in beamtheorydatareduction.Similarly, for the 4-point bendconfigurations,a longerspanbetweentheinnerandouterloadnoses,atleastequalto thespanbetweenthe inner loadnoses,resultsin lesserror comparedto beamtheory. Inaddition,theseFEresultsindicatethatthespanbetweentheinner loadnosesshouldnotbe too long to avoidobtaininga non-uniformmaximumstressbetweenthe inner loadnoses.Finally, the 3D analysisindicatesthat specimensshouldbe sufficientlywide toachieveafully constrainedstate&plane-strain at the center of the specimen width.
Conclusions
For 3-point bend test configurations, both the linear and geometric non-linear 2D plane-
strain and plane-stress analyses yielded similar results. The maximum tensile stresses
under the center load nose calculated from the finite element (FE) analysis were slightly
lower than stresses predicted by beam theory. The difference (maximum of 4%) was
greatest for the shortest span analyzed.
For 4-point bend test configurations, both the plane-stress and plane-strain 2D linear
analysis results agreed closely with beam theory except right below the load points.
However, 2D geometric non-linear analyses deviated slightly from beam theory
throughout the inner span as well as below the load points. Plane-stress results deviated
from beam theory more than plane-strain results. The maximum tensile stresses between
the inner span load points were slightly greater than the beam theory result. This

differencewas greatest(maximumof 4%) for configurationswith the shortestspansbetweeninnerandouterloadpoints.A contactanalysiswasalsoperformedin ordertoinvestigatethe influenceof modelingtheroller versusmodelingthesupportasa simpleboundaryconditionatonenodalpoint.TheB2configurationwasmodeledfor the24-plyand 36-ply IM7/8552 layups and the 24-ply $2/8552 layup. Generally, for allconfigurationsinvestigated,the discrepancybetweenthe FE and beamtheoryresultsbecamesmaller(max.2%)whentherollersweremodeledin conjunctionwith contactanalysis.Hence,thebeamtheoryyieldsa reasonablyaccuratevaluefor the maximumtensilestressinbendingcomparedto2D FEanalysis.
The3D linearFEanalysisof the4-pointconfigurationsagreedcloselywithbeamtheory,exceptrightbelowtheloadpoints.The3D linearFEresultsat thespecimenedgeagreedwith 2Dplane-stressresults,andthe3D linearFEresultsin thecenterof thespecimenagreedwith 2D plane-strainresults.The 3D geometricnon-linearanalysesdeviatedslightlyfrombeamtheorythroughouttheinnerspanaswell asunderloadpoints.The3Dgeometricnon-linearFE resultsat the specimenedgeagreedwith the 2D plane-stressresults.For the 12.7mm (0.50 in.) wide IM7/8552specimens,the3D geometricnon-linear FE resultsin the centerof the specimenagreedwith 2D plane-strainresults.However,for the6.35mm (0.25in.) wide $2/8552specimens,the 3D geometricnon-linearFEresultsin thecenterwerelessthan2Dplane-strainresults,indicatingthatthesespecimenswerenotwideenoughto achievefull constraint.
Theutility of theFE resultsis primarily for guidancein thechoiceof beamthickness,width,andconfiguration.Forthe3-pointbendconfiguration,longerspansarepreferredto minimize the error in beamtheorydatareduction.Similarly, for the 4-point bendconfigurations,a longerspanbetweentheinnerandouterloadnoses,atleastequalto thespanbetweenthe inner loadnoses,resultsin lesserror comparedto beamtheory. Inaddition,theseFEresultsindicatethatthespanbetweentheinner loadnosesshouldnotbe too long to avoidobtaininga non-uniformmaximumstressbetweenthe inner loadnoses.Finally, the 3D analysisindicatesthat specimensshouldbe sufficientlywide toachieveafully constrainedstateof plane-strainatthecenterof thespecimenwidth.
References
Minguet, P.J, and O'Brien, T.K., "Analysis of Test Methods for Characterizing
Skin/Stringer Debonding Failures in Reinforced Composite Panels", Composite
Materials': Testing and Design, Twelfth Volume, ASTM STP 1274, August, 1996,
p.105-124.
2) O'Brien, T.K., and Sen, J.K., "Tension-Torsion Behavior of Glass Epoxy Flexbeam
Laminates", ASTM Journal of Composites Technology and Research, JCTRER, Vol.
20, No.4, October, 1998, pp. 221-226.
10
O'Brien,T.K.,Chawan,A.D., andDeMarco,K.,: Influenceof SpecimenPreparationandSpecimenSizeon the TransverseTensileStrengthandScatterof GlassEpoxyLaminates,Proceedingsof the Twelfth InternationalConferenceon CompositeMaterials(ICCMXII), Paris,France,July,1999,paper976,ISBN2-9514526-2-4,
O'Brien,T. K., Chawan,A.D.,DeMarco,K., andParis,I.L,: Influenceof SpecimenPreparationandSpecimenSizeonCompositeTransverseTensileStrengthandScatter,NASA TM-2001-211030,ARL-TR-2540,July,2001.
O'Brien, T.K., Chawan,A.D., Krueger,R., and Paris, I.S.,: TransverseTensionFatigueLife Characterizationthrough Flexure Testing of CompositeMaterials,NASA TM-2001-211035,ARL TR 2544,July,2001(Acceptedfor publicationin theInternational Journal of Fatigue).
6) ABAQUS/Standard, "User's Manual, Volume II," Version 5.6, 1996.
Krueger, R., and O'Brien, T.K., "A Shell/3D Modeling Technique for the analysis of
delaminated composite laminates," Composites Part A: applied science and
manufacturing, vol. 32, January, 2001, pp. 25-44.
Acknowledgements
This study was performed as part of Cooperative Research and Development Agreements
(CRDA) between Bell Helicopter Company and the Boeing Company, Philadelphia, and
the U.S. Army Research Laboratory, Vehicle Technology Directorate, located at NASA
Langley Research Center.
Appendix 1
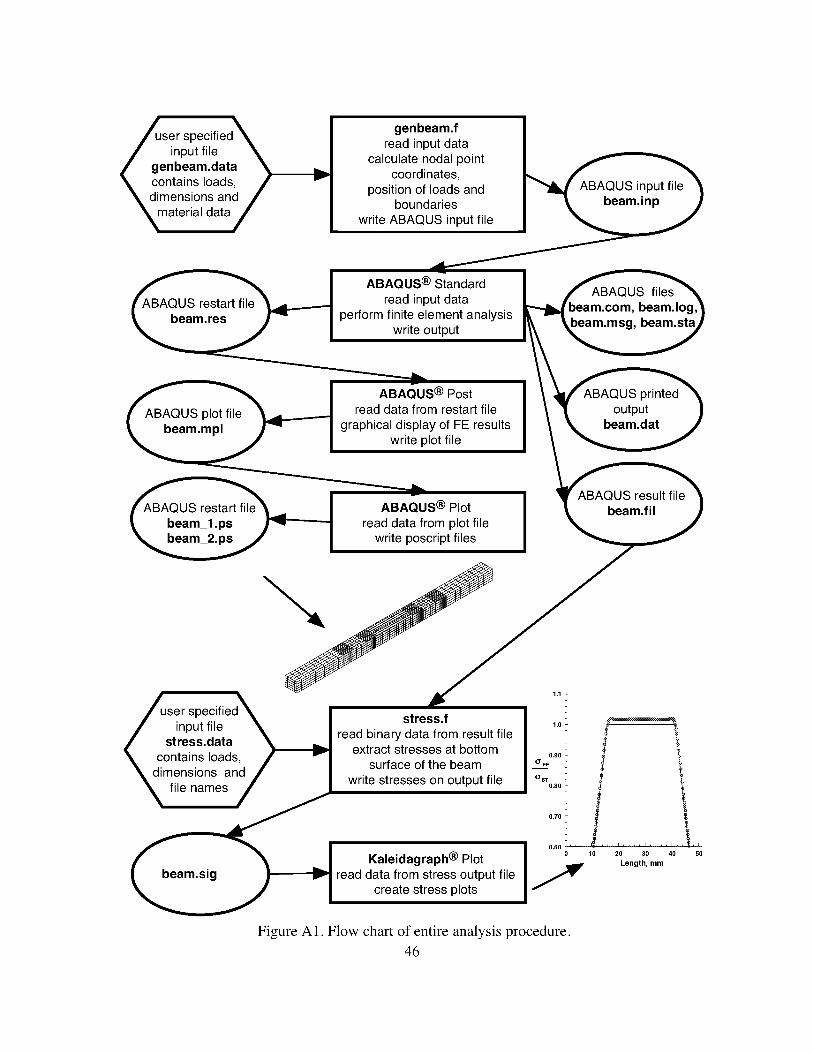
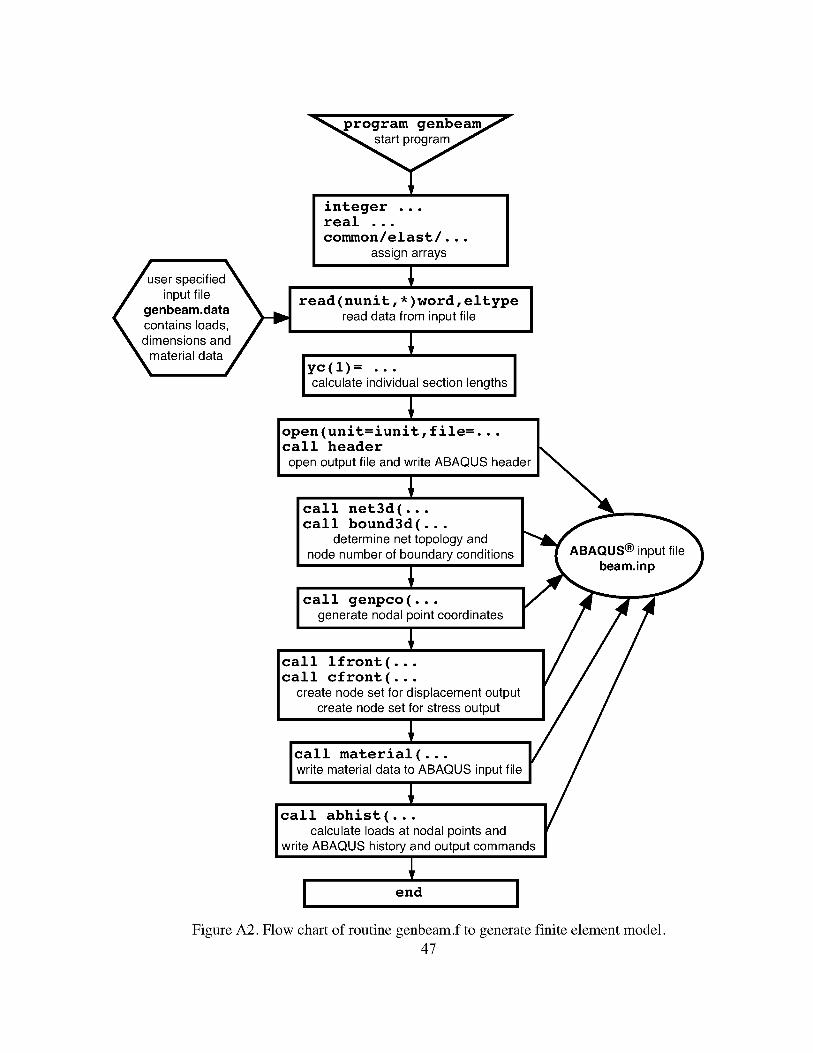
A general overview of the analysis procedure is given in Figure A1. The ABAQUS ®
input file was generated automatically using a user written FORTRAN routine
(genbeam.f in figure A1), which, in addition to the material data given in Table I, only
required the input of the loading, the geometrical data and mesh parameters as shown in
Figures 3 and 4. The use of this routine (flow chart shown in Figure A2) allowed the
quick generation of a large number of models for the different specimens and simplified
the otherwise tedious mesh refinement and convergence studies.
The stresses along the bottom side/surface of the beam specimens were of prime interest
as this is the location where the highest tensile stresses are to be expected. Therefore, the
averaged stresses at nodes were extracted for additional post-processing directly from theABAQUS ® binary result file using another user written FORTRAN routine (stress.f in
figure A1) the flow chart of which is depicted in Figure A3.
11
Appendix 2
Finite Element (FE) Analysis Formulation
A contact analysis was performed in order to investigate the influence of modeling the
roller versus modeling the support as a simple boundary condition at one nodal point. It
was expected that accounting for the roller would change the contact location and result
in a shorter span, s, of the specimen and thus result in a different stress distribution along
the bottom surface of the specimen. The contact analysis was performed using only two-
dimensional finite element models of the specimens as shown in Figure A4a. Only 20%
of the outer part of the roller was modeled with finite elements as shown in detail in
Figure A4b. A roller with a diameter of 4.73 mm was modeled which corresponds to the
roller diameter of the test fixture used in references 3&4. Material properties for the steel
rollers used in the simulation are given in Table 1. Displacements in x and y direction
were suppressed for all nodes along the inner radius of the model and along the line of
symmetry of the roller to simulate the rigid behavior of the roller. Contact was modeled
between two deformable bodies with small relative motion without friction using the
concept of master and slave surfaces available in ABAQUS ® [6]. The top surface of the
elements in the refined section of the roller modeled made up the master, or target,
surface as shown in Figure A4b, while the surface of the elements in the refined section
at the bottom of the specimen defined the slave or contact surface used in the analysis.
Contact Analysis results
The roller support was modeled and corresponding contact analysis was performed for
specimen configuration B2, only, because discrepancy in stresses between the finite
element and the beam theory results were most pronounced for this configuration as
shown in Figures 19-21. Additionally, the thinner 24-ply IM7/8552 B2 configuration
exhibited a more pronounced non-uniform stress distribution between the inner load
noses than the thick laminates. Therefore, the B2 configuration was modeled for the 24-
ply and 36-ply IM7/8552 layups and the 24-ply $2/8552 layup.
Figure A5 shows the finite element mesh for the 24-ply IM7/8552 carbon/epoxy material
B2 type specimen. The full specimen and the details are shown in the deformed position
at the failure load. As shown in the detail of Figure A5, contact occurs only locally. Due
to the local rotation of the specimen at the support, the contact location is changed and
moves inward which reduces the effective span s by about 0.6 mm at each support.
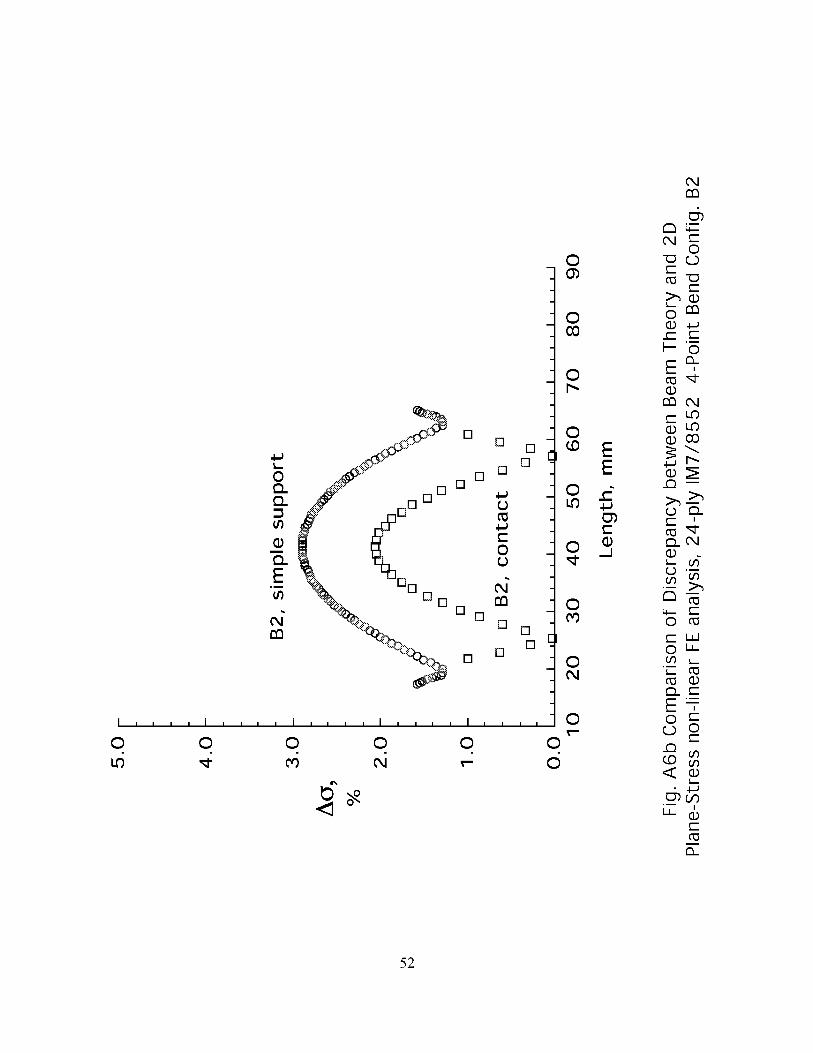
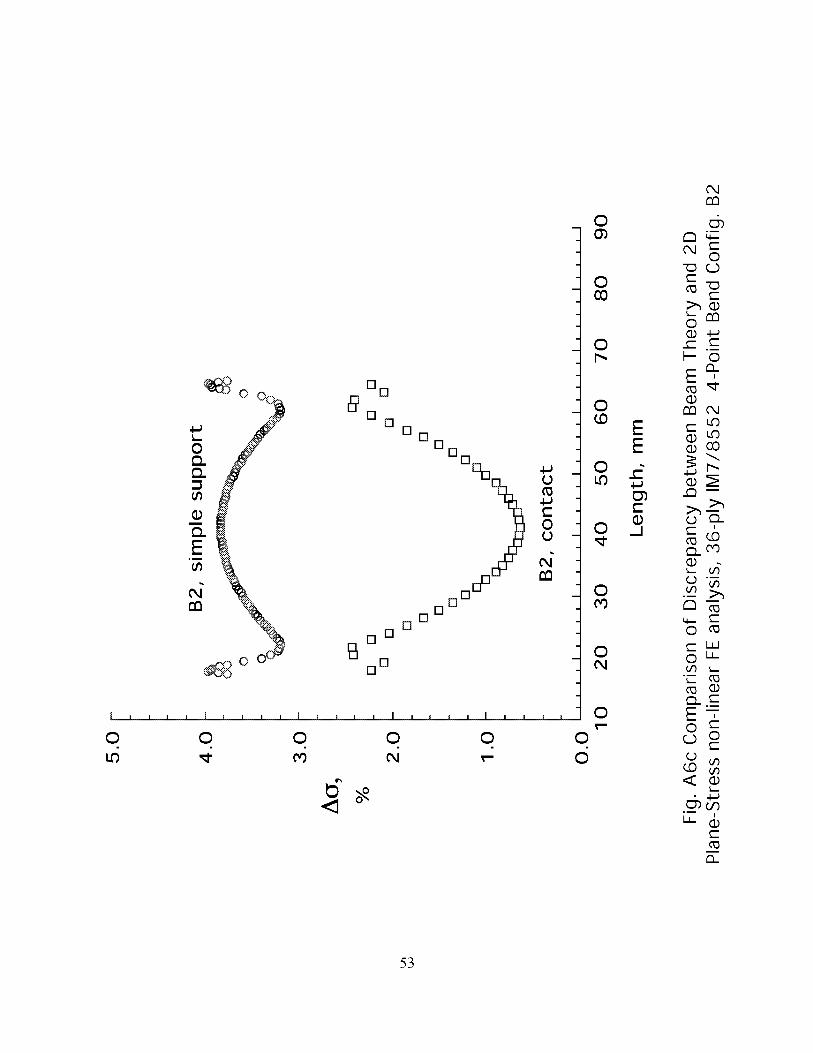
The tension stresses computed at the bottom of the specimen, using 215)contact analysis
where the roller support were modeled, are shown in Figures A6 a-c. The difference
between the beam theory and FE stresses for all configurations are lower compared to
results obtained from analysis where simple supported boundary conditions had been
used. This may be explained by considering equation (2). Because the distance between
the load points (s-g) remains unchanged in the simulation, the reduction of the effective
span, s, causes the same reduction in the length, _, which is used in equation (2) to
12

calculatethestresses.Forall configurationsinvestigated,thediscrepancybetweentheFEandbeamtheoryresultsbecamesmaller(max.3%)whentherollersweremodeledinconjunctionwith contactanalysisinsteadof simplesupportedboundaryconditions.
TABLE I. MATERIAL PROPERTIES.
$2/8552UnidirectionalGlass-EpoxyPrepreg
Ell = 47.71 GPa
v12 = 0.278
G12 = 4.83 GPa
E22 = 12.27 GPa
v13 = 0.278
G13 = 4.83 GPa
E33 = 12.27 GPa
v23 = 0.403
G23 = 4.48 GPa
IM7/8552 Unidirectional Carbon-Epoxy Prepreg
Ell = 161.0 GPa
v12 = 0.32
G12 = 5.17 GPa
E22 = 11.38 GPa
v13 = 0.32
G13 = 5.17 GPa
E33 = 11.38 GPa
v23 = 0.436
G23 = 3.98 GPa
Steel
E = 210.0 GPa v = 0.3
13

_- _PI2_s-2_ 212
p P/2 P/2
1 1 1_,_l t_,_ _,_t l_,_
Configuration s, mm Confi_ s, mm 2/2, mm s-2,mm
A 25.4 A1 50.8 12.7 25.4
B 50.8 A2 76.2 25.4 25.4
C 76.2 B2 76.2 12.7 50.8
B3 102 25.4 50.8
(a) 3-point bending
Figure 1.
(b) 4-point bending
Bending test configurations.
P/2
Gmax
0
(a) 3-point bending
Figure 2.
212 _s-2_ ,U2
P/2 P/2
P/2 P/2 P/2
-_ S _.-
Gmax
0/ \
(b) 4-point bending
Beam theory tension stress distribution on the bottom of beam.
14

nsl nr ns2 nr ns2 nr nsl nt
\ \ \ \ / / /| 1 | l I l | l | _llIlllllllI[|llll|llllIllIIIlll lll|lll|ll IllIll|llll|llll|ll llllllllIll I | | I | I | | I| I l l l | | l l l|llll|lllllIlllllllllll|llll||l |lllllllll llll|llllllllllllll IIIIIIIII|I I | | I l I I | |
| I I | l 1 I l | [|ll_ltll|ll[l|Illl|lllltllllt|l tlltl|llll IIl|||llll|l|Illl|l Illll|lJlll I t I I | I 1 I I
u:v:oJr v:o •.I S m.-
L: total specimen length
s: span between supportsr: length of refined section around supports and load points
t: specimen thicknessnr: number of elements in refined section
nsl: number of elements in overhang
ns2: number of elements in section between support and load point
nt: number of elements over the thickness
(a) Two dimensional FE model of three point bending specimen
P/2 P/2
nsl nr ns2 nr ns3 nr ns2 nr /nsl nt
' ' ' ° ,2,| | I | I I | I I [ll|l|ll|lll | I | I Illl| IIIll: I I | I | I I I "l | I I I I | [ | I I IIllI I | '1 | I|11|1 II$_HI_ I I | I I I I | I
| t I | IIlIIlllllIll I I I I I I I | III||llll||llll|l|ll [|1|1I | I I I I I I I Illlllll||ll | I | I IIIl| Ill|l:
I | t I | Illl|l||lll|| I I | I | J I | III||llll||llll|l|ll ||illI | I | | I | I | Ili|l|ll||lll | I | I I111| IIl||:I | I I I|llIIl|lll|| I I I I I I I I IIlIl|llll|llll|llll III11I I I | I I | I I IllllllllllI I I | I III1| IIIll:
I I I I I I I I I [lllllllllll I I I I Illll IIIII I I I I I I I I I I I I I I I l I I I IIIII I I I I IIIIIIIllIIII I I I I I I I I I
u:v:o 2v:s-L
•. S .-
s-L: span between inner load points
x ns3: number of elements in the center section
(b) Two dimensional FE model of four point bending specimen
Figure 3. Two dimensional FE models and corresponding load and boundary conditions
15

L: total specimen length
s: span
r: length of refined section aroundsupports and load points
t: specimen thicknessb: width
r
P/2
ns2 nr
nsl
ns3r P/2
rns2
nt
nsl
nb
nr
Figure 4.
nr: number of elements in refined section
nsl: number of elements in overhang
ns2: number of elements in section
between support and load pointnt: number of elements over the thickness
nb: number of elements across the width
s-L: span between inner load pointsns3: number of elements in the center section
Three dimensional FE model of four point bending specimen.
16

©
/
¢)
¢)
o_,_
-_<o_,_
cJ©
cD _¢)
¢)
©
(1.) ,
• ©
_cD¢)¢-q
¢-q
¢)o_,_
o_,_
_bo_,_
]7

o ocOo
I.ULI.
o
o
o
o
I-
18
o
o
ocO
oo
°vml
_ o°vml °vml
(1) "'_
• _ _o _
[_
N
©
o
_0
© ©°,_
E"
e_
¢)
¢)
o_,_
© ©_CJ
cD,_
¢) ¢)
o_,_
©
cD¢) ¢'q_ Lr_
°,_ I_
_ c-q
¢)o_,_
o_,_
_bo_,_
]9
o ocOo
o
o
I.ULI.
I-
o
o
o
o
2O
oo
cO
ocO
°vml
o_ o o
I
o
"" _0
[_ _
N _
©
oO

DDD
LO _ O0 _ _ 0
0
C_
00
C_
00
C_
00
°_
0
o ,-Q
_'_o "©"_
!
_ X_-_ 0
_ t"q
m t¢'3
• ¢:_"__c._.1
0c_
21

._ 4"" _ mm _ C
_DDD
m
m
[
W-E0
W-E0
<
W-E0
°_
_'_
[._ ._
X
m _
_ t"-
!c_n,.
_b
22
cr_ ._ cr_
_DD 3
m
(0
W-E0
(0
W-E0
(0
<
W-E0
(0
= =
_'_
[._ ._
=
=
X
m _
_ t"-
I
_b
23

©
©
¢)
¢)
°_,_
¢)
©
¢)
¢)
_ o
_cD¢-q
_ Lr_
°_,_
°_,_
¢-q
_b°_,_
24

o ocOo
l.IJI.i=
o
o
o
o
25
o
o
oo
o_
4=,0"} ,__
0
o
om _
_ t¢'3[... _
N
©
I.ULI.
I--
26
°vml
°vml
©
_ o°vml
I
I
[_
N
©

IJ.I I-LL _
27
°vml
°vml
©
°vml
I
I
[_
N
©
©
©°,_
E--
¢)
¢)
o_,_
cD _
(i.) °
o_,_
© ©
cD¢)_ c-q
°,_ I__ Lr_
¢) ¢'q
¢)o_,_
o_,_
_bo_,_
28
o ocOo
o_Do
LU _--U.
O
O
O
O
O
O
OO
°_
(I) ._ @
o_
._
o
o©
o_ _--_
N°_
©
°_
29

Ao,
%
D []
D_ _ Plane Stress _ _13o% _ _ Uo
D°'°_ 8 %o oo o, ? o© (2?
© ©Plane Strain
[]
O O
O , _ , , I , _ , , I , _ , , I , , , , I _ , , , I _ , , , I
15 20 25 30 35 40 45
Ao,
%
Length, mm
025
o Plane Strain_ o
30 35 40 45 50 55
Length, mm
(a) Configuration A1 (b) Configuration A2
Ao,%
4
_ Plane Stress (_,
f_[] []8[] [] [] []
[] []
° _ °[] []
o Plane Strain o
[] []
0 0
D []
4
3
AO,%
2
0 0
[] []0 , , , , I _ q , , I , , _ q I _ , , , I , , , q I _ _ , , I o
10 20 30 40 50 60 70
Length, mm
(c) Configuration B2
Plane Stress
0 Plane Strain Q
30 40 50 60 70 80
Length, mm
(d) Configuration B3
Fig. 18 Comparison of Discrepancy between Beam Theory and Plane-Stress and
Plane-Strain FE Analysis for $2/8552 Glass-epoxy 4-point bending configurations
30

N
0
0
LO _ eO N vii 0
0
0N
0
t"-I _l)
b _,.Q
I
©
0 00 i
,.ec_
_ V'3
_ mO "'_
m _
_._I
"'_ O
31

o,I
LO '_ CO N
OO_
OCO
O
O
_0 EE
EO •._J
OCO
OO,I
O
O
©o_
o o.0
, ©
o_
© ,
0
0
_ t---
• ,.._ _
©
I
©
32
N
CO
I.(3 '_ CO N _ O
O03
OCO
O
O_0 E
E
(-O •
,_J
OcO
ON
O
©o_
o o.0
, ©
o_
bo© ,
0
0
_ t---
• ,.._ _
©
I
©
33

©_J
Lr_Lr_
©
34
..', ..................
0
0
0
0
o,_iq
Gh
0
E-- _NE _
0"_
_c..)
_ t#'3
ow,,i
©
ow,,i
E0
ow,,i
35

A(J,
%
4
Plane Stress nl
o 3D eage,- nl o
A A0 O
A A
0 ¢.
_,_/. Plane Stress, linear _*a
1 _ 3D edge linear_DE3 "OD
10 20 30 40 50 60
Length, mm
, i
70
(a) 2D Plane Stress vs. 3D Edge results
Ao,
%
4
1
Of,,
10
o 3D center, nl o
_o _ o__Oo_-- --_oO _
A A A &<>
o _ / Plane Strain, nl _zX A A
o _ oA
Plane Stain, linear
A El/ 3D center, linear_.__a a_
20 30 40 50 60 70
Length, mm
(b) 2D Plane Strain vs. 3D Center results
Fig.24 Comparison of Discrepancy between Beam Theory and 2D and 313
FE Analysis for $2/8552 Glass-epoxy 4-point bending Configuration B2
36

37
©
_J
Lr_Lr_
©
Lr_

!
38

2.5
2.0
1.5
AO,%
1.0
0.50
0.010
Plane Stress, nl
3D edge, nl
%
_/ Plane Stress, linear _
O0 _ _'_3Dedgelinear _ DO
15 20 25 30 35 40 45
Length, mm
(a) 2D Plane Stress vs. 3D Edge results
2.0
1.5
1.O
AO,
%
0.50
0.010 15 20 25 30 35 40 45
Length, mm
(b) 2D Plane Strain vs. 3D Center results
Fig.27 Comparison of Discrepancy between Beam Theory and 2D and 3D
FE Analysis, 24-ply IM7/8552 Carbon-epoxy 4-point bending Configuration A1
39

Conf. A
_FE
I_BT0.40
0.20
Plane Strain
2O
15
Count
1D
0-5 0 5 I0
Distance from center load point (ram)
Conf. B
CfFE
OBT
1.0
0.80
0.60
0.40
0.20
0.020
Plane Strain
25
2O
15
I0
Count
S
015 10 S 0 5 10 15 20
Distance from center load point (mm)
1.0
0.80
0.60
OFF
OBT
0.40
Conf. C 020
Plane Strain
n = 50
0.0 0
-3D -2D -1D 0 10 2D 30
Distance from center load point (mm)
2O
15
I0
Count
5
Fig.28 Comparison of Normalized Bending Stress and Failure Location
$2/8552 3-point bending Configurations
40
Conf. A
OFE
OBT
1.0
0.80 i
0.60 i
0.40 _
0.20n= 37
15
10
Count
0.0 0-10 -5 0 5 10
Distance from center load point (ram)
1.0 30
Conf. B
OFE
OBT
0.80
O.6O
0.40
O.2O
25
20
15
Count
I0
5
O.O 0
-20 -15 -10 -5 0 5 10 15 20
Distance from center load point (ram
OFE
OBT
0.80
1.0 A 20
%
.. ..%..
% Count
O.O 0-30 -20 -I 0 O 10 20 30
Distance from center load point (rnm)
0.60
0.40
Conf. C 020
Fig.29 Comparison of Normalized Bending Stress and Failure Location
24-ply IM7/8552 3-point bending Configurations
41

Conf. A
OFE
OBT
OFE
OBT
0.80
0.40
0.20
1.0
0.80
0.60
n = 41
0
-5 0 5 I0
25
ZO
15
Count
10
Z5
2O
15
Count
0.40 1O
n = 43
Conf. B0.20 ' 5
0.0 O-20 -15 -lO -5 0 5 10 15 20
Distance from center load point (ram)
Conf. C
OFE
OBT
1.0
0.80
0.00
0.40
0.20
0.0-30
A
-20 -10 0 10
Distance from center load point (mm)
Fig.30 Comparison of Normalized Bending Stress and Failure Location
36-ply IM7/8552 3-point bending Configurations42
0
i ' ' '
rm
l
=_O
oo _ • o •
.o..°...v ,
0O
b_
0
0
O
i
b_
i
0i i • r_J
0 '
d0 L_ 0 0
Lr_
0
O
i .... i .... i .... i .... i .... i .... _
oo Ib • • I •
[] ..........
0
lm
O
0
i
'7
i .... i .... i .... i .... i .... i .... i .... i .... _
0 bl 0 l_ 0 I._ 0 0 0 '
0
<
,4,,,,o
E _
i
I
O
i :
O0
_oo 0 00 _ • • I_,
L _11 ,_O_A t
%, i I i , i i I i i , i I i , i _
L_I 0 0 0 '
d
0
m
Dm
E c_
u
' _ _
i
0
II
°_
°_
©
I
cq
cq
©°_
©
°_
©°_
°_
°_
°_
4_©
©°_
C_7
°_
43
0
0
L_
i
_, =
oi
i
Q _ O 0 Q _'
<
©,4,,,,o
=
©
0L_
0
i , , , i , , , i , , , i , , , i , , _
44
=o_,,_
=o_,,_
©
1¢31¢3
,4,,,,o
©
o_,,_
=
©o_,,_
o_,,_
o_,,_
o_,,_
=©
o_,,_
o_,,_

0
_, , _ , _ , rn L_ , _- , _J 0 0
_ o
"_ • 0 • • _ i
m
i
I .... I .... I .... I .... _
0 _'1 0 0 0 I
m d
N
0
0i i i g',l
• • • • • f-I _t_°oooo _
_'_ L_ 0 L_ 0 b_ _'_ 0 0 'i
0
.<
©,4,,,,o
©
.<
©,4,,,,o
©
l_ 0 0
i I I
• • _t •
DC_
D
m
i
D
i
l .... i .... i .... i , _ 0
0 b_ 0 _ _ '
0
(3 _J
_ • • _ • •
m
II
• •
0m
E
o_
b_
i
omi
oi .... E .... i .... i .... i ....
45
©
©
©
_-_ ©
©
ser specifiedX J
input file _, Ienbeam.datantains loads, f "- ]
mensions and f ]
aterial data/ ]
genbeam.f
read input datacalculate nodal point
coordinates,
position of loads andboundaries
write ABAQUS input file
US restart filebeam. res
ABAQUS ® Standard
read input dataperform finite element analysis
write output
US files
beam.lot
beam.msg, beam.sta
ABAQUS ® Post
read data from restart file
graphical display of FE results
write plot file
ABAQUS ® Plot
read data from plot filewrite poscript files
_user specified X ]
input file X I
stress.dataontains loads, / _ ]mensions and /' ]
file namesy
stress.f
read binary data from result fileextract stresses at bottom
surface of the beam
write stresses on output file
1.1
1.0
0.90
OBT0 80
0.6)
Kaleidagraph ® Plot
• read data from stress output filecreate stress plots
Figure AI. Flow chart of entire analysis procedure.
46
printed
outputbeam.dat
ABAQUS result file
beam.fil
.... i ,,, i .... i .... i,
10 20 30 40
Length, mm
i, i
5o
_ser specified_
input file %k Ienbeam.data
ntains loads, / Yl
mensions and /
aterial data/'
integer ...real ...
common/elast/...
assign arrays
read(nunit, *)word,eltype Iread data from input file
calculate individual section lengths
open (unit=iunit, file=...call header
open output file and write ABAQUS header
call net3d(...
call bound3d(...
determine net topology and
node number of boundary conditions
ca11 genpco(...
generate nodal point coordinates
call Ifront(...
call cfront(...
create node set for displacement output
create node set for stress output
Icall (...
material
write material data to ABAQUS input file
call abhist(..-calculate loads at nodal points and
write ABAQUS history and output commands
I I
ABAQUS ® input file
beam.inp
Figure A2. Flow chart of routine genbeam.f to generate finite element model.
47

_program stress/
IINCLUDE ' inc '
aba_param g
enable access to ABAQUS files
integer elnum,...
real stress(6),...character ...
_o assign arrays
\
ser specified_input file \ ,
stress.data ___J read ( nunit, * ) word, bl, . . .
ntains loads, / "-[ read data from user input file
fi/2sions2 nd/ '
_lcall gstart (kunit, output)
open file for stress output
LRUNIT (i, i )=8
LRUNIT (2,1 )=2
CALL INITPF (FNAME, NRU, . . .
CALL DBRNU (JUNIT)ABAQUS result file initialization
stress output filebeam.sig
CALL DBFILE (LOP,ARRAY, JRCD)
"- [ read each record of the ABAQUS result file|
ELSE IF(KEY.EQ.II)THEN
call datin(head, 1,...
identify stress record and store data in array
I call sort(iunit,kunit,...sort stress data and write to output file
callgend(iunit)
doseoutputfile
end [
Figure A3. Flow chart of routine stress.f to retrieve stresses at the bottom of the beam.
48

detail
\
P/2
s-L
P/2
L: total specimen lengths: span between supports
s-L: span between inner load pointst: specimen thickness
(a) Two dimensional FE model of four point bending specimen with modeled rollers
nrrl
rr
rr: radius of roller supportrt: modeled thickness
nt: number of elements over thickness
nrrl : number of elements outside the
contact regionnrr2: number of elements in the
contact region
contact surface
nrt • initial contact
u=v=O for all nodes along inner radiusand symmetry line of roller
(b) Detail of modeled roller and contacting surfaces
Figure A4. FE model with rollers and corresponding load and boundary conditions
49

P/2 P/2
[x "_ detail
"_ detail
Figure A5. Deformed FE model with details of modeled rollers and contacting surfaces
50

(_00 [] []000 D D
D D
__ DD D
E
E._ rn
rn D DD
D D
000 DD_00 [] []
0 0 0 0 0 0
_1" O0 N _ 0
O
0co
0
0EE
E
0 _
0O0
0N
0
Oqr_
r_ 0oq -_
0 0
.E "oI-- c
Em
©c Q..
_ C,,l(3.) t.f?
-Q t.f?>._CO
c C,,l
C3 m
4-- O_©
Q_.-I
E_-© ©
_ m
51
4-_
OO,.O,.
00
O,.E00
D D
D D
[][]
[][]
[]
[]
[]
[]
[]
[][]
0
c,i
[][]
[]
[][]
[][]
O O O O O O
I..O _ cO N _ O
OO_
OO3
O
O
E
O •,_J
OcO
ON
O
52
D D
[][]
[][]
_0 D D
[][]
[][]
[][]
[][]
[]
o
rn
[]
0 0 0 0 0 0
L.O _ _ N _ 0
0Ob
0CO
0
©
©N
©
O4
cbE3 _
0"o (_._c
c
_- rn0
c_-- 0
Earou '_"
¢'_ O4
c t.f?_ t.f?_ CO
_ r_
_ d
._m >._
q._ _© ou
© _-
•r'- o_
Q-.__E-r
_ m
cb
53

REPORT DOCUMENTATION PAGE FormApprovedQMB No. 0704-0188
Public reporting burden for this collection of information is estimated to average 1 hour per response, including the time for reviewing instructions, searching existing datasources, gathering and maintaining the data needed, and completing and reviewing the collection of information. Send comments regarding this burden estimate or any otheraspect of this collection of information, including suggestions for reducing this burden, to Washington Headquarters Services, Directorate for Information Operations andReports, 1215 Jefferson Davis Highway, Suite 1204, Arlington, VA 22202-4302, and to the Office of Management and Budget, Paperwork Reduction Project (0704-0188),Washington, DC 20503.1. AGENCY USE ONLY (Leave blank) 2. REPORT DATE 3. REPORT TYPE AND DATES COVERED
October 2001 Technical Memorandum
4. TITLE AND SUBTITLE 5. FUNDING NUMBERS
Analysis of Ninety Degree Flexure Tests for Characterization of Composite
Transverse Tensile Strength WU 581-10-21-01
6.AUTHOR{S)
T. Kevin O'Brien, Ronald Krueger
7. PERFORMING ORGANIZATION NAME(S) AND ADDRESS(ES)
NASA Langley Research Center U.S. Army Research Laboratory
Hampton, VA 23681-2199 Vehicle Technology Directorate
NASA Langley Research Center
Hampton, VA 23681-2199
9. SPONSORING/MONITORING AGENCY NAME(S) AND ADDRESS(ES)
National Aeronautics and Space Administration
Washington, DC 20546-0001and
U.S. Army Research Laboratory
Adelphi, MD 20783-1145
8. PERFORMING ORGANIZATIONREPORT NUMBER
L-18114
10. SPONSORING/MONITORINGAGENCY REPORT NUMBER
NASA/TM-2001-211227
ARL-TR-2568
11.SUPPLEMENTARY NOTES
Krueger: ICASE, NASA Langley Research Center, MS 132 C, Hampton, VA 23681-2199
12a. DISTRIBUTION/AVAILABILITY STATEMENT
Unclassified-Unlimited
Subject Category 24 Distribution: Nonstandard
Availability: NASA CASI (301) 621-0390
12b. DISTRIBUTION CODE
13. ABSTRACT (Maximum 200 words)
Finite element (FE) analysis was performed on 3-point and 4-point bending test configurations of ninety degree
oriented glass-epoxy and graphite-epoxy composite beams to identify deviations from beam theory predictions.
Both linear and geometric non-linear analyses were performed using the ABAQUS® fmite element code. The 3-
point and 4-point bending specimens were first modeled with two-dimensional elements. Three-dimensional
fmite element models were then performed for selected 4-point bending configurations to study the stress
distribution across the width of the specimens and compare the results to the stresses computed from two-
dimensional plane strain and plane stress analyses and the stresses from beam theory. Stresses for all
configurations were analyzed at load levels corresponding to the measured transverse tensile strength of the
material.
14. SUBJECT TERMS
Transverse Tensile Strength, matrix cracking, fmite element analysis,
1 7. S ECURITY CLASS IFI CATI O NOF REPORT
Unclassified
NSN 7540-01-280-5500
1 8. S I.-CURl TY CLASS IFI CAll O NOFTHIS PAGE
Unclassified
19. SECURITY CLASSIFICATIONOF ABSTRACT
Unclassified
15. NUMBER OF PAGES
5816. PRICE CODE
A0420. LIMITATION
OF ABSTRACT
UL
Standard Form 298 (Rev. 2-89)Prescribed by ANSI Std. Z-39-18298-102
Copyright © 2022 FDOKUMEN