Analysis of modeling effort and impact of different levels of detail in building information models
9
Analysis of modeling effort and impact of different levels of detail in building information models Fernanda Leite a, ⁎, Asli Akcamete b , Burcu Akinci b , Guzide Atasoy b , Semiha Kiziltas c a Department of Civil, Architectural and Environmental Engineering, The University of Texas at Austin, 1 University Station C1752, Austin, TX 78712-0276, United States b Department of Civil and Environmental Engineering, Carnegie Mellon University, 5000 Forbes Ave. Porter Hall, 119, Pittsburgh, PA, 15213, United States c Department of Civil Engineering, Middle East Technical University, K1-409, Ankara, 06531, Turkey abstract article info Article history: Accepted 17 November 2010 Available online 21 December 2010 Keywords: Building Information Modeling Level of detail impact Modeling effort The main objectives of this paper are to evaluate the modeling effort associated with generating building information modeling (BIM) at different levels of detail (LoD) and the impact of LoD in a project in supporting mechanical, electrical and plumbing (MEP) design coordination. Results show an increase in total modeling time ranging from doubling the modeling effort to eleven folding it, when going from one LoD to another. When comparing modeling time per object, rates ranged from 0.2 (decreased modeling time) to 1.56 (increased modeling time). Based on the experiments done in MEP design coordination, it was observed that the automatic clash detection process using BIMs, with its consistently higher recall rate, provides a more complete identification of clashes, with the cost of false positives (low precision). This study showed that additional modeling effort can lead to more comprehensive analyses and better decision support during design and construction. © 2010 Elsevier B.V. All rights reserved. 1. Introduction According to the National Building Information Modeling Standard Committee, a building information model (BIM) is defined as “a digital representation of physical and functional characteristics of a facility. As such it serves as a shared knowledge resource for information about a facility forming a reliable basis for decisions during its lifecycle from inception onward” [1]. BIMs have been gaining acceptance in the construction industry for many applications, such as constructability analyses, design checks, commissioning, life-cycle assessment, among others. Moreover, the widespread use of BIM is currently being encouraged by the US General Services Administration (GSA) as well as the US Army Corps of Engineers (USACE). GSA's Office of Government wide Policy [2] is the largest lessee of building assets in the United States, with 169 million sq ft leased. GSA requires utilization of BIM for all major projects receiving design funding from 2007 and on [3]. The USACE is another example of a federal agency implementing BIM organization-wide [4]. Various industry organizations, such as Associated General Con- tractors (AGC), National Institute for Building Sciences (NIBS) and major government organizations, such as GSA, have specialty groups working on adaptation of BIM within the Architecture, Engineering, Construction, and Facility Management (AEC/FM) industry, and are developing guidelines for generation, utilization and adoption of BIMs [3,5,6]. While potential benefits of utilizing such models are much talked about [7–12], there have not been many research studies investigating the modeling effort associated with generating BIM at different levels of detail (LoD) and the impact of an LoD in a project. Such evaluations are needed in order to take full advantage of the benefits of a semantically-rich building representation. Based on an existing set of LoDs [13] and on case studies carried out in two construction projects, the main objectives of this paper are: (1) to evaluate the modeling effort associated with generating BIM at different levels of details, ranging from depiction of approximate geometry, to precise geometry and then to fabrication level precision (these LoDs are defined in the Background Research section of this paper); and (2) to evaluate the impact of LoD in a project in supporting clash detection, in terms of precision and recall of identified clashes in mechanical, electrical and plumbing (MEP) design coordination. 2. Background research There is increasing support from industry professionals and software vendors for the utilization of BIM for improving project performance, interoperability and processes within the AEC/FM industry. This increasing support targets reducing losses of approx- imately $15.8 billion dollars annually for capital facilities, in the Automation in Construction 20 (2011) 601–609 ⁎ Corresponding author. E-mail addresses: [email protected] (F. Leite), [email protected] (A. Akcamete), [email protected] (B. Akinci), [email protected] (G. Atasoy), [email protected] (S. Kiziltas). 0926-5805/$ – see front matter © 2010 Elsevier B.V. All rights reserved. doi:10.1016/j.autcon.2010.11.027 Contents lists available at ScienceDirect Automation in Construction journal homepage: www.elsevier.com/locate/autcon
-
Upload
independent -
Category
Documents
-
view
1 -
download
0
Transcript of Analysis of modeling effort and impact of different levels of detail in building information models
Automation in Construction 20 (2011) 601–609
Contents lists available at ScienceDirect
Automation in Construction
j ourna l homepage: www.e lsev ie r.com/ locate /autcon
Analysis of modeling effort and impact of different levels of detail in buildinginformation models
Fernanda Leite a,⁎, Asli Akcamete b, Burcu Akinci b, Guzide Atasoy b, Semiha Kiziltas c
a Department of Civil, Architectural and Environmental Engineering, The University of Texas at Austin, 1 University Station C1752, Austin, TX 78712-0276, United Statesb Department of Civil and Environmental Engineering, Carnegie Mellon University, 5000 Forbes Ave. Porter Hall, 119, Pittsburgh, PA, 15213, United Statesc Department of Civil Engineering, Middle East Technical University, K1-409, Ankara, 06531, Turkey
⁎ Corresponding author.E-mail addresses: [email protected] (
(A. Akcamete), [email protected] (B. Akinci), guzide@[email protected] (S. Kiziltas).
0926-5805/$ – see front matter © 2010 Elsevier B.V. Aldoi:10.1016/j.autcon.2010.11.027
a b s t r a c t
a r t i c l e i n f oArticle history:Accepted 17 November 2010Available online 21 December 2010
Keywords:Building Information ModelingLevel of detail impactModeling effort
The main objectives of this paper are to evaluate the modeling effort associated with generating buildinginformation modeling (BIM) at different levels of detail (LoD) and the impact of LoD in a project in supportingmechanical, electrical and plumbing (MEP) design coordination. Results show an increase in total modelingtime ranging from doubling the modeling effort to eleven folding it, when going from one LoD to another.When comparing modeling time per object, rates ranged from 0.2 (decreased modeling time) to 1.56(increased modeling time). Based on the experiments done in MEP design coordination, it was observed thatthe automatic clash detection process using BIMs, with its consistently higher recall rate, provides a morecomplete identification of clashes, with the cost of false positives (low precision). This study showed thatadditional modeling effort can lead to more comprehensive analyses and better decision support duringdesign and construction.
F. Leite), [email protected] (G. Atasoy),
l rights reserved.
© 2010 Elsevier B.V. All rights reserved.
1. Introduction
According to the National Building InformationModeling StandardCommittee, a building informationmodel (BIM) is defined as “a digitalrepresentation of physical and functional characteristics of a facility.As such it serves as a shared knowledge resource for informationabout a facility forming a reliable basis for decisions during its lifecyclefrom inception onward” [1]. BIMs have been gaining acceptance in theconstruction industry for many applications, such as constructabilityanalyses, design checks, commissioning, life-cycle assessment, amongothers. Moreover, the widespread use of BIM is currently beingencouraged by the US General Services Administration (GSA) as wellas the US Army Corps of Engineers (USACE). GSA's Office ofGovernment wide Policy [2] is the largest lessee of building assetsin the United States, with 169 million sq ft leased. GSA requiresutilization of BIM for all major projects receiving design funding from2007 and on [3]. The USACE is another example of a federal agencyimplementing BIM organization-wide [4].
Various industry organizations, such as Associated General Con-tractors (AGC), National Institute for Building Sciences (NIBS) andmajor government organizations, such as GSA, have specialty groups
working on adaptation of BIM within the Architecture, Engineering,Construction, and Facility Management (AEC/FM) industry, and aredeveloping guidelines for generation, utilization and adoption of BIMs[3,5,6]. While potential benefits of utilizing such models are muchtalked about [7–12], there have not been many research studiesinvestigating the modeling effort associated with generating BIM atdifferent levels of detail (LoD) and the impact of an LoD in a project.Such evaluations are needed in order to take full advantage of thebenefits of a semantically-rich building representation.
Based on an existing set of LoDs [13] and on case studies carriedout in two construction projects, the main objectives of this paper are:(1) to evaluate the modeling effort associated with generating BIM atdifferent levels of details, ranging from depiction of approximategeometry, to precise geometry and then to fabrication level precision(these LoDs are defined in the Background Research section of thispaper); and (2) to evaluate the impact of LoD in a project insupporting clash detection, in terms of precision and recall ofidentified clashes in mechanical, electrical and plumbing (MEP)design coordination.
2. Background research
There is increasing support from industry professionals andsoftware vendors for the utilization of BIM for improving projectperformance, interoperability and processes within the AEC/FMindustry. This increasing support targets reducing losses of approx-imately $15.8 billion dollars annually for capital facilities, in the
602 F. Leite et al. / Automation in Construction 20 (2011) 601–609
United States alone, caused by a lack of complete integrated life-cycleinformation about facilities [14]. Moreover, the Construction IndustryInstitute, as stated in Eastman et al. [42], reported that 57% of activitiesin the construction industry are waste or non-value added activities,as compared to 26% in manufacturing. Waste in the constructionindustry is estimated in $300–400 billion annually [42]. AEC/FMcommittees and alliances, such as NIBS and AGC, work for full life-cycle implementation of BIM [3,5]. Software vendors also focus onproviding interoperable solutions, such as developing IndustryFoundation Classes (IFC) compliant applications, in order to enableintegrated project information throughout the life-cycle of construc-tion projects.With these efforts, more AEC/FM companies are utilizingBIM applications. For example, 48% of AEC/FM companies were usingBIM in 2009, which is a 75% increase as compared to 2007 [15].
Wide support for BIM is due to its various benefits throughoutproject design and planning, construction and facilities management.There are many benefits of BIM cited in the previous work insupporting decisions and improving processes throughout the life-cycle of a project [1,16–21]. Related to the preconstruction phase of aproject, these benefits include identification of design conflicts priorto construction, enabling the prefabrication of components prior toconstruction, and accurate geometric representation of all parts of afacility [1,16,18,20]. During construction, these benefits include lessrework, reduction in requests for information and change orders,customer satisfaction through visualization, improved productivity inphasing and scheduling, faster and more effective constructionmanagement with easier information exchange [1,17,19]. For thewhole lifecycle of a project, these benefits will include control ofwhole life cycle costs, integrated life-cycle data, rapid and accurateupdating of changes common through the conceptual development[1,17–20].
Though BIM is becoming widely-used in the AEC/FM industry,there is still a need for understanding the value added by BIM forconstruction projects and for companies operating in the AEC/FMindustry. The usage of BIM for all stages of a project is not yet acommon practice. Nonetheless, there have been numerous casestudies identifying the benefits, and testing the capabilities andlimitations of BIM [22–31]. In order to quantify the value added byBIM, several researchers have used different evaluation metricsdepending on the purpose for which BIM was utilized. Savings inman-hours during design, ability to quantify rooms and spaces withina facility, improvements in time and accuracy of cost estimates anddesign coordination, reduction in the number of requests forinformation (RFI) and change orders are examples of the metricsused in previous studies to quantify the value added by BIM usage.Table 1 provides a synopsis of the previous case studies conducted toquantify the benefits of using BIM. Given that structured metrics aredifficult to obtain in industry, Table 1 summarizes quantified benefitsreported in each publication.
Table 1A synopsis of a set of case studies that quantify benefits of using BIM through project phas
Purpose to use BIM Project type
Cost estimating Restaurant buildingVarious projects
Space calculations Medical research labDesign and planning Residential complex, commercial center, public shelter
Various projectsMedical office building
Aquarium projectArts centerPilot plant facilityVarious projects
While benefits of BIM are important to quantify, it is equallyimportant to identify what to include in a BIM to achieve theexpected value added by BIM usage in construction projects. The LoDto be included is a critical criterion to consider while developing aBIM of a project. Many researchers state that the use of a BIM (e.g.,cost estimating, energy simulation, creating fabrication drawings)will dictate the LoD that a model should have [18,26,37,38]. Someresearchers state that depending on the use of the BIM, differentversions of the BIM need to be created (e.g., cost model, equipmentinventory model, sequencing model, coordinationmodel, fabricationmodel) [39]. Though various researchers stated the importance ofdefining LoDs, there is a scarcity in defining what these LoDs shouldbe for each use of BIM. An initial effort to define LoD in BIM has beenthe one developed by Vico Software Inc. In that definition, LoD isdefined based on components and defined as the progression of acomponent from the lowest level of approximation (i.e., conceptualrepresentation) to the highest level of representation (i.e., as-built)based on the component's use. These LoDs are defined as conceptual,approximate geometry, precise geometry, fabrication and as-built[13]. Approximate geometry LoD represents components as genericelements (e.g., modeling a wall component as a generic wall withoutspecifying it as an interior or exterior wall components) withoutdefining their specific properties as it will appear in the confirmedfinal drawings. Precise geometry LoD represents components as theyappear in confirmed final drawings, and shows detailed material andcomponent properties. Fabrication LoD represents details of assem-blies as they appear in shop drawings. By using these definitions,levels of details of components that appear in a building informationmodel can be defined. Within this research study, the research teamused these definitions as a point of departure, and defined thesemantics that should be represented for those levels of details. Inaddition, using a subset of these LoDs, the research team analyzed themodeling effort (i.e., time and number of objects) needed to generatesuch LoDs and impact of these LoDs in supporting variousconstruction management tasks (such as coordination). The nextsection details the research method utilized to perform theseanalyses.
3. Research method
In order to evaluate the modeling effort and the impact of LoD,two construction projects were selected, where different LoDs wererequired to be modeled. An overview of the selected projects andhow they apply to this research is shown in Table 2, including projectdescription, BIM usage, as well as the studies carried out for thepurpose of this paper. The projects are described in detail subse-quently, followed by detailed descriptions of how each of the twotypes of studies was carried out for each project.
es.
Quantified benefits References
44% faster estimates [32]3% cost estimation accuracy, 80% faster estimates [33]20% saving in man-hrs, corresponding to 62% cost savings [20]2.6% to 47.4% reduction in work hours [34]40% reduction in unbudgeted change [33]20–30% labor cost saving in MEP contractors25–30% improvement in mechanical component installation6 months of schedule reduction in overall project$9 million saving in cost [35]$200,000 savings [36]$10 million savings [25]60% reduction in RFIs [18]10% savings from the contract value [33]
603F. Leite et al. / Automation in Construction 20 (2011) 601–609
3.1. Project descriptions
3.1.1. Project 1Project 1 was a commercial building consisting of five storeys with
189,000sq ft of office spaces. The estimated cost of the core and shellconstruction was $14 million (in US Dollars). The main structuralelements (beams and columns) in the building were steel elementsand the exterior enclosure was composed of curtain and brick veneerwalls with metal studs. The construction work also included allrelated site, structural, mechanical, plumbing, fire protection, andelectrical components.
The development of the BIM for this project started concurrentlywith the start of the construction phase, and contrasts with theconcept of BIM described in [1], but it is reported here since this wasthe approach carried out in Project 1. Ideally, the model should havebeen developed and augmented since the early design stages, in orderto help designer understand the project better, and building thefacility virtually. The aim of the general contractor (GC) was to gainexperience in BIM usage during construction and observe its benefitsand limitations. In this project, the role of the research team was tohelp the GC to achieve that, and identify the GC's LoD requirements fordifferent parts of the BIM during construction for the researchpresented in this paper. The team observed that the BIM had differentLoDs for different components of the model when generatedaccording to the project manager's requirements. In relation to suchdifferent LoDs, the number of objects that had to be modeled andhence the times to generate required models changed. The researchteam kept track of themodeling times as themodel of this project wasevolving in the required LoDs. It is important to note that the companyand the project manager were deploying BIM as their new businessprocess; hence, they were new to the process. The LoD in the BIMreflects the project manager's perspective since he requested thecomponents to be modeled based on the decisions that he had tomake on a daily basis. These requirements included design checks andmodeling of certain parts of the project for verification of verticalalignment of metal studs and elevator openings, coordinating theperimeter slab condition and addressing possible issues with pilecaps.
The quality of the model developed by the research team wasassessed in a commercially available model checker software toolbefore performing any analysis with the LoD variations andcorresponding modeling effort data, in order to verify that therewere no compromising design or modeling errors. The purpose of thisspecific model checker tool is to identify the design errors and analyzeif the design model is in compliance with the codes and user specifiedrules in terms of the quality and structural safety of the model. Theproblems identified by the tool were due to limitations of themodeling software (e.g. insulation modeled as a wall object and pilesmodeled as concrete column, since there were no pre-existinginsulation or pile objects in the software's library) and hence weclaim that the model for Project 1 is a valid one for further analyses.Project 1 was used for the analysis of themodeling effort, based on the
Table 2Overview of projects.
Project description BIM usage
Type Size (area) Cost (in USdollars)
Objective forrequired LoD
Compon
Project 1 Commercialbuilding
Five-storey,189,000 sq ft
$14 million Vertical alignmentand design check
Structufoundatexterior
Project 2 Academicbuilding
2 nine-storeybuildings,210,000 sq ft
$97 million Visualization anddesign check
Structuand ME
number of objects that needed to be modeled for required LoDs andthe corresponding time to model the components in those LoDs.
3.1.2. Project 2Project 2 was an academic building consisting of two buildings
and an underground garage with 150 spaces. The two buildingsincluded about 210,000 sq ft of area. The total project cost was$97 million (in US Dollars) and the construction cost was estimatedas $72 million.
A BIM was used in this project by the GC, in order for the GC'sproject engineers to have an initial experience in BIM duringconstruction. Unlike Project 1, where the research team was directlyinvolved in the modeling efforts, in this project, the GC hired a 3Dmodeling software company to develop a BIM. This approachcontrasts with the concept of BIM described in [1], but it is reportedhere since this was the approach carried out in Project 2. Ideally, themodel should have been developed and augmented since the earlydesign stages, in order to help designer understand the project better,and build the facility virtually. The approach carried out in Project 2,however, did lead to reentering of data, with impacts previouslydiscussed and described in [14].The modeling company delivered thefirst BIM out of 85% complete 2D architectural, structural, andmechanical, electrical and plumbing (MEP) drawings. The MEPincluded all elements larger than 1.5 in. and elements modeled areconsistent with minimum requirements listed in Brucker et al. [40].When construction for the building's underground garage was beingcarried out, the GC received a new BIM, based on 100% completedrawings. By this time, the heating, plumbing, fire safety, electricaland sheet metal subcontractors had started their weekly coordinationmeetings. Even though they had a BIM at hand, the subcontractorsdecided to coordinate their designs by overlaying 2D drawings on alight table, sincemost of the subcontractors did not design in 3D at thetime of this research was being carried out. Moreover, subcontractorsargued that there were no BIM requirements in their contract. Thisbrings to light an important issue of contract language, which is out ofscope of this work. All coordination was done on 2D drawings.Moreover, according to the subcontractors, the MEP in the BIM wasnot in the LoD that they needed. Given the fact that subcontractorswere going to coordinate in 2D and that there was a MEP modelavailable, this became one of the motivations of this research: toinvestigate the needed LoD in a BIM for MEP design coordination.
The GC also gave the BIM to the exterior enclosure subcontractor,who concluded that the LoD in themodel was not sufficient to analyzethe constructability of the building's skin. The LoD of the model thatthe GC provided to this subcontractor had no connections repre-sented. According to the exterior enclosure subcontractor, theseconnections were fundamental to assess how they will build the skin,considering that there were many unique layers in the exteriorenclosure and many variations of windows in this project.
Thus, Project 2 motivated two distinct analyses. The first one wasrelated to the modeling effort based on the number of objects thatneeded to be modeled and the associated time for modeling of the
Studies carried out
ents Modeling effort Measuring the impact of LoD
ral elements,ion, roof,enclosure
The number of objects andmodeling time in two differentLoDs for various components
–
ral, architecturalP elements
The number of objects andmodeling time in two differentLoDs for exterior enclosure
Precision and recall of clashesin MEP design coordination,with precise geometry model

604 F. Leite et al. / Automation in Construction 20 (2011) 601–609
components in different LoDs. In order to obtain comparablemodeling time, the research team developed two models of a sectionof Project 2's exterior enclosure: one in the original LoD, found in thethird-party model, and the other in the fabrication LoD, according torequirements specified by the exterior enclosure subcontractor. Thesecond analysis was on the differences in the accuracy andcomprehensiveness of the clashes that were detected by performingautomatic clash detection using a BIM and manual clash detection(i.e., with a light table using 2D drawing overlays). The automaticclash detection was carried out by the research team, and the manualcoordination was carried out by the project subcontractors with thepresence of one researcher collecting data on clashes identified duringcoordination meetings.
3.2. Description of performed analyses
For the modeling effort analysis in relation to the two projectsdescribed above, three researchers modeled the core and shell ofProject 1 and an undergraduate research assistant modeled theexterior enclosure of a section of Project 2. All of these modelers werefluent with the modeling environments being used. To evaluate theaccuracy of clash detection with different LoDs, the research teamcompared the types of clashes identified in the manual coordinationprocess (overlay of 2D drawings on a light table by pairs ofsubcontractors) and in the automatic clash detection process usingthe BIM of Project 2. The subsequent subsections detail how each ofthe analyses was performed.
3.2.1. Analysis of the effort required to model a BIM to a certain LoDIn order to analyze the effort (i.e., time and the number of objects
modeled) required for modeling in different LoDs, the research teamdeveloped a core and shell model for Project 1, and a model for aportion of Project 2's exterior enclosure. While modeling, the timespent to model each type of component was recorded. Also, thenumber of objects in two versions of the model (two different LoDs)was recorded.
For Project 1, modeled sections of the project included structuralelements, foundation, roof and exterior enclosure. Each of these hadtwo versions modeled: precise and fabrication LoDs. An exampledifference between models in the two LoDs is modeling of compositebrick veneer element as a single component (precise LoD) versusbricks with insulation and metal studs as separate components inrepresenting the exterior enclosure of a building (fabrication LoD).
For Project 2, the fabrication LoD model contained all connectionsof a portion of Project 2's exterior enclosure, so that the subcontractorcould study how to build the skin of the building. The model was laterused to build a full-scale physical prototype of the exterior enclosureon site. The fabrication LoD model was compared against a precisegeometry model that had the same LoD as the full version of Project2's BIM (developed by a third party).
3.2.2. Analysis of the impact of a model's LoD in the correspondingdecision making task
In order to analyze the impact of a model's LoD in thecorresponding decision that it needs to support, we carried out astudy on precision and recall in the identification of clashes in MEPdesign coordination. This study aimed at comparing the manual 2Dand an automatic BIM-based processes.
For five months, one member of the research team attendedweekly coordination meetings for Project 2. In these meetings, fivetypes of subcontractors (Ductwork/HVAC, Electrical, Plumbing, FireProtection and Heating) overlaid their drawings on a light table, inpairs of two, per each floor and section (the floor plan was dividedinto 6 sections) of the project. The researcher collected data on thenumber of clashes identified by the pairs of subcontractors and theirinformation exchange (i.e., information requests between subcon-
tractors, such as clearance between top the surface of a duct and thebottom surface of a ceiling), for each iteration. The informationexchanges were used to identify what objects need to be modeled in afabrication LoD model, such that the clashes that were identifiedmanually could also be identified automatically. Examples of suchdetailed components include: cable trays, hangers and insulationaround pipes.
For the purpose of this study, data for floors 1 and 2 of Project 2was used, since the researcher collected data for these two floorswhile attending weekly mechanical, electrical and plumbing (MEP)coordination meetings. The BIM contained objects representingarchitectural, structural, ductwork, electrical, plumbing and fireprotection specialties. The only trade not represented in the BIMwas heating, which is reflected as “not available (NA)” in our analyses.
After comparing the counts in clashes detected during coordina-tion meetings and through automatic clash detection, the researchteam analyzed precision and recall of clashes identified in bothprocesses, and kept track of objects that were and were not modeled,which had an impact in precision and recall values. Precision andrecall values were calculated based on formulas from the informationretrieval domain [41]. They are:
precision =relevant clashes∩ retrieved clashes
retrieved clashes
recall =relevant clashes∩ retrieved clashes
relevant clashes
In the formulas, relevant clashes (i.e., the real clashes that have tobe identified) are the summation of true positives (i.e., identified as aclash and it was really a clash) and false negatives (i.e., was really aclash but not identified). Retrieved clashes might be either truepositives or false positives (i.e., identified as a clash but was not a clashin reality). An example of a false positive is shown in Fig. 1. We alsolooked at false negatives in the coordination meetings, which mighthave been missed by the subcontractors, since they were performingclash detection manually. In other words, precision of 1 (or 100%)means that all the clashes retrieved are true positives; though it doesnot indicate that all clashes were found. High precision simply meansall clashes found were true positives. Recall of 1 (or 100%) means thatall possible clashes are retrieved, but does not mean that all clashesretrieved are true positives. With high recall, all possible clashes areretrieved, along with noise, such as false positives, as illustrated inFig. 1.
Results related to this part of the study are presented in Section 4.2,impact of a model's LoD on precision and recall in the identification ofclashes in MEP design coordination.
4. Results
The projects utilized in this research study involved illustration ofmodeling different components in different LoDs for differentpurposes in design and construction. Observed LoDs were: approx-imate geometry, precise geometry and fabrication. These three levelsof details correspond to the levels of details already defined by [13].
Table 3 shows an example based on Project 2, which illustratescomponents in each of three LoDs for a section of the exteriorenclosure. Table 3 also describes the semantics required to berepresented for the modeled components in the three LoDs and thespecific purposes for which each LoDwould be appropriate to use. TheLoDs captured in Table are based on those describes in [13,43]. Theapproximate geometry LoD is equivalent to level 200 in [13,43];precise geometry LoD is equivalent to level 300 in [13,43]; andfabrication LoD is equivalent to level 400 in [13,43].
In the example in Table 3, a model in the approximate geometryLoD would be composed of a generic wall element. For the precise
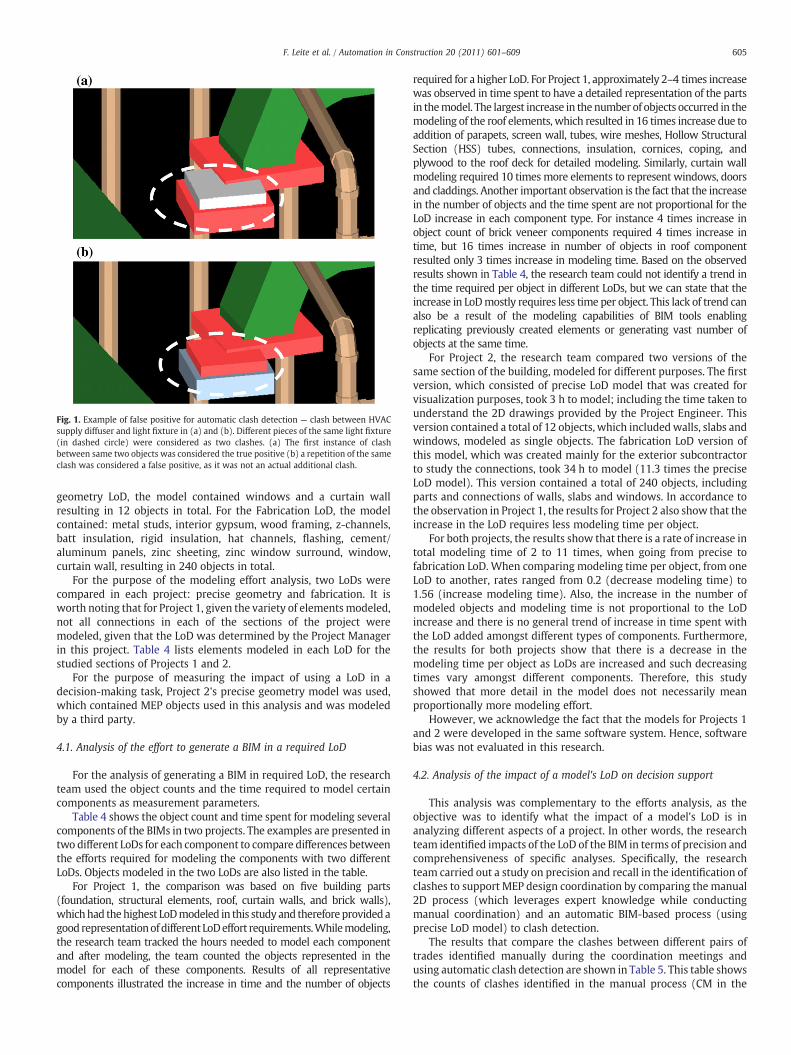
Fig. 1. Example of false positive for automatic clash detection — clash between HVACsupply diffuser and light fixture in (a) and (b). Different pieces of the same light fixture(in dashed circle) were considered as two clashes. (a) The first instance of clashbetween same two objects was considered the true positive (b) a repetition of the sameclash was considered a false positive, as it was not an actual additional clash.
605F. Leite et al. / Automation in Construction 20 (2011) 601–609
geometry LoD, the model contained windows and a curtain wallresulting in 12 objects in total. For the Fabrication LoD, the modelcontained: metal studs, interior gypsum, wood framing, z-channels,batt insulation, rigid insulation, hat channels, flashing, cement/aluminum panels, zinc sheeting, zinc window surround, window,curtain wall, resulting in 240 objects in total.
For the purpose of the modeling effort analysis, two LoDs werecompared in each project: precise geometry and fabrication. It isworth noting that for Project 1, given the variety of elementsmodeled,not all connections in each of the sections of the project weremodeled, given that the LoD was determined by the Project Managerin this project. Table 4 lists elements modeled in each LoD for thestudied sections of Projects 1 and 2.
For the purpose of measuring the impact of using a LoD in adecision-making task, Project 2's precise geometry model was used,which contained MEP objects used in this analysis and was modeledby a third party.
4.1. Analysis of the effort to generate a BIM in a required LoD
For the analysis of generating a BIM in required LoD, the researchteam used the object counts and the time required to model certaincomponents as measurement parameters.
Table 4 shows the object count and time spent for modeling severalcomponents of the BIMs in two projects. The examples are presented intwo different LoDs for each component to compare differences betweenthe efforts required for modeling the components with two differentLoDs. Objects modeled in the two LoDs are also listed in the table.
For Project 1, the comparison was based on five building parts(foundation, structural elements, roof, curtain walls, and brick walls),whichhad thehighest LoDmodeled in this study and therefore provided agood representationofdifferent LoDeffort requirements.Whilemodeling,the research team tracked the hours needed to model each componentand after modeling, the team counted the objects represented in themodel for each of these components. Results of all representativecomponents illustrated the increase in time and the number of objects
required for a higher LoD. For Project 1, approximately 2–4 times increasewas observed in time spent to have a detailed representation of the partsin themodel. The largest increase in the number of objects occurred in themodeling of the roof elements, which resulted in 16 times increase due toaddition of parapets, screen wall, tubes, wire meshes, Hollow StructuralSection (HSS) tubes, connections, insulation, cornices, coping, andplywood to the roof deck for detailed modeling. Similarly, curtain wallmodeling required 10 times more elements to represent windows, doorsand claddings. Another important observation is the fact that the increasein the number of objects and the time spent are not proportional for theLoD increase in each component type. For instance 4 times increase inobject count of brick veneer components required 4 times increase intime, but 16 times increase in number of objects in roof componentresulted only 3 times increase in modeling time. Based on the observedresults shown in Table 4, the research team could not identify a trend inthe time required per object in different LoDs, but we can state that theincrease in LoDmostly requires less time per object. This lack of trend canalso be a result of the modeling capabilities of BIM tools enablingreplicating previously created elements or generating vast number ofobjects at the same time.
For Project 2, the research team compared two versions of thesame section of the building, modeled for different purposes. The firstversion, which consisted of precise LoD model that was created forvisualization purposes, took 3 h to model; including the time taken tounderstand the 2D drawings provided by the Project Engineer. Thisversion contained a total of 12 objects, which includedwalls, slabs andwindows, modeled as single objects. The fabrication LoD version ofthis model, which was created mainly for the exterior subcontractorto study the connections, took 34 h to model (11.3 times the preciseLoD model). This version contained a total of 240 objects, includingparts and connections of walls, slabs and windows. In accordance tothe observation in Project 1, the results for Project 2 also show that theincrease in the LoD requires less modeling time per object.
For both projects, the results show that there is a rate of increase intotal modeling time of 2 to 11 times, when going from precise tofabrication LoD. When comparing modeling time per object, from oneLoD to another, rates ranged from 0.2 (decrease modeling time) to1.56 (increase modeling time). Also, the increase in the number ofmodeled objects and modeling time is not proportional to the LoDincrease and there is no general trend of increase in time spent withthe LoD added amongst different types of components. Furthermore,the results for both projects show that there is a decrease in themodeling time per object as LoDs are increased and such decreasingtimes vary amongst different components. Therefore, this studyshowed that more detail in the model does not necessarily meanproportionally more modeling effort.
However, we acknowledge the fact that the models for Projects 1and 2 were developed in the same software system. Hence, softwarebias was not evaluated in this research.
4.2. Analysis of the impact of a model's LoD on decision support
This analysis was complementary to the efforts analysis, as theobjective was to identify what the impact of a model's LoD is inanalyzing different aspects of a project. In other words, the researchteam identified impacts of the LoD of the BIM in terms of precision andcomprehensiveness of specific analyses. Specifically, the researchteam carried out a study on precision and recall in the identification ofclashes to support MEP design coordination by comparing the manual2D process (which leverages expert knowledge while conductingmanual coordination) and an automatic BIM-based process (usingprecise LoD model) to clash detection.
The results that compare the clashes between different pairs oftrades identified manually during the coordination meetings andusing automatic clash detection are shown in Table 5. This table showsthe counts of clashes identified in the manual process (CM in the
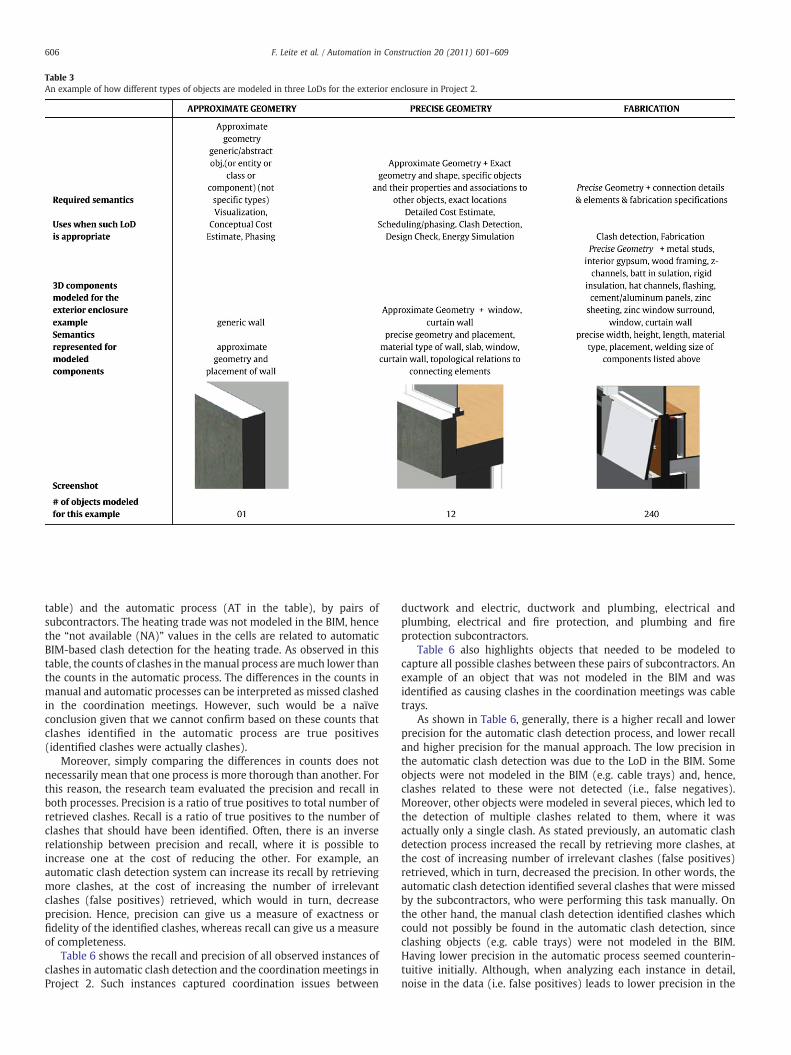
Table 3An example of how different types of objects are modeled in three LoDs for the exterior enclosure in Project 2.
606 F. Leite et al. / Automation in Construction 20 (2011) 601–609
table) and the automatic process (AT in the table), by pairs ofsubcontractors. The heating trade was not modeled in the BIM, hencethe “not available (NA)” values in the cells are related to automaticBIM-based clash detection for the heating trade. As observed in thistable, the counts of clashes in themanual process aremuch lower thanthe counts in the automatic process. The differences in the counts inmanual and automatic processes can be interpreted as missed clashedin the coordination meetings. However, such would be a naïveconclusion given that we cannot confirm based on these counts thatclashes identified in the automatic process are true positives(identified clashes were actually clashes).
Moreover, simply comparing the differences in counts does notnecessarily mean that one process is more thorough than another. Forthis reason, the research team evaluated the precision and recall inboth processes. Precision is a ratio of true positives to total number ofretrieved clashes. Recall is a ratio of true positives to the number ofclashes that should have been identified. Often, there is an inverserelationship between precision and recall, where it is possible toincrease one at the cost of reducing the other. For example, anautomatic clash detection system can increase its recall by retrievingmore clashes, at the cost of increasing the number of irrelevantclashes (false positives) retrieved, which would in turn, decreaseprecision. Hence, precision can give us a measure of exactness orfidelity of the identified clashes, whereas recall can give us a measureof completeness.
Table 6 shows the recall and precision of all observed instances ofclashes in automatic clash detection and the coordination meetings inProject 2. Such instances captured coordination issues between
ductwork and electric, ductwork and plumbing, electrical andplumbing, electrical and fire protection, and plumbing and fireprotection subcontractors.
Table 6 also highlights objects that needed to be modeled tocapture all possible clashes between these pairs of subcontractors. Anexample of an object that was not modeled in the BIM and wasidentified as causing clashes in the coordination meetings was cabletrays.
As shown in Table 6, generally, there is a higher recall and lowerprecision for the automatic clash detection process, and lower recalland higher precision for the manual approach. The low precision inthe automatic clash detection was due to the LoD in the BIM. Someobjects were not modeled in the BIM (e.g. cable trays) and, hence,clashes related to these were not detected (i.e., false negatives).Moreover, other objects were modeled in several pieces, which led tothe detection of multiple clashes related to them, where it wasactually only a single clash. As stated previously, an automatic clashdetection process increased the recall by retrieving more clashes, atthe cost of increasing number of irrelevant clashes (false positives)retrieved, which in turn, decreased the precision. In other words, theautomatic clash detection identified several clashes that were missedby the subcontractors, who were performing this task manually. Onthe other hand, the manual clash detection identified clashes whichcould not possibly be found in the automatic clash detection, sinceclashing objects (e.g. cable trays) were not modeled in the BIM.Having lower precision in the automatic process seemed counterin-tuitive initially. Although, when analyzing each instance in detail,noise in the data (i.e. false positives) leads to lower precision in the
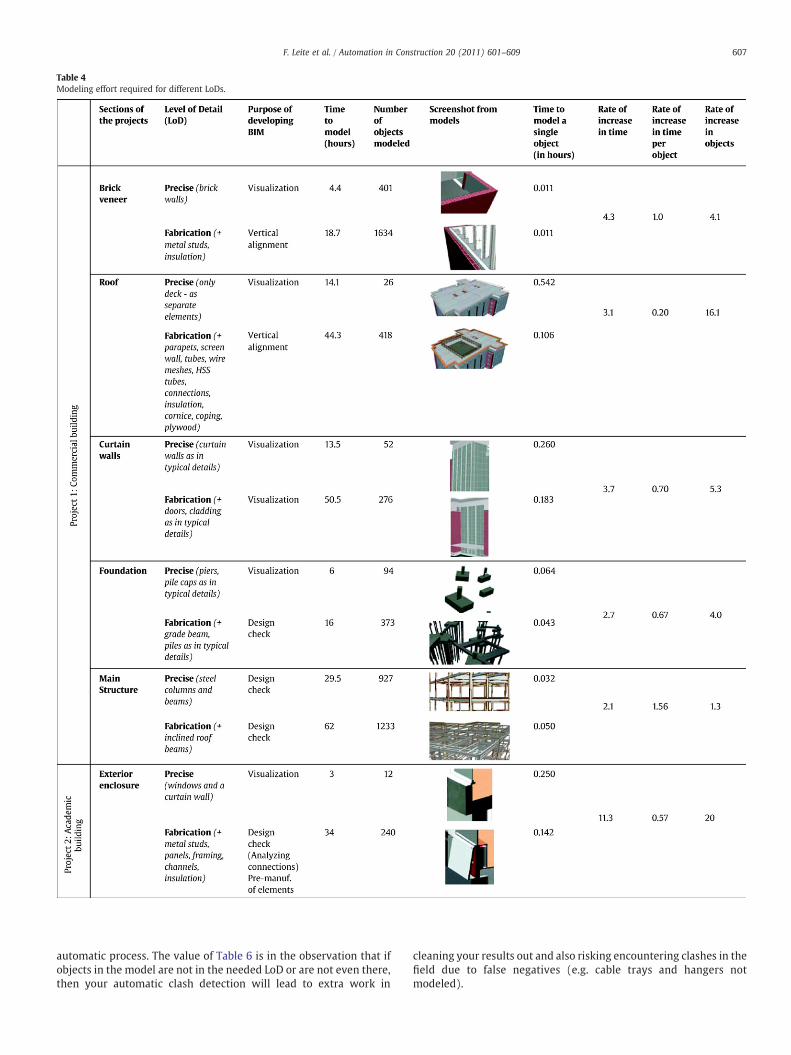
Table 4Modeling effort required for different LoDs.
607F. Leite et al. / Automation in Construction 20 (2011) 601–609
automatic process. The value of Table 6 is in the observation that ifobjects in the model are not in the needed LoD or are not even there,then your automatic clash detection will lead to extra work in
cleaning your results out and also risking encountering clashes in thefield due to false negatives (e.g. cable trays and hangers notmodeled).
Table 5Count of clashes between pairs of subcontractors.
Ductwork Electrical Heating Plumbing Fire protection
CM AT CM AT CM AT CM AT CM AT
Ductwork 10 44 0 NA 1 70 6 73Electrical 0 NA 4 3 3 6Heating 0 NA 4 NAPlumbing 3 25Fire protection
CM=collected in coordination meetings, AT=identified through automatic clash detection.
608 F. Leite et al. / Automation in Construction 20 (2011) 601–609
From the precision and recall values in Project 2, the research teamobserved that the automatic process using BIM at a precise LoD, withits consistently higher recall rate, provides a more completeidentification of clashes, with the cost of having to deal with manyfalse positives. The manual process, on the other hand, resulted inhigher precision rates. Nonetheless, it is more costly do deal with fielddetected clashes thanwith virtual false positive clashes. Hence, for thepurpose of MEP coordination, recall is preferable over precision.
5. Conclusions
While potential benefits of utilizing building information models(BIM) are much talked about, there have not been many researchstudies investigating the modeling effort associated with generatingBIM at different levels of detail (LoD) and the impact of an LoD in aproject. This study showed that more detail in a model does notnecessarily meanmore modeling work; and such additional effort canlead to higher precision better supporting decisions during design andconstruction. Results also showed that for the modeling effortanalysis, there was an increase in total modeling time ranging fromdoubling the effort to eleven folding it, when going from one LoD toanother. When comparing modeling time per object, from one LoD toanother, rates ranged from 0.2 (decrease modeling time) to 1.56(increase modeling time). It is noted that for the MEP coordinationproblem, the BIM-based approach can have a higher impact indecreasing possible field detected clashes due to its high recall rates.Nonetheless, the chosen LoD for a given task should be determined bythe purpose of its usage, considering the aforementioned impacts aswell as benefits of a LoD. Results presented in this paper are acquiredwith the utilization of two atypical projects. Albeit the number, theproject and software selections are widely used in the industry, andcan be considered as representative sets for regarding the evaluationsapplicable and valuable. However, we acknowledge the fact that themodels for Projects 1 and 2 were developed in the same softwaresystem. Hence, software bias was not evaluated in this research. Suchevaluation is suggested as future research. While this paper broughtan analysis of modeling effort and impact of different LoD in BIM,
Table 6Recall, precision and objects needed to capture all clashes, based on observations of clashe
Pairs of subcontractors analyzed 2D (coordination meeting)
Ductwork and electric Recall 10/18=0.56Precision 10/10=1.00
Ductwork and plumbing Recall 1/11=0.09Precision 1/1=1.00
Ductwork and fire protection Recall 6/9=0.67Precision 6/6=1.00
Electrical and plumbing Recall 4/6=0.67Precision 4/4=1.00
Electrical and fire protection Recall 3/4=0.75Precision 3/3=1.00
Plumbing and fire protection Recall 3/7=0.43Precision 3/3=1.00
there still remains the need to investigate BIM LoD requirements ofvarious stakeholders for different design and construction activities.Such requirements could determine which metrics are more relevantfor a given task, and, hence, drive a more objective determination ofLoDs to be used in supporting different design and constructionactivities. Also, there is the need for the development of a larger set ofcase studies for LoD evaluation, using different software systems andmodelers with different experience levels, to further evaluatemodeling effort differences with each level of detail. Although resultsshowed in this paper were based on BIM that is not fully integrated tothe product development process (e.g. Project 1 BIM modeled byresearch team and Project 2 BIM modeled by a third party company),as described in [1], it is expected that amodel developed as an integralpart of the product development process, and augmented withcollaboration between teams, could lead to even more promisingoutcomes. Hence, there are many opportunities for improvement interms of BIM integration to the project lifecycle.
Acknowledgements
This project is funded by a grant from the Pennsylvania Infrastruc-ture Technology Alliance (PITA). PITA's support is gratefully acknowl-edged. Any opinions, findings, conclusions or recommendationspresented in this paper are those of the authors and do not necessarilyreflect the view of the Pennsylvania Infrastructure Technology Alliance.The authorswould also like to acknowledge Brian Kish, for hismodelingassistance in Project 2.
References
[1] National Building Information Modeling Standard (NBIMS), Overview, Principlesand Methodologies, Version 1.0 — Part 1, http://www.wbdg.org/pdfs/NBIMSv1_p1.pdf8 (last accessed on August 27, 2010).
[2] General Services Administration (GSA), Executive summary report: an overviewof the U.S. federal government's real property assets, in: Office of Government-wide Policy (Ed.), Federal Real Property Report, Fiscal Year, 2005, p. 14.
[3] General Services Administration (GSA), Building InformationModeling Guide Series1, http://www.gsa.gov/graphics/pbs/GSA_BIM_Guide_v0_60_Series01_Overview_05_14_07.pdf8 (last accessed on September 12, 2010). Page 6.
s in automatic and manual processes for floors 1 and 2.
3D (automatic clash detection) Objects needed to capture all clashes
11/18=0.61 Lights, ducts, cable trays, hangers11/44=0.2511/11=1.00 Plumbing lines, ducts, hangers11/70=0.168/9=0.89 Ducts, sprinkler lines, hangers8/73=0.112/6=0.33 Lights, plumbing lines2/3=0.662/4=0.50 Lights, fire protection lines2/6=0.337/7=1.00 Plumbing lines, fire protection lines7/25=0.28

609F. Leite et al. / Automation in Construction 20 (2011) 601–609
[4] J. Castagna, U.S. Army Corps adopts BIM Teams for Facility Design, http://www.bimchannel.com/article-u.s._army_corps_adopts_bim_teams_for_facility_design-7.html8 (last accessed on March 17, 2010).
[5] Association of General Contractors (AGC), The Contractors' Guide to BuildingInformation Modeling, 2006, p. 48.
[6] R. Miller, United States National Building Information Modeling Standard, version1, part 1: Overview, Principles, and Methodologies, National Institute of BuildingSciences (NIBS)8 183 pp., http://www.wbdg.org/pdfs/NBIMSv1_p1.pdf8 (lastaccessed on September 12, 2010).
[7] C.B. Tatum, T.M. Korman, Coordinating building systems: process and knowledge,Journal of Architectural Engineering 6 (2000) 116–121.
[8] S. Staub-French, M. Fischer, Industrial Case Study of Electronic Design, Cost, andSchedule Integration, Technical Report No. 122, Center for Integrated FacilitiesEngineering, Stanford University, CA, USA, 2001, Available at bcife.stanford.edu/online.publications/TR122.pdfN, (last accessed on September 13, 2010).
[9] C. Kam, M. Fischer, R. Hänninen, S. Lehto, J. Laitinen, Capitalizing on early projectopportunities to improve facility life-cycle performance, Proceedings of the 19thInternational Symposium on Automation and Robotics in Construction, Gaithers-burg, Maryland, September 23–25, 2002, pp. 73–78, Available at: bwww.fire.nist.gov/bfrlpubs/build02/PDF/b02104.pdfN, (last accessed on September 13, 2010).
[10] A. Khanzode, M. Fischer, D. Reed, Case study of the implementation of the lean projectdelivery system(LPDS)usingvirtualbuilding technologiesona largehealthcareproject,Proceedings 13th Annual Conference of the International Group for Lean Construction,IGLC-13, Sydney, Australia, 2005, pp. 153–160, Available at: bhttp://www.iglc.net/conferences/2005/papers/session04/18_036_Khanzode_Fischer_Reed.pdfN, (lastaccessed on September 13, 2010).
[11] R. Sacks, R. Barak, A methodology for assessment of the impact of 3D modeling ofbuildings on structural engineering productivity, ASCE International Conferenceon Computing in Civil Engineering, Cancun, Mexico, July, 2005, Available at:bcedb.asce.org/cgi/WWWdisplay.cgi?147600N, (last accessed on September 13,2010).
[12] R. Sacks, R. Barak, Quantitative assessment of the impact of 3D modelling ofbuilding structures on engineering productivity, in: H. Rivard, E. Miresco (Eds.),11th International Conference on Computing in Civil and Building Engineering,2006, pp. 1186–1195, Montreal, Canada.
[13] Vico Software, Model Progression Speficiation, Available at: www.ipd-ca.net/Model%20Progression%20Spec%20V%2008-08-20.xls 20048 Last access on:September 02, 2010.
[14] M.P. Gallaher, A.C. O'Connor, J.L. Dettbarn Jr., L.T. Gilday, Cost analysis ofinadequate interoperability in the U.S. capital facilities industry, U.S. Departmentof Commerce, National Institute of Standards and Technology, NIST GCR 04-867,August 2004.
[15] N. Young, S. Jones, H. Bernstein, J. Gudgel, The Business Value of BIM: getting BuildingInformation Modeling to the bottom line, The McGraw-Hill Companies, New York,2009, p. 52, http://www.nibs.org/client/assets/files/bsa/mhc_bim_smartmarket1109.pdfN, (last accesses on August 27, 2010).
[16] Z. Shen, R. Issa, Quantitative evaluation of the BIM assisted construction detailedcost estimates, ITCON 15 (2010) 234–257.
[17] C. Matta, C. Kam, The GSA's BIM Pilot Program, Presentation by GSA PBS Office ofthe Chief Architect, http://bim.arch.gatech.edu/data/reference/gsaBIM.pdf 20058(last accessed on March 21, 2010).
[18] S. Staub-French, A. Khanzode, 3D and 4D modeling for design and constructioncoordination: issues and lessons learned, ITCON 12 (2007) 381–407.
[19] CRC for Construction Innovation, Adopting BIM for Facilities Management:Solutions for Managing the Sydney Opera House, http://eprints.qut.edu.au/27582/1/27582.pdf 20078 (last accessed on March 21, 2010).
[20] R. Manning, J. Messner, Case studies in BIM implementation for programming ofhealthcare facilities, ITCON 13 (2008) 446–457.
[21] B. Becerik-Gerber, S. Rice, The perceived value of building information modelingin the US building industry, ITCON 15 (2010) 185–201.
[22] V. Bazjanac, Virtual Building Environments (VBE) — Applying InformationModeling to Buildings, ECPPM — eWork and eBusiness in Architecture,Engineering and Construction, Istanbul, Turkey, 2004, Available at: http://gaia.lbl.gov/btech/papers/56072.pdf 20038 Last access on: September 02, 2010.
[23] L. Khemlani, Autodesk Revit: Implementation in Practice, White Paper8 Availableat: http://www.ideateinc.com/whitepapers/bim/Revit%20Implementation.pdfMarch 22, 2004, Last access on: September 02, 2010.
[24] J. Messner, D. Riley, M. Moeck, Virtual facility prototyping for sustainable projectdelivery, ITcon 11 (2006) 723–738.
[25] M. Boryslawski, Building owners driving BIM: the “letterman digital arts center”story, AECbytes, September 30, 2006.
[26] R.M. Leicht, J.I.Messner, Comparing traditional schematic design documentation to aschematic building information model, Proceedings of 24th CIB W78 Conference,Maribor, Slovenia, June 26–29 2007, Available at: b http://itc.scix.net/data/works/att/w78-2007-006-029-Leicht.pdf N Last access on: September 02, 2010.
[27] B.G. Heller, J. Bebee, Construction Firms Testing BIM Applications, Design-buildDateline, http://www.dcstrategies.net/pdf/2_hellerbebee_testing_bim.pdf 2007,(last accessed on March 21, 2010).
[28] Smilow Jeffrey, Practical BIM, Modern Steel Construction, November 2007.[29] T. Hartmann, J. Gao, M. Fischer, Areas of application for 3D and 4D models on
construction projects, Journal of Construction Engineering and Management 134(2008) 776–785.
[30] R. Sacks, R. Barak, Impact of three dimensional parametric modeling of buildingson productivity in structural engineering practice, Automation in Construction 17(2008) 439–449.
[31] C. Kam, M. Fischer, J. Kunz, C. Matta, An Example of Successful Government–AcademiaPartnership, Government/Industry Forum, October 31, 2006, http://reference.kfupm.edu.sa/content/e/x/an_example_of_successful_government_acad_81251.pdfN, (lastaccessed on March 21, 2010).
[32] M.A. Alder, Comparing time and accuracy of building information modeling to on-screen takeoff for a quantity takeoff of a conceptual estimate, Unpublished thesis,Brigham Young University, UK, 2006.
[33] J. Kunz, M. Fischer, Virtual Design and Construction: Themes, Case Studies andImplementation Suggestions, Stanford Center for Integrated Facility Engineering,http://cife.stanford.edu/online.publications/WP103.pdf 2007, (last accessed onMarch 21, 2010).
[34] I. Kaner, R. Sacks, W. Kassian, T. Quitt, Case studies of BIM adoption for precastconcrete design by mid-sized structural engineering firms, ITCON 13 (2008)303–323.
[35] A. Khanzode, M. Fischer, D. Reed, Benefits and lessons learned of implementingbuilding virtual design and construction (VDC) technologies for coordination ofmechanical, electrical, and plumbing (MEP) systems on a large healthcare project,ITCON 13 (2008) 324–342.
[36] S. Azhar, A. Nadeem, J.Y.N. Mok, B.H.Y. Leung, Building information modeling(BIM):a new paradigm for visual interactive modeling and simulation forconstruction projects, 1st International Conference on Construction in DevelopingCountries, Karachi Pakistan, August 4–5, 2008.
[37] M. Fischer, J. Kunz, Impact of information technology on facility engineering,Leadership and Management in Engineering 3 (2003) 100–103.
[38] K. Ku, S.N. Pollalis, M. Fischer, D.R. Shelden, 3D-model based collaboration indesign development and construction of complex shaped buildings, ITCON 13(2008) 458–485.
[39] I. Howell, B. Batcheler, Building information modeling two years later — hugepotential, some success, and several limitations, The Laiserin Letter 24 (February22, 2005).
[40] B.A. Brucker, M.P. Case, E.W. East, B.K. Huston, S.D. Nachtigall, J.C. Shockley, S.C.Spangler, J.T. Wilson, Building Information Modeling (BIM): a road map forimplementation to support MILCON transformation and civil works projectswithin the U.S. Army Corps of Engineers, US Army Corps of Engineers, EngineerResearch and Development Center, 2006, p. 99.
[41] C.V. Rijsbergen, Information Retrieval, 2nd Edition, Boston. Butterworth, London,1979.
[42] C. Eastman, P. Teicholz, R. Sacks, K. Liston, BIM handbook: a guide to buildinginformation modeling for owners, managers, designers, engineers and contrac-tors, Wiley, New York, 20088 504 pp.
[43] J. Bedrick, Organizing the Development of a Building Information Model,AECbytes, http://www.aecbytes.com/feature/2008/MPSforBIM.html September 18,2008.


![Ornament ist kein Detail [Ornament is no Detail] (2012)](https://static.fdokumen.com/doc/165x107/6345424d38eecfb33a067963/ornament-ist-kein-detail-ornament-is-no-detail-2012.jpg)