Analysis of Marketing Margins under Food Recalls and BSE Outbreaks in the U.S. Beef Industry
23
Analysis of Marketing Margins under Food Recalls and BSE Outbreaks in the U.S. Beef Industry Sunil P. Dhoubhadel West Central Research & Extension Center University of Nebraska-Lincoln 402 State Farm Rd. North Platte, NE 69101 [email protected] Sergio C. Castillo Department of Agricultural Economics Texas A&M University 308 B Blocker, 2124 TAMU College Station, TX 77843-2124 [email protected] Oral Capps, Jr. Department of Agricultural Economics Texas A&M University 330 B Blocker, 2124 TAMU College Station, TX 77843-2124 [email protected] Selected Paper prepared for presentation at the Agricultural & Applied Economics Association’s 2009 AAEA & ACCI Joint Meeting, Milwaukee, WI, July 26-28, 2009 Copyright 2009 by [Sunil P. Dhoubhadel, Sergio C. Castillo, and Oral Capps, Jr.]. All rights reserved. Readers may make verbatim copies of this document for non-commercial purposes by any means, provided this copyright notice appears on all such copies.
-
Upload
independent -
Category
Documents
-
view
0 -
download
0
Transcript of Analysis of Marketing Margins under Food Recalls and BSE Outbreaks in the U.S. Beef Industry
Analysis of Marketing Margins under Food Recalls and BSE Outbreaks in the
U.S. Beef Industry
Sunil P. Dhoubhadel West Central Research & Extension Center
University of Nebraska-Lincoln 402 State Farm Rd.
North Platte, NE 69101 [email protected]
Sergio C. Castillo Department of Agricultural Economics
Texas A&M University 308 B Blocker, 2124 TAMU
College Station, TX 77843-2124 [email protected]
Oral Capps, Jr. Department of Agricultural Economics
Texas A&M University 330 B Blocker, 2124 TAMU
College Station, TX 77843-2124 [email protected]
Selected Paper prepared for presentation at the Agricultural & Applied Economics Association’s
2009 AAEA & ACCI Joint Meeting, Milwaukee, WI, July 26-28, 2009
Copyright 2009 by [Sunil P. Dhoubhadel, Sergio C. Castillo, and Oral Capps, Jr.]. All rights
reserved. Readers may make verbatim copies of this document for non-commercial purposes by
any means, provided this copyright notice appears on all such copies.

Analysis of Marketing Margins under Food Recalls and Disease Outbreak in US Beef Industry
1
Analysis of Marketing Margins under Food Recalls and BSE Outbreaks in the U.S.
Beef Industry
Sunil P. Dhoubhadel1, Sergio C. Castillo2, Oral Capps, Jr.3
Abstract
It is generally observed that whenever there are cases of disease outbreaks or food recalls, there
is a concomitant decline in commodity prices. However, it is still not clear what happens to
price spreads among affected agents in the marketing chain. To shed light on this issue, we
estimate the collective impact of Bovine Spongiform Encephalopathy (BSE) and food recalls on
marketing margins associated with the U.S. beef industry over time. In previous research, the
effects of these variables on the market demand of meat were estimated separately. By including
these variables together in the same model specification we avoid the possibility of confounding
their effects, and we are in position to obtain more precise estimates of elasticities of price
transmission along the marketing chain.
Key words: marketing margins, elasticities of price transmission, BSE, food recalls, U.S. beef
industry
1 Sunil P. Dhoubhadel is Research Analyst at West Central Research & Extension Center of the University of Nebraska, Lincoln, NE. 2 Sergio C. Castillo is a Graduate Research Assistant at Texas A&M University, College Station, TX. 3 Dr. Oral Capps, Jr., is Professor and Holder of the Southwest Dairy Marketing Endowed Chair at Texas A&M University, College Station, TX.
Analysis of Marketing Margins under Food Recalls and Disease Outbreak in US Beef Industry
2
Introduction
We analyze the impact of Food Safety Inspection Service (FSIS) recalls and Bovine
Spongiform Encephalopathy (BSE) outbreaks on the U.S. beef market, specifically their effects
on the marketing margins at farm-wholesale-retail levels of the beef marketing chain. The
empirical question is how marketing margins respond to specific market stresses induced by food
safety concerns. The two types of food safety variables used in this study are related to food
contamination and animal disease. Because the two variables may appear simultaneously in
same period of time and some correlation is expected between food contamination and disease
outbreaks, it is important to analyze these variables collectively. Since the effect of these two
variables may simultaneously appear in some periods of time, this approach will allow us to
isolate the impact of each variable on marketing margins associated with the U.S. beef industry
using monthly data over the time period of 1982 to 2006. Further, our analysis rests on the use
of distributed lag models to take account of the effects of the BSE outbreaks. Our results may aid
policy makers to target support to the most vulnerable agents in the marketing channel given the
occurrences of food safety incidents.
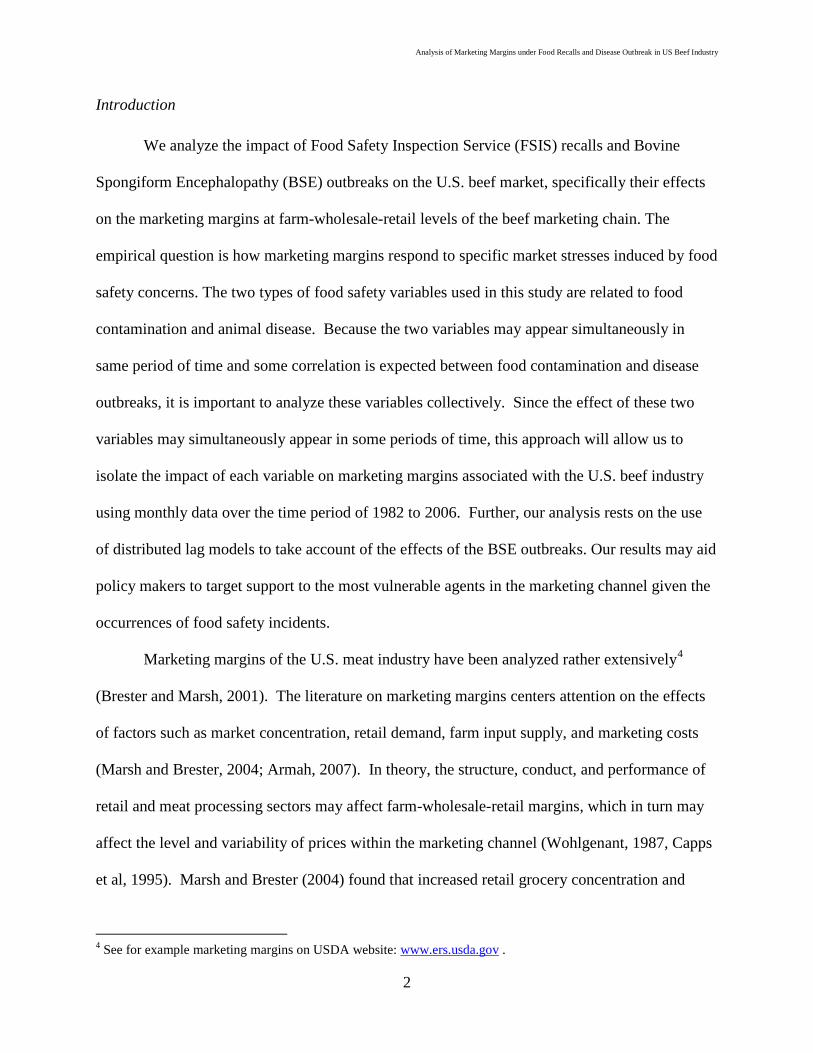
Marketing margins of the U.S. meat industry have been analyzed rather extensively4
4 See for example marketing margins on USDA website:
(Brester and Marsh, 2001). The literature on marketing margins centers attention on the effects
of factors such as market concentration, retail demand, farm input supply, and marketing costs
(Marsh and Brester, 2004; Armah, 2007). In theory, the structure, conduct, and performance of
retail and meat processing sectors may affect farm-wholesale-retail margins, which in turn may
affect the level and variability of prices within the marketing channel (Wohlgenant, 1987, Capps
et al, 1995). Marsh and Brester (2004) found that increased retail grocery concentration and
www.ers.usda.gov .
Analysis of Marketing Margins under Food Recalls and Disease Outbreak in US Beef Industry
3
declining retail grocery productivity significantly increased wholesale-to-retail margins and
reduced livestock (cattle and hogs) prices. Schroeter et al. (2000) found little evidence of
oligopoly power of meat packing firms but some evidence of oligopsony power by retail grocery
firms in the United States. Armah (2007) found that the surge in retail market concentration in
1999 resulted in increased oligopsony power of retailers relative to oligopoly power of
wholesalers in the U.S. beef industry. However, variables such as disease outbreaks or food
scares rarely have been included in analyses of market margins. To our knowledge, previous
works have examined the impacts of food contamination (i.e. food recalls) or disease outbreaks
(i.e. mad cow disease or BSE) in isolation, but heretofore, no study relates these market stress
variables together in analyzing marketing margins.
The first confirmed cases of BSE in Canada and in the United States had significant
effects on trade and prices of U.S. cattle and beef (Coffey et al. 2005; Almas, Collete, and
Amosson 2005; Hanrahan and Becker 2006; Mathews, Vaneveer, and Gustafson 2006).
Moreover, following BSE outbreaks, the United States announced a series of regulations which
required slaughterhouses to remove additional products from cattle and find new ways to dispose
of the specified risk materials banned from human or animal consumption (Mathews, Vaneveer,
and Gustafson 2006). These new regulations resulted in additional production costs and reduced
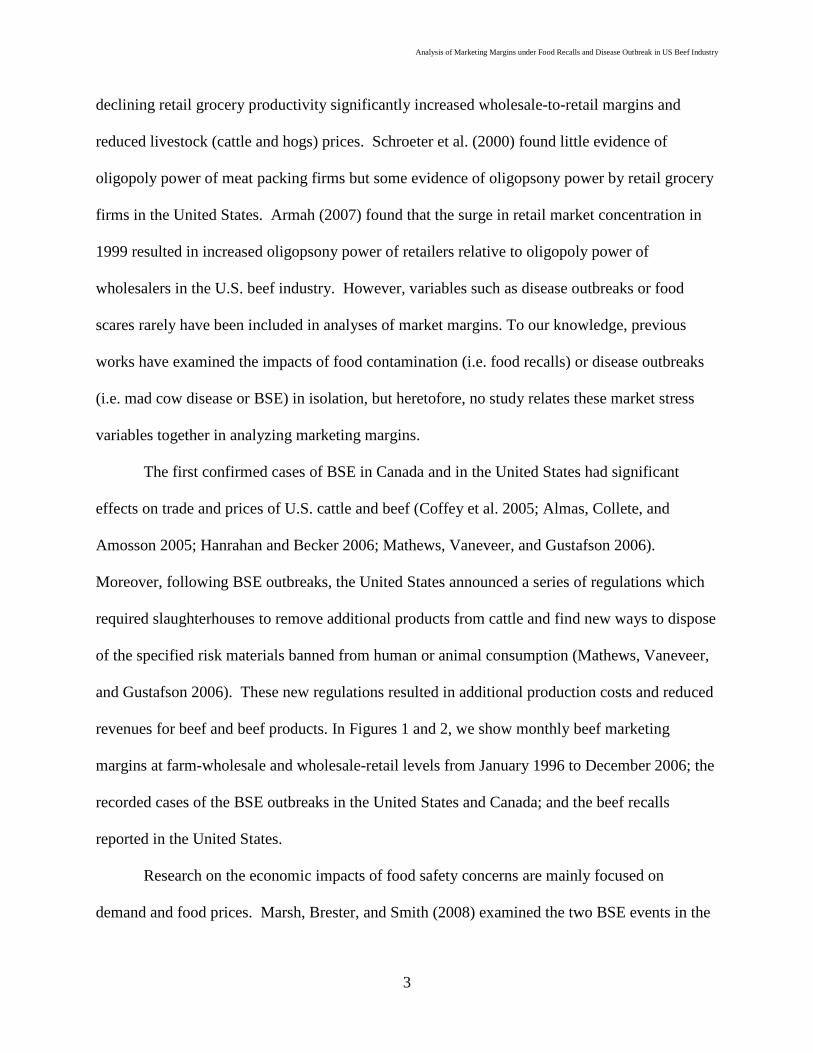
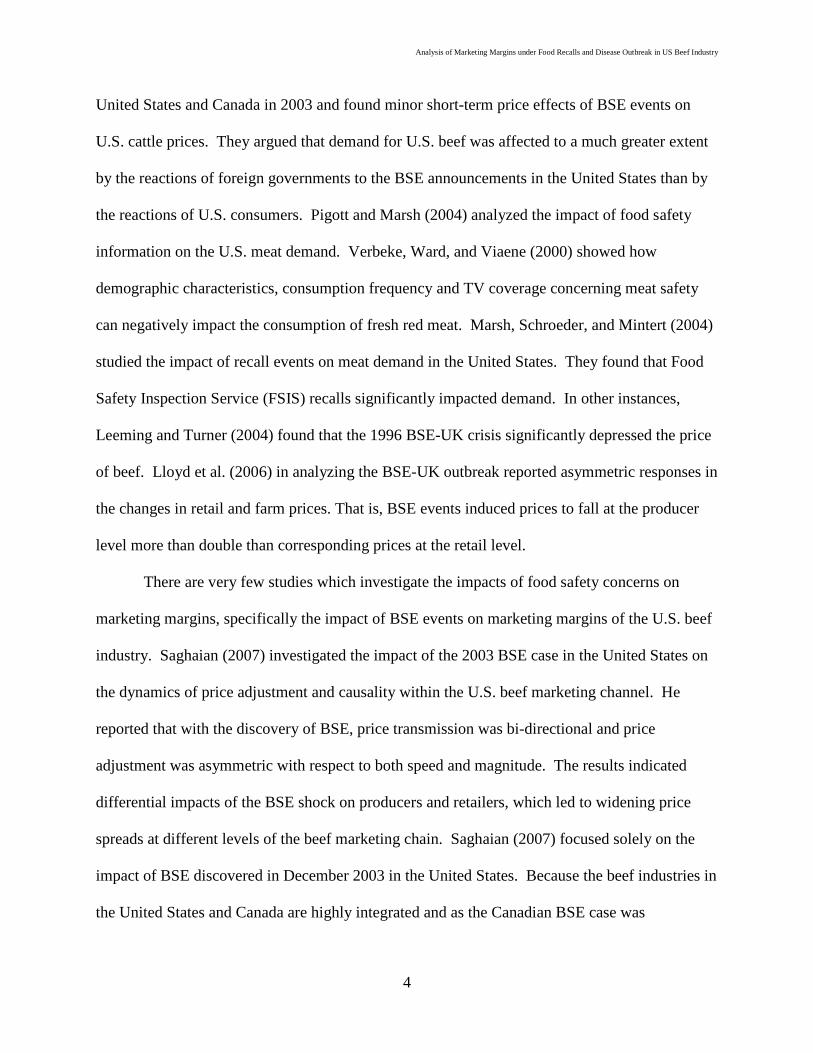
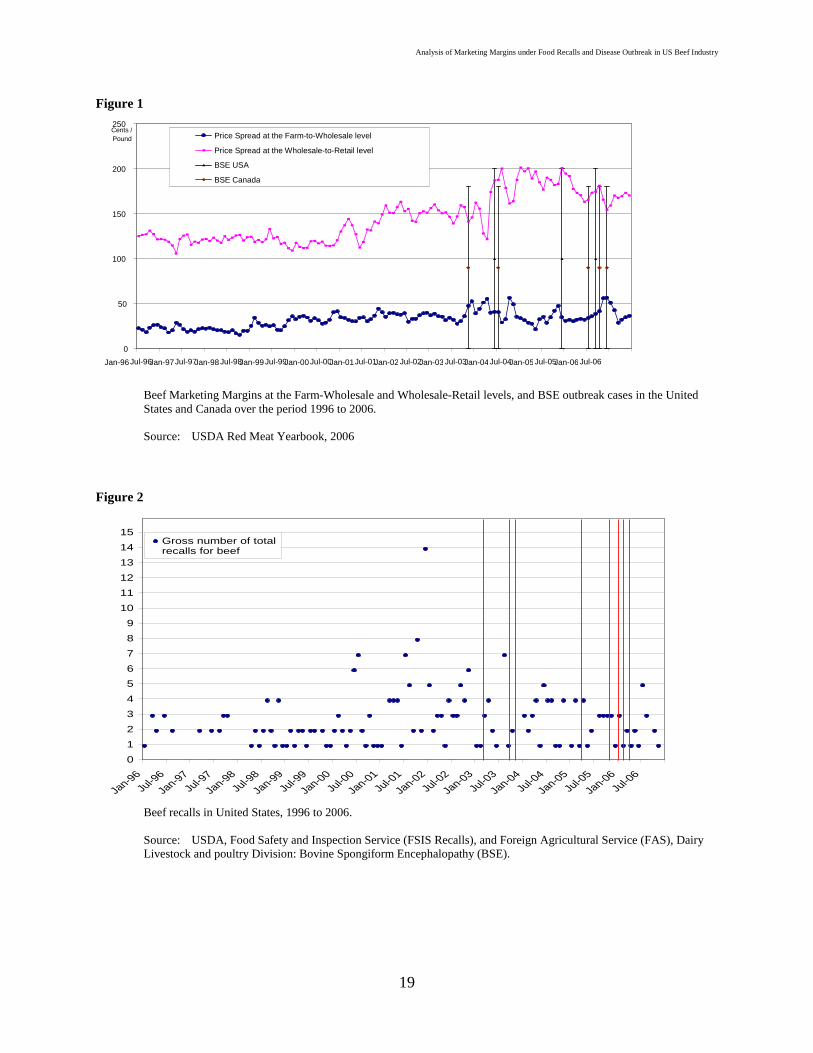
revenues for beef and beef products. In Figures 1 and 2, we show monthly beef marketing
margins at farm-wholesale and wholesale-retail levels from January 1996 to December 2006; the
recorded cases of the BSE outbreaks in the United States and Canada; and the beef recalls
reported in the United States.
Research on the economic impacts of food safety concerns are mainly focused on
demand and food prices. Marsh, Brester, and Smith (2008) examined the two BSE events in the
Analysis of Marketing Margins under Food Recalls and Disease Outbreak in US Beef Industry
4
United States and Canada in 2003 and found minor short-term price effects of BSE events on
U.S. cattle prices. They argued that demand for U.S. beef was affected to a much greater extent
by the reactions of foreign governments to the BSE announcements in the United States than by
the reactions of U.S. consumers. Pigott and Marsh (2004) analyzed the impact of food safety
information on the U.S. meat demand. Verbeke, Ward, and Viaene (2000) showed how
demographic characteristics, consumption frequency and TV coverage concerning meat safety
can negatively impact the consumption of fresh red meat. Marsh, Schroeder, and Mintert (2004)
studied the impact of recall events on meat demand in the United States. They found that Food
Safety Inspection Service (FSIS) recalls significantly impacted demand. In other instances,
Leeming and Turner (2004) found that the 1996 BSE-UK crisis significantly depressed the price
of beef. Lloyd et al. (2006) in analyzing the BSE-UK outbreak reported asymmetric responses in
the changes in retail and farm prices. That is, BSE events induced prices to fall at the producer
level more than double than corresponding prices at the retail level.
There are very few studies which investigate the impacts of food safety concerns on
marketing margins, specifically the impact of BSE events on marketing margins of the U.S. beef
industry. Saghaian (2007) investigated the impact of the 2003 BSE case in the United States on
the dynamics of price adjustment and causality within the U.S. beef marketing channel. He
reported that with the discovery of BSE, price transmission was bi-directional and price
adjustment was asymmetric with respect to both speed and magnitude. The results indicated
differential impacts of the BSE shock on producers and retailers, which led to widening price
spreads at different levels of the beef marketing chain. Saghaian (2007) focused solely on the
impact of BSE discovered in December 2003 in the United States. Because the beef industries in
the United States and Canada are highly integrated and as the Canadian BSE case was
Analysis of Marketing Margins under Food Recalls and Disease Outbreak in US Beef Industry
5
discovered in May 2003 just a few months before the U.S. BSE outbreak, it is possible that the
cumulative effects of the Canadian BSE outbreak still persisted within the United States. It
would be, therefore, reasonable to model the effect of the Canadian BSE case in analyzing the
impact on marketing margins of the U.S. beef industry. Moreover, as reported by Marsh,
Schroeder, and Mintert (2004), because food recalls also can significantly affect consumer
demand, it is important to analyze the collective impact of these variables on marketing margins
for beef.
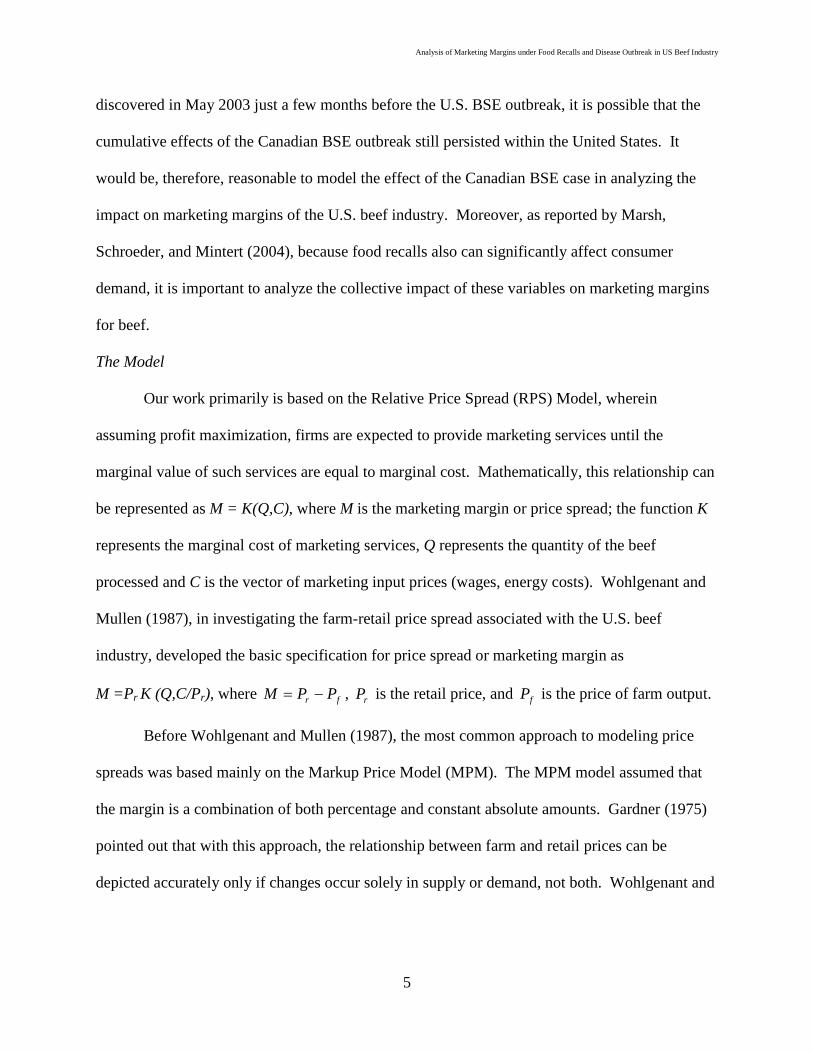
The Model
Our work primarily is based on the Relative Price Spread (RPS) Model, wherein
assuming profit maximization, firms are expected to provide marketing services until the
marginal value of such services are equal to marginal cost. Mathematically, this relationship can
be represented as M = K(Q,C), where M is the marketing margin or price spread; the function K
represents the marginal cost of marketing services, Q represents the quantity of the beef
processed and C is the vector of marketing input prices (wages, energy costs). Wohlgenant and
Mullen (1987), in investigating the farm-retail price spread associated with the U.S. beef
industry, developed the basic specification for price spread or marketing margin as
M =Pr K (Q,C/Pr), where fr PPM −= , rP is the retail price, and fP is the price of farm output.
Before Wohlgenant and Mullen (1987), the most common approach to modeling price
spreads was based mainly on the Markup Price Model (MPM). The MPM model assumed that
the margin is a combination of both percentage and constant absolute amounts. Gardner (1975)
pointed out that with this approach, the relationship between farm and retail prices can be
depicted accurately only if changes occur solely in supply or demand, not both. Wohlgenant and
Analysis of Marketing Margins under Food Recalls and Disease Outbreak in US Beef Industry
6
Mullen (1987) introduced the RPS model to allow simultaneous changes in both demand and
supply.
Wohlgenant and Mullen (1987) posited that in contrast to the markup pricing model, with
the RPS there is no fixed relationship between the price spread and the retail price. This
relationship is based on the theory that shifts in retail demand and farm supply have two possible
avenues of influence on the farm-retail price spread, namely quantity of output and retail price.
Increases in output and increases in relative marketing costs lead to higher relative price spreads.
Advancing the RPS model, Capps, Byrne, and Williams (1995) estimated the relative
price spread associated with the U.S. lamb industry. Unlike the Wohlgenant and Mullen (1987)
model, they decomposed the farm-to-retail relative price spread into slaughter-to-wholesale and
wholesale-to-retail segments. Further, they incorporated packer concentration in the slaughter-to-
wholesale specification with allowance for economies of scale. In addition, the respective price
spread models were estimated as a system of equations (SUR model) to capture gains in
efficiency. Capps, Byrne, and Williams (1995) also estimated elasticities of price transmission
(EPT) to take account of the responsiveness of downstream prices due to changes in upstream
prices along the marketing channel. Using the aforementioned theoretical framework and its
extensions, we center attention on how elasticities of price transmission react to incidences of
market stress (e.g. food recalls and BSE).
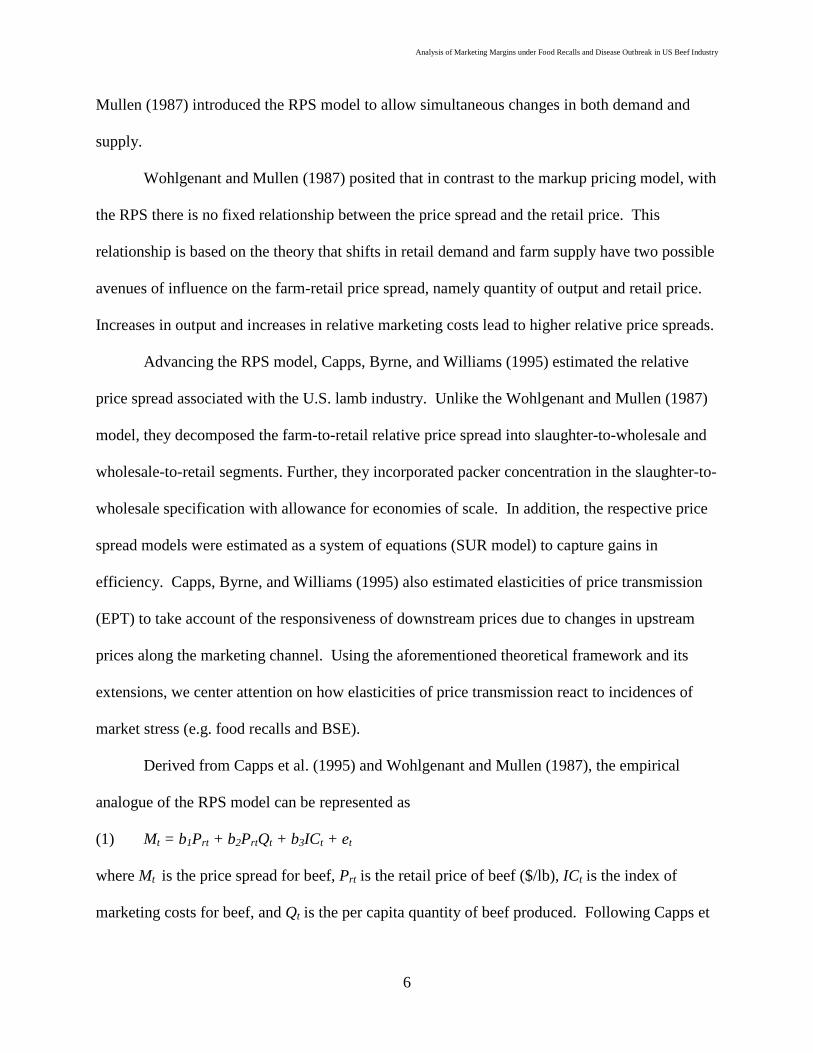
Derived from Capps et al. (1995) and Wohlgenant and Mullen (1987), the empirical
analogue of the RPS model can be represented as
(1) Mt = b1Prt + b2PrtQt + b3ICt + et
where Mt is the price spread for beef, Prt is the retail price of beef ($/lb), ICt is the index of
marketing costs for beef, and Qt is the per capita quantity of beef produced. Following Capps et

Analysis of Marketing Margins under Food Recalls and Disease Outbreak in US Beef Industry
7
al. (1995), the augmented RPS model used for this study includes the effect of beef packer
concentration at the farm-to-wholesale level as well at the wholesale-to-retail level; the second
adjustment includes the potential effects of seasonal fluctuations in beef demand; and finally,
adjustments were made to take account of effects of FSIS food recalls and BSE outbreaks in the
United States and Canada. Our empirical Augmented Relative Price Spread (ARPS) model is
given by equations (2) and (3).
(2) Mfwt = β1Pwt + β2PwtQwt + β3ICTt + γ1TOP4wt + φ1R1t + φ2R2t +φ3BSEusat
+ φ4BSEcant + εwt
(3) Mwrt = α1Prt + α2PrtQrt + α3ICTt +τ1TOP4rt + θ1R1t +θ2R2t+ θ3BSEusat
+ θ4BSEcant + εrt
With the ARPS model, we analyze the farm-to-wholesale (Mfw), wholesale-to-retail (Mwr)
and farm-to-retail margins (Mfr = Mwr + Mfw) in price equivalent retail weight terms
(cents/pound). Pwt and Prt correspond to wholesale prices and retail prices respectively
expressed in cents/ pound; Qwt and Qrt are the monthly per capita disappearance of beef in
pounds at the wholesale and retail levels of the marketing chain; ICT is an index of marketing
costs associated with the food industry; TOP4wt and TOP4rt are the top 4-firm concentration
ratios (%) at the wholesale (beef slaughter plants) and retail (box-beef packing plants) levels of
the industry channel. R1 indicates the number of all recall cases reported by FSIS while R2 is a
dummy variable to indicate “severe” FSIS recall cases. BSEusa and BSEcan are indicator variables,
which take into account the effect of the BSE outbreak in the United States and in Canada,
considering the integration of North America beef market.
Testable hypotheses include: (1) the marketing margins at different levels of the U.S.
beef marketing chain are not affected by FSIS recalls and BSE outbreaks, i.e. H 01 : φ1 = …=φ4=
Analysis of Marketing Margins under Food Recalls and Disease Outbreak in US Beef Industry
8
0 and; H 02 : θ1 =… = θ4 =0; and (2) the impacts of FSIS recalls and BSE outbreaks are the same
on the farm-to-wholesale marketing margin and the wholesale-to retail marketing margin, i.e.
H03:φ1 = θ1 , …, H06:φ4 =θ4,
An ARIMA model was used to account for contemporaneous correlations of the
disturbance terms in equations (2) and (3). The adjustment for seasonality was done by the
inclusion of monthly indicator variables. Additionally, the potential effects of R1, R2, BSEusa,
and BSEcan may not be felt at once, but instead these effects may be distributed over time. To
capture such potential responses, we employ a polynomial distributed lag process associated with
these respective variables.
Subsequently, we estimate the elasticity of price transmission (EPT) at the wholesale-
retail (EPTwr), farm-wholesale (EPTfw) and farm-retail (EPTfr) level. The EPT estimates reflect
the degree of price transmission along segments of the marketing channel, that is, the percentage
change in a downstream price due to a one-percent change in an upstream price. An EPT close
to zero means no transmission of price signals among the segments of the marketing chain,
which may be attributed to imperfect competition or non-price competition (Capps et al. 1995).
Data
Our study relies on the use of monthly data from January 1982 to December 2006. Prices
and quantities were collected based on the Red Meat Yearbook 20065
5 All these data were checked independently with various USDA personnel.
. Data for BSE and FSIS
recalls were taken from official reports of several federal agencies, all of them available on line.
Information on marketing cost indices and market concentration variables were taken from
related USDA reports. The sources of data as well as details pertaining to the data are presented
in the Appendix.
Analysis of Marketing Margins under Food Recalls and Disease Outbreak in US Beef Industry
9
Prices are expressed as cents per pound of retail weight equivalent. All these prices were
adjusted for inflation using the Consumer Price Index (CPI) for food and beverages (1982-84 =
100).
The quantities pertain to per capita beef consumption expressed in pounds. Farm
quantity is the total weight sold by feeder lots (quantity bought by slaughter plants). Wholesale
quantity is the carcass sold by slaughter plants to fabricating plants (or quantity bought by boxed
beef packer), and retail quantity is the amount sold by boxed beef packers to retail stores
(quantity bought by retail stores, ready to be sold to consumers)6
Four-firm concentration ratios were added to the respective specifications of the model.
At the wholesale level, concentration is measured as the percentage of the four largest cattle
slaughter firms from total commercial slaughter plants. At the retail level, concentration
corresponds to the percentage of output associated with the four largest boxed beef fabricating
plants relative to total output.
. The retail quantity was
constructed on the basis of disappearance of beef, given as commercial meat production, plus
imports, less exports, plus beginning stocks, less ending stocks. We then multiplied this quantity
by a conversion factor to arrive at a retail weight equivalent of beef. The conversion factor used
in this study is 0.74, the factor used in USDA reports from 1982 to 2006.
Marketing costs are incurred in paying wages, transportation/fuel, advertising, energy,
and other costs. As specific costs indigenous to the U.S. beef industry were not available, a Food
Marketing Cost Index7
6 Beef quantity includes the disappearance of veal as well. It was not possible to disaggregate beef and veal in the data of exports and imports.
developed by ERS, USDA was used as a proxy. This index is presented
on a monthly basis for both wholesaling and retail activities.
7 Mr. Howard Elitzak, Agricultural Economist, Economic Research Service (ERS), USDA generously provided
Analysis of Marketing Margins under Food Recalls and Disease Outbreak in US Beef Industry
10
FSIS reported meat recalls were taken from the USDA Food Safety and Inspection
Service web site8 and classified by type of meat (beef, pork, chicken, turkey, and others), by
class (class I, II and III), type of events (bacterial and others), and by the amount of meat recalled
(greater and less than 1,000 kg). These FSIS recalls were used to form two variables: (1) total
recalls, which is the sum of recalls of beef per month; and (2) a dummy variable to identify
severe recall cases. This dummy takes the value of one if it is a national recall case, a class I9
The BSE cases were taken from the USDA and classified as two dummy variables: (1)
BSE in the United States (December 2003 in Washington, June 2005 in Texas and March 2006
in Alabama); and (2) BSE in Canada (May 2003, January 2004, January 2006, April 2006, and
June 2006). The reason for isolating BSE from recall cases is to avoid any confounding of their
effects as well as to ascertain the individual impacts of BSE cases and recalls on marketing
margins for beef.
case due to bacterial reasons, or if the amount of meat recalled is greater than 1,000 kg. This
dummy variable is assigned a value of zero otherwise (regional recalls, class II or III non-
bacterial cases, or if amounts recalled <1,000 kg). Previous research provided some basis for the
construction of the food recall dummy variable (Salin et al, 2005; and Marsh et al, 2004).
Empirical Results
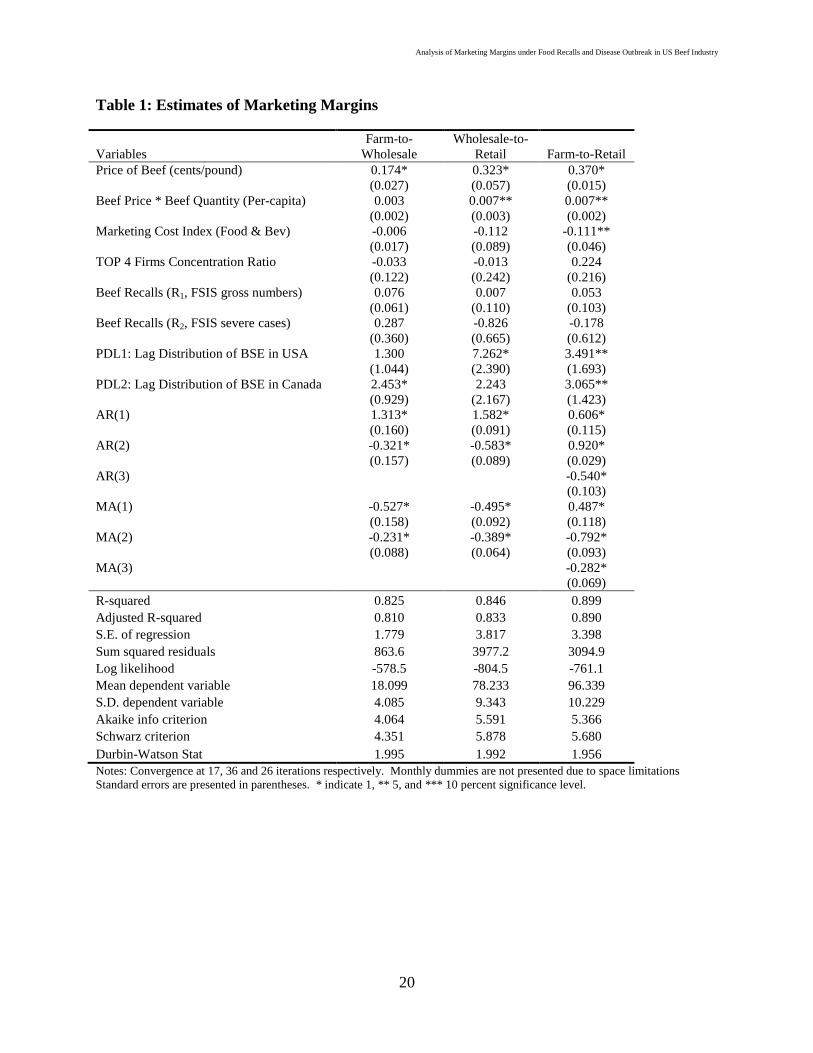
The parameter estimates pertaining to equations 2 and 3 for the ARPS model are shown
in Table 1. The third column refers to empirical results of the farm-to-retail marketing margin.
The software package used to obtain these parameter estimates, standard errors, test statistics and
these data. 8 Some data input of recall cases from 1982 to 1994 were generously provided by Dr. Schroeder from Kansas State University. 9 This class includes the more risky cases.
Analysis of Marketing Margins under Food Recalls and Disease Outbreak in US Beef Industry
11
p-values is EVIEWS 6.0. The goodness-of-fits for the respective empirical models were
reasonable, ranging from 0.825 to 0.899. The estimated coefficients of the appropriate
downstream beef price are significant at the 1 percent level in all marketing margins of beef.
The coefficients of the interaction of price-quantity variables are significant at the wholesale-to-
retail level and at the farm-to-retail levels. The coefficients related to the marketing cost index
are negative but not significant with exception of the farm-retail margin. The coefficient top 4-
firm concentration and recall variables are non-significant in all the marketing margin analyses.
The impacts of U.S. BSE outbreaks are significant in the analysis of the wholesale-to-retail
margin and in the farm-to-retail margin. The impacts of Canadian in BSE cases are significant in
the analysis of the farm-to-wholesale margin and in the farm-to-retail margin. Autoregressive
and moving average terms associated with the residuals are needed to fix the serial correlation
problem.
The joint significance of the recall variables and the BSE variables (F-statistic = 2.89, p-
value = 0.022) indicates their importance in affecting the marketing margins at different levels of
the U.S. beef marketing channel. Comparing changes in marketing margins at the farm-to-
wholesale level with those at the wholesale-to-retail indicates no significant difference due to R1
and BSE cases in Canada. However, the changes attributed to BSE in the United States and
attributed to R2 are significant, indicating that the effects of these BSE and recall cases have
differential impacts in the beef marketing chain.
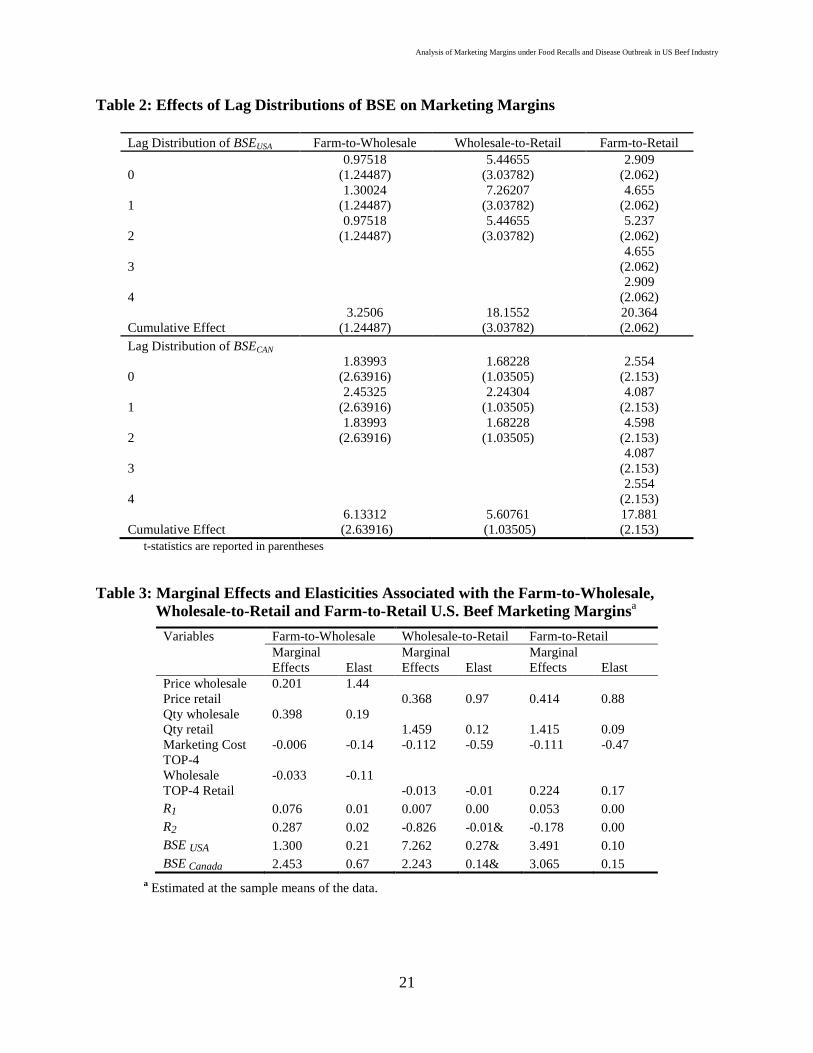
In Table 2, we show the distributed lag effects of BSEUSA and BSECAN on the respective
marketing margins. For BSE cases reported in the United States, the adjustment is done in two
months with an estimated effect of up to 18 cents on the wholesale-to-retail margin (around 23
percent of the average wholesale-to-retail marketing margin). BSE cases in Canada have a
Analysis of Marketing Margins under Food Recalls and Disease Outbreak in US Beef Industry
12
significant effect on the farm-to-wholesale margin. The adjustment also is done in two months at
the farm-to-wholesale level (around 35 percent of average farm-to-wholesale marketing margin).
Interestingly, both the BSE cases in the United States and Canada are significant for farm-to-
retail marketing margin relationships. The adjustment is done in four months with a cumulative
effect of about 20 cents (around 21 percent of average farm-to-retail marketing margin) for
BSEUSA and 18 cents (around 19 percent of average farm to retail marketing margin) for BSECAN.
The two-month and four-month lags are in line with the work of Schlenker and Villa-Boas
(2008). They found that reductions in beef sales persisted for three months after the U.S. BSE
event in 2003.
As exhibited in Table 3, we report the marginal effects and the elasticities associated with
the respective U.S. beef marketing margins. Prices and quantities, as expected, have positive
marginal effects on the marketing margins. While the marketing cost index and the four-firm
concentration ratios were found to be negatively related to the marketing margins, they were
generally non-significant. The marginal effects of BSE cases, either in the United States or
Canada have positive influences on marketing margins. Similarly, the effects of recalls R1 were
found to have positive, but non-significant influences on marketing margins. But the R2 effects
of the recalls were positive in the farm-to-wholesale margin and negative in the wholesale-to-
retail margin.
The results on elasticities indicate that in general marketing margins are inelastic with
respect to both recalls and BSE cases (Table 3). Marketing margins are more sensitive to
changes in prices than to changes in other determinants.
Analysis of Marketing Margins under Food Recalls and Disease Outbreak in US Beef Industry
13
Finally, following Capps et al. (1995), the elasticity of price transmission (EPT) from
the wholesale-to-retail level (EPTwr) can be estimated from equation 3 as follows:
rrCANUSAwrr TOPICTBSEBSERRPQP 4)1( 1
^
3
^
4
^
3
^
22
^
11
^^
2
^^
1
^γαθθθθαα +++++=−−− ,
Hence,
)4(*)]1/(1[ 1
^
3
^
4
^
3
^
22
^
11
^^
2
^^
1
^
rrCANUSAwrr TOPICTBSEBSERRPQP γαθθθθαα ++++++−−= , and
taking the derivative on Pw, it is )1/(1/ 2
^^
1
^^
rwr QPP αα −−=∂∂ . Therefore, EPTwr =
rwwr PPPP /*/^^
∂∂ = [1/( rQ2
^^
11 αα −− )]* rw PP / . Similarly, from equation 2, the EPT from the
farm-to-wholesale level is given as follows: EPTfw = wffw PPPP /*/^^
∂∂ = )]1/(1[ 2
^
1
^
wQββ −− *
wf PP / . Finally, the EPT from the farm-to-retail level is given by EPTfr = rffr PPPP /*/^^
∂∂ =
)]1/(1[ 2
^
1
^
rQδδ −− * rf PP / . Alternatively Mfr = Mfw + Mwr since it is an additive identity.
Therefore EPTfr = ( fwwr PPPP ˆ/ˆ*/^^
∂∂∂∂ ) rf PP /* = EPTfw * EPTwr. The empirical results
associated with the EPT estimates are presented in Table 4.
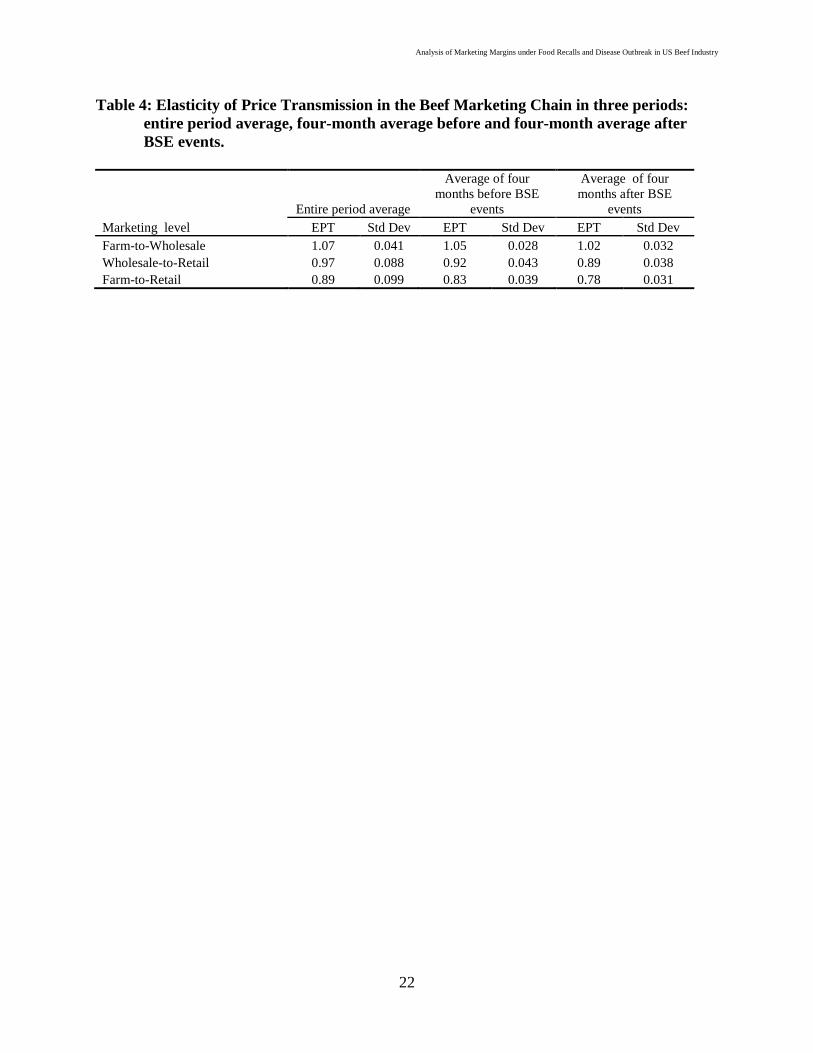
In Table 4, we present the EPT estimates over the entire sample period as well as for the
four-month period immediately before and immediately after the BSE outbreak either in the
United States or Canada. This comparison explores the possibility of a change in the elasticity of
transmission due to periods before and after the BSE outbreaks. Over the entire sample period, a
one-percent increase in farm prices results in a one-percent increase in wholesale prices. That is,
at this level of the marketing channel, the EPT is nearly one. However, at the wholesale-to-retail
level, the EPT is 0.97, and at the farm-to-retail level the EPT is 0.89. The EPT, however,
Analysis of Marketing Margins under Food Recalls and Disease Outbreak in US Beef Industry
14
decreases before and after the BSE events, at least within this four-month window. This
phenomenon is observed in all three levels of marketing chain.
Final Remarks
We examine the effects of FSIS recalls and BSE cases in the United States and Canada
on the marketing margins of the U.S. beef industry at various levels of marketing chain. Most of
the previous studies on this topic dealt with food recalls or BSE separately. This study assesses
combined effects of both variables in a dynamic context; it includes the lagged effects of beef
recalls and BSE outbreaks on the marketing margins assuming that adjustments are not made
instantaneously to such events.
As expected, the forces of demand and supply represented by prices and quantities have
positive influences on the respective marketing margins. For the most part neither marketing
costs nor market concentration have any significant effects on the marketing margins over the
period January 1982 to December 2006.
Beef recalls have insignificant impacts on the marketing margins at any level. Changes
in marketing margins because of BSE are, however, significant. BSE outbreaks in Canada
significantly affect the farm-to-wholesale marketing margin and BSE outbreaks in the United
States affect the wholesale-to-retail margin. However, BSE outbreaks, both in Canada and in the
United States, significantly affect the farm-to-retail level marketing margin. This effect is passed
on in two months from one level to other (i.e. farm-to-wholesale or wholesale-to-retail).
However, it takes four months for the BSE outbreaks to pass through the beef marketing chain
from the farm-to-retail level. During four months before and after the BSE outbreak periods, the
magnitude of the elasticities price transmission decreased, indicating a clear effect on marketing
margins.
Analysis of Marketing Margins under Food Recalls and Disease Outbreak in US Beef Industry
15
Some limitations are apparent in this analysis. For example, we used the recall
information and reported cases of BSE as a measure to analyze changes in marketing margins.
However, consumers may not be aware of such reports unless the general media publicizes such
information. Media can fabricate or exaggerate such information. As reported by Schlenker and
Villas-Boas (2008), the Oprah Winfrey TV show in 1996 on mad cow disease resulted in cattle
futures prices dropping substantially more than the drop observed following the first discovery of
BSE in the United States. In other cases, under reporting of some incidents by the media also is
possible. Because consumer demand and the marketing margins can be affected by the media,
one must be cautious concerning the magnitudes of the changes reported. Finally, this study is
based on the national level data; therefore, some care must be taken when extrapolating from our
results to shed light on changes indigenous to specific states or regions.
Analysis of Marketing Margins under Food Recalls and Disease Outbreak in US Beef Industry
16
References Almas, L. K., W. A. Colette, and S. H. Amosson. 2005. “BSE, U.S. Beef Trade and Cattle Feeding
Industry”. Selected paper prepared for presentation at the Southern Agricultural Economics Association Annual Meetings Little Rock, Arkansas, 5-9 February.
Armah. S. 2007. “An Empirical Analysis of Recent Changes in U.S. Beef Marketing Margins.”
Selected paper prepared for presentation at the American Agricultural Economics Association annual meetings, Portland, Oregon, 29 July - 1 August.
Brester, G. W., and J. M. Marsh. 2001. "The Effects of U.S. Meat Packing and Livestock
Production Technologies on Marketing Margins and Prices." Journal of Agricultural and Resource Economics 26:445-462.
Capps, O., P. Byrnes, and G. Williams.1995: “Analysis of Marketing Margins in the U.S. Lamb
Industry,” Agricultural and Resource Economics Review 24(2):232–240. Coffey B., J. Mintert, S. Fox, T. Schroeder, and L. Valentin. 2005. “The Economic Impact of BSE on the
U.S. Beef Industry: Product Value Losses, Regulatory Costs, and Consumer Reactions.” Kansas State University, Kansas.
Gardner, B.L. 1975. “The Farm-Retail Price Spread in a Competitive Food Industry.” American Journal of Agricultural Economics 57:399-409.
Hanrahan, C. E. and G. S. Becker. 2006. “Mad Cow Disease and U.S. Beef Trade.” Congressional
Research Service, the Library of Congress. Washington D.C. Greene, W. 2003. Econometric Analysis, 5th Edition. New Jersey: Prentice Hall. Hall, L., A. Schmitz, and J. Cothern. 1979."Beef Wholesale-Retail Marketing Margins and
Concentration." Economica 46:295300. Leeming, J. & Turner, P. 2004. “The BSE Crisis and the Price of Red Meat in the UK.” Applied
Economics 36:1825–1829. Lloyd, T. A., McCorriston, S, Morgan, C. Wyn, and Rayner, A. J. 2006. "Food Scares, Market
Power and Price Transmission: The UK BSE Crisis”. European Review of Agricultural Economics 33(2):119-147.
Marsh, J., and G. Brester. 2004: “Wholesale -Retail Margin Behavior in Pork and Beef,” Journal
of Agricultural and Resource Economics 29:45–64. Marsh, J. M., G. W. Brester & V. H. Smith. 2008. “Effects of North American BSE Events on
U.S. Cattle Prices”. Review of Agricultural Economics 30(1):36–150. Marsh, T. L., T. C. Schroeder, & J. Mintert. 2004. “Impacts of Meat Product Recalls on
Consumer Demand in the USA”. Applied Economics 36:897-909.

Analysis of Marketing Margins under Food Recalls and Disease Outbreak in US Beef Industry
17
Mathews, K. Jr., M. Vaneveer and R. A. Gustafson. 2006. An Economic Chronology of Bovine
Spongiform Encephalopathy in North America/ LDP-M-143-01. Washington DC: Economic Research Service/ USDA, Electronic outlook report from the economic research Service/USDA, June. Available at http://www.ers.usda.gov/publications/ldp/2006/06Jun/ldpm14301/ldpm14301.pdf
Piggot, N. E., & T. L. Marsh. 2004. “Does Food Safety Information Impact U.S. Meat
Demand?” American Journal of Agricultural Economics 86 (1):154-74. Saghaian, S. H. 2007. “Beef Safety Shocks and Dynamics of Vertical Price Adjustment: The
Case of BSE Discovery in the U.S. Beef Sector.” Agribusiness 23(3):333–348 Salin, V. S. Dharamsena, A.Wong, and P.Luo. 2005. “Food Product Recalls in the USA, 2000-
2003.” Paper presented at Food Distribution Research Society Annual Meeting, Washington DC, 19-21 October.
Schlenker W. and S. B. Villas-Boas 2008. “Consumer and Market Responses to Mad-Cow
Disease”. CUDARE Working Papers (Paper 1023). Department of Agricultural & Resource Economics, University of California, Berkeley
Schroeter, J. R., A. M. Azzam, M. Zhang. 2000. “Measuring Market Power in Bilateral Oligopoly: The
Wholesale Market for Beef.” Southern Economic Journal 66 (3): 526-547. U.S. Department of Agriculture, Economic Research Service (USDA, ERS). 2006. Red Meat
Yearbook: Washington DC, April. Available at http://www.ers.usda.gov/Data/MeatTrade/ U.S. Department of Agriculture, Foreign Agricultural Service (USDA, FAS). 2005. Bovine
Spongiform Encephalopathy (BSE). Washington DC, August. Available at http://www.fas.usda.gov/dlp/BSE/bse.html
U.S. Department of Agriculture, Food Safety and Inspection Service (USDA, FSIS). 2007. FSIS
Recalls: Recall Case Archive, Washington DC, September. Available at http://www.fsis.usda.gov/Fsis_Recalls/Recall_Case_Archive/index.asp
Verbeke W, R. W. Ward and J. Viaene. 2000. “Probit Analysis of Fresh Meat Consumption in
Belgium: Exploring BSE and Television Communication Impact.” Agribusiness 16(2):215–234
Wohlgenant, M.K. and J.D. Mullen. 1987, "Modeling the Farm-Retail Price Spread for Beef,"
Western Journal of Agricultural Economic, 12(2):19-25.

Analysis of Marketing Margins under Food Recalls and Disease Outbreak in US Beef Industry
18
Appendix
BASIC DATA Prices: Cents per pound. Retail weight equivalent.
• Farm: Net farm value. • Wholesaler: Wholesale value. • Retailer: Beef Retail value: Average retail prices for the selected product as reported by BLS
Source : http://www.ers.usda.gov/Data/meatpricespreads/Data/historicalpricespreads.xls
Quantity: Millions of pounds
• Farm: Results of multiply (Average Live Weight of Cattle Slaughtered under Federal Inspection) X (Number of Commercial Cattle Slaughter). Taken from Livestock Slaughter, NASS, USDA
• Wholesaler: Commercial Beef and Veal Slaughter Production. Taken from Livestock Slaughter, NASS, USDA
• Retailer: Estimated Disappearance for beef and veal was estimated with: Retail Disappearance = (Commercial production + imports – exports + beginning stock – ending stock) * λ . Where λ is the conversion factor from carcass to retail weight equivalent. The Conversion factor used was λ=0.74 for beef and λ = 0.83 for veal. Taken from Livestock Slaughter, NASS, USDA. Tables of Commercial Beef Production, exports and imports on beef and veal and the begging stock table. Source: Red Meat Yearbook 2006 Economic Research Service.
Concentration Ratios: Concentration is percentage 4 largest firms over the of total of firms • Wholesaler: For cattle slaughter plants: commercial slaughter • Retailer: For boxed beef production firms: U.S. boxed beef production Source: Packers and Stockyards Statistical Report. 1995, 2000 and 2005 Reporting Years. Based in Livestock and Poultry Situation and Outlook, ERS-USDA, various issues; and annual reports filed with GIPSA.
Marketing Cost Index:
• Wholesaler: Total food marketing cost index 1987=100 • Retailer: Total food marketing cost index 1987=100 Source: Agricultural Outlook: Statistical Indicators. Several years, Table 9. http://www.ers.usda.gov/publications/AgOutlook/AOTables/2003/01Jan/table09.xls
Recalls: U.S. Department of Agriculture, Food Safety and Inspection Service (USDA,FSIS). (2007). FSIS Recalls: Recall Case Archive. Updated to September 2007. URL: http://www.fsis.usda.gov/Fsis_Recalls/Recall_Case_Archive/index.asp BSE: U.S. Department of Agriculture, Foreign Agricultural Service (USDA, FAS). (2005). Dairy Livestock and poultry Division: Bovine Spongiform Encephalopathy (BSE). Updated to August 2005. http://www.fas.usda.gov/dlp/BSE/bse.html CPIF&B: Consumer price index for food and beverages. Index not seasonally adjusted. Source: Bureau of Labor Statistics, Dept. of Labor
Analysis of Marketing Margins under Food Recalls and Disease Outbreak in US Beef Industry
19
Figure 1
Beef Marketing Margins at the Farm-Wholesale and Wholesale-Retail levels, and BSE outbreak cases in the United States and Canada over the period 1996 to 2006. Source: USDA Red Meat Yearbook, 2006
Figure 2
0123456789
101112131415
Jan-96Jul-9
6Jan-97
Jul-97Jan-98
Jul-98Jan-99
Jul-99Jan-00
Jul-00Jan-01
Jul-01Jan-02
Jul-02Jan-03
Jul-03Jan-04
Jul-04Jan-05
Jul-05Jan-06
Jul-06
Gross number of totalrecalls for beef
Beef recalls in United States, 1996 to 2006. Source: USDA, Food Safety and Inspection Service (FSIS Recalls), and Foreign Agricultural Service (FAS), Dairy Livestock and poultry Division: Bovine Spongiform Encephalopathy (BSE).
0
50
100
150
200
250
Jan-96 Jul-96 Jan-97 Jul-97 Jan-98 Jul-98 Jan-99 Jul-99 Jan-00 Jul-00 Jan-01 Jul-01 Jan-02 Jul-02 Jan-03 Jul-03 Jan-04 Jul-04 Jan-05 Jul-05 Jan-06 Jul-06
Price Spread at the Farm-to-Wholesale level Price Spread at the Wholesale-to-Retail level BSE USA BSE Canada
Cents / Pound
Analysis of Marketing Margins under Food Recalls and Disease Outbreak in US Beef Industry
20
Table 1: Estimates of Marketing Margins
Variables Farm-to-
Wholesale Wholesale-to-
Retail Farm-to-Retail Price of Beef (cents/pound) 0.174*
(0.027) 0.323* (0.057)
0.370* (0.015)
Beef Price * Beef Quantity (Per-capita) 0.003 (0.002)
0.007** (0.003)
0.007** (0.002)
Marketing Cost Index (Food & Bev) -0.006 (0.017)
-0.112 (0.089)
-0.111** (0.046)
TOP 4 Firms Concentration Ratio -0.033 (0.122)
-0.013 (0.242)
0.224 (0.216)
Beef Recalls (R1, FSIS gross numbers) 0.076 (0.061)
0.007 (0.110)
0.053 (0.103)
Beef Recalls (R2, FSIS severe cases) 0.287 (0.360)
-0.826 (0.665)
-0.178 (0.612)
PDL1: Lag Distribution of BSE in USA 1.300 (1.044)
7.262* (2.390)
3.491** (1.693)
PDL2: Lag Distribution of BSE in Canada 2.453* (0.929)
2.243 (2.167)
3.065** (1.423)
AR(1) 1.313* (0.160)
1.582* (0.091)
0.606* (0.115)
AR(2) -0.321* (0.157)
-0.583* (0.089)
0.920* (0.029)
AR(3)
-0.540* (0.103)
MA(1) -0.527* (0.158)
-0.495* (0.092)
0.487* (0.118)
MA(2) -0.231* (0.088)
-0.389* (0.064)
-0.792* (0.093)
MA(3)
-0.282* (0.069)
R-squared 0.825 0.846 0.899 Adjusted R-squared 0.810 0.833 0.890 S.E. of regression 1.779 3.817 3.398 Sum squared residuals 863.6 3977.2 3094.9 Log likelihood -578.5 -804.5 -761.1 Mean dependent variable 18.099 78.233 96.339 S.D. dependent variable 4.085 9.343 10.229 Akaike info criterion 4.064 5.591 5.366 Schwarz criterion 4.351 5.878 5.680 Durbin-Watson Stat 1.995 1.992 1.956 Notes: Convergence at 17, 36 and 26 iterations respectively. Monthly dummies are not presented due to space limitations Standard errors are presented in parentheses. * indicate 1, ** 5, and *** 10 percent significance level.
Analysis of Marketing Margins under Food Recalls and Disease Outbreak in US Beef Industry
21
Table 2: Effects of Lag Distributions of BSE on Marketing Margins
Lag Distribution of BSEUSA Farm-to-Wholesale Wholesale-to-Retail Farm-to-Retail
0 0.97518
(1.24487) 5.44655
(3.03782) 2.909
(2.062)
1 1.30024
(1.24487) 7.26207
(3.03782) 4.655
(2.062)
2 0.97518
(1.24487) 5.44655
(3.03782) 5.237
(2.062)
3 4.655
(2.062)
4 2.909
(2.062)
Cumulative Effect 3.2506
(1.24487) 18.1552
(3.03782) 20.364 (2.062)
Lag Distribution of BSECAN
0 1.83993
(2.63916) 1.68228
(1.03505) 2.554
(2.153)
1 2.45325
(2.63916) 2.24304
(1.03505) 4.087
(2.153)
2 1.83993
(2.63916) 1.68228
(1.03505) 4.598
(2.153)
3 4.087
(2.153)
4 2.554
(2.153)
Cumulative Effect 6.13312
(2.63916) 5.60761
(1.03505) 17.881 (2.153)
t-statistics are reported in parentheses Table 3: Marginal Effects and Elasticities Associated with the Farm-to-Wholesale,
Wholesale-to-Retail and Farm-to-Retail U.S. Beef Marketing Marginsa a Estimated at the sample means of the data.
Variables Farm-to-Wholesale Wholesale-to-Retail Farm-to-Retail Marginal Effects Elast
Marginal Effects Elast
Marginal Effects Elast
Price wholesale 0.201 1.44 Price retail 0.368 0.97 0.414 0.88 Qty wholesale 0.398 0.19 Qty retail 1.459 0.12 1.415 0.09 Marketing Cost -0.006 -0.14 -0.112 -0.59 -0.111 -0.47 TOP-4 Wholesale -0.033 -0.11 TOP-4 Retail -0.013 -0.01 0.224 0.17 R1 0.076 0.01 0.007 0.00 0.053 0.00 R2 0.287 0.02 -0.826 -0.01& -0.178 0.00 BSE USA 1.300 0.21 7.262 0.27& 3.491 0.10 BSE Canada 2.453 0.67 2.243 0.14& 3.065 0.15
Analysis of Marketing Margins under Food Recalls and Disease Outbreak in US Beef Industry
22
Table 4: Elasticity of Price Transmission in the Beef Marketing Chain in three periods: entire period average, four-month average before and four-month average after BSE events.
Marketing level Entire period average
Average of four months before BSE
events
Average of four months after BSE
events EPT Std Dev EPT Std Dev EPT Std Dev
Farm-to-Wholesale 1.07 0.041 1.05 0.028 1.02 0.032 Wholesale-to-Retail 0.97 0.088 0.92 0.043 0.89 0.038 Farm-to-Retail 0.89 0.099 0.83 0.039 0.78 0.031