analysis of india's revealed comparative advantage in agro ...
16
Indian Journal of Economics & Business, Vol. 14, No. 1, (2015) : 115-130 * Student of M. A. (Economics), Gokhale Institute of Politics and Economics, Pune, E-mail: [email protected] ** Associate Professor, ADRT Centre, Institute for Social and Economic Change, Bangalore, E-mail: [email protected] ANALYSIS OF INDIA’S REVEALED COMPARATIVE ADVANTAGE IN AGRO-PROCESSED PRODUCTS ANDHALE ASHISH * AND ELUMALAI KANNAN ** Abstract The paper attempts to assess India’s revealed comparative advantage (RCA) in agro- processed products. It also analyses the structure of comparative advantage in India and its change from 2003 to 2013. We have followed the scheme of commodity aggregation adopted in the World Integrated Trade Solution (WITS) for the purpose of analysis. Accordingly, 116 agro- processed products were grouped into three categories namely processed animal, vegetable and food products. The four variants of indices of RCA were used to get the products having comparative advantage to exports. The consistency and stability tests were also conducted for the indices over the years. Key words: Revealed Comparative Advantage, Agro-Processing, Exports, India. JEL classification: F14, Q17, Q18. INTRODUCTION Agriculture being the primary sector of Indian economy and has got a prime role in the economy. It provides an employment to over 50 percent of the rural workforce and is the single largest private sector occupation. It is also an important source of raw materials to industries like sugar, cotton and jute textile that depends directly on the same. India’s foreign trade is also deeply connected with the agriculture sector. Despite its fall in contribution towards country’s GDP, it accounts for about 14.7 per cent of the total export earnings in the country, where agro-processed products contribute significantly. This outlines the role of agro-processed products in India’s export, having a multiplier effect on the economy. According to FAO [1997], “Agro-processing is a subset of manufacturing that processes raw materials and intermediate products derived from the agricultural sector. Agro-processing thus means transforming products originating from agriculture, forestry and fisheries.” Thus, the study of agro-processed products is
-
Upload
khangminh22 -
Category
Documents
-
view
0 -
download
0
Transcript of analysis of india's revealed comparative advantage in agro ...
Indian Journal of Economics & Business, Vol. 14, No. 1, (2015) : 115-130
* Student of M. A. (Economics), Gokhale Institute of Politics and Economics, Pune, E-mail:[email protected]
** Associate Professor, ADRT Centre, Institute for Social and Economic Change, Bangalore, E-mail:[email protected]
ANALYSIS OF INDIA’S REVEALED COMPARATIVEADVANTAGE IN AGRO-PROCESSED PRODUCTS
ANDHALE ASHISH* AND ELUMALAI KANNAN**
Abstract
The paper attempts to assess India’s revealed comparative advantage (RCA) in agro-processed products. It also analyses the structure of comparative advantage in Indiaand its change from 2003 to 2013. We have followed the scheme of commodityaggregation adopted in the World Integrated Trade Solution (WITS) for the purposeof analysis. Accordingly, 116 agro- processed products were grouped into threecategories namely processed animal, vegetable and food products. The four variantsof indices of RCA were used to get the products having comparative advantage toexports. The consistency and stability tests were also conducted for the indices overthe years.
Key words: Revealed Comparative Advantage, Agro-Processing, Exports, India.
JEL classification: F14, Q17, Q18.
INTRODUCTIONAgriculture being the primary sector of Indian economy and has got a prime role inthe economy. It provides an employment to over 50 percent of the rural workforceand is the single largest private sector occupation. It is also an important source ofraw materials to industries like sugar, cotton and jute textile that depends directlyon the same. India’s foreign trade is also deeply connected with the agriculturesector. Despite its fall in contribution towards country’s GDP, it accounts for about14.7 per cent of the total export earnings in the country, where agro-processedproducts contribute significantly. This outlines the role of agro-processed productsin India’s export, having a multiplier effect on the economy.
According to FAO [1997], “Agro-processing is a subset of manufacturing thatprocesses raw materials and intermediate products derived from the agriculturalsector. Agro-processing thus means transforming products originating fromagriculture, forestry and fisheries.” Thus, the study of agro-processed products is
116 Andhale Ashish and Elumalai Kannan
important as it adds value to the raw material, which will boost the domesticemployment in the country thereby contributing towards the India’s foreign trade.Adding value to agricultural commodities has been identified as the importantstep towards achieving the objective of increment in exports, which further callsfor the focus of the governmentpolicy.
Present study is based on India’s revealed comparative advantage (RCA) inagro-processed products. The study analyses the structure of comparative advantagein India and its changes over a period of 11years from 2003 to 2013. Total numbersof 116 agro- processed products were grouped into three categories namely processedanimal products, processed vegetable products and processed food products. Analysishas been done by using the four variants of indices of revealed comparativeadvantage. The study has also conducted various tests for consistency and stabilityfor the indices over the years.
Chapter scheme begins with the study on trends and composition of agro-processed products’ exports, along with its statistics, percentage share to the totalagricultural exports and imports and its percentage share to the total nationalexports and imports. A substantial amount of review work has also been done tosupport the findings. Further, the paper has proposed a concrete methodology onwhich the entire analysis is based on. Last part of the paper contains the informationabout empirical findings and analysis, interpreting the results of the study. At theend the conclusion sums up the whole work along with the suitable policyimplications.
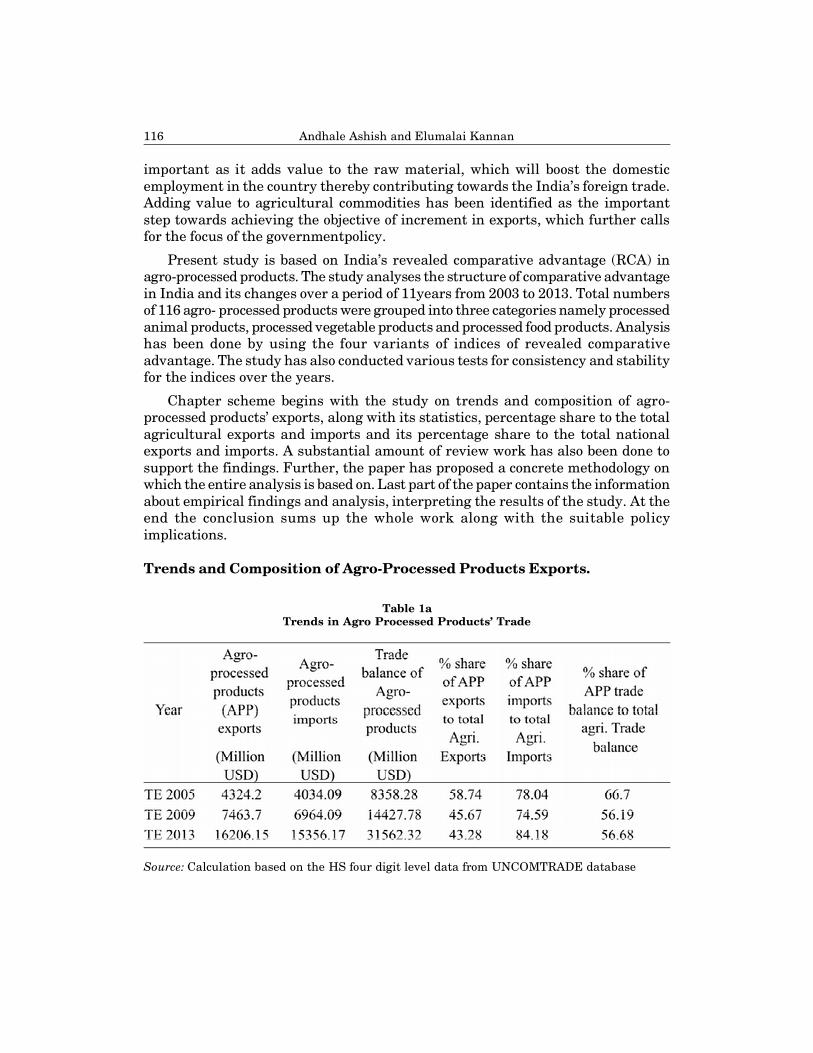
Trends and Composition of Agro-Processed Products Exports.
Table 1aTrends in Agro Processed Products’ Trade
Source: Calculation based on the HS four digit level data from UNCOMTRADE database
Analysis of India’s Revealed Comparative Advantage in Agro-Processed Products 117
From table 1a, we can observe that there is a substantial increase in agroprocessed product’s exports and imports over time. The value of export has increasedtremendously from 4324.20 million USDin 2005 to 16206.15 million USDin 2013.The imports also increasedtremendously from the year 2009but there is a gradualdecrease in the percentage share of agro-processed products (APP) exports to thetotal agricultural export. Percentage share of APP imports to the total agriculturalexports decreased in the year 2009 but it again increased in the year 2013.
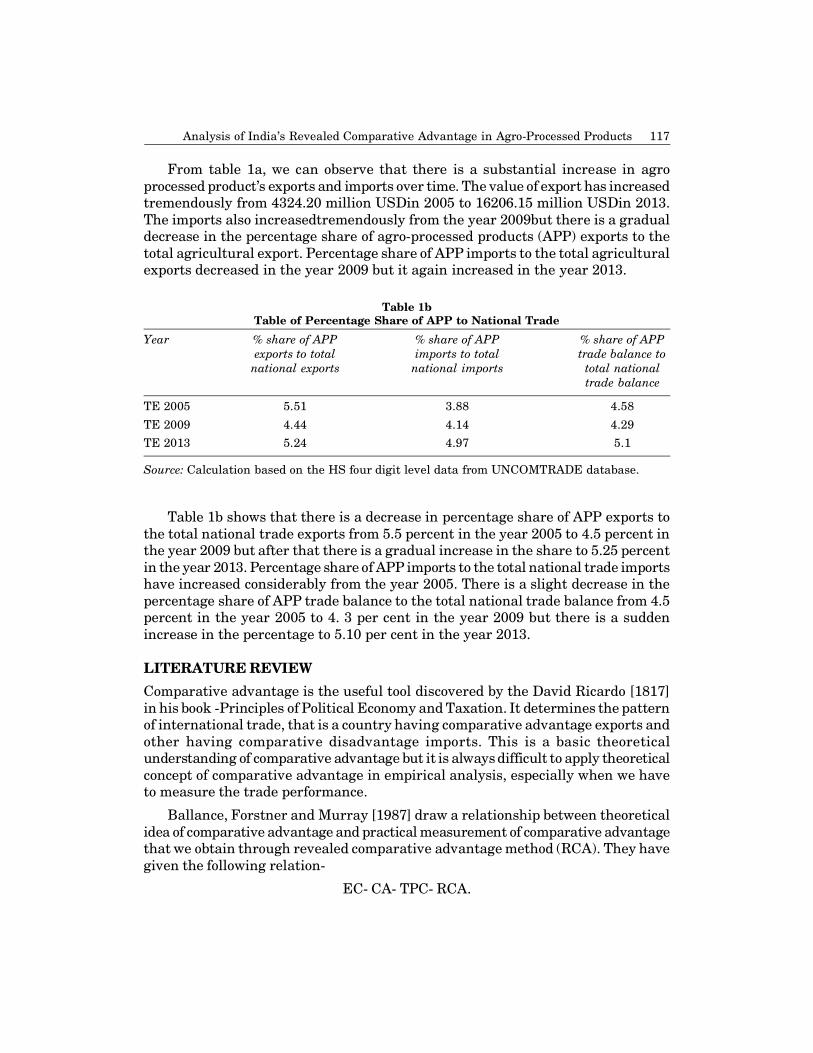
Table 1bTable of Percentage Share of APP to National Trade
Year % share of APP % share of APP % share of APPexports to total imports to total trade balance to
national exports national imports total nationaltrade balance
TE 2005 5.51 3.88 4.58
TE 2009 4.44 4.14 4.29TE 2013 5.24 4.97 5.1
Source: Calculation based on the HS four digit level data from UNCOMTRADE database.
Table 1b shows that there is a decrease in percentage share of APP exports tothe total national trade exports from 5.5 percent in the year 2005 to 4.5 percent inthe year 2009 but after that there is a gradual increase in the share to 5.25 percentin the year 2013. Percentage share of APP imports to the total national trade importshave increased considerably from the year 2005. There is a slight decrease in thepercentage share of APP trade balance to the total national trade balance from 4.5percent in the year 2005 to 4. 3 per cent in the year 2009 but there is a suddenincrease in the percentage to 5.10 per cent in the year 2013.
LITERATURE REVIEWComparative advantage is the useful tool discovered by the David Ricardo [1817]in his book -Principles of Political Economy and Taxation. It determines the patternof international trade, that is a country having comparative advantage exports andother having comparative disadvantage imports. This is a basic theoreticalunderstanding of comparative advantage but it is always difficult to apply theoreticalconcept of comparative advantage in empirical analysis, especially when we haveto measure the trade performance.
Ballance, Forstner and Murray [1987] draw a relationship between theoreticalidea of comparative advantage and practical measurement of comparative advantagethat we obtain through revealed comparative advantage method (RCA). They havegiven the following relation-
EC- CA- TPC- RCA.
118 Andhale Ashish and Elumalai Kannan
This relation shows that the economic condition (EC) that determines country’sinternational pattern of comparative advantage (CA) which depends on the country’spattern of international trade, production, consumption (TPC) which will evaluatethe actual measure of comparative advantage(RCA).
Balassa [1965] first introduced the concept of Revealed Comparative Advantage(RCA). It had been transformed several times by Balassa [1977, 1979, and 1986].Formula defined as a country’s share of world exports of a commodity divided by itsshare of total world exports. The RCA of a commodity is greater than one indicatesthat India is efficient in exporting that commodity in world market. RCA has beenused widely to analyse the changes in trading pattern [Yeates 1992; Amity 1999;Proudman and Redding 2000; Ferto and Hubbard 2003; Klasra and Fidan 2004;Batra and Khan 2005; Kannan 2010].
Ferto and Hubbard [2002]investigate the competitiveness of Hungarianagriculture in relation to that of the EU for the period 1992 to 1998 by using fourindices of RCA namely the relative trade advantage which includes relative importadvantage, the logarithm of the relative export advantage and revealedcompetitiveness. These indices are suggested by Vollrath [1991].They used 4-digitlevel of SITC classification. The paper has found that though there are significantchanges in Hungarian agriculture during the 1990s, the pattern of revealedcomparative advantage has remained stable.
Similarly by using the modified RCA indices namely RTA and ln REA,Gopal[2007] analysed the export performance and studied the revealed comparativeadvantage of finfish export from India for the period 2001 to 2005.They found thatthe finfish exports from India have not revealed any comparative advantage amongthe total marine products export in the period of study.
Oduro, Offei [2013] investigated the Ghana’s revealed comparative advantagein agro- processed products. Their objective of the study is to find out the RCAindex of agro- processed products and to check their stability and consistency byapplying various tests like cardinal test, ordinal test and dichotomous test. Theyfound the four various RCA indices as we discussed above for Ghana’s trade inagro- processed products with the rest of the world from 2004- 2011. The data forthe study was sourced from UN COMTRADE at four digit HS level of classification.A total 69 agro- processed product groups used as sample for this study. They foundthat nine agro- processed product groups have comparative advantage howeverthe share of agro processed products in which Ghana has comparative advantagedeclined over the period 2004 to 2011.
Serin and Civan [2008] worked on ‘Revealed Comparative Advantage andCompetitiveness: A Case Study of for Turkey towards EU.’ It investigated thatTurkey’s comparative advantage in the tomato, Olive oil and fruit juice industriesand how this has changed over the period 1995-2005 in the EU market. They usedthe two important indexes for the analysis namely, revealed comparative advantage(RCA) and Comparative export performance (CEP) index. They have estimated the
Analysis of India’s Revealed Comparative Advantage in Agro-Processed Products 119
import demand function of EU for rival countries. Their hypothesis was that ifTurkey is competitor for these countries, its price has significant effect on exportdemand functions. Their results indicate that Turkey has high comparativeadvantage in the fruit juice and olive oil in the EU market, but tomato hascomparative disadvantage in the market.
Using the similar techniques of indices and regression analysis of import andexport demand function, Bhattacharyya [2011] investigated the revealedcomparative advantage and competitiveness: A case study for India in horticulturalproducts. This study shows the India’s comparative advantage in vegetable, fruits,and flowers trade in the Asian, EU, and North American (USA and Canada) marketsas compared to other south East Asian countries.They used the two importantindexes for the analysis namely, RCA and Comparative Export Performance (CEP)index. They estimated the import demand function of EU for rival countries for thecommodities like onion, mango and fresh flowers. This paper shows that India hasa high comparative advantage in vegetable and fruits markets in the EU but this isnot the case of flower market.
DATA AND METHODOLOGYThis paper has sourced its data from UN COMTRADE database at HS four digitlevel of classification for the period 2003 to 2013. The study uses the WorldIntegrated Trade Solution (WITS) for identifying and grouping the products for thepurpose of analysis. Accordingly, 116 agro-processed products were analysed andgrouped into three categories. These categories are
(1) Processed Animal Products.
(2) Processed Vegetable Products.
(3) Processed Food Products.
There is analysis of 32 products in the category of processed animal products,whereas 40 products were analysed in the processed vegetable products and 44products analysed in the processed food products.Balassa (1965) developed the mostwidely used approach to analysing revealed comparative advantage known as theBalassa Index. This index is essentially an index of revealed export advantage(RXA) which can be expressed as:
1ij
XijXiRCA
XwjXw
(1)
Where
RCA1ij = first measure of revealed comparative advantage for country iin product j;
Xij = value of country i’s export of product j;
120 Andhale Ashish and Elumalai Kannan
Xi = value of country i’s total exports;
Xwj = value of world exports of product j;
Xw = value of world exports.
It measures the ratio of the share of a jth product in the ith country’s total exportsto the share of that product in world exports. When the value of the index is greaterthan one, it is the indication of revealed comparative advantage and value is lessthan one, it means revealed comparative disadvantage.There are several commentsmade on this index. Some of them are-
A) RCA1ijis biased due to the omission of imports, particularly when country-
size is important, [Greenaway and Milner 1993].
B) Export subsidies and other protectionist measures of governments may toan extent, distort RCA index hence there were some measures taken by theresearcher to remove these biasness.
Vollrath [1991] proposed three alternative measures of a country’s revealedcomparative advantage.
1) The relative trade advantage (RTA) is expressed as the differencebetweenthe revealed export advantage (RXA) and revealed import advantage (RMA)
RCA2ij = RTAij= RXAij - RMAij (2)
Where,
,
Xij MijXi MiRXA RMA
Xwj MwjXw Mw
RCA2 = second measure of comparative advantage
M = imports, X = exports.
2) The second alternative measure proposed by Vollrath is the logarithm of therelative export advantage and is defined as:
RCA3 = ln (RXAij) (3)
Where
RCA3 = third measure of comparative advantage.
3) The third alternative measures proposed by Vollrath is revealedcompetiveness (RC) which is expressed as the difference between the logarithm ofrelative export advantage and the relative import advantage. This final measure isexpressed as
RCA4 = RC= ln(RXAij) – ln(RMAij) (4)
Analysis of India’s Revealed Comparative Advantage in Agro-Processed Products 121
Where,
RCA4 = fourth measure of comparative advantage.
The positive value of RTA, ln(RCA), RC indicates the revealed comparativeadvantage whereas negative value gives revealed comparative disadvantage. Thisstudy will employ all the revealed comparative advantage indices specified above(equation 1 to 4) to estimates the India’s revealed comparative advantage in agroprocessed products.
Ballance [1987] pointed out that the RCA indicators can provide informationon the degree of comparative advantage a product has compared to other products.This is referred to as the cardinal interpretation. Products may be ranked on thebasis of their revealed comparative advantage, thus providing an ordinalinterpretation of the indices. Finally, in the dichotomous interpretation, productcan be classified into two groups based on their comparative advantage ordisadvantage. The consistency test of the indices as cardinal measures ofcomparative advantage is based on the correlation coefficient between paired indicesover the period. The consistency test of the indices as ordinal measures ofcomparative advantage is based on rank correlation coefficient between pairedindices over the years. The dichotomous test is simply the share of product groupsin which both of the paired indices suggest comparative advantage or comparativedisadvantage. Cardinality, ordinalityand dichotomous tests were used to check theconsistency of the indices.
There are various measures used to check the stability of the indices. Thecoefficient of variation presented for the three categories of the products suggestthat RCA indices are fairly stable over the years. A second indicator of stability inRCA which is used in the study is the correlation between the index in a period andthe index in subsequent periods. Using TE2005 as a base year, the correlationcoefficient for the four indices for India over the years (TE2009, TE2013) iscalculated.
The distribution of the RCA1 index (Balassa index) over the period as suggestedby Hinloopen and Van Marrewijk[2001] is used to check whether the India’s RCAhas weakened or improved over the years.
EMPIRICAL FINDINGS AND ANALYSIS
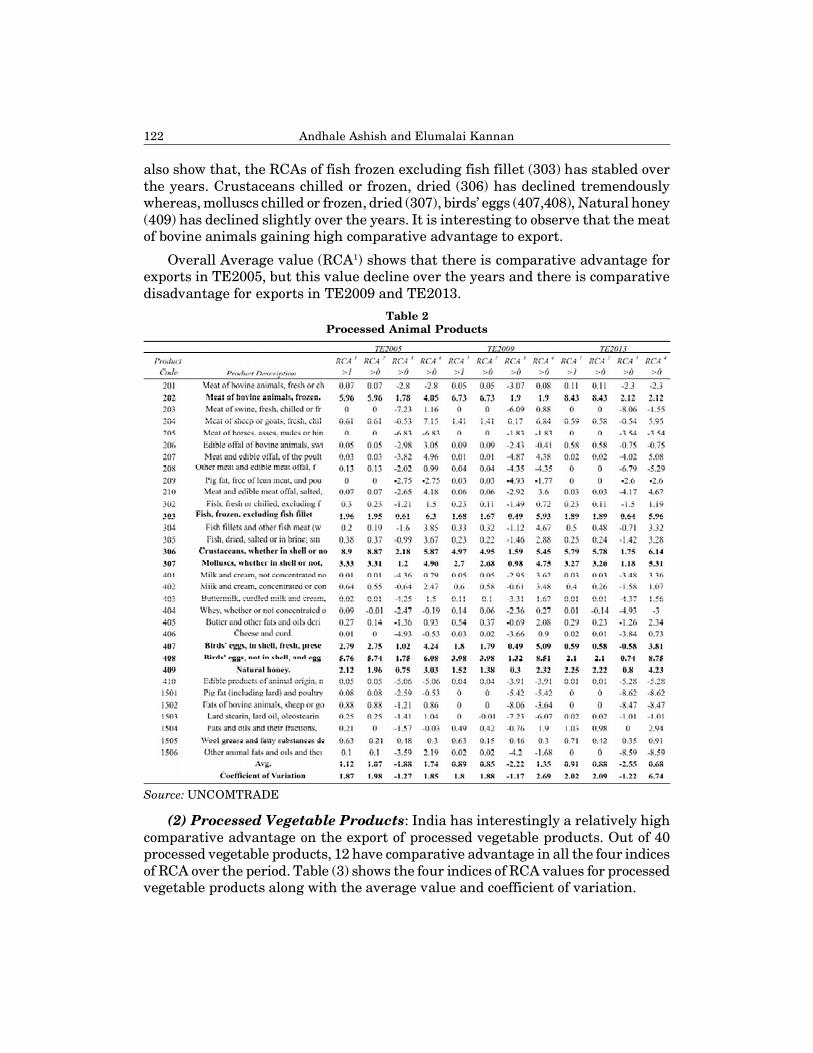
(A) Revealed Comparative Advantage-(1) Processed Animal Products: The study has analysed 32 processed animalproducts of which 7 products have revealed comparative advantage. These are theproducts in which all the four indices show a revealed comparative advantage.Table (2) shows the four indices of RCA values for processed animal product alongwith the average value and coefficient of variation. The result shows that the RCAsfor meat of bovine animals, frozen (202) have increased during the studies and stillmanage to maintain their high rank among the processed animal products. Results
122 Andhale Ashish and Elumalai Kannan
also show that, the RCAs of fish frozen excluding fish fillet (303) has stabled overthe years. Crustaceans chilled or frozen, dried (306) has declined tremendouslywhereas, molluscs chilled or frozen, dried (307), birds’ eggs (407,408), Natural honey(409) has declined slightly over the years. It is interesting to observe that the meatof bovine animals gaining high comparative advantage to export.
Overall Average value (RCA1) shows that there is comparative advantage forexports in TE2005, but this value decline over the years and there is comparativedisadvantage for exports in TE2009 and TE2013.
Source: UNCOMTRADE
Table 2Processed Animal Products
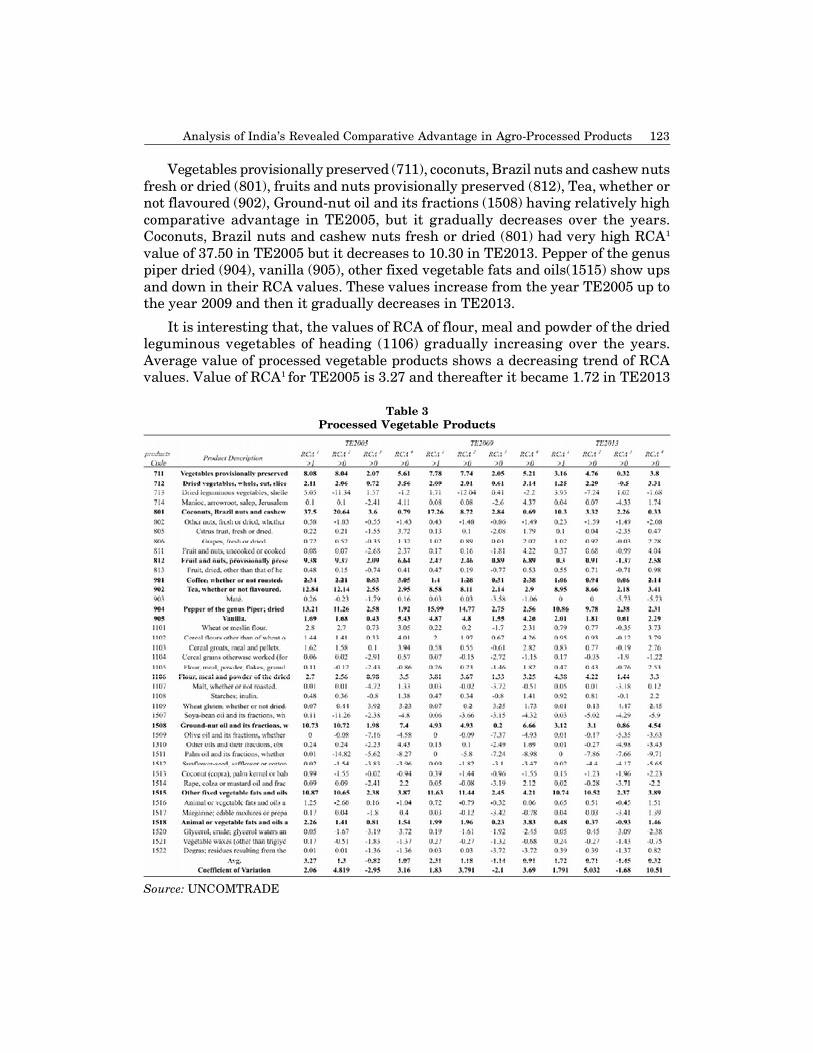
(2) Processed Vegetable Products: India has interestingly a relatively highcomparative advantage on the export of processed vegetable products. Out of 40processed vegetable products, 12 have comparative advantage in all the four indicesof RCA over the period. Table (3) shows the four indices of RCA values for processedvegetable products along with the average value and coefficient of variation.
Analysis of India’s Revealed Comparative Advantage in Agro-Processed Products 123
Vegetables provisionally preserved (711), coconuts, Brazil nuts and cashew nutsfresh or dried (801), fruits and nuts provisionally preserved (812), Tea, whether ornot flavoured (902), Ground-nut oil and its fractions (1508) having relatively highcomparative advantage in TE2005, but it gradually decreases over the years.Coconuts, Brazil nuts and cashew nuts fresh or dried (801) had very high RCA1
value of 37.50 in TE2005 but it decreases to 10.30 in TE2013. Pepper of the genuspiper dried (904), vanilla (905), other fixed vegetable fats and oils(1515) show upsand down in their RCA values. These values increase from the year TE2005 up tothe year 2009 and then it gradually decreases in TE2013.
It is interesting that, the values of RCA of flour, meal and powder of the driedleguminous vegetables of heading (1106) gradually increasing over the years.Average value of processed vegetable products shows a decreasing trend of RCAvalues. Value of RCA1 for TE2005 is 3.27 and thereafter it became 1.72 in TE2013
Table 3Processed Vegetable Products
Source: UNCOMTRADE
124 Andhale Ashish and Elumalai Kannan
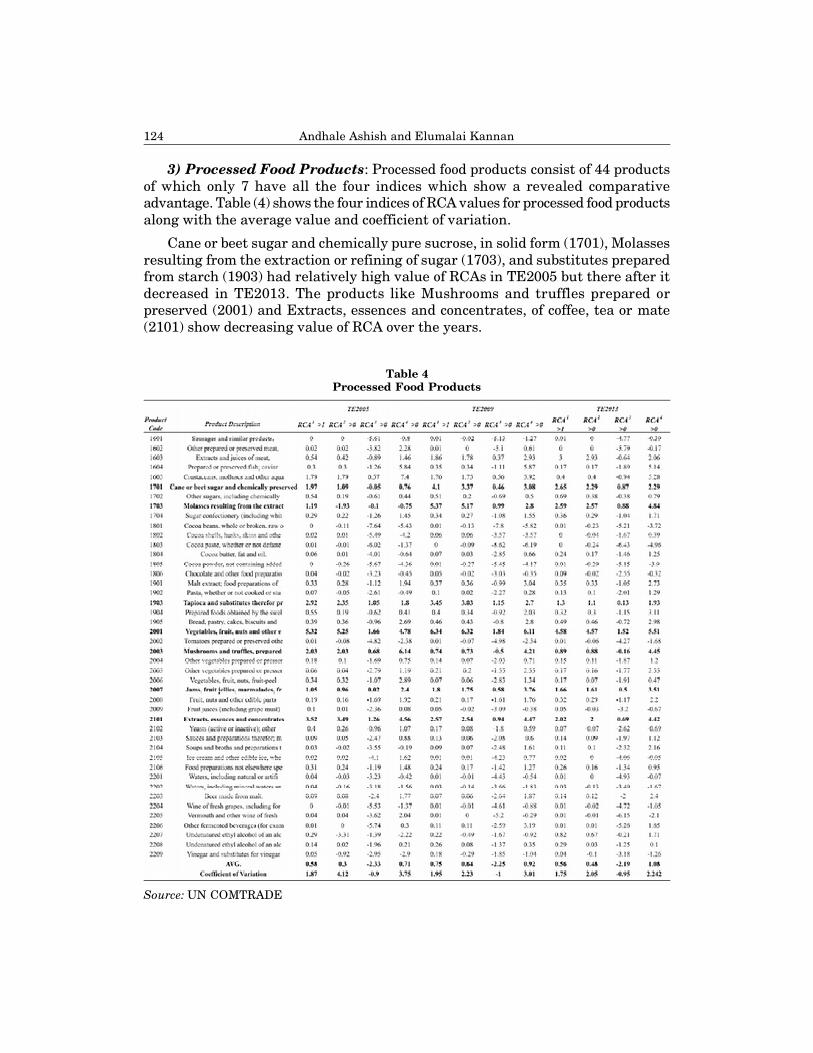
3) Processed Food Products: Processed food products consist of 44 productsof which only 7 have all the four indices which show a revealed comparativeadvantage. Table (4) shows the four indices of RCA values for processed food productsalong with the average value and coefficient of variation.
Cane or beet sugar and chemically pure sucrose, in solid form (1701), Molassesresulting from the extraction or refining of sugar (1703), and substitutes preparedfrom starch (1903) had relatively high value of RCAs in TE2005 but there after itdecreased in TE2013. The products like Mushrooms and truffles prepared orpreserved (2001) and Extracts, essences and concentrates, of coffee, tea or mate(2101) show decreasing value of RCA over the years.
Table 4Processed Food Products
Source: UN COMTRADE
Analysis of India’s Revealed Comparative Advantage in Agro-Processed Products 125
Extracts and juices of meat, fish or crustaceans, molluscs or other aquaticinvertebrates (1603) had comparative disadvantage till TE2005 and thereafter itimproved with RCA1 value of 3.00 in TE2013. Crustaceans, molluscs and otheraquatic invertebrates, prepared or preserved.(1605) had comparative advantagetill TE2005 but it shows comparative disadvantage in TE2013. Average value ofprocessed food products shows comparative disadvantage for India over the years.
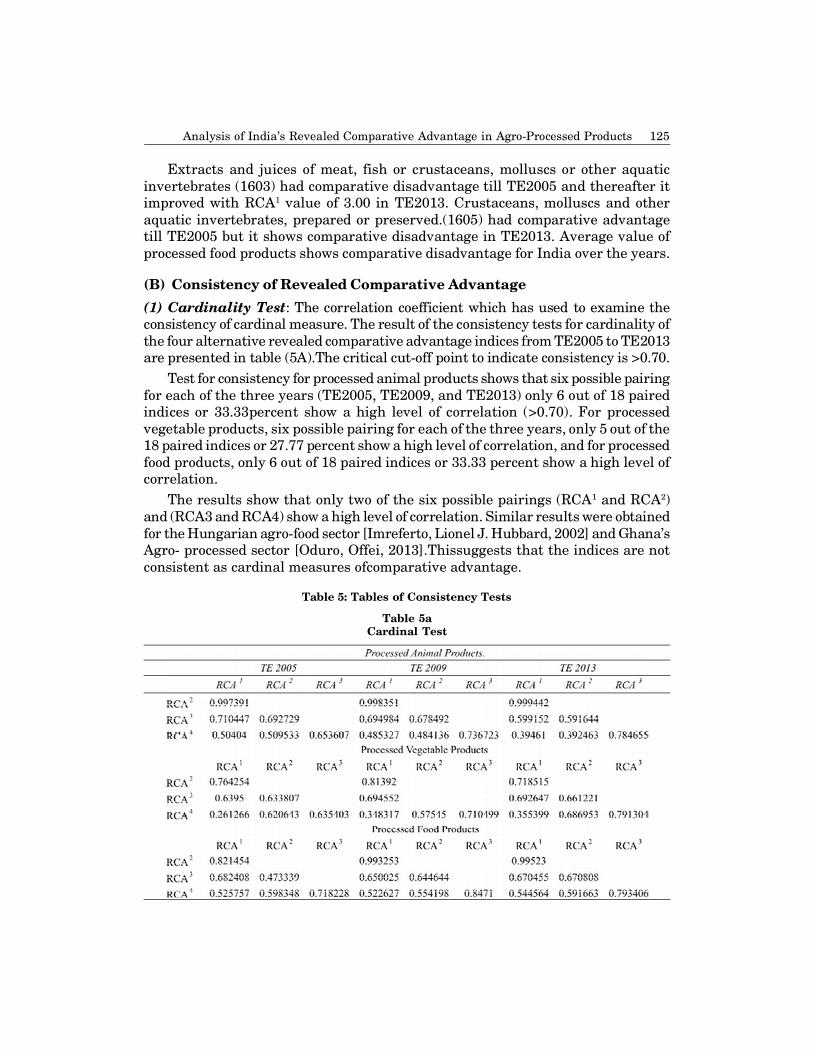
(B) Consistency of Revealed Comparative Advantage(1) Cardinality Test: The correlation coefficient which has used to examine theconsistency of cardinal measure. The result of the consistency tests for cardinality ofthe four alternative revealed comparative advantage indices from TE2005 to TE2013are presented in table (5A).The critical cut-off point to indicate consistency is >0.70.
Test for consistency for processed animal products shows that six possible pairingfor each of the three years (TE2005, TE2009, and TE2013) only 6 out of 18 pairedindices or 33.33percent show a high level of correlation (>0.70). For processedvegetable products, six possible pairing for each of the three years, only 5 out of the18 paired indices or 27.77 percent show a high level of correlation, and for processedfood products, only 6 out of 18 paired indices or 33.33 percent show a high level ofcorrelation.
The results show that only two of the six possible pairings (RCA1 and RCA2)and (RCA3 and RCA4) show a high level of correlation. Similar results were obtainedfor the Hungarian agro-food sector [Imreferto, Lionel J. Hubbard, 2002] and Ghana’sAgro- processed sector [Oduro, Offei, 2013].Thissuggests that the indices are notconsistent as cardinal measures ofcomparative advantage.
Table 5: Tables of Consistency Tests
Table 5aCardinal Test
126 Andhale Ashish and Elumalai Kannan
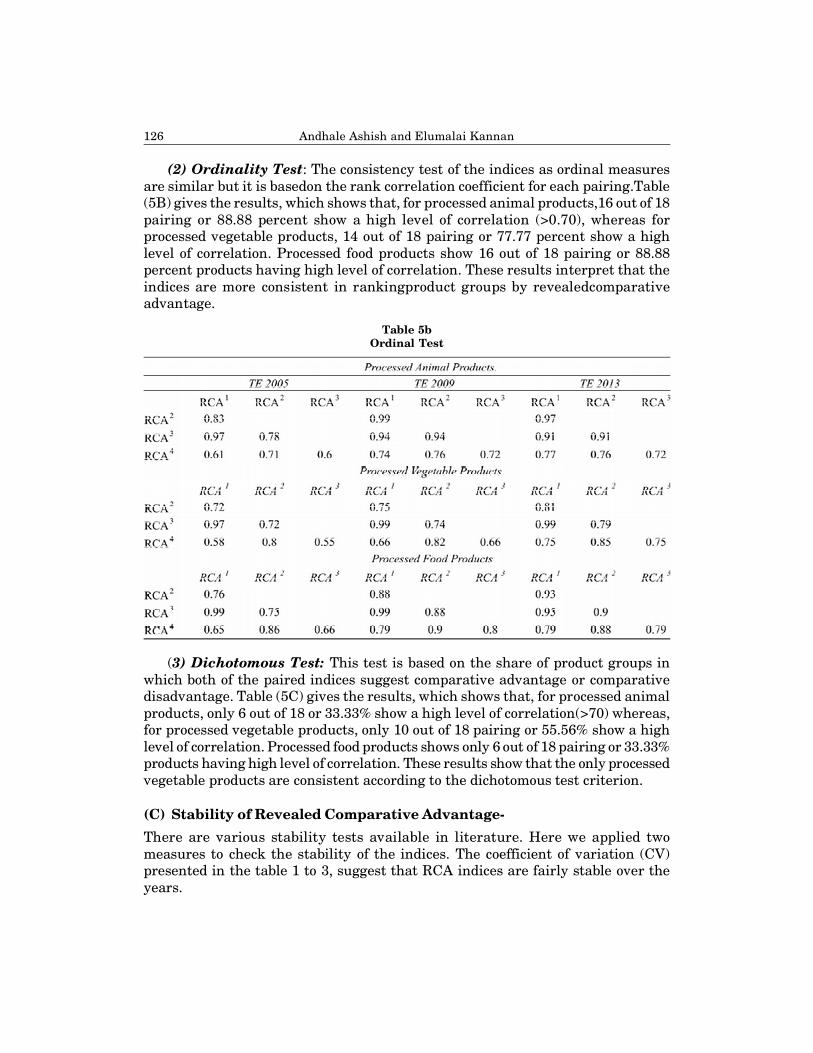
(2) Ordinality Test: The consistency test of the indices as ordinal measuresare similar but it is basedon the rank correlation coefficient for each pairing.Table(5B) gives the results, which shows that, for processed animal products,16 out of 18pairing or 88.88 percent show a high level of correlation (>0.70), whereas forprocessed vegetable products, 14 out of 18 pairing or 77.77 percent show a highlevel of correlation. Processed food products show 16 out of 18 pairing or 88.88percent products having high level of correlation. These results interpret that theindices are more consistent in rankingproduct groups by revealedcomparativeadvantage.
Table 5bOrdinal Test
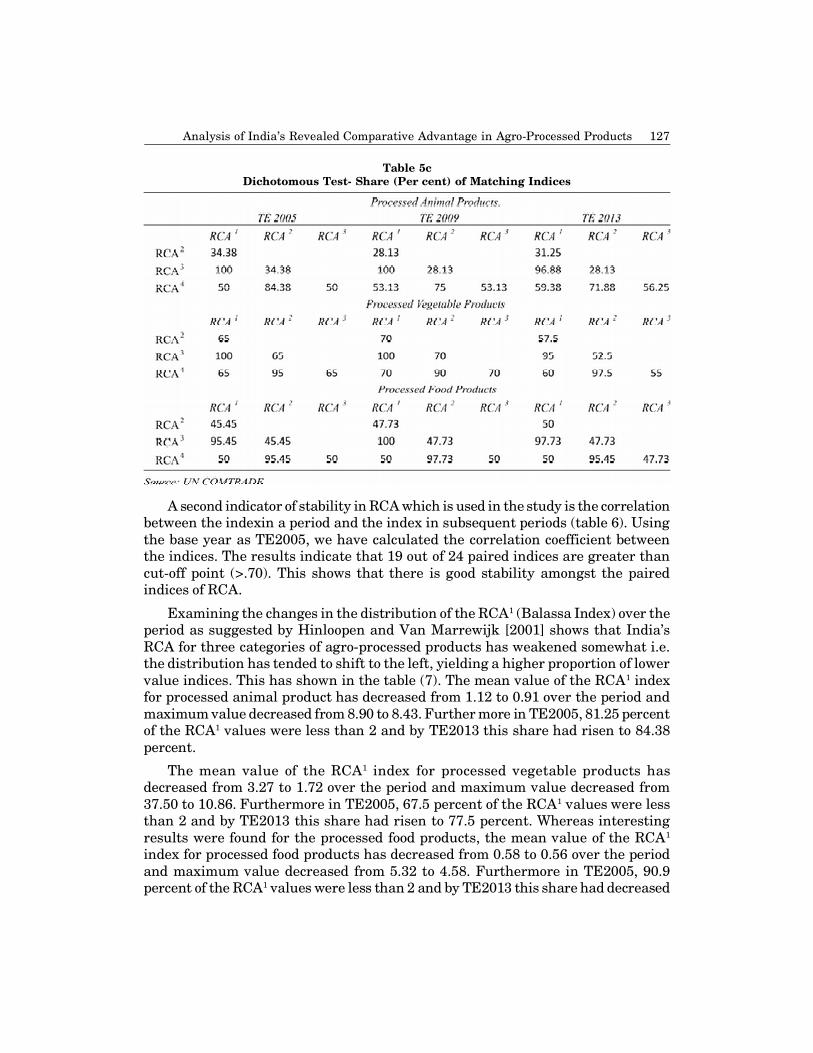
(3) Dichotomous Test: This test is based on the share of product groups inwhich both of the paired indices suggest comparative advantage or comparativedisadvantage. Table (5C) gives the results, which shows that, for processed animalproducts, only 6 out of 18 or 33.33% show a high level of correlation(>70) whereas,for processed vegetable products, only 10 out of 18 pairing or 55.56% show a highlevel of correlation. Processed food products shows only 6 out of 18 pairing or 33.33%products having high level of correlation. These results show that the only processedvegetable products are consistent according to the dichotomous test criterion.
(C) Stability of Revealed Comparative Advantage-There are various stability tests available in literature. Here we applied twomeasures to check the stability of the indices. The coefficient of variation (CV)presented in the table 1 to 3, suggest that RCA indices are fairly stable over theyears.
Analysis of India’s Revealed Comparative Advantage in Agro-Processed Products 127
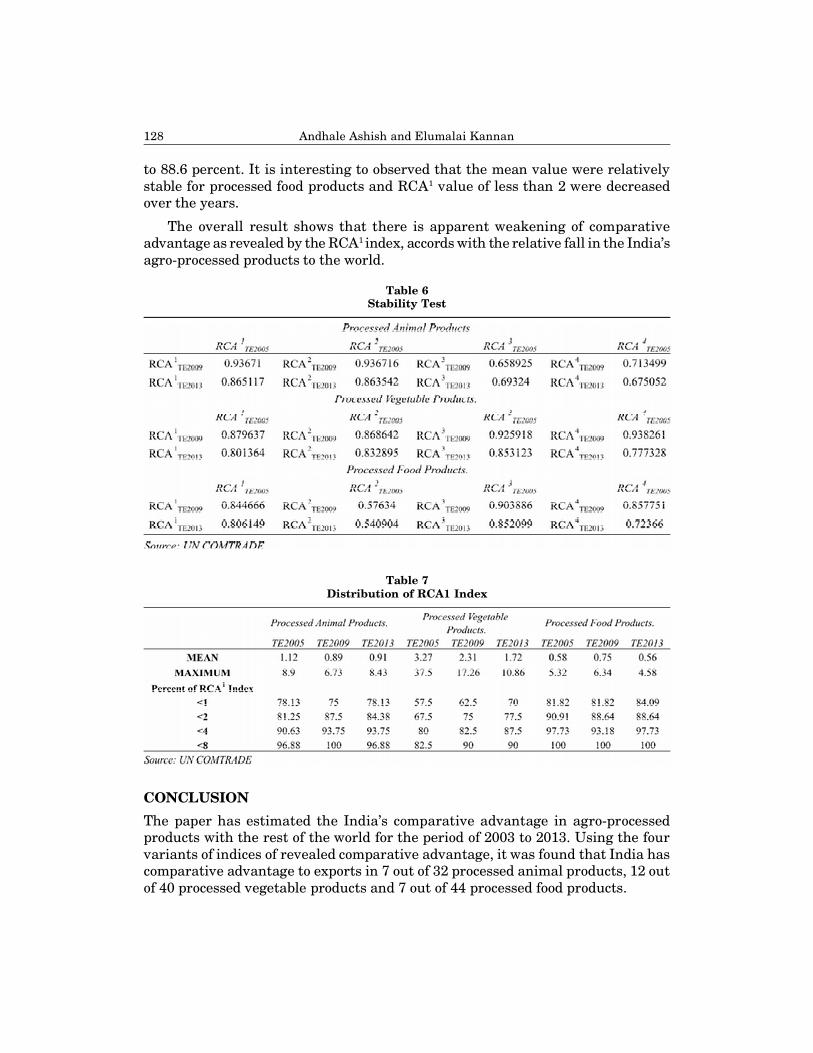
A second indicator of stability in RCA which is used in the study is the correlationbetween the indexin a period and the index in subsequent periods (table 6). Usingthe base year as TE2005, we have calculated the correlation coefficient betweenthe indices. The results indicate that 19 out of 24 paired indices are greater thancut-off point (>.70). This shows that there is good stability amongst the pairedindices of RCA.
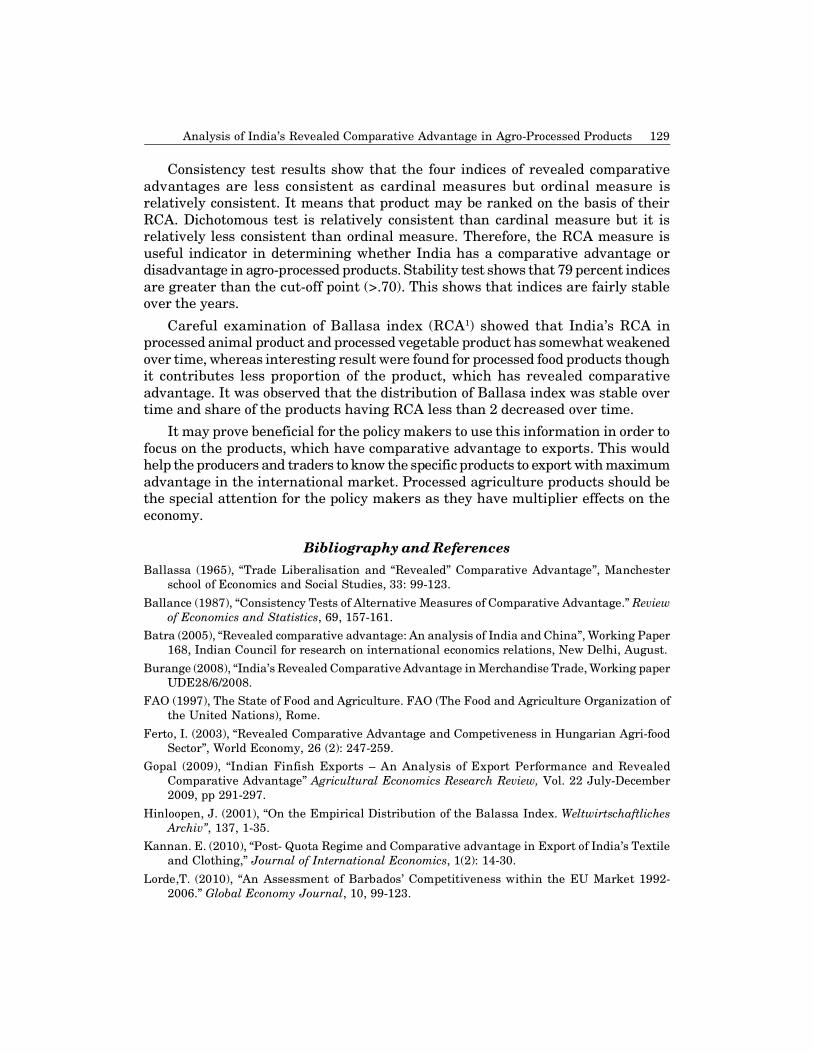
Examining the changes in the distribution of the RCA1 (Balassa Index) over theperiod as suggested by Hinloopen and Van Marrewijk [2001] shows that India’sRCA for three categories of agro-processed products has weakened somewhat i.e.the distribution has tended to shift to the left, yielding a higher proportion of lowervalue indices. This has shown in the table (7). The mean value of the RCA1 indexfor processed animal product has decreased from 1.12 to 0.91 over the period andmaximum value decreased from 8.90 to 8.43. Further more in TE2005, 81.25 percentof the RCA1 values were less than 2 and by TE2013 this share had risen to 84.38percent.
The mean value of the RCA1 index for processed vegetable products hasdecreased from 3.27 to 1.72 over the period and maximum value decreased from37.50 to 10.86. Furthermore in TE2005, 67.5 percent of the RCA1 values were lessthan 2 and by TE2013 this share had risen to 77.5 percent. Whereas interestingresults were found for the processed food products, the mean value of the RCA1
index for processed food products has decreased from 0.58 to 0.56 over the periodand maximum value decreased from 5.32 to 4.58. Furthermore in TE2005, 90.9percent of the RCA1 values were less than 2 and by TE2013 this share had decreased
Table 5cDichotomous Test- Share (Per cent) of Matching Indices
128 Andhale Ashish and Elumalai Kannan
to 88.6 percent. It is interesting to observed that the mean value were relativelystable for processed food products and RCA1 value of less than 2 were decreasedover the years.
The overall result shows that there is apparent weakening of comparativeadvantage as revealed by the RCA1 index, accords with the relative fall in the India’sagro-processed products to the world.
Table 6Stability Test
Table 7Distribution of RCA1 Index
CONCLUSIONThe paper has estimated the India’s comparative advantage in agro-processedproducts with the rest of the world for the period of 2003 to 2013. Using the fourvariants of indices of revealed comparative advantage, it was found that India hascomparative advantage to exports in 7 out of 32 processed animal products, 12 outof 40 processed vegetable products and 7 out of 44 processed food products.
Analysis of India’s Revealed Comparative Advantage in Agro-Processed Products 129
Consistency test results show that the four indices of revealed comparativeadvantages are less consistent as cardinal measures but ordinal measure isrelatively consistent. It means that product may be ranked on the basis of theirRCA. Dichotomous test is relatively consistent than cardinal measure but it isrelatively less consistent than ordinal measure. Therefore, the RCA measure isuseful indicator in determining whether India has a comparative advantage ordisadvantage in agro-processed products. Stability test shows that 79 percent indicesare greater than the cut-off point (>.70). This shows that indices are fairly stableover the years.
Careful examination of Ballasa index (RCA1) showed that India’s RCA inprocessed animal product and processed vegetable product has somewhat weakenedover time, whereas interesting result were found for processed food products thoughit contributes less proportion of the product, which has revealed comparativeadvantage. It was observed that the distribution of Ballasa index was stable overtime and share of the products having RCA less than 2 decreased over time.
It may prove beneficial for the policy makers to use this information in order tofocus on the products, which have comparative advantage to exports. This wouldhelp the producers and traders to know the specific products to export with maximumadvantage in the international market. Processed agriculture products should bethe special attention for the policy makers as they have multiplier effects on theeconomy.
Bibliography and ReferencesBallassa (1965), “Trade Liberalisation and “Revealed” Comparative Advantage”, Manchester
school of Economics and Social Studies, 33: 99-123.
Ballance (1987), “Consistency Tests of Alternative Measures of Comparative Advantage.” Reviewof Economics and Statistics, 69, 157-161.
Batra (2005), “Revealed comparative advantage: An analysis of India and China”, Working Paper168, Indian Council for research on international economics relations, New Delhi, August.
Burange (2008), “India’s Revealed Comparative Advantage in Merchandise Trade, Working paperUDE28/6/2008.
FAO (1997), The State of Food and Agriculture. FAO (The Food and Agriculture Organization ofthe United Nations), Rome.
Ferto, I. (2003), “Revealed Comparative Advantage and Competiveness in Hungarian Agri-foodSector”, World Economy, 26 (2): 247-259.
Gopal (2009), “Indian Finfish Exports – An Analysis of Export Performance and RevealedComparative Advantage” Agricultural Economics Research Review, Vol. 22 July-December2009, pp 291-297.
Hinloopen, J. (2001), “On the Empirical Distribution of the Balassa Index. WeltwirtschaftlichesArchiv”, 137, 1-35.
Kannan. E. (2010), “Post- Quota Regime and Comparative advantage in Export of India’s Textileand Clothing,” Journal of International Economics, 1(2): 14-30.
Lorde,T. (2010), “An Assessment of Barbados’ Competitiveness within the EU Market 1992-2006.” Global Economy Journal, 10, 99-123.
130 Andhale Ashish and Elumalai Kannan
Oduro (2013), “Investigating India’s Revealed Comparative Advantage in Agro-processedproducts,” Scientific research publication Inc, 385-390.
Serin (2008), “ Revealed Comparative Advantage and Competitiveness: A case study of for Turkeytowards EU”, Journal of Economic and Social Research 10(2), 2008, 25-41.
Shahab S. (2013), “Comparative Advantage of Leather Industry in Pakistan with Selected AsianEconomies,” International Journal of Economics and Financial Issues, 3, 133-139.
Vollrath, T. (1991), “A Theoretical Evaluation of Alternative Trade Intensity Measures of RevealedComparative Advantage.” Review of World Economics, 127, 265-280.