ANALYSIS OF INDIAN INDUSTRIAL GROWTH DURING ECONOMIC REFORMS: 1980-2010.
37
ANALYSIS OF INDIAN INDUSTRIAL GROWTH DURING ECONOMIC REFORMS: 1980-2010. Boppana Nagarjuna & P. Rajendra School of Economics,University of Hyderabad HYDEERABAD ,INDIA, [email protected] Introduction Developing countries have been progressively adopting market friendly reforms during the 1980s and 1990s. Indian economy has also undergone similar reforms since the mid- 1980s and especially during the 1990s. Due to reforms (Economic Openness), changes have been taken place in the almost all the important sectors of Indian economy. The performance of the Indian Industrial sector has undergone noticeable changes since Independence till date. There has been diversification of the industrial structure along with variation in growth during this period. With reference to growth in Industry, early 1950s to mid-1960s witnessed substantial growth, while there was deceleration during mid- 1960s to late 1970s. Again, there was revival in 1970s followed by massive growth in the 1980s. During the early 1990s, to revitalize the Indian economy performance of the macroeconomic indicators and to sustain higher growth in the long run, a series of economic reforms were introduced in the Indian economy during the 1990s. As part of the economic reforms, certain industrial and trade policy reforms were introduced. 1
Transcript of ANALYSIS OF INDIAN INDUSTRIAL GROWTH DURING ECONOMIC REFORMS: 1980-2010.

ANALYSIS OF INDIAN INDUSTRIAL GROWTHDURING ECONOMIC REFORMS: 1980-2010.
Boppana Nagarjuna & P. Rajendra
School of Economics,University of Hyderabad
HYDEERABAD ,INDIA, [email protected]
Introduction
Developing countries have been progressively adopting
market friendly reforms during the 1980s and 1990s. Indian
economy has also undergone similar reforms since the mid-
1980s and especially during the 1990s. Due to reforms
(Economic Openness), changes have been taken place in the
almost all the important sectors of Indian economy. The
performance of the Indian Industrial sector has undergone
noticeable changes since Independence till date. There has
been diversification of the industrial structure along with
variation in growth during this period. With reference to
growth in Industry, early 1950s to mid-1960s witnessed
substantial growth, while there was deceleration during mid-
1960s to late 1970s. Again, there was revival in 1970s
followed by massive growth in the 1980s. During the early
1990s, to revitalize the Indian economy performance of the
macroeconomic indicators and to sustain higher growth in the
long run, a series of economic reforms were introduced in
the Indian economy during the 1990s. As part of the economic
reforms, certain industrial and trade policy reforms were
introduced.
1
The main objective of reforming the
industrial sector was to enhance its efficiency and growth.
In this background, the impact of reforms on growth of the
Industrial sector needs to be examined. The debate has
revolved around the performance of Indian Manufacturing
Sector in recent times, particularly in the post 1991 reform
period has been controversial and has attracted the
attention of the several researchers. And the question is
that whether the shift in policy regime made any significant
changes in its growth performance of Indian Manufacturing
Sector of the post reform period (1991). Hence, the present
study starts with an examination of the Indian Manufacturing
Sector growth performance in the context of the shift in the
policy regime.
In this chapter, an attempt is made to examine the
growth performance of the industrial manufacturing sector
based on technology classification those are as follows:
High Technology, Medium High Technology, Low Technology and
Medium Low Technology Industrial Sectors. For this study, it
has been consider and prepared the data based on the
concordance between ISIC REV.2 CODE, NIC 87 CODE, NIC 98
CODE, NIC 2004, and 2008. The analysis carried out for the
entire study period is from 1981-82 to 2011-12. To analyse
impact of the Economic Openness on Indian Industries and the
entire study period broadly divided into two pre (1981-1991)
and post transition period (1991-2012) (refer page no.12 for
more information). To study the growth performance of these
industries, variables are used in the analysis are the Gross
2

Value Added (GVA), Fixed Capital (FC) and Labour (LA).In
order to observe the performance of industries growth rates
were computed according to the following formula:
Pt = Po (1+ r)n
Pt / Po = (1+ r)n
1+ r = (Pt / Po) 1/n
r = (Pt / Po) 1/n – 1
Where Pt = current year value
Po = initial year value
r = compound annual growth rate
n =number of years
In this connection the study divides into two sections.
Section I deals with macro level growth performance analysis
of Indian Manufacturing Sector. Section II provides an
analysis of impact of Economic Openness on industrial growth
with reference to a particular group of industries based on
technology.
4.1. Growth Performance Analysis of Indian Manufacturing
Sector at Macro level
4.1.1. Growth Performance of Indian Manufacturing Sector in
pre Transition Era
Three important phases of the industrial growth can be
identified in the pre 90s era. - The first phase is from 1950-3

51 to 1964-65, second phase is from 1965-66 to 1970s and third
phase is from 1979-80 to 1989-90. The first phase of
industrial growth is tagged as phase of rapid industrial
growth i.e. from 1950-51 to 1964-65. The Manufacturing
Sector grew at an average rate of 5.8 per cent in first half
of fifties and 6.5 per cent in the second half of the
decade. The growth was mainly due to the second five year
plan of building a strong capital base through investment in
public sector especially as the private sector was in the
emerging stage. The Second phase is tagged as deceleration
phase of industrial growth. The late sixties and seventies
witnessed in manufacturing was due to emergence of macro
political-economic uncertainties such as wars with Pakistan
and China, rising prices, oil prices shocks, licensing
requirements for investment, reservation of industries in
public sector. The Third phase observed a revival of
industrial growth with the gradual withdraw of constraints
and controls through sequential policy reforms. The table
4.1 below shows that growth rates in manufacturing between
1950-51 to1989-90. There was an improvement in manufacturing
growth during 1980s.
Table 4.1: Indian Manufacturing Sector’s Growth in PreTransition Period
Sectors 1950-51 to1955-56
1956-57 to1965-66
1966-67 to1979-80
1981-82 to1989-90
Manufacturing 5.8 6.5 4.3 5.8
Registered 6.2 8.2 4.5 7.6
4

Unregistered 5.6 4.5 4.1 3.4
GDP 3.6 3.6 3.4 5.6
Source: Central Statistical Organization
4.1.2. Paradigm Shift of Industrial Policy and ManufacturingSector in Post
Transition Era
Industrial Policy since 1991 has been more for
facilitating industrial development. Industrial licensing
was abolished for most of the industries and there are only
5 industries related to security, strategic and
environmental concerns where an industrial license is
currently required. Along with the removal of the
industrial licensing, reforms were initiated in areas of
reservation of products for exclusive production in the
small scale sector. The Government has also enacted the
Micro, Small and Medium Enterprises Development (MSMED) Act,
2006 stepping up the investment limit to Rs.5 core for small
enterprises and Rs. 10 core for medium enterprises. The
table 4.2 below indicates manufacturing growth at an average
rate of 7 per cent during 1992-2001 and it is increased to
7.4 per cent in 2001-12.
Table 4.2: Indian Manufacturing Growth in post
Transition PeriodSectors 1992-93 to 2000-01 2001-02 to 2011-
12Manufacturing 7 7.4Registered 7.4 9.1Unregistered 6.4 5.7
5

GDP 6.2 7.5 Source: Central Statistical Organization
4.1.3. Trends in Indian Manufacturing Sector of
Employment and GDP
The Table 4.3 shows that the sectorial share of
employment as compiled from various NSSO rounds from1987-88
onwards to 2009-10. During the past two decades there has been
about 13 percentage point reduction in the employment share in
agriculture despite no increase in manufacturing share in
employment. In fact, there has been a decrease in the share of
employment in manufacturing between 2004-05 and 2009-10. As
seen from the Table 4.4, the decline of number of persons
employed in manufacturing from 56 million in 2004-05 to 52
million in 2009-10 and it resulted that about 4 million
workers have withdrawn from the manufacturing sector. The
reasons for decline in the manufacturing employment may be the
sluggish global demand for major export items like textiles,
handicrafts, leather which are labour intensive.
Table 4.3: Sectors Share in Employment
NSSO Rounds ReferenceYears
Agriculture
Manufacturing
Industry
Services
66th (2009-10) 51.8 11.4 21.9 26.3
61st (2004-05) 56.5 12.2 18.7 24.8
55th (1999-00) 60.1 11 16.3 23.6
50th (1993-94) 64.3 10.5 14.8 20.9
43rd (1987-88) 64.5 11.2 16.1 19.4
Source: Computed from various rounds of NSSO
6

Table 4.4: Manufacturing Sector -Number of persons employed in
Millions
NSSORounds
ReferenceYears Rural Urban Total
66th (2009-10) 24.12 28.23 52.35
61st (2004-05) 27.76 28.3 56.06
55th (1999-00) 22.99 21.99 44.98
50th (1993-94) 19.55 17.9 37.45
43rd (1987-88) 19.73 19.16 38.88
38th 1983 15.84 14.65 30.49
Source: Computed from various rounds of NSSO
4.1.4. International level comparison of Indian
Manufacturing Sector’s in GDP and
Employment
Table 4.5 gives a clear picture about the share of
Indian Manufacturing sector value added in GDP and share of
industrial employment in total employment across a few
countries. The Manufacturing value added of GDP is 14 per
cent in India compared to 13 per cent in United States and
31 per cent in China. The share of employment in industry is
total of 22 per cent in India as compared to 27 per cent in
China. The Table as follows:
Table 4.5: Share of Indian Manufacturing Sector in GDP andEmployment in industry
Countries Manufacturing
Value Added (% of
Employment in
Industry (%)
7

GDP) of total employment)Thailand 36 20China 31 27Korea 31 17Malaysia 26 27Japan 19 25Sri Lanka 17 25Brazil 15 22Pakistan 15 20India 14 22US 13 17Indonesia 11 19Bangladesh 10 15
Source: World Bank Note: Figures are ranging from 2009-2011
4.1.5. Trends in Export of Indian Manufacturing Sector
Manufacturing production and exports have been driving
the rapid growth of many dynamic emerging economics. Table
4.6 and figure 2.1 gives a clear picture about the trends in
exports of Indian Manufacturing sector from 1981-82 to 2012-
2013. There has been a sharp acceleration in India
manufacturing exports performance from mid 1990s (post
transition period) when compare to 1980s (pre transition
period). During the last decade of reforms, India’s exports
have performed well. Positive policy measures combined with
robust growth of world trade have led to this improved
performance. Compared to pre-liberalization period, India’s
export to GDP ratio has increased. And also The Table 4.7
and (figures from 2.2 to 2.10) shows that the Sector wise
Exports of Indian Manufactured products performance. Almost
all sectors (Textile and Textile Products, Manufacture of
Leather, Chemicals and Related Products, Manufacture of
8

Metals, Machinery and Instruments, Pharmaceuticals & others,
Transport Equipment, Electronic Goods and Petroleum
Products) steady rise from 1990s.
Source : Author’s calculations.
Table 4.6: Exports of Manufactured goods in India
Year Manufactured Goods1987-88 106.261988-89 146.411989-90 199.321990-91 233.191991-92 324.131992-93 406.6
9
1987-88
1989-90
1991-92
1993-94
1995-96
1997-98
1999-00
2001-02
2003-04
2005-06
2007-08
2009-10
2011-12
0.00
2000.00
4000.00
6000.00
8000.00
10000.00
12000.00
Figure 4.1Exports of Manufactured Goods
(Rup
ees
in B
illi
on)

1993-94 522.451994-95 640.671995-96 794.331996-97 873.771997-98 986.61998-99 1085.061999-00 1287.612000-01 1568.582001-02 1591.462002-03 1947.652003-04 2228.292004-05 2728.722005-06 3212.612006-07 3842.612007-08 4145.992008-09 5664.022009-10 5464.562010-11 7198.632011-12 8885.992012-13 9996.12
Source: Directorate General of Commercial Intelligence and Statistics
10
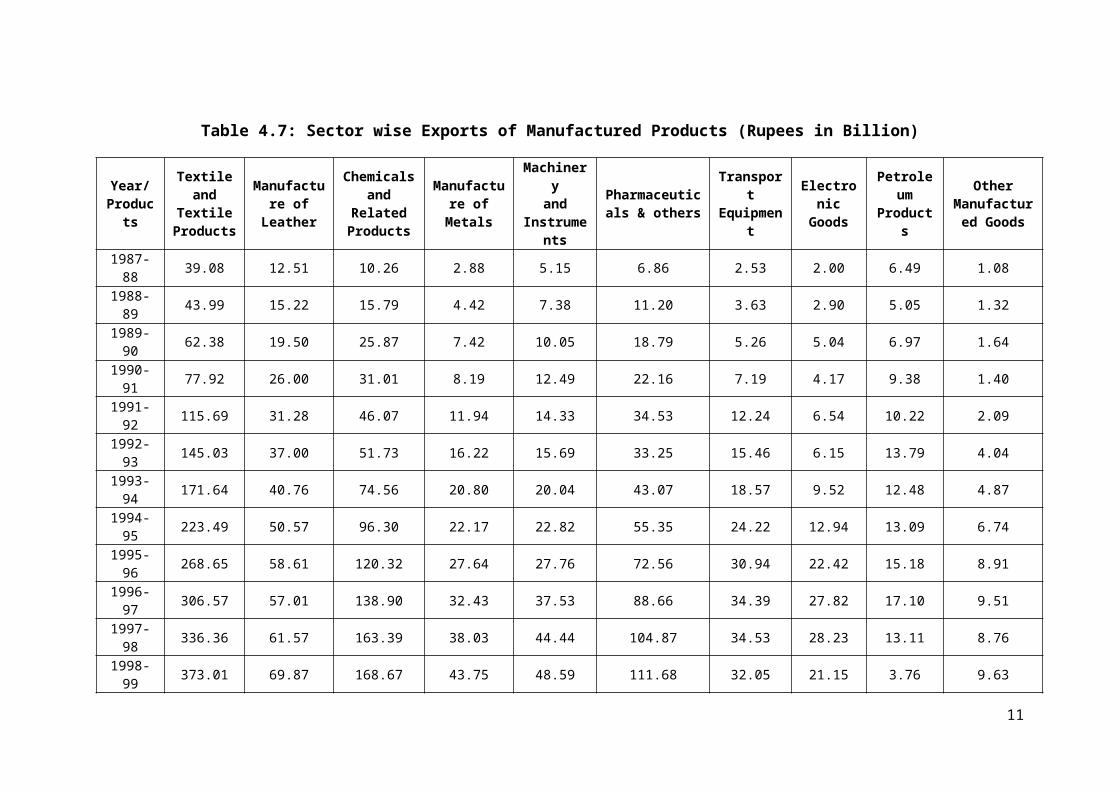
Table 4.7: Sector wise Exports of Manufactured Products (Rupees in Billion)
Year/Products
Textileand
TextileProducts
Manufacture ofLeather
Chemicalsand
RelatedProducts
Manufacture ofMetals
Machineryand
Instruments
Pharmaceuticals & others
Transport
Equipment
ElectronicGoods
Petroleum
Products
OtherManufactured Goods
1987-88 39.08 12.51 10.26 2.88 5.15 6.86 2.53 2.00 6.49 1.08
1988-89 43.99 15.22 15.79 4.42 7.38 11.20 3.63 2.90 5.05 1.32
1989-90 62.38 19.50 25.87 7.42 10.05 18.79 5.26 5.04 6.97 1.64
1990-91 77.92 26.00 31.01 8.19 12.49 22.16 7.19 4.17 9.38 1.40
1991-92 115.69 31.28 46.07 11.94 14.33 34.53 12.24 6.54 10.22 2.09
1992-93 145.03 37.00 51.73 16.22 15.69 33.25 15.46 6.15 13.79 4.04
1993-94 171.64 40.76 74.56 20.80 20.04 43.07 18.57 9.52 12.48 4.87
1994-95 223.49 50.57 96.30 22.17 22.82 55.35 24.22 12.94 13.09 6.74
1995-96 268.65 58.61 120.32 27.64 27.76 72.56 30.94 22.42 15.18 8.91
1996-97 306.57 57.01 138.90 32.43 37.53 88.66 34.39 27.82 17.10 9.51
1997-98 336.36 61.57 163.39 38.03 44.44 104.87 34.53 28.23 13.11 8.76
1998-99 373.01 69.87 168.67 43.75 48.59 111.68 32.05 21.15 3.76 9.63
11

1999-00 425.62 68.91 203.95 53.11 51.27 133.82 35.11 29.51 1.69 11.82
2000-01 515.55 88.83 268.89 72.08 72.19 167.39 45.31 48.04 85.42 16.26
2001-02 486.77 91.10 288.62 76.50 82.70 176.32 48.69 55.86 101.07 18.52
2002-03 562.21 89.45 360.80 89.42 97.20 225.45 64.55 60.63 124.69 23.02
2003-04 587.79 99.39 434.06 111.50 127.58 268.62 89.88 79.42 163.97 28.18
2004-05 609.06 108.81 559.11 152.83 167.12 320.77 127.14 82.31 314.04 36.96
2005-06 726.18 119.44 653.90 187.42 224.80 404.09 191.39 96.21 515.33 43.55
2006-07 786.13 136.50 784.42 229.92 304.20 495.88 223.98 129.14 845.20 54.89
2007-08 782.09 141.01 853.28 283.89 367.50 561.73 282.82 135.32 1141.92 52.52
2008-09 920.62 163.55 1044.42 347.17 503.42 718.80 512.98 313.01 1233.98 61.02
2009-10 941.89 159.46 1086.87 262.03 452.56 748.06 466.10 258.95 1328.99 74.27
2010-11 1103.75 178.18 1315.44 385.28 539.42 879.59 731.21 373.78 1887.79 96.45
2011-12 1343.12 229.72 1778.16 459.19 685.82 1175.48 1013.11 424.19 2679.15 122.07
2012-13 1487.73 264.99 2172.57 545.97 827.88 1471.43 1001.65 438.83 3276.79 143.08
Source: Directorate General of Commercial Intelligence and Statistics, Note: Due to change in commodity classification by DGCI&S, data on’ from 1970-71 to 1975-1976 and 1976-77 to 1986-8 may not comparable.
12

1987-8...
1989-9...
1991-9...
1993-9...
1995-9...
1997-9...
1999-0...
2001-0...
2003-0...
2005-0...
2007-0...
2009-1...
2011-1...0.00
200.00
400.00
600.00
800.00
1000.00
1200.00
1400.00
1600.00
Figure 4.2 Exports of Textile and Textile
Products (Rupees in Billion)
19191919191919191919191919202020202020 202020202020200.00
50.00
100.00
150.00
200.00
250.00
300.00
Figure 4.3Exports of Leather Products
Rupees in Billion
13

1987-88
1989-90
1991-92
1993-94
1995-96
1997-98
1999-00
2001-02
2003-04
2005-06
2007-08
2009-10
2011-12
0.00
100.00
200.00
300.00
400.00
500.00
600.00
Figure 4.5 Exports of Metals products
Rupees in Billion
14
0.00
300.00
600.00
900.00
1200.00
1500.00
1800.00
2100.00
2400.00
Figure 4.4Exports of Chemicals and Related Products
Rupees in Billion

0.00100.00200.00300.00400.00500.00600.00700.00800.00900.00
Figure 4.6Exports of Machinery and Instruments
Rupees in Billion
1987-88
1989-90
1991-92
1993-94
1995-96
1997-98
1999-00
2001-02
2003-04
2005-06
2007-08
2009-10
2011-12
0.00200.00400.00600.00800.00
1000.001200.001400.001600.00
Figure 4.7 Exports of Pharmaceuticals & others
Rupees in Billion
15

1987-88
1989-90
1991-92
1993-94
1995-96
1997-98
1999-00
2001-02
2003-04
2005-06
2007-08
2009-10
2011-12
0.00
200.00
400.00
600.00
800.00
1000.00
1200.00
Figure 4.8 Exports of Transport Equipnment
Rupees in Billion
1987-88
1989-90
1991-92
1993-94
1995-96
1997-98
1999-00
2001-02
2003-04
2005-06
2007-08
2009-10
2011-12
0.00
100.00
200.00
300.00
400.00
500.00
Figure 4.9 Exports of Electronic Goods
Rupees in Billion
16

1 1 1 1 1 1 1 1 1 1 1 1 1 2 2 2 2 2 2 2 2 2 2 2 2 20.00
300.00600.00900.001200.001500.001800.002100.002400.002700.003000.003300.003600.00
Figure 4.10Exports of Petroleum Products
Rupees in Billion
4.2. Growth Performance Analysis of Technology Based
Classification
4.2.1. Growth Rates of Gross Value Added, Capital and Labour
in High Technology
Manufacturing Sector
The trend rates of growth of GVA provide in the Table
4.8 stood at 10.3 per cent for aggregate High Technology
Manufacturing Sector of the entire study period. In terms of
Gross Value Added the Radio, TV & Communication Industry
is the best performer with a growth rate of 13.2 per cent
and followed by Office & Computing Equipment Industry. On17

the contrary, the worst performing industry was Drug &
Medicines with 8.6 per cent rate of growth.
A further analysis of pre and post transition period
suggests that the trend in growth rate of GVA during post
transition period had increased from 6.2 per cent to 13.6
per cent for the entire High Technology Manufacturing
Sector. Almost all industries are positive in the post
transition period. The highest growth rate of GVA recorded
by Radio, TV & Communication Industry was 21.2 per cent and
the lowest growth rate of GVA recorded by Drug & Medicines
Industry indicates 10.2 per cent.
It has been noticed that the growth rate of
capital recorded 17.2 per cent for aggregate High Technology
Industrial sector of the entire study period. The growth
rate of capital was attained the highest 20.7 per cent in
the Office & Computing equipment Industry during the entire
study period. The Drug & Medicines Industry was the lowest
15.4 per cent in growth rate of capital of this period.
A pre and post transition period comparison
analysis depicts that the trend in growth rate of capital
during post transition period have increased from 13.6 per
cent to 21.8 per cent for the entire High Technology
Manufacturing Sector. Almost all industries are in positive
growth rate of capital recorded in the post transition
period. The growth rate of capital is highest in the Office
& Computing equipment Industry to the extent of 32.0 per
cent and the lowest growth rate of capital was recorded by
18

the Drug & Medicines industry to the extent of 16.3 per cent
in the post transition period when compare to pre transition
period.
At the aggregate level, the growth rate of
labour was found lower than the Gross Value Added and
Capital in all the industries during the entire study
period. In most of the industries, the growth rate was found
to be less than 2 per cent during this period. A further
analysis of pre and post transition period suggests that the
trend in growth rate of labour during post transition period
was negative and it was fallen from 3.9 per cent to -1.67
per cent for High Technology Manufacturing Sector at
aggregate level. The highest growth rate of labour was found
in the Office & Computing equipment industry to the extent
of 3.0 in the post transition period. Drug & Medicines
Industry has scored the lowest growth rate of labour to the
extent of -3.9 during this period.
However, at disaggregate industrial level of pre
and post transition period comparison depicts that the trend
in growth rate of labour during post transition period have
been decreased drastically in almost all industries.
19

Table 4.8: Compound Annual Growth Rates (CAGR) ofHigh Technology Manufacturing Sector Pre and Post Transition Period
Industry Group
Value Added Capital Labour
PreTransition period
PostTransition period
Entireperiod
PreTransiti
onperiod
PostTransition period
Entire
period
PreTransiti
onperiod
PostTransiti
onperiod
Entire
period
Office& Computing Equipment 7.5 11.9 11.3 12.5 32.0 20.7 -0.0 3.0 -1.4
Drug &Medicines 6.0 10.2 8.6 14.4 16.3 15.4 2.0 -3.9 3.5Radio, TV &Communication 6.2 21.2 13.2 13.5 27.6 19.2 8.4 1.3 2.7
Aggregate 6.2 13.6 10.3 13.6 21.8 17.2 3.9 -1.67 2.8
Source: Computed using the data from Annual Survey of Industries, EPW Research Foundation.
20

21

Pre Transition
Post Transition
Entire
Pre Transition
Post Transition
Entire
Pre Transition
Post Transition
Entire
Value Added Capital Labour
-100102030
Compound Annual Growth Rates (CAGR) ofHigh Technology Manufacturing Sector Pre and Post
Transition Period
Office& Computing Equipment Drug &MedicinesRadio, TV &Communication Aggregate
4.2.2. Growth Rates of Gross Value Added, Capital and Labour
in Medium High
Technology Manufacturing Sector
The Table 4.9 depicts a synoptic view of the trend
in growth rate of GVA of Medium High Technology
Manufacturing Sector at aggregate and disaggregates level.
The pattern of growth of GVA in the Medium High Technology
Manufacturing Sector stands at 7.1 per cent for the entire
study period. Industry-wise calculated growth rates reveals
that Professional goods Industry and also Other Transport
Industry recorded the highest growth rate of 12.5 per cent
during the entire study period in terms of GVA and followed
by Chemicals excl. drugs industry with 7.9 per cent. The
lowest growth rate of GVA recorded in the Electrical
machines excl.com equipment Industry with 4.1 per cent.
22

A comparative analysis of pre & post transition
period shows that there has been an increase in the growth
rate of GVA at aggregate level from 6.8 per cent in pre
Transition period to 8.7 per cent in post transition period
in the Medium High Technology Manufacturing Sector. Out of
6 industrial groups, 5 industries have witnessed
acceleration in the growth rate of GVA during the post
transition period. The highest growth rate of GVA was
found in the Other Transport Industry with 14.8 per cent in
the post transition period. Non electrical industry has
lowest growth rate of GVA with 5.8 per cent during the same
period.
It has been noticed that the growth rate of
capital was recorded as 13.1 per cent for aggregate Medium
High Technology Manufacturing Sector in the entire study
period. The growth rate of capital is highest with 17.1 per
cent in the Professional goods industry and the lowest was
recorded in the Electrical machines excl.com equipment
industry with 11.6 per cent in the same period. A pre and
post transition period comparison depicts that the trend in
growth rate of capital during post transition period it was
decreased from 17.6 per cent to 10.2 per cent for the entire
Medium High Technology Sector. Almost all industries are
witnessed turn down in the growth rate of capital recorded
in the post transition period. The growth rate of capital
highest in the Professional goods industry to the extent of
27.4 per cent and lowest growth rate of capital recorded by
Non-electrical industry to the extent of 16.6 per cent in
23

the pre Transition period when compare to post transition
period .
24

Table 4.9: Compound Annual Growth Rates (CAGR) of
Medium - High Technology Manufacturing Sector Pre & Post Transition Period
Industry Group
Value Added Capital LabourPre
Transition
period
PostTransition period
Entireperiod
PreTransitionperiod
PostTransition period
Entireperiod
PreTransitionperiod
PostTransition period
Entireperiod
Professional goods 11.8 12.9 12.5 27.4 10.7 17.1 2.7 2.2 2.3
Motor vehicles 8.9 6.4 7.3 17.8 14.0 15.4 6.2 -0.7 2.3Electrical machines excl.com equipment
1.9 8.9 4.1 16.9 8.4 11.6 1.6 -3.6 -1.2
Chemicals excl. drugs 7.0 10.5 7.9 17.3 10.0 12.8 0.9 1.5 1.2
Other transport 12.9 14.8 12.5 20.3 9.5 14.1 6.5 1.5 3.1
Non-electrical 4.9 5.8 5.0 16.6 8.9 12.0 0.7 -1.4 -0.5
Aggregate 6.8 8.7 7.1 17.6 10.2 13.1 2.2 -0.4 0.7
Source: Computed using the data from Annual Survey of Industries, EPW Research Foundation.
25

Pre Transition
Post Transition
Entire
Pre Transition
Post Transition
Entire
Pre Transition
Post Transition
Entire
Value Added Capital Labour
-50
50
Compound Annual Growth Rates (CAGR) ofMedium - High Technology Manufacturing Sector Pre & Post
Transition Period
Professional goodsMotor vehiclesElectrical machines excl.com equipmentChemicals excl. drugsOther transportNon-electricalAggregate
Growth rate of labour is lower than the value added and
capital in all the industries during the entire study period
at the aggregate level. In most of the industries, the
growth rate was found to be less than two per cent during
the same period. A Pre and Post transition period
comparison analysis suggests that the trend in growth rate
of labour during post transition period has negative from
2.2 per cent to -0.4 per cent for Medium High Technology
Manufacturing Sector at aggregate level. Out of 6 industrial
groups, 3 industries have witnessed acceleration in the
growth rate of labour during the pre- transition period
except others such as Professional goods, Chemicals excl.
Drugs and Other transport Industries. And, whereas the
Electrical machines excl.com equipment, Non- electrical and
Motor vehicles Industries recorded negative growth rate of
labour during the Post transition period.
26

4.2.3. Growth Rates of Gross Value Added, Capital and Labour
in Low Technology
Manufacturing Sector
The Table 4.10 illustrates that the growth pattern of
GVA in Low Technology Manufacturing Sector. The total GVA
recorded an overall growth of 7.7 per cent for the entire
Low Technology Manufacturing Sector. The Industry-wise
analysis reveals Food, beverages and Tobacco Industry
recorded the highest growth rate of 6.0 per cent and the
lowest GVA was found in Wood products and furniture with 3.4
per cent in the same period.
A comparative analysis of Pre & Post transition period
reveals that an average growth rates of GVA was same at
aggregate level of Low Technology Manufacturing Sector. And
another point is to understand in this period was that
almost all industries growth rate of GVA decreased in Post
transition period compare to pre Transition period. The
highest growth rate of GVA was found in the Food, beverages
and Tobacco Industry to the extent of 9.8 in the pre
Transition period and followed by Textiles apparel and
Leather Industry with a growth rate of 7.0 per cent. Wood
products and furniture Industry was found at the lowest
growth rate of 1.8 per cent in the post transition period.
The pattern of growth of capital in the Low Technology
Manufacturing Sector stands at 13.3 per cent for the entire
study period. Industry-wise calculated growth rate reveals
27

that Wood products and furniture Industry recorded as the
highest growth rate of
28

Table 4.10: Compound Annual Growth Rates (CAGR) ofLow Technology Manufacturing Sector Pre & Post Transition Period
Industry Group
Value Added Capital Labour
PreTransition period
PostTransiti
onperiod
Entire
period
PreTransition period
PostTransition period
Entireperiod
PreTransition period
PostTransition period
Entireperiod
Paper, paper products and printing
4.6 3.8 3.8 15.6 9.3 11.8 -0.2 -0.2 -0.1
Textiles, apparel and leather
7.0 3.3 4.2 17.8 10.9 13.7 -1.9 1.0 0.2
Food, beverages and tobacco 9.8 3.7 6.0 18.5 10.2 13.6 -1.8 0.6 -0.4
Wood products and furniture 6.2 1.8 3.4 17.2 13.0 14.2 -0.4 0.8 -0.3
Aggregate 8.7 8.6 7.7 17.5 10.3 13.3 1.4 0.6 0.9
Source: Computed using the data from Annual Survey of Industries, EPW Research Foundation.
29

30
Pre Transition
Post Transition
Entire
Pre Transition
Post Transition
Entire
Pre Transition
Post Transition
Entire
Value Added Capital Labour
-1010
Compound Annual Growth Rates (CAGR) ofLow Technology Manufacturing Sector Pre & Post
Transition Period
Paper, paper products and printing Textiles, apparel and leatherFood, beverages and tobacco Wood products and furnitureAggregate
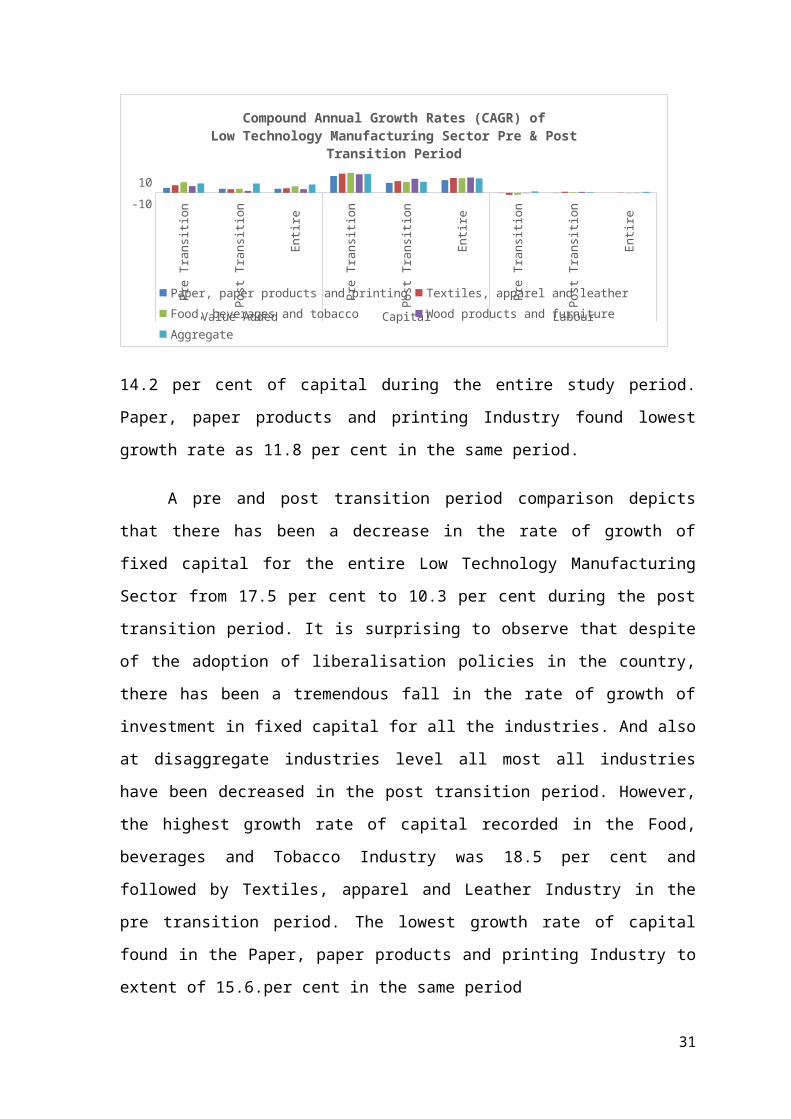
14.2 per cent of capital during the entire study period.
Paper, paper products and printing Industry found lowest
growth rate as 11.8 per cent in the same period.
A pre and post transition period comparison depicts
that there has been a decrease in the rate of growth of
fixed capital for the entire Low Technology Manufacturing
Sector from 17.5 per cent to 10.3 per cent during the post
transition period. It is surprising to observe that despite
of the adoption of liberalisation policies in the country,
there has been a tremendous fall in the rate of growth of
investment in fixed capital for all the industries. And also
at disaggregate industries level all most all industries
have been decreased in the post transition period. However,
the highest growth rate of capital recorded in the Food,
beverages and Tobacco Industry was 18.5 per cent and
followed by Textiles, apparel and Leather Industry in the
pre transition period. The lowest growth rate of capital
found in the Paper, paper products and printing Industry to
extent of 15.6.per cent in the same period
31

In all the industries growth rate of labour is lower
than the value added and capital during the entire study
period at the aggregate level. In most of the industries,
the growth rate found negative during this period. A pre and
post transition period comparison analysis suggests that
trend growth rate of labour during Post transition period
have decreased from 1.4 per cent to 0.6 per cent for Low
Technology Manufacturing Sector at aggregate level.
Textiles, apparel and Leather Industry recorded the highest
growth rate of 1.0 per cent in of labour during the entire
study period and the lowest growth rate was recorded in the
Paper, paper products and printing Industry as -0.2 per
cent in the Post transition period.
4.2.4. Growth Rates of Gross Value Added, Capital and Labour
in Medium Low
Technology Manufacturing Sector
The trend in the growth rates of GVA provided in the
Table 4.11 stood at 4.6 per cent for aggregate Medium Low
Technology Manufacturing Sector of the entire study period.
In terms of Gross Value Added, Other manufacturing Industry
was the best performer with highest growth rate of 15.6 per
cent and followed by Petroleum refineries and Coal products
Industry with 12.7 per cent rate of growth in the same
period. On the contrary, the worst performing industry with
lowest growth rate of -0.6 per cent in the Shipbuilding and
repairing. A comparative analysis of pre and post transition
periods declares that the growth rate was decreased and it
32

was 7.3 per cent at pre transition period and fallen to 3.5
per cent in the post transition.
Out of 8 industrial groups, 3 industries have witnessed
acceleration in the growth rate of GVA during the post
transition period and the other five was not so. The highest
growth rate of GVA was found in Petroleum refineries and
Coal products the Industry to the extent of 14.1 in the post
transition period and followed by Other Manufacturing
Industry and Rubber and plastic products. And, the lowest
growth rate of GVA was recorded with -12.1 per cent in the
Shipbuilding and repairing in pre Transition period.
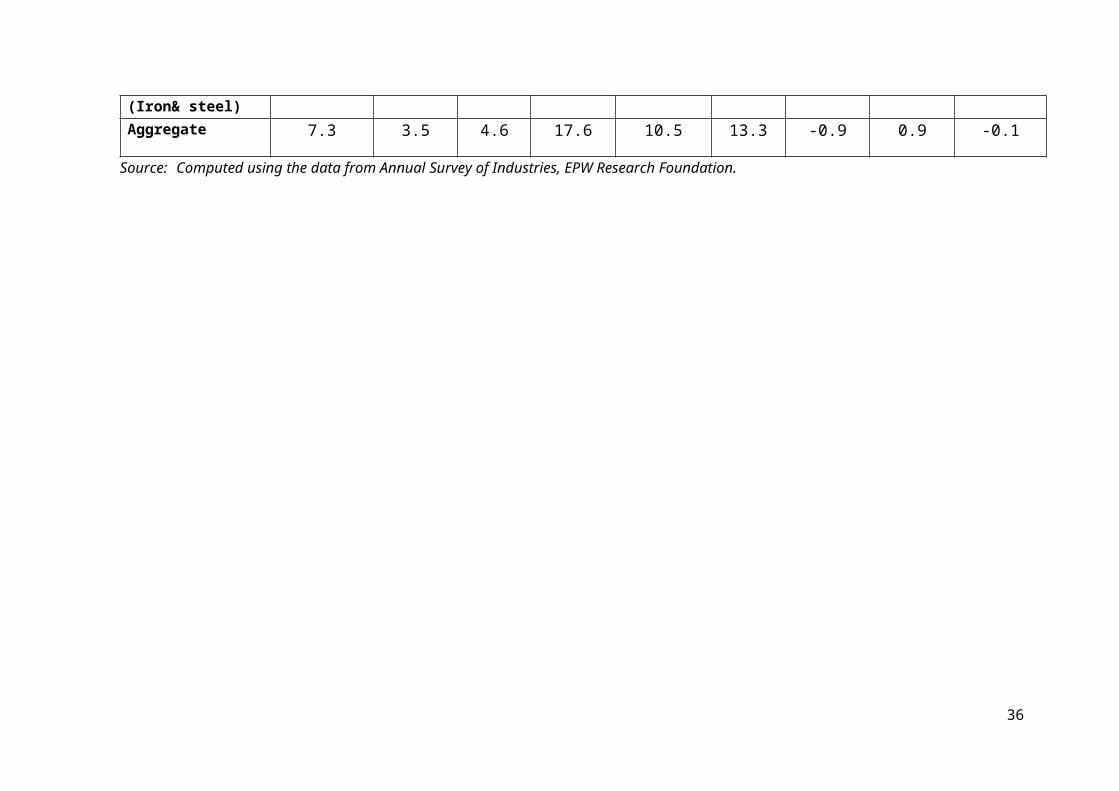
It has been noticed that growth rate of capital
recorded as 13.3 per cent for aggregate level of Medium Low
Technology Manufacturing Sector of the entire study period.
The highest growth rate was recorded as 7 .1 per cent in the
Other Manufacturing Industry during the entire study period
and Shipbuilding and repairing industry had the lowest
growth rate of capital with 3.9 per cent during the same
period.
A pre and post transition period comparison depicts
that the trend in growth rate of capital during post
transition period have decreased from 17.6 per cent to 10.5
per cent for the entire Medium High Technology Manufacturing
Sector. Almost all industries are witnessed acceleration in
the growth rate of capital recorded in the pre Transition
period.
33

The highest growth rate of capital was recorded 25.1
per cent in the Rubber and plastic products Industry and
followed by Non- metallic mineral with growth rate of 22.4,
and also Metal products industries with a growth rate of
20.2 in the pre transition period. The growth rate was
found lowest growth rate of capital by Shipbuilding and
repairing Industry to the extent of 1.1 per cent in pre
transition period when compare to Post transition period.
Growth rate of labour is lower than the Gross
Value Added and Capital in all the industries during the
entire study period at the aggregate level. In most of the
industries, the growth rate found less than two per cent
during this period. A pre and post transition period
comparison analysis suggests that the trend in growth rate
of labour during post transition period has shows a
positive result and it raised from -0.9 per cent to 0.9 per
cent for Medium Low Technology Manufacturing Sector at
aggregate level. Out of 8 industrial groups, 4 industries
have witnessed acceleration in the growth rate of labour
during the post transition period. The highest growth rate
was found in the Other
34

Table 4.11: Compound Annual Growth Rates (CAGR) ofMedium Low Technology Manufacturing Sector Pre & Post Transition period
Industry Group Value Added Capital Labourpre
Transitionperiod
postTransiti
onperiod
Entireperiod
preTransiti
onperiod
postTransitionperiod
Entireperiod
preTransiti
onperiod
postTransiti
onperiod
Entireperiod
Rubber and plastic products
15.0 10.4 11.6 25.1 12.2 17.0 4.3 5.3 4.8
Shipbuilding and repairing -12.1 8.3 -0.6 1.1 6.0 3.9 -10.1 1.5 -2.8
Other manufacturing 17.7 13.4 15.6 16.3 18.4 17.1 4.2 8.4 6.6
Non-ferrous metals 18.4 3.2 10.3 19.2 10.1 14.8 12.5 -7.5 1.2
Non-metallic mineral products
12.1 3.5 7.6 22.4 10.1 15.2 1.8 -0.2 0.9
Metal products 3.3 7.2 5.7 20.2 10.6 14.3 1.8 1.0 1.2Petroleum refineries and coal products
13.1 14.1 12.7 16.8 17.1 16.7 2.4 2.9 2.5
Ferrous metals 4.7 10.2 5.3 15.5 7.8 11.0 -1.6 -1.1 -1.8
35
(Iron& steel)Aggregate 7.3 3.5 4.6 17.6 10.5 13.3 -0.9 0.9 -0.1
Source: Computed using the data from Annual Survey of Industries, EPW Research Foundation.
36

pre Transition
post Transition
Entire
pre Transition
post Transition
Entire
pre Transition
post Transition
Entire
Value Added Capital Labour
-15-10-5051015202530
Compound Annual Growth Rates (CAGR) ofMedium Low Technology Manufacturing Sector Pre & Post
Transition period
Rubber and plastic products Shipbuilding and repairingOther manufacturing Non-ferrous metalsNon-metallic mineral products Metal productsPetroleum refineries and coal products Ferrous metals (Iron& steel)Aggregate
Manufacturing Industries with 8.4 per cent .Whereas Non-
ferrous metals Industry recorded as -7.5 per cent of
negative growth rate of labour during the post transition
period.
********
37