Analysis of Impediments to Fair Housing Choice
64
Analysis of Impediments to Fair Housing Choice Prepared for the: City of Livonia Charter Township of Redford City of Westland Prepared by: Southeast Michigan Council of Governments 535 Griswold Street, Suite 300 Detroit, MI 48226-3602 www.semcog.org June 30, 2011
-
Upload
khangminh22 -
Category
Documents
-
view
5 -
download
0
Transcript of Analysis of Impediments to Fair Housing Choice

Analysis of Impediments to Fair Housing Choice
Prepared for the:
City of Livonia Charter Township of Redford
City of Westland
Prepared by:
Southeast Michigan Council of Governments
535 Griswold Street, Suite 300
Detroit, MI 48226-3602
www.semcog.org
June 30, 2011
1
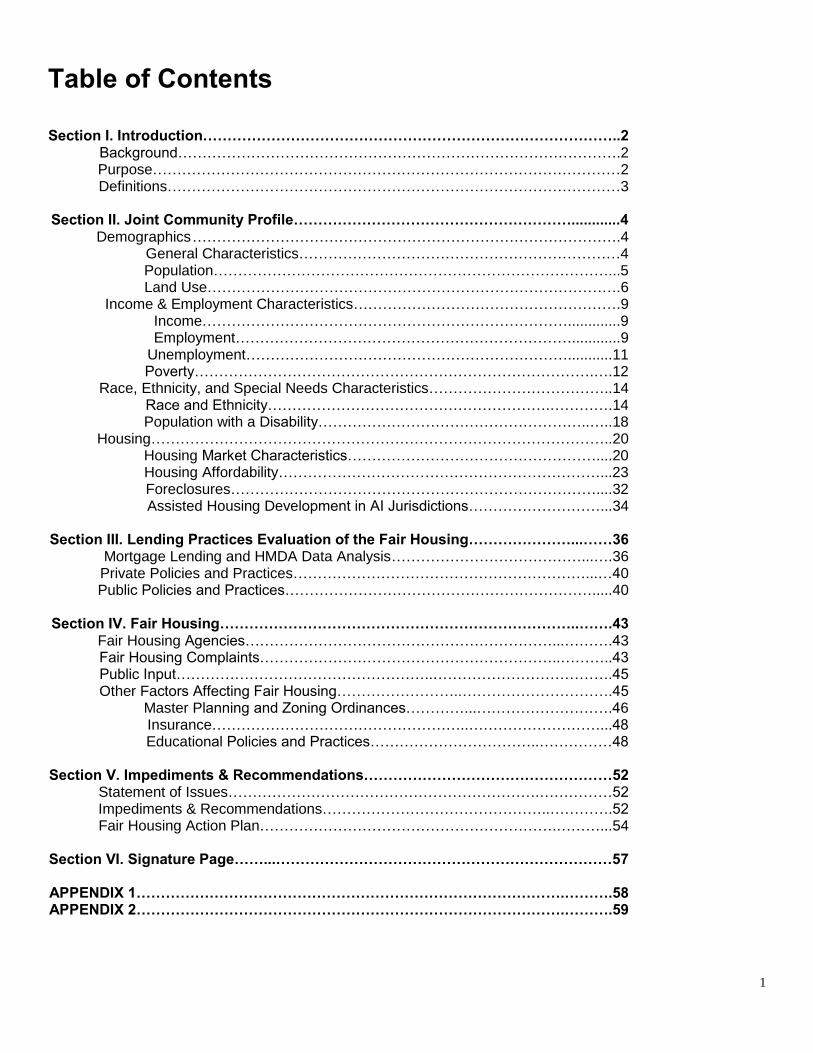
Table of Contents Section I. Introduction…………………………………………………………………………..2 Background……………………………………………………………………………….2 Purpose……………………………………………………………………………………2
Definitions…………………………………………………………………………………3
Section II. Joint Community Profile…………………………………………………............4 Demographics …………………………………………………………………………….4
General Characteristics…………………………………………………………4 Population………………………………………………………………………...5 Land Use………………………………………………………………………….6
Income & Employment Characteristics……………………………………………….9 Income………………………………………………………………….............9 Employment……………………………………………………………............9
Unemployment…………………………………………………………...........11 Poverty……………………………………………………………………….….12 Race, Ethnicity, and Special Needs Characteristics………………………………..14 Race and Ethnicity………………………………………………….………….14 Population with a Disability………………………………………………..…..18
Housing…………………………………………………………………………………..20 Housing Market Characteristics……………………………………………....20 Housing Affordability…………………………………………………………...23 Foreclosures…………………………………………………………………....32 Assisted Housing Development in AI Jurisdictions………………………...34
Section III. Lending Practices Evaluation of the Fair Housing…………………...……36 Mortgage Lending and HMDA Data Analysis …………………………………...….36 Private Policies and Practices……………………………………………………...…40 Public Policies and Practices……………………………………………………….....40
Section IV. Fair Housing………………………………………………………………..…….43 Fair Housing Agencies………………………………………………………...……….43
Fair Housing Complaints……………………………………………………..………..43 Public Input……………………………………………..……………………………….45
Other Factors Affecting Fair Housing……………………..………………………….45 Master Planning and Zoning Ordinances…………...……………………….46 Insurance……………………………………………..………………………...48
Educational Policies and Practices……………………………..……………48
Section V. Impediments & Recommendations……………………………………………52 Statement of Issues……………………………………………………….……………52 Impediments & Recommendations………………………………………..………….52 Fair Housing Action Plan…………………………………………………….………...54
Section VI. Signature Page……...……………………………………………………………57
APPENDIX 1…………………………………………………………………………….……….58 APPENDIX 2…………………………………………………………………………….……….59

2
Section I – Introduction BACKGROUND
Community Development Block Grant (CDBG) entitlement jurisdictions are required to submit to the U.S. Department of Housing and Urban Development (HUD) certification of affirmatively furthering fair housing. This certification has three elements:
1. Complete an Analysis of Impediments to Fair Housing Choice; 2. Take actions to overcome the effects of any impediments identified through the analysis; and 3. Maintain records reflecting the analysis and actions taken.
An Analysis of Impediments to Fair Housing Choice (AI) is an examination of the impediments or barriers to fair housing that affect protected classes within a geographic region. Any discussion of impediments to fair housing focuses on discrimination and should not be confused with a full-scale discussion of housing affordability. The Federal Fair Housing Act bars discrimination in housing based on race, color, religion, sex, national origin, familial status (families with children), and disability. Michigan’s Elliott-Larsen Civil Rights Act protects those categories and adds marital status and age as protected categories. HUD defines impediments to fair housing choice as any action, omission, or decision:
Taken because of race, color, religion, sex, disability, familial status, or national origin that restricts housing choices or the availability of housing choice;
That constitutes a violation, or potential violation, of the Fair Housing Act;
That is counterproductive to fair housing choice, such as community resistance when minorities, persons with disabilities and/or low-income persons first move into white and/or moderate income areas, or resistance to the siting of housing facilities for persons with disabilities; or
That has the effect of restricting housing opportunities on the basis of race, color religion, sex, disability, familial status or national origin.
Further, HUD interprets that to affirmatively further fair housing a jurisdiction should:
Analyze and eliminate housing discrimination in the particular jurisdictions;
Promoting fair housing choice for all persons;
Providing opportunities for inclusive patterns of housing occupancy;
Promoting housing that is physically accessible to, and usable by, all persons, particularly persons with disabilities; and
Foster compliance with the nondiscrimination provisions of the Fair Housing Act. The AI process involves a thorough examination of a variety of sources related to housing, affirmatively furthering fair housing, the fair housing delivery system and housing transactions, which affect people who are protected under fair housing law. AI sources include census data; home mortgage industry data; federal, state and local housing complaint data; surveys of housing industry experts and stakeholders; and other housing information. This AI also included public input and review process via direct contact with stakeholders, public forums to collect input from citizens, distribution of draft reports for citizen review and formal presentation of findings.
PURPOSE
The purpose of this AI is to evaluate a broad range of quantitative and qualitative data, document identified impediments to fair housing choice and to suggest actions that can be considered in working toward overcoming or mitigating the identified impediments. This Analysis provides information pertaining to demographic and housing conditions, fair housing requirements, fair housing safeguards, and impediments to fair housing and recommended corrective actions.

3
Many sources of information were used to compile this document, including the jurisdictions Consolidated Plans; Comprehensive Annual Performance and Evaluation Reports (CAPERs); previous AI’s, comprehensive planning documents; and a wealth of other information from government and private institutions; and also from citizens.
DEFINITIONS The following definitions have been adopted by the City of Livonia, Redford Township, and the City of Westland for purposes of this study.
Fair Housing: equal and free access to residential housing choices regardless of race, color, religion, sex, age, disability, familial status (the presence of children), national origin, marital status, creed, ancestry, or unfavorable military discharge. Residential housing is fundamental to meeting essential needs and pursuing personal, educational, employment or other goals.
Impediments to fair housing: 1) any actions, omissions, or decisions taken because of race, color, religion, sex, age, handicap (disability), familial status (the presence of children), national origin, marital status, creed, ancestry, or unfavorable military discharge, which restrict housing choice, or 2) any actions, omissions, or decisions which have the effect of restricting housing choices or the availability of housing choices on the basis of race, color, religion, sex, age, disability, familial status or national origin or marital status, creed, or ancestry.
A central tenet of this study is that affordable housing is linked to fair housing in much the same way that issues of race and class are linked. This analysis assesses barriers to affordability, as well as fair housing issues. This assertion does not indicate that racial and ethnic discrimination have ended. It does contend, however, that they may be fading and that other forms of discrimination, not based solely on race and ethnicity, are increasing. A second tenet concerns the dynamics of the neighborhood life cycle. Neighborhoods are established, grow and prosper, mature, and then may begin to decline as the physical environment changes (e.g. new and more exciting homes are built, with new and possibly better services offered elsewhere). Mainstream buyers would be more likely to choose those opportunities perceived as being more desirable. As the older neighborhood loses its cachet and the “smart” money moves elsewhere, prices may decline, and the neighborhood begins an economic and, possibly a racial or ethnic, transition which results in a re-segregation of the community. This often results in minor changes in the lives of the lower-income or minority residents who moved for an improved quality of life. If this premise is true, it is necessary to address the root(s) of the problem which may have to do with market dynamics as much as racial and income prejudice. Fair housing would then involve the successful retention of middle-income and non-minority residents in neighborhoods at-risk of downward spiral, every bit as much as opening new housing opportunities for minority and lower-income persons.
The three CDBG entitlement communities of Livonia, Redford Township, and Westland recognize the complexity of fair housing issues and the increasing inter-dependence between each jurisdiction. Thus the three communities agreed to jointly produce what is intended to be a more comprehensive, thorough, and effective assessment of fair housing within the study area than would otherwise be possible. The intent of this AI is to establish a single framework by which Livonia, Redford Township, and Westland can jointly approach, assess and affirmatively further fair housing.
4
Section II - Joint Community Profile
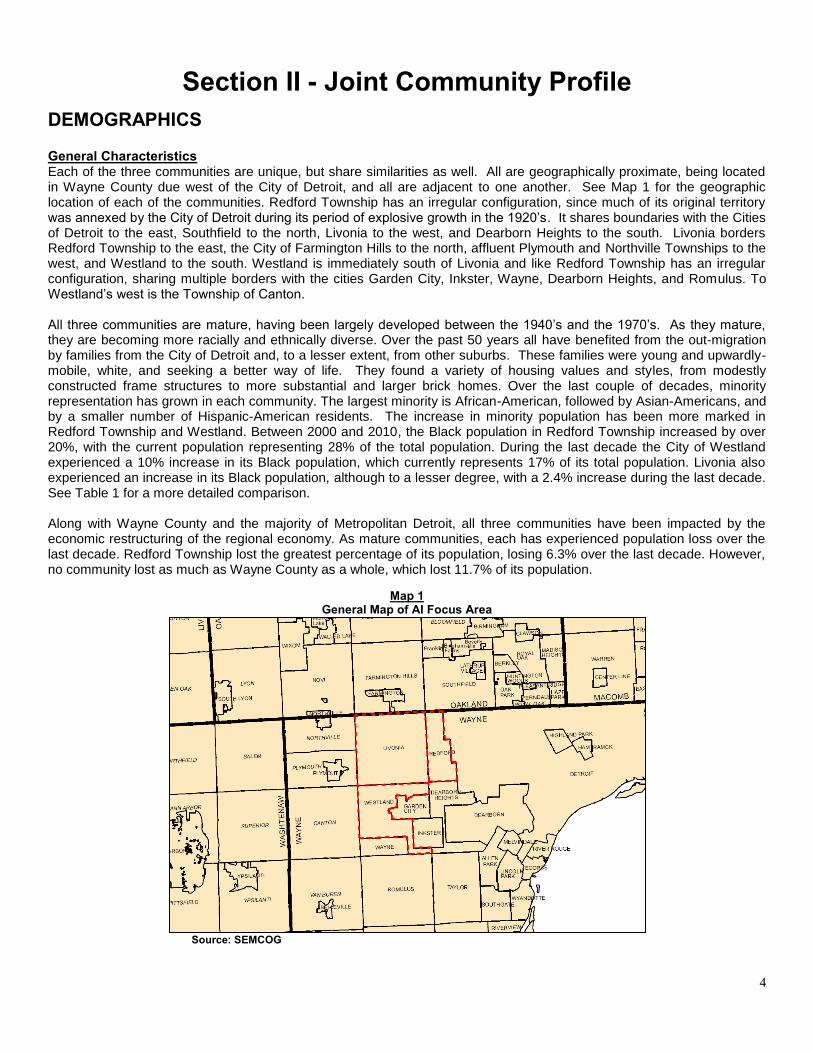
DEMOGRAPHICS General Characteristics Each of the three communities are unique, but share similarities as well. All are geographically proximate, being located in Wayne County due west of the City of Detroit, and all are adjacent to one another. See Map 1 for the geographic location of each of the communities. Redford Township has an irregular configuration, since much of its original territory was annexed by the City of Detroit during its period of explosive growth in the 1920’s. It shares boundaries with the Cities of Detroit to the east, Southfield to the north, Livonia to the west, and Dearborn Heights to the south. Livonia borders Redford Township to the east, the City of Farmington Hills to the north, affluent Plymouth and Northville Townships to the west, and Westland to the south. Westland is immediately south of Livonia and like Redford Township has an irregular configuration, sharing multiple borders with the cities Garden City, Inkster, Wayne, Dearborn Heights, and Romulus. To Westland’s west is the Township of Canton. All three communities are mature, having been largely developed between the 1940’s and the 1970’s. As they mature, they are becoming more racially and ethnically diverse. Over the past 50 years all have benefited from the out-migration by families from the City of Detroit and, to a lesser extent, from other suburbs. These families were young and upwardly-mobile, white, and seeking a better way of life. They found a variety of housing values and styles, from modestly constructed frame structures to more substantial and larger brick homes. Over the last couple of decades, minority representation has grown in each community. The largest minority is African-American, followed by Asian-Americans, and by a smaller number of Hispanic-American residents. The increase in minority population has been more marked in Redford Township and Westland. Between 2000 and 2010, the Black population in Redford Township increased by over 20%, with the current population representing 28% of the total population. During the last decade the City of Westland experienced a 10% increase in its Black population, which currently represents 17% of its total population. Livonia also experienced an increase in its Black population, although to a lesser degree, with a 2.4% increase during the last decade. See Table 1 for a more detailed comparison. Along with Wayne County and the majority of Metropolitan Detroit, all three communities have been impacted by the economic restructuring of the regional economy. As mature communities, each has experienced population loss over the last decade. Redford Township lost the greatest percentage of its population, losing 6.3% over the last decade. However, no community lost as much as Wayne County as a whole, which lost 11.7% of its population.
Map 1 General Map of AI Focus Area
Source: SEMCOG

5
Population Table 1 reveals that the population of metropolitan Detroit (defined for this analysis as the seven county SEMCOG region), Wayne County, and each of the three focus communities have all decreased in population between 2000 and 2010. SEMCOG estimates that the population of both Livonia and Redford Township will continue to decline over the next 25 years, while the population of Westland is projected to slightly increase by 3.4%. As a whole, the population of the focus area is stagnant with very little growth expected in the near future.
Table 1
General Population Characteristics of AI Study Area
MUNICIPALITY 2000 2010 2035
ESTIMATE % GROWTH 2000 – 2010
PROJECTED GROWTH
2010 – 2035 Livonia 100,545 96,942 95,779 (3.6%) (1.2%) Redford Township 51,622 48,362 45,687 (6.3%) (5.8%) Westland 86,602 84,094 87,088 (2.9%) 3.4% Wayne County 2,061,162 1,820,584 1,850,398 (11.7%) 1.6% Metropolitan Detroit 4,833,368 4,704,743 5,062,552 (2.7%) 7.1%
Source: SEMCOG Community Profile Data – April 2011
Although each community is unlikely to see gains in its total population in the near future, each has been and will continue to see a re-alignment of its population. Table 2 shows that each community’s elderly, over 65, population will increase substantially, while its youth population, under 18, will decline. This aging of the population, especially in inner-ring and mature communities, is not unique. However, the challenge of providing the required services to meet the needs of this changing population must be strategically addressed in each community. An additional challenge to this population shift is the significant loss of residents between the ages of 18-64 who are the key occupants of both owner- and renter-occupied households. SEMCOG estimates that combined the three communities will lose roughly 30,000 of this key population cohort.
Table 2
Population by Age Group CENSUS
2000 2035
ESTIMATE CHANGE 2000-2035
Livonia # % # % 65 and over 16,988 16.9% 25,340 26.5% 8,352
35-64 41,910 41.7% 31,962 33.4% -9,948
18-34 17,689 17.6% 16,997 17.7% -692
5-17 18,304 18.2% 15,487 16.2% -2,817
Under 5 5,654 5.6% 5,993 6.3% 339
Redford 65 and over 7,698 14.9% 12,710 27.8% 5,012
35-64 18,923 36.7% 14,840 32.5% -4,083
18-34 11,923 23.1% 8,158 17.9% -3,765
5-17 9,537 18.5% 7,126 15.6% -2,411
Under 5 3,541 6.9% 2,853 6.2% -688
Westland 65 and over 11,456 13.2% 25,133 28.9% 13,677
35-64 32,158 37.1% 27,960 32.1% -4,198
18-34 22,831 26.4% 15,827 18.2% -7,004
5-17 14,140 16.3% 13,053 15.0% -1,087
Under 5 6,017 6.9% 5,115 5.9% -902
Source: SEMCOG Community Profile Data – April 2011 As noted, each community has experienced a decline in its population between 2000 and 2010. Table 3 shows that this decrease is due to the out-migration of families to the outer-suburbs, communities throughout the state, and/or communities outside of the state. This loss of demand in each of the three communities has resulted in a more than doubling of the residential vacancy rate. How these communities address this realignment of population and housing and continue to offer housing choices that meet resident demand will likely be an ongoing challenge.

6
Table 3 Population Change
CENSUS 1990-1999
SEMCOG 2000-2009
Livonia
Natural Increase 269 (47)
Net Migration (300) (272)
Pop. Change (30) (319)
Redford
Natural Increase 224 166
Net Migration (500) (611)
Pop. Change (276) (445)
Westland
Natural Increase 535 296
Net Migration (347) (727)
Pop. Change 188 (432)
Outer-Wayne County
Natural Increase 5,569 4,218
Net Migration (2,951) (4,316)
Pop. Change 2,618 (99)
Source: SEMCOG Community Profile Data Land Use Land uses in the study area are demonstrated in Map 2 and Table 4.
Map 2 SEMCOG 2008 Land Use for AI Study Area
Source: SEMCOG Community Profile Data
Land Use Acres Percent Agricultural 0 0.00%
Single-family residential 19,371 44.80%
Multiple-family residential 863 2.00%
Commercial 4,217 9.80%
Industrial 3,698 8.60%
Governmental/Institutional 3,388 7.80%
Park, recreation, and open space 3,388 7.80%
Airport 0 0.00%
Transportation, Communication, & Utility 8,164 18.90%
Water 136 0.30%
Total
43,224 100%

7
Roughly 50% of the study area’s land use is residential; with the City of Westland having the majority of the area’s muti-family residential units. Each community’s industrial land is located along the CSX Class 1 Railroad, which is the major freight line between Detroit, Lansing, Grand Rapids, and Chicago. Both Livonia and Westland have significant commercial areas (8.9% and 13.5% respectively). This has enabled these two communities to develop several activity generating centers, drawing people from across western Wayne County and possibly the metropolitan area. Redford Township, on the other hand, shows comparable land-use ratios but has less available land area to work with. Its commercial and industrial uses are older and more localized, making it better equipped to serve neighborhood and local needs for shopping, and employment. All three communities have been able to use tax revenues to provide a variety of excellent public services to residents.
Table 4 Land Use/Land Cover in 2008
LAND USE TYPE LIVONIA
ACRES % REDFORD
ACRES % WESTLAND
ACRES %
Agriculture 0 0.0% 0 0.0% 0 0.0%
Single Family Res. 10,171 44.3% 3,431 47.7% 5,769 44.1%
Multi-Family Res. 165 0.7% 22 0.3% 677 5.2%
Commercial/Office 2,033 8.9% 412 5.7% 1,772 13.5%
Industrial 2,536 11.1% 426 5.9% 735 5.6%
Government & Institutional 2,026 8.8% 528 7.3% 834 6.4%
Park, Recreation, & Open Space 1,803 7.9% 432 6.0% 1,153 8.8%
Airport 0 0.0% 0 0.0% 0 0.0%
Transportation Communications & Utility 4,093 17.8% 1,943 27% 2,127 16.3%
Water 115 0.5% 5 0.1% 15 0.1%
Total Acres 22,943 100% 7,198 100% 13,083 100% SEMCOG: Community Profile Data, April 2011 It should be noted that large numbers of residents commute to employment centers located in Detroit and throughout the region, and transportation is therefore important to the economic viability of all three communities. In total, 18.9% of the land use in the study area is for transportation, communications, and utility, with roadways making up the vast majority. All three communities are situated adjacent to several major transit corridors, which have served as magnets for business growth and job creation. Interstate 96 provides direct access into Detroit on the east, and to points west, and funnels activity into the study area. Interstate 275, directly connects with I-75, an extremely busy commercial route. Both are critical to the movement of people and commerce, and all three communities have flourished as a result of their proximity to them. By-and-large, transportation is available for most residents in the study area. Each of the three communities offer reliable transportation options to residents, including special needs populations. Both Redford Township and Westland provide public transit to residents through the SMART bus system. SMART is the regional public transportation provider for Macomb, Oakland, and Wayne Counties. See Map 3 for a detailed map of bus services for Redford and Westland. The Redford Connector service provides curb-to-curb bus service throughout the community and selected locations outside of Redford. The Redford Connector tailors its schedule so that seniors can get to their appointments, but is also available to any residents who need to travel to the local grocery store, hairdresser, Redford Community Center, or any other necessary destination. The bus runs Monday through Friday from 7:30 A.M. to 5:30 P.M. Redford resident seniors ride for free, while all other seniors and handicap persons are charged $1.00 per trip and general public is charge $2.00 per trip. In Westland, SMART has partnered with the Nankin Transit Commission to provide residents ages 55 and over, and those who are physically and/or mentally challenged, with transportation for medical and non-medical trips. The fare for this service is $1.00. The City of Livonia and Livonia Housing Commission administer three transportation assistance programs to assist Livonia residents with employment and social service needs. The programs are heavily marketed to senior citizens and persons with disabilities but the transportation programs are not restricted to special needs populations. The City of Livonia electorate opted out the SMART regional transportation program several years ago. The local Livonia Community Transit Program (Map 4) was established and the City of Livonia levees .5 mills of mileage which generates $950,000 annually to operate the community transportation program. The Transit Program is a call-for-service program and is highly responsive to the transportation needs of residents especially elderly and disabled.

8
In addition to the Community Transit Program, the City of Livonia allocates federal HUD Community Development Block Grant (CDBG) funds to facilitate the Livonia Senior Van Transportation program. In the 2011-12 CDBG program year, $50,000 was allocated to sponsor senior citizen transportation with social service needs. The Livonia Housing Commission also administers a transportation program for residents of low income Public Housing. The residents have limited incomes and mobility options, therefore the Housing Commission sponsors a transportation program and has two transportation vehicles to assist Public Housing elderly and disabled residents with social service needs.
Map 3 SMART Route Transit Map for Redford and Westland
Source: SMART
Fixed SMART Route
Park & Ride Route
Community borders
Map 4
Livonia Community Transit Map
Source: City of Livonia
Botsford Route
Millennium Route

9
INCOME & EMPLOYMENT CHARACTERISTICS Income A decent income is necessary to provide life’s essentials, including decent, safe and sanitary housing. Adequate income is also essential to gaining access (by virtue of community, neighborhood, or voluntary association) to other facilities and services which provide a high standard of living. This includes employment centers; excellent public schools, which not only educate, but also help individuals make friends through clubs and informal associations; high quality and well-maintained parks and recreational facilities; and excellent libraries and cultural venues. These features create communities that individuals want to live, and remain in. Higher-income households demand, and receive, these amenities as a matter of course; choosing to live in those communities which can provide them. From a municipal perspective, a strong tax base is indispensable in order to provide desired services and amenities, and in order to attract additional development and residents.
According to the U.S. Census Bureau’s 2005-2009 American Community Survey (ACS) data, all three communities have a higher median household, median family, and median non-family income than Wayne County. However, it is likely that a key determinant of this is the inclusion of the City of Detroit in the Wayne County estimate. Table 5 shows that although the AI Study Area has a higher median income for households, families, and non-families than Wayne County, only the City of Livonia has a higher median income for households and families than the Detroit-Warren-Livonia PMSA. When compared with the study area’s neighboring communities to the north and west, all three communities have lower median incomes.
Table 5 Income Comparisons
(2009 inflation-adjusted dollars)
MUNICIPALITY
MEDIAN HOUSEHOLD
INCOME
MEDIAN FAMILY INCOME
MEDIAN NON-FAMILY
INCOME Livonia $71,928 $84,295 $37,743
Redford $52,573 $62,551 $35,870
Westland $48,822 $61,233 $32,122
Wayne County $42,232 $52,595 $26,700
Detroit PMSA $52,954 $65,518 $31,495 Source: US Census Bureau, 2005-2009 ACS
Employment Southeast Michigan is in the midst of economic challenges not seen since the Great Depression. Due to the restructuring of the domestic auto industry, the region has been in an almost decade-long recession, losing employment every year since 2001 (it is important to note that, in 2005, the region’s economy was 680% more concentrated in auto manufacturing employment than the national economy – a gross disproportion). Staggering job loss, declining personal income, home foreclosure, an eroding tax base, and reductions in government services are facts this region faces every day. From year 2000 to 2009, Southeast Michigan lost almost 500,000 jobs, or 20% of its total. A rapidly transforming new economy has left many less skilled and educated workers behind. Unemployment – already among the highest in the nation at eight percent in 2008 – skyrocketed to more than 15% in 2009. The study area is not immune to these larger regional, state, and national economic challenges. Table 6 shows that between 2005 and 2010 the region as a whole lost 7,028 jobs. Only the City of Westland had an increase, although modest, in employment. Although all three communities are expected to maintain or increase employment opportunities in the next couple of decades, these new jobs are very likely to be focused away from higher-paying manufacturing jobs and towards service and health care related industries.
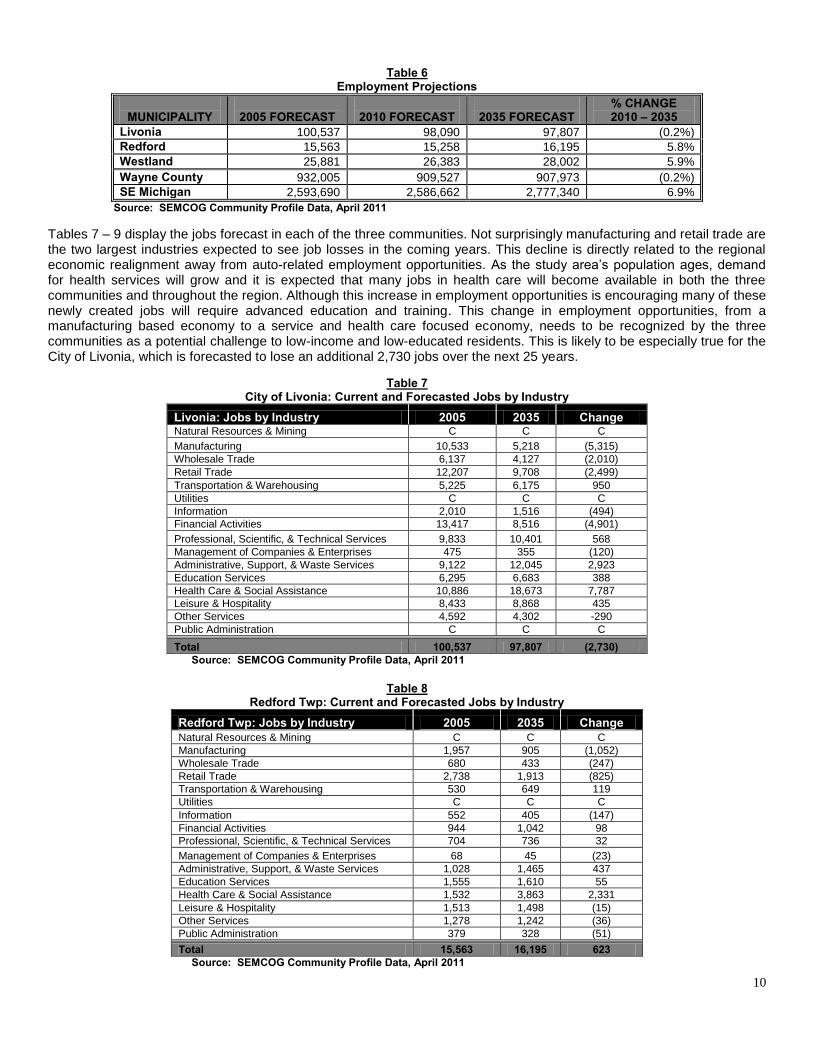
10
Table 6 Employment Projections
MUNICIPALITY
2005 FORECAST
2010 FORECAST
2035 FORECAST
% CHANGE 2010 – 2035
Livonia 100,537 98,090 97,807 (0.2%)
Redford 15,563 15,258 16,195 5.8%
Westland 25,881 26,383 28,002 5.9%
Wayne County 932,005 909,527 907,973 (0.2%)
SE Michigan 2,593,690 2,586,662 2,777,340 6.9%
Source: SEMCOG Community Profile Data, April 2011 Tables 7 – 9 display the jobs forecast in each of the three communities. Not surprisingly manufacturing and retail trade are the two largest industries expected to see job losses in the coming years. This decline is directly related to the regional economic realignment away from auto-related employment opportunities. As the study area’s population ages, demand for health services will grow and it is expected that many jobs in health care will become available in both the three communities and throughout the region. Although this increase in employment opportunities is encouraging many of these newly created jobs will require advanced education and training. This change in employment opportunities, from a manufacturing based economy to a service and health care focused economy, needs to be recognized by the three communities as a potential challenge to low-income and low-educated residents. This is likely to be especially true for the City of Livonia, which is forecasted to lose an additional 2,730 jobs over the next 25 years.
Table 7 City of Livonia: Current and Forecasted Jobs by Industry
Livonia: Jobs by Industry 2005 2035 Change Natural Resources & Mining C C C
Manufacturing 10,533 5,218 (5,315)
Wholesale Trade 6,137 4,127 (2,010)
Retail Trade 12,207 9,708 (2,499)
Transportation & Warehousing 5,225 6,175 950
Utilities C C C
Information 2,010 1,516 (494)
Financial Activities 13,417 8,516 (4,901)
Professional, Scientific, & Technical Services 9,833 10,401 568
Management of Companies & Enterprises 475 355 (120)
Administrative, Support, & Waste Services 9,122 12,045 2,923
Education Services 6,295 6,683 388
Health Care & Social Assistance 10,886 18,673 7,787
Leisure & Hospitality 8,433 8,868 435
Other Services 4,592 4,302 -290
Public Administration C C C
Total 100,537 97,807 (2,730) Source: SEMCOG Community Profile Data, April 2011
Table 8
Redford Twp: Current and Forecasted Jobs by Industry Redford Twp: Jobs by Industry 2005 2035 Change Natural Resources & Mining C C C
Manufacturing 1,957 905 (1,052)
Wholesale Trade 680 433 (247)
Retail Trade 2,738 1,913 (825)
Transportation & Warehousing 530 649 119
Utilities C C C
Information 552 405 (147)
Financial Activities 944 1,042 98
Professional, Scientific, & Technical Services 704 736 32
Management of Companies & Enterprises 68 45 (23)
Administrative, Support, & Waste Services 1,028 1,465 437
Education Services 1,555 1,610 55
Health Care & Social Assistance 1,532 3,863 2,331
Leisure & Hospitality 1,513 1,498 (15)
Other Services 1,278 1,242 (36)
Public Administration 379 328 (51)
Total 15,563 16,195 623 Source: SEMCOG Community Profile Data, April 2011
11
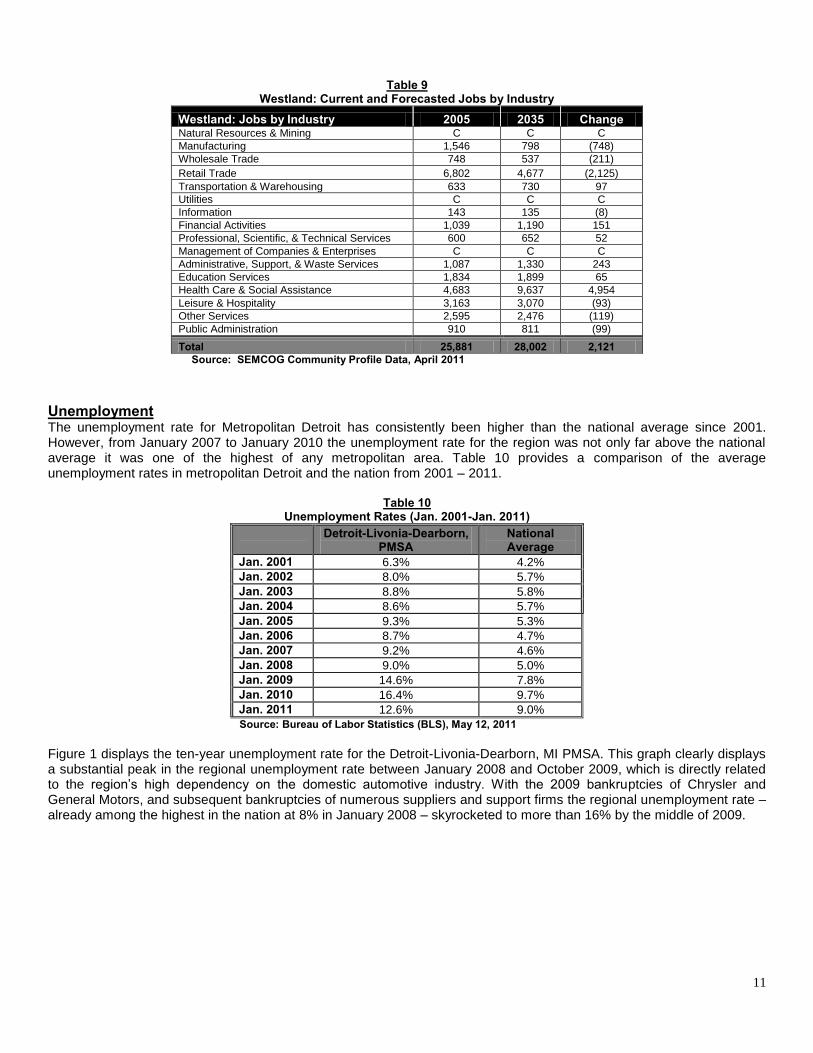
Table 9
Westland: Current and Forecasted Jobs by Industry Westland: Jobs by Industry 2005 2035 Change Natural Resources & Mining C C C
Manufacturing 1,546 798 (748)
Wholesale Trade 748 537 (211)
Retail Trade 6,802 4,677 (2,125)
Transportation & Warehousing 633 730 97
Utilities C C C
Information 143 135 (8)
Financial Activities 1,039 1,190 151
Professional, Scientific, & Technical Services 600 652 52
Management of Companies & Enterprises C C C
Administrative, Support, & Waste Services 1,087 1,330 243
Education Services 1,834 1,899 65
Health Care & Social Assistance 4,683 9,637 4,954
Leisure & Hospitality 3,163 3,070 (93)
Other Services 2,595 2,476 (119)
Public Administration 910 811 (99)
Total 25,881 28,002 2,121 Source: SEMCOG Community Profile Data, April 2011
Unemployment The unemployment rate for Metropolitan Detroit has consistently been higher than the national average since 2001. However, from January 2007 to January 2010 the unemployment rate for the region was not only far above the national average it was one of the highest of any metropolitan area. Table 10 provides a comparison of the average unemployment rates in metropolitan Detroit and the nation from 2001 – 2011.
Table 10 Unemployment Rates (Jan. 2001-Jan. 2011)
Detroit-Livonia-Dearborn, PMSA
National Average
Jan. 2001 6.3% 4.2%
Jan. 2002 8.0% 5.7%
Jan. 2003 8.8% 5.8%
Jan. 2004 8.6% 5.7%
Jan. 2005 9.3% 5.3%
Jan. 2006 8.7% 4.7%
Jan. 2007 9.2% 4.6%
Jan. 2008 9.0% 5.0%
Jan. 2009 14.6% 7.8%
Jan. 2010 16.4% 9.7%
Jan. 2011 12.6% 9.0%
Source: Bureau of Labor Statistics (BLS), May 12, 2011 Figure 1 displays the ten-year unemployment rate for the Detroit-Livonia-Dearborn, MI PMSA. This graph clearly displays a substantial peak in the regional unemployment rate between January 2008 and October 2009, which is directly related to the region’s high dependency on the domestic automotive industry. With the 2009 bankruptcies of Chrysler and General Motors, and subsequent bankruptcies of numerous suppliers and support firms the regional unemployment rate – already among the highest in the nation at 8% in January 2008 – skyrocketed to more than 16% by the middle of 2009.

12
Figure 1
Unemployment Rate: Detroit-Livonia-Dearborn, MI PMSA
Source: Bureau of Labor Statistics (BLS), May 12, 2011
The AI Study Area and Wayne County were directly impacted by this regional and statewide economic restructuring. Table 11 shows that unemployment in each of the three communities more than doubled between 2000 and 2009. Table 11 reflects American Community Survey (ACS) data for 2005-2009 since community level data is not available from the Bureau of Labor Statistics (BLS).
Table 11 Percent Persons (16 years & over) who are Unemployed
MUNICIPALITY
CENSUS 1990
CENSUS 2000
ACS 2005-2009
Livonia 4.5% 2.0% 4.9%
Redford 5.3% 2.5% 7.0%
Westland 6.3% 3.0% 6.1%
Wayne County N/A 5.1% 9.0% Source: U.S. Census Bureau 2000 and ACS 2005-2009
Poverty According to the 2000 Census each of the three community’s poverty rate was well below Wayne County and the Detroit-Livonia-Dearborn, PMSA. Westland had the highest poverty rate of 6.8%, followed by Redford at 5.1%, and Livonia at 3.2%. Unfortunately the data displayed in Table 12 is now over ten years old and it is likely that the poverty rates have increased in all communities and the region as a whole due to the long-lasting economic restructuring that began in 2006.
Table 12 Percent of Individuals Below Poverty Level
MUNICIPALITY
CENSUS 2000
Livonia 3.2%
Redford 5.1%
Westland 6.8%
Wayne County 16.4%
Detroit, PMSA 10.7% Source: US. Census Bureau 2000 Map 5 displays the poverty rates for several communities throughout the region. This map shows that the communities with high poverty rates are predominately closely clustered around the City of Detroit. Each community within the AI Study Area (identified by red stars) has a poverty rate below the regional average, and it’s likely that several communities with a poverty rate between 10.6 and 38.3 are the drivers of the regional average of 10.7% - with the City of Detroit playing the largest part.

13
Map 5
Percent of Persons Below the Poverty Level in 1999
Source: Census 2000 SF3 data

14
RACE, ETHNICITY, & SPECIAL NEEDS CHARACTERISTICS Race and Ethnicity Broken into major racial and ethnic groupings, the makeup of the study area shows a steadily increasing minority population. Table 13 below shows that between 2000 and 2010 the AI Study Area as a whole lost White residents, while at the same time experienced significant increases in minority population, especially in its Black population. Redford Twp experienced both the greatest percentage loss of White residents and the greatest percentage increase of Black residents over this ten-year period.
Table 13 Major Racial and Ethnic Groups in 2000 & 2010
LIVONIA
2000
%
2010
%
% Change 2000-2010
White 94,651 94.1% 87,332 90.1% (4.1%)
Black 945 0.9% 3,264 3.4% 2.4%
Asian 1,944 1.9% 2,441 2.5% 0.6%
Hispanic 1,731 1.7% 2,399 2.5% 0.8%
Multi-Racial 982 1.0% 1,205 1.2% 0.3%
Other 292 0.3% 301 0.3% 0.0%
Total Population
100,545
100%
96,942
100%
-
REDFORD
2000
%
2010
%
% Change 2000-2010
White 44,731 86.7% 31,292 64.7% (21.9%)
Black 4,383 8.5% 13,292 28.7% 20.2%
Asian 385 0.7% 399 0.8% 0.1%
Hispanic 1,044 2.0% 1,420 2.9% 0.9%
Multi-Racial 793 1.5% 1,093 2.3% 0.7%
Other 286 0.6% 267 0.6% (-0.1%)
Total Population
51,622
100%
48,362
100%
-
WESTLAND
2000
%
2010
%
% Change 2000-2010
White 74,116 85.6% 61,826 73.5% (12.1%)
Black 5,823 6.7% 14,347 17.1% 10.3%
Asian 2,427 2.8% 2,526 3% 0.2%
Hispanic 2,138 2.5% 3,165 3.8% 1.3%
Multi-Racial 1,586 1.8% 1,730 2.1% 0.2%
Other 512 0.6% 500 0.6% 0.0%
Total Population
86,602
100%
84,094
100%
-
SEMCOG Region
2000
%
2010
%
% Change 2000-2010
White 3,410,105 70.6% 3,223,281 68.5% (2.0%)
Black 1,051,595 21.8% 1,018,089 21.6% (0.1%)
Asian 123,269 2.6% 168,092 3.6% 1.0%
Hispanic 136,136 2.8% 182,970 3.9% 1.1%
Multi-Racial 90,233 1.9% 92,100 2.0% 0.1%
Other 22,155 0.5% 20,211 0.4% 0.0%
Total Population 4,833,493 100% 4,704,743 100% -
Source: SEMCOG Community Profile Data, April 2011
Table 13 shows significant racial and ethnic changes in the AI Study Area between the 2000 and 2010 Census counts. First, the non-minority population is decreasing in all three jurisdictions, as it is throughout Metropolitan Detroit. This data shows a continued rise in the number of Blacks, Hispanics and Asians in the three communities. This is especially true for both Redford and Westland, which saw percent increases in Black population of 20.2% and 10.3% respectfully. While all three communities decreased in total population for the decade, this total population loss was the result of significant losses in White population. All three communities saw an increase in both the total number and percentage of non-White populations. Thus throughout the AI Study Area, minorities are moving into areas which have historically been segregated. This may result from: fair housing legislation; increased opportunity of choice as fringe development continues; declines in housing costs; or attitudinal shifts (i.e. decreasing opposition to living in racially-integrated communities) among the White population. Minority families have more housing options now than in the past and all three communities are becoming more open.

15
Unfortunately at the writing of this Analysis, 2010 census data at the census tract level is not yet available. However, it is important to understand minority concentration and income levels within each of the three communities. For this, 2010 estimate data from the Federal Financial Institutions Examination Council (FFIEC) is provided in Table 14. While all three communities in the AI Study Area are largely non-minority, all strive to maintain racial and ethnic balance in all neighborhoods. It is often considered that a racially-concentrated area is one having 40% or more of its population belonging to one or several readily identifiable racial or ethnic groups. This is about 10% higher than the 31.5% minority population found in the seven county SEMCOG region in 2010. As shown in Table 14, in the AI Study Area, only two census tracts (one in Redford and one in Westland) have a high enough minority population for an objective observer to perceive them as being “minority” (exceeding the 40% threshold). Interestingly of the two census tracts in Livonia with a 10% or greater minority population, one has the highest median family income in the city, while the other has the second lowest. Following suit to the data presented in Table 14, the vast majority of census tracts in Livonia have a minority population between 4% and 6%. Both Westland and Redford also show that there is not a direct correlation to be made between the percentage of minority residents and the Median Family Income per census block. The data presented in this table may be inconsistent with other census information since the number of minorities in both communities appears to be greater than the total presented in Table 13 would suggest. This may be due to the way that people were classified, but there are no definitive answers to this. The data for all three communities, however, reveal that those minorities living in areas with a greater concentration of minorities than found elsewhere would appear to have (sometimes significantly) higher incomes than found elsewhere in the community. This supports the contention that middle- and upper- income minority households have taken advantage of opportunities to obtain decent housing outside of minority-concentrated areas.

16
Table 14 Minority Concentrations and Income Levels by Census Tract in AI Communities
CENSUS TRACT #
% MINORITY RESIDENTS
INCOME AS % OF 2010 MFI FOR
AREA 2010 EST. MFI FOR TRACT
INCOME DESCRIPTION
Livonia 5561 7.63% 116.02% $64,855 Middle Income
5562 9.96% 122.77% $68,628 Upper Income
5563 6.33% 145.14% $81,133 Upper Income
5564 10.92% 218.91% $122,371 Upper Income
5565 5.87% 150.64% $84,208 Upper Income
5566 4.21% 190.37% $106,417 Upper Income
5567 4.89% 164.33% $91,860 Upper Income
5568 4.97% 169.55% $94,778 Upper Income
5569 7.21% 154.00% $86,086 Upper Income
5570 11.73% 117.29% $ 65,565 Middle Income
5571 9.02% 139.46% $77,958 Upper Income
5572 4.70% 139.46% $77,958 Upper Income
5573 4.13% 165.29% $92,397 Upper Income
5574 3.79% 169.58% $94,795 Upper Income
5575 4.47% 178.73% $99,910 Upper Income
5576 6.05% 190.98% $106,758 Upper Income
5577 2.63% 139.27% $77,852 Upper Income
5579 4.38% 171.88% $96,081 Upper Income
5580 4.99% 155.02% $86,656 Upper Income
5581 4.73% 149.75% $83,710 Upper Income
5582 6.28% 122.92% $68,712 Upper Income
5583 6.59% 108.24% $60,506 Middle Income
5584 5.89% 161.17% $90,094 Upper Income
5585 4.47% 138.58% $77,466 Upper Income
5586 6.55% 140.90% $78,763 Upper income
5587 4.64% 157.20% $87,875 Upper Income
5588 4.14% 128.32% $71,731 Upper Income
5589 4.89% 127.46% $71,250 Upper Income
5590 5.15% 128.09% $71,602 Upper Income
5591 5.67% 130.02% $72,681 Upper Income
5592 5.60% 123.78% $69,193 Upper income
Redford Township 5541 9.92% 110.32% $61,669 Middle Income
5542 8.72% 104.07% $58,175 Middle Income
5543 5.73% 115.77% $64,715 Middle Income
5544 7.32% 107.12% $59,880 Middle Income
5545 12.17% 92.0% $51,428 Middle Income
5546 5.13% 114.9% $64,229 Middle Income
5547 5.72% 129.38% $72,323 Upper Income
5548 27.65% 127.73% $71,401 Upper Income
5549 14.06% 119.82% $66,979 Middle Income
5551 7.04% 114.76% $64,151 Middle Income
5553 16.04% 124.99% $69,869 Upper Income
5554 56.02% 118.7% $66,353 Middle Income
5555 16.83% 115.29% $64,447 Middle Income
5556 5.41% 125.57% $70,194 Upper Income
Westland 5651 14.08% 85.14% $47,593 Middle income
5652 24.71% 127.82% $71,451 Upper Income
5653 25.42% 95.58% $53,429 Middle Income
5654 25.29% 93.57% $52,306 Middle Income
5655 8.15% 98.43% $55,022 Middle Income
5656 7.55% 162.82% $91,016 Upper Income
5657 14.19% 163.14% $91,195 Upper Income
5658 7.66% 113.03% $63,184 Middle Income
5659 11.02% 120.12% $67,147 Upper Income
5670 41.95% 93.27% $52,138 Middle Income
5671 11.71% 90.04% $50,332 Middle Income
5672 10.78% 116.92% $65,358 Middle Income
5673 10.32% 128.63% $71,904 Upper Income
5674 5.31% 121.96% $68,176 Upper income
5678 12.39% 115.74% $64,699 Middle Income
5679 6.94% 115.76% $64,710 Middle income
5680 10.26% 146.71% $82,011 Upper Income
5682 8.13% 121.59% $67,969 Upper Income
5683 9.05% 107.37% $60,020 Middle Income
5684 6.04% 119.98% $67,069 Middle Income
5685 11.02% 77.92% $43,557 Mod. Income
5687 21.24% 116.79% $65,286 Middle Income
Source: 2010 Census Report, Obtained from Government Website www.ffiec.gov

17
Maps 6 – 8 geographically display the concentrations of non-white persons for census tracts within each community. It should be noted that the source for these maps is PolicyMap, which uses American Community Survey data for 2005-2009. It is possible that the data portrayed in the maps do not align with the data shown in Table 14, especially with the slightly changed grouping of “non-white persons” as opposed to “minority residents”. Map 6 shows that the focus of census tracts in Livonia that have a greater than average (for the City) percentage of “non-white person” can be found primarily in the northeast corner. From Map 6 we can see that census tracts 5562, 5570, 5571, and 5582 have a non-white population of over 13.45%. This is substantially different from the data presented in Table 14. For Redford Twp, census tracts with greater than 25.88% non-white residents are located along the Township’s eastern Detroit border. Map 8 displays that Westland’s northwest and southeast corners have a greater percentage of non-white persons as compared to the rest of the City.
Map 6 City of Livonia: Race as a Percent of Non-White Persons (2005-2009)
5.74% or less 5.75% - 13.44% 13.45% - 25.87% 25.88% - 49.38% 49.39% or more
Source: Census, ACS 2005-2009
Map 7 Redford Twp: Race as a Percent of Non-White Persons (2005-2009)
5.74% or less 5.75% - 13.44% 13.45% - 25.87% 25.88% - 49.38% 49.39% or more
Source: Census, ACS 2005-2009

18
Map 8 Westland: Race as a Percent of Non-White Persons (2005-2009)
5.74% or less 5.75% - 13.44% 13.45% - 25.87% 25.88% - 49.38% 49.39% or more Source: Census, ACS 2005-2009
Population with a Disability Disability is defined by the Census Bureau as a lasting physical, mental, or emotional condition that makes it difficult for a person to do activities or impedes them from being able to go outside the home alone or to work. Defined in this fashion, the AI Study Area’s disabled population comprised 37,068 persons aged 5 or older during the 2000 census. Table 15 shows that all three communities had an individual and combined disability rate less than both Wayne County and the State of Michigan. However, both Redford and Westland have a significantly higher disability rate than Livonia. The availability of accessible housing plays a role in housing choice, as does the availability of disability services and related facilities.
Table 15 Disability status (population 5 years and over)
CENSUS 2000
PERCENT
Livonia 13,307 14.2%
Redford 8,688 18.1%
Westland 15,073 18.9%
Wayne County 433,933 23%
State of Michigan 1,711,231 21.8%
Source: Census 2000 Maps 9–11 present detailed maps of each of the AI Study Area communities and reveal that there were numerous areas and census tracts with a higher percentage of disabled persons than the community average. Map 9 displays that within the City of Livonia, there were three census tracts with a concentration of disabled persons between 15.9% and 18.6%. Map 10 displays that Redford Township also has three census tracts with a concentration of disabled persons between 19.4% and 21.5%. These census tracts had a higher concentration of disabled persons than the Township average, but below the averages of Wayne County and the State of Michigan. Map 11 shows that the City of Westland has one census tract (5670) that has a significant concentration of disabled persons – well above both the county and state averages. This census tract’s concentration of 34.6% disabled persons is significant and should be further analyzed to determine the cause and potential reason for its disproportion. Also, since this data is over ten years old it is recommended that all three communities analyze 2010 data to see if any significant changes have occurred over this time – especially within those census tracts with high concentrations than the community and state averages.

19
Map 9 Livonia: Disability status (population 5 years and over)
Source: Census 2000
Map 10
Redford Twp: Disability status (population 5 years and over)
Source: Census 2000
Map 11 Westland: Disability status (population 5 years and over)
Source: Census 2000

20
HOUSING Housing Market Characteristics Housing in the study area is primarily comprised of single-family detached units. This is especially true in Livonia and in Redford Township where 88% and 93% of the housing units respectively are single-family. Although the primary housing type in Westland is also single-family, it has a much greater amount of condominiums, apartments, and duplexes, which comprise 41% of the city’s total housing stock. Additionally, Westland has a greater number of mobile and manufactured
homes, which comprises 5% of its total housing units. See the below table for additional information.
Table 16 Housing Units by Unit Type: Census 2000
SINGLE FAMILY
DUPLEX TOWNHOUSE/CONDO
MULTI-UNIT APARTMENT
MOBLE/MANU. HOUSING
OTHER
Livonia 33,947 69 843 3,753 56 0
Redford Twp. 19,207 101 207 881 209 0
Westland 21,345 577 2,788 12,243 1,101 22
Source: Census 2000 Much of the housing is the study area is older, especially in Redford Township where the average median year of construction is 1954. The majority of single-family owner-occupied housing construction in all three communities occurred between 1950 and 1970. During this twenty-year period 60% of Livonia’s current housing stock, 76% of Redford’s housing stock, and 54% of Westland’s housing stock were constructed. In Redford Township roughly 85% of all single family homes were constructed before 1960 and these units reflect the size and configuration patterns characteristic of that era. In all three communities the majority of housing units were constructed before 1970 and are very likely to require ongoing maintenance and system upgrades to remain in good repair. These units are generally the most affordable, but are also the most vulnerable to deterioration. This remains a major concern. Livonia and Westland experienced continued housing development in the 1990s and early 2000s. In Livonia, 10% of its owner-occupied housing stock was constructed after 1990, while in Westland 14% was constructed. All three communities have seen a slowing of construction in the last five years due to a combination of factors including the national foreclosure crisis that began in 2006 and the general souring of the regional economy.
Table 17
Year of Housing Construction LIVONIA REDFORD WESTLAND Age of Structure
Owner # %
Renter # %
Owner # %
Renter # %
Owner # %
Renter # %
2005 or later 187 0.6% 11 0.3% 44 0.3% 26 1.4% 300 1.4% 45 0.5%
2000-2004 771 2.5% 12 0.3% 165 1.0% 63 3.4% 792 3.7% 240 2.5%
1990-1999 2,068 6.7% 266 7.4% 150 0.9% 175 9.4% 2,710 12.5% 1,026 10.5%
1980-1989 2,125 6.9% 672 18.7% 140 0.9% 74 3.9% 1,307 6.0% 1,702 17.4%
1970 – 1979 4,179 13.5% 1,014 28.2% 502 3.2% 153 8.2% 2,607 12.0% 2,757 28.3%
1960 – 1969 8,324 26.9% 596 16.5% 1,463 9.2% 236 12.6% 4,769 22.0% 1,748 17.9%
1950 – 1959 10,077 32.6% 745 20.7% 9,754 61.4% 756 40.4% 6,917 31.9% 1,186 12.2%
1940 – 1949 1,840 5.9% 104 2.9% 2,478 15.6% 223 11.9% 1,510 7.0% 684 7.0%
1939 or earlier 1,295 4.2% 180 5.0% 1,187 7.5% 164 8.8% 725 3.4% 366 3.8%
Total 30,866 100% 3,600 100% 15,883 100% 1,870 100% 21,637 100% 9,754 100% Median Year of Cons.
1963
1972
1954
1957
1963
1973
Source: U.S. Census, 2005-2009 American Community Survey Table 17 also shows that Westland has a much greater concentration of rental housing (9,754 units) as compared to the other two communities. Like the owner-occupied housing, the rental units are also relatively old, with Livonia’s median year of construction occurring in 1972, Redford’s in 1957, and Westland’s in 1973. The City of Westland has one of the highest proportions of rental units found in Metropolitan Detroit, with 35% of its housing units being rentals. Additionally, the number of rentals in Westland has more than doubled since 1970 with the construction of 5,770 rental units.
Table 18 shows that all three communities experienced fewer new housing units between 2000 and 2010 as compared with either Wayne County or Metropolitan Detroit. This reflects the current trend regionally and nationally towards new construction in the suburban fringes and outside of the inner-ring urban core.

21
Table 18 Housing Units in AI Study Area
HOUSING UNITS
2000
HOUSING UNITS
2010 % CHANGE
2000-2010 Livonia 38,658 40,401 4.5%
Redford Township 20,605 20,739 0.7%
Westland 38,077 39,201 3%
Outer-Wayne County 451,049 472,523 4.8%
Metropolitan Detroit 1,951,898 2,060,749 5.6%
Source: SEMCOG Community Profile Data – April 2011 The residential vacancy rate has more than doubled in each of the three communities, with Redford Township seeing the largest change in vacancy - from 2.1% in 2000 to 7.7% in 2010. In 2010, Redford had 1,168 more vacant homes than in 2000. This rather drastic increase in vacant units is not unique to the study area, and in fact Metropolitan Detroit’s 2010 vacancy rate is 10.5%. The substantial increase in vacant housing in the AI Study Area greatly impacts the ability of each community to maintain and provide quality public services to their residents as each rely on property tax revenue as the key source of funding. Additionally, the significance of a doubling in the vacancy rate in both the AI Study Area and the larger region points towards a loss of demand for housing and an overall weakening of the local housing market.
Table 19 Vacancy in AI Study Area
VACANT UNITS
2000
VACANT UNITS
2010 CHANGE
2000-2010
RESIDENTIAL VACANCY RATE
2000
RESIDENTIAL VACANCY RATE
2010 Livonia 569 1,687 1,118 1.5% 4.2% Redford Township 423 1,591 1,168 2.1% 7.7% Westland 1,544 3,315 1,771 4.1% 8.5% Outer-Wayne County 19,037 39,219 20,182 4.2% 8.3% Metropolitan Detroit 106,680 215,991 109,311 5.5% 10.5%
Source: SEMCOG Community Profile Data – May 2011 The majority of home owners moved into their home during the 1990s with the median year of all three communities being 1995. During this 15 year period, 62% of Livonia, 65% of Redford, and 68% of Westland owners moved into their current unit. This relatively new concentration of owners likely reflects that there is a demand for the supply of affordable housing for starting and first-time homebuyer households. Some units have been purchased by persons of modest means, who may or may not have the means to maintain them; others are still owned by their original occupants, who no longer have either the physical or financial ability to maintain them properly; while still others are rented. The result is that these units are subject to significant deterioration absent major investments in repair. Additionally the three communities have homes that are now old enough that construction styles, floor plans, the amount of living area, and other amenities offered may not always reflect contemporary preferences among homebuyers. This drives middle-income households, who can maintain and upgrade such units, to other neighborhoods and maybe even to other communities. It also comes just when these homes and neighborhoods require active and aggressive maintenance, and significant levels of investment, to maintain viability. See Table 20 for further detail.
Table 20 Duration of Occupancy
LIVONIA REDFORD WESTLAND Moved Into Unit
Owner # %
Renter # %
Owner # %
Renter # %
Owner # %
Renter # %
2005 or later 2,893 9% 1,616 45% 1,782 11% 824 44% 2,765 13% 5,057 52%
2000 - 2004 7,033 23% 1,138 32% 4,082 26% 679 36% 5,333 25% 3,092 32%
1990 – 1999 9,303 30% 556 15% 4,394 28% 229 12% 6,583 30% 1,129 12%
1980 – 1989 4,509 15% 168 5% 2,050 13% 90 5% 2,358 11% 262 3%
1970 – 1979 3,556 12% 56 2% 1,559 10% 23 1% 2,191 10% 169 2%
Before 1969 3,572 12% 76 2% 2,016 13% 25 1% 2,407 11% 45 1%
Total 30,866 100% 3,600 100% 15,883 100% 1,870 100% 21,637 100% 9,754 100% Median Year of Move
1994
2004
1995
2004
1996
2005+
Source: 2005-2009 American Community Survey

22
All three communities have strategies in place to address the aging housing stock. Older housing typically needs maintenance and repair, for which housing rehabilitation programs have been set up. The City of Livonia offers income eligible residents loans from $1,500 - $15,000 for major home improvements to bring the home up to applicable city building codes. For minor home repair improvements, the city provides up to $1,500 in grant awards. In Redford Township income eligible households and eligible homeowners may qualify for both major and minor home repairs. These repairs are secured by installation payment loans and deferred payment loans, not to exceed $5,000. Redford also offers loans or grants to qualified low and moderate income homeowners for limited repairs of hazardous housing conditions through an Emergency Rehabilitation Program. The City of Westland provides both general home rehabilitation and emergency home rehabilitation grants, loans, or deferred loans to low and moderate income homeowners. Additionally, matching grants are available for rehabilitation improvements of sub-standard rental units.
Unfortunately, the difficulty of housing repair and maintenance of units constructed pre-1978 is compounded by special hazards (e.g. lead-based paint), which add complexity to the process and increases overall costs. The result is that the amount of required private and/or public investment for these properties is significant. Each community should therefore monitor these conditions as the housing stock continues to age. Certain areas in all three jurisdictions have been determined to be functionally and/or physically obsolete, and redevelopment of improper and/or obsolete land uses has been adopted in a limited number of instances. Additional redevelopment projects are possible in all three communities. This may provide opportunities for the development of new and affordable housing.
As expected considering the loss of population and increase in vacancy rate of the AI Study Area, owner-occupied housing decreased in all three communities. Redford Twp experienced the greatest decline in owner-occupied housing, losing 2,430 units between 2000 and 2010. The declines experienced by both Livonia and Westland align with the losses experienced throughout outer-Wayne County and the Metropolitan Detroit region. However, it should be noted that both Livonia and Redford Twp have a greater concentration of owner-occupied housing as compared to the larger region, while Westland is well below the average for both the county and the region. Table 21 also shows that as a whole the three-community AI Study Area lost a total of 3,666 owner-occupied housing units, which represent 36% of the total loss of outer-Wayne County.
Table 21 Owner-Occupied Housing
OWNER-OCCUPIED
2000
OWNER-OCCUPIED
2010 CHANGE
2000-2010 PERCENT OWNER-
OCCUPIED 2010 Livonia 33,808 33,394 (414) 83%
Redford Township 18,183 15,753 (2,430) 76%
Westland 22,901 22,079 (822) 56%
Outer-Wayne County 327,190 316,976 (10,214) 67%
Metropolitan Detroit 1,324,468 1,296,000 (28,468) 63%
Source: SEMCOG Community Profile Data – May 2011 Renter occupied housing units increased significantly in all three communities within the AI Study Area. The greatest increase in renter occupied housing occurred in Redford Township where the percentage of renter occupied housing increased from 9.7% in 2000 to slightly over 16% in 2010. Table 22 shows that the City of Westland has the highest concentration of renter occupied housing units within the AI Study Area and is well above both the county and regional averages. Livonia saw a less-significant increase in renter-occupied housing.
Table 22
Renter-Occupied Units
RENTER OCCUPIED
2000
RENTER-OCCUPIED
2010 CHANGE
2000-2010 PERCENT RENTER-
OCCUPIED 2010 Livonia 4,281 5,320 1,039 13%
Redford Township 1,999 3,395 1,396 16%
Westland 13,632 13,807 175 35%
Outer-Wayne County 104,822 116,328 11,506 25%
Metropolitan Detroit 520,845 548,758 27,913 27%
Source: 2005-2009 American Community Survey
23
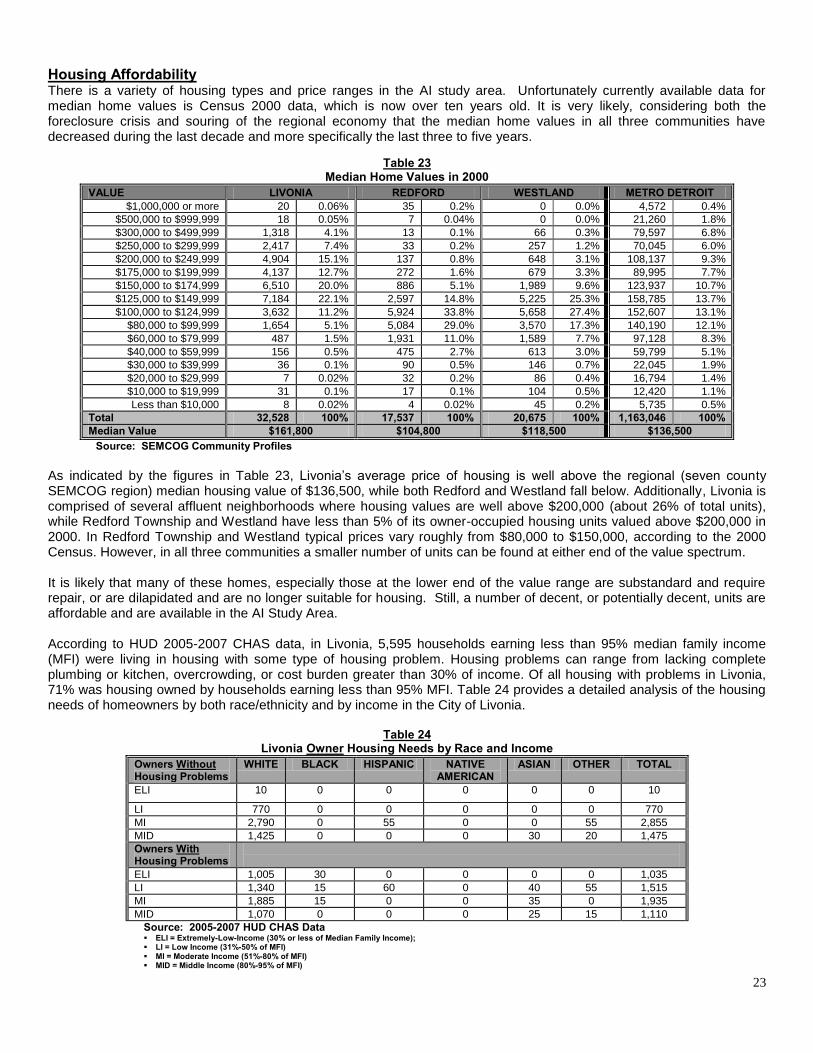
Housing Affordability There is a variety of housing types and price ranges in the AI study area. Unfortunately currently available data for median home values is Census 2000 data, which is now over ten years old. It is very likely, considering both the foreclosure crisis and souring of the regional economy that the median home values in all three communities have decreased during the last decade and more specifically the last three to five years.
Table 23 Median Home Values in 2000
VALUE LIVONIA REDFORD WESTLAND METRO DETROIT $1,000,000 or more 20 0.06% 35 0.2% 0 0.0% 4,572 0.4%
$500,000 to $999,999 18 0.05% 7 0.04% 0 0.0% 21,260 1.8%
$300,000 to $499,999 1,318 4.1% 13 0.1% 66 0.3% 79,597 6.8%
$250,000 to $299,999 2,417 7.4% 33 0.2% 257 1.2% 70,045 6.0%
$200,000 to $249,999 4,904 15.1% 137 0.8% 648 3.1% 108,137 9.3%
$175,000 to $199,999 4,137 12.7% 272 1.6% 679 3.3% 89,995 7.7%
$150,000 to $174,999 6,510 20.0% 886 5.1% 1,989 9.6% 123,937 10.7%
$125,000 to $149,999 7,184 22.1% 2,597 14.8% 5,225 25.3% 158,785 13.7%
$100,000 to $124,999 3,632 11.2% 5,924 33.8% 5,658 27.4% 152,607 13.1%
$80,000 to $99,999 1,654 5.1% 5,084 29.0% 3,570 17.3% 140,190 12.1%
$60,000 to $79,999 487 1.5% 1,931 11.0% 1,589 7.7% 97,128 8.3%
$40,000 to $59,999 156 0.5% 475 2.7% 613 3.0% 59,799 5.1%
$30,000 to $39,999 36 0.1% 90 0.5% 146 0.7% 22,045 1.9%
$20,000 to $29,999 7 0.02% 32 0.2% 86 0.4% 16,794 1.4%
$10,000 to $19,999 31 0.1% 17 0.1% 104 0.5% 12,420 1.1%
Less than $10,000 8 0.02% 4 0.02% 45 0.2% 5,735 0.5%
Total 32,528 100% 17,537 100% 20,675 100% 1,163,046 100% Median Value $161,800 $104,800 $118,500 $136,500
Source: SEMCOG Community Profiles As indicated by the figures in Table 23, Livonia’s average price of housing is well above the regional (seven county SEMCOG region) median housing value of $136,500, while both Redford and Westland fall below. Additionally, Livonia is comprised of several affluent neighborhoods where housing values are well above $200,000 (about 26% of total units), while Redford Township and Westland have less than 5% of its owner-occupied housing units valued above $200,000 in 2000. In Redford Township and Westland typical prices vary roughly from $80,000 to $150,000, according to the 2000 Census. However, in all three communities a smaller number of units can be found at either end of the value spectrum. It is likely that many of these homes, especially those at the lower end of the value range are substandard and require repair, or are dilapidated and are no longer suitable for housing. Still, a number of decent, or potentially decent, units are affordable and are available in the AI Study Area. According to HUD 2005-2007 CHAS data, in Livonia, 5,595 households earning less than 95% median family income (MFI) were living in housing with some type of housing problem. Housing problems can range from lacking complete plumbing or kitchen, overcrowding, or cost burden greater than 30% of income. Of all housing with problems in Livonia, 71% was housing owned by households earning less than 95% MFI. Table 24 provides a detailed analysis of the housing needs of homeowners by both race/ethnicity and by income in the City of Livonia.
Table 24 Livonia Owner Housing Needs by Race and Income
Owners Without Housing Problems
WHITE BLACK HISPANIC NATIVE AMERICAN
ASIAN OTHER TOTAL
ELI 10 0 0 0 0 0 10
LI 770 0 0 0 0 0 770
MI 2,790 0 55 0 0 55 2,855
MID 1,425 0 0 0 30 20 1,475
Owners With Housing Problems
ELI 1,005 30 0 0 0 0 1,035
LI 1,340 15 60 0 40 55 1,515
MI 1,885 15 0 0 35 0 1,935
MID 1,070 0 0 0 25 15 1,110
Source: 2005-2007 HUD CHAS Data ELI = Extremely-Low-Income (30% or less of Median Family Income); LI = Low Income (31%-50% of MFI) MI = Moderate Income (51%-80% of MFI) MID = Middle Income (80%-95% of MFI)

24
Of Redford’s 17,405 total owner households 30% experienced some type of housing problem. Of this 30%, over 70% were households whose income was less than 95% of median family income for the region. Table 25 provides a detailed analysis of the housing needs of homeowners by both race/ethnicity and by income.
Table 25 Redford Owner Housing Needs by Race and Income
Owners Without Housing Problems WHITE BLACK HISPANIC
NATIVE AMERICAN ASIAN OTHER TOTAL
ELI 55 0 0 0 10 0 65
LI 765 35 0 0 0 0 805
MI 1,580 40 0 10 0 1,630
MID 1,035 85 0 0 0 15 1,135
Owners With Housing Problems
ELI 635 240 30 10 0 15 935
LI 685 170 15 0 40 20 935
MI 1,440 285 20 0 0 0 1,765
MID 260 95 80 0 0 40 480
Source: 2005-2007 HUD CHAS Data Of Westland’s 23,135 total owner households (according to 2005-2007 HUD CHAS data) 28% experienced some type of housing problem. Of this 28%, over 80% were households whose income was less than 95% of median family income for the region. Table 26 provides a detailed analysis of the housing needs of homeowners by both race/ethnicity and by income.
Table 26 Westland Owner Housing Needs by Race and Income
Owners Without Housing Problems
WHITE
BLACK
HISPANIC
NATIVE AMERICAN
ASIAN
OTHER
TOTAL
ELI 120 0 0 0 0 0 120
LI 810 30 25 0 0 0 860
MI 2,310 75 50 15 0 0 2,310
MID 1,445 95 0 0 0 0 1,540
With Housing Problems
ELI 1,175 45 0 20 4 20 1,265
LI 950 70 90 0 25 45 1,185
MI 1,770 25 130 0 25 15 1,960
MID 705 80 0 0 0 15 800
Source: 2005-2007 HUD CHAS Data Table 27 shows that the City of Westland has the most affordable rents of the three communities and are likely at or below the fair market rent for Wayne County as established by HUD for fiscal years 2005 and 2011 (Table 28).
Table 27
Year 2005-2009 Rental Rates for Renter-Occupied Housing Units CONTRACT RENT
LIVONIA # %
REDFORD # %
WESTLAND # %
< $200 99 3% 28 1.6% 147 1.6%
$200 - $299 133 4% 10 0.6% 253 2.7%
$300 - $499 321 9.7% 70 4.1% 641 6.8%
$500 - $749 684 20.6% 450 26.2% 3,435 36.5%
$750 - $999 1,245 37.4% 447 26.1% 3,322 35.3%
$1,000 - $1,499 556 16.7% 612 35.7% 1,109 11.8%
>$1,500 288 8.7% 98 5.7% 513 5.4%
No Rent Paid 274 N/A 155 N/A 334 N/A
Total Units 3,326 100% 1,715 100% 9,420 100% Median Rent $820.00 $933.00 $758.00
Source: 2005-2009 American Community Survey

25
Table 28 Fair Market Rent (Wayne County, MI)
Fair Market Rents (FMR’s) 2005 2011 Efficiency $606 $594
One-Bedroom $670 $676
Two-Bedroom $805 $809
Three-bedroom $962 $968
Four-Bedroom $992 $997
Source: 2005-2009 ACS; HUDuser.org A look at minority renter housing needs in each community will further inform our study of rental housing conditions in each community, and the reader is referred to the following three tables for data on minority needs, as well as the entire population, in order to identify any significant differences in need. Table 29 provides the renter housing needs by race and income for the City of Livonia. According to HUD-CHAS data, of Livonia’s 3,745 renter households, 1,860 (50%) had some degree of housing problems. Housing problems can range from lacking complete plumbing or kitchen, overcrowding, or cost burden greater than 30% of income. Additionally, of the 3,745 renter households, 2,295 are ELI, LI, or MI. That means that 61% of all renters in the City could, depending on the condition of their unit or the proportion of rent they pay, be in need of some kind of housing assistance. There does not appear to be a disproportionate number of ELI or LI minority renter households in Livonia, given the extent of total need. A total of 150 Black households and 80 Hispanic households were living in a unit that had one or more housing problems.
Table 29 Livonia Renter Housing Needs by Race and Income
Renters Without Housing Problems WHITE BLACK HISPANIC
NATIVE AMERICAN ASIAN OTHER TOTAL
ELI 105 0 0 0 0 0 105
LI 255 0 0 0 0 0 255 MI 105 80 35 0 0 0 220 MID 220 20 0 0 0 0 240 Renters With Housing Problems
ELI 540 45 0 0 0 25 605 LI 570 50 60 0 0 15 695 MI 340 55 20 0 0 0 415 MID 70 0 0 0 0 0 70 Source: 2005-2007 HUD CHAS Data ELI = Extremely-Low-Income (30% or less of Median Family Income); LI = Low Income (31%-50% of MFI) MI = Moderate Income (51%-80% of MFI) MID = Middle Income (80%-95% of MFI)
Table 30 provides the renter housing needs by race and income for Redford Twp. According to HUD-CHAS data, of Redford’s 1,955 renter households, 940 (48%) had some degree of housing problems. Additionally, of the 1,955 renter households, 1,180 are ELI, LI, or MI. That means that 60% of all renters in Redford could, depending on the condition of their unit or the proportion of rent they pay, be in need of some kind of housing assistance. There does appear to be a disproportionate number of ELI Black renter households in Redford, living with housing problems. Of the total 385 ELI renters with housing problems, 190 (or 50%) were Black.
Table 30 Redford Renter Housing Needs by Race and Income
Renters Without Housing Problems WHITE BLACK HISPANIC
NATIVE AMERICAN ASIAN OTHER TOTAL
ELI 45 0 0 0 0 0 45
LI 40 15 0 10 0 0 70 MI 160 0 0 10 0 0 175 MID 135 0 145 0 0 0 280 Renters With Housing Problems
ELI 195 190 0 0 0 25 385 LI 290 50 0 0 0 20 360 MI 100 35 0 10 0 15 145 MID 15 20 0 0 0 0 35
Source: 2005-2007 HUD CHAS Data

26
Table 31 provides the renter housing needs by race and income for the City of Westland. According to HUD-CHAS 2005-2007 data, of Westland’s 11,955 renter households, 4,845 (41%) had some degree of housing problems. Additional ly, of the 11,955 renter households, 5,040 are ELI, LI, or MI. That means that 42% of all renters in Westland could, depending on the condition of their unit or the proportion of rent they pay, be in need of some kind of housing assistance. There does not appear to be a disproportionate number of ELI or LI minority renter households in Livonia, given the extent of total need. A total of 655 ELI or LI Black households and 190 Hispanic ELI or LI households were living within a unit that had one or more housing problems.
Table 31 Westland Renter Housing Needs by Race and Income
Renters Without Housing Problems WHITE BLACK HISPANIC
NATIVE AMERICAN ASIAN OTHER TOTAL
ELI 220 15 0 0 0 0 235
LI 355 50 0 0 0 0 405 MI 1,145 660 40 0 85 10 1,940 MID 500 330 4 0 15 0 855 Renters With Housing Problems
ELI 1,655 445 105 0 15 40 2,255
LI 1,095 210 85 45 0 95 1,550 MI 580 325 15 0 0 0 920 MID 30 45 0 0 25 0 100
Source: 2005-2007 HUD CHAS Data It should be noted that there are some adverse living conditions in rental housing in the study area, but these are not found specifically in minority-inhabited areas. This is probably due to the tendency of renter households to have less income than owner households. All three communities are working to provide owner housing opportunities for those who currently rent. The generally accepted definition of affordability, according to HUD, is for a household to pay no more than 30% of its annual income on housing. Families who pay more than 30% of their income for housing are considered cost burdened and may have difficulty affording necessities such as food, clothing, transportation and medical care. The lack of affordable housing is a significant hardship for low-income households preventing them from meeting their other basic needs, such as nutrition and healthcare, or saving for their future and that of their families. Over the past few years, housing prices in Southeast Michigan have dropped below income which has made more and more housing in the region affordable to more residents. Figure 2 displays the “bursting of the housing bubble” in Southeast Michigan and the fact that housing values are currently well below income growth. Although it may be logical to assume that housing is now affordable to more and more residents, there are several downward pressures that keep housing out of reach to many families and keep homeowners from maintaining homes to a high standard. Primarily in the region and in the AI study area, there are too many foreclosures, too high of vacancy rates, and too few employed workers in the labor force.
Figure 2 Detroit MSA, Housing Value Forecast for 2011-2012
Source: SEMCOG
0
50
100
150
200
250
19
90
19
92
19
94
19
96
19
98
20
00
20
02
20
04
20
06
20
08
20
10
20
12
Housing Prices Income

27
In order to gain a more accurate picture of affordability in the AI Study Area, it is helpful to look at the combined cost of housing and transportation. The H+T Affordability Index, which was developed to “measure the true affordability of housing choice” in the country, has been chosen as a source to analyze this combined cost. Of particular interest is the alignment of housing and transportation costs in analyzing a family’s ability to access housing in metro areas. Figures 3 – 5 show the percent of income residents in each of the three communities spend on housing costs and on the combination of housing and transportation costs. According to the H+T Affordability Index there are no households in Redford Township that are paying greater than 30% of their income on housing, while only 2.9% of households in Westland pay greater than 30% of their income on housing. In both communities, the addition of transportation costs to the affordability measure substantially increases the number of households with affordability problems. In Redford, 16.4% of households and in Westland, 14.2% of households pay more than 45% of income on the combination of housing and transportation. In Livonia, 26.8% of households pay greater than 30% of their income on housing, while a vast majority (68.6%) of households pays greater than 45% of their income on the combination of housing and transportation.
Figure 3 Livonia: Housing Costs - % Income Livonia: Housing + Transportation Costs - % Income
Households % of Households
Households % of Households
Less than 30% 27,940 73.2%
Less than 45% 11,994 31.4%
30% and Greater 10,206 26.8% 45% and Greater 26,151 68.6%
Livonia Total 38,146 100% Livonia Total 38,146 100%
Source: H+T Affordability Index - http://htaindex.cnt.org/

28
Figure 4
Redford: Housing Costs - % Income Redford: Housing + Transportation Costs - % Income
Households % of Households
Households % of Households Less than 30% 20,201 100% Less than 45% 16,881 83.6%
30% and Greater 0 0% 45% and Greater 3,321 16.4%
Redford Total 20,201 100% Redford Total 20,201 100%
Source: H+T Affordability Index - http://htaindex.cnt.org/
Figure 5 Westland: Housing Costs - % Income Westland: Housing + Transportation Costs - % Income
Households % of Households
Households % of Households Less than 30% 35,427 97.1% Less than 45% 31,323 85.8%
30% and Greater 1,075 2.9% 45% and Greater 5,179 14.2%
Westland Total 36,503 100% Westland Total 36,503 100%
Source: H+T Affordability Index - http://htaindex.cnt.org/

29
When compared to the Detroit MSA, households in Redford Twp and Westland are paying substantially less of their income on both housing costs and the combined costs of housing and transportation. Figure 6 shows the full Detroit MSA affordability index. According to the H+T Affordability Index Livonia’s households pay a greater percentage of income on housing and the combined costs of housing and transportation. This may show that for the City of Livonia the cost of housing may an impediment to low and moderate income families. Within the Detroit MSA, 21.7% of households pay more than 30% of income on housing costs. Geographically the heaviest concentration of households who pay greater than 30% of income on housing costs are located in Oakland County and northern Macomb County. And generally speaking the further a household is located from an employment hub the greater the probability that housing costs could be an issue for households. Geographically, much of the region pays more than 45% of income on the combined costs of housing and transportation. However, since Wayne County and the areas immediately surrounding the City of Detroit generally have a higher concentration and density of households the total percentage of households paying greater than 45% of income on the combined costs of housing and transportation is relatively low at 39.4%.
Figure 6 Detroit MSA: Housing Costs - % Income Detroit MSA: Housing + Transportation Costs - % Income
Households % of Households
Households % of Households
Less than 30% 1,326,746 78.3%
Less than 45% 1,027,232 60.6%
30% and Greater 368,585 21.7% 45% and Greater 668,045 39.4%
Detroit MSA Total 1,695,331 100% Detroit MSA Total 1,695,331 100% Source: H+T Affordability Index - http://htaindex.cnt.org/ While Figures 3-6 show the geographic distribution of housing affordability in the AI Study Area and the larger region, they do not show which types of households pay a greater percentage of income on housing and transportation costs. Not surprisingly in all three communities owner-households pay on average a greater percentage of income on the combined costs of housing and transportation. Once again, Livonia has the greatest percentage of both owners and renters paying more than 45% of income on the combined costs of housing and transportation. Figures 7-9 show that Redford households pay a lower percent of income on housing and transportation, while Westland has pockets of neighborhoods where households are paying above 45% of income on the combined costs.

30
Figure 7 Livonia: Housing + Transportation, % Income for Owners Livonia: Housing + Transportation, % Income for Renters
Households % of Households
Households % of Households No Data Available 21 0.1% No Data Available 7,811 20.5%
Less than 40% 38 0.1% Less than 37% 10,426 27.3%
40 to 45% 7,049 18.5% 37 to 42% 10,644 27.9%
45 to 50% 17,230 45.2% 42 to 48% 3,830 10%
50 to 60% 11,972 31.4% 48 to 55% 3,630 9.5%
60% and Greater 1,836 4.8% 55% and Greater 1,804 4.7%
Livonia Total 38,146 100% Livonia Total 38,146 100%
Source: H+T Affordability Index - http://htaindex.cnt.org/ Figure 8 Redford: Housing + Transportation, % Income for Owners Redford: Housing + Transportation, % Income for Renters
Households % of Households
Households % of Households No Data Available 0 0% No Data Available 3,008 14.9%
Less than 40% 4,117 20.4% Less than 37% 10,858 53.7%
40 to 45% 12,494 61.8% 37 to 42% 4,566 22.6%
45 to 50% 3,590 17.8% 42 to 48% 1,505 7.5%
50 to 60% 0 0% 48 to 55% 264 1.3%
60% and Greater 0 0% 55% and Greater 0 0%
Redford Total 20,202 100% Redford Total 20,202 100%
Source: H+T Affordability Index - http://htaindex.cnt.org/

31
Figure 9 Westland: Housing + Transportation, % Income for Owners Westland: Housing + Transportation, % Income for Renters
Households % of Households
Households % of Households No Data Available 0 0% No Data Available 1,972 5.4%
Less than 40% 8,700 23.8% Less than 37% 21,793 59.7%
40 to 45% 13,951 38.2% 37 to 42% 10,052 27.5%
45 to 50% 8,917 24.4% 42 to 48% 2,685 7.4%
50 to 60% 4,935 13.5% 48 to 55% 0 0%
60% and Greater 0 0% 55% and Greater 0 0%
Westland Total 36,503 100% Westland Total 36,503 100%
Source: H+T Affordability Index - http://htaindex.cnt.org/
It should be noted that although the addition of transportation costs to housing affordability does provide a “better” picture of the true costs, there are other costs to be considered, for example, the direct and indirect costs of living in higher poverty vs. lower poverty communities. Additionally, when evaluating neighborhood costs and benefits, indirect factors such as quality of local schools, access to employment, exposure to environmental hazards, exposure to crime, health outcomes, and quality of municipal and social services, should also be considered. An examination of these “other” factors are explored in Section IV of this AI.
Homeownership may also be difficult for many lower-income and lower-income minority households to achieve in many segments of the market. Unable to afford the costs of homeownership and other necessities, they may find renting or home-sharing to be more realistic options. The cost of homeownership, while not an impediment to fair housing per se, certainly affects the ability of many minority households to obtain decent housing.

32
Foreclosures Southeast Michigan has been hit particularly hard by the foreclosure crisis. While accounting for 40% of Michigan’s total population, the tri-county area of Macomb, Oakland, and Wayne Counties accounted for 63% of all foreclosure notices in the state as of May 2008. Each of the three communities has been adversely impacted by a dramatic increase in foreclosures beginning in 2006 and continuing today. Table 32 shows that the foreclosure crisis hit each community hard, and according to HUD the tri-community area had a joint foreclosure start rate of 6.9%. Neighborhoods in Redford Township and Westland were hit particularly hard and as of February 2011 the housing foreclosure rates for these communities were 1 in 20 and 1 in 40, respectively.
Table 32
Foreclosures in Study Area
HUD 18 Month Foreclosure
Start Rate
HUD 18 Month Foreclosure Starts (ending June 2008)
2010 New Residential
Foreclosures
Housing Foreclosure
Rate Livonia 3.9% 1,098 520 1 in 51
Redford Twp 9.9% 1,682 704 1 in 20
Westland 7% 1,538 705 1 in 40
Source: HUD and SEMCOG In 2008, the federal government responded to the foreclosure crisis through the Neighborhood Stabilization Program (NSP). This was established for the purpose of stabilizing communities impacted by foreclosures and abandonment, through the purchase and redevelopment of foreclosed and abandoned homes and residential properties. Redford Township and Westland were allocated NSP funding directly from HUD, while Livonia received an allocation from the State of Michigan. Under NSP-1, Redford received $3,041,364, Westland received $2,061,722, and Livonia received $1,450,000. Maps 12 - 14 show the foreclosure risk scores and areas of greatest need by census tract for each community. It should be noted that the entirety of Redford Township (Map 13) had a foreclosure risk score of either a 9 or 10, with census tracks abutting the City of Detroit in particular need. Redford allocated its NSP funds across the Township with an emphasis on those neighborhoods most in need. The City of Livonia as a whole had much lower foreclosure risk scores than Redford, with only one census tract with a risk score of 9 and the majority with risk scores of 6 or below. The City of Westland has several census tracts with foreclosure risk scores of 9 or 10, with the majority located on its eastern border.
Map 12
City of Livonia: Foreclosure Risk Score by Census Tract
Risk Score 9
8
7
6
Source: HUD, 2008

33
Map 13 Redford Twp: Foreclosure Risk Score by Census Tract
Risk Score
10
9
Source: HUD, 2008
Map 14 City of Westland: NSP Areas of Greatest Need
Source: HUD, 2010

34
In addition to the devastation foreclosures have on homeowners and neighborhoods, they also result in decreases in property revenue for local governments, which directly results in a decline in their ability to provide high levels of public services to residents. Between 2009 and 2010 the three community study area lost over $906 million, or 38.8% of its taxable property value. Individually, the City of Livonia lost 10.8%; Redford Township lost 16.8%; and the City of Westland 11.2% of its taxable value.
Assisted Housing Developments in AI Jurisdictions City of Livonia 1. McNamara Tower (Elderly Public Housing - serving low and moderate income senior citizens)
160 total units – (54 Efficiencies;106 One Bedroom) 2. William W. Brashear Tower (Elderly Public Housing – Section 8 & Barrier Free Units)
196 total units – (180 One Bedroom; 16 Two Bedroom) 3. Livonia Opportunity House – (MSHDA administered – Special Housing & Section 8)
16 total units (16 Two Bedroom) 4. Ziegler Place -- (Elderly HUD administered – Section 8 & Barrier Free)
140 total units – (140 One Bedroom) 5. Trinity Park - (Elderly HUD administered – Section 8 and Section 236)
40 total units – (40 One Bedroom)
Table 33 Livonia Subsidized Housing Inventory
HUD MSHDA Public Housing Total Elderly Units 180 16 356 552
Section 236 32 0 0 32
Section 8 260 16 196 472
Barrier Free 33 0 16 49
Special Housing 0 16 0 16
Public Housing 0 0 160 160 Source: Michigan State Housing Authority (MSHDA)
Redford Township
1. Coventry Place - (Elderly HUD administered – Section 8 & Section 202)
56 total units - (14 Efficiencies, 42 One Bedroom) 2. Village of Redford - (Elderly MSHDA administered – LIHTC & Market Rate)
112 total units – (56 One Bedroom, 56 Two Bedroom)
Table 34 Redford Subsidized Housing Inventory
HUD MSHDA Total Elderly Units 56 112 168
Section 8 56 0 56
Section 202 1 0 1
MSHDA-LIHTC 0 48 48
Market Rate 0 64 64 Source: Michigan State Housing Authority (MSHDA)

35
City of Westland 1. Greenwood Villa - (Elderly and Family MSHDA administered – Section 8)
298 total units – (205 One Bedroom; 83 Two Bedroom; 10 Three Bedroom) 2. London Cooperative Inc. - (Family HUD administered – Section 221(d)3)
277 total units – (27 One Bedroom; 142 Two Bedroom; 82 Three Bedroom; 26 Four Bedroom) 3. Norris Apartments - (Family “Other” administered – LIHTC & Barrier Free)
60 total units – (7 One Bedroom; 51 Two Bedroom; 2 Three Bedroom) 4. Thomas F Taylor Towers - (Elderly HUD administered – Section 8 & Barrier Free)
266 total units – (230 One Bedroom; 36 Three Bedroom) 5. Westgate Tower – (Elderly MSHDA administered – Section 236)
148 total units – (148 One Bedroom) 6. Westhaven Manor – (Elderly MSHDA administered)
144 total units – (122 One Bedroom; 22 Two Bedroom) 7. Woodbridge Pond – (Family “Other” administered – LIHTC)
190 total units – (38 One Bedroom; 152 Two Bedroom)
Table 35 Westland Subsidized Housing Inventory
HUD MSHDA Other Total Family Units 277 88 250 615 Elderly Units 266 502 0 768
Section 8 564 298 0 862
Section 221(d)3 277 0 0 277
Section 236 0 148 0 148
Market Rate 0 115 0 115
Barrier Free 12 0 3 15
MSHDA 0 29 0 29
LIHTC 0 0 250 250 Source: Michigan State Housing Authority (MSHDA)
It should be noted that some residents are resistant to any rental development, and obtaining decent and affordable rental housing can be difficult for lower-income families. Finding decent, affordable, and physically accessible rentals may also pose a problem for disabled individuals, although with more handicapped accessible units built since passage of the Americans with Disabilities Act, it is less of a problem than in the past, although they still exist. Even with requirements imposed by the Americans with Disabilities Act, units may be accessible, but there may be barriers e.g. a lack of curb cuts which impede accessibility for handicapped individuals. The circumstances are somewhat different for renters, especially developmentally-disabled renters, who seek to live independently.

36
Section III - Lending Practices and Public/Private Policy
Mortgage Lending and HMDA Data Analysis The communities analyzed 2009 aggregate home mortgage, refinancing and improvement loan transaction data for the Detroit-Livonia-Dearborn MSA area. Such data can indicate patterns or trends in mortgage banking, and is made available to the public through the Home Mortgage Disclosure Act (HMDA). Disclosure is required of financial institutions by the Federal Government, and the resulting reports provide summaries for loan approvals, denials, and withdrawals for federally insured and conventional mortgages, mortgage refinancing, and home improvement loans. HMDA data is only available at the community level for loan applications by loan type, as displayed in Table 36. Any specific information related to loan applications and loan type, such as loan applications by race or income, is only available for the Detroit metropolitan area as a whole, and is not specific to Livonia, Redford Twp, or Westland. It is reasonable to assume, however, that lending practices and patterns in the AI Study Area are similar to those experienced elsewhere in the larger MSA region. This information is provided in Tables 36 – 40. Again, all data was derived from the HMDA website, www.ffiec.gov/hmda, in April 2011, and covered loans made during 2009. Financing institutions can take one of several actions pertaining to the mortgage loan application:
“Loan originated” indicates that the loan was made by the lending institution/
“Approved, not accepted” represents loans approved by the lender, but not accepted by the applicant. This generally occurs if better terms are found at another lending institution.
“Denied” defines a situation where the loan application failed.
“Withdrawn” means that the applicant closed the application process.
“Determined incomplete” means that the loan application process was closed by the institution due to incomplete information.
Table 36 displays the actions taken for loans in each of the three AI Study Area communities. For all three communities refinance loans had both the highest origination and denial rates. The data presented in Table 36 does not show a significant concentration of loan denials in any one particular community.
Table 36 Loan Applications Received, by Loan Type
Federally Insured Conventional Refinance
Home Improvement
Livonia Loan Originated 364 288 1330 54
Approved, not accepted 34 22 151 14
Denied 87 47 523 57
Withdrawn 31 20 257 11
Determined incomplete 12 3 75 3
Redford Loan Originated 313 67 355 21
Approved, not accepted 35 7 46 11
Denied 98 49 262 64
Withdrawn 38 21 107 3
Determined incomplete 5 3 18 1
Westland Loan Originated 432 185 536 31
Approved, not accepted 36 17 64 14
Denied 99 53 388 89
Withdrawn 56 15 142 6
Determined incomplete 8 7 45 1
Source: HMDA Aggregated Reports, 2009

37
Table 37 Disposition of loan applications by race/ethnicity
Detroit-Livonia-Dearborn, MSA, 2009
Number of Loans on 1-4 Family Dwellings Federally Insured Conventional Refinance
Home Improvement
White Received 5,785 4,149 16,692 1,621 Originated 68.37% 62.86% 54.83% 31.83%
Denied 15.51% 21.43% 25.02% 53.24%
Other Disposition 16.13% 15.71% 20.15% 14.93%
Black Received 1,816 760 3,419 1,606 Originated 45.76% 30.79% 27.79% 19.49%
Denied 31.72% 47.89% 48.35% 70.67%
Other Disposition 22.52% 21.32% 23.87% 9.84%
Hispanic Received 233 115 381 113 Originated 60.09% 43.48% 33.07% 14.16%
Denied 21.46% 43.48% 43.04% 75.22%
Other Disposition 18.45% 13.04% 23.88% 10.62%
Asian Received 133 291 1,197 48 Originated 58.65% 60.48% 58.73% 31.25%
Denied 23.31% 20.27% 19.80% 58.33%
Other Disposition 18.05% 19.24% 21.47% 10.42%
Other Received 90 69 332 61 Originated 56.67% 53.62% 40.36% 11.48%
Denied 20.00% 20.29% 33.43% 72.13%
Other Disposition 23.33% 21.74% 26.20% 16.39%
Source: HMDA Aggregated Reports, 2009
In 2009, denial rates for Black applicants ranged from 16.2 percentage points higher than White applicants for federally insured home purchases, to 23.3 percentage points higher for refinance loans in the Detroit-Livonia-Dearborn MSA (Table 37). With the exception of home improvement loans, Black applicants were denied at a higher percentage than any other race or ethnicity in 2009. Of perhaps most concern is the large discrepancy in conventional and refinance loan applications. In both instances, Black applicants were denied nearly 50% of the time. The denial rates for Hispanic loan applications were also higher than Whites, but lower than Black applicants – with roughly 43% denial rates for both conventional and refinance loans. It is also important to consider the criteria for home refinancing loans since they allow mortgagers to take advantage of lower interest rates, obtain better terms, and thereby improve their financial position. With fewer home purchases occurring in the region and overall home prices dropping to below year 2000 levels, refinance loans are more critical than ever for mortgagers in the metro Detroit region. Additionally, they make the cost of housing less expensive and enable those who use them to lower housing costs, make necessary improvements, or move to better housing. Here too, the data diverges between the various groups. The loan origination rates are lower on average than for either federally insured or conventional loans. The higher origination rates applied to Asian applicants (at 58.73%), while the lowest loan approval rates applied to Black applicants (at 27.79%). For all races and ethnicities, the overall approval rate for origination for home improvement loan applications was the lowest. Approval rates for home improvement loans vary from 31.8% for Whites, 19.5% for Blacks, 14.1% for Hispanic, 31.2% for Asian, and 11.4% for Other. The major reasons given for application denial are also of great importance when analyzing trends in mortgage lending. Table 38 provides the six major reasons loans were denied in 2009. For all races and ethnicities the three main reasons for denial were 1) poor credit history, 2) unfavorable debt-to-income ratio, and 3) collateral.

38
Table 38 Reasons for denial of loan applications for 1-4 family homes
Detroit-Livonia-Dearborn, MSA
Federally Insured Conventional Refinance
Home Improvement
White Applicants 1,027 955 4,200 1,040 Credit History 17% 19% 10% 43%
Debt-to-Income Ratio 19% 19% 12% 29%
Collateral 22% 23% 52% 12%
Credit app incomplete 6% 8% 7% 1%
Employment History 7% 2% 1% 1%
Other 29% 29% 18% 14%
Black Applicants 644 331 1,422 1,197 Credit History 26% 33% 26% 60%
Debt-to-Income Ratio 16% 20% 12% 26%
Collateral 19% 19% 41% 6%
Credit app incomplete 6% 5% 5% 0.5%
Employment History 7% 2% 1% 1%
Other 26% 21% 15% 6.5%
Hispanic Applicants 59 51 169 103 Credit History 15% 24% 18% 48%
Debt-to-Income Ratio 17% 18% 12% 29%
Collateral 32% 20% 44% 9%
Credit app incomplete 2% 6% 8% 0%
Employment History 5% 6% 1% 1%
Other 29% 26% 17% 13%
Other Applicants 52 85 373 91 Credit History 21% 20% 9% 44%
Debt-to-Income Ratio 27% 16% 13% 31%
Collateral 17% 22% 55% 14%
Credit app incomplete 10% 7% 8% 1%
Employment History 4% 6% 1% 1%
Other 21% 29% 14% 9%
Source: HMDA Aggregated Reports, 2009
Poor credit history was the top reason Black applicants were denied loans across all four loan types. Compared to both White and Hispanic applicants, there does appear to be a concentration of Black applicants being denied loans due to poor credit history (Table 38). With the exception of home improvement loans, the leading reason for denied loans for White applicants was collateral. Both credit history and debt-to-income ratio had similar denial rates across loan type. For Hispanic applicants, both credit history and collateral were the major reasons for denial. However, denials due to poor credit history were not as concentrated for Hispanics applicants as they were for Black applicants. While there are differences in approval rates between all races and ethnicities the differences between Black and Hispanic applicants appear to be significant. It is also important to consider loan denial rates based on income. Not surprisingly, there is a trend of fewer loans being originated among low-income applicants. While this is not surprising when based purely on income, it is important to discern whether denial rates differ by race or ethnicity and income. Table 39 on the following page displays denial rates by mortgage type, race or ethnicity, and income.

39
Table 39
Mortgage Loan Denial Rates by Race/Ethnicity and Income Detroit-Livonia-Dearborn, MSA, 2009
Low-Income (<50% of Median)
Apps. Denied
# %
Mod-Mid Income Applicants
(50-79% of Median) Apps. Denied
# %
Mid & Upper Income (80% &
greater of Median
Apps. Denied
# % Federally Insured
White 1,046 227 22% 2,000 281 14% 2,701 227 8%
Black 321 141 44% 680 200 29% 796 230 29%
Asian 25 11 44% 31 9 29% 76 11 14%
Hispanic 66 11 17% 91 19 21% 72 19 26%
Other 6 1 17% 31 9 29% 52 7 14%
Conventional White 423 153 36% 947 252 27% 2,755 479 17%
Black 105 72 69% 191 99 52% 456 190 42%
Asian 33 11 33% 36 12 33% 220 36 16%
Hispanic 18 7 39% 33 18 55% 62 24 39%
Other 11 5 45% 20 6 30% 38 11 29%
Refinance White 1,088 343 32% 2,144 709 33% 11,224 2,906 26%
Black 502 297 59% 732 463 63% 1319 739 56%
Asian 49 25 51% 62 22 35% 1044 186 18%
Hispanic 39 24 62% 66 36 55% 192 96 50%
Other 21 8 38% 31 14 45% 240 80 33%
Home Improvement
White 303 217 72% 420 213 51% 828 372 45%
Black 509 398 78% 534 380 71% 537 333 62%
Asian 18 12 67% 14 5 36% 16 11 69%
Hispanic 33 28 85% 43 33 77% 35 22 63%
Other 18 17 94% 18 11 61% 23 14 61%
Source: HMDA Aggregated Reports, 2009
In all cases, low-income applicants (<50% of AMI) were denied (regardless of race, ethnicity, or mortgage type) at a greater degree than applicants earning greater than 50% AMI. However, minority racial and ethnic groups faced a much higher loan denial rate than Whites. For example for conventional loans, Black applicants experienced much higher loan denial rates than White applicants at all income levels; at <50% of AMI Blacks had a denial rate of 69% compared to a denial rate of 36% for Whites; at 50%-79% of AMI Blacks had a denial rate of 52% compared to a denial rate of 27% for Whites; and at >80% AMI Blacks had a denial rate of 42% compared to a denial rate of 17% for Whites. Similarly, for refinance loans, Hispanic applicants experienced much higher loan denial rates than White applicants at all income levels; at <50% of AMI Hispanics had a denial rate of 62% compared to a denial rate of 32% for Whites; at 50%-79% of AMI Hispanics had a denial rate of 55% compared to a denial rate of 33% for Whites; and at >80% AMI Hispanics had a denial rate of 50% compared to a denial rate of 26% for Whites. Consequently, as income rose, the difference in denial rates between White applicants and other minority racial and ethnic population diverged. It is also important to analyze whether loan approval and loan denial rates vary dependant on the degree of minority concentration by geographic area. Table 40 provides loan origination data by income and minority concentration.

40
Table 40
Loan Origination by Income and Minority Composition Detroit-Livonia-Dearborn, MSA, 2009
TYPE OF CENSUS TRACT FEDERALLY INSURED
CONVENTIONAL
REFINANCE HOME IMPROVEMENT
Low Income Approved # %
Denied # %
Approved # %
Denied # %
Approved # %
Denied # %
Approved # %
Denied # %
< 10% Minority - - - - - - - - - - - - - - - -
10 – 19% Minority - - - - - - - - - - - - - - - -
20 – 49% Minority 9 53% 6 35% 6 25% 14 58% 9 20% 26 57% 2 13% 12 75%
50 – 79% Minority 6 50% 4 33% 10 48% 4 19% 9 33% 13 48% 4 22% 12 67%
80 – 100% Min. 16 30% 21 39% 14 25% 26 46% 44 21% 95 46% 27 16% 119 68%
Moderate Income < 10% Minority - - - - - - - - - - - - - - -
10 – 19% Minority 23 59% 4 10% 27 51% 17 32% 18 43% 14 33% 5 36% 9 64%
20 – 49% Minority 104 43% 70 29% 67 37% 66 36% 105 32% 132 41% 25 19% 96 73%
50 – 79% Minority 20 29% 30 43% 32 30% 59 55% 73 30% 120 49% 20 14% 105 74%
80 – 100% Min. 71 29% 105 43% 51 23% 128 57% 240 20% 710 58% 163 18% 673 73%
Middle Income < 10% Minority 1087 70% 239 15% 356 60% 144 24% 1317 47% 895 32% 124 27% 271 60%
10 – 19% Minority 445 63% 138 19% 216 56% 100 26% 621 45% 436 70% 55 26% 123 59%
20 – 49% Minority 417 55% 195 26% 195 45% 147 34% 488 37% 494 38% 51 21% 151 62%
50 – 79% Minority 71 43% 55 33% 28 27% 47 45% 118 27% 203 47% 18 15% 94 77%
80 - 100% Min. 154 32% 190 39% 47 17% 154 57% 340 25% 651 48% 111 21% 361 67%
Upper Income < 10% Minority 1809 72% 341 14% 1432 69% 328 16% 5642 58% 2178 22% 222 37% 272 45%
10 – 19% Minority 647 67% 170 18% 545 68% 137 17% 2292 58% 891 22% 73 36% 91 44%
20 – 49% Minority 274 67% 65 16% 268 71% 65 17% 781 57% 293 22% 19 28% 35 51%
50 – 79% Minority 14 37% 13 34% 15 29% 22 42% 20 25% 46 57% 7 44% 8 50%
80 – 100% Min. 56 34% 59 36% 31 33% 44 46% 79 27% 129 44% 24 24% 66 65%
Source: HMDA Aggregated Reports, 2009
It is clear from Table 40 that there are differences in loan approval rates based upon the degree of minority concentration in a community. To the extent that financial institutions inhibit the ability of minority homebuyers from purchasing, improving, or refinancing their properties, there is a differential impact and this can be an impediment to fair housing.
Private Policies and Practices The real estate industry has been the target of much criticism concerning unprofessional, unethical, or illegal practices which could affect fair housing. Reforms governing real estate qualifications and practices have been set in place over the past 40 years, and virtually every real estate agent and firm is required to train staff and adhere to specific conduct standards concerning fair housing. This has helped to reduce the instance of blatantly discriminatory and otherwise unprofessional practices in the industry, and has helped open the housing market for qualified buyers. A fair housing training seminar was held in March 2009, for the cities of Livonia and Westland. This training was presented by the Fair Housing Center of Metropolitan Detroit and was attended by various representatives of the real estate industry, as well as housing and community development departments of the cities. Special attention was given to the issue of marketing housing to a racially and ethnically diverse population. The City of Livonia has also hosted fair housing seminars on its own.
Public Policies and Practices Racial and ethnic minorities have often raised concerns about the provision of unequal or discriminatory public safety and other human services. As stated in Section II all three communities have experienced significant increases in minority populations over the last ten years. Although Livonia has a significantly smaller minority population than Redford or Westland, the trend for all three communities points to a continuing loss of majority (i.e. White) population and increase in minority (i.e. Black, Hispanic, Asian, etc.) populations. All three communities are aware of the need to provide services on an equal basis and have targeted essential services for low-income and minority residents.

41
Additionally, each community has undertaken many activities to provide affordable and fair housing for all residents and has made the provision of affordable housing its number one community development priority by allocating a large percentage of CDBG program funds for housing rehabilitation designed to meet the needs of the ELI, VLI, LI population, and persons with special needs. Some specific examples of local policies and practices follow:
Community Development Block Grant
Livonia has targeted its CDBG and related funds to housing opportunities, and providing essential human services including homeless prevention and related assistance, domestic abuse prevention, mental health counseling, transportation assistance, and other public services. Some of these are minority recipients. As mentioned, it has also implemented an extensive program to provide low-rent public housing and voucher assistance for those living in privately-owned dwelling units.
Redford Township has focused its CDBG program on the provision of housing services, providing special guidance related to fair housing and homeownership; and public services including assistance to those families at risk of homelessness, transportation, crime prevention, legal services, youth services, and transportation. Some of the beneficiaries are minority residents, including non-residents. As mentioned, the Township entered into an agreement with the Michigan State Housing Development Authority (MSHDA) to have that entity provide rental assistance vouchers to income-eligible families.
Westland has allocated its CDBG funds to housing rehabilitation and public improvements in CDBG-eligible areas and to target populations, such as the elderly and youth. These funds are directed to all types of housing including, homeowners, renters and first time homebuyers. Minority populations benefit from these programs. As mentioned, it has also implemented an extensive program to provide housing voucher assistance for those living in privately-owned dwelling units.
Section 8 and Housing Choice Voucher Programs The U.S. Department of Housing and Urban Development (HUD) provides financial housing assistance to eligible low-income families based upon income. The amount the family pays for rent and utilities will generally not exceed 30% of income. Family income must be within HUD guidelines for household size in order to qualify. Owners of rental properties must comply with HUD program requirements. The rent for a property must be reasonable and must pass the HUD Housing Quality Standards.
The Livonia Housing Commission currently assists approximately 909 families.
The Westland Housing Commission currently assists approximately 1,090 families.
Equal Housing Opportunity Plans Livonia, Redford Township and Westland have adopted Equal Housing Opportunity Plans which strive to reach out to lower-income families, to promote more housing opportunities for families outside low-income and minority-impacted areas, to promote employment opportunities in employment practices, and to promote business opportunities in housing programs for Section 3, women’s and minority-owned businesses.
Other Public Actions to Address Housing and Service Needs: All three communities have homebuyer and housing rehabilitation programs.
Livonia, Redford Township and Westland offer an emergency rehabilitation program for qualified low and moderate income homeowners to make limited repairs of hazardous housing conditions that may jeopardize the health or safety of a homeowner, e.g. fuse panel for electrical services, furnace, water break, roof leak or sewer back up.
All three communities have established ongoing and productive relationships with private lenders. These entities have assisted lower income homebuyers by providing low cost, flexible mortgage products. These relationships were significant in regards to implementation of the Neighborhood Stabilization Program (NSP), placing qualified homeowners into previously foreclosed and vacant homes.
Redford Township and Westland both provide barrier free home access grants, loans or deferred loans for low and moderate income homeowners to improve accessibility and convenience for persons with permanent physical handicaps.
Livonia, Redford Township and Westland enacted rental certification ordinances, with inspections conducted every two years. This ordinance has been combined with code enforcement, and with demolition efforts, and with locally- and Federally-funded infrastructure improvements, to make a significant impact on removing incipient blight from the community.

42
Livonia has devoted a large share of its CDBG funds to affordable housing activities, including activities designed to address homelessness. In 2003, it targeted $395,000 (47% of the total budget) to housing repair, another $223,600 (or 26.6% of the budget) to the repair of private and public housing.
All three communities are members of the Out-Wayne County Coalition on Homelessness, and have been able to tap into, that organization’s resources to better serve the homeless population.
Livonia, Redford Township and Westland have provided legal and counseling support for those who may have been affected by unlawful discrimination. Livonia does so through its Housing and Human Relations Commissions, and through a continuing contract with the Fair Housing Center of Metropolitan Detroit. Redford Township does so through its housing counseling agency, which provides information concerning housing opportunities to every person who seeks it. This body is capable of providing initial counseling in cases of potential housing discrimination, if necessary. Westland does so through its contract with the Fair Housing Center of Metropolitan Detroit and housing counseling agency referral. Each is also aware that similar services are available through the Fair Housing Center of Metropolitan Detroit, the State of Michigan and HUD, and forward complaints which come to their attention, if they cannot be resolved at the local level.
All three communities have engaged in dialogue with the minority community (individuals and organizations) to promote mutual understanding and to identify and resolve issues early on. In Redford, the Township government has worked closely with neighborhood associations to address community concerns, particularly the Redford Ministerial Alliance, and other community groups to welcome new residents and to create better and long-lasting relationships between them. Livonia has grass roots organizations such as People of Livonia Addressing Issues of Diversity (PLAID), which seeks to promote racial and ethnic understanding. PLAID, like the City government, has been quick to provide alternative views on potentially polarizing issues of community concern. Westland works with neighborhood, homeowner and condominium associations such as the Southeast Homeowners Association and the Norwayne Community Citizens Council.

43
Section IV. Fair Housing
Fair Housing Agencies The jurisdictions have the ability to enforce fair housing requirements and can use the offices of various Federal and/or State agencies. These include: U.S. Government: Department of Housing and Urban Development Office of Fair Housing and Equal Opportunity Department of Justice Department of Treasury Environmental Protection Agency Department of Labor State of Michigan: There are a number of state agencies responsible for enforcing fair housing law, from real estate practices to mortgage approval and homeowner’s insurance. Anyone who believes that they have been unlawfully discriminated against in housing is able to get assistance from the State, including counseling and representation, if necessary. The State of Michigan’s fair housing laws are substantially equivalent with Federal statutes, meaning that they provide the same level of protection to protected individuals that the Federal government would.
Local and Municipal: The Township of Redford relies on HUD, and the State of Michigan to counsel and represent aggrieved individuals and families. Its Community Development and Home Maintenance Departments also provide guidance to individuals and families on fair housing concerns. Both Livonia and Westland contract with the Fair Housing Center of Metropolitan Detroit (FHC) to provide technical and consultative services. Examples include FHC training of housing commission board members and staff on fair housing requirements, advocating for those who may have experienced unlawful discrimination, and conducting fair housing testing within each city. Finally, the Housing Commissions in both Livonia and Westland provide guidance to individuals and families on fair housing concerns. Other Protections: Private organizations, notably the Fair Housing Center of Metro Detroit, actively monitor fair housing activity in the area and stand ready to provide necessary assistance to aggrieved individuals.
Fair Housing Complaints The Fair Housing Center of Metropolitan Detroit (FHC) provides annual reports of fair housing complaints (and fair housing compliance). Table 41 provides an overview of the number of complaints that have occurred in each community between 2005 and 2010. Those that occurred concerned a variety of issues, involving both rentals and sales, with rental issues appearing to outweigh home sales. The complaints involved race, family status, and disability status concerns. Considering the size of the jurisdictions, this is a surprisingly small number of complaints over a five year period, and may be attributable to efforts by the communities to work with citizens, non-residents, and with members of the real estate community to ensure open and fair housing.
Both Livonia and Westland have used the Fair Housing Center as a fair housing consultant. The FHC has helped develop operating guidelines and assessing whether specific landlord practices were legal and advisable. This relationship has been instrumental in helping the cities develop a record of fair and impartial Section 8 Program administration.

44
Table 41 Fair Housing Complaints by Jurisdiction Reported by the Fair Housing Center
Livonia
2005 - 2006 2006 - 2007 2007 - 2008 2008 - 2009 2009 - 2010 Open – beginning of year 6 4 5 3 1
New Compliant 0 2 1 1 2
Total Complaints 6 6 6 4 3 Race 2 4 4 3 2
Age 0 0 0 0 1
Family Status 2 1 0 0 0
Disability 0 0 2 1 0
National Origin 1 1 2 0 0
Sex 0 0 0 0 0
Religion 1 0 0 0 0
Demographic Total1 6 6 6 4 3 Multi-Family 3 3 3 3 2
Single-Family 2 2 2 1 1
Commercial 1 1 1 0 0
Condominium 0 0 0 0 0
Property Total2 6 6 6 4 3 Westland 2005 - 2006 2006 - 2007 2007 - 2008 2008 - 2009 2009 - 2010 Open – beginning of year 24 13 20 16 11
New Compliant 3 7 7 3 3
Total Complaints 27 20 27 19 14 Race 21 11 18 12 9
Age 0 2 2 2 0
Family Status 6 5 5 1 1
Disability 5 7 7 2 2
National Origin 0 0 0 0 1
Sex 0 0 1 1 1
Religion 1 0 0 0 0
Marital Status 1 1 1 0 0
Demographic Total1 27 20 27 19 14 Multi-Family 14 13 17 10 7
Single-Family 4 3 3 3 2
Condominium 1 2 2 2 1
Cooperation 2 2 3 2 2
Section 8 0 0 2 2 2
Appraisal 1 0 0 0 0
Property Total2 27 20 27 19 14 Redford 2005 - 2006 2006 - 2007 2007 - 2008 2008 - 2009 2009 - 2010 Open – beginning of year N/A N/A N/A N/A N/A
New Compliant N/A 1 0 2 0
Total Complaints N/A 1 0 2 0 Race N/A 1 0 2 0
Demographic Total1 N/A 1 0 2 0
Multi-Family N/A 0 0 2 0
Appraisal N/A 1 0 0 0
Property Total2 N/A 1 0 2 0
Source: Fair Housing Center of Metropolitan Detroit, Annual Reports 2005-2010
1 Totals may reflect more than one basis and thus do not always equal the total number of complaints.
2 Totals may reflect more than one basis and thus do not always equal the total number of complaints.

45
The Livonia and Westland Housing Commissions perform a public service function regarding fair housing law and practices - informing the public (including prospective renters) of rights and issues, and distributing literature, including Landlord/Tenant rights booklet. These identify and define the rights of both owners and renters in regard to rental laws in the community and in the State of Michigan. Housing Commission staff also assists individuals seeking housing in the community by providing the names and contact points for potential residency. Staff in all three communities counsel individuals who may have been unlawfully discriminated against. If warranted staff advise landlords of their legal responsibilities and how to fulfill them. Moreover, they monitor rental practices under the Section 8 Housing Program and if necessary refer cases to the FHC. Table 41 shows that housing discrimination complaints were primarily race-related and tended to concern rental properties. Additionally, because Redford Township does not have a contact with the FHC available fair housing complaint data for is not as comprehensive as for Livonia and Westland. The data provided in Table 41 for Redford displays only “new complaints” for 2006-2010 and does not include any “open” cases from previous years.
Public Input Regarding Fair Housing On May 18, 2011 Livonia, Redford Township, and Westland jointly hosted a public hearing to obtain views of citizens, public agencies, and other interested parties regarding the draft AI. The hearing was held at the Livonia Housing Commission at 10800 Farmington Road, Livonia, MI 48150. Unfortunately, there was limited turnout at this hearing and no public comments were received. Written comments were also requested by each of the three communities. None were received. Additionally, between May 1, 2011 and May 31, 2011 all three communities hosted a Fair Housing Survey on their websites for residents and other interested parties to complete and provide comment and opinion concerning fair housing issues. A total of 34 individuals completed the survey. The complete results of this survey are included in APPENDIX 2. The major findings of the survey were:
Of those who responded 84.4% were not of a “protected class”
Familial status and having a disability were the two most likely protected classes of those who responded
Only 8.8% of respondents were “very knowledgeable” about Fair Housing Laws
17.6% of respondents have, or know someone who has, experienced housing discrimination
Race/color was the most likely basis for housing discrimination, while rental apartment complex was the most likely location
Of those who responded “insufficient income” and “lack of affordable housing” were seen as the most likely current impediments to fair housing choice
77.8% of those who responded feel that fair housing choices are NOT geographically limited to certain neighborhoods
54.5% perceive certain geographic areas or neighborhoods as being undesirable From the survey results a few observations align especially well with both the fair housing complaints filed between 2005-2010 and the perceptions of the communities as to fair housing choice in the AI Study Area. Respondents to the survey believe that housing discrimination is most likely to be related to race/color and that discrimination is likely to occur in rental or multi-family units, both of which align with the 2005-2010 report from the Fair Housing Center. Additionally, the respondents overwhelmingly believe that impediments to fair housing are likely to be based more on income (or lack thereof) or lack of affordable housing choices, then on traditional “protected classes”.
Other Factors Affecting Fair Housing One perceived impediment to fair housing is that steering along racial and ethnic lines is prominent in the real estate industry. This practice encourages non-minorities to look in new or recently established areas, and encourages lower-income persons and minorities to consider older and likely declining neighborhoods. If real, it would artificially stimulate sales of real estate, to the detriment of all concerned (by perpetuating segregation along racial and income lines), but particularly to lower-income and minority families, and to the older communities which would see a decline in public perception, property values, and could also experience a dramatic increase in the demands for services. It is therefore wise to test this perception. The following factors were analyzed as potential factors that impact the availability and access of fair and equitable housing in the AI Study Area.
46
Master Planning and Zoning Ordinances Municipalities, operating in a free economy, cannot direct the exact nature of development within their boundaries. They cannot, for example, direct developers to build specific types of units or developments, nor can they direct levels of amenities. They are more likely to exert an indirect influence over development by: establishing master plans, which contain elements of an envisioned planning future; developing and implementing zoning ordinances, which provide legal governance over the type and specific
dimensions of development within areas of the community and then; monitoring development proposals which come their way for consistency with the plans and ordinances.
Although indirect, municipal development controls are considerable, and many communities have successfully used their powers for the common good. Trouble can arise, however, depending on how the term “common good” is defined and applied. It is not always possible to meet all needs within any community, given the competing needs and desires of various residents and community interests, and sometimes choices are made, with the result that competing needs are met to varying degrees. Local zoning requirements can, for example, effectively exclude affordable housing for lower-income and minority families through minimum lot sizes or construction requirements. Zoning can also be used to prevent group quarters or community residences in certain neighborhoods. The same powers can also be used to focus on affordable housing to the exclusion of other interests, with the result that the community could become a lower-income enclave. Either approach can promote imbalanced development, to the detriment of citizens and business alike. The purpose of this study is to determine whether there is fair housing in the City of Livonia, in Redford Township, and in the City of Westland. Given the existence of racial, ethnic and income imbalances across the country, it seems that the ideal of fair housing may not yet be attained. A review was made of local zoning ordinances, as shown in the Table 42, to determine the role municipal governments play in unfair housing practices. All three zoning ordinances provide, as a matter of policy, for the maintenance and preservation of existing housing. Given the long period of development, these ordinances were changed to reflect construction styles and trends. They therefore accommodate smaller homes and lot sizes, larger units, and multiple dwelling units of various sizes and types. The newer homes are more typical of Livonia, and are, by definition, more expensive. Livonia’s zoning ordinance reflects this variety with ten zoning classifications, while Redford’s allows four, and Westland allows eight. The communities, in conformance with their zoning ordinances, have actively promoted housing maintenance and rehabilitation programs for neighborhood residents, along with a variety of human service programs designed to meet identified needs of each neighborhood. These neighborhoods can and do provide significant opportunities for affordable housing among lower-income families. The lot sizes are reasonable in terms of overall size and are not exclusionary. These practices have resulted in the development of affordable housing in both communities. The existence of affordable housing opportunities does, however, not always translate into equal housing for racial and ethnic minorities. Table 14 shows that several neighborhoods within the study area have significantly more minorities in certain census tracts, as opposed to others. Maps 6-8 provide a visual representation of the geographic concentrations of minority populations in each of the three communities.
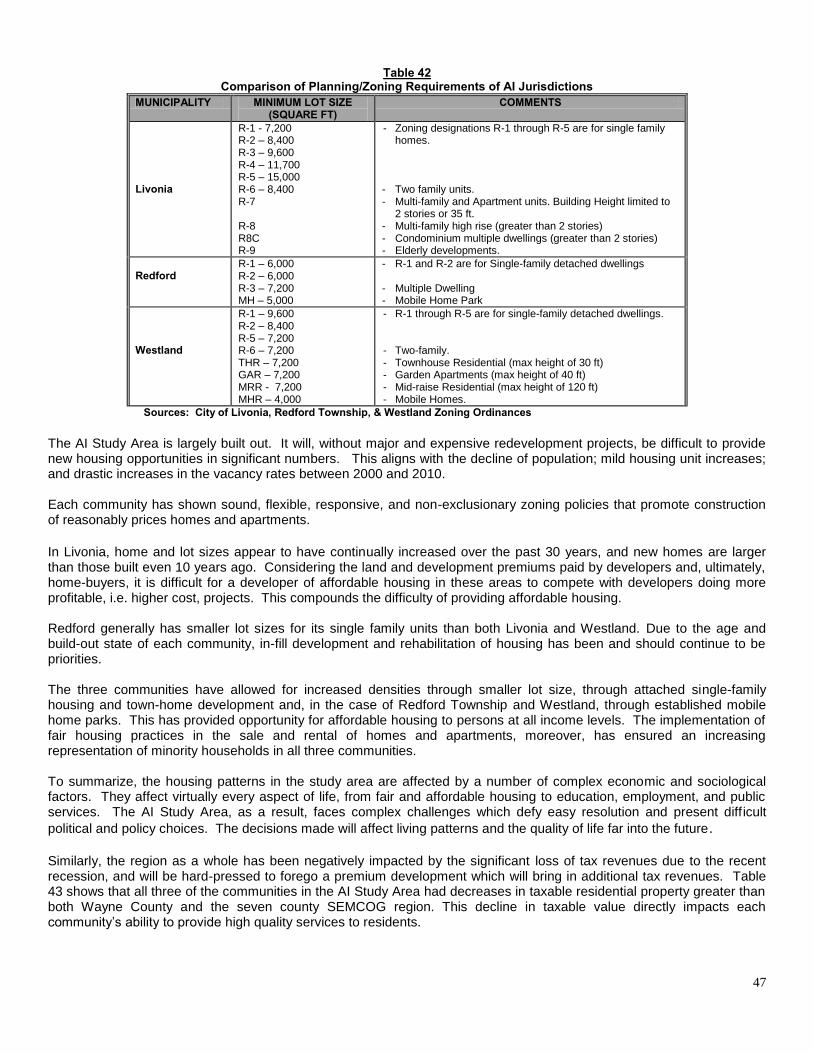
47
Table 42 Comparison of Planning/Zoning Requirements of AI Jurisdictions
MUNICIPALITY MINIMUM LOT SIZE (SQUARE FT)
COMMENTS
Livonia
R-1 - 7,200 R-2 – 8,400 R-3 – 9,600 R-4 – 11,700 R-5 – 15,000 R-6 – 8,400 R-7 R-8 R8C R-9
- Zoning designations R-1 through R-5 are for single family homes.
- Two family units. - Multi-family and Apartment units. Building Height limited to
2 stories or 35 ft. - Multi-family high rise (greater than 2 stories) - Condominium multiple dwellings (greater than 2 stories) - Elderly developments.
Redford
R-1 – 6,000 R-2 – 6,000 R-3 – 7,200 MH – 5,000
- R-1 and R-2 are for Single-family detached dwellings
- Multiple Dwelling - Mobile Home Park
Westland
R-1 – 9,600 R-2 – 8,400 R-5 – 7,200 R-6 – 7,200 THR – 7,200 GAR – 7,200 MRR - 7,200 MHR – 4,000
- R-1 through R-5 are for single-family detached dwellings. - Two-family. - Townhouse Residential (max height of 30 ft) - Garden Apartments (max height of 40 ft) - Mid-raise Residential (max height of 120 ft) - Mobile Homes.
Sources: City of Livonia, Redford Township, & Westland Zoning Ordinances The AI Study Area is largely built out. It will, without major and expensive redevelopment projects, be difficult to provide new housing opportunities in significant numbers. This aligns with the decline of population; mild housing unit increases; and drastic increases in the vacancy rates between 2000 and 2010. Each community has shown sound, flexible, responsive, and non-exclusionary zoning policies that promote construction of reasonably prices homes and apartments.
In Livonia, home and lot sizes appear to have continually increased over the past 30 years, and new homes are larger than those built even 10 years ago. Considering the land and development premiums paid by developers and, ultimately, home-buyers, it is difficult for a developer of affordable housing in these areas to compete with developers doing more profitable, i.e. higher cost, projects. This compounds the difficulty of providing affordable housing. Redford generally has smaller lot sizes for its single family units than both Livonia and Westland. Due to the age and build-out state of each community, in-fill development and rehabilitation of housing has been and should continue to be priorities. The three communities have allowed for increased densities through smaller lot size, through attached single-family housing and town-home development and, in the case of Redford Township and Westland, through established mobile home parks. This has provided opportunity for affordable housing to persons at all income levels. The implementation of fair housing practices in the sale and rental of homes and apartments, moreover, has ensured an increasing representation of minority households in all three communities. To summarize, the housing patterns in the study area are affected by a number of complex economic and sociological factors. They affect virtually every aspect of life, from fair and affordable housing to education, employment, and public services. The AI Study Area, as a result, faces complex challenges which defy easy resolution and present difficult
political and policy choices. The decisions made will affect living patterns and the quality of life far into the future. Similarly, the region as a whole has been negatively impacted by the significant loss of tax revenues due to the recent recession, and will be hard-pressed to forego a premium development which will bring in additional tax revenues. Table 43 shows that all three of the communities in the AI Study Area had decreases in taxable residential property greater than both Wayne County and the seven county SEMCOG region. This decline in taxable value directly impacts each community’s ability to provide high quality services to residents.

48
Table 43
Change in Taxable Value of Residential Property for 2009-2010 2009 2010 Change % Change
Livonia 3,087,075,810 2,743,391,270 (343,684,540) (11.1%)
Redford 973,911,616 791,305,772 (182,605,844) (18.7%)
Westland 1,464,934,695 1,262,861,648 (202,073,047) (13.8%)
Wayne County 32,889,053,263 29,572,602,004 (3,316,451,259) (10.1%)
Southeast Michigan 123,196,800,237 109,653,243,719 (13,543,556,518) (11.0%) Source: SEMCOG
The combination of the regional (and national) economic downturn, the foreclosure crisis, and severe declines in property values has impacted the construction of new residential units in the AI Study Area. APPENDIX I provides the total number of residential building permits counts for each of the communities. This table shows that each community experienced a significant decline in residential building permits beginning in 2007, with Redford actually experiencing more demolitions than new units in 2007-2009 and Westland experiencing more demolitions than new units in 2010. The building permits for Wayne County show that this phenomenon was not unique to the AI Study Area, but a problem for the larger region. Insurance Homeowner insurance and, to a lesser extent, automobile insurance may not readily come to mind when discussing fair housing, but the ability to obtain the former is critical and the ability to obtain the latter is important for individuals seeking housing. High insurance rates, or the inability to obtain insurance at all, can dissuade resident households to move from, and potential buyers seeking housing, certain designated neighborhoods. In the past, insurance companies, like realtors and mortgage companies, have been charged with arbitrarily charging higher premiums or refusing to insure at all, in designated areas. This practice is termed redlining, and it is illegal.
The practice of redlining may no longer be overly prevalent within the industry, but the fact that families in some localities, or in certain zip code areas, may pay more, or may find it difficult to obtain homeowners or car insurance, could be a powerful economic disincentive to fair housing. The industry has taken steps, e.g. making a general charge to cover costs for high-risk individuals or areas, as a way of providing coverage despite potentially higher claim costs. This is a very difficult issue to address, given differing crime and accident patterns in different communities and neighborhoods. There are other emerging issues which may affect the ability of lower income and minority households to obtain insurance in the future. Lead, for example, has received increased public, legislative, and regulatory attention over the last decade. All sellers of real estate must now notify purchasers of known hazards. The Lead Safe Housing Rule requires that lead hazards be identified and corrected in homes rehabilitated with CDBG and other Federal housing funds. It is possible that the scope of covered properties will expand to all residential properties, not just those receiving some form of Federal assistance. It is also likely that lead and other known toxins will affect insurers and the insurance underwriting process in the future. Lower income households, particularly lower-income minority households inhibit a disproportional share of the older and substandard housing that is likely to contain lead. They are therefore at a greater risk than other elements of the population to the adverse effects of lead. They could bear a disproportionate share of the financial burden should insurers alter their underwriting requirements to reflect the new requirements. Educational Policies and Practices Schools are extremely important to many families considering the purchase of a home, particularly those with children. The common wisdom is that some schools are better than others. Consequently home-buyers who make informed decisions will compare schools, and school districts, before making their selection of housing. This is natural. Too often, however, schools with a large proportion of racial and ethnic minorities are shunned by middle-income home-buyers, often because they are perceived as being substandard or unsafe. This promotes, and results in, the continuing segregation of neighborhoods. Poor school performance, or the perception thereof, can therefore be an impediment to fair housing. The City of Livonia is served by two school districts; the Clarenceville Public Schools, and the Livonia Public School District. Redford Township is served by two districts, South Redford and Redford Union. The City of Westland is served by the Wayne-Westland School District. In order to compare school performance, we compared data for each of the six school districts.

49
Table 44 Comparison of General Statistics of Study Area Schools
DISTRICT
DISTRICT SERVES
TOTAL
STUDENT POPULATION
STUDENT TEACHER
RATIO
STUDENTS ELIGIBLE REDUCED
LUNCH Clarenceville Livonia 1,843 19 : 1 44%
Livonia Livonia 16,642 18 : 1 18%
Redford Union
Redford 3,391 17 : 1 53%
South Redford
Redford 3,373 19 : 1 44%
Wayne-Westland
Westland 11,056 19 : 1 52%
Michigan Averages
N / A N / A 18 : 1 42%
Source: GreatSchools.org Obviously, the Livonia district is much larger than the other districts, nearly 5 times larger than both Redford Union and South Redford, and significantly larger than Wayne-Westland. Clarenceville is by far the smallest school district of the six and actually serves both Wayne and Oakland counties. The size of the school district is unlikely to have any bearing on the quality of education found, however there are other differences that likely do impact the quality of education. Table 44 shows that Clarenceville, South Redford, and Wayne-Westland each have a higher than average student-teacher ratio (more students for every teacher) than the state average, which is one indicator that may be considered when looking at educational quality and access. However, this divergence is minimal and each of the school districts align very closely with the state average of eighteen students for every one teacher. Another indicator displayed in Table 44 is the percent of students who are eligible for reduced lunch in each school district. While Livonia School District was far below the state average (18% of students in Livonia are eligible for reduced lunch, compared to the state average of 42%), both Redford Union and Wayne-Westland had a significantly higher percent of students eligible for reduced lunch (53% and 52% respectfully).
Map 15 Percent Change in School Age Population by School District (2005-2015)
Source: SEMCOG 2035 Forecast Map 15 shows that all five of the school districts serving the AI Study Area are forecasted to loss school age children between 2005 and 2015. Livonia, Redford Union, and South Redford are expected to lose more than 20% of school age population, while Clarenceville and Wayne-Westland are forecasted to lose between 10%-20% of their school age children. This aligns with the AI Study Area’s general forecast of significant decreases in school-aged children between 2000 and 2035, while significant increase in population over 65 years of age.
A look at other performance characteristics may shine more light on district achievement differences. When comparing district performance measures, Livonia is the only school district that consistently out-performed the state average for both MEAP and MME tests (Table 45). The MEAP (Michigan Educational Assessment Program) is a standardized test taken by all public schools in Michigan and the MME (Michigan Merit Exam) is a minimum-competency test for all high school

50
students, and is primarily used to measure “Adequate yearly progress”. Redford Union, South Redford, and Wayne-Westland all performed below the state averages for both MEAP and MME (the only exception was Grade 8 Science MEAP scores for South Redford).
Table 45
Comparison of District Performance Indicators, 2009
CLARENCEVILLE
LIVONIA
REDFORD UNION
SOUTH REDFORD
WAYNE WESTLAND
STATE OF MICHIGAN AVERAGE
MEAP
Grade 3 - Reading 84% 94% 80% 85% 83% 90%
Grade 3 - Writing 61% 71% 49% 52% 55% N / A
Grade 3 - Math 90% 96% 88% 92% 91% 95%
Grade 8 - Reading 73% 83% 73% 72% 68% 83%
Grade 8 - Science 69% 87% 72% 81% 65% 76%
Grade 8 - Writing 77% 75% 57% 72% 64% N / A
Grade 8 - Math 77% 86% 80% 71% 69% 70%
MME
Reading 47% 69% 50% 50% 44% 60%
Social Studies 75% 87% 71% 81% 79% 81%
Science 43% 67% 37% 46% 41% 56%
Writing 37% 56% 37% 32% 28% 43%
Math 35% 57% 21% 36% 30% 49%
Source: MI Dept. of Education, 2009-2010 This relatively significant difference in academic performance may suggest that there is a material difference to be found in the number and type of specialized class offerings within more affluent school districts. Additionally, the variations in performance levels between school districts might also be different because academic performance is related to the number of students who aspire and attain higher education. The data provided in Table 46 aligns very closely with the academic performance scores in Table 45. Residents in Livonia have above average education attainment (compared to the seven county SEMCOG region), while residents in both Redford and Westland have average to below average education attainment.
Table 46 Highest Level of Education, 2000
LIVONIA REDFORD WESTLAND
SOUTHEAST MICHIGAN
Graduate/Masters+ 9.9% 4.3% 4.7% 2.2%
Bachelor’s Degree 19.7% 11.8% 11.4% 15.2%
Associate Degree 7.4% 6.3% 5.8% 6.6%
Some College, No Degree 24.3% 27.4% 24.7% 23.3%
High School Graduate 27.5% 36.3% 34.5% 28.3%
Did Not Graduate High School 11.2% 13.9% 18.9% 17.1%
Source: SEMCOG A wealthier district, according to this view, would be able to offer a larger number and variety of advanced placement courses than one with fewer financial resources. They may also be able to offer more special extra-curricular activities. It would be likely that even though performance levels may be similar between districts among college-bound students, those from wealthier districts still have an advantage over their less affluent counterparts. This could explain the difference in scores of the MEAP and MME tests, and the alignment of higher educational attainment and higher median household income (Table 46). This would likely make a significant difference in educational opportunity between school districts, and would strengthen the desire of wealthier families to purchase housing in the more affluent districts. This would, obviously, strengthen patterns of segregation by race and income throughout the community and, significantly throughout the Detroit region. It is important to note that the aggregated data do not distinguish between the levels of educational performance between neighborhoods within and between districts. Obtaining such data was beyond the scope of this study.
There may be an opportunity for communities tagged as being “lower-income”, “minority” and “under-performing” to do better, through a careful evaluation of performance criteria. This could provide insight for school systems to refine their approach to enhance overall student achievement levels. If, for example, the number and type of advanced placement courses were expanded, or if magnet or enrichment programs were introduced, they might be able to offer college-bound students more in-depth instruction and opportunities for specialized learning. This could also be used to attract students

51
who might otherwise locate outside of the district. Such courses could also be used to help inspire other students who might otherwise not perform as well.
It would appear, from the above, that there are objective performance factors which affect public attitudes concerning educational quality in our communities. There is, however, the possibility that unspoken fears and prejudices would govern choice even if all other factors were equal. It is difficult, however, to gain empiric data concerning whether and how unspoken public attitudes or fears drive housing market choices irrespective of other factual considerations.

52
Section V. – Impediments & Recommendations Statement of Issues Over the past 20 to 30 years, many segments of the population, principally highly educated professionals and high-tech workers, prospered, while others, primarily those with less education, lower skill levels, and some workers in manufacturing fell further behind. The economy is beginning to provide replacement jobs in the service sector, but many of these pay a lower wage than the lost jobs in manufacturing. In Southeast Michigan it is fair to assume that at least some of those displaced by economic restructuring have lost ground. Over the last decade, housing opportunities for minorities have greatly increased within the Livonia, Redford Township, and Westland. As more and more minorities live in middle- and upper-income neighborhoods in these communities, the relationship between race, income and housing needs within each community becomes less compelling. This is encouraging for the residents of all three communities since income and, presumably, housing conditions for minorities appear to be coming in line with those for the population as a whole. These circumstances are radically different from what was experienced in the past. This does not imply that racial- and ethnic-prejudice, and the tools used to enforce them, no longer exist. It may be that they are fading as more minorities succeed and are able to command the same privileges as non-minority populations. It may be as appropriate to address the causes of poverty and to address issues concerning gaining access to decent jobs (e.g. job skills, work attitudes, education, transportation, housing close to major employment centers etc.), as it is to focus on overtly discriminatory practices which have kept minorities from equal housing opportunities in the past. In order for communities to function well, there must be an adequate supply of housing in proximity to employment, public transportation, and community facilities. The housing stock must include affordable and accessible for sale and rental units, not only to meet social equity goals, but in order to ensure community viability. The development of a diverse and affordable housing stock must be carried out without sacrificing sound regulations that are in place to protect the environment and public health and safety. Fair and affordable housing issues transcend jurisdictional boundaries. Communities need to forge cross-jurisdictional partnerships to develop coherent long-term local housing policies that support a shared vision for housing and community development for the entire region. Coalition building, working toward consensus, and coordinating housing programs and resources are key tools and building blocks to addressing a multitude of housing issues. This Joint Analysis of Impediments to Fair Housing is an important step in analyzing housing related needs and issues that go beyond the boundaries of a single community. Through the partnership and shared vision of the three communities involved in this AI it is hoped that the shared impediments to fair housing can be addressed through shared solutions.
Impediments and Recommendations Impediment to Fair Housing #1: Public Perception of Exclusivity The public perception both within and beyond the AI Study Area is that the City of Livonia is exclusive and does not welcome minority households – especially as compared to either Redford Township or Westland.
Recommendation: It is suggested that to counter this perception of exclusivity the city should actively pursue an educational campaign. Additionally, it is presumed that this perception has begun to change over the last couple of years as more minority households have taken up residence. Despite this, Livonia (as well as Redford and Westland) could provide more educational opportunities that promote the community as inclusive and conduct outreach to minority and other disadvantaged residents.
Impediment to Fair Housing #2: Insufficient Housing for Special Needs Populations There are a number of households which have members with special needs, particularly among the frail elderly and those who need assistance to conduct one or more of life’s daily essential tasks. These individuals and households need additional assistance.

53
Recommendation: Continue, if feasible, the development and implementation of programs designed to address the needs of special needs populations. For example, the Westland Housing Commission has combined Section 8 Housing Vouchers with Medicaid Waivers to house the frail elderly in an independent living environment for longer than what might otherwise be possible. Initiatives like this, as well as working to provide transitional housing assistance to homeless veterans with HOME and Section 8 assistance are encouraging. However with each community, and the region as a whole, expected to significantly age (i.e. by 2035 more than one in four residents in the AI Study Area will be over the age of 65) each community will need to take additional and perhaps more drastic initiatives to provide the required services and housing choices for this growing population.
Impediment to Fair Housing #3: Lack of Affordable Housing for Developmentally-Disabled Persons Since the developmentally disabled have limited ability to secure decent affordable housing through their personal resources, they may be forced to live in inaccessible units, or share accommodations in order to pool resources. The lack of affordable housing for the developmentally disabled is therefore an impediment to fair housing.
Recommendation: All three communities should work with housing providers to ensure the offering of suitable and affordable housing to developmentally disabled individuals. The City of Livonia’s Mental Health Counseling Program and the City of Westland’s participation in the Southeast Michigan Community Alliance (SEMCA) are examples of allocating resources to provide mental health counseling and prevention services to low and moderate income residents.
Impediment to Fair Housing #4: Perceived School System Competitiveness Although beyond the scope of the AI, public perception of school performance informs housing choice, which affects social, income, and demographic patterns. When this occurs, minorities and lower-income persons tend to be hurt because they tend to be less able to afford the choices made by others. This can result in minorities and lower-income households living in segregated and inferior communities. Such an occurrence is an impediment to fair housing. Recommendation:
This impediment is similar in scope to Impediment #1 – public perception of exclusivity. As it relates to the school systems, Redford Township and Westland are perceived as less competitive than Livonia. It is suggested that to counter this perception of competitiveness the communities could actively pursue an educational campaign.
Impediment to Fair Housing #5: Insufficient Number of Rental Housing for Large Families There are few rental units (three or more bedroom), which are capable of housing large families. This condition may inhibit large families from finding affordable housing in the AI Study Area, especially in Livonia and Redford Township. Only the City of Westland provides subsidized housing units with three bedrooms or greater.
Recommendation: The construction of rental housing is largely the domain of private developers, over which the communities have little if any direct control. If possible, the communities should consider offering incentives, e.g. HOME funding, to developers who construct larger rental units, to encourage their development.
Impediment to Fair Housing #6: Disparate Mortgage Lending and Home Improvement Loan Rates The preceding analysis indicates that minorities, especially Black and Hispanic families, tend to experience higher loan denial rates than Whites in metropolitan Detroit. The data is too broad to draw specific conclusions regarding lending practices in the region, let alone the three communities in the AI Study Area, but the fact that disparate lending occurs among disadvantaged and minority populations is significant, even if the reasons are related to the applicant’s failure to meet standard underwriting criteria. Any increase in loan approval rates among minority applicants would improve their ability to obtain decent and affordable housing. More families would be able to purchase housing and more would be able to improve both their physical environment through improvement loans, and their financial situation, through refinancing. This is especially true in a time of unprecedented low mortgage rates. Although this is a fundamental issue affecting the entire nation, there are possible remedies within each of the cities’ control.
Recommendation: The three communities should continue and, if possible, expand their homebuyer counseling and credit counseling to individuals and families, as part of its housing programs. They may also provide post-purchase counseling to those who have purchased housing already.

54
Impediment to Fair Housing #7: Difficulty in Qualifying for Loans Given that poor credit history appears to be a major reason for loan denial, it would appear that financial counseling could assist lower-income families become more successful in acquiring Federally-insured mortgage assistance. Recommendation:
All three communities already have homeownership classes underway. However, each community could consider expanding or continuing the required pre-purchase housing counseling required under the Neighborhood Stabilization Program (NSP).
Fair Housing Action Plan The Fair Housing Action Plan includes the following components:
Impediment – brief description of impediment discussed in the AI.
Recommended Action – specific recommendations to address the impediment.
Recommended Participants – key communities, organizations, or groups whose participation is necessary to implement the recommended action.
Timeframe – when work on the recommended action is targeted to begin:
1. Short-term – Initiate the action within one year 2. Mid-term – Initiate the action within the next three years 3. Long-term – Initiate the action within the next five years 4. Ongoing – The action is currently being implemented or has been implemented in the past and should be
continued or enhanced during the next five years 5. New – The action has not been previously undertaken

55
Fair Housing Action Plan Impediment Description of
Impediment Recommended Action Recommended
Participants Timeframe
1. Public perception of exclusivity
The public perception both within and beyond the AI Study Area is that the City of Livonia is exclusive and does not welcome minority households – especially as compared to either Redford Township or Westland.
The City of Livonia should actively pursue an educational campaign. Additionally, it is presumed that this perception has begun to change over the last couple of years as more minority households have taken up residence. Despite this, Livonia (as well as Redford and Westland) could provide more educational opportunities that promote the community as inclusive and conduct outreach to minority and other disadvantaged residents.
- City of Livonia - Redford Township - City of Westland - Fair Housing Center
of Metropolitan Detroit
Mid-Term/Ongoing
2. Insufficient housing for special needs populations
There are a number of households which have members with special needs, particularly among the frail elderly and those who need assistance to conduct one or more of life’s daily essential tasks. These individuals and households need additional assistance.
Continue, if feasible, the development and implementation of programs designed to address the needs of special needs populations. With each community, and the region as a whole, expected to significantly age (i.e. by 2035 more than one in four residents in the AI Study Area will be over the age of 65) each community will need to take additional and perhaps more drastic initiatives to provide the required services and housing choices for this growing population.
- City of Livonia - Redford Township - City of Westland - Fair Housing Center
of Metropolitan Detroit - Non-profit & for-profit
Developers
Long-term/Ongoing
3. Lack of affordable housing for developmentally-disabled persons
Since the developmentally disabled have limited ability to secure decent affordable housing through their personal resources, they may be forced to live in inaccessible units, or share accommodations in order to pool resources. The lack of affordable housing for the developmentally disabled is therefore an impediment to fair housing.
All three communities should work with housing providers to ensure the offering of suitable and affordable housing to developmentally disabled individuals.
- City of Livonia - Redford Township - City of Westland - Fair Housing Center
of Metropolitan Detroit - Non-profit & for-profit
Developers - Housing providers - MSHDA
Long-term/Ongoing
4. Perceived school system competitiveness
Public perception of school performance informs housing choice, which affects social, income, and demographic patterns. When this occurs, minorities and lower-income persons tend to be hurt because they tend to be less able to afford the choices made by others. This can result in minorities and lower-income households living in segregated and inferior communities.
As it relates to the school systems, Redford Township and Westland are perceived as less competitive than Livonia. It is suggested that to counter this perception of competitiveness the communities could actively pursue an educational campaign.
- City of Livonia - Redford Township - City of Westland
Long-term/Ongoing
5. Insufficient number of rental housing for large families
There are few rental units (3+ bedroom), which are capable of housing large families. This condition may inhibit large families from finding affordable housing in the AI Study Area, especially in Livonia and Redford Township. Only the City of Westland provides subsidized housing units with three bedrooms or greater.
The construction of rental housing is largely the domain of private developers, over which the communities have little if any direct control. If possible, the communities should consider offering incentives, e.g. HOME funding, to developers who construct larger rental units, to encourage their development.
- City of Livonia - Redford Township - City of Westland - Non-profit & for-profit
Developers
Mid-term/Ongoing
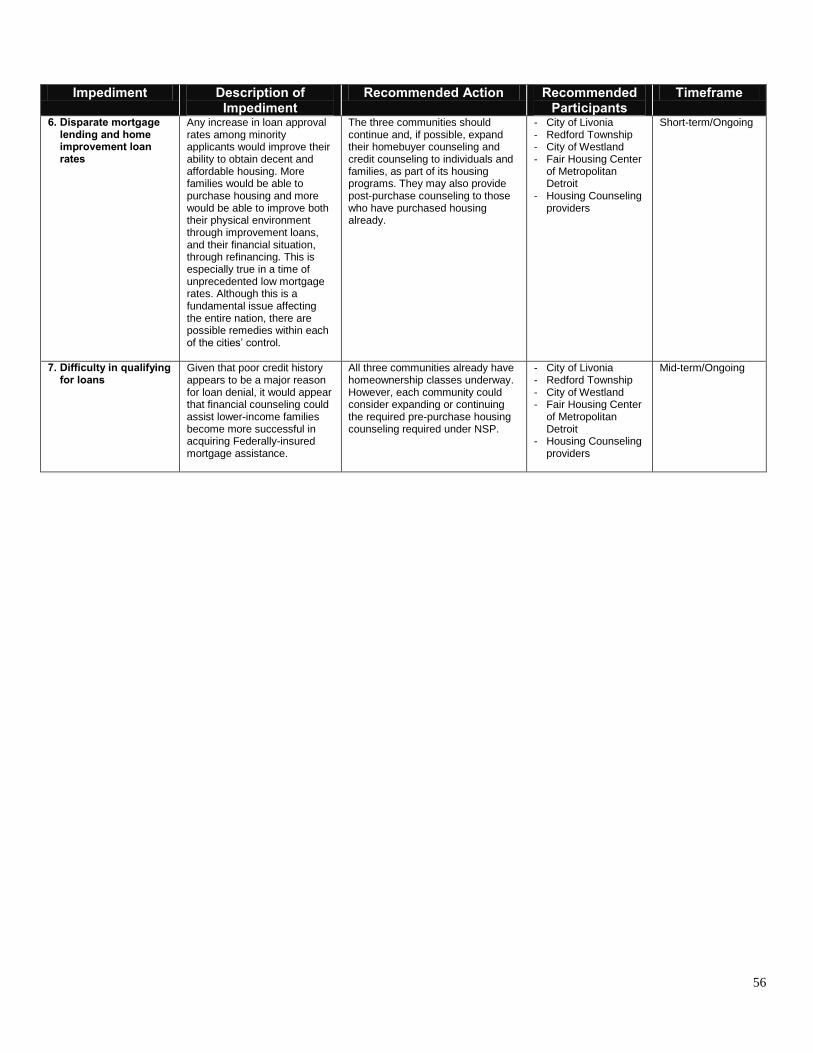
56
Impediment Description of
Impediment Recommended Action Recommended
Participants Timeframe
6. Disparate mortgage lending and home improvement loan rates
Any increase in loan approval rates among minority applicants would improve their ability to obtain decent and affordable housing. More families would be able to purchase housing and more would be able to improve both their physical environment through improvement loans, and their financial situation, through refinancing. This is especially true in a time of unprecedented low mortgage rates. Although this is a fundamental issue affecting the entire nation, there are possible remedies within each of the cities’ control.
The three communities should continue and, if possible, expand their homebuyer counseling and credit counseling to individuals and families, as part of its housing programs. They may also provide post-purchase counseling to those who have purchased housing already.
- City of Livonia - Redford Township - City of Westland - Fair Housing Center
of Metropolitan Detroit
- Housing Counseling providers
Short-term/Ongoing
7. Difficulty in qualifying for loans
Given that poor credit history appears to be a major reason for loan denial, it would appear that financial counseling could assist lower-income families become more successful in acquiring Federally-insured mortgage assistance.
All three communities already have homeownership classes underway. However, each community could consider expanding or continuing the required pre-purchase housing counseling required under NSP.
- City of Livonia - Redford Township - City of Westland - Fair Housing Center
of Metropolitan Detroit
- Housing Counseling providers
Mid-term/Ongoing

vettraino
Text Box
57

58
APPENDIX 1
Residential Building Permits
Livonia Single Family
Two Family
Attach Condo
Multi Family
Total Units
Total Demos
Net Total
2000 94 2 18 0 114 12 102 2001 99 0 56 0 155 18 137 2002 106 0 55 0 161 16 145 2003 75 0 163 0 238 17 221 2004 108 0 81 0 189 14 175 2005 127 0 69 0 196 12 184 2006 84 0 36 0 120 22 98 2007 38 0 0 0 38 12 26 2008 20 0 0 0 20 3 17 2009 10 0 0 0 10 8 2 2010 28 0 0 0 28 17 11
2000-2010 789 2 478 0 1,269 150 1,118
Redford Single Family
Two Family
Attach Condo
Multi Family
Total Units
Total Demos
Net Total
2000 13 0 0 0 13 3 10 2001 13 0 0 0 13 2 11 2002 18 0 0 0 18 0 18 2003 38 0 0 0 38 6 32 2004 50 0 0 0 50 4 46 2005 51 0 0 18 69 4 65 2006 32 0 0 0 32 30 2 2007 7 0 0 0 7 8 -1 2008 2 0 0 0 2 3 -1 2009 0 0 0 0 0 9 -9 2010 3 0 0 0 3 0 3
2000-2010 227 0 0 18 245 10 174
Westland Single Family
Two Family
Attach Condo
Multi Family
Total Units
Total Demos
Net Total
2000 82 0 8 0 90 12 78 2001 79 0 0 53 132 20 112 2002 88 2 78 50 218 7 211 2003 241 2 173 0 416 8 408 2004 158 0 95 0 253 11 242 2005 130 0 45 0 175 8 167 2006 59 0 16 0 75 21 54 2007 53 0 0 0 53 4 49 2008 29 0 12 0 41 3 38 2009 13 0 0 0 13 2 11 2010 5 0 0 0 5 13 -8
2000-2010 937 4 427 103 1,471 109 1,363 Out-Wayne County
Single Family
Two Family
Attach Condo
Multi Family
Total Units
Total Demos
Net Total
2000 2,808 20 659 257 3,744 345 3,399 2001 2,784 68 819 514 4,185 459 3,726 2002 2,605 204 1,103 243 4,155 293 3,862 2003 2,614 90 1,522 608 4,834 469 4,365 2004 3,000 82 1,808 577 5,467 354 5,113 2005 2,339 42 1,353 56 3,790 404 3,386 2006 1,439 10 614 20 2,083 545 1538 2007 656 4 104 0 764 431 333 2008 403 16 53 24 496 351 145 2009 223 2 10 52 287 442 -155 2010 314 4 35 0 353 400 -47
2000-2010 19,185 542 8,080 2,351 30,158 4,493 25,665 Source: SEMCOG Residential Building Permits, April 2011

APPENDIX 2 Fair Housing Survey (May 1-May 31, 2011)
Total Respondants: 34
Livonia 45.70%
Redford Township 5.70%
Westland 48.60%
Anglo/White 82.40%
African American/Black 11.80%
Hispanic/Chicano/Latino 0.00%
American Indian/Native American 0.00%
Asian/Oriental/Pacific Island 2.90%
Multi-racial 0.00%
Other 2.90%
Yes 15.60%
No (skip to question #7) 84.40%
Race 14.30%
Color 28.60%
Religion 14.30%
Sex 14.30%
National Origin 0.00%
Familial Status (family with one or more persons under 18 years of age) 42.90%
Disabled/handicapped 42.90%
Age 28.60%
Yes 45.50%
No 54.50%
Race 72.70%
Color 72.70%
Religion 63.60%
Sex 63.60%
Disability/Handicap 81.80%
Are you a resident of:
Which ethnic or cultural group you are considered a member:
Do you, or someone in your household, qualify as a "protected class"
If you answered "yes" to #6, to which protected class do you/your household
belong? (Check all that apply)
Do you have children under the age of 18 years?
Housing discrimination can occur if someone is denied housing or housing
financing based on which of the following categories (check all that apply):
vettraino
Text Box
59

Family Status (family with one or more persons under 18 years of age) 72.70%
National Origin 81.80%
Age 63.60%
Sexual Orientation 63.60%
Poor English Language Skills 54.50%
Citizenship Status 63.60%
Level of Income 72.70%
Source of Income (public assistance) 54.50%
Other (please list) 0.00%
Very Knowledgeable 8.80%
Somewhat Knowledgeable 41.20%
Not Knowledgeable 50.00%
Yes, I have 17.60%
Yes, a person I know has 5.90%
No (please skip to question #14) 76.50%
If yes, which of the following best describes the person or organization
that discriminated against you or the person you know?
Rental property manager/owner 75.00%
Seller of a housing unit 25.00%
Condominium or homeowner's association 0.00%
Real estate professional 0.00%
Loan officer or mortgage broker 12.50%
Municipal employee 0.00%
Other (please list) 0.00%
Rental apartment complex 50.00%
Individual housing unit for rent 25%
Individual housing unit for sale 25.00%
Condominiums for sale 0.00%
Real Estate Office 0.00%
Lending institution 12.50%
Public Housing Authority 0.00%
City Office 0.00%
Other (please list) 0.00%
How much do you know about Fair Housing Laws, including State of Michigan Fair
Housing Law?
Have you or anyone you know ever experienced housing discrimination?
What describes the location where the discrimination occurred?
vettraino
Text Box
60

Race 37.50%
Color 37.50%
Religion 0.00%
Sex 12.50%
Disability/Handicap 12.50%
Family Status 25.00%
National Origin 12.50%
Age 0.00%
Sexual Orientation 0.00%
Poor English lanuage skills 0.00%
Citizenship Status 0.00%
Level of Income 12.50%
Source of Income (public assistance) 0.00%
Race 37.50%
Color 25.00%
Ethnicity 25.00%
National Origin 25.00%
Sex 0.00%
Sexual Orientation 25.00%
Family Status 25.00%
Disability/Handicap 12.50%
Age 25.00%
Insufficient Income 50.00%
Lack of sufficient affordable housing 50.00%
Insufficient public transportation 37.50%
Municipal codes, ordinances, or regulations 0.00%
Other 0.00%
No 77.80%
Yes 22.20%
Spread throughout the city 79.40%
Concentrated in certain areas/neighborhoods 20.60%
Do you think affordable housing options are located throughout your city, or are
they concentrated in certain areas/neighborhoods?
Do you feel your housing choices are geographically limited to certain areas or
neighborhoods?
What do you see as current impediments to fair housing choices?
What do you believe was the basis for the discrimination you or the person you
know experienced?
vettraino
Text Box
61
No 45.50%
Yes 54.50%
Yes 79.40%
No 20.60%
Yes 69.70%
No 30.30%
Yes 87.90%
No 12.10%
Yes 90.90%
No 9.10%
Nothing 6.10%
I wouldn't know what to do 30.30%
Complain to the individual/organization that discriminated against me 30.30%
Contact City offices 54.50%
Contact my elected municipal representative 27.30%
Contact a local fair housing organization 42.40%
Contact HUD 21.20%
Contact a private attorney 21.20%
Contact the City Attorney 21.20%
Contact the State Attorney General 9.10%
Other (please identify) 6.10%
No 90.90%
Yes 9.10%
Do you feel that there is an adequate supply of affordable housing that is available
to all residents?
Do you perceive certain geographic areas or neighborhoods with our city to be
undesirable?
Do you feel that there is an adequate supply of affordable housing that is available
to disabled residents?
Do you feel there is an adequate supply of affordable housing that is available to
senior citizen residents?
Do you feel there is an adequate supply of affordable housing that is available to
residents with children?
What would you do, or did you do, if you were discriminated against in housing
choice? (check all that apply)
Are you familiar with the fair housing or social services provided by our city?
vettraino
Text Box
62
Yes 32.40%
No (please skip to question #24) 67.60%
Fair housing flyers or pamphlets 63.60%
Fair housing handbook 18.20%
Fair housing public service announcement on the radio 27.30%
Fair housing public service announcement on the television 18.20%
Other (please list) 18.20%
Yes 87.10%
No 12.90%
Very Effective 25.00%
Somewhat Effective 59.40%
Not Effective 15.60%
Public Meeting(s) 29.40%
Fair housing literature/information in public libraries and City Hall 47.10%
Television advertisements/announcements 50.00%
Radio advertisements/announcements 26.50%
Information on the City website 79.40%
Other (please describe) 17.60%
If you answered yes to question #22, what information have you seen/heard?
(check all that apply)
Do you think that adequate fair housing information is available in other language
translations?
In your opinion, how effective are the current fair housing laws, programs, and
enforcement mechanisms?
What do you feel would be the most effective ways to inform the residents about
their fair housing rights and/or responsibilities? (check all that apply)
Have you seen or heard information regarding the fair housing programs, laws, or
enforcement?
vettraino
Text Box
63