Fair Housing assessment For CinCinnati and Hamilton County
296
FAIR HOUSING ASSESSMENT FOR CINCINNATI AND HAMILTON COUNTY August 2019 Prepared by the Community Building Institute for the City of Cincinnati and Hamilton County
-
Upload
khangminh22 -
Category
Documents
-
view
0 -
download
0
Transcript of Fair Housing assessment For CinCinnati and Hamilton County

Fair Housing assessment For CinCinnati and Hamilton CountyAugust 2019
Prepared by the Community Building Institute for the City of Cincinnati and Hamilton County

Fair Housing Assessment for Cincinnati and Hamilton CountyAugust 2019
i
table oF ContentsExEcutivE Summary 1
Themes 5
community participation procESS 7Stakeholder Interviews 8
Geographically Based Focus Groups 9
Protected Class Focus Groups 10
Community Survey: Resident 12
Community Survey: Housing Professional 18
aSSESSmEnt of paSt GoalS and actionS 26
analySiS 35Demographic Summary 35
Segregation and Race 35
Racially Integrated Communities 41
Age Characteristics 50
Racially/Ethnically Concentrated Areas of Poverty (R/ECAPs) 50
Disparity in Access to Opportunity 57
Access to Employment 66
Access to Quality Schools 71
Environmental Issues 75
Access to Capital 77
Disproportionate Housing Needs 78
Cost Burden 78

Fair Housing Assessment for Cincinnati and Hamilton CountyAugust 2019
ii
Young Families 87
Young Adults 88
Limited Options for Seniors 88
People with Disabilities 89
Poor Housing Conditions 93
Publicly supported housing 95
Evictions and Foreclosures 100
Homelessness 102
Housing Supportive Services 104
Unwelcoming Communities 105
Contributing Factors 106
Land Use and Zoning 111
Planning and Comprehensive Approaches to Community Development 112
Plan Implementation 113
Lack of Regional Cooperation 115
fair HouSinG GoalS and prioritiES 116Summary of Recommendations 117
Goals and Milestones 118

Fair Housing Assessment for Cincinnati and Hamilton CountyAugust 2019
iii
appEndix a: additional SupplEmEntal information 122
appEndix B: liSt of StakEHoldEr intErviEwS 124
appEndix c: fair HouSinG aSSESSmEnt- rESidEntial SurvEy rESultS 128
appEndix d: fair HouSinG aSSESSmEnt- HouSinG profESSional SurvEy rESultS 186
appEndix E: dEmoGrapHicS of puBlicly SupportEd HouSinG dEvElopmEntS, By proGram catEGory: city of cincinnati 225
appEndix f: dEmoGrapHicS of puBlicly SupportEd HouSinG dEvElopmEntS, By proGram catEGory: Hamilton county 231
appEndix G: fair HouSinG lawS and compliancE 233
appEndix H: air quality in winton tErracE and SprinG GrovE villaGE 241
appEndix i: Hamilton county icma fEllowSHip data 244

Fair Housing Assessment for Cincinnati and Hamilton CountyAugust 2019
iv
maps, tables, and CHarts3 Map 1: Hamilton County
Housing Patterns
14 Survey Chart 1: Renters and Owners: Percent of Monthly Income Spent on Housing
18 Survey Chart 2: Respondents Role in Regional Housing Market
19 Survey Map
20 Survey Chart 3: Market Segments that Housing Professionals Would Like to Serve
25 Survey Chart 4: Housing Discrimination Observed in Region by Housing Professionals
36 Map 2: Black and White Areas of Poverty
37 Map 3: Black and White Areas of Poverty - Trends
38 Table 1: Demographics
39 Table 2: Demographics Trends
40 Table 3: Racial/Ethnic Dissimilarity Trends
47 Map 4: Demographic: Non-White or Black Population
48 Map 5: National Origin
49 Map 6: Non-Black and -White Concentrated Areas of Poverty - Trends
51 Map 7: Racially/Ethnically Concentrated Areas of Poverty
52 Table 4: R/ECAP Demographics
58 Table 5: Opportunity Indicators, by Race/Ethnicity
60 Map 8: Households with Limited Transportation Options
61 Map 9: Job Density in the OKI Region and Metro Bus Access
62 Map 10: Hamilton County Grocery Stores and Hospitals Local and Express Routes
63 Map 11: Hamilton County Grocery Stores and Hospitals Metro Bus Routes With 30 Minute Daytime Frequencies or Better
64 Map 12: Low Transportation Cost
65 Map 13: Transit Trips Index
67 Map 14: Job Hubs (Cincinnati Chamber, OKI, REDI Partnership)

Fair Housing Assessment for Cincinnati and Hamilton CountyAugust 2019
v
68 Map 15: Labor Market Index
69 Map 16: Jobs Proximity Index
72 Map 17: Percent Households That Are Families with Children
73 Map18:SchoolProficiencyIndex
74 Map 19: Hamilton County School Districts
76 Map 20: Environmental Health Index
79 Table 6: Demographics of Households with Disproportionate Housing Needs
80 Table 7: Demographics of Households with Severe Housing Cost Burden
81 Map 21: Percent Households With Burden
82 Map 22: Cost Burdened: Extremely Low Income Households
83 Map 23: Cost Burdened: Extremely Low Income Owner Households
84 Map 24: Cost Burdened: Extremely Low Income Renter Households
85 Map 25: Percent Households Who Are Renters
86 Map 26: Percent Households Who Are Owners
89 Table 8: Disability by Type
90 Map 27: Disability: Hearing, Vision, Cognitive
91 Map 28: Disability: By Age
92 Map 29: Disability: By Ambulatory, Self-Care, Independence Living
95 Table 9: Publicly Supported Housing Units by Program Category
96 Map 30: Publicly Supported Voucher Units
97 Map 31: Publicly Supported Housing
98 Table 10: Publicly Supported Households by Race/Ethnicity
99 Table 11: R/ECAP and Non-R/ECAP Demographics by Publicly Supported Housing Program Category
100 Table 12: Census Tract Racial Composition by Eviction Filing Rate (percent non-Hispanic Black)
101 Map 32: Average Eviction Filing Rate by Census Tract, 2014-2017
1Fair Housing Assessment for Cincinnati and Hamilton CountyAugust 2019
This Fair Housing Assessment for Cincinnati and Hamilton County report provides an overview of the impediments of fair housing issues in the area. As recipients of federal funding through the U.S. Department of Housing and Urban Development, the City and the County are required to affirmatively further fair housing and conduct periodic analyses of impediments to fair housing choices. This report focuses primarily on issues of housing choice related to the classes protected by federal, state, and local laws. Federal law prohibits housing discrimination based on race, color, national origin, religion, sex, disability, or family status. Military and ancestry status are protected classes in the State of Ohio. In the City of Cincinnati, protected classes also include marital status, Appalachian origin, sexual orientation, and transgender status.
In addition to stakeholder outreach, focus groups were conducted with protected classes as well as geographically based outreach. Also, two surveys were conducted for County residents and housing professionals. A total of eight geographically based focus groups were conducted along with a total of six protected class focus groups. Current fair housing was analyzed to identify barriers to fair housing including information associated with revitalizing neighborhoods and the extent to which the neighborhoods are accessible to protected classes and how transportation relates to employment and housing options.
Following the housing crisis of 2008, urban regions across the country are struggling to address the lack of affordable housing supply within their housing markets. The national factors for this problem include reductions in federal funding to provide affordable housing, stagnation of wages, an aging housing stock, urban sprawl, and lack of housing supply as well as increasing demand for real estate within urban regions after years of population loss and disinvestment. Within Hamilton County, the trend of population decline has slowed, and the region appears poised for population growth. The 2020 Census will provide evidence of how the County’s population has changed over the past decade.
The region has experienced a market resurgence and a trend toward urban revitalization in downtown Cincinnati and nearby neighborhoods, and also in locations throughout the County like Silverton and Woodlawn. Coupled with the County’s and City’s efforts to encourage
exeCutive summary

2Fair Housing Assessment for Cincinnati and Hamilton CountyAugust 2019
population growth – including redevelopment, investment in transportation, and promotion of the region – local, state, and national factors that collectively affect affordable housing availability have highlighted the continuing need for local action to address affordable housing.
In Hamilton County, the households most impacted by rising housing costs are those with the lowest incomes. A recent study found there were more than 40,000 Hamilton County households with incomes of 30% or less of Area Median Income (AMI) living in housing that was not affordable to them - which means 72% of these very-low income households were cost burdened. Across all income levels, there were nearly 100,000 households that were cost burdened. The significant shortage of affordable housing causes extreme stress for low-and moderate-income households and exposes protected classes to even more discriminatory behavior, as they compete for increasingly fewer available units.
The successes this region has experienced in the urban core are felt differently in different parts of the County. Map 1 illustrates these differences. The Downtown/Over-the-Rhine, basin and Uptown markets are stabilizing and attracting new public and private investments. Suburban markets, particularly on the eastern and western sides of the County have fully recovered from the recession. Historic segregation and poverty patterns are changing as more Black households move into suburban locations on the west side of Cincinnati and the north and north central parts of Hamilton County. The Lower Mill Creek communities and other Racially/Economically Concentrated Areas of Poverty (R/ECAP) continue to see persistent poverty and lack of opportunity. There are also parts of Hamilton County and Cincinnati that have remained stable, integrated communities with healthy housing markets, and schools that have supported diverse populations for decades. Communities like College Hill and Kennedy Heights in Cincinnati and Silverton, Woodlawn, Forest Park and Golf Manor in Hamilton County were identified in the Stable Integrated Communities Report published by the Wilder Foundation in 2007 as having been integrated in the 1970’s and continue to be welcoming opportunity communities today.
Many of these integrated communities are less fiscally stable than they were ten years ago. They struggle to keep property maintenance standards intact, residential property values stable, and school performance high as increasing numbers of poor families move into their communities. In order for these communities to continue to serve as welcoming communities of opportunity, they are going to need support to address growing poverty and declining public revenues. For more information on these, please see Appendix I (Hamilton County ICMA Fellowship Data).

3Fair Housing Assessment for Cincinnati and Hamilton CountyAugust 2019
Map
1: H
amilt
on C
ount
y H
ousi
ng P
atte
rns

4Fair Housing Assessment for Cincinnati and Hamilton CountyAugust 2019
Map 1 illustrates in brown these communities in north and north central Hamilton County and Cincinnati. The areas shown in red are the racially segregated White parts of the County. Those on the east side have all recovered from the 2008 recession and most are in a stronger position today than they were in 2007; while this is true for some of the suburban communities on the west side, it is not true for all of them. Delhi Township and Whitewater Township show market weakness and growing poverty. Those areas in green are areas with long-term persistent poverty that provide limited opportunities for residents. Areas in downtown and Uptown Cincinnati, shown in purple, are in transition. New public and private investments in infrastructure and commercial and residential investments are changing markets and generating jobs. Quickly rising housing prices in some places are displacing long-time residents and reducing the number of available affordable units. From focus groups, these changes are disproportionately affecting Black households and low- and moderate-income households.
Discrimination against protected classes and housing affordability are two separate issues but they are so tightly intertwined that one requires addressing the other. From the State of Black Cincinnati 2015 report, Black households are much more likely to live in neighborhoods of concentrated poverty with access to lower performing schools and poor access to jobs. The proportion of people experiencing homelessness are also disproportionately members of a protected class; Blacks, veterans, and young people between the ages of 18 and 24. Immigrants and refugees are also much more likely to be living in housing in very poor condition and in areas of concentrated poverty than White families.
This pattern of development shows itself over and over in the following analysis and may point to some positive ways to improve the lives of protected class residents in the County. The following themes run through the data, focus groups and interview findings.

5Fair Housing Assessment for Cincinnati and Hamilton CountyAugust 2019
themesat risk protected classes: Young mothers with children, residents with disabilities, and young people (ages 18-24) are experiencing significant housing challenges and the most overt discrimination. Young people who are aging out of the foster care system and young people that identify as LBGTQ (lesbian, gay, bisexual, transgender, and questioning (or queer)) are particularly vulnerable to housing discrimination and insecurity. Residents with disabilities are extremely limited in their options for housing and often have to endure lengthy processes to receive reasonable accommodations.
lack of resources: There are not enough resources currently allocated to serve the housing needs of protected classes or low- and moderate-income people.
poor physical conditions in affordable rental units: Housing conditions are poor and getting worse for immigrants, refugees and others trying to secure housing at less than $900 a month.
lack of access to public transit: The lack of public transportation keeps many opportunity areas off limits to people who would like to choose them.
lack of coordination among current partners: The current system of housing agencies and organizations that provide support services is uncoordinated, underfunded, and incredibly complex to navigate; often leaving those in need with no help.
opposition to new units: Land use regulations, lack of competitive access to state and federal tax credits and other funding opportunities, and resident opposition are making production of new affordable and moderately priced housing very difficult.
lack of access to capital for home and rental unit maintenance: Lack of access to capital for low- and moderate-income homeowners and rental property owners puts owners and tenants at risk of displacement and makes the maintenance of existing, affordable rental and owner-occupied units a challenge.
Geographic disparity: The 49 jurisdictions in Hamilton County and the 52 neighborhoods in Cincinnati are responding to these challenges very differently –
• A revitalizing urban core is making many housing units that were affordable no longer available and pushing Black households and low-income residents out of these communities.

6Fair Housing Assessment for Cincinnati and Hamilton CountyAugust 2019
• The north central neighborhoods in the City and a norther cluster of communities in the County are successfully integrating and provide housing opportunities for a diverse group of residents.
• Areas of Cincinnati located in the near west side, our Racially and Ethnically Concentrated Areas of Poverty (R/ECAP), are persistently underinvested and experiencing very significant distress - these communities are home to refugee, immigrant, and black households that face significant housing insecurity and other significant barriers to upward mobility.
• Far eastern and western suburban communities in Hamilton County, and eastern communities in Cincinnati, continue to be very segregated with a majority white population. While they may represent opportunity areas for many residents, members of protected classes do not know about these communities and often cannot get there because of lack of access to public transportation, and lack of affordable housing in these areas.

7Fair Housing Assessment for Cincinnati and Hamilton CountyAugust 2019
In order to gain a better understanding of fair housing issues and to assess the ability of people in protected classes to access housing they choose, in the places that they want to live, the Community Building Institute (CBI) engaged in a rigorous community engagement process. Stakeholder interviews were conducted with ten housing professionals and those working to serve people who struggle to find adequate housing.
In addition, two kinds of focus groups were conducted. CBI met with protected class residents in the City and the County to discuss how they access housing and the kinds of challenges they face. Two of these focus groups were held as part of a two-day Fair Housing Summit co-hosted by Housing Opportunities Made Equal of Greater Cincinnati (HOME) and the Community Building Institute (CBI) November 1- 2, 2018. These focus groups concentrated on barriers to fair housing for people with disabilities. There were also geographically based focus groups hosted in communities across the County, both in City neighborhoods and County communities, to identify trends in different parts of the County.
Finally, two surveys were conducted; one for any County resident, and a second for housing professionals including developers, realtors, government officials, and lenders. The survey was open for one month from mid-January to mid- February 2019. Full interview lists, focus group questions, surveys and complete survey results are included in the Appendices B to D.
Community partiCipation proCess

8Fair Housing Assessment for Cincinnati and Hamilton CountyAugust 2019
stakeholder interviewsStakeholder interviews were conducted in October and November of 2018 with 18 separate organizations that work in housing issues in the region. Those interviewed include executive directors of organizations, case managers who work directly with clients, housing providers, lenders and staff at the City, the County, the Cincinnati Metropolitan Housing Authority (CMHA), the Legal Aid Society of Greater Cincinnati, and HOME, among others. Highlights of each of the individual interviews are included in Appendix B.
A summary of the key findings from these interviews follows:
• Service providers struggle to connect with reliable housing providers who can accommodate their clients.
• Service providers are dedicating a significant amount of time and resources to helping their clients navigate the voucher system and network of emergency services supports that are designed to help those at risk for losing their housing.
• Housing providers struggle to connect their tenants with other services.
• There are not nearly enough resources to serve those who are struggling to find housing.
• There is very little coordination between housing service agencies and housing providers.
• Transportation is an issue for everyone’s clients.
• There are opportunity areas all over the County that protected class residents never even consider because there is no public transportation and housing is assumed too expensive.

9Fair Housing Assessment for Cincinnati and Hamilton CountyAugust 2019
geographically based Focus groupsIn order to understand the housing market and the experiences of protected classes in different parts of the County, the Community Building Institute conducted 8 “geographically based” focus groups. CBI met with residents and appointed and elected officials and other housing partners to understand market dynamics and the different experiences people are having throughout the region. The full list of locations and focus groups along with the co-hosts for each session are included in Appendix B. In meeting with people in different parts of the County, it was discovered that in different sub-markets there were very different experiences for protected classes.
• Central Hamilton County feels like an integration success story – local jurisdictions need support as more low-income households move into small communities with little in the way of supports.
• Rising prices in historically Black neighborhoods in the basin, Uptown, and near east side neighborhoods are displacing Black residents and exacerbating housing shortages for many.
• There is reported discrimination based on race in eastern and western suburbs. Based on interviews this ranges from being steered away from units to being shown poor quality units to excessive neighbor complaints about behavior, particularly of children, to police calls that seem unnecessary or even inappropriate.
• Immigrant residents in the Lower, East, and West Price Hill and other near west side neighborhoods are living in units in very poor condition.
• Deteriorating property conditions in affordable units region-wide pose difficult choices for residents – they must decide whether to stay in unsafe and unhealthy conditions, or lose housing altogether.

10Fair Housing Assessment for Cincinnati and Hamilton CountyAugust 2019
protected Class Focus groups CBI had open discussions with people in protected classes to understand what is experienced wherever they were in the region. Five protected class focus groups were conducted. Insights from the geographically based focus groups also supported these findings. Conversations were held with people in comfortable groups in settings they were used to and get the truest picture of how they experience the housing market. The following is a summary of their voices and thoughts.
• Young Black mothers with children and people with disabilities are among the most housing challenged.
• When people try to access services or find housing using the many “help lines,” “clearing houses,” or “one-stop resources” they experience very long wait times and lines to get little or no help.
• Young adults, those 18-24 years of age, including those aging out of foster care and other young adults on their own face housing discrimination based on age and lack the supports to be self-sufficient. Some youth manage to access vouchers or rental assistance but many are unable to access resources, and therefore remain in very unstable housing situations.
• Seniors are often trapped in housing that does not serve their needs, or that they cannot afford, because there are few other options for them
• Deteriorating property conditions in affordable units region-wide pose difficult choices for residents – they must decide whether to stay in unsafe and unhealthy conditions, or lose housing altogether.
• Housing units at the low end of the market are often in very poor condition and getting worse.
• Immigrant families report unsafe and unsanitary conditions with very few recourses or allies to resolve issues. Residents trying to resolve issues by withholding rent are often starting the string of events that leads to eviction.

11Fair Housing Assessment for Cincinnati and Hamilton CountyAugust 2019
• Housing counselors at HOME, Legal Aid and other agencies advise people to continue paying the rent while the agencies try to negotiate with property owners or place rent in escrow.
• A general fear of retaliation by property owners, lack of understanding about escrow, and an often slow process of enforcement on property owners causes tenants to remain in extremely poor units.
• When tenants with a Housing Choice Voucher are deciding whether or not to leave a unit that is not meeting their needs, they are forced to walk a fine line of finding a new unit in time so they do not lose their voucher.

12Fair Housing Assessment for Cincinnati and Hamilton CountyAugust 2019
Community survey: resident In total, 494 respondents completed the Fair Housing Assessment Resident Survey. The survey was designed to better understand resident’s perceptions and experiences with housing in the Hamilton County region. The survey was open to any resident of Hamilton County. Survey respondents included residents from over 90 communities in the County.
The majority of survey respondents reported being home owners, while about 1 in 4 survey respondents reported being renters. Very few respondents reported living with family or friends or having a different living situation. Although the breakdown is not demographically representative of Hamilton County, it is believed the survey findings provide valuable insights into the status of housing in this region.
The majority of renters reported renting from private property owners (81%) and less than 10% of renters reported living in HUD project-based properties of Cincinnati Metropolitan Housing Authority housing. About 10% of respondents answered an “other” type of rental housing. Only 6% of respondents reported using a Housing Choice Voucher. Less than 5% of survey respondents reported that their household had experienced homelessness in the past three years and less than 2% of respondents reported having been evicted in the past three years. Just over 40% of survey respondents had lived in their current residence for over 10 years and 10% of respondents had lived in their residence for 6-10 years. Almost half of respondents (47%) had lived in their current residents for five years or less.
Slightly less than half of survey respondents (44%) reported that their household structure was “married or unmarried couple”. Another 26% of respondents reported living alone and 14% of respondents identified their household structure as a married or unmarried couple with children under 18. About 6% of respondents reported having a family household with adult children.
Overall, 72% of survey respondents identified as white and 22% of respondents identified as Black. Less than 3% of survey respondents identified as being a member of a Spanish, Hispanic or Latino group.

13Fair Housing Assessment for Cincinnati and Hamilton CountyAugust 2019
annual Household income of respondents• 14% - $29,999 or less annually
• 19% - $30,000-49,999 annually
• 37% - $50,000-$99,999 annually
• 30% - $100,000 or more annually
Employment Status of respondents• 62% - employed full time (32+ hours a week)
• 18% - retired
• 8% - employed part time
• 4% - disabled, not able to work
• 4% - other
• Less than 4% - not employed, either not employed but looking for work or not looking for work
top reasons for picking current Housing
For respondents overall, the top five reasons selected for choosing their current housing were: (1)To be near work/job opportunities, (2) It’s what I can afford, (3) To be near stores, goods and services I need, (4)To be near family and friends and (5)The neighborhood is safe.
For renters, the top reason for picking the place that they live was affordability. For extremely low income respondents (earning less than $15,000 annually) their top reasons for picking the place that they live was affordability, having good access to transportation and the neighborhood being safe.
Housing cost Burden and overall Satisfaction
Overall, just over half of the survey respondents reported spending less than 30% of their monthly income on housing. However, 35% of respondents reported spending 30-50% of their monthly income on housing, meaning they are cost burdened, and 10% of respondents reported spending over 50% of their monthly income on housing.
62% of owners reported spending less than 30% of their monthly income on housing expenses compared to only 35% of renters. Another 32% of owners reported spending between 30% and 50% on housing expenses compared to 45% of renters who reported spending between

14Fair Housing Assessment for Cincinnati and Hamilton CountyAugust 2019
30% and 50% of their monthly income on housing expenses. Almost 1 in 5 renters reported spending over 50% of their monthly income on their housing.
Low income respondents reported spending a significantly higher percentage of their monthly income on housing. For extremely low-income respondents (less than $15,000 annual income), 83% of respondents reported spending more than 30% of their monthly income on housing. In addition, 68% of respondents earning $15,000-$49,999 annually reported spending more than 30% of their monthly income on housing.
Renters were significantly more likely to report being dissatisfied with their housing. Just over 1 in 5 renters reported being somewhat dissatisfied or very dissatisfied with their housing, compared 1 in 20 respondents who identified as owners.
Survey Chart 1: Renters and Owners: Percent of Monthly Income Spent on Housing
Survey Question: How much of your monthly income do you spend on housing? (Including rent and essential utilities like electricity, water, waste and gas)

15Fair Housing Assessment for Cincinnati and Hamilton CountyAugust 2019
Housing challenges and factors that limit Housing options
Respondents overall reported that “the cost of housing going up”, “other challenges”, “having problems with their neighbors”, “poor unit conditions”, “not feeling safe in their housing,” and “units not being handicapped accessible” were the top housing challenges they faced. Respondents who selected that there were “other” top challenges indicated that housing maintenance and repair costs, increasing property taxes and utility costs, and challenges with unit/house not meeting their needs as they get older were challenges.
Black respondents and renters sited that “property owners not being responsive” was a key challenge, which was rated higher than “not feeling safe in their housing” or “the unit not being handicapped accessible.” In addition, 22% of respondents who identified as renters reported that their unit was unhealthy (mold, insect problems, lead paint). Homeowners also identified not having decent access to public transportation as a key challenge.
overall respondents:• Cost of housing is going up.
• Other- housing repair and maintenance costs, increasing property tax and utility costs, challenges with unit/house not fitting needs as you get older.
• I am having problems with my neighbors.
• Condition of my unit is poor.
• I don’t feel safe in my housing.
• Unit is not handicapped accessible.
Respondents who reported having moved in the past 2 years were asked about what issues limited their housing options. Overall, respondents reported that affordability, credit history, lack of pet friendly options, not being able to find a unit large enough for their family and units being listed as available but not actually being available as the top issues that limited their housing options.
Homeowners also indicated that “property owners not accepting their income level” and “not feeling welcomed in the neighborhood where they wanted to live” were top issues that limited their housing options. Renters indicated that “not knowing how to find housing options” was a top issue and respondents with Housing Choice Vouchers identified “property owners not accepting vouchers” and “eviction history” as top issues. Hispanic and Black respondents indicated that “not being shown units where they want to live” was a key issue limiting their housing options.

16Fair Housing Assessment for Cincinnati and Hamilton CountyAugust 2019
Housing discrimination and lack of feeling comfortable
Overall, 1 in 4 respondents reported that they have at least “sometimes” felt uncomfortable or discriminated against in their neighborhood. Three in four respondents reported that they “seldom” (37%) or “never” (38%) have felt discriminated against in their neighborhood.
The top five reasons that residents have reported feeling uncomfortable or discriminated against in their neighborhood were: (1) Race/ethnicity, (2) Something else, (3) Color, (4) Age and (5) Sex. When defining “something else,” respondents primarily indicated issues related to safety, including crime and drug activity, their income level, and differing political views. Renters and homeowners reported the same top five reasons as survey respondents overall. Between 56% and 62% of renters and owners who selected “age” as a reason for being discriminated against indicated that it was because of being “too old.” Black and White survey respondents also reported the same top five reasons.
Respondents who reported being employed full-time and those earning $30,000-70,000 in annual income, as well as higher income respondents, reported top reasons for discrimination that were consistent with overall survey respondents. There were not a significant number of respondents who reported over $200,000 in annual income who responded to these questions. Respondents who identified as disabled-not able to work, retired, and less than $30,000 in annual income prioritized “source of income” in their top reasons for feeling uncomfortable or discriminated against in their neighborhood.
Being treated differently when looking for Housing
The overwhelming majority of respondents reported that they did not feel treated differently than other people looking for housing, but 11% of respondents reported that they did feel treated differently than others. Renters were three times more likely (21%) to report having been treated differently than owners (7%). Similarly, respondents who reported less than $30,000 in annual household income (31%) were three times more likely to report having been treated differently than respondents who reported $30,000- $99,999 in annual household income (10%). Only 5% of respondents who reported an annual household income of over $100k reported being treated differently.
When asked what respondents perceived as the reason they were treated differently, the top five reasons were their race/ethnicity, color, age, source of income and “something else.” These top reasons tracked closely with the reasons respondents reported feeling uncomfortable or discriminated against in their neighborhood. When respondents explained the “something

17Fair Housing Assessment for Cincinnati and Hamilton CountyAugust 2019
else” that played a role, interestingly a few respondents indicated that they had received more privileged or preferential treatment and therefore had an easier time looking for housing than others.
Respondents who reported less than $30,000 in annual household income reported that “a disability” was one of the top 5 reasons they felt they had been treated differently when looking for housing. Those respondents also reported that their children were a top (6th) reason they felt they had been treated differently. Black respondents also sited their family status (having children under age 18 living in their household or they are pregnant) and their children as top reason they felt they had been treated differently.
loan applications and approvals
Overall, 70% of survey respondents reported not having applied for a loan to make home improvements or get a mortgage in the last three years. A little over 1 in 4 respondents reported having applied for a loan and being approved and only 5% reported applying and being denied. A few respondents reported that their loan applications were denied because of the current value of their home. One respondent described the issues in the following statement: “I needed to get equity out to make major repairs, but the appraisal was too low to borrow money to make repairs to make the house appraise at a higher rate. So... the house will eventually fall apart around me. Yay, circular logic?”
It is important to note that 42% of the overall survey respondents reported having lived in their current housing unit for over 10 years. In addition, 31% of respondents reported having lived in their unit for 2-5 years and another 16% of respondents reported living in their unit for 1 year or less.

18Fair Housing Assessment for Cincinnati and Hamilton CountyAugust 2019
Community survey: Housing professionalIn total, 218 respondents completed the Fair Housing Assessment Survey for Housing Professionals. When asked to identify their role in the housing market in the region, just under one in three survey respondents selected “other” when describing their role. These respondents reported being property managers, housing advocates, housing counselors or social workers or case managers, members of housing services agencies and housing inspectors. Almost one in four respondents reported their role as a “Community Development Professional” and just over one in five respondents identified “Property owners with rental property.” In addition, 14% of respondents identified at Real Estate Agents. Government employee, developers, and housing lenders made up the remaining respondents. Respondents were given the option to select more than one role in the housing market.
Survey Chart 2: Respondents Role in Regional Housing Market
Survey Question: What best describes your role in the housing market in the region? (Please select all that apply.)

19Fair Housing Assessment for Cincinnati and Hamilton CountyAugust 2019
Survey respondents reported working in diverse parts of the Hamilton County region. The highest numbers of respondents reported working in the Downtown Basin and Near East Side regions of the County (see map), while the lowest number of respondents reported working in the Suburban regions. The majority of respondents reported a long tenure in the Hamilton County market. Just over 60% of respondents reported having worked the region for over 10 years.
Survey Map

20Fair Housing Assessment for Cincinnati and Hamilton CountyAugust 2019
Market Segments: Who do you serve and who do you want to serve?
Overall, one in four respondents reported serving the low-income rental market (average unit rent $500-$800) and another 17% of respondents reported serving the moderate rate rental market (average unit rent $700- $1,000). Market rate rental (average unit rent $900-$1,500), market rate owner-occupied units (average unit price $150,000- $349,000), moderate rate owner-occupied units (average unit price $50,000- $149,999) and low income owner-occupied units (average unit price $30,000- $49,999) were each reported as being served by between 12% and 13% of respondents.
When asked what market segments housing professionals would like to serve, the low income rental market (average unit rent $500-$800) was the most frequently identified. This was closely followed by the moderate rate rental market (average unit rent $700- $1000) and moderate rate owner occupied market (average unit price $50,000-$149,999), as well as low income home owner occupied units (average unit price $30,000- $49,999) and the market
Survey Question: What market segments would you like to serve? (please select all that apply)
Survey Chart 3: Market Segments that Housing Professionals Would Like to Serve
Housing Lender
Property owner
with rental property
Developer Government Employee
Other Community Development Professional
Real Estate Agent
Housing Lender
Property owner
with rental property
Developer Government Employee
Other Community Development Professional

21Fair Housing Assessment for Cincinnati and Hamilton CountyAugust 2019
rate rental market (average unit rent $900-$1,500). Property owners with rental property, Community development professionals, developers, government employees, and those who identified as “other” responded with a stronger appetite for wanting to serve low and moderate income renters. Almost half of the rental property owners (48%) reported owning one to five rental units and another 21% of rental property owners reported owning 100 or more units.
While many of the survey respondents reported wanting to serve low income renters, across the board housing professionals reported low income renters and low income owners as the most difficult segments of the market to serve. Moderate rate rental and moderate rate owner occupied markets were reported as the next most difficult to serve. Real estate agents also reported that high end renters and owners were difficult to serve. Just under two in five survey respondents reported that local jurisdictions are unwilling to approve affordable housing types and just over one in four respondents reported that the jurisdictions are unwilling to approve multi-family housing types.
Reasons Housing Professionals Find it Hard to Serve Low-Income Households
The top five reasons identified by overall survey respondents tracked closely among different types of housing professionals. While difficulty getting financing did not show up in the top five list of overall respondents (it was sixth), difficulty getting financing did show up in the top five reasons cited by real estate agents, rental property owners, developers, government employees and community development professionals. Developers also cited “other” under their top five reasons.
top 5 reasons that low income households are hard to serve:1. Incomes/ lack of ability to pay2. The numbers don’t work, costs more to produce a unit that
people can afford3. Not enough subsidies available4. Affordable units do not exist in places where low income
households want to live5. Poor credit history-credit scores
When asked what makes moderate income households hard to serve, the top five reasons mirrored the reasons cited for what made low income households hard to serve with a couple of exceptions. Difficulty getting financing was the top reason cited for what makes moderate income households hard to serve and poor credit history-credit scores came in as a close sixth.

22Fair Housing Assessment for Cincinnati and Hamilton CountyAugust 2019
top 5 reasons for real estate agents that low-income households are hard to serve:1. Incomes/ lack of ability to pay2. Affordable units do not exist in places where low-income
households want to live 3. The numbers don’t work, costs more to produce a unit that
people can afford4. Difficulty getting financing5. Poor credit history-credit scores
top 5 reasons for property owners with rental property that low-income households are hard to serve:
1. Incomes/ lack of ability to pay2. The numbers don’t work, costs more to produce a unit that
people can afford3. Difficulty getting financing4. Not enough subsidies available5. Poor credit history-credit scores6. Affordable units aren’t available where low-income
households want to live (tie)
top 5 reasons for developers that low-income households are hard to serve:1. The numbers don’t work, costs more to produce a unit that
people can afford2. Not enough subsidies available3. Incomes/ lack of ability to pay4. Difficulty getting financing5. Other
top 5 reasons for community development professionals that low-income households are hard to serve:
1. The numbers don’t work, costs more to produce a unit that people can afford
2. Not enough subsidies are available3. Incomes/lack of ability to pay4. Difficult getting financing5. Poor credit history-credit scores

23Fair Housing Assessment for Cincinnati and Hamilton CountyAugust 2019
top 5 reasons for government employees that low-income households are hard to serve:1. Not enough subsidies are available2. Incomes/lack of ability to pay3. The numbers don’t work, costs more to produce a unit that
people can afford4. Poor credit history-credit scores5. Difficulty getting financing
Barriers in the Housing industry
The top five reason identified by overall survey respondents tracked closely among different types of housing professionals. Among real estate agents, keeping good tenants and “other” barriers tied as their fifth highest ranking barriers. Those issues did not show up for other types of providers. The cost of units not matching people’s ability to pay was the top barrier reported by developers, real estate agents, CDC professionals, and government employees.
Overall, respondents identified the top 5 barriers in the housing industry as:1. The cost of units does not match people’s ability to pay2. Lack of financing3. Subsidies are not available4. Available subsidies are not practical5. Local jurisdictions are unwilling to approve needed housing
types
top 5 barriers reported by developers:1. The cost of units does not match people’s ability to pay2. Lack of financing3. Subsidies are not available4. Available subsidies are not practical5. Local jurisdictions are unwilling to approve needed housing
types
top 5 barriers reported by real estate agents:1. The cost of units does not match people’s ability to pay2. Lack of financing3. Subsidies are not available4. Available subsidies are not practical5. Keeping good tenants 6. “Other” (tie)

24Fair Housing Assessment for Cincinnati and Hamilton CountyAugust 2019
top 5 barriers reported by community development corporation (cdc) professionals1. The cost of units does not match people’s ability to pay2. Subsidies are not available3. Lack of financing4. Available subsidies are not practical5. Local jurisdictions are unwilling to approve needed housing
types
top 5 barriers reported by government employees1. The cost of units does not match people’s ability to pay2. Subsidies are not available3. Lack of financing4. Local jurisdictions are unwilling to approve needed housing
types5. Available subsidies are not practical
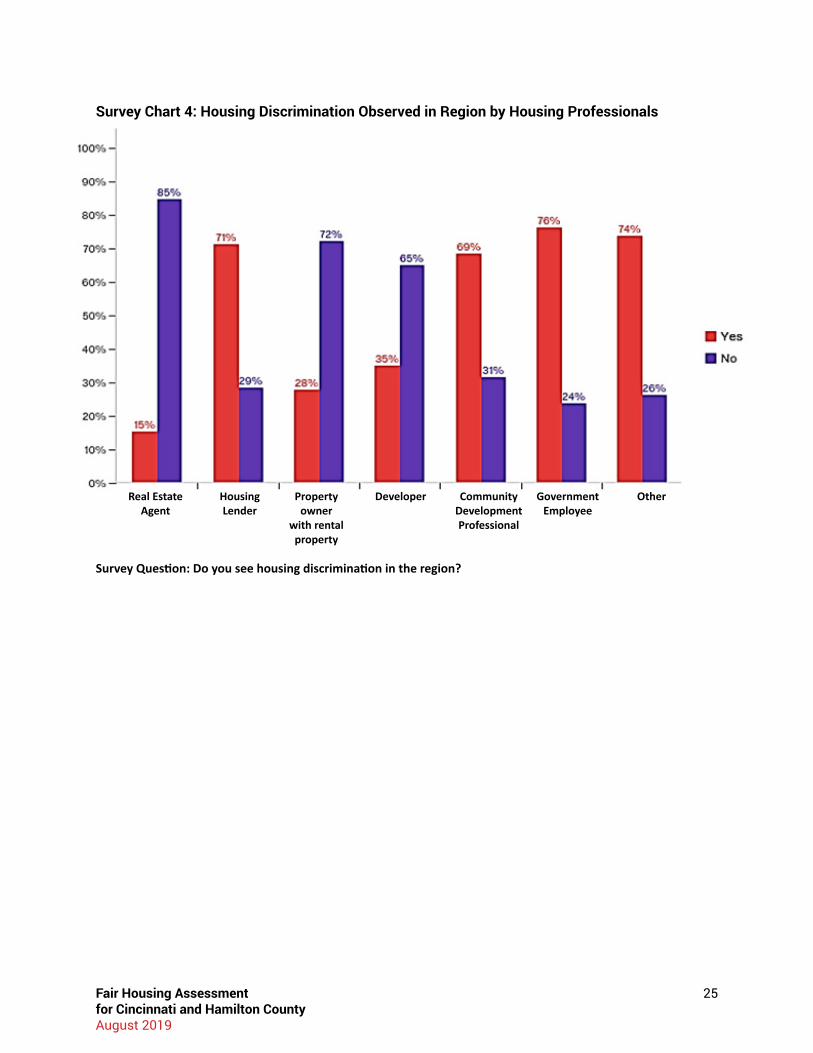
Housing Discrimination in the Region
Overall, the majority of respondents (55%) reported that they see housing discrimination in the region. Respondents did not overwhelmingly pinpoint the discrimination to specific geographic areas of the region. However, the Downtown/Basin region, Near East Side region and Near West Side regions were the areas where the highest number of respondents recognized discrimination. Community development professionals, government employees, and housing lenders were more likely to recognize housing discrimination in the region. Real estate agents, property owners with rental property and developers were the least likely to report that there is housing discrimination in the region.
Do you see housing discrimination in this region?
The top things that respondents believed discrimination was based on were (1) Race/ethnicity, (2) Source of Income, (3) Color, (4) Disability, and (5) Limited English. These were followed closely by undocumented status and family status.
Respondents perceived discrimination to be slightly more prevalent in the Downtown/ Basin, Near East and West Side and Uptown regions compared to the Near North Side and suburban regions.
25Fair Housing Assessment for Cincinnati and Hamilton CountyAugust 2019
Real Estate Agent
Housing Lender
Property owner
with rental property
Developer Government Employee
Other Community Development Professional
Survey Chart 4: Housing Discrimination Observed in Region by Housing Professionals
Survey Question: Do you see housing discrimination in the region?

26Fair Housing Assessment for Cincinnati and Hamilton CountyAugust 2019
assessment oF past goals and aCtionsAn important part of the Fair Housing Assessment is to review the past efforts of the City and the County in this area, and to assess progress made on past plans and recommendations. The following is an assessment of the specific recommendations made in the last Fair Housing Assessment of 2014 and done in consultation with the City and the County as well as other housing partners in the region. The City, County, and most of the local government jurisdictions (cities, villages, and townships) faced significant financial challenges during the past five years and resources for housing assistance in each respective jurisdiction have not kept pace with demand.
Both the City and the County have faced significant financial challenges in the past five-year period and prioritizing housing investments has not been high on the list for either jurisdiction. Over this same period, it has become increasingly clear that housing affordability is a major issue and needs attention. The kinds of change that will be needed to create more open housing markets in this region that result in more options for protected classes remains a politically charged set of issues that the City, County, and the 49 other jurisdictions in the County will have to reckon with if true progress is going to be made.
What follows is an intentional effort by both the City and the County to address the recommendations of the 2014 Fair Housing Assessment with limited resources and a lack of priority around these topics. Even given limited resources, it is clear both staffs want to effect change and improvements in the lives of protected class residents.
previous recommendation 1.0: Support implementation of the Sorta Go forward plan. Encourage county jurisdictions to work with Sorta on increasing public transportation services in additional communities.
Over the past five years there has been very little forward movement on increasing access to public transportation, and it is becoming a critical issue for the region. Housing providers, residents who use public transportation, low-income and disabled

27Fair Housing Assessment for Cincinnati and Hamilton CountyAugust 2019
residents and jurisdictions that would like enhanced public transportation are all frustrated by the lack of progress on improving METRO and expanding service in parts of the county currently not served. In fact METRO is projected to face a significant budget deficit by 2020 if no additional revenue is identified, a situation that would trigger another round of service cuts, fee increases and put METRO into further financial distress. The SORTA Go Forward Plan is a good blueprint for enhancing the system and providing better service, but very little progress has been made on the Plan to date. The SORTA Board made a decision in fall of 2018 not to forward a ballot issue that would have created additional revenue. While the City, the County, and the Chamber of Commerce all realize the need, and have expressed some understanding of the urgency system users feels they have yet to act on changes. A bus users group, the Better Bus Coalition, have indicated that they will be supporting a citizen-led initiative to forward a ballot measure in fall 2019.
Both City and County administrative staff have been working with SORTA staff to make improvements to the system where they can. With the first extension of service, the County and SORTA recently instituted a route that would serve the Kings Mills area and Sinclair Community College north of I-275.
The City is actively working to better integrate bike ways and cycling into the overall transportation system as well including creating shared bike lanes, installing bike racks, bike sharing, and creating independent bike ways such as the Wasson Way trail.
previous recommendation 2.1: in adopting cincinnati’s new land development code, consider removal zoning classifications based on who lives in the residential property.
The City of Cincinnati has been in the process of implementing a major update to their development regulations in a unified Land Development Code for several years with a Sustainable Communities Grant from Department of Housing and Urban Development (HUD). The recommendation to remove the classifications that create different requirements depending on the relationships of those living in a unit are being considered, but have not yet been approved. The City reports that work on the Land Development Code may be completed sometime in 2019 or 2020.
previous recommendation 2.2: cincinnati establishes an administrative “reasonable accommodation” procedure that is separate from the formal zoning variance process to expedite reasonable accommodation requests and make them less burdensome.

28Fair Housing Assessment for Cincinnati and Hamilton CountyAugust 2019
The City requires a permit, not a zoning process, for the installation of ramps on the exterior of a building. In cases where these installations do not meet the current zoning setback or yard regulations a variance may still be required.
The City has made other improvements to the process encouraging new construction projects and substantial renovations to consider accessibility and visitability guidelines. For those making “visitable” accommodations to one-, two-, and three-unit properties, tax abatements can be extended beyond the normal term. The City has also created specific “visitability” standards for public projects and strengthened the language in city contracts around expectations for Americans with Disabilities Act (ADA) compliance.
previous recommendation 2.3: provide fair housing training for local zoning and building staff.
The City has worked with Housing Opportunities Made Equal (HOME), who hosted an in-service training with building and housing professionals on the Fair Housing in 2016. The County has made similar training available to their staff. While HOME is providing training and coaching to jurisdictions on a regular basis their funding from the City and the County has been reduced over this planning period and there has not been a sustained effort to keep this training going.
previous recommendation 3.0: Encourage cmHa to maintain its scattered site inventory and assist it in obtaining funding to maintain and expand scattered site public and affordable housing.
The Cincinnati Metropolitan Housing Authority currently has 1,344 units located in scattered sites across the County, about 25% of the total public housing units available in Hamilton County. The number of scattered site units that CMHA directly controls has not changed significantly between 2014 and 2018. The location of new scattered site units had been an ongoing challenge, particularly in the western suburbs where there has been active opposition to new projects.
New projects in north central Hamilton County have been a more positive development. Mt. Healthy and Colerain Township have new CMHA senior housing projects and Woodlawn is working with CMHA on a proposed senior housing project.

29Fair Housing Assessment for Cincinnati and Hamilton CountyAugust 2019
previous recommendation 3.0.1: require all city-funded residential development to follow inclusionary housing policies as required by law as recommended in plan cincinnati
There are no inclusionary zoning provisions in the current Cincinnati Zoning Code or in any other applicable zoning code in the County. Through a competitive award process, Cincinnati prioritizes funding for housing at 30% of Area Median Income (AMI) and housing that is mixed- income in its current criteria for project selection for housing development funds. In looking at residential housing project characteristics, projects that target lower area median incomes as well as mixed income housing projects have the ability to score higher in the evaluation process.
The County has located housing units in suburban locations since 2015, primarily using HOME Investment Partnerships funds. These units have been located in integrated communities in the north central parts of the County.
previous recommendation 3.1.2: advocate fair housing standards throughout the region as recommended in plan cincinnati.
This is a broad recommendation. Both the City and the County, elected and appointed officials, have acknowledged the need for more affordable housing throughout the region, particularly in areas that present opportunities for good schools, access to employment, and transportation. Regional partners like the United Way of Greater Cincinnati, the Greater Cincinnati Foundation, and the Child Poverty Collaborative have also identified housing affordability as an important regional priority. Housing Affordability in Hamilton County, a report produced by the Community Building Institute in 2017 and supported by Local Initiatives Support Corporation (LISC) of Greater Cincinnati and Northern Kentucky, identified 40,000 households with incomes of 30% or less of Area Median Income (AMI) living in housing that was not affordable to them. Across all income levels, there were nearly 100,000 households that were cost burdened. The City established an Affordable Housing Trust Fund in late 2018 and announced $700,000 would go to the fund in February 2019.
There has been much less discussion of the barriers to good housing for people in protected classes. The Urban League of Greater Southwest Ohio published The State of Black Cincinnati in 2015, a report that illustrated the significant gap in housing choices and opportunity for Black residents in the region compared to White residents. The hopeful news is that housing affordability has risen to the level of regional priority; the disheartening news is that there has been insufficient progress to improve life on the ground for many residents from protected classes, particularly if they are also poor.

30Fair Housing Assessment for Cincinnati and Hamilton CountyAugust 2019
previous recommendation 4.1.1: work with cincinnati community councils and county jurisdictions to encourage welcoming initiatives and become more inclusive in leadership development and civic activities.
The kinds of activities and initiatives that promote new civic leadership and more inclusive decision-making at a neighborhood or local jurisdiction level typically happen in individual communities. Planning initiatives, leadership development trainings and recruiting efforts that expand the diversity of civic space in this region are widespread. Initiatives like Place Matters, a comprehensive community development strategy supported by LISC and a regional Local Advisory Committee, which includes the City the County, United Way, and other local philanthropy and lending institutions, works to support these kinds of efforts in communities in Cincinnati and northern Kentucky. Invest in Neighborhoods and the Community Building Institute have teamed to create training and support for these kinds of activities. Invest in Neighborhoods’ annual neighborhood summit always supports and encourages diverse leadership.
Leadership in many Community Councils still does not always reflect the demographics of the community. This is true for Cincinnati neighborhoods and suburban jurisdictions in the County. Some very concerted efforts in this area are underway in places like Westwood, East Westwood, Silverton, Deer Park, and many other communities in the City and in the central and northern Hamilton County suburbs. The Greater Cincinnati Foundation and United Way have been working to fund new leadership and programs and agencies run by Black and minority executives.
previous recommendation 4.1.2: ask community councils to annually report the composition of their Boards compared to their community.
While this has been discussed and Community Council leadership and Invest in Neighborhoods had promoted this idea, it has not been implemented.
previous recommendation 4.1.3: fund and support fair housing testing and enforcement activities to mitigate discrimination in housing (plan cincinnati recommendation).
The City and the County both fund HOME to conduct fair housing testing and enforcement. Between 2015 and 2018, the funding levels devoted to this activity have remained flat by the County and reduced slightly by the City. The Legal Aid Society of Greater Cincinnati is an important partner that protects tenants from housing discrimination and in particular unlawful eviction. Although the funding levels for

31Fair Housing Assessment for Cincinnati and Hamilton CountyAugust 2019
this activity have been reduced slightly by both the City and the County over the past several years, there has been an investment of $612,000 between 2015 and 2018, serving 9,500 persons to help support fair housing.
previous recommendation 4.2: Encourage cmHa to review the Housing choice voucher (Hcv) program to make the program more acceptable to rental property owners. work with cmHa to track families with vouchers who live in low-poverty communities in Hamilton county.
CMHA hosts regular sessions with interested property owners throughout the year to educate them on the HCV process and requirements. They also host Saturday sessions quarterly to connect property owners with units to rent with voucher holders looking for units. Property owners regularly complain that meeting the standards to qualify a property are onerous, too time consuming, and not worth the effort when there are so many potential renters that are looking for units and do not have vouchers. Tenants with vouchers have also complained that when they find a unit and a willing property owner, they cannot get their unit approved for the voucher because the process takes a long time and because HUD standards seem to require unnecessary improvement. These complaints are system-wide. These observations are in the context of other residents who complain of horrendous conditions in units available at affordable rents.
There are more HCV units in the suburban parts of the County today than there were in 2000. We know from focus group interviews and resident and housing professional surveys that there are parts of the County that many voucher holders do not consider because they are thought to be too expensive, not served by public transportation, and not welcoming to them. Suburbs to the east and west are typically mentioned in this context. Residents who never explore these opportunity locations don’t report discrimination, but current residents in some eastern and western locations report that they believe discrimination based on race takes place regularly.
previous recommendation 4.3.0: Support adding source of income protection to ohio’s fair housing law.
Source of income protections do not currently exist. Housing advocates locally have been reviewing national best practices on this topic and LISC and Affordable Housing Advocates (AHA) have been working with Legal Aid, the City and the County to explore this recommendation.

32Fair Housing Assessment for Cincinnati and Hamilton CountyAugust 2019
previous recommendation 4.3.1: continue city and county support for the mobility program to help more families find rental opportunities in the neighborhoods of their choice.
Due to lack of funding from the City and County, HOME ended their mobility program. City funds previously used for this activity were redirected to other high priority public service activities. The County redirected funds to support foreclosure prevention. While HOME continues to counsel households in opportunity locations, there is no formal program. Based on focus group interviews and resident survey results, there is a lack of awareness of what is available in these locations. The lack of reliable public transportation also makes many communities seem impractical or unattainable to residents who depend on public transportation.
previous recommendation 5.1: Explore options to increase staff capacity to work with Spanish-speaking residents in the government that take complaints and enforce laws related to housing conditions. provide language training for current employees. work with existing non-profit organizations such as Su Casa and Santa Maria Services who provide services to these residents.
While the Spanish-speaking population in the region has grown by 7,000 to just over 8,000 since 2010, there has not been significant progress on this issue. The City does provide housing, health, and building inspectors with the ability to call on a contractor who is available to translate during inspections, and in taking complaints, however this service is not always used. Latino residents in Price Hill in particular report awful housing conditions in units that are available to them and a reluctance to report complaints for fear of losing their housing. These complaints include insect infestation, inoperable plumbing, doors and windows that do not lock, drywall damage, and water leaks. Housing advocates from Santa Maria Community Services, Su Casa Hispanic Center, and HOME support residents when they want to file a complaint, and often encourage them to do so, but many severe housing code violations go unreported and uncorrected because people are not comfortable with the processes available to them. Information gathered through focus groups find that Burundi refugees have similar problems with very poor property conditions and a fear of reporting these issues.
previous recommendation 5.2: Encourage and support community events that engage immigrant families as neighbors, potential business customers and parents.
The City and the County host events throughout the year that are designed to attract diverse residents. They also support community groups who host events.

33Fair Housing Assessment for Cincinnati and Hamilton CountyAugust 2019
In communities where there are concentrations of Spanish-speaking residents (like Lower Price Hill, East Price Hill, West Price Hill, and Carthage) events featuring Latin traditional food, music, and culture have been attracting more immigrants. Community organizations and schools like Roberts Paideia Academy and the Academy of World Languages, both Cincinnati Public elementary schools, play an important role in connecting families to the larger community. The City also annually funds a Neighborhood Support Program that provides community councils with financial resources to facilitate programs/events that promote civic engagement.
Previous Recommendation 6.0: Support more financial education, analyze existing services provided by local nonprofits in the area to answer question and explain the mortgage process and conduct outreach on homeownership and lending.
There are many homeowner training programs in the region. The Home Ownership Center, Working in Neighborhoods (WIN), Habitat for Humanity of Greater Cincinnati, have all been conducting homebuyer training for over a decade. The City and County ensure that homebuyer education it provides funding for is consistent with the HUD Final Rule for Housing Counseling, and housing counselors are HUD-certified housing counselors. The City and County have worked with Habitat to make sure minority clients know about opportunities that are available.
Many of the organizations and resources that might be available to potential homebuyers are focused on eviction prevention, basic financial stability, and emergency assistance. Access to capital for protected classes in the City and the County continues to be a significant issue for many potential homebuyers, and for existing homeowners who need to be able to access loan products to maintain homes.
previous recommendation 7.1: provide funding assistance for low and moderate-income renters to make accessibility modifications in Cincinnati and the balance of Hamilton County.
Both the City and the County have funds available to property owners who have residents who need modifications to better accommodate their needs. The City and County also have funds available to low income homeowners who need to make these modifications. In both cases the resources available do not adequately address the needs of those who need accommodations. In 2018, there were 21,959 people with ambulatory difficulty in the City of Cincinnati and another 28,197 people in Hamilton County. In many of the focus groups conducted as part of this work, lack of access to accommodations for residents with a disability was one of the most often cited

34Fair Housing Assessment for Cincinnati and Hamilton CountyAugust 2019
difficulties people have with their housing. Complaints to HOME regarding problems disabled residents are having with property owners unwilling or unable to respond to their request for accommodations represented about 70% of the HOME complaints addressed in 2018, and have been the largest single type of complaint HOME addressed annually for at least the last five years. The County, which administers its own program in house, has also found property owners that are reluctant to make accessibility modifications.
In the last few years, the City has invested $583,000 in the Compliance Assistance Repairs for the Elderly (CARE) program assisting 81 elderly homeowners. The CARE program provides funding to extremely low-income, elderly homeowners to correct exterior home violations.
previous recommendation 7.2: provide support and assistance to neighborhood groups providing housing for people with mental disabilities. Train elected officials in the City and the county on fair housing, particularly the rights of people with disabilities.
Housing that is accessible and workable for people with disabilities, some of the most vulnerable neighbors, which is affordable to them continues to be one of the most challenging issues this region faces. Housing for people with mental disabilities can be the most challenging. Talbert House has approximately 24,000 clients in any year and of these many have housing issues. Organizations who provide services for clients with mental health issues who have housing challenges often have such a hard time finding housing for their clients that many of these organizations have begun developing housing of their own to support their clients. They report having difficulty in many Cincinnati neighborhoods and Hamilton County communities with siting such housing. They can meet with significant resistance from neighbors.
While some communities, including Kennedy Heights, Northside, and others, are taking active steps to create a more welcoming environment, they are in the minority. In the fall of 2018, HOME and CBI hosted a two day workshop and training on the topic of finding ways to introduce more intentional housing for all kinds of people with disabilities into your community. There were over 100 people at the session.
35Fair Housing Assessment for Cincinnati and Hamilton CountyAugust 2019
analysis
demographic summary According to the 2013 - 2017 American Community Survey 5-year estimates, there are about two million people in the Greater Cincinnati region. Cincinnati (the region’s largest city) has an estimated population of 298,957 and Hamilton County (the region’s largest county) has an estimated population of 808,703. Both the City and the County’s population inched up slightly 1.5% and 1.4% respectively from 2010. The Cincinnati-Middletown Metropolitan Statistical Area is home to some of the fastest growing suburban counties in the State of Ohio (Butler and Warren counties) and rapid suburban growth in Northern Kentucky. The rapid move to farther suburban regions in the 1990’s and early 2000’s seems to have slowed in recent years. Cincinnati and Hamilton County, the center of the region, have seen a revitalization and strengthening of housing markets and a growth in employment. In the region, Hamilton County and the City of Cincinnati remain majority White. The County’s share of Black population is estimated to be 26.5% for 2017, and for the City’s the share is estimated at 42.9%, both up slightly from the 2009-13 estimate. This region has not been a significant destination for immigrants and refugees over the years. Hispanic and Latino residents make up just 3.3% of the County’s total population and 3.6% of the City’s total population, but they are rising much more quickly than in the past, and more quickly than other groups. See Tables 1 and 2 for complete demographics and demographic trends dating back to 1990.
segregation and race Maps 2 and 3 illustrate a pattern of racial segregation in the County. The first map shows the Black population concentrated in Cincinnati, along the western Mill Creek hillside, and in the near east side communities of Avondale, Evanston, Walnut Hills, Bond Hill, Roselawn, and Winton Hills. There is also a Black population in central Hamilton County between eastern Colerain Township and west of the I-75 corridor. Eastern and western suburban communities in Hamilton County remain largely White as well as Cincinnati neighborhoods including Mt.

36Fair Housing Assessment for Cincinnati and Hamilton CountyAugust 2019
Map
2: B
lack
and
Whi
te A
reas
of P
over
ty

37Fair Housing Assessment for Cincinnati and Hamilton CountyAugust 2019
Map
3: B
lack
and
Whi
te A
reas
of P
over
ty -
Tren
ds

38Fair Housing Assessment for Cincinnati and Hamilton CountyAugust 2019
Table 1: Demographics
Race/Ethnicity # % # % # %White, Non-Hispanic 144,404 48.63% 356,719 78.08% 1,723,455 81.50%Black, Non-Hispanic 130,857 44.07% 71,235 15.59% 253,816 12.00%Hispanic 8,235 2.77% 11,322 2.48% 54,992 2.60%Asian or Pacific Islander, Non-Hispanic
5,603 1.89% 8,145 1.78% 41,245 1.95%
Native American, Non-Hispanic
549 0.18% 614 0.13% 3,272 0.15%
Two or More Races, Non-Hispanic
6,571 2.21% 8,004 1.75% 34,557 1.63%
Other, Non-Hispanic 725 0.24% 851 0.19% 3,243 0.15%National Origin #1 country of origin India 1,410 0.51% Mexico 2,366 0.55% Mexico 11,301 0.57%#2 country of origin Mexico 1,400 0.51% India 2,147 0.50% India 11,174 0.56%#3 country of origin Guatemala 1,191 0.43% Guatemala 924 0.22% China excl.
Hong Kong & Taiwan
5,674 0.29%
#4 country of origin Other Western Africa
1,129 0.41% Germany 853 0.20% Guatemala 3,922 0.20%
#5 country of origin China excl. Hong Kong & Taiwan
995 0.36% Other Western Africa
773 0.18% Germany 3,314 0.17%
#6 country of origin Canada 512 0.19% China excl. Hong Kong & Taiwan
758 0.18% Philippines 2,962 0.15%
#7 country of origin Other Eastern Africa
488 0.18% Korea 673 0.16% Vietnam 2,895 0.15%
#8 country of origin Germany 448 0.16% Vietnam 600 0.14% Canada 2,849 0.14%#9 country of origin Korea 416 0.15% Philippines 553 0.13% Japan 2,516 0.13%#10 country of origin Ethiopia 352 0.13% Canada 520 0.12% Korea 2,186 0.11%Limited English Proficiency (LEP) Language#1 LEP Language Spanish 3,925 1.42% Spanish 3,713 0.87% Spanish 18,935 0.96%#2 LEP Language French 999 0.36% African 852 0.20% Chinese 3,369 0.17%#3 LEP Language African 858 0.31% Vietnamese 515 0.12% African 2,481 0.13%#4 LEP Language Chinese 466 0.17% French 511 0.12% Vietnamese 2,195 0.11%#5 LEP Language Arabic 383 0.14% Russian 454 0.11% French 2,119 0.11%#6 LEP Language Cambodian 187 0.07% Chinese 378 0.09% Russian 1,629 0.08%#7 LEP Language Other Indic
Language172 0.06% German 375 0.09% Japanese 1,596 0.08%
#8 LEP Language German 169 0.06% Korean 355 0.08% German 1,345 0.07%#9 LEP Language Korean 165 0.06% Other Indic
Language312 0.07% Arabic 1,199 0.06%
#10 LEP Language Vietnamese 126 0.05% Other Asian Language
205 0.05% Other Indic Language
975 0.05%
Disability Type Hearing difficulty 8,205 3.04% 14,229 3.36% 67,344 3.44%Vision difficulty 7,579 2.80% 8,440 1.99% 41,143 2.10%Cognitive difficulty 17,231 6.37% 20,244 4.78% 97,662 4.99%Ambulatory difficulty 21,959 8.12% 28,197 6.65% 131,412 6.71%Self-care difficulty 7,833 2.90% 10,619 2.51% 48,858 2.50%Independent living difficulty
15,217 5.63% 19,990 4.72% 90,741 4.64%
SexMale 142,504 47.99% 219,186 47.97% 1,033,702 48.88%Female 154,439 52.01% 237,704 52.03% 1,080,878 51.12%AgeUnder 18 66,009 22.23% 111,427 24.39% 527,230 24.93%18-64 198,853 66.97% 277,798 60.80% 1,329,345 62.87%65+ 32,081 10.80% 67,665 14.81% 258,005 12.20%Family TypeFamilies with children 29,711 47.56% 52,782 43.47% 248,984 45.70%
Table 1 - Demographics
Note 1: All % represent a share of the total population within the jurisdiction or region, except family type, which is out of total families.Note 2: 10 most populous places of birth and languages at the jurisdiction level may not be the same as the 10 most populous at the Region level, and are thus labeled Note 3: Data Sources: Decennial Census; ACSNote 4: Refer to the Data Documentation for details (www.hudexchange.info/resource/4848/affh-data-documentation).
(Cincinnati, OH-KY-IN) Region(Cincinnati, OH CDBG, HOME, ESG) Jurisdiction (Hamilton County, OH CDBG, HOME, ESG)

39Fair Housing Assessment for Cincinnati and Hamilton CountyAugust 2019
1990
Tre
nd20
00 T
rend
2010
Tre
ndCu
rren
t19
90 T
rend
2000
Tre
nd20
10 T
rend
Curr
ent
Race
/Eth
nicit
y #
%#
%#
%#
%#
%#
%#
%#
%W
hite
, Non
-Hisp
anic
218,
046
60.3
6%17
4,52
452
.83%
144,
404
48.6
3%14
4,40
448
.63%
407,
057
89.1
1%39
2,07
984
.46%
356,
719
78.0
8%35
6,71
978
.08%
Blac
k, N
on-H
ispan
ic 13
5,76
337
.58%
143,
199
43.3
5%13
5,72
145
.71%
130,
857
44.0
7%42
,332
9.27
%57
,006
12.2
8%76
,245
16.6
9%71
,235
15.5
9%Hi
span
ic2,
316
0.64
%4,
123
1.25
%8,
235
2.77
%8,
235
2.77
%2,
481
0.54
%4,
808
1.04
%11
,322
2.48
%11
,322
2.48
%
Asia
n or
Pac
ific
Islan
der,
Non-
Hisp
anic
3,83
71.
06%
5,79
41.
75%
6,59
02.
22%
5,60
31.
89%
3,95
60.
87%
7,46
21.
61%
9,78
42.
14%
8,14
51.
78%
Nativ
e Am
erica
n, N
on-
Hisp
anic
557
0.15
%1,
420
0.43
%1,
184
0.40
%54
90.
18%
438
0.10
%1,
693
0.36
%1,
849
0.40
%61
40.
13%
Natio
nal O
rigin
Fore
ign-
born
9,93
12.
75%
12,2
753.
72%
13,3
194.
49%
15,2
885.
15%
10,6
132.
32%
13,2
282.
85%
19,5
974.
29%
19,6
454.
30%
LEP
Limite
d En
glish
Pr
ofici
ency
5,94
91.
65%
7,57
72.
29%
7,04
92.
37%
8,17
52.
75%
5,24
21.
15%
6,72
11.
45%
9,59
62.
10%
9,41
32.
06%
Sex
Mal
e16
8,19
246
.60%
155,
823
47.1
7%14
2,50
447
.99%
142,
504
47.9
9%21
8,58
047
.83%
222,
297
47.8
9%21
9,18
647
.97%
219,
186
47.9
7%Fe
mal
e19
2,71
453
.40%
174,
515
52.8
3%15
4,43
952
.01%
154,
439
52.0
1%23
8,45
552
.17%
241,
897
52.1
1%23
7,70
452
.03%
237,
704
52.0
3%Ag
eUn
der 1
890
,336
25.0
3%83
,725
25.3
5%66
,009
22.2
3%66
,009
22.2
3%12
1,48
026
.58%
126,
156
27.1
8%11
1,42
724
.39%
111,
427
24.3
9%18
-64
220,
223
61.0
2%20
5,70
362
.27%
198,
853
66.9
7%19
8,85
366
.97%
277,
025
60.6
1%27
1,98
658
.59%
277,
798
60.8
0%27
7,79
860
.80%
65+
50,3
4713
.95%
40,9
0912
.38%
32,0
8110
.80%
32,0
8110
.80%
58,5
3012
.81%
66,0
5214
.23%
67,6
6514
.81%
67,6
6514
.81%
Fam
ily T
ype
Fam
ilies
with
child
ren
42,1
0250
.86%
34,0
0451
.75%
29,7
1147
.56%
29,7
1147
.56%
61,0
6648
.43%
54,2
6848
.32%
52,7
8243
.47%
52,7
8243
.47%
1990
Tre
nd20
00 T
rend
2010
Tre
ndCu
rren
t#
%#
%#
%#
%1,
601,
562
87.3
9%1,
691,
611
84.8
0%1,
723,
455
81.5
0%1,
723,
455
81.5
0%20
3,29
211
.09%
238,
796
11.9
7%27
3,54
012
.94%
253,
816
12.0
0%9,
298
0.51
%22
,446
1.13
%54
,992
2.60
%54
,992
2.60
%13
,761
0.75
%28
,583
1.43
%49
,053
2.32
%41
,245
1.95
%2,
206
0.12
%8,
616
0.43
%9,
779
0.46
%3,
272
0.15
%
31,8
501.
74%
51,2
862.
57%
81,4
503.
85%
88,3
044.
18%
18,8
661.
03%
29,1
671.
46%
39,4
611.
87%
42,5
272.
01%
880,
689
48.0
6%96
8,69
248
.56%
1,03
3,70
248
.88%
1,03
3,70
248
.88%
951,
624
51.9
4%1,
026,
138
51.4
4%1,
080,
878
51.1
2%1,
080,
878
51.1
2%
490,
800
26.7
9%54
1,82
927
.16%
527,
230
24.9
3%52
7,23
024
.93%
1,12
5,60
761
.43%
1,21
9,64
361
.14%
1,32
9,34
562
.87%
1,32
9,34
562
.87%
215,
906
11.7
8%23
3,35
811
.70%
258,
005
12.2
0%25
8,00
512
.20%
244,
949
50.4
7%20
2,54
649
.88%
248,
984
45.7
0%24
8,98
445
.70%
(Cin
cinna
ti, O
H-KY
-IN) R
egio
n
Note
1: A
ll %
repr
esen
t a sh
are
of th
e to
tal p
opul
atio
n w
ithin
the
juris
dict
ion
or re
gion
for t
hat y
ear,
exce
pt fa
mily
type
, whi
ch is
Note
3: R
efer
to th
e Da
ta D
ocum
enta
tion
for d
etai
ls (w
ww
.hud
exch
ange
.info
/res
ourc
e/48
48/a
ffh-d
ata-
docu
men
tatio
n).
Note
2: D
ata
Sour
ces:
Dece
nnia
l Cen
sus;
ACS
(Ham
ilton
Cou
nty,
OH
CDBG
, HOM
E, E
SG) J
urisd
ictio
n(C
incin
nati,
OH
CDBG
, HOM
E, E
SG) J
urisd
ictio
n
Tabl
e 2:
Dem
ogra
phic
s Tr
ends

40Fair Housing Assessment for Cincinnati and Hamilton CountyAugust 2019
Adams, Hyde Park, and Mt. Lookout. Please note, throughout this report, “Black” and “White” are used as race categories. This use is consistent with demographic information provided by the Department of Housing and Urban Development (HUD) and the U.S. Census (https://www.census.gov/mso/www/training/pdf/race-ethnicity-onepager.pdf)
The Cincinnati region has been identified over the years as a metropolitan area that is among the most segregated in the Country. Using the dissimilarity index presented in Table 3, the overall regional index for Greater Cincinnati region is reported as 71 for 2017. A score of 60 is considered very high/very segregated. The index in Hamilton County is 66, and for the City of Cincinnati the score for 2017 was 58. After decades of the dissimilarity index moving in a positive direction between 1990 and 2010 (meaning a decrease in dissimilarity), index scores in Cincinnati, Hamilton County, and the Greater Cincinnati got worse between 2010 and 2017. Hamilton County lost all ground it had gained between 1990 and 2010. Its current Black/White dissimilarity index score is about the same as it was in 1990.
Table 3: Racial/Ethnic Dissimilarity Trends
Racial/Ethnic Dissimilarity Index
1990 Trend 2000 Trend 2010 Trend Current
Non-White/White 63.25 55.74 48.63 53.81Black/White 65.88 59.37 53.36 58.40Hispanic/White 29.69 29.32 31.99 36.65Asian or Pacific Islander/White
42.68 37.54 33.72 40.67
Racial/Ethnic Dissimilarity Index
1990 Trend 2000 Trend 2010 Trend Current
Non-White/White 58.24 55.37 52.21 57.57Black/White 66.23 65.44 61.83 66.25Hispanic/White 21.39 28.32 40.23 44.05Asian or Pacific Islander/White
29.74 34.95 34.26 41.85
Racial/Ethnic Dissimilarity Index
1990 Trend 2000 Trend 2010 Trend Current
Non-White/White 68.90 60.96 53.05 58.07Black/White 75.45 72.36 66.78 71.02Hispanic/White 26.02 28.95 36.79 40.30Asian or Pacific Islander/White
42.97 41.16 42.19 49.02
(Cincinnati, OH CDBG, HOME, ESG) Jurisdiction
(Hamilton County, OH CDBG, HOME, ESG)
(Cincinnati, OH-KY-IN) Region
Note 1: Data Sources: Decennial CensusNote 2: Refer to the Data Documentation for details

41Fair Housing Assessment for Cincinnati and Hamilton CountyAugust 2019
racially integrated CommunitiesThere are certainly success stories in the region. There are communities that have been diverse for decades. A report published in 2007 for the Stephen H. Wilder Foundation by Charles F. Casey-Leininger, Going Home: the struggle for fair housing in Cincinnati 1990 to 2007, finds that “Starting with the 1970 Census, racial segregation declined modestly in the City of Cincinnati and to a smaller extent in suburban areas of the County. This occurred as, over the three decades from 1970 to 2000, an increasing number of communities found Blacks and Whites living together on the same blocks. Indeed, at the 2000 Census, about one-quarter of Hamilton County communities were racially integrated by the measures used in this study. Moreover, starting with the 1980 Census, fourteen of these communities have maintained stable racial integration. This is in sharp contrast to the results of the 1984 study that found few racially integrated neighborhoods between 1940 and 1980, that those that did exist generally did so only as neighborhoods changed from largely White to largely Black.”
Places like East Walnut Hills, Madisonville, Northside, College Hill, Pleasant Ridge, University Heights, and Winton Place in Cincinnati and places like Forest Park, Golf Manor, Mt. Healthy, Northbrook (located in Colerain Township), Springdale, and Silverton in the County have become communities of opportunity and choice for a broad spectrum of residents since 1980.
Westwood, West Price Hill and north-central Hamilton County are becoming increasingly racially diverse.
The communities on the west side of Cincinnati and northern Hamilton County are becoming the most racially diverse communities in the region. As reported in the Wilder Study on Sustainable, Integrated Communities, some communities, including College Hill, Kennedy Heights, Silverton, Forest Park, and Woodlawn, have been integrated since the 1970’s. Some communities, including West Price Hill, Westwood, and Deer Park, have become more integrated since 2000. Most of these communities are middle income communities, with a strong single-family homeowner base, that provide attractive choices for many protected class households. These places have all struggled with the tensions that come with racial integration. There has been a loss of White families at public schools, opposition to affordable, multi-family housing, particularly the efforts of Cincinnati Metropolitan Housing Authority (CMHA), and a slow integration of civic leadership. Recently both Mt. Healthy and Woodlawn have demonstrated support of CMHA projects and have seen CMHA as a good partner to solve redevelopment challenges. In Mt. Healthy, the Reserve on South Martin, is a senior housing project that eliminated a blight and provided much needed affordable senior housing. CMHA

42Fair Housing Assessment for Cincinnati and Hamilton CountyAugust 2019
and Woodlawn are partnering to submit a Low-Income Housing Tax Credit (LIHTC) application for a new mixed-use project that they hope will provide affordable housing and connect to an anchor church in the community.
Almost all of these communities have come to embrace their diversity at some level and see it as a positive characteristic of their communities. These are not perfect stories of integration, but many civic leaders in these places are actively working to make all residents feel welcome. Colerain Township has been supporting a diverse group of residents in Northbrook who are creating an integrated civic association and working on quality of life issues in their community. In Westwood and East Westwood, a diverse group of residents came together with support from the Urban League Police Partnering Center to address crime, drug dealing, and safety concerns. As they continue to meet, they have created relationships and connections between Black and White churches in the area, resulting in a significant decrease in crime. These anecdotal stories reflect a larger trend where residents report feeling satisfied in their communities and a willingness to confront racism and incivilities.
These communities struggle with property conditions. Single-family homes that are between 50 and 75 years old need to be maintained and property owners are having a hard time accessing capital for home improvement loans and getting mortgages. This housing can present a great opportunity for protected class households that can manage a mortgage and renovations. In cases where these units can be purchased and renovated for under $125,000 (monthly payments of less than $700), they represent relatively affordable housing, units much more affordable than the $900 or $1,000 monthly rent that is becoming the norm in many places. The challenge to this is potential buyers may have credit score problems, lack a down payment, or lack the knowledge to navigate the lending process. Supporting existing moderate-income homeowners in these communities is also important. Cost burdened households report difficulty getting home improvement loans and home equity loans. Lenders express concern about credit scores and loan-to-value ratios that have declined in communities that lost significant value in the housing crisis in 2008 that have still not regained their full value.
Households, both Black and White, that are able to purchase and maintain their homes report much more stable financial positions, and lower housing costs, and less cost burden than households that are renting increasingly higher priced units. The process of wealth generation through homeownership has been battered in the past recession, but it is still the way that moderate and middle-income families generate wealth. People also reported significantly lower housing costs if they had inherited or purchased housing from a family member. This

43Fair Housing Assessment for Cincinnati and Hamilton CountyAugust 2019
allows families to live in communities of choice with significantly lower housing costs than households that have to purchase or rent in the current market.
While the next generation of homebuyers encounter trouble accessing capital to purchase and improve homes, Cincinnati and Hamilton County communities are all citing concerns with large Real Estate Investment Trusts (REITs). These REITs buy single-family units throughout the county, make limited improvements, and then rent single-family homes in fairly poor condition with very little local management or control. In these cases, property conditions continue to deteriorate and renters live in units in poor condition.
Code enforcement is a critical part of the equation to keeping housing in good condition, especially when out-of-town owners are not managing properties appropriately. In Cincinnati, code enforcement is typically done in response to complaints filed. Protected class residents report that they are often reluctant to complain because they fear they will lose their housing as a result of sharing a complaint. In suburban communities, inspection may be even more irregular. Most small communities have at best a part-time housing inspector working one or two days a week, also inspecting based on complaints. So in both the City and the County, code enforcement resources are stretched very thin and inspectors are the only arbiter of housing conditions for many in protected classes. Of the housing available in the region at less than $750 a month, a full 65% is not subsidized so there is no other check to ensure good property conditions because inspection is complaint-driven and resources are limited.
There are more poor households in first ring suburbs in both City and County communities where services typically available to low-income households in the center city may not be accessible to these communities. Transportation limitations are cited as an issue, making access to services more difficult. Communities are looking for connections to service providers for protected class households and other low-income households that can help new residents navigate services and access the things they need.
One of the biggest constraints to living in these communities is the ability to access jobs. While households in north central communities are potentially closer to jobs along the industrial I-75 corridor and near employment in Blue Ash and the Kenwood Mall area, the transit routes are not convenient and often require a trip downtown to get to a nearby suburb.

44Fair Housing Assessment for Cincinnati and Hamilton CountyAugust 2019
far eastern and western suburbs continue to be racially segregated.
Suburban communities on the west side of Hamilton County, including Crosby Township, Whitewater Township, and Delhi Township, have a Black population that makes up less than 3% of their total population. Similarly, communities in the eastern part of Hamilton County, including Anderson Township and Newtown, also have a Black population that makes up less than 3% of their total population. Some of the most affluent communities in the region, including Montgomery, Indian Hill, Terrace Park, Mariemont, Madeira, Hyde Park, Mt Lookout, and Mt. Adams all have less than 4% Black population.
Much of eastern and western Hamilton County are townships that have a suburban development pattern with mostly, and in some cases exclusively, single-family homes. Most of these townships have some commercial zoning and some have limited manufacturing, but mostly these are classic bedroom communities. Whitewater and Crosby Townships are rural in character with very little commercial or multi-family uses.
Segregated communities.
There is reported discrimination based on race in eastern and western suburbs where the Black population makes up less than 5% of the total population. Based on interviews, this ranges from being steered away from units, to being shown lesser quality units, to excessive neighbor complaints about behavior (particularly about children), to police calls that are excessive and seem unnecessary or even inappropriate. Residents of these communities understand the long entrenched patterns of segregation and discrimination and suggest it is in part due to the longevity of residents, families living in the same communities for multiple generations, and the closed social networks in these places.
Protected class residents express little knowledge of these parts of the County, with opinions that there are communities where they would not be welcomed, or where they would be not be comfortable.
The other big townships in the region; places like Anderson (43,800) on the far east side, and Green (58,789) and Delhi (29,612) on the west side, are among the biggest townships in the State and have suburban development patterns. They too are mostly single-family bedroom communities with some retail and commercial uses along corridors like Delhi Pike in Delhi and Harrison Avenue in Green. Among these far eastern and western townships, Green is the most diverse with 5% of its population Black. All of the other eastern and western townships have less than 3% Black population. Most also have between 1% and 2% Hispanic households.

45Fair Housing Assessment for Cincinnati and Hamilton CountyAugust 2019
There are a very limited number of Asian households, less than 2% in every case in these communities. These eastern and western townships make up approximately 22% of the County population and significantly more of the geography of the County. County-wide, the proportion of Black households is 25%, while these communities have less than 5%, in most cases less than 2%.
There are also some segregated White Cincinnati neighborhoods and other cities and villages in Hamilton County. Indian Hill, Terrace Park, Montgomery, and Mariemont have fewer than 5% Black populations and Hyde Park and Mt. Lookout have less than 3% Black households. Indian Hill has an Asian population of approximately 9% and Montgomery has 7%, with both of these communities having over 2% Latino population. County-wide, the Asian population makes up 2% of the total population, while the Latino also makes up 2%.
These communities all have populations of disabled households; often these are households with family and networks in the community. Because these are also some of the most expensive housing markets in the region, particularly on the east side, it can be a challenge for households with a disabled person who does not have the income to support more expensive rents or mortgages. There are not property owners in these locations that are willing to provide affordable housing. Families of grown children from these communities worry that once parents are gone these will not be affordable or appropriate places for their children to live.
Zoning that prohibits multi-family housing without a Planned Unit Development hearing and a lack of public transportation both conspire to keep protected class populations out of these communities. In interviews in these communities, existing residents acknowledge the lack of diversity in their communities and understand that a level of discriminatory behavior may contribute. Residents mostly express the sense that people who grow up in these communities stay in them and this leaves little room for new residents. Some of these communities have mounted vigorous efforts to keep CMHA and other multifamily housing providers out of their communities. As Maps 30 and 31 show, there is a concentration of subsidized housing in the City and north central portions of the County. Residents from protected classes do not know these communities; they do not know anyone who lives in them and do not know how to get to them. This is housing that could potentially be a good choice for people who wanted a more suburban community, but protected class households never get to these places to “test the water.”

46Fair Housing Assessment for Cincinnati and Hamilton CountyAugust 2019
Growing immigrant and foreign-born populations.
Maps 4, 5, and 6 illustrate the small but growing immigrant and refugee populations in the region. Two Spanish-speaking groups; Mexican and Guatemalan immigrants are both becoming more a part of the community in East and West Price Hill and Carthage in Cincinnati. HUD maps do not illustrate populations in Springdale and Norwood in the County, but service providers like the Norwood Service League in Norwood have been serving Mexican and Guatemalan families for over ten years. SuCasa has clients all over the north central part of Hamilton County, with a cluster of households in Springdale.
African refugees from Burundi and other West African countries have settled here and many live in CMHA properties in Millvale and Winton Hills. Residents of from India live in Clifton, Clifton Heights and other neighborhoods around the University of Cincinnati.
A growing Latino population with a concentration of households in Price Hill, Carthage, Norwood,Springdale,andSpringfieldTownship.
The Latino population in the region has remained small compared with other parts of the nation. Just 2% of the population in Hamilton County and Cincinnati is Latino. The overall Latino population in the County is 2,390 and 2,591 in the City. This is only about 33% of the region’s Latino population. While still a small part of the overall population, this group is growing faster than most other groups.
Households from Mexico and Guatemala are the biggest share of this group. There are clusters of Latino residents that are making up noticeable parts of the community in parts of Price Hill, Carthage, Springdale, Springfield Township, and Norwood. Stores and restaurants serving Latin foods exist in all of these communities. In some places, the Latino community is providing new life in neighborhoods that were losing population between 2000 and 2010. Schools in the Cincinnati Public Schools (CPS) district (Roberts Paideia Academy, the Academy of World Languages, LEAP Academy, and Ethel M. Taylor) all have Spanish-speaking students and families looking to them as an important connection and network. In addition to CPS, Princeton Schools, which serves the north central zone of the County, has a total Latino student population of 24%. Over 70% of children at Heritage Hill, within the Princeton district, are Hispanic. These schools are working to support these new students with English as a Second Language programs and Spanish-speaking staff and teachers. However, kindergarten readiness scores, reading and math achievement, and other measures of success demonstrate that these schools are struggling to support these students.

47Fair Housing Assessment for Cincinnati and Hamilton CountyAugust 2019
Map
4: D
emog
raph
ic: N
on-W
hite
or B
lack
Pop
ulat
ion

48Fair Housing Assessment for Cincinnati and Hamilton CountyAugust 2019
Map
5: N
atio
nal O
rigin

49Fair Housing Assessment for Cincinnati and Hamilton CountyAugust 2019
Map
6: N
on-B
lack
and
-Whi
te C
once
ntra
ted
Area
s of
Pov
erty
- Tr
ends

50Fair Housing Assessment for Cincinnati and Hamilton CountyAugust 2019
age characteristics While the national population continues to age, Cincinnati’s population of seniors 65 years of age and over continues to remain 2.5% points below the national rate, and 3.5% points below the rate in Hamilton County overall. Between the 2009-13 estimate and the 2013-17 estimate, the proportion of seniors 65 and older went from 13.5% to 14.5% in Hamilton County. This is slightly higher than the 2013-17 national rate of 13.4%.
Cincinnati had 11.9% of its population at 65 years of age and above in the 2013-17 estimate, up minimally from the 11.5% in the 2009-13 estimate. Cincinnati has a higher percentage of young families and young children as well. Unfortunately, young families with young children and particularly young Black families with young children are more likely to be poor and struggle to find housing. In a 2015 report to HUD evaluating the Cincinnati-Hamilton County Community Action Agency, findings illustrated that young with children under the age of five, face pervasive challenges related to poverty.
racially/ethnically Concentrated areas of poverty (r/eCaps)Areas of concentrated poverty and racial and ethnic concentration in the Ohio portion of the Greater Cincinnati region are all in the City of Cincinnati. A part of the east side of Covington, Kentucky is also a R/ECAP, but for the purposes of this report the focus is on Ohio. Of the 54,177 people who live in R/ECAP’s 75% are Black households, compared with 44% of the overall population. There are 7,122 families with children in these areas. There are relatively fewer households of ethnic origin in these locations, but a concentration of Guatemalan (378) and Mexican (203) households in North and South Fairmont and East Price Hill, and a concentration of West African (Burundi) (113) households in Millvale.
Lower Mill Creek Communities.
The largest R/ECAP area geographically includes the communities along the inner west side of the Lower Mill Creek. This cluster includes parts of East Price Hill, North and South Fairmont, East Westwood, Millvale, South Cumminsville, the Villages at Roll Hill, and parts of Mt. Airy. This cluster of communities was discussed in some detail above. These are communities which have been experiencing poverty for decades. Populations are majority Black and they are home to a cluster of Guatemalan, Mexican, and African immigrant and refugee populations.

51Fair Housing Assessment for Cincinnati and Hamilton CountyAugust 2019
Map
7: R
acia
lly/E
thni
cally
Con
cent
rate
d Ar
eas
of P
over
ty

52Fair Housing Assessment for Cincinnati and Hamilton CountyAugust 2019
R/ECAP Race/Ethnicity
# % # % # %
Total Population in R/ECAPs
54,177 - 1 - 61,223 -
White, Non-Hispanic 9,918 18.31% 0 0.00% 12,771 20.86%
Black, Non-Hispanic 40,913 75.52% 1 100.00% 43,197 70.56%
Hispanic 1,291 2.38% 0 0.00% 2,796 4.57%Asian or Pacific Islander, Non-Hispanic
550 1.02% 0 0.00% 740 1.21%
Native American, Non-Hispanic
117 0.22% 0 0.00% 125 0.20%
Other, Non-Hispanic 91 0.17% 0 0.00% 104 0.17%
R/ECAP Family Type
Total Families in R/ECAPs
11,536 - 0 - 13,150 -
Families with children
7,122 61.74% 0 N/a 7,990 60.76%
R/ECAP National OriginTotal Population in R/ECAPs
54,177 - 1 - 61,223 -
#1 country of origin Guatemala 378 0.70% Null 0 0.00% Guatemala 838 1.37%#2 country of origin Other Eastern
Africa230 0.42% Null 0 0.00% Mexico 432 0.71%
#3 country of origin Mexico 203 0.37% Null 0 0.00% Other Eastern Africa
230 0.38%
#4 country of origin Other Western
Africa
113 0.21% Null 0 0.00% Other Western
Africa
113 0.18%
#5 country of origin Honduras 108 0.20% Null 0 0.00% Vietnam 110 0.18%#6 country of origin China excl.
Hong Kong & Taiwan
99 0.18% Null 0 0.00% Honduras 108 0.18%
#7 country of origin Vietnam 79 0.15% Null 0 0.00% Pakistan 105 0.17%#8 country of origin Peru 78 0.14% Null 0 0.00% India 104 0.17%#9 country of origin India 71 0.13% Null 0 0.00% China excl.
Hong Kong & Taiwan
99 0.16%
#10 country of origin Jordan 62 0.11% Null 0 0.00% Nigeria 99 0.16%
(Cincinnati, OH-KY-IN) Region
Note 1: 10 most populous groups at the jurisdiction level may not be the same as the 10 most populous at the Region level, and are thus labeled Note 2: Data Sources: Decennial Census; ACSNote 3: Refer to the Data Documentation for details (www.hudexchange.info/resource/4848/affh-data-documentation).
(Cincinnati, OH CDBG, HOME, ESG) Jurisdiction
(Hamilton County, OH CDBG, HOME, ESG) Jurisdiction
Table 4: R/ECAP Demographics

53Fair Housing Assessment for Cincinnati and Hamilton CountyAugust 2019
The Lower Mill Creek communities have experienced significant disinvestment in their housing markets, community institutions, and public infrastructure. This part of the community has property in very poor condition and these are some of the most disinvested neighborhoods in the city. Populations are majority black and they are home to a cluster of Guatemalan, Mexican and African populations. The population in these communities has declined steadily since the 1980’s and the loss of schools, retail, bus service, jobs, and housing has been pronounced. To be places that productively support households, these communities need significant investment in parks, schools, existing housing, and infrastructure including roads and sidewalks.
South Fairmont is home to the large Metropolitan Sewer District (MSD) Lick Run project designed to separate the storm and sanitary sewers in the Lick Run watershed and mitigate one of the most significant Combined Sewer Overflows (CSOs) in the region. The project will eliminate a major source of water solution that flows into the Ohio River. As a result of this project, over 150 households and 30 businesses were displaced and the neighborhoods of North and South Fairmont have been struggling to address the quality of life problems that come along with this significant public works project. Housing unit losses displaced both renters and long-time homeowners.
In North Fairmont, years of disinvestment, lack of access to capital by homeowners, and structural and storm water issues on hillsides have left almost every block in the neighborhood with between 25% and 50% of units demolished. Streets and sidewalks are in poor condition and residents have been working to improve green spaces and play areas for children as part of their priorities. They have also been working to combat illegal dumping and encourage overall neighborhood cleanup efforts.
There is a group of Burundi and Guatemalan residents who have become members of the St. Leo’s Church in the community. While not all of these congregants live in the community, they have enlivened the church and the church community provides a source of support and a network for families. There have been some efforts by the church and others to renovate housing in the neighborhood for these families, but safety concerns, lack of resources, and capacity issues have been barriers.
Cincinnati Metropolitan Housing Authority (CMHA) continues to consider its options for the part of the community that was formally English Woods. Two projects, Sutter View and Marquette Manor, remain on this site that used to house over 3,000 residents. Today there are about 250 units between the Marquette Manor and Sutter View projects, with Marquette Manor

54Fair Housing Assessment for Cincinnati and Hamilton CountyAugust 2019
slated for demolition due to poor conditions. CMHA put out a Request for Proposals (RFP) for project recommendations in this location but have not made decisions about its future direction.
There are other large HUD-subsidized projects in this R/ECAP including over 500 units in Millvale (owned and operated by CMHA), more than 700 private project-based Section 8 units, and the Villages at Roll Hill apartments.
A group of Burundi residents live in Millvale. Many of them report bullying and harassment at the complex. Children attend school at either Ethel Taylor Elementary School in Millvale or the Academy of World Languages in Evanston. Guatemalan families in Price Hill that are part of the St. Leo’s parish attend Roberts Paideia Academy or Holy Family Catholic School. Both of these schools have made a concerted effort to serve Spanish-speaking families and the additional supports from Santa Maria Community Services in Price Hill are an important part of the network that serves these families in this area.
A new CPS school opened in 2017 in North Fairmont to serve the growing need for schools on the west side of Cincinnati. The LEAP Academy is a language immersion magnet school that focuses on Spanish. This school is becoming an important support to Spanish-speaking families on the west side of Cincinnati.
Uptown.
Uptown is another R/ECAP area in Cincinnati; it is a collection of communities in the near east side that include parts of Avondale, Evanston, and Walnut Hills. These are places where the first Black families moving out of the West End settled as I-75 was being built and they were being displaced. These communities have had strong Black leadership over the decades and include Black middle class and Black homeowners who have gained and maintained wealth in these communities. In the 1960’s and 70’s, these were communities that experienced rapid change as White flight took place. They have also been communities that have experienced disinvestment and loss of population and businesses. Property conditions have deteriorated and safety has become a concern for many residents. Some of the largest institutions in the region, including major hospitals, universities, and related employers, are in these communities. The communities are also well served by METRO. They are among only a few communities that are adequately served by public transportation because they are physically in the middle of the system and several routes run on major corridors.

55Fair Housing Assessment for Cincinnati and Hamilton CountyAugust 2019
More recently, Avondale has seen a City investment of $4.3 million in the renovation of the Avondale Town Center, which will activate new commercial and housing space, including 50 low-income housing tax credit units. Evanston saw the new construction of 26 units of affordable housing called St. Ambrose apartments on an old site that was once a safe haven for crime. The City has recently committed to investing $680,000 in Walnut Hills for the new construction of 44 units of affordable housing for low-income single parents pursuing a four-year college degree.
Investments in Cincinnati Children’s Hospital Medical Center, the opening of a new I-71 interchange at Martin Luther King Drive, and the investments being made in commercial and office development along the Innovation Corridor at Martin Luther King Drive and Reading Road, are certainly driving change in these communities, much good, and some bad. Residents, particularly low-income and Black residents express concern about displacement and rising rents and, for homeowners, rising property taxes. Community groups in Evanston and Avondale are currently working on community plans that include goals about protecting existing residents, creating balanced growth, and ensuring that Black-owned businesses get a fair opportunity to benefit from the revitalization. The Walnut Hills Redevelopment Foundation and Walnut Hills Area Council completed a community plan in 2017 that also outlined affordable housing goals.
Winton Hills.
Winton Hills is a community of just under 5,000 people with high poverty rates: 64% of the total population live in poverty and over 88% of children under five years of age live in poverty. The community consists of several large affordable housing complexes. Findlater Gardens (649 units) and Winton Terrace (608 units) are the largest site-based housing complexes in the CMHA system. 94% and 95% respectively of the residents in these units are Black. In addition to these major housing complexes, there are two landfills in the vicinity. Center Hill Landfill is a capped facility and Gray Road Landfill is an active site. This community is poorly served by public transportation; it is off the main street corridors, out of reach and to the north of the most active service areas. Plan Cincinnati (the Plan), the City’s comprehensive plan approved in 2012, points out that between 75% and 100% of households do not have access to a vehicle and there is very limited bus service. The Plan also points out that the community does not have an active business district that you could walk to and is poorly served by community services (community centers, parks, churches, and health clinics).

56Fair Housing Assessment for Cincinnati and Hamilton CountyAugust 2019
The communities of Winton Terrace, Winton Hills , and Spring Grove Village are neighborhoods located in the valley along Interstate-75, within the area’s industrial corridor. The Environmental Protection Agency (EPA) reports several of the industries in this area to have been in violation of the Clean Air Act and has issued citations to several of these companies. The Ohio EPA air quality index lists this area as moderate to unhealthy on average annually. Cincinnati Children’s Hospital Medical Center reports that residents from Winton Hills have among the highest admission rates for asthma and respiratory issues. Recent air studies conducted in December 2018 by the Southwest Ohio Air Quality Agency, in coordination with Ohio’s Environmental Protection Agency (Ohio EPA), showed that “air quality for the Cincinnati area, for the majority of the year, is at the good or moderate levels.” According to the U.S. EPA Toxic Release Inventory, air emissions from the 45223 ZIP code have dropped by more than 80 percent since 2007.” See Appendix H for more information.
West End.
The West End is the first and most historic Black neighborhood because in the early history of Cincinnati it was the only place where Black families were allowed to live. These historic households built a vibrant, active community. Over the years, the population was displaced as a result of highway construction, urban renewal, and changes to historic and public housing in the area. Between Hope VI, City West, Stanley Rowe, and Laurel Homes, there are still over 900 CMHA units in the West End, down from over 3,000 units in 1990. This is still a tight knit community where low-income homeowners and renters are worried about the displacement that may come with the new investments in the FC Cincinnati Major League Soccer stadium and continued investment in Over-the-Rhine (OTR), the neighborhood just to the east.
Parts of Over-the-Rhine are also a part of this same R/ECAP. Neighborhood conditions are changing dramatically here as well. Historically, this was a more integrated, low-income community with strong civic leadership and active community engagement. As this neighborhood continues to attract investments and market forces trend upward, the preservation of existing and the creation of new affordable housing units are challenges that have to be addressed. Although Over-the-Rhine stakeholders, including the private and public sector, continue to make investments in affordable housing units, including those for people with very low incomes, this remains an increasingly difficult proposition given the rise in real estate prices and the scarcity of available land. The Over-the-Rhine Community Council has indicated a desire to maintain affordable housing in the community. A concerted effort to investment more in affordable housing must take place or affordability in the neighborhood will be in jeopardy if not completely lost.

57Fair Housing Assessment for Cincinnati and Hamilton CountyAugust 2019
The West End completed a community plan in 2016 that did not contemplate the soccer stadium investment. The Port, an economic development agency in Greater Cincinnati, and Habitat for Humanity of Greater Cincinnati are currently working with the neighborhood to ensure balanced growth and protection of current residents. With that, the City has recently invested $500,000 and the County has invested $300,000 in the creation of 57 units of affordable housing for homeless individuals in the West End.
disparity in access to opportunityA household’s choice of housing is partly about what opportunities that location makes available to them. Every person strives to live in a location that makes the logistics of the day easier by providing access to jobs, education, cultural and recreational resources, and transportation that makes it easy to get around.
Table 5 shows that opportunities in this region are not equitable. Black and Hispanic households are significantly more likely to live in areas of concentrated poverty in the City and the region than White households. In addition, if those households are poor they are even more likely to be living in areas of concentrated poverty.
The differences in access to quality schools are equally as stark for Black and Hispanic households in Cincinnati and the County. Black households, regardless of income, are less likely to have access to good schools. Access to transportation and jobs are harder to interpret in the index findings because there is so little access to public transportation overall.
lack of public transportation is one of the biggest barriers to fair housing in Hamilton county.
The lack of public transportation in areas that are predominately White areas, along with poor service in parts of the community that are integrating, is one of the key barriers to fair housing in this region. Areas that are integrating are seeing an increasing number of protected class households who need access to good public transportation.
The public transportation in the Cincinnati region is provided by Southwest Ohio Regional Transit Authority (SORTA), which operates METRO. The system is built to serve City residents, because it is mostly funded by a City transit tax. Service coverage in the downtown, the basin and Uptown is relatively frequent and reliable. This area includes two major employment clusters, downtown, and the area around the University of Cincinnati and regional hospitals, including University Hospital and Cincinnati Children’s Hospital Medical Center.

58Fair Housing Assessment for Cincinnati and Hamilton CountyAugust 2019
(Cincinnati, OH CDBG, HOME, ESG) Jurisdiction
Low PovertyIndex
School Proficiency
IndexLabor Market
IndexTransit Index
Low Transportation
Cost IndexJobs
Proximity IndexEnvironmental Health Index
Total Population White, Non-Hispanic 41.25 34.74 56.22 62.16 71.39 53.40 18.39Black, Non-Hispanic 17.80 21.87 26.47 65.06 74.91 48.62 16.35Hispanic 28.43 26.89 40.07 63.48 72.87 53.01 18.46Asian or Pacific Islander, Non-Hispanic
47.80 44.09 60.29 66.73 77.69 62.67 14.23
Native American, Non-Hispanic
25.48 25.91 36.96 64.33 74.30 52.63 16.32
Population below federal poverty lineWhite, Non-Hispanic 34.05 26.90 45.13 64.55 74.06 55.13 16.63Black, Non-Hispanic 13.42 20.20 21.40 65.53 75.23 49.52 17.08Hispanic 11.43 15.90 18.52 62.53 71.42 45.83 22.49Asian or Pacific Islander, Non-Hispanic
46.69 41.68 59.03 66.64 78.44 55.33 13.52
Native American, Non-Hispanic
1.34 15.59 1.44 63.98 74.07 27.91 20.24
(Hamilton County, OH CDBG, HOME, ESG) Jurisdiction
Low PovertyIndex
School Proficiency
Index
Labor Market Index
Transit Index
Low Transportation
Cost Index
Jobs Proximity Index
Environmental Health Index
Total Population White, Non-Hispanic 64.32 56.50 66.46 47.88 52.83 49.98 28.98Black, Non-Hispanic 41.43 30.37 48.69 51.83 61.11 49.71 21.31Hispanic 46.41 46.43 57.52 49.49 60.99 54.50 23.08Asian or Pacific Islander, Non-Hispanic
66.26 60.73 71.55 49.68 56.92 55.46 26.14
Native American, Non-Hispanic
52.91 44.31 57.71 50.82 58.01 51.12 24.15
Population below federal poverty lineWhite, Non-Hispanic 51.50 46.16 56.96 51.13 57.73 52.00 25.99Black, Non-Hispanic 30.18 26.24 38.26 53.42 62.78 47.70 21.32Hispanic 27.12 39.34 45.20 49.97 68.30 63.24 18.12Asian or Pacific Islander, Non-Hispanic
46.77 44.56 52.03 51.42 62.59 62.69 19.57
Native American, Non-Hispanic
53.69 38.46 52.92 40.77 48.85 53.55 19.77
(Cincinnati, OH-KY-IN) RegionTotal PopulationWhite, Non-Hispanic 61.46 60.67 59.64 42.47 47.95 47.39 40.89Black, Non-Hispanic 30.80 31.18 37.22 58.01 67.34 49.23 21.35Hispanic 46.65 51.85 51.52 49.55 58.05 53.90 30.89Asian or Pacific Islander, Non-Hispanic
71.40 70.55 73.84 49.23 55.02 52.66 32.68
Native American, Non-Hispanic
50.59 51.53 50.82 46.21 52.78 50.25 36.43
Population below federal poverty lineWhite, Non-Hispanic 44.95 48.46 45.71 45.92 52.99 51.13 37.87Black, Non-Hispanic 19.22 24.94 26.75 61.30 71.00 49.56 19.40Hispanic 25.59 36.48 33.68 52.44 63.67 52.91 26.24Asian or Pacific Islander, Non-Hispanic
50.24 49.52 57.35 56.75 65.48 54.69 24.36
Native American, Non-Hispanic
31.21 43.60 35.68 45.35 57.01 54.29 33.63
Note 1: Data Sources: Decennial Census; ACS; Great Schools; Common Core of Data; SABINS; LAI; LEHD; NATANote 2: Refer to the Data Documentation for details (www.hudexchange.info/resource/4848/affh-data-documentation).
Table 5: Opportunity Indicators, by Race/Ethnicity

59Fair Housing Assessment for Cincinnati and Hamilton CountyAugust 2019
Downtown is also served by a streetcar system that connects the northern part of Over-the-Rhine to the Banks at the riverfront. There is bus service along several major corridors in a radial system that for most cross-town trips requires a trip downtown. In most of the rest of the region, bus service is much less frequent and reliable, and in many parts of the County and the region it is non-existent. Part of the reason for the lack of access is a requirement that METRO get approval for all bus stops from the local jurisdiction. A bike share program, Red Bike, and several scooter share companies, are serving downtown, the basin, and Uptown. The City has made investments in Red Bike and in bike lanes throughout the City. The City and the County have been working to add to the connections and local trails that connect to a larger regional trail network.
Map 8 illustrates the problem. METRO is a radial system where most of the major routes lead to downtown. It is also clear that the Mill Creek communities in the near west side R/ECAP area are not at all well served, along with Winton Hills (a second R/ECAP area). While there is some service to parts of eastern Hamilton County, including to the Kenwood Mall area an important employment centers and out Madison Road to Madisonville, there is very little coverage within walking distance to most of the housing in these locations. There is no service in western Hamilton County with daytime frequencies of less than 30 minutes. Map 9 shows additional limited service into western Hamilton County along Harrison, Glenway, and Colerain avenues. These maps also highlight the need for additional service in the integrated communities in north central Hamilton County. Protected class residents in these locations have limited access to transportation that gets them to important employment locations without a trip downtown.
Maps 10 and 11 illustrate the access by public transportation to grocery stores and hospitals. A route map that highlights all the service areas shows connections to all of the hospitals and most grocery stores. When considering routes serving these locations within a 30 minute daytime frequency, the system is not feasible to someone who needs to get around in a reasonable time.
Maps 12 and 13 illustrate the lowest cost for transportation in the central and urban core where service coverage is best. The slightly higher cost index in the Mill Creek and Winton Hills R/ECAP underscore that while people can get on a bus in these locations, they have to go farther (downtown to transfer) to get where they want to go. These challenges are affecting Black and immigrant households disproportionately as they make up the majority of households in these locations.

60Fair Housing Assessment for Cincinnati and Hamilton CountyAugust 2019
Map
8: H
ouse
hold
s w
ith L
imite
d Tr
ansp
orta
tion
Opt
ions
Perc
enta
ge o
f Hou
seho
lds
With
Zer
o C
ars
& M
etro
Bus
Rou
tes
With
30
Min
ute
Day
time
Freq
uenc
ies
or B
ette
r
Lege
nd Met
ro B
us R
oute
s <
30 M
in F
reqs
% N
o C
ar H
hlds
0% 0.1%
- 5%
5.1%
- 10
%
10.1
% -
20%
20.1
% +
± 02½
51¼
Mile
s
Map
ped
by M
ark
Sam
aan
2018
Dat
a fro
m S
OR
TA, C
AG
IS, &
Cen
sus
Bur
eau
Map
pro
vide
d by
:

61Fair Housing Assessment for Cincinnati and Hamilton CountyAugust 2019
Map
9: J
ob D
ensi
ty in
the
OKI
Reg
ion
and
Met
ro B
us A
cces
s
Ham
ilton
But
ler
Cle
rmon
t
War
ren
Boo
ne
Dea
rbor
n
Ken
ton
Cam
pbel
l
Job
Den
sity
in th
e O
KI R
egio
n &
Met
ro B
us A
cces
s
Lege
nd Met
ro B
us R
oute
s
Inte
rsta
tes
OK
I Cou
ntie
s
Blo
ck G
roup
sJo
bs p
er A
cre
10+
5.1
- 10
3.1
- 5
1.1
- 3
0.6
- 1
0 - 0
.5±
05
102½
Mile
s
Map
ped
by M
ark
Sam
aan
2018
Dat
a fro
m S
OR
TA, C
AG
IS, &
the
Cen
sus
Bur
eau
Map
pro
vide
d by
:

62Fair Housing Assessment for Cincinnati and Hamilton CountyAugust 2019
Map
10:
Ham
ilton
Cou
nty
Gro
cery
Sto
res
and
Hos
pita
ls L
ocal
and
Exp
ress
Rou
tes
! (! (
! (
! (! (! (! ( ! (! (! (
! (
! (
! (
! (
! (
! (
! (
! (! (
! (
! (
! (! (
! (! (
! (
! (
! (
! (
! (
! (! (
! (! (
! (
! (
! (
! (
! (! (
! (
! (! (
! (
! (! (
! (
! (! ( ! (! (! (
! (! (
! (! (! (
! ( ! (
! (! (
! (
! ( ! (
! (
! (! (
! (! (
! (
K
K
K
K
K
K
K
K KKK
K
KK K K
K
Sou
rces
: Esr
i, H
ER
E, G
arm
in, U
SG
S, I
nter
map
, IN
CR
EM
EN
T P,
NR
Can
, Esr
i Jap
an, M
ETI
, Esr
iC
hina
(Hon
g K
ong)
, Esr
i Kor
ea, E
sri (
Thai
land
), N
GC
C, ©
Ope
nStre
etM
ap c
ontri
buto
rs, a
nd th
e G
ISU
ser C
omm
unity
Ham
ilton
Cou
nty
Gro
cery
Sto
res
& H
ospi
tals
Loca
l & E
xpre
ss M
etro
Bus
Rou
tes
Lege
nd
KH
ospi
tals
! (G
roce
ry S
tore
s
Expr
ess
Loca
l
± 02½
51¼
Mile
s
Map
ped
by M
ark
Sam
aan
2018
Dat
a fro
m S
OR
TA &
CA
GIS
Map
pro
vide
d by
:

63Fair Housing Assessment for Cincinnati and Hamilton CountyAugust 2019
Map
11:
Ham
ilton
Cou
nty
Gro
cery
Sto
res
and
Hos
pita
ls M
etro
Bus
Rou
tes
With
30
Min
ute
Dayt
ime
Freq
uenc
ies
or B
ette
r
! (! (
! (
! (! (! (! ( ! (! (! (
! (
! (
! (
! (
! (
! (
! (
! (! (
! (
! (
! (! (
! (! (
! (
! (
! (
! (
! (
! (! (
! (! (
! (
! (
! (
! (
! (! (
! (
! (! (
! (
! (! (
! (
! (! ( ! (! (! (
! (! (
! (! (! (
! ( ! (
! (! (
! (
! ( ! (
! (
! (! (
! (! (
! (
K
K
K
K
K
K
K
K KKK
K
KK K K
K
Sou
rces
: Esr
i, H
ER
E, G
arm
in, U
SG
S, I
nter
map
, IN
CR
EM
EN
T P,
NR
Can
, Esr
i Jap
an, M
ETI
, Esr
iC
hina
(Hon
g K
ong)
, Esr
i Kor
ea, E
sri (
Thai
land
), N
GC
C, ©
Ope
nStre
etM
ap c
ontri
buto
rs, a
nd th
e G
ISU
ser C
omm
unity
Ham
ilton
Cou
nty
Gro
cery
Sto
res
& H
ospi
tals
Met
ro B
us R
oute
s W
ith 3
0 M
inut
e D
aytim
e Fr
eque
ncie
s or
Bet
ter
Lege
nd
KH
OS
PIT
AL
! (G
roce
ry S
tore
s
Met
ro B
us R
oute
s <
30 M
in F
reqs
± 02½
51¼
Mile
s
Map
ped
by M
ark
Sam
aan
2018
Dat
a fro
m S
OR
TA, C
AG
IS, &
Cen
sus
Bur
eau
Map
pro
vide
d by
:

64Fair Housing Assessment for Cincinnati and Hamilton CountyAugust 2019
Map
12:
Low
Tra
nspo
rtat
ion
Cost
This
map
inde
x es
timat
es th
e tr
ansp
orta
tion
cost
for a
sing
le p
aren
t hou
seho
ld
mak
ing
50%
of A
rea
Med
ian
Inco
me
(AM
I) w
ho is
renti
ng, f
urth
er u
sing
the
Loca
tion
Affor
dabi
lity
Inde
x (L
AI).

65Fair Housing Assessment for Cincinnati and Hamilton CountyAugust 2019
Map
13:
Tra
nsit
Trip
s In
dex

66Fair Housing Assessment for Cincinnati and Hamilton CountyAugust 2019
While most households drive alone to work those transportation costs are not significant in Hamilton County. While congestion and parking costs in the downtown and Uptown are increasing it is still easy to travel in a private vehicle. Farther out in the suburbs, trips require longer commutes, which adds to the overall transportation costs of a household.
The lack of access to public transportation in the east and western parts of the County contributes to restricted access to protected class households who rely on buses as their primary source of transportation. Because there is not access to public transportation, many households do not consider these communities. They do not report discrimination in these places because protected class households never even try to find housing in these communities.
access to employment The Greater Cincinnati Chamber of Commerce (the Chamber) reports that fewer than 3 in 4 jobs in the region are reachable within a 90 minute public transit trip, making 75% of jobs that cannot be accessed using public transportation. For protected classes, the relationship between employment and transportation is a critical one. People strive to find housing in locations that give them access and opportunity around employment. Map 14 from the Chamber shows the major employment centers in the region. Of these locations downtown and Uptown are well served by the current METRO system if you live in central Cincinnati. See also, Map 9. This puts many of the other major employment centers out of transit range for most of those living in the integrated communities of central and north central Hamilton County. R/ECAP locations are particularly disadvantaged by the location of major employers and the public transit network. Map 15 highlights that well. Every one of the R/ECAP areas in Cincinnati (there are none in Hamilton County) has among the lowest labor participation engagements. This index measures employment but also takes into account those in the area with a bachelor’s degree or higher, something many in protected classes do not have. At this point, the unemployment rate in Cincinnati and Hamilton County reported by the Bureau of Labor Statistics is 4.1% and 3.7%, respectively. This indicates that most households are working, but have a hard time getting to jobs.
Map 16 illustrates that there are job locations all over the region, and highlights the importance of the I-75 corridor and the downtown and uptown areas. The west side of Cincinnati and father west in Hamilton County have not traditionally been employment centers, and this is still the case today. Most of the employment west of the Mill Creek is in hospitals, educational institutions, and retail locations.

67Fair Housing Assessment for Cincinnati and Hamilton CountyAugust 2019
Map
14:
Job
Hub
s (C
inci
nnat
i Cha
mbe
r, O
KI, R
EDI P
artn
ersh
ip)

68Fair Housing Assessment for Cincinnati and Hamilton CountyAugust 2019
Map
15:
Lab
or M
arke
t Ind
ex
This
map
inde
x in
clud
es th
e un
empl
oym
ent r
ate,
the
labo
r for
ce p
artic
ipati
on ra
te, a
nd
the
perc
ent o
f res
iden
ts w
ith a
bac
helo
r’s d
egre
e or
abo
ve.

69Fair Housing Assessment for Cincinnati and Hamilton CountyAugust 2019
Map
16:
Job
s Pr
oxim
ity In
dex
This
map
inde
x di
spla
ys a
gra
vity
mod
eled
des
crip
tion
by C
ensu
s Blo
ck G
roup
of
the
rela
tive
prox
imity
of t
his g
roup
to a
ll jo
b lo
catio
ns in
the
regi
on w
ith jo
b co
ncen
trati
ons m
ore
heav
ily w
eigh
ted.

70Fair Housing Assessment for Cincinnati and Hamilton CountyAugust 2019
Some employment centers that are hard to reach include the industrial corridor along I-75 around the intersection of I-75 and I-275, Blue Ash and the Kings Island area. Another significant employment center that is hard to access by bus is the airport area in Boone County in northern Kentucky. The Amazon Fulfillment Center, other major shipping companies, the airport itself, and other employers located close to the airport are over a two hour bus ride from central Cincinnati and north central Hamilton County neighborhoods where a majority of Black, immigrant and refugee households live.
Employers in the region report that they have difficulty filling jobs and often cite lack of transportation as a reason. Nehemiah Manufacturing Company is an employer that supports second chance hiring and has a robust jobs and life skills training component as part of employment. They are part of Beacon of Hope with 70 other employers that subsidize transportation to eight employers due to lack of public transit.
Because transit choices are so limited in much of the County and such a barrier to getting to jobs in the region, low-income residents often buy unreliable cars to address this barrier. People end up without reliable transportation, a car that does not work, and are out the expense of the car.
There is a consensus among City and County officials and SORTA that major changes to the public transportation system are needed and that much more of the region needs to be served. The short-term operation of the existing system suffers from significant budget shortfalls. The cycle of service cuts, fare increases, and unreliable service that results from bus breakdowns makes the system a challenge to use on a daily basis.
The solutions to this major systems outage in the region are complex. There is little consensus on how to move forward except that the system needs to be much bigger geographically to include more employment centers and housing choices. All funding options must be explored and extensive public education about funding must be included. Funding scenarios that require all residents to pay into the system will be a challenge. Employers that are not able to fill jobs along with current transit users are currently working to develop a way forward. This is a critical systems issue to reduce barriers to fair housing throughout much of the region.

71Fair Housing Assessment for Cincinnati and Hamilton CountyAugust 2019
access to Quality schoolsAccess to quality schools is an important factor in housing choices for families with children. Map 17 shows that those families live all over the region with a significant concentration in Cincinnati. There are also many families that live in the integrated communities up through central and northern parts of Hamilton County. These communities tend to have a somewhat older population. These are the places “where my granny and my auntie live.” There are also family households in the suburban western and eastern parts of Hamilton County. Since the density in these communities is so much lower, the density of families is as well.
Map 18 paints a fairly stark difference between the schools in the eastern and western communities of Hamilton County and the City and northern suburban communities. This index measures reading and math test scores for 4th graders at the school building level for housing within a 1.5 mile radius. The Wyoming and Sycamore Schools in central Hamilton County are particularly strong as are a collection of schools in Cincinnati Public Schools in the Clifton, Northside, and Uptown areas (Fairview, Rockdale, Spencer, Parker Woods).
The R/ECAP areas in the region are, for the most part, served by low performing schools. Areas in north central Hamilton County also suffer from some low performing schools. Cincinnati Public Schools is the largest district in the County. Princeton Schools and Northwest Local are the other two larger districts in the County.
Academics are the first order of business for schools and test scores are an important indicator of performance. There is however more to a school, and being connected to a school community, than 4th grade test scores. For many families, particularly immigrant and refugee families the network of support they get at a school is critical to their quality of life. Families in Price Hill endure some pretty terrible housing conditions to be close to Roberts Paideia Academy (CPS) and Holy Family elementary schools. Roberts enrollment for the 2017-18 school year is 787 children, 394 of whom are English language learners. The Academy for World Languages in Evanston and the LEAP Academy in North Fairmont are both CPS schools that support immigrant and refugee families. The Academy of World Languages just opened a community health clinic to provide families in the schools and residents in the community a medical home and dental and vision care. Map 19 shows the 22 separate school districts located in Hamilton County’s 49 jurisdictions.

72Fair Housing Assessment for Cincinnati and Hamilton CountyAugust 2019
Map
17:
Per
cent
Hou
seho
lds
That
Are
Fam
ilies
with
Chi
ldre
n

73Fair Housing Assessment for Cincinnati and Hamilton CountyAugust 2019
Map18:SchoolP
roficiencyIndex
This
map
inde
x is
bas
ed o
n th
e pe
r sch
ool p
erfo
rman
ce o
f fou
rth
grad
ers o
n th
e st
ate
profi
cien
cy te
st.

74Fair Housing Assessment for Cincinnati and Hamilton CountyAugust 2019
Map
19:
Ham
ilton
Cou
nty
Scho
ol D
istr
icts

75Fair Housing Assessment for Cincinnati and Hamilton CountyAugust 2019
environmental issuesThe quality of air and water are critical to our overall health. Map 20 illustrates the likelihood of a resident in a given area being exposed to harmful toxins, based on Environmental Protection Agency (EPA) data. Unfortunately, most of Cincinnati is in an area that is likely being exposed to harmful toxins in the environment. This includes the R/ECAP areas, but also much of the City and the northern suburbs. Suburban and more rural parts of the region are illustrated to be less exposed than the urban parts of the district. Air quality has been a major issue for residents of Winton Hills, a R/ECAP area, as discussed earlier in the report. 2018 data shows a marked improvement in the Cincinnati region air quality according to U.S. EPA real-time air quality data.
In addition to air quality, water quality has been a major problem for the Cincinnati region. The Metropolitan Sewer District (MSD) is under a federal consent decree to reduce water pollution by reducing the amount of untreated sewage that is released into area waterways during wet weather events. Cincinnati, like many other eastern and Midwestern cities, has a combined storm and sanitary sewer system that cannot accommodate flows during heavy rain and flooding events, which are becoming more frequent. The largest combined sewer overflow (CSO) exists in the Lick Run watershed in the R/ECAP area of the Lower Mill Creek. The Lick Run project underway is a $193 million dollar infrastructure investment that will take 400 million gallons of untreated sewage out of the water system by the end of project construction in 2020.
Communities United For Action (CUFA) is a citizens group that has been working with residents for over a decade in response to significant problems residents are having with sewage backups in their homes, exposure to unhealthy water and the other risks associated with this source of pollution. CUFA has successfully worked with MSD to create more transparency in their planning and design process to include residents most impacted by the problems. In 2015, MSD created a Rate Affordability Task Force with representatives from CUFA, local governments, Legal Aid of Southwest Ohio and other community stakeholders. MSD has implemented all but one recommendation which is in process. These are often low-income households in R/ECAP areas and other protected class households. The rising cost of sewer and water utilities in the region are becoming a huge issue for low-income residents, many of whom are losing their access to water because of unpaid water bills. The Board of County Commissioners recently approved the new MSD Customer Assistance Program for senior residents with annual incomes less than $32,800 who can save up to 25% on their MSD bills beginning August 1, 2019.

76Fair Housing Assessment for Cincinnati and Hamilton CountyAugust 2019
Map
20:
Env
ironm
enta
l Hea
lth In
dex
This
map
inde
x in
clud
es th
e po
tenti
al e
xpos
ure
to h
arm
ful t
oxin
s at a
nei
ghbo
rhoo
d le
vel,
spec
ifica
lly id
entif
ying
air
qual
ity ri
sks.

77Fair Housing Assessment for Cincinnati and Hamilton CountyAugust 2019
access to CapitalFair lending practices are an important part of understanding the disadvantage that Black and Hispanic households face with they are trying to buy a home and access capital for home repairs and maintenance. Protected class households are more likely to be denied credit, regardless of their income and credit history, than White households. As a result, Black and Hispanic households are less likely to be homeowners. For most middle-class families, owning a home is the best way to build wealth. In focus groups, families that own a house that was passed down from a family member report that they are likely paying much less in monthly housing expenses than households renting in a rental market where prices are going up. In 2016, Home Mortgage Disclosure Act (HMDA) data shows that 77% of White applicants were able to obtain a home loan once an application was completed in the Cincinnati metropolitan area. For Black households, the number was just 66%.
In addition to mortgage lending, access to loan products that make it possible for owners to make needed repairs and to refinance while they can take advantage of better interest rates is important. Many property owners, and seniors in particular, struggle to maintain their homes. Without access to lending products, building conditions suffer. Many communities in the north central cluster report that property maintenance suffers when homeowners cannot get a loan, and as a result, property values are declining. Applications to refinance a home are often a way for households to make needed repairs and to cover other major household expenses. In the Cincinnati region, in 2016, 56% of refinance loan applications for White households were approved, while only 34% Black refinance loan applications were approved. Home improvement loans were approved 57% of the time for White households and only 28% of the time for Black households.
Creating new loan products that work for protected class households, including purchase rehab loans, mortgage loans for under $100,000, lines of credit for home repairs, limited use of land contracts (managed by community development corporations and other reputable property owners), and other flexible lending products. Alternative credit scoring practices will also help property owners and those looking to buy housing with loan qualification. Support and information is also critical. Many potential borrowers do not have experience with the mortgage lending process. They need support with documentation necessary and need to be connected with a trusted individual or institution.

78Fair Housing Assessment for Cincinnati and Hamilton CountyAugust 2019
disproportionate housing needs“Disproportionate housing need” means people are living in housing units that do not meet their needs. HUD describes housing problems as units that have one or more of these characteristics for the household living there: does not have full plumbing, does not have kitchen facilities, is overcrowded (more than two persons per bedroom) or that costs more than 30% of household income. To be adequate, housing for people with a disability also needs to accommodate their particular needs around access, “visitability”, and other accommodation for ease of use in their unit. Housing that suits a household is also in a place that the household chooses. It provides access to schools, health care, employment, healthy food, culture and entertainment, and for many households it’s near family and friends.
When a household cannot find housing that serves their needs they are exhibiting “housing need.” These families may be living in a household that does not fully welcome them (“couch surfing” or “staying with a friend”) or they may experience homelessness. Households may lose their housing as a result of eviction or foreclosure. Laws are being violated when households cannot find adequate housing because of discrimination based on their protected class status or when the cumulative impact of discrimination across communities results in disparate ability to access opportunities.
Table 6 reports that 54,190 households in the City and another 55,762 in the County have reported one of four housing problems (cost burden, lack of complete plumbing, lack of complete kitchen, or overcrowding). Nearly half of all Black and Hispanic households in the City and County report at least one housing problem. Only 34% of White households in the City and 27% of White households in the County report at least one of these problems.
Cost burdenThe most prevalent housing problem in Hamilton County and Cincinnati is cost burden. Cost burden is defined as a household spending more than 30% of their income on housing, and a severely cost burdened household is spending more than 50% of their income on their housing. Tables 9 and 10 illustrate these issues. In 2017, 27,725 Cincinnati households (21%) reported being severely cost burdened. In the County, another 23,251 households (13%) reported severe cost burden. In both the City and the County, Black households and Hispanic households are more likely to be severely cost burdened than White households, and that large families (those with 5 or more people) are more likely to be extremely cost burdened. See Table 7 and Map 21 for detailed information about cost burden in Cincinnati and Hamilton County.

79Fair Housing Assessment for Cincinnati and Hamilton CountyAugust 2019
Disproportionate Housing NeedsHouseholds experiencing any of 4 housing problems
# with problems
# households
% with problems
# with problems
# households
% with problems
# with problems
# households
% with problems
Race/Ethnicity White, Non-Hispanic 22,895 66,935 34.20% 39,576 144,003 27.48% 189,466 674,044 28.11%Black, Non-Hispanic 27,890 55,395 50.35% 13,573 27,866 48.71% 48,782 100,573 48.50%Hispanic 1,414 2,849 49.63% 1,255 2,750 45.64% 6,498 14,877 43.68%Asian or Pacific Islander, Non-Hispanic 883 2,747 32.14% 645 2,251 28.65% 3,963 13,786 28.75%Native American, Non-Hispanic 194 328 59.15% 73 211 34.60% 437 1,266 34.52%Other, Non-Hispanic 909 1,808 50.28% 610 1,665 36.64% 3,590 8,775 40.91%Total 54,190 130,055 41.67% 55,762 178,870 31.17% 252,725 813,300 31.07%
Household Type and SizeFamily households, <5 people 18,895 53,270 35.47% 26,179 104,438 25.07% 114,930 466,844 24.62%Family households, 5+ people 4,270 7,745 55.13% 5,223 15,765 33.13% 24,842 72,199 34.41%Non-family households 31,025 69,045 44.93% 24,345 58,635 41.52% 112,965 274,271 41.19%
Households experiencing any of 4 Severe Housing Problems
# with severe
problems#
households
% with severe
problems
# with severe problems
# households
% with severe problems
# with severe
problems#
households
% with severe
problemsRace/Ethnicity White, Non-Hispanic 11,900 66,935 17.78% 17,572 144,003 12.20% 86,081 674,044 12.77%Black, Non-Hispanic 16,355 55,395 29.52% 6,816 27,866 24.46% 27,297 100,573 27.14%Hispanic 1,005 2,849 35.28% 819 2,750 29.78% 4,261 14,877 28.64%Asian or Pacific Islander, Non-Hispanic 573 2,747 20.86% 351 2,251 15.59% 2,274 13,786 16.49%Native American, Non-Hispanic 104 328 31.71% 65 211 30.81% 287 1,266 22.67%Other, Non-Hispanic 573 1,808 31.69% 301 1,665 18.08% 1,903 8,775 21.69%Total 30,500 130,055 23.45% 25,973 178,870 14.52% 122,150 813,300 15.02%
(Cincinnati, OH-KY-IN) Region
Note 1: The four housing problems are: incomplete kitchen facilities, incomplete plumbing facilities, more than 1 person per room, and cost Note 2: All % represent a share of the total population within the jurisdiction or region, except household type and size, which is out of total
Note 4: Refer to the Data Documentation for details (www.hudexchange.info/resource/4848/affh-data-documentation).Note 3: Data Sources: CHAS
(Cincinnati, OH CDBG, HOME, ESG) Jurisdiction
(Hamilton County, OH CDBG, HOME, ESG) Jurisdiction
Table 6: Demographics of Households with Disproportionate Housing Needs

80Fair Housing Assessment for Cincinnati and Hamilton CountyAugust 2019
A report published in 2017 by LISC and the Community Building Institute (CBI) reported that a third of the population of Hamilton County was cost burdened (spending more than 30% of income on housing) and 40,000 Hamilton County households with incomes of 30% or less of Area Median Income (AMI) lived in housing that was not affordable to them. Maps 22 - 24 illustrate where the cost burdened households live. The most severely impacted households were those making 0-30% of Area Median Income (AMI). These cost- burdened households are clustered in the R/ECAP communities. See Map 21. Maps show that cost burdened renters live primarily in the City of Cincinnati and that cost burdened homeowners live in suburban locations throughout the County. See Maps 22 and 23.
Households with Severe Housing Cost BurdenRace/Ethnicity # with severe
cost burden# households % with
severe cost burden
# with severe cost burden
# households % with severe cost burden
# with severe cost burden
# households % with severe cost
burdenWhite, Non-Hispanic 10,920 66,935 16.31% 15,904 144,003 11.04% 77,030 674,044 11.43%Black, Non-Hispanic 15,095 55,395 27.25% 6,221 27,866 22.32% 24,972 100,573 24.83%Hispanic 620 2,849 21.76% 535 2,750 19.45% 2,818 14,877 18.94%Asian or Pacific Islander, Non-Hispanic
505 2,747 18.38% 238 2,251 10.57% 1,839 13,786 13.34%
Native American, Non-Hispanic
105 328 32.01% 55 211 26.07% 258 1,266 20.38%
Other, Non-Hispanic 480 1,808 26.55% 298 1,665 17.90% 1,504 8,775 17.14%Total 27,725 130,055 21.32% 23,251 178,870 13.00% 108,421 813,300 13.33%Household Type and SizeFamily households, <5 people
9,239 53,270 17.34% 10,047 104,438 9.62% 46,179 466,844 9.89%
Family households, 5+ people
1,920 7,745 24.79% 1,532 15,765 9.72% 7,424 72,199 10.28%
Non-family households 16,560 69,045 23.98% 11,525 58,635 19.66% 54,822 274,271 19.99%
(Cincinnati, OH-KY-IN) Region
Note 3: The # households is the denominator for the % with problems, and may differ from the # households for the table on severe housing problems. Note 4: Data Sources: CHASNote 5: Refer to the Data Documentation for details (www.hudexchange.info/resource/4848/affh-data-documentation).
Note 1: Severe housing cost burden is defined as greater than 50% of income.
(Cincinnati, OH CDBG, HOME, ESG) Jurisdiction
(Hamilton County, OH CDBG, HOME, ESG) Jurisdiction
Note 2: All % represent a share of the total population within the jurisdiction or region, except household type and size, which is out of total households.
Table 7: Demographics of Households with Severe Housing Cost Burden

81Fair Housing Assessment for Cincinnati and Hamilton CountyAugust 2019
Map
21:
Per
cent
Hou
seho
lds
With
Bur
den

82Fair Housing Assessment for Cincinnati and Hamilton CountyAugust 2019
CIN
CIN
NAT
IC
INC
INN
ATI
CO
LER
AIN
TOW
NS
HIP
AND
ER
SO
NTO
WN
SH
IPIND
IAN
HIL
LG
RE
ENTO
WN
SH
IP
WH
ITE
WAT
ER
TOW
NS
HIP
CR
OS
BYTO
WN
SH
IP
BLU
EAS
H
SHA
RO
NVI
LLE
MIA
MI
TOW
NS
HIP
SPR
ING
FIE
LDTO
WN
SH
IP
DEL
HI
TOW
NS
HIP
EVE
ND
ALE
FOR
ES
TPA
RK
SPR
ING
DA
LEH
ARR
ISO
NTO
WN
SH
IP
MA
DE
IRA
REA
DIN
G
LOV
ELA
ND
NO
RW
OO
DN
OR
WO
OD
WY
OM
ING
NEW
TOW
N
CLE
VE
S
HAR
RIS
ON
MONTGOMERY
SYM
ME
STO
WN
SH
IP
WO
OD
LAW
N
SYC
AMO
RE
TOW
NSH
IPAM
BER
LEY
VILL
AG
E
GLE
ND
ALE
CH
EVIO
TC
HEV
IOT
LOC
K-
LAN
D
GR
EEN
HIL
LS
SILV
ER
TON
SILV
ER
TON
FAIR
FAX
ADD
YS
TON
MO
UN
TH
EALT
HY
NO
RTH
BEN
D
SAIN
TSA
INT
BER
NA
RD
BER
NA
RD
DEE
RD
EER
PAR
KPA
RK
TER
RA
CE
PAR
K
NO
RTH
CO
LLE
GE
HIL
L
MA
RIE
MO
NT
CO
LUM
BIA
TO
WN
SH
IP
LIN
CO
LNH
EIG
HTS
GO
LFG
OLF
MA
NO
RM
AN
OR
ELM
WO
OD
ELM
WO
OD
PLA
CE
PLA
CE
ARLI
NG
TON
ARLI
NG
TON
HEI
GH
TSH
EIG
HTS
0033
66
Mile
sM
iles
¯S
ubur
ban
Ham
ilton
Cou
nty
City
of C
inci
nnat
i
Cin
cinn
ati n
eigh
borh
oods
Num
ber o
f Hou
seho
lds
Cos
t Bur
dene
d (<
30%
AM
I)<
125
125
- 249
250
- 499
> 49
9
Map
22:
Cos
t Bur
dene
d: E
xtre
mel
y Lo
w In
com
e H
ouse
hold
s

83Fair Housing Assessment for Cincinnati and Hamilton CountyAugust 2019
CIN
CIN
NAT
IC
INC
INN
ATI
CO
LER
AIN
TOW
NS
HIP
AND
ER
SO
NTO
WN
SH
IPIND
IAN
HIL
LG
RE
ENTO
WN
SH
IP
WH
ITE
WAT
ER
TOW
NS
HIP
CR
OS
BYTO
WN
SH
IP
BLU
EAS
H
SHA
RO
NVI
LLE
MIA
MI
TOW
NS
HIP
SPR
ING
FIE
LDTO
WN
SH
IP
DEL
HI
TOW
NS
HIP
EVE
ND
ALE
FOR
ES
TPA
RK
SPR
ING
DA
LEH
ARR
ISO
NTO
WN
SH
IP
MA
DE
IRA
REA
DIN
G
LOV
ELA
ND
NO
RW
OO
DN
OR
WO
OD
WY
OM
ING
NEW
TOW
N
CLE
VE
S
HAR
RIS
ON
MONTGOMERY
SYM
ME
STO
WN
SH
IP
WO
OD
LAW
N
SYC
AMO
RE
TOW
NSH
IPAM
BER
LEY
VILL
AG
E
GLE
ND
ALE
CH
EVIO
TC
HEV
IOT
LOC
K-
LAN
D
GR
EEN
HIL
LS
SILV
ER
TON
SILV
ER
TON
FAIR
FAX
ADD
YS
TON
MO
UN
TH
EALT
HY
NO
RTH
BEN
D
SAIN
TSA
INT
BER
NA
RD
BER
NA
RD
DEE
RD
EER
PAR
KPA
RK
TER
RA
CE
PAR
K
NO
RTH
CO
LLE
GE
HIL
L
MA
RIE
MO
NT
CO
LUM
BIA
TO
WN
SH
IP
LIN
CO
LNH
EIG
HTS
GO
LFG
OLF
MA
NO
RM
AN
OR
ELM
WO
OD
ELM
WO
OD
PLA
CE
PLA
CE
ARLI
NG
TON
ARLI
NG
TON
HEI
GH
TSH
EIG
HTS
0033
66
Mile
sM
iles
¯S
ubur
ban
Ham
ilton
Cou
nty
City
of C
inci
nnat
i
Cin
cinn
ati n
eigh
borh
oods
Num
ber o
f Ow
ner-
Occ
upie
d H
Hs
Cos
t Bur
dene
d (<
30%
AM
I)<
30
30 -
59
60 -
119
> 11
9
Map
23:
Cos
t Bur
dene
d: E
xtre
mel
y Lo
w In
com
e O
wne
r Hou
seho
lds

84Fair Housing Assessment for Cincinnati and Hamilton CountyAugust 2019
CIN
CIN
NAT
IC
INC
INN
ATI
CO
LER
AIN
TOW
NS
HIP
AND
ER
SO
NTO
WN
SH
IPIND
IAN
HIL
LG
RE
ENTO
WN
SH
IP
WH
ITE
WAT
ER
TOW
NS
HIP
CR
OS
BYTO
WN
SH
IP
BLU
EAS
H
SHA
RO
NVI
LLE
MIA
MI
TOW
NS
HIP
SPR
ING
FIE
LDTO
WN
SH
IP
DEL
HI
TOW
NS
HIP
EVE
ND
ALE
FOR
ES
TPA
RK
SPR
ING
DA
LEH
ARR
ISO
NTO
WN
SH
IP
MA
DE
IRA
REA
DIN
G
LOV
ELA
ND
NO
RW
OO
DN
OR
WO
OD
WY
OM
ING
NEW
TOW
N
CLE
VE
S
HAR
RIS
ON
MONTGOMERY
SYM
ME
STO
WN
SH
IP
WO
OD
LAW
N
SYC
AMO
RE
TOW
NSH
IPAM
BER
LEY
VILL
AG
E
GLE
ND
ALE
CH
EVIO
TC
HEV
IOT
LOC
K-
LAN
D
GR
EEN
HIL
LS
SILV
ER
TON
SILV
ER
TON
FAIR
FAX
ADD
YS
TON
MO
UN
TH
EALT
HY
NO
RTH
BEN
D
SAIN
TSA
INT
BER
NA
RD
BER
NA
RD
DEE
RD
EER
PAR
KPA
RK
TER
RA
CE
PAR
K
NO
RTH
CO
LLE
GE
HIL
L
MA
RIE
MO
NT
CO
LUM
BIA
TO
WN
SH
IP
LIN
CO
LNH
EIG
HTS
GO
LFG
OLF
MA
NO
RM
AN
OR
ELM
WO
OD
ELM
WO
OD
PLA
CE
PLA
CE
ARLI
NG
TON
ARLI
NG
TON
HEI
GH
TSH
EIG
HTS
0033
66
Mile
sM
iles
¯S
ubur
ban
Ham
ilton
Cou
nty
City
of C
inci
nnat
i
Cin
cinn
ati n
eigh
borh
oods
Num
ber o
f Ren
ter H
Hs
Cos
t Bur
dene
d (<
30%
AM
I)<
100
100
- 199
200
- 299
> 30
0
Map
24:
Cos
t Bur
dene
d: E
xtre
mel
y Lo
w In
com
e Re
nter
Hou
seho
lds

85Fair Housing Assessment for Cincinnati and Hamilton CountyAugust 2019
Map
25:
Per
cent
Hou
seho
lds
Who
Are
Ren
ters

86Fair Housing Assessment for Cincinnati and Hamilton CountyAugust 2019
Map
26:
Per
cent
Hou
seho
lds
Who
Are
Ow
ners

87Fair Housing Assessment for Cincinnati and Hamilton CountyAugust 2019
young FamiliesMore than any other group, 55% of large families (those with 5 or more people) report at least one housing problem (see Table 6). These findings are consistent with discussions from focus groups with young Black moms with children. Young families report property owners do not want to rent to them because they have too many children, which some owners know makes their housing overcrowded even when families may have two or more children in a room. The housing discrimination is based on property owners who do not want to rent to households with children or to young head of households who may not have much experience with paying bills and taking care of a household. Families and property owners also talk about complaints from neighbors as a reason not to rent to families with children. Social service providers report that single parent Black households with more than one child face daunting problems in finding housing that works for them. They have to be close to some kind of child care, decent schools, a parent or caregiver’s work or education, a bus route that gets them to all those places, and a rent they can afford. Agencies also report that these households are reluctant to ask for help because they worry that they will lose their children if they do not have stable housing. This keeps young families from reporting discrimination.
Many families with children are living in R/ECAP locations where it can be difficult to access good educational and employment opportunities for them and their children. See Table 11 Of those families in public housing in R/ECAP areas, 94% are Black and 51% are families, In project-based Section 8 units, 87% of households are Black and 43% are families with children. Providing opportunities for families with children would require new or renovated housing with two and three bedrooms in opportunity areas be a priority. A recent study conducted for the Legal Aid Society of Greater Cincinnati, LIHTC Awards in Ohio, 2006-2015: Where Are They Providing Housing for Families with Children?, by Jill Khadduri and Carissa Climaco (2016), illustrates that the number of family projects built in low poverty areas in Ohio has gone down between 2006 and 2015, and that most LIHTC awards are made to projects at 50 to 100% of AMI, not to more deeply subsidized projects. Cincinnati and Hamilton County could prioritize new family projects in non-R/ECAP areas in the future to give families better opportunities for access to good schools, health care, and employment.

88Fair Housing Assessment for Cincinnati and Hamilton CountyAugust 2019
young adultsYoung adults, particularly those 18-24 aging out of foster care and on their own, face housing discrimination based on age and lack of supports to be successful. These young people, many of whom identify as LGBTQ face some significant challenges as they try to navigate the housing market with little or no support or experience. Property owners are reluctant to rent to them because of their lack of experience. Young adults report that a property owner will tell them directly they are too young to rent, but these young people often do not complain or report this discrimination. A focus group with young adults who had experienced homelessness revealed the huge challenges they face to get on their feet, lack of health care, no real access to higher education, difficulty finding living wage jobs, mental health trauma and difficulties, and lack of affordable housing. The services available to them can be very hard to navigate, if they are available at all.
limited options for seniorsSeniors are often trapped in housing that does not serve their needs, or that they cannot afford, because there are few other options for them. Seniors with disabilities are having a hard time managing in their single-family homes and not sure how to access services that would let them age in place or where to find affordable housing that would be more suitable. This also becomes a challenge between matching people with the right housing and supportive services. There are innovative conversations going on in Kennedy Heights, Woodlawn and other communities to begin to address these issues. The Council on Aging of Southwestern Ohio has been working to identify and support “naturally occurring senior communities.” The Council on Aging receives significant funding from the county-wide senior services levy to assist seniors in the region. These efforts often correspond to work to support those with disabilities.
In 2017, the City created the Office of Aging and Accessibility to supports older individuals and persons with disabilities, their families and caregivers in achieving safe, healthy, dignified, independent, and self-reliant lives through collaboration, innovation, and community partnerships. The goal is to foster a Cincinnati that is the best place to live independently and grow older in a community that provides exceptional opportunities and respects persons of all ages and all levels of abilities.

89Fair Housing Assessment for Cincinnati and Hamilton CountyAugust 2019
people with disabilities People with disabilities also experience housing challenges, often to get the kind of accommodations they need to live comfortably, and that are afforded to them by law. According to Table 8, there are over 131,400 people in the region with ambulatory difficulties, 21,900 live in the City and anther 28,000 live in Hamilton County. The table highlights people with hearing, vision, cognitive, self-care and independent living difficulties as well. For all of these households looking for housing, it is reasonable to expect property owners to make reasonable accommodations. Maps 27, 28, and 29 illustrate that these households are the most widely dispersed protected class households in the region.
Seniors report significant challenges with property owners making appropriate accommodations for them. Property owners often deny requests to make changes, seeming not to understand that this discrimination is against the law. Disabled residents report that owners often cite expense as a reason to refuse an accommodation. Service animals are a major issue and disabled residents report this can be a huge challenge. Neighbors who complain about service animals can cause hostile environments for residents. Between 2017 and 2018, over 65% of the discrimination complaints fielded by HOME were complaints from residents claiming they had been discriminated against based on their disability.
Table 8: Disability by Type
Housing Units # % # %
Total housing units 160,633 - 196,111 -
Public Housing 5,347 3.33% 32 0.02%
Project-based Section 8 6,643 4.14% 1,266 0.65%
Other Multifamily 357 0.22% 190 0.10%
HCV Program 7,761 4.83% 3,864 1.97%
(Cincinnati, OH CDBG, HOME, ESG)
Jurisdiction
Note 1: Data Sources: Decennial Census; APSHNote 2: Refer to the Data Documentation for details (www.hudexchange.info/resource/4848/affh-data-documentation).
(Hamilton County, OH CDBG, HOME, ESG) Jurisdiction

90Fair Housing Assessment for Cincinnati and Hamilton CountyAugust 2019
Map
27:
Dis
abili
ty: H
earin
g, V
isio
n, C
ogni
tive
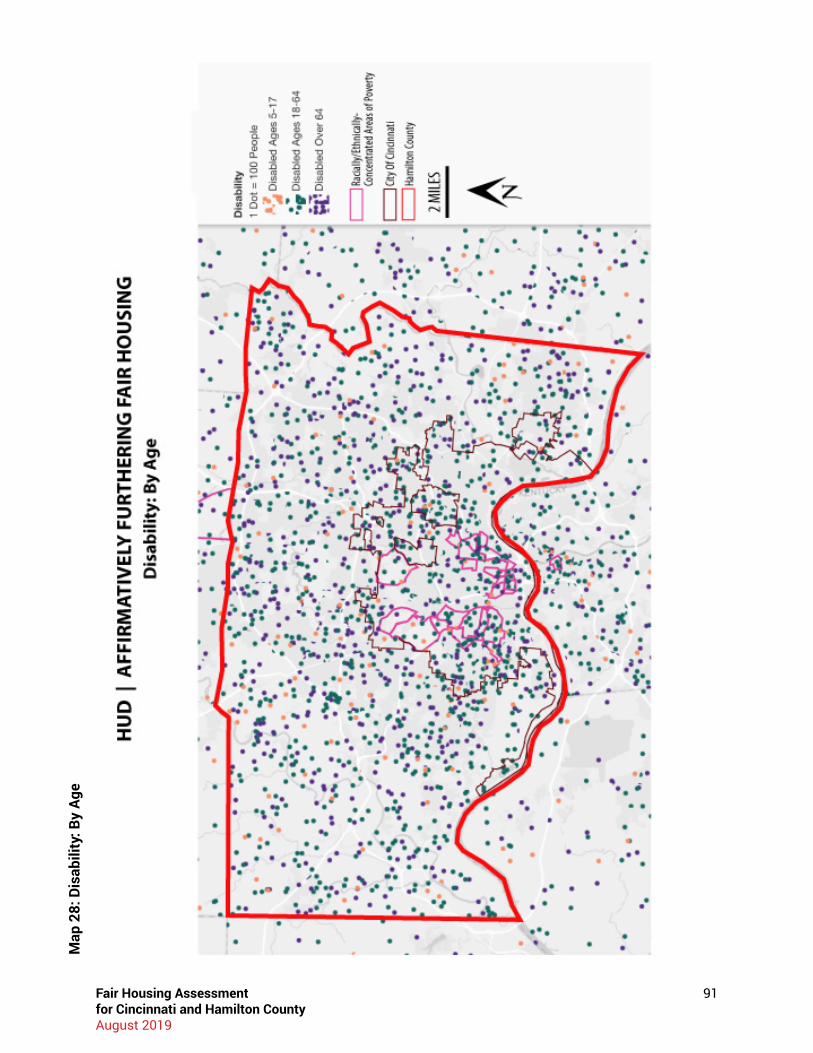
91Fair Housing Assessment for Cincinnati and Hamilton CountyAugust 2019
Map
28:
Dis
abili
ty: B
y Ag
e

92Fair Housing Assessment for Cincinnati and Hamilton CountyAugust 2019
Map
29:
Dis
abili
ty: B
y Am
bula
tory
, Sel
f-Ca
re, I
ndep
ende
nce
Livi
ng

93Fair Housing Assessment for Cincinnati and Hamilton CountyAugust 2019
Focus groups with people with disabilities have indicated they are often looking for housing in select neighborhoods. They want to be near family support networks and be able to access resources they know. As we have said often, this can make life challenging in much of the County where that is not reasonable access to reliable public transportation. This widely dispersed settlement pattern may explain part of why this protected class of residents makes up 65% of the housing complaints HOME has addressed over the past two years. People trying to find options in communities they are familiar with sometimes encounter property owners who do not understand or chose not to follow fair housing laws around accommodations.
poor Housing ConditionsThe poor condition of much of the affordable housing in the region warrants a larger conversation about the conditions many low-income protected class households find themselves in and the terrible choice to stay in unsafe, unsanitary housing or risk homelessness.
Extremely poor housing conditions for immigrants.
Immigrant residents in Price Hill and other near west side neighborhoods, Norwood, and Carthage are often living in units in very poor condition. These residents and Su Casa Hispanic Center and Santa Maria Community Services staff report that immigrants who do not have access to publicly subsidized housing must fend for themselves in the affordable private market. Residents report awful housing conditions and little recourse to seek improvements. Immigrants do not feel they can complain to the City because of language barriers, because they fear they will be evicted if they complain, and because they do not believe complaining will do them any good. Hispanic families like living in Price Hill because they feel comfortable that the schools in the area (Holy Family and Roberts in particular) serve their children well, but they are putting up with very poor living conditions so their children can access these schools.

94Fair Housing Assessment for Cincinnati and Hamilton CountyAugust 2019
Refugee households.
Refugee households, many of them in public housing, likewise complain of poor housing conditions and they do not feel empowered to get anything accomplished by reporting them. They report property managers who discourage formal complaints and then never follow-up or make needed repairs based on verbal complaints. Both immigrant households and refugee households often report being bullied, harassed, and victimized by other residents in public housing or in private buildings, and by neighbors.
While immigrants and refugees face some particular challenges dealing with poor property conditions, they are certainly not alone. Residents in protected classes all over the region report poor housing conditions and a sense that there is little they can do to effect change. As the housing market for affordable units continues to tighten, particularly in neighborhoods in the urban core where residents want to live, they do not want to risk losing their housing, even if it is in really bad condition. Residents report windows and doors that do not close or lock, bug infestations, plumbing and water problems, lack of heat and other deplorable housing conditions.
Lack of Utilities.
Residents also report that property owners are renting units that do not have running water or electricity. A recent field study of vacant housing in Hamilton County conducted by LISC in the summer of 2018 uncovered that many units identified through the Census or the US Postal Service records as vacant, and units that had water shut offs, were actually occupied. In some cases, there were tenants in buildings without proper utilities paying rent to a property owner. A significant problem both renters and housing service providers identified was households who have large outstanding water and utility bills not being able to rent units and have utilities turned on without paying back bills often in the thousands of dollars, something many low-income households cannot do. So rather than risk homelessness, people are living in some very poor conditions.

95Fair Housing Assessment for Cincinnati and Hamilton CountyAugust 2019
publicly supported housingIn order to provide support for households who cannot find housing in the private market, there are 25,460 publicly supported housing units in Hamilton County (20,108 in the City and 5,352 in the County). Table 9 illustrates the types of publicly supported housing in the City and the County. This number represents about 100 more units than were available in 2015 (25,328).The figures below demonstrate that we are not keeping up with the need in the community.
Housing Units # % # %
Total housing units 160,633 - 196,111 -
Public Housing 5,347 3.33% 32 0.02%
Project-based Section 8 6,643 4.14% 1,266 0.65%
Other Multifamily 357 0.22% 190 0.10%
HCV Program 7,761 4.83% 3,864 1.97%
(Cincinnati, OH CDBG, HOME, ESG) Jurisdiction
Note 1: Data Sources: Decennial Census; APSHNote 2: Refer to the Data Documentation for details (www.hudexchange.info/resource/4848/affh-data-documentation).
(Hamilton County, OH CDBG, HOME, ESG) Jurisdiction
Table 9: Publicly Supported Housing Units by Program Category
Over half of these units (11,625) are private market units renters are accessing with Housing Choice Vouchers (HCV), which are becoming increasingly difficult to use in a market with much more competition from market rate renters. Some property owners also complain that the inspections required for approval to use a voucher are too strenuous and so property owners just decline the voucher holder, which is legal in this region. The Legal Aid Society of Greater Cincinnati, Housing Opportunities Made Equal (HOME), and other housing support organizations report that their HCV clients are often not able to use their voucher because they cannot find property owners who will accept them. Map 30 clearly illustrates that property owners accepting vouchers are located in the City of Cincinnati and the integrated northern suburbs of Hamilton County. Map 31 shows the general location of public housing, other multi-family housing, project-based Section 8 units, and Low-Income Housing Tax Credit (LIHTC)units. This illustrates the same patterns as the HCV locations - a concentration of units in the City and northern suburbs, and a lack of units in the eastern and western suburbs.

96Fair Housing Assessment for Cincinnati and Hamilton CountyAugust 2019
Map
30:
Pub
licly
Sup
port
ed V
ouch
er U
nits

97Fair Housing Assessment for Cincinnati and Hamilton CountyAugust 2019
Map
31:
Pub
licly
Sup
port
ed H
ousi
ng

98Fair Housing Assessment for Cincinnati and Hamilton CountyAugust 2019
(Cincinnati, OH CDBG, HOME, ESG) JurisdictionHousing Type # % # % # % # %Public Housing 358 6.99% 4,713 92.01% 47 0.92% 3 0.06%Project-Based Section 8 1,152 19.56% 4,666 79.22% 53 0.90% 13 0.22%Other Multifamily 115 34.85% 213 64.55% 1 0.30% 0 0.00%HCV Program 560 7.72% 6,640 91.51% 51 0.70% 3 0.04%Total Households 66,935 51.47% 55,395 42.59% 2,849 2.19% 2,747 2.11%0-30% of AMI 11,770 31.90% 22,555 61.12% 740 2.01% 914 2.48%0-50% of AMI 17,915 32.30% 32,295 58.23% 1,280 2.31% 1,189 2.14%0-80% of AMI 28,390 37.00% 42,050 54.80% 1,805 2.35% 1,419 1.85%(Hamilton County, OH CDBG, HOME, ESG) JurisdictionHousing Type # % # % # % # %Public Housing 6 26.09% 17 73.91% 0 0.00% 0 0.00%Project-Based Section 8 605 53.12% 523 45.92% 10 0.88% 1 0.09%Other Multifamily 41 25.95% 116 73.42% 1 0.63% 0 0.00%HCV Program 483 13.50% 3,074 85.94% 14 0.39% 6 0.17%Total Households 144,003 80.51% 27,866 15.58% 2,750 1.54% 2,251 1.26%0-30% of AMI 13,500 65.36% 6,035 29.22% 617 2.99% 123 0.60%0-50% of AMI 22,783 55.71% 10,717 26.20% 1,070 2.62% 350 0.86%0-80% of AMI 46,481 65.72% 15,786 22.32% 1,568 2.22% 637 0.90%(Cincinnati, OH-KY-IN) RegionHousing Type # % # % # % # %Public Housing 2,030 25.94% 5,599 71.53% 189 2.41% 5 0.06%Project-Based Section 8 4,452 43.94% 5,540 54.68% 97 0.96% 27 0.27%Other Multifamily 871 71.33% 340 27.85% 4 0.33% 2 0.16%HCV Program 6,167 34.23% 11,635 64.57% 191 1.06% 21 0.12%Total Households 674,044 82.88% 100,573 12.37% 14,877 1.83% 13,786 1.70%0-30% of AMI 70,968 64.07% 32,565 29.40% 3,168 2.86% 1,651 1.49%0-50% of AMI 118,213 58.57% 49,334 24.44% 5,697 2.82% 2,996 1.48%0-80% of AMI 228,858 68.20% 66,973 19.96% 8,286 2.47% 4,309 1.28%
Note 3: Refer to the Data Documentation for details (www.hudexchange.info/resource/4848/affh-data-documentation).Note 2: Numbers presented are numbers of households not individuals.
Race/Ethnicity
White Black Hispanic Asian or Pacific Islander
Note 1: Data Sources: Decennial Census; APSH; CHAS
White Black Hispanic Asian or Pacific Islander
White Black Hispanic Asian or Pacific Islander
Table 10: Publicly Supported Households by Race/Ethnicity
The vast majority of households in CMHA public housing units (92%), other site-based projects (78%), and HCV holders (91%) in Cincinnati are Black (see Table 10). While the overall number of subsidized units in the County is lower and the concentration is slightly less, the majority of households in HCV units are Black (86%). Immigrant households that do not have legal status do not have access to publicly supported housing and are mostly finding housing in the private market. See Appendices E and F for detail on the number of units in various locations in the region in the City and the County.

99Fair Housing Assessment for Cincinnati and Hamilton CountyAugust 2019
Hamilton County has awarded over $4 million dollars between 2016-18 to support the construction or retention of nearly 450 units throughout the County. Projects range from the renovation of 14 single-family homes and the construction of new Habitat for Humanity homes in West College Hill to the construction of permanent supportive housing in the West End in partnership with Tender Mercies to support the Talbert House Logan Towers project. The City’s investment in Logan Towers was approximately $1 million.
(Cincinnati, OH CDBG, HOME, ESG) Jurisdiction
Total # units (occupied)
% White % Black % Hispanic % Asian or Pacific
Islander
% Families with
children
% Elderly % with a disability
Public HousingR/ECAP tracts 3,194 4.27% 94.97% 0.75% 0.00% 51.44% 15.67% 22.58%Non R/ECAP tracts 1,969 11.44% 87.16% 1.19% 0.15% 43.32% 19.03% 33.37%Project-based Section 8R/ECAP tracts 3,374 11.67% 87.19% 1.07% 0.06% 43.65% 16.69% 17.90%Non R/ECAP tracts 2,625 29.41% 69.25% 0.69% 0.42% 17.55% 42.21% 30.38%Other Multifamily
R/ECAP tracts 179 18.82% 80.65% 0.00% 0.00% N/a 85.43% 30.65%Non R/ECAP tracts 147 55.56% 43.75% 0.69% 0.00% N/a 94.87% 0.00%HCV ProgramR/ECAP tracts 2,360 4.66% 94.83% 0.43% 0.09% 59.41% 7.57% 17.17%Non R/ECAP tracts 4,952 9.19% 89.91% 0.84% 0.02% 52.04% 11.28% 20.94%(Hamilton County, OH CDBG, HOME, ESG) Jurisdiction
Total # units (occupied)
% White % Black % Hispanic % Asian or Pacific
Islander
% Families with
children
% Elderly % with a disability
Public HousingR/ECAP tracts N/a N/a 0.00% N/a N/a N/a N/a N/aNon R/ECAP tracts 24 26.09% 73.91% 0.00% 0.00% 37.50% 0.00% 6.25%Project-based Section 8R/ECAP tracts N/a N/a 0.00% N/a N/a N/a N/a N/aNon R/ECAP tracts 1,169 53.12% 45.92% 0.88% 0.09% 28.55% 48.60% 18.35%Other Multifamily
R/ECAP tracts N/a N/a N/a N/a N/a N/a N/a N/aNon R/ECAP tracts 163 25.95% 73.42% 0.63% 0.00% N/a 90.40% 0.56%HCV ProgramR/ECAP tracts 0 N/a N/a N/a N/a N/a N/a N/aNon R/ECAP tracts 3,603 13.45% 85.99% 0.39% 0.17% 64.77% 10.00% 18.69%
Note 2: Data Sources: APSHNote 3: Refer to the Data Documentation for details (www.hudexchange.info/resource/4848/affh-data-documentation).
Note 1: Disability information is often reported for heads of household or spouse/co-head only. Here, the data reflect information
Table 11: R/ECAP and Non-R/ECAP Demographics by Publicly Supported Housing Program Category

100Fair Housing Assessment for Cincinnati and Hamilton CountyAugust 2019
While publicly-supported housing units remain the same, the number of households that need them is increasing. The number of units for rent in the private market at less than $750 per month is decreasing. Between 2000 and 2014, the LISC/CBI report found a loss of over 10,000 units available at $750 or less in the private market.
evictions and Foreclosures Rental evictions and property foreclosures are a very bad way to have to lose one’s housing. The simple way to understand these events is that when a household does not have the money to pay the rent or the mortgage they lose their housing. When severely cost burdened households are paying beyond 50% of their income on housing, these events become unavoidable. They set off a chain of events that can cause financial instability for years. They are caused by poverty and simultaneously cause poverty. Financial stability and housing stability are very connected.
Table 12: Census Tract Racial Composition by Eviction Filing Rate (percent non-Hispanic Black)

101Fair Housing Assessment for Cincinnati and Hamilton CountyAugust 2019
Map
32:
Ave
rage
Evi
ctio
n Fi
ling
Rate
by
Cens
us T
ract
, 201
4-20
17

102Fair Housing Assessment for Cincinnati and Hamilton CountyAugust 2019
Reporting by the Legal Aid Society of Greater Cincinnati (Legal Aid) found that between 2014 and 2016, there were over 37,800 evictions in Hamilton County, with 8,465 of them resulting in households being “set out,” meaning all their belongings placed on the sidewalk. Research conducted by Elaine Johns-Wolfe at the University of Cincinnati in 2018 provides a better understanding of the impact of evictions on protected class households. The incidence of evictions, illustrated on Map 32 and Table 12, are highest in communities where the majority of residents are Black. A high incidence of evictions can also be found in the R/ECAP locations. Both the City and County fund foreclosure prevention with Legal aid and both will be funding eviction prevention in 2019.
HomelessnessThe ultimate failure of the housing market and public supports for those who need housing is homelessness. The Cincinnati region, like areas all across the country, struggles with homelessness. The City and the County have worked together through a Continuum of Care (CoC) since 1995 to address homelessness in a coordinated manner. The current CoC is managed by Strategies to End Homelessness (Strategies). Strategies, which was formed in 2007, is a collaboration between government, non-profit agencies, funders, housing providers, and policy-makers to address the issues of homelessness in the region, align resources, and coordinate services. There are 30 agencies that partner with Strategies in their mission to end homelessness. In 2017, HUD certified Strategies as one of eight Unified Funding Agencies in the country. Strategies manages over $22 million in resources for programs to eliminate homelessness.
Strategies, using the Homeless Management Information System (HMIS) data system, identified 7,197 individuals as homeless at some point in 2017. The majority of them were Black (62%), and a nearly one in four were children under 18 (24%). Strategies found that there were 560 families with children who experienced homelessness in 2017. These two groups, young people and families, are the target of particular attention at Strategies in the upcoming years. This is very consistent with what was heard in focus groups with protected class residents. Young people on their own and young families with young children are experiencing discrimination based on their age, their family status, and their lack of experience. While they are certainly struggling with poverty, they reported in focus groups that property owners openly discriminated against them when sharing why they would not rent to these young households. While these households expressed experiencing discrimination, they do not complain and do not show up in the HOME complaint tally because they fear losing their housing.

103Fair Housing Assessment for Cincinnati and Hamilton CountyAugust 2019
Strategies works with partners who provide rapid rehousing, transitional housing, permanent supportive housing, and a central access point for information. Strategies reports more people being served in each of these areas and fewer people on the streets between 2014 (1,700) and 2017 (980). The increase in clients being served in rapid re-housing was up 35% to 3,336 clients in 2017, transitional housing up 25% to 900 clients in 2017. This is indicative of the growing problem of a lack of affordable housing. As Strategies continues to increase shelter beds and temporary housing units, the needs just keep growing.
Trying to access services and find a housing unit when in a crisis situation can be a very stressful experience. Strategies reports assisting 993 households who called in 2017. The total call volume was 4,458. Those people who are looking for housing in a crisis feel very frustrated by the “system,” certainly not just with Strategies but with lots of agencies that are struggling to keep up with the need. While the support network to address homelessness is getting better and more coordinated, and there are more units of supportive housing, the people who need support report feeling lost and without the resources they need to navigate the system.
Young people in focus groups report that when they try to access services or find housing using the many “help lines,” “clearing houses,” or “one-stop resources” they experience very long wait times and lines to get little or no help. Young people (18-24), Black households living in poverty, immigrants, refugees, and disabled households all report a complex, confusing system of programs and services that are hard to access and often require multiple trips to places where it can take hours to make an application for services. People find out after very long wait times that help lines set up to help find housing or housing resources often do not have anything to offer. People looking for support feel disrespected and frustrated. Young people at Lighthouse Youth Services reported that this lack of resources or the knowledge of how to access resources absolutely leads to homelessness.
The Homeless Coalition (Coalition) is another organization that advocates for affordable housing and provides support services for people who are experiencing homelessness. The Coalition is actively involved in organizing low-income tenant organizations so residents can speak for themselves and advocate for policy change that will make systems changes. The Coalition, along with Advocates Housing Affordability (AHA) and LISC, were instrumental in advocating for a newly established housing trust fund that Cincinnati City Council established in 2018.
104Fair Housing Assessment for Cincinnati and Hamilton CountyAugust 2019
The City of Cincinnati allocates a portion of its general fund budget to human services providers to fulfill specified policy objectives, which include reducing homelessness, increasing gainful employment, violence prevention, and addiction treatment. Over the past two years, this human services funding has supported critical job training and homeless services for over 12,000 City residents.
Housing supportive servicesStable housing, social and emotional supports, and counseling are all key to helping people living in poverty, people with mental health issues, or people with disabilities to become stable contributing households. One without the other is often not a successful strategy for an individual or a family in becoming self-sufficient. Housing providers and social service agencies know this to be true and the shortage of affordable housing makes the challenges of our most vulnerable populations much worse. Agencies working on mental health, support for returning citizens, youth aging out of foster care, and the disabled all have similar challenges in finding adequate housing for their clients.
Organizations that provide support services for vulnerable and protected class populations are increasingly finding themselves in the housing business. In addition, housing developers, property owners, and community development corporations struggle to find support services for residents that have challenges. This pushes both kinds of agencies into work that they are not prepared and do not have capacity. In the case of property owners who may be open and willing to rent to vulnerable populations but are not able to support people with significant challenges, the relationship does not always end well. Property owners lose patience, renters feel bullied, and there is a loss of housing, and at worst eviction.
Support service agencies big and small often find themselves way out of their comfort zone trying to provide housing because clients cannot find it on their own. For example, Talbert House’s principal mission is to provide mental health and addiction services; it has become a significant housing provider because staff know successful treatment requires stable housing for their clients. Likewise, a small organization like Lydia’s House, which supports young single moms with young children, has a mission to provide supportive services to fragile families. They now find themselves in the housing business for the same reason. Their clients are among the most discriminated against population in the region.

105Fair Housing Assessment for Cincinnati and Hamilton CountyAugust 2019
There is little coordination between agencies.
Focus groups of residents reported that among agencies who provide support services for low- and moderate-income households, and for immigrant, refugee, handicapped, senior, or young households (often the same households), there is very little coordination. All of these agencies are looking for housing for their clients, operating their own intake processes and trying to provide furnishings and supports so households can be successful. Caseworkers describes their process to accomplish these tasks similarly, they have a relationship with a few property owners who they know will rent to their clients, and they guard those contacts closely to make sure they are available when they need them.
Therearenotenoughresourcestoservethosewhoarestrugglingtofindhousing.
Agencies that support protected classes and work to intentionally reduce barriers to fair housing and protect clients from the problems associated with discrimination have all received less funding over the past five years. The Legal Aid Society of Greater Cincinnati, Housing Opportunities Made Equal (HOME), Strategies to End Homelessness, and Lighthouse Youth Services have all experienced budget, staff, and program cuts. This at a time when the needs are growing. The shortage of affordable housing, the reductions in funds from HUD, the growing opioid crisis, and residential market trends all conspire to make housing challenges acute for residents who are low- and moderate-income, and particularly those who are Black, Latino, and handicapped. In an ever more challenging housing market, vulnerable residents are left to fend for themselves. Feedback from the focus groups and data from the agencies listed above provides evidence that this is resulting in greater homelessness, people occupying buildings without adequate utilities, and being preyed upon by discriminatory property owners and managers. Agency front line staff, housing counselors, and residents themselves report heartbreaking examples of discrimination, abuse, and people living in horrible conditions.
unwelcoming CommunitiesThere are opportunity areas all over the County that protected class residents never even consider because they do not feel welcomed, there is no public transportation, and housing is assumed too expensive. Agencies report that people do not feel welcomed in these mostly White communities, they have heard stories of police harassment, they expect housing to be too expensive and they have no experience in these communities because they do not know anyone who has lived there.

106Fair Housing Assessment for Cincinnati and Hamilton CountyAugust 2019
Housing Opportunities Made Equal (HOME) reports relatively few complaints in 2017 and 2018 based on race or national origin (155, or 17% of total complaints), but housing stakeholders who support protected populations suggest it is because these households never make it to these neighborhoods.
Agencies who are working to provide additional housing for their disabled, young, immigrant and refugee clients report some communities in the region are very hard to work with. These communities are mostly outside the City of Cincinnati, but there have been recent experiences in several majority Black neighborhoods of Cincinnati, where there was opposition to housing for people with disabilities and mental health challenges.
Contributing FactorsMarket Change – Geographic disparities.
Ten years out from the The Great Recession of 2007 to 2009, it seems clear that this region has recovered and made significant strides. Cincinnati has created jobs, increased wealth, and accomplished some major infrastructure projects long in the works. The construction of the Martin Luther King Drive I-71 interchange provides better access to Uptown from the east side of the region and the streetcar (downtown circulator) is complete and operational. There are also major institutions making new investments in the urban core and the region’s position as a logistics hub with improvements at the airport and other expansions is impressive. County jurisdictions have also experienced increased investment in housing and commercial sectors as well.
The region still, however, struggles with poverty and segregation. Market changes are impacting different parts of the region differently. While regional leadership has identified concentrated poverty as a concern for decades, it continues in the region in some of the R/ECAP areas identified here, though some of them are changing dramatically as new investment drives up property values. The countervailing trend not identified as much is concentrated areas of wealth. The east side of Cincinnati and Hamilton County remain racially segregated with housing values and median incomes rising. The west side of Cincinnati and northern Cincinnati and Hamilton County are becoming more racially diverse and households who are poor are finding their way into these communities which are providing more housing and educational options for them.

107Fair Housing Assessment for Cincinnati and Hamilton CountyAugust 2019
Housing markets are changing as well, some in part as a response to these bigger infrastructure and economic development investments and some because of hard work by community residents. Public and private investments are also changing the image and perceived and actual livability of communities in the region.
Increasing poverty in suburbs – north central Hamilton County.
Households living in poverty are clearly moving into more diverse parts of the City and into the County to north central communities. In 2018 research prepared by Tom Carroll, the Village Manager in Silverton, Carroll reports “What I observe after data collection is that a decade after the 2008 recession, Hamilton County’s 14 affluent suburbs have stabilized and largely recovered. But 10 other first suburbs have experienced a rapid acceleration of decline. In the middle, are nine first suburbs with great stress and trajectories going in the wrong direction.” These nine communities identified as “under stress” and “in decline” are among the most diverse suburban communities and are the places where many protected class residents live outside of Cincinnati. The health and prosperity of these areas should be of great concern, as they are the opportunity areas for protected class households in the region. For more information on Tom Carroll’s research, please see Appendix I (Hamilton County ICMA Fellowship Data).
Successful Integration.
North central Hamilton County is an integration success story. Community members, White and Black, reported living in integrated communities for decades where they have good relationships within their community and they feel supported by their neighbors. City, village, and township managers, along with other appointed and elected officials, are actively thinking about the diversity in their communities and working to preserve it. Young and older residents report good experiences in schools, longevity in their housing and a sense of general wellbeing about their communities. There are employment, health care, and shopping opportunities in these places and overall people feel satisfied with their communities.
Transportation can be an issue and true mobility in north central Hamilton County requires a car. While there are limited bus routes it can be a challenge to get to a wide range of locations and employment centers and most of the system this far out is designed to get you downtown for a transfer, which can mean a very long ride.

108Fair Housing Assessment for Cincinnati and Hamilton CountyAugust 2019
The issues that worry these communities is how to accept and support a growing low-income population and ensure that property conditions and housing markets stay stable and attract new investment. As poverty grows in these stable communities, they struggle to support this new population without the services and supports typically available in more urban neighborhoods. Elected officials are also paying attention to a trend that more of the single-family housing in their communities is being bought by out of town real estate investment trusts (REITs) and rented, with resulting deteriorating property conditions. As an example, Vinebrook Homes, a REIT, has acquired 1,200 homes or units in the County since 2005. Several of these are single-family homes.
Revitalization in the Urban Core.
There have been significant community and economic development investments and revitalization efforts in downtown, the basin communities and Uptown over the past decade. The changes to parks and civic spaces in OTR, Downtown, and the Banks have literally created new neighborhoods at the riverfront and fundamentally changed commercial and housing markets in many basin and Uptown communities.
Rising prices in historically Black neighborhoods in the basin, Uptown, and near east side are perceived to be displacing Black residents and exacerbating the affordable housing shortage. The improving market conditions in places like Over-the-Rhine, Corryville, Walnut Hills and Evanston signal a move back to the City by higher income households that are spending more on rent and to buy houses. Current residents fear displacement and in focus group discussions there are many incidents of low-income and Black households being displaced as rents in these communities rise. Long time owners and renters who remain in these communities are bracing themselves for the cultural conflicts and challenges that come with new neighbors.
Handicapped renters report that asking for accommodations often results in property owners trying to get them out of a unit when property owners think they can get a higher rent from someone else. Property owners who continue to rent at affordable rates (under $900 a month) are much less willing to make needed repairs. Renters do not want to complain about poor conditions too much for fear of losing their unit with nowhere else to go.
In focus groups conducted for this report, Black homeowners in these communities feel they are being singled out and harassed about housing code violations. These owners report not having the money to make needed repairs and not being able to get loans for property maintenance. Homeowners are worried they will not be able to keep up with rising property

109Fair Housing Assessment for Cincinnati and Hamilton CountyAugust 2019
taxes. They fear losing the retail and services that they need to coffee shops and bars. They also report that cultural differences between them and new, higher-income households are making them feel less a part of their own communities. In the County, some communities have experienced the loss of smaller, affordable single-family homes as they are purchased for demolition and then replaced by much larger homes (esp. Blue Ash, Montgomery, and Madeira).
Market Strengthening in Some R/ECAP Neighborhoods.
There are several neighborhoods in the basin area (Downtown, Over-the-Rhine, and the West End) of Cincinnati and in the near east side (another R/ECAP area that includes parts of Avondale and Walnut Hills and Evanston) that are part of the economic resurgence of the urban core. These communities are certainly changing. In focus groups with people who live in these communities, they report displacement and increasing rents and lots of speculative property acquisitions. Senior Black homeowners in Evanston report getting multiple offers per month to buy their homes. Renters in Walnut Hills renting from private market owners report non-renewal of leases, property owners unwilling to sign one-year leases, and other activity they perceive are designed to get them out of their units. Based on a 2015 study completed CBI it is estimated that over 3,000 units of affordable housing have been lost from OTR. Affordable units have been lost as a result of changes to HUD funding of site-based housing, poor property conditions, and private and public investments in higher cost housing.
The West End and Avondale are both neighborhoods with majority Black households where major economic development investments are being made. In Avondale, Cincinnati Children’s Hospital Medical Center is in the middle of a major expansion that is adding an entire new emergency wing to the hospital. This project represents the biggest dollar economic investment in over ten years in the City and creation of substantial new jobs. This illustrates the difficulty in Uptown where many of the region’s largest institutions and employers cannot complete expansion projects without affecting existing housing stock in majority Black communities.
A major HUD Choice Neighborhoods Grant is being completed by The Community Builders (TCB) that has substantially renovated approximately 200 affordable units in eight buildings along the Reading Road Corridor, along with new construction of a mixed-use building at Avondale Towne Center that includes retail space and 50 affordable housing units. Cincinnati Children’s Hospital Medical Center, in conjunction with the Uptown Consortium and Avondale Development Corporation, is investing in housing renovation supports to existing low-income homeowners in the community.

110Fair Housing Assessment for Cincinnati and Hamilton CountyAugust 2019
As previously noted, the new FC Cincinnati Major League Soccer stadium is currently under construction in the West End along Central Parkway. This too represents a significant investment of public and private resources in the community and the potential for new jobs for residents of the West End. There has been some minor displacement of housing and small businesses but the land for the stadium was mostly occupied by the Taft High School football stadium, which is being relocated within the neighborhood.
Residents in the West End, supported by the Seven Hills Neighborhood Houses, and the Port are currently working to develop plans to mitigate the loss of affordable housing that may result in the increased market interest in the neighborhood. In addition to the FC Cincinnati stadium, pressure on property values is being exerted by high prices in the Over-the-Rhine neighborhood just to the east on Central Parkway. Residents in the West End report feeling under pressure by increasing market forces. According to Multiple Listing Service (MLS) of Greater Cincinnati, the median home sale price in the West End in 2018 was $238,500, based on 30 sales. In 2017, the median sale price in the West End was $192,500 (35 sales).
Some low-income homeowners in the West End report feeling harassed by new property owners around them filing complaints about property conditions that result in code violations that can cost thousands of dollars to address. The most vulnerable residents to displacement are likely low-income renters who rent from private market property owners who are under no obligation to keep rents affordable. The largest number of affordable units in the West End are site-based CMHA units in City West, Laurel Homes, and Stanley Rowe. CMHA has 969 units in the West End. The Stanley Rowe units (650 homes) are in need of significant renovation and are vulnerable to loss because of this. Residents at Stanley Rowe include Black seniors, many of whom have been there over 20 years.
Uptown has seen significant change over the past five years in the Corryville and CUF area around the University of Cincinnati. These neighborhoods have always been home to students, mostly in small multifamily buildings (fewer than 25 units) and one-, two-, and three-family buildings owned by small property owners who own fewer than twenty units. Most of these buildings are at least 50 years old and in fair condition. These neighborhoods have also been home to a very diverse group of homeowners and renters who are not necessarily students. There are view properties on the outer hillsides that are mostly homeowners. These neighborhoods are racially diverse with an Asian and Indian population as well. Many of these residents are students, but certainly not all of them.

111Fair Housing Assessment for Cincinnati and Hamilton CountyAugust 2019
Over the past five years there have been hundreds of new units in large multifamily buildings built by market rate developers. The units in these new buildings along Short Vine Street, Calhoun Street , McMillian Avenue, and Martin Luther King Drive are being marketed to undergraduate and graduate students and medical residents. UC has also added dorm rooms on campus in more modern buildings and renovated several older dorms. The new units on the market are renting for between $1,100 and $2,000 a month, as opposed to the older units that were available for between $700 and $900 a month depending on the condition of the building and the units. As students move into these newer units, they leave small one-, two-, and three-family homes that provide some affordable housing to low-income residents in these neighborhoods. In both Corryville and CUF, the poverty rate is increasing as new residents find housing. Between 2012 and 2017, the poverty rate in CUF went from 41% to 49%, and in Corryville from 46% to 53%.
land use and ZoningLand use and zoning are the foundation for the kind of housing found in a region and where it is built. The long patterns of segregation and discrimination are reinforced by zoning practices. A significant part of the County is zoned low to very low-density which means there are not housing types that support protected class households in much of the region.
DefinitionsofResidentialUsesandLow-DensityZoning.
Zoning and land use practices that can limit housing choices typically limit density and define different types of housing by who lives in them. The recommendations in the last Fair Housing Assessment from 2009 included provisions that the City of Cincinnati should consider removing the definitions of housing that identify people by age (seniors), religious status (convents and monasteries), disability (developmental disability dwellings and patient homes), and by family status (requiring family relationships among those in granny units). These provisions all still exist in the current code. Zoning in Hamilton County is partly regulated by the County and in some cases regulated by the individual jurisdiction. For much of the County, particularly the far east and west suburban townships, County zoning is in place. This Code has also served as a model for other codes in the County. It too has provision for housing based on the kinds of people who live there. The County’s code regulates housing based on age (nursing homes), religion (dormitories for religious orders and schools), developmental disabilities (family homes), and mental health (residential facility, halfway house, family home). There is a long definition that describes and defines different types of housing for people with handicaps and different levels of impairment.

112Fair Housing Assessment for Cincinnati and Hamilton CountyAugust 2019
Very low-density zoning is also the norm in much of the County. Most residential zones essentially prohibit multifamily uses by right. To site a multifamily building in most of the residentially zoned property in the county requires a special hearing and in some cases a Planned Unit Development process. This process ensures that neighbors have an opportunity to comment on changes at a public hearing. It also is likely, and happens often in this region, that neighbors mount a vigorous campaign to halt any such projects in their jurisdiction. If providing affordable housing and adequate housing for protected classes is a priority, regional elected and appointed officials need to take a more proactive role in these processes.
Low-density single family zoning also protects communities like Hyde Park and Mt. Lookout from multifamily projects. Such projects have been approved in these neighborhoods, over objections, but they are mostly luxury housing, not affordable or special needs housing.
planning and Comprehensive approaches to Community developmentThere have been considerable efforts in comprehensive community development in the region over the past ten years, particularly in some of the R/ECAP neighborhoods. The Local Initiative Support Corporation (LISC) of Greater Cincinnati and Northern Kentucky and a group of funders including the United Way of Greater Cincinnati, Sisters of Charity Ministry Foundation, the Greater Cincinnati Foundation, the City of Cincinnati, and several local banks have been supporting an initiative called Place Matters for over ten years. Place Matters has been providing funding, targeted lending, technical assistance, and operating support and community development corporation capacity building to group of eight neighborhoods, six of them in Cincinnati. Avondale and the West End are communities in R/ECAP areas. Price Hill is an integrated neighborhood and the location of one of the significant clusters of Mexican and Guatemalan households. Price Hill also is home to many Appalachian households, a protected class in Cincinnati. These and other Place Matters communities have participated in some kind of community planning effort that included resident participation during this time.
A considerable investment has been made in strengthening the Community Development Corporations that operate in many R/ECAP areas and other communities with protected class populations in the City of Cincinnati. The Port, as well as its subsidiary, the Homesteading and Urban Redevelopment Corporation (HURC), are also working to provide market rate housing investment for renovation in Cincinnati disinvested neighborhoods. The focus and investment in these local organizations and their capacity has been a critical part of the overall revitalization strategy.
113Fair Housing Assessment for Cincinnati and Hamilton CountyAugust 2019
Evaluation of Place Matters shows positive results, crime rate reductions, improved neighborhood business districts with more shops, improving property values for units constructed or renovated by local CDCs, increased investments by the City on projects the community requests, and some improvements in school readiness for children in these communities. The housing objectives in the early part of this initiative were to stabilize housing markets impacted by the foreclosure crisis and to improve housing conditions and attract investment. In neighborhoods in the program like Avondale, the West End, Walnut Hills, and Madisonville there are now concerns that housing values and investment are reducing the amount of affordable housing. Because these communities are home to many protected class households maintaining affordable housing is important. The objective of this work have shifted to housing affordability in recent years.
In addition to Place Matters, a HUD Choice Neighborhoods grant was used to rehabilitate affordable housing units in multi-family buildings in Avondale. The project also includes a new construction mixed-use building that will bring a grocery store to the community. A HUD Choice Neighborhoods planning grant was awarded to Cincinnati Metropolitan Housing Authority to conduct a planning study in North and South Fairmont and English Woods, completed in 2014.
These activities have been successful at identifying community leaders and providing capacity support to people who live in these neighborhoods so they can advocate for their own objectives.
plan implementationRecent trends indicate an emerging need to focus more resources in areas where protected class households live and will benefit.
The resurgence of housing markets in the basin and Uptown are in many ways the result of a successful revitalization strategy that was aimed at stabilizing housing markets and attracting private investment where it was severely lacking. Investments in neighborhoods like Over-the-Rhine, Walnut Hills and Avondale have created new infill construction and substantial renovation of deteriorated housing stock, proving those markets and bringing about prices

114Fair Housing Assessment for Cincinnati and Hamilton CountyAugust 2019
closer in line with housing in other neighborhoods of choice. In some cases, these markets are experiencing price stability, while in other cases home prices continue to rise rapidly in some neighborhoods. Efforts to facilitate more construction of market rate housing in areas experiencing unmet demand should hopefully continue to increase overall housing supply and may help to mitigate against out-of-control price increases. After all, the relative affordability of the Cincinnati metropolitan area is attributable in part to the slow population growth of the City, County, and region as a whole.
However, not everyone is able to equally enjoy the new investment in the urban core, or the relative affordability of the region as a whole. Creating affordability for those with a very limited ability to pay for housing is much more than an issue of balancing supply and demand. Decades of stagnant real wage growth at the same time as significant construction cost increases have made it harder and harder for the market to provide “naturally occurring” affordable housing that is decent, safe, and sanitary. As the cost of residential construction in the Cincinnati metropolitan area continues to consistently escalate faster than rents, many residents of the City and County face cost pressures that are ultimately related to developers’ inability to “make the math work” to profitably create affordable housing. Heightened income inequality greatly exacerbates how these economic pressures are felt by protected classes, especially in those transitional neighborhoods where the price increases are sometimes rapid.
In this climate, it is imperative that the City and County increase their efforts to create affordable housing opportunities through incentives and other creative interventions to try to make the math work better for developers and residents, while on a parallel path continuing to also facilitate sufficient market rate construction to keep pace with demand. Many of these interventions could be targeted in neighborhoods whose existing residents are feeling most threatened by increased housing prices.
Neighborhood and community plans have been developed in City neighborhoods and suburban communities. The tools to implement “non-market” based recommendations are often a challenge. This is reflected in feedback from housing professionals on the current Fair Housing Assessment survey for housing professionals.

115Fair Housing Assessment for Cincinnati and Hamilton CountyAugust 2019
lack of regional cooperationMany of the barriers to fair housing; lack of affordable housing, lack of new construction of housing for populations with special needs (seniors, handicapped households, people with mental health issues), and even lack of public transportation are seen as local issues that should be decided locally. There has been little regional discussion of these issues, and local communities guard their local decision-making authority. In the example of improving public transportation, the City and the County, the Chamber of Commerce, and most other regional entities see this as an important issue and a major problem to be solved. Even with this level of agreement on the issue, cooperation is challenging. A chief concern moving forward is a lack of agreement among stakeholders about what kind of levy to propose and how big a geography to include.
Regional collaboration has been a challenge on a number of key issues over the years. Land use and development patterns, economic development, job locations and major infrastructure planning have all been difficult. Local jurisdictions value their autonomy, which can make regional discussions difficult. There has been very little interest in government consolidation over the years, but there have been recent successes with shared service delivery in the County. Joint service agreements on police and fire service, waste collection, and, in some cases, other services have been successful. Fair share housing has been one of the most contentious issues and no real recent attempts at collaboration on this topic have been made. Likewise, consolidated school systems have not been considered.

116Fair Housing Assessment for Cincinnati and Hamilton CountyAugust 2019
Fair Housing goals and prioritiesReducing the barriers to fair housing in Cincinnati and Hamilton County is a complex challenge made much more difficult by the deficit of affordable housing in the region for low and moderate-income households. It is a problem faced by communities across the Country. To begin to have a meaningful impact on these issuing ways that expand the choices for protected classes of residents will mean addressing persistent poverty, and racism, and fundamentally changing the way the public sector funds public transportation and supports affordable housing. It will also mean that local jurisdictions throughout the region, including the City of Cincinnati, will need to modify zoning codes and land use regulations to be more accommodating to many more housing types than the typical single-family home. Private lenders will have to find ways to provide access to capital to low- and moderate-income households in ways that allow these families to build wealth in their housing in the same ways that middle-income white families did in the 1970’s, 80’s and 90’s, and do today.
In this region and in many parts of the Country these challenges and actions seem so increasingly insurmountable and devoid of support mustering the political and community will to tackle these issues is not a priority. Recommendations that work around the edges and support a limited number of households is not an effective way to make real change. There are a set of market and social trends, and the legacy of the decade old foreclosure crisis, the retreat of the federal government from housing, that have created a true crisis of opportunity for over one in three of the households in the County, and for households across the Country. These households are those in the protected classes and are the most vulnerable among us. To have a real impact on these issues fundamental change is needed. The recommendations that follow are an attempt to start in small and big ways. But small improvements are not enough. Big changes are necessary to reduce the barriers to fair housing in this region and provide all households with the opportunity to get ahead and thrive, and that is the crux of the Fair Housing Act of 1968.

117Fair Housing Assessment for Cincinnati and Hamilton CountyAugust 2019
summary of recommendationsGoal 1 Support the communities in the City and the County who are actively working to
integrate their communities and provide housing choices for the broadest group of residents.
Goal 2 Create City and County housing trust funds with the resources necessary to develop new affordable inventory, improve and preserve existing inventory, help low- and moderate-income property owners, and provide emergency eviction assistance.
Goal 3 The City and the County should be actively working to support METRO and enhance existing public transportation in the short-term, and create a regional system in the long term that provides access to the employment in the region. There are thousands of housing units in the region that might be affordable and provide real opportunity for residents that are never considered because there is no access to reasonable public transportation.
Goal 4 Enhance the regulatory framework that provides inspections, enforcement and accountability to ensure housing is safe and healthy for residents. A critical companion to this is the Trust Fund to support low- and moderate- income property owners (often those with affordable rental units) so they can make needed repairs and not be harassed or lose their property.
Goal 5 Encourage public and private investment in housing types that can supply housing to protected classes affordably. Small single-family, four-family and small multi-family units are all over the County in opportunity areas and could be a private market resource to households. Zoning that provides more opportunities for multi-family housing throughout the County would support these investments.
Goal 6 Land use regulations that require, single-family lot sizes larger than a quarter acre, that prohibit multi-family housing, that regulate housing classifications by type of occupant and definitions of a family are likely having a disparate impact on low-income, protected classes of residents. Jurisdictions with these provisions in their zoning codes should be encouraged to change these provisions.
Goal 7 Elected and appointed officials throughout Hamilton County should be weighing in on projects that support protected classes to support these projects in communities that actively block such projects.

118Fair Housing Assessment for Cincinnati and Hamilton CountyAugust 2019
Goal 8 Support agencies that have capacity in housing production to develop affordable housing, and agencies that provide supportive housing services to connect with housing providers and create networks between the two to make the most of limited resources to provide housing units and the services people need to be successful.
Goal 9 Create a comprehensive, integrated, networked intake, information, and referral system – that lives in real time - so people can get information on housing availability, access to resources, and a place to voice a complaint when things are not right, without waiting for hours, days or years (literally) to get what they need.
Goal 10 Adequately fund and support the organizations and agencies whose mission(s) are to promote and protect protected classes and provide affordable housing – and then hold them accountable. Likewise, expect more support from regional housing and community development partners around affordability and anti-discriminatory activities and hold them accountable for outcomes that are publicly agreed upon and financially supported.
Goal 11 Access to private capital is a critical part of making housing available to protected classes. As the banking industry has responded to the housing crisis of 2008, loans for home maintenance and improvements and first time homebuyers has become much harder to acquire. Banks need to be encouraged to create lending products that serve these clients and make them widely available. Other creative funding initiatives like appropriately administered land contracts, homesteading, and other tools need to be piloted by Community Development Corporations and deployed.
goals and milestones (see tables on following pages)

119Fair Housing Assessment for Cincinnati and Hamilton CountyAugust 2019
Goal 1 Contributing Factors Fair Housing Issues Metrics & Milestones# of new housing projects (of over 25 units) market or affordable; # of new economic development projectsProperty owner trainings
Goal 2 Contributing Factors Fair Housing Issues Metrics & Milestones
Goal 2 Contributing Factors Fair Housing Issues Metrics & MilestonesAffordable unit targets are set (at least 200 units per year); funds are allocated to the TrustFund to accomplish target
Goal 3 Contributing Factors Fair Housing Issues Metrics & MilestonesExpand SORTA transit access and fund system with adequate revenue source
Current system does not support expanded transit
Lack of public transit is a major barrier to integrated hosing in opportunity areas
Ballot initiative or other funding measures for new transit levy and long term efforts to develop a transit plan
Goal 4 Contributing Factors Fair Housing Issues Metrics & MilestonesProvide funding assistance to small jurisdictions for more professional property inspection operations
Lack of resources for code enforcement; more absentee owners
Poor property conditions for many protected class households
Establish fund; train professional property inspection staff; property conditions improve in small jurisdictions
Establish a fund; identify revenue streams; goal should be to identify approximately $10 million annually
City and County Housing Trust Funds
Discussion: Many of the small jurisdictions throughout the County do not have the resources to manage rigorous code enforcement operations and are dealing with more absentee owners. Property conditions in these communities threaten to further destabilize housing markets.
Discussion: Fund should support both City and County projects and be available to create programming, lending and housing support services.
Create a target number of new affordable housing units and special housing to be provided and fund appropriate agencies to
Market forces are strengthening and reducing the number of affordable units available
Lack of access to housing in opportunity areas
Discussion: Many of the small jurisdictions throughout the County do not have the resources to manage rigorous code enforcement operations and are dealing with more absentee owners. Property conditions in these communities threaten
Discussion: Lack of reliable public transportation is one of the most significant barriers to many protected class households in considering many parts of the region. It also makes getting to employment locations from the urban core and the integrated communities in the central and northern parts of the County difficult. Cross-town connections are especially difficult.
Support integrated communities (those places in the County where racial integration is taking place)
Communities experiencing growing poverty
Racial segregation a persistent issue in many opportunity areas for protected classes
Discussion: It will be critical to support those places in the City and the County that are already integrated in order to keep them stable and providing benefit to protected class households.
Greater need for resources for affordable housing
Lack of access to affordable housing
goals
and m
ilesto
nes

120Fair Housing Assessment for Cincinnati and Hamilton CountyAugust 2019
Goal 5 Contributing Factors Fair Housing Issues Metrics & Milestones
Goal 6 and 7 Contributing Factors Fair Housing Issues Metrics & MilestonesEncourage local jurisdictions to modify land use regulations that support very low density residential zones
Low density zones exist in segregated parts of the County; there is a lack of affordable housing in segregated parts of the City and the County
Provide regional support for appropriate affordable housing projects targeted to protected classes in parts of the County that do not currently have such units
Active opposition to new housing in much of the County
Goal 8 Contributing Factors Fair Housing Issues Metrics & MilestonesCreate better connections between housing providers and support service providers and provide education outreach to the system
Limited resources are being used to develop duplicative professional capacity
Protected class households are not finding housing or getting the support services they need
Housing providers partner with existing service agencies to support tenants
Goal 9 Contributing Factors Fair Housing Issues Metrics & MilestonesEnhance the information the Central Access Point helpline (CAP) at Strategies to end Homelessness
Clients of many agencies report not getting service through help lines; there are not enough affordable housing units for clients looking for help
Access to affordable housing for protected classes
Clients report finding accurate information in housing searches
Zoning code changes; new multi-family housing projects (of 25 units or more) in communities they did not exist before; Regional elected officials support housing projects in segregated communities for protected classes
Vacant units remain throughout the City and County; LISC and the ULI Housing team is providing technical assistance
Discussion: Social service agencies looking for housing for their clients, and housing providers whose residents need support need to create better connections and networks so that we are not duplicating capacity with limited resources.
Discussion: Accurate information on housing availability is not clear or easy to access. Clients have lots of sources for information, many inaccurate.
Develop resources to renovate single family and small multi-family buildings all over County, create incentives for private property owners and provide additional units
Open opportunity areas for protected classes; provide additional affordable housing
Banks identify lending products to work with private borrowers; City/County vacancy rate for single-family buildings goes to 15%
Discussion: Available single-two- and three-family housing exists all over the County and can be a good opportunity for protected class first time homebuyers, many in opportunity areas throughout the County.
Barriers to housing in segregated communities for protected classes
goals
and m
ilesto
nes

121Fair Housing Assessment for Cincinnati and Hamilton CountyAugust 2019
Goal 10 Contributing Factors Fair Housing Issues Metrics & Milestones
Goal 11 Contributing Factors Fair Housing Issues Metrics & MilestonesLack of access to housing in opportunity areasDiscriminatory lending practices
Discussion: Many protected class households could access housing in opportunity communities with access to capital.
Support HOME, Legal Aid Society, and other organizations that promote fair housing and protect clients
Create new private lending products that serve protected class households, lender education and outreach with specific institutions supported by the Homeownership Center
Recession has tightened private market lending making it harder for protected class households to access capital
Increase loans for purchase rehab of and new mortgages in City and County integrated communities by 20%
Protected classes are not accessing housing in segregated communities and are not being represented in eviction filings
Access to affordable housing for protected classes
Mobility program recreated; 10 % of tenants represented in eviction filings
Discussion: While this seems a very low bar we know that getting to these milestones will be difficult.
goals
and m
ilesto
nes

122Fair Housing Assessment for Cincinnati and Hamilton CountyAugust 2019
appendix a: additional supplemental inFormation

123Fair Housing Assessment for Cincinnati and Hamilton CountyAugust 2019
The State of Black Cincinnati (2016)
LIHTC awards in Ohio, 2006-2015: Where Are They Providing Housing for Families with children. Abt Associates for Legal Aid Society of Southwest Ohio
Housing Affordability in Hamilton County 2017 Community Building Institute for LISC
Racial Disparities in Homelessness June 2018 Strategies to End Homelessness
“You are Being Asked to Leave the Premise”: A Study of Eviction in Hamilton County 2014-2017 by Elaina Johns-Wolfe June 2018
All in Cincinnati: Equity is the Path to Inclusive Prosperity by Policy Link supported by United Way, Greater Cincinnati Foundation and Interact for Health
Overview of Ohio 2018-2019 URS Opportunity Index Oct. 2017 Kirwan Institute for the Study of Race and Ethnicity
2015-2019 City of Cincinnati Consolidated Plan
2015-2019 Hamilton County Consolidated Plan
News reporting
The Affordability Puzzle CityBeat Jan. 23, 2018 by Nick Swartsell

124Fair Housing Assessment for Cincinnati and Hamilton CountyAugust 2019
appendix b: list oF stakeHolder interviews

125Fair Housing Assessment for Cincinnati and Hamilton CountyAugust 2019
Stakeholder Interviews
Agency Interviewee(s) Conversation Date
Legal Aid
Stephanie Moes and John Schrider
9-18
Lydia’s House
Mary Ellen Mitchell
9-16-18
Talbert House
Neil Tilow and Jimmy Wilson
10-12-18
Community Action Agency
Mark Lawson
10-18-18
Seven Hills Neighborhood Houses
Alexis Kidd
10-22-18
Lighthouse Youth Services Bonita Campbell and Paul Haffner
10-24-18
Hamilton Co. Re-entry Program
Trina Jackson
10-29-18
Beacon of Hope Katie Schad
10-29-18
Caracole Linda Seiter
10-31-18
YWCA Debbie Brooks
10-31-18
Strategies Becky Dabbelt
11-6-18
Better Bus Coalition Cam Hardy
11-12-18
Su Casa
Ted Bergh and Giovanna Alverez
11-13-18
Village of Silverton
Tom Carroll
12-13-18
Refugee Connect Megan Iverson and Robyn Lamont
1-10-19

126Fair Housing Assessment for Cincinnati and Hamilton CountyAugust 2019
HOME
Jeniece Jones 2-6-19
Housing Mediation Services Dianne Harp
1-22-19
Deer Park B. J. Jetter
2-17-19
Protected Class Focus Groups
Protected Class Contact Conversation Date
Youth Light House Youth Services; youth 18-24 years old. Young people aging out of foster care.
December 4th 3:00pm to 5:00pm
Young moms Lydia’s House, young moms and children September 16th 6pm – 8pm
Residents with barriers to employment
Employees at Nehemiah Manufacturing, Beacon of Hope
February 1st 10:30am
Persons with disabilities Fair Housing Summit; service providers, people with disabilities, local government staff and officials.
1st focus group November 1st 3pm to 4pm 2nd focus group November 2nd 1pm to 2pm

127Fair Housing Assessment for Cincinnati and Hamilton CountyAugust 2019
Geographically Based Focus Groups
Geography Host Group Description Conversation Date
Colerain Township A Greater Northbrook
November 26th 6pm - 7pm
Anderson Township Economic Development Committee
November 27th 3:30pm – 4:15pm
West End Sister Link group December 5th 6pm – 7pm
Walnut Hills Walnut Hills Redevelopment Foundation and Walnut Hills residents
1st focus group January 7th 4:30pm to 5:30pm 2nd focus group February 11th 6pm
Woodlawn Woodlawn Council Members, CMHA representatives, and community members from Woodlawn and Lincoln Heights
February 6th, 2019 6pm
Silverton Silverton Village Manager hosted, residents from Silverton and Golf Manor
January 28th, 2019 6pm
Price Hill Santa Maria Community Services housing staff
February 11th, 2019 3pm

128Fair Housing Assessment for Cincinnati and Hamilton CountyAugust 2019
appendix C: Fair Housing assessment- residential survey results

129Fair Housing Assessment for Cincinnati and Hamilton CountyAugust 2019
Report
Fair Housing Assessment- Resident Survey
All responses; n= 494 total respondents Downloaded March 11th 2019
What community or neighborhood do you live in?
What community or neighborhood do you live in?
Crosby Twp
Westwood
OTR
OTR
OTR
Price Hill- east
Pinecrest
Walnut Hills
Walnut Hills
Walnut Hills
Norwood
Sayler Park
East Price Hill
Sayler Park
Sayler Park
Northside
Sayler park
Price Hill
Amelia
Northside
South Fairmount
Northside
Sayler Park/Fernbank
college Hill
Milford
Columbia-Tusculum
Green Township
Hyde Park
Oakley
Kennedy Heights
West End
45223
Northside
Over-the-Rhine
Otr
Walnut HIlls
Gaslight District
silverton
Northside
Clifton
Spring Grove Village
Downtown
Mt Washington
Sayler park
Mount Washington
Sayler Park
Sayler park
Sayler Park
Sayler Park
Sayler Park
Spring Grove Village
Norwood
Finneytown
Evanston
Winton Hills
Columbia Tusculum
North Avondale
College Hill
West Price Hill
Pleasant Ridge
Central Business District
college hill
Delhi
College Hill
Evanston
Walnut Hills

130Fair Housing Assessment for Cincinnati and Hamilton CountyAugust 2019
Madisonville
Howell ave
College Hill
West End
College Hill
Pendleton
Clifton
College hill
Clifton
Mt. Airy
Price Hill
Mt Auburn
Spring Grove Village
North Avondale
Carthage
Finneytown
Northside
College Hill
College Hill
College Hill
Northside
College Hill
Clifton
WestEnd
West End
College hill
College Hill
College Hill
Colerain Township
College Hill
Mt. Healthy
Over the Rhine
Lower Price Hill
Price Hill
Oakley
Incline District
Price Hill
Walnut Hills
Evanston
East price hill
Madisonville
the Contested Zone between Avondale and North Avondale South Fairmount price hill
East Price Hill
West Price Hill
West Price Hill
Northside
Price Hill
East Price Hill Incline District
Greenhills
EPH
college hill
Springfield TWP
College Hill
Ivoirian
Mt Airy
East Walnut Hills
Evanston
East Walnut Hills
Evanston
Madisonville
Over The Rhine
Evanston
Forest Park
Walnut Hills
Evanston
Evasnton
Anderson
Madisonville
Madisonville
esast price hill
Delhi
Camp Washington
avondale
Anderson Township
Oakley
College Hill
Maddisonville
Avondale
Mt. Healthy
hgjdytji
West End
Delhi
Clifton
Village of Lincoln Heights
Hyde Park
Spring Grove Village
Fairfield
Madeira
Sharonville
Montgomery Ohio
Sedamsville
Landhill South Estates

131Fair Housing Assessment for Cincinnati and Hamilton CountyAugust 2019
Newtown
Blue Ash
OTR
lockland
Clifton
Northside 45223
North College Hill
Greenhills
madeira
Madeira
College Hill
College hill
Spring Grove Village / WInton Place
Anderson Township
Clifton
Finneytown
Clifton
avondale
Northside
College Hill
Hartwell
West End
College Hill
Andersom
Northside
college hill
45206
N. Avondale
Clifton
Springfield Township
College Hill
clifton
College Hill
Northside
Hyde Park
Hyde Park
northside
Northside
Sycamore Township, Ohio
Spring Grove Village
Colerain Township
Northside
Clifton
Colerain Township
College Hill
Northside
College hill
South Fairmount
college hill
Westwood
clifton
Spring Grove Villiage
College hill
Westwood
Mt Washington
north avondale
northside
Spring Grove Village
Spring grove village
Over the Rhine
Mount Healthy
Walnut Hills
kennedy Heights
East Walnut Hills
College Hill
Clifton
Oakley
Northside
West Price Hill
Northside
Mt. Adams
Spring Grove Village
Walnut Hills
Mt Washington
kennedy heights
North Avondale
Anderson Township
North avondale
North Avondale
Silverton
Walnut Hills
Walnut Hills
Silverton
Silverton
Silverton
Silverton
St. Bernard
Mt lookout
Clifton
Bond Hill
College Hill
Northside
Evanston

132Fair Housing Assessment for Cincinnati and Hamilton CountyAugust 2019
North Fairmount
West End
Village of Indian Hill
West End
West End
Northside
College Hill
East Walnut Hills
Colerain Township
Pendelton
Downtown
Clifton
Maddisonville
Roselawn
WEST END
West End
Northside
West End
Northside
northside
Anderson Township
Northside
Hyde Park
Northside
Betts Longworth
West End
West End
westend
West End
Northside
Clifton
Northside
West End
Northside
Northside
Northside
Northside
Northside
West End
Covedale
Northside
northside
Northside
bond hill
Price Hills
Anderson Township, OH
Hamilton County, Anderson Township Walnut Hills
North Fairmount
Walnut Hills
Walnut Hills
East Walnut Hills
Norwood
Anderson Township
Anderson Township
Mount Washington
Pleasant Ridge
Westwood
Walnut hills
Westwood
Walnut Hills
Anderson Township
Anderson Township
Walnut Hills
Anderson
Clifton Gaslight
Anderson Townshio
Mt. Washington
East Walnut Hills
Walnut Hills
East walnut Hills
Anderson Township
Aspen village
Westwood
Clifton Gaslight
Anderson Township
Clifton
Walnut hills
Walnut hills
Anderson Township
Walnut Hills
Walnut hills
Walnut Hills
Evanston
Walnut Hills
Anderson twp
Anderson
Walnut hills
Northside
Anderson Township
Anderson Township
Anderson
Madisonville

133Fair Housing Assessment for Cincinnati and Hamilton CountyAugust 2019
East Walnut Hills
Walnut hills
Spring Grove Village
Madisonville
Colerain
West Price Hill
Northside
Madisonville
Madisonville
Madisonville
Madisonville
Madisonville
Madisonville
Madisonville
CUF
Price Hill
Westwood
Woodlawn
Amberley
Green Township / White Oak
Madisonville
Bond Hill
mt washington
Madisonville
Madisonville
Bond Hill
Mt. Washington
Colerain Townships
Loveland, OH Hamilton County
Northside
Walnut Hills
Westwood
Price Hill
North College Hill
Avondale
Walnut Hills 45206
Westwood
Hamilton County
mt. airy
Dent
East price hill
Price Hill
West Price Hill
Northside
Westwood
Pendleton - OTR
Evanston
Price Hill
Price hill / fairmount
Bridgetown
Price Hill
Evanston
College Hill
White Oak / Cheviot
FInneytown
Northside
Northside
West End
Downtown
Downtown
College Hill
Wyoming
Over-The-Rhine
Colerain Township
Anderson
NORTHSIDE
Mt. Healthy
East Price Hill
Walnut Hills
east price hill
Anderson TWP
Hyde Park
East Price Hill
Lower Price Hill
North Avondale
Avondale
Oakley
Delhi
Northside
Green township/Bridgetown
Hartwell vine
Finneytown
West End
Westwood
Clifton
Downtown
Evanston
North Avondale
Mt. Airy
Clifton
Woodlawn
Reading, OH
Avondale

134Fair Housing Assessment for Cincinnati and Hamilton CountyAugust 2019
Westwood
West Price Hill
OTR
Westwood
Madisonville

135Fair Housing Assessment for Cincinnati and Hamilton CountyAugust 2019
What is the status of your current housing?
# Answer % Count
1 Own 71.09% 332
2 Rent 25.70% 120
3 Live with family or friends 3.00% 14
4 Other 0.21% 1
Total 100% 467
Other - Text
Live in a home owned by out-of-town family

136Fair Housing Assessment for Cincinnati and Hamilton CountyAugust 2019
Who do you rent from?
# Answer % Count
3 Private Property Owner 80.87% 93
2 HUD Project Based Section 8 Property Owner 6.09% 7
1 Cincinnati Metropolitan Housing Authority (CMHA) 3.48% 4
4 Other 9.57% 11
Total 100% 115
# Answer % Count
Corporation Corporation 16.67% 1
ERH ERH 33.33% 2
ERS ERS 16.67% 1
OTR OTR 16.67% 1
Uptown Rentals Uptown Rentals 16.67% 1
Total 100% 6

137Fair Housing Assessment for Cincinnati and Hamilton CountyAugust 2019
Do you use a Housing Choice Voucher?
# Answer % Count
1 Yes 5.83% 7
2 No 94.17% 113
Total 100% 120

138Fair Housing Assessment for Cincinnati and Hamilton CountyAugust 2019
What type of housing do you live in?
# Answer % Count
1 Single family home or duplex 76.31% 335
2 Condominium 4.56% 20
3 3-4 unit apartment building 5.69% 25
4 Small multi-family apartment complex (5 to 20 units) 5.47% 24
5 Large multi-family apartment complex (over 20 units) 6.83% 30
6 Shelter 0.00% 0
7 Mobile home 0.00% 0

139Fair Housing Assessment for Cincinnati and Hamilton CountyAugust 2019
8 Other 1.14% 5
Total 100% 439
Other - Text
1 bedroom unit
Townhouse
No HOA Townhouse
House with 4 unit apartments

140Fair Housing Assessment for Cincinnati and Hamilton CountyAugust 2019
How did you find your current housing?
# Answer % Count
1 Word of mouth 19.73% 87
2 Sign in yard 10.20% 45
3 Referral 1.81% 8
4 Real Estate Agent 33.79% 149
5 Property Management company 2.49% 11
6 Cincinnati Metropolitan Housing Authority (CMHA) 0.68% 3
7 Online: Craig's List or other website 14.74% 65

141Fair Housing Assessment for Cincinnati and Hamilton CountyAugust 2019
8 Other 16.55% 73
Total 100% 441
# Answer % Count
Approached owner because house wad to be demolished
Approached owner because house wad to be demolished 1.72% 1
Born in it Born in it 1.72% 1
Bought it off a friend. Bought it off a friend. 1.72% 1
Brother Brother 1.72% 1
Built a house on family property Built a house on family property 1.72% 1
Cincinnati Habitat for Humanity Cincinnati Habitat for Humanity 1.72% 1
Citirama Tour Citirama Tour 3.45% 2
Cousin Cousin 1.72% 1
Craigslist Craigslist 1.72% 1
DRIVE BY DRIVE BY 1.72% 1
Facebook/newspaper Facebook/newspaper 1.72% 1
Family Family 8.62% 5
Family sold it to me Family sold it to me 1.72% 1
Former Landlord's brother Former Landlord's brother 1.72% 1
Found lot and built. Found lot and built. 1.72% 1
From RF read a newspaper article about the project
From RF read a newspaper article about the project 1.72% 1
Grandparents house Grandparents house 1.72% 1
Habitat Habitat 1.72% 1
Habitat for Humanity Habitat for Humanity 1.72% 1
housing lottery housing lottery 1.72% 1
hUD hUD 1.72% 1
I own it I own it 1.72% 1
Inherent from parents Inherent from parents 1.72% 1
Inherited Inherited 3.45% 2

142Fair Housing Assessment for Cincinnati and Hamilton CountyAugust 2019
live long home live long home 1.72% 1
live with a family member live with a family member 1.72% 1
Living with a friend. I don't know how they found it
Living with a friend. I don't know how they found it 1.72% 1
MLS MLS 3.45% 2
moved in with my fiance (now husband) who is an advocate of the neighborhood
moved in with my fiance (now husband) who is an advocate of the neighborhood 1.72% 1
My dad My dad 1.72% 1
Newspaper Newspaper 1.72% 1
Newspaper story Newspaper story 1.72% 1
Online via MLS listing Online via MLS listing 1.72% 1
parents parents 1.72% 1
Parents house Parents house 1.72% 1
Passed down from another family Passed down from another family 1.72% 1
Purchased from relative Purchased from relative 1.72% 1
Real estate website Real estate website 1.72% 1
Relative suggested Relative suggested 1.72% 1
Saw development occuring Saw development occuring 1.72% 1
Saw it, contacted owner Saw it, contacted owner 1.72% 1
sibcy cline sibcy cline 1.72% 1
Sibcy Cline website Sibcy Cline website 1.72% 1
the old MLS website the old MLS website 1.72% 1
walk walk 1.72% 1
Walking the neighborhood. Walking the neighborhood. 1.72% 1
was already looking for a house & new the shortcut to get to w. wood
was already looking for a house & new the shortcut to get to w. wood 1.72% 1
we did marketing for community we did marketing for community 1.72% 1
Worked for Over-the-Rhine Community Housing who owns it.
Worked for Over-the-Rhine Community Housing who owns it. 1.72% 1
Wrote a letter to the owner and asked to buy the house.
Wrote a letter to the owner and asked to buy the house. 1.72% 1
Zillow Zillow 1.72% 1
Total 100% 58

143Fair Housing Assessment for Cincinnati and Hamilton CountyAugust 2019
How long have you lived in your current housing unit?
# Answer % Count
1 1 year or less 15.80% 70
2 2-5 years 30.93% 137
3 6-10 years 11.06% 49
4 Over 10 years 42.21% 187
Total 100% 443

144Fair Housing Assessment for Cincinnati and Hamilton CountyAugust 2019
How much of your monthly income do you spend on housing? (Including rent and essential utilities like electricity, water, waste and gas.)
# Answer % Count
1 Less than 30% of my monthly income 55.06% 245
2 Between 30% and 50% of my monthly income 34.83% 155
3 Between 51% and 70% of my monthly income 7.64% 34
6 More than 70% of my monthly income 2.47% 11
Total 100% 445

145Fair Housing Assessment for Cincinnati and Hamilton CountyAugust 2019
How satisfied are you with your current housing?
# Answer % Count
1 Very satisfied 52.98% 240
2 Somewhat satisfied 32.67% 148
3 Neither satisfied nor dissatisfied 3.97% 18
4 Somewhat dissatisfied 5.08% 23
5 Very dissatisfied 5.30% 24
Total 100% 453

146Fair Housing Assessment for Cincinnati and Hamilton CountyAugust 2019
Which of the following were the most important reasons you picked the house that you live in? (Please select all that apply.)
# Answer % Count
1 To be near family and friends 12.08% 159
2 To be near work/job opportunities 15.65% 206
3 To be near good schools 5.85% 77
4 To be near stores, goods, and services I need 13.15% 173
5 To have good access to public transportaion 7.07% 93
6 The neighborhood is safe 11.47% 151

147Fair Housing Assessment for Cincinnati and Hamilton CountyAugust 2019
7 It's what I can afford 14.89% 196
8 Utilities are included and/or reasonable 2.58% 34
9 Pet friendly 5.02% 66
10 I grew up here 3.65% 48
11 I really did not have a choice 1.29% 17
12 Other 7.29% 96
Total 100% 1316
Other
Other - Text
Could live on one floor
6th floor condo on hillside, LOTS of sun!
a lot of house for my money
Aesthetics
Affordable downtown area; feeling neighborhood to be revitalized soon; historic features
Architecture
Bought in 1992. Now retired and my reasons are more inclusive. Access to restaurants and entertainment, downtown, being among the highest. Renovations since purchase have made this my own.
Church options
Close to a community garden
Community
Cool neighborhood!
Decent yardfor pets, wildlife and activities
Development of area. Investment. Growth.
Diversity
Diversity
Easy access to highway
Foreclosed
Good qualityolder housing stock and large parcels

148Fair Housing Assessment for Cincinnati and Hamilton CountyAugust 2019
Great house at a great price.
handicap accessable
historic architecture
Historic Building
House was designed by a famous architect
housing lottery
I can work at home easily.
I consider myself part of this neighborhood.
I had to live in the City of Cincinnati for my job.
I liked the neighborhood
I liked the neighborhood
I love my Victorian!
I love this neighborhood
I loved the architecture of the house.
I was looking for an area that I could supply affordable housing to that had a high potential to gentrify
I've loved this house for years and was hoping it would come up for sale
Ibasicslly chose this place in spite of the bad public schools because I had already secured a seat for my daughter in a magnet school. Would not have moved here if didn't have a good school option. The house isn't perfect but it's the nicest I've lived in. And I can afford it without being totally house poor.
Initially investment property, but cost more than exspected for historical renovation
intergated
It was the correct size and a good price for the 6 of us that bought it, 35 years ago
It's quiet
Knew previous renter, referral
landlord okay with chickens/coop in backyard
Liberal, tolerant and diverse
Like the neighborhood
Like the neighborhood
Love of the neighborhood
Loved the house and the surrounding areas
Loved the house.

149Fair Housing Assessment for Cincinnati and Hamilton CountyAugust 2019
Maddisonville seems like an up and coming neighborhood
moved here to be a part of neighborhood and new church
Moving to an urban neighborhood
My family and I value and stay in the neighborhood for its economic & racial diversity.
My husband worked for the city, & College Hill gave us more bang for our buck.
near church
Neighborhood diversity and walk ability
nice house / yard
Nice Place
Outside maintenance included
Park like feeling with trees and birds
PERSONAL PREFERENCE
Poor rental history, was homeless at the time.
Proximity to downtown, diversity, urban, green
Quality Community!
reasonable cost + love the space
Redeveloping area close to Downtown
Secluded street with no through traffic
Style size and footprint of home convenient location
The diversity of the neighborhood
The neighborhood is no longer safe and viable
The proximity to downtown. The sense of community. The history.
The size of the house for my family and peaceful street
Thought they were more senior friendly
To be a part of the un-gentrified neighborhood (the people who were here)
To be close to Downtown. BTW, this question is confusing. You asked about the most (singular) then say select all that apply.
to be near parks
to be near the multiple area parks and proximity to the major highway system
To be near the vibrant down town arts scene
To buy house with my parents so the could avoid nursing home.

150Fair Housing Assessment for Cincinnati and Hamilton CountyAugust 2019
to live in an area with a progressive mindset
to live in an integrated neighborhood
View and proximity to city
walkability to business district (used to have post office & grocery store at time of purchase decision)
walkable and near freeways and parks
Walkable Neigborhood
Walkable neighborhood
Walkavle to church, park, and library
wawsher and dryer hook-up
Yard size and at the time senior housing near by

151Fair Housing Assessment for Cincinnati and Hamilton CountyAugust 2019
Rate the following characteristics of your current neighborhood on a scale of 1 to 5, with 5 being the best.
# Question Terrible (1) Poor
(2) Average (3) Good
(4) Excellent (5) Total
1 Access to affordable housing 5.80% 24 17.87% 74 37.20% 154 26.57% 110 12.56% 52 414
2 Access to public transportation 3.34% 14 8.59% 36 22.20% 93 39.62% 166 26.25% 110 419
3 Access to good schools 8.76% 36 16.79% 69 32.60% 134 25.30% 104 16.55% 68 411
4 Access to good employment 5.05% 21 8.89% 37 28.13% 117 31.49% 131 26.44% 110 416

152Fair Housing Assessment for Cincinnati and Hamilton CountyAugust 2019
opportunities in under one hour by
bus
5 Access to grocery store/ pharmacy 7.38% 31 17.14% 72 22.38% 94 24.05% 101 29.05% 122 420
6
Access to community center, libraries, parks, and other community uses
1.66% 7 5.23% 22 16.15% 68 35.63% 150 41.33% 174 421
7 Safety 7.64% 32 15.27% 64 31.50% 132 29.12% 122 16.47% 69 419
8 Condition of housing 3.58% 15 12.89% 54 35.32% 148 35.32% 148 12.89% 54 419
9 Condition of the business district 12.41% 52 19.81% 83 33.17% 139 24.58% 103 10.02% 42 419

153Fair Housing Assessment for Cincinnati and Hamilton CountyAugust 2019
Select any housing challenges you are experiencing. (Please select all that apply.)
# Answer % Count
1 Condition of my unit is poor (i.e. general upkeep such as paint and lighting, and amenities like plumbing and kitchen) 9.48% 47
2 Property owner is not responsive 4.64% 23
3 I don't feel safe in my housing 7.06% 35
4 Sex/Sexual harassment 0.81% 4
5 My unit is unhealthy (mold, insect problems, lead paint) 4.44% 22
6 I am having problems with my neighbors 12.30% 61

154Fair Housing Assessment for Cincinnati and Hamilton CountyAugust 2019
7 No good public transportation in the area 5.44% 27
8 Unit is not handicapped accessible 7.06% 35
9 My unit is not big enough for my household 3.83% 19
10 My unit is not pet friendly 1.41% 7
11 Unit does not accommodate a need I have because of a disability 1.41% 7
12 Cost of housing is going up 18.95% 94
13 I cannot always pay the utility bills- power and/or water shut off at least once in the last year 3.02% 15
14 I am in danger of eviction or foreclosure 1.81% 9
15 Other 18.35% 91
Total 100% 496
Other
Other - Text
CMHA failure tenants teasing or interfering with a service animal, eleator have not done annual safety test. Last one was in 2011.
none
None are applicable to my circumstances
None
Deteriorating condition
My neighbors in other properties have been displaced from their homes due to buy-outs and increased rents. New neighbors and tourists seem to think they are the answer to problems they perceive the neighborhood had or has.
Speed and unsafe drivers
None
Old houses can be challenging!
I need money for repairs.
I need home maintenance and don't already have accompany identified for roofing, plumbing, masonry and electrical repairs
None
Lead pipes
Sales of land bank properties to out of town owners who can't be tracked has lowered property values on the street.

155Fair Housing Assessment for Cincinnati and Hamilton CountyAugust 2019
None
NA
Need assistance with some repairs and maintenance at this time
taxes
Moving all the public housing into my area who do not maintain the property, do not respect other property owners, disrespect values and people, my property value has decreased by more than half. Staying aware of single floor opportunities in my neighborhood. I like the neighborhood, but feel I may not be able to do stairs for rest of my life.
changing home owners and group home housing
Not Applicable
N A
I have a neighbor whose dog barks constantly
None
Property taxes are sky rocketing
good
People use my yard as a turnaround
Cost of gas/electric is high, no sidewalks
excessive property tax
Need a ranch style in a few years.
crime, poor behavior from others
road conditions/pot holes & loud, inconsiderate, messy rehabbers flipping houses on my street
Not my idea of affordable; don't look out for seniors best interest when offering unaffordable living, they have your income, they should know better, this is supposed to be their mission
sometimes air quality bad because of BASF and St Bernard Soap Company emissions
I live in a one bedroom apartment and my Duke bill for using my gas stove is anywhere from $90-$130 a month...it’s ridiculous especially since heat and water are supposed to be free.
none
Getting older, finding the next house or apt in Northside is a price challenge
none of the above
Surrounding neighborhood is going down hill
Speeding on side streets causes my neighborhood to be unsafe for walking
I pay 47% of my net income for housing. I own my home so No mortgage payment. I turn 65 this year and my Real Estate taxes pose a large threat to me being able to stay in my home.

156Fair Housing Assessment for Cincinnati and Hamilton CountyAugust 2019
I have no challenges because I purchased a home and property that I can afford and keep in great condition. Homeowners should have assets to cover costs of mortgage, improvements and renovations, keep the lawn and garden clean and beautiful. Don't buy if you can't pay for it.
Property tax increases
Traffic is too fast and one way streets are dumb
None
None
None
None
Concentrated poverty, disproportionate number of deed-restricted low-income housing.
Neibors don't keep their homes up.
surrounded by blight. crime & low income housing that feeds the blight and everything else bad about this community No problems for me. But my son with a disability will have many problems living in the community in affordable housing.
None at this time
THESE AREN'T EVEN APPLICABLE FOR HOMEOWNERS
None, thankfully.
None of these apply to me.
Management isn't prompt on repairing/fixing things that have issues in mu apartment
none
Drug activity surrounding property
I cannot afford my own housing and have had to move in with a friend
n/a
Safety of neighborhood
Drainage issues
safety, access to good commercial convening spaces, and schools are bad. Also, community council leadership is awful and is does not represent the neihgborhood as a whole.
None of the above
Safe and walkable community no longer exists
None
N/A
Poor schools
Property taxes are outrageously expensive.

157Fair Housing Assessment for Cincinnati and Hamilton CountyAugust 2019
no elevator, poor parking options
GCWW is screwing customers. It’s wrong.
No problems, that's why you buy where you want to live, never have to worry about landlords
I was allergic to the carpet so I ripped it out, but underneath it was lead paint which I can't afford to fix.
my income is too much to live in low-income housing, but noy enough to pay market rent
None of the above
I am unchallenged, not true for several in neighborhood
significant violence, crime and gunfire in immediate area
I pay very little for rent, so I am in charge of repairs needed for my apartment. The repairs could become pretty expensive.
Landlord has recently [laced guard rail and temporary steps since I broke my hip.s

158Fair Housing Assessment for Cincinnati and Hamilton CountyAugust 2019
If lack of access to good public transportation is an issue, what specific challenges does it create for you? (Please select all that apply.)
# Answer % Count
1 Its hard to get to work 20.00% 10
2 Its have to get my children to school/ daycare 10.00% 5
3 Its hard to get the things I need 20.00% 10
4 Its hard to get to other places I need to go 24.00% 12
5 Other 26.00% 13
Total 100% 50
Other - Text
Access to the suburbs
I have to use a car to go places instead of less expensive public transportation.
I have to drive to work. No other choices.

159Fair Housing Assessment for Cincinnati and Hamilton CountyAugust 2019
I would like to use public transportation but it is not convenient. It takes too long to get where I would like to use it to get to. For me public transportation is a luxury/choice issue, but I support it and would like to use it for social and ecological reasons
Inconvenient bus routes
It's hard to doctors appointments
It would be more convenient for daily responsibilities
No rail system in Cincinnati
I drop kid off at school by I74, so I have to drive. not going to drive back to House or express pickup and take an hour to get downtown, then walk 3 blocks.
I have to drive to get to church, grocery, library, drug store, etc.
Has anyone in your household experiences homelessness in the past three years?
# Field Minimum Maximum Mean Std Deviation Variance Count
1 Has anyone in your household experiences homelessness in the past three years? 1.00 2.00 1.95 0.22 0.05 428
# Answer % Count
1 Yes 4.91% 21
2 No 95.09% 407
Total 100% 428

160Fair Housing Assessment for Cincinnati and Hamilton CountyAugust 2019
Have you been evicted in the past three years?
# Answer % Count
1 Yes 1.93% 8
2 No 98.07% 406
Total 100% 414

161Fair Housing Assessment for Cincinnati and Hamilton CountyAugust 2019
Do you agree or disagree with this statement: People can depend on each other in my community.
# Answer % Count
1 Agree strongly 18.81% 79
2 Agree somewhat 52.62% 221
3 Disagree somewhat 13.10% 55
4 Disagree strongly 8.33% 35
5 Don't know/no answer 7.14% 30
Total 100% 420

162Fair Housing Assessment for Cincinnati and Hamilton CountyAugust 2019
All things considered, over the past 12 months would you say your neighborhood is...
# Answer % Count
1 Getting better 44.15% 185
2 Staying the same 37.95% 159
3 Getting worse 12.17% 51
4 Don't know/no answer 5.73% 24
Total 100% 419

163Fair Housing Assessment for Cincinnati and Hamilton CountyAugust 2019
Right now, are you likely to recommend your neighborhood to someone else as a good place to live?
# Answer % Count
1 Definitely would recommend 48.57% 204
2 Probably would recommend 36.19% 152
3 Probably would not recommend 9.52% 40
4 Definitely would not recommend 5.71% 24
Total 100% 420

164Fair Housing Assessment for Cincinnati and Hamilton CountyAugust 2019
How often, if ever, have you felt uncomfortable or discriminated against in your neighborhood?
# Answer % Count
1 Always 2.13% 9
2 Most of the time 2.84% 12
3 Sometimes 19.67% 83
4 Seldom 36.97% 156
5 Never 38.39% 162
Total 100% 422

165Fair Housing Assessment for Cincinnati and Hamilton CountyAugust 2019
If you have felt uncomfortable or discriminated against, do you think any of the following were the reason? (Please select all that apply.)
# Answer % Count
1 Race/ethnicity 22.01% 81
2 Color 12.50% 46
4 National origin 1.90% 7
17 Appalachian origin 1.36% 5

166Fair Housing Assessment for Cincinnati and Hamilton CountyAugust 2019
15 Undocumented status 0.54% 2
11 Limited English 0.54% 2
5 Religion 2.45% 9
3 Sex 10.60% 39
7 Gender identity 1.63% 6
6 Sexual orientation 2.45% 9
9 Your age 11.14% 41
10 Your disability 2.45% 9
12 Family status (You have children under age 18 living in the household or you are pregnant) 2.99% 11
13 Marital status 4.08% 15
8 Your Children 1.90% 7
14 Military status 0.82% 3
18 Source of income 6.79% 25
19 Something else 13.86% 51
Total 100% 368
Something else % Count
a few car breakins and fewer home breakins 2.63% 1
being low-income 2.63% 1
Black youth cursing, ignoring traffic, pounding on cars 2.63% 1
Classism is alive and well in this area 2.63% 1
Crime and proximity to areas outside Silverton that have higher crime rates, drug traffic, gang activity, etc. 2.63% 1
Criminal element. 2.63% 1
Dating someone of an alternate race 2.63% 1
Drug activities 2.63% 1
Drug addicts steal to support their habit. 2.63% 1
Drug dealers “defending their turf”. Tension between original community members and newcomers 2.63% 1
General feeling of being uncomfortable in an unsafe environment 2.63% 1

167Fair Housing Assessment for Cincinnati and Hamilton CountyAugust 2019
I have felt uncomfortable with what I perceive as others drug use and/or sales. I watch and report what I feel is logical or I can verify. 2.63% 1
I live next door to a drug dealer :-( Police are not very good at monitoring or handling the activity going on. They are not very helpful at all. I've had to defend myself as a result. 2.63% 1
I was mugged 2.63% 1
Income level 5.26% 2
My politics 2.63% 1
N/A 2.63% 1
Neighborhood break ins 2.63% 1 Neighborhood I live in predominantly settled by African Americans and it is an on going concern about discrimination for financial assistance or general housing help 2.63% 1
Net Income 2.63% 1
occasionally feel unsafe late at night 2.63% 1 One living with me now because as a registered Sex offender from many years ago no one wants to rent to him. 2.63% 1
people of color on my street do not speak to me, they stare, and ignore me. I'm caucasian 2.63% 1
People pan handling, asking for money via a scam story and coming into the yard to do so 2.63% 1
political beliefs 2.63% 1
Political views 2.63% 1
Politics 2.63% 1
rising taxes 2.63% 1
Section 8 residents are allowed free rein to remake the street as a ghetto area. Landlords do not enforce the rules or monitor for drug activity, littering or anything else. 2.63% 1
Some people have seen me as one to "prey" upon. 2.63% 1
The way I was dressed. 2.63% 1
Too many drug addicts and street gangs in one area. 2.63% 1
too many people are indifferent to the rights of people who pay their own way 2.63% 1
too many people want to keep our community poor. Not sure what you mean by affordable housing, but we have subsidized housing and half-million dollar homes. 2.63% 1
Uncomfortable in fake, touristy, gentrified, exclusive part of neighborhood. 2.63% 1
Usual cat calling nonsense. 2.63% 1
you didn't aske: I'm WHITE & feel ABSOLUTELY discriminated against by the black community in the Westend 2.63% 1
100% 38

168Fair Housing Assessment for Cincinnati and Hamilton CountyAugust 2019
If you have felt discriminated against because of your age, which of the following was the reason
# Answer % Count
3 Something else 2.5% 1
1 Too old 57.5% 23
2 Too young 40.0% 16
Total 100% 40
Something else - Text
Socially people/organizations don't consider the elderly and think all are those that can be over looked.

169Fair Housing Assessment for Cincinnati and Hamilton CountyAugust 2019
Have you moved or tried to move in the last two years?
# Answer % Count
1 Yes 24.40% 102
2 No 75.60% 316
Total 100% 418

170Fair Housing Assessment for Cincinnati and Hamilton CountyAugust 2019
Did any of the following issues limit your housing options? (Please select all that apply.)
# Answer % Count
1 Eviction history 3.18% 5
2 There isn't much I can afford 28.03% 44
3 Units that did not accommodate my disability 1.27% 2
4 Could not find housing large enough for my household 8.28% 13
5 My credit history or credit score 13.38% 21

171Fair Housing Assessment for Cincinnati and Hamilton CountyAugust 2019
6 Property owner would not accept a housing choice voucher 2.55% 4
7 I have outstanding utility bills or other liabilities 4.46% 7
8 I or someone in my household have a criminal record 1.91% 3
9 Lack of pet friendly options 10.19% 16
10 Not being shown housing in the neighborhood I want to live in 3.82% 6
11 Not feeling welcome in the neighborhood I wanted to live in 4.46% 7
12 I don't know how to find housing options 5.10% 8
13 Property owners will not accept my income level for units I feel I can afford 6.37% 10
14 Units listed as available were actually not available 7.01% 11
Total 100% 157

172Fair Housing Assessment for Cincinnati and Hamilton CountyAugust 2019
Do you feel you have been treated differently than other people looking for housing?
# Answer % Count
1 Yes 11.06% 46
2 No 88.94% 370
Total 100% 416

173Fair Housing Assessment for Cincinnati and Hamilton CountyAugust 2019
If yes, do you think any of the following were the reason? (Please select all that apply.)
# Answer % Count
1 Race/ ethnicity 18.90% 24
2 Color 14.96% 19
4 National Origin 3.15% 4
15 Appalachian origin 0.00% 0
18 Undocumented status 0.00% 0

174Fair Housing Assessment for Cincinnati and Hamilton CountyAugust 2019
11 Limited English 0.79% 1
5 Religion 1.57% 2
3 Sex 4.72% 6
7 Gender Identity 2.36% 3
6 Sexual orientation 2.36% 3
9 Your age 14.17% 18
10 Your disability 4.72% 6
12 Family status (You have children under age 18 living in the household or you are pregnant) 3.15% 4
13 Marital status 3.15% 4
8 Your Children 3.94% 5
14 Military status 0.79% 1
16 Source of income 13.39% 17
17 Something else 7.87% 10
Total 100% 127
Something else
Something else - Text
Service animal (ESA)
Property owners get nothing to help them stay in their homes while landlords get wealthy off tax payers from subsidized housing
taxes
His being a registered sex offender
discrimination against self-sustaining people
Living on my own
I believe I've probably had an EASIER time looking for housing
Because we want more single-family, owner occupant housing units
From speaking with community members I get the impression the process was much easier for me
I am more privledged in treatment

175Fair Housing Assessment for Cincinnati and Hamilton CountyAugust 2019
If you feel that you have been treated differently because of your age, which of the following was the reason?
# Answer % Count
1 Too old 47.06% 8
2 Too young 29.41% 5
3 Something else 23.53% 4
Total 100% 17
Something else - Text
Put in same category as other elders instead of judged individually.
Student age is preferred. I am treated better than the average person.
responsible elder who is trusted

176Fair Housing Assessment for Cincinnati and Hamilton CountyAugust 2019
Have you applied for a loan to make home improvements or get a mortgage in the last three years?
# Answer % Count
1 Yes, and I was approved 25.93% 105
2 Yes, and I was denied 4.69% 19
3 No 69.38% 281
Total 100% 405

177Fair Housing Assessment for Cincinnati and Hamilton CountyAugust 2019
If your application was denied what reason were you given?
# Answer % Count
1 My income level 27.27% 9
2 The amount of money I had for a down payment 9.09% 3
3 How much I have in savings 9.09% 3
4 My credit history or score 21.21% 7
5 Something else 33.33% 11
Total 100% 33
Something else - Text
Bank supposedly to support the neighborhood never responded to the application
I needed to get equity out to make major repairs, but the appraisal was too low to borrow money to make repairs to make the house appraise at a higher rate. So... the house will eventually fall apart around me. Yay, circular logic?
Current value of home
type of income (self employed)
Lack of equity. Home not appraised adequately.

178Fair Housing Assessment for Cincinnati and Hamilton CountyAugust 2019
I wanted more than the comps based on appraisals.
The loan officer was unresponsive
Debt ration and cut
What is your gender?
# Answer % Count
1 Male 29.81% 124
2 Female 66.59% 277
3 Non-binary/ third gender 0.72% 3
4 Prefer not to answer 2.88% 12
Total 100% 416

179Fair Housing Assessment for Cincinnati and Hamilton CountyAugust 2019
What is your household structure?
# Answer % Count
1 Living alone 26.08% 109
2 Married or unmarried couple 44.02% 184
3 Group of unrelated adults 2.15% 9
4 Married or unmarried couple with children under 18 13.88% 58
5 Female headed household with children under 18 4.07% 17
6 Other family household with children under 18 0.96% 4
7 Family household with adult children 5.74% 24
8 Other 3.11% 13
Total 100% 418

180Fair Housing Assessment for Cincinnati and Hamilton CountyAugust 2019
Are you a member of a Spanish, Hispanic or Latino group?
# Answer % Count
1 Yes 2.26% 9
2 No 97.74% 389
Total 100% 398

181Fair Housing Assessment for Cincinnati and Hamilton CountyAugust 2019
What is your race? (Please select all that apply.)
# Answer % Count
1 Black or African American 22.41% 93
2 American Indian or Alaskan Native 0.48% 2
3 Native Hawaiian or Pacific Islander 0.48% 2
4 Asian 0.48% 2
5 White or Caucasian 72.05% 299
6 Bi-racial or multi-racial 2.41% 10
7 Other 1.69% 7
Total 100% 415

182Fair Housing Assessment for Cincinnati and Hamilton CountyAugust 2019
Other - Text
Anglo American
Euro-American
This is the problem. We classify and not welcome people
Hispanic
What is your annual household income?
# Answer % Count
1 Less than $15,000 7.44% 30
2 $15,000 - $29,999 6.95% 28
3 $30,000- $49,999 18.86% 76
4 $50,000- $69,999 16.63% 67
7 $70,000- $99,999 20.10% 81
5 $100,000- $199,999 20.60% 83

183Fair Housing Assessment for Cincinnati and Hamilton CountyAugust 2019
6 Over $200,000 9.43% 38
Total 100% 403
Q31 - What is your employment status?
# Answer % Count
1 Employed full time 32+ hours a week 61.74% 255
2 Employed part time 1-31 hours a week 8.47% 35
3 Not employed, but looking for work 1.21% 5
4 Not employed, and not looking for work 1.45% 6
5 Disabled, not able to work 4.12% 17

184Fair Housing Assessment for Cincinnati and Hamilton CountyAugust 2019
6 Retired 18.40% 76
7 Student 0.73% 3
8 Other 3.87% 16
Total 100% 413
Including you, how many people live in your household?
# Answer % Count
1 1 26.17% 106
2 2 42.47% 172
3 3 13.58% 55
4 4 10.37% 42
5 5 or more 7.41% 30
Total 100% 405

185Fair Housing Assessment for Cincinnati and Hamilton CountyAugust 2019
How many children under 18 live in your household?
# Answer % Count
1 0 74.34% 310
2 1 8.63% 36
3 2 9.59% 40
4 3 4.32% 18
5 4 1.92% 8
6 5 or more 1.20% 5
Total 100% 417

186Fair Housing Assessment for Cincinnati and Hamilton CountyAugust 2019
appendix d: Fair Housing assessment- Housing proFessional survey results

187Fair Housing Assessment for Cincinnati and Hamilton CountyAugust 2019
Report
Fair Housing Assessment- Housing Professionals
All responses; n= 218 total respondents Downloaded March 11th 2019
What best describes your role in the housing market in the region? (Please select all that apply.)
# Answer % Count
1 Real Estate Agent 11.57% 28
2 Housing Lender 4.55% 11
3 Property owner with rental property 18.18% 44
4 Developer 9.50% 23
5 Community Development Professional 19.83% 48

188Fair Housing Assessment for Cincinnati and Hamilton CountyAugust 2019
7 Elected Official 0.00% 0
8 Government employee 9.92% 24
9 Other 26.45% 64
Total 100% 242
Other
Other - Text
Professional COnsultant
Business owner in the area
Board of LISC and a CDC
Economic Development + Interior Design Officer
Community Organizer, Policy Organizer
Social Service
School Social Worker
Homeless program staff
board chair
Professional Services Provider
Non-Profit Housing Provider
Civil Engineer consultant
Social Worker
Homeowner, Property Manager for Affordable Housing
Resident and property owner
attorney / planner
HUD certified housing counselor
Subcontractor for construction services
Resident service coordinator
Historic Preservation Professional
Housing Specialist
housing attorney / advocate

189Fair Housing Assessment for Cincinnati and Hamilton CountyAugust 2019
Legal advocate for tenants and homeowners
renter
property inspector
Non Profit
physician
Property Manager Rental Property
Member Economic and Development Committee
Non-Profit Owner/Developer of Affordable Housing
Housing Advocate
Housing Counselor
Property Manager
housing case manager
Apartment
Housing Case Manager
nonprofit provider
Housing case manager
Social Worker Assisting clients seeking to maintain or seek out new housing
social worker
Social service provider
Housing advocate/Social worker
housing services agency
Social Services Housing Staff
mediator
Housing Specialist

190Fair Housing Assessment for Cincinnati and Hamilton CountyAugust 2019
How many housing units do you sell per year?
# Answer % Count
1 Less than 10 units per year 42.86% 12
2 Between 11 and 50 units per year 35.71% 10
3 Over 50 units per year 21.43% 6
Total 100% 28

191Fair Housing Assessment for Cincinnati and Hamilton CountyAugust 2019
How many units of rental property do you own?
# Answer % Count
1 1-5 units 47.62% 20
2 6-15 units 16.67% 7
3 16-30 units 9.52% 4
4 31-50 units 2.38% 1
5 51-100 units 2.38% 1
6 Over 100 units 21.43% 9
Total 100% 42

192Fair Housing Assessment for Cincinnati and Hamilton CountyAugust 2019
What types of property do you develop? (Please select all that apply.)
# Answer % Count
1 Single Family Homes - New Construction 20.00% 8
2 Single Family Homes- Renovation 25.00% 10
3 Multi-Family Homes- New Construction 20.00% 8
4 Multi-Family Homes- Renovation 35.00% 14
Total 100% 40

193Fair Housing Assessment for Cincinnati and Hamilton CountyAugust 2019
How many units of single family new construction do you develop per year?
# Answer % Count
1 1-20 units per year 87.50% 7
2 21 or more units per year 12.50% 1
Total 100% 8

194Fair Housing Assessment for Cincinnati and Hamilton CountyAugust 2019
How many single family homes do you renovate per year?
# Answer % Count
1 1-20 units per year 100.00% 10
2 21 or more units per year 0.00% 0
Total 100% 10

195Fair Housing Assessment for Cincinnati and Hamilton CountyAugust 2019
How many units of multi-family new construction do you develop per year?
# Answer % Count
1 1-20 units per year 37.50% 3
2 21 or more units per year 62.50% 5
Total 100% 8

196Fair Housing Assessment for Cincinnati and Hamilton CountyAugust 2019
How many multi-family units do you renovate per year?
# Answer % Count
1 1-20 units per year 50.00% 7
2 21 or more units per year 50.00% 7
Total 100% 14

197Fair Housing Assessment for Cincinnati and Hamilton CountyAugust 2019
At what level of government do you serve as an Elected Official?
# Answer % Count
1 Local 0.00% 0
2 State 0.00% 0
3 Federal 0.00% 0
Total 100% 0
At what level of government are you employed?
# Answer % Count
1 Local 85.71% 18
2 State 4.76% 1
3 Federal 9.52% 2
Total 100% 21

198Fair Housing Assessment for Cincinnati and Hamilton CountyAugust 2019
Tenure in the market
# Answer % Count
1 Working in the Cincinnati region for less than 5 years (You are new to the Cincinnati Housing Market) 20.90% 37
2 Working in the Cincinnati region for 5-10 years (Since the Recession) 17.51% 31
3 Working in the Cincinnati region for over 10 years (You survived the Recession here) 61.58% 109
Total 100% 177

199Fair Housing Assessment for Cincinnati and Hamilton CountyAugust 2019
What market segments do you serve? (Please select all that apply.)
# Answer % Count
1 High-end rental market (average unit rent over $1,300) 4.62% 20
2 Market rate rental market (average unit rent $900- $1,500) 11.55% 50
3 Moderate rate rental market (average unit rent $700- $1,000) 16.63% 72
4 Low-income rental market (average unit rent $500- $800) 25.17% 109
5 High- end owner occupied units (average unit price over $350,000) 4.85% 21

200Fair Housing Assessment for Cincinnati and Hamilton CountyAugust 2019
6 Market rate owner occupied units (average unit price $150,00- $349,999) 12.70% 55
7 Moderate rate owner occupied units (average unit price $50,000- $149,999) 12.93% 56
8 Low- income owner occupied units (average unit price $30,000- $49,999) 11.55% 50
Total 100% 433
Do you accept housing choice vouchers for your units?
# Answer % Count
1 Yes 52.63% 30
2 No 47.37% 27
Total 100% 57

201Fair Housing Assessment for Cincinnati and Hamilton CountyAugust 2019
What market segments would you like to serve? (Please select all that apply.)
# Answer % Count
1 High-end rental market (average unit rent over $1,300) 7.05% 34
2 Market rate rental market (average unit rent $900- $1,500) 12.45% 60
3 Moderate rate rental market (average unit rent $700- $1,000) 15.35% 74
4 Low- income rental market (average unit rent $500- $800) 18.88% 91
5 High-end owner occupied units (average unit price over $350,000) 7.26% 35

202Fair Housing Assessment for Cincinnati and Hamilton CountyAugust 2019
6 Market rate owner occupied units (average unit price $150,000- $349,999) 11.62% 56
7 Moderate rate owner occupied units (average unit price $50,000- $149,999) 13.90% 67
8 Low- income owner occupied units (average unit price $30,000- $49,999) 13.49% 65
Total 100% 482
What market segments do you feel are hard to serve? (Please select all that apply.)

203Fair Housing Assessment for Cincinnati and Hamilton CountyAugust 2019
# Answer % Count
1 High-end rental market (average unit rent over $1,300) 6.30% 22
2 Market rate rental market (average unit rent $900- $1,500) 4.58% 16
3 Moderate rate rental market (average unit rent $700- $1,000) 12.03% 42
4 Low- income rental market (average unit rent $500- $800) 29.51% 103
5 High- end owner occupied units (average unit price over $350,000) 4.58% 16
6 Market rate owner occupied units (average unit price $150,000- $349,999) 3.72% 13
7 Moderate rate owner occupied units (average unit price $50,000- $149,999) 14.90% 52
8 Low- income owner occupied units (average unit price $30,000- $49,999) 24.36% 85
Total 100% 349

204Fair Housing Assessment for Cincinnati and Hamilton CountyAugust 2019
What makes low-income households hard to serve? (Please select all that apply.)
# Answer % Count
1 Incomes/ lack of ability to pay 14.01% 80
2 The numbers don't work, costs more to produce a unit that people can afford 12.78% 73
3 Difficulty getting financing 9.81% 56
4 Not enough subsidies available 12.61% 72
5 Poor credit history- credit scores 10.86% 62

205Fair Housing Assessment for Cincinnati and Hamilton CountyAugust 2019
6 Tenants outstanding debt 7.36% 42
7 Large family size 5.60% 32
8 Need for units with accommodations for access and other disabilities 5.08% 29
9 Affordable units do not exist in places where low-income households want to live 11.38% 65
10 It is difficult to get units certified to accept Housing Choice Vouchers 5.78% 33
11 Other 4.73% 27
Total 100% 571

206Fair Housing Assessment for Cincinnati and Hamilton CountyAugust 2019
What makes moderate-income households hard to serve? (Please select all that apply.)
# Answer % Count
1 Incomes/ lack of ability to pay 12.08% 25
2 The numbers don't work, costs more to produce a unit that people can afford 14.01% 29
3 Difficulty getting financing 15.94% 33
4 Not enough subsidies available 10.63% 22
5 Poor credit history- credit scores 10.14% 21

207Fair Housing Assessment for Cincinnati and Hamilton CountyAugust 2019
6 Tenants outstanding debt 9.18% 19
7 Large family size 4.35% 9
8 Need for units with accommodations for access and other disabilities 4.35% 9
9 Affordable units do not exist in places where moderate-income households want to live 12.08% 25
11 It is difficult to get units certified to accept Housing Choice Vouchers 2.90% 6
10 Other 4.35% 9
Total 100% 207
Other - Text
Too many regulations that drive up prices
rising property taxes
lack of units in price range close to public transportation. Another issue is the rising cost of utilities, especially water/sewer
Low inventory
Stigma follows Housing Choice Voucher recipient
Low inventory
split incentives
when you have no dependence, and you make to much to live in low-income housing but you don't make enough to pay market rent.

208Fair Housing Assessment for Cincinnati and Hamilton CountyAugust 2019
What parts of the region do you work in? (Please use the map below as a reference and select the number that corresponds to the part(s) of the region you work in. Please select all that apply.)
# Answer % Count
29 1. Downtown Basin 16.20% 81
30 2. Uptown 13.20% 66
31 3. Near East Side 16.00% 80
32 4. Near North Side 14.20% 71
33 5. Near West Side 14.00% 70
34 6. Suburban West Side 7.00% 35
35 7. Suburban North Side 9.20% 46
36 8. Suburban East Side 10.20% 51
Total 100% 500

209Fair Housing Assessment for Cincinnati and Hamilton CountyAugust 2019
How do you advertise your available housing and/or housing services?
# Answer % Count
1 Word of mouth 25.29% 87
2 Sign in yard 9.59% 33
3 Referrals 20.06% 69
4 Real estate agent 10.76% 37
5 Property management company 5.52% 19
6 CMHA (Cincinnati Metropolitan Housing Authority) 6.10% 21
7 Online/ Craig's List or other website 13.37% 46
8 Other 9.30% 32
Total 100% 344

210Fair Housing Assessment for Cincinnati and Hamilton CountyAugust 2019
Other
Other - Text
N/A
N/A
membership and tenant meetings.
N/A
Website, presentations of services
In house sales agents
Does Not apply
Hamilton County board of DD
Not applicable
n/a
case managers
Legal services contact information is listed on eviction summons
Multiple Listing Service
zillow
FB
social media
Mailings, social media...
Realtor sites
MLS, our website
We do not provide housing directly. We work with local governments on regional planning & development issues.
Govt website
MLS, INTERNET
Community Organizations
HOME
NA

211Fair Housing Assessment for Cincinnati and Hamilton CountyAugust 2019
What are the barriers in the housing industry? (Please select all that apply.)
# Answer % Count
1 Lack of financing 16.75% 70
2 The cost of units does not match people's ability to pay 25.84% 108
5 Subsidies are not available 16.03% 67
3 Available subsidies are not practical 12.68% 53
4 Keeping good tenants 9.09% 38
6 Local jurisdictions are unwilling to approve needed housing types 10.77% 45
7 No barriers 2.15% 9

212Fair Housing Assessment for Cincinnati and Hamilton CountyAugust 2019
8 Other 6.70% 28
Total 100% 418
Other
Other - Text
Lack of leveraging public powers to create and fund housing affordable to household with low incomes.
Bureaucracy
Lack of or Poor homeowner training
Too many regulations that drive up prices
I do not work a lot with low income housing, but I do see that there is a lack of well maintained low income housing close to transportation and amenities such as groceries.
rising property taxes
Heroin and other drugs activity in the area And a lack of Help from local police is poor
zoning challenges, nimbyism, we want to build more side by side duplexes, as an example and many places we are interested in building do not want
cost of development
lack of a housing trust fund
Grants and down payment assistance
Getting good tenets
lack of quality housing in quality areas
Not enough units
lack of social consciousness investors who would accept a smaller return on investment for financing
Local red tape via the inspection and code enforcemnt departments
we need rent control
Lack of inventory
some families who need subsidies come with baggage
High poverty rate,
Legacy of segregation and other past institutional racism whose effects have never been adequately reversed
single people with no dependence need more then 1 bedroom apartments
Government shut down
we would like to build duplexes but these are not permitted in some areas, side by side, gap financing for big projects is limited and maybe getting more limited
criminal records

213Fair Housing Assessment for Cincinnati and Hamilton CountyAugust 2019
What types of housing are local jurisdictions unwilling to approve?
# Answer % Count
1 Multi-family 26.74% 23
2 Affordable 37.21% 32
3 Family 9.30% 8
4 Senior 9.30% 8
5 Handicapped accessible 8.14% 7
6 Other 9.30% 8
Total 100% 86
Other
Other - Text
criminal backgrounds
side by side duplex
Special needs, transitional projects have been stopped by NIMBYism.
Insufficient availability for increased need

214Fair Housing Assessment for Cincinnati and Hamilton CountyAugust 2019
Codes are too Stringent
Apartments
Boarding houses
Do you see housing discrimination in this region?
# Answer % Count
1 Yes 55.19% 85
2 No 44.81% 69
Total 100% 154

215Fair Housing Assessment for Cincinnati and Hamilton CountyAugust 2019
What is the discrimination based on? (Please select all that apply.)
# Answer % Count
1 Race/ ethnicity 16.13% 55
2 Color 13.20% 45
4 National origin 5.57% 19
17 Appalachian origin 0.88% 3
15 Undocumented status 7.04% 24

216Fair Housing Assessment for Cincinnati and Hamilton CountyAugust 2019
11 Limited English 7.33% 25
5 Religion 0.88% 3
3 Sex 2.93% 10
7 Gender identity 2.93% 10
6 Sexual Orientation 2.93% 10
9 Age 4.11% 14
10 Disability 8.80% 30
12 Familial status (There are children under 18 living in the household or someone in the household is pregnant) 6.74% 23
13 Marital status 0.59% 2
14 Military status 0.29% 1
18 Source of income 13.78% 47
19 Something else 5.87% 20
Total 100% 341
Something else
Something else - Text
Experience of homelessness, economic status, criminal justice history
Almost all of the above in varying degrees.
economic - imposing requirements that drive up sales price
criminal history
level of income
formerly homeless
As a lender, I am one step away from the rental process, so I based my "yes" answer on third party accounts.
Amount of income
Social ills such as previous criminal record and low wage employment
Subsidy
disability when it's mental health, not so much physical
Economic discrimination through zoning. Suburban communities with desirable schools impose zoning restrictions that drive up the cost of housing.
Low income

217Fair Housing Assessment for Cincinnati and Hamilton CountyAugust 2019
Classism
criminal background
The type of housing subsidy they have. Not all landlords will take all types of housing subsidies.
low income
disability related also, people who need 24 hour care, racial discrimination in re: to care providers and PARKING issues related to care providers
criminal record

218Fair Housing Assessment for Cincinnati and Hamilton CountyAugust 2019
In what geographic areas do you see discrimination? (Please use the map below as a reference and select the number that corresponds to the region(s) where you see discrimination. Please select all that apply.)
# Answer % Count
1 1. Downtown/ Basin 14.60% 40
2 2. Uptown 12.41% 34
3 3. Near East Side 14.23% 39
4 4. Near North Side 11.68% 32
5 5. Near West Side 13.50% 37
6 6. Suburban West Side 11.31% 31
8 7. Suburban North Side 10.58% 29
9 8. Suburban East Side 11.68% 32
Total 100% 274

219Fair Housing Assessment for Cincinnati and Hamilton CountyAugust 2019
If you feel that people are being treated differently because of their age, which of the following was the reason
# Answer % Count
1 Too old 57.14% 8
2 Too young 35.71% 5
3 Something else 7.14% 1
Total 100% 14
What is your gender?

220Fair Housing Assessment for Cincinnati and Hamilton CountyAugust 2019
# Answer % Count
1 Male 40.67% 61
2 Female 54.67% 82
3 Non-binary/ third gender 0.00% 0
4 Prefer not to answer 4.67% 7
Total 100% 150
Are you a member of a Spanish, Hispanic, or Latino group?
# Answer % Count
1 Yes 1.33% 2
2 No 98.67% 148
Total 100% 150

221Fair Housing Assessment for Cincinnati and Hamilton CountyAugust 2019
What is your race?
# Answer % Count
1 Black or African American 25.52% 37
2 American Indian or Alaskan Native 1.38% 2
3 Native Hawaiian or Pacific Islander 0.69% 1
4 Asian 2.76% 4
5 White or Caucasian 64.83% 94
6 Bi-racial 0.69% 1
7 Other 4.14% 6
Total 100% 145

222Fair Housing Assessment for Cincinnati and Hamilton CountyAugust 2019
What part of the region do you live in? (Please use the map below as a reference and select the number that corresponds to the region where you live.)
# Answer % Count
1 1. Downtown/ basin 13.67% 19
2 2. Uptown 7.91% 11
3 3. Near East Side 20.14% 28
4 4. Near North Side 16.55% 23
5 5. Near West Side 8.63% 12
6 6. Suburban West Side 6.47% 9
11 7. Suburban North Side 9.35% 13
7 8. Suburban East Side 17.27% 24
Total 100% 139

223Fair Housing Assessment for Cincinnati and Hamilton CountyAugust 2019
What kinds of loans does your institution make? (Please select all that apply.)
# Answer % Count
1 Fixed rate mortgage loan 25.00% 2
4 Adjustable rate mortgage loan 0.00% 0
5 Bridge loans 12.50% 1
6 Traditional mortgages for first time home buyers 12.50% 1
7 Traditional mortgages packaged with FHA 0.00% 0

224Fair Housing Assessment for Cincinnati and Hamilton CountyAugust 2019
8 Traditional mortgages for under $50,000 0.00% 0
9 Rehab Mortgage (purchase/rehab loan) 12.50% 1
10 Home Improvement Loan 12.50% 1
11 Other special products 12.50% 1
12 All of the above 12.50% 1
Total 100% 8
Q38_11_TEXT - Other special products
Other special products - Text
Survey won't permit selection of more than one type. CDF lends for acquisition, predevelopment, bridge financing, storefront build out, permanent loans, as needed.

225Fair Housing Assessment for Cincinnati and Hamilton CountyAugust 2019
appendix e: demograpHiCs oF publiCly supported Housing developments, by program Category: City oF CinCinnati

226Fair Housing Assessment for Cincinnati and Hamilton CountyAugust 2019
Demographics of Publicly Supported Housing Developments, by Program Category
Development Name PHA Code PHA Name # Units White Black Hispanic Asian Households with Children
Findlater Gardens OH004 Cincinnati Metropolitan Housing Authority
649 5% 94% 1% 0% 76%
Acquisition-Rehab OH004 Cincinnati Metropolitan Housing Authority
181 11% 89% 0% N/a 75%
Acquisition-Rehab OH004 Cincinnati Metropolitan Housing Authority
236 1% 98% 1% N/a 79%
Winton Terrace OH004 Cincinnati Metropolitan Housing Authority
608 4% 95% 1% N/a 73%
Beechwood OH004 Cincinnati Metropolitan Housing Authority
369 5% 93% 1% 0% 0%
Riverview House OH004 Cincinnati Metropolitan Housing Authority
139 11% 88% 1% 1% N/a
Park Eden OH004 Cincinnati Metropolitan Housing Authority
370 6% 93% 1% 0% 1%
Stanley Rowe Towers OH004 Cincinnati Metropolitan Housing Authority
195 1% 98% 1% N/a 62%
Pinecrest OH004 Cincinnati Metropolitan Housing Authority
190 40% 53% 5% 1% 1%
Millvale - North OH004 Cincinnati Metropolitan Housing Authority
517 7% 92% 1% 0% 82%
Marquette Manor OH004 Cincinnati Metropolitan Housing Authority
258 7% 91% 1% 0% 32%
Hope Vi, Phase 1 - Lincoln Court OH004 Cincinnati Metropolitan Housing Authority
47 0% 100% 0% N/a N/a
Stanley Rowe Towers OH004 Cincinnati Metropolitan Housing Authority
355 3% 97% 0% N/a 7%
Acquisition-Rehab OH004 Cincinnati Metropolitan Housing Authority
183 8% 91% 1% N/a 69%
Acquisition-Rehab OH004 Cincinnati Metropolitan Housing Authority
119 16% 82% 1% 1% 54%
Public Housing(Cincinnati, OH CDBG) Jurisdiction

227Fair Housing Assessment for Cincinnati and Hamilton CountyAugust 2019
Acquisition-Rehab OH004 Cincinnati Metropolitan Housing Authority
106 7% 93% 0% N/a 41%
Rhf-Scattered Sites (Acq) OH004 Cincinnati Metropolitan Housing Authority
234 9% 90% 1% N/a 64%
Acquisition-Rehab OH004 Cincinnati Metropolitan Housing Authority
167 21% 78% 1% N/a 72%
Acquisition-Rehab OH004 Cincinnati Metropolitan Housing Authority
105 6% 91% 3% N/a 74%
Hope Vi, Phase 2 - Lincoln Court OH004 Cincinnati Metropolitan Housing Authority
56 0% 98% 2% N/a 41%
Hope Vi, Phase 3 - Lincoln Court OH004 Cincinnati Metropolitan Housing Authority
40 2% 98% 0% N/a 53%
Hope Vi, Phase 1 - Laurel Homes OH004 Cincinnati Metropolitan Housing Authority
62 2% 98% 0% N/a 43%
Hope Vi, Phase 2 - Laurel Homes OH004 Cincinnati Metropolitan Housing Authority
19 0% 94% 6% N/a 44%
Hope Vi, Phase 4 - Lincoln Court OH004 Cincinnati Metropolitan Housing Authority
63 0% 100% 0% N/a 40%
Hope Vi - Laurel Iv OH004 Cincinnati Metropolitan Housing Authority
26 0% 100% 0% N/a 58%
Laurel Homes Phase V OH004 Cincinnati Metropolitan Housing Authority
53 0% 100% 0% N/a 51%

228Fair Housing Assessment for Cincinnati and Hamilton CountyAugust 2019
Development Name PHA Code PHA Name # Units White Black Hispanic Asian Households with Children
Abigail Apartments N/a N/a 32 19% 81% 0% N/a 72%St Leger Apts(Losantiville Evanston
N/a N/a 18 11% 89% 0% N/a 61%
Losantiville Buildings N/a N/a 69 25% 75% 0% N/a 67%Anna Louise Inn N/a N/a 32 50% 50% 0% N/a N/aAvondale Ii N/a N/a 43 7% 90% 0% N/a 73%Avondale Ii N/a N/a 15 N/a N/a N/a N/a N/aNavarre Garrone N/a N/a 45 7% 93% 0% N/a 66%Navarre Garrone N/a N/a 5 N/a N/a N/a N/a N/aNavarre Garrone N/a N/a 12 27% 73% 0% N/a 36%New Concepts Community N/a N/a 6 N/a N/a N/a N/a N/aBurnet Place N/a N/a 29 32% 68% 0% N/a 85%Burnet Place N/a N/a 33 23% 77% 0% N/a 29%Founders Home N/a N/a 36 4% 92% 4% N/a N/aFulton Chateau N/a N/a 26 15% 85% 0% N/a 62%Georgia Morris Apts. N/a N/a 27 4% 96% 0% N/a 4%Hale Apartments N/a N/a 46 2% 98% 0% N/a 18%Haddon Hall N/a N/a 113 2% 97% 1% N/a N/aHickory Woods N/a N/a 46 0% 95% 2% N/a 84%Hillcrest Elderly N/a N/a 200 18% 82% 0% N/a N/aHollister House N/a N/a 24 37% 63% 0% N/a N/aHolub Apartments Aka Sycamore Manor
N/a N/a 8 N/a N/a N/a N/a N/a
Jacon Apts. N/a N/a 29 0% 100% 0% N/a 35%Jan Apartments N/a N/a 66 0% 96% 0% N/a 25%Magnolia Heights N/a N/a 11 N/a N/a N/a N/a N/aMagnolia Heights N/a N/a 48 41% 59% 0% N/a 75%Magnolia Heights N/a N/a 8 N/a N/a N/a N/a N/aMagnolia Heights N/a N/a 30 34% 66% 0% N/a 59%Judson Terrace N/a N/a 40 26% 74% 0% N/a N/aKemper Arms Apartments N/a N/a 17 6% 94% 0% N/a 11%Kemper Lane N/a N/a 105 3% 95% 1% N/a N/aKing Towers Apts. N/a N/a 56 9% 88% 3% N/a 61%Lexington Apartments N/a N/a 6 N/a N/a N/a N/a N/aMcmicken Arms N/a N/a 18 12% 81% 6% N/a N/aMadison Villa Apts. N/a N/a 95 11% 82% 7% N/a N/aMalvern Place N/a N/a 45 3% 97% 0% N/a 67%Colonial Village N/a N/a 66 8% 88% 4% N/a 84%Ohio House N/a N/a 7 N/a N/a N/a N/a N/aCutter Apartments N/a N/a 40 0% 100% 0% N/a 38%Pendleton Iii N/a N/a 78 18% 81% 1% N/a 54%Shiloh Manor Apartments N/a N/a 27 4% 96% 0% N/a 30%St. Paul Village I N/a N/a 71 31% 63% 1% 3% N/aSt. Paul Lutheran Village Ii N/a N/a 65 32% 60% 5% 2% N/aSt. Clair Manor N/a N/a 31 4% 96% 0% N/a 19%The Courtyard N/a N/a 137 19% 79% 1% N/a 1%Union Baptist N/a N/a 169 13% 87% 0% N/a 13%Valley House N/a N/a 7 N/a N/a N/a N/a N/aWalnut Hills Apts. N/a N/a 197 4% 90% 6% N/a N/aWes Del Apartments N/a N/a 5 N/a N/a N/a N/a N/aWalker Apartments N/a N/a 26 4% 96% 0% N/a 38%Advent Iii N/a N/a 36 10% 86% 3% N/a N/aOtr Revitalization N/a N/a 94 21% 79% 0% N/a 63%Alms Hill Apartments N/a N/a 200 8% 91% 0% 1% 22%Ashwood Apartments N/a N/a 152 7% 93% 0% N/a 86%Pendleton Estates N/a N/a 42 22% 78% 0% N/a 73%Booth Residence N/a N/a 149 37% 62% 1% N/a N/aBurton Apartments N/a N/a 52 7% 93% 0% N/a 50%Clifton Place N/a N/a 182 55% 43% 1% 2% N/a
Project-Based Section 8(Cincinnati, OH CDBG) Jurisdiction

229Fair Housing Assessment for Cincinnati and Hamilton CountyAugust 2019
Development Name PHA Code PHA Name # Units White Black Hispanic Asian Households with Children
Avondale I N/a N/a 81 5% 94% 2% N/a 77%Cambridge Arms I N/a N/a 107 51% 48% 1% N/a N/aWalnut Hills Estates N/a N/a 33 0% 100% 0% N/a 76%Chapel Square Apartments N/a N/a 49 10% 90% 0% N/a 36%Terri Estates N/a N/a 81 65% 35% 0% N/a 57%Fairview Estates N/a N/a 28 19% 81% 0% N/a 71%North Rhine Heights N/a N/a 65 12% 86% 0% 2% 60%Abigail Apartments N/a N/a 14 23% 77% 0% N/a 85%Abigail Apartments N/a N/a 25 29% 71% 0% N/a 71%Cambridge Arms Ii N/a N/a 107 56% 43% 0% 1% N/aCarl Apartments N/a N/a 16 0% 100% 0% N/a 50%Cin-Avon N/a N/a 76 5% 94% 1% N/a 22%Baymiller N/a N/a 31 13% 84% 0% 3% 74%Cleveland Plaza N/a N/a 32 0% 100% 0% N/a 4%Community Manor N/a N/a 19 11% 89% 0% N/a 67%Darby Hills N/a N/a 44 52% 45% 0% 2% 85%Eatondale N/a N/a 44 19% 81% 0% N/a 81%Eatondale North Apartments N/a N/a 24 10% 90% 0% N/a 5%Edison Apartments N/a N/a 25 25% 75% 0% N/a N/aEntowne Manor N/a N/a 94 0% 100% 0% N/a 2%Villages At Roll Hill N/a N/a 703 4% 93% 3% 0% 81%Find-A-Way I N/a N/a 39 76% 24% 0% N/a N/aFind-A-Way Ii N/a N/a 39 79% 21% 0% N/a N/aParkway Towers N/a N/a 85 14% 86% 0% N/a N/aGateway Plaza N/a N/a 348 6% 92% 1% 1% 13%Raffel N/a N/a 11 0% 100% 0% N/a 55%Reids Valley View Manor N/a N/a 114 9% 90% 1% N/a 65%Richmond Village N/a N/a 83 8% 92% 0% N/a 44%Rolling Ridge Townhouses N/a N/a 50 0% 96% 0% N/a 72%Rosedale Apartments N/a N/a 23 5% 95% 0% N/a 35%Senior Chateau On The Hill N/a N/a 184 54% 44% 1% 1% N/aSaints Rest #1 N/a N/a 22 0% 100% 0% N/a 6%Scattered Sites Apartments N/a N/a 23 0% 100% 0% N/a 100%Senate Apts. N/a N/a 35 N/a N/a N/a N/a N/aShelton Gardens N/a N/a 137 3% 95% 1% N/a 16%Wesley Estates N/a N/a 29 21% 79% 0% N/a 55%Walnut Court N/a N/a 30 10% 90% 0% N/a N/aWalnut Towers N/a N/a 104 48% 51% 1% N/a N/aWashington Park Apartments N/a N/a 37 27% 73% 0% N/a 70%Western Glen Apartments N/a N/a 48 13% 87% 0% N/a 79%Woodside Apts. N/a N/a 24 15% 85% 0% N/a 45%Woodwinds Apartments N/a N/a 48 86% 14% 0% N/a 59%St. Francis Court N/a N/a 160 61% 39% 1% N/a N/a
(Cincinnati, OH CDBG) JurisdictionProject-Based Section 8
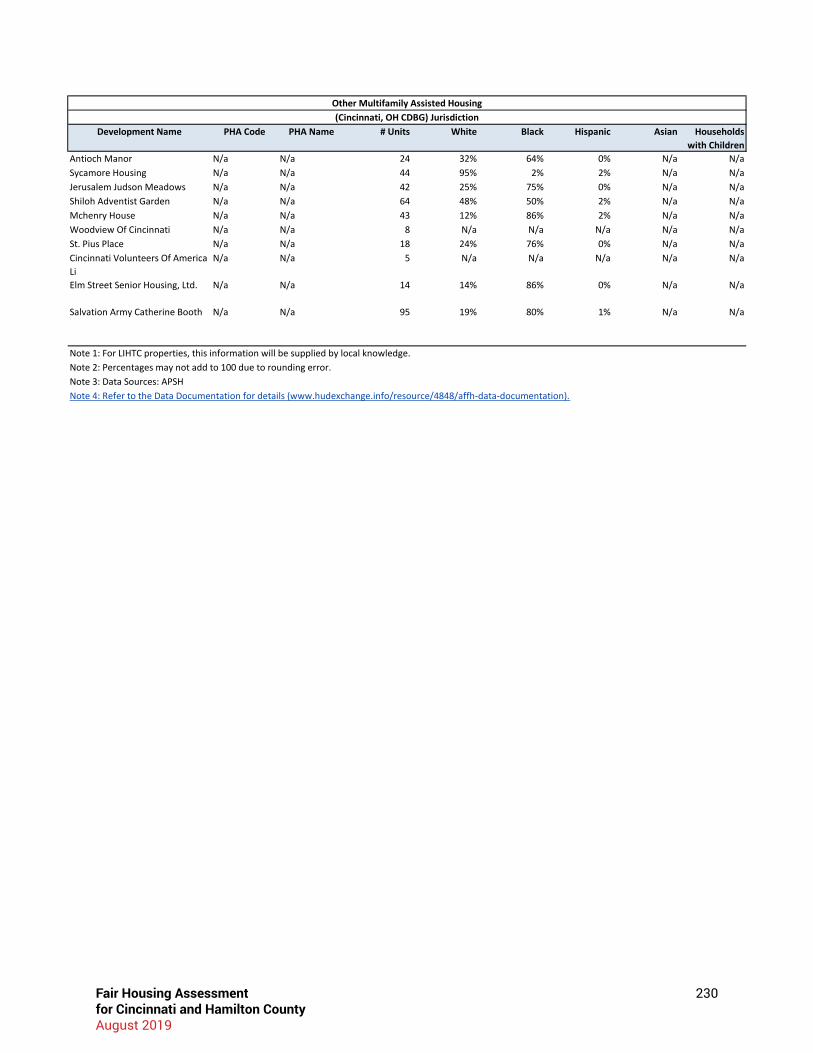
230Fair Housing Assessment for Cincinnati and Hamilton CountyAugust 2019
Development Name PHA Code PHA Name # Units White Black Hispanic Asian Households with Children
Antioch Manor N/a N/a 24 32% 64% 0% N/a N/aSycamore Housing N/a N/a 44 95% 2% 2% N/a N/aJerusalem Judson Meadows N/a N/a 42 25% 75% 0% N/a N/aShiloh Adventist Garden N/a N/a 64 48% 50% 2% N/a N/aMchenry House N/a N/a 43 12% 86% 2% N/a N/aWoodview Of Cincinnati N/a N/a 8 N/a N/a N/a N/a N/aSt. Pius Place N/a N/a 18 24% 76% 0% N/a N/aCincinnati Volunteers Of America Li
N/a N/a 5 N/a N/a N/a N/a N/a
Elm Street Senior Housing, Ltd. N/a N/a 14 14% 86% 0% N/a N/a
Salvation Army Catherine Booth N/a N/a 95 19% 80% 1% N/a N/a
Note 3: Data Sources: APSHNote 4: Refer to the Data Documentation for details (www.hudexchange.info/resource/4848/affh-data-documentation).
Other Multifamily Assisted Housing(Cincinnati, OH CDBG) Jurisdiction
Note 1: For LIHTC properties, this information will be supplied by local knowledge.Note 2: Percentages may not add to 100 due to rounding error.

231Fair Housing Assessment for Cincinnati and Hamilton CountyAugust 2019
appendix F: demograpHiCs oF publiCly supported Housing developments, by program Category: Hamilton County

232Fair Housing Assessment for Cincinnati and Hamilton CountyAugust 2019
Development Name PHA Code PHA Name # Units White Black Hispanic Asian Households with Children
Green Township Subphase A OH004 Cincinnati Metropolitan Housing Authority
12 58% 42% 0% N/a 58%
Missing OH004 Cincinnati Metropolitan Housing Authority
12 0% 100% 0% N/a 50%
Missing OH004 Cincinnati Metropolitan Housing Authority
8 N/a N/a N/a N/a N/a
Public Housing(Hamilton County, OH CDBG) Jurisdiction
Development Name PHA Code PHA Name # Units White Black Hispanic Asian Households with Children
Flora Gardens N/a N/a 50 91% 4% 2% 2% N/aHidden Meadows N/a N/a 96 4% 95% 1% N/a 74%Loveland Pines Apts. N/a N/a 37 84% 11% 5% N/a 51%Miami Community N/a N/a 8 N/a N/a N/a N/a N/aOak Park Apartments N/a N/a 71 10% 88% 1% N/a 79%Macarthur Park N/a N/a 85 74% 23% 2% 1% 75%Mkv, Inc. N/a N/a 149 59% 38% 2% 1% N/aWinton House N/a N/a 80 33% 67% 0% N/a N/aBurney View Apartments N/a N/a 50 14% 84% 2% N/a 76%Centennial Estates N/a N/a 33 0% 100% 0% N/a 53%Delhi Estates N/a N/a 73 97% 3% 0% N/a N/aPride Apartments N/a N/a 48 30% 68% 3% N/a 48%Progress Community N/a N/a 6 N/a N/a N/a N/a N/aRidgewood Apartments N/a N/a 50 47% 49% 4% N/a N/aRidgewood Ii Apts N/a N/a 125 57% 43% 0% N/a N/aSem Manor N/a N/a 144 94% 3% 3% N/a N/aWestover Village N/a N/a 89 87% 11% 1% N/a 68%White Cliff Apartments N/a N/a 72 4% 94% 1% N/a N/a
Project-Based Section 8(Hamilton County, OH CDBG) Jurisdiction
Development Name PHA Code PHA Name # Units White Black Hispanic Asian Households with Children
St. Theresa Village N/a N/a 49 33% 65% 2% N/a N/aFriendship Plaza N/a N/a 30 0% 100% 0% N/a N/aAhepa 127-Ii Apartments N/a N/a 50 24% 76% 0% N/a N/aForest Park Housing N/a N/a 8 N/a N/a N/a N/a N/aClovernook Housing Corp. N/a N/a 8 N/a N/a N/a N/a N/aRace Housing N/a N/a 4 N/a N/a N/a N/a N/aSt. Bernard Commons N/a N/a 41 36% 62% 3% N/a N/a
Other Multifamily Assisted Housing(Hamilton County, OH CDBG) Jurisdiction
Note 1: For LIHTC properties, this information will be supplied by local knowledge.Note 2: Percentages may not add to 100 due to rounding error. Note 3: Data Sources: APSHNote 4: Refer to the Data Documentation for details (www.hudexchange.info/resource/4848/affh-data-documentation).
233Fair Housing Assessment for Cincinnati and Hamilton CountyAugust 2019
appendix g: Fair Housing laws and ComplianCe

234Fair Housing Assessment for Cincinnati and Hamilton CountyAugust 2019
FAIR HOUSING AND RELATED LAWS
Fair housing and related statutes, regulations, and executive orders
Statutes
Executive Orders
Regulations
Statutes Fair Housing Act
42 U.S.C. §§ 3601-19 Title VIII of the Civil Rights Act of 1968 (Fair Housing Act), as amended, prohibits discrimination in the sale, rental, and financing of dwellings, and in other housing-related transactions, because of race, color, religion, sex, familial status, national origin, and disability. It also requires that all federal programs relating to housing and urban development be administered in a manner that affirmatively furthers fair housing.
Title VI of the Civil Rights Act of 1964
42 U.S.C. § 2000d-1 Title VI prohibits discrimination on the basis of race, color, and national origin in programs and activities receiving federal financial assistance.
Section 504 of the Rehabilitation Act of 1973
29 U.S.C. § 794 Section 504 prohibits discrimination based on disability in any program or activity receiving federal financial assistance.
Section 508 of the Rehabilitation Act of 1973
29 U.S.C. § 794d
Section 508 requires federal agencies to ensure that the electronic and information technology they develop, procure, or use allows individuals with disabilities to have ready access to and use of the information and data that is comparable to that of individuals without disabilities.
Title II of the Americans with Disabilities Act of 1990
42 U.S.C. §§ 12131 – 12165 Title II of the ADA prohibits discrimination based on disability in programs and activities provided or made available by public entities. HUD enforces Title II with respect to housing-related programs and activities of public entities, including public housing, housing assistance and housing referrals.
Federal Fair Housing and related laws

235Fair Housing Assessment for Cincinnati and Hamilton CountyAugust 2019
FAIR HOUSING AND RELATED LAWS
Fair housing and related statutes, regulations, and executive orders
Statutes
Executive Orders
Regulations
Statutes Fair Housing Act
42 U.S.C. §§ 3601-19 Title VIII of the Civil Rights Act of 1968 (Fair Housing Act), as amended, prohibits discrimination in the sale, rental, and financing of dwellings, and in other housing-related transactions, because of race, color, religion, sex, familial status, national origin, and disability. It also requires that all federal programs relating to housing and urban development be administered in a manner that affirmatively furthers fair housing.
Title VI of the Civil Rights Act of 1964
42 U.S.C. § 2000d-1 Title VI prohibits discrimination on the basis of race, color, and national origin in programs and activities receiving federal financial assistance.
Section 504 of the Rehabilitation Act of 1973
29 U.S.C. § 794 Section 504 prohibits discrimination based on disability in any program or activity receiving federal financial assistance.
Section 508 of the Rehabilitation Act of 1973
29 U.S.C. § 794d
Section 508 requires federal agencies to ensure that the electronic and information technology they develop, procure, or use allows individuals with disabilities to have ready access to and use of the information and data that is comparable to that of individuals without disabilities.
Title II of the Americans with Disabilities Act of 1990
42 U.S.C. §§ 12131 – 12165 Title II of the ADA prohibits discrimination based on disability in programs and activities provided or made available by public entities. HUD enforces Title II with respect to housing-related programs and activities of public entities, including public housing, housing assistance and housing referrals.

236Fair Housing Assessment for Cincinnati and Hamilton CountyAugust 2019
Title III of the Americans with Disabilities Act of 1990
42 U.S.C. § 12181 – 12189 Title III of the ADA prohibits discrimination based on disability in the goods, services, facilities, privileges, advantages, and accommodations of places of public accommodations owned, leased, or operated by private entities. The Department of Justice enforces Title III of the ADA, but certain HUD recipients and private entities operating housing and community development programs are covered by Title III of the ADA.
Architectural Barriers Act of 1968 42 U.S.C. § 4151 et seq.
The Architectural Barriers Act requires that buildings and facilities designed, constructed, altered, or leased with certain federal funds after September 1969 must be accessible to and useable by persons with disabilities.
Section 109 of Title I of the Housing and Community Development Act of 1974 42 U.S.C. § 5309
Section 109 prohibits discrimination on the basis of race, color, national origin, sex, and religion in any program or activity funded in whole or in part under Title I of the Community Development Act of 1974, which includes Community Development Block Grants.
Title IX of the Education Amendments Act of 1972
20 U.S.C. §§ 1681-83, 1685-88 Title IX prohibits discrimination on the basis of sex in any education programs and activities that receive federal financial assistance. HUD enforces Title IX when it relates to housing affiliated with an educational institution.
Violence Against Women Act
42 U.S.C. § 14043e–11
VAWA provide housing protections for victims of domestic violence, dating violence, sexual assault, and stalking in many of HUD’s housing programs. VAWA also requires the establishment of emergency transfer plans for facilitating the emergency relocation of certain tenants who are victims of domestic violence, dating violence, sexual assault, or stalking.
Age Discrimination Act 42 U.S.C. §§ 6101 – 6107
The Age Discrimination Act of 1975 prohibits discrimination on the basis of age in programs and activities receiving federal financial assistance.
Executive Orders Executive Order 11063

237Fair Housing Assessment for Cincinnati and Hamilton CountyAugust 2019
Equal Opportunity in Housing Executive Order 11063, issued on November 20, 1962, prohibits discrimination in the sale, leasing, rental, or other disposition of properties and facilities owned or operated by the federal government or provided with federal funds.
Executive Order 12892 | text version
Leadership and Coordination of Fair Housing in Federal Programs: Affirmatively Furthering Fair Housing Executive Order 12892, issued on January 17, 1994, requires federal agencies to affirmatively further fair housing in their programs and activities, and provides that the Secretary of HUD will be responsible for coordinating the effort.
Executive Order 12898 | text version Federal Actions to Address Environmental Justice in Minority Populations and Low-Income Populations
Executive Order 12898, issued on February 11, 1994, requires that each federal agency conduct its program, policies, and activities that substantially affect human health or the environment in a manner that does not exclude or otherwise subject persons to discrimination based on race, color, or national origin.
Executive Order 13166
Improving Access to Services for Persons With Limited English Proficiency Executive Order 13166, issued on August 11, 2000, requires each federal agency to take steps to ensure that eligible persons with limited English proficiency are provided meaningful access to all federally-assisted and federally-conducted programs and activities.
Executive Order 13217
Community Based Alternatives for Individuals With Disabilities Executive Order 13217, issued on June 18, 2001, requires federal agencies to evaluate their policies and programs to determine if any can be revised or modified to improve the availability of community-based living arrangements for persons with disabilities.
Regulations Accessibility Standards for Design, Construction, and Alteration of Publicly Owned Residential Structures
24 C.F.R. part 40
Affirmative Fair Housing Marketing
24 C.F.R. part 108
24 C.F.R. part 110
24 C.F.R. part 200, subpart M
24 C.F.R. § 203.12(b)(3)

238Fair Housing Assessment for Cincinnati and Hamilton CountyAugust 2019
Affirmatively Furthering Fair Housing
24 C.F.R. §§ 5.150 – 5.168
Certification and Funding of State and Local Fair Housing Enforcement Agencies
24 C.F.R. part 115
Collection of Data
24 C.F.R. part 121
Discriminatory Conduct Under the Fair Housing Act
24 C.F.R. part 100
Equal Access Rule
24 C.F.R. § 5.105
24 C.F.R. § 5.106
Fair Housing Act Complaint Processing
24 C.F.R. part 103
Fair Housing Poster
24 C.F.R. part 110
Fair Housing Initiatives Program
24 C.F.R. part 125
Information and Communication Technology Standards and Guidelines
36 C.F.R. part 1194
Nondiscrimination and Equal Opportunity in Housing Under Executive Order 11063
24 C.F.R. part 107
Nondiscrimination Based on Handicap in Federally-Assisted Programs and Activities of the Department of Housing and Urban Development
24 C.F.R. part 8
Nondiscrimination in Federally-Assisted Programs of the Department of Housing and Urban Development – Effectuation of Title VI of the Civil Rights Act of 1964
24 C.F.R. part 1
Nondiscrimination in Programs and Activities Receiving Assistance under Title I of the Housing and Community Development Act of 1974

239Fair Housing Assessment for Cincinnati and Hamilton CountyAugust 2019
24 C.F.R. part 6
Nondiscrimination on the Basis of Age in HUD Programs or Activities Receiving Federal Financial Assistance
24 C.F.R. part 146
Nondiscrimination on the Basis of Disability in State and Local Government Services
28 C.F.R. part 35
Nondiscrimination on the Basis of Sex in Education Programs or Activities Receiving Federal Financial Assistance
24 C.F.R. part 3
Protection for Victims of Domestic Violence, Dating Violence, Sexual Assault, or Stalking
24 C.F.R. §§ 5.2001 – 5.2011

240Fair Housing Assessment for Cincinnati and Hamilton CountyAugust 2019
local Fair Housing and related laws
All recipients, subrecipients, and sponsors must adhere to the nondiscrimination and equal opportunity requirements of State and Federal laws and Executive Orders, including, but not limited to:
1. The Fair Housing Act (42 U.S.C. 3601-19)
2. Executive Order 11063, as amended by Executive Order 12259 (3 CFR, 1959-1963 Comp., p. 652 and 3 CFR, 1980 Comp., p. 307) (Equal Opportunity in Housing Programs)
3. Title VI of the Civil Rights Act of 1964 (42 U.S.C. 2000d-2000d-4) (Nondiscrimination in Federally Assisted Programs)
4. The Age Discrimination Act of 1975 (42 U.S.C. 6101-6107);
5. Section 504 of the Rehabilitation Act of 1973 (29 U.S.C. 794)
6. Title II of the Americans with Disabilities Act, 42 U.S.C. 12101 et seq.;
7. 24 CFR part 8;
8. 42 US Code 3607
9. Ohio Revised Code 4112 et seq.
10. Ohio Administrative Code 4112-5
All recipients, subrecipients, and sponsors of the City of Cincinnati must adhere to these local regulations:
11. City of Cincinnati Equal Employment Opportunity Chapter 325 Cincinnati Municipal Code
12. City of Cincinnati Ordinance 16-2015
13. Cincinnati City Ordinance 65-2006
14. Cincinnati City Ordinance 235-2013

241Fair Housing Assessment for Cincinnati and Hamilton CountyAugust 2019
appendix H: air Quality in winton terraCe and spring grove village

242Fair Housing Assessment for Cincinnati and Hamilton CountyAugust 2019

243Fair Housing Assessment for Cincinnati and Hamilton CountyAugust 2019

244Fair Housing Assessment for Cincinnati and Hamilton CountyAugust 2019
appendix i: Hamilton County iCma FellowsHip data

245Fair Housing Assessment for Cincinnati and Hamilton CountyAugust 2019

246Fair Housing Assessment for Cincinnati and Hamilton CountyAugust 2019

247Fair Housing Assessment for Cincinnati and Hamilton CountyAugust 2019
248Fair Housing Assessment for Cincinnati and Hamilton CountyAugust 2019

249Fair Housing Assessment for Cincinnati and Hamilton CountyAugust 2019

250Fair Housing Assessment for Cincinnati and Hamilton CountyAugust 2019

251Fair Housing Assessment for Cincinnati and Hamilton CountyAugust 2019

252Fair Housing Assessment for Cincinnati and Hamilton CountyAugust 2019

253Fair Housing Assessment for Cincinnati and Hamilton CountyAugust 2019

254Fair Housing Assessment for Cincinnati and Hamilton CountyAugust 2019

255Fair Housing Assessment for Cincinnati and Hamilton CountyAugust 2019

256Fair Housing Assessment for Cincinnati and Hamilton CountyAugust 2019

257Fair Housing Assessment for Cincinnati and Hamilton CountyAugust 2019

258Fair Housing Assessment for Cincinnati and Hamilton CountyAugust 2019

259Fair Housing Assessment for Cincinnati and Hamilton CountyAugust 2019

260Fair Housing Assessment for Cincinnati and Hamilton CountyAugust 2019

261Fair Housing Assessment for Cincinnati and Hamilton CountyAugust 2019

262Fair Housing Assessment for Cincinnati and Hamilton CountyAugust 2019

263Fair Housing Assessment for Cincinnati and Hamilton CountyAugust 2019

264Fair Housing Assessment for Cincinnati and Hamilton CountyAugust 2019

265Fair Housing Assessment for Cincinnati and Hamilton CountyAugust 2019

266Fair Housing Assessment for Cincinnati and Hamilton CountyAugust 2019

267Fair Housing Assessment for Cincinnati and Hamilton CountyAugust 2019

268Fair Housing Assessment for Cincinnati and Hamilton CountyAugust 2019

269Fair Housing Assessment for Cincinnati and Hamilton CountyAugust 2019

270Fair Housing Assessment for Cincinnati and Hamilton CountyAugust 2019

271Fair Housing Assessment for Cincinnati and Hamilton CountyAugust 2019

272Fair Housing Assessment for Cincinnati and Hamilton CountyAugust 2019

273Fair Housing Assessment for Cincinnati and Hamilton CountyAugust 2019

274Fair Housing Assessment for Cincinnati and Hamilton CountyAugust 2019

275Fair Housing Assessment for Cincinnati and Hamilton CountyAugust 2019

276Fair Housing Assessment for Cincinnati and Hamilton CountyAugust 2019

277Fair Housing Assessment for Cincinnati and Hamilton CountyAugust 2019
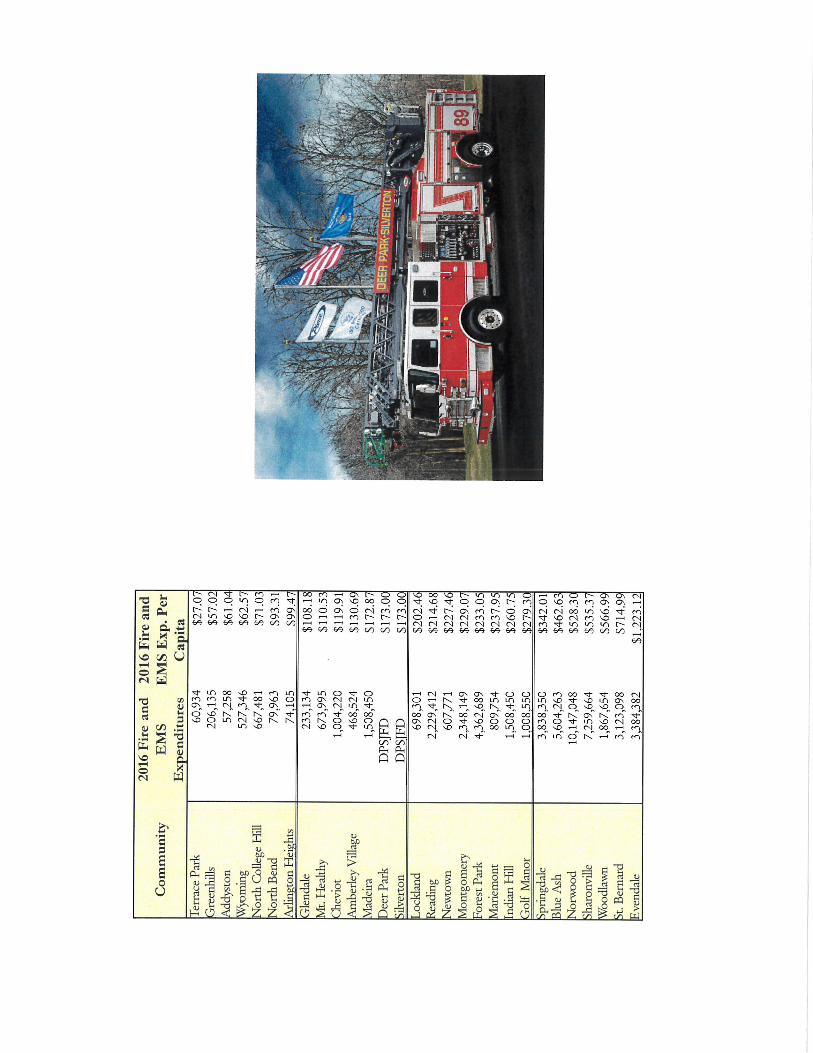
278Fair Housing Assessment for Cincinnati and Hamilton CountyAugust 2019

279Fair Housing Assessment for Cincinnati and Hamilton CountyAugust 2019

280Fair Housing Assessment for Cincinnati and Hamilton CountyAugust 2019

281Fair Housing Assessment for Cincinnati and Hamilton CountyAugust 2019

282Fair Housing Assessment for Cincinnati and Hamilton CountyAugust 2019

283Fair Housing Assessment for Cincinnati and Hamilton CountyAugust 2019

284Fair Housing Assessment for Cincinnati and Hamilton CountyAugust 2019

285Fair Housing Assessment for Cincinnati and Hamilton CountyAugust 2019

286Fair Housing Assessment for Cincinnati and Hamilton CountyAugust 2019

287Fair Housing Assessment for Cincinnati and Hamilton CountyAugust 2019

288Fair Housing Assessment for Cincinnati and Hamilton CountyAugust 2019

289Fair Housing Assessment for Cincinnati and Hamilton CountyAugust 2019

290Fair Housing Assessment for Cincinnati and Hamilton CountyAugust 2019