Analysis of dynamic effects relevant for the wear damage in hydraulic machines for wave energy...
14
Analysis of dynamic effects relevant for the wear damage in hydraulic machines for wave energy conversion Limin Yang n , Jørgen Hals, Torgeir Moan Centre for Ships and Ocean Structures and Department of Marine Technology, Norwegian University of Science and Technology, Otto Nielsens vei 10, NO-7491 Trondheim, Norway article info Article history: Received 1 December 2009 Accepted 25 April 2010 Available online 20 May 2010 Keywords: Wave Energy Converter Hydraulic power take-off Irregular waves High frequency oscillation Piston ring and cylinder bore Wear abstract The present paper deals with a mathematical model of a heaving-buoy Wave Energy Converter (WEC) equipped with high-pressure hydraulic power take-off machinery for energy conversion. This model is based on linear hydrodynamic theory, and a hybrid frequency–time domain model is used to study the dynamics of the heaving-body exposed to an irregular incident wave. For the power take-off system, end-stop devices are provided to protect the hydraulic machinery when the buoy is exposed to severe sea states. The model also takes into account the lubricated friction force and pressure drops of orifice flow through the valves in the hydraulic system. All the forces mentioned in the hydraulic power take- off machinery have non-linear features. A complete non-linear state space model for the WEC system is presented in this study. The WEC system was numerically simulated for different cylinder lengths under a fixed volume. The effect of fluid compressibility in the cylinder has been investigated in the mathematical model. High frequency oscillations (HFOs) caused by the compressibility of the fluid are displayed in the time series and in corresponding power spectra, and variation is shown for different cylinder sizes. Piston ring and cylinder bore wear damage is estimated by using Archard’s equation on the basis of the simulation results. A comparison of these results with a performance of an identical WEC system which neglects fluid compressibility has been done in this work. It shows that although the spectral power is small, HFO can make a large contribution to both the ring and cylinder bore wear. For the purpose of wear prediction, oscillations at or below the wave frequency and HFO may be equally important. & 2010 Elsevier Ltd. All rights reserved. 1. Introduction Wave energy is a non-polluting and renewable source of energy, created by the natural conversion of part of the wind blowing over the oceans. Among several possible methods of capturing wave energy, point absorbers have been used for this purpose, i.e., bodies with very small extension compared to the wavelength (Falnes, Chapter 6, 2002). Point-absorbing Wave Energy Converters (WECs) have been studied since the late 1970s, including testing on the laboratory scale and under real- sea conditions. Evans (1978) obtained a solution for hydrody- namic coefficients based on the linear water wave theory for an oscillating water column (OWC) device by assuming small dimensions compared with the wavelength. Budal and Falnes (1982) described a spherical buoy only performing a heaving oscillation relative to a strut joined to an anchor on the sea bed. In their paper, the latching method for phase control was supplied with the buoy. Compared to other types of absorbers, the point absorbers possess a large power-to-volume ratio implying a large ratio of absorbed power to the submerged buoy volume. They are also attractive in terms of easy modelling because the scattered wave field can be neglected and forces on the body are only due to incident waves. A series of studies by Falnes and Budal (1978), Evans (1981), French and Bracewell (1986), Pizer (1993), Vantorre et al. (2004), Babarit et al. (2004) and others have been carried out on these devices both in regular and irregular waves. The main mechanism that can be implemented to convert wave into mechanical and/or electrical energy is called a power take-off (PTO). The hydraulic PTO used here is a type that converts the oscillating motion of the body into hydraulic power by the use of hydraulic rams which then drive the shaft with a hydraulic motor connected to a generator, a configuration that is used by many researchers. Eidsmoen (1995) presented a tight-moored heaving-buoy WEC, with high-pressure hydraulic machinery for energy production. In his model, a linear friction force and a non- linear end-stop device were included. An estimate of the year- average power production was computed both with and without a control method for the time domain. Bjarte-Larsson and Falnes (2006) tested a heaving floating buoy with a hydraulic power take-off exposed to sinusoidal incident waves in a wave channel. Contents lists available at ScienceDirect journal homepage: www.elsevier.com/locate/oceaneng Ocean Engineering 0029-8018/$ - see front matter & 2010 Elsevier Ltd. All rights reserved. doi:10.1016/j.oceaneng.2010.04.005 n Corresponding author. Tel.: + 47 73595506; fax: + 47 73595528. E-mail address: [email protected] (L. Yang). Ocean Engineering 37 (2010) 1089–1102
Transcript of Analysis of dynamic effects relevant for the wear damage in hydraulic machines for wave energy...

Ocean Engineering 37 (2010) 1089–1102
Contents lists available at ScienceDirect
Ocean Engineering
0029-80
doi:10.1
n Corr
E-m
journal homepage: www.elsevier.com/locate/oceaneng
Analysis of dynamic effects relevant for the wear damage in hydraulicmachines for wave energy conversion
Limin Yang n, Jørgen Hals, Torgeir Moan
Centre for Ships and Ocean Structures and Department of Marine Technology, Norwegian University of Science and Technology, Otto Nielsens vei 10, NO-7491 Trondheim, Norway
a r t i c l e i n f o
Article history:
Received 1 December 2009
Accepted 25 April 2010Available online 20 May 2010
Keywords:
Wave Energy Converter
Hydraulic power take-off
Irregular waves
High frequency oscillation
Piston ring and cylinder bore
Wear
18/$ - see front matter & 2010 Elsevier Ltd. A
016/j.oceaneng.2010.04.005
esponding author. Tel.: +47 73595506; fax:
ail address: [email protected] (L. Yang).
a b s t r a c t
The present paper deals with a mathematical model of a heaving-buoy Wave Energy Converter (WEC)
equipped with high-pressure hydraulic power take-off machinery for energy conversion. This model is
based on linear hydrodynamic theory, and a hybrid frequency–time domain model is used to study the
dynamics of the heaving-body exposed to an irregular incident wave. For the power take-off system,
end-stop devices are provided to protect the hydraulic machinery when the buoy is exposed to severe
sea states. The model also takes into account the lubricated friction force and pressure drops of orifice
flow through the valves in the hydraulic system. All the forces mentioned in the hydraulic power take-
off machinery have non-linear features. A complete non-linear state space model for the WEC system is
presented in this study.
The WEC system was numerically simulated for different cylinder lengths under a fixed volume. The
effect of fluid compressibility in the cylinder has been investigated in the mathematical model. High
frequency oscillations (HFOs) caused by the compressibility of the fluid are displayed in the time series
and in corresponding power spectra, and variation is shown for different cylinder sizes. Piston ring and
cylinder bore wear damage is estimated by using Archard’s equation on the basis of the simulation
results. A comparison of these results with a performance of an identical WEC system which neglects
fluid compressibility has been done in this work. It shows that although the spectral power is small,
HFO can make a large contribution to both the ring and cylinder bore wear. For the purpose of wear
prediction, oscillations at or below the wave frequency and HFO may be equally important.
& 2010 Elsevier Ltd. All rights reserved.
1. Introduction
Wave energy is a non-polluting and renewable source ofenergy, created by the natural conversion of part of the windblowing over the oceans. Among several possible methods ofcapturing wave energy, point absorbers have been used for thispurpose, i.e., bodies with very small extension compared to thewavelength (Falnes, Chapter 6, 2002). Point-absorbing WaveEnergy Converters (WECs) have been studied since the late1970s, including testing on the laboratory scale and under real-sea conditions. Evans (1978) obtained a solution for hydrody-namic coefficients based on the linear water wave theory for anoscillating water column (OWC) device by assuming smalldimensions compared with the wavelength. Budal and Falnes(1982) described a spherical buoy only performing a heavingoscillation relative to a strut joined to an anchor on the sea bed. Intheir paper, the latching method for phase control was suppliedwith the buoy. Compared to other types of absorbers, the point
ll rights reserved.
+47 73595528.
absorbers possess a large power-to-volume ratio implying a largeratio of absorbed power to the submerged buoy volume. They arealso attractive in terms of easy modelling because the scatteredwave field can be neglected and forces on the body are only due toincident waves. A series of studies by Falnes and Budal (1978),Evans (1981), French and Bracewell (1986), Pizer (1993), Vantorreet al. (2004), Babarit et al. (2004) and others have been carried outon these devices both in regular and irregular waves.
The main mechanism that can be implemented to convertwave into mechanical and/or electrical energy is called a powertake-off (PTO). The hydraulic PTO used here is a type that convertsthe oscillating motion of the body into hydraulic power by the useof hydraulic rams which then drive the shaft with a hydraulicmotor connected to a generator, a configuration that is used bymany researchers. Eidsmoen (1995) presented a tight-mooredheaving-buoy WEC, with high-pressure hydraulic machinery forenergy production. In his model, a linear friction force and a non-linear end-stop device were included. An estimate of the year-average power production was computed both with and withouta control method for the time domain. Bjarte-Larsson and Falnes(2006) tested a heaving floating buoy with a hydraulic powertake-off exposed to sinusoidal incident waves in a wave channel.

Nomenclature
a piston area ratiob bulk moduluss parameter for viscous frictionZ kinematic viscosity of the oilg ratio of specific heatr oil densityo angular frequencyom angular speed of the shaftt torque acted on the shaftAN added mass at infinite frequencyA cross areaA,B,C state-space matricesB damping coefficientc discharge coefficientcs Stribeck velocitycturb discharge coefficient for turbulent flowCend, Dendforce parameters of end-stop deviceD inner diameter of cylinderDm motor displacementF forceh wear depth_h wear rateHs significant wave heightHFO high frequency oscillationHP high pressureJ shaft inertia momentk wear coefficientK stiffnessK(t) retardation functionL cylinder half lengthLP low pressurem buoy massN normal forceP fluid pressureq flow rateQ fluid volumeR resistance
Rt Reynolds numbers sliding distanceS hydrostatic stiffnesstR the height of ringTp spectral peak wave periodv velocityV geometric volumeWEC Wave Energy ConverterWeV wear volumeX position coordinatez additional state-space vector
Subscripts
0 initial or default valueA, B upper, lower chambersb cylinder borec Coulomb frictiond diving chamberend end-stopexc excitation forceext external forcef frictiong generatorhs hydrostaticm hydraulic machinery forcemin minimum valuen natural frequencynet net flowp pistonr rodR radiations Stribeck frictionsum summaryturb turbulent flowv viscous frictionval valvewp water pressure
L. Yang et al. / Ocean Engineering 37 (2010) 1089–11021090
Experimental results showed that the hydraulic power capturecan be significantly increased by use of the latching control. Halset al. (2007) used a hybrid frequency–time domain model andstudied the dynamics of a two-body WEC with hydraulic powertake-off. In their work (Hals et al., 2007), two kinds of hydraulicpower take-offs were mentioned: a passive hydraulic system anda hydraulic system with latching control implemented by the useof shut-off valves. Flow losses in the hydraulic power take-offwere also considered in the mathematical model. The mostcommon characteristic of the three research studies mentionedabove was the use of a one-way hydraulic ram which fed highpressure (HP) fluid to a hydraulic motor. Falc~ao (2007) used atwo-way hydraulic ram to connect the oscillating body. In hispaper, a time-domain analysis was presented to evaluate theperformance of a buoy oscillating in heave with a hydraulic powertake-off in irregular waves without phase control, and the size ofthe accumulators was also considered. In any case, the power lossin the hydraulic circuit was not mentioned. Later, Falc~ao (2008)expanded this work to consider also a phase-control methodwhere control valves were opened only after the pressure hadbuilt up to a chosen threshold value.
The hydraulic cylinder is full of liquid (water or oil) that isslightly compressible. The compressibility of the fluid can cause
pressure fluctuations during operation. Lopes et al. (2009) in theirwork considered the compressibility of the media (air) inside thechamber in their mathematical model for an OWC and gave ananalysis of pressure variations during latched intervals. Detailedanalysis of liquid compressibility in the hydraulic servo-systemsis referred by Jelali and Kroll (2003). From the previous research,we can see that fluid compressibility usually introduces highfrequency oscillation (HFO). This kind of oscillation makes acontribution to the piston and cylinder bore wear.
The wear of the piston ring and cylinder bore has been studiedfor many years within engine and motor systems (Peterson andWiner, 1980). Archard’s wear law (Archard and Hirst, 1956) iscommonly used in this domain. For such systems, the cyclicsliding velocity of the piston causes the film thickness to be cyclic,thus producing a squeeze film action. The film thickness variesthrough the engine cycle (Ting and Mayer, 1974; Priest et al.,1999). In these cases, the minimum film thickness occurs at ornear the top or bottom dead centre of the cylinder bore (In areciprocating engine, the dead centre is the maximum (top deadcentre) or minimum (bottom dead centre) position of the piston(Giorgio et al., 2007)). It can be determined by transient filmanalysis. Due to the reduced lubrication, the wear damage on thecylinder bore becomes most severe in the region near the top or

A
Cylinder
B
Piston rod
Support tower
Point absorber
Fixed frame
MWL
X
O Y
Fig. 1. Schematic illustration of Wave Energy Converter consisting of a heaving
sphere connected to the hydraulic cylinder. The cylinder is rigidly attached to a
frame which is fixed to the sea bed.
L. Yang et al. / Ocean Engineering 37 (2010) 1089–1102 1091
bottom dead centre (Giorgio et al., 2007). For the case of WECsystem studied in the present work, the excitation and dynamicresponses are irregular, which lead to uncertainties in the wearprediction. Compared with the wear modelling in the traditionalengine and motor system, analysis of the characteristic dynamicsis a key issue for wear prediction in the hydraulic power take-offsystem.
This paper addresses the case of a floating body oscillating inheave only. The motion of the body drives a two-way hydraulicram connected to a hydraulic motor and generator. A simplifieddiagram of this body with a fixed reference and its connectionto the hydraulic cylinder is shown in Fig. 1. The cylinder isconnected to a high-pressure hydraulic system, and theoscillating motion of the body is converted into the flow of oilat high pressure by the hydraulic system. In the hydraulic circuit,there is a hydraulic motor which drives an electric generator,and a gas accumulator system is used to reduce pressure peaksin the system and to store energy. Fig. 2 shows this kind of powertake-off system.
Random irregular waves are considered in this work, char-acterized by the significant wave height Hs and the peak period Tp,and deep water is assumed. A hybrid frequency–time domainmodel is used to study the dynamics of this WEC with a hydraulicpower take-off. The governing equations for a floating body whichis exposed to irregular waves, as well as for the power take-offhydraulic circuit, are presented in Section 2. Section 3 is devotedto the hydraulic natural frequency of the cylinder whenconsidering the compressibility of the hydraulic oil. The pistonis considered to be massless with fluid springs connected to eachside. Simulation results for various cylinder sizes with irregularwave excitation are presented. Section 4 gives an analysis of thewear damage on the piston ring and cylinder bore. Finally, theeffect of HFO on the wear of piston ring and cylinder bore isdiscussed based on the numerical results.
2. Non-linear dynamic model for the WEC system
We consider a WEC in the form of a heaving buoy (singledegree of freedom), moving relative to a fixed reference (thecoordinate is fixed with respective to mean position of the buoywith positive X vertically upwards, and the origin is set in theplane of the undisturbed surface, see Fig. 1). The fixed referencecould be any offshore structure fixed to the sea bed. This structureis illustrated in Fig. 1. In this paper, we do not consider how such afixed structure will be constructed. The design of systemsproviding force reference for WECs, be it fixed or moving, is atask on its own.
The governing equation for the floating buoy oscillations canbe written as
m €X ¼ FwpðtÞþFextðtÞ ð1Þ
where m is the mass of the buoy, €X is the acceleration, Fext is theexternal force applied on the buoy and Fwp is the force induced bythe water pressure on the submerged body surface.
Since we are studying a small and axisymmetric device it is notnecessary to consider the direction of the waves. If the amplitudesof the waves and body motions are small (giving a linear systemfrom the viewpoint of wave hydrodynamics), the force Fwp can bewritten as follows (Faltinsen, 1990):
FwpðtÞ ¼ FexcðtÞþFRðtÞþFhsðtÞ ð2Þ
where Fexc(t) is the force produced by incident waves when thebuoy is restrained from oscillation (excitation force), Fhs(t) is thehydrostatic force (it is assumed to be 0 when X¼0) and FR(t) isthe hydrodynamic force due to the body oscillation which is givenby Cummins (1962) as
FRðtÞ ¼ �A1 €X ðtÞ�
Zt
�1
Kðt�tÞ _X ðtÞ dt ð3Þ
Here, _X is the vertical velocity of the buoy, AN is the added massof the buoy in the limit of infinite frequency and K(t) is theradiation force kernel which represents the memory effect of thebody motion and can be calculated from radiation dampingcoefficient B(o) by (Falnes, 2002)
KðtÞ ¼2
p
Z 10
BðoÞ cosðotÞ do ð4Þ
With the assumption of linearity, the convolution integral inEq. (3) can be approximated by a state-space model (Taghipouret al., 2008):
_zðtÞ ¼ AzðtÞþB _X ðtÞ with zð0Þ ¼ 0 ð5Þ
and
Zt
�1
Kðt�tÞ _X ðtÞ dt� CzðtÞ ð6Þ
where zðtÞ ¼ z1ðtÞ, z2ðtÞ; . . ., znðtÞ½ �T is the state vector of theradiation force approximation.
In the case studied, frequency-dependent radiation dampingand the excitation force for the buoy are calculated numericallyby using the software package WAMIT, which is a commerciallyavailable program package developed by WAMIT Inc. (WAMIT,2006). The radiation force kernel function K(t) is approximated bya sixth-order state-space model which yields a satisfactory resultas shown in Fig. 3.
The WEC is equipped with a hydraulic machinery which, as shownin Fig. 2, consists of an axial hydraulic pump with the piston rodconnected to the heaving buoy, four check valves, low- and high-pressure accumulators and pipes. The pressure difference across the

E
A1
A2
Upper cylinderchamber
Lower cylinderchamber
B2
B1
accumulator
Motor
accumulator
HP
G
LP
qA1
qA2
qB1
qB2
A
B
D
CheckValve
Fig. 2. Schematic diagram of the passive hydraulic system. The system consists of a hydraulic cylinder, gas accumulators (HP and LP), check valves (A1, A2, B1 and B2), a
motor and a generator. When the piston is moving upwards, the flow follows the direction indicated by the red empty arrows. When the piston is moving downwards, the
flow follows the direction of the green filled arrows.
0 5 10 15-4
-2
0
2
4
6
8
10
12x 104
Time [s]
Impu
lse
resp
onse
[kg/
s2]
kernel functionreduced order model
Fig. 3. The impulse response function K(t) for the radiation force (line) and its
state-space approximation (symbols).
L. Yang et al. / Ocean Engineering 37 (2010) 1089–11021092
piston produces a load force Fm(t), which is taken to be positive whenit is acting on the body in the negative X-direction (Fig. 4):
FmðtÞ ¼ PAAp�aPBAp ð7Þ
Here PA and PB are the oil pressure of the upper and lower cylinderchambers, respectively; Ap is the piston area of the chamber, a is thepiston area ratio which equals (Ap�Ar)/Ap and Ar is the cross sectionarea of the rod.
The oil in this system is slightly compressible and thepressure in the fluid will increase when the oil is compressed.
A bulk modulus b is defined by the following relation(Thoma, 1970):
dP
b¼�
dV
Vð8Þ
For mineral oils, and for common pressures (Po450 bar) andtemperatures ([�40, 120] 1C), the value of the bulk modulus isabout 1.4�109 Pa (Jelali and Kroll, 2003).
The equation for the chamber pressure can then be derivedfrom the continuity of the mass equation (Egeland and Gravdahl,2002):
_PA ¼ bqA�
_V A
VA
_PB ¼ bqB�
_V B
VBð9Þ
where qA and qB are the net flow rates into and out of the upper andlower chambers, respectively. They are taken to be positive whenthe oil flows into the chambers; VA and VB are the volumes of theupper and lower chambers which can be written as
VA ¼ VA0�xpAP
VB ¼ VB0þxpaAPð10Þ
where xp is the vertical distance of the piston from the midpoint ofthe cylinder (we assume the piston is in the middle of the cylinder atX¼0), VA0 and VB0 are the fluid volumes for the upper and lowerchambers with the piston at the origin location, respectively. In thispaper, the piston and buoy are assumed as one rigid body, i.e., X¼xp.In the following, the buoy position X is used to represent the pistonexcursion instead of xp.
The time derivatives of Eq. (10) are given by
_V A ¼�AP_X
_V B ¼ APa _X ð11Þ

Fig. 4. Sketch of the piston pump with sealing elements and end stoppers. It consists of a hydraulic cylinder filled with oil, a piston, a piston rod and seals. In the figure,
qA and qB are the flow rate into and out of the cylinder chambers (positive flow into the chamber and negative flow out of the chamber), PA and PB are the oil pressures of the
chambers, Ap is the area of the piston, and Ff is the friction force. tR and wR are the thickness and width of the ring, respectively.
L. Yang et al. / Ocean Engineering 37 (2010) 1089–1102 1093
Combining Eqs. (9–11), the final derivative equations for thechambers are
_PA ¼b
ðVA0�APXÞðqAþAP
_X Þ
_PB ¼b
ðVA0þaAPXÞðqB�aAP
_X Þ ð12Þ
For simplification, the piston leakage and external rod leakageare neglected in Eq. (12).
The friction force Ff (Fig. 4) between the cylinder and thepiston is simulated as a function of relative velocity, which isreferred to as the Stribeck friction curve (Jelali and Kroll, 2003):
Ff ð_X Þ ¼ Fvð
_X ÞþFcð_X ÞþFsð
_X Þ
¼ s _Xþsignð _X Þ Fc0þFs0 exp �9 _X9cs
! !ð13Þ
The three characteristic parts of this force are viscous frictionFv, Stribeck friction Fs and Coulomb friction Fc. The parameter sregards viscous friction, Fc0 is the parameter for Coulomb friction,and Fs0 and cs are the Stribeck friction and Stribeck velocity,respectively.
For the hydraulic system, it is necessary to include adeceleration cushion at the end of the stroke to prevent damageto the cylinder housing. This function is carried out by an end-stop device (Fig. 4). This device gently dissipates kinetic energy,thus reducing the possibility of mechanical damage to thecylinder. The force from the end-stop device in our model follows
an approximate function as (Eidsmoen, 1995)
FendðtÞ ¼Dend exp CendðXðtÞ�XendÞð Þþexp �CendðXðtÞþXendÞð Þð Þ _X ðtÞ
ð14Þ
where Dend40 and Cend40. When the piston position deviatesmore than Xend from the midpoint of cylinder this force will stopthe motion quickly, and the WEC will lose most of its kineticenergy. Here, the parameter Xend is not the maximum excursion,but gives the excursion when the end-stop force becomesdominating.
The equation of the buoy motion may now be written asfollows, with Fext(t)¼�Fm(t)�Ff(t)�Fend(t):
ðmþA1Þ €X ðtÞ ¼ FexcðtÞ�CUzðtÞþFhsðtÞ�FmðtÞ�Ff ðtÞ�FendðtÞ ð15Þ
The hydrostatic force, in a linearized version, is Fhs(t)¼SX(t),where S is the hydrostatic stiffness of the buoy.
The WEC system also includes a high-pressure (HP) accu-mulator, a low-pressure (LP) accumulator and a hydraulicmotor. The check valves prevent liquid from leaving the HPaccumulator at E and from entering the LP accumulator at D. Inthis way, when the piston is moving upwards, the fluid flowfollows the direction of the red empty arrows, otherwise itfollows the green filled arrows, as shown in Fig. 2. Compared tothe compressibility of gas in the accumulators, the hydraulicfluid compressibility is considered to be negligible. It com-presses gas in the HP and LP accumulators and the volume of thecompressed gas determines the pressure in the accumulators.Here, assuming that the peaks in the flow into or out of theaccumulator are of short duration, the gas does not have time to

L. Yang et al. / Ocean Engineering 37 (2010) 1089–11021094
exchange much heat with its surroundings. Therefore, theisentropic pressure–volume law
PVg ¼ P0V0g¼ constant ð16Þ
is a good approximation (Karnopp et al., 2006). In this equation,g is the ratio of the specific heats at constant pressure andvolume (for air at atmospheric pressure, gE1.4). P and V are theinstantaneous pressure and volume of the gas, and P0 and V0 arethe values at the initial time. The gas volume V can be calculatedby
V ¼ V0�Q ¼ V0�
Z t
0q dt ð17Þ
Here Q and q denote the net liquid volume and flow rate intothe accumulator, respectively. The relationship between the twovariables is _Q ¼ q.
Applying Eqs. (16) and (17), the non-linear capacitancerelation between P and V of each accumulators now becomes
PHP ¼ ðP0_HPVg0_HPÞ=ðV0_HP�QHPÞ
g
PLP ¼ ðP0_LPVg0_LPÞ=ðV0_LP�QLPÞ
gð18Þ
The subscripts HP and LP represent the high pressureaccumulator and low pressure accumulator, respectively.
The last component in the WEC system is the hydraulic motor.During its operation, it will be driven by the pressure differencebetween the HP accumulator PHP and LP accumulator PLP withangular speed om. The shaft is connected to an electricalgenerator, which is represented simply as a linear resistor in thisstudy. (To achieve such a response in reality, the generator wouldhave to be controlled to behave like such a resistor. Thismodelling choice does not influence the effects studied in thispaper.) The state equation concerning the coupling between themotor and generator is
Jm _om ¼DmðPHP�PLPÞ�Rgom�tl ð19Þ
where Jm is the shaft inertia moment, Dm is the motordisplacement, Rg is the resistance coefficient of the generatorand tl is the equivalent torque loss of the motor which includesleakage, friction and pressure losses.
If the state variables are defined as
y1 ¼ X, y2 ¼_X , y3 ¼ zðtÞ, y4 ¼ PA, y5 ¼ PB, y6 ¼om,
y7 ¼QHP , y8 ¼QLP ð20Þ
then the complete non-linear state space model for the WECsystem can be written as
_y1 ¼ y2
_y2 ¼1
mþA1ðFexcðtÞ�FmðtÞ�Ff ðtÞ�FendðtÞ�Sy1�CUy3Þ
_y3 ¼ AUy3þBUy2
_y4 ¼b
VA0�Apy1ðqA1þqA2þApy2Þ
_y5 ¼b
VB0�aApy1ðqB1þqB2�aApy2Þ
_y6 ¼1
JmððPHP�PLPÞDm�Rgy6�tlÞ
_y7 ¼�qA1�qB1�qm
y8 ¼ qA1þqB1þqm ð21Þ
Here, the variables qA1, qB1, qA2 and qB2 are the flows through thecheck valves as shown in Fig. 2.
The empirical flow formula proposed by Borutzky et al. (2002)is used for the valves in this paper. The flow equations for the
check valves with diameter of Dval can be expressed as
qA1 ¼� cturbAval
ffiffiffiffiffiffiffiffiffiffiffiffiffiffiffiffiffiffiffiffiffiffiffiffiffiffiffiffiffiffiffiffiffiffiffiffiffiffiffiffiffiffiffiffiffiffiffiffiffiffiffiffiffiffiffiffiffiffiffiffiffiffiffiffiffiffiffiffiffiffiffi2
rmaxðPHP�PA,0ÞþZRt
2cturbDval
� �2s
�AvalZRt
2Dval
0@
1A
qA2 ¼ cturbAval
ffiffiffiffiffiffiffiffiffiffiffiffiffiffiffiffiffiffiffiffiffiffiffiffiffiffiffiffiffiffiffiffiffiffiffiffiffiffiffiffiffiffiffiffiffiffiffiffiffiffiffiffiffiffiffiffiffiffiffiffiffiffiffiffiffiffiffiffiffiffi2
rmaxðPLP�PA,0ÞþZRt
2cturbDval
� �2s
�AvalZRt
2Dval
0@
1Að22Þ
qB1 ¼� cturbAval
ffiffiffiffiffiffiffiffiffiffiffiffiffiffiffiffiffiffiffiffiffiffiffiffiffiffiffiffiffiffiffiffiffiffiffiffiffiffiffiffiffiffiffiffiffiffiffiffiffiffiffiffiffiffiffiffiffiffiffiffiffiffiffiffiffiffiffiffiffiffiffi2
rmaxðPB�PHP ,0Þþ
ZRt
2cturbDval
� �2s
�AvalZRt
2Dval
0@
1A
qB2 ¼ cturbAval
ffiffiffiffiffiffiffiffiffiffiffiffiffiffiffiffiffiffiffiffiffiffiffiffiffiffiffiffiffiffiffiffiffiffiffiffiffiffiffiffiffiffiffiffiffiffiffiffiffiffiffiffiffiffiffiffiffiffiffiffiffiffiffiffiffiffiffiffiffiffi2
rmaxðPLP�PB,0ÞþZRt
2cturbDval
� �2s
�AvalZRt
2Dval
0@
1A
Here, cturb is the discharge coefficient for the turbulent flow, Aval isthe cross section area of the valve, Z is the kinematic viscosity ofthe liquid, r is the density of the fluid and Rt is the Reynoldsnumber at which the linear characteristic intersects with theconstant value of cturb.
In Eq. (21), qm is the fluid flow rate into the diving chambersof the hydraulic motor. It depends on the shaft angular velocityom. In the linear wave theory, the excitation force Fexc(t) can beobtained by linear superposition. The forces Fm(t), Ff(t) and Fend(t)are described by Eqs. (7), (13) and (14), respectively. Finally, theaccumulator pressures PHP and PLP can be obtained by usingEq. (18) with parameters of the respective accumulators.
From Eq. (21), we can see that the power-take off system of theWECs is strongly non-linear, so a frequency domain analysis is notapplicable. The model can be dealt with by a time domain analysis.
Note that a number of assumptions that are typically satisfiedin this studied case have been made for the derivation of this non-linear model:
�
The internal leakage of the cylinder is neglected. � The masses of the piston and the piston rod, in addition to thefluid in the cylinder and pipeline, are not considered.
� The cylinder walls, accumulator walls, piston and rod are rigid. � The relation between the density and pressure is linear whenconsidering the compressibility of the hydraulic oil.
� Possible dynamic behaviour of the pressure in the pipelinesbetween the valves and the cylinder is assumed to be negligible.
The neglected effects can, however, be added if they appear tobe essential for special purposes.
3. Natural frequency of the hydraulic system
The hydraulic fluid in the cylinder chamber is compressible andcan thus be considered to be a very stiff spring. The stiffness of thespring is a function of the fluid bulk modulus b, piston area Ap,piston area ratio a and chamber volume V. For the cylinder with twochambers full of fluid, the fluid spring stiffness Kfluid is based on thetwo hydraulic springs connected in series and can be calculated as
Kfluid ¼ bAP
2
VAþðaAPÞ
2
VB
!ð23Þ
Suppose that the piston in the cylinder is situated in the mid-position at the initial time, then
VA0 ¼ APL
VB0 ¼ aAPL ð24Þ
where L is the half length of the cylinder.
L. Yang et al. / Ocean Engineering 37 (2010) 1089–1102 1095
Substituting Eqs. (10, 24) into Eq. (23), the fluid spring stiffnesscan now be described as
Kfluid ¼ bAP
L�Xþ
aAP
LþX
� �ð25Þ
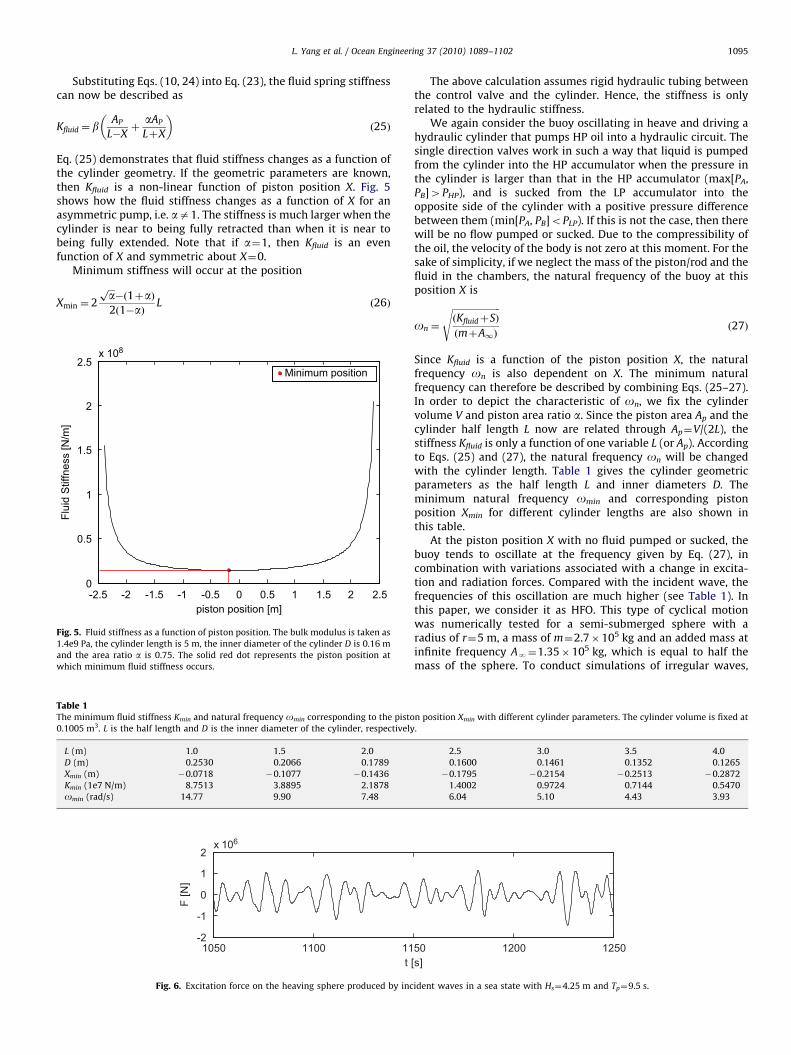
Eq. (25) demonstrates that fluid stiffness changes as a function ofthe cylinder geometry. If the geometric parameters are known,then Kfluid is a non-linear function of piston position X. Fig. 5shows how the fluid stiffness changes as a function of X for anasymmetric pump, i.e. aa1. The stiffness is much larger when thecylinder is near to being fully retracted than when it is near tobeing fully extended. Note that if a¼1, then Kfluid is an evenfunction of X and symmetric about X¼0.
Minimum stiffness will occur at the position
Xmin ¼ 2
ffiffiffiap�ð1þaÞ
2ð1�aÞL ð26Þ
Table 1The minimum fluid stiffness Kmin and natural frequency omin corresponding to the pisto
0.1005 m3. L is the half length and D is the inner diameter of the cylinder, respectively
L (m) 1.0 1.5 2.0
D (m) 0.2530 0.2066 0.1789
Xmin (m) �0.0718 �0.1077 �0.1436
Kmin (1e7 N/m) 8.7513 3.8895 2.1878
omin (rad/s) 14.77 9.90 7.48
1050 1100 11-2
-1
0
1
2x 10⁶
t
F [N
]
Fig. 6. Excitation force on the heaving sphere produced by inc
-2.5 -2 -1.5 -1 -0.5 0 0.5 1 1.5 2 2.50
0.5
1
1.5
2
2.5x 10⁸
piston position [m]
Flui
d S
tiffn
ess
[N/m
]
Minimum position
Fig. 5. Fluid stiffness as a function of piston position. The bulk modulus is taken as
1.4e9 Pa, the cylinder length is 5 m, the inner diameter of the cylinder D is 0.16 m
and the area ratio a is 0.75. The solid red dot represents the piston position at
which minimum fluid stiffness occurs.
The above calculation assumes rigid hydraulic tubing betweenthe control valve and the cylinder. Hence, the stiffness is onlyrelated to the hydraulic stiffness.
We again consider the buoy oscillating in heave and driving ahydraulic cylinder that pumps HP oil into a hydraulic circuit. Thesingle direction valves work in such a way that liquid is pumpedfrom the cylinder into the HP accumulator when the pressure inthe cylinder is larger than that in the HP accumulator (max[PA,PB]4PHP), and is sucked from the LP accumulator into theopposite side of the cylinder with a positive pressure differencebetween them (min[PA, PB]oPLP). If this is not the case, then therewill be no flow pumped or sucked. Due to the compressibility ofthe oil, the velocity of the body is not zero at this moment. For thesake of simplicity, if we neglect the mass of the piston/rod and thefluid in the chambers, the natural frequency of the buoy at thisposition X is
on ¼
ffiffiffiffiffiffiffiffiffiffiffiffiffiffiffiffiffiffiffiffiffiðKfluidþSÞ
ðmþA1Þ
sð27Þ
Since Kfluid is a function of the piston position X, the naturalfrequency on is also dependent on X. The minimum naturalfrequency can therefore be described by combining Eqs. (25–27).In order to depict the characteristic of on, we fix the cylindervolume V and piston area ratio a. Since the piston area Ap and thecylinder half length L now are related through Ap¼V/(2L), thestiffness Kfluid is only a function of one variable L (or Ap). Accordingto Eqs. (25) and (27), the natural frequency on will be changedwith the cylinder length. Table 1 gives the cylinder geometricparameters as the half length L and inner diameters D. Theminimum natural frequency omin and corresponding pistonposition Xmin for different cylinder lengths are also shown inthis table.
At the piston position X with no fluid pumped or sucked, thebuoy tends to oscillate at the frequency given by Eq. (27), incombination with variations associated with a change in excita-tion and radiation forces. Compared with the incident wave, thefrequencies of this oscillation are much higher (see Table 1). Inthis paper, we consider it as HFO. This type of cyclical motionwas numerically tested for a semi-submerged sphere with aradius of r¼5 m, a mass of m¼2.7�105 kg and an added mass atinfinite frequency AN¼1.35�105 kg, which is equal to half themass of the sphere. To conduct simulations of irregular waves,
n position Xmin with different cylinder parameters. The cylinder volume is fixed at
.
2.5 3.0 3.5 4.0
0.1600 0.1461 0.1352 0.1265
�0.1795 �0.2154 �0.2513 �0.2872
1.4002 0.9724 0.7144 0.5470
6.04 5.10 4.43 3.93
50 1200 1250[s]
ident waves in a sea state with Hs¼4.25 m and Tp¼9.5 s.

L. Yang et al. / Ocean Engineering 37 (2010) 1089–11021096
Bretschneider spectrum (e.g. Michel, 1999) is used. This spectrumwas discretized into 225 equally spaced (Do¼0.01 rad/s) sinu-soidal harmonics in the range between 0.25ror2.5 rad/s. Therandom phase angles are uniformly distributed between 0 and 2pand constant with time. The state-space Eq. (21) was numericallyintegrated in the time domain with a total simulation time of1500 s. For Hs¼4.25 m, Tp¼9.5 s, Fig. 6 gives the time variation ofthe excitation force Fexc(t) produced by incident waves in theinterval 1050rtr1250 s. For a cylinder type with L¼2.5 m andD¼0.16 m, Fig. 7a–e shows the buoy excursion X(t) and velocity
1050 1100 1
X [m
]
1050 1100 1
v [m
/s]
1050 1100 1
X [m
]
1050 1100 1
v [m
/s]
1195 1200 1205
-3-2-10123
-2-1012
-3-2-10123
-2-1012
-0.2-0.15
-0.1-0.05
00.05
0.10.15
X [m
]
Fig. 7. Plot curves on top of each other for comparison: (a–b) Time variation for the
Compressibility of the fluid in the WEC system is not considered (see also Falc~ao, 2007
considered (see Eq. (19) in Section 2). (e) Buoy excursion for a short time interval in o
_X ðtÞ in the same time interval. These simulation results of Fig. 7aand b are obtained by integrating the dynamic equations withoutconsidering the compressibility of the oil in the cylinder as doneby Falc~ao (2007). From the two figures, we can see that at sometime, when the excitation force Fexc(t) on the buoy is insufficientand no fluid is pumped into the accumulators, the buoy willremain stationary (flat line in Fig. 7a). This time period iscalled blocked period and denoted by Tblock. Fig. 7c and d givesthe corresponding buoy excursion and velocity by considering thefluid compressibility in the cylinder. Compared with Fig. 7a, we
150 1200 1250t [s]
150 1200 1250t [s]
150 1200 1250t [s]
150 1200 1250t [s]
1210 1215 1220t [s]
buoy excursion X(t) and velocity v(t) for r¼5 m, Hs¼4.25 m, Tp¼9.5 s, L¼2.5 m.
). (c–d) As in Fig. 7a and b, but compressibility of the fluid in the WEC system is
rder to give a clear display of the HFO observed in Fig. 7c.
L. Yang et al. / Ocean Engineering 37 (2010) 1089–1102 1097
can see that the reciprocating motion of the buoy as shown inFig. 7c mainly includes two parts: one occurs when the hydraulicfluid pumped or sucked from the cylinder, i.e., max[PA, PB]4PHP ormin[PA, PB]oPLP. It is the useful motion for energy absorption. Themotion amplitudes are consistent with the results shown inFig. 7a. It is found that this type of motion oscillates at or belowthe incident wave frequency (see Yang et al., 2009). In this paper,we define this motion as wave and lower frequency motion,
0 2 4 6 8 10 12 14 16 18 200
0.5
1
1.5
2
2.5
3
3.5
omega [rad/s]
Pow
er S
pect
rum
Den
sity
[mm
2.s]
motion spectrum
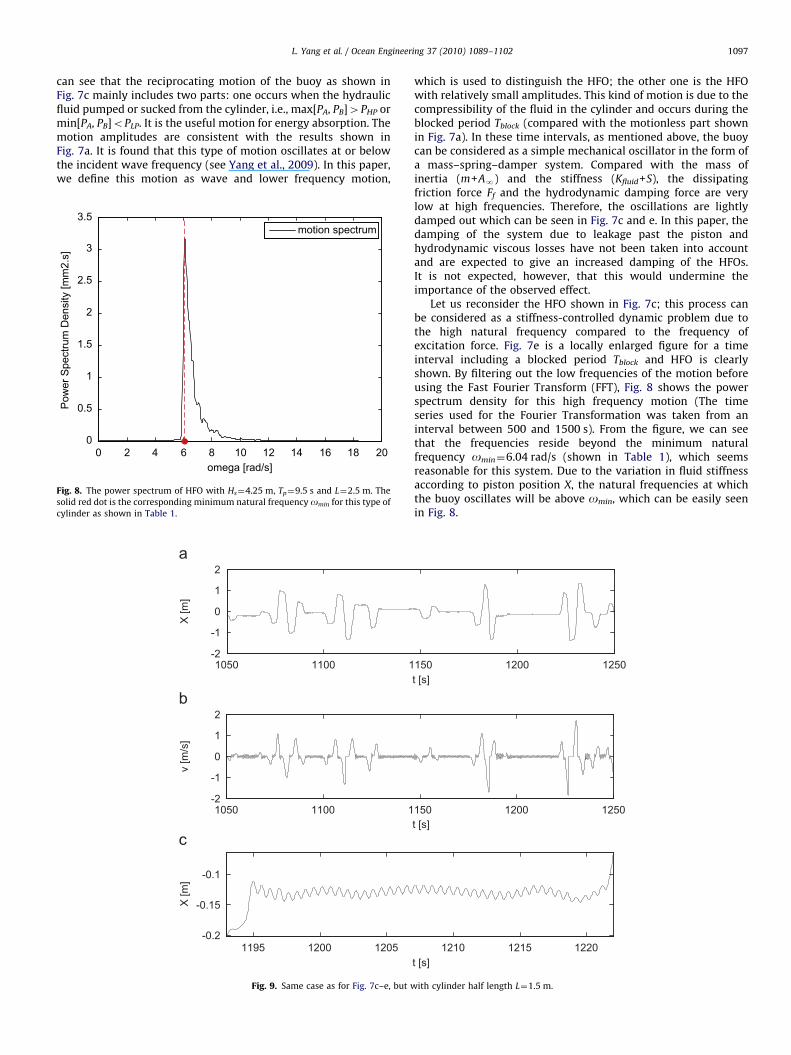
Fig. 8. The power spectrum of HFO with Hs¼4.25 m, Tp¼9.5 s and L¼2.5 m. The
solid red dot is the corresponding minimum natural frequency omin for this type of
cylinder as shown in Table 1.
1050 1100 1
X [m
]
1050 1100 1
v [m
/s]
1195 1200 1205
-2
-1
0
1
2
-2
-1
0
1
2
-0.2
-0.15
-0.1
X [m
]
Fig. 9. Same case as for Fig. 7c–e, but w
which is used to distinguish the HFO; the other one is the HFOwith relatively small amplitudes. This kind of motion is due to thecompressibility of the fluid in the cylinder and occurs during theblocked period Tblock (compared with the motionless part shownin Fig. 7a). In these time intervals, as mentioned above, the buoycan be considered as a simple mechanical oscillator in the form ofa mass–spring–damper system. Compared with the mass ofinertia (m+AN) and the stiffness (Kfluid+S), the dissipatingfriction force Ff and the hydrodynamic damping force are verylow at high frequencies. Therefore, the oscillations are lightlydamped out which can be seen in Fig. 7c and e. In this paper, thedamping of the system due to leakage past the piston andhydrodynamic viscous losses have not been taken into accountand are expected to give an increased damping of the HFOs.It is not expected, however, that this would undermine theimportance of the observed effect.
Let us reconsider the HFO shown in Fig. 7c; this process canbe considered as a stiffness-controlled dynamic problem due tothe high natural frequency compared to the frequency ofexcitation force. Fig. 7e is a locally enlarged figure for a timeinterval including a blocked period Tblock and HFO is clearlyshown. By filtering out the low frequencies of the motion beforeusing the Fast Fourier Transform (FFT), Fig. 8 shows the powerspectrum density for this high frequency motion (The timeseries used for the Fourier Transformation was taken from aninterval between 500 and 1500 s). From the figure, we can seethat the frequencies reside beyond the minimum naturalfrequency omin¼6.04 rad/s (shown in Table 1), which seemsreasonable for this system. Due to the variation in fluid stiffnessaccording to piston position X, the natural frequencies at whichthe buoy oscillates will be above omin, which can be easily seenin Fig. 8.
150 1200 1250t [s]
150 1200 1250t [s]
1210 1215 1220t [s]
ith cylinder half length L¼1.5 m.

1050 1100 1150 1200 1250t [s]
X [m
]
1050 1100 1150 1200 1250
-3-2-1012
-4
-2
0
2
4
v [m
/s]
t [s]
Fig. 10. Same case as for Fig. 7c–d, but with cylinder half length L¼4.0 m.
0 5 10 15 20 250
0.05
0.1
0.15
0.2
0.25
0.3
0.35
0.4
omega[rad/s]
Pow
er S
pect
rum
Den
sity
[mm
2.s]
motion spectrum
Fig. 11. As in Fig. 8, but with L¼1.5 m.
0 2 4 6 8 10 12 14 16 180
5
10
15
20
25
omega[rad/s]
Pow
er S
pect
rum
Den
sity
[mm
2.s]
motion spectrum
Fig. 12. As in Fig. 8, but with L¼4.0 m.
L. Yang et al. / Ocean Engineering 37 (2010) 1089–11021098
Figs. 9(a–c) and 10(a–b) show corresponding curves of X(t)and _X ðtÞ for smaller (L¼1.5 m) and larger (L¼4 m) half cylinderlengths for an identical floating buoy with the force shown inFig. 6. In the case of the former, the fluid flow is blocked for a muchlarger period of time, and the oscillating frequency in this timeinterval is much higher. (This HFO is not quite clear in the positionresponse shown in Fig. 9a. Here we supply a correspondingvelocity response in Fig. 9b and a detailed position response for acertain time interval shown in Fig. 9c, which serve our purposebetter.) The reason for this is that the cylinder with smaller lengthhas a relatively larger cross section area, i.e., the force Fm(t) definedin Eq. (7), is larger (with the same pressure input) which will resistthe buoy motion. On the contrary, in the case of L¼4 m, thecharacteristic dynamics will be changed in the opposite direction.We can follow the same way to analyze the problem.
Table 1 gives the minimum fluid stiffness for the various typesof cylinders and shows that stiffness due to fluid compressibilityis decreasing with L, i.e., the oscillating frequency varies with thecylinder length. Figs. 7c, 9c and 10a show these oscillations in the
time domain for different cylinder types. The oscillating frequen-cies of HFOs are consistent with the previous analysis. Comparedto the restoring coefficient S (for a sphere a radius of r¼5 m,SE7.9�105 N/m) of the spherical buoy, the fluid stiffness Kfluid
has a relative large value (Fig. 5). For this reason, the bodyoscillates at a much higher frequency during the time period Tblock
than otherwise. This characteristic can be easily seen in Figs. 7, 9and 10. Figs. 11 and 12 give the analysis of the power spectrumfor the high frequency motion with L¼1.5 and 4.0 m, respectively.The minimum frequencies omin for these sizes of the cylinderare presented in Table 1, and shown in Figs. 8, 11 and 12 as solidred dots.
4. Wear damage analysis for the piston ring and cylinder bore
From the analysis in the previous section, HFO with smallamplitudes (Figs. 7c, 9a and 10a) occurs due to the compressibilityof the oil in the cylinder. This type of motion can have an adverse

L. Yang et al. / Ocean Engineering 37 (2010) 1089–1102 1099
effect on the surface damage between the two contacting surfaces inthe piston and cylinder system. At the contact areas, the lubricatingoil will be squeezed out when the velocity is small or vanishing,resulting in surface-to-surface contact. Because a low amplitudemotion does not permit the contact area to be re-lubricated, seriouswear may occur for both the piston ring and cylinder bore. Thisprogressive damage and material loss can have economic conse-quences which involve not only the costs of replacement but also theexpenses involved in machine downtime and lost production. As aresult, the design of pump is a highly important task for this WECsystem, and it is necessary to make a detailed analysis of the wearunder HFOs.
1050 1100 1150t [s]
X [m
]
MotionCrossing level
1050 1100 1150
-2.5
-2
-1.5
-1
-0.5
0
0.5
1
1.5
2
2.5
-2.5
-2
-1.5
-1
-0.5
0
0.5
1
1.5
2
2.5
t [s]
X [m
]
MotionCrossing level
1195 1200 1205-0.2
-0.1
0
0.1
X [m
]
Fig. 13. A sample of the crossings for the p
Several wear mechanisms contribute to the wear progression ofa reciprocating hydraulic system. Different types of wear, such asadhesion, abrasion, corrosion, surface fatigue and impact wear,have been reported in the piston ring and cylinder bore system(Peterson and Winer, 1980). As reviewed by Becker and Ludema(1999), the three most important wear mechanisms mentionedover the years are corrosion, abrasion and adhesion. Corrosion iscommon when the components exposed to a variety of processfluids or other products that are chemically active. Abrasion resultsfrom the cutting and plowing action of hard particles. Adhesion isusually described as occurring when the oil film between the ringand the bore is so thin that surface contact occurs. Generally,
1200 1250
1200 1250
1210 1215 1220t [s]
MotionCrossing level
erformance shown in Fig. 7a, c and e.

-1.5 -1 -0.5 0 0.5 1 1.50
0.05
0.1
0.15
0.2
X [m]
Cro
ssin
g R
ate
[1/s
]
incompressible oilcompressible oil
Fig. 14. Plot of crossing rate of motion response along the cylinder bore for
Hs¼4.25 m, Tp¼9.5 s and L¼2.5 m. The analysis has been done for the time
interval between [500, 1500] s. The solid blue dots represent the WEC model with
incompressible oil and the solid red squares represent the WEC model with
compressible oil. (For interpretation of the references to colour in this figure
legend, the reader is referred to the web version of this article.)
-2 -1.5 -1 -0.5 0 0.5 1 1.5 20
0.2
0.4
0.6
0.8
1
1.2
1.4
1.6x 10⁻¹⁴
X [m]
Wea
r Rat
e [m
/s]
incompressible oilcompressible oil
Fig. 15. Plot of wear damage rate along the cylinder bore for Hs¼4.25 m, Tp¼9.5 s
and L¼2.5 m. The ring thickness tR is set as 3 mm and wear coefficient
K¼1�10�18 m2/N. The blue bars represent the case which neglects the fluid
compressibility while the red bars are the results obtained by considering the
compressible fluid. (For interpretation of the references to colour in this figure
legend, the reader is referred to the web version of this article.)
L. Yang et al. / Ocean Engineering 37 (2010) 1089–11021100
corrosion can be reduced by the choice of material for varioushydraulic fluids (Muller and Nau, 1998). Adhesion is commonduring the running-in period because of the surface roughness ofboth contact surfaces. Once running-in is complete, the systemwould attain a steady state and abrasive wear is generallyconsidered to be a dominant wear mechanism for the reciprocatinghydraulic system (Tung and Huang, 2004). Whatever the mainwear mechanisms are for a specific piston ring and cylinder boresystem, the total wear loss for both the ring and bore is the sumof the contributions from each mechanism that is observed.Detailed analysis of the piston ring and cylinder bore wear canbe seen from Yang and Moan (submitted for publication).
The most commonly used model for wear on sliding contactsurfaces states that the wear volume loss WeV is proportional tothe normal load N and the sliding distance s, according to
WeV ¼ kNs ð28Þ
where k is the wear coefficient. This model is often referred to asArchard’s wear law (Archard and Hirst, 1956). The wearcoefficient, k, is a function of the interacting materials, theirsurface topography, the lubricant and operating conditions. Forlubricated tribo-pairs (here are the piston ring and cylinder bore),the wear volume loss also depends on the lubrication regime andsurface roughness as described by the Stribeck curve, which isdefined by a dimensionless film thickness l (the ratio between theoil film thickness and the composite surface roughness). Assum-ing a pressure P(t) uniformly distributed along the interface witharea A, the total normal load N on the contact region is
NðtÞ ¼ PðtÞA ð29Þ
Combining Eqs. (28) and (29), the wear depth h can be written as
h¼ k PðtÞ s ð30Þ
For the cylinder bore, the sliding distance sb can be calculatedconsidering that during one ring crossing any segment of the boreis slid by a distance equal to the ring thickness, tR (Fig. 4). If weassume that there is a linear damage accrual rule, the total weardepth hb(X) of the cylinder bore at position X for a reciprocatingmotion during a time interval T with n(X) crossings can beexpressed as
hbðXÞ ¼XnðXÞi ¼ 1
kiðXÞPiðXÞtR ð31Þ
For a flat faced ring (Fig. 4), the contact pressure P(t) between thering and the bore can be approximated by using the sealedpressure Pcyl (Nikas, 2003). This sealed pressure is assumed to bethe larger of PA and PB. Therefore
PðtÞ � Pcyl ¼max PA, PB� �
ð32Þ
Since our system has only been defined on a conceptional level(the material, lubricant and operational conditions are unknown),we assume that the wear coefficient k is independent of time t.Eq. (31) can then be expressed as
hbðXÞ ¼ kðXÞtRnðXÞPðXÞ ð33Þ
where PðXÞ is the average pressure at piston position X.Eq. (33) shows that the cylinder bore wear depth is propor-
tional to the crossing times n(X). We again study the simulationresults obtained in Section 3. Using the buoy excursion X(t), whichneglects the HFO shown in Fig. 7a, a sample of the ring crossingsat the level of X¼�0.02 is given in Fig. 13a. Fig. 13b shows thecorresponding ring crossings at the same level for simulationresults including the HFO (Fig. 7c). Fig. 13c is a detailed plot of thecrossings in a time interval with HFOs. It is easy to find that thecrossing number n(�0.02) is much larger in Fig. 13b than inFig. 13a. Introducing the crossing rate k(X) which is defined as theratio of the crossing numbers n(X) to the corresponding time
interval T, Eq. (33) can be rewritten as
hbðXÞ ¼ kðXÞPðXÞkðXÞtRT ð34Þ
Therefore, the cylinder bore wear damage rate _hbðXÞ can beexpressed as
_hbðXÞ ¼hb Xð Þ
T¼ kðXÞPðXÞkðXÞtR ð35Þ
The values of k(X) along the cylinder bore are given in Fig. 14for the two cases; one neglects the fluid compressibility and onlyconsiders low frequency motion, the other includes the effect ofthe oil compressibility and the induced HFO. Generally speaking,the crossing rates along the cylinder bore are larger whenconsidering the fluid compressibility than with the assumptionof incompressible oil, but the difference is small far from thecylinder midpoint. On the contrary, a large difference is observedaround the midpoint of the cylinder (X¼0), which indicates thatmost of the HFOs occur in this region.

0
0.5
1
1.5
2
Cro
ssin
g R
ate
[1/s
]
L [m]1 1.5 2 2.5 3 3.5 41 2 3.5
5
6
7
8
9
10x 106
Mea
n P
ress
ure
[Pa]
Crossing RateMean Pressure
Fig. 17. Plot of zero-crossing rates of velocity response and mean pressure
between the piston ring and cylinder bore for fixed cylinder volume V and varying
cylinder half length L. The sea state parameters were Hs¼1.5 m and Tp¼9.5 s. The
effect of fluid compressibility is considered for different cylinder types.
0.75
1
1.25
Cro
ssin
g R
ate
[1/s
]
V [m3]0.08 0.12 0.16 0.20.12
6
7
8
9
10x 106
Mea
n P
ress
ure
[Pa]
Crossing RateMean Pressure
L. Yang et al. / Ocean Engineering 37 (2010) 1089–1102 1101
A ring with a thickness tR¼3 mm is used for case study. If thebore wear coefficient k(X) is assumed to be equal to 1�10�18 m2/N,the wear damage rate _hbðXÞ can be predicted by using Eq. (35).Fig. 15 gives the distribution wear damage rate for the two caseswith and without considering the fluid compressibility in the WECmodel. According to the results, the wear damage of the cylinderbore will be underestimated if we neglect the fluid compressibility.This effect reaches maximum when X¼�0.02 m. (The wear damagerate at this position is 1.58�10�14 m/s with fluid compressibilityincluded, while it is equal to 1.07�10�14 m/s with incompressiblefluid as shown in Fig. 15.) In practice, for the wear of cylinder bore,local wear damage is usually dominating. Cylinder repair is generallycarried out when the maximum wear of the internal surfaceapproaches a specific limit. To predict the position of the borewhere the maximum accumulated wear occurs is a critical issue.Fig. 15 shows that HFO induced by the fluid compressibility not onlyaffects the amount of wear damage but also the repair position.Fig. 16 gives the relative wear difference for the two cases. Thelargest difference occurs around the middle of the cylinder and canreach almost 50%. This increment could lead to a reduction in life ofthe cylinder bore. To sum up, HFO contributes significantly to thebore wear damage in this WEC system and it should therefore begiven thorough consideration.
Since the amplitudes of HFOs are usually very small (Figs. 7c, d,9a, c and 10a), it is difficult to catch all the oscillation cycles byusing discrete crossing levels. Additionally, as indicated byGiorgio et al. (2007), the severe wear usually occurs at or nearthe positions when the piston velocity is equal to 0. Hence, zero-crossing rate of the velocity is an important index for the borewear. In order to estimate the contributions of these HFOs to thewear damage, we consider the velocity response _X ðtÞ instead ofthe position X(t). At the turning points of X(t), we have
_X ðtÞ ¼ 0 ð36Þ
We can count the number of zero-crossings (the crossing levelis equal to 0) for the time series of the velocity. This zero-crossingnumber (we can also use a corresponding variable named zero-crossing rate) includes all the motion periods along the cylinderbore. The zero-crossing rates for different cylinder designs areshown in Fig. 17. The rates decrease with increase in cylinderlength. In addition, based on the simulation results of Falc~ao(2007) for a floating heaving buoy equipped with such a powertake-off, the maximum value of average power was found to occurfor a machinery force with a certain value Fm,opt in each sea state.
-2 -1.5 -1 -0.5 0 0.5 1 1.5 2-20
-10
0
10
20
30
40
50
X [m]
Wea
r Diff
eren
ce [%
]
Fig. 16. Plot of relative wear difference along the cylinder bore for Hs¼4.25 m,
Tp¼9.5 s and L¼2.5 m. Calculations are carried out for a same case as for Fig. 15.
Fig. 18. Plot of zero-crossing rates of velocity response and mean pressure
between the piston ring and cylinder bore for fixed cylinder half length L and
varying cylinder volume V. The sea state parameters were Hs¼1.5 m and Tp¼9.5 s.
The effect of fluid compressibility is considered for different cylinder types.
For a WEC system, the main function is to convert power. Fromthis point, we should choose the optimum force Fm,opt as the mainparameter for this system. Eq. (7) shows that Fm is related to thepiston area and pressure difference. For a constant value of Fm,opt,a larger piston area means a smaller pressure difference, i.e., asmaller PðXÞ in Eq. (34). Fig. 17 also gives the variation of PðXÞwithcylinder length L. As opposed to k, the mean pressure PðXÞ is anincreasing function of L. In order to find a minimum cylinder borewear damage, we need comprehensive consideration of all theparameters mentioned in Eq. (34), including the crossing rate kand average interface pressurePðXÞ. Alternatively, we can choosethe cylinder length first and then adjust the other variables of thecylinder, e.g. the cylinder volume V. The performances of WECsystem for different cylinder volumes with fixed L¼2.5 m aregiven by Fig. 18. We can follow the same path as we did for Fig. 17to analyze these obtained results. We do not elaborate this anyfurther here.

L. Yang et al. / Ocean Engineering 37 (2010) 1089–11021102
Similar to bore wear depth, ring wear depth can also beobtained from Eq. (30). The sliding distance of the ring can beobtained by
sring ¼
Zt9 _X ðtÞ9 dt ð37Þ
The ring wear depth is:
hring ¼ kPðtÞ
Zt9 _X ðtÞ9 dt ð38Þ
A comparison of Fig. 7b and d shows that the HFOs cause anincrease in the sliding distance, leading to increased wear as theresult. Combined with the risk of poor lubrication at turningpoints mentioned before, it is clear that HFOs should be a matterof concern also for the piston ring wear.
5. Conclusions
A dynamic model, with the assumptions listed at the end ofSection 2, has been presented for a heaving axisymmetric floatingbuoy, with a high-pressure hydraulic system for energy conversion. Inparticular, the compressibility of hydraulic fluid in the cylinder isincluded in the mathematic Wave Energy Converter (WEC) model.This hydraulic fluid acts likes a very stiff spring and, thereforeinfluences the dynamics of the buoy. This work presents the effect ofthis type of fluid stiffness for an asymmetric cylinder (aa1) indifferent designs of the same volume. The minimum naturalfrequencies caused by fluid stiffness are presented for the differentcylinder designs. The motion response of the floating buoy exposed toirregular waves is shown in time series where high frequencyoscillations (HFOs) are observed. From an analysis of the powerspectra, we can see that the main power of the HFOs resides beyondthe estimated minimum natural frequency omin, which is reasonablefor this system due to the variation of the piston position.
The wear model for piston ring and cylinder bore in the WECsystem developed in Yang and Moan (submitted for publication)based on Archard’s wear equation is applied to exemplify thecontribution of the HFOs to the wear by numerical simulation of theheaving buoy model under a sea state characterized by Hs¼4.25 mand Tp¼9.5 s. Numerical results show that HFO strongly affects thewear of the cylinder bore, especially at the domain around themidpoint of the cylinder in the longitudinal direction. Simulationresults combined with the analysis of Falc~ao (2007) indicate thatthere exists an optimum cylinder size which has minimum borewear damage. As for the cylinder bore, the piston ring wear will beaffected by the HFO. The HFOs can increase the sliding distance ofthe ring, which will lead to more ring wear. Although the incrementof the sliding distance is not large, the surface to surface contactunder this condition can also make a serious wear damage to thering. To sum up, not only the low frequency motion, but also thehigh-frequency one can cause the ring and bore wear. Therefore, oilcompressibility should be included in the mathematic model of thisWEC system for the purpose of wear prediction. Otherwise, the weardamage of the ring and cylinder will be underestimated, whichshould be avoided both because of safety and durability reasons.
Acknowledgements
The authors wish to acknowledge the support of the ResearchCouncil of Norway through the Centre for Ships and OceanStructures at the Norwegian University of Science and Technologyin Trondheim, Norway.
References
Archard, J.F., Hirst, W., 1956. The wear of metals under unlubricated conditions.Proceedings of the Royal Society of London, Series A, Mathematical andPhysical Science 236 (1206), 397–410.
Babarit, A., Duclos, G., Clement, A.H., 2004. Comparison of latching controlstrategies for a heaving wave energy device in random sea. Applied OceanResearch 26, 227–238.
Bjarte-Larsson, T., Falnes, J., 2006. Laboratory experiment on heaving body withhydraulic power take-off and latching control. Ocean Engineering 33, 847–877.
Becker, E.P., Ludema, K.C., 1999. A qualitative empirical model of cylinder borewear. Wear 225–229 (Part I), 387–404.
Borutzky, W., Barnard, B., Thoma, J., 2002. An orifice flow model for laminar andturbulent conditions. Simulation Modeling Practice and Theory 10 (3–4), 141–152.
Budal, K., Falnes, J., 1982. Wave power conversion by point absorbers: a Norwegianproject. International Journal of Ambient Energy 3 (2), 59–67.
Cummins, W., 1962. The impulse response function and ship motions. Schiff-stechnik 9 (1661), 101–109.
Egeland, O., Gravdahl, J.T., 2002. Modeling and simulation for automatic control.Marine Cybernetics.
Eidsmoen, H., 1995. On the theory and simulation of heaving-buoy wave-energyconverters with control. Ph.D. Thesis, NTH.
Evans, D.V., 1978. The oscillating water column wave energy device. Journal of theInstitute of Mathematics and its Applications 22, 423–433.
Evans, D.V., 1981. Maximum wave-power absorption under motion constraints.Applied Ocean Research 3, 200–203.
de O Falc~ao, A.F., 2007. Modelling and control of oscillating-body wave energyconverters with hydraulic power take-off and gas accumulator. OceanEngineering 34, 2021–2032.
de O Falc~ao, A.F., 2008. Phase control through load control of oscillating-body waveenergy converters with hydraulic PTO system. Ocean Engineering 35, 358–366.
Falnes, J., Budal, K., 1978. Wave-power conversion by point absorbers. NorwegianMaritime Research 6, 2–11.
Falnes, J., 2002. Ocean Waves and Oscillating Systems. Cambridge University Press,Cambridge.
Faltinsen, O.M., 1990. Sea Loads on Ships and Offshore Structures. CambridgeUniversity Press, Cambridge.
French, M.J., Bracewell, R., 1986. Heaving point absorbers reacting against aninternal mass. In: Evans, D.V, de, A.F, Falc~ao, O. (Eds.), Hydrodynamics ofOcean-wave Energy Utilization. IUTAM Symposium, Lisbon, Portugal (1985).Springer Verlag, Berlin, pp. 247–255.
Giorgio, M., Guida, M., Pulcini, G., 2007. A wear model for assessing the reliabilityof cylinder liners in marine diesel engines. IEEE Transactions on Reliability 56(1), 158–166.
Hals, J., Taghipour, R., Moan, T., 2007. Dynamics of a force compensated two-bodywave energy converter in heave with hydraulic power take-off subject tophase control. In: Proceedings of the Seventh European Wave and Tidal EnergyConference, Porto, Portugal.
Jelali, M., Kroll, A., 2003. Hydraulic Servo-systems: Modelling, Identification andControl. Springer, London, ISBN: 1-85233-692-7.
Karnopp, D.C., Margolis, D.L., Rosenberg, R.C., 2006. System Dynamics: Modellingand Simulation of Mechatronic Systems. John Wiley &Sons.
Lopes, M.F.P., Hals, J., Gomes, R.P.F., Moan, T., Gato, L.M.C., Falc~ao, A.F., de, O., 2009.Experimental and numerical investigation of non-predictive phase-control strategiesfor a point-absorbing wave energy converter. Ocean Engineering 36, 386–402.
Michel, W.H., 1999. Sea spectra revisited. Marine Technology and SNAME News 36(4), 211–227.
Muller, H.K., Nau, B.S., 1998. Fluid Sealing Technology: Principles and Applications.Marcel Dekker, New York.
Nikas, G.K., 2003. Elastohydrodynamics and mechanics of rectangular elastomericseals for reciprocating piston rods. Journal of Tribology 125 (1), 60–69.
Peterson, M.B., Winer, W.O., 1980. Wear Control Handbook. The American Societyof Mechanical Engineers, New York.
Pizer, D.J., 1993. Maximum wave-power absorption of point absorbers undermotion constraints. Applied Ocean Research 15 (4), 227–234.
Priest, M., Dowson, D., Taylor, C.M, 1999. Predictive wear modelling of lubricatedpiston rings in a diesel engine. Wear 231, 89–101.
Taghipour, R., Perez, T., Moan, T., 2008. Hybrid frequency time domain models fordynamic response analysis of marine structures. Ocean Engineering 35, 685–705.
Thoma, J., 1970. Modern Hydraulic Engineering. Trade and Technical Press, London.Ting, L.L., Mayer, J.E., 1974. Piston ring lubrication and cylinder bore wear analysis:
Part I-Theory. American Society of Mechanical Engineers, Journal of Lubrica-tion Technology 96, 305–314.
Tung, S., Huang, Y., 2004. Modeling of abrasive wear in a piston ring and enginecylinder bore system. Tribology Transactions 47, 17–22.
Vantorre, M., Banasiak, M., Verhoeven, R., 2004. Modelling of hydraulicperformance and wave energy extraction by a point absorber in heave.Applied Ocean Research 26, 61–72.
WAMIT, 2006. WAMIT User Manual. Version 6.3 /http://www.wamit.comS.Yang, L.M., Hals, J., Moan, T., 2009. A wear model for assessing the reliability of
wave energy converter in heave with hydraulic power take-off. In: Proceedingsof the Eighth European Wave and Tidal Energy Conference, Uppsala, Sweden.
Yang, L.M., Moan, T.. Analysis of wear in seals of a wave energy converter withhydraulic power take-off under random loads. Tribology Transactions,submitted for publication.