Analysis of acetic acid-induced whitening of high-grade squamous intraepithelial lesions
7
• .burnal of Biomedical Optics 6(4). 397-403 (October 2001) Analysis of acetic acid-induced whitening of high-grade &luamous intraepithelial lesions Brian W. Pogue Thayer S::hool of 81gi neeri ng Dartmouth College Hanover. New Hampshire Howard B. Kaufman Alex Zelenchuk Medispectra. Inc. Lexington. Massachusetts William Harper 3>lutions TeleComputing Hanover. New Hampshire Gregory C. Burke Aurora Optics, Inc. Lebanon, New Hampshire Eschel E Burke Thayer S::hool of 81gi neeri ng Dartmouth College Hanover. New Hampshire Diane M. Harper Departments of Community and Family Medicine Obstetrics and Gynecology Dartmouth Medical S::hool Hanover, New Hampshire 1 Introduction Abstract. Immature and dysplastic cervical squamous epithelium whitens after the application of acetic acid during a colpos::opic ex- amination. The whitening process occurs visually over several min- utes and subjectively discriminates between dysplastic and normal tissue. In this work, examples of the acetowhitening process are de- tailed in three ways: the color-imaged colposcopic appearance of the acetowhitening of high-grade cervical intraepithelial neoplasia (CIN 2/3), the kinetics of these reflectance patterns transformed to reduce noise in the signal, and a self-normalized green to red ratio measure- ment of the kinetics of these reflectance patterns. A total of six patients with biopsy confirmed CIN 2/3 were examined to obtain a set of timed images tracking the acetowhitening and the whitening-decay process over the course of 5-10 min. Regions of normal mature squa- mous epithelium within the same patients were also followed as an internal control. We determined that the temporal change over a 10 min time period in the ratio of green to red light intensities, taken from the respective color channels of the CCD, provides a reliable measure to clearly distinguish CIN 2/3 from normal cervical epithelium. This imaging and data normalization procedure may be applied to cervical lesions of different grades, to determine if a quantitative estimate pro- vides predictive value during the colposcopic diagnosis. © 2001 fbciely ofFf)oto-Oplicallnstrurnentation £hgineers. [DOl : 10.1117/1 .1412850J Keywords: cervical ; neoplasia; reflectance; acetic acid; scatter; colposcopy. Paper .80-01001 received Jm. 15. 2001; revised manuscript received Apr. 23. 2001 ; accepted for publication May 3, 2001. Colposcopy is the first diagnostic test for invasive cervical cancer in women whose screening Pap test is abnormal. The exam is performed with high magnification, a bright light source, and acetic acid. Cervical patterns are interpreted by clinically standardized criteria. The co[poscopic examination determines the location of the most severe dysplastic region for biopsy placement. I • 2 A fundamental part of the colpo- scopic exam is the use of acetic acid, which when applied to the cervix induces transient whitening changes in the epithe- li al tissues. The spatial and temporal changes of acetowhiten- in g are the major visual diagnostic indicators in the examina- tion, and are interpreted by the trained colposcopist based upon prior experience with the procedure. While this exam is an important diagnostic method, it suffers from being a sub- jective test because the kinetics used to diagnose cervical le- sions are learned through experience 2 and are subject to varia- tion between physiciansY Mitchell et al. 5 reported that the sensitivity and specificity of the colposcopic diagnosis of high-grade lesions from all others was 86% and 69%, respec- tively, based upon meta-analysis survey of published data. The accuracy of colposcopy is a function of physician train- ing, suggesting that interphysician variation in diagnosis will be present. There is increasing evidence that the colposcopic method would benefit from semiautomated algorithms which provide the physician with numeric scores for staging cervical lesions. 6 ,7 The opportunity to provide more objective assessment methods for cervical cancer diagnosis has motivated research into alternative diagnostic measurements such as fluorescence ,8 - 12 reflectance probes, near-infrared hemoglobin probes, 13 and image processing algorithms,1 4. 15 which are more conducive to quantitative decision making criteria. The ideal goal would be to find numeric measures which can be quantitatively correlated to lesion stage, and thereby have higher predictive value. A logical step in this development is to identify measurements that are derived from the standard colposcopic examination to be used as a physician 's aid in cervical diagnosis. While there has been some study of the acetowhitening phenomenon in high-grade lesions,16-18 there is limited data available in published form to develop metrics for classification. In this study, we examine the process of acetowhitening measured by a standard digital colposcope and outline methods to quantify the kinetics of acetowhitening in high-grade squamous intraepithelial neoplasia. The temporal kinetic of the acetowhitening process as measured by the reflected light maximizes within the first 1- 2 min and decays over several minutes thereafter, allowing a subjective interpretation by the physician in real time. Digital colposcopy provides individual electronic pictures of the cer- Address all correspondence to Brian W. Pogue. Tel : 603-646-3861; Fax: 603- 646-3856; Email : pogue@:lartmouth.edu 1083-3668/2001/$15.00 © 2001 S'lE .burnal of Biomedical Optics ' October 2001 • Vol. 6 No.4 397
-
Upload
independent -
Category
Documents
-
view
1 -
download
0
Transcript of Analysis of acetic acid-induced whitening of high-grade squamous intraepithelial lesions
•
.burnal of Biomedical Optics 6(4). 397-403 (October 2001)
Analysis of acetic acid-induced whitening of high-grade &luamous intraepithelial lesions
Brian W. Pogue Thayer S::hool of 81gi neeri ng Dartmouth College Hanover. New Hampshire
Howard B. Kaufman Alex Zelenchuk Medispectra. Inc. Lexington. Massachusetts
William Harper 3>lutions TeleComputing Hanover. New Hampshire
Gregory C. Burke Aurora Optics, Inc. Lebanon, New Hampshire
Eschel E Burke Thayer S::hool of 81gi neeri ng Dartmouth College Hanover. New Hampshire
Diane M. Harper Departments of Community and Family Medicine Obstetrics and Gynecology Dartmouth Medical S::hool Hanover, New Hampshire
1 Introduction
Abstract. Immature and dysplastic cervical squamous epithelium whitens after the application of acetic acid during a colpos::opic examination. The whitening process occurs visually over several minutes and subjectively discriminates between dysplastic and normal tissue. In this work, examples of the acetowhitening process are detailed in three ways: the color-imaged colposcopic appearance of the acetowhitening of high-grade cervical intraepithelial neoplasia (CIN 2/3), the kinetics of these reflectance patterns transformed to reduce noise in the signal, and a self-normalized green to red ratio measurement of the kinetics of these reflectance patterns. A total of six patients with biopsy confirmed CIN 2/3 were examined to obtain a set of timed images tracking the acetowhitening and the whitening-decay process over the course of 5-10 min. Regions of normal mature squamous epithelium within the same patients were also followed as an internal control. We determined that the temporal change over a 10 min time period in the ratio of green to red light intensities, taken from the respective color channels of the CCD, provides a reliable measure to clearly distinguish CIN 2/3 from normal cervical epithelium. This imaging and data normalization procedure may be applied to cervical lesions of different grades, to determine if a quantitative estimate provides predictive value during the colposcopic diagnosis. © 2001 fbciely
ofFf)oto-Oplicallnstrurnentation £hgineers. [DOl : 10.1117/1 .1412850J
Keywords: cervical ; neoplasia; reflectance; acetic acid; scatter; colposcopy.
Paper .80-01001 received Jm. 15. 2001; revised manuscript received Apr. 23. 2001 ; accepted for publication May 3, 2001.
Colposcopy is the first diagnostic test for invasive cervical cancer in women whose screening Pap test is abnormal. The exam is performed with high magnification, a bright light source, and acetic acid. Cervical patterns are interpreted by clinically standardized criteria. The co[poscopic examination determines the location of the most severe dysplastic region for biopsy placement. I
•2 A fundamental part of the colpo
scopic exam is the use of acetic acid, which when applied to the cervix induces transient whitening changes in the epithelial tissues. The spatial and temporal changes of acetowhitening are the major visual diagnostic indicators in the examination, and are interpreted by the trained colposcopist based upon prior experience with the procedure. While this exam is an important diagnostic method, it suffers from being a subjective test because the kinetics used to diagnose cervical lesions are learned through experience2 and are subject to variation between physiciansY Mitchell et al.5 reported that the sensitivity and specificity of the colposcopic diagnosis of high-grade lesions from all others was 86% and 69%, respectively, based upon meta-analysis survey of published data. The accuracy of colposcopy is a function of physician training, suggesting that interphysician variation in diagnosis will be present. There is increasing evidence that the colposcopic
method would benefit from semiautomated algorithms which provide the physician with numeric scores for staging cervical lesions.6,7
The opportunity to provide more objective assessment methods for cervical cancer diagnosis has motivated research into alternative diagnostic measurements such as fluorescence ,8- 12 reflectance probes, near-infrared hemoglobin probes, 13 and image processing algorithms,14.15 which are more conducive to quantitative decision making criteria. The ideal goal would be to find numeric measures which can be quantitatively correlated to lesion stage, and thereby have higher predictive value. A logical step in this development is to identify measurements that are derived from the standard colposcopic examination to be used as a physician's aid in cervical diagnosis. While there has been some study of the acetowhitening phenomenon in high-grade lesions,16- 18 there is limited data available in published form to develop metrics for classification. In this study, we examine the process of acetowhitening measured by a standard digital colposcope and outline methods to quantify the kinetics of acetowhitening in high-grade squamous intraepithelial neoplasia.
The temporal kinetic of the acetowhitening process as measured by the reflected light maximizes within the first 1- 2 min and decays over several minutes thereafter, allowing a subjective interpretation by the physician in real time. Digital colposcopy provides individual electronic pictures of the cer-
Address all correspondence to Brian W. Pogue. Tel : 603-646-3861; Fax: 603-646-3856; Email : pogue@:lartmouth.edu 1083-3668/2001/$15.00 © 2001 S'lE
.burnal of Biomedical Optics ' October 2001 • Vol. 6 No.4 397
•
Pogueet al.
vix, usually taken at maximal acetowhitening, that have been used for patient visit documentation .19.20 Balas et al. have completed pilot investigations to monitor acetic acid transients, and they present case examples where the tissue white light reflectance increases by over a factor of 2 for CIN 3 lesions.16- 18 By taking a series of images rapidly during the routine examination there is the opportunity to analyze the spatial and temporal changes with automated algorithms. The technology to achieve this image stream is simple, yet the image processing to accurately and quantitatively assess changes within the images is more challenging. In earlier work ls it was shown that there was likely more information about the dysplastic tissues in the blue-green region of the reflected spectrum. This was thought to be due to the fact that the tissue whitening process is a product of the relative overall increase in reflectance which occurs over all optical wavelengths, and diminishes the blue-green absorption of the blood which is present within the tissue. In this study this change in reflected spectrum is examined as a function of the time after application of acetic acid, allowing investigation of the spectral-temporal parameters which may be exploited for quantitying lesion stage. It is likely that some weighted combination of spatial, spectral, and temporal measurements will be needed to robustly characterize lesion stage, based upon the visual metrics which are routinely applied in colposcopy examination.
In this study we present the data from a series of patients with biopsy confirmed CIN 2/3 and those with normal mature epithelium. The system characteristics are examined, methods to acquire numerical data from the images are shown and some data normalization procedures are presented.
2 Materials and Methods 2.1 Patient Exami nation All patients recruited into the study had index Pap smears which indicated squamous intraepithelial lesions or atypical squamous cells of undetermined significance. A total of II patients had biopsy confirmed CIN 2/3, but five of those patient data sets were eliminated due to lack of visualization of the diseased region or due to incomplete data acquisition. The data sets from the six remaining patients with CIN 2/3 were used for this study. All patients underwent a standard colposcopic examination with automated time sequenced digital image capture. A timed image capture process was initiated before applying acetic acid to the cervix of each patient. Following standard procedures for colposcopic examination a solution of 5% acetic acid was applied to the cervical tissue surface for approximately 15- 30 s. Each patient was followed every 20 s for up to 10 min total to allow capture of the decay from whitening. The physician -DMH! electronically marked the biopsy sites immediately after the exam, and denoted them on the printed color images at a later time. Biopsies were all processed according to standard clinical pathology procedures. Regions within each series of images were correlated to the gold standard histologic biopsy results. This allowed a prospective analysis of the tissue regions of interest -ROI! , based upon the sites of biopsy. The Comm ittee for the Protection of Human Subjects at Dartmouth College approved this study.
398 .burnal of Biomedical Optics ' October 2001 • Vol. 6 No. 4
2.2 Colpo~opy Imaging ~stem The colposcope was a standard Carl Zeiss system, which was fitted with digital imaging capabilities, with aDage 3CCD color video camera, and standard Zeiss optics. The exposure time and sequencing of the images were automated by a custom written software package .-..solutions TeleComputing, Hanover, NH!. The light was delivered from a standard arc lamp assembly built into the scope. The light source used for standard colposcopy exams is alSO W tungsten lamp, but the light source used for image capturing here was a 300 W xenon arc lamp which provided greater intensity to increase the reflected signal, thereby providing higher signal to noise ratio --Aurora Optics, Inc., Hanover, NH!.
The imaging program acquired approximately one image every 20 s for up to 10 continuous minutes generating approximately 30 white light images. The images were saved as loss less JPEG format within the same program. The typical image noise level and spatial variation of the imaging field were determined through the use of a 10% reflectance standard, which approximated the reflectivity of cervical tissue.
2.3 Image Analysis A separate person -A.Z.! who was given the images showing biopsy location and results completed all data analysis. A custom written image analysis program --MediAnal, Solutions TeleComputing, Hanover, NH! was used to process the data from each image sequence in a semiautomated manner. The locations of a region of interest --ROI! were sequentially placed on successive images, and could be translated under user guidance on any given image to correct for small patient movements. For each ROI corresponding to a biopsy, five small regions, each 5 pixels by 5 pixels, were sampled and then averaged together to reduce the variance in the temporal sequence of data. The MediAnal processing algorithm calculated the luminosity of the white light, as well as the red, green, and blue channels. The standard deviations over the regions were also calculated.
Patient movement, detector movement or source variation can cause intensity variations, making data normalization necessary to compare different patients ' sets of images. Since it is known that the reflectance change from tissue is dominant in the blue-green region,15 it is possible to separate out the color channels from the CCD measurement and ratio these channels. In our earlier study,15 we documented that most epithelial structures which were indicative of neoplasia were strongest in the blue-green spectral regions and that the red reflectance contained the least structure. Analysis of our earlier data suggested that the blue channel would provide optimal contrast between tissues that whiten and those that do not, however this issue is also convolved with which channels provide the best signal to noise ratio. Thus, we examined both blue to red ratio and green to red ratio as a method to selfnormalize the data.
3 Results 3.1 Background Noise and Linearity Testing Detected background noise with the room lights and imaging light source off were typically 12-13 counts -6 2 SO! and a maximal spatial variation of four counts. When a 10% reflec-

"
tive target was used as the test object, a signal of 100 counts -6 4 SD! was measured. The signal varied spatially, as with all imaging systems of this type, with a 35% maximal decrease laterally from the center to the edge, and a 20% decrease vertically /Tom center to edge. Longitudinal translation of the target towards or away from the focus of the imaging system resulted in a 0.3% per mm change in detected intensity. Examining the individual data from the three color channels was the subject of part of this study, and while there is considerable interpatient variation in the remitted light, in general the standard deviations of the three channels was 4.8%, 3.8%, and 6.3%, for red, green, and blue, respectively, for a nonmoving target.
3.2 Patient Motion and Correction Specific tissue sites were marked on each image for all six patients to determine the effects of patient movement. While on average the patient motion was typically less than I mm, maximal average changes in site position for these patients were 4.5 mm. In all image sequences analyzed, the ROI positions were validated manually to be in the same location using a semiautomated procedure that was built into the software.
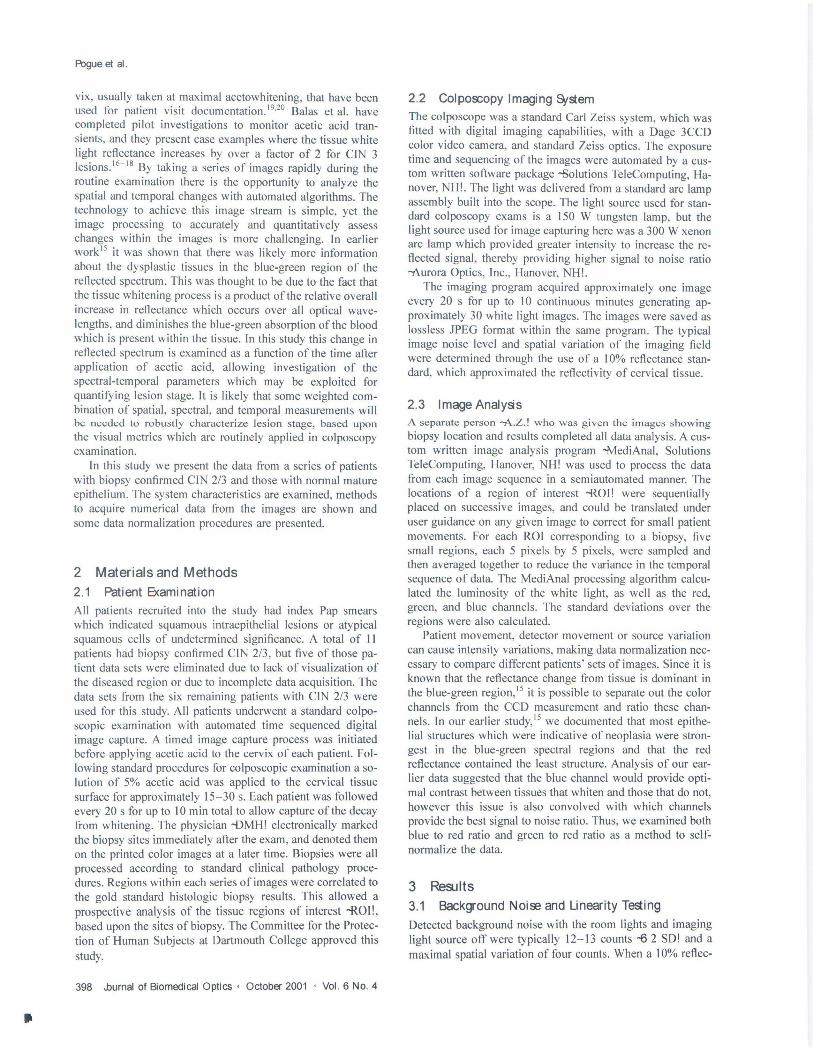
3.2 Patient Data The data from patients with biopsy confirmed CIN 2/3 were included in this study. The quality of a typical set of electronic images and the typical acetowhitening levels observed in a cervix with significant areas ofCIN 2/3 is illustrated in Figure I. In this case, much of the transformation zone around the cervical os contains CIN 2/3. In the first displayed image taken immediately after the application of acetic acid, pooling of the acetic acid in the bottom of the image caused the lower half of the cervix to be blurred. In the second image, taken 20 s later, the squamous epithelial lesion has whitened significantly, and continues to whiten for the next two images. The final two images illustrate the decay of acetowhitening which occurs on the timescale of several minutes, ultimately decaying back to background levels in approximately 10 min.
The data are measured from six women with two epithelial types : CIN 2/3 and mature squamous epithelium. For each tissue type, CIN 2/3 and the mature squamous epithelium, the data were normalized to have an average value of 1.0. The intensity of the CIN 2/3 region doubles during the first minute after acetic acid application. In contrast, the region of mature squamous epithelium increases maximally by 5% over the entire time sequence of 10 min.
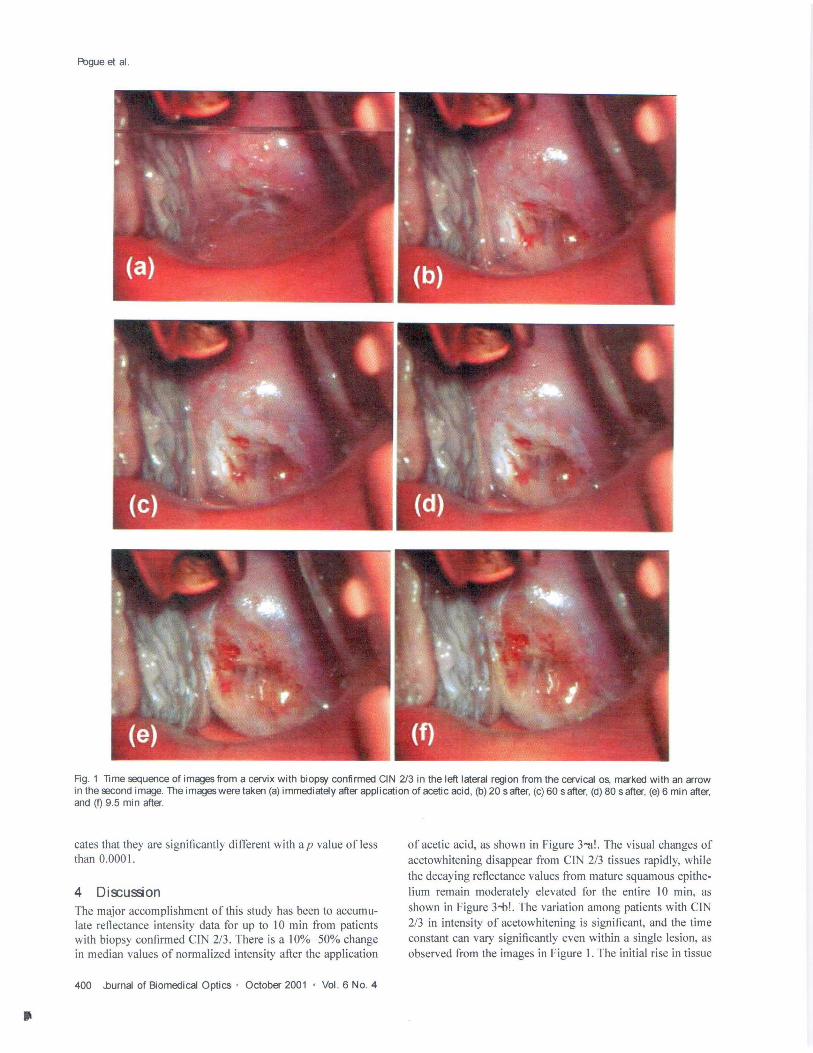
3.3 Normalization vs Ratio Data We examined both blue to red ratio, green to red ratio, and green to blue ratio as a method to self-normalize the data within an individual temporal stream of data and remove intensity shifts which may be more dependent upon light collection efficiency rather than due to intrinsic tissue characteristics. The same ROI data were used in Figure 2--a! , and the resulting ratio data are shown in Figures 2-b! - hi! , for both the CIN 2/3 and mature epithelium case. These ratios appear to reduce some of the noise in the raw intensity data, which presumably comes from patient movements during the exam. While the graph in -h! appears to have the greatest contrast in
Analysis of Acetic Acid-Induced Whitening ...
CIN 2/3 signal between peak and background, it suffers /Tom higher noise than the data in --c! , where the green to red ratio was used. This is most obvious in the mature epithelium data where the scatter is significantly reduced in the ratio values --c! as compared to the absolute values -b!.
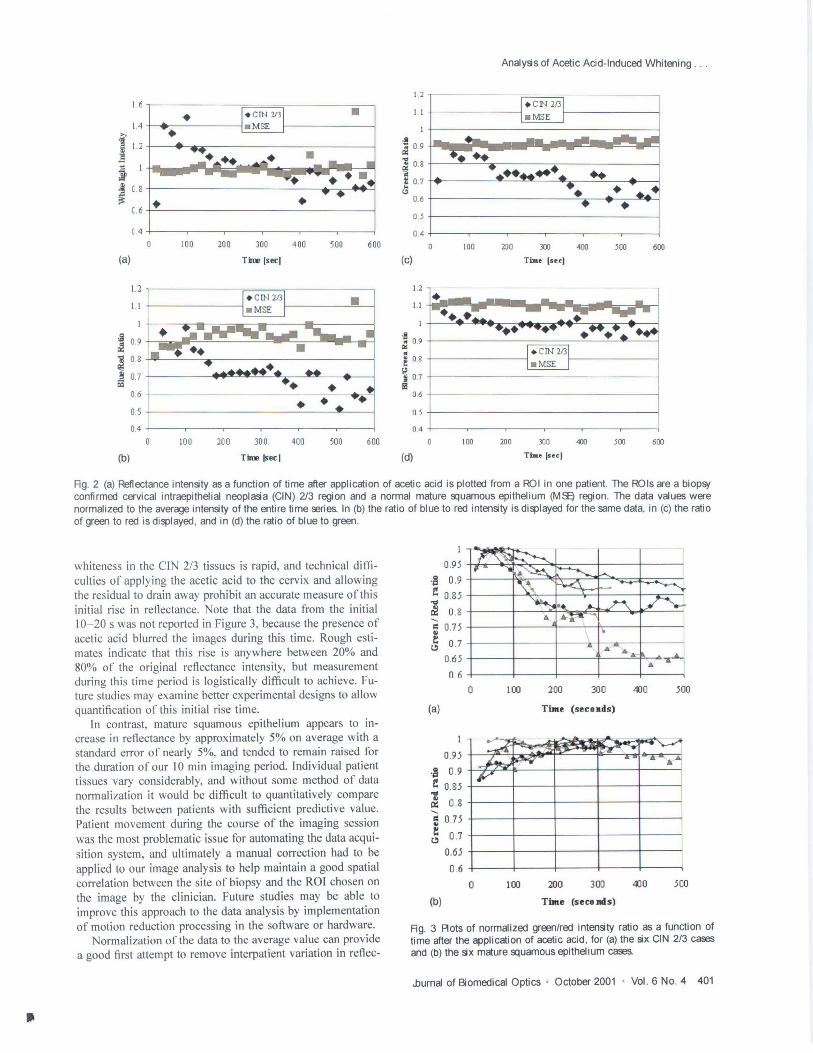
The data /Tom the six patients with CIN 2/3 and the six patients with normal mature epithelium were plotted with the green to red ratio, and the traces were normalized such that the maximal value was unity for each temporal data set. These data are plotted in Figure 3. The data were further processed to average the intensity for each 100 s interval, which simply provides a time-averaged smoothing to the data, and reduces any high frequency oscillations which are likely due to patient movement. These averaged data are plotted in Figure 4. Using this data set, the curves of CIN 2/3 and normal mature squamous epithelium are significantly different in shape, and all time-paired points for normal and CIN 213 tissue plotted in Figure 4 are statistically different from each other (P , 0.05) based upon a students t test.
3.4 Data Reduction In order to provide a single number from the temporal sequence observed from each patient, the slope of the reflected intensity versus time was examined as a predictive variable. From the data in Figures I through 3, it can be seen that CIN 2/3 regions are characterized by a rapid increase in reflectance within the first 60 s, followed by a large decrease. In most cases, the initial data before and immediately following the application of acetic acid could not be captured here due to practical problems of the physicians procedure blocking the view of the camera to the cervix. Nonetheless, the reflectance data at times beyond 20 s after the application of acetic acid was readily captured, and the transient behavior was distinctly different for normal tissues. In contrast to the CIN regions, the mature epithelium showed a moderate increase continuing for up to 300 s, followed by an almost constant reflectance over the time of acquisition here. To quantitatively compare these observations, the slopes of intensity versus time were calculated for each patient sequence shown in Figure 3. The time sequence was dichotomized to before 200 sand 200 or more seconds. The slopes are plotted against one another on parametric graphs in Figure 5--a!. This plot provides separation of the two tissue types into the upper right quadrant for normal tissue and lower right quadrant for ClN 2/3.
Another method to separate the two tissues is to simply compare the time averaged intensities which are displayed in Figure 4. An illustration of this is shown in Figure 5-b! where the average intensity in the first 100 s is plotted against the average intensity of the values between 200 and 300 s. This method of categorizing the data provides even clearer separation than the slope method for these two tissue types. The normal mature squamous epithelium data appear along the horizontal axis and the ClN 2/3 data along the vertical axis. The ratio of the long time data -z00-300 s! relative to the short time data -t 00 s! was calculated for these points, and provides a statistically significant method to separate the data which is independent of any data normalization. In this data set, the mature squamous epithelial tissue regions have an average ratio of 1.046 0.04, and the CIN 2/3 regions have a value of 0.856 0.06. A students t test of these data sets indi-
..burnal of Biomedical Optics ' October 2001 • Vol. 6 No.4 399
•
Pogue et al.
Rg. 1 lime sequence of images from a cervix with biopsy confirmed CIN 2/3 in the left lateral region from the cervical os, marked with an arrow in the second image. The images were taken (a) immediately after application of acetic acid, (b) 20 safter, (c) 60 safter, (d) 80 safter, (e) 6 min after, and (I) 9.5 min after.
cates that they are significantly different with ap value ofless than 0.0001.
4 Di&:ussion The major accomplishment of this study has been to accumulate reflectance intensity data for up to 10 min from patients with biopsy confirmed CIN 2/3. There is a 10%- 50% change in median values of normalized intensity after the application
400 ..burnal of Biomedical Optics ' October 2001 ' Vol. 6 NO.4
of acetic acid, as shown in Figure 3"!lL The visual changes of acetowhitening disappear from CIN 2/3 tissues rapidly, while the decaying reflectance values from mature squamous epithelium remain moderately elevated for the entire 10 min, as shown in Figure 3-bL The variation among patients with CIN 2/3 in intensity of acetowhitening is significant, and the time constant can vary significantly even within a single lesion, as observed from the images in Figure 1. The initial rise in tissue
•
1. 6
1.4
1' 1.1 i ~ C8
c.6
(.4
(a)
1.2
11
il 09 &! ~ 0 8
1! 0.7 ~
0 6
0.5
04
(b)
• •
.. 0 100
100
200
200
300
TIn! Isecl
300
Time Isecl
400
• 400
•
500 600
500 600
Analysis of Acetic Acid-Induced Whitening . . .
1.2
1.1
.8 ~ 0 9
~ 0.8
t 0 .7 t.'>
(c)
0 .6
0 .5
0.4
100 200 3CO
Tim. [sec)
400 500 600
1.2 ,------ ---- - ----------, - ..... I'" tIIf'~ u ri! _______ I
.! ~ 09
1 '" '". . I f 8 I_ . .,u~ I ~ 0.7 Ii!
0.6 t-I --------------1 0.5 +I------------------.J
0.4 +I --~--__._--_r_--,__-___,r--_l
100
(d)
200 300
Time [sec)
400 500 600
Rg. 2 (a) Reflectance intensity as a function of time after application of acetic acid is plotted from a ROI in one patient. The ROls are a biopsy confirmed cervical intraepithelial neoplasia (CIN) 2/3 region and a normal mature 9:1uamous epithelium (MSO) region. The data values were normalized to the average intensity of the entire time reries. In (b) the ratio of blue to red intensity is displayed for the same data, in (c) the ratio of green to red is displayed , and in (d) the ratio of blue to green.
whiteness in the CIN 2/3 tissues is rapid, and technical difficulties of applying the acetic acid to the cervix and allowing the residual to drain away prohibit an accurate measure of this initial rise in reflectance. Note that the data from the initial 10- 20 s was not reported in Figure 3, because the presence of acetic acid blurred the images during this time. Rough estimates indicate that this rise is anywhere between 20% and 80% of the original reflectance intensity, but measurement during this time period is logistically difficult to achieve. Future studies may examine better experimental designs to allow quantification of this initial rise time.
In contrast, mature squamous epithelium appears to increase in reflectance by approximately 5% on average with a standard error of nearly 5%, and tended to remain raised for the duration of our 10 min imaging period. Individual patient tissues vary considerably, and without some method of data normalization it would be difficult to quantitatively compare the results between patients with sufficient predictive value. Patient movement during the course of the imaging session was the most problematic issue for automating the data acquisition system, and ultimately a manual correction had to be applied to our image analysis to help maintain a good spatial correlation between the site of biopsy and the ROl chosen on the image by the clinician. Future studies may be able to improve this approach to the data analysis by implementation of motion reduction processing in the software or hardware.
Normalization of the data to the average value can provide a good first attempt to remove interpatient variation in reflec-
1
0.95
~ 0 .9
~ 0.85
"" &! 0 .8 "-~ 0.75 !: 0 .7 ~
0.65
0 .6
(a)
0.95
.~ 0 .9
~ 0.85
"" &l 0 .8 "-~ 0.75 z: ~ 0 .7
(b)
0.65
0 .6
0
o
... .. ...
100 200 300 400 500
TiJne (secoads)
I
I I I
100 200 300 400 500
TiJne (seco nds)
Rg. 3 Aots of normalized green/red intensity ratio as a function of time after the application of acetic acid, for (a) the six CIN 2/3 cases and (b) the six mature 9:1uamous epithelium cases.
.burna! of Biomedical Optics ' October 2001 • Vol. 6 No. 4 401

•
Fl:Jgue et al.
'il 1 0.95
8. s 09 ~!J . 't § 0.85
~1i ~ ~ o.s ..; '" ~ 0.75
0.7
~ -
~ L -l. , ~ ~ l--NOrmai
--HSD- I 1 r--
I lOa 200 300 400 500 60 )
Tome ale- applyOlg acetic acid (secoMS)
Rg. 4 Ratio of green to red light reflectance is shown using all data from patients in the previous figure averaged together. Where the pOints are averaged over each 100 s interval to provide the overall trend with a smoothing of the data. The error bars represent the standard error between patients for these averaged data points.
tance patterns. The intensity ratio of green to red light provides the best tradeoff between signal to noise and contrast, as a way to normalize the transient data within each picture in the time sequence. Normalizing the green by the red light preserves kinetics in reflected signal, indicating that the reflected light has a spectral change. While comparing initial
onool • • i ~ -0 .0001 A
i i ·0 .0003
,a ~ .
1! 1 ·00005
.§ I •
• • • • ••
• -0 .0007 +I--~--~-~--~--
-0 .0015 -0.0010 -0.0005 0 .0000 0.0005 0.0010
(a) Green/Red otio .Iope (time < 201 .ec)
1.0000
¥ <> <> •• '"'0.9000 ~ <> • • .. • ... • I • ii 0.8000 • • E ,g • :: 1: 0.7000
t • c.'; 0.6000 _
O_6()OO 0.7000 0.8000 0.9000 1.0000
(b) GrecnJRed raUa (Uroe < 1 .. u c)
Rg. 5 Two methods to separate the data are shown with (a) illustrating the calculated slopes of signal vs time using the ratio of green to red intensities separated into early times (x axis) and later times (y axis). The second graph (b) uses simple average intensity values for early (x axis) and later times (y axis). Each point on these graphs represents one patients ROI processed over the time of examination.
402 .burnal of Biomedical Optics ' October 2001 • Vol. 6 No.4
and final slopes can provide a good method for tissue classification, using the simpler time-averaged intensities appears to be a more robust method. We suggest that taking the ratio of short to longer time points for this green to red ratio signal provides an accurate way to separate out different tissue types. In this study, the ratio of the green/red reflectance signal at 200-300 s relative to 100 s provides a statistically accurate method to separate CIN 2/3 from mature squamous epithelia.
It is important to note that the reflectance change is thought to result from index of refraction changes in the cell nucleus.21.22 It is known that this subtle change in cellular organelles can be characterized by using the full spectrum of white light and fitting the spectrum to predictions from Mie scattering theory.23 A more detailed analysis of the spectral features of this acetowhitening may reveal discriminatory features such as those used by Backman et al. 24 to classity dysplastic versus normal tissues in the esophagus, colon, bladder, and oral cavity.
Ultimately a classification algorithm will have to make use of all the pertinent measures that colposcopy physicians currently use in their analysis, including morphologic feature detection as a function of time. In our previous studi S we illustrated that the Euler number provided a good metric for classitying CrN 2/3 tissues, and it is likely that by examination of this measure in the temporal sequence improved classification will result. Combination of morphological detection algorithms together with these temporal change algorithms are needed to provide measures of as many pertinent colposcopy parameters as is possible from this type of digital information. Future studies in this direction are needed to provide semi-automated algorithms for staging cervical lesions including low-grade intraepithelial lesions --LSILICIN \/HPV! , and metaplasia. This comparison is ongoing at present and will be the subject of a future study .
5 Conclusions In conclusion, this study presents the time sequence data of CIN 2/3 and normal mature squamous epithelium acetowhitening. By using the ratio of green to red light from the color images of the cervix, a self-normalized data set can be developed which minimizes artifacts due to patient motion and reflected intensity fluctuation. The increase and resulting decay in reflected intensity can be 50% in this normalized green to red ratio for CIN 2/3 on average. The increase in reflected intensity in normal mature epithelium is near 5% on average. Comparing the normalized green to red ratio where the data are time averaged over 100 s intervals provided a robust method to distinguish mature squamous epithelium from CrN 2/3 in this data set. This report is a feasibility study which may provide a method to separate cervical lesion regions from normal regions based upon relatively low-technology tools which can be used in a standard colposcopic imaging session.
Acknowledgments
The funding for this work came from Medispectra, Inc. --Lexington, MA!, the Robert Wood Johnson Foundation -n.M.H.!, the Norris Cotton Cancer Center Institutional Grants Program
•
funded through the American Cancer Society --8. w.P. , D.M.H.! , and the National Cancer Institute ROI CA 78734 --8. W.P. , E.E.B.!.
References R. Reid, " Biology and colposcopic features of human papillomavirus-associated cervical disease," Obstet. Gynecol. Clin. NorthAm. 20-l! , 123- 151 -I995!.
2. D. G. Ferris et a!. , " Colposcopy quality control: Establishing colposcopy criterion standards for the NC I A LTS trial ," J. Lower Gen. Tract. Dis. 2-4! , 195- 203 -I998!.
3. M. Skehan, W P. Soutter, K. Lim, T. Krausz, and J. Pryse-Davies, " Reliability of colposcopy and directed punch biopsy," Br. J. Obstet. Gynaecol. 97, 811-816 -I990!.
4. E. 1. Buxton, D. M. Luesley, M. I. Shafi , and M. Rollason, "Col poscopically directed punch biopsy: A potentially misleading investigation," Br. J. Obstet. Gynaecol. 98, 1273-1276 -I991! .
5. M. F. Mitchell , D. Schottenfeld, G. Tortolero-Luna, S. B. Cantor, R. Richards-Kortum, "Colposcopy for the diagnosis of squamous intraepithelial lesions: A meta-analysis," Obstel. Gynecol. (N. Y.) 91-4! , 626- 631 -I 998!.
6. W E. Crisp, B. L. Craine, and E. A. Craine, " The cbmputerized digital imaging colposcope: Future directions," Am. J. Obstet. Gyneco!. 162-6! , 1491 -1497 -I 990!.
7. A. Schneider and D. M. Zahm, " New adjunctive methods for cervical cancer screening," Obstet. Gynecol. C/in. North Am. 23-3! , 657-673 -I 996!.
8. R. Richards-Kortum et aI. , " In vivo fluorescence spectroscopy : Potential for noninvasive, automated diagnosis of cervical intraepithelial neoplasia and use as a surrogate endpoint biomarker," J. Cell. Biochem. 19, 111-119 -I994!.
9. L. Burke, J. Niloff, M. Kobelin, G. Abu-Jawdeh, A. Zelenchuk, and M. Modell , " Use of autofluorescence of cells to evaluate cervical neoplasia," J. Gyn. Tech. 2-4! , 187- 190 -I 996!.
10. A. Zelenchuk, M. Modell , L. Burke, 1. Niloff, X. Karlinskiy, Y. Resnichenko, and N. Shestopal, " Remote sensing as a method of cervical diagnosis," Proc. SPIE 3261 , 260- 269 -I 998!.
II. M. F. Mitchell , S. B. Cantor, N. Ramanujam, G. Tortolero-Luna, and R. Richards-Kortum, " Fluorescence spectroscopy for diagnosis of squamous intraepithelial lesions of the cervix," Obstet. Gyneco!. (N.Y.) 93-3! , 462-470 -I999!.
12. L. Burke, M. Modell , 1. Niloff, M. Kobelin, G. Abu-Jawdeh, and A. Zelenchuk, " Identification of squamous intraepithelial lesions: Fluorescence of cervical tissue during colposcopy," J. Lower Tract Dis. 3-3! , 159- 162 -I999! .
13. R. Hornung, T. H. Pham, K. A. Keefe, M. W Berns, Y. Tadir, and B.
Analysis of Acetic Acid-Induced Whitening ...
J. Tromberg, "Quantitative near-infrared spectroscopy of cervical dysplasia in vivo," Hum. Reprod. 14-11! , 2908-2916 -I999!.
14. F. W Abdul-Karim, Y. S. Fu, J. W Reagan, and W B. Wentz, " Morphometric study of intraepithelial neoplasia of the uterine cervix," Obstet. Gynecol. (N. Y.) 60~! , 210- 214 -I 982!.
15. B. W Pogue, M. A. Mycek, and D. M. Harper, " [mage analysis for discrimination of cervical neoplasia," J. Biomed. Opt. 5-1! , 72-82 ~OOO!,
16. T. Sakuma, T. Hasegawa, F. Tsutsui , and S. Kurihara, " Quantitative analysis of the whiteness of atypical cervical transformation zone," J. Reprod. Med. 30-l0! , 773-776 -I 985!.
17. C. Balas, A. Dimoca, E. Orfanudaki, and E. Koumantakis, " [n vivo assessment of acetic acid-cervical tissue interaction using quantitative imaging of back scattered light: Its potential use for the in vivo cervical cancer detection grading and mapping," Proc. SPIE 3568, 31 - 37 -I 998!.
18. J. C. Balas, G. C. Themelis, E. P. Prokopakis, I. Orfanudaki, E. Koumantakis, and E. S. Helidonis, " [n vivo detection and staging of epithelial dysplasias and malignancies based on the quantitative assessment of acetic acid-tissue," J. Photochem. Photobio!' 53, 153-157 -I 999!.
19. P. M. Cristoforoni, D. Gerbaldo, A. Perino, R. Piccoli , F. 1. Montz, and G. L. Capitanio, " Computerized colposcopy : results of a pilot study and analysis of its clinical relevance," Obstet. Gynecol. (N. Y.) 85-6! , 1011-10[6 -I 995!.
20. M. S. Mikhail , A. Anyaegbunam, and S. L. Romney, " Computerized colposcopy and conservative management of cervical intraepithe[ial neoplasia in pregnancy," Acta Obstet. Gynecol. Scand. 74-5! , 376-378 -I995!.
21 . A. Agrawal, U. Utzinger, C. Brookner, C. Pitris, M. F. Mitchell, and R. Richards-Kortum, " Fluorescence spectroscopy of the cervix: [nfluence of acetic acid, cervical mucus, and vaginal medications," Lasers Surg. Med. 25-3! , 237- 249 -I999!.
22. R. A. Drezek, T. Collier, C. K. Brookner, A. Malpica, R. Lotan, R. Richards-Kortum, and M. Follen, " Laser scanning confocal microscopy of cervical tissue before and after application of acetic acid," Am. J. Obstet. Gynecol. 182-5! , 1135-1139 ~OOO!,
23. R. Drezek, A. Dunn, and R. Richards-Kortum, "A pulsed finitedifference time-domain -fDTD! method for calculating light scattering from bio[ogical cells over broad wavelength ranges," Opt. Express 6-7! , 147-157 ~OOO!,
24. V. Backman, M. B. Wallace, L. T. Perelman, 1. T. Arendt, R. Gurjar, M. G. Muller, Q. Zhang, G. Zonios, E. Kline, T. McGillican, S. Shapshay, T. Valdez, K. Badizadegan, 1. M. Crawford, M. Fitzmaurice, S. Kabani, H. S. Levin, M. Seiler, R. R. Dasari, I. [tzkan, 1. Van Dam, and M. S. Feld, " Detection of preinvasive cancer cells," Nature (London) 406, 35- 36 ~OOO!,
..burnal of Biomedical Optics ' October 2001 ' Vol. 6 No.4 403