Analysing Fiscal Federalism in Global South - - Munich ...
30
Munich Personal RePEc Archive Analysing Fiscal Federalism in Global South: South Africa, Kenya, Ethiopia and Nepal Kaur, Gurleen and Chakraborty, Lekha S and Rangan, Divy and Kaur, Amandeep and Farida Jacob, Jannet NIPFP 2021 Online at https://mpra.ub.uni-muenchen.de/111228/ MPRA Paper No. 111228, posted 28 Dec 2021 04:38 UTC
-
Upload
khangminh22 -
Category
Documents
-
view
2 -
download
0
Transcript of Analysing Fiscal Federalism in Global South - - Munich ...

Munich Personal RePEc Archive
Analysing Fiscal Federalism in Global
South: South Africa, Kenya, Ethiopia
and Nepal
Kaur, Gurleen and Chakraborty, Lekha S and Rangan, Divy
and Kaur, Amandeep and Farida Jacob, Jannet
NIPFP
2021
Online at https://mpra.ub.uni-muenchen.de/111228/
MPRA Paper No. 111228, posted 28 Dec 2021 04:38 UTC

Analysing Fiscal Federalism in Global South:
South Africa, Kenya, Ethiopia and Nepal
Lekha Chakraborty
Gurleen Kaur Divy Rangan
Amandeep Kaur
Jannet Farida Jacob
Abstract
Thispaperexaminesthefiscalfederalismprocessesinfourcountriesinthe
globalsouth–viz.,SouthAfrica,Kenya,EthiopiaandNepal–focussingontheir
revenue and expenditure assignments and intergovernmental revenue sharing
mechanisms.Thesignificanceoffocussingonfederationsinglobalsouthisthat
the processes are still dynamic in terms of “optimal concurrency” in the
expenditure and revenue assignments; and “revenue sharing” norms. The
common feature of all these federations is the vertical and horizontal fiscal
imbalances emanating from the asymmetric revenue and expenditure
assignmentsandinturnidentifyingandrestatingtheroleofintergovernmental
fiscaltransferstoarriveateconomicconvergenceacrossjurisdictions.

Introduction
Whydonations“federate”?Or,whydounits“holdtogether”asanoptimal
political area? Empirical analysis of such questions are highly confined to
advancedcountries,forinstance,Alesinaetal(2017)haveexamined15European
UnioncountriesandNorwayfrom1980-2009todetermineif“Europe”–formed
onthebasisofeconomicintegration-asapoliticalprojectwas“tooambitious.”
However,thefederalisminglobalsouthisanareathathasnotbeenextensively
analysed.
Thispaperexaminesthefiscalfederalismprocessesinfourcountriesinthe
globalsouth–viz.,SouthAfrica,Kenya,EthiopiaandNepal–focussingontheir
revenue and expenditure assignments and intergovernmental revenue sharing
mechanisms.Thesignificanceoffocussingonfederationsinglobalsouthisthat
theprocessesarestilldynamicandthefederalfiscalrelationsarestillundergoing
transformationintermsof“optimalconcurrency”intheexpenditureandrevenue
assignments; and in terms of “revenue sharing” norms. For instance, Nepal
becameafederationafteralongunitaryruleonlyin2015withthepromulgation
of the Constitution, and stillmapping out an optimal revenue sharing formula
based on inter-jurisdictional expenditure needs. The House of Federation in
Ethiopiahasbeencontinuouslyrevisingthefederalgrantsharingformulaandalso
grappling with the elements of multi-ethnic federalism. The CRA in Kenya is
tacklingtheissuesrelatetorevenueallocationacrossjurisdictionsespeciallyin
thecontextofsharingnaturalresourcestaxation.SouthAfricaisapeculiar“hour
glass”fiscalfederalmodelwithafewtaxhandlesattheProvinciallevel.
Thecommonfeatureofall these federations is theverticalandhorizontal
fiscal imbalances emanating from the asymmetric revenue and expenditure
assignmentsandinturnidentifyingtheroleofintergovernmentalfiscaltransfers
toarriveateconomicconvergenceacrossjurisdictions.Themethodologyfollowed
in this paper is a judicious mix of secondary literature, inferences from the
multiple field level meetings in the countries, especially with the House of
FederationinEthiopiaandtheinternationalmeetingwiththeexpertsandpolicy
makersfromKenya,SouthAfrica,NepalandEthiopia,organisedbyNIPFP.
The paper is organised into sections. Section 1-4 analyses the specific
country experiences in terms of revenue and expenditure assignment and
intergovernmental transfer mechanisms in South Africa, Kenya, Ethiopia and
Nepal respectively. Section 5 uses general government data from Government
Finance Statistics (GFS) published by the IMF to understand the revenue and
expenditurebyfunctionandeconomicclassificationacrossthesefourcountries.
Section6concludes.

1. Federalism in South Africa
SouthAfricahasaunitarysystemofgovernance,but,inpractice,itishighly
decentralised with three tiers of government. It has, besides the national
government,nineprovincesand284localgovernments.Inthereorganisationof
sub-national units of government, race has been an important consideration
ratherthanfiscalimperatives.Inthepost-apartheidera,fourwhiteprovincesand
nine black homelands were reorganised into nine provinces; while 843
transitional municipalities were consolidated into 284 local governments by
combiningtheblackandwhiteareas(ChakrabortyandBagchi,2006).Thereare,
however,norurallocalbodiesunlikepanchayatsinIndia.
Theconstitutionassignsrevenuepowersandfunctionstothethreelevelsof
government (Table 1). The asymmetry between the revenue powers and
expenditurefunctionsacrossthetiersofgovernmenthavemadeprovincesand
local governments dependent in varying degrees on transfers from national
governmentflowingthrougharevenuesharingmodel.
Intermsofrevenueassignment,localgovernments—allmunicipalities—
have access to some substantial tax powers unlike the provinces. While the
national government is vested with all broad-based taxes such as income tax,
corporation tax, VAT, excises, fuel levy, and customs, constituting around 80
percent of total revenues, sources of revenue for provinces are very few and
insignificant (Chakraborty and Bagchi, 2006; Fourie and Valeta, 2008). These
includegamblingtaxes(bettingtaxoncasinoandhorserace),motorcarlicense
fees,anduserfeesonhospitalservices.
Revenue assignment in South Africa, the revenue assignment follows an
“hourglass”model,withthintaxhandleswiththeprovincialgovernment.itisthe
national government that raises the bulk of the country’s revenue through
instruments such as corporate tax, value added tax, fuel levy, pay as you earn,
customsandexciseduties(Table1).Theprovinces,ontheotherhand,havevery
limited tax instruments like gambling licencing, tourism levies and toll roads
levies. Municipalities have a more significant tax base where they can raise
revenue from sources such as municipal rates and tariffs and property taxes.
(Fourie&Valeta,2008).
According to theRepublicof SouthAfricaBudgetReview,provinces raise
about 3 per cent of their budgets from own revenue that comesmainly from
vehicleandgamblinglicences,andservicefees.Ontheotherhand,themunicipal
governmentsarelargelyabletofinancemuchoftheirbudgetsfromlocalrevenues.
Thismaybeattributedtothefactthatareallowedtoexclusivelylevyhigh-yield

taxessuchaspropertytaxandsurchargeforserviceslikewaterandelectricity.
Consequently, they require lessof inter-governmental grants (Kabru,2013). In
2015-16,only30%ofbudgetedmunicipal revenuewasderived from transfers
andsubsidies.(2016BudgetReview).
Table1:RevenueandExpenditureAssignments
Levelof
Government
ExpenditureFunctions RevenuePowers
National DefenceandIntelligence Incometax(personal)
ExternalAffairs Incometax(corporate)
CriminalJustice(Police,Prisons,Justice) VAT
HomeAffairs Fuellevy
HigherEducation Excise
Welfare
Housing
Health
Education
Communications
ScienceandTechnology
Culture
Art
LandAffairs
EnvironmentandTourism
MineralsandEnergy
TradeandIndustry
WaterAffairs
PublicWorks
Transport (National roads and bus
subsidies
Provincial SchoolEducation Taxongambling
ProvincialRoads Hospitalfee
Housing Licensefees
Welfare Motorcar
Health(academic,Hospitals,primary)
Local ElectricityReticulation Propertytax
GarbageCollection Regionallevies
Administration Electricity/WateruserCharges
Municipal
Firefighting
MunicipalInfrastructure(Streets)
Water
SanitationandWaste
WaterReticulation
Source:Chakraborty,2021

Expenditure assignment analysis reveals that nearly 80 per cent of
provincial budgets are spent on health, basic education and social welfare,
accordingtothe2019BudgetReviewbytheTreasuryofrepublicofSouthAfrica.
Rising levelofunpaidbillsandmedicalnegligenceclaimsputspressureon the
health budgets of the provinces. However, cost-containment measures in the
muchrecentyearshaveenabledprovincestoreallocateR5.7billiontoeducation
and health, as per the 2018 Budget Review. It has also been seen that
underspending has stabilised across national and provincial governments
(NationalTreasury,RepublicofSouthAfrica,2018).
Theintergovernmentalfiscaltransfers,aspertheSouthAfricanConstitution
(section214)in1996providedfortwotypesoftransferstothedevolvedunits.
Thefirstbeingthe“equitableshare”ofnationallycollectedrevenues.Accordingly,
since1998certainsharesofnationalrevenues(afternationaldebtservicingneeds
and contingency reserve for emergencies) have been allocated to subnational
governments as their "equitable share". This enables the other two lower
governments to provide basic services to poor residents. Under the system,
nationallyraisedrevenueisdividedamongthethreelevelsofgovernment,after
nationaldebt-servicingneedsaremetandacontingencyreserveforemergencies
istakenintoaccount.Thesecondisasetofconditionalandunconditionalgrants
toaccomplishdifferentpurposessuchasstaffsalaries,waterservicessubsidyand
capacity-buildinginitiatives.(Kaburu,2013).
Asperthelatestestimates,provincialgovernmentsreceive69.0percentof
nationalrevenueas“equitableshare”in2019-20whilelocalgovernmentsreceive
8.6 percent of the national revenue (Medium Term Budget Policy Statement,
2019). The division of revenue is made for three years under the multi-year
budgetingsysteminSouthAfrica.Theestimatesofrecentdivisionofrevenuetill
2022-23aregiveninTable2.
Table2:SouthAfrica:MediumtermEstimatesof“EquitableShare”
2016/
17
2017/
18
2018/
19
2019/
20
2020/
21
2021/
22
2022/
23
Rbillion Outcome Revised Medium-termestimates
Divisionofavailablefunds
Nationaldepartments 555.7 592.7 634.4 742.8 757.4 766.2 796.2
Provinces 500.4 538.6 572.0 612.8 651.5 694.8 731.1
Equitableshare 410.7 441.3 470.3 505.6 541.0 576.7 607.6
Conditionalgrants 89.7 97.2 101.7 107.3 110.5 118.2 123.5
Localgovernment 102.9 111.1 118.5 127.2 132.4 143.0 152.2
Equitableshare 50.7 55.6 60.8 69.0 74.7 81.1 87.2
Generalfuellevysharingwith
metropolitanmunicipalities
11.2 11.8 12.5 13.2 14.0 15.2 16.1

Conditionalgrants 40.9 43.7 45.3 45.1 43.7 46.8 49.0
Provisional allocations not
assignedtovotes
- - - - 21.2 34.9 33.1
Projectedunderspending -3.2
Total 1159.0 1242.3 1324.9 1479.6 1562.5 1638.9 1712.6
Percentageshares
Nationaldepartments 48.0% 47.7% 47.9% 50.1% 49.1% 47.8% 47.4%
Provinces 43.2% 43.3% 43.2% 41.3% 42.3% 43.3% 43.5%
Localgovernment 8.9% 8.9% 8.9% 8.6% 8.6% 8.9% 9.1%
Source:Medium-TermBudgetPolicyStatement2019
According to the Medium-Term Budget Policy Statement 2019, all direct
conditional grants have been lowered in the recent past, except for the early
childhood development grant and the learners with profound intellectual
disabilitiesgrant.(NationalTreasury,RepublicofSouthAfrica,2019).
The“ProvincialEquitableShare”allocationtoeachprovinceisdetermined
by a formula that takes into account thepopulation growth, economic activity,
poverty,anddemandforserviceslikeeducationandhealthcare.Smallerprovinces
are also compensated for the fixed costs ofmaintainingprovincial institutions.
(2016BudgetReview).Toensure fair fundingallocations toeachprovince, the
provincial equitable share formula is updated annually to reflect demographic
changesrelatedtothedemandforservicesprovidedbyprovinces.(Medium-Term
BudgetPolicyStatement,2019).
According to 2018Budget Review, Provinces,which depend on transfers
fromnationalgovernmentforover95percentoftheirbudgets,facesubstantial
spendingpressures toprovidehealth, educationandother services togrowing
populations.Inthiscontext,mostofthereductionsintransferstoprovinceshave
been made on infrastructure grants. The provincial equitable share, which
accounts for over 80 per cent of transfers and funds operating expenditure
coveringthesalariesofteachersandnurses,isreducedbyR4.7billionoverthe
MTEFperiod.Provincesareexpectedtoabsorbtheimpactofthesereductionsby
reducingthespendingonnon-coreitemssuchastravelandconsultants,andon
non-priorityprogrammes.(2018BudgetReview).
The “local government equitable share” enables the municipalities to
providebasicservicestopoorhouseholds,enablemunicipalitieswithlimitedown
resources to afford basic administrative and governance capacity and perform
coremunicipal functions. The “local government equitable share” formula has
beenupdatedrecentlytoaccountforprojectedhouseholdgrowth,inflationand
estimated increases in bulkwater and electricity costs over theMTEF period.
Largeurbanmunicipalities continue tounderinvest in infrastructure,primarily

because of poor programme and project preparation practices, leading to long
delays,highercostsandbreakdownsinservicedelivery.Whilepublicandprivate
capitalfundingisavailable,theseweaknessestranslateintolowlevelsofeffective
demand from the municipalities. To address these problems, from 2020-21
governmentwillintroducededicatedgrantfundingforlargeurbanmunicipalities
(Medium-Term Budget Policy Statement,2019)
(NationalTreasury,RepublicofSouthAfrica,2019).Accordingtothe2016Budget
Review,poorandruralmunicipalities,whichhavemuchlowertaxbasesthanbig
cities,relymoreheavilyonnationaltransfer.Therearechallenges,forinstance,
some formof financialdistress inSouthAfrica is evident from the fact that81
municipalcouncilshadvotedin2017/18toadoptbudgetswhichtheyknewwere
not funded.(2018BudgetReview).Section100oftheconstitutionrequiresthe
ministry or even the cabinet to take a decision to go to parliament, to get
parliamentary approval before an intervention to be taken. Fiscal Finance
Commissionhasnosignificantpowers.
2. Federalism in Kenya
Theconstitutionof2010establishedatwo-tiergovernmentinKenyawitha
nationalgovernmentand47countygovernments.AccordingtoArticle216(1)ofthe
ConstitutionofKenya,theCommissiononRevenueAllocation(CRA)ismandated
to make recommendations determining the basis for the equitable sharing of
revenue raised by the National Government between the national and county
governments, and among the county governments. Article 216(2) further
mandatestheCommissiontomakerecommendationsonothermattersrelatingto
the financing of, and financial management by, county governments and to
encouragefiscalresponsibility(Wangome,2016).However,thoserecommendations
oftheCRAarenotbinding.
Table3:RevenueandExpenditureAssignmentsInKenya
Level of
Government
RevenueFunctions ExpenditureFunctions
National
Government
incometax Nationaldefence
value-addedtax Policeservices
customsduties Judicialservices
and other duties on
importsandexports,
Nationalpublicworks
exciseduty Promotionofsportsandsportseducation.
Feesandcharges Disastermanagement
Allotherfunctionsnotincludedundercounty
government

CountyGovernment Propertyrates Agriculture
Entertainmenttaxes CountyHealthServices
Feesandcharges Controlofairpollution,noisepollution,other
publicnuisancesandoutdooradvertising
Culturalactivities,publicentertainmentand
publicamenities
Countytransport
Animalcontrolandwelfare
Tradedevelopmentandregulation,
Countyplanninganddevelopment
Pre-primaryeducation, villagepolytechnics,
homecraftcentresandchildcarefacilities
Implementation of specific national
government policies on natural resources
andenvironmentalconservation,
Countypublicworksandservices,
Firefighting services and disaster
management
Controlofdrugsandpornography.
Ensuringandcoordinating theparticipation
ofcommunitiesandlocationsingovernance
at the local level andassisting communities
and locations to develop the administrative
capacity
Source: Kenya Law Reform Commission, accessed from
http://www.klrc.go.ke/index.php/constitution-of-kenya/167-schedules-
schedules/fourth-schedule-distribution-of-functions-between-national-and-the-
county-governments/447-1-national-government
RevenueassignmentrevealsthatinKenya,totheextentthatcounty’sown-
sourcerevenuesaremeagre,countygovernmentswillvirtuallybefullydependent
onnationalrevenuesandanypotential(implicitorexplicit)stringsattached.In
thisregard,theConstitutionexplicitlyassignspropertyratesandentertainment
taxestothecountylevel,inadditiontoanumberofnon-taxrevenues(feesand
charges).Whilefurthertaxsourcesmaybeassignedtothecountylevelbynational
legislation, all major revenue sources (the value-added tax, income taxes, and
excise taxes) are exclusively assigned to the national level. The constitutional
assignment of taxes and revenue powers leaves county governments with a
limited own-source revenue base from which to make autonomous fiscal
decisions.(Boex&Kelly,2011).Silas(2018)notedthattheshareofcountyown
revenueintotalcountyrevenuerangedfrom0.759percentto90.17percentwith
ameanof37.72percent.Theproportionofownsourcerevenuecollectedbythe
countygovernments is lowcompared tooverall revenue.This isbelow theUN
recommendationof50percentplusorminus10percentofthetotalsubnational

government financialresources.Thiscouldbeattributedtoweak localrevenue
base and weak revenue administration in most counties in Kenya. Therefore,
countygovernmentsinKenyahaveverylittlecontrolovertheirrevenues(Silas,
2018).
Expenditure assignment analysis reveals that the Constitution assigns 14
functionstothecountygovernmentand35functionstothenationalgovernment
andallowsforvoluntarytransferoffunctionsorpowersofgovernmentfromone
leveltotheotherbyagreementbetweenthegovernments.However,theremaybe
overlapsinthesefunctionsbetweenthetwolevelsofgovernment.Forinstance,
thenationalgovernmentisgrantedcontrolofnationalbetting,casinosandother
formsofgambling,whereasthecountygovernmentsarealsograntedcontrolof
countybetting,casinosandotherformsofgambling.Thismaycauseconflictsin
determining national casinos and county casinos. Similarly, the national
government is in charge of promotionof sports and sports educationwith the
countygovernmentsbeinginchargeofsportsandculturalactivitiesandfacilities.
Thismay cause conflicts overmanagement of stadia already under the Stadia
ManagementBoard.(Kaburu,2013).Moreover,thereisnocleardemarcationon
howexpenditurerelatedtothesefunctions isgeneratedandspent.Tocurethe
overlaps, the Constitutionprovides that functions conferred onmore than one
levelofgovernmentarewithintheconcurrentjurisdictionofboth,andfunctions
not assigned to the County Governments remain to be functions of the NG.
(Kaburu,2013).Onthesideofexpendituredecentralization,theshareofcounty
governmentexpenditureintotalgovernmentexpenditurerangedfrom0.006per
centto1.424percentwithameanof0.145percentoverthestudyperiodof2002
to2013.Thewiderangebetweenthemaximumandtheminimumvaluesforall
thevariablessuggestsalargeheterogeneityacrossthecounties(Silas,2018).
Article202(1)oftheConstitutionstipulatesthatrevenueraisednationally
shall be shared equitably between national and county governments.More so,
Article 216(1) (a) mandates the Commission to recommend a basis for the
equitable sharing of revenue. Shareable revenue is defined in section 2 of the
CommissiononRevenueAllocationAct,2011tomean:“alltaxesimposedbythe
nationalgovernmentunderArticle209oftheConstitutionandanyotherrevenue
(includinginvestment income)thatmaybeauthorizedbyanActofParliament,
butexcludesrevenuesreferredtounderArticles209(4)and206(1)(a)(b)ofthe
Constitution”.
TheCommissionpreparedandsubmitteda recommendationonvertical
sharingofrevenueforFY2016/2017:Ksh.331,600millionforcountiesandfor
national government. The recommendation for counties equals to 35.4% of
auditedapprovedaccountsinlinewithArticle203(2)whichrequiresthatatleast
15%beallocatedtocounties.Thelatestauditedaccountsavailableareof2013-

14.(CRAReport2016-17).Thesecondrevenuesharingformulawaspreparedby
theCommissioninFY2015/2016andapprovedbyParliamentattheendofJune
2016forthehorizontaldissemination(Table4).
Table4:Equityinthesharingofrevenues:SecondAmendedFormula
Parameters PercentageWeights
1 Population 45%
2 EqualShare 26%
3 Poverty 18%
4 FiscalEffort 2%
5 LandArea 8%
6 DevelopmentFactor 1%
Source:CRAAnnualReportof2016-17
Thesharablepoolhasdeclinedfrom18percentofGDPto14percentofGDP
in the recent past. Four per cent of GDP is a whole loss of resources. The
CommissiononRevenueAllocationhasrecentlypresentedtherecommendation
on the thirdbasis forequitablesharingof revenueamongcountygovernments
(Table5).Thebasis isexpectedtobeusedforsharingofrevenuesforfinancial
years2019/20to2023/24.(CRA,2019).
Table5:Equityinthesharingofrevenues.(ThirdFormula)
Parameters PercentageWeights
1 Health 17%
2 Agriculture 10%
3 Othercountyservices 18%
4 BasicMinimumShare 20%
5 LandArea 8%
6 Roads 4%
7 Poverty 14%
8 UrbanServices 5%
9 FiscalEffort 2%
10 FiscalPrudence 2%
Source:CRAAnnualReportof2016-17
According to the CRA report of 2016-17, the “Current Conditional
Allocations” includehospitals, freematernalhealthcare,compensationforuser
fees forgone, leasingofmedical equipment, road fuel levy fund (15%ofActual
2014/15) and county emergency fund. The New Conditional Grants include
personnel emoluments for devolved staff, construction of headquarters in five

counties,rehabilitationofprimaryandsecondaryschools,rehabilitationofvillage
polytechnics.(CRAReport2016-17).
Table6:ConditionalAllocationsinKenya
2016/17Actual 2017/18 CRA
Recommendation
2017/18Actual
Sub Total Current Conditional
Grants
18,028 26,863 20,668
Sub Total New Conditional
Grants
- 9,100 2,605
Source:CRAAnnualReportof2016-17
Inrecognitionofthevastregionalandotherinequalitiesacrossthecountry,
anEqualisationFundwasestablishedconsistingof0.5%ofallrevenuecollected
bytheNationalGovernmenteachyear.Thisfundistobeusedforproviding,‘basic
services includingwater, roads, health facilities and electricity tomarginalised
areastotheextentnecessarytobringthequalityofthoseservicesinthoseareas
to the levelgenerallyenjoyedbytherestofthenation,sofaraspossible’.TheNational
GovernmentisalsoallowedtoutilisetheEqualisationFundthroughconditional
grantstoCountieswithmarginalisedcommunities.CountyGovernmentsmaybe
givenadditionalallocationsfromtheNationalGovernment’sshareoftherevenue,
eitherconditionallyorunconditionally.(Kaburu,2013).Inapaperthatusedpaneldata
collected from government and UNDP publications, it was shown that on an
average from 2002 to 2014, each county received 2.127 per cent of total
intergovernmentaltransfers,witharangeofbetween0.319percentand15.412
percent(Silas,2018).Whiletheweakassignmentofrevenuestothecountylevel
is offset to some extent by the block nature of discretionary grants received
throughtheequitableshare,transfersarenotperfectsubstitutesforownrevenue
sourcesinthedesignofanintergovernmentalfiscalsystem.(Boex&Kelly,2011)
The Constitution of Kenya requires the State to ensure sustainable
exploitation,utilization,managementandconservationofnaturalresources,and
ensuretheequitablesharingoftheaccruingbenefits(Art69(a));andutilizethe
natural resources for the benefit of the people of Kenya (Art. 69 (h)). The
Commission aims to provide technical advice and oversee implementation of
strategiesoneffectivenaturalresourceexploitationandrevenuesharing,promote
localcapacitiesinsustainablenaturalresourcesmanagementandfiscalplanning,
andnaturalresourcepolicyformulation/reforms.(CRAReport2016-17).

TheCRAwouldmanagethecostofexternalitiesarisingfromtheextraction
ofnatural resources.Thenationalgovernmentcancome inandusepartof the
proceeds of the natural resources and do the cleaning by itself or give the
resources to the sub-national governmentwhere theextractionhappened.The
aim is tonotdisadvantage the countygovernment as a result of the extractive
activitieswhentheyarenotbenefitingfromtherevenue.
Thechallengesareasfollows.Thereisreallynopolicyorlegalprovisionon
howmuchifatallshouldbedevolvedtothelowerlevelbythecountygovernment.
Thishasbeendonerandomlybycountygovernmentsinthepast.Yetanotherissue
relates to the treatment of urban jurisdictions. Such a functionwas previously
undertakenbythemunicipalitiesbutafter2010,theverticalformuladetermines
the quantum of resources which the two levels of government receive. If the
functionisnotassignedinitsdueconstitutionaldispensation,itcanleadtolarge
problemsasurbanfunctionslikeurbaninfrastructurearequiteexpensive.Howto
dealwithsub-nationalresourcerevenuesisamatterofconcern.Theconstitution
didn’tsayanything,buthassubsequentlegislationthatisnowtryingtodealwith
itandhence,thisissuerequiresattentionespeciallywhenKenyaisabouttosend
thefirstconsignmentofoil.IntheeventthatmembersofCRAdon’tagreeamong
themselves, there is an intergovernmentalmechanism formediation.However,
there is no clause in the constitution to arrive at some decision when this
mediationcollapsesagain.
3. FederalisminEthiopia
TheexpenditureassignmentinEthiopia,asperArticle52sub-article1ofthe
Constitution include foreign affairs, defence and national security services,
ensuringmacroeconomicstability,developmentactivitiesofnationalcharacters,
forthefederalgovernment.Articles96,97and98oftheConstitutionguarantee
thepowerofrevenuemobilizationandrevenuesharingbetweenthegovernment
andstategovernmentthroughconstitutionallyallocatedtaxbasestothetiersof
government.TherevenueassignmentisgiveninTable7.Manydynamictaxesare
atthefederalgovernmentlevel(Article96);stategovernmentsareallocatedtax
baseswithalocalnature.
Table7:RevenueAssignmentofFederalandStateGovernmentsinEthiopia

Federal(Article96) State(Article97)
customduties,taxesandotherchargesonimports
andexports.
levyandcollectincometaxeson
employeesoftheStateandof
privateenterprises.
incometaxonemployeesoftheFederal
Governmentandinternationalorganizations.
determineandcollectfeesfor
landusufractuaryrights.
income,profit,salesandexcisetaxeson
enterprisesownedbytheFederalGovernment.
levyandcollecttaxesonthe
incomesofprivatefarmersand
farmersincorporatedin
cooperativeassociations.
taxtheincomeandwinningsofnationallotteries
andothergamesofchance.
levyandcollectprofitandsales
taxesonindividualtraders
carryingoutabusinesswithin
theirterritory.
levyandcollecttaxesontheincomeofair,railand
seatransportservices.
levyandcollecttaxesonincome
fromtransportservicesrendered
onwaterswithintheirterritory.
levyandcollecttaxesonincomeofhousesand
propertiesownedbytheFederalGovernment;it
shallfixrents
levyandcollecttaxesonincome
derivedfromprivatehousesand
otherpropertieswithinthe
States.
determineandcollectfeesandchargesrelatingto
licensesissuedandservicesrenderedbyorgansof
theFederalGovernment
collectrentonhousesandother
propertiestheyown.
levyandcollecttaxesonmonopolies levyandcollectprofit,sales,
exciseandpersonalincometaxes
onincomeofenterprisesowned
bytheStates.
levyandcollectFederalstampduties. levyandcollecttaxesonincome
derivedfromminingoperations,
androyaltiesandlandrentalson
suchoperations.
righttotaxinternationaltrade determineandcollectfeesand
chargesrelatingtolicenses
issuedandservicesrenderedby
Stateorgans
Righttotaxinternationaltradeandamajorshare
indomesticindirecttaxes
fixandcollectroyaltyforuseof
forestresources.
Source:Bekana,2020

Thecombinedregionalshareofrevenuecollectionhasremainedfluctuating
around20percentoftotalrevenue–slightlyhigherinrecentyears.Asnational
government has 80 per cent of dynamic taxes, the vertical and horizontal
inequality results from the assignment problem of tax power, the federal
governmenthasbeenprovidingasubstantialamountofblockandspecificgrants
to state governments. The Ethiopian federal transfer system used grant
distributionformulainitiallywithequalweightinthegrantdistributionformula
to three indicators –population, levelofdevelopmentand revenuegeneration.
Later the poverty index was incorporated as a criterion in 2001, only to be
droppedin2004(Table8).
Table8:CriteriaandWeightsofFederalGrantFormulainEthiopia
Indicator 1994 1998 2001 2004
Indexofpopulation 33.33 60 55 65
CompositeInvertedIndexof
Development
33.33 25 20 25
IndexofOwn-Revenueraisingeffort 33.33 15 15 10
PovertyIndex 0.00 00 10 00
Source:MinistryofFinance,2020
From2009thegrantdistributionformulawaschangedtotheproportionof
fiscalgapofthestatesinthetotalfiscalgap–thefiscalgapbeingestimatedasthe
differencebetweenrevenuepotential(notactualrevenue)ofthestatesandtheir
respectiveexpenditureneeds.Inthisapproachfiscalgapsarecalculatedbyfirst
estimatingrevenue-generatingpotentialusingarepresentativerevenuesystem,
andexpenditureneedsusingarepresentativeexpendituresystem.Thefiscalgap
of each state is calculated as the difference between potential revenue and its
expenditureneeds.Thenthefiscalgapofallstatesisaggregatedandtherelative
fiscalgapofeachstate to the total fiscalgap isdetermined.Availableevidence
indicatesthatthetotalfinancialresourcesavailableforgrant–thepool–isalways
smallerthanthetotalfiscalgapofregionalstates.Thegrantisdistributedbased
ontherelativefiscalgapofregionalstates.
In Ethiopia, Constitution lays down the legal basis for intergovernmental
fiscal transfers - the sharing of concurrent taxes and the sharing of federal
revenue.Article94 states thatunless otherwise it doesnotdeter thebalanced
development,thefederalgovernmentmayprovidestateswithgrantsintheform
ofassistanceor loans.Article98dealswith theconcurrentpowersof taxation,
where two levels of government can jointly levy and collect certain revenue.
Article62(sub7)bestowstheHouseofFederationthepowertodeterminethe

divisionofthefederalsubsidiesamongregions.Thereisacontinuousrevisionin
the grant distribution formula prepared by the House of Federation, with the
objective to equalize the fiscal capacities of regions so that they canprovide a
comparablelevelofpublicservicestotheirelectorates.
Ethiopiahasahighlycentralizedfiscalsystem.Forthelast24years(1986–
2009E.C.),theFederalGovernmenthasbeenraising79.45%oftotalrevenuesbut
accountableforonly62%oftotalexpenditures.Thiscreatesalargeverticalfiscal
gap(17.5%).TheFederalGeneralPurposeGrant(FGPG)istheforemostprogram
tofillfiscalgap.Ithasfinancedabout78.33%ofsubnationalexpendituresduring
theperiodbetween1986–2009E.C..Thehorizontalinequitiesarealsobridged
withthistransfer.TheFGPGisaformulabasedtransferprogramthattakesinto
consideration both the revenue raising capacity of the regions aswell as their
expenditureneeds.
The intergovernmental fiscal transfers first begun in 1992-93, however
thosegrantswerearbitraryandadhocbasedonapprovedprojectsoftheregions.
In1994-95,aformulabasedgrantsystemwasintroduced,withtheobjectiveto
equalize the fiscal capacities of the regional states to enable them provide
comparablelevelofbasicservices.
TheobjectiveofFederalGeneralPurposeGrantFormulaistoequalizethe
fiscalcapacitiesofregionssothattheycanprovideacomparablelevelofpublic
services to their electorates. The development of the grant allocation formula
startedwiththeestimationofrelativefiscalgapwhichinvolvesestimationofthe
relativerevenuepotentialsandexpenditureneedsofregions.Inaccordancewith
established international practice, the representative tax system (RTS) and
representativeexpendituresystem(RES)methodologieshavebeenusedtoassess
the revenuepotential andexpenditureneedsof the regional statesofEthiopia.
Based on these approaches, the basic procedures for determining the revenue
potentialandexpenditureneedsofeachregionarepresentedasfollows:
AssessmentofPotentialRevenue:TheRepresentativeTaxSystem(RTS)isusedto
assess potential revenue. This approach focuses on major revenue sources of
regionsandapplicationofappropriatetaxratestoarriveatpotentialrevenue.The
RTSiscarriedoutforsixtaxrevenuesources,accountingfor75.2%ofregional
ownsourcerevenues.Theapproachidentifiesanappropriatetaxbaseanduses
theapplicabletaxratetoarriveatpotentialrevenuethatcanbederivedfroman
identifiedsource.Estimatingequalizationentitlementsusingtherepresentative
taxsystemrequiresinformationonthetaxbases,taxratesandrevenuesforeach
stateorsub-nationalgovernment.Thebasicstepsusedinestimatingthepotential
revenueareasfollows.(i)Identifyingmajorrevenuesources/definingmajortax

basesofregions.(ii)Collectdataontheselectedtaxbasesfromdifferentsources
includingMoFED,CSA,regionalgovernmentoffices,BOFEDsetc.(iii)Determine
thestandard(representative)taxratesdependingonthenatureofthesourceof
taxorcomputetheweightedaveragesofthetaxratesonthebasisofthevariations
intaxratesinprogressiveorotherways.
(iv)CalculatetheRRCofeachregionusingthefollowingformula.
Where Bij is the ith region's tax base and tjis the
weightedaveragetaxrateonthejthtaxbase.
Here,thisformulahasmadeanimprovementoverthepreviousoneinassessing
theregionalrevenuecapacitybyusingweightedaverageinsteadofsimpleaverage
taxrates.
Expenditure Need Assessment: The representative expenditure system (RES) is
usedtoestimateexpenditureneedsoftheregionalstates.Theformulausedthe
simplest version of the representative expenditure approach to enable policy
makersatdifferentlevelsofthecentralgovernmentandtheregionalgovernments
understand it easily. It can also be defended theoretically and on the basis of
logicalreasoning.Accordingtothisapproach,theexpenditureneedofaregionfor
agivenexpenditurecategoryiisgivenby:-
Exp_need_i=Measurementunit*RepresentativeExpenditure*AdjustmentIndex
Thatis,expenditureneedofaregionforexpenditurecategoryiisgivenby
theunitofmeasurementorworkloadused(e.g.,numberofschoolagechildrenfor
education,lengthofroadsinkilometersforroad,population,area,andspecificage
groups and sex for healthcare services, etc.) multiplied by the representative
expenditureoncategoryi,whichisthenationalperunitaverageexpenditurefor
each category.The representative expenditure is obtainedbydividingnational
total actual expenditure (i.e. total of all regions for which the grant is to be
distributed)totheunitofmeasurementofallregions,whererecentoneyearor3-
5 years figure is used in both cases. Then, the result is adjusted by an index
constructed from factors explaining unit cost differentials across sub-national
governments (these must be factors beyond the control of the sub-national
governmentssuchastopography,agro-ecologicalzones,populationdensity,high
wage,forexample,duetohighrelativecostofliving,slope,etc.).
As was done in estimating revenue, important expenditure sectors have
beenincludedinestimatingexpenditureneedsofregionalstates.Thesesectors
havebeendeterminedbytakingthebiggestsectorsthatcoverformorethan95%
of theregions’ totalpublicexpenditure.Since theycover the lion’sshareof the
expendituresofeachregionalstate,theycanbeconsideredas‘representativetax
categories’.Thiswasdonebyusing regionalbudget expendituredataobtained
*i ij j
j
C B t=å

fromtheNationalAccountsDepartmentoftheMoFED.Thesectors,whichhave
been considered in the formula, are General Administration, Primary and
Secondary Education (including TVET), Public Health, Agriculture and Rural
Development,DrinkingWater,RuralRoadConstructionandMaintenance,Urban
DevelopmentandMicroandSmallScaleEnterprise(MSE)Development.
It is worthmentioning here that expenditure for hardship allowances in
some regions is estimated on ad hoc basis for the representative expenditure
system is not applicable. There are other expenditure items such as
security/defenseandspillovercostsforeducationandhealththatareraisedby
theregionalstatesthatneedspecialtreatment.Thoughtheseexpenditureneeds
areveryimportantinreality,theycannotbedealtwithwithintheframeworkof
representativeexpendituresystemsincetheyarenotproblemsofallregions.As
a result, it was decided via political negotiation for such expenditures to be
estimated on ad-hoc basis but only for Dire Dawa administration and Harari
region.
Thechallengesareasfollows.TheFGPGinappropriatelytriestoachievemore
thanoneobjective.Ontheonehand,thegrantaimstoequalizethefiscalcapacities
of regional states.On theotherhand, itattempts toprovidecompensations for
spill-outs of benefits as well as for additional security and defense related
expenditures incurred by border regions affected by external conflicts.
RepresentativeExpenditureSystem(RES)calculationsuseeconometricprocedures
toestimatetheextentoftheadjustmentindexthatexplainsunitcostdifferentials
acrosssub-nationalgovernments.Thismakestheformulaalittlebitcomplexfor
the policy makers to understand it adequately. Capital expenditure needs are
evaluatedwithoutanyregardtoinfrastructuredeficiencies.TheFOBapproximates
needs using macro indicators of lack of access but translating these into
expenditureneedforfacilitiesrequiresaplanningviewandgeographicalmapping
offacilitiesinrelationtonationalminimumstandard.Thelatterviewisabsentin
the FGPG calculations.The Capital ExpenditureNeeds for Education andHealth
wereestimatedwithouttakingintoaccountthedifferencesincoverageamongthe
regional states. For instance, capital expenditure for education is required to
createaccessforthoseschoolagepopulationwhodon’thaveaccesstoeducation.
However, the expenditure need for education is estimated based on the total
numberofschoolagepopulation.Thisapproachisusednotonlyineducationbut
alsoinhealth.ThewayInverseofPopulationDensityisusedasadjustmentfactor
tocapturetheadditionalcostincurredbysparselypopulatedregionshasresultedin
exaggeratedbenefits.Insomeoftheregions,therearedesertareaswhereonecan
hardlyfindpeople.Therefore,takinginverseofpopulationdensityasadjustment
factor requires caution not to wrongly consider such desert areas as factors
compelregionstoincurextracostofadministrationandprovisionofservices.

The FGPG enhances autonomy but weakens regional and local government
accountability forservicedeliveryperformanceto localresidentsas financing for
regional expenditures depends on relative fiscal gaps and does not entail any
monitoring reportingprovisions.As longas the regionshavewider fiscal gaps,
they are entitled to get relatively better share from the federal grant. And no
mechanismistheretomonitorwhetherthoseregionswhohavereceivedbetter
shareowingtotheirrelativefiscalgapreducetheirdevelopmentalgapsornot.
The FGPG provides incentives for higher operational spending and provides
disincentivesforovercominginfrastructuredeficiencies.Thisisbecausecapitaland
operatinggrantsarelumpedtogetherandgivenasalump-sumgrantandhigher
operatingspendingleadstohigherexpenditureneedsinfuturewhereashigher
capitalspendingbyregionswoulddirectlyreducetheirfutureexpenditureneeds
entitlements1.
4. Federalism in Nepal
InNepal, itwasonly in2015Constitutioncame intobeingandNepalhas
becomefederal.TheConstitution–Schedules5,6and8explainsthejurisdiction,
powersandfunctionsofthreetiersofgovernment.Therearesevenprovincesand
753localgovernmentsinNepal.TheSchedule7oftheConstitutionexplainsthe
concurrency in the jurisdictions, powers of the federal andprovincial levels of
government,andschedule9outlinestheconcurrent jurisdictions/powersofall
threelevelsofgovernment(federal,provincialandlocal).Theseschedulesexplain
thefinanceandfunctionsofthedifferentlevelsofgovernment.
In Nepal, National Natural and Fiscal Commissionwas constituted under
Article250.TheArticle60(3)oftheConstitutiongivestheNationalNaturaland
FiscalCommissionthemandatetodeterminethemagnitudeoffiscaltransfersto
provinces and local governments. In India, 41 per cent of divisible tax pool is
devolvedtothesubnationalgovernments.FiscalEqualisationGrantsisoneofthe
significant fiscal transfers in Nepal. As per the Article 60 (4) , the Fiscal
EqualizationGrantsisdeterminedonthebasisofexpenditureneedsandrevenue
capacity of the subnational governments. As per the Article 251, the National
NaturalandFiscalCommissionismandatedtorecommendthefiscalequalization
grants,andalsotorecommendthecriteriaforconditionalgrants.Theconditional
grantsaredesignedonthebasisofGovernmentofNepal’spolicyandprograms,
standards and status of infrastructural development at the local level. The
Commissionalsohastorecommendthebasisandformulaforrevenuesharingto
subnational governments. The National Natural and Fiscal Commission is also
mandatedbyclauses inConstitutiontodevisea formula forFiscalEqualization
1ThesepointsareprovidedbytheexpertsinthemeetingattheHouseofFederation,Ethiopiain2019.

Grants.TheFiscalEqualisationGrantsistominimizethefiscalgapbetweentheir
expenditureneedsandrevenuepotential.
InNepal,since2017-18,FiscalEqualisationGrantsconstitutethesignificant
sourceofsubnationalfinances.ThedevolutionformulafortheFiscalEqualisation
Grants had only three components – area, population and cost adjusted
development.Thereareambiguitiesinthemagnitudeandcriteriaofdevolutionof
Fiscal equalisation Grants. However, the periodic assessments of expenditure
needs across jurisdictions and also the assessment on revenue potential are
requiredtofinetunetheformulatodevolvetheFiscalEqualisationGrants.
Nepal has entered a federal structure with the promulgation of the
ConstitutionofNepalonSeptember20,2015,whichareexplainedinSchedule5,
6,and8whichlaystheexplanationonthejurisdiction,powersandfunctionsof
three tiers of government. It has, besides the National government, seven
provincesand753localgovernments.TheSchedule7oftheConstitutionexplains
theconcurrencyinthejurisdictions,powersofthefederalandprovinciallevelsof
government,andschedule9outlinestheconcurrent jurisdictions/powersofall
threelevelsofgovernment(federal,provincialandlocal).Theseschedulesexplain
thefinanceandfunctionsofthedifferentlevelsofgovernment.Table9explains
brieflyonthepowersexclusivelyandconcurrentlyassignedtothethree-tiersof
government.
Table9.FunctionalAssignmentinNepal:ConcurrencyandExclusive
ExclusivePowers ConcurrentPowers
Federaland
Provincial
Federal,Provincial,
andLocal
Federal Defense,centralplanning,
foreignaffairs,citizenship,
passport,etc.(Schedule5)
Civilandcriminal
procedure,supply
anddistributionof
essentialgoods,
population
management,social
security,casino,
etc.(Schedule7)
Cooperatives,
education,health,
agriculture,
irrigation,mines,
minerals,disaster
management,
environment,
forest,personal
events,
archaeology,motor
vehiclepermits,etc.
(Schedule9)
Provincial Provincialpolice
administration,provincial
civilservice,higher
education,provincial-level
developmentactivities
suchaselectricity,
irrigation,roads,land

management,etc.
(Schedule6)
Local TownPolice,management
oflocalservices,basicand
secondaryeducation,basic
health,localroads,
drinkingwater,etc.
(Schedule8)
Source:ConstitutionofNepal(2015)andDevkota(2020)
In Nepal, NNRFC (National Natural Resources and Fiscal Commission) was
constituted under Article 250 of the Constitution of Nepal. Article 60(3) has
further extended the mandate to determine the amount of fiscal transfers to
provincesandlocal-levelgovernments.Nepal’sshareofsubnationalspendingin
total general government spending of about 36 percent in FY 2018-19Budget
(IMF 2019), which shows a high dependence of subnational governments on
transfersandsharedrevenuesfromthenationalgovernment.
FiscalEqualisationGrantsisoneofthesignificantfiscaltransfersinNepal.
AspertheArticle60(4),theFiscalEqualizationGrantsisdeterminedonthebasis
ofexpenditureneedsandrevenuecapacityofthesubnationalgovernments.Asper
the Article 251, the National Natural and Fiscal Commission is mandated to
recommendthefiscalequalizationgrants,andalsotorecommendthecriteriafor
conditional grants. The conditional grants are designed on the basis of
Government of Nepal’s policy and programs, standards and status of
infrastructural development at the local level. The Commission also has to
recommend the basis and formula for revenue sharing to subnational
governments.TheNationalNaturalandFiscalCommission isalsomandatedby
clauses in Constitution to devise a formula for Fiscal Equalization Grants. The
FiscalEqualisationGrantsistominimizethefiscalgapbetweentheirexpenditure
needsandrevenuepotential.
Extending on the Revenue Raising Powers mandated to each level of
government, the country followsbothprincipleof separationandconcurrence,
whichmeansthatthetaxationpowersareassignedtoallthetiersofgovernment,
withanoticeablyoverlapinpowers.But,theprovisionsofrevenue-raisingrights
among the three tiersof governmentunder the federal structure is laidby the
constitutionandtheLocalGovernanceOperationAct(2017),whichdealswiththe
issueofpoweroverlap.(IIDS2020)

Table 10 shows the Revenue-Raising powers assigned to each tier of
governmentaccordingtotheConstitution,dividedacrossthreecategoriesi.e.,Tax
Revenue,Non-TaxRevenue,andotherrevenue.
Table10.RevenueAssignmentinNepal
Federal Provincial Local
A.TaxRevenue . CustomDuty
. ExciseDuty
. ValueAddedTax
. CorporateIncomeTax
. PersonalIncomeTax
. RemunerationTax
. HouseandLand
RegistrationFee
. VehicleTax
. Entertainment
Tax
. Advertisement
Tax
. Taxon
Agricultural
Income
. PropertyTax
. HouseRentTax
. HouseandLand
RegistrationFee
. VehicleTax
. LandTax(Land
Revenue)
. EntertainmentTax
. AdvertisementFees
B.Non-Tax
Revenue
. PassportFee
. VisaFee
. TourismFee
. ServiceFee
. Gambling/Lottery
. FinesandPenalties
. ServiceFee
. TourismFee
. Finesand
Penalties
. ServiceFee
. TourismFee
. FinesandPenalty
C.Other
Revenue
. Ohertaxandnon-tax
raised/levied
accordingtofederal
andotherprevailing
laws
. Othertaxand
non-tax
raised/levied
accordingtothe
provinciallaw
andother
prevailinglaw
onthe
provincial
jurisdiction.
. Othertaxandnontax
raised/levied
accordingtothe
locallawandother
prevailinglawson
thelocalgovernment
leveljurisdiction.
Source:Devkota(2020)
InNepal,since2017-18,FiscalEqualisationGrantsconstitutethesignificantsource
of subnational finances.Thedevolution formula for theFiscalEqualisationGrantshad
onlythreebroadcomponents–area,populationandcostadjusteddevelopment.There
areambiguitiesinthemagnitudeandcriteriaofdevolutionofFiscalequalisationGrants.
However,theperiodicassessmentsofexpenditureneedsacrossjurisdictionsandalsothe
assessmentonrevenuepotentialarerequiredtofinetunetheformulatodevolve
theFiscalEqualisationGrants.Table11showsthattheFiscalEqualizationGrant
Allocation Formula has experiences several changes in order to incorporate
parameterstobetterfulfilthefiscalneedsacrossdifferenttiersofgovernment.

Table11.Nepal-FiscalEqualizationGrantAllocationFormulafortheProvinces
andLocal
S.No. Criteria FY2018/19&19/20 FY2020/21
Province Local Province&
Local
1 MultidimensionalPoverty
Index
15 - -
HumanDevelopment
Index
- 15 10
2 Economicandsocial
inequality
15 5 5
3. Statusofinfrastructure 10 10 10
4. Statusofrevenue 0 0 5
5. Expenditureneed 60 70 70
Total 100 100 100
Source:NNRFC(2020)andDevkota(2020)
Table12presentsaclearerpictureontherevenuedistributionamongFederal,
Provincial, and Local Governments, classified by the different type of taxes,
includingVAT,ExciseDuty,andvariousothertaxes.
Table12.RevenueAllocationinNepal
Taxes Federal Province Local
VAT 70% 15% 15%
Excise(Domestic
Collection)
70% 15% 15%
Royalty
Expedition 50% 25% 25%
Hydrogen 50% 25% 25%
Forestry 50% 25% 25%
Mine&Minerals 50% 25% 25%
WaterandOther
NaturalResources
50% 25% 25%
Source:Subedi(2020)
5. A Comparative Analysis of General Government Revenue &
Expenditure across Four Countries.

ThedataongeneralgovernmentisextractedfromtheGovernmentFinance
Statistics, published by IMF. The size of the government measured by the
expenditure to GDP ratio among the four countries is highest for Nepal. The
composition of expenditure shows that transfers between the levels of
governmentishighestinSouthAfrica,around10.35percentofGDP,followedby
Ethiopiaat6.21percent(Table13).
Table13:Expenditure,byFunctioninNepal,Ethiopia,KenyaandSouth
Africa,2019(as%ofGDP)
Heads Nepal Ethiopia Kenya South
Africa
TotalExpenditure 31.42 15.11 27.86 31.18
Expenditureongeneralpublicservices 4.07 7.26 11.98 16.17
Expenditureonpublicdebttransactions 1.77 0.48 5.50 3.49
Transfersbetweendifferentlevelsofgovt 1.89 6.21 3.69 10.35
Expenditureondefence 1.63 0.63 1.58 1.09
Expenditureonpublicorderandsafety 2.15 0.30 1.66 2.88
Expenditureoneconomicaffairs 10.59 3.11 5.94 2.92
Expenditure on agriculture, fishing,
forestry,&hunting
2.95 1.33 0.49 0.32
Expenditure on mining, manufacturing, &
construction
2.73 0.01 0.02 0.21
Expenditureontransport 3.52 1.41 3.72 1.33
Expenditureoncommunication 0.18 0.02 0.36 0.08
Expenditureonfuel&energy 1.20 0.12 1.01 0.32
Expenditureonenvironmentprotection 0.24 0.02 0.14 0.13
Expenditure on housing & community
amenities
1.55 0.29 0.76 1.56
Expenditureonhealth 1.72 0.42 0.69 1.05
Expenditureonoutpatientservices 0.14 0.00 0.14 0.00
Expenditureonhospitalservices 0.62 0.09 0.23 0.52
Expenditureonpublichealthservices 0.96 0.29 0.08 0.39
Expenditureonrecreation,culture,&
religion
0.25 0.07 0.11 0.16
Expenditureoneducation 4.11 2.35 3.97 1.67
Expenditureonpre-primary&primary
education
1.68 0.00 1.67 0.14
Expenditureonsecondaryeducation 0.44 0.00 1.14 0.01
Expenditureontertiaryeducation 2.00 1.91 0.98 0.96
Expenditureonsocialprotection 1.45 0.65 1.02 3.55
Source:IMF(2019),GovernmentFinanceStatistics.

Theexpenditurebyeconomicclassificationacrossfourcountriesrevealthat
intergovernmental transfers in the form of grants constitute a significant
componentofexpenditure.ItishighestinSouthAfricaat16.55percentofGDP,
followedbyKenya(10.39percentofGDP).Thedisaggregationofthegrantsto
other governments by capital and current reveals that current expenditure is
higherthancapitalexpenditure,forinstanceinSouthAfrica,withingrants,current
expenditurewas14.87ofGDPandcapitalexpenditurewas1.68percentofGDP.
However, inNepal,capitalgrantandcurrentwerealmostequalaround4-5per
centofGDP(Table14).
Table14:Expenditure,byEconomicClassificationinNepal,Ethiopia,Kenya
andSouthAfrica,2019(as%ofGDP)
Heads Nepal Ethiopia Kenya South
Africa
Compensationofemployees 4.50 1.27 5.12 3.30
Wagesandsalaries 4.50 1.14 2.75
Employers'socialcontributions 0.00 0.13 0.56
Useofgoodsandservices 2.16 2.13 2.52 1.31
Consumptionoffixedcapital 0.24
Interestexpense 0.38 0.48 2.85 3.49
Interestexpensetononresidents 0.12 0.23 0.76
Interestexpensetoresidentsotherthan
gengovt
0.26 0.25 2.09
Interestexpensetoothergengov 0.00 0.00 0.00
Subsidiesexpense 0.04 0.00 0.37 0.78
Subsidiesexpensetopubliccorporations 0.03 0.00 0.37 0.67
Subsidiesexpensetoprivateenterprises 0.01 0.00 0.00 0.11
Subsidiesexpensetoothersectors 0.00 0.00 0.00 0.00
Grantsexpense 9.23 5.99 10.42 17.75
Grantsexpensetoforeigngovts 0.00 0.00 0.03 1.16
Grantsexpensetointorgs 0.01 0.00 0.00 0.04
Grantsexpensetoothergengovt 9.22 5.99 10.39 16.55
Grantsexpensetoothergengovt:
current
4.52 4.06 6.08 14.87
Grantsexpensetoothergengovt:capital 4.70 1.93 4.32 1.68
Socialbenefitsexpense 3.30 0.00 0.81 3.39
Socialsecuritybenefitsexpense 0.00 0.00 0.81 2.37
Socialassistancebenefitsexpense 1.50 0.00 0.00 0.68
Employment-relatedsocialbenefits
expense
1.80 0.00 0.00 0.34
Otherexpense 0.00 1.53 0.06 0.68
Propertyexpenseotherthaninterest 0.00 0.00 0.00 0.00
Expenseonothertransfers 0.00 1.53 0.06 0.68
Expenseonothertransfers,current 0.00 1.53 0.06 0.25
Expenseonothertransfers,capital 0.00 0.00 0.00 0.43
Source:IMF(2019),GovernmentFinanceStatistics.
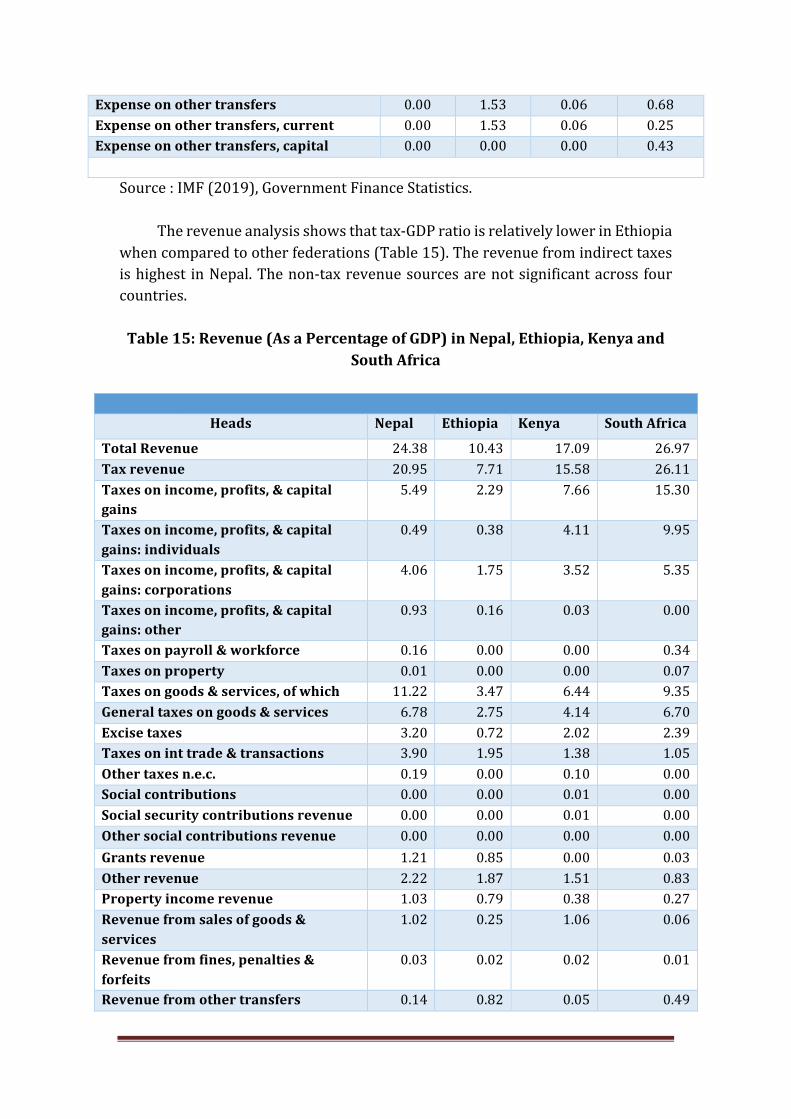
Therevenueanalysisshowsthattax-GDPratioisrelativelylowerinEthiopia
whencomparedtootherfederations(Table15).Therevenuefromindirecttaxes
ishighest inNepal.Thenon-taxrevenuesourcesarenotsignificantacross four
countries.
Table15:Revenue(AsaPercentageofGDP)inNepal,Ethiopia,Kenyaand
SouthAfrica
Heads Nepal Ethiopia Kenya SouthAfrica
TotalRevenue 24.38 10.43 17.09 26.97
Taxrevenue 20.95 7.71 15.58 26.11
Taxesonincome,profits,&capital
gains
5.49 2.29 7.66 15.30
Taxesonincome,profits,&capital
gains:individuals
0.49 0.38 4.11 9.95
Taxesonincome,profits,&capital
gains:corporations
4.06 1.75 3.52 5.35
Taxesonincome,profits,&capital
gains:other
0.93 0.16 0.03 0.00
Taxesonpayroll&workforce 0.16 0.00 0.00 0.34
Taxesonproperty 0.01 0.00 0.00 0.07
Taxesongoods&services,ofwhich 11.22 3.47 6.44 9.35
Generaltaxesongoods&services 6.78 2.75 4.14 6.70
Excisetaxes 3.20 0.72 2.02 2.39
Taxesoninttrade&transactions 3.90 1.95 1.38 1.05
Othertaxesn.e.c. 0.19 0.00 0.10 0.00
Socialcontributions 0.00 0.00 0.01 0.00
Socialsecuritycontributionsrevenue 0.00 0.00 0.01 0.00
Othersocialcontributionsrevenue 0.00 0.00 0.00 0.00
Grantsrevenue 1.21 0.85 0.00 0.03
Otherrevenue 2.22 1.87 1.51 0.83
Propertyincomerevenue 1.03 0.79 0.38 0.27
Revenuefromsalesofgoods&
services
1.02 0.25 1.06 0.06
Revenuefromfines,penalties&
forfeits
0.03 0.02 0.02 0.01
Revenuefromothertransfers 0.14 0.82 0.05 0.49

RevenuefromNI&SGS:premiums,
fees&claims
0.00 0.00 0.00 0.00
Source:IMF(2019),GovernmentFinanceStatistics.
The “assignment problem” remained as a significant issue in the fiscal
federalarrangements ,whichledtoverticalandhorizontal imbalances(Breton,
1977;Bird,2000,Breton,2000,RaoandSingh(2005;Oates,WE(2005):;Wheare,
Kenneth(1964).However,theintergovernmentaltransfersaredesignedonless
arbitrary adadhocmanner,which can reduce thevolatilityof the subnational
fiscalspace.
6. Conclusion
Thepoliticaleconomyofthetransfersrevealedthattherevenueassignment
andrevenuesharingaremandatedthroughConstitutioninthecountriesunder
study.Theanalysisshowsthatverticalandhorizontal fiscal imbalancesremain
significantacrossallthefourcountriesduetotheasymmetryintherevenueand
expenditureassignments.Thedynamictaxeswereassignedatthenationallevel
inthesecountries,leavingwithnomajorrevenueatlocallevelexceptforSouth
Africa.Theformulaofrevenuesharingisdynamicandthecountriesareconstantly
improvisingthoseindicators.Theemphasisonfiscalequalisationisgiveninthe
revenue sharing mechanisms. The unconditional grants given on the basis of
expenditureneedsrequiremeticulousanalysisacross jurisdictions.Thenatural
resourcetaxationisinastateoffluxandrequiresfurtherattentioninitsrolein
offsettingfiscaldisabilitiesacrossjurisdictions.
References
Alesina (2017) “Is Europe an optimal political area?” - Brookings Brookings
PapersonEconomicActivity,Spring2017.
Bird,RichardM(2000):"FiscalDecentralizationandCompetitiveGovernments"
in Gianluigi Galeotti, Pierre Salmon and Ronald Wintrobe (eds),
CompetitionandStructure:ThePoliticalEconomyofCollectiveDecisions
—EssaysinHonorofAlbertBreton,Cambridge,UK:CambridgeUniversity
Press.
Boex,J.,&Kelly,R.(2011).FiscalDecentralizationinKenya:ASmallSteporGiant
.UrbanInstituteCenteronInternationalDevelopmentandGovernance.
Breton,Albert (2000): "FederalismandDecentralization:OwnershipRights and
SuperiorityofFederalism,"Publius:TheJournalofFederalism,32(2):1-15.
Breton(1977):"AnEconomist'sPerspectiveonFiscalFederalism"inWOates(ed),
ThePoliticalEconomyofFiscalFederalism,Massachusetts:Lexington,pp
3-20.
Chakraborty,Lekha2021.,Federal
Chakraborty,Lekha.S.,&Bagchi,Amaresh. (2007).Fiscal Decentralisationand
Decentralisation and Gender Responsive Budgeting Gender Responsive
BudgetingInSouthInSouthAfrica:AnAppraisal.NIPFPWorkingPapers.
CRAReport2016-17.(n.d.).AnnualReportandFinancialStatementsof2016-17.
CRA.
CRA.(2019).Retrievedfromhttps://www.crakenya.org/
Devkota, K.M. 2020 “Intergovernmental Fiscal Transfers in a Federal Nepal”
International Center for Public Policy, WP 20-17, November.
https://icepp.gsu.edu/files/2020/11/paper2017a.pdf
Fourie,D.J.,&Valeta,L.(2008).IntergovernmentalFiscalRelationsintheSouth
AfricanContext.AfricanJournalofPublicAffairs.
IIDS.2020.“FiscalFederalisminNepal:RevenuePotentialofProvincialandLocal
Governments and Recommendations to Enhance Own-Source Revenue
Generation” Institute of Integrated Development Studies, June.
https://www.iids.org.np/images/publications/7a06e163acf0126073dc1
68f1d73339b.pdf

IMF. 2019 “Nepal: Selected Issues” IMF Staff Country Reports, February, 17.
https://www.elibrary.imf.org/view/journals/002/2019/061/article-
A002-en.xml
Kaburu, F. N. (2013). Fiscal Decentralisation in Kenya and South Africa: A
ComparativeAnalysis.
National Council of Provinces: Select Committee on Appropriations under
NationalTreasury,RepublicofSouthAfrica.(2015).ProvincialandLocal
GovernmentEquitableShareFormulas.
NationalTreasury,RepublicofSouthAfrica.(2019).MediumTermBudgetPolicy
Statement2019.
NationalTreasury,RepublicofSouthAfrica.(2016).BudgetReview2016.
NationalTreasury,RepublicofSouthAfrica.(2017).BudgetReview2017.
NationalTreasury,RepublicofSouthAfrica.(2018).BudgetReview2018.
Oates, W E (1999): "An Essay on Fiscal Federalism," Journal of Economic
Literature,37:1120-49,(September).
Oates,WE(2005):"TowardaSecondGenerationTheoryofFiscalFederalism,"
InternationalTaxandPublicFinance,12:349-73.
RaoandSingh(2005):PoliticalEconomyofFederalisminIndia,OxfordUniversity
Press
Silas,PM(2018).EffectsofFiscalDecentralisationonPovertyReductioninKenya,
IJIER.
Subedi,S.R.2020“FiscalManagementinFederalSystem:ContemporaryIssues”
https://dms.nasc.org.np/sites/default/files/documents/Fiscal%20Feder
alism%20JS%202076.10.21.pdf
Wangome, L. M. (2016). Challenge of revenue allocation facing devolution in
Kenya.
Watts, Ronald (1996): Comparing Federal Systems in the 1990s, Institute of
IntergovernmentalRelations,Queen'sUniversity,Kingston.
Wheare,Kenneth(1964):FederalGovernment(FourthEdition),London:Oxford
UniversityPress.