An Overview of Marine Biodiversity in United States Waters
47
Review An Overview of Marine Biodiversity in United States Waters Daphne Fautin 1 *, Penelope Dalton 2 , Lewis S. Incze 3 , Jo-Ann C. Leong 4 , Clarence Pautzke 5 , Andrew Rosenberg 6 , Paul Sandifer 7 , George Sedberry 8 , John W. Tunnell Jr. 9 , Isabella Abbott 10 , Russell E. Brainard 11 , Melissa Brodeur 12 , Lucius G. Eldredge 13 , Michael Feldman 12 , Fabio Moretzsohn 9 , Peter S. Vroom 14 , Michelle Wainstein 2 , Nicholas Wolff 3 1 Department of Ecology and Evolutionary Biology, University of Kansas, Lawrence, Kansas, United States of America, 2 Washington Sea Grant, University of Washington, Seattle, Washington, United States of America, 3 Aquatic Systems Group, University of Southern Maine, Portland, Maine, United States of America, 4 Hawaii Institute of Marine Biology, Kaneohe, Hawaii, United States of America, 5 North Pacific Research Board, Anchorage, Alaska, United States of America, 6 Conservation International, Arlington, Virginia, United States of America, 7 Hollings Marine Laboratory, National Oceanic and Atmospheric Administration, Charleston, South Carolina, United States of America, 8 Gray’s Reef National Marine Sanctuary, Savannah, Georgia, United States of America, 9 Harte Research Institute for Gulf of Mexico Studies, Texas A&M University – Corpus Christi, Corpus Christi, Texas, United States of America, 10 Department of Botany, University of Hawaii at Ma ¯noa, Honolulu, Hawaii, United States of America, 11 National Oceanic and Atmospheric Administration Fisheries, Pacific Islands Fisheries Science Center, Honolulu, Hawaii, United States of America, 12 Consortium for Ocean Leadership, Washington, D. C., United States of America, 13 Bishop Museum, Honolulu, Hawaii, United States of America, 14 Joint Institute for Marine and Atmospheric Research, Honolulu, Hawaii, United States of America Marine biodiversity of the United States (U.S.) is extensively documented, but data assembled by the United States National Committee for the Census of Marine Life demonstrate that even the most complete taxonomic inventories are based on records scattered in space and time. The best-known taxa are those of commercial importance. Body size is directly correlated with knowledge of a species, and knowledge also diminishes with distance from shore and depth. Measures of biodiversity other than species diversity, such as ecosystem and genetic diversity, are poorly documented. Threats to marine biodiversity in the U.S. are the same as those for most of the world: overexploitation of living resources; reduced water quality; coastal development; shipping; invasive species; rising temperature and concentrations of carbon dioxide in the surface ocean, and other changes that may be consequences of global change, including shifting currents; increased number and size of hypoxic or anoxic areas; and increased number and duration of harmful algal blooms. More information must be obtained through field and laboratory research and monitoring that involve innovative sampling tech- niques (such as genetics and acoustics), but data that already exist must be made accessible. And all data must have a temporal component so trends can be identified. As data are compiled, techniques must be developed to make certain that scales are compatible, to combine and reconcile data collected for various purposes with disparate gear, and to automate taxonomic changes. Information on biotic and abiotic elements of the environment must be interactively linked. Impediments to assembling existing data and collecting new data on marine biodiversity include logistical problems as well as shortages in finances and taxonomic expertise. Introduction An extensive global scientific initiative, the Census of Marine Life (Census) has assembled the first catalog of marine life, creating a baseline against which impacts of global change and human activity can be measured. The Census has been involved in examining previously unexplored marine ecosystems and in explaining the dynamic role of species over space and time. Some of the data gathered by Census projects have already provided vital information to policy makers and ocean educators to help preserve and protect marine resources, and will do so into the future. Conserving marine bio- diversity will increase the ability of ecosystems to adapt and recover following natural or human-caused disturbances, including the impacts of global change in its many forms [1]. The Census has highlighted the importance of preserving natural marine biodiversity as a critical part of maintaining marine ecosystem functions and services, including fisheries, water quality, recreation, and shoreline protection [2]. This overview summarizes the knowledge—and some of the major gaps in knowledge—of marine biodiversity of the United States (U.S.) as of late 2009, when the data were assembled. The inventories and the summaries provided in Table S1 and its condensed version, Table 1, are at the species level, but there is discussion of biodiversity at ecosystem and genetic levels, which are also vital (e.g., [2]). Although it does not include information about regions administered by or associated politically with the U.S., the area that is covered is enormous, bordering on at least five major named bodies of water, and extending from 67u W to about 172.5u E, and from the tropics to the Arctic (just south of 19u N to 71u N). The regions differ greatly in history of exploration and knowledge of their biodiversity. Because the biota of a place such as Alaska may have more in common with that of Japan than with that of another part of the U.S., such as the Gulf of Mexico, a single list of marine species reported from the U.S. or an annotation that a Citation: Fautin D, Dalton P, Incze LS, Leong J-AC, Pautzke C, et al. (2010) An Overview of Marine Biodiversity in United States Waters. PLoS ONE 5(8): e11914. doi:10.1371/journal.pone.0011914 Editor: Yan Ropert-Coudert, Institut Pluridisciplinaire Hubert Curien, France Received April 7, 2010; Accepted July 6, 2010; Published August 2, 2010 Copyright: ß 2010 Fautin et al. This is an open-access article distributed under the terms of the Creative Commons Attribution License, which permits unrestricted use, distribution, and reproduction in any medium, provided the original author and source are credited. Funding: The Census of Marine Life U.S. National Committee (USNC) receives funding from the Alfred P. Sloan Foundation and the National Oceanic and Atmospheric Administration’s Ocean Exploration and Research Program. Authors of the Northeast Continental Shelf Large Marine Ecosystem section gratefully acknowledge support from the Alfred P. Sloan Foundation through the Census of Marine Life Program. Initial funding for the project the Gulf of Mexico Large Marine Ecosystem section was based on was provided by the Harte Research Institute for Gulf of Mexico Studies at Texas A&M University-Corpus Christi. Later funding was provided by the National Centers for Coastal Ocean Science of NOAA and the Alfred P. Sloan Foundation. The funders had no role in study design, data collection and analysis, decision to publish, or preparation of the manuscript. Competing Interests: The authors have declared that no competing interests exist. * E-mail: [email protected] PLoS ONE | www.plosone.org 1 August 2010 | Volume 5 | Issue 8 | e11914
Transcript of An Overview of Marine Biodiversity in United States Waters

Review
An Overview of Marine Biodiversity in United StatesWatersDaphne Fautin1*, Penelope Dalton2, Lewis S. Incze3, Jo-Ann C. Leong4, Clarence Pautzke5, Andrew
Rosenberg6, Paul Sandifer7, George Sedberry8, John W. Tunnell Jr.9, Isabella Abbott10, Russell E.
Brainard11, Melissa Brodeur12, Lucius G. Eldredge13, Michael Feldman12, Fabio Moretzsohn9, Peter S.
Vroom14, Michelle Wainstein2, Nicholas Wolff3
1 Department of Ecology and Evolutionary Biology, University of Kansas, Lawrence, Kansas, United States of America, 2 Washington Sea Grant, University of Washington,
Seattle, Washington, United States of America, 3 Aquatic Systems Group, University of Southern Maine, Portland, Maine, United States of America, 4 Hawaii Institute of
Marine Biology, Kaneohe, Hawaii, United States of America, 5 North Pacific Research Board, Anchorage, Alaska, United States of America, 6 Conservation International,
Arlington, Virginia, United States of America, 7 Hollings Marine Laboratory, National Oceanic and Atmospheric Administration, Charleston, South Carolina, United States of
America, 8 Gray’s Reef National Marine Sanctuary, Savannah, Georgia, United States of America, 9 Harte Research Institute for Gulf of Mexico Studies, Texas A&M University –
Corpus Christi, Corpus Christi, Texas, United States of America, 10 Department of Botany, University of Hawaii at Manoa, Honolulu, Hawaii, United States of America,
11 National Oceanic and Atmospheric Administration Fisheries, Pacific Islands Fisheries Science Center, Honolulu, Hawaii, United States of America, 12 Consortium for Ocean
Leadership, Washington, D. C., United States of America, 13 Bishop Museum, Honolulu, Hawaii, United States of America, 14 Joint Institute for Marine and Atmospheric
Research, Honolulu, Hawaii, United States of America
Marine biodiversity of the United States (U.S.) is extensively
documented, but data assembled by the United States National
Committee for the Census of Marine Life demonstrate that even the
most complete taxonomic inventories are based on records scattered
in space and time. The best-known taxa are those of commercial
importance. Body size is directly correlated with knowledge of a
species, and knowledge also diminishes with distance from shore and
depth. Measures of biodiversity other than species diversity, such as
ecosystem and genetic diversity, are poorly documented. Threats to
marine biodiversity in the U.S. are the same as those for most of the
world: overexploitation of living resources; reduced water quality;
coastal development; shipping; invasive species; rising temperature
and concentrations of carbon dioxide in the surface ocean, and other
changes that may be consequences of global change, including
shifting currents; increased number and size of hypoxic or anoxic
areas; and increased number and duration of harmful algal blooms.
More information must be obtained through field and laboratory
research and monitoring that involve innovative sampling tech-
niques (such as genetics and acoustics), but data that already exist
must be made accessible. And all data must have a temporal
component so trends can be identified. As data are compiled,
techniques must be developed to make certain that scales are
compatible, to combine and reconcile data collected for various
purposes with disparate gear, and to automate taxonomic changes.
Information on biotic and abiotic elements of the environment must
be interactively linked. Impediments to assembling existing data and
collecting new data on marine biodiversity include logistical
problems as well as shortages in finances and taxonomic expertise.
Introduction
An extensive global scientific initiative, the Census of Marine Life
(Census) has assembled the first catalog of marine life, creating a
baseline against which impacts of global change and human activity
can be measured. The Census has been involved in examining
previously unexplored marine ecosystems and in explaining the
dynamic role of species over space and time. Some of the data gathered
by Census projects have already provided vital information to policy
makers and ocean educators to help preserve and protect marine
resources, and will do so into the future. Conserving marine bio-
diversity will increase the ability of ecosystems to adapt and recover
following natural or human-caused disturbances, including the impacts
of global change in its many forms [1]. The Census has highlighted the
importance of preserving natural marine biodiversity as a critical part
of maintaining marine ecosystem functions and services, including
fisheries, water quality, recreation, and shoreline protection [2].
This overview summarizes the knowledge—and some of the
major gaps in knowledge—of marine biodiversity of the United
States (U.S.) as of late 2009, when the data were assembled. The
inventories and the summaries provided in Table S1 and its
condensed version, Table 1, are at the species level, but there is
discussion of biodiversity at ecosystem and genetic levels, which are
also vital (e.g., [2]). Although it does not include information about
regions administered by or associated politically with the U.S., the
area that is covered is enormous, bordering on at least five major
named bodies of water, and extending from 67u W to about 172.5uE, and from the tropics to the Arctic (just south of 19u N to 71u N).
The regions differ greatly in history of exploration and knowledge
of their biodiversity. Because the biota of a place such as Alaska
may have more in common with that of Japan than with that of
another part of the U.S., such as the Gulf of Mexico, a single list of
marine species reported from the U.S. or an annotation that a
Citation: Fautin D, Dalton P, Incze LS, Leong J-AC, Pautzke C, et al. (2010) AnOverview of Marine Biodiversity in United States Waters. PLoS ONE 5(8): e11914.doi:10.1371/journal.pone.0011914
Editor: Yan Ropert-Coudert, Institut Pluridisciplinaire Hubert Curien, France
Received April 7, 2010; Accepted July 6, 2010; Published August 2, 2010
Copyright: � 2010 Fautin et al. This is an open-access article distributed underthe terms of the Creative Commons Attribution License, which permitsunrestricted use, distribution, and reproduction in any medium, provided theoriginal author and source are credited.
Funding: The Census of Marine Life U.S. National Committee (USNC) receivesfunding from the Alfred P. Sloan Foundation and the National Oceanic andAtmospheric Administration’s Ocean Exploration and Research Program. Authorsof the Northeast Continental Shelf Large Marine Ecosystem section gratefullyacknowledge support from the Alfred P. Sloan Foundation through the Census ofMarine Life Program. Initial funding for the project the Gulf of Mexico LargeMarine Ecosystem section was based on was provided by the Harte ResearchInstitute for Gulf of Mexico Studies at Texas A&M University-Corpus Christi. Laterfunding was provided by the National Centers for Coastal Ocean Science of NOAAand the Alfred P. Sloan Foundation. The funders had no role in study design, datacollection and analysis, decision to publish, or preparation of the manuscript.
Competing Interests: The authors have declared that no competing interestsexist.
* E-mail: [email protected]
PLoS ONE | www.plosone.org 1 August 2010 | Volume 5 | Issue 8 | e11914

species occurs in the U.S. is of little use for many scientific and
management purposes. This overview is therefore divided into six
geographically based sections (Figure 1), four of which are more or
less coincident with large marine ecosystems (LMEs) (http://www.
lme.noaa.gov). They are the Northeast U.S. Continental Shelf
LME (#7), the Southeast U.S. Continental Shelf LME (#6), the
Insular Pacific–Hawaiian LME (#10), and the Gulf of Mexico
LME (#5). The last section covers the entire LME, not just that
portion along the U.S. Gulf coast. The section on the West Coast
concerns much, but not all, of the California Current LME (#3).
The Alaska section includes part or all of four LMEs: the Chukchi
Sea LME (#54), the Beaufort Sea LME (#55), the East Bering Sea
LME (#1), and the Gulf of Alaska LME (#2).
Each region is spatially defined, and features of its oceano-
graphic setting that are known or likely to affect marine
biodiversity are described. The approximate number of species
in each major taxon is listed, with comments on taxa of particular
note, including those that are commercially important or
endangered. For example, the highest marine diversity ever
recorded was on the slope east of Charleston in the Southeast U.S.
Continental Shelf LME, and the Straits of Florida in that same
LME has the richest ichthyofauna in the Atlantic. The Aleutian
Islands has cold-water corals in very high diversity and abundance.
Endemism of the Hawaiian biota is the highest of any tropical
marine ecosystem on earth. Each section enumerates the threats to
biodiversity in the region. As extensive as it is, it is clear from the
biotic diversity inventories compiled in these six sections as an
activity of the Census that knowledge of U.S. marine biodiversity is
fragmentary. Knowledge is uneven spatially, taxonomically, and
through time. Taxa that are best known – taxonomically,
biologically, temporally, and in their geographical and ecological
distribution – are no doubt those of current commercial
importance, particularly finfish, or past commercial importance,
such as whales and some birds. Knowledge diminishes with depth
Table 1. Biotic diversity of the six U.S. geographically-based sections in the text.
Taxonomic groupNortheast U.S.Continental Shelf LME
Southeast U.S.ContinentalShelf LME
Gulf ofMexico
Insular-PacificHawaii LME
CaliforniaCurrent LME
High Arctic (notexclusively the U.S.)
Domain Archaea UD UD UD UD UD UD
Domain Bacteria(including Cyanobacteria)
10 (9) 48 (16) UD (45) UD (183) UD UD
Domain Eukarya 5,032 4,229 15,374 8,244 10,160 5,925
Kingdom Chromista 376 217 1,034 175 187 287
Phaeophyta 154 217 86 84 187
Kingdom Plantae 246 113 967 821 703 150
Chlorophyta 98 65 195 247 139
Rhodophyta 148 38 392 574 557
Angiospermae UD 10 380 UD 7
Kingdom Protoctista (Protozoa) 51 165 2,169 798 896 759
Dinomastigota (Dinoflagellata) 49 644 43 UD 70
Foraminifera 2 165 951 755 670 325
Kingdom Animalia 4,359 3,734 11,150 6,395 8,374 4,729
Porifera 36 111 339 144 134 163
Cnidaria 212 362 792 460 400 227
Platyhelminthes 77 705 676 1389 134
Mollusca 868 698 2455 1345 663 488
Annelida 689 400 866 343 830 533
Crustacea 810 696 2579 1325 2680 1525
Bryozoa 138 91 266 168 150 331
Echinodermata 138 522 309 290 151
Urochordata (Tunicata) 44 35 102 102 62 64
Other invertebrates 173 41 549 228 733 600
Vertebrata (Pisces) 954 1200 1541 1214 909 415
Other vertebrates 220 100 434 81 134 98
TOTAL REGIONAL DIVERSITY3 5,042 4,277 15,419 8,427 10,160 5,925
Values are number of species1,2. See Table S1 for more details.Notes:1Sources of the reports: databases, scientific literature, books, field guides, technical reports, and personal communication with taxonomic experts.2Identification guides cited in Text S2.3Includes all taxonomic groups as reported in Table S1.UD = Listed in work but number undetermined to date; because taxonomic units in ICoMM are not species, they are not comparable to the data presented here and soare not included.doi:10.1371/journal.pone.0011914.t001
U.S. Marine Biodiversity
PLoS ONE | www.plosone.org 2 August 2010 | Volume 5 | Issue 8 | e11914

and with distance from shore, and with body size. A major
challenge is to interrelate components assessed at genetic, species,
habitat, and ecosystem levels.
The data come from a wide range of research efforts, including
basic studies, monitoring programs that assess activities like
fisheries, and exploration in preparation for activities such as oil
production. The goal is to summarize patterns of biodiversity;
secondary, and some primary, sources of information are cited in
references. The Census has worked to assemble marine biodiver-
sity data into an open-access database, the Ocean Biogeographic
Information System (OBIS). Some of the data presented here are
accessible through OBIS, the international site (http://www.iobis.
org) and/or the U.S. node of OBIS, OBIS-USA (http://obisusa.
nbii.gov).
U.S. research capacityAbundant information is available on U.S. marine waters, much
a result of the large number of marine laboratories, vessels, and
scientists in the U.S. According to the National Association of
Marine Laboratories (NAML), an organization representing
marine laboratories in the U.S. and its territories, more than
120 such laboratories support over 10,000 scientists, engineers,
and professionals (http://www.naml.org/about).
The hundreds of vessels used by marine laboratories, univer-
sities, and federal agencies range from small dinghies to global-
class ships as long as 84 m. According to the Federal Fleet Status
Report in 2007, 39 U.S. vessels were more than 40 m long
(Figure 2). Figure 2 is projections based upon 2007 construction
plans for the U.S. research fleet through 2025, organized by class
and function. Since it was published, two vessels over 40 m in
length (RV Okeanos Explorer and RV Marcus Langseth) have been
added to the research fleet.
Many Census projects conduct research within U.S. waters.
‘‘Listening curtains’’ of the Pacific Ocean Shelf Tracking (POST)
project track fishes of several species on migrations from Alaska to
Baja, California, and Tagging of Pacific Predators (TOPP) has
used marine life, including bluefin tuna and elephant seals, as
oceanographers, fitting them with tags that collect data on
temperature and salinity as they migrate, mate, and feed. The
Natural Geography of Inshore Areas (NaGISA), which aims to
inventory and monitor biodiversity in the nearshore zone of the
world’s oceans at depths less than 20 m, conducts research along
many stretches of the U.S. coastline, notably in Alaska and New
Figure 1. Map of six regions covered in the overview. The six regions are identified by the LME with which they coincide or of which they are apart: Northeast U.S. Continental Shelf, Southeast U.S. Continental Shelf, Gulf of Mexico, Insular Pacific–Hawaiian, California Current, Chukchi Sea,Beaufort Sea, East Bering Sea, and Gulf of Alaska.doi:10.1371/journal.pone.0011914.g001
U.S. Marine Biodiversity
PLoS ONE | www.plosone.org 3 August 2010 | Volume 5 | Issue 8 | e11914

England. Many of the scientists involved in the Arctic Ocean
Diversity (ArcOD) project, which studies waters of the Arctic
Ocean, are at the University of Alaska, Fairbanks. In the Gulf of
Mexico, researchers of the Continental Margin Ecosystems on a
Worldwide Scale (COMARGE) study areas of the continental
margin that are relatively untouched by commercial exploitation.
The Census of Coral Reef Ecosystems (CReefs) is an international
cooperative effort to assess, visualize, and explain diversity
patterns, including those of the coral reefs of the Hawaiian
Islands, before such patterns are further affected by global change.
The Gulf of Maine Area (GoMA) program documents patterns of
biodiversity and related processes so its findings can be used to
establish ecosystem-based management (EBM) of the Gulf of
Maine (Table 2). The International Census of Marine Microbes
(ICoMM: http://icomm.mbl.edu/microbis/) has inventoried ma-
rine microbial diversity (inclusive of the Bacteria, Archaea,
Protista, and associated viruses) in numerous places in U.S.
waters. Included in its activities is Visual Analysis of Microbial
Population Structures (VAMPS) at http://vamps.mbl.edu.
The importance of biodiversityMeetings organized by the Census U.S. National Committee for
members of academic, government, and not-for-profit organiza-
tions have addressed topics concerned with how biodiversity can
be assessed. A major premise of Census activities in the U.S., that
maintaining biodiversity is a worthy goal, accepts the assertion [3]
that the survival and well-being of humans depend on intact, fully
functioning ecosystems. Further, conservation of biodiversity for its
own intrinsic value, above and beyond consideration of human
needs, should be a significant and recognized goal of global society
[4].
In the marine environment and elsewhere, a growing body of
evidence relates the maintenance of healthy, natural biodiversity to
provision of a broad spectrum of ecosystem services, including
those that humans rely upon and value, such as food, medicines,
recreation, climate modulation, and protection from extreme
weather [2,3]. However, at a global scale, 60% of ecosystem
services are degraded [3]. Along U.S. coasts, loss or impairment of
biodiversity correlates with degraded ecosystem services important
to humans [5]. Specifically, there are impacts to tourism, loss of
aesthetic and other cultural attributes, lowered property values,
and increased health risks to humans and animals from harmful
algal blooms and their toxins, infectious disease organisms, and
chemical contaminants [6,7]. Efforts to develop national marine
spatial planning as a component of national ocean policy will be an
important advance in the efforts to conserve marine biodiversity
[8].
The U.S. Commission on Ocean Policy (USCOP) [9] identified
EBM as a cornerstone of ocean policy reform and specifically
stated that conservation of natural biodiversity was a crucial part
of EBM. The USCOP report said, ‘‘One of the central goals for
ecosystem-based management should be the explicit consideration
of biodiversity on species, genetic, and ecosystem levels…[I]t is
now understood that every species makes some contribution to the
structure and function of its ecosystem. Thus, an ecosystem’s
survival may well be linked to the survival of all the species that
inhabit it.’’ The Joint Ocean Commission Initiative (JOCI) [10]
reemphasized the importance of EBM, including the conservation
of biodiversity, in recommendations to President Barack Obama’s
administration. An extensive discussion of implementing EBM for
the marine environment is presented in McLeod and Leslie [11].
According to the 2008 Valencia Declaration [12], ‘‘Marine
biodiversity underpins the functioning of marine ecosystems and
their provision of services—without biodiversity there would be no
ecosystem services.’’ While the ecological mechanisms linking
biodiversity to sustained marine ecosystem function are not fully
understood, it is clear that preserving biodiversity could be one
important way to maintain continued provision of critical
ecosystem services, including fisheries, water quality, and others
[2,6]. Because sustained biodiversity is likely to benefit most
Figure 2. Federal fleet status projected through 2025. Figure courtesy of the Interagency Working Group on Facilities Federal OceanographicFleet Status Report. July 2007. Available at http://www.oceanleadership.org/files/IWG-F%20Fleet%20Status%20Report%20-%20Final.pdfdoi:10.1371/journal.pone.0011914.g002
U.S. Marine Biodiversity
PLoS ONE | www.plosone.org 4 August 2010 | Volume 5 | Issue 8 | e11914

ecosystem services, Palumbi et al. [2] suggested that an EBM
approach focused on conservation of natural biodiversity would
benefit sectoral management and enhance the resiliency of coastal
ecosystems and the human communities associated with them.
Maintaining and improving coastal resiliency is important with
regard to effects of ecosystem alterations, especially those that may
occur as inadvertent consequences of human behavior.
A wide range of human activities affect marine biodiversity both
in direct ways, such as exploitation by fisheries, habitat loss due to
dredging, filling, and other construction influences, fishing gear
impacts, and pollution, and in less direct ways, including effects of
global change resulting in acidification, warmer waters, and
coastal inundation. Some activities cause biodiversity loss due to
ecosystem changes (e.g., reduced coral reef health commonly is
associated with reduced populations or even extirpation of some
organisms), whereas others may change ecosystem function
because of alterations in diversity - either up or down (e.g., due
to invasive species). Rising atmospheric carbon dioxide not only
contributes to temperature increase but, as some of that carbon
dioxide dissolves in the ocean, pH of ocean water declines. A
growing number of studies have demonstrated adverse impacts on
marine organisms, including decreases in rates of coral calcifica-
tion, reduced ability of algae and zooplankton to maintain
protective shells, and reduced survival of larval marine shellfish
and fish [13,14,15]. Ecosystems can undergo rapid change in their
ability to provide a range of ecosystem services as biodiversity
changes [6].
To monitor and evaluate changing biodiversity, and develop
policy responses to it requires developing reference levels of
biodiversity currently and, as far as is possible, into the past (e.g.,
[16]). This overview is intended to summarize the current state of
knowledge for the U.S., where relatively few management
measures for protecting marine biodiversity have been
implemented.
Results
Northeast United States Continental Shelf Large MarineEcosystem
Description of the Northeast Continental Shelf
region. The Northeast U.S. Continental Shelf LME extends
more than 3,000 km from Cape Hatteras, North Carolina, into
Canadian waters of the Gulf of Maine (Figure 3) [17]. It includes
the Bay of Fundy, Northeast Channel, and all of Georges Bank.
The LME includes two biogeographic provinces historically
divided at Cape Cod: the Virginian Province extends south to
Cape Hatteras, and the Acadian Province extends north to the
Gulf of St. Lawrence [17]. While many studies have corroborated
Cape Cod as a shoreward ‘‘boundary’’ between these provinces
(see Wares [18] for discussion), the extension of this demarcation
to offshore habitats is not straightforward. Depending on the
faunal and environmental comparisons being made, some studies
have drawn a connection between Georges Bank and the northern
Mid-Atlantic Bight to the south, while others claim that Georges
Bank is distinct from both the Gulf of Maine and regions to the
south (Theroux and Grosslein [19] discuss similarities between
Georges Bank and the shelf region south of it; Longhurst [20] and
others discuss the distinctness of Georges Bank; Cook and Auster
[21] provide a thorough discussion). Despite the distinctions
between them, Georges Bank and the Gulf of Maine are generally
recognized as a closely coupled system. A recent description of
world marine coastal ecoregions [22] places the northern border of
the Virginian Province at a line extending from Cape Cod
southeastward across the shelf, thus assigning Georges Bank to the
Table 2. Census of Marine Life projects by Large Marine Ecosystem.
Alaska RegionCaliforniaCurrent
Gulf ofMexico
Southeast U.S.Continental Shelf
Northeast U.S.Continental Shelf
Insular Pacific–Hawaiian
Census Project LMEs # 1, 2, 54, 55 LME #3 LME #5 LME #6 LME #7 LME #10
ArcOD > & m n/a n/a n/a n/a n/a
CeDAMar n/a n/a n/a n/a & > &
ChEss n/a & & m n/a n/a n/a
COMARGE n/a & m > & m n/a n/a n/a
GoMA n/a n/a n/a n/a > & m n/a
MAR-ECO n/a n/a n/a n/a & n/a
POST & m > & m n/a n/a n/a n/a
CAML n/a n/a n/a n/a n/a n/a
CenSeam n/a n/a n/a n/a & n/a
CMarZ & & & & & &
CReefs n/a n/a n/a n/a n/a > & m
ICoMM & & & & > & &
NaGISA > & & & & & n/a
TOPP & > & m & m n/a n/a & m
FMAP & & & & & &
HMAP n/a n/a n/a n/a > & m n/a
OBIS & & & & & &
Note: > = Census project’s primary area of study; & = Census studies in the region; m = Intensive and integrated studies of biodiversity; N/A = No Census work inthe region. Please see Text S1 for full project titles.doi:10.1371/journal.pone.0011914.t002
U.S. Marine Biodiversity
PLoS ONE | www.plosone.org 5 August 2010 | Volume 5 | Issue 8 | e11914

U.S. Marine Biodiversity
PLoS ONE | www.plosone.org 6 August 2010 | Volume 5 | Issue 8 | e11914
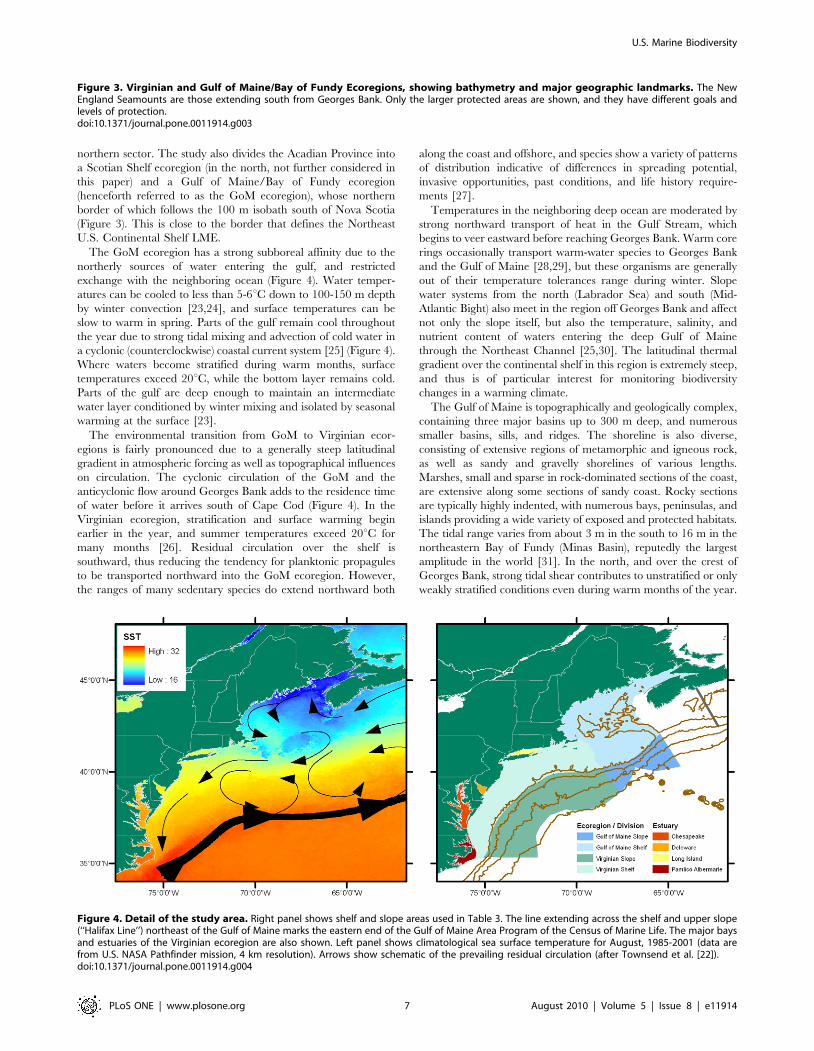
northern sector. The study also divides the Acadian Province into
a Scotian Shelf ecoregion (in the north, not further considered in
this paper) and a Gulf of Maine/Bay of Fundy ecoregion
(henceforth referred to as the GoM ecoregion), whose northern
border of which follows the 100 m isobath south of Nova Scotia
(Figure 3). This is close to the border that defines the Northeast
U.S. Continental Shelf LME.
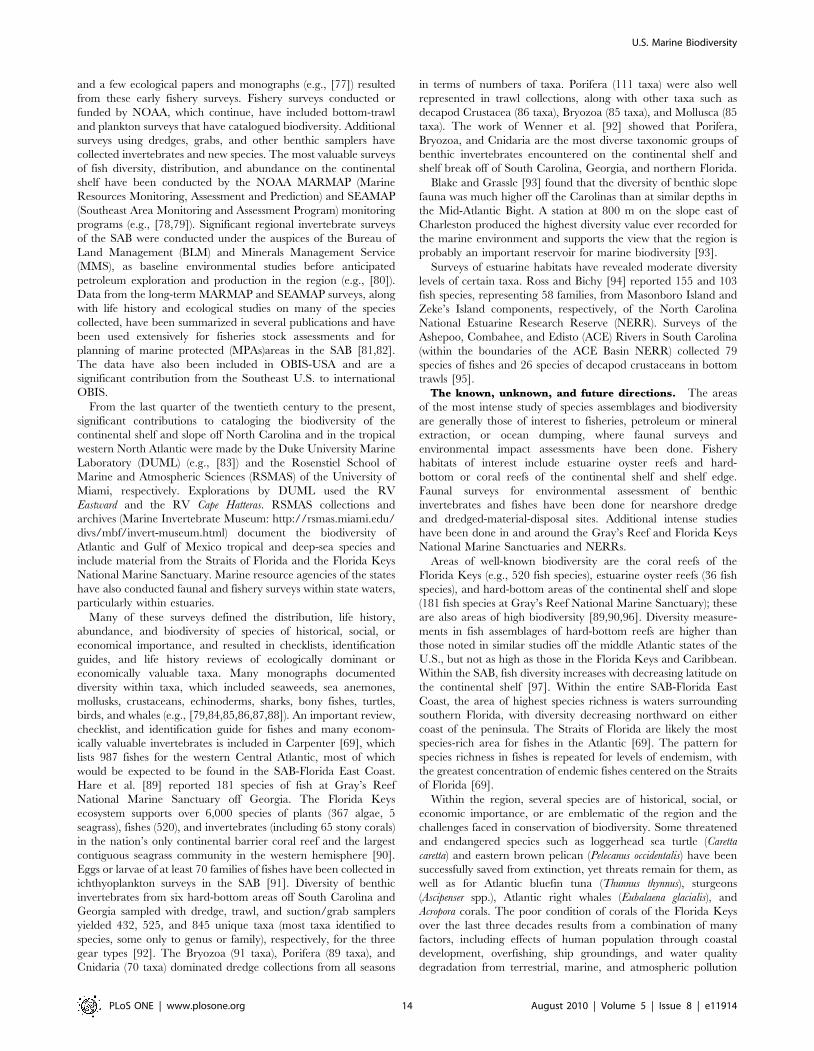
The GoM ecoregion has a strong subboreal affinity due to the
northerly sources of water entering the gulf, and restricted
exchange with the neighboring ocean (Figure 4). Water temper-
atures can be cooled to less than 5-6uC down to 100-150 m depth
by winter convection [23,24], and surface temperatures can be
slow to warm in spring. Parts of the gulf remain cool throughout
the year due to strong tidal mixing and advection of cold water in
a cyclonic (counterclockwise) coastal current system [25] (Figure 4).
Where waters become stratified during warm months, surface
temperatures exceed 20uC, while the bottom layer remains cold.
Parts of the gulf are deep enough to maintain an intermediate
water layer conditioned by winter mixing and isolated by seasonal
warming at the surface [23].
The environmental transition from GoM to Virginian ecor-
egions is fairly pronounced due to a generally steep latitudinal
gradient in atmospheric forcing as well as topographical influences
on circulation. The cyclonic circulation of the GoM and the
anticyclonic flow around Georges Bank adds to the residence time
of water before it arrives south of Cape Cod (Figure 4). In the
Virginian ecoregion, stratification and surface warming begin
earlier in the year, and summer temperatures exceed 20uC for
many months [26]. Residual circulation over the shelf is
southward, thus reducing the tendency for planktonic propagules
to be transported northward into the GoM ecoregion. However,
the ranges of many sedentary species do extend northward both
along the coast and offshore, and species show a variety of patterns
of distribution indicative of differences in spreading potential,
invasive opportunities, past conditions, and life history require-
ments [27].
Temperatures in the neighboring deep ocean are moderated by
strong northward transport of heat in the Gulf Stream, which
begins to veer eastward before reaching Georges Bank. Warm core
rings occasionally transport warm-water species to Georges Bank
and the Gulf of Maine [28,29], but these organisms are generally
out of their temperature tolerances range during winter. Slope
water systems from the north (Labrador Sea) and south (Mid-
Atlantic Bight) also meet in the region off Georges Bank and affect
not only the slope itself, but also the temperature, salinity, and
nutrient content of waters entering the deep Gulf of Maine
through the Northeast Channel [25,30]. The latitudinal thermal
gradient over the continental shelf in this region is extremely steep,
and thus is of particular interest for monitoring biodiversity
changes in a warming climate.
The Gulf of Maine is topographically and geologically complex,
containing three major basins up to 300 m deep, and numerous
smaller basins, sills, and ridges. The shoreline is also diverse,
consisting of extensive regions of metamorphic and igneous rock,
as well as sandy and gravelly shorelines of various lengths.
Marshes, small and sparse in rock-dominated sections of the coast,
are extensive along some sections of sandy coast. Rocky sections
are typically highly indented, with numerous bays, peninsulas, and
islands providing a wide variety of exposed and protected habitats.
The tidal range varies from about 3 m in the south to 16 m in the
northeastern Bay of Fundy (Minas Basin), reputedly the largest
amplitude in the world [31]. In the north, and over the crest of
Georges Bank, strong tidal shear contributes to unstratified or only
weakly stratified conditions even during warm months of the year.
Figure 4. Detail of the study area. Right panel shows shelf and slope areas used in Table 3. The line extending across the shelf and upper slope(‘‘Halifax Line’’) northeast of the Gulf of Maine marks the eastern end of the Gulf of Maine Area Program of the Census of Marine Life. The major baysand estuaries of the Virginian ecoregion are also shown. Left panel shows climatological sea surface temperature for August, 1985-2001 (data arefrom U.S. NASA Pathfinder mission, 4 km resolution). Arrows show schematic of the prevailing residual circulation (after Townsend et al. [22]).doi:10.1371/journal.pone.0011914.g004
Figure 3. Virginian and Gulf of Maine/Bay of Fundy Ecoregions, showing bathymetry and major geographic landmarks. The NewEngland Seamounts are those extending south from Georges Bank. Only the larger protected areas are shown, and they have different goals andlevels of protection.doi:10.1371/journal.pone.0011914.g003
U.S. Marine Biodiversity
PLoS ONE | www.plosone.org 7 August 2010 | Volume 5 | Issue 8 | e11914

The large, shallow banks (Nantucket Shoals, Georges Bank, and
Browns Bank) restrict exchanges between the Gulf of Maine and
the open Atlantic, and create a marginal sea distinctive from the
relatively smooth and open continental shelf to the south.
From Cape Cod to Delaware Bay, the shoreline is characterized
by mixed sandy and rocky regions, and it is predominantly sandy
deposits south to Cape Hatteras. The shelf is generally wide and
gently sloping, but narrows in the south at Cape Hatteras, which is
close to the Gulf Stream. Unlike the Gulf of Maine, the Virginian
Province has several large, shallow estuarine systems with
comparatively narrow connections to the coastal ocean: Delaware
Bay, Chesapeake Bay, and the Pamlico/Albemarle Sound system
(Figure 4). Together with Long Island Sound and Narragansett
Bay, these estuarine or estuary-like systems contribute significantly
to the total area and variety of coastal habitats along the eastern
U.S. continental shelf.
The continental slope in the north is cut by numerous
submarine canyons, remnants of drainages that formed during
periods of lower sea level. South of Cape Cod they are fewer, with
the notable exceptions of the large Hudson and Baltimore
Canyons. On the mid- to lower slope south of Georges Bank,
and within the U.S. Exclusive Economic Zone (EEZ), are four
seamounts of the New England Seamount Chain. These rise to
summit depths ranging from –1,200 m to –2,800 m, or within the
depth range of the slope. Bear Seamount, the closest and
shallowest, is 65 km from the shelf break. The seamount chain
extends a long distance toward the Corner Rise Seamounts and
the Mid-Atlantic Ridge system, possibly serving as a series of
faunal stepping-stones.
Regional history of biodiversity studies. The U.S. Fish
Commission research vessel Fish Hawk conducted the earliest
intensive surveys of the biology of the outer continental shelf in
1880, sampling with bottom dredges and trawls, opening an era of
investigation of shelf sea species and their distributions, collecting
many new taxa of mollusks and fishes. In 1882, Alabtross was
launched as the first large vessel of any nation built expressly for
marine research. Both vessels were used in extensive biological and
environmental surveys of the North American East Coast from
Newfoundland (Albatross) and the Gulf of Maine (Fish Hawk) to
Florida and elsewhere. In 1912, Henry Bryant Bigelow began his
pioneering studies of the Gulf of Maine in a joint academic and
federal fisheries investigation. Bigelow’s unique contribution to
science was to combine measurements of temperature, salinity,
plankton, circulation (drift bottles), and fishes to develop a holistic
view of the ocean and the life it supports. ‘‘Nothing in the sea falls
haphazard,’’ he wrote in a 1929 report to the National Academy
of Sciences, ‘‘if we cannot predict, it is because we do not know the
cause, or how the cause works.’’ From his work in the Gulf of
Maine (1912-28) he published treatises on the fishes [32], the
plankton [33], and the physical oceanography [34]. The original
Fishes of the Gulf of Maine, written with William W. Welsh
(posthumously) [32], has become a classic. It was updated in
subsequent editions by Bigelow and Schroeder [35] and Collette
and Klein-McPhee [36]. The latest edition includes 118 families
and 252 species, with extensive information describing the
organisms, their biology, general range, and distribution in the
Gulf of Maine. The treatises on physical oceanography and the
plankton continue to be used for comparative purposes. Fahay
[37] described the ichthyoplankton of the region from Cape
Hatteras to the Scotian Shelf in an illustrated guide to 290 species
likely to be collected by plankton or neuston nets, including some
oceanic mesopelagic and bathypelagic forms.
Scientific sampling of coastal intertidal and shallow subtidal
organisms extends back to the mid-1800s [38,39]. One area of
early focus was Cobscook Bay, near the Canadian border, where
the diversity of physical habitats and the large tidal range probably
contribute to its diverse invertebrate assemblages. In a historical
checklist of marine invertebrates from the bay (an area of only 110
km2) spanning 162 years, Trott [39] listed nearly 800 species in 17
phyla. Cobscook Bay and neighboring Passamaquoddy Bay are
subjects of joint U.S. and Canadian Census studies of intertidal
and shallow subtidal communities (NaGISA), and the history of
nearshore ecosystems (HNS). The Gulf of Maine Area Program of
the Census includes the GoM ecoregion, plus the southern and
western Scotian Shelf, the continental slope to 2,000 m, and the
western New England Seamounts.
The known, unknown, and future directions. The Census
Gulf of Maine Area Program has developed a Gulf of Maine
Register of Marine Species (GoMRMS) in collaboration with the
Huntsman Marine Science Center, Canada. GoMRMS is a
provisional list of taxa based on (1) a previous dataset from the
Bay of Fundy (1,408 species); (2) a compilation of species collected
in the Gulf of Maine area based on museum specimen holdings,
research and survey cruises, and published reports; and (3) species
expected in the Gulf of Maine area based on published faunal lists
and ranges from the Canadian Atlantic RMS. The Canadian
Atlantic Register of Marine Species (CARMS) includes species
from the Canadian and U.S. Atlantic as far south as Cape Hatteras.
Taxonomic updating and validation of GoMRMS are ongoing.
Details can be found at http://www.marinebiodiversity.ca/.
The area covered by GoMRMS is the same as the GoMA study
area (defined above), with three modifications. GoMRMS also
includes a portion of Nantucket Shoals and Nantucket Sound
south of Cape Cod; on the slope it includes depths to 1,000 m; and
it does not include the seamounts. As of 12 November 2009,
GoMRMS listed 3,141 species, about 31% of them validated for
updated taxonomy, occurrence, and other documentation (the
percentage varies by group). Because GoMRMS was designed to
support GoMA, it extends beyond the GoM ecoregion as shown in
Figure 4, thus including the Scotian Shelf ecoregion of Spalding
et al. [22]. The list of fishes (504 species) includes mesopelagic
species from research cruises off the Atlantic coast of Nova Scotia.
By contrast, the fishes listed by Collette and Klein-McPhee [36]
for the GoM include 252 species, only a third of which are
permanent residents, the remainder seasonally migrating (in
descending rank order) from the south, from deep water, and
from the north.
There is no readily comparable register of species for the
Virginian ecoregion. We constructed a preliminary list using
regional registers from the Canadian Center for Marine
Biodiversity. All species occurring between Davis Strait (Canadian
Arctic) and Cape Hatteras (contained in the Northwest Atlantic
Register of Marine Species) minus those that occur from Davis
Strait to the southern Gulf of Maine (Canadian Atlantic RMS)
amount to 952 species unique to the Virginian ecoregion. Adding
this number to the species in GoMRMS gives a total of 4,093
register species for the two marine ecoregions covered in this
section (Table S2). The relatively small number of additions
ascribed to the south is the result of a northern bias in the register
work to date, and is not a reliable reflection of biodiversity
patterns.
We examined three survey databases for potential additions to
the species already accounted for in the registers. Two databases
from the National Marine Fisheries Service (NMFS)/Northeast
Fisheries Science Center are the demersal trawl survey database
and the benthic fauna database. The trawl surveys are directed at
the assessment of living marine resources and the management of
fisheries. Using standardized methods, they have been conducted
U.S. Marine Biodiversity
PLoS ONE | www.plosone.org 8 August 2010 | Volume 5 | Issue 8 | e11914

two or more times per year since the 1960s [40,41]. The benthic
database contains records obtained using a variety of methods,
mainly in the 1960s and early 1970s [42]. For this analysis,
samples were restricted to three methods that were applied in a
similar manner in both ecoregions. Sampling methods were (1) for
shelf depths less than 200 m, the fisheries demersal trawls (as
above) and 1 m2 Campbell and 0.25 m2 Smith-McIntyre grabs
[42,43,44,45]; and (2) for the upper slope, a Campbell grab (as
above). Sample size for the slope was small, but we include the
data for interest. While both databases date back to the 1960s, the
demersal trawl survey data form the only systematic time series. A
third database is from a series of surveys of coastal waters (mostly
near shore) and major bays and estuaries along the Atlantic coast
of the U.S., conducted by the U.S. Environmental Protection
Agency (EPA) as part of its National Coastal Assessment (NCA)
from 1990 to 2004 [46,47]. Samples were obtained with small
trawl nets and modified Van Veen grabs (0.04 m2, 0.5 mm sieve).
Samples from these databases were selected so that they came
only from the GoM and Virginian ecoregions as shown in Figure 4.
All sampling methods were used to add to the species list, but only
the grab samples were used to compare the two ecoregions
because not many trawl samples were available from the Gulf of
Maine. The NCA database includes sampling sites that were
located far up some estuaries and rivers, but we used data only
from stations along the coast and near the mouths of large bays.
All three of the databases are either in OBIS or there are plans to
submit the data to OBIS in the near future. Analysis was
completed in November 2009.
After using the World Register of Marine Species (WoRMS) to
vet species names, we compared the list of species found in the three
databases with the combined GoM and Virginian list from the
registers. Species appearing in our search of the databases but not in
the registers represent 952 provisional additions to the named
species from the Northeast Continental Shelf, and a grand total of
5,045 named species. Results are summarized in Table 3, and more
detail is provided in Table S1 and Table S2. About 5% of the
species could not be vetted by WoRMS at the time of analysis, so
some errors of synonymies and identification may exist.
Table 3. Biotic diversity in the Northeast U.S. Continental Shelf Large Marine Ecosystem.
Taxonomic group Total no. species1,2 Total in registers Provisional additions from databases
Domain Archaea UD
Domain Bacteria (including Cyanobacteria) 10 (9) 10
Domain Eukarya 5,032
Kingdom Chromista 376
Phaeophyta 154 154
Kingdom Plantae 246
Chlorophyta 98 98
Rhodophyta 148 148
Angiospermae UD
Kingdom Protoctista (Protozoa) 51
Dinomastigota (Dinoflagellata) 49 49
Foraminifera 2 2
Kingdom Animalia 4,359
Porifera 36 32 4
Cnidaria 212 192 20
Platyhelminthes 77 76 1
Mollusca 868 687 181
Annelida 689 445 244
Crustacea 810 549 261
Bryozoa 138 76 62
Echinodermata 138 73 65
Urochordata (Tunicata) 44 42 2
Other invertebrates 173 140 33
Vertebrata (Pisces) 954 877 77
Other vertebrates 220 220
SUBTOTAL 5,042 4,090 952
TOTAL REGIONAL DIVERSITY3 5,045# 4,093 952
Notes: Summary of named species from regional registers and provisional additions from three regional databases as of November 2009 (see text for details).1Sources of the reports: databases, scientific literature, books, field guides, technical reports, and personal communication with taxonomic experts.2Identification guides cited in Text S2.3Includes all taxonomic groups as reported in Table S1.UD = Listed in work but number undetermined to date.# = three unclassified Protoctista species bring the sub-total (5,042) to the total diversity (5,045).doi:10.1371/journal.pone.0011914.t003
U.S. Marine Biodiversity
PLoS ONE | www.plosone.org 9 August 2010 | Volume 5 | Issue 8 | e11914

We also examined the databases for species occurring in one or
both ecoregions (summarized in Table 4). The data show more
than twice the number of fish species in the south (364 vs. 154
demersally caught species). Also, relatively few species are unique
to the GoM, while a large number are unique to the Virginian
region. [Note: these are species caught by demersal trawls, and not
the full species list.] For the benthic invertebrates on the shelf,
sampling effort was not equally distributed by method between the
two ecoregions (a potential source of bias), and only the pooled
results are shown. In the pooled assessment, the southern
ecoregion showed a third more total species and more than twice
as many unique species. The nearshore data show similar patterns.
The slope regions contain a small number of samples and a little
over 100 identified species in each ecoregion, about half of which
were unique to that region. Taxonomic details of the database
findings are given in Table S3. The three databases contain 2,356
species, providing spatial information on nearly half of the total
named species (n = 5,045, Table 3) in this report. This assessment
provides only a preliminary view of the information, and more
detailed analysis is needed. Many species that overlap the two
ecoregions on the shelf do so primarily in the southern Gulf of
Maine and Georges Bank, and species occurrences do not reflect
patterns of abundance or dominance. Ecoregion size and sample
sizes have not been factored in.
Other sources of data, such as East Coast plankton surveys will
add to this list over time, but they are not as accessible at present
and some are regional in nature. The EPA/NCA database
includes many estuarine samples that we did not include here.
North of our study area are two other sources of spatially explicit
biodiversity data worth mentioning. These are trawl surveys,
comparable to the U.S. survey, conducted by the Canadian
Department of Fisheries and Oceans and also available through
OBIS, and a species compilation for the Gulf of St. Lawrence,
which is divided into spatial subunits [48]. The diversity of marine
invertebrates has been published [48](2,214 species), and data for
all taxa are available upon request (http://www.qc.ec.gc.ca/
faune/biodiv/en/methods/data_access.html). Other significant
databases containing biodiversity information are listed in Table
S4; Text S2 provides a list of useful taxonomic and field guides.
Underused databases represent a wealth of potential informa-
tion, but are still far from complete. Effective stewardship of
marine resources requires new sampling capabilities in remote, as
well as accessible, parts of the sea. Exploration requires tools for
rapid quantitative measurements at scales from small to very large.
Two recent developments in the northeastern U.S. illustrate these
two ends of the spectrum. At the small to medium scale, imaging
and image-processing technology are opening up opportunities for
rapid assessment of benthic communities [49]. At the large scale,
new acoustic sampling technology is enabling long-distance,
synoptic, and high-frequency observation of the density, distribu-
tion, and behavior of large schools of fish [50,51]. Both are rooted
in the basic exploration of patterns in nature, but have potentially
important applications for understanding and managing human
impacts on marine ecosystems. The establishment of marine and
shoreland protected areas, long-term ecological research sites, and
other types of natural heritage sites provides means for conserving
and studying biodiversity, as well as educating the public about the
aesthetic and practical benefits of managing for biodiversity
maintenance [52].
Trouble spots and emerging issues. Virtually all of the
issues cited below are common to other regions of the U.S. and
many other countries. We focus on providing citations for recent
work in our region.
The greatest immediate threats to regional marine biodiversity
are the direct and indirect effects of fishing, which has been
conducted at intense, industrial levels for half a century or more.
Fishing impacts on biodiversity include severe reductions in upper-
trophic-level predators and cascading responses through lower
parts of the food web [53,54,55]. Selective removals (spatially or
by size) can have genetic and population structural effects, with
consequences for resilience and adaptation of the populations, and
fishing activities alter the structure of bottom communities [56,57].
The entire region, but particularly the northeast, is faced with the
challenge of sustaining or restoring productive and economically
viable fisheries while also taking meaningful steps to conserve
biodiversity and the ecosystem functions and adaptability that
depend on it.
A second challenge, now increasingly apparent in the region, is
global change, which brings alterations in temperature, circula-
tion, acidification, and sea level. Rising temperatures and shifts in
organism distributions, phenology, and composition have been
noted by numerous authors [26,58,59,60,61], and acidification
threatens many important components of the regional biota
[14,62].
Along the coast, the effects of human encroachment and activity
on coastal habitats reduces the amount of natural space,
introduces pollutants, and impedes natural adjustments to the
shore as sea level increases [63]. Eutrophication and hypoxia have
become problems in more densely populated regions [64,65], and
seagrass communities in the northeast have been in decline, in
keeping with a worldwide trend [66]. Invasive species, of which
there are now many in eastern U.S. waters, represent yet another
way that natural biodiversity of the region is being altered by
human activities.
The Census of Marine Life contribution to the Northeast
Continental Shelf region. To improve understanding of
patterns and processes that support marine biodiversity, the
Census program has focused attention on the extensive task of
Table 4. Species from demersal fish and benthic surveys using the same methods across both the Gulf of Maine/Bay of Fundy andthe Virginian ecoregions of the Northeast U.S. Continental Shelf Large Marine Ecosystem.
Ecoregion Fish - Shelf Invertebrates - Shelf Invertebrates – Upper Slope
I. Species numbers GoM only 9 220 49
Both 145 619 59
Virginian only 219 499 59
II. Number of samples GoM 5,579 2,091 42
Virginian 6,973 3,079 94
Notes: The numbers are species unique to each ecoregion, or that occur in both.doi:10.1371/journal.pone.0011914.t004
U.S. Marine Biodiversity
PLoS ONE | www.plosone.org 10 August 2010 | Volume 5 | Issue 8 | e11914

documenting what lives in the ocean. The Gulf of Maine Register
of Marine Species (GoMRMS) developed by the Census Gulf of
Maine Area Program represents a major advance in compiling
biodiversity information for this region.
Southeast United States Continental Shelf Large MarineEcosystem
Description of the South Atlantic Bight and Florida East
Coast region. The region includes marine habitats from Cape
Hatteras, North Carolina to West Palm Beach, Florida, an area
often referred to as the South Atlantic Bight or SAB [67]), plus the
remaining southeast coast of Florida, including the Florida Keys
(Figure 5). This large, complex, and diverse area, with Cape
Hatteras, North Carolina and Cape Canaveral, Florida as well-
recognized zoogeographic boundaries, extends seaward to the
limit of the U.S. EEZ. Thus, it includes areas beyond the 200 m
depth contour (generally considered the outer boundary of coastal
and shelf realms, provinces, and ecoregions [22]) and
encompassing the waters of the continental slope, Blake Plateau,
and the Straits of Florida. For the purposes of this summary, the
area considered will be called the SAB-Florida East Coast. For
comparison with other biogeographic descriptions, it includes part
of the Temperate North Atlantic Realm that contains the Warm
Temperate Northwest Atlantic Province, and within that the
Carolinian Ecoregion, and the subtropical zone (northern quarter
and western Atlantic portions) of the Western Central Atlantic
area (Fishing Area 31) of the Food and Agriculture Organization
(FAO) of the United Nations.
Circulation, hydrography, and most marine habitats and
ecosystems of the SAB-Florida East Coast have been well studied
(see Atkinson and others [67,68,69] for useful summaries and
citations of additional reviews and original studies). The region is
dominated hydrographically by the Gulf Stream, which has a
major influence on the fauna. Bottom type and topography are
also important determinants of diversity, as well as having an
influence on circulation and recruitment of larvae. The Gulf
Stream is formed from the Florida Current that originates in the
tropical Atlantic. The Florida Current, in turn, originates in the
Gulf of Mexico as the Loop Current and along the Eastern
Caribbean as the Antilles Current. Counter currents and gyres
created by bottom features such as the Pourtales Terrace in the
Florida Current and the Charleston Bump in the Gulf Stream help
retain the pelagic larvae within the area of the Florida Keys and
SAB, respectively, by causing persistent gyres and eddies that spin
off the current and retain their pelagic flora and fauna, some of
which recruit to benthic and pelagic habitats in the region. The
Carolina capes and their seaward shoals, along with the broad
shelf (up to 200 km), also influence Gulf Stream flow and result in
retention of water masses and their pelagic larvae in gyres between
the capes. The Virginia Current, originating in the Labrador
Current to the north, flows southward along the middle Atlantic
states of the U.S. and occasionally rounds Cape Hatteras, bringing
cooler water and larvae of cold-temperate species into the region,
where they become temporary or longer-term residents. The
region thus has a high diversity of cold-temperate, warm-
temperate, and tropical species.
The warming influence of the Gulf Stream in the SAB is
especially notable from January through March near the shelf
break, where tropical species of fishes, corals, and other animals
are found. A warm band of relatively constant temperature (18-
22uC) and salinity (36.0-36.2 psu) is observed near the bottom
year-round just inshore of the shelf break, bounded by seasonally
variable waters on the inshore side, and by fluctuating waters
subject to cool-water upwelling events and warm Gulf Stream
intrusions on the offshore side.
Fresh water input in the SAB is supplied mainly by the Cape
Fear, Pee Dee, Santee, Savannah, and Altamaha rivers. In South
Florida, land reclamation and water management projects have
diverted most flow from the Everglades (which formerly flowed
into Florida Bay) into the Atlantic and Gulf of Mexico. River
runoff is highest during March and April, and tropical weather
systems provide additional freshwater input from June through
October, particularly in South Florida. Seasonal heating and
cooling of coastal and shelf waters follow a trend in air
temperature increase and decrease, with a lag of approximately
one month.
Semidiurnal tides dominate, the range varing considerately
because of differing shelf widths. The maximum coastal tides of 2.2
m occur at Savannah, where the shelf is widest, and decrease to
1.3 m at Cape Fear and 1.1 m at Cape Canaveral. Tidal range in
the Florida Keys and Florida Bay is less than 1 m.
Small frontal eddies and meanders propagate northward along
the western edge of the Gulf Stream every 1-2 weeks, providing
small-scale upwelling of nutrients along the shelf break of the SAB.
In two areas of the SAB upwelling of nutrient-rich deep water is
more permanent. The one just north of Cape Canaveral is caused
by diverging isobaths; the other, which is larger and stronger, and
which occurs between 32u and 33u N and results from a deflection of
the Gulf Stream offshore by the topographic irregularity known as
the Charleston Bump. The consistent upwelling of nutrient-rich
deep waters in this region is the main steady source of nutrients near
the shelf break within the entire SAB, and contributes significantly
to primary and secondary production in the region. Eddy formation
along the inshore edge of the Gulf Stream results in retention of eggs
and larvae and their transport onshore. In the Straits of Florida, a
westward-flowing countercurrent inshore of the Florida Current,
and cyclonic gyres spun off the Florida current (such as the Pourtales
Gyre associated with the Pourtales Terrace), similarly retain pelagic
larvae in the area of the Florida Keys.
The width of the continental shelf varies from just a few
kilometers off West Palm Beach south through the Florida Keys, to
200 km wide off Brunswick and Savannah, Georgia. The gently
sloping shelf (about 1m/km) in the SAB can be divided into the
following zones:
N Inner shelf (0-20 m), dominated by tidal currents, river runoff,
local wind forcing, and seasonal temperature changes;
N Middle shelf (21-40 m), where waters are dominated by winds
but influenced by the Gulf Stream. Stratification of the water
column changes seasonally, with mixed conditions from
October through March and vertical stratification from June
through September. Strong stratification allows upwelled
waters (caused by the effect of bottom topography on the
Gulf Stream) to advect farther onshore near the bottom and, at
the same time facilitates offshore spreading of lower-salinity
water in the surface layer; and
N Outer shelf (41-75 m), dominated by the Gulf Stream. The
shelf break generally occurs at about 50 m depth, but is
shallower southward off Florida and deeper off North
Carolina.
Temperature and salinity of shelf waters fluctuate seasonally
(from 10 to 29uC and from 33.0 to 36.5 psu), whereas warm and
salty surface Gulf Stream waters are much less variable. Off of
South Florida through the ocean side of the Florida Keys, the shelf
is narrow, capped by coral reefs out to the shelf edge, and under
the influence of the warm tropical Florida Current.
U.S. Marine Biodiversity
PLoS ONE | www.plosone.org 11 August 2010 | Volume 5 | Issue 8 | e11914

Figure 5. The SAB-Florida East Coast Large Marine Ecosystem. The large red arrow represents the Gulf Stream.doi:10.1371/journal.pone.0011914.g005
U.S. Marine Biodiversity
PLoS ONE | www.plosone.org 12 August 2010 | Volume 5 | Issue 8 | e11914

The continental shelf of the SAB consists of sand/shell bottom,
interspersed with rocky outcrops, which are particularly prominent
along the shelf break in depths from 45 to 60 m. Sand- and mud-
bottom areas of the continental shelf and slope support less
biomass and lower diversity of species than hard-bottom areas, but
sustain a few important fishery species, such as tilefish (Lopholatilus
chamaeleonticeps), flounders (Paralichthys spp.), sciaenids (drums and
croakers), and calico scallop (Argopecten gibbus). Coastal sand/mud
bottom is an important habitat for penaeid shrimp, and a seasonal
bottom-trawl fishery occurs along much of the coast of the region.
Hard-bottom areas of the continental shelf throughout the SAB
support a warm-temperate or tropical fauna, owing to structurally
complex rocky reef formations and the proximity of warm Gulf
Stream waters. The rocky outcrops from North Carolina south to
Cape Canaveral and the ridges off South Florida function as reefs
and provide substrate for a great diversity and biomass of sessile
invertebrates and algae. Diverse assemblages of polychaetes,
mollusks, crustaceans, echinoderms, and other invertebrates
inhabit the attached sponges, corals, and ascidians and shelter in
the complex rocky bottom. Reef fish assemblages of economically
valuable snappers (Lutjanidae), groupers (Serranidae), grunts
(Haemulidae), porgies (Sparidae), and diverse tropical families
such as wrasses (Labridae), damselfishes (Pomacentridae), and
others are associated with the complex hard bottom. The areal
extent and distribution of productive live bottom habitat on the
continental shelf north of Cape Canaveral have not been
completely mapped: estimates of extent range from 4 to 30% of
the shelf area [68].
South of Cape Canaveral, a ridge system parallel to the
shoreline of Florida exists along drowned coral reef tracts; these
coral reefs and worm-tube and coquina-shell reefs in shallow water
harbor many reef species. South of Miami, the Florida Keys
contain the only system of shallow reef-building corals in the
continental U.S. Although lower in coral diversity than the nearby
Caribbean Sea, these reefs contain a high diversity of other
invertebrates and fishes. Whereas the shelf break in the SAB
occurs at about 50 m depth, in the Keys it occurs in depths from
10 to 20 m. The Florida reef tract extends in a curve of about 370
km and encompasses 6,000 patch reefs and well-developed spur-
and-groove and shelf-edge coral ridge formations.
Saltmarshes and estuaries, which are particularly well developed
along the southeast coast [70], include 24,000 km2 of coastal
wetlands, including 3,600 km2 of salt and brackish marsh. The
region from Cape Hatteras, North Carolina, through the Dry
Tortugas, Florida, includes about 1,700 km of coast interrupted by
hundreds of rivers, sounds, estuaries, and inlets that provide a wide
diversity of habitats. About 1,000 km of this encompasses the SAB
embayment between Cape Hatteras and Cape Canaveral that
includes a band (up to 12 km wide) of salt marsh and tidal creeks
that serve as important nursery habitat and are particularly well
developed off South Carolina and Georgia. The Indian River
Lagoon, Biscayne Bay, and Florida Bay estuaries are fringed by
mangroves and include mangrove islets, with associated attached
epifauna and motile invertebrates and fishes. The Indian River
Lagoon system is particularly high in diversity because of tropical
influences. These estuaries are important nursery areas for many
marine fishes that spend their adult lives offshore.
The continental slope off the southeastern U.S. is unusual in
that a large part of it is interrupted by the relatively flat Blake
Plateau that separates the inshore Florida-Hatteras slope (200-500
m) and the offshore Blake Escarpment (1,000-3,000 m). The fauna
of the slope and Blake Plateau is poorly known because of the
difficulty of sampling deep, hard rocky bottoms under the swift
Gulf Stream current. The hard bottoms of the Blake Plateau are
colonized by a wide variety of deep-sea sponges and corals, and in
some places the corals have formed significant mound and ridge
systems (up to 150 m tall) with associated sponges, other
cnidarians, mollusks, polychaetes, crustaceans, echinoderms, and
fishes (see review in [71]).
Regional history of biodiversity studies. Surveys and
collections of marine organisms of southeastern North America
began during the U.S. colonial period (seventeenth and eighteenth
centuries), and early work included Catesby’s (1731-43)
publication of The Natural History of Carolina, Florida, and the
Bahama Islands [72] (see Pietsch and Anderson [73] for reviews of
additional early collections of marine vertebrates). These two
volumes contained descriptions and a checklist of many marine
crustaceans, fishes, turtles, birds, and mammals. Many collections
were sent to Europe for study during the American colonial
period, and checklists of marine species were compiled as studies of
the specimens were published. Of particular note were the
collections of Alexander Garden of Charleston, South Carolina,
who collected what were used as type specimens for original
descriptions of regionally emblematic species such as striped mullet
(Mugil cephalus), mummichog (Fundulus heteroclitus), black sea bass
(Centropristis striata), and bluefish (Pomatomus saltatrix), among many
others. William Bartram, in his Travels Through North and South
Carolina, Georgia, East and West Florida… and John Edwards
Holbrook, in several publications, provided descriptions and
checklists of additional coastal marine fishes from South
Carolina, Georgia, and Florida [73].
Early exploratory studies offshore along the Atlantic coast of the
southeastern U.S. concentrated on finding exploitable fish
populations. From 1877 to 1880, the U.S. Coast and Geodetic
Survey (a predecessor agency of the current National Oceanic and
Atmospheric Administration, NOAA) conducted exploratory
surveys aboard the steamer Blake along the Atlantic coast to
Florida, the Gulf of Mexico, and the Caribbean, in addition to a
cruise northward into the Gulf of Maine [74]. These surveys were
aimed primarily at bottom-living organisms. Agassiz [74] de-
scribed habitats (including important hard-bottom and sponge-
coral habitats of the southeastern shelf), oceanographic features
(including the Blake Plateau, other bottom features, and the Gulf
Stream), and organisms (including many new genera and species)
of the continental shelf and deep sea of the region, and noted
similarities and differences between the fauna and that of the
Caribbean to the south. The Gulf Stream was noted as a major
influence on faunal composition on the outer continental shelf;
cold-temperate benthic species were found inshore and offshore of
the Gulf Stream on bottoms of a variety of types. These early
descriptions of deep corals collected on the Blake Plateau, along
with recent concern for damage to fragile deep-coral habitats by
fishing, have led to recent exploration of deep coral banks and
other deep habitats in the SAB-Florida East Coast area (see
NOAA Ocean Exploration, below). Descriptions of oceanic fishes
from early expeditions (including those of the Blake) were
summarized in 1896 by Goode and Bean [75].
Since the mid-twentieth century, NOAA and its predecessor
agencies (e.g., the Bureau of Commercial Fisheries) have explored
habitats and their natural resources off the coast of the
southeastern U.S. Beginning in the 1950s, ships such as Silver
Bay, Pelican, Oregon, and Gill conducted exploratory fishing surveys
using trawl nets. These early surveys found concentrations of
snappers, groupers, and other economically valuable fishes
associated with rocky outcrops and other hard-bottom reefs on
the continental shelf and shelf-edge. They also documented the
significant fishery resources (drums, flatfishes, mullets, herrings,
shrimps) of soft-bottom communities. Many taxonomic (e.g., [76])
U.S. Marine Biodiversity
PLoS ONE | www.plosone.org 13 August 2010 | Volume 5 | Issue 8 | e11914
and a few ecological papers and monographs (e.g., [77]) resulted
from these early fishery surveys. Fishery surveys conducted or
funded by NOAA, which continue, have included bottom-trawl
and plankton surveys that have catalogued biodiversity. Additional
surveys using dredges, grabs, and other benthic samplers have
collected invertebrates and new species. The most valuable surveys
of fish diversity, distribution, and abundance on the continental
shelf have been conducted by the NOAA MARMAP (Marine
Resources Monitoring, Assessment and Prediction) and SEAMAP
(Southeast Area Monitoring and Assessment Program) monitoring
programs (e.g., [78,79]). Significant regional invertebrate surveys
of the SAB were conducted under the auspices of the Bureau of
Land Management (BLM) and Minerals Management Service
(MMS), as baseline environmental studies before anticipated
petroleum exploration and production in the region (e.g., [80]).
Data from the long-term MARMAP and SEAMAP surveys, along
with life history and ecological studies on many of the species
collected, have been summarized in several publications and have
been used extensively for fisheries stock assessments and for
planning of marine protected (MPAs)areas in the SAB [81,82].
The data have also been included in OBIS-USA and are a
significant contribution from the Southeast U.S. to international
OBIS.
From the last quarter of the twentieth century to the present,
significant contributions to cataloging the biodiversity of the
continental shelf and slope off North Carolina and in the tropical
western North Atlantic were made by the Duke University Marine
Laboratory (DUML) (e.g., [83]) and the Rosenstiel School of
Marine and Atmospheric Sciences (RSMAS) of the University of
Miami, respectively. Explorations by DUML used the RV
Eastward and the RV Cape Hatteras. RSMAS collections and
archives (Marine Invertebrate Museum: http://rsmas.miami.edu/
divs/mbf/invert-museum.html) document the biodiversity of
Atlantic and Gulf of Mexico tropical and deep-sea species and
include material from the Straits of Florida and the Florida Keys
National Marine Sanctuary. Marine resource agencies of the states
have also conducted faunal and fishery surveys within state waters,
particularly within estuaries.
Many of these surveys defined the distribution, life history,
abundance, and biodiversity of species of historical, social, or
economical importance, and resulted in checklists, identification
guides, and life history reviews of ecologically dominant or
economically valuable taxa. Many monographs documented
diversity within taxa, which included seaweeds, sea anemones,
mollusks, crustaceans, echinoderms, sharks, bony fishes, turtles,
birds, and whales (e.g., [79,84,85,86,87,88]). An important review,
checklist, and identification guide for fishes and many econom-
ically valuable invertebrates is included in Carpenter [69], which
lists 987 fishes for the western Central Atlantic, most of which
would be expected to be found in the SAB-Florida East Coast.
Hare et al. [89] reported 181 species of fish at Gray’s Reef
National Marine Sanctuary off Georgia. The Florida Keys
ecosystem supports over 6,000 species of plants (367 algae, 5
seagrass), fishes (520), and invertebrates (including 65 stony corals)
in the nation’s only continental barrier coral reef and the largest
contiguous seagrass community in the western hemisphere [90].
Eggs or larvae of at least 70 families of fishes have been collected in
ichthyoplankton surveys in the SAB [91]. Diversity of benthic
invertebrates from six hard-bottom areas off South Carolina and
Georgia sampled with dredge, trawl, and suction/grab samplers
yielded 432, 525, and 845 unique taxa (most taxa identified to
species, some only to genus or family), respectively, for the three
gear types [92]. The Bryozoa (91 taxa), Porifera (89 taxa), and
Cnidaria (70 taxa) dominated dredge collections from all seasons
in terms of numbers of taxa. Porifera (111 taxa) were also well
represented in trawl collections, along with other taxa such as
decapod Crustacea (86 taxa), Bryozoa (85 taxa), and Mollusca (85
taxa). The work of Wenner et al. [92] showed that Porifera,
Bryozoa, and Cnidaria are the most diverse taxonomic groups of
benthic invertebrates encountered on the continental shelf and
shelf break off of South Carolina, Georgia, and northern Florida.
Blake and Grassle [93] found that the diversity of benthic slope
fauna was much higher off the Carolinas than at similar depths in
the Mid-Atlantic Bight. A station at 800 m on the slope east of
Charleston produced the highest diversity value ever recorded for
the marine environment and supports the view that the region is
probably an important reservoir for marine biodiversity [93].
Surveys of estuarine habitats have revealed moderate diversity
levels of certain taxa. Ross and Bichy [94] reported 155 and 103
fish species, representing 58 families, from Masonboro Island and
Zeke’s Island components, respectively, of the North Carolina
National Estuarine Research Reserve (NERR). Surveys of the
Ashepoo, Combahee, and Edisto (ACE) Rivers in South Carolina
(within the boundaries of the ACE Basin NERR) collected 79
species of fishes and 26 species of decapod crustaceans in bottom
trawls [95].
The known, unknown, and future directions. The areas
of the most intense study of species assemblages and biodiversity
are generally those of interest to fisheries, petroleum or mineral
extraction, or ocean dumping, where faunal surveys and
environmental impact assessments have been done. Fishery
habitats of interest include estuarine oyster reefs and hard-
bottom or coral reefs of the continental shelf and shelf edge.
Faunal surveys for environmental assessment of benthic
invertebrates and fishes have been done for nearshore dredge
and dredged-material-disposal sites. Additional intense studies
have been done in and around the Gray’s Reef and Florida Keys
National Marine Sanctuaries and NERRs.
Areas of well-known biodiversity are the coral reefs of the
Florida Keys (e.g., 520 fish species), estuarine oyster reefs (36 fish
species), and hard-bottom areas of the continental shelf and slope
(181 fish species at Gray’s Reef National Marine Sanctuary); these
are also areas of high biodiversity [89,90,96]. Diversity measure-
ments in fish assemblages of hard-bottom reefs are higher than
those noted in similar studies off the middle Atlantic states of the
U.S., but not as high as those in the Florida Keys and Caribbean.
Within the SAB, fish diversity increases with decreasing latitude on
the continental shelf [97]. Within the entire SAB-Florida East
Coast, the area of highest species richness is waters surrounding
southern Florida, with diversity decreasing northward on either
coast of the peninsula. The Straits of Florida are likely the most
species-rich area for fishes in the Atlantic [69]. The pattern for
species richness in fishes is repeated for levels of endemism, with
the greatest concentration of endemic fishes centered on the Straits
of Florida [69].
Within the region, several species are of historical, social, or
economic importance, or are emblematic of the region and the
challenges faced in conservation of biodiversity. Some threatened
and endangered species such as loggerhead sea turtle (Caretta
caretta) and eastern brown pelican (Pelecanus occidentalis) have been
successfully saved from extinction, yet threats remain for them, as
well as for Atlantic bluefin tuna (Thunnus thynnus), sturgeons
(Ascipenser spp.), Atlantic right whales (Eubalaena glacialis), and
Acropora corals. The poor condition of corals of the Florida Keys
over the last three decades results from a combination of many
factors, including effects of human population through coastal
development, overfishing, ship groundings, and water quality
degradation from terrestrial, marine, and atmospheric pollution
U.S. Marine Biodiversity
PLoS ONE | www.plosone.org 14 August 2010 | Volume 5 | Issue 8 | e11914

(including temperature increases). In a notice published on 12
February 2010, NMFS announced it will evaluate the status of 82
species of stony coral that the Center for Biological Diversity has
asked to be listed as threatened or endangered under the
Endangered Species Act. These include Montastrea spp., which
form large colonies and are important in building reefs of the
Florida Keys, and Oculina varicosa, which occurs on deep reefs in
the region.
Within the pelagic realm, the pelagic brown algae Sargassum
natans and S. fluitans (gulfweed) form a complex but dynamic
habitat used by a diversity of cnidarians, bryozoans, crustaceans,
polychaetes, and other invertebrates, as well as juveniles and adults
of many fishes [98].
Deeper faunas of the continental slope and abyss are less well
known than those of shelf areas, but were described in early
explorations, and by Menzies et al. [83]. In recent years, the
NOAA Office of Ocean Exploration has funded collections and
submersible observations of deep-reef and other habitats of the
SAB, and additional checklists of species and descriptions of their
habitats are emerging. Such studies on deep corals and sponges
have revealed a high diversity of polychaetes, mollusks, and
crustaceans associated with large sessile epifauna [99]. This is an
area for additional exploration. The biodiversity of inquiline
species is apparently high, but only a few individuals of a few
species of sponge, coral, and ascidian have been examined for
associated endofauna. A range of hosts, especially in deep water, is
unexamined and may contain a great diversity of endofauna.
Poorly known geographic areas include the complex hard bottom
of the Blake Plateau and Charleston Bump, including deep coral
habitats. Recent submersible explorations have resulted in
collection of previously poorly known or rare species, which have
been shown with further exploration to be quite common (e.g.,
[100,101]). Planktonic communities and microbes of benthic and
pelagic habitats are poorly known. All ‘‘bioengineered’’ habitats
such as coral banks, worm-tube mounds and reefs, sponge reefs,
tilefish burrows, red grouper (Epinephelus morio) excavations, and
similar structures are special habitats that are poorly studied and
have interesting and complex symbiotic relationships.
Areas of relatively low biodiversity include lower reaches of
estuaries, anoxic areas, and sand/mud bottom of the shelf. Anoxic
dead zones do not naturally occur in the region, but the deep
reaches of some dredged estuaries are anoxic. Most sampling has
been directed at structurally complex hard bottoms because of
their importance in fisheries and as potential areas of petroleum
deposits, so low-diversity habitats such as sand and mud bottom
may need additional study to determine the factors that affect
biodiversity in the region.
Assemblages of fishes support important fisheries. Because of the
diversity of species and life history strategies, and the nonselective
nature of some fishing gear, traditional management by imposing
limits on individual species is difficult. In addition, the complex
ecological relationships among targeted species and their preda-
tors, prey, and habitats are poorly understood, thus delaying the
development of ecosystem-based management. Additional study of
assemblages, and of the interrelationships of the species in those
communities, is needed.
Much of the taxonomic literature for the region is scattered in
descriptions of single species and in monographs on higher taxa,
including families, orders, and classes. Much taxonomic and
ecological research deals with more than one LME, making it
difficult to assess the biodiversity of the region. Compiling
regional checklists and identification guides is needed to provide
baseline data on biodiversity of the region. Current knowledge of
the biota of the Southeast U.S. Continental Shelf LME is
summarized in Table 5; more detail is provided in Table S1 and
Table S5.
Trouble spots and emerging issues. In addition to general
degradation of water quality, increasing sea temperature, and
ocean acidification, many habitats in the region are threatened by
overfishing and coastal development. Overfishing has severely
depleted populations of top-level demersal predatory fishes such
as sharks, snappers, groupers, and jacks (Carangidae). Populations
of pelagic sharks, tunas, and mackerels (Scombridae) are also
currently or periodically overfished. Fishing pressure and demand
remain high, and management is often slow to respond. Man-
agement efforts are aimed at restoring sustainable stocks of
individual species, and little effort has historically been made to
restore sustainable functioning ecosystems.
Efforts at restoring some endangered and threatened species
have been successful, as in the cases of the eastern brown pelican
and loggerhead sea turtle. However, marine mammals, such as
Atlantic right whale and the Florida manatee, are still endangered.
Reef-forming corals of the Florida Keys are declining [90], and
decades of fishing on aggregations of spawning reef fishes have
Table 5. Biotic diversity in the Southeast U.S. ContinentalShelf Large Marine Ecosystem.
Taxonomic group No. species1,2
Domain Archaea UD
Domain Bacteria (including Cyanobacteria) 48 (16)
Domain Eukarya 4,229
Kingdom Chromista 217
Phaeophyta 217
Kingdom Plantae 113
Chlorophyta 65
Rhodophyta 38
Angiospermae 10
Kingdom Protoctista (Protozoa) 165
Dinomastigota (Dinoflagellata)
Foraminifera 165
Kingdom Animalia 3,734
Porifera 111
Cnidaria 362
Platyhelminthes
Mollusca 698
Annelida 400
Crustacea 696
Bryozoa 91
Echinodermata
Urochordata (Tunicata) 35
Other invertebrates 41
Vertebrata (Pisces) 1200
Other vertebrates 100
TOTAL REGIONAL DIVERSITY3 4,277
Notes:1Sources of the reports: databases, scientific literature, books, field guides,technical reports, and personal communication with taxonomic experts.
2Identification guides cited in Text S2.3Includes all taxonomic groups as reported in Tables S1 and S5.UD = Listed in work but number undetermined to date.doi:10.1371/journal.pone.0011914.t005
U.S. Marine Biodiversity
PLoS ONE | www.plosone.org 15 August 2010 | Volume 5 | Issue 8 | e11914
resulted in declining abundance in aggregations. Recent
protection of spawning sites has reversed this trend for mutton
snapper (Lutjanus analis) [102], and may be effective for other
species.
Efforts at designating reef areas as no-fishing zones have been
successful in restoring populations of top-level predatory fishes in
the Florida Keys [103], and recent implementation of small areas
where bottom fishing is not allowed in the SAB show promise of
restoring predators in those areas as well. The small MPAs in the
SAB will be useful in providing data on how no-take zones
established for the conservation of habitat and restoration of
fishery species affect sustainable fisheries and biodiversity.
Unfortunately, those areas now have large populations of the
invasive lionfish (Pterois spp.), first discovered in the MPAs in 2002,
before designation. Because lionfish have no predators in this
system and they prey on small fishes, including new recruits, their
impact on endemic fish population recovery and restoration within
the new MPAs is a concern.
The fisheries operating in the Western Central Atlantic land the
greatest diversity of fishes of any Atlantic region [69], and
nonselective fishing gear, invasive species, environmental factors
beyond the control of the South Atlantic Fishery Management
Council (SAFMC) (e.g., global change), along with the high
biodiversity, will continue to make management for sustainable
fisheries and conservation of biodiversity a difficult task.
Several MPAs exist in the region. In addition to three National
Marine Sanctuaries (Monitor, Gray’s Reef, and Florida Keys), the
SAFMC established special zones to protect banks of ivory tree
coral (Oculina varicosa) on the upper slope off Florida [71] (Figure 5).
In 1984, the SAFMC designated the Oculina Bank as a Habitat
Area of Particular Concern (HAPC). This action closed an area of
92 km2 to trawling, dredging, longlining, and trapping, and
established other restrictions. In 1994, the SAFMC created the
Experimental Oculina Research Reserve, closing the area to all
bottom fishing indefinitely. These restrictions were put into place
to protect spawning reef fishes, restore reef fish stocks, and protect
particularly sensitive habitats or species assemblages of the coral
and associated organisms that include at least 350 invertebrate
species [71,104]. An additional large HAPC has been approved by
the SAFMC to protect deep (more than 400 m) banks of the coral
Lophelia and other coral banks on the Blake Plateau and the Straits
of Florida. These efforts are expected to have positive impacts on
the conservation of biodiversity.
In February 2009, the SAFMC established eight no-bottom-
fishing zones on the outer continental shelf between southern
North Carolina and the Florida Keys ranging in area from 27 to
514 km2. These small areas are aimed at protecting deepwater reef
species and providing areas where a natural reef ecosystem can
function.
The region contains several NERRs. These include the North
Carolina NERR (which encompasses four sites from Currituck
Banks south to Masonboro Island); North Inlet-Winyah Bay
NERR and ACE Basin NERR, South Carolina; Sapelo Island
NERR, Georgia; and Guana Tolomato Matanzas NERR,
northeast Florida. These areas comprise large shallow sounds
and other estuarine lagoons and tidal creeks, relatively pristine
saltmarsh, mangrove and other wetlands, subtidal seagrass and
oyster beds, and upland maritime forest.
The Charleston Bump has seasonal fisheries closures, pelagic
longline in February-April and bottom wreckfish (Polyprion
americanus) in January-April. Thus, for much of the period from
mid-January to mid-April, little or no fishing occurs on the
Charleston Bump. The Charleston Bump is included in the deep-
sea coral HAPC under consideration by the SAFMC.
In spite of recent measures to protect offshore habitats, coastal
development continues to have an impact on habitats of estuarine
species and estuarine-dependent stages of shelf species. Coral reefs
are in decline worldwide, and the Florida Keys are no exception.
Global change and concomitant ocean acidification and sea level
rise will continue to affect these nearshore habitats. The region lies
at the crossroads between tropical and temperate faunas and
would be a good area for monitoring effects of climate change on
biodiversity and changing faunas.
Fisheries in the region target a diverse assemblage of reef fishes
that exist in physically stable environments characterized by
biologically accommodated communities. Overfishing of individ-
ual species and fishing gear effects are likely to have an impact on
the health of populations of associated algae, invertebrates, and
other vertebrates; many of the behavioral and trophic interactions
among species in these diverse assemblages are poorly understood.
New species and assemblages are likely to be discovered in deep
sponge/coral endofauna, and in the complex hard bottom that
underlies swift Gulf Stream currents on the Blake Plateau.
The Census of Marine Life contribution to the Atlantic
Bight and Florida East Coast region. The Census, through
OBIS, is currently summarizing and mapping decades of fishery
survey data that have not traditionally been used for the valuable
biodiversity data that such surveys contain. While some previous
mapping of fishery species has been done (e.g., http://ocean.
floridamarine.org/efh_coral/ims/viewer.htm), extensive datasets
on distribution, abundance, and size of several hundred additional,
nonfishery species are available for mapping.
Gulf of Mexico Large Marine EcosystemDescription of the Gulf of Mexico region. The Gulf of
Mexico LME, located in the southeastern part of North America,
is surrounded by the U.S., Mexico, and Cuba, and encompasses
three ecoregions, the northern Gulf, southern Gulf, and Floridian
[105]. Occupying a surface area of more than 1.5 million km2, its
maximum east-west dimension is 1,573 km and it is 900 km from
north to south between the Mississippi Delta and Yucatan
Peninsula. The shoreline, extending from Cape Sable, Florida,
to Cabo Catoche, Quintana Roo, Mexico, is about 5,696 km long;
it includes another 380 km of Gulf shoreline in Cuba from Cabo
San Antonio in the west to Havana in the east [106] (Figure 6).
The Gulf of Mexico basin resembles a bowl with a shallow rim.
The shallow continental shelves are narrow and terrigenous in the
west, moderately broad and terrigenous in the north, and wide,
carbonate platforms in the east, adjacent to the Florida and
Yucatan peninsulas. On an area basis, roughly 32% of the Gulf is
continental shelf, 41% is continual slope (200-3,000 m), and 24%
is abyssal plain (more than 3,000 m). The deepest area (more than
3,800 m) occurs within the Sigsbee Deep [106,107].
Warm, tropical water enters the Gulf of Mexico from the
Caribbean Sea between the Yucatan Peninsula and Cuba via the
Yucatan Straits, where it forms the main Gulf current, the Loop
Current. Large eddies occasionally spin off of this major current
and move westward [108]. The Loop Current exits via the Florida
Straits between Florida and Cuba and forms one of the world’s
strongest and most important currents, the Gulf Stream.
As a large receiving basin, the Gulf of Mexico receives extensive
drainages from five countries (U.S., Canada, Mexico, Guatemala,
and Cuba), including over two-thirds of the U.S. watershed. The
Mississippi River dominates drainage in the north and the
Grijava-Usumacinta River System dominates in the south.
Thirty-three major river outlets and 207 estuaries and lagoons
are found along the Gulf coastline [105,106].
U.S. Marine Biodiversity
PLoS ONE | www.plosone.org 16 August 2010 | Volume 5 | Issue 8 | e11914

Biologically, the shallow waters of the northern Gulf are warm-
temperate (Carolinian Province) and those in the south are tropical
(Caribbean Province) [109]. Oyster reefs and salt marshes are the
dominant habitat type in northern, low-salinity estuaries, and
seagrass beds are common in clearer, more saline bays. In the
tropical southern Gulf, mangroves line bay and lagoon shorelines
with oyster reefs, salt marshes, and seagrasses distributed in similar
salinity conditions as the northern Gulf. In the western Gulf,
wedged between two wet regions, the Laguna Madre of Texas and
Tamaulipas exist as the most famous of only five hypersaline
lagoons in the world [110], where salinity historically ranged over
100. After dredging of the Gulf Intracoastal Waterway in Texas
(late 1940s) and barrier island passes and inlets in Texas and
Mexico, salinities have moderated and fluctuate around 40. This
highly productive lagoon has extensive wind-tidal flats and shallow
seagrass beds in a semiarid region. Offshore, coral reefs are
common in the Florida Keys, Cuba, and the southern Gulf off the
state of Veracruz and on the Campeche Bank [111], and other
topographic highs or hard bottoms are sporadic on the normally
smooth, soft substratum of the continental shelves [112,113].
Unique, recently discovered, and highly diverse habitats in deeper
Gulf waters include chemosynthetic communities and communi-
ties of deepwater corals (Lophelia reefs) [114,115,116].
Regional history of biodiversity studies. The history of
research on coastal and marine biota of the Gulf of Mexico can be
divided into three periods: early exploration, local coastal studies,
and large-scale, multidisciplinary investigations and synthesis
[107]. The exploratory period (1850-1939) included collecting
on field expeditions and exploratory cruises by federal agencies
and museums, primarily from the northeastern U.S. The local
coastal period (1940-59) saw establishment of federal, state, and
academic laboratories in coastal locations around the Gulf.
Prominent locations included (clockwise): Port Aransas and
Galveston, Texas; Gran Isle, Louisiana; Ocean Springs and
Pascagoula, Mississippi; Alligator Harbor and St. Petersburg,
Florida; and Havana, Cuba. Knowledge of the biota around these
laboratories increased greatly during this period, and one
particularly important publication [117] summarized existing
knowledge of the origin, waters, and marine life of the Gulf. In
addition to a wide range of topics covered, it represented the first
compilation of species from numerous taxa living in the Gulf
(2,444 species). Starting in 1960, multidisciplinary investigation
Figure 6. Gulf of Mexico Large Marine Ecosystem, surrounded by United States, Mexico, and Cuba. Map also shows EEZ boundaries,state boundaries, international boundaries, marine ecoregions, and marine protected areas. The large pink arrows in the eastern Gulf represent thedominant Loop Current.doi:10.1371/journal.pone.0011914.g006
U.S. Marine Biodiversity
PLoS ONE | www.plosone.org 17 August 2010 | Volume 5 | Issue 8 | e11914

and syntheses resulted in an increased number of coastal
laboratories and the sponsorship of large state and federal
investigations on the continental shelves. Some examples are the
NMFS studies (1961-65); Florida Hourglass Cruises (1965-67); BLM
studies off Mississippi, Alabama, and Florida and the South Texas
Outer Continental Shelf in the 1970s; BLM and MMS
Topographic Features Program (1975-85); NMFS and EPA
Buccaneer Gas and Oil Field Program (1977-80); and
Department of Energy Strategic Petroleum Reserve Studies
(1981-85). As oil and gas exploration and production moved
deeper, MMS began funding studies on the continental slope and
deep Gulf of Mexico. In addition to the numerous natural bottom
ecosystem studies, MMS also funded studies of oil and gas
platforms in the northwestern Gulf, most of which are available on
the MMS Gulf of Mexico Region Web site (http://www.gomr.
mms.gov/). This ‘‘steel archipelago’’ provides hard-substratum
habitat from shallow to deep areas on thousands of platforms (over
4,000 in 2005).
Large ecosystem studies were also conducted in Mexico by
scientists from the Universidad Nacional Autonoma de Mexico,
Instituto de Ciencias del Mar y Limnologia. The two major studies
in the 1990s were OGMEX (Oceanografia del Golfo de Mexico)
and COBEMEX (Communidades Bentonicas del Golfo de
Mexico) [118].
Several iconic or well-known species are of historical, social, and
economic importance [119]. The West Indian monk seal
(Monachus tropicalis) was probably the first large animal to go
extinct because of human activity in the Gulf and Caribbean. It
was last seen on the Campeche Bank islands in 1948 and in the
Caribbean in the early 1950s [120]. Other Gulf of Mexico species
that became endangered include the Kemp’s Ridley sea turtle
(Lepidochelys kempii) and whooping crane (Grus americana). Restora-
tion programs for each of these have increased their population
numbers in recent decades. West Indian manatees (Trichechus
manatus) are greatly reduced and now exist only in certain
drainages along the west coast of Florida. Menhaden (Brevoortia
patronus) is the largest commercial fishery by weight, and the
penaeid shrimp fishery is the largest by value (white shrimp
Litopenaeus setiferus, pink shrimp Farfantepenaeus duorarum, and brown
shrimp Farfantepenaeus aztecus). Various grouper and snapper species
are predominant commercial species offshore in Cuba and
Mexico, as well as in the Florida Keys and on scattered hard-
bottom areas off Florida (grouper) and Texas (snapper).
Predominant commercial coastal shellfish in the northern Gulf
include the American oyster (Crassostrea virginica) and the blue crab
(Callinectes sapidus) [121,122]. In the tropical southern Gulf, the
spiny lobster (Panulirus argus) and the queen or pink conch
(Eustrombus gigas) are taken. However, these are commercially
extinct in many areas now and are taken only by recreational
fishers, sometimes under strict regulations [123].
The two species of largest recreational catch and economic
value in the northern Gulf are spotted sea trout (Cynoscion nebulosus)
and red drum (Scianops ocellatus) [121,122]. The red snapper
(Lutjanus campecheanus) is a favorite offshore recreational species in
the northwestern Gulf and one that has recently occasioned fishery
management discussions and regulation. The bottlenose dolphin
(Tursiops truncatus), probably the single most recognizable Gulf
species by the public, is abundant in coastal bays and estuaries, as
well as offshore in the northern Gulf, and is found gulfwide [120].
All of these studies increased our knowledge of the presence,
abundance, and distribution of biota in the Gulf of Mexico.
However, there had been no comprehensive species compilation
since Galtsoff [117] until the Biodiversity of the Gulf of Mexico
Project [124], which lists 15,419 species in 40 phyla of microbes,
plants, and animals (Table 6; more detailed Table S1). Subsequent
phases of this project will include data analysis, exploration to fill
data gaps, and conversion of this benchmark work into a web-
based database for OBIS and GulfBase (http://www.gulfbase.org/).
The list of contributors to Biodiversity of the Gulf of Mexico Project
[124] can be found in Text S3. Significant databases containing
biodiversity information are listed in Table S4.
The known, unknown, and future directions. The areas
of most intense study have been near state, federal, private, and
academic laboratories around the Gulf coast and in areas of high
economic, fishery, or ecological interest. For instance, the
northwestern Gulf of Mexico, one of the most active oil and gas
production areas in the world, has received funding for decades by
MMS, primarily regarding environmental studies, monitoring,
and protection. The Florida Keys coral reef and island ecosystem
has received extensive attention, funding, and study since being
designated a National Marine Sanctuary in 1990 [125], and the
Flower Garden Banks National Marine Sanctuary has received
similar attention since its designation in 1992 [126]. Coastal
Table 6. Biotic diversity in the Gulf of Mexico.
Taxonomic group No. species1,2
Domain Archaea UD
Domain Bacteria (including Cyanobacteria) UD (45)
Domain Eukarya 15,374
Kingdom Chromista 1,034
Phaeophyta 86
Kingdom Plantae 967
Chlorophyta 195
Rhodophyta 392
Angiospermae 370
Kingdom Protoctista (Protozoa) 2,169
Dinomastigota (Dinoflagellata) 644
Foraminifera 951
Kingdom Animalia 11,150
Porifera 339
Cnidaria 792
Platyhelminthes 705
Mollusca 2455
Annelida 866
Crustacea 2579
Bryozoa 266
Echinodermata 522
Urochordata (Tunicata) 102
Other invertebrates 549
Vertebrata (Pisces) 1541
Other vertebrates 434
TOTAL REGIONAL DIVERSITY3 15,4194
Notes:1Sources of the reports: databases, scientific literature, books, field guides,technical reports, and personal communication with taxonomic experts.
2Identification guides cited in Text S2.3Includes all taxonomic groups as reported in Table S1.4Includes 54 species of fungi.UD = Listed in work but number undetermined to date.doi:10.1371/journal.pone.0011914.t006
U.S. Marine Biodiversity
PLoS ONE | www.plosone.org 18 August 2010 | Volume 5 | Issue 8 | e11914

habitats, such as oyster reefs and seagrass beds, known for high
biodiversity, have received considerable attention.
By contrast, much of the coastal and shelf areas in Mexico and
Cuba are little known due to the lack of research funding or
coastal infrastructure to support field studies. The Cuban shelf
between Havana and the western tip of Cabo San Antonio, which
has extensive mangroves, seagrass beds, and coral reefs, is one of
the least studied areas of Cuba. Mexico’s oceanographic vessel, the
RV Justo Sierra, has greatly expanded research capability and
knowledge in recent decades in the southern Gulf of Mexico.
Several recent collaborative publications have broadly increased
knowledge about fishery resources [127], environmental contam-
ination and impacts [128], and the environment and its condition
of the southern Gulf of Mexico [129,130]. More remote hard-
bottom areas, especially in Mexico and Cuba, have been little
explored. These include the offshore area between the U.S.-
Mexico border and Tampico, the nearshore and offshore volcanic
rocky shores of the state of Veracruz, and the Campeche Bank
continental shelf and shorelines.
Gulfwide biodiversity patterns cannot be completely explained
for lack of complete information, although we know that the Gulf
of Mexico exhibits great habitat complexity that probably supports
high levels of biodiversity due to both endemic and cosmopolitan
species [118]. Linkage to the Caribbean Sea with large-scale
circulation renders the southern and eastern Gulf of Mexico with a
distinct Caribbean biota. However, there appears to be strong
regional endemism, as demonstrated in large-scale studies across
the entire northern Gulf [118,131,132]. Eventual analysis of
databases from the Biodiversity of the Gulf of Mexico Project will
provide considerable insight into spatial distribution of species. Of
15,419 species, 1,511 (10%) are endemic to the Gulf of Mexico
and 341 (2%) are nonindigenous [124]. The most diverse taxa are
crustaceans (2,579 species), mollusks (2,455), and vertebrates
(1,975); the least diverse are kinorhynchs (2 species), entoprocts
(2), priapulids (1), hemichordates (5), and cephalochordates (5).
Representatives of additional taxa known to exist in the Gulf of
Mexico (placozoans, orthonectids, loriciferans, and pogonopho-
rans) have not yet been identified.
Trouble spots and emerging issues. Ecosystem goods and
services generated by marine biodiversity have been affected in
selected areas primarily because of overfishing, habitat loss, or
degradation in water quality. Harmful algal blooms [133] and
hypoxia [134] regularly drive mobile animals from certain areas,
and increasing coastal development encroaches upon or destroys
habitats. In recent years, intense hurricanes have caused extensive
coastal habitat damage and loss in the Gulf of Mexico.
The range of variability in and knowledge of the status
(threatened, endangered, invasive) of species in some higher taxa
in the Gulf of Mexico is wide. The larger ‘‘charismatic
megafauna’’ (sea turtles, large sea birds, marine mammals) are
far better known than microbes, sponges, and worms. Within the
Gulf, all five sea turtles, all seabirds and colonial waterbirds
(herons, egrets, gulls, terns, etc.), and all marine mammals have
protected status at various levels. The most endangered and best-
known species include the Kemp’s Ridley sea turtle, the whooping
crane, the piping plover, the reddish egret, and all the great whales
[119,120,135].
Recent notable invasive species include the Australian spotted
jellyfish (Phyllorhiza punctata) and the brown and green mussels
(Perna perna and P. viridis, respectively). The spotted jellyfish bloom
in the northern Gulf of Mexico was so great in 2000 that shrimp
trawls clogged in minutes and fisheries were shut down [136].
Brown mussels blanketed coastal jetties and rocky shores from
Corpus Christi, Texas, to Veracruz, Mexico, in the early 1990s
[137,138]. A die-off caused by El Nino increased mean summer
water temperatures [139] and reduced the populations signifi-
cantly after that, but the green mussel invaded Tampa Bay in 1999
and was discovered in coastal power plant intake pipes [140]. The
orange cup coral (Tubastraea coccinea), originally from the Indo-
Pacific, invaded the Gulf of Mexico in the late 1970s and is now
found throughout the Gulf on oil and gas platforms, other artificial
structures, and coral reefs [141].
Overfishing in the northern Gulf of Mexico has affected both
commercial and recreational fisheries [142,143]. Impacts have
been addressed by regulations imposed on fisher groups, and in
several cases positive results have followed. For example, when red
drum populations plummeted in the 1980s, commercial harvest
was stopped [144], and this species, along with the spotted sea
trout, were declared game fish. Aggressive management action to
ban commercial netting and sale of these species was successful, as
was implementation of strict bag and size limits and hatchery-
based restoration efforts were implemented with success.
In the southern Gulf of Mexico, the shrimp fishery, based
primarily out of Campeche, Mexico, has almost completely ceased
because of a combination of overfishing, underregulation, and
environmental change [145]. Octopus is one of the most
important fishery resources in the southern Gulf: Octopus maya
represents 80% of the catch and O. vulgaris the rest [146]. The
octopus fishery is fully exploited, and management measures need
revision to maintain sustainability. Conch and lobster fisheries on
coral reefs in the southern Gulf of Mexico are essentially extinct
commercially because of overharvesting and lack of regulations or
enforcement of regulations [123]. Red grouper (Epinephelus morio) is
the most important fishery resource on the continental shelf of the
Campeche Bank [147]. Reduced catches and sizes of grouper and
snapper on coral reefs in the southern Gulf during the 1970s led to
the harvesting of herbivorous fishes, which are also now reduced in
numbers on many reefs [111]. Heavy shark fishing on these reefs
led to reduced populations and catches around almost all reefs in
the 1990s.
Historically, MPAs in the Gulf of Mexico, as in most of the rest
of the world, focused on coastal areas to protect threatened species
or unique habitats, like whooping cranes at the Aransas National
Wildlife Refuge in coastal Texas or the coral reefs of John
Pennecamp Coral Reef State Park in the Florida Keys. During the
1990s, offshore sites were added with the beginning of the
National Marine Sanctuary Program (NMSP) (Florida Keys
National Marine Sanctuary and Flower Gardens Banks National
Marine Sanctuary) in the U.S. and the National Commission of
Protected Natural Areas (Veracruz Reefs National Park and
Alacran Reef National Park) in Mexico (see Figure 6). Recently, a
network of MPAs has been suggested and considered by both the
U.S. and Mexico. This concept, known as the ‘‘Islands in the
Stream,’’ would involve a system or network of MPAs around the
Gulf of Mexico, primarily on offshore hard-bottom reefs and
banks. Ocean circulation would link populations at network sites
[148].
Habitat loss and destruction, and degradation of water quality
in the Gulf are two of the key issues addressed in the Governors’
Action Plan for Healthy and Resilient Coasts [149]. Although
habitat loss is greatest in Louisiana, where 80-130 km2 of coastal
wetlands are lost each year, other states are experiencing
significant loss due to coastal development and infrastructure in
selected areas. The Gulf of Mexico Alliance is dedicated to
working within and across states to slow this loss, as well as
encourage and support habitat restoration.
Global change has been the subject of several major
multidisciplinary studies involving numerous state and federal
U.S. Marine Biodiversity
PLoS ONE | www.plosone.org 19 August 2010 | Volume 5 | Issue 8 | e11914

agencies, private industry, and academia. Informative and
educational reports have been widely distributed in the northern
Gulf area as an alert to environmental change and its impact on
habitat, biodiversity, and quality of life [150,151,152]. In Texas
and Louisiana, sea level rise has been compounded by the
subsidence of some coastal lands due to water and petroleum
extraction [153].
Overexploitation of shell resources by individuals and for
commercial sales, principally in the tourism industry, has resulted
in restrictions in some places (e.g., Sanibel Island, Florida, and
South Padre Island, Texas), but sales of shells, soft and hard corals,
and hawks bill sea turtle carapaces continue in street markets of
Veracruz, Mexico.
The best opportunities for potential future discoveries of new
species and communities are likely in the remote, unexplored areas
of the Mexican coast (northeast Mexico and Campeche Bank), the
northwest coast of Cuba, and deepwater areas of the lower
continental slope and abyss in all areas. Small, soft-bodied and
shell-less invertebrates are often undersampled; as better sampling
protocols are developed, many new discoveries will be made in the
Gulf of Mexico and elsewhere.
The Census of Marine Life contribution to the Gulf of
Mexico region. Although the Gulf of Mexico Biodiversity
Project is an affiliate project within Census, it was well under way
before joining the Census. Its final product (a complete all-taxa
inventory) is unique among Census projects and will be one of only
a few such inventories ever completed for a LME. Two other
Census projects had study sites in the Gulf of Mexico. NaGISA
had sites in the northeastern Gulf at Destin, Florida, and in the
southeastern Gulf at La Habana, Cuba. COMARGE also had two
sites, on muddy slopes, on the Mississippi Canyon in the northern
Gulf of Mexico and at chemosynthetic ecosystems in the southern
Gulf.
Insular Pacific–Hawaiian Large Marine EcosystemDescription of the Insular Pacific-Hawaiian region. The
Hawaiian Archipelago consists of eight high volcanic islands with
offshore nonstructural reef communities and fringing reefs
abutting the shore [154] at its southern end, and a series of
small islands, atolls, shoals, seamounts, and banks stretching to
Midway and Kure atolls at its northwestern end (Figure 7).
Excluding Midway, which is an unincorporated territory of the
U.S., the Hawaiian Islands form the U.S. stat of Hawaii. The eight
Main Hawaiian Islands (MHI), which are home to 99% of the
state’s 1.3 million human residents, are separated from the
southernmost area of the mostly uninhabited Northwestern
Hawaiian Islands (NWHI) (Figure 8), which span more than
2,000 km, by 250 km of open ocean. The archipelago extends
2,500 km astride the Tropic of Cancer between 154u409 and
178u259 W, and 18u549 and 28u 159 N. Its total land area is
approximately 16,642 km2. About 3,000 km from the nearest
continent, it is the most isolated group of islands on earth.
Undersea mapping is ongoing, including annual multibeam
surveys. The forereef slopes, between 20 and 500 m, have been
extensively surveyed, but large areas of the shallow reefs and some
bank tops are still unmapped (Pacific Islands Benthic Habitat
Mapping Center at http://www.soest.hawaii.edu/pibhmc/
pibhmc_nwhi.htm).
The Hawaiian Islands lie within the southern portion of the
anticyclonic North Pacific Subtropical Gyre. Although mean
surface currents are driven west by the northeasterly trade winds,
variability of the flow is great. Because the high MHI cast a partial
wind shadow in the easterly trade winds that blow almost year
round, a narrow zone of weak winds develops on the lee sides of
the islands. In the central part of these generally westward
currents, the narrow and intermittent Subtropical Countercurrent
flows eastward from the western Pacific [155,156]. This current
has been speculated to be a genetic gateway that is most likely
responsible for some of Hawaii’s flora and fauna [157,158].
Eldredge and Abbott inventoried 8,427 species of fish, algae,
coral, and other invertebrates (unpublished) (Table S6). Befitting
its isolated location, Hawaii has estimated rates of endemism of
25% or greater for most coral reef species [159,160,161,162,163].
Results of the CReefs Expedition in November 2006 to the French
Frigate Shoals, in the central portion of the Hawaiian Archipelago,
which was the first dedicated biodiversity assessment carried out in
the NWHI, suggest that the number of known species underes-
timates the true biodiversity.
Regional history of biodiversity studies. Several French
and Russian ships visited the islands in the early 1800s. The U.S.
Exploring Expedition, the first of the major exploration
expeditions to have passed through the Hawaiian Islands, sailed
in the Pacific between 1838 and 1842, making a stop in Hawaii in
May-June 1841. Records of material collected on that trip are
presented in numerous volumes. The Challenger, on its short stop in
Hawaii in mid-1875, collected plankton and dredged in Pearl
Harbor. The German biologist Hugo Schausinsland spent three
months on Laysan; material he collected was the subject of
numerous articles. The deep-dredging expedition of the Albatross
Trans-Pacific cruise in 1891, under the leadership of Alexander
Agassiz from Harvard, resulted in reports of many new species.
The Albatross Expedition in 1902 initiated the first major
collections from Hawaii. These were published in three volumes
of the Bulletin of the United States Fish Commission for 1903: ‘‘Aquatic
Resources of the Hawaiian Islands; I. Shore Fishes; II. Deep Sea
Fishes and Commercial Fisheries; III. Miscellaneous Papers’’
(which include isopods, brachyuran and macrurans, hydroids,
schizopods, nemerteans, sea stars, medusae, and polychaetes). This
investigation established a baseline for further investigation, and
some new species are still being described from this material.
During his two-year Danish Pacific Expedition, Dr. Th.
Mortensen visited the Hawaiian Islands, and the holothurian
Opheodesoma spectabilis was collected and described from his
collections in Pearl Harbor. In 1922, a plan was designed for a
major survey of 13 Hawaiian Islands and Johnston, and Wake
Island, with the Tanager, a Navy Department mine sweeper: four
trips were made during 1923 and 1924. Material from the Tanager
Expedition, primarily published in Marine Zoology of Tropical Central
Pacific [164], included crustaceans, echinoderms, polychaetes, and
foraminiferans. An expedition led by P.S. Galtsoff to Pearl and
Hermes between July and September 1930, surveyed the
abundance of pearl oyster for potential commercial use. He
noted the corals, algae, sponges, mollusks, crustaceans, and
echinoderms [165].
Since these early cruises, conducting inventories of the biota of
Hawaii has largely been the responsibility of the Bishop Museum.
Virtually all definitive published treatments and manuals of
Hawaiian organisms, beginning with Fauna Hawaiiensis in 1901,
have been produced by the Museum, or in close collaboration with
it. In 1992, the Hawaii State Legislature recognized the Bishop
Museum for these contributions and designated it as the Hawaii
Biological Survey (HBS). Surveys have occurred in targeted sites in
the MHI, such as Kaneohe Bay and Pearl Harbor on the island of
Oahu, and waters around the island of Kahoolawe. Electro-
nic datasets for Hawaiian marine biodiversity include: http://
hbs.bishopmuseum.org/ (Hawaii Biological Survey); http://
cramp.wcc.hawaii.edu/ (Reef Assessment and Monitoring Pro-
gram); http://www.nbii.gov/portal/community/Communities/
U.S. Marine Biodiversity
PLoS ONE | www.plosone.org 20 August 2010 | Volume 5 | Issue 8 | e11914

Geographic_Perspectives/Pacific_Basin/ (National Biological Infor-
mation Infrastructure(NBII), Pacific Basin Information Node); and
http://www.nbii.gov/portal/community/Communities/Habitats/
Marine/Marine_Data_(OBIS-USA)/.
The Bishop Museum has conducted intensive biological
inventories since 1995, covering all of MHI, Midway Atoll,
French Frigate Shoals, and Johnston Atoll. The results of these
inventories have appeared in numerous Technical Reports of the
Bishop Museum, including a checklist of all species collected
with museum records of previously collected specimens. Many
specialists have been consulted for the determination of species,
and voucher specimens have been deposited in the Bishop
Museum. Initial information on the numbers of Hawaiian species
can be found in Eldredge [166].
Fishes have been of interest for many years. Jordan and
Everman [167], in their introduction to the Albatross Expedition,
reported on all previous collections of fishes and added many
more. Gosline and Brock [168] presented information on the
zoogeography of Hawaiian fishes and provided keys to species. In
1993, a popular book on Hawaiian fishes by Hoover [169] was
published. A checklist of fishes of the Hawaiian Archipelago,
recording some 1,250 species and including the history of
ichthyology in the Hawaiian Islands, was published by the Bishop
Museum [170]. Most recently the fishes of Hawaiian waters were
thoroughly reviewed in a handsome all-color volume [171].
Stony coral investigations began with Vaughan’s [172]
monograph on the recent corals of the Hawaiian Islands. This
was based primarily on the Albatross 1902 collections, but also
included some from the U.S. Exploring Expedition, and other
material. This and more recent collections were the basis of a
review of the scleractinians along with a key to species [173]. An
updated species list has also been published [158], as well as a field
guide to the Hawaiian corals [174]. Cairns has revised the
hydrocorals and ahermatypic corals [175].
The crustaceans have been fairly well documented. Rathbun [176]
described the specimens from the Albatross 1902 Expedition.
Numerous publications resulted from the four decades of investiga-
tions of C. H. Edmondson of the Bishop Museum. More recent work
has been based on museum material collected also over decades. A
series of papers based on collections made in 2006 under the auspices
of the Census include descriptions of more than100 new species
[177,178,179] from French Frigate Shoals; additional reports are in
preparation. Eldredge (unpublished) has prepared an authoritative list
of the anomuran and brachyuran fauna of the Hawaiian Islands.
Figure 7. The Hawaiian Archipelago. Map shows the designation of the Marine protected areas, the Marine Ecoregion Boundary, and the U.S.EEZ.doi:10.1371/journal.pone.0011914.g007
U.S. Marine Biodiversity
PLoS ONE | www.plosone.org 21 August 2010 | Volume 5 | Issue 8 | e11914
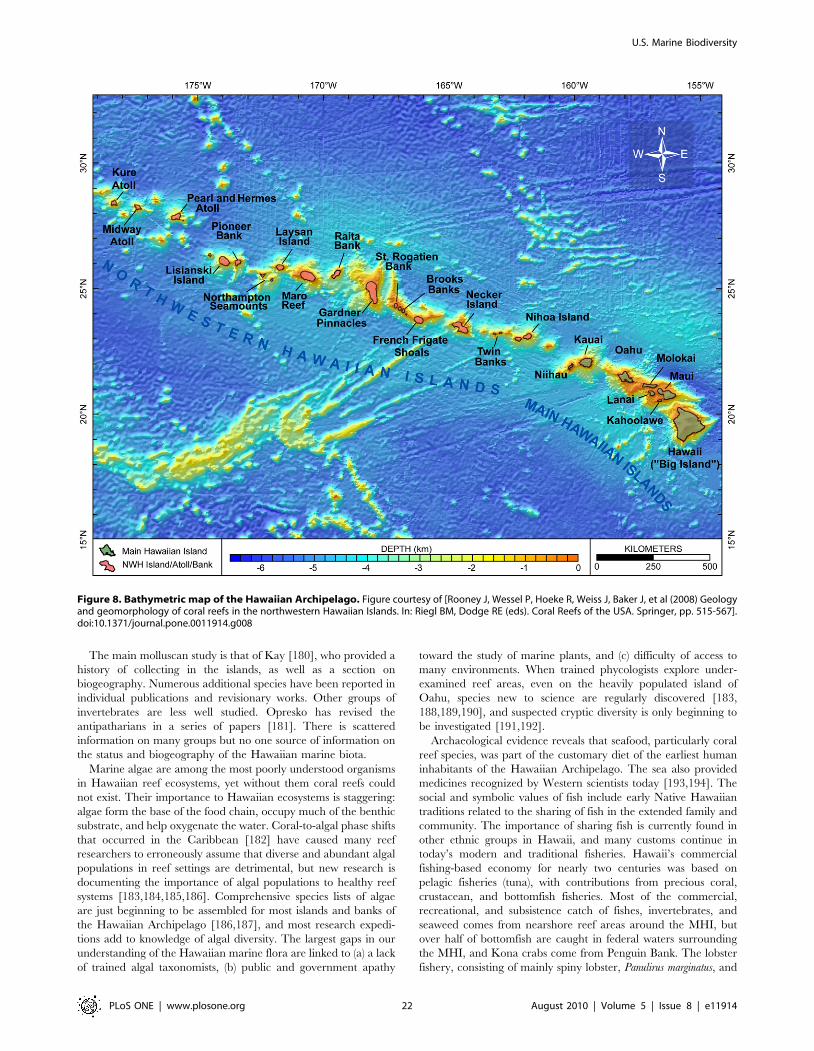
The main molluscan study is that of Kay [180], who provided a
history of collecting in the islands, as well as a section on
biogeography. Numerous additional species have been reported in
individual publications and revisionary works. Other groups of
invertebrates are less well studied. Opresko has revised the
antipatharians in a series of papers [181]. There is scattered
information on many groups but no one source of information on
the status and biogeography of the Hawaiian marine biota.
Marine algae are among the most poorly understood organisms
in Hawaiian reef ecosystems, yet without them coral reefs could
not exist. Their importance to Hawaiian ecosystems is staggering:
algae form the base of the food chain, occupy much of the benthic
substrate, and help oxygenate the water. Coral-to-algal phase shifts
that occurred in the Caribbean [182] have caused many reef
researchers to erroneously assume that diverse and abundant algal
populations in reef settings are detrimental, but new research is
documenting the importance of algal populations to healthy reef
systems [183,184,185,186]. Comprehensive species lists of algae
are just beginning to be assembled for most islands and banks of
the Hawaiian Archipelago [186,187], and most research expedi-
tions add to knowledge of algal diversity. The largest gaps in our
understanding of the Hawaiian marine flora are linked to (a) a lack
of trained algal taxonomists, (b) public and government apathy
toward the study of marine plants, and (c) difficulty of access to
many environments. When trained phycologists explore under-
examined reef areas, even on the heavily populated island of
Oahu, species new to science are regularly discovered [183,
188,189,190], and suspected cryptic diversity is only beginning to
be investigated [191,192].
Archaeological evidence reveals that seafood, particularly coral
reef species, was part of the customary diet of the earliest human
inhabitants of the Hawaiian Archipelago. The sea also provided
medicines recognized by Western scientists today [193,194]. The
social and symbolic values of fish include early Native Hawaiian
traditions related to the sharing of fish in the extended family and
community. The importance of sharing fish is currently found in
other ethnic groups in Hawaii, and many customs continue in
today’s modern and traditional fisheries. Hawaii’s commercial
fishing-based economy for nearly two centuries was based on
pelagic fisheries (tuna), with contributions from precious coral,
crustacean, and bottomfish fisheries. Most of the commercial,
recreational, and subsistence catch of fishes, invertebrates, and
seaweed comes from nearshore reef areas around the MHI, but
over half of bottomfish are caught in federal waters surrounding
the MHI, and Kona crabs come from Penguin Bank. The lobster
fishery, consisting of mainly spiny lobster, Panulirus marginatus, and
Figure 8. Bathymetric map of the Hawaiian Archipelago. Figure courtesy of [Rooney J, Wessel P, Hoeke R, Weiss J, Baker J, et al (2008) Geologyand geomorphology of coral reefs in the northwestern Hawaiian Islands. In: Riegl BM, Dodge RE (eds). Coral Reefs of the USA. Springer, pp. 515-567].doi:10.1371/journal.pone.0011914.g008
U.S. Marine Biodiversity
PLoS ONE | www.plosone.org 22 August 2010 | Volume 5 | Issue 8 | e11914

slipper lobster, Scyllarides squammosus, was confined to the NWHI
until the fishery started to collapse in the early 1990s; it was closed
in 1993, and remains closed because stocks have not recovered.
Black corals continue to be collected by scuba divers from 30 to
100 m in the MHI, whereas the collection of other precious corals
in Hawaii has been limited. The commercial aquarium fishery is
now Hawaii’s major inshore fishery; landings are reported as more
than 220,000 specimens, with a wholesale value of $1.93 million in
2006 [154]. Its retail value can be estimated conservatively at more
than $10 million, based on the retail value of yellow tangs
(Zebrasoma flavescens), each of which sells for at least $25; in 2006,
366,317 yellow tangs were reportedly collected in Hawaii.
The known, unknown, and future directions. The
Hawaiian Islands are among the best biologically known islands
in the Pacific Ocean, many publications having dealt with the
general marine biota. In 1933, C.H. Edmondson first published
Reef and Shore Fauna of Hawaii [165], which included invertebrates
as well as fishes. He revised this book in 1946 without the fishes
[195]. A popular book, Seashore Treasures, followed in 1949 [196].
Fielding and Robinson [197] prepared an underwater guide
mainly to the most common species. The most complete field
guide to the marine invertebrates was revised by Hoover [198].
Hoover [199] wrote another field guide to the fishes, sea turtles,
dolphins, whales, and seals. Still, it is likely that large numbers of
new species remain to be discovered throughout the archipelago,
where known endemism is the highest of any tropical marine
ecosystem on earth [171,200,201].
Two workshops on ‘‘Marine and Coastal Biodiversity in the
Tropical Island Pacific Region,’’ held in November 1994 in
Honolulu, resulted in two publications—Volume 1: Species
systematics, and information management priorities and Volume
2: Population, development, and conservation priorities. Volume 1
includes 13 sections on the status of various taxonomic groups
authored by specialists who provide information on numbers of
species and their biogeography [202].
Studies of Hawaiian algae during the past decade have greatly
increased understanding of species diversity and species ranges and
led to the publication of three major works: Marine Red Algae of the
Hawaiian Islands [203], Marine Green and Brown Algae of the Hawaiian
Islands [204], and Hawaiian Reef Plants [205]. At French Frigate
Shoals alone, recent work has increased the number of
documented species by 380% [187] and led to the discovery of
two species new to science [189,190]. Archipelago-wide studies are
revealing nuances in algal biogeography; some species prefer
specific habitat types, and some are adapted to cold winter
temperature regimes found in the northernmost areas of the
Hawaiian Archipelago (Vroom and Braun, in review). Many algal
species in the Hawaiian archipelago are pantropical, whereas
others share affinities with the Japanese, Australian, or Indo-
western Pacific floras [203,204]. For species that occur in Hawaii
and elsewhere, it is often unclear whether their distributional
patterns are natural or are the result of introductions. Some species
that occur in disparate geographic locations have turned out to
represent genetically distinct species that have converged on
similar morphologies. Molecular research [191,192,206,207] is
greatly helping in understanding both these types of situations and
may reveal that many Hawaiian species thought to be represen-
tatives of Caribbean or Indo-western Pacific taxa are new species
endemic to the Hawaiian Islands.
Recent studies in the NWHI suggest that French Frigate Shoals
is where coral reef diversity is highest in the Hawaiian
Archipelago, and there is evidence that species arrived here from
the southern Pacific via Johnston Atoll [208]. The first marine
biodiversity survey with the taxonomic expertise to assess reef taxa
over a broad range of flora and fauna was the CReefs Expedition.
Although comprehensive biodiversity surveys and analyses are
desirable to follow up on this survey, they remain uncertain based
on permitting concerns. French Frigate Shoals has the largest
number of species of Acropora, the major reef-building coral of the
rest of the Indo-Pacific; these corals have not been observed south
of Kauai in the MHI.
Assessing biodiversity of Hawaiian coral reefs has been difficult
because of limited financial and logistical resources, severe
shortages of trained taxonomists, and the subjectivity and biases
of methods. These challenges are particularly problematic for the
small and cryptic invertebrate taxa, among which the greatest
diversity is likely to occur. Many techniques and types of
equipment are needed to collect mobile and sessile, infaunal and
epifaunal, and pelagic and benthic organisms in a variety of
habitats that encompass various depths, exposures to wave energy,
and other environmental forcing [209]. Although comprehensive
CReefs-type biodiversity assessments are desirable at representa-
tive regions and habitats across the Hawaiian Archipelago, and
elsewhere across the Pacific Islands, such efforts are generally too
costly and require more extensive taxonomic expertise and
curatorial capacity than exists in the region.
Resource limitation was a problem even for the CReefs
Expedition. Although funded adequately for operations, it had
inadequate resources for thorough post-cruise processing and
analyses of the specimens collected. Techniques used, including
such time-honored ones as yabbie pumps and trawls, are described
in detail at http://hawaiianatolls.org/research/CoML/collection.
php. These techniques were supplemented with GPS position data
and with before-and-after photographs at each site. Budgetary
constraints and the urgent need for baseline biodiversity
assessments prior to additional, and potentially dramatic, biodi-
versity shifts occurring in response to climate change, particularly
ocean acidification, have allowed CReefs and the Pacific Islands
Fisheries Science Center Coral Reef Ecosystem Division of NMFS
to lead the development, testing, and implementation of
Autonomous Reef Monitoring Structures (ARMS) as a standard
method to collect sessile or sedentary biota in a reproducible
manner [210]. Diversity of specimens collected by ARMS can be
assessed using molecular techniques, which can be more rapid
than morphological analyses [211].
In October 2006, 12 ARMS were deployed in four sets of three
replicates at a backreef site, a lagoon patch reef site, and two
forereef sites at French Frigate Shoals. Recovered and analyzed in
October 2007, the collection included mollusks (28%), ascidians
(24%), crustaceans (19%), and bryozoans (11%). Two non-native
solitary tunicates, Cnemidocarpa irene and Polycarpa aurita, were new
records for the NWHI [212]. Crustacean biodiversity was
characterized through DNA. The 12 ARMS recovered from the
NWHI and 7 recovered from the south shore of Oahu provide
confidence that cryptic invertebrate fauna collected are represen-
tative of the habitat and intrasite variability is acceptably low.
Preliminary results from 9 ARMS recovered in February 2009
from a CReefs site at Lizard Island, Great Barrier Reef, also
indicated low intrasite variability (M. Timmers, personal commu-
nication). Thus, coupling ARMS with morphological and
molecular analyses can be effective in assessing some components
of coral reef invertebrate biodiversity.
There is a need for more surveys in different geographic regions,
habitats, and depths throughout the Hawaiian Archipelago. In
particular, baseline assessments must be made so that invasive
species, which are a serious problem in some areas of the MHI,
can be detected before alterations in the biodiversity occur.
Regions in the MHI that are more remote should particularly be
U.S. Marine Biodiversity
PLoS ONE | www.plosone.org 23 August 2010 | Volume 5 | Issue 8 | e11914

the subject of exploration. Current knowledge of the biota of the
Insular Pacific- Hawaiian LME is summarized in Table 7 (more
detail is available in Table S1).
Trouble spots and emerging issues. Despite a wealth of
potential new species, the Hawaiian LME (Figure 7) is considered
depauparate. Its coral reefs have significantly fewer species of
fishes, corals, and algae than those of Indonesia and Australia (see
Table 8 and [213]). In Hawaiian environments, redundancy in
ecosystem function is probably low, and there are concerns that it
is a relatively fragile ecosystem [214]. The Archipelago’s isolation,
relatively low species diversity, and high endemism may make the
system comparatively non-resistant to perturbations, such as
invasion by alien species, human use, and pollution.
Endemics dominate abundance assessments in many NWHI
communities [163], and because many endemics have narrow
habitat and physiological tolerances, they may fare worse under
climate change than wide-ranging species [215]. The high density
of some endemics may allow quick recovery from localized pulsed
disturbances, but they may render the habitat vulnerable to large-
scale, constant impacts like marine debris, global change factors,
and fishing, contributing to the NWHI’s probable low resistance
and resilience. Populations of some irreplaceable species, like
Hawaiian monk seals and some seabirds that are already listed as
critically endangered, may have larger impacts on the ecosystem
than is realized at the moment.
Current studies indicate that Hawaii’s endemic species have
evolved to provide multiple ecosystem services (functional
compensation). The question of whether this is a common
phenomenon in depauparate systems, especially in island envi-
ronments, requires an assessment of biodiversity, coupled with
ecosystem functional analysis [2]. Few studies have examined the
effect of genetic heterogeneity, a component of biodiversity that
controls whether organisms have the genetic potential to adapt to
environmental change, on ecosystem resilience in the marine
environment.
An assessment of the trouble spots in the Hawaiian ecosystem
was published by Selkoe, Halpern, and Toonen [216], who
developed a threat-ranking system that identified areas of concern
in the NWHI. Maro Reef emerged as the region of primary
concern [217]. Although this island and similar ones are protected
to some extent by the designation of the Papahanaumokuakea
Marine National Monument in 2006 and the closing of all fishing
in the area by 2011, they are threatened by potential impacts of
global change, which is likely to affect marine ecosystems across
the entire Hawaiian Archipelago. Global change models predict
that threats to Hawaii’s ecosystem include sea level and
temperature rise, and pH decline [218,219].
The Census of Marine Life contribution to the Insular
Pacific-Hawaiian region. A major contribution to knowledge
of Hawaiian marine biodiversity was the CReefs survey of the
French Frigate Shoals. During the 16 survey days, at least 2,025
‘‘unique morphospecies’’ were collected. Taxonomic experts are in
the process of identifying the collected specimens, with a final tally
projected to reach more than 100 newly described taxa (including
species, genera, and families).
California Current Large Marine EcosystemDescription of the California Current region. The
California Current LME stretches from Baja California to
Table 7. Biotic diversity in the Insular Pacific–Hawaiian LargeMarine Ecosystem.
Taxonomic group No. species1
Domain Archaea UD
Domain Bacteria (including Cyanobacteria) UD (183)
Domain Eukarya 8,244
Kingdom Chromista 175
Phaeophyta 84
Kingdom Plantae 821
Chlorophyta 247
Rhodophyta 574
Angiospermae UD
Kingdom Protoctista (Protozoa) 798
Dinomastigota (Dinoflagellata) 43
Foraminifera 755
Kingdom Animalia 6,395
Porifera 144
Cnidaria 460
Platyhelminthes 676
Mollusca 1345
Annelida 343
Crustacea 1325
Bryozoa 168
Echinodermata 309
Urochordata (Tunicata) 102
Other invertebrates 228
Vertebrata (Pisces) 1214
Other vertebrates 81
TOTAL REGIONAL DIVERSITY2 8,4273
Notes:1Sources of the reports: databases, scientific literature, books, field guides,technical reports, and personal communication with taxonomic experts.
2Includes all taxonomic groups as reported in Table S1.3Includes 55 species of fungi.UD = Listed in work but number undetermined to date.doi:10.1371/journal.pone.0011914.t007
Table 8. Comparative species numbers of selected groups inIndonesia, Australia and Hawaii.
Indonesiaa Australiab Hawaiic
Fish 3,000+ 1,500+ 1,214+
Corals 700+ (450) 400+ (359) 460 (99 scleractinian)
Algae n/a 3,000+ 500+
Notes:aFenner D (2002) Reef corals of the Raja Ampat Islands, Papua Province,Indonesia. Part II. Comparison of individual survey sites. Appendix 2. Coralspecies recorded at individual sites in the Raja Ampat Islands. In: McKenna SA,Allen GA, Suryadi S, editors. A marine rapid assessment of the Raja AmpatIslands, Papua Province, Indonesia RAP Bulletin of Biological Assessment 22.Washington, D.C.: Conservation International. pp. 29-36, 104-112.
bCRC Reef Research Centre (2008) REEF FACTS: Plants and animals on the GreatBarrier Reef. Huisman JM (2000) Marine plants of Australia. Nedlands, Australia:University of Western Australia Press. 300 p.
cAbbott IA (1999) Marine red algae of the Hawaiian Islands. Honolulu: BishopMuseum Press. 477 p.
Abbott IA, Huisman JM (2004) Marine green and brown algae of the HawaiianIslands. Honolulu: Bishop Museum Press. 259 p.Huisman JM, Abbott IA, Smith CM (2006) Hawaiian reef plants. Honolulu,Hawaii: University of Hawaii Sea Grant. 264 p.doi:10.1371/journal.pone.0011914.t008
U.S. Marine Biodiversity
PLoS ONE | www.plosone.org 24 August 2010 | Volume 5 | Issue 8 | e11914
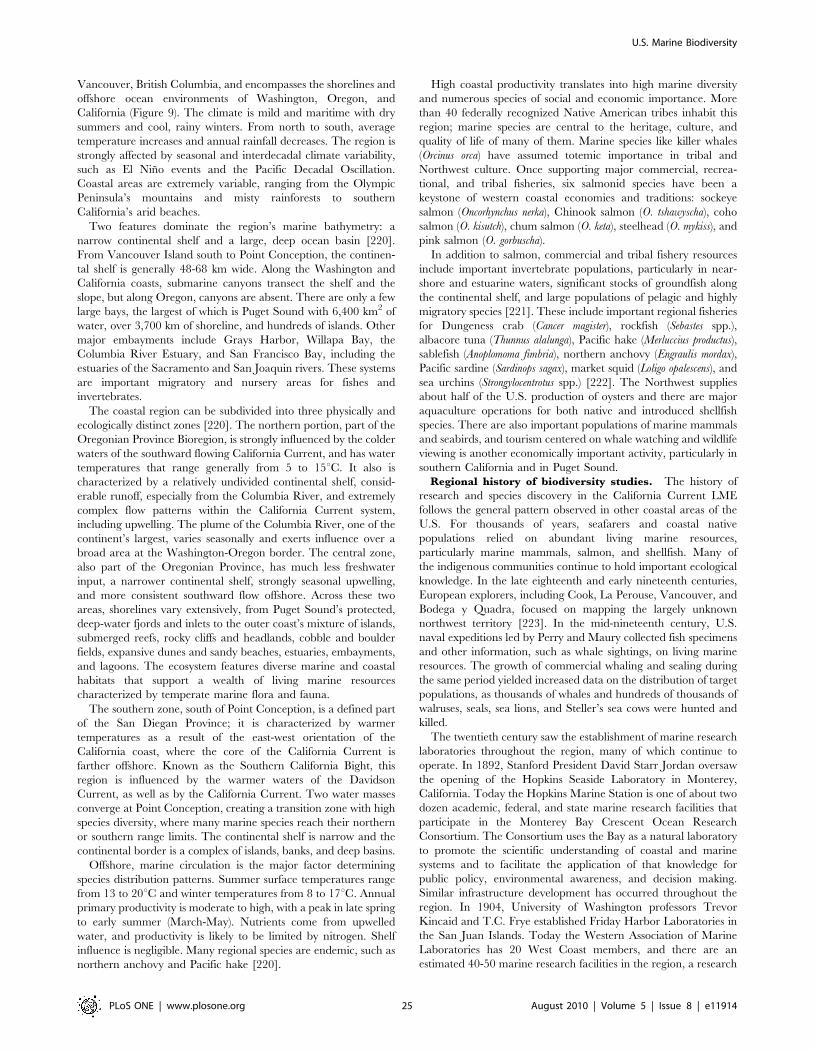
Vancouver, British Columbia, and encompasses the shorelines and
offshore ocean environments of Washington, Oregon, and
California (Figure 9). The climate is mild and maritime with dry
summers and cool, rainy winters. From north to south, average
temperature increases and annual rainfall decreases. The region is
strongly affected by seasonal and interdecadal climate variability,
such as El Nino events and the Pacific Decadal Oscillation.
Coastal areas are extremely variable, ranging from the Olympic
Peninsula’s mountains and misty rainforests to southern
California’s arid beaches.
Two features dominate the region’s marine bathymetry: a
narrow continental shelf and a large, deep ocean basin [220].
From Vancouver Island south to Point Conception, the continen-
tal shelf is generally 48-68 km wide. Along the Washington and
California coasts, submarine canyons transect the shelf and the
slope, but along Oregon, canyons are absent. There are only a few
large bays, the largest of which is Puget Sound with 6,400 km2 of
water, over 3,700 km of shoreline, and hundreds of islands. Other
major embayments include Grays Harbor, Willapa Bay, the
Columbia River Estuary, and San Francisco Bay, including the
estuaries of the Sacramento and San Joaquin rivers. These systems
are important migratory and nursery areas for fishes and
invertebrates.
The coastal region can be subdivided into three physically and
ecologically distinct zones [220]. The northern portion, part of the
Oregonian Province Bioregion, is strongly influenced by the colder
waters of the southward flowing California Current, and has water
temperatures that range generally from 5 to 15uC. It also is
characterized by a relatively undivided continental shelf, consid-
erable runoff, especially from the Columbia River, and extremely
complex flow patterns within the California Current system,
including upwelling. The plume of the Columbia River, one of the
continent’s largest, varies seasonally and exerts influence over a
broad area at the Washington-Oregon border. The central zone,
also part of the Oregonian Province, has much less freshwater
input, a narrower continental shelf, strongly seasonal upwelling,
and more consistent southward flow offshore. Across these two
areas, shorelines vary extensively, from Puget Sound’s protected,
deep-water fjords and inlets to the outer coast’s mixture of islands,
submerged reefs, rocky cliffs and headlands, cobble and boulder
fields, expansive dunes and sandy beaches, estuaries, embayments,
and lagoons. The ecosystem features diverse marine and coastal
habitats that support a wealth of living marine resources
characterized by temperate marine flora and fauna.
The southern zone, south of Point Conception, is a defined part
of the San Diegan Province; it is characterized by warmer
temperatures as a result of the east-west orientation of the
California coast, where the core of the California Current is
farther offshore. Known as the Southern California Bight, this
region is influenced by the warmer waters of the Davidson
Current, as well as by the California Current. Two water masses
converge at Point Conception, creating a transition zone with high
species diversity, where many marine species reach their northern
or southern range limits. The continental shelf is narrow and the
continental border is a complex of islands, banks, and deep basins.
Offshore, marine circulation is the major factor determining
species distribution patterns. Summer surface temperatures range
from 13 to 20uC and winter temperatures from 8 to 17uC. Annual
primary productivity is moderate to high, with a peak in late spring
to early summer (March-May). Nutrients come from upwelled
water, and productivity is likely to be limited by nitrogen. Shelf
influence is negligible. Many regional species are endemic, such as
northern anchovy and Pacific hake [220].
High coastal productivity translates into high marine diversity
and numerous species of social and economic importance. More
than 40 federally recognized Native American tribes inhabit this
region; marine species are central to the heritage, culture, and
quality of life of many of them. Marine species like killer whales
(Orcinus orca) have assumed totemic importance in tribal and
Northwest culture. Once supporting major commercial, recrea-
tional, and tribal fisheries, six salmonid species have been a
keystone of western coastal economies and traditions: sockeye
salmon (Oncorhynchus nerka), Chinook salmon (O. tshawyscha), coho
salmon (O. kisutch), chum salmon (O. keta), steelhead (O. mykiss), and
pink salmon (O. gorbuscha).
In addition to salmon, commercial and tribal fishery resources
include important invertebrate populations, particularly in near-
shore and estuarine waters, significant stocks of groundfish along
the continental shelf, and large populations of pelagic and highly
migratory species [221]. These include important regional fisheries
for Dungeness crab (Cancer magister), rockfish (Sebastes spp.),
albacore tuna (Thunnus alalunga), Pacific hake (Merluccius productus),
sablefish (Anoplomoma fimbria), northern anchovy (Engraulis mordax),
Pacific sardine (Sardinops sagax), market squid (Loligo opalescens), and
sea urchins (Strongylocentrotus spp.) [222]. The Northwest supplies
about half of the U.S. production of oysters and there are major
aquaculture operations for both native and introduced shellfish
species. There are also important populations of marine mammals
and seabirds, and tourism centered on whale watching and wildlife
viewing is another economically important activity, particularly in
southern California and in Puget Sound.
Regional history of biodiversity studies. The history of
research and species discovery in the California Current LME
follows the general pattern observed in other coastal areas of the
U.S. For thousands of years, seafarers and coastal native
populations relied on abundant living marine resources,
particularly marine mammals, salmon, and shellfish. Many of
the indigenous communities continue to hold important ecological
knowledge. In the late eighteenth and early nineteenth centuries,
European explorers, including Cook, La Perouse, Vancouver, and
Bodega y Quadra, focused on mapping the largely unknown
northwest territory [223]. In the mid-nineteenth century, U.S.
naval expeditions led by Perry and Maury collected fish specimens
and other information, such as whale sightings, on living marine
resources. The growth of commercial whaling and sealing during
the same period yielded increased data on the distribution of target
populations, as thousands of whales and hundreds of thousands of
walruses, seals, sea lions, and Steller’s sea cows were hunted and
killed.
The twentieth century saw the establishment of marine research
laboratories throughout the region, many of which continue to
operate. In 1892, Stanford President David Starr Jordan oversaw
the opening of the Hopkins Seaside Laboratory in Monterey,
California. Today the Hopkins Marine Station is one of about two
dozen academic, federal, and state marine research facilities that
participate in the Monterey Bay Crescent Ocean Research
Consortium. The Consortium uses the Bay as a natural laboratory
to promote the scientific understanding of coastal and marine
systems and to facilitate the application of that knowledge for
public policy, environmental awareness, and decision making.
Similar infrastructure development has occurred throughout the
region. In 1904, University of Washington professors Trevor
Kincaid and T.C. Frye established Friday Harbor Laboratories in
the San Juan Islands. Today the Western Association of Marine
Laboratories has 20 West Coast members, and there are an
estimated 40-50 marine research facilities in the region, a research
U.S. Marine Biodiversity
PLoS ONE | www.plosone.org 25 August 2010 | Volume 5 | Issue 8 | e11914

U.S. Marine Biodiversity
PLoS ONE | www.plosone.org 26 August 2010 | Volume 5 | Issue 8 | e11914

staff of several hundred, and a sizable government and academic
research fleet.
Numerous reviews and syntheses of various taxonomic groups
have been written for the region, focusing particularly on
nearshore species and those of commercial significance (e.g.,
[224,225,226,227,228,229,230]). General information on larger
and better-known species, such as marine mammals and seabirds,
also is readily available [231,232]. Table 9 summarizes those data;
more detail is available in Table S1.
While significant capacity exists on the West Coast for collection
of biodiversity information, existing activities are generally not
integrated, have limited geographic coverage, and sample
infrequently. Nearshore and intertidal information is collected at
local scales, and integrating observations can be difficult [221].
Much of the available long-term data is a product of fishery
management efforts, and a substantial proportion is funded
through NOAA. Interest in integrated ocean observing systems,
ecosystem approaches to management, and assessment of regional
environmental change have sparked renewed interest in existing
long-term datasets and spurred new partnerships to collect and
integrate marine data. Potentially useful databases for biodiversity
information are listed in Table S4.
The known, unknown, and future directions. As a Census
contribution, the North Pacific Marine Science Organization
(PICES) recently completed an overview of what is known and
unknown with respect to marine biodiversity in the North Pacific
Ocean [233]. It concludes that regional knowledge is based on
aggregate values derived from limited coastal sampling and
detailed information related to commercially important species,
or proximity to a marine science facility. The report discusses six
categories of marine life, focusing on taxonomy, geographic
distribution, abundance, life history, productivity, and variability.
A summary of the PICES report is provided below, along with
taxon-specific information on the state of knowledge regarding
biodiversity in the California Current system, where available,
from personal communications with taxonomic experts.
Bacterioplankton may be very abundant, numbering about
3.161028 single-celled organisms in the world ocean. Growth is
controlled by dissolved organic carbon and, in surface waters,
temperature. Cyanobacteria such as Synechococcus are important in
the California Current region and some species fix nitrogen.
Identification of abundant groups in bacterial communities is
important in assessing roles in carbon cycling and ocean
biogeochemical processes, and as a component of some marine
food webs. The role and importance of bacterioplankton are
largely unknown, because of poorly defined taxa and a basic lack
of core census information [233].
Ocean-color-sensing satellites measuring productivity are the
primary source of phytoplankton information. The California
Current system is less productive than similar South American
upwelling systems because of the breadth of the shelf and
differences in wind stress. Diatoms often dominate regional
phytoplankton species composition; Coscinodiscus, Nitzschia, and
Tripodonesis species form 81% of the biomass, particularly in
upwelling areas. Although phytoplankton is better known than
marine bacteria, critical unknowns include smaller organisms,
temporal and spatial variability, and the dynamics of species
composition and harmful algal blooms [233].
The rich seaweed flora of the Pacific coast has been extensively
explored and cataloged. The accuracy of biodiversity estimates is
affected by limited knowledge of deep communities, of micro-
scopic forms, of species that have been collected rarely, and of
species complexes that need further study, especially with
molecular methods. Future studies will reveal that some species
represent complexes of multiple species, while some species should
be merged. The calcified red seaweeds (Corallinales) are a good
example of a group that will profit from extensive revision. Many
species on the West Coast were described from distant parts of the
world; as a consequence, it is likely that names have been
misapplied and revisions will reveal a higher degree of endemism
(K.A. Miller, personal communication).
The zooplankton is generally better known than bacterioplank-
ton and phytoplankton, although limited information is available
Figure 9. California Current Large Marine Ecosystem (CCLME). Map also shows EEZ boundaries, state boundaries, international boundaries,marine ecoregions, marine protected areas, major embayments, bathymetry and major oceanic currents.doi:10.1371/journal.pone.0011914.g009
Table 9. Biotic diversity in the California Current Large MarineEcosystem.
Taxonomic group No. species1,2,3
Domain Archaea UD
Domain Bacteria (including Cyanobacteria) UD
Domain Eukarya 10,160
Kingdom Chromista 187
Phaeophyta 187
Kingdom Plantae 703
Chlorophyta 139
Rhodophyta 557
Angiospermae 7
Kingdom Protoctista (Protozoa) 896
Dinomastigota (Dinoflagellata) UD
Foraminifera 670
Kingdom Animalia 8,374
Porifera 134
Cnidaria 400
Platyhelminthes 1389
Mollusca 663
Annelida 830
Crustacea 2680
Bryozoa 150
Echinodermata 290
Urochordata (Tunicata) 62
Other invertebrates 733
Vertebrata (Pisces) 909
Other vertebrates 134
TOTAL REGIONAL DIVERSITY4 10,1605
Notes:1Sources of the reports: databases, scientific literature, books, field guides,technical reports, and personal communication with taxonomic experts.
2Identification guides cited in Text S2.3Taxonomic experts cited in Text S4.4Includes all taxonomic groups as reported in Table S1.5Includes 198 parasite-only other protozoans (Haplosporida, Microsporida,Myxosporida, Sarcomastigophora, Sporozoa).
UD = Listed in work but number undetermined to date.doi:10.1371/journal.pone.0011914.t009
U.S. Marine Biodiversity
PLoS ONE | www.plosone.org 27 August 2010 | Volume 5 | Issue 8 | e11914

on the species composition and ecology of smaller zooplankters. In
the 1990s, dramatic shifts in species composition between large cold-
water and small warm-water taxa mirrored environmental oscilla-
tions in the northern areas of the California Current. Shelf copepods,
including species both large (Calanus marshallae, Acartia clausii, and A.
longemirus), and small (e.g. Pseudocalanus species and Oithona similas),
dominate this biota. Knowledge is limited with respect to distribution
and abundance of rare species, zooplankton productivity, spatial and
temporal variability, gelatinous zooplankton, midwater oceanic
shrimps, and deep oceanic zooplankton [233].
Invertebrates are fairly well known, at least for the macrofauna
of the continental shelf. However, deep-sea species are poorly
known and there is little information on the life histories or
biogeography of noncommercial species. In addition, few estimates
of benthic productivity exist, and information on spatial or
temporal variability exists for only selected areas [233]. What is
known and unknown also varies with taxon:
N The richest component of the cnidarian fauna on the
continental shelf appears to be hydrozoans, which make up
just over half the known species of the phylum (greater than
the proportion of hydrozoans in the phylum worldwide).
Cnidaria are best known in the intertidal zone; knowledge
declines with depth, and for some groups, like anemones, the
deep fauna is almost unknown. This is especially problematic
for the West Coast, where the continental shelf is narrow, so
most of the subtidal benthic area within the region is deep (D.
Fautin, personal communication).
N According to Crandall and Norenburg [234,235] there are 137
species of Nemerteans in the Pacific region of the U.S. (not
including Alaska or Hawaii), 119 of which are benthic and 18
bathypelagic. This number is likely an underestimate, based on
the rate of discovery of undescribed species. For example,
about 50 species are known from Central California to Oregon
[233] and recently at least 10 species collected from Oregon
opportunistically are either new to the area or possibly to
science (S. Maslakova, personal communication). This is also
true for other areas in the U.S. Pacific Coast.
N West Coast Gastrotricha species are vastly understudied; only
8 species have been published from the intertidal and shallow
coastal waters of California and Washington. No gastrotrichs
were reported from Oregon until 2001, when Hummon
recorded 30 species in 12 genera [224].
N Most nematodes are known from either the holdfasts of
intertidal kelp or from intertidal sediments. Nematodes inhabit
virtually all habitats, so it is likely that many other species are
either undescribed or unrecognized in this region [224].
N Numbers for Echinodermata are likely to be conservative, with
new taxa and biogeographic records to be added as regions
below 100 m are explored. This will be especially true for
brittlestars and sea cucumbers, as these are less well known
from abyssal regions than are, for example, the sea urchins.
Distribution of species among the five major clades is
approximate and as follows: Crinoidea (sea lilies and feather
stars), 10; Asteroidea (sea stars), 100; Ophiuroidea (brittlestars
and basketstars), 60; Holothuroidea (sea cucumbers), 40;
Echinoidea (sea urchins, heart urchins, and sand dollars), 80
species (R.J. Mooi, personal communication).
More is known about fishes than most other species groups
because of their larger size and use as a sustainable resource.
There are an estimated 912 West Coast fishes (J. Orr, personal
communication), of which 7 are agnathans (hagfish and lampreys)
and 80 are chondrichthyians (sharks, rays, and ratfish). Also
included are 11 species that have been recognized but not yet
named. Primary unknowns for fishes in general include the life
histories of many species, productivity estimates, and spatial and
temporal variability [233].
Seabirds and marine mammals are perhaps the two best-known
groups because they are relatively large and charismatic, many are
of economic importance, and certain species, particularly those
that breed on land, can be easily observed and tracked. A total of
92 species of seabirds has been recorded on the West Coast [231];
of these, 52 are associated with the northern California Current
and 49 with its southern reach [233]. Thirty-eight marine
mammal species can be found within the region [232], 16 in the
north and 30 in the south [233]. The list of marine mammal
species was considered complete until 2002, when a new species of
beaked whale was identified from genetic analysis of five animals
stranded on the California coast. As with other groups of species,
unknowns for both seabirds and marine mammals include species
productivity and variability [233].
Trouble spots and emerging issues. Over the past decade,
marine endangered species have emerged as an increasingly
serious problem with wide-ranging societal implications. At
present, about 25 species of West Coast marine mammals,
seabirds, turtles, fish, and shellfish are listed as threatened or
endangered under the federal Endangered Species Act (http://
www.nmfs.noaa.gov/pr/pdfs/esa_factsheet.pdf). Many of the
listed whales and turtles are migratory oceanic species that were
designated at the time the law was enacted (http://www.nmfs.
noaa.gov/pr/pdfs/esa_factsheet.pdf). Over a little more than a
decade, however, the depletion of salmon and steelhead runs (as a
result of dams, overfishing, loss of habitat, and hatchery fish
interactions) has led to the need to protect dozens of salmonid
populations. Today, 52 evolutionarily significant units are
recognized for the 6 regional salmonid species (http://www.nwr.
noaa.gov/ESA-Salmon-Listings/Salmon-Populations/); 5 species
are designated as endangered and 23 as threatened (http://www.
nwr.noaa.gov/ESA-Salmon-Listings/upload/snapshot-7-09.pdf).
Hundreds of millions of dollars are being spent to restore critical
habitat, and serious consideration is being given to dam removals.
Federal managers recently concluded that current water-pumping
operations in California’s Federal Central Valley Project and the
California State Water Project should be changed to ensure
survival of winter and spring-run Chinook salmon, Central Valley
steelhead, the southern population of North American green
sturgeon, as well as southern resident killer whales that rely on
Chinook salmon runs for food [236]. In response, the federal
government will spend $109 million to construct a pumping plant
to allow salmon and green sturgeon unimpeded passage (http://
www.noaanews.noaa.gov/stories2009/20090604_biological.html).
While the primary focus currently is on salmon, other listed and
candidate species are on a collision course with human develop-
ment and activities in the region.
Overfishing continues to be a problem for salmon. The U.S.
Department of Commerce in April 2009 extended a disaster
declaration for the California and Oregon fisheries in response to
expected poor salmon returns in the Sacramento River (http://
www.noaanews.noaa.gov/stories2009/20090430_salmon.html).
In a typical year, about half a million fall-run Chinook return to
the river to spawn (http://www.noaanews.noaa.gov/stories2009/
20090430_salmon.html). In 2007 and 2008, poor ocean conditions
and overreliance on hatchery fish reduced returns to a fraction of
that number [237], necessitating a near closure of the Oregon and
California fisheries.
The West Coast groundfish fishery includes more than 90
species of rockfish, flatfish, roundfish, sharks, and skates (http://
U.S. Marine Biodiversity
PLoS ONE | www.plosone.org 28 August 2010 | Volume 5 | Issue 8 | e11914

www.pcouncil.org/facts/groundfish.pdf). Seven species (widow
rockfish, canary rockfish, yelloweye rockfish, darkblotched rock-
fish, bocaccio, Pacific ocean perch, and cowcod) currently are
overfished and subject to rebuilding efforts (http://www.pcouncil.
org/facts/groundfish.pdf). While rockfish populations in some
locales are relatively healthy, others face severe localized
depletions. Three rockfish populations in Puget Sound and the
Strait of Georgia currently are being considered for listing under
the Endangered Species Act as a result of overfishing (http://
www.nmfs.noaa.gov/mediacenter/docs/04_22_2009.pdf). In the
Georgia Basin, canary and yelloweye rockfish are proposed for
threatened status, and bocaccio is proposed for endangered status
(http://www.nmfs.noaa.gov/mediacenter/docs/04_22_2009.pdf).
The top headline in the June 14, 2009, Seattle Times asked ‘‘Is the
Pacific Ocean’s chemistry killing sea life?’’ (http://seattletimes.
nwsource.com/html/localnews/2009336458_oysters14m.html).
The West Coast shellfish industry is facing a fifth consecutive year of
oyster hatchery failures, and scientists are beginning to examine
possible links to ocean acidification (http://seattletimes.nwsource.
com/html/localnews/2009336458_oysters14m.html). Other re-
gional climate change concerns are alteration in coastal habitats
as a result of sea level rise, changing ocean water circulation and
upwelling patterns, shifts in the abundance and distribution of
marine species, and increased incidence of harmful algal booms and
other nuisance species [222].
Aquatic invasive species (AIS) are nonindigenous species that
threaten the diversity or abundance of native species, the
ecological stability of infested waters, or human activities that
depend on such waters. On the West Coast, the introduction and
spread of AIS have emerged as major environmental, economic,
and public health problems tied to expansion in international
trade and transportation [222]. Recent studies suggest that AIS
are a significant threat to biodiversity, second only to habitat loss
and degradation and more serious than pollution and overhar-
vesting (e.g., [238]). In San Francisco Bay, AIS dominate many
important habitats in number of species, population size, and
biomass [239]. Researchers concluded that San Francisco Bay is
one of the most invaded estuaries in the world; a new species
arrives and becomes established every 14 weeks [239]. In the
Northwest, concerns have grown regarding AIS capacity to
undermine shellfish harvests. Species such as the invasive tunicates
Didemnum and Styela clava, European green crab, Japanese oyster
drill, Spartina (cordgrasses), and various pathogens and parasites
represent ongoing threats to the regional aquaculture industry
(http://wdfw.wa.gov/fish/ans/index.htm; http://www.sfei.org/
bioinvasions/BioInvproginfo.htm).
Another emerging West Coast concern is hypoxia, or low
oxygen conditions, that may be caused by numerous factors. In
urban estuaries, hypoxic events are attributed, at least in part, to
excess anthropogenic nutrient input [240]. The duration and
severity of the event may be determined by additional factors, such
as water depth, wind, and flushing rates [240]. By contrast,
offshore events that reduce or eliminate populations of fish and
benthic invertebrates in historically productive habitats may be
responses to other processes. Although seasonal wind-driven
upwelling is known to transport nutrients and low-oxygen water
to coastal waters, it is not yet fully understood why ocean events
occur some years and not others. Reports of long-term decreases
in oxygen concentrations at open ocean and coastal locations have
prompted concern about the consequences for marine ecosystems
[241]. In August 2006, an event with severe hypoxic and anoxic
conditions on the central Oregon coast led to the complete
absence of all fish from normally populated rocky reefs and to high
mortality of large benthic invertebrates [242].
The Census of Marine Life contribution to the California
Current region. In 2002, 2003, and 2005, the Census and
Scripps Institution of Oceanography’s Center for Marine
Biodiversity and Conservation sponsored three workshops to
examine marine biodiversity in the past, present, and future. In
addition, two of the initial field projects of the Census have been
focused on the West Coast. TOPP attaches satellite tags to 22
species of top marine predators to study migration patterns and
the oceanographic factors that influence them. POST is a tool for
tracking the movement of marine animals along the coast, using
acoustic transmitters implanted in a variety of species and a series
of receivers running in lines across the ocean floor. One major
POST focus is the development of a permanent continental-scale
marine telemetry system.
Alaska’s Large Marine Ecosystems – the Gulf of Alaska,Eastern Bering Sea and Aleutian Islands, and Chukchi andBeaufort Seas
Description of the Alaska region. Alaska’s marine waters
are some of the most productive in the world; Alaskan commercial
fisheries yield over half of fish landings from U.S. waters. Because
this is a large region, various ways have been proposed for dividing
it ecologically, from a few large ecosystems to many smaller
ecoregions (e.g., [243,244,245]). For purposes of this overview, the
region includes at least parts of four LMEs listed in the
Introduction, with emphasis on areas within the U.S. EEZ. The
LMEs differ in ecosystem structure, function and biodiversity, in
commercial, recreational, and subsistence uses, and in resource
management issues [246], as well as in climate, seasonal weather
patterns, and sea ice conditions. All are graced with relatively
pristine waters, and all have significant deep ocean basin waters.
The Gulf of Alaska (GoA) LME ranges from Vancouver Island,
B.C. (about 50uN and 125uW) to Samalga Pass in the Aleutians, at
roughly 52uN and 169uW (Figure 10). Several significant bodies of
water adjoin the Gulf, including Southeast Alaska inside waters,
Prince William Sound, and Cook Inlet. The continental shelf is
relatively narrow off Southeast Alaska, broadens around Kodiak
Island, and then narrows toward the Aleutians. This relatively
deep shelf is extremely irregular, reflecting tectonic and glacial
influences. A nearly continuous coastal mountain barrier results in
enhanced winds and precipitation [247,248].
The Bering Sea and Aleutian Islands (BSAI) LME extends
northward from the Aleutians to the Bering Strait. It has a broad,
highly productive continental shelf that supports robust cod,
pollock, flatfish, and crab fisheries. Several large underwater
canyons cut into the shelf, bringing nutrient-laden waters onto the
shelf and providing hard substrate areas of high biodiversity for
corals and sponges [249,250]. The waters are generally well mixed
by strong tides and winter winds, although transitional zones or
fronts separate the southeastern Bering Sea shelf into coastal,
middle, and outer shelf domains in the spring and summer
[251,252].
The high Arctic comprises the Alaska portions of the Chukchi
and Beaufort sea LMEs. The boundary between the Arctic and
BSAI LMEs is indistinct, and in many respects the hydrographic
characteristics of the northern Bering Sea relate more to the Arctic
Chukchi Sea than to the southern Bering Sea shelf [253]. These
continental shelves are among the largest in the world [253].
Because those of the northern Bering and southern Chukchi Seas
are typically less than 50 m deep, they formed a continuous land
bridge from Alaska to Siberia during the last ice age, which ended
about 10,000 to14,000 years ago [254]. The Alaska Beaufort Sea
shelf is relatively narrow.
U.S. Marine Biodiversity
PLoS ONE | www.plosone.org 29 August 2010 | Volume 5 | Issue 8 | e11914

Coastal currents thread the LMEs together and the presence or
absence of seasonal and permanent sea ice helps differentiate
them. The Alaska Coastal Current influences all regions, forced
mainly by a combination of coastal, wind-driven convergence, and
freshwater runoff from land [247]. The Alaska Coastal Current
flows northward from British Columbia along the entire Gulf of
Alaska coast through Unimak Pass, and onto the southern Bering
Sea shelf. There it is low in nutrients because of the strong
freshwater and terrestrial influences along its path that extends all
the way to the western Beaufort Sea [255]. Upwelling in the Gulf
of Anadyr transports nutrient-laden water onto the northern
Bering Sea shelf, and the Chirikov Basin, whence it enters the
Chukchi Sea through the western portion of Bering Strait
[253,256]. This nutrient transport system drives high primary
and secondary production along the way, supporting abundant
and diverse marine mammal, bird, fish, and shellfish populations.
The Chukchi shelf is influenced on the Russian side by the
Siberian Coastal Current flowing east along the northern coast of
Russia from the Laptev Sea, bringing considerable river discharge
and ice melt. The Alaska side is influenced by freshwater from the
Yukon and Kuskokwim rivers transported north by the Alaska
Coastal Current.
Seasonal and multiyear sea ice distinguishes the BSAI and
Arctic. Sea ice provides a seasonal or year-round substrate for
primary and secondary production inside and below the ice
[251,257]. Seasonal ice begins to form on the leeward side of
coastlines in late fall, and frigid northerly winds blow the ice
southward. The timing of ice advance and retreat and the extent
of coverage vary greatly from year to year. The maximum
southern sea ice boundary in the Bering Sea in March is predicted
to move north over the next 50 years because of global warming.
In the Chukchi and Beaufort seas, seasonal ice begins to add to the
polar pack ice in early October. By late October or early
November, it extends far south through the Bering Strait, joining
the ice forming in the Bering Sea. Ice begins to melt in mid-June in
the southern Chukchi Sea. The Arctic coastal regions of the
Chukchi and Beaufort Seas generally are covered with shore-fast
ice for about eight months, but over the past two decades, sea ice
extent and thickness have diminished. Record seasonal retreats of
sea ice northward into the Chukchi and Beaufort seas were
reported for 2002-2005 [258], but they were exceeded by ice
retreats in 2007 and 2008 [255]. During the first half of July 2009,
Arctic sea ice extent declined more quickly than in 2008, but not
as fast as in 2007 (National Snow and Ice Data Center: http://
Figure 10. Gulf of Alaska, Bering Sea and Aleutians, and Chukchi and Beaufort seas. Map also shows large marine ecosystems, EEZboundaries, state boundaries, international boundaries, marine ecoregions, and marine protected areas.doi:10.1371/journal.pone.0011914.g010
U.S. Marine Biodiversity
PLoS ONE | www.plosone.org 30 August 2010 | Volume 5 | Issue 8 | e11914

nsidc.org/arcticseaicenews/). Some climate-ocean models predict
the ice cover over the Arctic Ocean will decline in extent by
roughly 10-50% by 2100, and in summer will completely
disappear by 2040 [259]. By 2090, average annual air tempera-
tures are projected to rise across the entire Arctic region by
roughly 3 to 5uC over land areas and up to 7uC over the oceans.
The Gulf of Alaska shelf is dominated by gravel, sand, silt, and
mud, punctuated by areas of hardrock. There are numerous banks
and reefs with coarse, rocky bottoms, but much of the shelf is
covered by glacial silt from the Copper River and the Bering and
Malaspina glaciers [247]. In contrast, the Aleutian shelf is narrow,
with a complicated mixture of substrata, including a significant
proportion of hard pebble, boulder, and rock. The Aleutian passes
are very deep and have bedrock outcrops and coarsely fragmented
sediment interspersed with sand.
The Bering Sea shelf is composed mainly of sand and mud
[243]. Small amounts of gravel are common around the shallow
eastern and southern perimeter of the shelf, near the Pribilof
Islands and in the Bering Strait area. Undersea canyons on
the outer shelf with hard substratum are particularly rich areas
of marine epifaunal biodiversity. Near St. Matthew and St.
Lawrence islands, mud and sand substrata predominate, turning
to a complex mixture of substrata north of St. Lawrence
Island and into Norton Sound, supporting a rich infaunal
community.
The offshore Chukchi Sea is composed of silty sand and mud,
whereas the nearshore eastern Chukchi Sea is composed of more
heterogeneous and coarser sediments, including sand and gravel.
The coastal region is also influenced by river sediments from the
Yukon and other Alaska rivers. The Beaufort Sea is blanketed
mainly with silty sands and mud from many rivers, especially the
MacKenzie River west to the Kuparuk and Colville rivers (e.g.,
[260]). The Boulder Patch off Prudhoe Bay on the North Slope of
the high Arctic with cobbles and boulders that support many
species of algae and invertebrates unknown from the surrounding
soft-bottom areas [261]. It is protected from deep-draft sea ice by a
chain of offshore barrier islands and shoals. The multiyear sea ice
provides unique habitat for ice-associated phytoplankton, zoo-
plankton, small invertebrates, and a few species of fish, as well as
resting, breeding, and hunting platforms for marine mammals of
several species [262].
Regional history of biodiversity studies. Marine research
off Alaska is not for the faint of heart. High winds and waves, and
freezing sea spray often preclude fieldwork during the long winters
from October through April or May, and regions of the Bering Sea
and Arctic Ocean covered by sea ice require special logistics.
These include ice breakers or at least ice-strengthened hulls on
research vessels, or in other cases, remote camps on multiyear pack
ice. The Gulf of Alaska is the most accessible LME. It has winter
storms, and sometimes extensive broken sea ice in Cook Inlet.
Research facilities affiliated with the University of Alaska
Fairbanks (UAF) or NOAA are located in coastal communities,
including Sitka (UAF), Juneau (UAF and NOAA), Cordova
(Prince William Sound Science Center), Seward (UAF and Alaska
SeaLife Center), Kachemak Bay (NOAA and UAF), and Kodiak
(NOAA and UAF). In the Bering Sea and high Arctic, it is likely
that most large-scale federally funded research programs will
continue to focus on support of fisheries and oil and gas activities.
Research there requires ships capable of operating in high seas and
storm conditions. These large vessels, such as the Healy, Miller
Freeman, and Oscar Dyson, typically load and offload in Seattle,
Kodiak, and Dutch Harbor. Transit times are long and operations
expensive. This also applies to Arctic operations, which will
require icebreaker support for the foreseeable future [263].
Establishing and maintaining camps on the pack ice are even
more expensive and time consuming.
This region has many, diverse Native communities with
intimate cultural connection to the marine ecosystems that
sustained them for thousands of years. A wealth of traditional
ecological knowledge is held in these communities, but is only just
beginning to be incorporated into scientific understanding of
Alaska’s marine ecosystems [246].
There have been many scientific expeditions over the years,
despite the high cost and adverse conditions. PICES funded an
illustrated historical review of seafaring discovery and scientific
exploration of the North Pacific Ocean from 1500 to 2000 [223].
Voyages of early explorers were mostly for mapping. Vitus
Bering’s Second Kamchatka Expedition (1741-42) included Georg
Steller, the first scientist to be carried on a Pacific voyage, who
identified five species of salmon, named various seabirds and
marine mammals, and described life cycles and ecological
relationships. In the 1820s, Russian voyages associated with the
Russian-American Company carried naturalists who collected
fishes, crustaceans, and birds that apparently were deposited in the
Imperial Russian Academy of Sciences in St. Petersburg, Russia.
In 1874, deep benthic species were collected in the Aleutian
Trench on an expedition led by George Belknap on the U.S.
steamer Tuscarora. In 1886, the U.S. Fisheries Commission sent its
flagship, the Albatross, to work Alaskan waters each summer,
concentrating on the species harvested for subsistence and
commercial use. In 1899, the Harriman Alaska Expedition
explored the Pacific coastal waters from Seattle through Prince
William Sound, out to the Aleutians and north along the Russian
coast of the Bering Sea [264]. Invertebrates were surveyed
extensively and specimens were distributed to universities and
museums for analysis and identification, resulting in four volumes
on species ranging from ribbon and segmented worms to sea stars
and sea spiders [265,266,267].
In 1955, the NORPAC (North Pacific) Expeditions used 19
ships from 14 oceanographic institutions in three countries to
collect near-simultaneous ocean data across the North Pacific
between 20 and 60uN. Phytoplankton and zooplankton compo-
sition and abundance data were collected along with oceano-
graphic data. The Japanese research vessel Oshoro Maru and the
University of Washington’s Brown Bear were primarily responsible
for data collection off Alaska. The data were published in the
NORPAC Data and NORPAC Atlas of the annual publication
Oceanographic Observations of the Pacific. Starting in the 1950s, the
Russian research vessel Vityaz, the Bering Sea Commercial
Research Expedition, and the Pacific Research Institute of
Fisheries and Oceanography (TINRO), as well as the Oshoro
Maru, collected zooplankton and deep-sea fauna in the North
Pacific [268]. A review of investigations in the Gulf of Alaska is
provided by Hood [269] and reviews of mostly benthic
investigations in the Bering, Chukchi, and Beaufort seas are
provided by Grebmeier et al. and by Sirenko and Gagaev
[253,270].
The early expeditions in the Aleutians and Gulf of Alaska
inventoried marine biodiversity qualitatively rather than quanti-
tatively, but the most comprehensive and accessible programs are
more recent ones funded by MMS and NOAA. These programs
originally aimed at providing baselines for oil and gas develop-
ment. Fish stock assessments became mandatory in the 1980s as
foreign fisheries were replaced by U.S. fisheries. The MMS Outer
Continental Shelf Environmental Assessment Program (OC-
SEAP), which began in 1974 and continues today, although at a
lower level since the mid-1980s, has collected extensive species
information. NOAA’s bottom trawl surveys collect information on
U.S. Marine Biodiversity
PLoS ONE | www.plosone.org 31 August 2010 | Volume 5 | Issue 8 | e11914

fishes and many species from the Bering Sea and Aleutians and
Gulf of Alaska to support fishery management decisions by the
North Pacific Fishery Management Council and the Secretary of
Commerce. Biodiversity information has also been collected by the
Exxon Valdez Oil Spill Trustee Council in Prince William Sound,
continuous plankton recorder surveys across the North Pacific,
Seward Line zooplankton collections in the Gulf of Alaska, and
Hokkaido University’s annual training cruises on the Oshoro Maru
to the Bering Sea and Strait and, less frequently, to the Chukchi
Sea.
Biodiversity research in the high Arctic Ocean is described by
Hopcroft et al. [271]. Pack ice provided a platform for sampling
from stations such as T-3 and Arctic Ice Dynamics Joint
Experiment in the 1960s and 1970s, and extensive Arctic
nearshore research was funded by MMS through OCSEAP in
the 1970s and 1980s. Among numerous expeditions by icebreakers
and other research vessels to the northern Bering Sea and Strait,
the Chukchi Sea, and other Arctic regions [272] is the Western
Arctic Shelf-Basin Interactions Project in 2002-2008, which
assessed the effects of variability in sea ice cover and hydrography
on the marine ecosystem and the impacts of climate change. The
project included extensive collection of specimens and mapping of
benthic fauna [255,273].
The NOAA Office of Ocean Exploration supported cruises to
study biodiversity in 2002 and 2005. An international team of 50
scientists from the U.S., Canada, China, and Japan used a
remotely operated vehicle specially designed to operate under ice
and at great depth to explore biota over the full range of habitats
in the deep Canada Basin, from brine channels in the sea ice to the
benthic communities. Among other activities, the program
sampled under-ice fauna and gelatinous zooplankton, and
collected cephalopods and deep-sea benthic fauna. The Russian-
American Long-term Census of the Arctic in 2004-12 involves a
partnership with the Russian Academy of Sciences and other
Russian institutions to create a benchmark dataset to study the
distribution and migration patterns of organisms in the Pacific
gateway area of the Bering Strait and southern Chukchi Sea,
regions that are thought to be particularly sensitive to climate
change [270]. Three biodiversity-focused programs supported
under the Census are ArcOD [274], NaGISA [275], and the
Census of Marine Zooplankton (CMarZ) [276,277]. Recently,
MMS initiated programs in Arctic waters because of renewed
national interest in oil and gas exploration and development. For
example, in August 2008, NOAA’s Alaska Fisheries Science
Center was funded by MMS to survey the offshore waters of the
Beaufort Sea to provide estimates of abundance and species
composition of marine fishes and invertebrates, as well as
information on the macro- and microzooplankton communities
and their oceanographic environment [278]. Also in 2008, the oil
and gas industry began new biological assessment programs
(Chukchi Sea Offshore Monitoring in Drilling Area: Chemical and
Benthos) in the Chukchi Sea in response to the sale of leases for
new offshore prospect areas.
Understanding ecosystem processes and relationships of organ-
isms within ecosystems is a focus of large-scale research programs
off Alaska (e.g., see the joint National Science Foundation–North
Pacific Research Board Bering Sea study at http://bsierp.nprb.
org). In addition to such hypothesis-driven ecosystem research are
significant efforts to support resource management by monitoring
fish and invertebrate distribution and abundance through time.
These surveys contribute to broader knowledge of biodiversity,
continuing to add to the many efforts over the past 40 years to
enumerate species from the coastal rocky headlands to the deep
ocean and even in sea ice. However, no species inventory exists of
all realms for any region of Alaska. A census of all organisms,
including plants, will require intensive discovery and compilation
(and in some cases, translation) of a wide variety of taxonomic
works for the North Pacific, including those from Japan and
Russia, two countries that have done significant research in
northern waters for decades. For example, Sirenko [279] provides
the most extensive taxon lists available for free-living invertebrates
in the high Arctic. ArcOD is working under the leadership of Dr.
Sirenko in St. Petersburg, Russia, on a multi-volume taxonomic
inventory for the Arctic that eventually will be published by Alaska
Sea Grant. The first volume treated mostly groups of free-living
crustaceans [280]. A special issue in Deep-Sea Research Part II
includes papers on sea ice, pelagic and Benthic communities, food
web structure, and barcoding, with a focus on the Chukchi Sea
and Canada Basin [281].
Significant databases containing biodiversity information are
listed in Table S4. What data from federal programs sponsored by
MMS and NOAA are available at the National Ocean Data
Center (NODC) is unclear because data and metadata submission
requirements are unevenly enforced by federal agencies. Many
individual project reports from OCSEAP are available online at
the Alaska Resources Library and Information Services (ARLIS:
http://www.arlis.org/docs/vol1/OCSEAP2/macro.html), but it
is unclear whether all datasets in those reports were digitized and
submitted to NODC.
Electronic project reports for research funded by the Exxon
Valdez Oil Spill Trustee Council (EVOSTC) on benthic nearshore
biodiversity in Prince William Sound and along the North Gulf
coast are available at http://www.evostc.state.ak.us/, but most
EVOSTC funds were passed to agencies, such as the Alaska
Department of Fish and Game, to do the work, and now, years
later, EVOSTC is just beginning to compile the project data for a
central database. There seems also to be a large dataset at the
Institute for Marine Science at UAF containing data on a broad
range of species collected along the Alaska shoreline just after the
1989 oil spill, at a cost of some $20 million, but the extent to which
these data are being rescued and made accessible is unclear.
The known, unknown, and future directions. Surveys and
monitoring, such as described above, must continue to document
how the species mix may change as organisms migrate into and out
of Alaska waters because of global change. Although currently there
is no comprehensive list of species for all of Alaska because either
there are no Alaskan surveys of particular taxa or the literature is
inadequate for compiling such an all-inclusive list. However,
comprehensive lists exist for particular regions. Bodil Bluhm, Rolf
Gradinger, and Russ Hopcroft, who are associated with ArcOD,
have compiled the most complete list available for any region of
Alaska, an inventory of nearly 6,000 species for the Arctic Ocean
(Table 10; more detail is available in Table S1) that is based heavily
on Sirenko [279]. More conservative lists for each LME have been
provided by Bruce Wing (Curator, Reference Collections, at the
Auke Bay Lab of NOAA’s Alaska Fisheries Science Center),
estimating 542 species in the Gulf of Alaska, 572 in the Bering Sea
and Aleutian Islands, and 220 in the Arctic (Table S7), with roughly
2,500 species Alaska-wide. The total number is smaller than for just
the Arctic (albeit the entire Arctic) cited above, which would imply
the total number of species for Alaska as a whole is at least several
times and possibly an order of magnitude greater than that given in
Table S7. The large discrepancies in various estimates stem from,
and are evidence of, the incomplete knowledge of Alaskan marine
biodiversity. We will not know how many species exist off Alaska
until a major effort is made to combine and reconcile species lists
and then ‘‘ground-truth,’’ or verify, identifications using accurate,
scientifically acceptable taxonomic guides. Until then, investigators
U.S. Marine Biodiversity
PLoS ONE | www.plosone.org 32 August 2010 | Volume 5 | Issue 8 | e11914

interested in marine biodiversity will need to rely on primary
research articles and summaries for specific assemblages and
subregions. See Text S2 for a list of useful taxonomic guides. In
addition to taxonomic studies, knowledge of marine habitats off
Alaska and habitat mapping are needed.
Atlas and Griffiths [282] reviewed studies of bacteria in the Gulf
of Alaska, identifying 13 genera of isolates: Microcyclus,
Moraxella, Acinetobacter, Vibrio, Beneckea, Aerimonas, Flavo-
bacterium, Alcaligenes, Arthrobacter, Bacillus, Pseudomonas,
Chromobacterium, and Micrococcus. In the Arctic Ocean, Bano
and Hollibaugh [283] identified approximately 18 phylotypes,
which they consider a minimum estimate of richness. They
concluded that Arctic Ocean bacterioplankton assemblages, which
are as complex as assemblages from California coastal waters,
represent novel groups of organisms, at least compared with those
from tropical and temperate waters.
Photographs and descriptions of the more abundant and visible
species of seaweeds are at http://www.seaweedsofalaska.com: they
include 23 species of Chlorophyta (green), 37 of Phaeophyta
(brown), and 61 of Rhodophyta (red). This is only a partial list of
Alaskan seaweeds. A recent survey of specimens collected over the
past two centuries, together with the application of molecular
techniques to recent collections, shows surprisingly high diversity,
given the history of glaciation, large areas of unsuitable habitat,
and otherwise harsh environmental conditions [284]. The number
of recognized species has increased from 376 in 1977 to about 550
today, and may actually be around 600 species, with recent
discoveries of previously unknown seaweeds in the Aleutians (e.g.,
a new species of kelp on Kagamil Island [285]) and the northern
Gulf of Alaska (S. Lindstrom, personal communication). There is a
wide range of biogeographic patterns: species that occur primarily
to the south and have their northern limit in Alaska, species that
occur primarily to the west and have their eastern limit in Alaska,
species that are primarily Atlantic but extend through the Arctic to
Alaska, and some endemics. Southeast Alaska alone has on the
order of 368 species of seaweeds, making it the most diverse region
in the state [284,286]. The entire Arctic is estimated to have about
150 species [287] of which about half are verified to occur in
Alaska (S. Lindstrom, personal communication). The Alaska
Seaweed Database (http://herbarium.botany.ubc.ca/herbarium_
data/algae_alaska/search.htm) lists 25 Phaeophyceae species, 18
Rhodophyta, 15 Chorophyta, and 1 Plantae species (Table S1).
One of many lists of planktonic species is that by Sambrotto and
Lorenzen [288] for phytoplankton in the eastern subarctic Pacific
north of 42uN and east of 180uW, which includes the Gulf of
Alaska and much of the Aleutian Islands area. Cooney [289]
provided a list of zooplankton for the northern Gulf of Alaska. R.
Hopcroft (personal communication) compiled a list for the Arctic
Ocean, which he noted was continually evolving and will be
included in the more formal Arctic Register of Marine Species
now under development. Combined, as shown in Table 11,
roughly 350 species of phyto- and zoo-plankton occur in the Gulf
of Alaska. The most speciose group is Crustacea, which includes
an abundance of copepods, amphipods, decapods, and mysids.
Crustaceans are also diverse in the Bering Sea and the Gulf of
Alaska. Cooney [290] listed 310 species of zooplankton in the
Bering Sea. Motoda and Minoda [291] provided a list of 327
species (including phytoplankton) for the Bering Sea. For
gelatinous zooplankton of the Arctic Ocean, Hopcroft [292] listed
6 ctenophores, 45 medusae, 12 siphonophores, 4 pteropods, and 5
larvaceans, but noted that twice as many species will be identified
when sampling is completed. Kosobokova and Hopcroft [293]
listed a total of 111 species, including 74 species of crustaceans (55
copepods, 2 euphausiids, 11 amphipods, 1 decapod, 5 ostracods),
17 cnidarians, 1 foraminiferan, 4 ctenophores, 2 pteropods, 4
larvaceans, 4 chaetognaths, and 5 polychaetes from a single
Canada Basin cruise. For the Arctic Ocean in general, Horner
[294] estimated there are some 287 diatom species. In a single sea
ice core taken in the Chukchi Sea, Quillfeldt et al. [295] found 237
diatom species. Hopcroft’s estimate of 357 plankton species in the
Arctic is based on his unpublished data added to species lists
provided by Sirenko [279].
As with plankton, there are many lists of benthic invertebrate
species (e.g., [261,279,296,297,298,299,300,301]). Some examples
are given in Table 12. The detailed study of macrofauna in Prince
William Sound by Foster [299] provided one of the most extensive
lists, with a total of 1,582 species, most of which were crustaceans,
mollusks, annelids, and cnidarians. To the north, Stoker [296]
found fewer macrofaunal species in the eastern Bering Sea and
Chukchi Sea shelf than in the Gulf of Alaska: most of the 492
Table 10. Biotic diversity in the high Arctic (not exclusivelythe U.S.).
Taxonomic group No. species1,2
Domain Archaea UD
Domain Bacteria (including Cyanobacteria) UD
Domain Eukarya 5,925
Kingdom Chromista 287
Phaeophyta3
Kingdom Plantae3 150
Chlorophyta
Rhodophyta
Angiospermae
Kingdom Protoctista (Protozoa) 759
Dinomastigota (Dinoflagellata) 70
Foraminifera 325
Kingdom Animalia 4,729
Porifera 163
Cnidaria 227
Platyhelminthes 134
Mollusca 488
Annelida 533
Crustacea 1525
Bryozoa 331
Echinodermata 151
Urochordata (Tunicata) 64
Other invertebrates 600
Vertebrata (Pisces) 415
Other vertebrates 98
TOTAL REGIONAL DIVERSITY4 5,925
(Bluhm, Gradinger and Hopcroft, personal communication).Notes:1Sources of the reports: databases, scientific literature, books, field guides,technical reports, and personal communication with taxonomic experts.
2Identification guides cited in Text S2.3The 150 species of seaweeds listed by Bluhm, Gradinger and Hopcroft for theentire Arctic include Phaeophyta. For more detail regarding seaweeds in theArctic Ocean, see Table S1.
4Total regional diversity for the Arctic Ocean, including all taxonomic groups, isreported in Table S1.
UD = Listed in work but number undetermined to date.doi:10.1371/journal.pone.0011914.t010
U.S. Marine Biodiversity
PLoS ONE | www.plosone.org 33 August 2010 | Volume 5 | Issue 8 | e11914

species were mollusks, annelids, and crustaceans. In the Boulder
Patch, Dunton and Schonberg [261] found 204 species, with
annelids, mollusks, and crustaceans predominating. To the east, in
the southern Beaufort Sea and west Amundsen Gulf, Chapman
and Kostylev [302] compiled a list of 855 benthic species,
dominated by annelids, crustaceans, and mollusks.
In a study of over 14,000 stations in Arctic seas, Sirenko and
Piepenburg [303] found 4,296 animal species, about 87%
invertebrates. Benthic species predominated, the richest group
being crustaceans (1,075 species, or 25%). They noted that in
general, benthic taxa are not as well studied as planktonic taxa,
and that among the benthic taxa, macrobenthic groups tend to be
best known. They estimated that about 90% of species of
foraminiferans, sponges, bryozoans, mollusks, and echinoderms
are known, whereas turbellarians, nematodes, scyphomedusae,
ascidians, and ostracods are particularly poorly studied. They
concluded that an estimated 1,800 invertebrate species remain
unknown, which, when added to the known species, would result
in an estimate of about 5,600 invertebrate species in Arctic seas.
Expanding on that study, Sirenko [279] provided a list of free-
living invertebrates, 1,168 species from the Chukchi Sea (updated
to 1,436 species in 2009 [304]) and 833 species from the central
Arctic Ocean Basin, for a total of 4,784 from the entire Arctic.
Sirenko included both planktonic (about 300 multicellular species,
which comprise 6% of Arctic species) and benthic species
(macrobenthos are 60% of species, and meiobenthos are 34%).
As with other lists, crustaceans, mollusks, and annelids contributed
high numbers of species, and more species remain to be found. For
example, after discovering 9-10 new invertebrate species in only
about 2 m2 of seafloor in the Canada Basin, MacDonald et al.
[305] concluded that potentially hundreds of more new species
may be found in future inventories in the Arctic basins or even in
the Canada Basin alone.
The most recent and comprehensive compilation of fish species
off Alaska is by Mecklenburg et al. [306], with updated
georeferenced species information in the authors’ database at
http://www.arcodiv.org/Database/Fish_datasets.html (linked to
OBIS). They reported 521 confirmed species Alaska-wide, plus
another 80 reported but not confirmed, or probably in Alaska but
not reported. The 521 species include 474 saltwater species, 22
freshwater species, and 25 that are anadromous or euryhaline.
Sculpin and rockfish dominate the list. There are roughly 341
species in the Gulf of Alaska, 367 in the Bering Sea and Aleutians
and 78 in the Arctic. These contrast with earlier estimates of 287
species belonging to 55 families in the Gulf of Alaska [307], and
300 in the Bering Sea [308]. From NOAA bottom trawl surveys
along the Aleutians, Logerwell et al. [309] found 245 fishes in
three provinces (Arctic-Kurile, Kurile, and Oregonian). The most
diverse assemblage, composed mainly of arrowtooth flounder,
Pacific cod, Pacific halibut, rock soles, and walleye pollock, was in
the northeast shallow continental shelf of the Aleutians, east of
Adak Strait. In a synthesis of information on the Arctic Ocean,
Mecklenburg et al. [310] reported up to 104 fish species.
Mecklenburg et al. [306] noted that their catalog added a
minimum of 90 new confirmed species to the inventory done in
1972. Andriashev and Chernova [311] list 415 species of marine,
diadromous, and freshwater species occurring in brackish waters
for the entire Arctic and adjacent waters.
Twenty-six species of marine mammals, which include seals, sea
lions, walrus, whales, dolphins, porpoises, sea otters, and polar
bears, exist off Alaska; 25 are documented by Angliss and Allen
[312] and the narwhal was added recently by NOAA. Seventeen of
those species occur in the Gulf of Alaska, 25 in the Bering Sea, and
14 in the Arctic (J. Ferdinand, NOAA, personal communication).
Alaska seabirds are represented mainly by albatrosses, shear-
waters, fulmars, storm petrels, cormorants, gulls, puffins, murres,
Table 11. Plankton species estimates for Gulf of Alaska, Bering Sea and the Arctic Ocean (numbers should be consideredminimum estimates).
Taxa Gulf of Alaska planktona Bering Sea planktonb Bering Sea zooplanktonc Arctic Oceand
Radiolaria 116 24 40
Chlorophyta 5
Foraminifera 111 3
Dinoflagellates 14 16
Cnidaria 42 21 41 73
Ctenophora 3 1 1 13
Annelida 9 1 17 6
Crustacea 152 139 235 203
Mollusca 9 1 8 5
Chaetognatha 5 6 6 10
Urochordata 4 2 2 4
Total 354 327 310 357
Notes:aSambrotto RN, Lorenzen CJ (1986) Chapter 9. Phytoplankton and primary production. In: Hood D, Zimmerman S, editors. Gulf of Alaska, physical environment andbiological resources. Washington, D.C.: NOAA Ocean Assessments Division, Alaska Office. pp. 249-282. Cooney RT (1986) Chapter 10. Zooplankton. In: Hood D,Zimmerman S, editors. Gulf of Alaska, physical environment and biological resources. Washington, D.C.: NOAA Ocean Assessments Division, Alaska Office. pp. 285-303.
bMotoda S, Minoda T (1974) Plankton of the Bering Sea. In: Hood DW, Kelley EJ, editors. Oceanography of the Bering Sea with emphasis on renewable resources:Institute of Marine Sciences, University of Alaska Fairbanks. pp. 207-241.
cCooney RT (1981) Bering Sea zooplankton and micronekton communities with emphasis on annual production. In: Hood DW, Calder JA, editors. The eastern Bering Seashelf: Oceanography and resources Vol. 2. Seattle: University of Washington Press. pp. 947-974.
dSirenko BI (2001) List of species of free-living invertebrates of Eurasian Arctic seas and adjacent deep waters. Explorations of the Fauna of the Seas 51(59). (Plusunpublished data from Russ Hopcroft).
doi:10.1371/journal.pone.0011914.t011
U.S. Marine Biodiversity
PLoS ONE | www.plosone.org 34 August 2010 | Volume 5 | Issue 8 | e11914
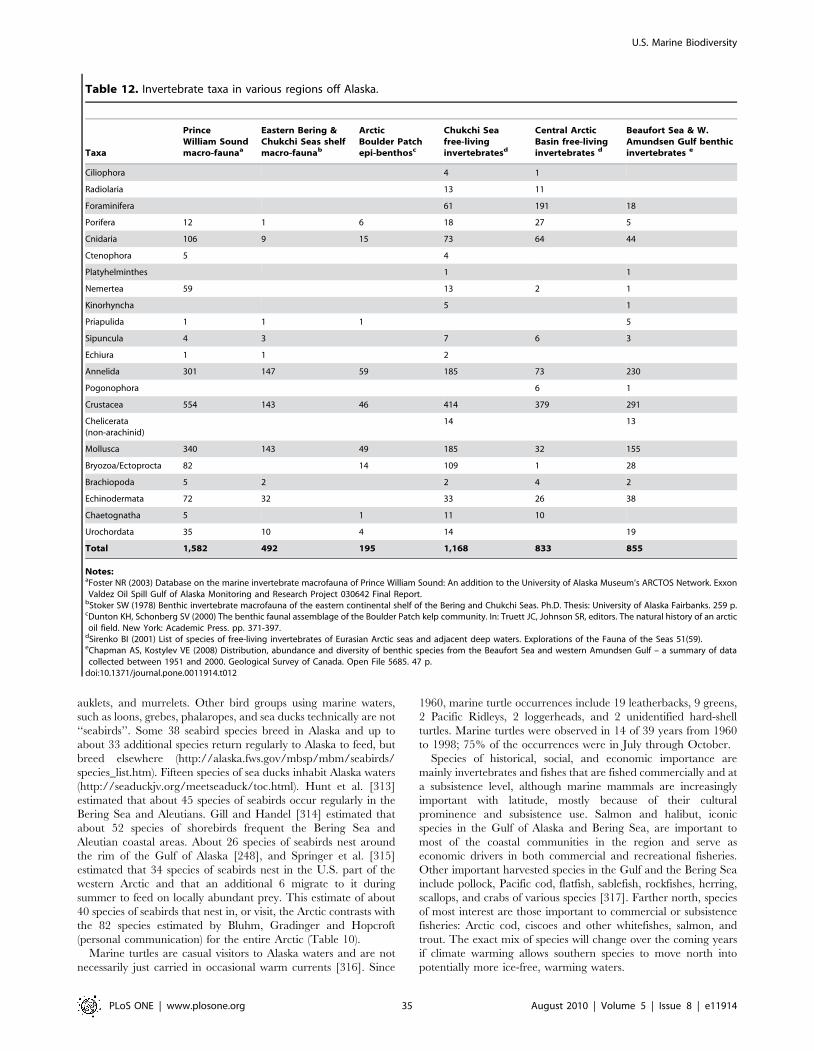
auklets, and murrelets. Other bird groups using marine waters,
such as loons, grebes, phalaropes, and sea ducks technically are not
‘‘seabirds’’. Some 38 seabird species breed in Alaska and up to
about 33 additional species return regularly to Alaska to feed, but
breed elsewhere (http://alaska.fws.gov/mbsp/mbm/seabirds/
species_list.htm). Fifteen species of sea ducks inhabit Alaska waters
(http://seaduckjv.org/meetseaduck/toc.html). Hunt et al. [313]
estimated that about 45 species of seabirds occur regularly in the
Bering Sea and Aleutians. Gill and Handel [314] estimated that
about 52 species of shorebirds frequent the Bering Sea and
Aleutian coastal areas. About 26 species of seabirds nest around
the rim of the Gulf of Alaska [248], and Springer et al. [315]
estimated that 34 species of seabirds nest in the U.S. part of the
western Arctic and that an additional 6 migrate to it during
summer to feed on locally abundant prey. This estimate of about
40 species of seabirds that nest in, or visit, the Arctic contrasts with
the 82 species estimated by Bluhm, Gradinger and Hopcroft
(personal communication) for the entire Arctic (Table 10).
Marine turtles are casual visitors to Alaska waters and are not
necessarily just carried in occasional warm currents [316]. Since
1960, marine turtle occurrences include 19 leatherbacks, 9 greens,
2 Pacific Ridleys, 2 loggerheads, and 2 unidentified hard-shell
turtles. Marine turtles were observed in 14 of 39 years from 1960
to 1998; 75% of the occurrences were in July through October.
Species of historical, social, and economic importance are
mainly invertebrates and fishes that are fished commercially and at
a subsistence level, although marine mammals are increasingly
important with latitude, mostly because of their cultural
prominence and subsistence use. Salmon and halibut, iconic
species in the Gulf of Alaska and Bering Sea, are important to
most of the coastal communities in the region and serve as
economic drivers in both commercial and recreational fisheries.
Other important harvested species in the Gulf and the Bering Sea
include pollock, Pacific cod, flatfish, sablefish, rockfishes, herring,
scallops, and crabs of various species [317]. Farther north, species
of most interest are those important to commercial or subsistence
fisheries: Arctic cod, ciscoes and other whitefishes, salmon, and
trout. The exact mix of species will change over the coming years
if climate warming allows southern species to move north into
potentially more ice-free, warming waters.
Table 12. Invertebrate taxa in various regions off Alaska.
Taxa
PrinceWilliam Soundmacro-faunaa
Eastern Bering &Chukchi Seas shelfmacro-faunab
ArcticBoulder Patchepi-benthosc
Chukchi Seafree-livinginvertebratesd
Central ArcticBasin free-livinginvertebrates d
Beaufort Sea & W.Amundsen Gulf benthicinvertebrates e
Ciliophora 4 1
Radiolaria 13 11
Foraminifera 61 191 18
Porifera 12 1 6 18 27 5
Cnidaria 106 9 15 73 64 44
Ctenophora 5 4
Platyhelminthes 1 1
Nemertea 59 13 2 1
Kinorhyncha 5 1
Priapulida 1 1 1 5
Sipuncula 4 3 7 6 3
Echiura 1 1 2
Annelida 301 147 59 185 73 230
Pogonophora 6 1
Crustacea 554 143 46 414 379 291
Chelicerata(non-arachinid)
14 13
Mollusca 340 143 49 185 32 155
Bryozoa/Ectoprocta 82 14 109 1 28
Brachiopoda 5 2 2 4 2
Echinodermata 72 32 33 26 38
Chaetognatha 5 1 11 10
Urochordata 35 10 4 14 19
Total 1,582 492 195 1,168 833 855
Notes:aFoster NR (2003) Database on the marine invertebrate macrofauna of Prince William Sound: An addition to the University of Alaska Museum’s ARCTOS Network. ExxonValdez Oil Spill Gulf of Alaska Monitoring and Research Project 030642 Final Report.
bStoker SW (1978) Benthic invertebrate macrofauna of the eastern continental shelf of the Bering and Chukchi Seas. Ph.D. Thesis: University of Alaska Fairbanks. 259 p.cDunton KH, Schonberg SV (2000) The benthic faunal assemblage of the Boulder Patch kelp community. In: Truett JC, Johnson SR, editors. The natural history of an arcticoil field. New York: Academic Press. pp. 371-397.
dSirenko BI (2001) List of species of free-living invertebrates of Eurasian Arctic seas and adjacent deep waters. Explorations of the Fauna of the Seas 51(59).eChapman AS, Kostylev VE (2008) Distribution, abundance and diversity of benthic species from the Beaufort Sea and western Amundsen Gulf – a summary of datacollected between 1951 and 2000. Geological Survey of Canada. Open File 5685. 47 p.
doi:10.1371/journal.pone.0011914.t012
U.S. Marine Biodiversity
PLoS ONE | www.plosone.org 35 August 2010 | Volume 5 | Issue 8 | e11914

Marine mammals of cultural and subsistence significance
include walruses, northern fur seals, Steller sea lions, sea otters,
ice seals (ribbon, ringed, bearded, and spotted), harbor seals, and
certain whales, such as bowheads and belugas [246]. Seabirds
important to subsistence include the red-faced cormorant,
spectacled and Steller’s eiders, gulls, kittiwakes, murres and
murrelets, and auklets. Species such as albatrosses, fulmars, and
petrels affect the economics of the commercial fishing fleet because
they are prone to direct strikes and incidental catch. Protection
measures may include commercial fisheries closures triggered by
the numbers of seabirds taken as bycatch and mandatory
deployment of seabird deterrence measures throughout the fishing
fleet [246].
Some regions have been studied intensively and stand out for
their biotic richness. For example, the 1989 Exxon Valdez oil spill
stimulated comprehensive baseline studies of nearshore areas in
Prince William Sound and downstream from the spill, well past
Kodiak [248]. These highly productive, diverse nearshore areas
provide nursery habitat for juvenile pink and chum salmon and
juvenile herring, and the annual growth of microalgae, seaweeds,
and seagrasses in the intertidal and shallow subtidal zones supports
many invertebrates, which are prey for fishes, seabirds, and marine
mammals. Foster [299] identified nearly 1,600 marine inverte-
brate species in Prince William Sound, and even that is an
underestimate, because not all phyla were included. Prince
William Sound’s rocky intertidal and shallow subtidal habitats
also have been studied by Konar et al. [318] to determine taxon
richness, invertebrate abundance, and macroalgal biomass and
depth-stratified community zonation patterns. These types of in-
depth studies document changes in the Sound as it slowly recovers
from the 1989 oil spill.
A second example of high biodiversity is the Aleutian Islands,
well known to be globally important for marine birds. In addition,
the region may harbor the highest diversity and abundance of
cold-water corals in the world [250]. Discoveries of wondrous,
possibly unique, communities of corals, sponges, and bryozoans
have prompted fisheries closures to protect the diverse species
from gear impacts [319]. Submersible observations have docu-
mented representatives of six major taxonomic groups and at least
50 species or subspecies of corals that may be endemic to the
region. Alaska has about 141 species of corals in Alcyonacea (soft
corals), Gorgonacea (sea fans, bamboo corals, and tree corals),
Scleractinia (cup corals or stony corals), Stylasterina (hydrocorals),
and Antipatharia (black corals). The coral gardens are character-
ized by a rigid framework, high topographic relief, and high
taxonomic diversity. The species mix varies by region; gorgonians
and black corals and most common in the Gulf of Alaska, and
gorgonians and hydrocorals most common in the Aleutian Islands.
Soft corals are common on Bering Sea shelf habitats, and corals
are found as far north as the Beaufort Sea.
The biodiversity of the Bering Strait and southern Chukchi Sea
has also been well studied [253,262,270,279]. The region has an
abundant and diverse macrobenthos of relatively high biomass,
dominated by polychaetes, crustaceans, bivalve mollusks, and
ophiuroid echinoderms [301]. Epifaunal numbers are dominated
by gastropods, abundance by crustaceans, and biomass by
echinoderms, mainly sea stars [300]. Most dominant species are
of boreal Pacific rather than Arctic origin, owing to the prevailing
northward flowing currents.
The Boulder Patch, another well-studied area [261], is one of
the richest and most diverse biological communities in the
American Beaufort Sea. It contains about 140 taxa of benthic
infauna from 11 invertebrate phyla dominated by polychaetes,
mollusks, and bryozoans, and an even more diverse assemblage of
epifauna, including 158 taxa dominated by fishes, sponges,
mollusks, bryozoans, cnidarians, and polychaetes. These commu-
nities are important to Arctic nearshore food webs and could be
vulnerable to anthropogenic activities that increase siltation or add
contaminants. NaGISA has sampled macroalgal-associated hab-
itats in the Boulder Patch and also discovered a new boulder field
about 100 km farther west in Camden Bay [320]. Camden Bay
has 13 macroalgal species and 58 invertebrate taxa, making it a
hot spot for biodiversity along the Beaufort Sea coast.
Sea ice serves as habitat for a unique, highly specialized
community of bacteria, algae, protozoans, and metazoans, which
contribute to the biogeochemical cycles of polar seas [262]. Inside
the sea ice in brine pockets and channels, more than 200 diatom
and 70 flagellate species have been identified. Metazoan fauna is
thought to be less diverse, although several taxa remain
unidentified or have only recently been described [321]. These
are grazed by amphipods, an important food source for diving
birds and Arctic cod. Arctic cod provide a crucial link between the
sea ice food web and marine mammals. ArcOD is a Census project
that is providing more understanding of life living in sea ice and
brine channels, some of the coldest habitats in the global ocean.
The many deep-sea canyons, such as Pribilof, Bering, and
Zemchug canyons, that incise the continental shelf as well as the
surrounding shelf break and slope, are features ripe for discovery
of new epifaunal species. Also of interest is Bowers Ridge, a
submerged structure that forms an arc extending to the north and
west from the Aleutian Islands. The top of the ridge rises to less
than 200 m from the surface near its southern end, with a deeper
area to the north. Relatively unexplored, the ridge is likely to
include habitats for corals as well as fishes and crabs.
A greater understanding is needed of the biogeographic patterns
of cold-water corals and how they relate to corals elsewhere [250].
This will require more research in the field using multibeam
surveys and submersibles to collect specimens and data on
distribution, and more laboratory analyses of palaeontology,
phylogeny, taxonomy, and genetics. It may be that the endemism
and high diversity and abundance of corals in the Aleutians are
evidence that that is the center of origin for some taxa [250].
Additional research is needed on the many seamounts and
pinnacles in Alaska waters. There have been submersible dives on
some pinnacles, such as at Cape Edgecumbe near Sitka. These rise
from about 160 m to within 40 m of the ocean surface. The sides
and tops of the pinnacles are composed of columnar basalt, and
gorgonian corals grow on the steep walls. The boulder fields at the
base of the pinnacles provide refuge for adult rockfish, lingcod,
and giant Pacific octopus. The top of the pinnacles are covered
with anemones, tunicates, and hydrocorals. Adult lingcod
aggregate there during the late spring and early summer [319].
The NOAA Office of Ocean Exploration program supported
studies of five seamounts, Giacomini, Pratt, Welker, Denson, and
Dickens, which stretch over a 750 km section of the northeast
Pacific, called the Kodiak-Bowie Seamount Chain. The 2004 Gulf
of Alaska Seamount Expedition used the deep submersible vehicle
Alvin in 2004 to make 17 dives on the seamounts to depths of 3,500
m. It discovered a complex community of organisms, ranging from
microscopic to macroscopic, living on corals. The voyage and plan
are summarized at http://oceanexplorer.noaa.gov/explorations/
04alaska and http://oceanexplorer.noaa.gov/explorations/02alaska/
background/plan/plan.html.
The high Arctic also needs more sampling. It is undergoing
dramatic change with retreat of the permanent, as well as seasonal,
ice. Special techniques will be needed to sample the deep basins
where most new species probably will be found. A more complete
inventory of benthic species is needed along with estimates of their
U.S. Marine Biodiversity
PLoS ONE | www.plosone.org 36 August 2010 | Volume 5 | Issue 8 | e11914

genetic diversity, and detailed maps of their distribution. ArcOD
has begun such research, barcoding 360 Arctic species of benthos,
plankton, and fish, many from Alaska [322]. Microbial and
meiofaunal communities also are poorly known.
Finally, a cautionary note. Information in existing databases and
portals is not necessarily accurate. In the Arctic, for example,
unresolved taxonomic questions and controversial classifications
plague efforts to evaluate and synthesize information on Arctic
species of fish and lower-trophic-level species [271]. Because of
limited sampling, all but the most common species are known from
small numbers of specimens, and the available specimens and
distributional records are inadequate to determine taxonomic and
distributional boundaries, especially for similar-looking species
(or subspecies) that inhabit the same areas, so are frequently
misidentified. Voucher specimens should be deposited to help allay
this problem in the future. Name changes due to taxonomic
reorganization are inevitable. For example, the taxonomy and
phylogenetic relationship of kelps in the GoA have been
reevaluated, resulting in the most common kelp species having
been transferred from genus Laminaria to genus Saccharina [323].
One of the more abundant canopy-forming kelps in Alaska has
experienced two name changes in about that many years: the
species known as Alaria fistulosa was changed by Lane et al. [324] to
Druehlia fistulosa, and then by Wynne (2009) [325] to Eualaria
fistulosa.
There also should be a concerted effort to retrieve data from
Japanese and Russian research cruises in the Bering Sea over the
past 50 years, as well as old records from past expeditions such as
on Fletcher’s Ice Island T-3. Private industry data from oil and gas
companies, such as BP and ConocoPhillips, also should be
retrieved. NOAA and MMS should be encouraged to submit
biodiversity data to OBIS from new research activities in the
Beaufort and Chukchi seas.
Trouble spots and emerging issues. Global change will be
the most significant issue for biodiversity in Alaska in the near
future: it can affect diversity within species, between species, and of
ecosystems [326]. Warming will alter the geographic distribution
of marine organisms (e.g., [270]), the flow of energy within the
ecosystem [327], and ecosystem productivity and resilience. Most
of the present ice-covered areas are likely to have reduced ice
cover, especially in summer, which could lead to increased
primary and secondary production and possibly enhanced fish
production [328]. Arctic benthic communities of Atlantic and
Pacific origin are likely to expand, displacing colder-water species,
especially those with narrow temperature preferences. There also
will be a shift northward in the distribution of many species of
fishes, which could lead to extinction of some current Arctic
species.
In the Bering Sea and Arctic Ocean, sea ice is predicted to
decline significantly, a process that has already begun (e.g., [258]).
There probably will always be seasonal ice, even in the northern
Bering Sea, but multiyear ice will decrease, disappearing
altogether in some regions. At the very least, as is happening
already, weather and wind patterns could shift multiyear ice far to
the east in the Canada Basin, leaving large stretches of open water
in the Chukchi and western Beaufort Seas.
Warmer temperatures and little sea ice cover in the Bering Sea
are causing a shift in the size composition of crustacean
zooplankton to smaller species, with potential food web implica-
tions. Warm years result in increases of zooplankton predators
such as chaetognaths, another indication that global change may
be having a significant impact on community organization [329].
Warmer temperatures also are thought to be accompanied by
earlier and higher zooplankton production, with more of the
ice-related and pelagic primary production going into the pelagic
system, whereas cold temperatures result in later, lower zooplank-
ton production with energy flowing predominately to the benthos
[330]. Loss of energy to the benthos could result in major changes
in the biomass and species assemblages of Bering Sea benthic
communities and their avian and mammalian predators
[253,331].
The Chukchi Sea may be transformed into an ecological
extension of the Bering Sea with a northward shift of the subarctic-
to-arctic front that is accompanying warming [253]. This could
lead to a decline in benthic infaunal biomass as the ecosystem
shifts from benthic to pelagic dominance of organic matter
consumption. The upper trophic structure could change signifi-
cantly [262]. For example, a shift to pelagic production would
favor some pelagic feeders, such as bowhead, fin, minke, and blue
whales, but disadvantage benthic feeders, such as gray whales,
walrus, bearded seals, and diving ducks [253,272,331].
The benthic food web could be affected by hydrographic
changes that may accompany ice retreat. For example, samples
taken during the Western Arctic Shelf-Basin Interactions project in
2002 in the Chukchi and Beaufort seas showed that large-bodied
copepods are prevalent on the outer continental shelf. If ice
retreats and there is strong upwelling, these copepods could end up
on the inner shelf and possibly outcompete smaller zooplankters.
Grazing by these species would probably drive the ecosystem
toward a pelagic food chain. A mismatch of the timing of the
phytoplankton bloom with the advection of large-bodied copepods
into the shelf region would result in large exports to the benthic
food chain [332].
Changes in community structure likely will accompany climate
change [253,329,331,333] as subarctic species move north and
compete with the colder-water species present now. Mueter and
Litzow [334] have estimated that the southern edge of the summer
cold pool in the Bering Sea has retreated northward by about 230
km from the early 1980s to 2006 (but 2008-2009 saw the
reemergence of an extensive cold pool on the Bering Sea shelf).
Subarctic taxa, which were at the northern limit of their thermal
tolerance, are now in areas formerly covered by the cold pool: the
centers of distribution of 40 taxa, including pollock, halibut, rock
sole, and snow crab, have moved northward an average of 34 km
[334].
Pacific species of mollusks and crabs have moved north into the
Chukchi Sea [270]. NOAA [278] has documented fish of six
species that have extended their range into the Beaufort Sea from
the Chukchi or Bering seas. Displacement of fish stocks northward
is likely to be accompanied by (1) economic stresses as fishing fleets
are compelled to expand their operations at higher fuel costs, and
(2) geopolitical stresses if the U.S. fish stocks relocate to near the
boundary with Russia, adding a layer of complexity to the
management of these species. On the positive side, northward
movement of fish stocks could provide additional subsistence
fishing opportunities for local communities.
Foraging and resting habitats also will change. Sea ice
substratum provides the resting and foraging base for ice seals,
walrus, and polar bears [335,336]. If it is not available, or the ice
moves offshore into deep waters, the normal benthic or pelagic
prey base may be unavailable. Moving between distant floes also
will cost energy. There may be a decline in reproductive success
for those mammals, such as ice seals, that den and raise their pups
on the ice [259]. Loss of sea ice also could cause overcrowding of
land haulouts, as occurred with walrus on the Chukotka Peninsula
in 2007, when thousands of individuals were crowded into a small
beach and many died from suffocation and injuries [337]. The loss
of sea ice as a hunting platform for local native residents could
U.S. Marine Biodiversity
PLoS ONE | www.plosone.org 37 August 2010 | Volume 5 | Issue 8 | e11914

have a profound impact on their subsistence hunting success, and
it would be more dangerous to hunt in more open water [259].
Increased temperatures have already led to increased river
runoff in the Arctic, which could change nutrient content, increase
sediment loads, and decrease salinities in nearshore waters. This
could reduce benthic biomass and diversity [262]. Nearshore
benthic communities also could undergo significant change
induced by reduced ice cover, longer open-water season, changing
flows through the Bering Strait, increased frequency and intensity
of storms, increased river and freshwater runoff, and increased ice
scouring and coastal erosion.
A shipping assessment projected through 2020 by the Arctic
Council [263] concluded that Arctic natural resource development
(hydrocarbons, hard minerals, and fisheries) and regional trade
will be key drivers of marine activity. Oil and gas development in
particular may increase significantly. The MMS currently has
about 5,400 km2 under lease in the Beaufort Sea and about 11,000
km2 in the Chukchi Sea. The most recent lease sale, Chukchi Sea
Lease Sale 193, held on February 6, 2008, broke records with 667
bids on 488 blocks. Four additional lease sales are planned for
2009-12 [338], although they may be delayed or stopped by
litigation.
Such activities will result in increased shipping. The most
significant threat from ships to the Arctic marine environment is
the release of oil through accidental or illegal discharge. Oil can
reduce insulating properties of marine mammals and seabirds,
causing hypothermia, and can be fatal if ingested, inhaled, or
absorbed. Birds and mammals are typically concentrated in leads
and polynyas, increasing the risk to these animals if there is an oil
spill. Other potential impacts of shipping are ship strikes on
mammals, introduction of alien species through fouling and in
ballast water, disruption of migratory patterns of mammals, noise,
and garbage and other debris. Release of debris can cause
entanglement, introduction of bacteria and disease, and ingestion
of plastics and other foreign items [263].
Ocean acidification could have an impact on the prey base,
fisheries species, and deepwater corals. In particular, calcification
by bivalves that dominate polar shelves could be adversely
affected, and thus the food web that relies on them [339]. Cooley
and Doney [340] estimated that mollusk stocks contributed $748
million (19%) of the $3.8 billion ex-vessel revenues of the annual
domestic U.S. commercial fisheries harvest in 2007. To the extent
mollusk populations are diminished or imperiled, there could be
revenue declines, job losses, and indirect economic costs. Ocean
acidification also is predicted to reduce the absorption of low-
frequency sound, leading to a noisier environment for marine
mammals [341].
The marine ecosystems and their biodiversity will be changing
dramatically over the coming decades. Surveys and continued
monitoring of organisms will be needed, particularly in highly
diverse areas. Long-term monitoring programs are expensive and
a coordinated plan will be needed. Such planning for Arctic
marine biodiversity is under way by the Marine Expert
Monitoring Group, which is implementing the Circumpolar
Biodiversity Monitoring Program under the umbrella of the
Conservation of Arctic Fauna and Flora working group of the
Arctic Council [342]. This multinational effort is being designed to
identify biodiversity changes within a reasonable timeframe, to
identify possible links between biodiversity trends and anthropo-
genic stressors, and to make information available and useful to
managers in developing strategies for sustainable use of Arctic
living resources. Biodiversity indices must cover central physical
and biological elements in an ecosystem, include organisms
important to local human communities, be relatively simple to
measure, and be sensitive to ecosystem change. Monitoring sites
must be in focal marine areas that already have long datasets, are
biological hot spots (e.g., marginal ice zones, polynyas, boundaries,
and fronts), and are key to biogeochemical properties, biota, and
invasive species. For example, the Pacific-Arctic Gateway through
the Bering Strait would be an ideal monitoring area because of
increased heat and freshwater flow, increased marine mammal
migration, declining sea ice cover, increased oil and gas
exploration, exploratory fisheries in the last decade, and flow of
pollutants, especially persistent organic pollutants largely from
Asia.
In establishing such programs, it also will be critical to
determine which taxon level is most cost-effective to monitor.
For example, detecting invasive species will require monitoring at
the species level, but for some macroalgal assemblages, Konar and
Iken [343] have shown that monitoring higher taxonomic levels or
functional groups might be more appropriate to help eliminate
environmental ‘‘noise’’ caused by natural variation.
Census of Marine Life Contributions in the Alaska
region. Three Census projects have been active in Alaska.
NaGISA has sampled 11 sites in the Gulf of Alaska and 2 in the
Beaufort Sea. The GoA sites are rocky macroalgal and seagrass
habitats at Kodiak Island, Kachemak Bay, and Prince William
Sound. A notable discovery was a bed of rhodoliths (free-living
calcareous red algae) in Prince William Sound, a significant
northward extension of their distribution [344]. Another finding in
the GoA is that intertidal macroalgal biodiversity is among the
highest in the world. In sampling along the Beaufort Sea coast,
four species of brown and red macroalgae found in the Boulder
Patch may represent invasions since studies in the 1980s. The
boulder field in Camden Bay, discovered by NaGISA, has less
encrusting coralline red algae and harbors particularly high
abundances of the gastropod Boreocingula martyni, which was only
rarely found in the Boulder Patch [320]. The 71 taxa found
exceeded numbers reported for soft-bottom environments in the
Beaufort Sea, but was lower than in the Boulder Patch in
Stefansson Sound. Because species richness is comparable in the
two regions, both should be considered biodiversity hot spots.
These findings are opening interesting new questions about the
dispersal potential and exchange of larvae between these boulder
communities. They will provide critical benchmarks against which
to evaluate ecosystem change in the Arctic and for restoration
should an oil spill or other catastrophe occur.
ArcOD examines the full spectrum of marine life from microbes
to mammals in all oceanographic realms, from the shallow shelves
to the deep basins. About 30 expeditions or field activities were
related to ArcOD, including many conducted within the
framework of the International Polar Year Arctic Marine
Biodiversity cluster, for which ArcOD was the lead project.
Scientific exploration and discovery included (1) expeditions into
previously understudied areas, such as the deep Canada Basin, (2)
investigation of previously understudied taxonomic groups, such as
gelatinous zooplankton, (3) study of understudied habitats, such as
sea ice pressure ridge systems and seafloor pock marks, and (4)
establishing time-series to begin assessing change, for example for
zooplankton in the Canada Basin and for various taxonomic
groups in the Chukchi Sea. New expeditions and investigations of
previously collected material have yielded over 40 species new to
science. Algae such as diatoms and flagellates, and meiofaunal
invertebrates thrive in this environment in concentrations of
thousands of individuals per liter [257,345]. In the sea ice,
researchers discovered a new genus and species of hydroid that
moves about 20 cm per hour [346], possibly a key predator
because it devours tiny shrimplike crustaceans, and was named
U.S. Marine Biodiversity
PLoS ONE | www.plosone.org 38 August 2010 | Volume 5 | Issue 8 | e11914

Sympagohydra tuuli after the discoverers’ newborn daughter
[347,348]. The first biological data ever collected on sea ice
ridges in the Alaska region suggest high potential importance of
these structures at a time of ice shrinkage because of the
abundance of ice meiofauna and under-ice amphipods is high
along their deep-reaching keels [334].
In the pelagic realm, ArcOD has sampled throughout the Arctic
(e.g., [349]) and has undertaken the largest consolidation of
zooplankton records to date. Using high-definition cameras on an
ROV, researchers found many new species and more than 50
taxonomic categories of gelatinous zooplankton: almost two-thirds
were medusae, one-fifth was siphonophores, and one-tenth was
larvaceans [349]. In the benthic realm, ArcOD has undertaken
one of the most extensive deep-sea sampling efforts of the Canada
Basin in- and epi-fauna [305,350]. The first new species formally
described from the 2005 expedition was a seafloor polychaete
Sigambra healyae named in honor of the research vessel, the U.S.
Coast Guard Cutter Healy [351]. ArcOD affiliates have also
undertaken the largest examination of fish species known for the
Chukchi Sea [352] and established species lists and patterns of
community structure for Chukchi Sea pelagic, benthic, and fish
assemblages [270].
CMarZ is linked to an ongoing, multidisciplinary monitoring
program along the Seward Line in the northern Gulf of Alaska
that has been operating for over a decade, with an emphasis on
seasonal and interannual patterns of the zooplankton species
inhabiting the upper 100 m of water [276,277]. Diversity is lower
than in warmer waters, but biomass and productivity are high. As
for most planktonic systems, the dominant species change as the
seasons progress, and in warmer years there are variable
contributions from expatriated southern species. An as-yet-
unanalyzed series of collections down to 600 m holds the promise
of understanding the mesopelagic realm in this region.
Discussion
Knowledge about marine biodiversity of the U.S. is extensive
owing to two or three centuries of its study in many places and by
a variety of enterprises. These enterprises include governmental
agencies from federal to local levels, with mandates both to extract
and to protect marine resources, living (e.g., fisheries) and not (e.g.,
petroleum and other minerals). The innumerable academic
institutions with shore facilities for study of the marine environ-
ment (private ones such as the Duke University Marine
Laboratory and public ones such as Friday Harbor Laboratories
of the University of Washington) have provided foci of research
and knowledge. Other academic resources are seagoing facilities
and natural history museums, supported both publicly (such as the
U.S. National Museum of Natural History and the Natural
History Museum of Los Angeles County) and privately (such as the
B.P. Bishop Museum in Honolulu and the American Museum of
Natural History in New York City). Non-American contributions
to knowledge of U.S. marine biodiversity have been from
expeditions such as the British Challenger (in Hawaii) and Japanese
ones in Alaska.
However, as is clear from the biotic diversity inventories
compiled in these six sections as an activity of the Census,
knowledge of U.S. marine biodiversity is fragmentary. Lists, such
as these for regions and the composite one for the country as a
whole (Tables 1 and S1), are essential as baselines for making
management decisions and for assessing biotic changes – both
good and bad [122]. However, a national list is no better than the
best of the regional ones, and ever the most complete list – for the
Gulf of Mexico – is based on records scattered in space and time.
Comparable knowledge is available for only parts of the other
areas, such as the MHI and the Bay of Fundy, and less
taxonomically extensive inventories are more common. That of
Cobscook Bay, Maine, is notable for its temporal depth, a
dimension missing from most compilations in any explicit way.
Knowledge is also uneven taxonomically. Even animals
exploited commercially are incompletely known: Eschmeyer
[353] estimated that 200 new species of fishes are being described
worldwide each year, and thus it is very likely that new species
remain to be discovered in all parts of the U.S. As a generalization,
body size is directly correlated with knowledge of a species. And
knowledge is uneven spatially, diminishing with depth and with
distance from shore. Biodiversity is commonly tallied by species,
but ecosystem diversity and genetic diversity are also essential to
understand (e.g., [2,9]). A major challenge is to interrelate
components assessed at different levels of space, time, and
taxonomic resolution. As the volume of genetic data grows (e.g.,
the ICoMM inventory), cross-referencing the sorts of ‘‘instanta-
neous’’ assessments of biodiversity in these data with the metrics
that are common in policy, legislation, and public information will
become increasingly important. Further, microbial data are
currently available for discrete times and places [354]; integrating
them meaningfully with species inventories over large spans of
space and time is one of the great challenges, because it is through
these small organisms that the range shifts resulting from human
agency or global change are likely first to be perceived in the
future.
Health of a marine system is not necessarily directly pro-
portional to its biodiversity. In general, a naturally species-poor
system seems to function as well as a naturally richer one – health
appears to be related to the degree that an ecosystem is intact [2].
An ecosystem with redundancy contains multiple species that
perform similar functions, but in a system with low redundancy,
the loss of a species may remove a particular function; it is feared
that Hawaii represents such an unresilient system. This condition
may be related to Hawaii’s having such a large proportion of
endemic species, which are typically characterized by narrow
habitat and physiological tolerances.
Another point of consensus among the sections is the inventory
of threats to marine biodiversity. Indeed, most threats identified
for the U.S. are true for the entire world. Foremost is
overexploitation of living resources, especially fishes and inverte-
brates for food, by both commercial and recreational fishers.
However, in Hawaii aquarium fishes now constitute the most
valuable fishery, and in some places there is a souvenir trade in
mollusk shells and turtle carapaces. Coastal development removes
land from its natural function, commonly perturbs the seafloor
during the building process, and reduces water quality by
introducing sediment, chemicals, and particularly nutrients into
the marine environment during the building process and
afterward. Shipping presents dangers both on- and offshore from
pollution by purposeful and accidental release of oil and other
noxious substances, by transporting potentially invasive species,
and, on coasts, by groundings. The consequences of global change
include rising sea levels attendant upon rising temperatures,
shifting currents, and rising concentrations of carbon dioxide in
the surface ocean, all of which are likely to affect the geographic
and bathymetric distributions of marine organisms. Such changes,
along with diminished water quality, probably contribute to the
growing number and size of hypoxic or anoxic areas, such as those
in the Gulf of Mexico and along the West Coast, which have
profound biotic impacts. Warming poses a different threat in
Alaska – it reduces the amount, duration, and thickness of ice,
which is an essential component of the habitat for organisms from
U.S. Marine Biodiversity
PLoS ONE | www.plosone.org 39 August 2010 | Volume 5 | Issue 8 | e11914

polar bears to some hydroids. Perhaps a combination of global
change and other indirect human perturbations to the marine
environment account for the apparent growth in number and
duration of harmful algal blooms: in recent years New England
has experienced some of the worst episodes on record. Increased
carbon dioxide has already lowered the pH of the surface ocean;
this is expected to have a negative effect on survival of plankton,
the base of the marine food chain, and the growth and health of
corals, which form biodiverse reefs in shallow waters of the
Hawaiian Islands and Florida, and deep reefs in Alaska and the
Southeast U.S. Invasive species are increasingly being recognized.
In some cases their introduction was due to clear human agency,
such as the Indo-Pacific lionfish (Pterois) that was brought to the
coast of the Southeast U.S. by home aquarists. The orange cup
coral (Tubastraea coccinea), also from the Indo-Pacific, lives on oil
platforms in the Gulf of Mexico, a habitat of human construction.
Warming seas are likely to enhance both extirpations and
introductions, making some areas inhospitable for organisms that
have long lived there while allowing others to establish popula-
tions. A complete biotic inventory for an area is essential to
recognize invasive species before they become conspicuous by the
damage they inflict, and to recognize that species previously
present are gone before their absence has follow-on effects.
Certainly more information must be obtained through field and
laboratory research and monitoring. Innovations in sampling
ranging from genetics to acoustics have been identified in these
sections. But the sections also make clear that many more data
currently exist than are easily accessible. Mobilizing those
resources so they are available in an integrated data system would
enhance knowledge of marine biodiversity in the U.S. enormously,
and would be an important step in monitoring the effects of
management practices and identifying threats to the biota.
Biodiversity databases, which can be useful as management
tools as well as for basic science, are commonly organized and
searchable taxonomically and geographically, but temporal
organization is also essential so that trends through time can be
identified (e.g., [16]). An apparent limitation is the existence of
historical records. But, as has been shown repeatedly by the
Census History of Marine Animal Populations (HMAP) project,
they do exist, some in unlikely forms, and can be mobilized. A
species list for a place, a habitat, or an ecosystem is a beginning,
necessary but not sufficient for scientific understanding and
development of long-term policy. Species richness (number of
species) is the simplest measure of diversity, but knowledge of
evenness, relative abundance, and dispersion [355] is also needed.
An example of the sorts of biotic data available but not accessible
are those from fisheries surveys concerned with nontarget species.
Integrating such information can provide a much fuller inventory
of the ecosystem to which the target species belongs than is now
possible. But integrating data over space and time can be difficult –
techniques must be developed to make certain that scales are
compatible, to combine and reconcile data collected for various
purposes with disparate gear, and to automate taxonomic changes.
Interactive links between information on biotic features and that
on abiotic elements of the environment will provide insights.
OBIS, an initial Census effort at assembling the more obvious
datasets, including some of those from Census projects, provides
tools to create maps so organism distributions can be visualized,
and to model potential distributions based on abiotic character-
istics of the environment.
Three other impediments to assembling existing data and
collecting new data on marine biodiversity were explicit or implicit
in all sections: logistical problems, shortages in finances, and
shortages in taxonomic expertise. Finances, of course, are essential
to provide the other two. Offshore and deep-water biotas are more
poorly known than those of the coasts largely because of the
expense and logistical challenges of operating there, as is also true
for high latitudes. A threat not to biodiversity itself but to
increasing the knowledge of it is a continuing downturn in training
of taxonomists, a problem that is particularly acute for taxa not of
direct human relevance. Molecular techniques are improving for
routine identifications, but taxonomists will continue to be
essential to identify specimens from which molecules are then
extracted, to identify poorly-known taxa, and to describe new taxa.
And all sections demonstrated that progress in understanding
marine biodiversity was enhanced by activities of the Census that
built capacity and international collaborations because limited
resources of equipment, knowledge, and money could be shared.
Supporting Information
Table S1 Biotic diversity of the six U.S. geographically-based
sections in the text, and a worldwide estimate.
Found at: doi:10.1371/journal.pone.0011914.s001 (0.15 MB
DOC)
Table S2 Taxonomic detail of species of the Northeast U.S.
Continental Shelf Large Marine Ecosystem in registers (first three
columns) and provisional additions identified from a survey of
three databases.
Found at: doi:10.1371/journal.pone.0011914.s002 (0.11 MB
DOC)
Table S3 Taxonomic detail of species of the Northeast U.S.
Continental Shelf Large Marine Ecosystem from databases.
Found at: doi:10.1371/journal.pone.0011914.s003 (0.08 MB
DOC)
Table S4 Significant databases containing biodiversity informa-
tion for inclusion in the Ocean Biogeographic Information System
(OBIS - http://www.iobis.org/) (from described surveys in five of
the six regions described in this overview).
Found at: doi:10.1371/journal.pone.0011914.s004 (0.12 MB
DOC)
Table S5 Assessment of marine biodiversity, represented as
number of described species by phylum, in the Southeast U.S.
Continental Shelf Large Marine Ecosystem.
Found at: doi:10.1371/journal.pone.0011914.s005 (0.08 MB
DOC)
Table S6 Compared assessments of large scale/regional marine
biodiversity (Insular Pacific-Hawaiian Large Marine Ecosystem vs.
worldwide estimate), represented as number of described species
by phylum.
Found at: doi:10.1371/journal.pone.0011914.s006 (0.08 MB
DOC)
Table S7 Alaska regional estimates of marine species, repre-
sented as number of described species by phylum (Bruce Wing,
NOAA Auke Bay Lab, Juneau).
Found at: doi:10.1371/journal.pone.0011914.s007 (0.10 MB
DOC)
Text S1 Abbreviations from An Overview of Marine Biodiver-
sity in United States Waters.
Found at: doi:10.1371/journal.pone.0011914.s008 (0.03 MB
DOC)
Text S2 Taxonomic and Regional Guides for the Northeast U.S.
Continental Shelf, Southeast U.S. Continental Shelf, Gulf of
Mexico, California Current and Gulf of Alaska, Eastern Bering
U.S. Marine Biodiversity
PLoS ONE | www.plosone.org 40 August 2010 | Volume 5 | Issue 8 | e11914

Sea, and Aleutian Islands, and Chukchi and Beaufort Seas Large
Marine Ecosystems.
Found at: doi:10.1371/journal.pone.0011914.s009 (0.17 MB
DOC)
Text S3 List of Contributors to the Harte Research Institute for
Gulf of Mexico Studies Gulf of Mexico Biodiversity Project [Felder
DL, Camp DK (eds) (2009) Gulf of Mexico Origin, Waters, and
Biota. Volume 1, Biodiversity. College Station, Texas: Texas
A&M University Press. 1384 p.]
Found at: doi:10.1371/journal.pone.0011914.s010 (0.12 MB
DOC)
Text S4 California Current Large Marine Ecosystem Contrib-
uting Taxonomic Experts
Found at: doi:10.1371/journal.pone.0011914.s011 (0.03 MB
DOC)
Acknowledgments
The Census U.S. National Committee (USNC) acknowledges the entire
Census program and thanks Michele DuRand, Charles Griffiths, and
Patricia Miloslavich for their guidance and assistance in preparing the U.S.
contribution to the collection ‘‘Marine Biodiversity and Biogeography –
Regional Comparisons of Global Issues’’. The USNC also thanks
Consortium for Ocean Leadership personnel Gregg Schmidt and Kristin
Mellon for reviewing the manuscript, and Jason Mallet for assistance with
graphics. The authors appreciatively recognize Jesse Cleary, Census
Mapping and Visualization team member at Duke University’s Marine
Geospatial Ecology Lab, for the six regional maps.
The following individuals assisted the authors of the six U.S. regional
sections.
Northeast United States Continental Shelf Large MarineEcosystem:
The authors thank Lou van Guelpen, Michael Fogarty, Tom Noji,
Stephen Hale, Sara Ellis, Gerhard Pohle, Joan Palmer, Jeremy Collie,
Andrew Gilbert, Jeffrey Herter, Jeffrey Hyland, and Howard Townsend for
providing information on databases, access to data, and helpful discussions.
The authors have tried to provide an introduction to the region, its
biodiversity resources, and some thoughts to stimulate interest in improving
access to and use of data. They accept responsibility for the limitations such
a brief overview inevitably entails.
Southeast United States Continental Shelf Large MarineEcosystem:
The author thanks the following individuals who provided information
on the diversity of particular taxa in the region: Dale Calder, Royal
Ontario Museum (Cnidaria); Daphne Fautin, University of Kansas
(Cnidaria); Dennis Forsythe, The Citadel (birds); Grant Gilmore,
Estuarine, Coastal and Ocean Science, Inc. (fishes); Danny Gleason,
Georgia Southern University (sponges); David Knott, South Carolina
Department of Natural Resources (polychaetes, hemichordates, general
invertebrate diversity) and Reid Wiseman, College of Charleston (algae,
Cyanobacteria). The following individuals provided additional review: Billy
Causey, NOAA Office of National Marine Sanctuaries; Kim Iverson,
South Atlantic Fishery Management Council; Brian Keller, NOAA Office
of National Marine Sanctuaries; Oleg Pashuk, formerly of the South
Carolina Department of Natural Resources; Marcel Reichert, South
Carolina Department of Natural Resources; and Steve Ross, University of
North Carolina at Wilmington.
Gulf of Mexico Large Marine Ecosystem:
John W. Tunnell, Jr., Darryl L. Felder, and Sylvia A. Earle conceived
the project and are Series Editors of the seven-volume set of books, Gulf of
Mexico Origin, Waters, and Biota (the Biodiversity volume was published by
Texas A&M University Press). Darryl Felder and David Camp are co-
editors of the Biodiversity volume, and 140 authors/taxonomists
contributed to it (see Text S3). Fabio Moretzsohn was instrumental in all
aspects of project development and implementation, and Dixie Smith was
instrumental in manuscript preparation.
California Current Large Marine Ecosystem:
The authors thank the contributors whose names can be found in Text
S4.
Alaska’s Large Marine Ecosystems – the Gulf of Alaska,Eastern Bering Sea and Aleutian Islands, and Chukchi andBeaufort Seas:
The author acknowledges the following individuals who reviewed the
draft Alaska section and/or provided significant taxonomic information:
Russ Hopcroft, Bodil Blum, Rolf Gradinger, Brenda Konar, and Katrin
Iken at the University of Alaska Fairbanks; Bruce Wing, NOAA Alaska
Fisheries Science Center’s Auke Bay Laboratory in Juneau; Jacqueline
Grebmeier at Chesapeake Biological Lab at the University of Maryland
Center for Environmental Science, Solomons, MD; North Pacific Research
Board staff members Francis Wiese, Tom Van Pelt, and Nora Deans; and
Alaska Ocean Observing System Executive Director Molly McCammon.
References
1. Pomponi SA (2009) Statement prepared for the Subcommittee on Insular
Affairs, Oceans, and Wildlife; Committee on Natural Resources; U.S. House of
Representatives. March 3, Hearing on managing our ocean and wildlife
resources in a dynamic environment: Priorities for the new administration and
the 111th Congress. Washington, D.C.
2. Palumbi SR, Sandifer PA, Allen JD, Beck MK, Fautin DG, et al. (2009)
Managing for ocean biodiversity to sustain marine ecosystem services. Front
Ecol Environ 7: 204–211.
3. Millennium Ecosystem Assessment (2005) Ecosystems and human well-being:
Biodiversity synthesis. Washington: D.C.: World Resources Institute.
4. McCauley DJ (2006) Selling Out on Nature. Nature 443: 27–28.
5. Palmer M, Bernhardt E, Chornesky E, Collins S, Dobson A, et al. (2004)
Ecology for a crowded planet. Science 304: 1251–1252.
6. Worm B, Barbier EB, Beaumont N, Duffy JE, Folke C, et al. (2006) Impacts of
Biodiversity Loss on Ocean Ecosystem Services. Science 314: 787–790.
7. Sandifer P (2009) Conserving marine biodiversity to sustain ecosystem services,
increase resiliency, and enhance human well-being. Abstracts, Coastal and
Estuarine Research Federation Biennial Conference. Portland, Ore.
8. Obama B (2009) Memorandum for the Heads of Executive Departments and
Agencies Regarding a National Policy for the Oceans, Our Coasts, and the
Great Lakes. June 12, 2009. Available at http://www.whitehouse.gov/sites/
default/files/page/files/2009ocean_mem_rel.pdf.
9. USCOP, U.S. Commission on Ocean Policy (2004) An Ocean Blueprint for the
21st Century. Final Report of the U.S. Commission on Ocean Policy.
Washington, D.C. 676 p.
10. JOCI, Joint Ocean Commission Initiative (2009) Changing Oceans, Changing
World. Ocean Priorities for the Obama Administration and Congress.
Congress Recommendations from the Joint Ocean Commission Initiative.Wa-
shington D.C.: Meridian Institute.
11. McLeod K, Leslie H (2009) Ecosystem-Based Management for the Oceans.
Washington D.C.: Island Press. 392 p.
12. Delegates of The World Conference on Marine Biodiversity (2008) The
Valencia Declaration – A Plea for the Protection of Marine Biodiversity.
The World Conference on Marine Biodiversity, November 2008. Valencia,
Spain.
13. Gazeau F, Quiblier C, Jansen JM, Gattuso JP, Middelburg JJ, et al. (2007)
Impact of elevated CO2 on shellfish calcification. Geophys Res Lett 34:
L07603.
14. Orr JC, Fabry VJ, Aumont O, Bopp L, Doney SC, et al. (2005) Anthropogenic
ocean acidification over the twenty-first century and its impact on calcifying
organisms. Nature 437(7059): 681–686.
15. Raven JA, Caldeira K, Elderfield H, Hoegh-Guldberg O, Liss P, et al. (2005)
Ocean acidification due to increasing atmospheric carbon dioxide. London:
Royal Society.
16. Claesson SH, Rosenberg AA (2009) Stellwagen Bank marine historical ecology;
final report. Gulf of Maine Cod Project. University of New Hampshire. 132 p.
17. Sherman K, Celone P, Adams S (2004) NOAA Fisheries Service’s Large
Marine Ecosystems Program: Status Report. 21 p.
18. Wares JP (2002) Community genetics in the northwestern Atlantic intertidal.
Mol Ecol 11: 1131–1144.
19. Theroux RB, Grosslein MD (1987) Benthic fauna. In: Backus RH, ed. Georges
Bank. Cambridge, Mass: MIT Press. pp 283–295.
20. Longhurst AR (1998) Ecological Geography of the Sea. San Diego, CA:
Academic Press. 398 p.
21. Cook R, Auster P (2007) A bioregional classification for the continental shelf of
northeastern North America for conservation analysis and planning based on
representation. Silver Spring, Md: U.S. Deptartment of Commerce, NOAA,
Office of Marine Sanctuaries. 14 p.
U.S. Marine Biodiversity
PLoS ONE | www.plosone.org 41 August 2010 | Volume 5 | Issue 8 | e11914

22. Spalding MD, Fox HE, Allen GR, Davidson N, Ferdana ZA, et al. (2007)Marine Ecoregions of the World: A Bioregionalization of Coastal and Shelf
Areas. BioScience 57: 573–583.
23. Hopkins TS, Garfield NI (1981) Physical Origins of Georges Bank Water. J Mar
Res 39: 465–500.
24. Brown WS, Irish JD (1993) The annual variation of water mass structure in the
Gulf of Maine: 1986-1987. J Mar Res 51: 53–107.
25. Townsend DW, Thomas AC, Mayer LM, Thomas M, Quinlan J (2006)
Oceanography of the Northwest Atlantic Continental Shelf. In: Robinson AR,
Brink KH, eds. The Sea. Cambridge, Mass.: Harvard University Press. pp119–168.
26. Fogarty MJ, Incze LS, Hayhoe K, Mountain D, Manning J (2008) Potentialclimate change impacts on Atlantic cod (Gadus morhua) off the northeastern
USA. Mitig Adapt Strat Global Change 13: 453–466.
27. Jennings RM, Shank TM, Mullineaux LS, Halanych KM (2009) Assessment of
the Cape Cod phylogeographic break using the bamboo worm reveals the roleof regional water mases in dispersal. J Hered 100: 86–96.
28. Brown H, Bollens S, Madin L, Horgan E (2005) Effects of warm waterintrusions on populations of macrozooplankton on Georges Bank, Northwest
Atlantic. Cont Shelf Res 25: 143–156.
29. Wroblewski JS, Cheney J (1984) Ichthyoplankton associated with a warm core
ring off the Scotian Shelf. Can J Fish Aquat Sci 41: 294–303.
30. Greene C, Pershing A (2003) The flip-side of the North Atlantic Oscillation andmodal shifts in slope-water circulation patterns. Limnol Oceanogr 48: 319–322.
31. Archer AW, Hubbard MS (2003) Highest tides in the world. Geol Soc Am SpecPaper 370: 151–173.
32. Bigelow HB, Welsh WW (1925) Fishes of the Gulf of Maine. Washington D.C.:U.S. Government Printing Office. 586 p.
33. Bigelow HB (1926) Plankton of the offshore waters of the Gulf of Maine. BullUS Bur Fish 40: 1–509.
34. Bigelow HB (1927) Physical oceanography of the Gulf of Maine. Bull US BurFish 40: 511–1027.
35. Bigelow HB, Schroeder WC (1953) Fishes of the Gulf of Maine. Fish Bull, USFish Wildl Serv 74.
36. Collette B, Klein-MacPhee G (2002) Bigelow and Schroeder’s fishes of the Gulfof Maine. Washington D.C.: Smithsonian Institution Press. 748 p.
37. Fahay MP (1983) Guide to the early stages of marine fishes occurring in thewestern North Atlantic Ocean, Cape Hatteras to the southern Scotian Shelf.
J Northwest Atl Fish Sci 4: 423.
38. Larsen PF (2004) Notes on the environmental setting and biodiversity of
Cobscook Bay, Maine: A boreal macrotidal estuary. Northeast Nat 11: 13–22.
39. Trott TJ (2004) Cobscook inventory: a historical checklist of marine
invertebrates spanning 162 years. Northeast Nat 11: 261–324.
40. Azarovitz TR (1981) A brief historical review of Woods Hole Laboratory trawl
survey time series. In: Doubleday WG, Rivard D, eds. Bottom trawl surveys.
Ottawa, Canada: Department of Fisheries and Oceans, Canadian SpecialPublication of the Fisheries and Aquatic Sciences. pp 62–67.
41. Byrne CJ, Azarovitz TR, Sissenwine MP (1981) Factors affecting variability ofresearch vessel trawl surveys. In: Doubleday WG, Rivard D, eds. Bottom Trawl
Surveys. Ottawa, Canada: Department of Fisheries and Oceans, CanadianSpecial Publication of the Fisheries and Aquatic Sciences. pp 258–273.
42. Theroux RB, Wigley RL (1998) Quantitative composition and distribution of
the macrobenthic invertebrate fauna of the continental shelf ecosystems of thenortheastern United States. Washington D.C., U.S. Department of Commerce.
240 p.
43. Hathaway JC, ed (1971) Datafile. Continental margin program. Atlantic Coast
of the United States, Vol 2, samples collection and analytical data. WoodsHole, Mass.: Woods Hole Oceanographic Institute, REF# 71-15, USGS.
44. Steimle FW, Burnett JM, Theroux RB (1995) A history of benthic research inthe NMFS Northeast Fisheries Science Center. Mar Fish Rev 57(2): 1–13.
45. Wigley RL, Theroux RB (1981) Atlantic Continental Shelf and Slope of theUnited States- Macrobenthic Invertebrate Fauna of the Middle Atlantic Bight
Region-Faunal Composition and Quantitative Distribution. Geological Survey
Professional Paper 529-N. Washington, D.C.: U.S. Government PrintingOffice.
46. Hale SS, Hughes MM, Strobel CJ, Buffum HW, Copeland JL, et al. (2002)Coastal ecological data from the Virginian Biogeographic Province, 1990-
1993. Ecology 83: 2942.
47. Hale SS, Heltshe JF (2008) Signals from the benthos: Development and
evaluation of a benthic index for the nearshore Gulf of Maine. Ecol Indic 8:338–350.
48. Brunel P, Bosse L, Lamarche G (1998) Catalogue des invertebres marins del’estuaire et du golfe du Saint-Laurent. Publ spec can sci halieut aquat 126: 405.
49. York AD (2009) HabCam sheds light on invading tunicate: habitat mappingcamera system monitors ecosystem change over time and space. Sea Tech
50(8): 41–46.
50. Makris NC, Ratilal P, Symoonds DT, Jagannathan S, Lee S, et al. (2006) Fishpopulation and behavior revealed by instantaneous continental shelf-scale
imaging. Science 311: 660–663.
51. Makris NC, Ratilal P, Jagannathan S, Gong Z, Andrews M, et al. (2009)
Critical Population Density Triggers Rapid Formation of Vast Oceanic FishShoals. Science 323(5922): 1734–1737.
52. Novacek MJ (2008) Engaging the public in biodiversity issues. PNAS 105(Suppl 1): 11571–11578.
53. Baum J, Myers R, Kehler D, Worm B, Harley S, et al. (2003) Collapse and
Conservation of Shark Populations in the Northwest Atlantic. Science 299:
389–392.
54. Frank K, Petrie B, Choi J, Leggett W (2005) Trophic Cascades in a Formerly
Cod-Dominated Ecosystem. Science 308: 1621–1623.
55. Myers R, Baum J, Shepherd T, Powers S, Peterson C (2007) Cascading Effects
of the Loss of Apex Predatory Sharks from a Coastal Ocean. Science 315:
1846–1850.
56. Auster P, Malatesta R, Langton R, Watting L, Valentine P, et al. (1996) The
impacts of mobile fishing gear on seafloor habitats in the gulf of Maine
(Northwest Atlantic): Implications for conservation of fish populations. Res Fish
Sci 4(2): 185.
57. Watling L, Norse E (1998) Disturbance of the Seabed by Mobile Fishing Gear:
A Comparison to Forest Clearcutting. Conserv Biol 12(6): 1180–1197.
58. Nixon S, Granger S, Buckley B, Lamont M, Rowell B (2004) A one hundred
and seventeen year coastal water temperature record from Woods Hole,
Massachusetts. Estuaries 27: 397–404.
59. Greene C, Pershing A (2007) OCEANS: Climate Drives Sea Change. Science
315: 1084–1085.
60. Collie J, Wood A, Jeffries H (2008) Long-term shifts in the species composition
of a coastal fish community. Can J Fish Aquat Sci 65: 1352–1365.
61. Nye J, Link J, Hare J, Overholtz W (2009) Changing spatial distribution of fish
stocks in relation to climate and population size on the Northeast United States
continental shelf. Mar Ecol Prog Ser 393: 111–129.
62. Talmage S, Gobler C (2009) The effects of elevated carbon dioxide
concentrations on the metamorphosis, size, and survival of larval hard clams
(Mercenaria mercenaria), bay scallops (Argopecten irradians), and Eastern oysters
(Crassostrea virginica). Limnol Oceanogr 54: 2072–2080.
63. Lotze H, Lenihan H, Bourque B, Bradbury R, Cooke R, et al. (2006)
Depletion, Degradation, and Recovery Potential of Estuaries and Coastal Seas.
Science 312: 1806–1809.
64. Calabretta C, Oviatt C (2008) The response of benthic macrofauna to
anthropogenic stress in Narragansett Bay, Rhode Island: A review of human
stressors and assessment of community conditions. Mar Pollut Bull 56:
1680–1695.
65. Seitz R, Dauer D, Llanso R, Long W (2009) Broad-scale effects of hypoxia on
benthic community structure in Chesapeake Bay, USA. J Exp Mar Biol Ecol
381: S4–S12.
66. Waycott M, Duarte C, Carruthers T, Orth R, Dennison W, et al. (2009)
Accelerating loss of seagrasses across the globe threatens coastal ecosystems.
Proc Natl Acad Sci 106: 12377–12381.
67. Atkinson LP, Menzel DW, Bush KA, eds (1985) Oceanography of the
southeastern U.S. continental shelf. Washington D.C.: American Geophysical
Union. 156 p.
68. SAFMC (1998) Final Habitat Plan for the South Atlantic Region: Essential Fish
Habitat Requirements for Fishery Management Plans of the South Atlantic
Fishery Management Council. CharlestonSouth Carolina: South Atlantic
Fishery Management Council. 458 p.
69. Carpenter KE, ed (2002) The living marine resources of the Western Central
Atlantic. Volume 1: Introduction, mollusks, crustaceans, hagfishes, sharks,
batoid fishes and chimaeras. Rome: FAO. 600 p.
70. Dame R, Alber M, Allen D, Mallin M, Montague C, et al. (2000) Estuaries of
the south Atlantic coast of North America: Their geographical signatures.
Estuaries 23: 793–819.
71. Ross SW, Nizinski MS (2007) State of deep coral ecosystems in the U.S.
southeast region: Cape Hatteras to southeastern Florida. In: Lumsden SE,
Hourigan TF, Bruckner AW, Dorr G, eds. The State of Deep Coral
Ecosystems of the United States 2007 NOAA Technical 1047 Memorandum
CRCP-3. Silver Spring, Md. pp 233–270.
72. Catesby M (1731-1734) The natural history of Carolina, Florida and the
Bahama Islands.
73. Pietsch TW, Anderson WD, Jr. (1997) Collection building in ichthyology and
herpetology. Amer Soc Ichthy Herp Spec Pub 3: 409–437.
74. Agassiz A (1888) Three cruises of the United States Coast and Geodetic Survey
Steamer ‘‘Blake’’: In the Gulf of Mexico, in the Caribbean Sea, and along the
Atlantic coast of the United States, from 1877 to 1880. Volume I. Bull Mus
Comp Zool. pp 1–314.
75. Goode GB, Bean TH (1896) Oceanic ichthyology: deep-sea and pelagic fishes
of the world. Bull U S Nat Mus 2: 553.
76. Bigelow HB (1964) Fishes of the western North Atlantic, Part Four; Bigelow
HB, editor: Memoir Sears Foundation for Marine Research I. 599 p.
77. Miller GC, Richards WJ (1980) Reef fish habitat, faunal assemblages, and
factors determining distributions in the South Atlantic Bight. Proc Gulf Caribb
Fish Inst 32: 114–130.
78. Wenner CA (1983) Species associations and day-night variability of trawl
caught fishes from the inshore sponge-coral habitat, South Atlantic Bight. Fish
Bull 81: 532–552.
79. Wenner CA, Sedberry GR (1989) Species composition, distribution, and
relative abundance of fishes in the coastal habitat off the southeastern United
States. 49 p.
80. Wenner EL, Knott DM, Van Dolah RF, Burrell VG, Jr. (1983) Invertebrate
communities associated with hard bottom habitats in the South Atlantic Bight.
Estuar Coast Shelf Sci 17: 143–158.
U.S. Marine Biodiversity
PLoS ONE | www.plosone.org 42 August 2010 | Volume 5 | Issue 8 | e11914

81. Rowe JJ, Sedberry GR (2006) Integrating GIS with fishery survey historical
data: A possible tool for designing marine protected areas. Proc Gulf Caribb
Fish Inst 57: 9–30.
82. Sedberry GR, Pashuk O, Wyanski DM, Stephen JA, Weinbach P (2006)
Spawning locations for Atlantic reef fishes off the southeastern U.S. Proc Gulf
Caribb Fish Inst 57: 463–514.
83. Menzies RJ, George RY, Rowe GT (1973) Abyssal environment and ecology of
the world oceans. New York and London: Wiley-Interscience. 488 p.
84. Sedberry GR, Van Dolah RF (1984) Demersal fish assemblages associated with
hard bottom habitat in the South Atlantic Bight of the U.S.A. Environ Biol
Fishes 11: 241–258.
85. Williams AB (1984) Shrimps, lobsters, and crabs of the Atlantic Coast of the
Eastern United States, Maine to Florida. Washington D.C.: Smithsonian
Institution Press.
86. Sebens KP (1998) Marine Flora and Fauna of the Eastern United States
Anthozoa: Acitniaria, Corallimorpharia, Ceriantharia, and Zoanthidea.
NOAA Tech. Rep. NMFS 141: 68.
87. Grace MA (2001) Field guide to requiem sharks (Elasmobranchiomorphi:
Carcharhinidae) of the Western North Atlantic. NOAA Tech. Rep. NMFS
153: 32.
88. Heard RW, King RA, Knott DM, Thoma BP, Thornton-DeVictor S (2007) A
guide to the Thalassinidea (Crustacea: Malacostraca: Decapoda) of the South
Atlantic Bight. NOAA Professional Paper NMFS 8: 30.
89. Hare JA, Walsh HJ, Marancik KE, Score D, Sedberry GR, et al. (in press) Fish
fauna of Gray’s Reef National Marine Sanctuary and the implications for
place-based management. NOAA Cons Ser.
90. NMSP, National Marine Sanctuary Program (2007) Florida Keys National
Marine Sanctuary Revised Management Plan. Silver Spring Md.: U.S.
Department of Commerce, NOAA, National Ocean Service, National Marine
Sanctuary Program.
91. Powell AB, Robbins RE (1998) Ichthyoplankton adjacent to live-bottom
habitats in Onslow Bay, North Carolina. NOAA Tech. Rep. NMFS. 32 p.
92. Wenner EL, Hinde P, Knott DM, Van Dolah RF (1984) A temporal and
spatial study of invertebrate communities associated with hard-bottom habitats
in the South Atlantic Bight. 104 p.
93. Blake JA, Grassle JF (1994) Benthic community structure on the U.S. Atlantic
slope off the Carolinas: Spatial heterogeneity in a current-dominated system.
Deep-Sea Res 41: 835–874.
94. Ross SW, Bichy J (2002) Checklist of the fishes documented from the Zeke’s
Island and Masonboro Island components of the North Carolina National
Estuarine Research Reserve. National Estuarine Research Reserve Technical
Report Series 2002. 34 p.
95. Upchurch S, Wenner E (2008) Fish and decapod crustacean assemblages from
the Ashepoo-Combahee-Edisto Basin, South Carolina (1993–1999). J Coastal
Res 55: 200–213.
96. Lehnert RL, Allen DM (2002) Nekton use of subtidal oyster shell habitat in a
southeastern U.S. estuary. Estuaries 25: 1015–1024.
97. Love JW, Chase PD (2007) Marine fish diversity and composition in the Mid-
Atlantic and South Atlantic Bights. Southeast Nat 6: 705–714.
98. Cassaza TL, Ross SW (2008) Fishes associated with pelagic Sargassum and
non-structured, open-water habitats in the Gulf Stream off North Carolina,
USA. Fish Bull 106: 348–363.
99. Fiore CL (2006) Characterization of macrofaunal assemblages associated with
sponges and tunicates off the southeastern United States [M.S. Thesis].
Charleston: College of Charleston. 122 p.
100. Harasewych MG, Sedberry GR (2006) Rediscovery, range extension, and
redescription of Calliostoma torrei Clench and Aguayo, 1940 (Gastropoda:
Vetigastropoda: Calliostomatidae). The Nautilus 102: 39–44.
101. Caruso JH, Ross SW, Sedberry GR, Sulak KJ (2007) Deep-water chaunacid
and lophiid anglerfishes (Pisces: Lophiiformes) off the south-eastern United
States. J Fish Biol 70: 1015–1026.
102. Burton ML, Brennan KJ, Munoz RC, Parker J RO (2005) Preliminary
evidence of increased spawning aggregations of muotton snapper (Lutjanus
analis) at Riley’s Hump two years after establishment of the Tortugas South
Ecological Reserve. Fish Bull 103: 404–410.
103. Kramer K, Heck KL (2007) Top-down trophic shifts in Florida Keys patch reef
marine protected areas. Mar Ecol Prog Ser 349: 111–123.
104. Reed JK (2002) Comparison of deep-water coral reefs and lithoherms off
southeastern USA. Hydrobiologia 471: 57–69.
105. Kumpf H, Steidinger K, Sherman K, eds (1999) The Gulf of Mexico Large
Marine Ecosystem: Assessment, Sustainability, and Management. Malden,
Mass: Blackwell Science. 704 p.
106. Tunnell JW, Jr. (2009) The Gulf of Mexico. In: Earle SA, Glover LK, eds.
Ocean: An Illustrated Atlas. Washington, D.C.: National Geographic Society.
pp 136–137.
107. Darnell RM, Defenbaugh RE (1990) Gulf of Mexico. Environmental overview
and history of environmental research. Am Zool 30: 3–6.
108. Sturges W, Lugo-Fernandez A, eds (2007) Circulation of the Gulf of Mexico:
Observations and Models. American Geophysical Union. 347 p.
109. Briggs JC (1974) Marine Zoogeography. New York: McGraw Hill. 475 p.
110. Tunnell JW, Jr., Judd FW, eds (2002) The Laguna Madre of Texas and
Tamaulipas. College Station, Tex: Texas A&M University Press. 346 p.
111. Tunnell JW, Jr., Chavez EA, Withers K, eds (2007) Coral Reefs of the
Southern Gulf of Mexico. College Station, Tex: Texas A&M University Press.
194 p.
112. Rezak R, Edwards GS (1972) Carbonate sediments of the Gulf of Mexico.
Texas A&M University Oceanography Studies 3: 263–280.
113. Rezak R, Bright TJ, McGrail DW (1985) Reefs and Banks of the Northwestern
Gulf of Mexico. New York: John Wiley & Sons. 259 p.
114. CSA International Inc (2007) Characterization of northern Gulf of Mexico
deepwater hard bottom communities with emphasis on Lophelia corals. OCS
MMS 2007-044. New OrleansLouisiana: U.S. Department of the Interior,
Minerals Management Service, Gulf of Mexico OCS Regional Office. 169 p.
115. Brooks J, Fisher C, Roberts H, Bernard B, MacDonald I, et al. (2008)
Investigations of chemosynthetic communities on the lower continental slope of
the Gulf of Mexico, Interim Report 1. OCS Study MMS 2008-2009. New
OrleansLouisiana: U.S. Department of the Interior, Minerals Management
Service, Gulf of Mexico OCS Regional Office. 332 p.
116. Cordes EE, McGinley MP, Podowski EL, Becker EL, Lessard-Pilon S, et al.
(2008) Coral communities of the deep Gulf of Mexico. Deep-Sea Res 55:
777–787.
117. Galtsoff PS, ed (1954) Gulf of Mexico, Its Origin, Waters and Marine Life.
Washington, D.C.: U.S. Fish Wld S Fish B, Volume 55: 604.
118. Rabalais NN, Carney RS, Escobar-Briones EG (1999) Overview of continental
shelf benthic communities of the Gulf of Mexico. In: Kumpf H, Steidinger K,
Sherman K, eds. The Gulf of Mexico Large Marine Ecosystem: Assessment,
Sustainability, and Management. Malden, Mass.: Blackwell Science. pp
171–195.
119. Davis RW, Evans WE, Wursig B, eds (2000) Cetaceans, Sea Turtles and
Seabirds in the Northern Gulf of Mexico: Distribution, Abundance and
Habitat Associations. Vol. II: Technical Report. New Orleans, LA: Geological
Survey, Biological Resources Division, USGS/BRD/CR-1999-0006 and
Minerals Management Service, Gulf of Mexico OCS Region. 346 p.
120. Wursig B, Jefferson TA, Schmidley DJ (2000) The Marine Mammals of the
Gulf of Mexico. College Station, Tex.: Texas A&M University Press. 232 p.
121. Nelson DM, ed (1992) Distribution and abundance of fishes and invertebrates
in Gulf of Mexico estuaries, Vol. I: Data summaries. ELMR Rep No 10.
Rockville, Md.: NOAA/NOS Strategic Environmental Assessments Division.
273 p.
122. Pattillo ME, Czapala TE, Nelson DM, Monaco ME Distribution and
abundance of fishes and invertebrates in Gulf of Mexico estuaries, Vol. II:
species life history summaries. Rockville, Md.: NOAA/NOS Strategic
Environmental Assessments Division. 377 p.
123. Tunnell JW, Jr. (1992) Natural versus human impacts to Southern Gulf of
Mexico coral reef resources. In: Richmond RH, ed. Proceedings of the Seventh
International Coral Reef Symposium Mangilao, Guam. pp 300–306.
124. Felder DL, Camp DK, eds (2009) Gulf of Mexico Origin, Waters, and
Biota. Vol. 1, Biodiversity. College Station, Tex.: Texas A&M University Press.
1384 p.
125. NOAA, National Oceanic and Atmospheric Administration (1996) Florida
Keys National Marine Sanctuary – Final Management Plan/Environmental
Impact Statement. Silver Spring, Md.: NOAA/NOS, Office of Ocean and
Coastal Resource Management.
126. NOAA, National Oceanic and Atmospheric Administration (1991) Flower
Garden Banks National Marine Sanctuary – Final Environmental Impact
Statement/Management Plan. Washington, D.C.: NOAA/NOS, Sanctuaries
and Resources Division. 63 p.
127. Flores Hernandez D, Sanchez-Gil P, Seijo JC, Arreguın-Sanchez F, eds (2005)
Analisis y Diagnostico de los Recursos Pesqueros Crıticos del Golfo de Mexico.
Universidad Autonoma de Campeche, EPOMEX serie Cientifica 7: 496.
128. Botello AV, Osten JRV, Gold-Bouchet G, Agraz-Hernandez C, eds (2005)
Golfo de Mexico, Contaminacion e Impacto Ambiental: Diagnostico y
Tendencias: Universidad Autonoma de Campeche, Universidad Autonoma
de Mexico, Instituto Nacional de Ecologıa. 696 p.
129. Caso M, Pisanty I, Ezcurra E (2004) Diagnostico Ambiental del Golfo de
Mexico: Instituto Nacional de Ecologıa (INE-SEMARNAT).
130. Withers K, Nipper M (2008) Environmental Analysis of the Gulf of Mexico
(English Translation of Caso et al. 2004) Harte Research Institute for Gulf of
Mexico Studies, Special Publication Series No. 1 Texas A&M University-
Corpus Christi.
131. Harper DE, Jr. (1991) Macrofauna and macroepifauna. In: Brooks JM, ed.
Mississippi-Alabama Continental shelf Ecosystem Study Data summary and
synthesis Vol II Technical Narrative OCS Study MMS 91-0063. US
Department of the Interior, Minerals Management Service, Gulf of Mexico
OCS Regional Office: New Orleans, Louisiana.
132. Carney RS (1993) Review and reexamination of OCS spatial-temporal
variability as determined by MMS studies in the Gulf of Mexico. OCS Study
MMS 93-0041. New Orleans, Louisiana: U.S. Department of the Interior,
Minerals Management Service, Gulf of Mexico OCS Regional Office/.
133. Walsh JJ, Jolliff JK, Darrow BP, Lenes JM, Milroy SP, et al. (2006) Red tides in
the Gulf of Mexico: Where, when, and why? J Geophys Res 111: 1–46.
134. Rabalais N (2004) Hypoxia in the Gulf of Mexico. In: Withers K, Nipper M,
eds. Environmental Analysis of the Gulf of Mexico. Texas A&M University-
Corpus Christi: Harte Research Institute for Gulf of Mexico Studies.
U.S. Marine Biodiversity
PLoS ONE | www.plosone.org 43 August 2010 | Volume 5 | Issue 8 | e11914

135. McKay M, Nides J, Lang W, Vigil D (2001) Gulf of Mexico Marine Protected
Species Workshop, June 1999. New Orleans, La.: U.S. Deptartment of the
Interior, Minerals Management Service, Gulf of Mexico OCS Region. 171 p.
136. Graham WM, Martin DC, Felder DL, Asper VL, Perry HM (2003) Ecological
and economic implications of a tropical jellyfish invader in the Gulf of Mexico.
Biol Invasions 5: 53–69.
137. Hicks DW, Tunnell JW, Jr. (1993) Invasion of the South Texas coast by the
edible brown mussel, Perna perna (Linnaeus, 1758). The Veliger 36: 92–94.
138. Hicks DW, Tunnell JW, Jr. (1995) Ecological notes and patterns of dispersal in
the recently introduced mussel, Perna perna (Linnaeus, 1758) in the Gulf of
Mexico. Am Malacol Bull 11: 203–206.
139. Hicks DW, McMahon RF (2002) Temperature acclimation of upper and lower
thermal limits and freeze resistance in the nonindigenous brown mussel, Perna
perna (L.). Gulf of Mexico Marine Biology 140: 1167–1179.
140. Benson AJ, Marelli DC, Frischer ME, Danforth JM, Williams JD (2001)
Establishment of the green mussel, Perna viridis (Linnaeus 1758) (Mollusca:
Mytilidae) on the west coast of Florida. J Shellfish Res 20(1): 21–29.
141. Fenner D, Banks K (2004) Orange cup coral Tubastraea coccinea invades Florida
and the Flower Garden Banks, northwestern Gulf of Mexico. Coral Reefs 23:
505–507.
142. Coleman FC, Figueira WF, Ueland JS, Crowder LB (2004) The impact of
United States recreational fisheries on marine fish populations. Science 305:
1958–1960.
143. Waters JR (2003) Review of the U.S. commercial red snapper fishery in the
Gulf of Mexico. National Marine Fisheries Service & Southeast Fisheries
Science Center, National Oceanic and Atmospheric Administration.
144. Swingle WE (1990) Status of the commercial and recreational fishery. In:
Chamberlin GW, Miget RJ, Hab MG, eds. Red Drum Aquaculture. College
Station, Tex.: Texas A&M Sea Grant Program. pp 22–24.
145. Ramırez-Rodriguez M, Chavez EA, Arreguın-Sanchez F (2000) Perspectives of
the pink shrimp (Farfantepenaeus duorarum Burkenroad) fishery of Campeche
Bank, Mexico. Ciencias Marinas 26: 97–112.
146. Arreguın-Sanchez F, Solıs-Ramırez MJ, Gonzalez de la Rosa ME (2000)
Population dynamics and stock assessment for Octopus maya (Cephalopoda:
Octopodidae) fishery in the Campeche Bank, Gulf of Mexico. Revista de
Biologia Tropical 48 (2/3): 323–331.
147. Arreguın-Sanchez F, Contreras M, Moreno V, Burgos R, Valdes R (1996)
Population dynamics and stock assessment of red grouper (Epinephelus morio)
fishery on Campeche Bank, Mexico. In: Arreguın-Sanchez F, Munro JL,
Balgos MC, Pauly D, eds. Biology, fisheries and culture of tropical groupers
and snappers: ICLARM Conference Proceedings. pp 202–217.
148. Ritchie KB, Keller BD, eds (2008) A scientific forum on the Gulf of Mexico
concept: The Islands in the Stream. Marine Sanctuaries Conservation Series
NMSP-08-04. Silver Spring, Md.: U.S. Department of Commerce. National
Oceanic and Atmospheric Administration, National Marine Sanctuary
Program. 105 p.
149. Gulf of Mexico Alliance (2006) Governor’s Action Plan for Healthy and
Resilient Coasts. Gulf of Mexico Alliance. 32 p.
150. Twilley RR, Barron EJ, Gholz HL, Harwell MA, Miller RC, et al. (2004)
Confronting Climate Change in the Gulf Coast Region: Prospects for
Sustaining our Ecological Heritage. Washington D.C., Cambridge Mass.:
Union on Concerned Scientists and Ecological Society of America.
151. Ning ZH, Turner RE, Doyle T, Abdollahi KK (2003a) Integrated Assessment
of the Climate Change Impacts on the Gulf Coast Region. Findings of the Gulf
Coast Regional Assessment. Baton Rouge, La.: GCRCC and LSU Graphic
Services.
152. Ning ZH, Turner RE, Doyle T, Abdollahi KK (2003b) Preparing for a
Changing Climate: Potential Consequences of Climate Variability and
Change-Gulf Coast Region. Baton Rouge, La.: GCRCC and LSU Graphic
Services.
153. Anderson JB (2007) The Formation and Future of the Upper Texas Coast.
College Station, Tex.: Texas A&M University Press. 163 p.
154. Friedlander AM, Maragos J, Brainard R, Clark A, Aeby G (2008) Status of
Coral Reefs in Hawaii and United States Pacific Remote island Areas (Baker,
Howland, Palmyra, Kingman, Jarvis, Johnson, Wake) in 2008. In: Wilkinson C,
ed. Status of Coral Reefs of the World. Townsville, Australia: Global Coral
Reef Monitoring Network and Reef and Rainforest Research Center.
155. Kobashi F, Kawamura H (2002) Seasonal variation and instability nature of the
North Pacific Subtropical Countercurrent and the Hawaiian Lee Countercur-
rent. J Geophys Res 107: 3185.
156. Firing J, Brainard R (2006) Ten years of shipboard ADCP measurements along
the Northwestern Hawaiian Islands, Atoll. Res Bull 543: 347–364.
157. Rivera MA, Kelley CD, Roderick GK (2004) Subtle population genetic
structure in the Hawaiian group, Epinephelus querus (Serranidae) as revealed by
mitochondrial DNA analyses. Biolog J Linnean Soc 81: 449–468.
158. Maragos JE, Potts DC, Aeby GS, Gulko D, Kenyon JC (2004) 2000-2002
Rapid ecological assessment of corals on the shallow reefs of the Northwestern
Hawaiian Islands, Part I: Species and Distribution. Pac Science 58: 211–230.
159. Juvik SP, Juvik JO, Paradise TR (1998) Atlas of Hawaii. University of Hawaii
Press. 333 p.
160. Randall JE (1995) Zoogeographic analysis of the inshore Hawaiian fish fauna.
In: Maragos J, Peterson M, Eldredge L, Bardach J, Takeuchi H, eds. Marine
and coastal biodiversity in the tropical island Pacific region: Vol. 1, Species
systematics and information management priorities. Honolulu: East-West
Center. pp 193–203.
161. Randall JE (1998) Zoogeography of shore fishes of the Indo-Pacific region.
Zoolog Studies 37: 227–268.
162. Allen GR (2002) Indo-Pacific coral-reef fishes as indicators of conservation
hotspots. Proc 9th Int Coral Reef Symp 2: 921–926.
163. DeMartini EE, Friedlander AM (2004) Spatial patterns of endemism in
shallow-water reef fish populations of the northwestern Hawaiian Islands. Mar
Ecol Prog Ser 271: 281–296.
164. Edmondson CH, Fisher WK, Clark HL, Treadwell AL, Cushman JA (1925)
Marine zoology of tropical central Pacific. Bulletin BP Bishop Museum 27
[Tanager Expedition Publication No 1]. 148 p.
165. Edmondson CH (1933) Reef and shore fauna of Hawaii. B.P. Bishop Museum
Special Publication 22: 295.
166. Eldredge LG (1993) Hawaii’s biodiversity: a detailed assessment of the numbers
of species in the Hawaiian Islands. Bishop Museum Occasional Papers 76:
1–28.
167. Jordan DS, Everman BW (1905) The aquatic resources of the Hawaiian Islands
I. Shore fishes. Bulletin of the US Fish Commission for 1903.
168. Gosline WA, Brock VE (1960) Handbook of Hawaiian fishes. University of
Hawaii Press. 372 p.
169. Hoover JP (1993) Hawaii’s fishes. A guide for snorkelers, divers, and aquarists.
Honolulu: Mutual Publishing. 178 p.
170. Mundy BC (2005) Checklist of the fishes of the Hawaiian Islands. Bishop
Museum Bulletin in Zoology 6: 704.
171. Randall JE (2007) Reef and shore fishes of the Hawaiian Islands. University of
Hawaii Sea Grant. 546 p.
172. Vaughan TW (1907) Recent Madreporaria of the Hawaiian Islands and
Laysan. Bull U S Nat Mus 59: 222.
173. Maragos JE (1977) Order Scleractinia stony corals. In: Devaney DM,
Eldredge LG, eds. Reef and Shore fauna of Hawaii: B.P.Bishop Museum
Special Publication 64(1). pp 158–241.
174. Fenner D (2005) Corals of Hawaii. A field guide to the hard, black, and soft
corals of Hawaii and the Northwest Hawaiian Islands, including Midway.
Honolulu: Mutual Publishing. 143 p.
175. Cairns SD (1984) New records of ahermatypic corals (Scleractinia) from the
Hawaiian and Line Islands. Occasional Papers of the Bernice Pauahi Bishop
Museum 25: 1–30.
176. Rathbun MJ (1906) Aquatic Resources of the Hawaiian Islands III. The
Brachyura and Macrura of the Hawaiian Island Bulletin of the US Fish
Commission for 1903: 827–930.
177. Martin J, Godwin S, Moffitt R (2009) Additions to the decapod crustacean
fauna of the Hawaiian Islands, I. A review of the genus Sakaila Manning and
Holthuis, 1981 (Decapoda, Brachyura, Aethiridae), with the description of a
new species from the northwestern Hawaiian Islands. Zootaxa 2018: 25–44.
178. Martin JW, Moffitt RB, McLaughlin PA (2009) Additions to the decapod
crustacean fauna of the Hawaiian Islands, II. First record of the unusual hermit
crab genus Porcellanopagurus Filhol, 1885, and Solitariopagurus Turkay, 1986
(Decapoda, Anomura, Paguridae). Zootaxa 2057: 53–62.
179. Schnabel KE, Martin JW, Moffitt RB (2009) Additions to the decapod
crustacean fauna of the Hawaiian Islands, III. A new species of the genus
Babamunida (Crustacea: Galatheidae) from Hawaii based on morphological and
molecular evidence. Zootaxa 2130: 21–30.
180. Kay EA (1979) Hawaiian marine shells. Reef and shore fauna Section 4:
Mollusca. BP Bishop Museum Special Publication 64(4): 1–653.
181. Opresko DM (2001) Revision of the antipatharia (Cnidaria: Anthozoa). Part I.
Establishment of a new family, Myriopathidae. Zool Meded 75: 147–774.
182. Hughes TP, Reed DC, Boyle MJ (1987) Herbivory on coral reefs: community
structure following mass mortalities of sea urchins. J Exper Mar Biol Ecol 113:
39–59.
183. Vroom PS (2005) Dasya atropurpurea sp. nov. (Ceramiales, Rhodophyta), a deep
water species from the Hawaiian archipelago. Phycologia 44: 572–580.
184. Vroom PS, Page KN, Kenyon JC, Brainard R (2006) Algae-Dominated Reefs.
Am Sci 94: 429–437.
185. Bruno JF, Sweatman H, Precht WF, Selig ER, Schutte VGW (2009) Assessing
evidence of phase shifts from coral to macroalgal dominance on coral reefs.
Ecology 90: 1478–1490.
186. Vroom PS, Timmers MAV (2009) Spatial and temporal comparison of algal
biodiversity and benthic cover at Gardner pinnacles, Northwestern Hawaiian
islands. J Phycol 45: 337–347.
187. Vroom PS, Page KN, Peyton KA, Kukea-Shultz JK (2006) Marine algae of
French Frigate Shoals, Northwestern Hawaiian Islands: Species list and
biogeographic comparisons. Pac Science 60: 81–95.
188. Kraft GT, Saunders GW, Abbott IA, Haroun RJ (2004) A uniquely calcified
brown alga from Hawaii: Newhousia imbricata gen. et sp nov (Dictyotales,
Phaeophyceae). J Phycol 40: 383–394.
189. Vroom PS, Abbott IA (2004) Acrosymphyton brainardii sp. nov. (Gigartinales,
Rhodophyta) from French Frigate Shoals, Northwestern Hawaiian Islands.
Phycologia 43: 68–74.
190. Vroom PS, Abbott IA (2004) Scinaia huismanii sp. nov. (Nemaliales,
Rhodophyta): an addition to the exploration of the marine algae of the
northwestern Hawaiian Islands. Phycologia 43: 445–454.
U.S. Marine Biodiversity
PLoS ONE | www.plosone.org 44 August 2010 | Volume 5 | Issue 8 | e11914
191. Sherwood AR (2007) Phylogeography of Asparagopsis taxiformis (Bonnemaiso-niales, Rhodophyta) in the Hawaiian Islands: two mtDNA markers support
three separate introductions. J Phycol (supplement): 17.
192. Conklin KY, Sherwood AR (2009) Rethinking native species: evidence for
repeated colonizations of Spyridia filamentosa (Ceramiales, Rhodophyta) in theHawaiian Archipelago. J Phycol 45: 2–3.
193. Tabrah FL, Koshiwagi M, Norton TR (1970) Antitumor activity in mice of
tentacles of two tropical sea annelids. Science 170: 181–183.
194. Jimeno J, Faircloth G, Fernandez Sousa-Faro JM, Scheuer P, Rinehart K
(2004) New marine derived anticancer therapeutics – A journey from the sea toclinical trials. Mar Drugs 2: 14–29.
195. Edmondson CH (1946) Reef and shore fauna of Hawaii. B.P. Bishop MuseumSpecial Publicaton 22: 381.
196. Edmondson CH (1949) Seashore treasurers. Pacific Books. 144 p.
197. Fielding A, Robinson E (1987) An underwater guide to Hawaii. Honolulu:
University of Hawaii Press. 156 p.
198. Hoover JP (1999) Hawaii’s sea creatures. A guide to Hawaii’s marine
invertebrates, revised edition. Honolulu: Mutual Publishing. 366 p.
199. Hoover JP (2008) The ultimate guide to Hawaiian reef fishes, sea turtles,
dolphins, whales, and seals. Honolulu: Mutual Publishing. 388 p.
200. Kay EA, Palumbi SR (1987) Endemism and evolution in Hawaiian marine
invertebrates. Trends in Ecol & Evol 2: 183–186.
201. Jokiel PL (1987) Ecology, biogeography and evolution of corals in Hawai’i.
Trends Ecol & Evol 2: 179–182.
202. Maragos JE, Peterson MNA, Eldredge LG, Bardach JE, Takeuchi HF (1995)
Marine and coastal biodiversity in the tropical island Pacific region. Vol. 1.Species systematics and information management priorities. Honolulu: East-
West Center. 424 p.
203. Abbott IA (1999) Marine Red Algae of the Hawaiian Islands. Honolulu: BishopMuseum Press. 477 p.
204. Abbott IA, Huisman JM (2004) Marine Green and Brown Algae of theHawaiian Islands. Honolulu: Bishop Museum Press. 259 p.
205. Huisman JM, Abbott IA, Smith CM (2006) Hawaiian Reef Plants. Honolulu,Hawaii: University of Hawaii Sea Grant. 264 p.
206. Verbruggen H, De Clerck O, N’Yeurt ADR, Spalding H, Vroom PS (2006)Phylogeny and taxonomy of Halimeda incrassata, including descriptions of H.
kanaloana and H. heteromorpha spp. nov. (Bryopsidales, Chlorophyta).Eur J Phycol 41: 337–362.
207. Conklin KY, Kurihara A, Sherwood AR (2009) A molecular method foridentification of the morphologically plastic invasive algal genera Eucheuma
and Kappahycus (Rhodophyta Gigarinales) in Hawai’i. J Applied Phycol
Online.
208. Kobayashi DR (2006) Colonization of the Hawaiian Archipelago via Johnston
Atoll: a characterization of oceanographic transport corridors for pelagic larvaeusing computer simulation. Coral Reefs 25: 407–417.
209. Brainard RE (2007) Cruise Report for Oscar Elton Sette, Cruise OES-06-11(OES-47), 8–28 October 2006. NOAA PIFSC Cruise Report CR-07-007, 15
March 2007. 46 p.
210. Zimmerman TL, Martin JW (2004) Artificial reef matrix structures (ARMS): an
inexpensive and effective method for collecting coral reef-associated inverte-brates. Gulf Caribb Res 16: 59–64.
211. Brainard R, Moffitt R, Timmers M, Paulay G, Plaissance L (2009)
Autonomous reef monitoring structures (ARMS): a tool for monitoring indicesof biodiversity in the Pacific Islands [Abstr]. 11th Pacific Science Inter-
Congres. Papeete, Tahiti. 197 p.
212. Godwin S, Harris L, Charrette A, Moffitt R (2008) The marine invertebrate
species associated with the biofouling of derelict fishing gear in thePapahanaumokuakea Marine National Monument: A focus on marine non-
native species transport. A preliminary report to NOAA-PIFSC-CRED.Hawaii Institute of Marine Biology. 26 p.
213. Bellwood DR, Hughes TP (2001) Regional-scale assembly rules and
biodiviersity of coral reefs. Science 292: 1532–1534.
214. Bellwood DR, Hughes TP, Folke C, Nystrom M (2004) Confronting the coral
reef crisis. Nature 429: 827–833.
215. Hawkins JP, Roberts CM, Clark V (2000) The threatened status of restricted-
range coral reef fish species. Anim Conserv 3: 81–88.
216. Selkoe KA, Halpern BS, Toonen RJ (2008) Evaluating and ranking the
vulnerability of regions within the Papahanaumokuakea Marine NationalMonument to anthropogenic threats. Aquat Conserv 18: 1149–1165.
217. Selkoe KA, Halpern BS, Ebert CM, Franklin E, Selig ER, et al. (2009) A mapof human impacts to a ‘‘pristine’’ coral reef ecosystem, the Papahanaumokua-
kea Marine National Monument. Coral Reefs 28: 635–650.
218. Buddemeier RW, Kleypas JA, Aronson RB (2004) Coral reefs and global
climate change: potential contributions of climate change to stresses on coralreef ecosystems. Arlington, Va.: Pew Center on Global Climate Change.
219. Hoegh-Guldberg O, Mumby PJ, Hooten AJ, Steneck RS, Greenfield P (2007)
Coral Reefs Under Rapid Climate Change and Ocean Acidification. Science318: 1737–1742.
220. NOAA (1988) West Coast of North America. Coastal and Ocean ZonesStrategic Assessment: Data Atlas. Rockville, Md.: NOAA, Ocean Assessments
Division. Strategic Assessment Branch; Northwest and Alaska Fisheries Center;James Dobbin Associates Incorporated.
221. PICES, North Pacific Marine Science Organization (2004) Marine ecosystemsof the North Pacific. PICES Special Publication 1: 280.
222. Risien J, ed (2009) West Coast Regional Marine Research and Information
Needs. Corvallis, Ore.: Oregon Sea Grant. 56 p.
223. Hayes D (2001) Historical Atlas of the North Pacific Ocean: Douglas &
McIntyre, Ltd., under auspices of North Pacific Marine Science Organization
(PICES). 224 p.
224. Carlton JT, ed (2007) The Light and Smith Manual: Intertidal Invertebrates
from Central California to Oregon, 4th Edition; Carlton JT, ed. Los Angeles:
University of California Press. 1001 p.
225. Kozloff EN (1996) Marine Invertebrates of the Pacific Northwest, revised.
Seattle/London: University of Washington Press. 539 p.
226. Ricketts EF, Calvin J, Hedgpeth JW, Phillips DW (1985) Between Pacific Tides,
5th edition. Stanford Stanford University Press. 652 p.
227. Lamb A, Hanby BP (2005) Marine Life of the Pacific Northwest: A
Photographic Encyclopedia of Invertebrates, Seaweeds and Selected Fishes.
Madeira ParkBritish Columbia: Harbour Publishing Co. Ltd. 398 p.
228. Stallcup R (1994) Ocean Birds of the North Pacific A Guide for the Sea-going
Naturalist. Stinson Beach, Calif: Point Reyes Bird Observatory. 214 p.
229. Lamb A, Edgell P (1986) Coastal Fishes of the Pacific Northwest. Madeira
ParkBritish Columbia: Harbour Publishing Co. Ltd. 224 p.
230. Ainley DG, Jones RE, Stallcup R, Long DJ, Page GW, et al. (1993) Beached
Marine Birds and Mammals of the North American West Coast: A Revised
Guide to their Census and Identification, with Supplemental Keys to Beached
Sea Turtles and Sharks. San Francisco: U.S. Dept. of Commerce, NOAA
Sanctuaries and Reserves Division, Gulf of the Farallones National Marine
Sanctuary. 236 p.
231. Harrison P (1983) Seabirds, an Identification Guide. Boston: Houghton Mifflin
Company. 448 p.
232. Jefferson TA, Webber MA, Pittman RL (2008) Marine Mammals of the World,
A Comprehensive Guide to Their Identification. Amsterdam/Boston: Aca-
demic Press. 573 p.
233. Perry RI, McKinnell SM, eds (2005) Marine life in the North Pacific Ocean:
the known, unknown and unknowable. PICES Special Publication 2: 46.
234. Crandall F, Norenburg J (2001) Checklist of the Nemertean Fauna of the
United States. Second Edition. pp 1–36.
235. Roe P, Norenburg JL, Maslakova SA (2007) Nemertea. In: Carlton J, ed. The
Light and Smith Manual: Intertidal Invertebrates from Central California to
Oregon, 4th Edition. pp 182–196.
236. National.Marine.Fisheries.Service.Southwest.Region (2009) Biological Opinion
and Conference Opinion on the long-term operations of the Central Valley
Project and State Water Project, Endangered Species Act Section 7
Consultation.
237. Lindley ST, Grimes CB, Mohr MS, Peterson W, Stein J, et al. (2009) What
caused the Sacramento River fall Chinook stock collapse? NOAA Technical
Memorandum NOAA-TM-NMFS-SWFSC-447.
238. Dextrase AJ, Mandrak NE (2006) Impacts of alien invasive species on
freshwater fauna at risk in Canada. Biol Invasions 8: 13–24.
239. Cohen AN, Carlton JT (1998) Accelerating Invasion Rate in a Highly Invaded
Estuary. Science 279: 555–558.
240. National Science and Technology Council Committee on Environment and
Natural Resources (2003) An Assessment of Coastal Hypoxia and Eutrophi-
cation in U.S. Waters. Washington, D.C.: National Science and Technology
Council. 74 p.
241. Diaz RJ, Rosenberg R (2008) Spreading Dead Zones and Consequences for
Marine Ecosystems. Science 321: 926–929.
242. Chan F, Barth JA, Lubchenco J, Kirincich A, Weeks H, et al. (2008)
Emergence of Anoxia in the California Current Large Marine Ecosystem.
Science 319: 920.
243. NRC, National Research Council, Committee on the Bering Sea Ecosystem
(1996) The Bering Sea ecosystem. Washington, D.C.: National Academy Press.
307 p.
244. Sherman K (1993) Large marine ecosystems as global units for marine
resources management an ecological perspective. In: Sherman K,
Alexander LM, Gold BD, eds. Large marine ecosystems Stress, mitigation,
and sustainability. Washington, D.C.: AAAS Press. pp 3–14.
245. Piatt JF, Springer AM (2007) Marine ecoregions of Alaska. In: Spies R, ed.
Long-term ecological change in the northern Gulf of Alaska: Elsevier. pp
522–526.
246. NPRB, North Pacific Research Board (2005) NPRB Science Plan of 2005.
AnchorageAlaska: North Pacific Research Board. 198 p.
247. Mundy P, ed (2005) The Gulf of Alaska: Biology and Oceanography. Alaska
Sea Grant College Program, University of Alaska Fairbanks. 214 p.
248. Spies R, ed (2007) Long-term ecological change in the northern Gulf of Alaska.
Amsterdam: Elsevier. 589 p.
249. Stabeno PJ, Kachel N, Mordy C, Righi D, Salo S (2008) An examination of the
physical variability around the Pribilof Islands in 2004. Deep Sea Res II 55:
1701–1716.
250. Heifetz J, Wing BL, Stone RP, Malecha PW, Courtney DL (2005) Corals of the
Aleutian Islands. Fish Oceanogr 14 (Suppl 1): 131–138.
251. Macklin SA, Hunt GL, Jr., eds (2004) The Southeast Bering Sea Ecosystem:
Implications for Marine Resource Management. Final Report: Southeast
Bering Sea Carrying Capacity. Silver Spring, Md.: NOAA Coastal Ocean
Program Decision Analysis Series No. 24. 192 p.
U.S. Marine Biodiversity
PLoS ONE | www.plosone.org 45 August 2010 | Volume 5 | Issue 8 | e11914

252. Hunt GL, Jr., Stabeno PJ, Strom S, Napp JM (2008) Patterns of spatial and
temporal variation in the marine ecosystem of the southeastern Bering Sea,
with special reference to the Pribilof Domain. Deep Sea Res II 55: 1919–1944.
253. Grebmeier JM, Cooper LW, Feder HM, Sirenko BI (2006) Ecosystem
dynamics of the Pacific-influenced northern Bering and Chukchi seas in the
Amerasian Arctic. Prog Oceanogr 71: 331–361.
254. O’Neill D (2004) The last giant of Beringia: The mystery of the Bering Land
Bridge. Boulder, Colo.: Westview Press. 231 p.
255. Grebmeier JM, Harvey HR, Stockwell DA (2009) The Western Arctic Shelf-
Basin Interactions (SBI) project, volume II: An overview. Deep Sea Res II 56:
1137–1143.
256. Ladd CL, Hunt GL, Jr., Mordy CW, Salo SA, Stabeno PJ (2005) Marine
environment of the eastern and central Aleutian Islands. Fisheries Oceanog-
raphy 14: 22–30.
257. Gradinger R (2008) Sea-ice algae: Major contributors to primary production
and algal biomass in the Chukchi and Beaufort Seas during May/June 2002.
Deep-Sea Res II 56(17): 1201–1212.
258. Stroeve J, Holland MM, Meier W, Scambos T, Serreze M (2007) Arctic sea ice
decline: Faster than forecast. Geophys Res Lett 34.
259. ACIA, Arctic Climate Impact Assessment (2005) Arctic Climate Impact
Assessment: Scientific Report. Cambridge: Cambridge University Press.
1042 p.
260. Naidu AS (1988) Marine surficial sediments. Section 1.4. In: Bering, Chukchi
and Beaufort Seas: coastal and ocean zones strategic assessment data atlas.
Washington, D.C.: NOAA Strategic Assessment Branch, Ocean Assessment
Division.
261. Dunton KH, Schonberg SV (2000) The benthic faunal assemblage of the
Boulder Patch kelp community. In: Truett JC, Johnson SR, eds. The natural
history of an arctic oil field. New York: Academic Press. pp 371–397.
262. Bluhm BA, Gradinger R (2008) Regional variability in food availability for
arctic marine mammals. Ecol Appl 18: Supplement S77–S96.
263. Arctic Council (2009) Arctic Marine Shipping Assessment 2009 Report.
Tromsø, Norway: Arctic Council. 188 p.
264. Litwin TS, ed (2005) The Harriman Alaska Expedition retraced: a century of
change, 1899-2001. Rutgers University Press. 287 p.
265. Coe WR (1910) Nemertians. Harriman Alaska Series Vol XI. Washington,
D.C.: Smithsonian Inst. 251 p.
266. Robertson A (1910) Bryozoans. Harriman Alaska Series Vol XI. Washington,
D.C.: Smithsonian Institution. 251 p.
267. Verrill AE (1914) Monograph of the shallow-water starfishes of the North
Pacific Coast from the Arctic Ocean to California. Harriman Alaska Series Vol
XIV. Washington, D.C.: Smithsonian Institution. 408 p.
268. Coyle KO, Chavtur VG, Pinchuk AI (1996) Zooplankton of the Bering Sea: A
review of Russian-language literature. In: Mathisen OA, Coyle KO, eds.
Ecology of the Bering Sea A review of Russian literature Alaska Sea Grant
College Program Report No 96-01. Fairbanks, Alaska: University of Alaska. pp
97–133.
269. Hood DW (1986) Chapter 1. Physical setting and scientific history. In: Hood D,
Zimmerman S, eds. Gulf of Alaska: physical environment and biological
resources. Washington, D.C.: NOAA Ocean Assessments Division, Alaska
Office. pp 5–27.
270. Sirenko BI, Gagaev SY (2007) Unusual abundance of macrobenthos and
biological invasions in the Chukchi Sea. Russ J Mar Biol 33: 355–364.
271. Hopcroft R, Bluhm B, Gradinger R, eds (2008) Arctic Ocean synthesis: Anal-
ysis of climate change impacts in the Chukchi and Beaufort seas with strategies
for future research. Final report for project 503 for North Pacific Research
Board. Institute of Marine Sciences, University of Alaska Fairbanks. http://
doc.nprb.org/web/05_prjs/503_final.pdf.
272. Piepenburg D (2005) Recent research on Arctic benthos: common notions need
to be revised. Polar Biol 28: 733–755.
273. Grebmeier JM, Harvey HR (2005) The Western Arctic Shelf–Basin
Interactions (SBI) project: An overview. Deep Sea Res II 52: 3109–3115.
274. Bluhm BA, Gradinger R, Huttmann F, Hopcroft RR, Gebruk A, et al. (2008)
Arctic Ocean Diversity – A Census of Marine Life project in the Arctic.
Biologie in Unserer Zeit (in German) 38: 40–49.
275. Iken K, Konar B, eds (2003) Proceedings of the Arctic Biodiversity Workshop:
New Census of Marine Life Initiative; 2003. Fairbanks, Alaska. Alaska Sea
Grant College program, University of Alaska Fairbanks. 162 p.
276. Coyle KO, Pinchuk AI (2003) Annual cycle of zooplankton abundance,
biomass and production on the northern Gulf of Alaska shelf, October 1997
through October 2000. Fish Oceanogr 12: 227–251.
277. Coyle KO, Pinchuk AI (2005) Cross-shelf distribution of zooplankton relative
to water masses on the northern Gulf of Alaska shelf. Deep-Sea Res II 52:
217–245.
278. NOAA, National Oceanic and Atmospheric Administration (2008) Cruise
report for the 2008 Beaufort Sea Survey, July 27-August 30, 2008, F/V Ocean
Explorer. Preliminary report from NOAA NMFS Alaska Fisheries Science
Center and Minerals Management Service Alaska OCS Region. 18 p.
279. Sirenko BI (2001) List of species of free-living invertebrates of Eurasian Arctic
seas and adjacent deep waters. Explorations of the Fauna of the Seas 51(59).
280. Vassilenko SV, Petryashov VV, eds (2009) Illustrated keys to free-living
invertebrates of Eurasian Arctic seas and adjacent deep waters, Vol. 1.
Rotifera, Pycnogonida, Cirripedia, Leptostraca, Mysidacea, Hyperiidea,
Caprellidea, Euphausiasea, Dendrobranchiata, Pleocyemata, Anomura, andBrachyura. Alaska Sea Grant, University of Alaska Fairbanks. 186 p.
281. Bluhm BA, Iken K, Hopcroft RR (2009) Observations and exploration of the
Arctic’s Canada Basin and the Chukchi Sea: the Hidden Ocean andRUSALCA expeditions. Deep-Sea Res II 57(1-2): 1–4.
282. Atlas RM, Griffiths RP (1986) Chapter 8. Microbiology. In: Hood D,Zimmerman S, eds. Gulf of Alaska, physical environment and biological
resources. Washington, D.C.: NOAA Ocean Assessments Division, Alaska
Office. pp 221–246.
283. Bano N, Hollibaugh JT (2002) Phylogenetic composition of bacterioplankton
assemblages from the Arctic Ocean. Appl Environ Microbiol 68: 505–518.
284. Lindstrom SC (2006) Biogeography of Alaskan seaweeds. J App Phycol 18:
637–641.
285. Kawai H, Hanyuda T, Lindeberg M, Lindstrom SC (2008) Morphology andmolecular phylogeny of Aureophycus aleuticus GEN. ET SP. NOV.
(Laminariales, Phaeophyceae) from the Aleutian Islands. J Phycol 44:1013–1021.
286. Lindstrom SC (2009) The biogeography of seaweeds in Southeast Alaska.
J Biogeogr 36: 401–409.
287. Wiencke C, Clayton MN, Gomez I, Iken K, Luder UH, et al. (2006) Life
strategy, ecophysiology and ecology of seaweeds in polar waters. Reviews in
Environmental Sciences and Biotechnology 6: 95–126.
288. Sambrotto RN, Lorenzen CJ (1986) Chapter 9. Phytoplankton and primary
production. In: Hood D, Zimmerman S, eds. Gulf of Alaska, physicalenvironment and biological resources. Washington, D.C.: NOAA Ocean
Assessments Division, Alaska Office. pp 249–282.
289. Cooney RT (1986) Chapter 10. Zooplankton. In: Hood D, Zimmerman S, eds.Gulf of Alaska, physical environment and biological resources. Washington,
D.C.: NOAA Ocean Assessments Division, Alaska Office. pp 285–303.
290. Cooney RT (1981) Bering Sea zooplankton and micronekton communities with
emphasis on annual production. In: Hood DW, Calder JA, eds. The eastern
Bering Sea shelf: Oceanography and Resources Vol. 2. Seattle: University ofWashington Press. pp 947–974.
291. Motoda S, Minoda T (1974) Plankton of the Bering Sea. In: Hood DW,Kelley EJ, eds. Oceanography of the Bering Sea with emphasis on renewable
resources, Institute of Marine Sciences, University of Alaska Fairbanks. pp
207–241.
292. Hopcroft RR (2002) Spineless wonders: The pelagic fauna. NOAA Ocean
Explorer: Exploration at http://www.oceanexplorer.noaa.gov/explorations/02arctic/background/fauna/fauna.html.
293. Kosobokova KN, Hopcroft RR (in press) Diversity and vertical distribution of
mesozooplankton in the Arctic’s Canada Basin. Deep Sea Res II.
294. Horner RA (1985) Sea ice biota. Boca Raton, FL: CRC Press. 215 p.
295. Quillfeldt CH, Ambrose WG, Clough LM (2003) High number of diatom
species in first-year ice from the Chukchi Sea. Polar Biol 26: 806–818.
296. Stoker SW (1978) Benthic invertebrate macrofauna of the eastern continental
shelf of the Bering and Chukchi Seas. Ph.D. Thesis: University of AlaskaFairbanks. 259 p.
297. Jewett SC, Feder HM (1981) Epifaunal invertebrates of the continental shelf of
the eastern Bering Sea and Chukchi Seas. In: Hood DW, Calder JA, eds. Theeastern Bering Sea shelf: Oceanography and Resources Vol. 2. Seattle:
University of Washington Press. pp 1131–1153.
298. Feder HM, Jewett SC (1986) Chapter 12. The subtidal benthos. In: Hood D,
Zimmerman S, eds. Gulf of Alaska: physical environment and biological
resources. Washington, D.C.: NOAA Ocean Assessments Division, AlaskaOffice. pp 347–396.
299. Foster NR (2003) Database on the marine invertebrate macrofauna of PrinceWilliam Sound: An addition to the University of Alaska Museum’s ARCTOS
Network. Exxon Valdez Oil Spill Gulf of Alaska Monitoring and Research
Project 030642 Final Report.
300. Feder HM, Jewett SC, Blanchard AL (2005) Southeastern Chukchi Sea
(Alaska) epibenthos. Polar Biol 28: 402–421.
301. Feder HM, Jewett SC, Blanchard AL (2007) Southeastern Chukchi Sea(Alaska) macrobenthos. Polar Biol 30: 261–275.
302. Chapman AS, Kostylev VE (2008) Distribution, abundance and diversity ofbenthic species from the Beaufort Sea and western Amundsen Gulf – a
summary of data collected between 1951 and 2000. Geological Survey of
Canada. Open File 5685: 47.
303. Sirenko BI, Piepenburg D (1994) Current knowledge on biodiversity and faunal
zonation patterns of the shelf of the seas of the Eurasian Arctic, with specialreference to the Laptev Sea. Reports on Polar Research 144: 69–74.
304. Sirenko BI, Vassilenko SV, eds (2009) Fauna and zoogeography of benthos of
the Chukchi Sea. Explorations of the Fauna of the Seas 61(69): 1–230.
305. MacDonald IR, Bluhm B, Iken K, Gagaev S, Strong S (in press) Benthic
macrofaunal and megafaunal assemblages in the Arctic deep-sea CanadaBasin. Deep Sea Res II.
306. Mecklenburg CW, Mecklenburg TA, Thorsteinson LK (2002) Fishes of Alaska.
Bethesda, Md: American Fisheries Society. 1116 p.
307. OCSEAP (1986) Chapter 14. Marine Fisheries: Resources and Environments.
In: Hood D, Zimmerman S, eds. Gulf of Alaska, physical environment andbiological resources. Washington, D.C.: NOAA Ocean Assessments Division,
Alaska Office. pp 417–458.
308. Wilimovsky NJ (1974) Fishes of the Bering Sea: The state of existing knowledgeand requirements for future effective effort. In: Hood DW, Kelley EJ, eds.
U.S. Marine Biodiversity
PLoS ONE | www.plosone.org 46 August 2010 | Volume 5 | Issue 8 | e11914

Oceanography of the Bering Sea with emphasis on renewable resources
Institute of Marine Sciences, University of Alaska Fairbanks. pp 243–256.309. Logerwell EA, Aydin K, Barbeaux S, Brown E, Conners ME, et al. (2005)
Geographic patterns in the demersal ichthyofauna of the Aleutian Islands. Fish
Oceanogr 14: 93–112.310. Mecklenburg CW, Norcross BL, Holladay BA, Mecklenburg TA (2008) Fishes.
In: Hopcroft R, Bluhm B, Gradinger R, eds. Arctic Ocean synthesis: Analysisof climate change impacts in the Chukchi and Beaufort seas with strategies for
future research Final report for project 503 for North Pacific Research Board
Institute of Marine Sciences, University of Alaska Fairbanks, http://doc.nprb.org/web/05_prjs/503_final.pdf.
311. Andriashev AP, Chernova NV (1995) Annotated list of fishlike vertebrates andfish of the Arctic seas and adjacent waters. J Ichthyol 35(1): 81–123.
312. Angliss RP, Allen BM (2009) Alaska marine mammal stock assessments, 2008.NOAA Tech. Memo NMFS-AFSC-193. U.S. Department of Commerce.
258 p.
313. Hunt GL, Jr., Gould PJ, Forsell DJ, Peterson H, Jr. (1981) Pelagic distributionof marine birds in the eastern Bering Sea. In: Hood DW, Calder JA, eds. The
eastern Bering Sea shelf: Oceanography and Resources Vol. 2. Seattle:University of Washington Press. pp 689–718.
314. Gill RE, Handel CH (1981) Shorebirds of the eastern Bering Sea. In:
Hood DW, Calder JA, eds. The eastern Bering Sea shelf: Oceanography andResources Vol. 2. Seattle: University of Washington Press. pp 719–738.
315. Springer A, Byrd V, Divoky G, Murphy E, Petersen M, et al. (2008) ArcticOcean synthesis: Analysis of climate change impacts in the Chukchi and
Beaufort seas with strategies for future research. In: Hopcroft R, Bluhm B,Gradinger R, eds. Final report for project 503 for North Pacific Research
Board Institute of Marine Sciences University of Alaska Fairbanks, Available at
http://doc.nprb.org/web/05_prjs/503_final.pdf.316. Hodge RP, Wing BL (2000) Occurrences of marine turtles in Alaska waters
1960-1998. Herpetol Rev 31(3): 148–151.317. NPFMC, North Pacific Fishery Management Council (2008) Stock assessment
and fishery evaluation reports for groundfish resources off Alaska.December
2008 Anchorage, Alaska: North Pacific Fishery Management Council.318. Konar B, Iken K, Edwards M (2009) Depth-stratified community zonation
patterns on Gulf of Alaska rocky shores. Mar Ecol 30: 63–73.319. Witherell D, Woodby D (2005) Application of marine protected areas for
sustainable production and marine biodiversity off Alaska. Mar Fish Rev 67:1–27.
320. Iken K, Konar B (2009) Essential Habitats in our Arctic front yard: Nearshore
benthic community structure. Final Report to Alaska Sea Grant. 11 p.321. Bluhm BA, Gradinger R, Schnack-Schiel SB (in press) Sea ice meio- and
macrofauna. In: Thomas DN, Dieckmann GS, eds. Sea ice 2nd edition: Wiley-Blackwell.
322. Gradinger R, Bluhm B, Hopcroft R, Gebruk A, Kosobokova KN, et al.
(accepted), Chapter 10. Marine Life in the Arctic. In: MacIntyre A, ed. Life inthe World’s Oceans: Diversity, Distribution and Abundance. Wiley-Blackwell.
323. Lane CE, Mayes C, Druehl LD, Saunders GW (2006) A multi-gene molecularinvestigation of the kelp (Laminariales, Phaeophyceae) supports substantial
taxonomic re-organization. J Phycol 42: 493–512.324. Lane CE, Lindstrom SC, Saunders GW (2007) A molecular assessment of
northeast Pacific Alaria species (Laminariales, Phaeophyceae) with reference to
the utility of DNA barcoding. Mol Phylogen Evol 44: 634–648.325. Wynne MJ (2009) Marine algae and early explorations in the upper North
Pacific and Bering Sea. Algae 24: 1–29.326. Usher MB (2005) Chapter 10.Principles of Conserving the Arctic’s Biodiversity.
Arctic Climate Impact Assessment 2005 Cambridge University Press. 1042 p.
327. Carroll ML, Carroll J (2003) The Arctic Seas. In: Black KD, Shimmield GB,eds. Biogeochemistry of marine systems: Blackwell Publishing.
328. Leong H (2005) Chapter 9. Marine Systems. Arctic Climate Impact Assessment2005 Cambridge University Press. 1042 p.
329. Hunt GL, Jr., Stabeno PJ, Strom S, Napp JM (2008) Patterns of spatial and
temporal variation in the marine ecosystem of the southeastern Bering Sea,with special reference to the Pribilof Domain. Deep-Sea Res II 55: 1919–1944.
330. Hunt Jr. GL, Stabeno P, Walters G, Sinclair E, Brodeur RD, et al. (2002)Climate change and control of the southeastern Bering Sea pelagic ecosystem.
Deep Sea Res II 49: 5821–5853.331. Grebmeier JM, Overland JE, Moore SE, Farley EV, Carmack EC, et al. (2006)
A major ecosystem shift observed in the northern Bering Sea. Science 311:
1461–1464.
332. Lane PVZ, Llinas L, Smith SL, Pilz D (2007) Zooplankton distribution in the
western Arctic during summer 2002: Hydrographic habitats and implicationsfor food chain dynamics. J Marine Syst 70: 97–103.
333. Orensanz JM, Ernst B, Armstrong DA, Stabeno P, Livingston P (2004)
Contraction of the geographic range of distribution of snow crab (Chionoecetes
opilio) in the eastern Bering Sea: An environmental ratchet? CalCOFI Rep 45:
65–79.334. Mueter FJ, Litzow MA (2008) Sea ice retreat alters the biogeography of the
Bering Sea continental shelf. Ecol Appl 18: 309–320.
335. Laidre KL, Stirling I, Lowry L, Wiig Ø, Heide-Jørgensen MP, et al. (2008)Quantifying the sensitivity of arctic marine mammals to climate-induced
habitat change. Ecol Appl 18(2): S97–S125.336. Metcalf V, Robards M (2008) Sustaining a healthy human-walrus relationship
in a dynamic environment: Challenges for comanagement. Ecol Appl 18(2)Supplement: 148–156.
337. Jay VJ, Fischbach AS, Douglas DC (2008) Distributional response of Pacific
walruses in the eastern Chukchi Sea to the extreme summer sea ice retreat in2007. Abstract for Alaska Marine Science Symposium, January 2008.
Anchorage, Alaska.338. NPFMC, North Pacific Fishery Management Council (2009) Environmental
Assessment/Regulatory Impact Review/Initial Regulatory Flexibility Analysis
for the Arctic Fishery Management Plan and Amendment 29 to the FisheryManagement Plan for Bering Sea/Aleutian Islands King and Tanner Crabs.
January 2009. Anchorage, Alaska: North Pacific Fishery Management Council.351 p.
339. Smith WO, Jr., Barber DG (2007) Benthic processes in polynas. ElsevierOceanography Series 74: 363–390.
340. Cooley SR, Doney SC (2009) Anticipating ocean acidification’s economic
consequences for commercial fisheries. Environ Res Lett 4 (1 June 2009).341. Hester KC, Peltzer ET, Kirkwood WJ, Brewer PG (2008) Unanticipated
consequences of ocean acidification: A noisier ocean at lower pH. Geophys ResLett 35: L19601.
342. Vongraven D (2008) Background Paper: Circumpolar Marine Biodiversity
Monitoring Program (Version 12). Marine Export Monitoring GroupNorwegian Polar Institute. 67 p.
343. Konar B, Iken K (2009) Influence of taxonomic resolution and morphologicalfunctional groups in multivariate analyses of macroalgal assemblages.
Phycologia 48: 24–31.344. Konar B, Riosmena-Rodriguez R, Iken K (2006) Rhodolith bed. A newly
discovered habitat in the North Pacific Ocean. Bot Mar 49: 355–359.
345. Gradinger R, Bluhm B (2005) Susceptibility of sea ice biota to disturbances inthe shallow Beaufort Sea: Phase 1: Biological coupling of sea ice with the
pelagic and benthic realms, Final Report. OCS Study MMS 2005-062University of Alaska Fairbanks Coastal Marine Institute.
346. Bluhm BA, Gradinger R, Piraino S (2007) First record of sympagic hydroids
(Hydrozoa, Cnidaria) in Arctic coastal fast ice. Polar Biol 30: 1557–1563.347. Piraino S, Bluhm BA, Gradinger R, Boero F (2008) Sympagohydra tuuli gen. nov.
and sp. nov. (Cnidaria: Hydrozoa) a cool hydroid from the Arctic sea ice. J MarBiol Assoc UK 88: 1637–1641.
348. Gradinger R, Bluhm BA, Iken K (accepted) Arctic sea ice ridges – safe heavensfor sea ice fauna during periods of extreme ice melt? Deep-Sea Res II.
349. Raskoff KA, Hopcroft RR, Kosobokova KN, Youngbluth MJ, Purcell JE (in
press) Jellies under ice: ROV observations from the Arctic 2005 Hidden OceanExpedition. Deep Sea Res II.
350. Bluhm BA, MacDonald IR, Debenham C, Iken K (2005) Macro- andmegabenthic communities in the high Arctic Canada Basin: initial findings.
Polar Biol (spec issue) 28: 218–231.
351. Gagaev SY (2008) Sigambra healyae sp. n., a new species of polychaete(Polychaeta: Pilargidae) from the Canadian Basin of the Arctic Ocean.
Russ J Mar Biol 34: 73–75.352. Mecklenburg CW, Stein DL, Sheiko BA, Chernova NV, Mecklenburg TA,
et al. (2007) Russian-American Long-term Census of the Arctic: benthic
fisheries trawled in the Chukchi Sea and Bering Strait, August 2004.Northwestern Nat 88: 168–187.
353. Eschmeyer WN, ed (1998) Catalog of fishes. San Francisco: CaliforniaAcademy of Sciences. 2,905 p.
354. Sogin ML, Morrison HG, Huber JA, Welch DM, Huse SM, et al. (2006)Microbial diversity in the deep sea and the underexplored ‘‘rare biosphere’’.
Proc Nat Acad Sci 103: 12115–12120.
355. Magurran AE (2003) Measuring biological diversity. Oxford: Blackwell. 260 p.
U.S. Marine Biodiversity
PLoS ONE | www.plosone.org 47 August 2010 | Volume 5 | Issue 8 | e11914