An Investigative Relationship between Efforts-Rewards Model and Job Stress in Private Educational...
10
42 An Investigative Relationship between Efforts-Rewards Model and Job Stress in Private Educational Institutions: A Validation Study Saif ur Rehman Federal Government College of Commerce Sector H-8/4 Islamabad, Pakistan E-mail: [email protected] Muhammad Aslam Khan Faculty of Business Administration, Preston University Islamabad, Pakistan E-mail: [email protected] Hasan Afzal Independent Researcher, Hong Kong 1903 Un Shing House Un Chau Estate Cheung Sha Wan, Kowloon, Hong Kong E-mail: [email protected] Abstract The aim of this study was to provide the reliability and validity of new four quadrant model of the 30-item efforts–rewards questionnaire and to analyze its association with job stress and employees turnover intention in a sample of private educational institutions. A self reported survey was conducted, in private educational institutions, among 180 teachers. Appropriate internal consistencies of the four scales: efforts, rewards, job stress and turnover intention, were obtained. Zero-order correlation and regressions analysis replicated the theoretically assumed structure of the efforts-reward model (ERM) construct in men and women collectively. Evidence of criterion validity was obtained from cross-correlations of the scales and from their linear, multiple and hierarchical regression analysis. Finally, all four scales were associated with a highly significant ratio of job stress, and the effect was strongest for the ERM ratio as predicted by fundamental theory. Based on the results of this study, the four quadrant version of the ERM, questionnaire is considered a reliable and valid instrument for measuring psychosocial stress at work environment. It is applicable to all services and manufacturing industries. The findings from this study strongly supported this theory of efforts and rewards. We found a high percentage of teachers with both job stress and dissatisfaction and an imbalance characterized by high effort and low reward in their professional life. This work environment obviously calls for preventive measures. Keywords: Efforts-Rewards Model, Job reward, Job efforts, Job stress, Educational institutions 1. Background of Study The Effort-Reward Model (ERM) dates back to the late Siegrist et al., (1986), presented a job dissatisfaction model according to which mental stress and dissatisfaction result from the interaction of job efforts and job rewards. Likewise, the model has been used in organizational intervention studies as well (Tsutsumi & Kawakami, 2004). The ERM Model has its origin in medical sociology and emphasizes both the job efforts and the job rewards structure of work environment (Marmot, Siegrist, & Theorell, 2006). According to their model, work-related benefits depend upon a reciprocal relationship between job efforts and job rewards at work place. Job efforts represent job obligations that are imposed on the employee to perform his/her duty to meet the requirements. Job rewards distributed by the employer consist of money, esteem, and job security/ career development. This model predicts that mental dissatisfaction and job dissatisfaction are the combination of high job efforts with low job rewards. Therefore, four types of jobs predicts through this model which
-
Upload
independent -
Category
Documents
-
view
1 -
download
0
Transcript of An Investigative Relationship between Efforts-Rewards Model and Job Stress in Private Educational...
Vol. 5, No. 3 International Journal of Business and Management
42
An Investigative Relationship between Efforts-Rewards Model and Job
Stress in Private Educational Institutions: A Validation Study
Saif ur Rehman Federal Government College of Commerce
Sector H-8/4 Islamabad, Pakistan E-mail: [email protected]
Muhammad Aslam Khan
Faculty of Business Administration, Preston University Islamabad, Pakistan
E-mail: [email protected]
Hasan Afzal Independent Researcher, Hong Kong
1903 Un Shing House Un Chau Estate Cheung Sha Wan, Kowloon, Hong Kong
E-mail: [email protected]
Abstract The aim of this study was to provide the reliability and validity of new four quadrant model of the 30-item efforts–rewards questionnaire and to analyze its association with job stress and employees turnover intention in a sample of private educational institutions. A self reported survey was conducted, in private educational institutions, among 180 teachers. Appropriate internal consistencies of the four scales: efforts, rewards, job stress and turnover intention, were obtained. Zero-order correlation and regressions analysis replicated the theoretically assumed structure of the efforts-reward model (ERM) construct in men and women collectively. Evidence of criterion validity was obtained from cross-correlations of the scales and from their linear, multiple and hierarchical regression analysis. Finally, all four scales were associated with a highly significant ratio of job stress, and the effect was strongest for the ERM ratio as predicted by fundamental theory. Based on the results of this study, the four quadrant version of the ERM, questionnaire is considered a reliable and valid instrument for measuring psychosocial stress at work environment. It is applicable to all services and manufacturing industries. The findings from this study strongly supported this theory of efforts and rewards. We found a high percentage of teachers with both job stress and dissatisfaction and an imbalance characterized by high effort and low reward in their professional life. This work environment obviously calls for preventive measures. Keywords: Efforts-Rewards Model, Job reward, Job efforts, Job stress, Educational institutions 1. Background of Study The Effort-Reward Model (ERM) dates back to the late Siegrist et al., (1986), presented a job dissatisfaction model according to which mental stress and dissatisfaction result from the interaction of job efforts and job rewards. Likewise, the model has been used in organizational intervention studies as well (Tsutsumi & Kawakami, 2004). The ERM Model has its origin in medical sociology and emphasizes both the job efforts and the job rewards structure of work environment (Marmot, Siegrist, & Theorell, 2006). According to their model, work-related benefits depend upon a reciprocal relationship between job efforts and job rewards at work place. Job efforts represent job obligations that are imposed on the employee to perform his/her duty to meet the requirements. Job rewards distributed by the employer consist of money, esteem, and job security/ career development. This model predicts that mental dissatisfaction and job dissatisfaction are the combination of high job efforts with low job rewards. Therefore, four types of jobs predicts through this model which
International Journal of Business and Management March, 2010
43
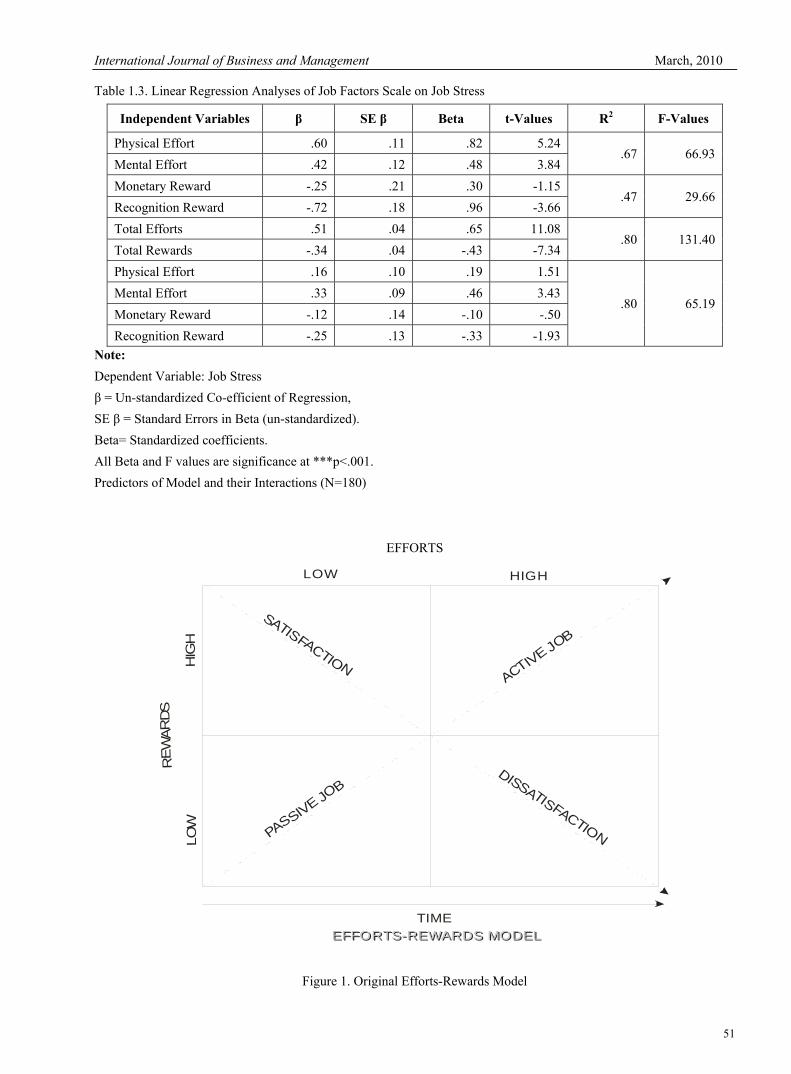
might result from different combinations of job efforts and job rewards: passive jobs (low job efforts and low job rewards), active jobs (both high efforts and high rewards), job satisfaction (low efforts and high job rewards) and high dissatisfaction jobs (high job efforts and low job rewards). The given below four diagonals in the figure within one model represent two interactions situations in which job efforts and job rewards deviate: low-high combination, low-low combination, and some situations in which they are matched high-high combination. According to Siegrist et al. (2004), the first condition, when job efforts are relatively higher than job rewards results high dissatisfaction job, is of primary importance in conducting research study. Furthermore, passive jobs are dissatisfying job, whilst active jobs are associated with more satisfaction and reduced depression of employees, even if they are more challenging. Similarly, an active job is associated with outcomes such as job motivation, job involvement, learning, personal growth, job participation and job innovation. The following model illustrates the core concept of Marmot, Siegrist, Tores Theorell, & Feeney, (1999), Siegrist et al (2004) Efforts-Rewards Model. (Figure 1 insert here) The given model encompasses a succeeding theoretical prediction concerning the diagonal running from passive to active jobs and stepping down from satisfaction to dissatisfaction. Therefore, self-styled active jobs, which have high levels of both job efforts and job rewards, challenge their stakeholders, and give confidence to these individuals to develop competencies, locus of control, acquire supports and exercise talents that may otherwise remain dormant. Those employees who have these positions find that the challenges (efforts) attached with their jobs are corresponding by equivalent levels of rewards, and consequently these employees become more actively involved in a range of steady growing professionally and individually, and providing quality output to their organization. On the other hand, those employees who have passive jobs come across few challenges (job efforts) and so become gradually less involved in job and in other activities of organization. Eventually, Siegrist et al. (2004) predicted that low levels of job rewards have two sets of potential consequences - psychological dissatisfaction, if efforts are high and passive withdrawal, if efforts are low. Data analysis is included self-report procedures of job efforts (stressors), job rewards (real wages), and job dissatisfaction (exhaustion, depression, dissatisfaction, behavioral outcomes, etc.). Job efforts placed depend upon work pace and meeting deadlines, while the job rewards (real wages) classified into three mechanisms: personal financial need, personal social needs, and personal esteem on and off the work environment. These research findings as a result support our hypothesis that the relationship between job efforts and job rewards contributes to the prediction of level of job satisfaction and dissatisfaction. This study was a cross-sectional, self-report questionnaire of random samples of 180 employees of private educational institutions of Rawalpindi. The following hypotheses were tested:
H1. Job efforts are positively related to respondent ratings of job stress. H2. Job rewards are negatively related to job stress. H3. The combination of job efforts and job rewards predicts levels of job stress better than does either main
effect alone 2. Methods In this study, two different private educational set up in Rawalpindi, Pakistan, were surveyed; one was Punjab Group of Colleges and another was Siddeeq Public School System. Questionnaires were sent to all 200 teachers in the schools and colleges of the two educational groups and were returned by 180 teachers. The response rates were 90% (180/200). Mean working time was 3.4 years (SD = 1.5). Demographics showed that 60% of the respondents were male, and mean age was 28 years (SD = 8.7, range 25–40). The response rate and reliability did not differ significantly from the remaining participants in socio-demographic and work related characteristics. This study was approved by the Directors of respective groups of educational institution. Questionnaires contained an administration number for organizational-wise identification (which was only known to the researchers) and could be returned directly to researcher in sealed envelopes. The 30-item ERM questionnaire consists of four scales and is developed with addition of 7 questions in original 23-items questionnaire of Siegrist et al (2004). The four scales are termed physical and mental efforts (10 items), monetary and recognition rewards (10 items, including money, esteem, job security, job participation and promotion prospects), job stress (7 items), and employee’s turnover intention (3 items). Responses to all the items of job efforts, job rewards, job stress and employees’ turnover intention are scored on a 5-point scale (1 = strongly disagree and 5 = strongly agree with the statement). Consequently, with such a scoring, the range for the scale ‘job effort’ is 1A to 10A, for the scale ‘job reward’ 1B to 10B, for the scale of ‘job stress’ 1C to 7C and for the scale ‘employees’ turnover intention’ 8C & 10C (see Appendix 1.1). Furthermore, total efforts scales were measured by ten items with contents varies from physical load, time pressure, interruptions, responsibility, working overtime, to increasing demands, and repetitive work. Example items are: “I have constant time pressure due to a heavy workload,” and “I have a lot of responsibility in my job." Internal reliability of the job effort scale, expressed by Cronbach’s alpha, was satisfactory in this sample i.e. α = 0.78. Total rewards were assessed by 10 items with a 5-point rating scale, which were coded in same direction afterward. This scale was composed
Vol. 5, No. 3 International Journal of Business and Management
44
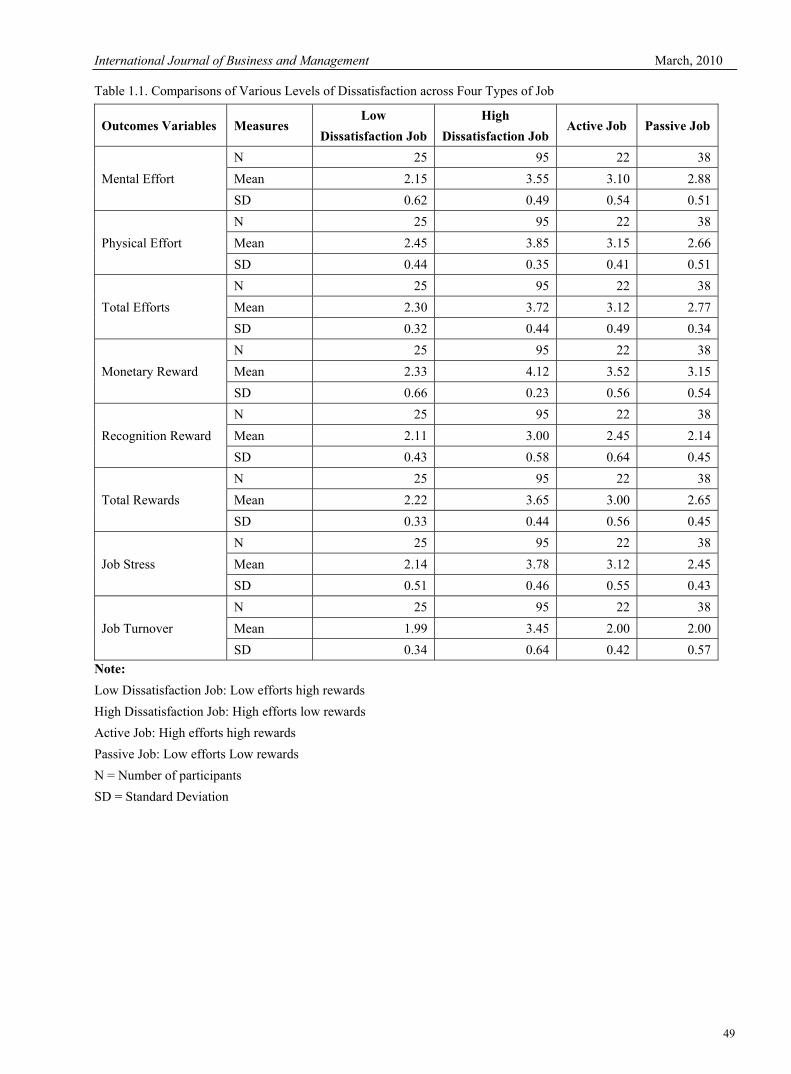
of three components, i.e., monetary rewards (2 items, e.g., “Considering all my efforts and achievements my salary/income is adequate”) career-related aspects (3 items, e.g., “My job promotion prospects are good”), job security (1 item, e.g., “My job security is good”) and recognition rewards (4 item, e.g., “I receive the respect I deserve from my colleagues”). Cronbach’s alpha of the composite rewards scale (10 items) was good in this samples (α= 0.81). Job stress was measured by eight items with rating scales ranging from 1 (strongly disagree) to 5 (strongly agree). The items consist of inability or uncontrollability to and of impatience and disproportionate irritability. Example items are: “When I get home, I can not relax and switch off’ work,” and “As soon as I get up in the morning I start thinking about work problems.” Cronbach’s alpha of this scale was satisfactory in Sample 1 (α = 0.72). Employees’ turnover intention was measured by two items with rating scales ranging from 1 (strongly disagree) to 5 (strongly agree). The items consist of intention to withdraw from work and of impatience and disproportionate irritability. Example items are: “I feel a great deal of stress because of my job,” and “Over the past month, I have seriously thought about making a real effort to enter a new and different occupation/Origination.” Cronbach’s alpha of this scale was satisfactory in Sample 1 (α = 0.69). According to Siegrist et al (2004) a ratio between the two jobs factor scales ‘job efforts’ and ‘job rewards’ are calculated to quantify the degree of mismatch between high costs and low gain. Therefore, this questionnaire is developed to moderate the Sigrist (1996; 2004) and Tseng and Cheng (2002) questionnaires to meet the requirement of new model. More specifically, the ERM questionnaire claims that work characterized by both job efforts and job rewards represents a reciprocity deficit/surplus between “costs” and “gains,” which could elicit positive/negative emotions among on job employees. The accompanying feelings may produce satisfaction or dissatisfaction reactions as predicted in the given model. Some assumptions of the ER Model concerns individual differences (personality traits) in the experience of effort-reward imbalance. In fact some employees characterized by a motivational pattern of high job-related commitment and a high need for recognition and rewards will respond with more dissatisfaction reactions to an job effort-job reward imbalance, in comparison with less committed employees (Siegrist, 1996; 2004). 3. Results and Discussion 3.1 Evaluation of Original Model Accumulated empirical evidence suggested a job dissatisfaction model, according to which various outcomes of dissatisfaction are result from the interaction of job efforts and job rewards. This original model predicts that mental dissatisfaction and job dissatisfaction are the combination of high job efforts with low job rewards. This study is critically evaluated (Siegrist, 1996; 2004) original presentation of the job dissatisfaction model in the form of comparisons between groups of workers broken down by levels of job efforts and/or job rewards. Similar analyses are performed on the current data set. Current analyses using the total job factor scales only are reported. Groups with higher efforts and low rewards reported greater levels of stress on immediate and remote outcomes of dissatisfaction (see Table 1.1). These findings provide strong support to four quadrant original model. Similar analyses are performed using sub-groups determined by levels of total rewards on various outcomes. The effect of low efforts and greater rewards on outcomes of stress is highly significant when two levels of rewards are used to form sub-groups. These findings generally support hypotheses 2 (rewards on stress). Furthermore, Table 1.1 shows total efforts and total rewards scales used to assign participants to “high” and “low” groups on each job factor, and these are combined to form four groups representing all possible combinations of high and low efforts and rewards levels. Validity tests for possible additive effects are conducted (by SPSS) by comparing mean levels of these groups. Analyses that examined the effects on outcomes of dissatisfaction provided a direct test of original four-quadrant model of job factors. As can be seen from the sub-group high amd low means and standard deviation tests given in Table 1.1, there are clear trends in the expected direction, that is, participants employed in high efforts/low rewards (high dissatisfaction and high means values) jobs reported the highest levels of job stress, dissatisfaction outcomes, whilst those in low efforts/high rewards jobs reported fewest stressors and least dissatisfaction (low means values). Table 1.1 shows that the pattern of group means from lowest levels of dissatisfaction outcomes in low efforts/high rewards jobs, to highest levels of dissatisfaction in high efforts/low rewards jobs, are consistent with the ideas of stress researchers. (Table 1.1 insert here) In these cases, means values varied in the predicted order (highest means values in the high efforts-low rewards and lowest means values in the low efforts –high rewards), and the amount of differences between means values of all job factors are as expected in original model. Therefore, high and low mean values are strongly associated with the role of immediate and remote of dissatisfaction. In all these cases significant interactions are consistent with expectations-thereby providing strong support for relevant hypotheses. Table 1.2 presents the zero-order correlations between the 8 variables measured in this study. Scores on most of the variables remained almost stable during current study. Correlations between various measures of the same variable ranged from -0.19 (employees monetary rewards over mental efforts) to 0.98 (monetary rewards and recognition rewards to total rewards) were calculated. Correlations between pairs of specific efforts scales averaged approximately 0.58 on both occasions. This finding is consistent with evidence reported in this study regarding the relatively good fit of a single-factor
International Journal of Business and Management March, 2010
45
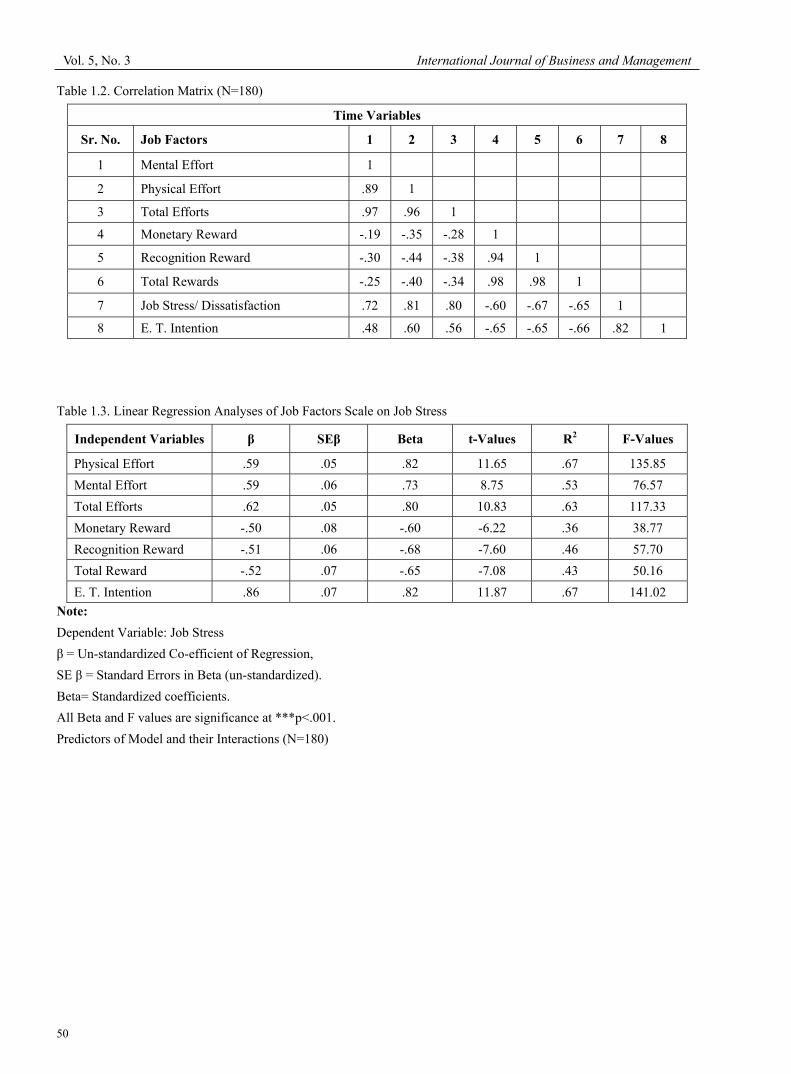
model to the full set of efforts items (Siegrist & Peter, 1996). Correlations between pairs of specific rewards scales were stronger, averaging approximately. 58 except mental efforts. Total efforts were correlated in the expected directions with the job stress, and with the outcome variables of employees’ turnover intention. Similarly, there was a trend for job stress and employees turnover intention to be more highly correlated with these variables than was monetary rewards. The two composite outcomes of efforts were moderately inter-correlated in the expected (positive) direction with job stress and employee’s turnover intention. Consistent with hypotheses 1, job efforts was positively correlated with both stressors and turnover. Conversely, a reward was negatively correlated with job stressors and job turnover. Most job factor-dissatisfaction relationships were quite stable in this study. Total efforts and total rewards were highly correlated with job stress than either was with job factor, and job stress was closely associated with total efforts than were monetary rewards. Comparisons with correlations reported in past researches, reveal that this study measures of efforts and rewards were correlated in the same direction with all measures of job stress, but somewhat slightly higher than typically reported in the study of Hanson et al., (2000) & Oreskog & Orbom, (1996). (Table 1.2 insert here) Reported is Pearson correlation for pairs of interval/ratio scaled variables (including all composite scales and sub-scales of total efforts, total rewards and stressors). Correlations are significant (two-tailed) at p < .001 if over .16, at p < .01. (N = 180). For all analyses involving all independent and dependent variables of job stress, scores were inverted so that (consistent with all other job stress outcomes) high scores indicate high levels of stress. These consistencies between the current and typical past findings are evidence of the validity of the measures used in this study. Finally, it is concluded this study designed to develop and test multi-item scales to measure the past studies predictor, moderator and criterion variables and to extend the model of Theorell (1990) and Siegrist & Peter, (1996). Interestingly, the scale developed in this study was reliable and factorially-consistent across both job factors and times of measurement. Zero-order correlations between all pairs of variables were also reported. Furthermore, several sets of analyses were performed to compare the magnitude of single stressors across sub-groups of the sample defined by the efforts, rewards and job stress as job factors. These analyses followed procedures adopted in past researches. All sub-groups of total efforts, total rewards and employees’ turnover intention were highly correlated with all job factors (see Table 1.2). Tests for possible main and additive effects between the job factors and stressors yielded significant finding. Hierarchical regression models were computed using the total efforts, rewards and stressor scales. Hypothesis 1 & 2 predicted a main effect of efforts and rewards whereas hypothesis 3 predicted an additive effect of efforts and rewards on job stress. As an initial test of these hypotheses, the job factor measures were standardized, and the following variables computed using these standardized variables. These variables were computed through cross-sectional study data separately. Since gender and age were not significantly different correlation with total stressors, these were excluded as efforts and rewards variables. (Table 1.3 insert here) Significant predictors of this study were total efforts (β = .62, Beta = .80, t-values = 10.83, F-values = 117.33 and R2 = .63 at p < .001), total rewards (β = -.52, Beta = -.65, t-values = -7.08, F-values = 50.16 and R2 = .43 at p < .001), and employee’s turnover intention (β = .86, Beta = .82, t-values = 11.87, F-values = 141.02 and R2 = .67 at p < .001) on job stress. Table 1.4 shows that additive interaction term was highly significant than that of main effect alone (although the efforts plus rewards interaction approached significance, p = .001). In short, the analyses strongly support hypothesis 1, 2 and 3 or any of the interaction effects. As shown in Table 1.3 and 1.4 specific stressor scale scores were predicted by the corresponding efforts variable in two domains (sub-group) and by the corresponding rewards variables. Most of these effects were significant in two regression tables. Employee’s turnover scale predicted job factors significantly at all levels of variables (Table 1.4 insert here) All of the interaction terms predicted stressor scores consistently across the all sub-group analysis (see Tables 1.2, 1.3 and 1.4). However, the total efforts plus total rewards interaction, and the four sub-group interactions, were each significant predictors of job stress. In sum, these analyses of the cross-sectional study specific job factor data provide quite strong support for the main and additive effects of efforts and rewards (hypotheses 1-3). 3.2 Summary of Findings from Stressors and Job Stress Hypotheses 1 (Independent effects of job efforts and job stress) This hypothesis was strongly supported through correlation and regression analysis. Reliable effects of total efforts and two sub-groups on stressors were shown in this cross-sectional study, but total efforts were slightly better predictor of stress than physical and mental efforts alone. Therefore, in all analyses, stressors were more closely related to total efforts plus two sub-groups.
Vol. 5, No. 3 International Journal of Business and Management
46
Hypothesis 2 (Independent effects of rewards on job stress) Both correlation and sub-group analyses provided evidence for the predicted independent effects of total rewards (monetary and recognition rewards) on job stress. The effects were significant predictor for both types of rewards in this study sub-group analysis. The contribution of total rewards to the explanation of total stressors held in this study was remained highly significant. On balance, hypothesis 2 (independent effects of rewards on job stress) was further confirmed. Hypothesis 3 (Additive effects and rewards on job stress) The (total) efforts plus (total) rewards composite variable was more highly correlated with job stress and employees turnover intention than was efforts and rewards alone. However, ANOVAs using composite job factor variables provided strong support for the efforts plus rewards additive effect. Furthermore, in this study different correlation and regression analyses indicated that efforts and rewards explained significant amount in variance in job stress and employees turnover intention. The efforts plus rewards hypothesis was significantly supported by the regression analysis, and also received strong support from the various sub-group analyses (see Table 1.4). Multiple regressions provided full support to combine effects of four sub-groups (physical efforts, mental efforts, monetary rewards and recognition rewards) better than main effect alone (see Tables 1.4). Therefore, the hypothesis was confirmed. 4. Discussion Siegrist et al. (2004) consistently argued that job efforts and job rewards have direct effects on job stress. Their fundamental theory and original models provided significant supports to the current variables. But current research concluded that perceived job stressfulness is an important mediator of the job factors - stress relationship. Both efforts and rewards are likely to have strong additive effects upon these more proximate outcomes than main and interaction effects. The findings from this study strongly supported this theory of efforts and rewards. At this stage we made it clear that stress researchers (van Dick and Wagner 2001; Yoon 2002; Bauer et al. 2005; Siegrist et al. 2004), appraisals of job stressfulness appear to be a joint function of environmental and personal factors but latter they extended to role of efforts and rewards and nature of work. Results of this study reported further evidence of the independent linear and additive effects of efforts and rewards on job stress, and provide moderately strong support for a similar role played by complexities of work environment among the employees. The results were also generally consistent with the additive effects of efforts and rewards on job stress, and provide significant support for efforts plus rewards additive effect on job stress and employees’ turnover intention. In past few researchers put attention on additive effects on job stressfulness, despite the potential theoretical and practical implications of the existence of such effects. The current results are reasonably consistent in suggesting that significant amount of power are obtained through the inclusion of multiple job factors to account for variance in job stress. It is concluded that current findings demonstrated that the two job resources of efforts (particularly, physical efforts) and rewards act in a supplemental, rather than substitutive manner, in reducing perceptions of job stress and employees’ turnover intention. A significant buffering role of rewards on the efforts-stress relationship in this study was obtained through main and sub-group regression analyses (see Tables 1.3 & 1.4). These significant effects were obtained in through cross-sectional design and a limited number of (competing) predictors. Findings from this study are broadly consistent with these earlier results. Furthermore, there was evidence, that the results were slightly strong and consistent in predicting stressors in the main and sub-group analysis than composite effects. Our results were consistent and developed significant relationships between total efforts, total rewards and job stress, but also slightly less consistent with main and interactive effects associated with these variables, must be placed systematically within the context of this study. This study provided evidence that the teachers of our sample are relatively high degree of job stress symptoms compared to values in other studies. Furthermore, based on the ERI questionnaire, 80% of the teachers belong to a so-called effort–reward imbalance risk group. As a consequence, our sample would reflect a selection of somewhat high burdened teachers. However, since in our sample parameters, such as gender, ages, and school type, were not representative, we assume that this possible differ is limited. Further limitations of the representativeness of our study result from the fact that only two educational systems were included working in private sector, and finally, that the survey, instead of being conducted also in a current work environment, was done only in and around a big-sized city. In spite of the aforementioned clarifications we feel that our data give a realistic description of the professional situation of teachers. Teachers of our sample showed a relatively high degree of job stress symptoms when compared with data of other studies. Teachers in our sample indicated significant amount of job stress and turnover intention due to lack of motivation, low rewards and high efforts, and repetitive work environment (see Table 1.2, 1.3 and 1.4). Our study made use of the Effort- Reward-Imbalance Questionnaire (ERI). According to Siegrist (2001), an effort reward imbalance predicts occupational stress especially in psychosocial work environments. In our sample, 80% of the teachers displayed high imbalance (ERI) ratio, indicating that effort outweighs reward. Our data indicate that this is caused by the increased effort reported by full-time teachers. Thus it appears that increasing time spent working in school/college is correlated with increasing effort but not with increasing rewards. Older teachers have a worse ERI ratio, due to their high scores in
International Journal of Business and Management March, 2010
47
the efforts scale. Decreasing resilience along age may cause an increase in perceived effort. A further subgroup difference in the ERI parameters was observed between teachers of the different college types. Teachers in Punjab College of Information Technology (PCIT) felt less rewarded. This may be a consequence of a higher degree of behavioral disorders caused by the fact that college needs high degree of work environments. Although the aforementioned differences were significant, the effect sizes turned out to be increased for the last couple of years. In this regard, Candova´ (2005) who found that personal expectations and aims have a strong influence in experiencing stress and dissatisfaction (see also Barth 1997). These are the possible reasons why significant group differences explain only small parts of the total variances in the job stress parameters. Similarly, the results of the ERI are strongly determined by personal variables such as e.g. unrealistic aspirations or intrinsic claims (Heyse et al. 2004, Schmitz 2004). As a consequence our group differences explain only a small part of the variances in the ERI scales and subscales. 5. Conclusion and Recommendations In conclusion, we found a high percentage of teachers with both job stress and dissatisfaction and an imbalance characterized by high effort and low reward in their professional life. This work environment obviously calls for preventive measures. Necessary changes should probably include several aspects, first of all smaller class sizes and less numbers of assignments, job description, job specification, attractive salary structure, and good promotional policy. In addition management should support teachers in improving their interpersonal skills, since during the last couple of years students have become more difficult clients. The additive relationship between these two job factors (job efforts and job rewards) suggests that maximum reductions in job dissatisfaction require reasonable job efforts and increasing job rewards. At the same time it may also improve productivity levels. On the other hand, if the relationship is interactive, and efforts only increase job stress and dissatisfaction under conditions of low rewards, this suggests a practicable approach to improving job-related well-being without sacrificing worker performance. Our findings stated that the performance of employees (individually and collectively) and the organization as a whole can be improved by the re-design of jobs description to incorporate greater worker rewards (personal financial need, personal social needs, and personal esteem) with reasonable job efforts. In fact, our research model invites attention of new researcher on several limitations of his previous models. Firstly, the additive or interactive effects of efforts and rewards at both the group and organizational levels were not considered. Secondly, the potential stressors of specific types of job efforts and rewards were not assessed. Thirdly, the role played by job efforts and job rewards on job stress and dissatisfaction were not explored. Finally, the theory was not adequately precise to determine the exact mathematical relationship between job efforts and job rewards. Future research is obviously needed to extend the existing ER model by providing new information about issues inherent in job stress research. First, we conclude that the four quadrant ER model is a psychometrically well-justified measure of assessing psychosocial stress at work place. Our demonstration of time invariance of the ER scales allows researchers to conduct job stress intervention studies without having to worry about whether observed differences and real changes in efforts, rewards, and satisfaction are due to structural change of the ER 30-items scales over time. However, we encourage researchers to examine the assumption of stable instruments before conducting substantive analyses of data. Although there is still room to sophisticate the ER scale as described earlier (i.e., items similarities of both efforts and satisfaction, the stability of the job rewards constructs, as well as the way of response rating and reliability), the one-step response format in the latest version seems to be applicable to all kind of working employees. Finally, the methodological approaches proposed here offer several benefits in studying the stability of ER constructs and operationalizations. Moreover, it extends it into the job stress and impact on job performance where this kind of conceptual advance pay huge dividend to organization concerned. References Bentler, P., & Bonett, D. (1980). Significance tests and goodness of fit in the analysis of covariance structures. PsychologicalBulletin, 88, 588–606. Chichester, UK: Wiley & Sons, &Yeager, S. (1976). Measuring change and persistence in human affairs: Types of change generated by OD designs. Journal of Applied Behavioral Science,12, 133–157. Dormann, C., & Zapf. (2002). Social stressors at work, irritation, and depressive symptoms: Accounting for unmeasured third variables in a multi-wave study. Journal of Occupational and Organizational Psychology, 75, 33–58. Dragano, N., von dem., & Siegrist, J. (2003). [Psychosocial work stress and usculoskeletal diseases: Significance for prevention]. Zeitschrift f¨ur Gesundheitswissenschaften, 11, 196–207. Frese., & Zapf. (1988). Methodological issues in the study of work stress: Objective vs subjective measurement of work stress and the question of longitudinal studies. In C. L. Cooper & R. Payne (Eds.), Causes, coping and consequences of stress at work (pp. 375–411). Goodman, J., & Blum, T. (1996). Assessing the non-random sampling effects of subject attrition in longitudinal research. Journal of Management, 22, 627–652. Hair, Jr., J., Anderson, R., & Tatham, R. (2006). Multivariate data analysis. Upper Saddle River, NJ: Pearson Education.
Vol. 5, No. 3 International Journal of Business and Management
48
Hanson, E., Schaufeli, W., Vrijkotte, T., Plomp., & Godaert, G. (2000). The validity and reliability of the Dutch effort-reward imbalance questionnaire. Journal of occupational Health Psychology, 5, 142–155. Joksimovic, L., Starke, D., & Siegrist, J. (2002). Perceived work stress, overcommitment, and self reported musculoskeletal pain: A cross-sectional investigation. International Journal of Behavioral Medicine, 9, 122–138. Peter, R., Siegrist, J., Theorell, T., & Westerholm, P. (1998). High effort, low reward, and cardiovascular risk factors in employed Swedish men and women: Baseline results from the WOLF study. Journal of Epidemiology and Community Health, 52, 540–547. Siegrist, J. (1996). Adverse health effects of high-effort/low-reward conditions. Journal of Occupational Health Psychology, 1, 27–41. Siegrist, J., & Peter, R. (1996). Measuring effort-reward imbalance at work: Guidelines. D¨usseldorf: Heinrich Heine University. Siegrist, J., Siegrist., & Weber, I. (1986). Sociological concepts in the etiology of chronic disease: The case of ischemic heart disease. Social Science & Medicine, 22, 247–253. Siegrist, J., Starke, D., Chandola., & Peter, R. (2004). The measurement of effort-reward imbalance at work: Social Science& Medicine, 58, 1483–1499. Tsutsumi, A. (2004). Development and application of the Japanese version of effort- reward imbalance questionnaire. Okayama, Japan: Okayama University School of Medicine and Dentistry. Tsutsumi, A., & Kawakami, N. (2004). A review of empirical studies on the model of effort-reward imbalance at work: Reducing occupational stress by implementing a new theory. Social Science& Medicine, 59, 2335–2359. Tsutsumi, A., & Matoba, T. (2002). Responsiveness of measures in the effort-reward imbalance questionnaire to organizational changes: A validation study. Journal of Psychosomatic Research, 52(4), 249–256. Tsutsumi, A., Ishitake, T., Peter, R., Siegrist, J., & Matoba. (2001). The Japanese version of the Effort-Reward Imbalance Questionnaire: A study in dental technicians. Work and Stress, 15, 86–96. Van Vegchel, N., de Jonge, J., Bakker, A., & Schaufeli, W. B. (2002). Testing global and specific indicators of rewards in the Effort-Reward Imbalance Model: Does it make any difference? Journal of Work and Organizational Psychology, 11, 403–421. Van Vegchel, N., de Jonge, J., Bosma, H., & Schaufeli, W. (2005). Reviewing the effort- reward imbalance model: Drawing up the balance of empirical studies. Social Science &Medicine, 60, 1117–1131. Zapf, D., Dormann, C., & Frese. (1996). Longitudinal studies in organizational stress research: A review of methodological issues. Journal of Occupational Health Psychology, 1, 145–169.
International Journal of Business and Management March, 2010
49
Table 1.1. Comparisons of Various Levels of Dissatisfaction across Four Types of Job
Outcomes Variables Measures Low
Dissatisfaction JobHigh
Dissatisfaction JobActive Job Passive Job
Mental Effort N 25 95 22 38Mean 2.15 3.55 3.10 2.88SD 0.62 0.49 0.54 0.51
Physical Effort N 25 95 22 38Mean 2.45 3.85 3.15 2.66SD 0.44 0.35 0.41 0.51
Total Efforts N 25 95 22 38Mean 2.30 3.72 3.12 2.77SD 0.32 0.44 0.49 0.34
Monetary Reward N 25 95 22 38Mean 2.33 4.12 3.52 3.15SD 0.66 0.23 0.56 0.54
Recognition Reward N 25 95 22 38Mean 2.11 3.00 2.45 2.14SD 0.43 0.58 0.64 0.45
Total Rewards N 25 95 22 38Mean 2.22 3.65 3.00 2.65SD 0.33 0.44 0.56 0.45
Job Stress N 25 95 22 38Mean 2.14 3.78 3.12 2.45SD 0.51 0.46 0.55 0.43
Job Turnover N 25 95 22 38Mean 1.99 3.45 2.00 2.00SD 0.34 0.64 0.42 0.57
Note: Low Dissatisfaction Job: Low efforts high rewards High Dissatisfaction Job: High efforts low rewards Active Job: High efforts high rewards Passive Job: Low efforts Low rewards N = Number of participants SD = Standard Deviation
Vol. 5, No. 3 International Journal of Business and Management
50
Table 1.2. Correlation Matrix (N=180)
Time Variables
Sr. No. Job Factors 1 2 3 4 5 6 7 8
1 Mental Effort 1
2 Physical Effort .89 1
3 Total Efforts .97 .96 1
4 Monetary Reward -.19 -.35 -.28 1
5 Recognition Reward -.30 -.44 -.38 .94 1
6 Total Rewards -.25 -.40 -.34 .98 .98 1
7 Job Stress/ Dissatisfaction .72 .81 .80 -.60 -.67 -.65 1
8 E. T. Intention .48 .60 .56 -.65 -.65 -.66 .82 1 Table 1.3. Linear Regression Analyses of Job Factors Scale on Job Stress
Independent Variables β SEβ Beta t-Values R2 F-Values
Physical Effort .59 .05 .82 11.65 .67 135.85 Mental Effort .59 .06 .73 8.75 .53 76.57 Total Efforts .62 .05 .80 10.83 .63 117.33 Monetary Reward -.50 .08 -.60 -6.22 .36 38.77 Recognition Reward -.51 .06 -.68 -7.60 .46 57.70 Total Reward -.52 .07 -.65 -7.08 .43 50.16 E. T. Intention .86 .07 .82 11.87 .67 141.02
Note: Dependent Variable: Job Stress β = Un-standardized Co-efficient of Regression, SE β = Standard Errors in Beta (un-standardized). Beta= Standardized coefficients. All Beta and F values are significance at ***p<.001. Predictors of Model and their Interactions (N=180)
International Journal of Business and Management March, 2010
51
Table 1.3. Linear Regression Analyses of Job Factors Scale on Job Stress
Independent Variables β SE β Beta t-Values R2 F-Values
Physical Effort .60 .11 .82 5.24 .67 66.93
Mental Effort .42 .12 .48 3.84 Monetary Reward -.25 .21 .30 -1.15
.47 29.66Recognition Reward -.72 .18 .96 -3.66 Total Efforts .51 .04 .65 11.08
.80 131.40Total Rewards -.34 .04 -.43 -7.34 Physical Effort .16 .10 .19 1.51
.80 65.19Mental Effort .33 .09 .46 3.43 Monetary Reward -.12 .14 -.10 -.50 Recognition Reward -.25 .13 -.33 -1.93
Note: Dependent Variable: Job Stress β = Un-standardized Co-efficient of Regression, SE β = Standard Errors in Beta (un-standardized). Beta= Standardized coefficients. All Beta and F values are significance at ***p<.001. Predictors of Model and their Interactions (N=180)
EFFORTS
HIGHLOW
HIG
HLO
W
ACTIVE JOB
PASSIVE JOB
DISSATISFACTION
SATISFACTION
TIME
REW
ARDS
EFFORTS-REWARDS MODELEFFORTS-REWARDS MODEL
Figure 1. Original Efforts-Rewards Model