Strain partitioning in an accretionary wedge, in oblique convergence: analogue modelling
Upload
independentCategory
view
0download
0
An investigation of Vulcanian eruption dynamics using laboratory
analogue experiments and scaling analysis
A. B. CLARKE1*, J. C. PHILLIPS2 & K. N. CHOJNICKI1
1School of Earth and Space Exploration, Arizona State University,
Tempe, AZ, 85287–1404, USA2Center for Environmental and Geophysical Flows, Department of Earth Sciences,
University of Bristol, Wills Memorial Building, Queen’s Road, Bristol, BS8 1RJ, UK
*Corresponding author (e-mail: [email protected])
Astract: Vulcanian eruptions are frequent, small-scale, short-lived explosive volcanic eruptions,which are thought to be produced by impulsive sources. The experiments presented here, producedby injections of mixtures of water, alcohol or salt and solid particles into fresh water, created a widevariety of turbulent flows from steady and impulsive sources. We focus on the experimental flowsanalogous to Vulcanian events – unsteady, finite-volume releases of buoyancy (thermals) andmomentum (puffs), and short releases driven by both momentum and buoyancy. Dimensionalanalysis, based on two controlling source parameters, total injected momentum (M) and totalinjected buoyancy (B), identified a universal scaling relationship for the propagation of theflows; the non-dimensional, time-varying velocity term (ut1/2/B1/4), where u is flow front verticalvelocity and t is time from flow onset, varies with the time-varying, non-dimensional ratio of sourceparameters (M/Bt), such that ut1/2/B1/4 ¼ k(M/Bt)1/2. The quantitative relationship successfullydescribes experiments and several Vulcanian eruptions for a wide range of initial conditions. Theutility of the relationship is demonstrated by estimating total mass erupted and vent mass flux as afunction of time, two parameters important to hazards assessment, for the well-documented7 August 1997 Vulcanian eruption at Soufriere Hills volcano, Montserrat. Results compare favour-ably to independent estimates of total mass erupted (based in part on deposit studies) and eruptionduration (based on seismic analysis) with the advantage that our approach requires only thedetermination of the eruption cloud front velocity from conventional video analysis.
Particle-laden jets and plumes occur in manyenvironments and settings, including atmosphericclouds (Turner 1966), black smokers at mid-oceanridges (Sudarikov & Roumiantsev 2000), riversentering bodies of water (Cookman et al. 1997),industrial explosions and smokestacks, bomb andmeteorite impact zones, fuel injectors (Lee et al.2004) and volcanic eruptions (Sparks et al. 1997).In most cases, they are generated by unsteadysource flux, but unfortunately there is little funda-mental understanding of how to relate time-varyingand impulsive source fluxes to flow evolution, andno complete theoretical description which does soover a wide range of conditions.
This work focuses on the specific case of hazar-dous Vulcanian eruptions, which are generated byhighly unsteady, short-lived vent fluxes of momen-tum and/or buoyancy. Vulcanian eruptions are gen-erally characterized as discrete, violent explosionswhich are generated by an impulsive source(Morrissey & Mastin 2000). Often they result froma sudden decompression of a conduit containingpressurized, vesiculated magma (Self et al. 1979;Woods 1995; Sparks et al. 1997; Stix et al. 1997;
Druitt et al. 2002). Such eruptions have beendescribed in detail at a number of volcanoes(Sparks et al. 1997), including Ngauruhoe, NewZealand (Nairn & Self 1978; Self et al. 1979),Galeras, Colombia (Stix et al. 1997), and SoufriereHills volcano, Montserrat (Druitt et al. 2002). Typi-cally only a portion of the magma in the conduit isfragmented and evacuated, such that Vulcanianeruptions last only seconds to minutes and eruptless than 0.1 km3 of magma (Morrissey & Mastin2000). Vulcanian explosions can produce atmos-pheric shock waves (Nairn 1976; Ishihara 1985),exhibit vent velocities up to hundreds of metresper second, eject blocks and bombs up to 5 kmfrom the vent (Fagents & Wilson 1993; Waittet al. 1995; Druitt et al. 2002) and can producevertical turbulent plumes up to 20 km high(Morrissey & Mastin 2000).
The short-duration, unsteady nature of Vulca-nian eruptions makes them distinct from Plinianeruptions, in which it is generally accepted thatbubbly magma rises to meet a fragmentation wave,and, as is commonly assumed, steadily feeds thevent flux over long periods. However, most Plinian
From: THORDARSON, T., SELF, S., LARSEN, G., ROWLAND, S. K. & HOSKULDSSON, A. (eds)Studies in Volcanology: The Legacy of George Walker. Special Publications of IAVCEI. 2, 155–166.Geological Society, London. 1750-8207/09/$15.00 # IAVCEI 2009.
eruptions exhibit temporal variations associatedwith changes in vent mass flux (e.g. Carey &Sigurdsson 1987; Scott et al. 1996; Sparks et al.1997; Di Muro et al. 2004; Houghton et al. 2004),making existing steady jet and plume theoryapproximate at best (e.g. Turner 1973) for both Vul-canian and Plinian eruptions.
Vent mass flux for explosive volcanic eruptionsis often estimated from column heights by assumingsteady vent conditions (Wilson et al. 1980, follow-ing Morton et al. 1956) or by assuming that short-duration events are generated by an instantaneous,purely buoyant release (thermals; as summarizedin Turner 1973, pp. 186–189). However, fundamen-tal theory relating overall flow evolution to ventflux does not exist for short-lived highly unsteadymomentum- and buoyancy-driven releases, andtherefore there is no simple means of estimatingtime-varying mass flux or total mass erupted byshort-duration explosive events. Our preliminarycalculations suggest that over long episodes ofperiodic eruptive activity (such as at Santiaguitovolcano in Guatemala), the total mass erupted byVulcanian eruptions could be large, and is thereforeworth quantifying. Santiaguito has been producingperiodic explosive eruptions since the 1970s(e.g. Rose 1980; Johnson et al. 2004). We can con-servatively estimate the mass erupted at Santiaguitoby assuming that 104 m3 dense rock equivalent(DRE ¼ 2500 kg m23), which is equivalent to2.5 � 107 kg of magma, was erupted 10 times aday over 20 years, resulting in a total of1.9 � 1012 kg. For comparison, the Plinian phaseof the Mount Pinatubo eruption in 1991 ejectedroughly 1.3 � 1013 kg of magma (Scott et al.1996). In contrast to many Plinian eruptions, theash erupted by Santiaguito volcano is not ejectedinto the stratosphere where it may potentially havea global affect, but the mass erupted is significantand can have devastating effects on local cropsand nearby populations.
In this paper we present a laboratory investi-gation of the fundamental dynamics governingshort-duration, unsteady, turbulent flows for whichboth buoyancy and momentum may be important.We varied buoyancy and momentum injected inorder to develop a scaling analysis that enablesour experiments to be compared with Vulcanianeruptions. The experimental method is describedfirst, followed by qualitative observations andgeneral experimental results. Dimensional analysisis then used to develop a scaling relationship forthe laboratory experiments. We then demonstratethat the same scaling relationship describes severalwell-documented Vulcanian eruptions. Finally,inspired by George Walker’s pioneering approachof using quantitative estimates based on field obser-vations to infer controlling parameters for volcanic
processes, we extract a simple formula from thedimensional analysis in order to estimate the massflux and mass erupted by Vulcanian events usingdirect observations of the rise rate of the eruptioncolumn. The paper concludes with recommen-dations for future field measurements that arerequired for further development of predictivemodels of Vulcanian eruptions.
Methods
High-pressure suspensions of particles in aqueoussolution were rapidly released into a tank of freshwater in a series of systematic laboratory exper-iments. The injected volume, buoyancy, momen-tum, particle size and concentration were variedto produce a range of flows. Flow types includedplumes (steady releases where only buoyancy con-trols the flow propagation), jets (steady releaseswhere only momentum controls the flow propa-gation), thermals (impulsive releases where onlybuoyancy controls the flow propagation), puffs(impulsive releases where only momentum controlsthe flow propagation) and collapsing fountainswhich generated density currents. This paperfocuses solely on the impulsive releases (thermals,puffs and releases driven by both momentum andbuoyancy) as analogous to flows produced byVulcanian eruptions.
A schematic of the experimental apparatus isshown in Figure 1. The reservoir was filled with a
Fig. 1. Schematic, not-to-scale, drawing of theexperimental setup. The Lexan viewing tank had basedimensions of 0.61 by 0.61 m and was filled to a depth of1 m with fresh water.
A. B. CLARKE ET AL.156
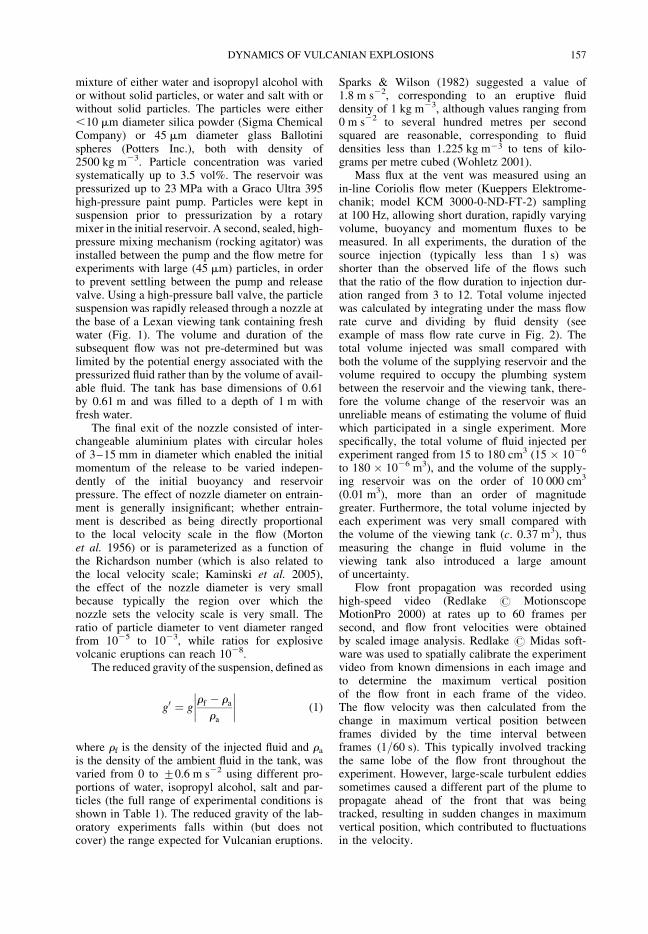
mixture of either water and isopropyl alcohol withor without solid particles, or water and salt with orwithout solid particles. The particles were either,10 mm diameter silica powder (Sigma ChemicalCompany) or 45 mm diameter glass Ballotinispheres (Potters Inc.), both with density of2500 kg m23. Particle concentration was variedsystematically up to 3.5 vol%. The reservoir waspressurized up to 23 MPa with a Graco Ultra 395high-pressure paint pump. Particles were kept insuspension prior to pressurization by a rotarymixer in the initial reservoir. A second, sealed, high-pressure mixing mechanism (rocking agitator) wasinstalled between the pump and the flow metre forexperiments with large (45 mm) particles, in orderto prevent settling between the pump and releasevalve. Using a high-pressure ball valve, the particlesuspension was rapidly released through a nozzle atthe base of a Lexan viewing tank containing freshwater (Fig. 1). The volume and duration of thesubsequent flow was not pre-determined but waslimited by the potential energy associated with thepressurized fluid rather than by the volume of avail-able fluid. The tank has base dimensions of 0.61by 0.61 m and was filled to a depth of 1 m withfresh water.
The final exit of the nozzle consisted of inter-changeable aluminium plates with circular holesof 3–15 mm in diameter which enabled the initialmomentum of the release to be varied indepen-dently of the initial buoyancy and reservoirpressure. The effect of nozzle diameter on entrain-ment is generally insignificant; whether entrain-ment is described as being directly proportionalto the local velocity scale in the flow (Mortonet al. 1956) or is parameterized as a function ofthe Richardson number (which is also related tothe local velocity scale; Kaminski et al. 2005),the effect of the nozzle diameter is very smallbecause typically the region over which thenozzle sets the velocity scale is very small. Theratio of particle diameter to vent diameter rangedfrom 1025 to 1023, while ratios for explosivevolcanic eruptions can reach 1028.
The reduced gravity of the suspension, defined as
g0 ¼ grf � ra
ra
�������� (1)
where rf is the density of the injected fluid and ra
is the density of the ambient fluid in the tank, wasvaried from 0 to +0.6 m s22 using different pro-portions of water, isopropyl alcohol, salt and par-ticles (the full range of experimental conditions isshown in Table 1). The reduced gravity of the lab-oratory experiments falls within (but does notcover) the range expected for Vulcanian eruptions.
Sparks & Wilson (1982) suggested a value of1.8 m s22, corresponding to an eruptive fluiddensity of 1 kg m23, although values ranging from0 m s22 to several hundred metres per secondsquared are reasonable, corresponding to fluiddensities less than 1.225 kg m23 to tens of kilo-grams per metre cubed (Wohletz 2001).
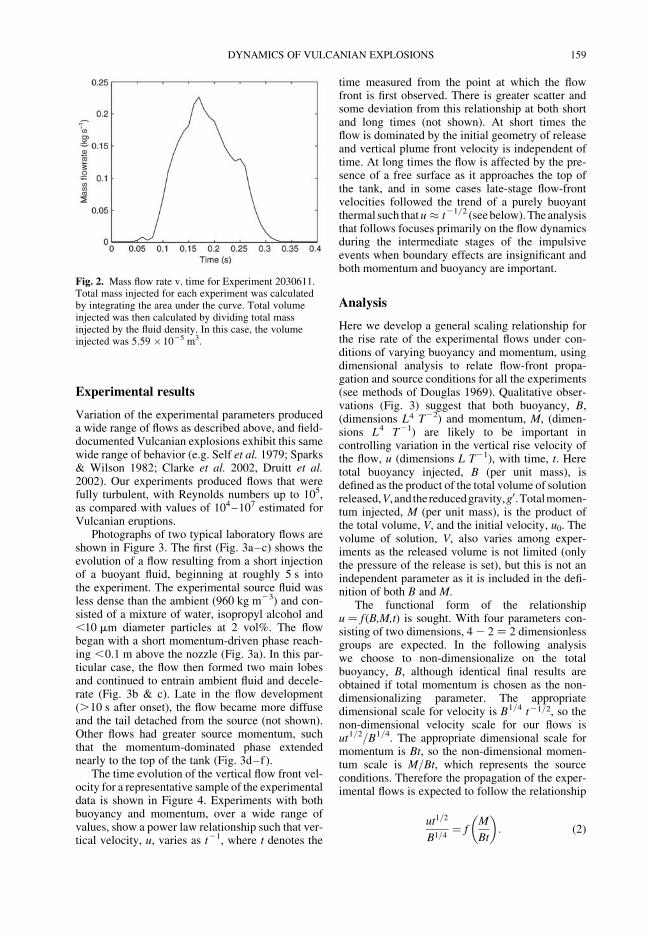
Mass flux at the vent was measured using anin-line Coriolis flow meter (Kueppers Elektrome-chanik; model KCM 3000-0-ND-FT-2) samplingat 100 Hz, allowing short duration, rapidly varyingvolume, buoyancy and momentum fluxes to bemeasured. In all experiments, the duration of thesource injection (typically less than 1 s) wasshorter than the observed life of the flows suchthat the ratio of the flow duration to injection dur-ation ranged from 3 to 12. Total volume injectedwas calculated by integrating under the mass flowrate curve and dividing by fluid density (seeexample of mass flow rate curve in Fig. 2). Thetotal volume injected was small compared withboth the volume of the supplying reservoir and thevolume required to occupy the plumbing systembetween the reservoir and the viewing tank, there-fore the volume change of the reservoir was anunreliable means of estimating the volume of fluidwhich participated in a single experiment. Morespecifically, the total volume of fluid injected perexperiment ranged from 15 to 180 cm3 (15 � 1026
to 180 � 1026 m3), and the volume of the supply-ing reservoir was on the order of 10 000 cm3
(0.01 m3), more than an order of magnitudegreater. Furthermore, the total volume injected byeach experiment was very small compared withthe volume of the viewing tank (c. 0.37 m3), thusmeasuring the change in fluid volume in theviewing tank also introduced a large amountof uncertainty.
Flow front propagation was recorded usinghigh-speed video (Redlake # MotionscopeMotionPro 2000) at rates up to 60 frames persecond, and flow front velocities were obtainedby scaled image analysis. Redlake # Midas soft-ware was used to spatially calibrate the experimentvideo from known dimensions in each image andto determine the maximum vertical positionof the flow front in each frame of the video.The flow velocity was then calculated from thechange in maximum vertical position betweenframes divided by the time interval betweenframes (1/60 s). This typically involved trackingthe same lobe of the flow front throughout theexperiment. However, large-scale turbulent eddiessometimes caused a different part of the plume topropagate ahead of the front that was beingtracked, resulting in sudden changes in maximumvertical position, which contributed to fluctuationsin the velocity.
DYNAMICS OF VULCANIAN EXPLOSIONS 157
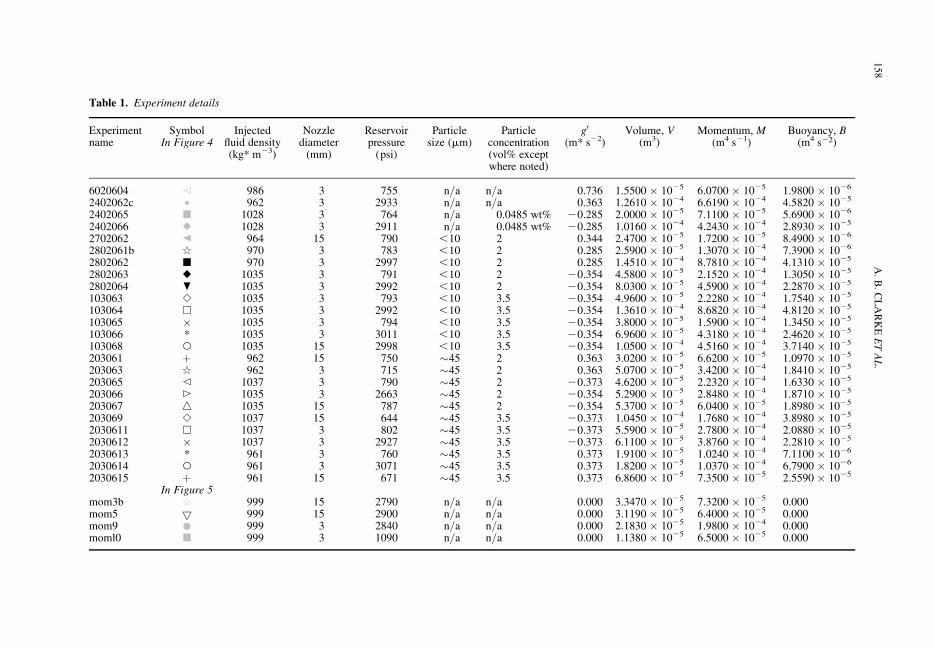
Table 1. Experiment details
Experimentname
SymbolIn Figure 4
Injectedfluid density(kg* m23)
Nozzlediameter
(mm)
Reservoirpressure
(psi)
Particlesize (mm)
Particleconcentration(vol% exceptwhere noted)
g0
(m* s22)Volume, V
(m3)Momentum, M
(m4 s21)Buoyancy, B
(m4 s22)
6020604 N 986 3 755 n/a n/a 0.736 1.5500 � 1025 6.0700 � 1025 1.9800 � 1026
2402062c † 962 3 2933 n/a n/a 0.363 1.2610 � 1024 6.6190 � 1024 4.5820 � 1025
2402065 B 1028 3 764 n/a 0.0485 wt% 20.285 2.0000 � 1025 7.1100 � 1025 5.6900 � 1026
2402066 V 1028 3 2911 n/a 0.0485 wt% 20.285 1.0160 � 1024 4.2430 � 1024 2.8930 � 1025
2702062 R 964 15 790 ,10 2 0.344 2.4700 � 1025 1.7200 � 1025 8.4900 � 1026
2802061b q 970 3 783 ,10 2 0.285 2.5900 � 1025 1.3070 � 1024 7.3900 � 1026
2802062 B 970 3 2997 ,10 2 0.285 1.4510 � 1024 8.7810 � 1024 4.1310 � 1025
2802063 V 1035 3 791 ,10 2 20.354 4.5800 � 1025 2.1520 � 1024 1.3050 � 1025
2802064 P 1035 3 2992 ,10 2 20.354 8.0300 � 1025 4.5900 � 1024 2.2870 � 1025
103063 S 1035 3 793 ,10 3.5 20.354 4.9600 � 1025 2.2280 � 1024 1.7540 � 1025
103064 A 1035 3 2992 ,10 3.5 20.354 1.3610 � 1024 8.6820 � 1024 4.8120 � 1025
103065 � 1035 3 794 ,10 3.5 20.354 3.8000 � 1025 1.5900 � 1024 1.3450 � 1025
103066 * 1035 3 3011 ,10 3.5 20.354 6.9600 � 1025 4.3180 � 1024 2.4620 � 1025
103068 W 1035 15 2998 ,10 3.5 20.354 1.0500 � 1024 4.5160 � 1024 3.7140 � 1025
203061 þ 962 15 750 �45 2 0.363 3.0200 � 1025 6.6200 � 1025 1.0970 � 1025
203063 q 962 3 715 �45 2 0.363 5.0700 � 1025 3.4200 � 1024 1.8410 � 1025
203065 N 1037 3 790 �45 2 20.373 4.6200 � 1025 2.2320 � 1024 1.6330 � 1025
203066 M 1035 3 2663 �45 2 20.354 5.2900 � 1025 2.8480 � 1024 1.8710 � 1025
203067 4 1035 15 787 �45 2 20.354 5.3700 � 1025 6.0400 � 1025 1.8980 � 1025
203069 S 1037 15 644 �45 3.5 20.373 1.0450 � 1024 1.7680 � 1024 3.8980 � 1025
2030611 A 1037 3 802 �45 3.5 20.373 5.5900 � 1025 2.7800 � 1024 2.0880 � 1025
2030612 � 1037 3 2927 �45 3.5 20.373 6.1100 � 1025 3.8760 � 1024 2.2810 � 1025
2030613 * 961 3 760 �45 3.5 0.373 1.9100 � 1025 1.0240 � 1024 7.1100 � 1026
2030614 W 961 3 3071 �45 3.5 0.373 1.8200 � 1025 1.0370 � 1024 6.7900 � 1026
2030615 þ 961 15 671 �45 3.5 0.373 6.8600 � 1025 7.3500 � 1025 2.5590 � 1025
In Figure 5mom3b q 999 15 2790 n/a n/a 0.000 3.3470 � 1025 7.3200 � 1025 0.000mom5 5 999 15 2900 n/a n/a 0.000 3.1190 � 1025 6.4000 � 1025 0.000mom9 † 999 3 2840 n/a n/a 0.000 2.1830 � 1025 1.9800 � 1024 0.000moml0 B 999 3 1090 n/a n/a 0.000 1.1380 � 1025 6.5000 � 1025 0.000
A.
B.
CL
AR
KE
ET
AL
.158
Experimental results
Variation of the experimental parameters produceda wide range of flows as described above, and field-documented Vulcanian explosions exhibit this samewide range of behavior (e.g. Self et al. 1979; Sparks& Wilson 1982; Clarke et al. 2002, Druitt et al.2002). Our experiments produced flows that werefully turbulent, with Reynolds numbers up to 105,as compared with values of 104–107 estimated forVulcanian eruptions.
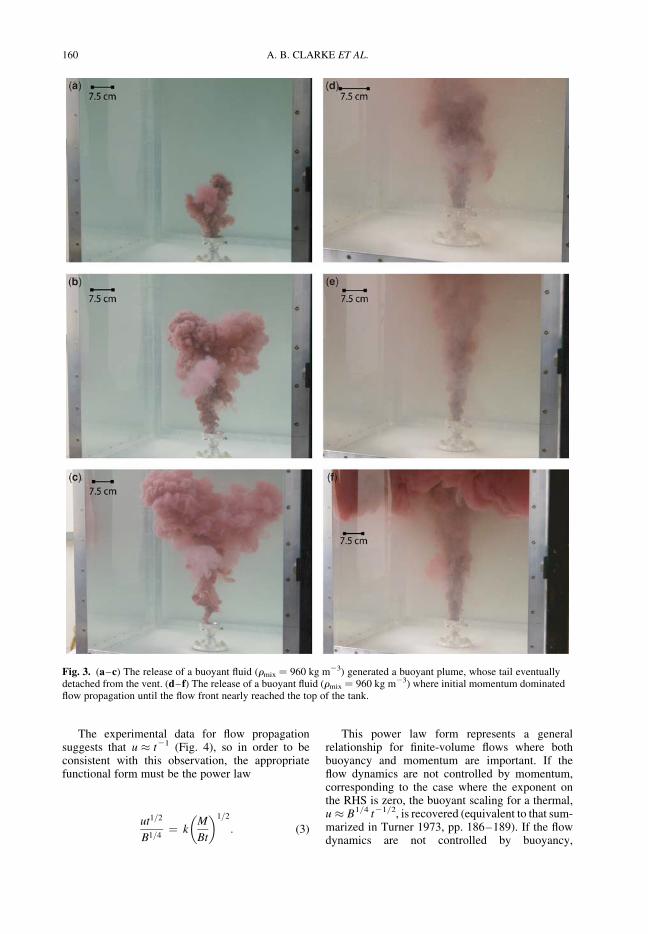
Photographs of two typical laboratory flows areshown in Figure 3. The first (Fig. 3a–c) shows theevolution of a flow resulting from a short injectionof a buoyant fluid, beginning at roughly 5 s intothe experiment. The experimental source fluid wasless dense than the ambient (960 kg m23) and con-sisted of a mixture of water, isopropyl alcohol and,10 mm diameter particles at 2 vol%. The flowbegan with a short momentum-driven phase reach-ing ,0.1 m above the nozzle (Fig. 3a). In this par-ticular case, the flow then formed two main lobesand continued to entrain ambient fluid and decele-rate (Fig. 3b & c). Late in the flow development(.10 s after onset), the flow became more diffuseand the tail detached from the source (not shown).Other flows had greater source momentum, suchthat the momentum-dominated phase extendednearly to the top of the tank (Fig. 3d–f).
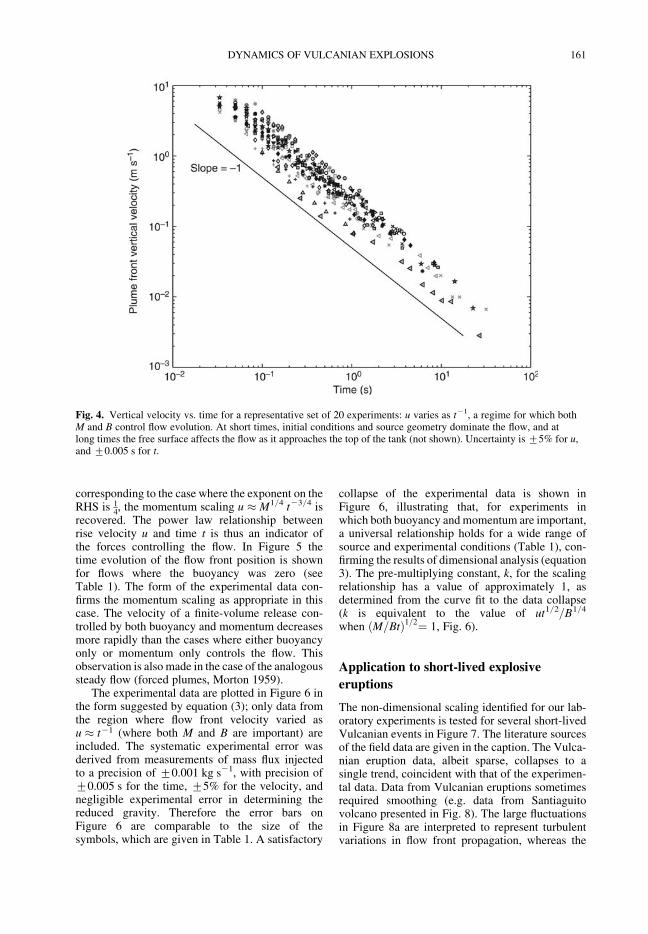
The time evolution of the vertical flow front vel-ocity for a representative sample of the experimentaldata is shown in Figure 4. Experiments with bothbuoyancy and momentum, over a wide range ofvalues, show a power law relationship such that ver-tical velocity, u, varies as t21, where t denotes the
time measured from the point at which the flowfront is first observed. There is greater scatter andsome deviation from this relationship at both shortand long times (not shown). At short times theflow is dominated by the initial geometry of releaseand vertical plume front velocity is independent oftime. At long times the flow is affected by the pre-sence of a free surface as it approaches the top ofthe tank, and in some cases late-stage flow-frontvelocities followed the trend of a purely buoyantthermal such that u � t21/2 (see below). The analysisthat follows focuses primarily on the flow dynamicsduring the intermediate stages of the impulsiveevents when boundary effects are insignificant andboth momentum and buoyancy are important.
Analysis
Here we develop a general scaling relationship forthe rise rate of the experimental flows under con-ditions of varying buoyancy and momentum, usingdimensional analysis to relate flow-front propa-gation and source conditions for all the experiments(see methods of Douglas 1969). Qualitative obser-vations (Fig. 3) suggest that both buoyancy, B,(dimensions L4 T22) and momentum, M, (dimen-sions L4 T21) are likely to be important incontrolling variation in the vertical rise velocity ofthe flow, u (dimensions L T21), with time, t. Heretotal buoyancy injected, B (per unit mass), isdefined as the product of the total volume of solutionreleased,V, andthereducedgravity,g0.Totalmomen-tum injected, M (per unit mass), is the product ofthe total volume, V, and the initial velocity, u0. Thevolume of solution, V, also varies among exper-iments as the released volume is not limited (onlythe pressure of the release is set), but this is not anindependent parameter as it is included in the defi-nition of both B and M.
The functional form of the relationshipu ¼ f (B,M,t) is sought. With four parameters con-sisting of two dimensions, 4 2 2 ¼ 2 dimensionlessgroups are expected. In the following analysiswe choose to non-dimensionalize on the totalbuoyancy, B, although identical final results areobtained if total momentum is chosen as the non-dimensionalizing parameter. The appropriatedimensional scale for velocity is B1/4 t21/2, so thenon-dimensional velocity scale for our flows isut1/2/B1/4. The appropriate dimensional scale formomentum is Bt, so the non-dimensional momen-tum scale is M/Bt, which represents the sourceconditions. Therefore the propagation of the exper-imental flows is expected to follow the relationship
ut1=2
B1=4¼ f
M
Bt
� �: (2)
Fig. 2. Mass flow rate v. time for Experiment 2030611.Total mass injected for each experiment was calculatedby integrating the area under the curve. Total volumeinjected was then calculated by dividing total massinjected by the fluid density. In this case, the volumeinjected was 5.59 �1025 m3.
DYNAMICS OF VULCANIAN EXPLOSIONS 159
The experimental data for flow propagationsuggests that u � t21 (Fig. 4), so in order to beconsistent with this observation, the appropriatefunctional form must be the power law
ut1=2
B1=4¼ k
M
Bt
� �1=2
: (3)
This power law form represents a generalrelationship for finite-volume flows where bothbuoyancy and momentum are important. If theflow dynamics are not controlled by momentum,corresponding to the case where the exponent onthe RHS is zero, the buoyant scaling for a thermal,u � B1/4 t21/2, is recovered (equivalent to that sum-marized in Turner 1973, pp. 186–189). If the flowdynamics are not controlled by buoyancy,
Fig. 3. (a–c) The release of a buoyant fluid (rmix ¼ 960 kg m23) generated a buoyant plume, whose tail eventuallydetached from the vent. (d– f) The release of a buoyant fluid (rmix ¼ 960 kg m23) where initial momentum dominatedflow propagation until the flow front nearly reached the top of the tank.
A. B. CLARKE ET AL.160
corresponding to the case where the exponent on theRHS is 1
4, the momentum scaling u � M1/4 t23/4 is
recovered. The power law relationship betweenrise velocity u and time t is thus an indicator ofthe forces controlling the flow. In Figure 5 thetime evolution of the flow front position is shownfor flows where the buoyancy was zero (seeTable 1). The form of the experimental data con-firms the momentum scaling as appropriate in thiscase. The velocity of a finite-volume release con-trolled by both buoyancy and momentum decreasesmore rapidly than the cases where either buoyancyonly or momentum only controls the flow. Thisobservation is also made in the case of the analogoussteady flow (forced plumes, Morton 1959).
The experimental data are plotted in Figure 6 inthe form suggested by equation (3); only data fromthe region where flow front velocity varied asu � t21 (where both M and B are important) areincluded. The systematic experimental error wasderived from measurements of mass flux injectedto a precision of +0.001 kg s21, with precision of+0.005 s for the time, +5% for the velocity, andnegligible experimental error in determining thereduced gravity. Therefore the error bars onFigure 6 are comparable to the size of thesymbols, which are given in Table 1. A satisfactory
collapse of the experimental data is shown inFigure 6, illustrating that, for experiments inwhich both buoyancy and momentum are important,a universal relationship holds for a wide range ofsource and experimental conditions (Table 1), con-firming the results of dimensional analysis (equation3). The pre-multiplying constant, k, for the scalingrelationship has a value of approximately 1, asdetermined from the curve fit to the data collapse(k is equivalent to the value of ut1/2/B1/4
when M=Btð Þ1=2¼ 1, Fig. 6).
Application to short-lived explosive
eruptions
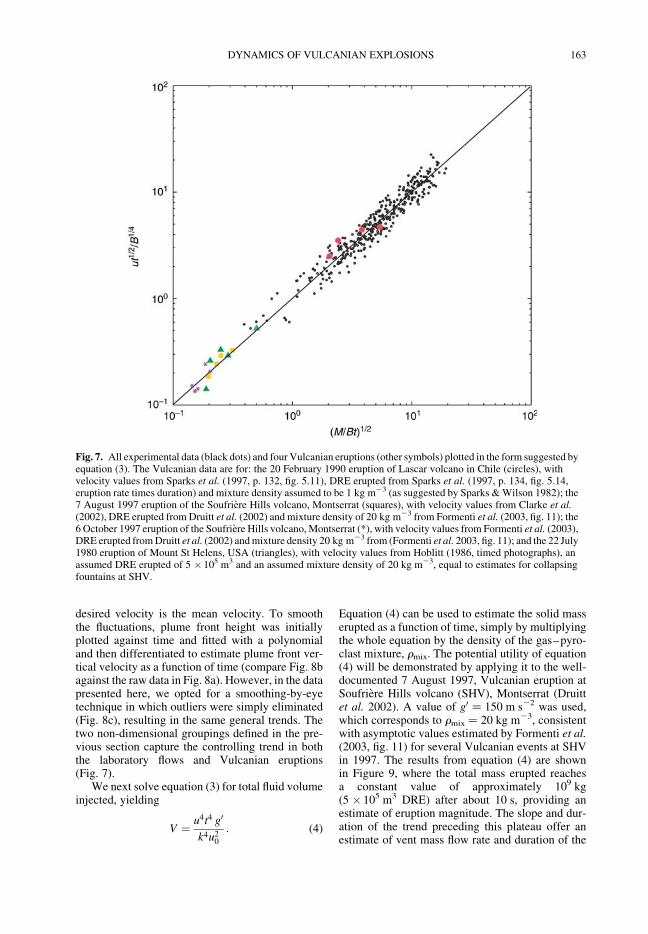
The non-dimensional scaling identified for our lab-oratory experiments is tested for several short-livedVulcanian events in Figure 7. The literature sourcesof the field data are given in the caption. The Vulca-nian eruption data, albeit sparse, collapses to asingle trend, coincident with that of the experimen-tal data. Data from Vulcanian eruptions sometimesrequired smoothing (e.g. data from Santiaguitovolcano presented in Fig. 8). The large fluctuationsin Figure 8a are interpreted to represent turbulentvariations in flow front propagation, whereas the
Fig. 4. Vertical velocity vs. time for a representative set of 20 experiments: u varies as t21, a regime for which bothM and B control flow evolution. At short times, initial conditions and source geometry dominate the flow, and atlong times the free surface affects the flow as it approaches the top of the tank (not shown). Uncertainty is +5% for u,and +0.005 s for t.
DYNAMICS OF VULCANIAN EXPLOSIONS 161
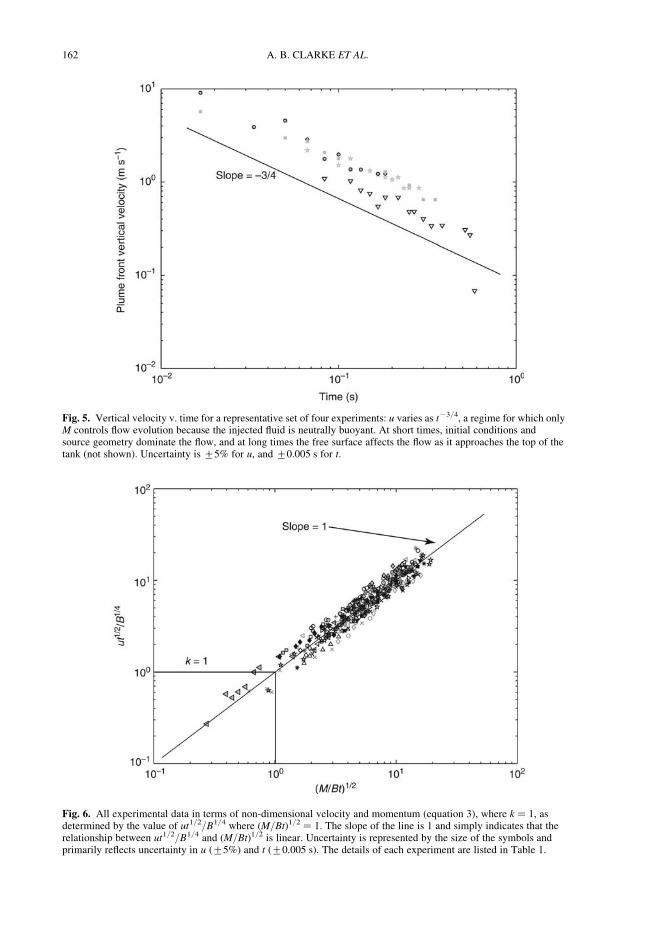
Fig. 5. Vertical velocity v. time for a representative set of four experiments: u varies as t23/4, a regime for which onlyM controls flow evolution because the injected fluid is neutrally buoyant. At short times, initial conditions andsource geometry dominate the flow, and at long times the free surface affects the flow as it approaches the top of thetank (not shown). Uncertainty is +5% for u, and +0.005 s for t.
Fig. 6. All experimental data in terms of non-dimensional velocity and momentum (equation 3), where k ¼ 1, asdetermined by the value of ut1/2/B1/4 where (M/Bt)1/2 ¼ 1. The slope of the line is 1 and simply indicates that therelationship between ut1/2/B1/4 and (M/Bt)1/2 is linear. Uncertainty is represented by the size of the symbols andprimarily reflects uncertainty in u (+5%) and t (+0.005 s). The details of each experiment are listed in Table 1.
A. B. CLARKE ET AL.162
desired velocity is the mean velocity. To smooththe fluctuations, plume front height was initiallyplotted against time and fitted with a polynomialand then differentiated to estimate plume front ver-tical velocity as a function of time (compare Fig. 8bagainst the raw data in Fig. 8a). However, in the datapresented here, we opted for a smoothing-by-eyetechnique in which outliers were simply eliminated(Fig. 8c), resulting in the same general trends. Thetwo non-dimensional groupings defined in the pre-vious section capture the controlling trend in boththe laboratory flows and Vulcanian eruptions(Fig. 7).
We next solve equation (3) for total fluid volumeinjected, yielding
V ¼ u4t4 g0
k4u20
: (4)
Equation (4) can be used to estimate the solid masserupted as a function of time, simply by multiplyingthe whole equation by the density of the gas–pyro-clast mixture, rmix. The potential utility of equation(4) will be demonstrated by applying it to the well-documented 7 August 1997, Vulcanian eruption atSoufriere Hills volcano (SHV), Montserrat (Druittet al. 2002). A value of g0 ¼ 150 m s22 was used,which corresponds to rmix ¼ 20 kg m23, consistentwith asymptotic values estimated by Formenti et al.(2003, fig. 11) for several Vulcanian events at SHVin 1997. The results from equation (4) are shownin Figure 9, where the total mass erupted reachesa constant value of approximately 109 kg(5 � 105 m3 DRE) after about 10 s, providing anestimate of eruption magnitude. The slope and dur-ation of the trend preceding this plateau offer anestimate of vent mass flow rate and duration of the
Fig. 7. All experimental data (black dots) and four Vulcanian eruptions (other symbols) plotted in the form suggested byequation (3). The Vulcanian data are for: the 20 February 1990 eruption of Lascar volcano in Chile (circles), withvelocity values from Sparks et al. (1997, p. 132, fig. 5.11), DRE erupted from Sparks et al. (1997, p. 134, fig. 5.14,eruption rate times duration) and mixture density assumed to be 1 kg m23 (as suggested by Sparks & Wilson 1982); the7 August 1997 eruption of the Soufriere Hills volcano, Montserrat (squares), with velocity values from Clarke et al.(2002), DRE erupted from Druitt et al. (2002) and mixture density of 20 kg m23 from Formenti et al. (2003, fig. 11); the6 October 1997 eruption of the Soufriere Hills volcano, Montserrat (*), with velocity values from Formenti et al. (2003),DRE erupted from Druitt et al. (2002) and mixture density 20 kg m23 from (Formenti et al. 2003, fig. 11); and the 22 July1980 eruption of Mount St Helens, USA (triangles), with velocity values from Hoblitt (1986, timed photographs), anassumed DRE erupted of 5 �105 m3 and an assumed mixture density of 20 kg m23, equal to estimates for collapsingfountains at SHV.
DYNAMICS OF VULCANIAN EXPLOSIONS 163
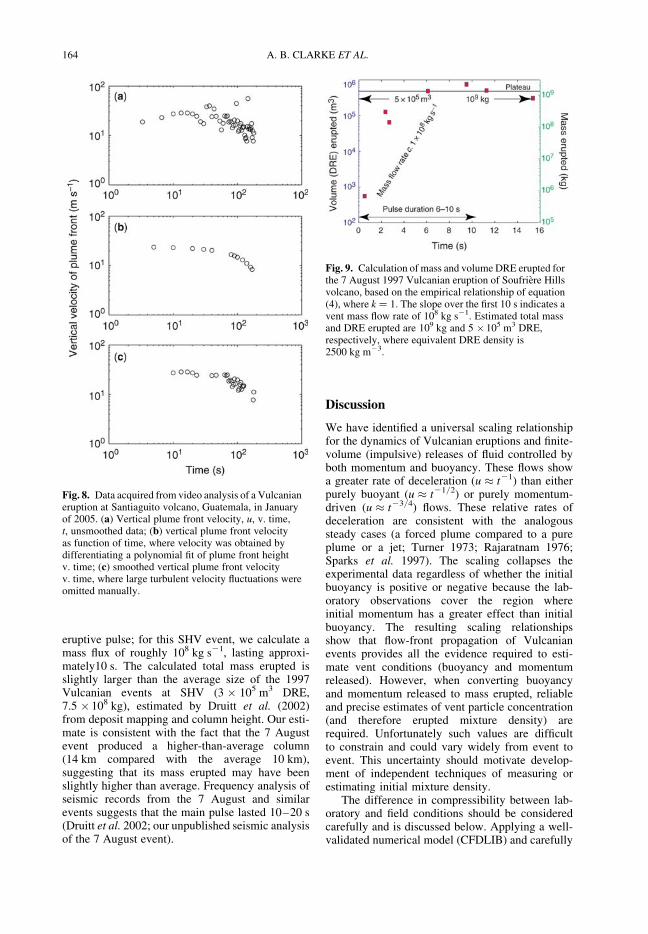
eruptive pulse; for this SHV event, we calculate amass flux of roughly 108 kg s21, lasting approxi-mately10 s. The calculated total mass erupted isslightly larger than the average size of the 1997Vulcanian events at SHV (3 � 105 m3 DRE,7.5 � 108 kg), estimated by Druitt et al. (2002)from deposit mapping and column height. Our esti-mate is consistent with the fact that the 7 Augustevent produced a higher-than-average column(14 km compared with the average 10 km),suggesting that its mass erupted may have beenslightly higher than average. Frequency analysis ofseismic records from the 7 August and similarevents suggests that the main pulse lasted 10–20 s(Druitt et al. 2002; our unpublished seismic analysisof the 7 August event).
Discussion
We have identified a universal scaling relationshipfor the dynamics of Vulcanian eruptions and finite-volume (impulsive) releases of fluid controlled byboth momentum and buoyancy. These flows showa greater rate of deceleration (u � t21) than eitherpurely buoyant (u � t21/2) or purely momentum-driven (u � t23/4) flows. These relative rates ofdeceleration are consistent with the analogoussteady cases (a forced plume compared to a pureplume or a jet; Turner 1973; Rajaratnam 1976;Sparks et al. 1997). The scaling collapses theexperimental data regardless of whether the initialbuoyancy is positive or negative because the lab-oratory observations cover the region whereinitial momentum has a greater effect than initialbuoyancy. The resulting scaling relationshipsshow that flow-front propagation of Vulcanianevents provides all the evidence required to esti-mate vent conditions (buoyancy and momentumreleased). However, when converting buoyancyand momentum released to mass erupted, reliableand precise estimates of vent particle concentration(and therefore erupted mixture density) arerequired. Unfortunately such values are difficultto constrain and could vary widely from event toevent. This uncertainty should motivate develop-ment of independent techniques of measuring orestimating initial mixture density.
The difference in compressibility between lab-oratory and field conditions should be consideredcarefully and is discussed below. Applying a well-validated numerical model (CFDLIB) and carefully
Fig. 8. Data acquired from video analysis of a Vulcanianeruption at Santiaguito volcano, Guatemala, in Januaryof 2005. (a) Vertical plume front velocity, u, v. time,t, unsmoothed data; (b) vertical plume front velocityas function of time, where velocity was obtained bydifferentiating a polynomial fit of plume front heightv. time; (c) smoothed vertical plume front velocityv. time, where large turbulent velocity fluctuations wereomitted manually.
Fig. 9. Calculation of mass and volume DRE erupted forthe 7 August 1997 Vulcanian eruption of Soufriere Hillsvolcano, based on the empirical relationship of equation(4), where k ¼ 1. The slope over the first 10 s indicates avent mass flow rate of 108 kg s21. Estimated total massand DRE erupted are 109 kg and 5 �105 m3 DRE,respectively, where equivalent DRE density is2500 kg m23.
A. B. CLARKE ET AL.164
examining their velocity data, Formenti et al. (2003)show that, for Vulcanian eruptions at Soufriere Hillsvolcano, Montserrat, pressure inside individual jetsadjusts to atmospheric pressure within 50 m abovethe vent (within c. 2 vent diameters), and initiallysupersonic flows decelerate to subsonic conditionsover similar distances. Their finding is reasonablyconsistent with other field observations (velocitydata in Fig. 7), and with relationships based onunderexpanded supersonic jet experiments (Yuceil& Otugen 2002), which allow the location andcharacteristics of the virtual source (the point atwhich the flow becomes pressure-balanced) to becalculated from physical vent conditions. Accordingto the study, an underexpanded jet reaches ambientpressure at some finite distance from the vent (theexpansion region), beyond which the jet behavesas an ordinary pressure-balanced jet and thereforedoes not go through any additional pressureadjustments.
Applying, with caution, the relationships derivedfor steady, supersonic, ideal-gas jets (Yuceil &Otugen 2002) and assuming eruption pressuresranging from 1 to 10 MPa (Chojnicki et al. 2006),we estimate virtual source characteristics oftypical Vulcanian eruptions. The estimates dependstrongly on input parameters which can be difficultto constrain. However, even for the highest eruptionpressures and end-member values of fluid properties(sound speed, a ¼ 10 m s21; ratio of specific heats,g approaching 1), the calculated distance fromphysical vent to virtual source is not more than700 m, and in most cases does not significantlyexceed 100 m. The virtual diameter in the mostextreme cases is much larger than physical ventdiameter (by a factor of 8), but is changed by onlya factor of 2 at low exit pressures. The velocity atthe virtual source is only slightly larger than it isat the actual vent (increase by a factor of c. 1.1).On the other hand, mixture density appears to bestrongly affected by expansion of water vapourbetween the physical and virtual vents, withmixture density decreasing by up to a factor of 70for the highest exit pressures. Given that Vulcanianeruption velocities generally decay to subsonic vel-ocities quickly, and that most data is taken frompoints greater than one hundred metres from thephysical vent (see literature sources of Fig. 7), weassert that the data generally represent the pressure-balanced, subsonic portion of the flow. Theserelationships also suggests that source conditionsderived from our relationships (equations 3 and 4)apply to a virtual source, rather than a physicalvent, and that this distinction may be most signifi-cant for very high eruption pressures (10 MPa),representing relatively rare Vulcanian events. Wealso suggest that future field measurements ofinitial mixture density consider this distinction.
Conclusions and recommendations
We develop a robust scaling relationship(equations 3 & 4, Figs 6 & 7) that captures thedynamics of the propagation of short-lived labora-tory experiments and several observed Vulcanianeruptions where both momentum and buoyancymay be important to flow propagation. Therelationship was successfully applied to the well-documented event of 7 August 1997 at SoufriereHills volcano, Montserrat, in order to demonstratehow the analysis can be used to estimate the time-varying vent mass flux and total mass erupted for aVulcanian eruption (which can not be measureddirectly) from the vertical flow-front velocity(Fig. 9). The scaling relationship on which thisestimate is based holds over a wide range ofinitial conditions, so the method is robust anddoes not depend on whether the flow is positivelybuoyant or purely momentum driven.
In order to better understand Vulcanian eruptiondynamics, we strongly recommend more detailedfield documentation of short-lived explosive erup-tions. Field studies, when possible, should measureplume vertical velocity as a function of time, usedeposits to constrain total mass erupted for individ-ual events, and use seismic signals to estimate pulseduration (e.g. Druitt et al. 2002). Vent particle con-centration (and therefore erupted mixture density) isdifficult to constrain and could vary widely fromevent to event. However, if both time-variantplume front vertical velocity and total masserupted are independently measured, the relation-ships presented here for real eruptions (equation 4)can be used to constrain vent (virtual source) par-ticle concentration. Novel ways to directly measureparticle concentration and mixture density at thevent would greatly improve our understanding ofimpulsive explosive eruptions.
We gratefully acknowledge helpful discussions withH. J. Fernando, A. J. Hogg, laboratory assistance fromC. Skiba, and financial support from NSF EAR 0541925.This manuscript was improved by the insightful reviewsby M. T. Guðmundsson & B. Zimanowski as well as sug-gestions from the editors, in particular by Guðrun Larsen.
References
CAREY, S. & SIGURDSSON, H. 1987. Temporal variationsin column height and magma discharge rate during the79 A.D. eruption of Vesuvius. Geological Society ofAmerica Bulletin, 99, 303–314.
CHOJNICKI, K., CLARKE, A. B. & PHILLIPS, J. C. 2006.A shock-tube investigation of the dynamics of gas-particle mixtures: implications for explosive volcaniceruptions. Geophysical Research Letters, 33, L15309,doi:10.1029/2006FL026414.
DYNAMICS OF VULCANIAN EXPLOSIONS 165
CLARKE, A. B., NERI, A., MACEDONIO, G., VOIGHT, B.& DRUITT, T. H. 2002. Computational modeling of thetransient dynamics of the August 1997 Vulcanianexplosions at Soufriere Hills volcano, Montserrat:influence of initial conduit conditions on near-ventpyroclastic dispersal. Journal of the Geological Society,London, Memoir, 21, 319–348.
COOKMAN, J. L., METZGER, J. M., FLEMINGS, P. B. &SLINGERLAND, R. L. 1997. A numerical model ofsedimentation from suspension in a buoyant plume.Eos, Transactions, American Geophysical Union, 78,Fall Meeting Supplement, 276.
DI MURO, A., NERI, A. & ROSI, M. 2004. Contempora-neous convective and collapsing eruptive dynamics:The transitional regime of explosive eruptions. Geo-physical Research Letters, 31, L10607; doi:10.1029/2004GL019709.
DOUGLAS, J. F. 1969. An Introduction to DimensionalAnalysis for Engineers. Pitman, London.
DRUITT, T. H. & YOUNG, S. R. 2002. Episodes of cyclicVulcanian explosive activity with fountain collapse atSoufriere Hills volcano, Montserrat. In: DRUITT, T. H.& KOKELAAR, B. P. (eds) The Eruption of SoufriereHills Volcano, Montserrat, from 1995 to 1999. Geo-logical Society, London, Memoirs, 21, 281–306.
FAGENTS, S. A. & WILSON, L. 1993. Explosive volcaniceruptions – VII. The ranges of pyroclasts ejected intransient volcanic explosions. Geophysical JournalInternational, 113, 359–370.
FORMENTI, Y., DRUITT, T. H. & KELFOUN, K. 2003.Characterization of the 1997 Vulcanian explosions ofSoufriere Hills Volcano, Montserrat, by video analysis.Bulletin of Volcanology, 65, 587–605.
HOBLITT, R. 1986. Observations of the Eruptions of July22 and August 7, 1980, at Mount St. Helens, Washing-ton. United States Geological Survey ProfessionalPapers, 1335.
HOUGHTON, B. F., WILSON, C. J. N., FIERSTEIN, J. &HILDRETH, W. 2004. Complex proximal depositionduring the Plinian eruptions of 1912 at Novarupta,Alaska. Bulletin of Volcanology, 66, 95–133.
ISHIHARA, K. 1985. Dynamical analysis of volcanicexplosion. Journal of Geodynamics, 3, 327–349.
JOHNSON, J. B., HARRIS, A. J. L., SAHETAPY-ENGEL,S. T. M., WOLF, R. & ROSE, W. I. 2004. Explosiondynamics of pyroclastic eruptions at SantiaguitoVolcano. Geophysical Research Letters, 31, L06610;doi:10.1029/2003GL019079.
KAMINSKI, E., TAIT, S. & CARAZZO, G. 2005. Turbulententrainment in jets with arbitrary buoyancy. Journalof Fluid Mechanics, 526, 361–376.
LEE, K., LEE, C. & JOO, Y. 2004. Application techniqueof particle image velocimetry and entropy analysis toinvestigate spray structure for gasoline direct injectioninjector. Measurements in Science and Technology, 14,953–964.
MORRISSEY, M. M. & MASTIN, L. G. 2000. VulcanianEruptions. In: SIGURDSSON, H. (eds) Encyclopedia ofVolcanoes. Academic Press, San Diego, CA, 463–475.
MORTON, B. R. 1959. Forced plumes. Journal of FluidMechanics, 5, 151–163.
MORTON, B. R., TAYLOR, G. I. & TURNER, J. S. 1956.Turbulent gravitational convection from maintainedand instantaneous sources. Philosophical Transactionsof the Royal Society of London A, 234, 1–23.
NAIRN, I. A. 1976. Atmospheric shock waves and conden-sation clouds from Ngaurhoe explosive eruptions.Nature, 259, 190–192.
NAIRN, I. A. & SELF, S. 1978. Explosive eruptions andpyroclastic avalanches from Ngauruhoe in February1975. Journal of Volcanology and GeothermalResearch, 3, 39–60.
RAJARATNAM, N. 1976. Turbulent Jets. Elsevier,Amsterdam.
ROSE, W. I. 1980. Gas and hydrogen isotopic analysesof volcanic eruptions clouds in Guatemala sampledby aircraft. Journal of Volcanology and GeothermalResearch, 7, 1–10.
SCOTT, W. E., HOBLITT, R. P., TORRES, R. C., SELF, S.,MARTINEZ, M. L. & NILLOS, T. JR. 1996. Pyroclasticflows of the June 15, 1991, climactic eruption of MountPinatubo. In: NEWHALL, C. G. & PUNONGBAYAN, R.S. (eds) Fire and Mud: Eruptions and Lahars of MountPinatubo, Philippines. University of Washington Press,Seattle, WA, 545–570.
SELF, S., WILSON, L. & NAIRN, I. A. 1979. Vulcanianeruption mechanisms. Nature, 277, 440–443.
SPARKS, R. S. J. & WILSON, L. 1982. Explosive volcaniceruptions – V. Observations of plume dynamicsduring the 1979 Soufriere eruptions, St. Vincent. Geo-physical Journal of the Royal Astronomical Society,69, 551–570.
SPARKS, R. S. J., BURSIK, M. I., CAREY, S. N., GILBERT,J. S., GLAZE, L. S., SIGGURDSSON, H. & WOODS, A.1997. Volcanic Plumes. John Wiley & Sons,New York.
STIX, J., TORRES, R. C., NARVAEZ, L., CORTES, P.,RAIGOSA, J., GOMEZ, D. & CASTONGUAY, R. 1997.A model of Vulcanian eruptions at Galeras volcano,Colombia. Journal of Volcanology and GeothermalResearch, 77, 285–303.
SUDARIKOV, S. M. & ROUMIANTSEV, A. B. 2000. Struc-ture of hydrothermal plumes at the Logatchev ventfield, 14 degrees 450N, Mid-Atlantic Ridge; evidencefrom geochemical and geophysical data. Journalof Volcanology and Geothermal Research, 101,245–252.
TURNER, J. S. 1966. Jets and plumes with negative orreversing buoyancy. Journal of Fluid Mechanics, 26,779–792.
TURNER, J. S. 1973. Buoyancy Effects in Fluids. Cam-bridge University Press, New York.
WAITT, R. B., MASTIN, L. G. & MILLER, T. P. 1995.Ballistic showers during Crater Peak eruptions ofMount Spurr Volcano, summer 1992. United StatesGeological Survey Bulletin, 2139, 89–106.
WILSON, L., SPARKS, R. S. J. & WALKER, G. P. L. 1980.Explosive Volcanic Eruptions IV. The control ofmagma properties and conduit geometry on eruptioncolumn behaviour. Geophysical Journal of the RoyalAstronomical Society, 63, 117–148.
WOHLETZ, K. H. 2001. Pyroclastic surges and com-pressible two-phase flow. In: FREUNDT, A. & ROSI,M. (eds) From Magma to Tephra. Elsevier, Amster-dam, 247–312.
WOODS, A. W. 1995. A model of vulcanian explosions.Nuclear Engineering and Design, 155, 345–357.
YUCEIL, K. B. & OTUGEN, M. V. 2002. Scaling par-ameters for underexpanded supersonic jets. Physicsof Fluids, 14, 4206–4215.
A. B. CLARKE ET AL.166
Copyright © 2022 FDOKUMEN