
An investigation of polyamide 6 and 12 synthesis in an ...
154
An investigation of polyamide 6 and 12 synthesis in an oscillatory baffled reactor Ross David Frank Laska Thesis submitted for the degree of Doctor of Philosophy Centre for Oscillation Baffled Reactor Applications (COBRA) School of Engineering and Physical Sciences Heriot-Watt University March 2019 The copyright in this thesis is owned by the author. Any quotation from this thesis or use of any of the information contained in it must acknowledge this thesis as the source of the quotation or information.
-
Upload
khangminh22 -
Category
Documents
-
view
5 -
download
0
Transcript of An investigation of polyamide 6 and 12 synthesis in an ...

An investigation of polyamide 6 and 12 synthesis
in an oscillatory baffled reactor
Ross David Frank Laska
Thesis submitted for the degree of Doctor of Philosophy
Centre for Oscillation Baffled Reactor Applications (COBRA)
School of Engineering and Physical Sciences
Heriot-Watt University
March 2019
The copyright in this thesis is owned by the author. Any quotation from this thesis or use of
any of the information contained in it must acknowledge this thesis as the source of the
quotation or information.

I
Abstract
This work focuses on the investigation of the synthesis of polyamide-12 (PA-12) particles in
an oscillatory baffled reactor (OBR) and was funded by Polymer Technology Ltd (PTL).
Despite considerable usage in industry, there is very little information available for both
synthesis and reaction kinetics of PA-12 synthesis. As a result, the initial effort was directed to
the study and the understanding of reaction kinetics and parameters affecting kinetics for the
PA-6 synthesis, a sister reaction, for which there are some literature and recipes on public
domain.
For the PA-6 reaction, the effects of various operational conditions on molecular
weight, particle size and melting point were investigated using the design of experiment (DOE)
technique. The results of the DOE studies indicated that temperature, the rate of chain initiator
injection and agitation speed had the most influence over specifications of PA-6 particles. A
new method for measuring reactant concentration by FTIR was devised, allowing reaction
kinetics to be extracted. By switching from a batch to a semi-continuous reactor, the reaction
order could change from 1st to zeroth, depending on the injection rate and reaction temperature.
The biggest deviation from batch conditions was that monomer to catalyst ratio in the semi-
continuous reactor did not have any effect over polymer properties.
From the learning of PA-6 synthesis, the PA-12 recipe was formulated and tested. By
using continuous injection of the chain initiator and by adding small amounts of caprolactam
and N, N-Ethylene bis(stearamide), PA-12 particles were successfully synthesised. As with
PA-6, reaction temperature, injection rate and stirring rate had a strong influence over PA-12
particle properties. However, while increasing the injection rate lead to an increase in the size
of PA-12 particles it caused PA-6 particles to decrease in size. Provided that the reaction recipe
can be developed further to stop the build-up of material between baffle columns the next steps
would be study the reaction under continuous conditions.

II
Acknowledgements
There are many people I need to thank who have helped me with my research. Without their
assistance, this project would not have been a success.
Firstly, I thank my doctoral advisor, Professor Xiongwei Ni for his constant direction,
support, patience and for the chance to carry out this enterprise. Furthermore, I need thank the
other members in the COBRA group: Juliet Adelakun, Guillermo Jimeno Millor, Meifen Jiang,
Arabella, McLaughlin and Francisca Navarro Fuentes for their help and friendship over the
course of the project.
Thanks to the technicians, Richard Kinsella and Douglas Wagener for their assistance
with experimental apparatus and their friendship. Additionally, thanks to Arno Kraft for
allowing me to borrow his spare Schlenk line. Thank you to Cameron Smith for his help in
obtaining and ordering the necessary equipment and supplies. Thanks to Andrew Haston for
his help with electronic apparatus and in the development of the syringe heater. Additionally,
I need to thank Dr Stephen Mansell and Rob Newland for their assistance in teaching me air
sensitive chemistry techniques. Thanks to Dr Florin Dan for his invaluable advice in creating
a working synthetic route for PA-12. Thank you to Warren Thompson for his help in learning
the statistical software Minitab. And thank you to Professor Graeme White for allowing me to
borrow his Fume hood.
For making sure that I kept a good balance between work and life I thank Rick, Tom
and Murray. And, finally, thanks to my family and my girlfriend Tatiana for their constant
backing, encouragement and love throughout this project.

III
Research Thesis Submission Please note this form should be bound into the submitted thesis.
Name: Ross David Frank Laska
School: Engineering and Physical Sciences
Version: (i.e.
First, Resubmission, Final)
Final Degree Sought:
Doctor of Philosophy, Chemical Engineering
Declaration In accordance with the appropriate regulations I hereby submit my thesis and I declare that: 1. The thesis embodies the results of my own work and has been composed by myself 2. Where appropriate, I have made acknowledgement of the work of others 3. The thesis is the correct version for submission and is the same version as any electronic
versions submitted*. 4. My thesis for the award referred to, deposited in the Heriot-Watt University Library, should be
made available for loan or photocopying and be available via the Institutional Repository, subject to such conditions as the Librarian may require
5. I understand that as a student of the University I am required to abide by the Regulations of the University and to conform to its discipline.
6. I confirm that the thesis has been verified against plagiarism via an approved plagiarism detection application e.g. Turnitin.
ONLY for submissions including published works Please note you are only required to complete the Inclusion of Published Works Form (page 2) if your thesis contains published works) 7. Where the thesis contains published outputs under Regulation 6 (9.1.2) or Regulation 43 (9)
these are accompanied by a critical review which accurately describes my contribution to the research and, for multi-author outputs, a signed declaration indicating the contribution of each author (complete)
8. Inclusion of published outputs under Regulation 6 (9.1.2) or Regulation 43 (9) shall not constitute plagiarism.
* Please note that it is the responsibility of the candidate to ensure that the correct version of the
thesis is submitted.
Signature of Candidate:
Date:
Submission
Submitted By (name in capitals):
ROSS DAVID FRANK LASKA
Signature of Individual Submitting:
Date Submitted:

IV
For Completion in the Student Service Centre (SSC)
Limited Access Requested Yes No Approved Yes No
E-thesis Submitted (mandatory for
final theses)
Received in the SSC by (name in
capitals): Date:

V
Table of Contents
Abstract………………………………………………………………………………... I
Acknowledgements……………………………………………………………………. II
Thesis Submission Form………………………………………………………………. III
Table of Contents……………………………………………………………………… V
List of Tables………………………………………………………………………….. VIII
List of Figures…………………………………………………………………………. X
Nomenclature…………………………………………………………………………. XIII
Acronyms……………………………………………………………………………... XV
Chapter 1 – Introduction………………………………………………………………. 1
1.1-Basis of research………………………………………………………………... 1
1.2-Research objectives…………………………………………………………….. 2
1.3-Structure of the thesis…………………………………………………………... 3
Chapter 2 – Literature Review………………………………………………………… 4
2.1-Polymers……………………………………………………………………….. 4
2.1.1-Polymerisation mechanisms……………………………………………… 6
2.1.1.1-Condensation polymerisation……………………………………….. 6
2.1.1.2-Chain-Growth Polymerisation………………………………………. 6
2.1.2-Methods of Polymerisation………………………………………………. 7
2.1.2.1-Bulk Polymerisation………………………………………………… 8
2.1.2.2- Solution/precipitation polymerisation……………………………… 8
2.1.2.3-Suspension polymerisation………………………………………….. 9
2.1.2.4-Emulsion polymerisation……………………………………………. 10
2.1.3-Nylon……………………………………………………………………... 11
2.1.4-Lactam-polymerisation mechanisms……………………………………... 13
2.1.5-Anionic Polymerisation mechanism……………………………………… 14
2.1.6-Anionic Polymerisation methods………………………………………… 19
2.1.7-Reaction kinetics…………………………………………………………. 21
2.1.8-Nylon Particle synthesis………………………………………………….. 26
2.1.9-Polymer development…………………………………………………….. 27
2.1.10-Morphology……………………………………………………………... 30
2.2-Oscillatory Baffled Reactors…………………………………………………... 33
2.2.1-Background………………………………………………………………. 33

VI
2.2.2-Mixing in an OBR………………………………………………………... 34
2.2.3-Fluid mechanics…………………………………………………………... 35
2.2.4-Polymerisation using Oscillatory Baffled Reactor……………………….. 39
2.2.5-Power consumption………………………………………………………. 41
Chapter 3 - Experimental setup and procedure………………………………………... 43
3.1-Experimental Apparatus……………………………………………………….. 43
3.1.1-The Stirred Tank Reactor (STR)…………………………………………. 43
3.1.2-The Oscillatory Baffled Reactor………………………………………….. 44
3.1.3-The set up for PA-6 equimolar kinetic measurements…………………… 45
3.2-Reagents……………………………………………………………………….. 46
3.3-Experimental procedures………………………………………………………. 46
3.3.1-Recipe and Procedure for PA-6 synthesis within STR…………………… 46
3.3.2-Procedure for PA-6 kinetic study in an OBR…………………………….. 47
3.3.3- Procedure for equimolar kinetics measurements………………………… 48
3.3.4-Recipe and Procedure for PA-12 synthesis………………………………. 49
3.4-Measurement tools…………………………………………………………….. 51
3.4.1-Melting point analysis……………………………………………………. 51
3.4.2-Particle size analysis……………………………………………………… 53
3.4.3-Molecular weight analysis………………………………………………... 54
3.4.4 Morphology analysis……………………………………………………... 57
3.5-Kinetics study………………………………………………………………….. 58
Chapter 4 - PA-6 synthesis and kinetics………………………………………………. 61
4.1 - PA-6 synthesis………………………………………………………………... 61
4.1.1-Introduction………………………………………………………………. 61
4.1.2-Factorial Design………………………………………………………….. 62
4.1.3-Experimental design……………………………………………………… 64
4.1.4-Interpretion of DOE data…………………………………………………. 65
4.1.5 Results and discussion……………………………………………………. 68
4.1.5.1-Effect of factors on the molecular weight…………………………... 68
4.1.5.2-Effect of factors on the melting point……………………………….. 72
4.1.5.3-Effect of factors on mean particle size……………………………… 76
4.2-Reaction Kinetics……………………………………………………………… 82
4.2.1-Introduction………………………………………………………………. 82

VII
4.2.2-Analytical methods……………………………………………………….. 83
4.2.3-Results and discussion……………………………………………………. 85
4.2.3.1-Effect of Chain initiator and catalyst concentration………………… 94
4.2.3.2-Effect of temperature on reaction kinetics………………………….. 99
4.2.3.3-Effect of mixing on kinetics………………………………………… 102
4.3-Conclusions……………………………………………………………………. 107
4.3.1-Plackett-Burman design conclusions……………………………………... 107
4.3.2-Kinetic measurement conclusions………………………………………... 107
4.4.-Problems………………………………………………………………………. 108
4.4.1-PA-6 synthesis……………………………………………………………. 108
4.4.2 Kinetics measurements…………………………………………………… 109
Chapter 5 - PA-12 synthesis…………………………………………………………... 111
5.1-Introduction……………………………………………………………………. 111
5.2-Results and discussions………………………………………………………... 111
5.2.1-Development of synthesis route………………………………………….. 111
5.2.2-Effect of experimental parameters on molecular weight…………………. 115
5.2.3-Effect of experimental parameters on mean particle size………………… 117
5.2.4 Effect of experimental parameters on melting point……………………... 119
5.2.5 Morphology………………………………………………………………. 120
5.3 Conclusions…………………………………………………………………….. 122
5.4 Problems, observations and solutions………………………………………….. 123
Chapter 6-Conclusions and future work………………………………………………. 125
6.1 Conclusions…………………………………………………………………….. 125
6.2 Future research…………………………………………………………………. 128
References……………………………………………………………………………... 131

VIII
List of Tables
Table 2.1 Table of potential catalysts, chain initiators and solvents………………….. 15
Table 3.1 Physical properties of reagents for PA-6 synthesis………………………… 46
Table 3.2 Reaction conditions for PA-6 synthesis within OBR………………………. 48
Table 3.3 The reaction conditions for kinetics studies under equimolar conditions….. 49
Table 3.4 Recipe and physical properties of reagents for PA-12 synthesis…………… 49
Table 3.5 PA-12 synthesis reaction parameters……………………………………….. 50
Table 3.6 Table of CI mixture constituents…………………………………………… 51
Table 3.7 Particle size distributions of PA-6 and PA-12 samples…………………….. 54
Table 3.8 Molecular weights of PA-6 and PA-12 samples…………………………… 57
Table 3.9 Summary of the calibration curve data……………………………………... 60
Table 4.1 List showing how many experiments are required to carry out a full
factorial analysis depending on how many variables are present……………………...
63
Table 4.2 List of different factorial designs and required experiments that can be
used to analyse 6 factors……………………………………………………………….
64
Table 4.3 Table of variables values and desired responses…………………………… 65
Table 4.4 Plackett-Burman screening design with six variables generated using
Minitab software……………………………………………………………………….
68
Table 4.5 Summary of each model studying the influence of various factors over
molecular weight………………………………………………………………………
69
Table 4.6 Summary of each model studying the influence of various factors over
melting point model……………………………………………………………………
73
Table 4.7 Model summaries for each mean particle size model………………………. 77
Table 4.8 Table of all p-values for all models………………………………………… 81
Table 4.9 Table of raw data from DOE investigations (results are not presented in
their initial randomised order)…………………………………………………………
82
Table 4.10 Table of CI injection rates with corresponding reaction orders and rate
constants………………………………………………………………………………..
96
Table 4.11 Table of catalyst volumes with corresponding reaction orders and rate
constants………………………………………………………………………………..
99
Table 4.12 Table of reaction temperatures with corresponding reaction orders and
rate constants…………………………………………………………………………...
99

IX
Table 4.13 Oscillatory Reynolds numbers for the corresponding oscillation frequency 104
Table 5.1 Percentage yield of PA-12 after 2 hours using different masses of EBS and
caprolactam contents. Reaction considered a failure if uncontrollable agglomeration
occurred………………………………………………………………………………...
114
Table 5.2. Table displaying the influence of CI injection rate, temperature and mass
of EBS on the molecular weight……………………………………………………….
116
Table 5.3 Table displaying the influence of CI injection rate, reaction temperature
and mass of EBS on the PA-12 particle size…………………………………………...
118
Table 5.4 Influence of variables on the PA-12 melting point and degree of
crystallinity…………………………………………………………………………….
119

X
List of Figures
Figure 2.1 Diagram of suspension polymerisation in action………………………….. 10
Figure 2.2 Representation of emulsion polymerisation in action……………………... 11
Figure 2.3 Anionic Initiation and Propagation reactions in the polymerisation of un-
substituted lactams……………………………………………………………..............
17
Figure 2.4 Example of potential side reactions that can take place during
polymerisation………………………………………………………………………….
18
Figure 2.5 Adiabatic conversion of nylon-6 with an initial polymerization
temperature of 136°C and caprolactam magnesium bromide concentration of
108mmol L-1. Isophthaloyl-bis-caprolactam concentrations used were 40mmol L-1
(lower line), 70mmol L-1 (middle line) and 100mmol L-1 (upper line)………………..
23
Figure 2.6 Adiabatic conversion of nylon-6 experimental data for initial
polymerization temperature of 135C with isophthaloyl-bis-caprolactam (chain
initiator) concentrationof 70mmol-1 and caprolactam magnesium bromide of
108mmol-1 (lower curve) and 150mmol-1 (higher curve)……………………………...
25
Figure 2.7 Illustration of the various phases of polymer particle development……….. 30
Figure 2.8 SEM image of PA-6 particles: a) PA-6 with defined spherulites resultant
from the use of a quick/slow CI/catalyst combination6 b) PA-6with a macroporous
continuous network resultant from the use of slow/slow or a slow/quick CI/catalyst
combination…………………………………………………………………………….
31
Figure 2.9 Eddy formation within an OBR…………………………………………..... 34
Figure 2.10 Flow within a tube with diameter D……………………………………… 35
Figure 2.11 Oscillatory motion applied to flow in a tube……………………………... 36
Figure 2.12 Oscillatory baffled flow…………………………………………………... 36
Figure 2.13 Effect of oscillation frequency on mean particle size with a fixed
amplitude and baffle width…………………………………………………………….
40
Figure 2.14 Effect of amplitude on mean particle size at a fixed frequency and baffle
width……………………………………………………………………………………
41
Figure 3.1 Setup for STR. Note that in this setup a syringe was used instead of Teflon
tubing. Schlenk line connector not shown……………………………………………..
43
Figure 3.2 Setup of oscillated baffled reactor, for simplicity the Schlenk line,
hairdryer and various seals used were not displayed…………………………………..
45
Figure 3.3 In-depth look at the syringe pump and baffle……………………………… 45
XI
Figure 3.4 DSC spectrum showing melting point of all substances in the reaction
mixture…………………………………………………………………………………
52
Figure 3.5 DSC spectrum comparing melting point of synthesised PA-6 particles and
control PA-6……………………………………………………………………………
52
Figure 3.6 DSC spectrum comparing melting point of synthesised PA-12 particles
and control PA-12……………………………………………………………………...
53
Figure 3.7 a) Particle size distribution of PA-12 synthesised particles b) Particle size
distribution of PA-6 synthesised particles……………………………………………..
54
Figure 3.8 Average molecular weight distributions based upon two scans of various
synthesised PA-12 polymer particles…………………………………………………..
56
Figure 3.9 Molecular weight distributions of various synthesised PA-6 polymer
particles………………………………………………………………………………...
56
Figure 3.10 Example SEM images of PA-12………………………………………….. 58
Figure 3.11. a) FTIR spectra of caprolactam dissolved in ethylbenzene at the
beginning of the reaction and b) FTIR spectra of caprolactam dissolved in
ethylbenzene near the end of the reaction……………………………………………...
59
Figure 3.12* Calibration curve showing how carbonyl peak height is related to
monomer concentration………………………………………………………………..
60
Figure 4.1 Pareto graphs of Models 1A (a) 2A (b), 3A(c) and 4A(d)………………… 70
Figure 4.2 Interaction plot between monomer mass and rate of injection…………….. 72
Figure 4.3 Cube plot of temperature, the rate of injection and monomer mass
relationship effects on molecular weight………………………………………………
72
Figure 4.4 Pareto graphs of Models 1B (a) 2B (b), 3B(c) and 4B(d)…………………. 74
Figure 4.5 Interaction plot between solvent volume and temperature for model 3B…. 75
Figure 4.6 Cube plot of temperature and solvent volume effects on 2nd melting point.. 76
Figure 4.7 Pareto graphs of Models 1C (a) 2C(b), 3C(c) and 4C(d)………………….. 77
Figure 4.8 Interaction plot between stirring speed and monomer mass for model 4d… 79
Figure 4.9 Cube plot of monomer mass, the rate of injection and stirring speed
relationship effects on molecular weight………………………………………………
80
Figure 4.10 Caprolactam consumption with time and the corresponding integrated
rate plots for one-shot injection of CI………………………………………………….
87
Figure 4.11 Caprolactam consumption with time and the corresponding integrated
rate plots for continuous injection of CI at a rate of 40µL/min………………………..
88

XII
Figure 4.12 Potential reaction mechanism for caprolactam reacting with octadecyl
isocyanate………………………………………………………………………………
88
Figure 4.13 a) OI consumption against time for single injection with a reaction
temperature of 70°C and corresponding integrated rate order plots…………………...
89
Figure 4.14 OI consumption against time for continuous injection at 70μL/min and
70°C and correspoding integrated rate plots…………………………………………...
90
Figure 4.15 OI consumption against time for one-shot injection at 40°C and
corresponding integrated rate order plots……………………………………………...
91
Figure 4.16 a) OI consumption against time for continuous injection at 70μL/min and
50°C and corresponding integrated order rate plots…………………………………...
92
Figure 4.17 a) OI consumption against time for continuous injection (35µL/min) at
80 C, b) Zero-order integrated rate plot………………………………………………..
93
Figure 4.18 Caprolactam consumption at injection rates of 40μL/min, 30μL/min and
20μL/min and corresponding integrated rate order plots for all injection rates………..
95
Figure 4.19 Caprolactam consumption with catalyst volumes of 2mL, 4mL and 6mL
and corresponding integrated rate order plots for all catalyst volumes………………..
97
Figure 4.20 Caprolactam consumption at temperatures 80°C, 90°C and 100°C. All
three experiments were carried out with an injection rate of 20μL/min……………….
100
Figure 4.21 a) Order tests for reaction temperatures of 80°C, 90°C and 100°C……… 100
Figure 4.22 Concentration profiles at different oscillation frequencies and
corresponding integrated rate order plots……………………………………………...
103
Figure 4.23 OI consumption under equimolar at stirring speeds 400, 600, and 800rpm
and corresponding integrated rate order plots………………………………………….
106
Figure 5.1 The build-up of oligomer on the baffle……………………………………. 112
Figure 5.2 Micrograph of PA-6 particles formed using a ‘slow-slow’ CI/catalyst
system………………………………………………………………………………….
121
Figure 5.3 Micrographs of Nylon-12 particles formed using a slow/slow CI/catalyst
combination at a magnification of a)x1811 and b) x5000……………………………..
121

XIII
Nomenclature
Symbol Definition Units
[A] Chain initiator concentration (mol-1 L)
[C] Catalyst concentration (mol-1 L)
Ao Response constant Varies
APIPE Cross-sectional area of pipe (m2)
APISTON Cross-sectional area of piston (m2)
b Autocatalytic term (l mol-1)
CA Reactant concentration and at point in time (mol L-1)
CA0 Initial concentration of material (mol L-1)
CD Discharge coefficient (--)
CV Fractional conversion (--)
D Pipe diameter (m)
D0 Orifice diameter (m)
Ds Diameter of stirrer (m)
F Oscillating frequency (Hz)
H Half channel width (m)
Hmax Max channel width (m)
K Pre-exponential factor Varies
k Number of variables within the model (--)
l Mixing length (m)
L Baffle spacing (m)
M0 Monomer concentration (mol-1 L)
N Number of baffles per unit length (m-1)
N Number of points within the data sample (--)
P/V Power density (W m-3)
Po Power number (--)
Q Volume flow rate (V min-1)
R Universal gas constant (J mol-1 K-1)
R2 Percentage of variation in response (--)
R2(adj) R2 value adjusted to account for different
predictors in model
(--)

XIV
rA Reaction rate Varies
Re Reynolds Number (--)
Ren Numerical Reynolds number (--)
Reop Orifice plate Reynolds number (--)
Rep Pulsating Reynolds number (--)
Stf Strouhal number (--)
T Temperature (K)
U Activation energy (J mol-1)
u0 Velocity (ms-1)
up Pulsating flow velocity (ms-1)
upeak Peak velocity maximum channel width (ms-1)
uref Velocity reference (ms-1)
V Dynamic viscosity (Pa.S)
VL Volume (m3)
X Variation of displacement (m)
Xc Degree of crystallinity (--)
xo Centre-to-peak oscillation amplitude (m)
Y A response Varies
Z An individual factor in a response Varies
α Baffle free area ratio (--)
β Ratio of the orifice to pipe diameter (--)
ΔHc Enthalpy of crystallisation (J/g)
ΔHc(100%) Heat of fusion for 100% crystalline
polymer
(J/g)
ΔHm Enthalpy of melting (J/g)
ρ Density (kg/m3)

XV
Acronyms
Name
ANOVA
Definition
Analysis of variance
ATR-FTIR Attenuated Total Reflection-Fourier Transform Infrared
CI Chain Initiator
CST Continuously stirred tank
DOE Design of Experiment
DSC Differential Scanning Calorimeter
FFD Fractional factorial design
GC Gas Chromatography
HFIP Hydrofluroisopropanol
HPLC High Performance Liquid Chromatography
HT-GC High Temperature Gas Chromatography
IDI Isophorone Diisocyanate
MMA Methylmethacrylate
OBF Oscillatory Baffled Flow
OBR Oscillating Baffled Reactor
OI Octadecyl Isocyanate
PB Plackett-Burman
PIB Polyisobutene
POF Pure oscillatory flow
PS Polystyrene
PTFE Polytetrafluoroethylene
PVC Poly(vinyl) chloride
RBF Round bottom flask
ROAP Ring-opening Anionic polymerisation
RTD Residence time distribution
SEM Scanning electron microscope
STR Stirred Tank Reactor
TGA-MS Thermal-gravimetric analysis-Mass spectroscopy
THF Tetrahydrofuran
TVA Thermal Volatilisation Analysis

1
Chapter 1 - Introduction
This chapter discusses the purpose and inspiration of the research.
1.1-Basis of research
Nylon is the name given to a range of polymers consisting of aliphatic and/or semi-aromatic
polyamides. Nylons are thermoplastics known for their high heat, wear and chemical
resistances. Since the initial creation by Wallace Carothers in 1935 at the DuPont research
facility, nylons have found usage in a vast range of applications including but not limited to
stockings, parachutes, toothbrushes and kitchen utensils. Originally nylons were synthesised
via a condensation reaction between a diamine and a dicarboxylic acid1. Later devised methods
involved the hydrolytic or anionic polymerisation of lactams. These methods were initially
developed to prevent patent violations2 and are still in use today. Unusually, anionic
polymerisation requires both a catalyst and chain initiator (CI) for a successful reaction.
Nylon powders (specifically nylon-6) were first synthesised by Chrzczonowicz in 1955
through the anionic precipitation polymerisation of caprolactam3. Since then nylon particles
have found usage in flame-spraying4, electrostatic coating5 and as lacquer binders6. Normally
the chain initiator is added in a single injection but as indicated by Florin and Grolier7 that
adding the CI continuously over a period improves the control over the reaction. However,
little research and publications are available on this very subject, the one-shot injection has
been the prescribed method in the production of nylon-6 alike. The impact of injection methods
on key process and polymer properties, such as melting point, molecular weight, particle size
and reaction kinetics, has not been investigated.
One of the derivatives to Nylon-6 (PA-6 from now) is Nylon-12 (PA-12 from now),
which is of key interest in this PhD work. Multiple different routes to synthesise PA-12 in a
powdered form already exist but the working recipes are company heirlooms and not available
for public viewership. Between Arkema, Evonik and UBE approximately 600,000 tons of
Nylon-12 is produced each year, most of which is used in cosmetic and powder coating
industries. However, these companies do not change the chemical or mechanic properties of
2
their products without substantial incentive. Often only small quantities of the material (< 250
kg per month) are required for a particular industrial sector, manufacturing could only be
possible if high sale price is warranted, commonly above £15/kg. This limits the applications
and developments of such materials. The grinding process currently used for customisation, in
addition to being expensive, produces a wider distribution of particle sizes. The ground material
must go through a sieving procedure in order to produce the correct distribution. It is not
unusual for more than 30% of the ground material to be discarded in the form of ‘fines’ or
oversized particles. The latter polymer beads would go through further grinding, while the
former presents significant hazards in storage and transportation.
This leaves a gap in the market, in which PA-12 could be produced in relatively small
quantities with customers tailored parameters at a lower cost. The continuous baffled
oscillatory reactor (COBR) provides uniform mixing, enhanced mass8 and heat transfer9 rates
that give better control over droplet/particle size and molecular weight distributions and is a
viable alternative to the traditional stirred tank reactors. Additionally, nylon particle formation
can take several hours and can be very power intensive. COBR’s can achieve maximum
conversion rates at much lower power densities than traditional stirred tanks, lowering
production costs. Finally, linear scale up relationships would make it easy to go from lab to
industrial scale relationships10.
Reaction kinetics and parameters affecting the kinetics of PA-6 synthesis under semi-
continuous conditions have not been investigated; understanding PA-6 reaction kinetics is also
the prologue for creating a synthesis route for PA-12 that is not available in public domain.
These are the motivations of this PhD work.
1.2-Research objectives
The following is the list of objectives for this thesis work:
• Develop an in-depth understanding of how reaction conditions affect properties of PA-
6, e.g. molecular weight, particle size and melting point;

3
• Develop an understanding of how reaction kinetics are influenced by adding the chain
initiator continuously;
• Develop a reproducible method to synthesise PA-12 within an OBR;
• Develop an understanding of how PA-12’s properties are affected by changes in
reaction temperature, injection rate and additive concentration.
1.3-Structure of the thesis
The thesis is divided into six chapters. After this introduction in Chapter two, there is a
literature review of current knowledge on nylon particle synthesis, properties and the OBR.
Chapter three describes the experimental set-ups, procedures and analytical methods
applied to accomplish research goals. Chapter 4 presents the work carried out on PA6. Firstly,
the factors affecting the desired polymer properties were analysed. This was followed by the
study of the reaction kinetics.
Chapter five describes how the synthesis route for the production of PA-12 was
developed and discuss how various factors affected polymer properties. Chapter 6 summarises
major findings from this work and recommends future research to be carried out based upon
the results of this PhD work.

4
Chapter 2 - Literature review
This chapter reviews background literature relevant to the synthesis of nylon particles and the
design and operation of the OBR.
2.1-Polymers
Polymers (also known as a class of macromolecules) are a class of large molecule synthesised
through the covalent bonding of many chemical units. These units are called monomers. For a
chemical to be considered a monomer it must possess two or more sites where bonding can
take place. A polymer does not have to be synthesised from only one monomer it can be made
from multiple different monomers. When a polymer is synthesised from only one monomer, it
is called a homopolymer. Should two monomers be used then the resultant polymer is called a
copolymer; and in rare cases when three monomers are used, the resultant polymer is called a
terpolymer. Copolymerisation is often used to improve the properties of existing
homopolymers. This is done by choosing monomers with separate desired characteristics
where these two different monomers can be arranged in four different ways along the chain,
depending on the desired properties of the polymer.
A polymer can display a range of different characteristics, with many different
parameters affecting polymer properties. In general, the four most important ones are 1)
Polymer size, as in molar mass and chain length; 2) Chemical composition, this determines the
strength of intramolecular and intermolecular bonding; 3) Polymer structure and architecture,
whether the material is made from branched or only single polymer chains, do chains bond
together to form networks? 4) Polymer shape, the degree of twisting, coiling, chain
entanglements etc. Through the manipulations of these characteristics, there are many different
potential properties that a polymer may possess. A polymer may have a high modulus,
preventing deformation; others will easily be deformed and capable of being severely elongated
but still capable of returning to their initial shape. More recent developments have shown that
polymers have possible applications in heterogeneous catalysts11, photovoltaic cells12,
molecular sensing13 and gas storage14.

5
There are multiple different ways to classify polymers; one of the more common ones
is based upon their group structure. Most synthetic plastics can be categorised into 3 groups:
plastics, fibres and elastomers but there is no set line between these groups. Plastics can also
be further subdivided into two other categories: thermoplastics and thermosets. The key
difference between the two is that thermoplastics soften upon heating and are capable of being
reshaped, becoming rigid again when cooled. In contrast, when a thermoset has been heated
above a set temperature they will become permanently solid and will not soften or change shape
upon being reheated.
Elastomers are easily deformed and capable of undergoing substantial elongations
while being able to recover their starting shape. A common example of this is an elastic band.
Flexible plastics usually have moderate to high tensile strength and modulus but also capable
of recovering its original shape after small deformations. Fibres and rigid plastics are
characterised by a high resistance to being deformed and high tensile strength. Kevlar is a key
example of a synthetic fibre; its high tensile strength allows it to be used in a range of
applications, the most famous of which is body armour. Owing to its exceptional stiffness,
Kevlar can also be used as a plastic reinforcement in aeroplanes, boat hulls etc. The difference
between fibre and rigid plastics is that fibre is a polymer that has been melted down and drawn
into a filament. This process involves stretching the polymer, uncoiling the polymer chains and
aligning them parallel to the direction of stretching. Such properties are called anisotropy. This
orientates the polymer along with an axis, making the fibre much stronger along the axis than
across it.
To summarise, polymers have a multitude of properties that allow them to be found in
a range of applications, with more waiting to be found.

6
2.1.1-Polymerisation mechanisms
2.1.1.1-Condensation polymerisation
Condensation polymerisation reactions are classified as polymerisation reactions involving the
elimination of a smaller molecule, such as water or hydrochloric acid. Because of this
elimination, the polymer will lack some of the atoms present within the monomer. A
condensation reaction is a form of step-growth polymerisation that is a reaction with
bifunctional (or multifunctional) chains in a stepwise fashion. For example, any two species
can react with each other; two monomers react to form a dimer, a dimer and a monomer form
a trimer, two dimers can react and so forth. As a result, while the monomer is used up very
quickly, the degree of polymerisation increases very slowly and so does molecular weight. As
a consequence of this, molecular weight distributions are usually broad and average molecular
weights are often lower than those of other methods. Molecular weights can be increased by
removing side product during the reaction and by ensuring an exact 1:1 ratio between
functional groups. Despite these disadvantages, condensation reactions are still used
extensively in industry, owing to their versatility. Examples include the production of Kevlar,
Nomex and polyimides. Furthermore, unlike addition polymers, a polymer formed through
condensation polymerisation may be biodegradable owing to the innate reversibility of the
condensation reaction.
2.1.1.2-Chain-Growth Polymerisation
Chain-growth polymerisation is a method of polymerisation in which an unsaturated monomer,
which can be vinyl or cyclic in nature, adds itself onto a growing chain’s active site15.
Depending on the functionality of the monomer in question, the growth of the polymer can
occur at one end only or at different ends. Chain-growth polymerisation methods are superior
to step-growth polymerisation methods if polymers with high molar masses are desired.
Additionally, unlike in step polymerisation where each individual monomer within a polymer
chain is a residue of its monomer, in chain-growth polymerisation, the polymer has the same
chemical composition of the monomer pre-polymerisation. The 3 most common forms of chain
growth polymerisation are free-radical, cationic and anionic. All three methods are comprised
of 3 individual stages: 1) initiation, where the active site is formed through the use of an

7
initiator; 2) propagation, where the active site created in the initiation step begins to grow into
a macromolecular chain via a kinetic chain mechanism, defined by a repeating sequence of a
monomer being added to the growing chain; and the final stage is 3) termination, where the
growth of a chain has stopped, either caused by the neutralisation of the active site or the
transfer of said site. There is no elimination of a small molecule during the polymerisation
process. This is crucial for potential applications within an OBR, as mixing could be affected
by the addition of small molecules.
Anionic polymerisation is a form of chain growth polymerisation that while somewhat
difficult to carry out experimentally, does have advantages over free-radical polymerisations.
In free-radical polymerisations, it is very easy for two growing polymer chains to react
together, either through recombination or disproportionation (a redox reaction in which a
chemical substrate undergoes oxidation and reduction reaction simultaneously to give two
different products, causing chain growth to terminate) reaction. In anionic (and cationic)
polymerisation, such terminations are not possible, as the negatively (positive in the case of
cationic polymerisation) charged ends repel each other electrostatically. Termination via chain
transfer is also highly unlikely as this requires a hydride (H-) to be transferred from a growing
chain onto a monomer; such a transfer is energetically unfavourable.
To summarise, there are multiple different ways that polymerisation can be
undertaken, choosing the correct mechanism is vital to polymer is synthesised with the
desired properties in the most efficient manner.
2.1.2-Methods of Polymerisation
There are many methods for chain addition polymerisation, such as bulk, solution, suspension
etc. Each of the relevant methodologies will be described in the following sections. In addition,
two step-growth polymerisation methods, condensation and evaporation will also be examined.

8
2.1.2.1-Bulk Polymerisation
Bulk polymerisation, also known as mass polymerisation, is a method where an initiator is
added to the molten monomer, for successful polymerisation the initiator must be soluble in
the monomer16. As there is no need for a dispersant or other solvent, the resultant polymer is
very pure, temperatures required are relatively high in comparison to other methods and
molecular weight distribution of products can easily be changed via the addition of a chain
transfer agent17. However, during bulk polymerisation, the rate of polymerisation increases,
instead of decreasing as would be expected, this leads to auto-polymerisation (i.e. acceleration
of reaction) or the so-called Tromorsdorf effect16. This is caused by an increase in viscosity of
the system as the reaction progresses. While the increase in viscosity decreases as the number
of termination steps takes place within the system17, 18, the increase in viscosity and the
Tromorsdorf effect make heat transfer and mixing challenging as the reaction proceeds.
Broader molecular weight distributions and low molecular weights of resultant polymers are
the direct outcomes. For these reasons, bulk polymerisation is not often used in industry.
Notable exceptions including the production of poly(ethylene), poly(styrene) and poly (methyl
methacrylate).17
2.1.2.2- Solution/precipitation polymerisation
Solution polymerisation can either be a homogeneous or heterogeneous (depending on whether
the polymer remains in solution) method of polymerisation. Should the polymer be soluble in
the solvent, it is called a lacquer or varnish19. If only the monomer is soluble, then the polymer
will precipitate as it’s formed19. Should a precipitate be formed the method is called
precipitation polymerisation. The monomer is dissolved within an inert solvent; catalyst can
then be added or can already be present within the solvent. Similar to bulk polymerisation,
solution polymerisation also experiences the Tromorsdorf effect but thermal control is better
as the solvents act as a dilutent16. Additionally, the solvent lowers the viscosity of the solution,
allowing for easier processing. If the final product is in pearl/bead/powder form, isolation of
the product is very easy19. However, like bulk polymerisation, molecular weights of products
tend to be low due to chain transfer to the solvent, but high molecular weights can be achieved
with longer durations. In addition, it is impossible to completely eliminate chain transfer, as no
solvent is entirely inert19. Solvent removal is then the problem as it can be expensive, very

9
difficult to be done fully19 and can cause the degradation of polymer properties. Finally, the
polymer produced is not as pure as that by bulk polymerisation. Polymers formed by this
method include polyacrylic acid and polyacrylonitrile.
2.1.2.3-Suspension polymerisation
Suspension polymerisation is a heterogeneous polymerisation technique where a monomer that
is (mostly) insoluble in water(or other polar liquid) is dispersed within the liquid in the form
droplets, as shown in Figure 2.120. A steric stabilizer is usually included within the system to
stop coalescence and an initiator is also added to the system. The initiator must be non-reactive
towards the solvent and be soluble in the monomer. The major aim is to form a uniform
dispersion of monomer droplets within the aqueous phase and to control the coalescence of
droplets during polymerisation. Reverse phase suspension polymerisations are also possible
where a hydrophilic polymer and catalyst are held within an aqueous phase which is dispersed
in a non-polar organic layer20. Suspension polymerisation does not have a problem with heat
control, viscosity or chain transfer but like solution polymerisation, the polymer must be
purified because it is not as pure at that achieved from bulk polymerisation19. An additional
problem is that if the monomer is rather soluble in water, the system would have to be
vigorously stirred to prevent agglomeration. Agglomeration is also a problem in the synthesis
of tacky polymers17. Despite this, suspension polymerisation has been used to synthesise
poly(vinyl) chloride (PVC) industrially, amongst others.

10
Figure 2.1 Diagram of suspension polymerisation in action21
2.1.2.4-Emulsion polymerisation
Emulsion polymerisation is like suspension polymerisation in that it is a heterogeneous
polymerisation technique. The name is a misnomer as polymerisation does not occur in
emulsion droplets but in latex particles that are formed at the beginning of the process22, 23.
Emulsion polymerisation requires a monomer with little to no water solubility, a water soluble
initiator and a surfactant24. The surfactant acts as an emulsifier for the monomer within the
continuous phase. The initiator and surfactant are not absolutely necessary to form the latex
required but it is uncommon for them to be absent24. Once all parts of the system have been
added a new phase will form as a polymer colloid, a dispersion of discrete, colloidally stable
latex particles24, 25. The mechanism of emulsion polymerisation is illustrated in Figure 2.2.
These latex particles are made up of many polymer chains. The surfactant prevents these latex
particles from coagulating together. Through emulsion polymerisation, polymers with high
molecular weights can be synthesised quickly and like with suspension polymerisation,
emulsion polymerisation does not have problems with heat control, viscosity or chain
transfer23.

11
Figure 2.2 Representation of emulsion polymerisation in action 26
In summary, there are numerous methods available to synthesise polymers, each with
its own advantages and disadvantages. Choosing the right method to create a viable synthetic
route for PA-12 particles is crucial.
2.1.3-Nylon
Nylon is the label given to a range of polymers, specifically aliphatic and semi-aromatic
polyamides (a polymer where the monomer units are bonded together via an amide bond). It
was the first commercially successful thermoplastic. Nylons are known for their high heat,
chemical and wear resistance. In addition, nylons are good at absorbing water from their
surroundings27. This absorption of water will affect the mechanical properties of the nylon;
improve the impact resistance and flexibility of the nylon at the cost of strength and stiffness.
Also, it is also an electrical insulator. These various characteristics have allowed nylons to be
useful in a range of applications including cable ties, fluid reservoirs, fishing lines, sporting
equipment, low voltage switch gears, carpets and a host of others18, 28.
The two main methods to synthesise nylons are either via a condensation reaction
between diamines and dicarboxylic acids or through the addition polymerisation of lactams or

12
amino acids with themselves. The first nylon used for industrial applications was synthesised
by Wallace Carothers at the DuPont research facility on February 28th 1935 via a step-growth
polymerisation reaction with adipic acid and hexamethylenediamine1. The first variant of nylon
was initially titled fibre-66, due to both the acid and the amine possessing 6 carbons. As there
were two separate monomers being used in the production of this variant of nylon, it is a
copolymer. Using the same condensation technique but with different substrates, a whole range
of different nylons can be produced. Today Nylon is synthesised via a range of techniques
including rotational moulding, casting, injection moulding or extrusion into film or fibre,
depending on the desired shape and properties. While nylon first found usage as the bristles in
toothbrushes, the main goal was for nylon to be a replacement for silk, specifically in woman’s
hosiery. This proved to be very successful and by 1941 30% of all hosiery was made from
nylon29. However, with the advent of WW2, all nylon production went to towards the war
effort.
As mentioned before lactams can also be used in the synthesis of nylons, however, this
route was not investigated by Carothers but by Paul Schlack, working for IG Farben. Schlack
attempted to reproduce the synthesis of nylon 6,6 without impeding on any patents2. Schlack
showed that via ring-opening polymerisation caprolactam can be polymerised to form a nylon1.
As caprolactam consists of 6 carbons, the new carbon is labelled nylon-6, because only one
monomer is used in the production of this polymer, nylon-6 is a homopolymer. These two
polymers are the two most commercially used nylons27. It must be noted that the method of
polymerisation has a substantial impact on polymer properties, with the melting point of nylon-
6,6 having a melting point of ~270°C while the melting point of nylon-6 is only ~220°C, despite
having the same molecular structure.
Nylons have a range of desirable properties and can be synthesised either by
condensation or chain-growth polymerisation. Due to the lack of eliminated molecule during
the polymerisation process the chain-growth method is the most suitable method.

13
2.1.4-Lactam-polymerisation mechanisms
There are multiple routes in which a lactam can be polymerised into its corresponding
polyamide including anionic and cationic30, 31 polymerisations, together with acidolytic32, 33,
aminolytic33, 34 and hydrolytic33, 35 processes. Initially, Schrock synthesised nylon-6 by heating
caprolactam to approximately 250 °C with up to 10% water present2. It should be noted that
polymerisation can occur without a catalyst present, however, this process is incredibly slow
and so does not contribute to polymer synthesis36.
Later work showed that lactam polymerisation could be performed using amines
(aminolytic process) and carboxylic acids (acidolytic process). The aminolytic process
involves the protonation of the lactam, however, the protonation happens in a very low amount
leading to long polymerisation times, even at temperatures above 200°C. Polymerisation times
under the acidolytic process are even longer. Hydrolytic polymerisation has been used in
industry to produce nylon-6 fibres37. However, hydrolytic polymerisation requires a very high
reaction temperature of ~250°C and extended reaction times. PA-12 has also been successfully
synthesised under hydrolytic conditions, requiring reaction temperatures of ~260°C38. The
cationic process has potential, but it does not produce polymers in such a high yield or with as
high molecular weights as the anionic method does. This is mostly due to the electron
withdrawing nature of the lactam functional group, which will stabilise the negative charge
required39.
The method with the most potential is anionic polymerisation; there is a substantial
amount of literature, both in journals and in patents detailing the usage of procedures in
producing PA-6 and various other polyamide derivatives using this method, including PA-1240-
44. Based upon literature surveyed, anionic polymerisation is one of the most used in modern
polyamide production methods: however, this does not preclude older techniques being used45,
46. Anionic polymerisation requires lower reaction temperatures than other methods, has faster
reaction times47 and produces polymers with low polydispersity. And crucially, no literature
has been found where nylon-6 particles have been synthesised by any other method other than
anionic polymerisation.
14
To summarise, due to the substantially lower reaction temperatures required and that it
the only addition polymerisation mechanism that has been proven to make polyamide particles,
anionic polymerisation seems the best mechanism for developing a synthesis route for PA-12.
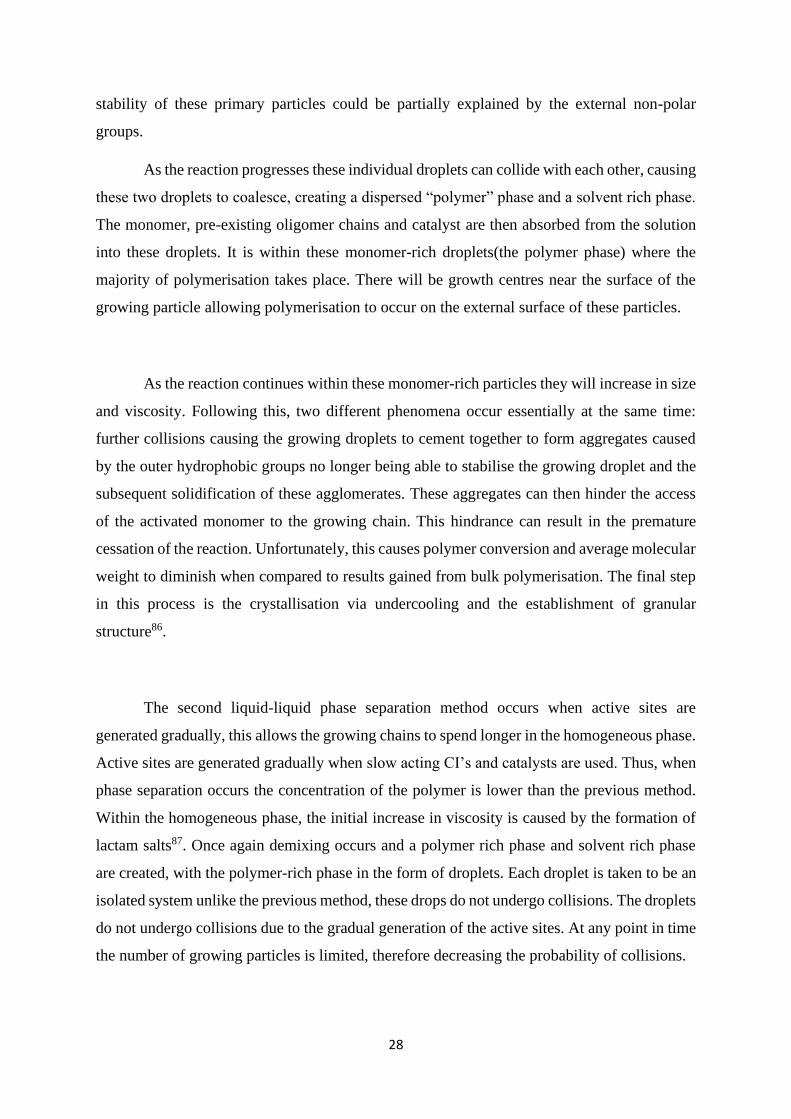
2.1.5-Anionic Polymerisation mechanism
Anionic polymerisation of lactams requires a “two” catalyst system consisting of a catalyst
(also known as an Initiator) and a chain initiator (also known as a co-catalyst or activator)39, 48.
What is named a catalyst can be more accurately described as a pre-catalyst. The ‘catalyst’ will
react with the lactam monomer to form an anionically activated monomer complex. It is this
complex that is the actual catalyst. The chain initiator acts as a growth centre for the growing
chain. Catalysts can be separated into three major groups: metal alkyl lactamates; strong bases
reacting with lactams to yield lactamates in irreversible or reversible reactions and substances
that have low to medium basicity initially but form strong bases in reaction conditions39.
Catalyst concentration is usually between 0.8 and 3 moles per 100 moles of lactam49, 47. There
are an array of catalysts and chain initiators to choose from when devising a synthetic route,
see Table 2.1 for potential catalysts and chain initiators.

15
Monomer Catalyst (Initiator) Activators (Cocatalyst) Solvent
Dodecalactam Alkali metals50 CO2 Decane
Metal Halides51 N-acyllactams e.g Ethylbenzene
Metal alkoxides52 Acyl chlorides THF
Grignard Reagents53 Ureas
Pentametylene guanidine54 Anhydrides
Quaternary ammonium salts55 Esters
Phosphazene56 Amides
Carbenes57 Diacylalkylamines
Bicyclic ‘superbase’
protophosphatranes58, 59
Acylating agents with a slow
acylating action
Isocyanates e.g Octadecylisocyanate
HCI: Hexamethylene diisocyanate
Imides e.g. DCI: N,N'-
dicyclohexylcarbodiimide or DICI
N,N'-Diisopropylcarbodiimide
Table 2.1 Table of potential catalysts, chain initiators and solvents
The full reaction for the anionic polymerisation of lactams is not completely understood
but the mechanism can be split into five steps. Figure 2.3 gives an in-depth mechanism for
these five steps. An unusual aspect of this reaction is that there are two ‘initiation’ stages. The
first initiation step in the polymerisation process is the formation of the anionically active
monomer through treatment with the chosen catalyst. For simplicity the first initiation step is
called the activation step. The first step is the creation of the anionically active monomer by
treating the monomer with the chosen catalyst(see step 1 in Figure 2.3).

16
Once the anionically activated monomer has been formed there are two possible
limiting situations that can take place60: a) acylation of the monomer by the active species; and
b) addition of chain initiator. In the case of a) the dimerisation of monomer is a slow reaction
because dimerization requires a substantial induction period as lactams are only moderately
good acylating agents. The chain initiator can either be formed in situ or added to the reaction
mixture pre-formed. The initiation step is the anionically active monomer reacting rapidly with
the chosen chain initiator via nucleophilic attack of the electron deficient carbon atom on the
CI36 (see step 2 in Figure 2.3). It is the resulting complex that is the true initiator of this
polymerisation. During this process a proton-exchange reaction will regenerate the active
monomer and protonate the negatively charged nitrogen atom on the chain end to complete the
cycle (step 3 in Figure 2.3). The propagation step is very similar to the to the initiation stage.
The difference is that following the nucleophilic attack of the ring of the previously added
lactam is broken open as shown in step 4. As with the initiation step a proton exchange reaction
regenerates the active monomer and the pattern will begin anew. Depending on chain initiator
the initiation mechanism may change somewhat but the core process will remain the same.

17
Figure 2.3 Anionic Initiation and Propagation reactions in the polymerisation of un-
substituted lactams36

18
As with any polymerisation process, there are multiple potential side reactions that can
take place. Two undesired disproportionation reactions involving polymer amide and amide
anions can potentially occur (see Figure 2.4)36. Undesired transacylation reactions can also
occur, causing depolymerisation of the integration of a single monomer unit (see Figure 2.4).
These are a small example of the potential side reactions that can take place, many others can
potentially occur, particularly at elevated temperatures.
Figure 2.4 Example of potential side reactions that can take place during polymerisation36
If care is taken any potential termination step can be avoided and ‘living’
polymerisation can be achieved. This would lead to polydispersities very close to one being
attained. However, as carbanions are very sensitive to moisture, oxygen and other potential
protic (a solvent which has a hydrogen atom attached to either an oxygen or nitrogen atom)
impurities, anionic polymerisation must be carried out under nitrogen in thoroughly dried
equipment and solvents, conditions for ‘living’ anionic polymerisation are more difficult to
achieve.

19
In summary, while the mechanism behind the anionic polymerisation of lactams is not
completely understood, there is a great deal of literature on the subject. However, the
mechanism may vary substantially depending on reaction conditions and the combination of
catalyst and CI used. Such variations can influence reaction kinetics.
2.1.6-Anionic Polymerisation methods
As mentioned previously anionic polymerisation must take place in an inert atmosphere, free
of moisture, and unfortunately, this does add complications for the implementation into a
continuous reactor. The four main potential methods to achieve anionic polymerisation of a
lactam into polyamide particles include polymerisation in suspension, emulsion, precipitation
and using a polystyrene (PS)/polyamide blend. One other possible method to make polyamide
particles exists, but involves dissolving the premade polymer and then expanding the solution
through various nozzles into the anti-solvent CO261. This method is used to makes particles
from polymers that are formed by condensation polymerisation such as nylon-6/6. This system
would be very difficult to adapt to a tubular reactor and unnecessarily expensive as the other
methods form particles directly from the monomer.
A novel method to synthesise polyamides from lactams is through the formation of a
polystyrene /polyamide blend, via the inversion of phase morphology caused by these blends
at low PS concentrations62, 63. Firstly, styrene is polymerised using the lactam as a solvent via
a free-radical polymerisation reaction to give polystyrene which surrounds the lactam. This is
then followed by the polymerisation of the lactam to its respective nylon variant via anionic
polymerisation. Resultant polyamide is in a mini-spherical form surrounded by PS. PS can be
dissolved via the addition of tetrahydrofuran (THF) to isolate the polyamide in a powdered
form. This method has potential, however, takes a great deal of time, with polymerisation of
styrene alone taking 24h and presently, the spread of the distribution of particle sizes available
by this method is quite small with sizes only ranging from 7μm to 80μm but are easily
reproducible62. Several years later work carried out by Wu et al64 used this method to
successfully synthesis PA-12 particles. They employed a more updated method where the
polystyrene was polymerised pre-reaction, drastically shortening the reaction time. Neither the

20
molecular weight nor particle size was analysed in their report but based on scanning electron
microscopy (SEM) images the particle size was approximately 20μm. Unfortunately, such a
polymerisation method would be very difficult to adapt to a tubular reactor and even harder to
make into a continuous system.
The polymerisation of caprolactam in suspension has been achieved65 requiring
temperatures of 180°C for polymerisation. The research65 showed that, while high temperatures
were required and at present no suspension stabiliser has been found, the technique gave control
over molecular weight and particle size. Suspension polymerisation of dodecalactam would be
harder to do than that of caprolactam as the technique requires the monomer to be in the molten
state, caprolactam melts at ~70°C while dodecalactam melts ~150°C. Molten solutions
generally have higher viscosity, impacting flowability. In addition, there is no way of knowing
if the suspending media of low molar mass polyisobutenes (PIB’s) would work as efficiently.
Additional problems include that PIB’s are extremely sticky, which would make it extremely
difficult, if not impossible, to use in any tubular reactor. The polymerisation of caprolactam
has also been achieved through emulsion polymerisation,66 one method necessitates the use of
very high temperatures ~210°C for up to 22 hours. The other emulsion polymerisation method
requires plenty of pre-reaction processing66. Despite these shortcomings, both emulsion
methods do have potential as a viable route for the polymerisation of caprolactam and
dodecalactam, however further work would be required to make either method be viable for
industry scale synthesis. As with emulsion and suspension polymerisation method precipitation
polymerisation has been used to produce nylon particles. Nearly all literature and patents
concerning nylon particle synthesis uses the precipitation method and required reaction
temperatures to synthesis PA-12 are lower than those required for emulsion and suspension
methods as the monomer is not required to be kept in the molten state.
In summary, a catalyst and chain initiator are required for successful polymerisation.
Multiple different anionic polymerisation methods are available, but the precipitation
polymerisation was considered the best to develop a synthesis route for PA-12.

21
2.1.7-Reaction kinetics
The chemical kinetics behind anionic polymerisation of a lactam is a complex process due to
the multiple irreversible and reversible reactions in which the active species of the reaction are
both spent and revived67. Information on the kinetics of nylon-6 particle synthesis is very
limited and no information is available in the public domain for the synthesis of PA-12
particles. However, there is a substantial volume of literature for bulk reaction kinetics that can
be used to enhance what little literature on particle synthesis is available.
Two approaches are taken to create a kinetic model: mechanistic models68-70 and overall
models71-73. A mechanistic model is ideal as it attempts to account for all possible reactions,
however, in the case of ROAP of lactams not all these reactions are understood, this leads to
the mechanistic approach being impractical. As such, overall models, in which all reactions
steps that happen within the system are accounted for by a single reaction step, are more
practical at this time67.
Numerous models have been proposed throughout years however the autocatalytic
model developed by Malkin72 is commonly used as a basis to understand nylon synthesis
kinetics. However, there is one substantial limitation to this model. It is only valid when the
catalyst and CI are of equal concentration. Following this, Bolgov et al67 then developed a
modification of this model that takes into account unequal amounts of catalysts and chain
initiators (see equation 2.1). It must be noted that it appears that only fast acting chain initiators
were used when developing this model. It is unknown if this model is valid when slow acting
CIs are used.

22
𝑑𝑋
𝑑𝑇= 𝐾 exp (
𝑈
𝑅𝑇)
[𝐴][𝐶]
[𝑀0](1 − 𝐶𝑉) × {1 +
𝑏
[𝐴][𝐶]12
} (2.1)
where CV is the fractional conversion, T is the temperature (K), K is the pre-exponential factor
(l mol-1 s-1), U is the activation energy (J mol-1), R is the universal gas constant (J mol-1 K-1),
[A] is chain initiator concentration (mol L-1), [C] catalyst concentration (mol L-1), M0 is the
initial monomer concentration (mol L-1), b is the autocatalytic term (l mol-1)67.
Investigations carried out by Davé, et al67 confirmed the kinetics of anionic
polymerisation of caprolactam through the use of an adiabatic reactor. These studies showed
that reaction temperature has a very strong effect on polymerisation. Going from a starting
polymerisation temperature of 117°C to 136°C showed a substantial increase in reaction rate
and conversion, however, increasing from 136°C to 157°C there is very little difference.
Crystallisation rate is at its maximum rate at 140-145°C. At lower temperatures, the
polymerisation rate is low due to growing polymer chains beginning to crystallise, limiting the
movement of the active site and ultimately suppressing the propagation of the growing chain.
At elevated temperatures equilibrium conversion had already been reached and so increasing
the temperature had no further impact on reaction kinetics.
As previously noted, the CI/catalyst combination has a very strong impact on
polymerisation kinetics. When a quick-quick or a quick-slow combination is used the formation
of the carbanion active species (the initiation step) is much faster, by several orders of
magnitude than the propagation step. The chain initiator only aids in the initiation of the
reaction and has no known involvement in the propagation step, however as the propagation
step can only take place post initiation the CI has a strong influence over kinetics. Figure 2.5
shows that altering the chain initiator concentration had a substantial effect on adiabatic
conversion, however only to a point, after which increasing concentration CI had little effect74.
Molecular weight has an inverse relationship with chain initiator concentration, the lower the
CI concentration, the larger the molecular weight of the resultant polyamide. When
polymerisation rate is slow long polymer chains can become entangled. This entanglement

23
creates a gel-like structure that can force the reaction to shift from a kinetic mechanism to a
diffusion one.
Figure 2.5 Adiabatic conversion of nylon-6 with an initial polymerization temperature of
136°C and caprolactam magnesium bromide concentration of 108mmol L-1.
Isophthaloyl-bis-caprolactam concentrations used were 40mmol L-1 (lower line),
70mmol L-1 (middle line) and 100mmol L-1 (upper line)67
These findings were substantiated by the work of Zhang et al75. The investigations
carried out by Zhang et al studied the synthesis of nylon-3 copolymers. Like with PA-6 particle
synthesis the reaction starts in a homogeneous medium but unlike PA-6 particle synthesis the
product, PA-3 remains in solution. Regardless these experiments found that there was a first-
order rate dependence on monomer and chain initiator concentration.

24
Investigations carried out by Stratula-Vahnoveanu et al76 is one of the few studies
looking at the kinetics of nylon particle synthesis. Their work showed that for the most part,
the reaction follows pseudo-first-order kinetics, but at later stages the reaction slows down,
causing the reaction to deviate from first order kinetics. This was partly attributed to
precipitated polymer causing the mobility of CI to decrease. In conjunction, the polymer
particles hinder the ability of the activated monomer to reach the active site of the growing
chain. As with bulk polymerisation increasing the temperature lead to a substantial increase in
reaction rate. Unlike bulk polymerisation, equilibrium conversion is not reached with
increasing temperature, but reaction temperatures above 140°C lead to the formation of large
aggregates that cling to the reactor wall.
The impact of mixing intensity has on chemical kinetics has been studied for decades77
and in nylon particle synthesis mixing intensity has a normal influence over reaction kinetics.
The mixing intensity has less influence on reaction rate than temperature and increasing the
mixing intensity past a certain point has no further influence on the reaction rate. Interestingly,
at low mixing rates, the reaction order can seemingly change from pseudo first order to pseudo-
zero-order reaction. The reason for this is not completely understood but it may be caused due
to a change in the hydrodynamic regime76.
The results from Stratula-Vahnoveanu and Vasiliu-Oprea was corroborated by the work
of Dan and Grolier7. Their investigation made no mention to the order of the reaction however
studies into mixing effects and temperature reported similar results to work carried out by
Stratula-Vahnoveanu.
The CI/catalyst combination also brings in another complication, depending on the
combination used the rate determining step can be altered. When both the catalyst and CI are
considered slow-acting, the rate determining step is the ‘initiation’ step between the CI and the
catalyst78. Therefore, the overall rate equation would be second order. In most literature, the
propagation step is considered the rate-determining step and most kinetic models are based on
this. There is, however some disagreement with this consensus. Work done by Ueda et al stated

25
that even the concentrations of the catalyst and chain initiator can cause the rate equation to
change79. It should also be noted that these observations were made using a far more efficient
catalyst and a CI that would be considered fast acting, so how valid such observations would
be for a slow acting catalyst/CI combination is questionable.
The catalyst concentration, despite being key to the propagation step, was found to have
to no effect on the adiabatic conversion (see Figure 2.6), at least within the concentrations
tested. Again, these results were backed up by Zhang et al43. They observed a zero-order rate
dependence on the catalyst concentration.
Figure 2.6 Adiabatic conversion of nylon-6 experimental data for initial polymerization
temperature of 135C with isophthaloyl-bis-caprolactam (chain initiator) concentration
of 70mmol-1 and caprolactam magnesium bromide of 108mmol-1 (lower curve) and
150mmol-1 (higher curve)67
In summary, the reaction kinetics reported differ, there have been very few published
works on both synthesis and kinetics in PA-6 and PA-12.

26
2.1.8-Nylon Particle synthesis
The methodology to synthesise nylon (nylon-6) particles was developed by the pioneering
research done by Chrzczonowicz3, 80-82. Initially, the particles were formed using a CI/catalyst
combination of carbon dioxide and sodium caprolactamate. Following this research, a host of
different catalysts and chain initiators was used to produce particles of various molecular
weights, particle sizes and morphologies. Regardless of the combination used, these nylon-6
particles are characterised as having high homogeneity and high molecular weight.83, 84. These
particles have an array of uses including but not limited to flame spaying4, electrostatic
coating5, thickener85, 86 and lacquer binders6. In comparison to bulk polymerisation, lower
basicity and milder temperatures are required for successful polymerisation as this limits the
formation of branching polymers. The result of this leads to polymers with greater structure
regularity and molecular weight homogeneity. Providing that the end product is stable, this
method can be used to synthesise a host of different nylon powders.
The synthesis of nylon particles is a complex process with many competing factors.
The most important of these factors include temperature, the initial concentration of monomer,
amount of catalyst and activator/catalyst ratio60. Temperature increases conversion, the degree
of polymerisation and particle size. The effect of temperature is limited and after a certain point
increasing temperature any further only gives negligible improvements. The monomer to
solvent ratio is in a delicate balance. If too much solvent is used, then the rate and degree of
polymerisation are poor. If too little solvent is used, then the degree of polymerisation
decreases as the mixture takes on more bulk-like characteristics. For numerous reasons a
substantial amount of catalyst is required to carry out polymerisation and much like the
monomer/solvent ratio, the monomer/catalyst is in a delicate balance. The combination of
catalyst and chain initiator is a vital part (perhaps the most important) of the synthesis as it has
a huge influence on particle size, molecular weight, product yield and morphology. Both the
catalyst and the chain initiators can broadly be put into two categories: “slow” and “fast”
acting6. The catalysts are characterised by their nucleophilicity: quick acting reagents such as
alkali metal caprolactamates (formed by reaction between monomer and sodium hydride) are
highly nucleophilic while slow acting reagents have a lower nucleophilicity. It is hypothesised
that for slow-acting catalysts electron donating substituents decrease the nucleophilicity. Thus,

27
there are four different combinations that can be used to induce polymerisation: a) quick-quick;
b) quick-slow; c) slow-quick, and d) slow-slow. When a quick-quick combination is used
polymerisation becomes more bulk-like in nature and product yields, particle sizes and
molecular weights are high. Conversely, product yields, particles sizes and molecular weights
are significantly smaller for slow-slow and slow-quick chain initiator/catalyst systems. The
quick-slow chain initiator/catalyst combination results in polymers with intermediate
properties.
In summary, many different factors influence the properties of nylon particles. How
adding the chain initiator continuously affects polymer properties has not been investigated in
literature. The correct choice of CI/catalyst combination is of vital important for the
development of a PA-12 synthesis route.
2.1.9-Polymer development
The polymerisation takes place mainly in a heterogeneous mixture consisting of, paradoxically
the lactam acting as a “solvent” and the hydrocarbon as the nonsolvent60. The liquid medium
enables the movement of monomer and catalytic components to the growing polymer. The
growing macromolecule has the greatest opportunity to grow when the mixture remains
homogeneous. As such, polymerisation is the fastest at the very beginning of the reaction. As
the caprolactam is consumed the reaction medium becomes poorer. This leads to phase
separation, indicated by of opalescence of the reaction mixture. Phase separation can occur in
different ways and is dependent on the concentration of the polymer.
When the concentration of polymer is high within the homogeneous phase (specifically
between binodal and spinodal lines), these conditions are usually met when a quick-slow
CI/catalyst combination is used, the growing polymer precipitates to form nuclei after a short
period of time. As there is no stabiliser used in this process the assumption is that polymer
chains within the nuclei are orientated with the hydrophobic end of the chain initiator are facing
outwards, to the non-polar solvent while the reactive growth centre faces inwards. As such, the
28
stability of these primary particles could be partially explained by the external non-polar
groups.
As the reaction progresses these individual droplets can collide with each other, causing
these two droplets to coalesce, creating a dispersed “polymer” phase and a solvent rich phase.
The monomer, pre-existing oligomer chains and catalyst are then absorbed from the solution
into these droplets. It is within these monomer-rich droplets(the polymer phase) where the
majority of polymerisation takes place. There will be growth centres near the surface of the
growing particle allowing polymerisation to occur on the external surface of these particles.
As the reaction continues within these monomer-rich particles they will increase in size
and viscosity. Following this, two different phenomena occur essentially at the same time:
further collisions causing the growing droplets to cement together to form aggregates caused
by the outer hydrophobic groups no longer being able to stabilise the growing droplet and the
subsequent solidification of these agglomerates. These aggregates can then hinder the access
of the activated monomer to the growing chain. This hindrance can result in the premature
cessation of the reaction. Unfortunately, this causes polymer conversion and average molecular
weight to diminish when compared to results gained from bulk polymerisation. The final step
in this process is the crystallisation via undercooling and the establishment of granular
structure86.
The second liquid-liquid phase separation method occurs when active sites are
generated gradually, this allows the growing chains to spend longer in the homogeneous phase.
Active sites are generated gradually when slow acting CI’s and catalysts are used. Thus, when
phase separation occurs the concentration of the polymer is lower than the previous method.
Within the homogeneous phase, the initial increase in viscosity is caused by the formation of
lactam salts87. Once again demixing occurs and a polymer rich phase and solvent rich phase
are created, with the polymer-rich phase in the form of droplets. Each droplet is taken to be an
isolated system unlike the previous method, these drops do not undergo collisions. The droplets
do not undergo collisions due to the gradual generation of the active sites. At any point in time
the number of growing particles is limited, therefore decreasing the probability of collisions.
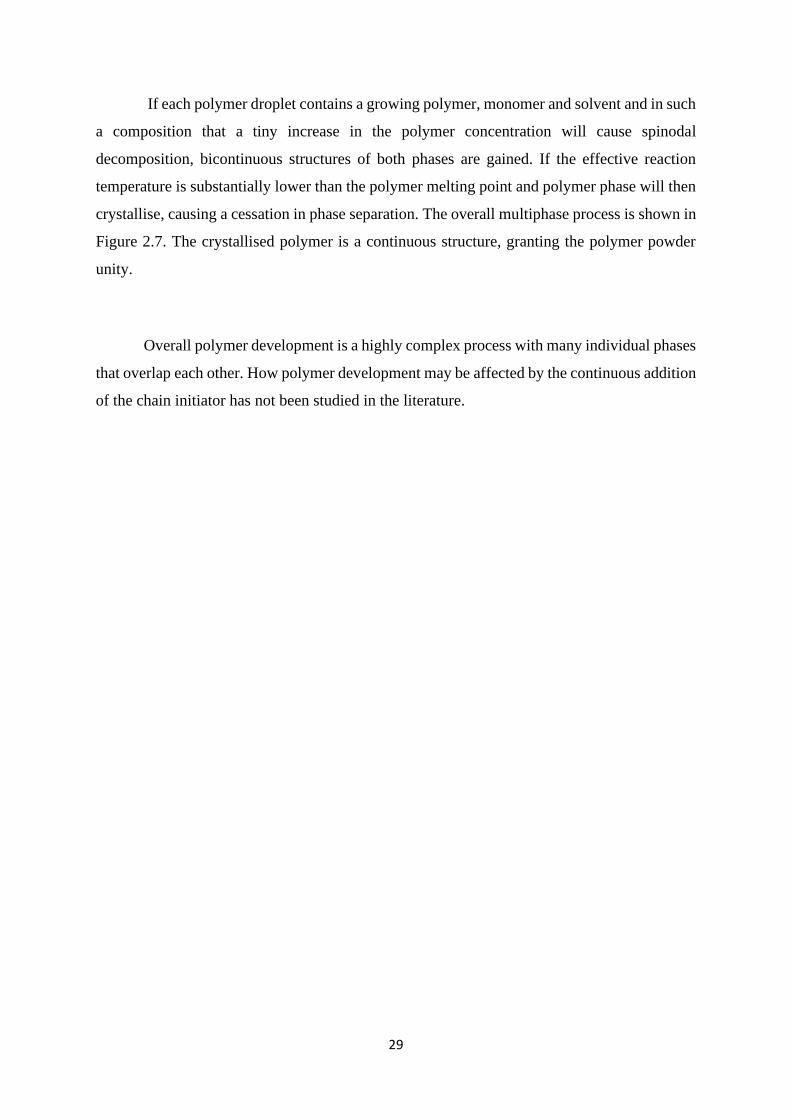
29
If each polymer droplet contains a growing polymer, monomer and solvent and in such
a composition that a tiny increase in the polymer concentration will cause spinodal
decomposition, bicontinuous structures of both phases are gained. If the effective reaction
temperature is substantially lower than the polymer melting point and polymer phase will then
crystallise, causing a cessation in phase separation. The overall multiphase process is shown in
Figure 2.7. The crystallised polymer is a continuous structure, granting the polymer powder
unity.
Overall polymer development is a highly complex process with many individual phases
that overlap each other. How polymer development may be affected by the continuous addition
of the chain initiator has not been studied in the literature.

30
Figure 2.7 Illustration of the various phases of polymer particle development86
2.1.10-Morphology
The morphology of polymer particles is controlled by a complex array of competing
components such as phase separation and crystallisation. As mentioned previously the choice
of chain initiator/catalyst has a strong influence on the morphology of polymer particles. For

31
the quick-quick combination three different chain initiators where investigated by Dan et al6
and all resulted in fused agglomerates made from smaller individual particles. The shape of
these individual particles was found to become more irregular as the efficiency of the chain
initiator increased, even for chain initiators of the same class. Increasing the chain initiator
efficiency naturally increases the number of polymer rich domains. The higher number of
domains causes the reaction medium to favour the coalescence of liquid droplets, this results
in irregular particles with a cactus-like structure6.
The inner structure of these individual particles changes from a more solid spherulitic
structure to a crudely spherical globular morphology as the efficiency of the chain initiator
decreases. For the highly efficient CIs the spherulitic structure has a densely packed core with
lamellae radiate along the spherulite radius (see Figure 2.8). As CI efficiency decreases the
lamella become less advanced. Additionally, growing polymer chains can be captured by
existing particles, forming lamellae on the surface.
a b
Figure 2.8 SEM image of PA-6 particles: a) PA-6 with defined spherulites resultant from the
use of a quick/slow CI/catalyst combination6 b) PA-6with a macroporous continuous
network resultant from the use of slow/slow or a slow/quick CI/catalyst combination6
For both slow-quick and slow-slow CI/catalyst combinations morphologies are quite
different. SEM images in Figure 2.9 showed that unlike other combinations the polymer
particles were not the result of agglomeration. Instead, it has a bicontinuous network structure.

32
The network structure is a fibrillar one, with some fibrils interconnected as bundles, it is
thought that these bundles form the ‘skeleton’ of the particle. Both individual and bundled
fibrils can connect to two or more different fibrils, forming the final morphology of the particle.
It was found that using an efficient initiator (for this category) resulted in particles that were
flat and ‘disk’-like. As the phase separation time increases the particles become more spherical.
Regardless of the CI used the outer surface is rough with a continuous cohesive structure. These
are porous particles with the size of the pores dependent on the efficiency of the CI.
Studies into the quick-quick combination found that the increased nucleophilicity of the
catalyst causes rapid agglomeration resulting in most of the polymer sticking to the side of the
reactors. Very little polymer is produced. The little polymer that was produced is characterised
by a strong spherulite structure. Decreasing catalyst concentration was found to decrease the
polymer yield but had no effect on particle morphology. Decreasing reaction temperature
however did prevent deposition.
To summarise, particle morphology is controlled primarily by the choice of the CI and
catalyst. Using more efficient combinations gives ‘spongy’ particles that are made from fused
agglomerates. Using less efficient combinations results in individual particles with a structure
made from a bicontinuous network, however how the morphology of PA-12 compares to PA-
6 has not currently been reported in literature.

33
2.2-Oscillatory Baffled Reactors
2.2.1-Background
The research into oscillatory baffled flow (OBF) originated in the 1930s. Van Dijck developed
a column of perforated plates which allowed for the mixing of relatively immiscible liquids via
oscillatory motion88. A later investigation carried out by Sergeev analysed oscillatory motion
within smooth-walled pipes.89 Later Karr carried out research using a reciprocating plate
column as an extractor90. Following this, it was Bellhouse et al who developed a furrowed
membrane that used vortices formed by oscillatory flow to safely enhance the oxygenation of
blood for open heart surgery91, this was the first usage of oscillatory flow within ducts.
However, it wasn’t until the 1980s that research into OBF began to see substantial growth. In
1980 Sobey et al conducted further studies on the oxygenator to develop a numerical model of
the motion of fluid in both steady and unsteady flow.92, 93
The beginning of what would become the oscillatory baffled reactor was introduced by
Mackley (1987) through the study of oscillatory baffled tubes94, 95. The original study for this
came from work done by Knott and Mackley96 which showed that eddies would form when a
periodic flow passes through a sharp edge. The device that Mackley used was a simple cylinder
containing periodically placed shape-edge hollow baffles. The fluid oscillates around these
baffles. The contact between the baffles and the fluid form vortices that mix said fluid. Further
work by Brunold et al investigated what the Reynolds number is required for efficient mixing
and initiated studies on what geometries enhanced mixing97. It was work carried out by Dickins
et al that demonstrated that each baffle cavity acts as a continuously stirred tank (CST). Thus
near plug flow residence time distribution (RTD) can be achieved with specific reactor
geometries and Reynolds numbers98. Throughout the 1990s research continued to flourish. A
30-fold improvement of the Nusselt number over traditional stirred tank reactor (STR) was
shown to be achievable 9. In conjunction, similar improvements in mass transfer8 and residence
time distribution99. Significantly, scale-up correlations were found to be linear8, 10.

34
2.2.2-Mixing in an OBR
The mixing in an OBR occurs when the fluid oscillation causes liquid to pass through the
baffles, generating eddies downstream of each baffle99. These vortices draw fluid from the
edges of the tubular reactor into the eddy downstream. Upon flow reversal the eddies will then
be driven into the centre of the reactor,97 (see Figure 2.9),100 creating strong radial motion
within the system. The oscillation allows for the continuous creation and destruction of these
eddies resulting in flow patterns that lead to efficient radial and axial mixing.
Figure 2.9 Eddy formation within an OBR100
Figure 2.9 shows that these eddies cause mixing within each baffle cavity. This allows
each baffle cavity to act as a perfectly mixed stirred tank. The formation of these eddies can be
achieved by oscillation of the fluid itself or via the oscillation of the baffles. Oscillation of the
baffles can be attained via a linear or rotary motor. To oscillate the fluid a piston or bellow is
required.

35
2.2.3-Fluid mechanics
The mechanical fluid conditions within any tubular reactor can be described by the Reynolds
number that is a ratio of inertial forces within a fluid against the viscous forces within a fluid
as seen in Figure 2.10. It is defined by the equations below
𝑅𝑒 =
ρ D𝑢
𝑣
(2.2)
where ρ is the density of the fluid (kg/m3), D is the pipe diameter (m), u is the velocity of the
fluid (ms-1), v is the dynamic viscosity of the fluid (PaS). When the Re ≤ 2000 the fluid can be
described as laminar. Disregarding the transitional phase when Re ≥ 2000 the fluid can be
described as turbulent. During turbulent flow eddies can occur, leading to lateral mixing.
Simply speaking lamina flow is ‘smooth’ while turbulent flow is ‘rough’. In summary, the
Reynolds number is an indicator for the state of flow; describing how ‘smooth’ or ‘rough’ flow
it is.
Figure 2.10 Flow within a tube with diameter D101
However, this equation cannot sufficiently describe all the motions a fluid undergoes
within a tube when oscillatory motion is applied as shown in Figure 2.11, therefore, an
additional dimensionless group is necessary. To account for this a pulsating Reynolds number,
Rep can be used as
𝑅𝑒𝑝 =𝑢𝑝𝐷
𝑣′
(2.3)

36
Figure 2.11 Oscillatory motion applied to flow in a tube101
Where up is the pulsating flow velocity (ms-1). Work carried out by Sarpkaya102 defined up as
the amplitude of the periodic component of the cross-sectional mean velocity (=πfxoApiston/Apipe)
where f is the oscillating frequency (Hz), xo is the centre-to-peak oscillation amplitude (m) and
Apiston and Apipe (m2) are the cross-sections of the piston and pipe respectively. In the majority
of cases, up can be simplified to the product of the amplitude of oscillation multiplied by the
frequency, Rep = xof. The Rep number describes the oscillatory motion exercised upon a fluid
while the Re describes the state of flow. By combing these two terms all term’s important to
describing flow can be covered as shown in Figure 2.12.
Figure 2.12 Oscillatory baffled flow101
37
However, these two terms do not take into consideration any distortion of the tube’s
shape or the inclusion of inserts, such as baffles. Under these conditions, Re and Rep are no
longer enough to accurately characterise the flow of the liquid. To reconcile this issue, the
Strouhal number was brought in. The Strouhal number is defined as:
𝑆𝑡𝑓 = 𝑓𝐻/𝑢𝑝𝑒𝑎𝑘 (2.4)
Where H is the half channel width (m) and upeak the peak velocity at the maximum channel
width, Hmax101. It was not until later work done by Sobey103 that physical meaning for Stf was
provided. The Stf was defined as the ratio of the scale of channel length to the scale of the fluid
particle displacement. Further research carried out in the 1980’s investigating unsteadiness in
laminar flow94, 97 demonstrated that when an intermittently reversing flow is applied to a tube
that is equipped with equally spaced, transversely mounted orifice-type baffles vortex rings are
swept into the cavity between the baffles when flow reverses. The continuous process of vortex
creation, growth and ejection results in ‘chaotic mixing’.
Brunold et al97 proposed that the fluid mechanics of oscillatory baffled flow can be
described using the following dimensionless groups, the Reynolds number, Reo and the
Strouhal number as below:
𝑅𝑒𝑜 =
𝑢𝑝𝐻𝑚𝑎𝑥
𝑣= 𝜔𝑥𝑜𝐷/𝑣
(2.5)
𝑆𝑡 = 𝜔𝐻𝑚𝑎𝑥/4𝜋𝑥0 (2.6)
Further research did illustrate a flaw with these two groups. There was no mention of
either baffle spacing or orifice diameter. Both parameters are of crucial importance when
discussing OBF. The space between baffles impacts the shape of the eddies created and the
orifice diameter controls the size of the vortices within the inter-baffle cavity.
38
Assuming the same oscillatory Reynolds number (e.g 500) under pure oscillatory flow
(Figure 2.11) the mechanical conditions will be primarily axial, while under OBF (Figure 2.12)
mixing will be chaotic in nature with a mixture of axial and radial components.
Studies have shown that under oscillatory flow two mixing regimes are possible. For
Reo<250 mixing intensity is low, and flow is 2D axi-symmetric. This is described as a ‘soft’
mixing regime. Should the Reo>250, the flow becomes increasingly 3D (no axial-symmetry)
and chaotic. This allows an OBR to either act as a plug flow reactor when an input and output
are imposed or as a device for uniform mixing. However, no single Reynolds number can
define two different flow regimes. Under OBF an oscillator usually functions sinusoidally and
due to this the variation of displacement, x and velocity, u0 takes the form of
𝑥 = −𝑥0cos (𝜔𝑡) (2.7)
𝑢0 = 𝑥0𝜔sin (𝜔𝑡) (2.8)
Maximum velocity, 𝑢0𝑚𝑎𝑥 = 𝑥0𝜔 when sin(𝜔𝑡)=1. This indicates that there is no
difference in oscillatory velocity for both pure oscillatory flow (POF) and OBF. This means
that the input of the system is identical. From this, it can be concluded that Re0 only defines
the strength of input to the system. With regards to fluid mechanical conditions the input is not
related to the output.101
Using a slightly different type of baffle orifice the research of Jones and Bajura104 on
pulsating laminar flow provided key insights into this problem. Jones and Bajura did not use
one, but two Reynolds numbers, the numerical Reynolds number Ren and the orifice plate
Reynolds number, Reop.as

39
𝑅𝑒𝑛 = 𝑢𝑟𝑒𝑓𝐷/2𝑣 (2.9)
𝑅𝑒𝑜𝑝 = 4𝑄/𝜋𝑣𝐷0 (2.10)
Where 𝑢𝑟𝑒𝑓 is the velocity reference (ms-1) and Q is volume flow rate (min-1). An equation
below relates these two equations:
𝑅𝑒𝑜𝑝 = (
4
𝛽) 𝑅𝑒𝑛
(2.11)
Where β is the ratio of the orifice to pipe diameter (=D0/D).
From Re0 of 100-300, OBF shows plug-flow characteristics. Under these conditions,
the vortices are symmetrically generated within the cavity of each baffle. At Reynolds numbers
higher than 300, symmetry is destroyed and flow becomes chaotic.
2.2.4-Polymerisation using Oscillatory Baffled Reactor
One of the first investigations into polymerisation with industrial applications within an OBR
was carried out by Ni et al95. They studied how the formation of methylmethacrylate (MMA)
droplets was affected by varying operational conditions, compared polymers made in an OBR
with those from a traditional STR. The weight & number averaged molecular weights and
polydispersity were similar to those obtained in the STR105, particle size distributions were
narrowed due to better and uniform mixing achieved in the OBR.

40
The influence of frequency of oscillation and oscillation amplitude, as well as baffle
width on mean particle size were examined, Ni et al. found that the dv0.5 (the median for a
volume distribution) decreased with the increase of the oscillation frequency following a
dependence of dv0.5∝f-1.39 (see Figure 2.13). In addition, increasing oscillation frequency also
decreased the particle size distribution. In contrast, the size of particles formed within an STR
varied with impeller speeds from power index of -0.3 to -3.3, depending on reaction
conditions106-109.
Figure 2.13 Effect of oscillation frequency on mean particle size with a fixed amplitude and
baffle width95
Much like frequency, increasing the amplitude of oscillation led to a decrease in particle
size (see Figure 2.14) with a power index of -1.19. The baffle thickness had little influence
over the Sauter mean droplet size; when the baffle width increased from 0.8mm to 3.0mm, the
power index was similar from -0.92 to -1.0295.

41
Figure 2.14 Effect of amplitude on mean particle size at a fixed frequency and baffle width95
2.2.5-Power consumption
When designing a reactor or any sort of mixing device one of the most important parameters
to consider is power consumption 110. How much power a reactor requires is a useful way of
determining mixing efficiency and can be used as the basis for comparison of the effectiveness
of different types of reactors111.
There were two different models for estimating the power density of an OBR: the eddy
acoustic model and a quasi-steady flow model. Work carried out by Jealous and Johnson
employed the quasi-steady flow method to determine the power density of a pulsed plate
column112, this has been the basis for the evaluation of the power density in OBR113, 114 as
shown below.

42
𝑃
𝑉=
2𝜌𝑁
3𝜋𝐶𝐷2 (
1 − 𝛼2
𝛼2) 𝑥0
3𝜔3 (2.12)
Where ρ is the fluid density (kg m-3), N is the number of baffles per unit length of the tube (m-
1), α is the baffle free area ratio and CD is a discharge coefficient for the orifice. In the vast
majority of cases, the value of CD is taken to be 0.7115-117.
It must be noted that the quasi-state model is only appropriate for oscillations high
amplitudes (5-30 mm) and low frequencies (0.5-2). Beyond these values, the eddy acoustic
model appears to become more effective in determining power dissipation118. This model is
defined as
𝑃
𝑉= 1.5
𝜌𝜔3𝑥02𝑙
𝐿𝛼
(2.13)
where l is the mixing length (m) and L is the baffle spacing (m). Significantly, numerous
investigations have shown that OBRs are much more efficient than traditional STRs and in
some cases, up to 94%-99% decrease in required power density has been reported117, 119-121.
Unlike traditional STR, scale-up in OBR did not necessitate an increase in power consumption
per unit mass.
Overall, the OBR allows for very efficient scale-up and a substantial decrease in power
density when compared to an STR. OBR was chosen as the model reactor for this research.
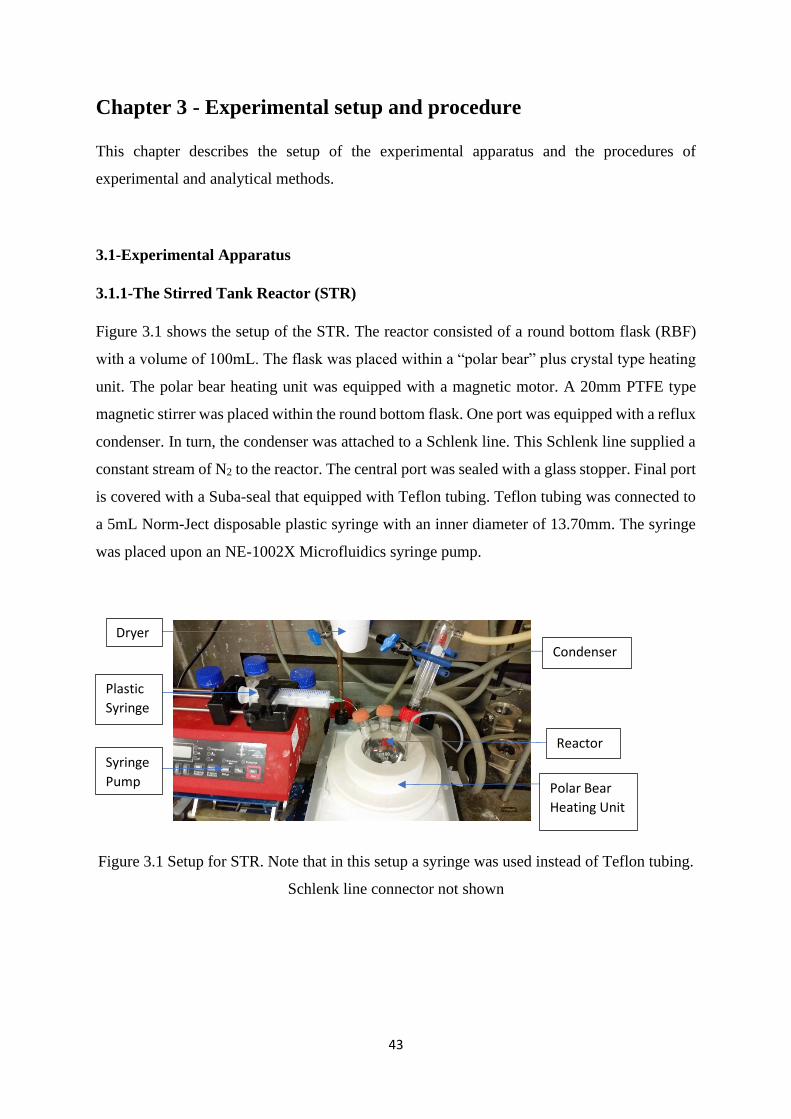
43
Chapter 3 - Experimental setup and procedure
This chapter describes the setup of the experimental apparatus and the procedures of
experimental and analytical methods.
3.1-Experimental Apparatus
3.1.1-The Stirred Tank Reactor (STR)
Figure 3.1 shows the setup of the STR. The reactor consisted of a round bottom flask (RBF)
with a volume of 100mL. The flask was placed within a “polar bear” plus crystal type heating
unit. The polar bear heating unit was equipped with a magnetic motor. A 20mm PTFE type
magnetic stirrer was placed within the round bottom flask. One port was equipped with a reflux
condenser. In turn, the condenser was attached to a Schlenk line. This Schlenk line supplied a
constant stream of N2 to the reactor. The central port was sealed with a glass stopper. Final port
is covered with a Suba-seal that equipped with Teflon tubing. Teflon tubing was connected to
a 5mL Norm-Ject disposable plastic syringe with an inner diameter of 13.70mm. The syringe
was placed upon an NE-1002X Microfluidics syringe pump.
Figure 3.1 Setup for STR. Note that in this setup a syringe was used instead of Teflon tubing.
Schlenk line connector not shown
Dryer
Plastic
Syringe
Syringe
Pump
Condenser
Reactor
Polar Bear
Heating Unit

44
3.1.2-The Oscillatory Baffled Reactor
The OBR consisted of a jacketed glass column with an internal diameter of 50mm and a height
of 500mm. Baffle string consisted of four stainless steel baffles with an outer diameter of
48mm, an orifice diameter of 24mm and a thickness of 3mm. The baffles were spaced at 65mm
by stainless steel spacers. In all experiments only the first baffle was inserted in the reaction
mixture therefore OBR was used as a batch or semi-batch reactor only, not a continuous one.
Height of reaction mixture within glass column was ~75mm.
Heating was carried out in a water bath. The heating fluid was water in all cases bar
experiments investigating kinetics at 100°C, in those circumstances the heating fluid used was
silicon oil. The temperature was checked intermittently using a thermocouple. The baffles were
oscillated within the column by a linear motor (Ni-Tech). This motor was held in place by a
steel frame above the OBR. The OBR itself was held in place by a plastic frame, seen in Figure
3.2 Frequencies of 0-10Hz and amplitudes of 0-50mm were possible using this setup. The
column glass possesses three ports. The first port was connected to a Schlenk line. This Schlenk
line supplied a constant stream of N2. The second port was covered with a Suba-seal equipped
with Teflon tubing. The tubing was connected to a 5mL Norm-Ject disposable plastic syringe
with an inner diameter 13.70mm. This syringe was placed upon an NE-1002X Microfluidics
syringe pump. The syringe was heated by a hairdryer to keep CI in the liquid state within the
syringe and Teflon tubing. The remaining port was closed with a stopper. This port was opened
temporarily when withdrawing a sample. A cap was placed on the top of the reactor to ensure
that the nitrogen atmosphere was contained. For PA-12 synthesis the syringe was placed within
a heated sleeve that is used to keep reaction mixture in the liquid phase (Figure 3.3).

45
Figure 3.2 Setup of oscillated baffled reactor, for simplicity the Schlenk line, hairdryer and
various seals used were not displayed
Figure 3.3 In-depth look at the syringe pump and baffle
3.1.3-The set up for PA-6 equimolar kinetic measurements
The glassware was left to dry overnight. Jacketed beaker was heated by a water bath via
circulated water and placed on the magnetic motor. 20mm PTFE type magnetic stirrer was
placed within the round bottom flask. Teflon tubing was connected to a 5mL Norm-Ject
disposable plastic syringe with an inner diameter of 13.70mm. This syringe was placed upon
an NE-1002X Microfluidics syringe pump. A watch glass was placed on the beaker to prevent
the evaporation of ethylbenzene.
Water Bath
Oscillatory Piston + Motor
Jacketed Reactor
Syringe Pump
Syringe Heater
Plastic syringe
Heated Sleeve
Baffle Piller
Steel Baffle
Teflon tubing
Reactor Stand

46
3.2-Reagents
The laboratory grade caprolactam, dodecalactam, N,N-alkylbisamide, octadecyl isocyanate
Red-Al® (determine concentration) and anhydrous grade ethylbenzene were procured from
Sigma-Aldrich. The caprolactam and dodecalatam were heated at 50°C overnight before use.
Remaining chemicals were used as received.
3.3-Experimental procedures
3.3.1-Recipe and Procedure for PA-6 synthesis within STR
The recipe and physical properties of reactants for PA-6 synthesis are shown below in Table
3.1.
Chemical Molecular
mass
(g·mol−1)
Density at 25C
(g/cm3)
Melting point
(°C)
Boiling
point (°C)
Caprolactam 113.16 N/A 68-71 136-138
Ethylbenzene
anhydrous, 99.8%
106.17 0.867 -95 136
Octadecyl Isocyanate 295.5 0.847 15-16 172-173
Red-Al® ≥60 wt. % in
toluene
202.16 1.036 N/A 110
Table 3.1 Physical properties of reagents for PA-6 synthesis
The procedure involves that the glassware was left to dry overnight. The round bottom
flask was then continuously purged with nitrogen and heated with a heat gun to remove
moisture. Steam of N2 was also present until the termination of the reaction. The polar bear
heating unit was set to its required temperature and stirring speed and turned on. Once the
required temperature had been reached, the apparatus was left for approximately 30 minutes to
purge any remaining moisture from the reactor. All but one port of the reactor was then sealed.
A syringe was purged with nitrogen and used to transport the ethylbenzene to the reactor. Once
the monomer was fully dissolved, a new syringe was purged with nitrogen and employed to

47
inject the catalyst into the reaction mixture. The catalyst then reacted with the monomer, giving
off hydrogen. Once this reaction was completed, indicated by the cessation of hydrogen, the
final port was sealed with a Suba-seal. A second syringe purged with nitrogen was loaded with
Octadecyl Isocyanate (OI) by gently injecting it into the syringe until the Teflon tubing was
filled. The tubing was then used to pierce the Suba-seal, inserted into the reactor and submerged
in the reaction mixture. A hairdryer was placed above the syringe, heating the tubing and the
syringe to ensure that OI remained in the liquid state within the syringe. An injection rate was
chosen and the OI was continuously fed into the reactor. This signalled the beginning of the
reaction.
3.3.2-Procedure for PA-6 kinetic study in an OBR
The glassware was left overnight in an oven to remove any moisture from previous cleaning.
The OBR was then assembled as shown in Figure 3.2 and purged with a continuous stream of
nitrogen. This stream of N2 is present until the end of the reaction. The water heater was set to
its required temperature and turned on. Once the required temperature has been reached, the
apparatus was left for approximately 30 minutes to purge any remaining moisture from the
reactor. All but one port of the reactor was then sealed. A syringe was purged with nitrogen
and used to transport the ethylbenzene to the reactor. Once the monomer was fully dissolved,
oscillation frequency and amplitude were selected and the motor turned on. A new syringe
purged with nitrogen was employed to inject the catalyst into the reaction mixture. The catalyst
then reacted with the monomer, giving off hydrogen, once the reaction was completed the final
port was sealed. A second syringe purged with nitrogen was loaded with OI. The syringe was
then placed on the syringe pump. Teflon tubing equipped with a Suba-seal was then connected
to the loaded syringe and OI was gently injected into the syringe until the tubing was filled.
One port on the reactor was then opened allowing the tubing to be placed in the middle of the
baffle and the tip was submerged within the reaction mixture. The Suba-seal resealed the
reactor. A hairdryer was placed above the syringe and the tubing to ensure that OI remained in
the liquid state within the syringe. An injection rate was chosen and the OI then flowed into
the mixture. This signals the beginning of the reaction. To remove a sample from the reactor a
port was temporarily unsealed. A 1mL syringe equipped with Teflon tubing was used to
withdraw approximately 0.3mL of solution from the reactor. The port was then resealed. Teflon
tubing was disconnected from the syringe and quenched and cleaned with methanol and placed

48
within an oven. The sample was then analysed by ATR-FTIR. Table 3.2 lists the reaction
conditions.
Conditions Value
Temperature 90°C
Monomer mass 12g
Ethylbenzene volume 60mL
Catalyst volume 4mL
Octadecyl isocyanate volume (single
injection)
2mL
Octadecyl isocyanate injection rate
(continuous injection)
20 μL/min
Oscillation frequency 1Hz
Oscillation amplitude 32mm
Table 3.2 Reaction conditions for PA-6 synthesis within OBR
3.3.3- Procedure for equimolar kinetics measurements
As there was no catalyst used, there was no need to carry out the reaction out under inert
conditions. For simplicity, equimolar experiments were carried out in a beaker and not in the
OBR. The procedure for the single and continuous injection methods were slightly different.
For the single injection, the monomer and ethylbenzene (20mL) was placed within the reactor
and the monomer was dissolved in the ethylbenzene. The CI was then added into the mixture
in a one-shot fashion. For continuous injection, the CI and ethylbenzene(10mL) were first
added to the beaker. The monomer was then dissolved by the remaining ethylbenzene (10mL).
The dissolved monomer was loaded onto a syringe. The syringe was equipped with Teflon
tubing and placed on the syringe pump. The dissolved monomer was then injected into the
mixture at a set rate. Table 3.3 shows the experimental conditions.
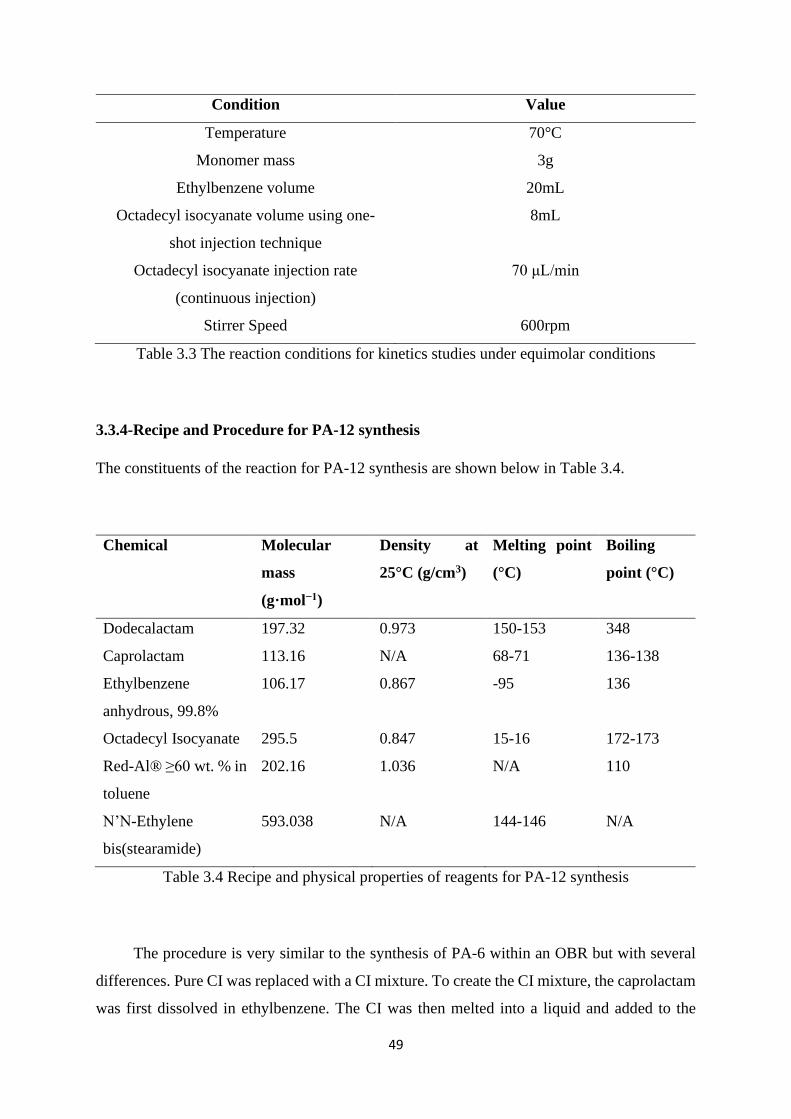
49
Condition Value
Temperature 70°C
Monomer mass 3g
Ethylbenzene volume 20mL
Octadecyl isocyanate volume using one-
shot injection technique
8mL
Octadecyl isocyanate injection rate
(continuous injection)
70 μL/min
Stirrer Speed 600rpm
Table 3.3 The reaction conditions for kinetics studies under equimolar conditions
3.3.4-Recipe and Procedure for PA-12 synthesis
The constituents of the reaction for PA-12 synthesis are shown below in Table 3.4.
Chemical Molecular
mass
(g·mol−1)
Density at
25°C (g/cm3)
Melting point
(°C)
Boiling
point (°C)
Dodecalactam 197.32 0.973 150-153 348
Caprolactam 113.16 N/A 68-71 136-138
Ethylbenzene
anhydrous, 99.8%
106.17 0.867 -95 136
Octadecyl Isocyanate 295.5 0.847 15-16 172-173
Red-Al® ≥60 wt. % in
toluene
202.16 1.036 N/A 110
N’N-Ethylene
bis(stearamide)
593.038 N/A 144-146 N/A
Table 3.4 Recipe and physical properties of reagents for PA-12 synthesis
The procedure is very similar to the synthesis of PA-6 within an OBR but with several
differences. Pure CI was replaced with a CI mixture. To create the CI mixture, the caprolactam
was first dissolved in ethylbenzene. The CI was then melted into a liquid and added to the

50
mixture. The mixture was stirred vigorously by hand and loaded into a syringe. The syringe
was placed within the custom-made syringe heating sleeve (see Figure 3.3). The syringe sleeve
was then heated to 55°C for 10 minutes, after which the heat was reduced to 30°C, the syringe
heater was left at this temperature for the remainder of the reaction. The syringe and sleeve
were then placed on the syringe pump. Teflon tubing equipped with a Suba-seal was connected
to the loaded syringe and the CI mixture was gently injected into the syringe until the tubing
was filled. One port on the reactor was opened and the tubing was then placed at the side of the
baffle within the reactor, next to the reactor wall to prevent the formation of droplets. Tubing
must be kept above the reaction mixture. The Suba-seal was used to reseal the reactor. Tables
3.5 and 3.6 contain the operating conditions for the reaction.
Conditions Value
Temperature 80°C
Dodecalactam (monomer) mass 12g
Ethylbenzene volume 60mL
Catalyst volume 2mL
N,N- Ethylene bis(steramide) mass 0.15g
CI mixture volume (single injection) 2mL
Octadecyl isocyanate injection rate
(continuous injection)
15 μL/min
Oscillation frequency 1Hz
Oscillation amplitude 32mm
Table 3.5 PA-12 synthesis reaction parameters

51
CI Mixture components Value
Ethylbenzene 10mL
Caprolactam 0.25g
Octadecyl Isocyante 0.75mL
Table 3.6 Table of CI mixture constituents
3.4-Measurement tools
3.4.1-Melting point analysis
The melting point was determined using the Differential Scanning Calorimeter (DSC) 214
polyma. The system was equipped with an intracooling system that could operate between
temperatures of -70 to 600°C. Pressurised nitrogen (~2 bar) at flow rates of 40mL/min and
20mL/min was used as the purge gas to prevent sample oxidation. 10-15mg of the sample was
weighed and placed into an aluminium container. A pierced lid was used to cover the pan. An
empty pan was used as a reference to track the heat flow. Due to the specific heat capacity of
the sample, the reference pan usually the heats slightly quicker. Upon heating both pans will
have parallel heat flow signals until a physical change within the sample occurs. At which point
more or less heat will be required to keep sample pan the same temperature as the reference
pan. By measuring the difference in the heat flow signals the amount of heat absorbed or
released during these transitions can be measured.
Netzsch Proteus© thermal analysis program version 7.0.1 was used for data acquisition
and analysis. For PA-6 analysis the sample was heated to 250°C at a rate of 10K/min, then
cooled back down to 25°C at the same rate. The resulting melting and cooling curves were used
to determine the melting point and crystallisation point. The melting point was considered to
be the peak of the curve that was determined using the previously stated software. For PA-12
analysis, the sample was heated to 200°C at a rate of 10K/min, then cooled back down to 25°C
at the same rate.

52
The analysis of the melting points of the product is the means for verification and
confirmation of successful synthesis, as both PA-6 and PA-12 have distinct melting points from
other substances in the recipes as shown in Figure 3.4. The synthesised particles were then
compared to control PA-6 and PA-12 polymers acquired from Sigma Aldrich as shown in
Figures 3.5 and 3.6, this confirms if the nylon variant had been successfully synthesised. In
both cases, the melting point of the particles is slightly lower than that of the control but still
within normal values for PA-6 and PA-12.
Figure 3.4 DSC spectrum showing melting point of all substances in the reaction mixture
Figure 3.5 DSC spectrum comparing melting point of synthesised PA-6 particles and control
PA-6

53
Figure 3.6 DSC spectrum comparing melting point of synthesised PA-12 particles and control
PA-12
3.4.2-Particle size analysis
The particle size distribution was determined using a Mastersizer (series 3000). The
Mastersizer uses laser diffraction to measure the size of particles. Particle sizes are measured
by passing a laser beam through the dispersed particulate sample. The angular variation in
intensity of the scattered light is measured. Larger particles scatter the light in small angles
relative to the laser beam while small particles scatter the light in larger angles. The angular
scattering intensity data is then examined using the Mie theory of light scattering. Laser
diffraction offers multiple advantages over fractionation sieving techniques. Firstly, analysis is
much quicker and easily reproducible. Secondly, if desired, laser diffraction can be used to
make real-time measurements. However, laser diffraction techniques require substantial
calibration when compared to sieving techniques
Data acquisition and analysis were carried out using the Mastersizer 3000 software
v3.40. For each sample, 0.5g of nylon particles were dispersed in approximately 5mL of
propan-2-ol. Samples were placed in a Sonicator for 5 minutes and vigorously mixed by hand.
Each sample was stirred at 2000 rpm and each sample was measured 5 times. Fresh dispersant
was used for each sample. For PA-6 and PA-12, the refractive index was 1.53 and 1.525

54
respectively. No information on the absorption index could be found for either PA-6 or PA-12
so an index of 0.5 was used for both. Both sets of particles were considered to be none spherical.
Figure 3.7 and Table 3.7 shows the typical particle size distribution from the Mastersizer.
a b
Figure 3.7 a) Particle size distribution of PA-12 synthesised particles b) Particle size
distribution of PA-6 synthesised particles
Sample Name Dx(10) (μm) Dx(50) (μm) Dx(90) (μm)
PA-12 OBR
retry 8
74.8 113 174
Nylon-6 CL
Plankett-5
analysis 2
13.8 40.1 94.3
Table 3.7 Particle size distributions of PA-6 and PA-12 samples
3.4.3-Molecular weight analysis
Molecular weight was analysed by Smithers Rapra by Gel Permeation Chromatography, the
results of which are shown in Figures 3.8, 3.9 and Table 3.8. Gel Permeation Chromatography
is a chromatographic method where molecules in solution are separated by their size and
molecular weight. The chromatographic column is packed with fine porous beads that are used
to measure the dimensions of the sample. The amount of time the mobile phase stays within
the column is based on the size of the polymer. Molecules that are larger than the largest pores

55
in the column will pass through the column directly. Smaller molecules that partially interact
with the pores in the column matrix are separated and eluted from the column in order of
decreasing size. The biggest drawback to this technique is the cost. PA-12 has very high
chemical resistance. Among the few known solvents include the fertiliser m-cresol, 95%
sulphuric acid and Hydrofluoroisopropanol (HFIP). HFIP is the most commonly used solvent
in nylon analysis. However, this is very expensive solvent and therefore the amount of sample
that can be analysed is limited. The other major drawback to Gel Permeation Chromatography
is that is does not, by itself, give absolute values for molecular weight. Therefore, it works best
if samples are analysed in bulk, using the same calibration. If analytes are being analysed under
different calibrations a reference sample would have to be chosen and analysed under both
calibrations to allow for compassion between groups.
The instrument used was a Malvern/Viscotek TDA 301 with associated pump and
autosampler. The columns were Agilent PL HFIPgel guard plus 2 x PL HFIPgel 300 x 7.5mm,
9μm. The solvent of choice was 1,1,1,3,3,3-hexafluoropropan-2-ol with 25mM NaTFAc.
Samples were eluted at a flow rate of 0.8mL/min at 40°C. The GPC system was calibrated
using Agilent Easivial polymethylmethacrylate calibrants. Each sample was prepared by
adding 10mL of solvent to 20mg of sample. The sample was left overnight to ensure complete
dissolution. The solution was mixed and filtered through a 0.45μm membrane into autosampler
vials. Vials are placed in an autosampler. Injection of contents of each vial was carried out
automatically.

56
Figure 3.8 Average molecular weight distributions based upon two scans of various
synthesised PA-12 polymer particles
Figure 3.9 Molecular weight distributions of various synthesised PA-6 polymer particles

57
Nylon-variant Sample Molecular Weight
PA-12 Retry 3 45,100
Retry 4 36,100
Retry 5 40,100
Retry 7 42,900
Retry 8 26,900
Retry 9 35,300
Retry 10
PA-6 PA-6 CL-P-1 4110
PA-6 CL-CP-1 3990
PA-6 CL-CP-2 3820
PA-6 CL-P-8T2 2580
PA-6 CL-P-9T2 2540
Table 3.8 Molecular weights of PA-6 and PA-12 samples
3.4.4 Morphology analysis
Morphology analysis was carried out using an FEI Quanta 3D FEG Dual Beam Scanning
Electron Microscope. The election microscope develops images from samples by scanning the
sample with a beam of electrons. The electrons interact with surface of the sample, this
produces multiple signals that contain information about the topography and composition of
the sample. The electron beam is scanned in a raster scan pattern. The position of the beam is
combined with the intensity of the detected signal to produce an image. SEM microscopes have
a potential resolution of 0.2nm, allowing for the creation of highly detailed images of
organelles within a cell. Something that is not possible to do using light microscopes. However,
electrons can be deflected by molecules in the air, therefore the sample must be placed in a
vacuum. Additionally, a sample must be electrically conductive. Samples that are
nonconductive must be coated with ultrathin layer of a conductive material such as gold.
Magnification of PA samples ranged from x100 up to x35,000. An example of which is seen
in Figure 3.10.

58
a b
Figure 3.10 Example SEM images of PA-12
3.5-Kinetics study
Reaction kinetics were followed via ATR-FTIR by analysing the gradual reduction in the
carbonyl peak of the caprolactam as the reaction progresses. This is shown in Figure 3.11. The
peak has a very strong signal and is isolated from other large peaks in the spectrum. As nylon
particles are formed and precipitate, the intensity of the carbonyl peak decreases. The FTIR
instrument sends infrared radiation ranging from 10,000cm-1 to 100cm-1 through the sample.
Absorbed energy is converted into rotational and vibrational energy. The detector measures
what wavelengths have been absorbed. The resulting signal is presented as a spectrum. Each
molecule and chemical structure and functional group has a unique spectrum. Very little
analyte is required for successful analysis. Samples can either be in the solid or liquid state and
require no preparation. Results are easily reproducible and there are minimal operator-induced
variations. However infrared spectroscopy cannot analyse an analyte that does not possess a
dipole monument.
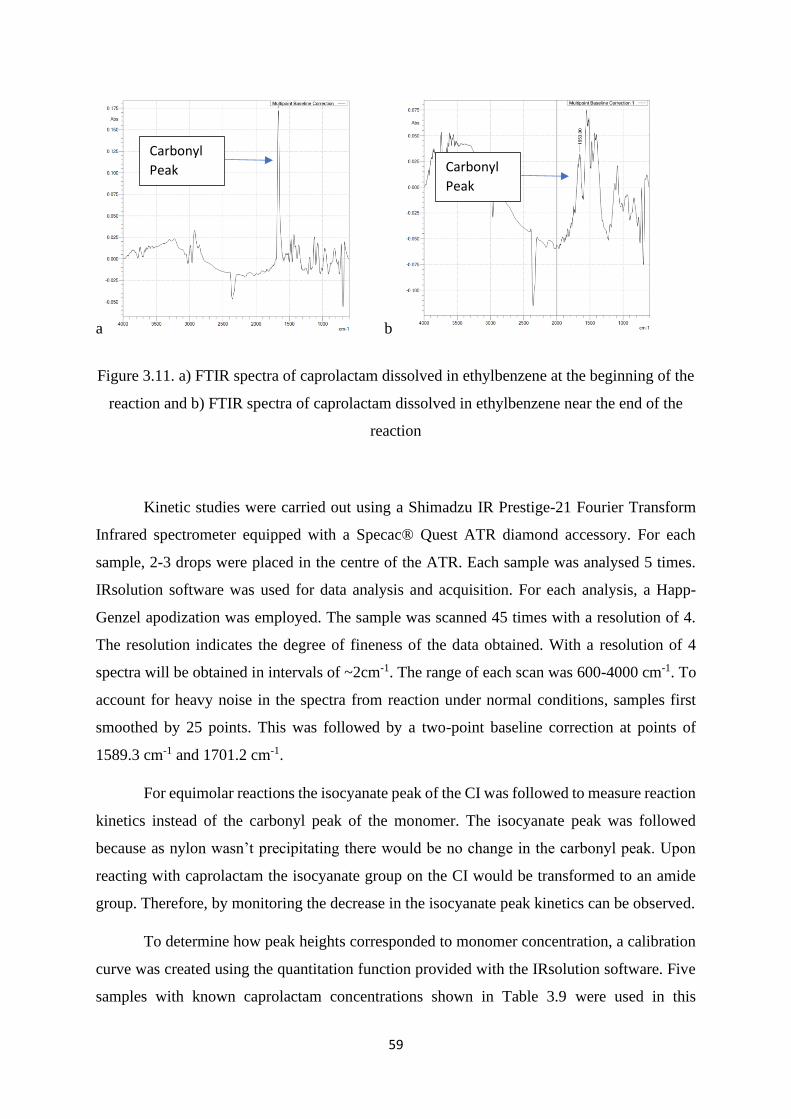
59
a b
Figure 3.11. a) FTIR spectra of caprolactam dissolved in ethylbenzene at the beginning of the
reaction and b) FTIR spectra of caprolactam dissolved in ethylbenzene near the end of the
reaction
Kinetic studies were carried out using a Shimadzu IR Prestige-21 Fourier Transform
Infrared spectrometer equipped with a Specac® Quest ATR diamond accessory. For each
sample, 2-3 drops were placed in the centre of the ATR. Each sample was analysed 5 times.
IRsolution software was used for data analysis and acquisition. For each analysis, a Happ-
Genzel apodization was employed. The sample was scanned 45 times with a resolution of 4.
The resolution indicates the degree of fineness of the data obtained. With a resolution of 4
spectra will be obtained in intervals of ~2cm-1. The range of each scan was 600-4000 cm-1. To
account for heavy noise in the spectra from reaction under normal conditions, samples first
smoothed by 25 points. This was followed by a two-point baseline correction at points of
1589.3 cm-1 and 1701.2 cm-1.
For equimolar reactions the isocyanate peak of the CI was followed to measure reaction
kinetics instead of the carbonyl peak of the monomer. The isocyanate peak was followed
because as nylon wasn’t precipitating there would be no change in the carbonyl peak. Upon
reacting with caprolactam the isocyanate group on the CI would be transformed to an amide
group. Therefore, by monitoring the decrease in the isocyanate peak kinetics can be observed.
To determine how peak heights corresponded to monomer concentration, a calibration
curve was created using the quantitation function provided with the IRsolution software. Five
samples with known caprolactam concentrations shown in Table 3.9 were used in this
Carbonyl
Peak Carbonyl
Peak
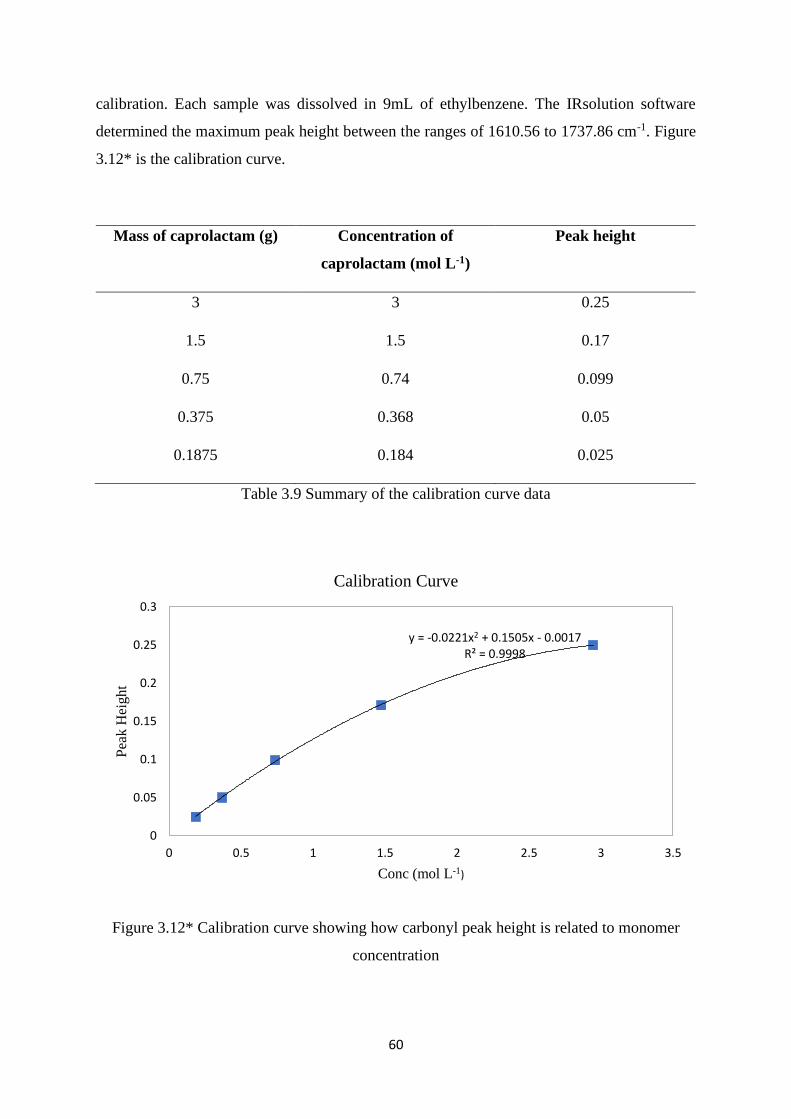
60
calibration. Each sample was dissolved in 9mL of ethylbenzene. The IRsolution software
determined the maximum peak height between the ranges of 1610.56 to 1737.86 cm-1. Figure
3.12* is the calibration curve.
Mass of caprolactam (g) Concentration of
caprolactam (mol L-1)
Peak height
3 3 0.25
1.5 1.5 0.17
0.75 0.74 0.099
0.375 0.368 0.05
0.1875 0.184 0.025
Table 3.9 Summary of the calibration curve data
Figure 3.12* Calibration curve showing how carbonyl peak height is related to monomer
concentration
y = -0.0221x2 + 0.1505x - 0.0017R² = 0.9998
0 0.5 1 1.5 2 2.5 3 3.5
0
0.05
0.1
0.15
0.2
0.25
0.3
Conc (mol L-1)
Pea
k H
eight
Calibration Curve

61
Chapter 4 - PA-6 synthesis and kinetics
This chapter is split into two sections. The first section presents the results and discussion of
the effect of experimental parameters on polymer properties. The second section is focused on
the effect of experimental parameters on reaction kinetics.
4.1-PA-6 synthesis
4.1.1-Introduction
Nylon particles were first created by the pioneering work of Chrzczonowicz 3, 82 through the
anionic precipitation polymerisation of caprolactam. Even with the presence of a catalyst,
anionic polymerisation of lactams requires very high temperatures due to the low
nucleophilicity of caprolactam. To circumvent this requirement a chain initiator is used. The
chain initiator can be added in two different ways, either all at once(‘one-shot’) or through
continuous injection over a set time. Published research regarding pure nylon particles is rare,
and almost all research was focused on synthesis using the ‘one-shot’ injection method.
There are many different competing variables (or factors) involved in nylon particle
synthesis that can affect the resultant polymer’s properties. These variables include but are not
limited to temperature, monomer/catalyst ratio, monomer/solvent ratio, catalyst/CI ratio,
mixing speed, choice of catalyst, choice of CI etc. The majority of literature has focused on
how the choice of CI and catalyst used in the synthesis of nylon particles impacts the polymer
properties. Data pertaining to continuous injection of chain initiator is very limited. Patents47,
49 state what factors affect polymer properties, such as melting point, molecular weight and
particle size, but are voided of quantitative data that are crucial to the development of a viable
synthesis route and in turn the creation of bespoke particles. Due to the extended reaction time
required for synthesis, a factorial design was used to analyse how different variables affected
desired responses.

62
4.1.2-Factorial Design
Factorial design or Design of Experiment (DOE) is a multivariate statistical tool that analyses
a system’s response to changes in specified variables or process parameters. The impact of
each parameter can be quantified and the statistical significance of the process response
determined. This allows for the optimal values for a given response to be obtained. A factorial
design also has the additional benefit of analysing any potential combination of variables that
can affect a chosen response, i.e. a 2-way interaction. For example, both the catalyst
concentration and monomer concentration of a system may positively affect the molecular
weight of a polymer but at high catalyst concentration the influence the monomer concentration
has on molecular weight is reduced. Such observations would be very difficult to make using
traditional methods.
This powerful technique can be used to improve control, increase reliability and lower
production costs122. Factorial designs have previously shown to be an effective method to
analyse polymer properties123-127. In these factorial designs many different factors were tested
by, for example, analysing the impacts temperature, reaction time and oxidant concentration
have on the yield of polyaniline particle synthesis. This helped to develop a model that
accurately predicted how multiple variables affected drug release from extended-release
extrudates124.
Once a factorial design goes beyond three factors, it becomes increasingly complex. In
the majority of designs, each factor is represented by two levels, ‘high’ and ‘low’. These two
levels are the limits of the design. In rare cases, a 3-level design is also used. The number of
experiments required by a normal design is 2n, so 5 factors would require 32 experiments as
illustrated in Table 4.1. By this point, it can become advantages to use either a fractional
factorial design (FFD) or a Plackett-Burman screening design. The purpose of design screening
is to identify the main variables that have a statistically significant effect on a response. A FFD
has an lower or higher resolution to a screening design (see Table 4.2). The resolution of a
design describes how the main effects are confounded with 2-level, 3-level interactions and
etc. Confounding, or aliasing, is when the estimated effect of one factor includes the influence
of another. Like a factorial design, the Plackett-Burman design consists of a series of
experiments with high and low values which are then analysed to see their effects128, 129.

63
However, while the screening design has a lower resolution, it can successfully screen up to 11
factors with only 12 experiments (does not include centre points) and can significantly convert
any three factors used in the design to a full factorial design without additional experiments.
Therefore, assuming you have 11 factors and all responses are only affected by any three (or
less) factors, 12 experiments will yield the same amount of information as 2048 experiments
required to complete a full factorial design! The fractional factorial design cannot directly be
converted into a full design. It was for these reasons that the Plackett-Burman design was
chosen over a fractional factorial one.
No. of variables No. of experiments required
2 4
3 8
4 16
5 32
6 64
11 2048
Table 4.1 List showing how many experiments are required to carry out a full factorial
analysis depending on how many variables are present
The six factors of interest in the PA-6 synthesis are temperature, monomer mass,
solvent volume, catalyst volume, the rate of CI injection and mixing intensity. These factors
were chosen because all have been stated to have an influence over either molecular weight,
particle size or melting point, but have not been studied in detail. The effects of different
catalysts and CIs combinations have on polymer properties are well documented, so they were
not involved in the design.
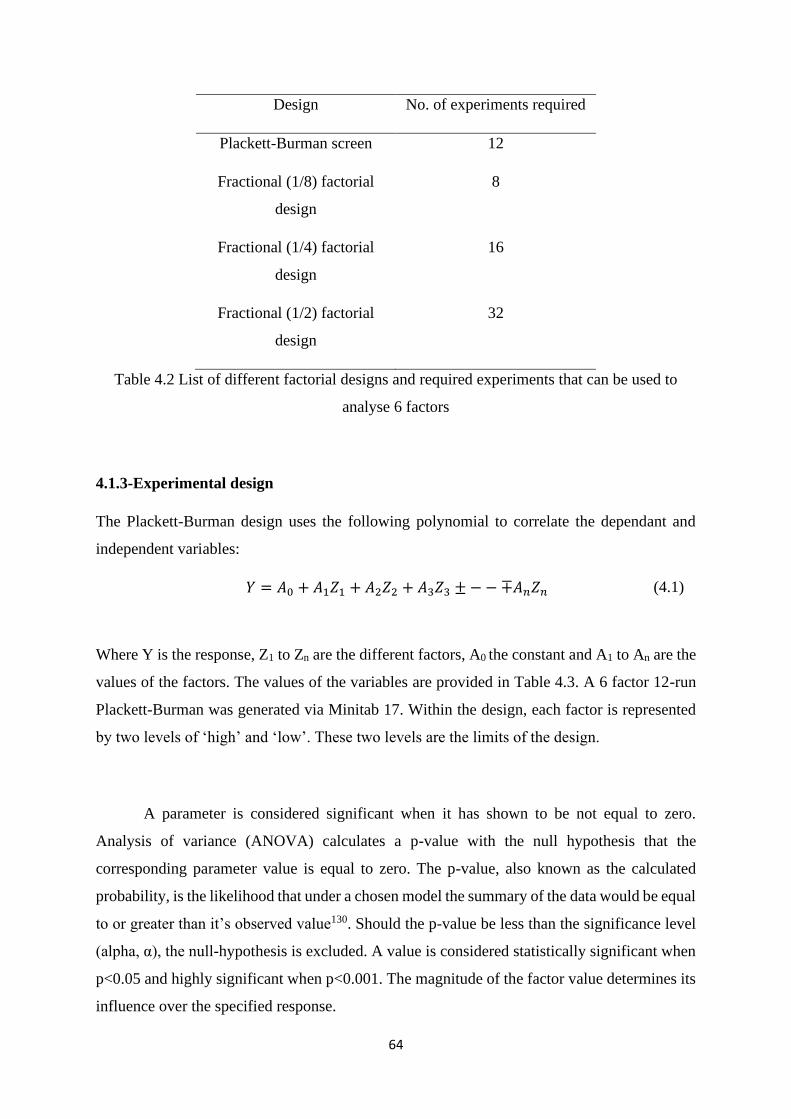
64
Design No. of experiments required
Plackett-Burman screen 12
Fractional (1/8) factorial
design
8
Fractional (1/4) factorial
design
16
Fractional (1/2) factorial
design
32
Table 4.2 List of different factorial designs and required experiments that can be used to
analyse 6 factors
4.1.3-Experimental design
The Plackett-Burman design uses the following polynomial to correlate the dependant and
independent variables:
𝑌 = 𝐴0 + 𝐴1𝑍1 + 𝐴2𝑍2 + 𝐴3𝑍3 ± − − ∓𝐴𝑛𝑍𝑛 (4.1)
Where Y is the response, Z1 to Zn are the different factors, A0 the constant and A1 to An are the
values of the factors. The values of the variables are provided in Table 4.3. A 6 factor 12-run
Plackett-Burman was generated via Minitab 17. Within the design, each factor is represented
by two levels of ‘high’ and ‘low’. These two levels are the limits of the design.
A parameter is considered significant when it has shown to be not equal to zero.
Analysis of variance (ANOVA) calculates a p-value with the null hypothesis that the
corresponding parameter value is equal to zero. The p-value, also known as the calculated
probability, is the likelihood that under a chosen model the summary of the data would be equal
to or greater than it’s observed value130. Should the p-value be less than the significance level
(alpha, α), the null-hypothesis is excluded. A value is considered statistically significant when
p<0.05 and highly significant when p<0.001. The magnitude of the factor value determines its
influence over the specified response.
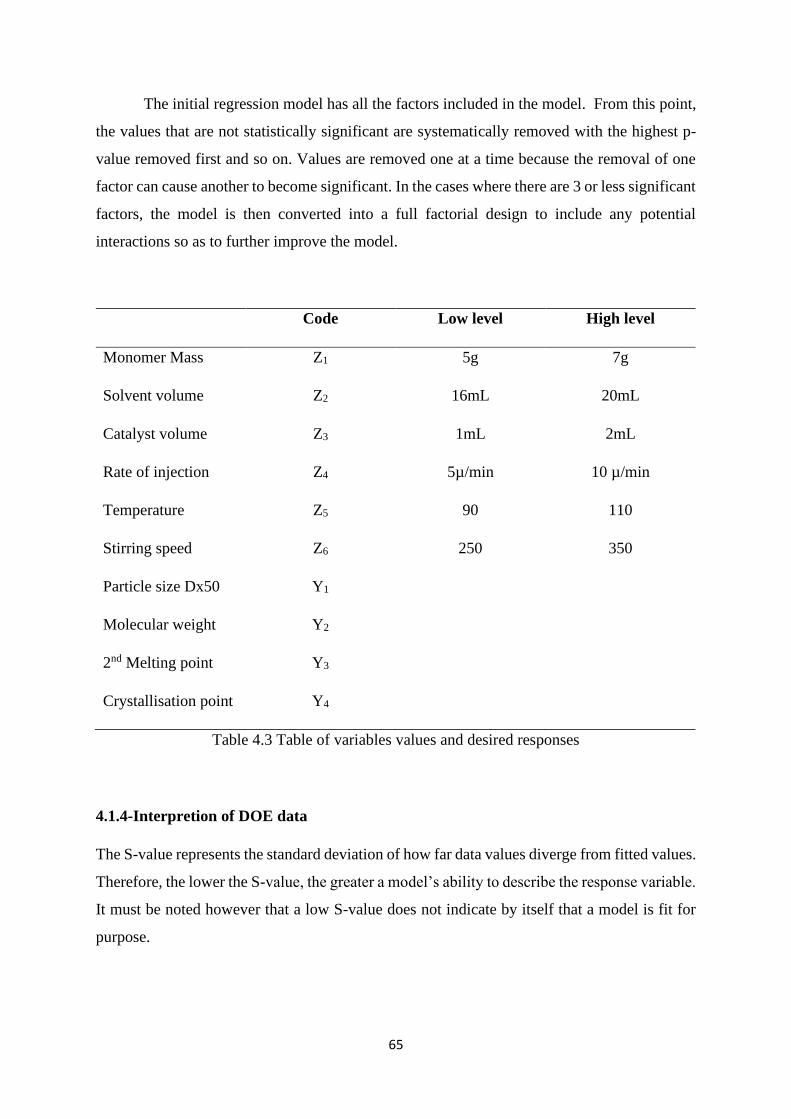
65
The initial regression model has all the factors included in the model. From this point,
the values that are not statistically significant are systematically removed with the highest p-
value removed first and so on. Values are removed one at a time because the removal of one
factor can cause another to become significant. In the cases where there are 3 or less significant
factors, the model is then converted into a full factorial design to include any potential
interactions so as to further improve the model.
Code Low level High level
Monomer Mass Z1 5g 7g
Solvent volume Z2 16mL 20mL
Catalyst volume Z3 1mL 2mL
Rate of injection Z4 5µ/min 10 µ/min
Temperature Z5 90 110
Stirring speed Z6 250 350
Particle size Dx50 Y1
Molecular weight Y2
2nd Melting point Y3
Crystallisation point Y4
Table 4.3 Table of variables values and desired responses
4.1.4-Interpretion of DOE data
The S-value represents the standard deviation of how far data values diverge from fitted values.
Therefore, the lower the S-value, the greater a model’s ability to describe the response variable.
It must be noted however that a low S-value does not indicate by itself that a model is fit for
purpose.

66
The R2 value is the percentage of variation in the response variable described by the
model. It is calculated by the equation shown below:
𝑅2 = 1 −
𝐹𝑖𝑟𝑠𝑡 𝑠𝑢𝑚 𝑜𝑓 𝑒𝑟𝑟𝑜𝑟𝑠
𝑆𝑒𝑐𝑜𝑛𝑑 𝑠𝑢𝑚 𝑜𝑓 𝑒𝑟𝑟𝑜𝑟𝑠
(4.2)
Where the first sum of errors is the variation not explained by the model and the second sum
of errors is all variation within the model. When adding new factors to a model, the R2 will
always be at least as high as its highest value for the previous model. Due to this, R2 is a tool
that is best used to compare models with the same number of factors. The R2 adjusted is like
the R2 but considers the number of factors included within the model. As such the R2 adjusted
value is useful when comparing different models. R2 adjusted is calculated using the equation
below:
𝑅2(𝑎𝑑𝑗)[
(1 − 𝑅2)(𝑛 − 1)
𝑛 − 𝑘 − 1] = 1
(4.3)
Where n is the number of points within the data sample and k is the number of variables within
the model. The R2 (pred) is calculated with a formula that is equivalent to systematically
removing each observation from the set, estimating the regression equation, then determining
how well the model predicts the removed observation. In effect, the R2 (pred) shows the
predictive ability of a model. A model with a substantially lower predicted R2 than R2 value
can indicate that there are too many predictors in the model.
This thesis uses three different charts to illustrate the results of a model derived from a
design. The three charts used were Pareto charts of standardised effect, interaction plots and
3D-cube plots. The Pareto charts show what factors from the highest weight to lowest are
involved in the model. Should a factor cross over the red dotted line, they are considered
statistically significant. The interaction plot contains two blue and green dots. The blue dots
signify the mean value of a factor at its ‘low’ and ‘high’ levels and is joined by a single line.
The steeper the line, the greater the impact of the variable on the response. The red dot

67
represents the centre point. The green dots are similar to the blue dots, but they represent the
other factor of interest. The 3D cube plot shows various relationships between factors and a
response within a model. Each cube can show three factors, and should the model only contain
two factors, the cube is reduced to a square.

68
4.1.5 Results and discussion
RunOrder PtType Blocks Monomer
Mass
Solvent
Volume
Catalyst
Volume
Rate of
Injection Temperature
Stirring
speed
1 1 1 7 16 2 5 90 250
2 1 1 7 20 1 10 90 250
3 1 1 5 20 2 5 110 250
4 1 1 7 16 2 10 90 350
5 1 1 7 20 1 10 110 250
6 1 1 7 20 2 5 110 350
7 1 1 5 20 2 10 90 350
8 1 1 5 16 2 10 110 250
9 1 1 5 16 1 10 110 350
10 1 1 7 16 1 5 110 350
11 1 1 5 20 1 5 90 350
12 1 1 5 16 1 5 90 250
13 0 1 6 18 1.5 7.5 100 300
14 0 1 6 18 1.5 7.5 100 300
15 0 1 6 18 1.5 7.5 100 300
16 0 1 6 18 1.5 7.5 100 300
Table 4.4 Plackett-Burman screening design with six variables generated using Minitab
software
4.1.5.1-Effect of factors on the molecular weight
The Plackett-Burman (PB) experiments were carried as shown in Table 4.4 (reactions were
carried out in a randomised order). The model produced is labelled model 1A (see Figure 4.1
and Table 4.5). The non-significant figures were then removed systematically from the
smallest to the largest to produce model 2A. Looking at Table 4.5, model 2A has a poorer fit

69
than 1A, indicated by the lower R2 values and larger S value. This may be caused by the
confounding of factors that can occur with lower resolution designs. No literature can be found
by the author to show that mixing intensity has a significant influence over the molecular
weight. Therefore, confounding may have caused the stirring speed to become a significant
player. To test this hypothesis, the PB was converted into a full factorial design using the
variables temperature, the rate of injection and monomer mass. The subsequent model is
labelled model 3A. As can be seen in Table 4.5, the removal of the mixing speed factor in the
conversion to full factorial has improved the quality of the model. The S-value has decreased
and R2 (adjusted) value has increased as well. As before the non-significant figures were
removed and the final model 4A was produced. For all models in the thesis, the actual p-values
can be seen in Table 4.8. All results used to create all DOE models are in Table 4.9.
Plackett-
Burman
Design
S-value R2 R2 (adjusted) R2(predicted)
Model 1A 444.3 96.57% 92.57% 80.32%
Model 2A 466.7
94.96% 91.80% 85.13%
Full
Factorial
Model 3A 335.6
98.38% 96.12% *
Model 4A 311.5
98.05% 96.66% 94.17%
Table 4.5 Summary of each model studying the influence of various factors over molecular
weight

70
a b
c d
Figure 4.1 Pareto graphs of Models 1A (a) 2A (b), 3A(c) and 4A(d)
In agreement with various patents and literature, increasing the temperature increases
the molecular weight of the polymer produced. Of the variables tested, the model found that
temperature was the most important factor for controlling molecular weight. The work by
Schreiber and Waldman131 theorised that the temperature dependence of molecular weight was
caused by the dissociation of polymer aggregates in the solution that have been made from
inter-chain entanglements. Higher reaction temperatures lead to an increase in polymer-solvent
interactions. This, in turn, causes gradual disentanglement.
Increasing the rate of injection was found to have a negative impact on molecular
weight, as it would lead to more active sites for the monomer to react with, resulting in more,
but smaller growing chains. Conversely increasing the monomer concentration leads to an
increase in molecular weight. Again, this agrees with various patents and literatures pertaining
to the single injection technique as well as other similar chain growth reactions47, 60, 132-134.
71
However, the negative impact the rate of injection has on molecular weight did not
agree with the findings of Hilaire and Guerin who observed that reducing CI concentration
decreased molecular weight135. The possible reason for this contradiction is complex. Using
the single injection method it is known that the optimal CI/catalyst ratio is approximately
0.67/160. Any deviation from this ratio would lead to a decrease in molecular weight. Even at
the low-level injection rate tested in this work, this ratio may have been exceeded over the
duration of the reaction time, with the high-level injection rate causing further deviation. In
contrast, the injection rates and times used by Hilaire and Guerin may have never reached the
optimum ratio. Furthermore, Udipi et al74 observed when studying the reaction in bulk that
below certain concentrations, decreasing the concentration of the CI further would cause an
increase in molecular weight, but above the specific concentration, increasing CI concentration
increases the molecular weight.
Interestingly the interaction plot of Figure 4.2 shows that as the rate of injection
increases there is a strong negative interaction with monomer mass. At lower rates of injection,
increasing monomer mass has a substantial positive effect on the polymer’s molecular mass,
however, at higher injection rates, this effect becomes negligible. This shows that two dominant
factors tested in controlling molecular weight overall are temperature and rate of injection as
shown in Figure 4.3, with monomer mass having a smaller, but significant influence.
Where the results differ substantially from literature is the effect the catalyst has on
molecular weight. Surprisingly, our results showed that the catalyst concentration had very
little influence on molecular weight. This disagrees with other literatures where increasing the
catalyst concentration increased the molecular weight until an optimum value is reached, after
which further increases in concentration would have a negative effect on molecular weight.
This optimum value is dependent on both the monomer and CI concentration. It may be that
the continuous injection method limits the influence of the catalyst concentration. Another
possible explanation is that the excess of chain initiator masks any impact the catalyst has.

72
Figure 4.2 Interaction plot between monomer mass and rate of injection
Figure 4.3 Cube plot of temperature, the rate of injection and monomer mass relationship
effects on molecular weight
4.1.5.2-Effect of factors on the melting point
The process used to develop the model to describe the melting point is the same as the one used
to develop the molecular weight model. Firstly, the initial model 1B is produced and the non-
significant figures removed systemically to produce model 2B (see Figure 4.4). The removal
of these factors improved the model predictive-ability substantially with R2 (predicted) going
from 17.89% to 68.49% (see Table 4.6), however, improvements to the standard error of the
regression analysis were small.

73
The screening found that the two most important factors were temperature and solvent
volume. This is surprising as the relationship between molecular weight and polymer melting
point is well known, where as molecular weight increases so does the melting point until it
reaches its maximum value. Therefore, it would be expected that the same factors that affect
molecular weight would affect the melting point, but this is not the case. The reported melting
points for nylon-6 particles vary from 205°C 7, 60 to 215°C 136, 137. Under optimum conditions,
215°C was reached in this work. It is possible that when the temperature is high, excluding the
influence of the solvent volume, the necessary molecular weight is reached regardless of the
rate of injection or monomer mass. Work carried out by Florin and Grolier also noted that a
higher reaction temperature resulted in particles with a higher melting point. They suggested
that this increase was caused by changes in the crystallinity and morphological properties of
the particles7.
S-value R2 R2 (adjusted) R2(predicted)
Plackett-
Burman
Design
Model 1B 2.28471
89.34% 78.68% 17.89%
Model 2B 2.25167
83.73% 79.29% 68.49%
Full
Factorial
Model 3B 1.33010 96.90% 92.77% *
Model 4B 1.33497 95.32% 92.72% 85.77%
Table 4.6 Summary of each model studying the influence of various factors over melting
point model

74
a b
c d
Figure 4.4 Pareto graphs of Models 1B (a) 2B (b), 3B(c) and 4B(d)
The solvent volume having a positive influence was most surprising. This is a direct
contradiction to the finding of the molecular weight analysis, which found that the solvent
volume had a negative, albeit insignificant impact on molecular weight. One possible
explanation is that melting point depression is caused by trapped and unreacted monomer. It is
known that one of the issues with precipitation polymerisation is the presence of impurities in
the final product. As each experiment was only carried out over a period of two hours, each
reaction was not given the required time to reach completion. Because of this, there would still
be monomer present in the solution. As the solution volume increases, the corresponding
monomer concentration would be lower. Therefore, there will be less unreacted monomer
trapped within the polymer particles at higher solvent volumes once the reaction has been
quenched and the polymer dried.
Solvent volume and temperature were then involved in the conversion of the PB into
an FF design, resulting in model 3B. While it was not considered to be statistically significant,
the rate of injection was included within the FF design. Including it did not require any

75
additional experiments and any impact rate of injection could have may have been masked due
to aliasing.
Model 3B saw a substantial improvement in the S-value and smaller increases to the R2
(adjusted) and R2 (predicted) values. Again, non-significant factors were removed
systematically until model 4B was created. Interestingly the full factorial design showed that
the rate of injection had a slight, but a statistically significant negative influence on the melting
point, as would be expected due to its impact on the molecular weight. Additionally, the design
conversion from PB to FF suggested that there was a minor but statistically significant negative
interaction between solvent volume and temperature shown in Figures 4.5 and 4.6.
Interestingly, this is despite both the corresponding main factors having a positive influence
over the melting point. Further investigations would have to be carried out in order to
understand the source of this interaction.
Figure 4.5 Interaction plot between solvent volume and temperature for model 3B

76
Figure 4.6 Cube plot of temperature and solvent volume effects on 2nd melting point
4.1.5.3-Effect of factors on mean particle size
The process used to screen the mean particle size response were the same as the previous two.
Model 1C was first produced by the PB screening design. Insignificant variables were then
systematically removed, resulting in model 2C. As can be seen from the model summary in
Table 4.7, low S-values together with over 90% R2 values indicate that this is a very good
model. The three significant factors were mixing speed, the rate of injection and monomer mass
(Figure 4.7).
Research into a range of different polymers formed by precipitation polymerisation
have all shown that increasing monomer concentration increases the polymer particle size .47,
134, 138, 139 The reasons for this are two-fold: greater monomer concentrations are able to sustain
growth of larger particles and; increase in concentration changes the equilibrium distribution
between the polymer phase and the rest of the medium, this encourages particle growth.

77
S-value R2 R2 (adjusted) R2(predicted)
Plackett-
Burman
Design
Model 1C 2.15658
98.21% 95.09% *
Model 2C 1.90411
97.56% 96.17% 93.32%
Full
Factorial
Model 3A 2.13596
98.05% 95.32% *
Model 4C 1.69092
97.80% 97.06% 95.63%
Table 4.7 Model summaries for each mean particle size model
a b
c d
Figure 4.7 Pareto graphs of Models 1C (a) 2C(b), 3C(c) and 4C(d)
78
By far the most influential variable on the particle size is the stirring speed. It was
observed that an increase in stirring speed (agitation) causes the particle size and distribution
to decrease, as shown in Figure 4.9. This observation is in agreement by the research by Hilaire
et al47 on PA-6 particle synthesis and a host of other work on polymer particle size control140,
141. An explanation for this is that as the shear imposed upon the system increases so does the
breakage of agglomerates. This results in finer and narrower particle sizes and distributions.
Again the observation that the rate of injection causing an increase in particle size was
in agreement with the work done by Hilaire47. A possible explanation for this is that due to
increasing injection rate there are more centres for polymer growth at any one time. This, in
turn, means that the rate of aggregation of these growing particles will also increase, resulting
in greater particles sizes.
The lack of apparent effect caused by temperature is unusual as all work on particle
sizes found by the author state that an increase in temperature corresponded to an increase in
particle size. Increasing the temperature would increase the rate of collisions between growing
particles, leading to a greater rate of agglomeration. On the other hand, higher collisions would
lead to more particle breakage, it seems that breakage was dominant over agglomeration.
Further investigations should be carried out to see if these results are found at lower stirring
speeds.
It should be noted that increasing the catalyst concentration also had little effect on
particle size. Based upon previous work investigating nylon particle synthesis it would be
expected that increasing the catalyst concentration would cause an increase in particle size as
well47, 60, 142. As the CI is added continuously over a long period time, there could possibly be
an optimum catalyst/CI ratio for particle growth, and even at low injection rates, this ratio may
be exceeded. Therefore, again eliminating any influence the catalyst concentration may have
at these concentrations.
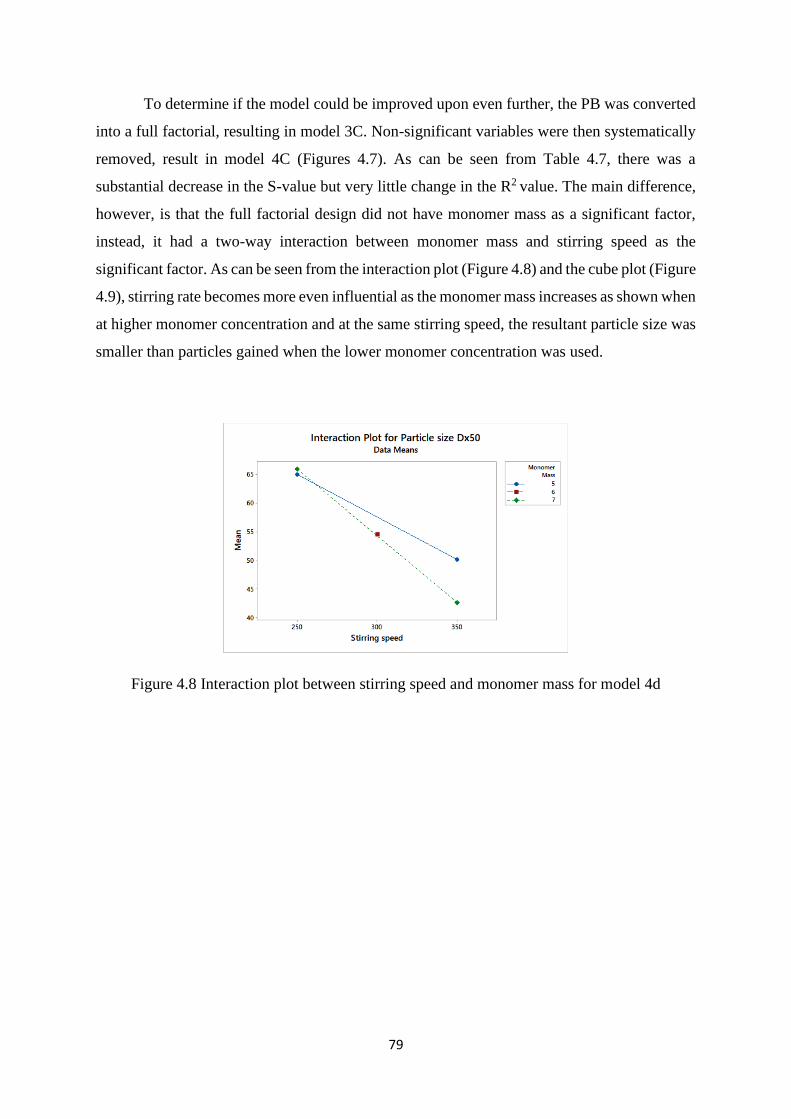
79
To determine if the model could be improved upon even further, the PB was converted
into a full factorial, resulting in model 3C. Non-significant variables were then systematically
removed, result in model 4C (Figures 4.7). As can be seen from Table 4.7, there was a
substantial decrease in the S-value but very little change in the R2 value. The main difference,
however, is that the full factorial design did not have monomer mass as a significant factor,
instead, it had a two-way interaction between monomer mass and stirring speed as the
significant factor. As can be seen from the interaction plot (Figure 4.8) and the cube plot (Figure
4.9), stirring rate becomes more even influential as the monomer mass increases as shown when
at higher monomer concentration and at the same stirring speed, the resultant particle size was
smaller than particles gained when the lower monomer concentration was used.
Figure 4.8 Interaction plot between stirring speed and monomer mass for model 4d

80
Figure 4.9 Cube plot of monomer mass, the rate of injection and stirring speed relationship
effects on molecular weight

81
Mo
del
4C
Mo
del
3C
Mo
del
2C
Mo
del
1C
Mo
del
4B
Mo
del
3B
Mo
del
2B
Mo
del
1B
Mo
del
4A
Mo
del
3A
Mo
del
2A
Mo
del
1A
Model
0.9
65
0.0
24
0.0
51
0.2
10
0.0
00
0.1
02
0.0
08
0.0
10
Monom
er
Mass
0.5
54
0.0
00
0.0
02
0.0
05
0.0
08
0.5
17
Solv
ent
Volu
me
0.5
44
0.6
62
0.1
76
Cataly
st
Volu
me
0.0
00
0.0
35
0.0
00
0.0
04
0.0
12
0.0
18
0.1
91
0.0
00
0.0
26
0.0
01
0.0
01
Rate o
f
Injectio
n
0.0
0
0.0
03
0.0
00
0.3
72
0.0
00
0.0
00
0.0
00
0.0
00
0.0
0
0.0
13
0.0
00
0.0
00
Tem
peratu
re
0.0
01
0.9
43
0.0
21
0.0
24
Stirrin
g
speed
0.0
01
0.1
10
Monom
er
Mass*
Rate o
f
Injectio
n
0.9
12
Monom
er
Mass*
Tem
peratu
re
0.0
04
0.2
21
Monom
er
Mass*
Stirrin
g
speed
0.9
32
Monom
er
Mass*
Rate o
f
Injectio
n*
Tem
peratu
re
0.8
20
Monom
er
Mass*
Rate o
f
Injectio
n*
Stirrin
g sp
eed
0.4
64
0.6
78
Rate o
f
injectio
n*
Solv
ent
volu
me
Rate o
f
Injectio
n*
Tem
peratu
re
0.8
55
Rate o
f
Injectio
n*
Stirrin
g sp
eed
0.3
75
Tem
peratu
re*
Rate o
f
injectio
n
0.0
02
0.0
06
Tem
peratu
re*
Solv
ent
volu
me
0.2
77
Tem
peratu
re*
Rate o
f
injectio
n*
Solv
ent
volu
me
Table 4.8 Table of all p-values for all models

82
Variables Responses
Run Monomer
Mass (g)
Solvent
Volume
(mL)
Catalyst
volume
(mL)
Rate of
Injection
(μL/min)
Temperature
(°C)
Stirring
rate
(rpm)
Molecular
Weight
Melting
point
(°C)
Particle
size
(μm)
1 7 16 2.0 5.0 90 250 4500 201.9 60.9
2 7 20 1.0 10.0 90 250 1600 207.1 66.3
3 5 20 2.0 5.0 110 250 4840 207.2 57.8
4 7 16 2.0 10.0 90 350 2540 198.6 49.4
5 7 20 1.0 10.0 110 250 4030 212.5 70.6
6 7 20 2.0 5.0 110 350 6900 216.4 40.1
7 5 20 2.0 10.0 90 350 2150 209.4 51.3
8 5 16 2.0 10.0 110 250 4100 213.7 65.0
9 5 16 1.0 10.0 110 350 3670 209.9 54.7
10 7 16 1.0 5.0 110 350 7110 215.0 38.1
11 5 20 1.0 5.0 90 350 2580 208.5 44.4
12 5 16 1.0 5.0 90 250 2460 202.5 53.7
13 6 18 1.5 7.5 100 300 3990 210.4 52.8
14 6 18 1.5 7.5 100 300 3820 210.4 54.6
Table 4.9 Table of raw data from DOE investigations (results are not presented in their initial
randomised order)
4.2-Reaction Kinetics
4.2.1-Introduction
While there has been a substantial amount of literature on the kinetics of anionic polymerisation
of nylon in bulk, only two studies were found by the author on the study of the kinetics of nylon
particle synthesis though precipitation polymerisation7, 76. The investigations by Stratula-
Vahnoveanu indicated that the nylon particle synthesis proceeded through pseudo-first-order
kinetics.
One other publication investigated nylon variants that stayed in solution after the
reaction had finished75. Under those conditions, polymerisation exhibited a first-order rate
dependence on the monomer and chain initiator and a zero-order rate dependence on the
concentration of the catalyst. A somewhat conflicting work revealed how the concentration of

83
the catalyst and chain initiator increased the rate of polymerisation up to a point67, albeit this
study was carried out under bulk polymerisation. Work done by Dan et al. stated that similar
effects occurred in particle synthesis, however, no quantitative data was provided60. These
works were primarily interested in the study of reaction kinetics using a one-shot injection
method. The work by Dan and Grolier7 investigated the continuous method but was more
interested in how the continuous injection of C controlled heat release more than overall
kinetics.
Furthermore, studies using CO2 and sodium caprolactamate as the chain initiator and
the catalyst respectively showed that not only did the CI/catalyst combination influence rate of
polymerisation but could potentially change the rate determining step as well. When both the
catalyst and CI are considered ‘slow’ acting, the rate determining step is the ‘initiation’ step
between the CI and the catalyst78. Therefore, the overall rate equation would be of a second
order. In contrast when a ‘fast’ acting system is used, the propagation reaction step becomes
the rate-determining step leading a first-order reaction mechanism36, 74. In most literature, the
propagation step is considered the rate-determining step and most kinetic models are based on
this. Work done by Ueda et al. stated that even the concentrations of the catalyst and chain
initiator can cause the rate equation to change79, but it should be noted that these observations
were made using a ‘fast’-acting CI/catalyst combination so how valid such observations would
be for a slow acting catalyst/CI combination is questionable.
4.2.2-Analytical methods
Dan et al. and Stratula-Vahnoveanu et al. used isothermal calorimetry and gravimetric analysis,
respectively, in studying nylon particle synthesis. Gravimetric analysis is a simple analytical
method that requires very little analytical apparatus but is very time-consuming as it requires
multiple reactions to investigate a single variable. For example, to study the reaction kinetics
at 100°C the reaction would have to be carried out multiple times, with each subsequent
reaction being quenched at a later period to analyse how much product had been synthesised
in that period. The calorimetric method allows for in situ measurements and is therefore less
time-consuming7. However kinetic information is gained from a profile of heat-rate against
time, not from the more common profile of substrate/product concentration against time. In
addition, calorimetry does not differentiate between heat release caused by polymerisation and

84
heat caused by crystallisation; further analysis would have to be carried out to quantify the heat
of crystallisation. When a catalyst is used, either the catalyst or substrate is usually added in
either one-shot or multiple injections. Continuous injection is much less common, because
should the reaction become inhibited then the quality of the results can become suspect143. This
could potentially be an issue because it is known that at lower reaction temperatures,
polymerisation caprolactam into nylon particles can be ‘physically interrupted’76. Calorimetry
would not be able to detect this directly.
For these reasons it was decided that a different method would be used to measure
polymerisation parameters in order to extract kinetics. The method chosen was Attenuated
Total Reflection-Fourier Transform Infrared (ATR-FTIR) spectroscopy. Using this method
there is no requirement to dilute samples144 and spectra can be gained quickly. Since only drops
are required for analysis, samples could be analysed multiple times, increasing the reliability
of results. The in situ FTIR probes available had a maximum operating temperature of 70°C.
At those temperatures the reaction would be prohibitively long therefore in situ measurements
were not attempted. Unlike calorimetry, this method follows the rate of the consumption of the
reactant directly so there is no need to differentiate between the heat of reaction and the heat
of crystallisation. The main disadvantage with this method is that any sample must be analysed
immediately once removed from the main reactor. Attempts to quench and store samples for
later analysis all failed. More details are provided in section 4.4.2.
To ensure that the correct reaction order is determined, the data of a reactant decreasing
with time is fitted to rate equations. Should the data fall on a straight line for a given rate
equation, the reaction order is confirmed. Should the plot curve upwards then the actual order
of reaction is less than assumed, and vice versa. The first order rate equation and its integrated
form are expressed below:

85
−𝑟𝐴 = −
𝑑𝐶𝐴
𝑑𝑡= 𝑘𝐶𝐴
(4.4)
ln (
𝐶𝐴0
𝐶𝐴) = 𝑘𝑡
(4.5)
Likewise for a second order:
−𝑟𝐴 = −
𝑑𝐶𝐴
𝑑𝑡= 𝑘𝐶𝐴
2 (4.6)
1
𝐶𝐴−
1
𝐶𝐴0= 𝑘𝑡
(4.7)
For zeroth order
−𝑟𝐴 =
𝑑𝐶𝐴
𝑑𝑡= 𝑘
(4.8)
𝐶𝐴0−𝐶𝐴 = 𝑘𝑡 (4.9)
Where -rA is the reaction rate (units change with reaction order), k is the rate constant (units
change with reaction order), t is the reaction time (min), CA0 is the initial concentration of
material (mol L-1) and CA is reactant concentration and any point in time (mol L-1).
4.2.3-Results and discussion
Figures 4.10 and 4.11 are the plots of the integrated rate form for both single and continuous
injection methods respectively. In both cases, pseudo-first-order reaction kinetics were
observed.
A small difference between the single and continuous injection can be visualized at
approximately 15 minutes into the reaction. In the single injection (Figure 4.10), there is a sharp
drop in monomer concentration from the initial starting point to 15 minutes into the reaction.

86
This corresponds to the reaction taking place in the homogeneous medium where polymer
growth is the fastest6. After a certain amount of time dependent on the degree of polymerisation
and polymer concentration, a liquid-liquid phase separation occurs, creating a polymer rich
phase and a solvent rich phase. This slows down the reaction, which is manifested by a lack of
dip as seen past the 15-minute mark in Figure 4.11 when the CI is added continuously. This
indicates that the continuous injection method limits the rate of the reaction during the
homogeneous phase.
Using a low-efficiency catalyst and chain initiator it was expected, based on the work
by Dan and Vasilie-Opera78 who used a ‘fast-slow’ catalyst/CI combination that the initiation
step was the rate-determining step, which would result in second-order reaction kinetics. The
first order kinetics observed suggests that propagation is still the rate determining step. One
potential reason for this is that the efficiency of the catalyst/CI combination is still high enough
to ensure that the propagation step is the slowest step in the reaction. The usage of a slow-
acting catalyst, such as Red-Al, helps to suppress the propagation step as well as the initiation
step. The combination used by Dan and Vasiliu-Opera would have only suppressed the
initiation step but not propagation. One other possibility is that the initiation step is the rate
determining step with this catalyst/CI combination, but side reactions are consuming the chain
initiator forcing a deviation from a second order.

87
Figure 4.10 Caprolactam consumption with time and the corresponding integrated rate plots
for one-shot injection of CI
To investigate if side reactions were causing this deviation further reactions under
equimolar conditions without the presence of the catalyst were carried out. The lack of catalyst
meant that the chain initiator reacted with the monomer and, in theory, the reaction would
progress no further than the ‘initiation’ stage. A potential reaction mechanism for this is shown
in Figure 4.12. Under these conditions, both the monomer and the CI would be consumed
linearly over time. Therefore, a reaction order of two should be observed regardless of what
step determines the overall reaction rate.

88
Figure 4.11 Caprolactam consumption with time and the corresponding integrated rate plots
for continuous injection of CI at a rate of 40µL/min
Figure 4.12 Potential reaction mechanism for caprolactam reacting with octadecyl isocyanate

89
Section below concerns equimolar reactions only
Under equimolar conditions there is no precipitation of a product, therefore reaction
kinetics cannot be followed using the carbonyl group. Thankfully, equimolar conditions the
isocyanate group on the chain initiator becomes visible to FTIR and is consumed during the
reaction as shown in Figure 4.12. However, if CI was injected into the mixture it would be very
difficult to follow kinetics as the isocyanate group would be consumed as it entered the reactor.
Effectively isocyanate signal wouldn’t be seen on the FTIR spectrum. To account for this
experiments where reaction was carried out under semi-batch conditions the dissolved
monomer was injected in the reactor containing the CI and a known volume of ethylbenzene.
Figures 4.13 and 4.14 illustrate that under equimolar conditions both injection methods
retain first order kinetics. Therefore, side reactions must be taking place to cause this deviation
from second order kinetics. Consequently, the same side reactions may also take place under
normal polymerisation conditions.
Figure 4.13 a) OI consumption against time for single injection with a reaction temperature of
70°C and corresponding integrated rate order plots

90
Figure 4.14 OI consumption against time for continuous injection at 70μL/min and 70°C and
correspoding integrated rate plots
The self-polymerisation of caprolactam is known to require temperatures up to 220-
250°C145 but the presence of a chain initiator may allow for some oligomerisation to occur at
much lower temperatures. The first order rate dependence on chain initiator concentrations
suggests that oligomerisation is occurring. To try to account for these potential side reactions
the reaction temperature was lowered from 70°C to 40°C for the single injection run and to
50°C for the continuous injection run (Figures 4.15 and 4.16 respectively).

91
Figure 4.15 OI consumption against time for one-shot injection at 40°C and corresponding
integrated rate order plots

92
Figure 4.16 a) OI consumption against time for continuous injection at 70μL/min and 50°C
and corresponding integrated order rate plots
At lower temperatures, the difference in CI injection method had a substantial impact
on the reaction order; pseudo-first-order kinetics are seen for the single injection method (see
Figure 4.15). Conversely, second order kinetics were achieved using the continuous injection
(Figure 4.16). When the monomer mixture is added continuously, the CI is in large excess until
the end of the reaction. This suggests that the side reactions, at least at elevated temperatures,
are caused by oligomerisation, not by the CI-monomer molecule reacting with the chain
initiator. At lower CI concentration levels there may be a deviation from second-order kinetics,
but this would require further experimentation to confirm.
Interestingly when the injection rate lowers from 70 µL/min to 35 µL/min and the
reaction temperature was raised to 80°C, the reaction order changes again from first to zero
order as shown in Figure 4.17. Under these conditions, the reaction rates for the initial reaction
between OI and the monomer and any potential side reactions are greater than that for the rate
of injection of the monomer. This means the kinetics are controlled solely by the rate of

93
injection. Zero-order kinetics would be favoured with high reaction temperatures and low
injection rates. However, this is in a delicate balance. Should the rate of injection increase or
the temperature be below a certain point then the reaction would revert to first order. This
reversion is caused by the rates of injection exceeding the rate of formation, allowing the
monomer to accumulate within the reaction mixture and to take part in side reactions that were
not possible at lower injection rates.
It is impossible to tell from these results if polymerisation, specifically is of 1st or 2nd
order using the OI/Red-Al combination. However, in practice even if polymerisation has
second-order kinetics it would be very difficult to achieve the required reaction conditions to
observe it and synthesise nylon particles in a reasonable time frame. In practice, overall
reaction kinetics is either first or zero order depending on reaction temperature and injection
rate
Figure 4.17 a) OI consumption against time for continuous injection (35µL/min) at 80 C, b)
Zero-order integrated rate plot
End of equimolar section

94
4.2.3.1-Effect of Chain initiator and catalyst concentration
As shown previously in Figure 4.11 under continuous injection conditions a first order reaction
was achieved, assuming that the rate of production of particles is less than the rate of injection
of the CI, resulting in the accumulation of CI in the reaction mixture.
In both cases, the reaction stops before the caprolactam is completely consumed. This
premature cessation of the polymerisation has been noted before in the work carried out by
Stratula-Vahnoveanu and Vasiliu-Opera76. Davé et al. found something similar when studying
the reaction in bulk, albeit the reaction didn’t stop, only slowed down significantly. Two
relevant reasons were proposed. Firstly, because the reaction temperature is below
crystallisation temperature, there is a competition between polymerisation and crystallisation.
Therefore, if the polymerisation rate is slow, then growing crystals may entangle with the
growing chains, encumbering the mobility of active sites. Secondly, the gel-like structure may
force a shift from a kinetic-controlled mechanism to diffusion based one67. In the case of
precipitation polymerisation, Dan and Vasiliu-Oprea stated60 that if the reaction temperature
was sufficiently low, crystallisation could occur, hindering the various phase separations that
continue within each droplet and hampering the transport of monomer within the solution phase
to the active sites in the polymer-rich phase. As crystallisation progresses, polymerisation
would eventually cease.

95
Figure 4.18 Caprolactam consumption at injection rates of 40μL/min, 30μL/min and
20μL/min and corresponding integrated rate order plots for all injection rates
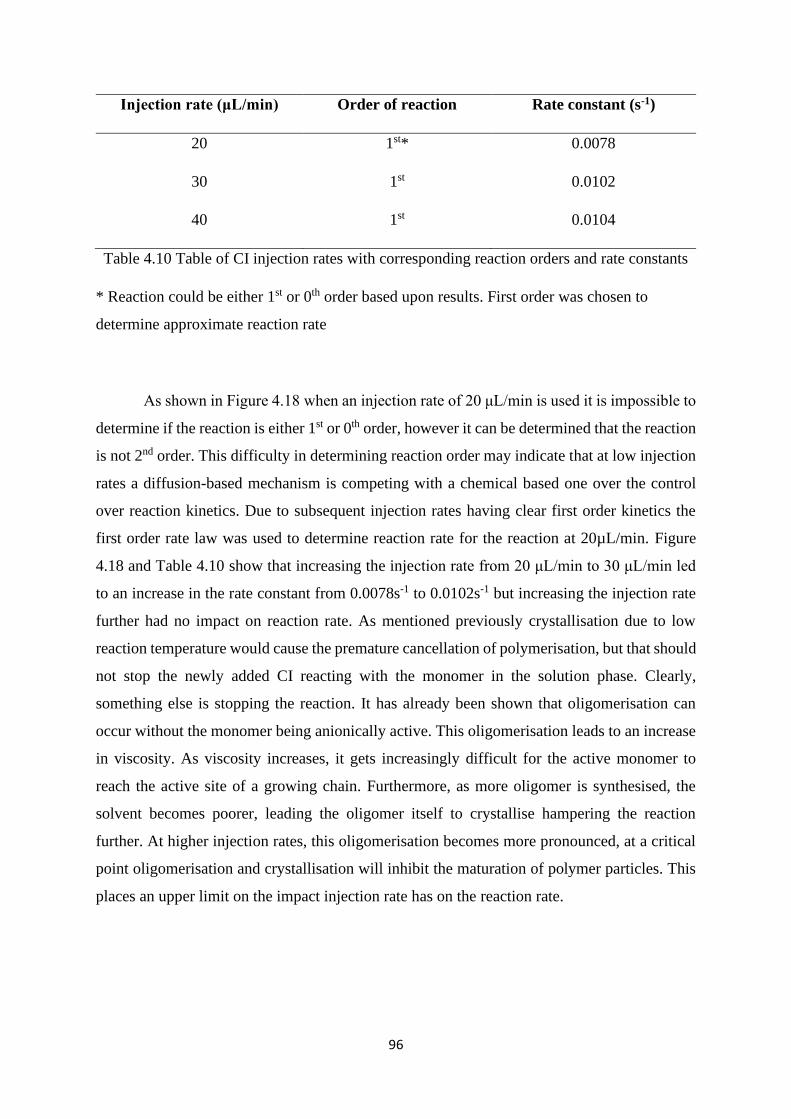
96
Injection rate (μL/min) Order of reaction Rate constant (s-1)
20 1st* 0.0078
30 1st 0.0102
40 1st 0.0104
Table 4.10 Table of CI injection rates with corresponding reaction orders and rate constants
* Reaction could be either 1st or 0th order based upon results. First order was chosen to
determine approximate reaction rate
As shown in Figure 4.18 when an injection rate of 20 μL/min is used it is impossible to
determine if the reaction is either 1st or 0th order, however it can be determined that the reaction
is not 2nd order. This difficulty in determining reaction order may indicate that at low injection
rates a diffusion-based mechanism is competing with a chemical based one over the control
over reaction kinetics. Due to subsequent injection rates having clear first order kinetics the
first order rate law was used to determine reaction rate for the reaction at 20µL/min. Figure
4.18 and Table 4.10 show that increasing the injection rate from 20 μL/min to 30 μL/min led
to an increase in the rate constant from 0.0078s-1 to 0.0102s-1 but increasing the injection rate
further had no impact on reaction rate. As mentioned previously crystallisation due to low
reaction temperature would cause the premature cancellation of polymerisation, but that should
not stop the newly added CI reacting with the monomer in the solution phase. Clearly,
something else is stopping the reaction. It has already been shown that oligomerisation can
occur without the monomer being anionically active. This oligomerisation leads to an increase
in viscosity. As viscosity increases, it gets increasingly difficult for the active monomer to
reach the active site of a growing chain. Furthermore, as more oligomer is synthesised, the
solvent becomes poorer, leading the oligomer itself to crystallise hampering the reaction
further. At higher injection rates, this oligomerisation becomes more pronounced, at a critical
point oligomerisation and crystallisation will inhibit the maturation of polymer particles. This
places an upper limit on the impact injection rate has on the reaction rate.

97
Figure 4.19 Caprolactam consumption with catalyst volumes of 2mL, 4mL and 6mL and
corresponding integrated rate order plots for all catalyst volumes
As can be seen in Figure 4.19 similar observations were made in respect to catalyst
concentration. At low catalyst volumes it becomes very difficult to determine the reaction
order. In the case of catalyst volume, it appears that the reaction is either 1st or 2nd order. As
0
0.2
0.4
0.6
0.8
1
1.2
1.4
1.6
1.8
2
0 50 100 150 200 250 300
Comparison of different catalyst volumes
2mL 4mL 6mL

98
higher catalyst volumes clearly had a reaction order of 1 the first order rate law was used to
determine the approximate reaction rate. Again, it appears that there is a competition between
diffusion and chemical-based mechanisms over control of the reaction rate. Table 4.11 shows
that as the catalyst volume increases from 2mL to 4mL, the reaction rate constant increases
from 0.0043s-1 to 0.00792s-1, however the increases in the rate constant from 4mL to 6mL were
somewhat smaller. As the catalyst will always be in vast excess of the CI at any given point,
increasing or decreasing catalyst concentration should have no real effect on reaction kinetics.
However, the oligomerisation and subsequent crystallisation would be hindering the access of
active monomer to an active site. With more anionically active monomer, the probability that
active monomer would be able to find a growing chain would increase. As the rate constant
when using 6mL of catalyst was identical to the ones gained using higher injection rates it
appears that oligomerisation becomes the dominating factor with respect to the reaction rate.
These results are similar to those gained by Davé et al67. studying bulk polymerisation.
They found that increasing the concentration of the chain initiator increased the reaction rate
until an optimum point was reached. In the study carried out by Zhang et al. looking at the
solution polymerisation of variously substituted β-lactams, they reported that polymerisation
had a first order-rate dependence on the concentration of the CI but no mention of any limitation
placed upon it. This difference is likely caused by the polymers of these β-lactams remaining
in solution. Therefore, no early crystallisation can take place to cause premature cessation to
polymerisation. Zhang et al43. found that the reaction was of zero order with respect to the
catalyst. Davé et al., like Zhang et al., reported that the concentration of the catalyst had no
impact on reaction rate. But it should be noted that in the study carried out by Davé the catalyst
was always in excess of the chain initiator. Consequently, as the catalyst cannot begin
polymerisation on its own, such a change in catalyst concentration would have shown no effect
on the reaction rate.

99
Catalyst volume (mL) Order of reaction Rate constant (s-1)
2 1st* 0.0043
4 1st 0.0079
6 1st 0.0102
Table 4.11 Table of catalyst volumes with corresponding reaction orders and rate constants
4.2.3.2-Effect of temperature on reaction kinetics
As shown in Figure 4.20 and Table 4.12 the temperature had a dramatic effect on the kinetics
of the reaction. Below 90°C the reaction rate and monomer consumption decrease substantially.
There is a smaller but noticeable increase in the reaction rate and monomer consumption
between 90°C and 100°C. However as shown by the two final samples in Figure 4.20,
polymerisation has effectively ended before all caprolactam has been reacted. The reaction
temperature is closer to the melting point of the polymer, therefore, it takes longer for both the
polymer-rich phase within each individual droplet and oligomer made from excess CI to
crystallise.
Temperature Order of reaction Rate constant
80 1st 0.0058 s-1
90 1st 0.008 s-1
100 0 0.0083 mol s-1
Table 4.12 Table of reaction temperatures with corresponding reaction orders and rate
constants

100
Figure 4.20 Caprolactam consumption at temperatures 80°C, 90°C and 100°C. All three
experiments were carried out with an injection rate of 20μL/min
Figure 4.21 a) Order tests for reaction temperatures of 80°C, 90°C and 100°C

101
The calorimetric studies carried out by Dan and Grolier7 showed that temperature has
very little influence on the initiation step but has a huge impact on the propagation step.7 If
initiation was the rate-determining step there is a possibility that temperature would have a
limited impact on the reaction rate.
As proven in Figure 4.21 increasing the reaction temperature from 90°C to 100°C
causes the reaction to shift from an overall first-order to a zero-order reaction as shown in Table
4.12. For these conditions to occur, the rate of polymer maturation, from inception to
solidification, must be slower than the rate of injection. Therefore, as the polymerisation cannot
take place without the presence of a chain initiator, the reaction rate is controlled by mechanical
injection of the chain initiator. Under these conditions at any instant in time, the number or
available anionically active monomer molecules will vastly exceed the number of chain
initiator molecules. These reaction conditions are similar to those found in a reaction catalysed
by enzymes146. Reaction conditions that favour zero order kinetics are high temperatures and
low injections rates that ensure that initiation and subsequent particle maturation happen
quickly, limits the amount excess oligomer formed and hinders the crystallisation of said
oligomer. Low reaction temperatures and high injections rate will favour a return to first order
reaction kinetics.

102
4.2.3.3-Effect of mixing on kinetics
This section concerns single injection only.
The importance that mixing intensity has on the kinetics of a chemical reaction has been known
since the 1950’s147. As mentioned previously the synthesis of polyamide particles is a highly
complex process involving multiple phase changes where the non-polar solvent transports both
monomer and catalyst to the growing chains. Additionally due to the substantial difference in
densities between the solvent used and fully formed polyamide particles (866 g/cm3 and1150
g/cm3 respectively), the minimal mixing intensity would have to ensure that particles are kept
in suspension76. Investigations carried out by Stratula-Vahnoveanu and Vasiliu-Oprea
determined that at higher mixing intensities (1000 and 2000rpm), altering mixing speed had no
effect on reaction rate. These results were corroborated by Dan and Grolier who found that
increasing mixing speeds rapidly increased reaction rate until the optimal point was reached,
after which further increases of mixing intensity had no effect. Similar results were observed
when the reaction was carried within an OBR at oscillation frequencies 1.5, 1.0 and 0.5Hz as
shown below in Figure 4.22.

103
Figure 4.22 Concentration profiles at different oscillation frequencies and corresponding
integrated rate order plots

104
As shown in Figure 4.22 at all three frequencies, concentration profiles remain broadly
the same. It should be noted however that there is greater variance in the results for the
experiment carried out at 0.5Hz, the reasons for this are unknown. The investigations carried
out by Stratula-Vahnoveanu and Vasiliu-Oprea discovered something interesting. At lower
mixing speeds, the order of reaction deviated from a pseudo-first to a pseudo-zeroth. Initially,
it was theorised that fluid motion, characterised by the Reynolds number, NRe, was responsible
for this change. Stratula-Vahnoveanu and Vasiliu-Oprea then examined the effect of changing
the Reynolds number (initial starting values ranged from 5000 to 16,000) throughout the
reaction and postulated that below a certain NRe, specifically at the edge between laminar and
intermediate flow regimes, the reaction progressed via pseudo-zero order kinetics. In most
cases, the border between these flow regimes occurres around Reynolds numbers of 2000-
5000. The OBR allows good mixing to be achieved at substantially lower Reynolds numbers
than STRs. This makes them very suitable to investigate this hypothesis. The Oscillatory
Reynolds number can be determined using the equation below
𝑅𝑒𝑜 = 𝜔𝑥𝑜𝐷/𝑣 (4.10)
Where 𝜔 is the oscillation frequency, 𝑥𝑜 is the centre-to-peak amplitude, the D is the diamter
of the tube and 𝑣 is the dynamic viscosity. Table 4.13 gives the range of Reo.
Oscillation frequency (Hz) Order of reaction Oscillatory Reynolds
number
0.5 Undetermined 1678
1.0 1st 3356
1.5 1st 5035
Table 4.13 Oscillatory Reynolds numbers for the corresponding oscillation frequency
Using oscillation frequencies of 1.0Hz and 1.5Hz, first-order kinetics were retained,
indicating that the flow regime did not influence reaction order. The results from 0.5Hz were

105
messy and too inconsistent to be used to determine the reaction order. In addition, the dip
between first and second measurement was severe in all cases. Large dips in monomer
concentration early in the reaction have been seen before but never to this degree. The reason
for this abnormally large dip is not known. In the work carried out by Stratula-Vahnoveanu
and Vasiliu-Oprea, the shift in reaction order from zero to one was not accompanied by a
substantial decrease in reaction rate. As shown in Figure 4.23 under equimolar conditions,
lowering the mixing intensity did not lead to a decrease in reaction rate or a change in reaction
order. Therefore, any change must occur at later stages of the reaction. One possible
explanation is that the lower mixing speeds the reaction shifts from a chemical control
mechanism to diffusion one and under these conditions, the reaction rate becomes independent
of the monomer concentration. In the work carried out by Stratula-Vahnoveanu and Vasiliu-
Oprea, there was not a large decrease in reaction rate following the change in the reaction order,
indicating that poor mixing was not responsible for this change. It has been proven that shear
rate has a strong influence on the size of polymer phase droplets. The weaker the agitation, the
larger the liquid-like droplets and the lower the corresponding surface area to volume ratio.
This hinders diffusion of active and normal monomer into the polymer droplets. Past a certain
size of droplet, diffusion would become independent from monomer concentration and pseudo-
zero order kinetics would be observed.

106
Figure 4.23 OI consumption under equimolar at stirring speeds 400, 600, and 800rpm and
corresponding integrated rate order plots

107
4.3-Conclusions
4.3.1-Plackett-Burman design conclusions
In this chapter, using the Plackett-Burman factorial design, the factors that affect molecular
weight, particle size distribution and the melting point of nylon-6 particles were determined
and analysed in detail when the chain initiator was injected continuously. The most important
factors affecting molecular weight were temperature, the rate of injection and monomer
concentration.
Similar to molecular weight, the injection rate and temperature had a significant impact
on the melting point. Conversely to molecular weight, increasing the monomer/solvent ratio in
favour of the solvent actually increased the melting point. It is theorised that small amounts of
unreacted monomer are trapped within the polymer particles and the greater solvent volume
minimalizes the amount of monomer trapped.
For particle size, the most important factors were mixing speed followed by the
injection rate. Oddly while monomer mass was not found to be a significant factor, a 2-way
interaction between monomer mass and mixing speed was.
The biggest deviation from the single injection method was the apparent lack of
influence that the catalyst concentration had on either particle size or molecular weight. When
the chain initiator is added in a single injection, the catalyst/monomer/chain initiator ratio has
influence over both. Adding the chain initiator continuously it appears that the CI/catalyst
stoichiometry becomes irrelevant.
4.3.2-Kinetic measurement conclusions
A new method to analyse the kinetics of nylon-6 particle synthesis using ATR-FTIR was
successfully developed. In theory, using the ‘slow-slow’ catalyst combination, the rate
determining step would be the initiation reaction between the CI and active monomer. Under
these conditions, the reaction would have second order kinetics. In practice, first-order kinetics

108
were observed in most cases. This deviation is caused by the CI reacting with the non-activated
monomer to form small oligomer chains. At no point was second order kinetics achieved.
The three factors of interest were the catalyst concentration, CI injection rate and
reaction temperature. All three factors were shown to influence reaction kinetics. Both catalyst
and CI injection rate affected the reaction rate, however no further increase in reaction rate was
observed past an optimum concentration. Additionally, in all cases, there was a cessation of
polymerisation before the complete consumption of the monomer. This cessation occurred at
the same point in the reaction. It is thought that the excess oligomerisation and crystallisation
due to low reaction temperatures are the cause of these limitations. Only with increasing the
reaction temperature was this premature stoppage of polymerisation delayed. The reaction
order was found to change depending on the rate of injection and reaction temperature. If the
reaction was carried out using a low injection rate under high temperatures, polymerisation
proceeded via zero order kinetics. However, at lower reaction temperatures and higher injection
rates, overall reaction kinetics reverted back to first order.
Previous research carried out in an STR found that the reaction proceeded through
pseudo-first order kinetics under a turbulent flow regime and via a zero-order mechanism under
a flow regime in the intermediate-laminar boundary region. From these results, it was suggested
that the flow regime can influence reaction kinetics. When polymerisation was carried out in
an OBR, a first order reaction kinetics was maintained. From these observations, it was
hypothesised that large particles with poor surface-area to volume ratios were the cause of the
change in order.
4.4.-Problems
4.4.1-PA-6 synthesis
Two substantial problems arose when attempting to synthesise PA-6, both were related to the
continuous injection of the CI. Originally Isophorone Diisocyanate (IDI) was chosen as it is a
liquid at room temperature. However, particles made using this CI were of poor quality. It may

109
have been possible to improve upon these results using IDI however it was recommended that
the CI should be changed to OI.
The use of OI presented a second problem, OI is a solid at room temperature. The
experimental apparatus had to be adjusted to take this into account. The simplest solution
required two stages. The first was to keep the exposure of Teflon tubing connecting the
chamber of the syringe pump to the reaction vessel the cool air as minimal as possible. The
second step was to heat the syringe pump chamber and Teflon connecting tube with a hair dryer
placed above them. Once these steps had been implemented, PA-6 particles of high quality
were synthesised consistently.
4.4.2 Kinetics measurements
Initially, samples were not analysed immediately but were quenched using a specified aliquot
of methanol, sealed immediately to ensure that the solvent and methanol did not evaporate and
stored for later analysis. However, as samples cooled they solidified due to the previously
growing chains coming out of solution. This makes High Performance Liquid Chromatography
(HPLC) and Gas Chromatography (GC) impossible. Initial attempts to use GC were
ineffective. Methanol is a good solvent for caprolactam and subsequent oligomers so in theory
increasing methanol concentration would ensure dissolution at room temperature. Even so, the
high boiling point of caprolactam and oligomers would require the usage of the expensive High
Temperature Gas Chromatography technique (HT-GC). The HPLC technique also suffers from
difficulties as there have been no pre-existing methods to analyse caprolactam. The
development of a new method is a complex and time-consuming process.
Instead of trying to keep samples in solution, Thermal-Gravimetric Analysis-Mass
Spectroscopy (TGA-MS) was proposed. Using this technique, the state of the sample would be
irrelevant and both the consumption of caprolactam and the formation of products, in theory,
could be followed. However, it was impossible to find these two pieces of equipment equipped
with a connector that could withstand the temperatures (>510°C) required. A different thermal
analytical technique, Thermal Volatilisation Analysis (TVA), was also attempted, however, the
boiling point of caprolactam was too high for this technique to be valid.

110
FTIR analysis was also attempted using additional methanol to keep the samples in
solution, however the results were very poor and inconsistent. It was decided that samples
would be analysed immediately to circumvent the necessity of using methanol altogether.

111
Chapter 5 - PA-12 synthesis
This chapter presents the development of a synthesis route to synthesise PA-12 within an OBR.
5.1-Introduction
The majority of literature concerning nylon particle synthesis focuses on PA-6 particles, there
is very little available concerning the synthesis of PA-12 particles. Most of what was found by
the author were in the form of patents or books. Like with the PA-6 variant, when synthesised
in bulk, the main method used is hydrolytic polymerisation or anionic. Due to the poor quality
of polymers formed using cationic polymerisation, this method has not been reported to have
been used in industry148. In terms of properties, PA-12 has characteristics that are between
aliphatic nylons with shorter chains (such as Nylon-6) and polyolefins149. PA-12 has similar
mechanical properties to PA-6 and PA-6,6 but has a substantially lower melting point (178°C-
180°C)150 than either of them and it’s low water absorbance characteristics and density are
closer to polyolefins151. It crystallises in a pseudo-hexagonal modification. Thanks to its
relatively long hydrocarbon chain length, PA-12 possess dimensional stability and paraffin-
like structure. PA-12 has numerous applications ranging from laser sintering (or UV curing)49,
use as an additive in polyethylene films152, electrostatic coating153, 154 and cosmetics154.
There are two known ways to form PA-12 particles, both involve anionic
polymerisation. Attempts to replicate synthesis of PA-12 particles via precipitation
polymerisation using methods provided in patents were not successful. The other involves
polymerising styrene to form polystyrene and then polymerising the laurolactam trapped within
it. This requires two polymerisation steps and styrene polymerisation may damage the motor
used for oscillation. For these reasons the method chosen was precipitation polymerisation.
5.2-Results and discussions
5.2.1-Development of synthesis route
At first glance, the main issue with PA-12 synthesis seems to be the overall speed of the
reaction. It appears that the dodecalactam is much more reactive than caprolactam. Using
conditions that would successfully produce PA-6 particles instead results in a tough rubbery

112
like substance precipitating from solution quickly and beginning to coat the baffles as shown
in Figure 5.1. This substance is most likely a mixture of the oligomer, small polymer chains
and monomer. However, the work by Frunze et al.155 studying the formation of nylon-6/12
copolymers in bulk polymerisation found that caprolactam was more reactive than
dodecalactam. Therefore, the problems must arise from either the rate of agglomeration of
growing particles, poor solvency of the monomer and subsequent oligomer or a combination
of the two.
Figure 5.1 The build-up of oligomer on the baffle
If the CI is being added quickly, the precipitation of the rubbery oligomer occurs very
fast, almost immediately in some cases. Slowing the injection rate lowers the rate of formation
of this coating by 15-30 minutes but does not stop it. In theory, it may be possible to avoid
altogether by making the injection rate very low, on the scale of nl/min. However, in practice,
this would make the reaction time prohibitively long.

113
If the issue was purely down to agglomeration, the easiest solution to counteract this
would be to lower the temperature. Unfortunately, dodecalactam comes out of solution at
~70°C and the reaction remains uncontrollable at this temperature. If solvency was the only
issue, then lowering temperature will have made the problem even worse.
The work by Florin and Vasiliu-Opera went into substantial detail of the multiple phase
separations that occur during polymer synthesis6. While all these phases somewhat over-lap,
they noted that polymerisation was the quickest when the reaction mixture was in the
homogeneous phase. Initial phase separation occurred due to the solvent becoming ‘poorer’ as
polymerisation progressed, which led to liquid-liquid demixing resulting in the two phases.
Depending on the solvent quality, this can lead to rapid precipitation and solidification. The
phase separation results in a polymer rich phase and solvent rich one. It was theorised that the
polymer phase is in the shape of liquid like droplets. The polymerisation is slower in this phase,
as would be agglomeration of polymer chains and particles. In the majority of cases, it was
noticed that the formation of the rubbery oligomer began before the initial phase separation.
As this is where polymerisation is fast, rapid polymerisation will be making the solvent
‘poorer’, very quickly leading to precipitation and solidification seen on the baffles.
By adding a small amount of caprolactam to the system, the polymer will begin to grow
as a PA-6 oligomer chain. Due to the greater acidity of the hydrogen on the caprolactam amide
group, the catalyst would react to with caprolactam first and not the dodecalactam, therefore
caprolactam would have to be consumed before reaction could continue with the dodecalactam.
The greater solubility granted to the growing chains due to the incorporation of the
caprolactam, monomer would help the reaction pass through the homogeneous phase and allow
phase separation to occur without issue. Care has to be taken to ensure that the PA-12 properties
are not affected by this incorporation of caprolactam.
In a patent published by Arkema49, the inorganic additive N,N-Ethylene bis(stearamide)
(EBS) was added to help the control of the particle size of synthesised PA-12. The additive
interacts at the polymer-solvent interface, coats the surface of individual particles resulting in

114
long-range repulsion between them. This helps to prevent the agglomeration of particles156.
Unfortunately, any attempt to replicate the conditions used in the patent failed. However, the
addition of the additive to the reaction mixture aids in the prevention of agglomeration at all
stages of the reaction.
A secondary problem that was encountered was clogged Teflon tubing. In some cases,
particularly with fast injection rates, oligomer would form at the end and sometimes inside the
tubing. This clogging was caused by the OI immediately reacting with the monomer and the
resultant oligomer coming out of solution. To circumvent this, the OI was ‘capped’ with
caprolactam. The capped OI takes longer to react with activated anion due to lower
nucleophilicity of the carbonyl carbon on the caprolactam, therefore, enabling the CI blend to
mix within the reactor. To keep the CI blend in a liquid form, it must be dissolved in
ethylbenzene and be constantly heated. Furthermore, the addition of the solvent will also dilute
the OI, further slowing the reaction, aiding in the prevention of uncontrolled agglomeration.
To cap the CI, an equimolar amount of caprolactam was dissolved in ethylbenzene and
mixed with the OI. The mixture was then heated to 55°C for 20 minutes to ensure that all the
caprolactam had reacted with the OI. By combining all three additions, consistent PA-12
synthesis was achieved. EBS, in particular, had a significant effect on polymerisation as shown
in Table 5.1.
Mass of EBS Mass of caprolactam Percentage Yield
0.5 0.6 0
0.25 0.6 5.2%
0.15 0.6 55%
0.15 0 Reaction failed
0 0.6 Reaction failed
Table 5.1 Percentage yield of PA-12 after 2 hours using different masses of EBS and
caprolactam contents. Reaction considered a failure if uncontrollable agglomeration occurred.

115
When 0.5g of EBS was used, the reaction was slowed so significantly that even after 2
hours phase separation had not even begun. Halving the EBS concentration allowed for the
formation of only a small amount of product but, crucially, PA-12 was successfully
synthesised. Lowering the EBS further to 0.15g substantially increased the percentage yield.
Attempts to remove the small amount of caprolactam while using 0.15g of EBS were not
successful. This indicates that the problems with rapid solidification of the oligomer from
agglomeration occurred mainly in the homogeneous phase.
Removing EBS from the system also resulted in rapid solidification of the growing
oligomer. EBS helps to prevent agglomeration in the homogeneous phase so it may be possible
that increasing the amount of caprolactam in the mixture would enable the reaction to proceed
smoothly without the EBS, this however may compromise the quality of the particles. In
addition, it is possible that the rapid precipitation of particles may be induced/ continue to
proceed after phase separation because of the absence of EBS.
5.2.2-Effect of experimental parameters on molecular weight
The most immediate difference between PA-12 and PA-6 is that the PA-12 molecular weights
are significantly larger than the PA-6 particles formed in section 4.1. This most likely arises
from the difference in CI/monomer molar ratio. When synthesising PA-6 the ratio was more in
favour of the chain initiator, resulting in lower molecular weights. As the results show in Table
5.2 and in section 4.1.5.1, decreasing the injection rate caused an growth in the molecular
weight. By decreasing the concentration of CI, there will be fewer active sites leading to longer
polymer chains. This observation is in agreement with Udipi et al.74 in their work on bulk
polymerisation where below a certain CI concentration, decreasing the CI concentration
resulted in an increase in molecular weight. However, Udipi et al. found that passed a certain
point increasing the molecular weight lead to an increase in molecular weight. Alternatively,
the patent by Hilaire et al. made no mention of the positive impact decreasing the CI
concentration can have on the molecular weight. Alternatively, the patent by Hilaire et al. only
states that increasing the CI concentration increases molecular weight. Ultimately, however,

116
the changing of injection rate had a noticeable but minor impact when compared to the reaction
temperature.
Variable Variable value Molecular weight (g mol-1)
Injection Rate 30μL/min 33700
22.5μL/min 35300
15μL/min 36100
Temperature 90°C 42900
80°C 36100
70°C 26900
EBS 0.35g 36100
0.25g 45100
0.15g 40100
Table 5.2. Table displaying the influence of CI injection rate, temperature and mass of EBS
on the molecular weight
The temperature of the reaction had the most powerful influence over the molecular
weight. Increasing the reaction temperature by 20°C nearly doubled the molecular weight of
the particles. This observation agrees with multiple patents and articles47, 60, 74. The work by
Dan and Grolier7 found that temperature had little influence over the initiation step but greatly
affected the rate of the propagation step. Noticeably, the impact temperature has on molecular
weight of PA-12 is much more substantial than it had on PA-6, this could be attributed to the
fact that molecular weight’s temperature dependence becomes more pronounced at greater
molecular weights131.
The impact EBS has on molecular weight is slightly harder to assess. The middle mass
value, 0.25g, corresponded to the highest molecular weight recorded, substantially higher than

117
the value gained with a higher reaction temperature. While the mixture with the lowest mass
of EBS resulted in the particles with the second highest molecular weight. Neither Hilaire and
Guerin47 nor Vasiliu et al. 156 mentioned that an additive such as EBS had any effect on the
molecular weight.
As previously noted, soon after the reaction has initiated, the homogeneous mixture
demixes into a polymer rich phase and solvent rich one. The polymer rich phase is theorised to
be in the form of liquid-like droplets. It is within these droplets that the majority of
polymerisation takes place. The EBS only covers these droplets. Therefore, the additive has no
influence over potential chain entanglements within the droplets. The solvent phase transports
the monomer to the droplets. The EBS layer covering the droplets could be hindering the access
of the monomer to these droplets, resulting in lower molecular weights. Unfortunately, there
were no articles found by the author detailing how an additive may affect the molecular weight
of a polymer to compare with this hypothesis.
5.2.3-Effect of experimental parameters on mean particle size
As shown in Table 5.3, as temperature increases so does the mean particle size. This
observation is in agreement with other patents and articles47, 60 focused on particle size control
of PA-6 particles. Increasing the reaction temperature would lead to greater collisions between
the growing particles, resulting in particle amalgamation. Likewise, increasing the EBS
concentration resulted in a decrease in particle size. This is expected as increasing the coating
of the polymer droplets would lead to greater repulsion between them, leading to fewer particle
collisions.

118
Variable Variable value Mean Particle size
Injection Rate 30μL/min 145
22.5μL/min 162
15μL/min 175
Temperature 90°C 284
80°C 175
70°C 113
EBS 0.35g 157
0.25g 141
0.15g 175
Table 5.3 Table displaying the influence of CI injection rate, reaction temperature and mass
of EBS on the PA-12 particle size
The most surprising set of results were those concerning the injection rate. The results
were the opposite of what was expected. Both the observations by Hilaire and Guerin47
studying PA-12 synthesis and those in Chapter 4 investigating PA-6 particle size control
showed that increasing the injection rate led to larger particles, not smaller ones. However,
similar observations have been found when polystyrene was formed via suspension
polymerisation using a semi-batch process157.
With the EBS acting as a coating for the ‘liquid-like’ polymer phase droplets to help
the prevention of coalescence, the reaction in some respects could be considered to be carried
out in a pseudo-suspension. Nogueira et al. studied the effect of injecting additional styrene
monomer into an already polymerising system157 and reported that at lower feeding rates
particles became larger. The reasons for which are not completely understood but it was
theorised that at low feeding rates there was more uniform interaction between old and new

119
droplets, because of this interaction, existing particles swell. Such interactions may be the cause
of the patterns observed in PA-12 particle synthesis.
5.2.4 Effect of experimental parameters on melting point
Both the reaction temperature and the injection rate had no real impact on the melting point of
PA-12 particles. The melting point of polymers is controlled by various factors including but
not limited to, main chain structure, intermolecular forces, molecular weight, crystallinity and
the absence or presence of certain additives such as plasticizers. When the molecular weight of
a polymer is below a certain point, further reductions in molecular weight will have a negative
effect on the melting point. Both temperature and injection rate adjust the molecular weight of
the particles but as shown in Table 5.4, not to the degree where the melting point is affected.
Variable Variable value Melting Point (C Degree of
Crystallinity
Injection Rate 30μL/min 178.7 37.68
22.5μL/min 178.4 39.14
15μL/min 179.7 38.93
Temperature 90°C 177.3 38.10
80°C 179.7 39.15
70°C 178.2 38.68
EBS 0.35g 174.3 38.54
0.25g 173.7 38.09
0.15g 179.7 39.71
Table 5.4 Influence of variables on the PA-12 melting point and degree of crystallinity
At low concentrations, EBS did not affect the melting point, however, at higher
concentrations, EBS lowered the melting point by approximately 5°C. EBS has been shown
to be a capable nucleating agent in the synthesis of polylactic acid158. While unlikely, it may

120
be possible that in the context of polyamide synthesis EBS was acting as a nucleation inhibitor.
To determine if this was the case, the degree of crystallinity was determined using the equation
below:
𝑋𝑐 =
(∆𝐻𝑚 − ∆𝐻𝑐)
∆𝐻𝑐(100%)× 100 (%)
(5.1)
Where 𝑋𝑐 is the degree of crystallinity, ∆𝐻𝑚 (J/g) is the enthalpy of melting of the sample, ∆𝐻𝑐
(J/g) is the enthalpy of crystallisation and ∆𝐻𝑐(100%) (J/g) is the heat of fusion for 100%
crystalline polymer. The value for the heat of fusion for 100% crystalline polymer was taken
to be 209.3 J/g determined by Gogolewski159.
As seen in Table 5.4, while the crystallinity of each sample varies slightly, overall there
was no real difference in the degree of crystallinity between samples. This indicates that the
EBS was not acting as nucleation inhibitor. An alternate explanation for the reduction in
melting point is that EBS is being trapped within the polymer particles but only at higher
concentrations is there enough EBS present to have a negative impact over the melting point.
5.2.5 Morphology
Investigations by Dan et al.6 showed that the morphology of PA-6 particles was controlled by
a complex process involving phase separation and crystallisation. Both of which are strongly
influenced by the catalyst/CI combination used, e.g. ‘slow’ acting and ‘fast’ acting. The
efficiency of a catalyst is dependent on its nucleophilicity. Therefore, caprolactamates of alkali
metals are considered ‘fast’ acting, while alkali metal aluminium alcolates are ‘slow’ acting6
for the purposes of PA-6 synthesis. The efficiency of the chain initiator is dependent on the
electron deficiency of the carbonyl carbon. The more electron deficient the carbon atom is, the
more efficient the CI.

121
Dan and Vasiliu-Oprea reported that when using a ‘slow-slow’ or a ‘slow-quick’
CI/catalyst combination, the resultant particles were irregularly shaped and roughly textured.
The polymer particles had a continuous structure giving cohesion to the particle, consequently,
the particles were highly porous as shown in Figure 5.2.
Figure 5.2 Micrograph of PA-6 particles formed using a ‘slow-slow’ CI/catalyst system
a b
Figure 5.3 Micrographs of Nylon-12 particles formed using a slow/slow CI/catalyst
combination at a magnification of a)x1811 and b) x5000

122
However, the morphology of PA-12 resulting from the usage of a ‘slow-slow’
CI/catalyst system was substantially different as shown in Figure 5.3. There are no individual
particles, instead, there are fused agglomerates from individual globules. In this case, the
globules have a porous, spherulitic structure that is commonly seen in PA-6 particles made
from highly efficient CIs.
Particle morphology is highly influenced by the initial phase separation that occurs once
the concentration of growing chains and the degree of polymerisation reaches a certain level.
This liquid-liquid phase separation results in a polymer rich phase and a solvent rich phase.
The former is made from liquid-like droplets and polymerisation continues within these
spheres. When phase separation is reached quickly, shear forces caused by mixing allow
polymer phase droplets to collide before solidification, resulting in agglomeration.
Additionally, chain growth also has a strong influence on the morphology, when all the chain
initiator reacts immediately, demixing domains are more uniform.
Less efficient (‘slow-acting’) CIs react slowly, therefore the viscosity of the
homogeneous medium increases slowly. When enough active sites are generated, chain growth
begins. As with more efficient CIs, a polymer phase and solvent rich phase are formed with the
polymer phase in the shape of liquid-like droplets. However, in this case, the droplets do not
collide, instead, phase separation continues to occur within each droplet. A small increase in
polymer concentration can then induce spinodal demixing, leading to the creation of continuous
structures seen in Figure 5.2.
5.3 Conclusions
A method to synthesise PA-12 particles was successfully created. The main issue to overcome
was the rapid agglomeration of oligomer in the initial phase of the reaction. This was achieved
by three alterations to a method that is used to synthesise PA-6. Firstly, small amounts of
caprolactam was added to help smooth the reaction during the initial homogeneous phase.
Secondly, the additive EBS was added. EBS coats the ‘liquid’-like droplets of the polymer
phase and causes steric repulsion between these droplets, lowering the agglomeration rate.

123
Lastly, the CI was capped with caprolactam and dissolved in ethylbenzene. All three alterations
were required for successful synthesis.
Using this method, the influences of reaction temperature, EBS concentration and
injection rate on the molecular weight, the particle size and the melting point were investigated.
Expectedly, the reaction temperature had a substantial influence over the molecular weight and
particle size, but no impact on melting point. Increasing the injection rate led to a small decrease
in both molecular weight and particle size. This decrease in particle size was the opposite of
what was expected. It is theorised that the presence of EBS is responsible for this unexpected
result. Again, the injection rate had no impact on the melting point. Only the concentration of
EBS had any effect on the melting point. At higher concentrations, EBS noticeably lowered
the melting point. Furthermore, particle size was lowered with increasing EBS concentration.
Increasing the EBS would lead to a greater repulsive coating, hindering agglomeration and
subsequently lowering particle size. Theoretically, EBS should have no impact on the
molecular weight but in practice the EBS coating may be hindering the monomer from entering
the polymer phase droplets.
5.4 Problems, observations and solutions
To ensure that CI is added continuously, it is preferred that the tip of the tubing is submerged
within the reaction mixture. However, backwards fluid oscillations can force the CI mixture
back into the Teflon tubing, leading to blockage. Unfortunately, the only means to resolve this
issue was to remove the tubing from the reaction mixture and suspend the tubing over it. It was
attempted to ensure that the tubing exit was in contact with the reactor wall so as to avoid the
formation of droplets, but this was not always successful.
Capping the CI with caprolactam resulted in the eventual solidification of the CI at
room temperature. The addition of ethylbenzene to the mixture helped to keep the CI mixture
in a liquid state for longer, however eventually the capped CI would come out of solution within
either the syringe or the Teflon tubing. To account for this, the syringe and Teflon tubing had
to be constantly heated.

124
It must be noted that, initially, Nylon-12 particles were formed without the aid of EBS.
It was later discovered that the catalyst used in these had been poisoned/contaminated. From
this, it can be assumed that if a catalyst is sufficiently weak, the EBS is then not required for
synthesis.

125
Chapter 6-Conclusions and future work
The final chapter presents the major conclusions reached in this work. In addition, some
suggestions for future research are also put forward.
6.1 Conclusions
The factorial design was successful in determining which factors control polymer properties of
interest when the chain initiator was added continuously over a set time. The most important
factors influencing molecular weight were reaction temperature, the rate of injection and
monomer concentration and two-way interaction between the monomer mass and the CI
injection rate. Increasing the temperature lead to a substantial increase to the molecular weight.
Conversely, increasing the injection rate of the CI lead to a decrease in the molecular weight.
Additionally, increasing the monomer mass also increased the molecular weight. However, due
to the two-way interaction between the monomer mass and the CI injection rate the influence
monomer mass has molecular weight decreases greatly as the CI injection rate increases.
For particle size, the significant factors were stirring speed, the CI injection rate and a
two-way interaction between monomer mass and the stirring speed. The stirring speed was the
dominating factor controlling the particle size. It was found that increasing the stirring speed
resulted in a marked decrease in the particle size. And due to the two-way interaction between
monomer mass the stirring rate becomes even more influential at greater monomer masses.
Lastly, increasing the CI lead to an increase in particle size.
The melting point was affected by the reaction temperature, a two-way interaction
solvent volume and temperature and the solvent volume. As expected, increasing the reaction
temperature lead to an increase in the melting point, however so did increasing the solvent
volume. This is surprising as the solvent volume had no influence over molecular weight and
if it had it would be expected that increasing the solvent volume would decrease the molecular
weight and therefore melting point. It is thought that the concentration of un-reacted monomer
trapped within the particles was minimised due to increased solvent volume.
126
The most surprising results from the design was the apparent lack of influence the
catalyst concentration had on the polymer properties. For the reaction under batch conditions
it was reported that both the monomer/catalyst ratio and the monomer/CI ratio had influence
over molecular weight and particle size. Under semi-batch conditions neither ratio appeared to
have any influence over polymer properties.
The kinetics of PA-6 synthesis under semi-batch conditions were studied in substantial
detail. In theory, with the combination of slow acting catalyst and CI used, the reaction kinetics
would be second order due to the initiation step becoming the rate determining step. In practice,
however, second order kinetics were never observed under full reaction conditions. Reactions
under equimolar conditions without the presence of the catalyst were undertaken to investigate
the initiation stage of the reaction. It was found that side reactions may be taking place forcing
a deviation from second order kinetics. Under equimolar conditions the single injection method
always resulted in first order kinetics but under continuous injection conditions 1st, 2nd and 0th
order kinetics were observed. Under continuous conditions 1st order kinetics were observed
when both the CI injection rate and reaction temperature where high, 0th order kinetics were
observed when the reaction temperature was high, and the injection rate was low. 2nd order
kinetics were observed when the reaction temperature was low, and the injection rate was high.
Three different stirring rates were tested to determine if mixing had any influence over
chemical kinetics. None of the three stirring rats tested had any influence over the reaction rate.
The four factors of interest under normal reaction conditions were reaction
temperature, CI injection rate, catalyst concentration and mixing intensity. In all cases there
was a premature cessation of the reaction. It was theorised that this cessation was caused by
the pre-mature crystallisation of nylon particles and oligomer due to undercooling. This pre-
mature crystallisation first hinders then completely inhibits the reaction. By increasing the
reaction temperature crystallisation can be hindered allowing the reaction to progress further
than it would at lower temperatures. However, other than reaction temperature, no other
variable had any influence over this stoppage. Increasing both the catalyst and CI concentration
increased reaction rate, but beyond a certain point, increasing concentration further had no
further impact on kinetics. At low catalyst and… concentrations the order of reaction was
undefinable, indicating that reaction kinetics were controlled via a diffusion mechanism and

127
not a chemical one. The upper limits of influence for both catalyst concentration and CI
injection was the same, with the reaction rate being near identical when either the CI injection
rate or the catalyst concentration was at its maximum value. Again, the stirring rate was not
found to have any impact over the reaction kinetics.
In practice, the order observed was either first or zero for the reaction under normal
conditions. At no point were 2nd order kinetics observed. The order was depended on the
reaction temperature and rate of injection. With slow injection rates and high temperatures,
zero order kinetics were favoured, while first order kinetics were favoured with fast injection
rates and low reaction temperatures. With slow injection rates and high reaction temperatures
it was theorised that the rate of polymer maturation, from inception to precipitation was greater
than the rate of injection. Under these conditions the reaction rate would be independent of
monomer concentration. With higher injection rates and lower temperatures the CI would be
able to accumulate within the reactor making it more single injection-like in character, resulting
in first order kinetics.
A method to synthesise PA-12 particles was successfully developed. This was achieved
by capping the CI with caprolactam and by adding small amounts of caprolactam and EBS to
the reaction mixture. All three were required for successful synthesis. Using this method, the
effects of temperature, CI injection rate and EBS concentration on molecular weight, particle
size and melting point were studied. Increasing the reaction temperature led to an increase in
particle size and molecular weight but had no impact on the melting point. Conversely,
increasing the CI injection rate led to a decrease in both molecular weight and particle size;
however, again, there was no change in melting point. Only by increasing EBS concentration,
was the melting point negatively affected. The reasons for this was not determined. Like with
injection rate, increasing EBS concentration resulted in a small decrease in and particle size.
The influence EBS had over molecular weight could not be determined. Results were erratic
with the median value for the EBS concentration giving by far the largest reported molecular
weight. Investigations would have to repeated to determine the effect of EBS has on the
molecular weight of PA-12.

128
Currently it is not recommended to attempt the synthesis of PA-12 under continuous
conditions. There are two major related issues that would need to be resolved. The first issue
is that there is still substantial build-up of a mixture of product and oligomer forming between
the columns of the baffles. In addition, a thin layer of oligomer can form on the surface of the
reactor. This build-up, while not ideal does not interfere with oscillation of the baffle under
batch conditions. However, under continuous conditions these two problems would be
heightened and eventually either of these issues may interfere with the oscillatory motion of
the baffle/fluid. The second major issue is that cleaning the reactor is difficult. Even provided
that the reaction recipe in its current state could be used in a continuous reactor for a limited
time it would be very difficult to clean the reactor. Under batch conditions the build-up of
product and oligomer is relatively easy to clean by hand. Under continuous conditions were
there could be many baffle cells the reactor would have to be cleaned using solvents. The only
chemicals found by the author that are known to fully dissolve PA-12 are m-cresol, 90%+
sulphuric acid and HFIP. All of which are dangerous and in the case of HFIP, expensive.
Additionally, the polymer would act as a thickening agent. To counteract this excessive solvent
would have to be used. To solve both these major issues the reaction recipe and conditions
would have to be optimised to make it as ‘smooth’ as possible to circumvent this build-up. If
this can be achieved, then further studies in a continuous reactor can be recommended.
6.2 Future research
Due to the time constraints, some aspects of the research work cannot be investigated, the
following is a list of potential future work in this area:
• The factorial design was successful in analysing a host of experimental properties that
influence PA-6 particle synthesis. However, there is room for improvement. Further
study of the various two-way interactions that influence polymer properties may
substantially improve the model. Udipi et al.74 showed that the mechanisms controlling
polymer properties such as molecular weight can change dramatically depending on the
concentration of the reactants. Expanding the model to study greater variations in
reactant concentrations would give a greater understanding of these mechanistic
changes. Additionally, new factorial designs to investigate different combinations of
129
catalysts, CIs and solvents would give a better insight into the most efficient ways to
manipulate polymer properties;
• It is advisable to repeat previous kinetic measurements using In-situ methods. It was
observed that due the reaction mixture shifting from the homogeneous to heterogeneous
phase the reaction rate could change substantially during the first 15 minutes. The In-
situ methods would provide greater detail to what is happening during this phase change
as well as the whole reaction. In addition, it would give clarity to measurements gained
when a 0.5Hz oscillation frequency was used. There are other variables that potentially
impact polymerisation kinetics that have not been studied. Of interest would be to
investigate how solvent properties and monomer concentration affect reaction kinetics.
• It was theorised that a physical interruption of the polymerisation process occurs at low
reaction temperatures due to premature crystallisation caused by undercooling. It was
theorised that this could be overcome by a simultaneous increase in catalyst and chain
initiator concentration. Further reactions would have to carried out to determine if this
is the case;
• There is substantial room for improvement to the method developed to synthesise PA-
12. Currently, there is still considerable build-up of material in the baffle pillars and a
thin layer of sticky oligomer formed on the surface of the reactor. Reaction conditions
would have to be optimised to avoid these issues;
• It was theorised that the oscillation of the reaction mixture was forcing the mixture into
the Teflon tubing used to inject the CI mixture, leading to blockages in the tubing during
PA-12 synthesis. To circumvent this the Teflon tubing was not submerged within the
reaction mixture. However, now it cannot be guaranteed that the injection rate of the CI
into the reaction mixture is consistent. Therefore, it is important to develop a method
that would allow Teflon tubing to be submerged in the mixture. One possibility would
be to the lower the concentration of CI in the CI mixture and increase the volume of
ethylbenzene. This would allow the injection rates of the CI to be increased without
causing the reaction to fail and the greater pressure in the Teflon tubing would stop the
backflow of the reaction mixture into the tubing.

130
• Despite synthesis of PA-6 being carried in both a STR and OBR there was no direct
comparisons made. Changing from STR and OBR should have no effect over the
melting point and molecular weight, but particle size would be influenced strongly by
the change in reactor. Studies would have carried to determine if an OBR can control
particle size more effectively than an OBR. Additionally, it would have to be
determined if the OBR was a more efficient reactor overall through the study of the
power density of both reactors. Normally OBR’s are much more efficient than STR’s
but under conditions required to synthesise desired particle sizes this may not be the
case.
• The investigation as to how experimental parameters effect PA-12 properties was
limited, particularly, the influence of EBS over molecular weight could not be
determined. Factorial designs could provide further/in-depth analyses of how various
parameters affect PA-12 properties. Using factorial designs multiple factors can be
investigated thoroughly, quickly and with an efficient use of resources. The result from
this design could also be easily compared to those gained through the study of PA-6
formation. Such designs and comparisons may lead to greater insight as to why PA-12
synthesis is so difficult to control;

131
References
1. Seymour, R. B.; Kirshenbaum, G. S.; Meeting, A. C. S., High performance polymers, their origin and development: proceedings of the Symposium on the History of High Performance Polymers at the American Chemical Society Meeting held in New York, April 15-18, 1986. Elsevier: 1986. 2. Paul, S. Manufacture of artificial silk. US2142007A, 1938/12/27/, 1938. 3. Chrzczonowicz, S., Zesz. Nauk. Polit. Lbdzkiej,: Chemia, 1955; Vol. 3, p 94. 4. Blackmore, C. E., Nylon Powders and their Application as Surface Coatings Using Flame Spraying. Surface Engineering 1987, 3 (1), 29-34. 5. Kiefer, S. L.; Hart, S.; Creech, R. G. Method of electrostatic powder spray coating. US4774102A, 1988/09/27/, 1988. 6. Dan, F.; Vasiliu-Oprea, C., Anionic polymerization of caprolactam in organic media. Morphological aspects. Colloid and Polymer Science 1998, 276 (6), 483-495. 7. Dan, F.; Grolier, J.-P. E., Spectrocalorimetric screening for complex process optimization. In Chemical Thermodynamics for Industry, The Royal Society of Chemistry: 2004; pp 88-103. 8. Ni, X.; Gao, S., Mass transfer characteristics of a pilot pulsed baffled reactor. Journal of Chemical Technology & Biotechnology 1996, 65 (1), 65-71. 9. Mackley, M. R.; Stonestreet, P., Heat transfer and associated energy dissipation for oscillatory flow in baffled tubes. Chemical Engineering Science 1995, 50 (14), 2211-2224. 10. Ni, X.; Gao, S., Scale-up correlation for mass transfer coefficients in pulsed baffled reactors. The Chemical Engineering Journal and the Biochemical Engineering Journal 1996, 63 (3), 157-166. 11. An, W. K.; Han, M. Y.; Wang, C. A.; Yu, S. M.; Zhang, Y.; Bai, S.; Wang, W., Insights into the Asymmetric Heterogeneous Catalysis in Porous Organic Polymers: Constructing A TADDOL-Embedded Chiral Catalyst for Studying the Structure-Activity Relationship. Chemistry-a European Journal 2014, 20 (35), 11019-11028. 12. Jiang, D. L.; Xu, F., Porous organic materials for electric energy storage and power supply. Abstracts of Papers of the American Chemical Society 2014, 248, 2. 13. Zhang, Y. W.; A, S. G.; Zou, Y. C.; Luo, X. L.; Li, Z. P.; Xia, H.; Liu, X. M.; Mu, Y., Gas uptake, molecular sensing and organocatalytic performances of a multifunctional carbazole-based conjugated microporous polymer. Journal of Materials Chemistry A 2014, 2 (33), 13422-13430. 14. Zhang, C.; Yang, X.; Zhao, Y.; Wang, X. Y.; Yu, M.; Jiang, J. X., Bifunctionalized conjugated microporous polymers for carbon dioxide capture. Polymer 2015, 61, 36-41. 15. Cowie, J. M. G.; Arrighi, V., Polymers : chemistry and physics of modern materials. 3rd ed.; CRC Press: Florida, 2007; p 499 p. 16. Misra, G. S., Introductory Polymer Chemistry. J. Wiley & Sons: 1993. 17. Nicholson, J. W.; Chemistry, R. S. o., The Chemistry of Polymers. Royal Society of Chemistry: 2006. 18. Seymour, R., Applications of Polymers. Springer US: 2012. 19. Sharma, B. K., Industrial Chemistry. GOEL Publishing House: 1991. 20. VivaldoLima, E.; Wood, P. E.; Hamielec, A. E.; Penlidis, A., An updated review on suspension polymerization. Industrial & Engineering Chemistry Research 1997, 36 (4), 939-965. 21. Jensen, A. T.; Neto, W. S.; Ferreira, G. R.; Glenn, A. F.; Gambetta, R.; Gonçalves, S. B.; Valadares, L. F.; Machado, F., 8 - Synthesis of polymer/inorganic hybrids through heterophase polymerizations. In Recent Developments in Polymer Macro, Micro and Nano Blends, Visakh, P. M.; Markovic, G.; Pasquini, D., Eds. Woodhead Publishing: 2017; pp 207-235. 22. Odian, G., Principles of Polymerization. Wiley: 2004. 23. Anderson, C. D.; Daniels, E. S., Emulsion Polymerisation and Latex Applications. Rapra Technology Limited: 2003.

132
24. Thickett, S. C.; Gilbert, R. G., Emulsion polymerization: State of the art in kinetics and mechanisms. Polymer 2007, 48 (24), 6965-6991. 25. Chern, C. S., Emulsion polymerization mechanisms and kinetics. Progress in Polymer Science 2006, 31 (5), 443-486. 26. El-hoshoudy, A. N. M. B., Emulsion Polymerization Mechanism. In Recent Research in Polymerization, InTech: 2018. 27. Kohan, M. I.; Kohan, M. I., Nylon Plastics Handbook. Hanser Publishers: 1995. 28. Seymour, R. B., Polymers for engineering applications. ASM International: 1987. 29. Seymour, R. B.; Porter, R. S., Manmade Fibres: Their origin and development. Springer Netherlands: 1993. 30. Doubravszky Von, S.; Geleji, F., Über probleme der kationischen polymerisation des caprolactams. II. Die polymerisation mit caprolactam-hydrochlorid. Die Makromolekulare Chemie 1967, 110 (1), 246-256. 31. Mizerovskii, L. N.; Silant'eva, V. G., Cationic polymerization of caprolactam in the presence of HPO3. Polymer Science U.S.S.R. 1978, 20 (9), 2280-2289. 32. Van der Want, G. M.; Kruissink Ch, A., A non-hydrolytic polymerization of ϵ-caprolactam. The polymerization initiated by hydrogen chloride. Journal of Polymer Science 1959, 35 (128), 119-138. 33. Majury, T. G., Amines and carboxylic acids as initiators of polymerization in caprolactam. Journal of Polymer Science 1958, 31 (123), 383-397. 34. Frost, J. W., Synthesis of caprolactam from lysine. 2005. 35. Giori, C.; Hayes, B. T., Hydrolytic polymerization of caprolactam. I. Hydrolysis—polycondensation kinetics. Journal of Polymer Science Part A-1: Polymer Chemistry 1970, 8 (2), 335-349. 36. Šebenda, J., Chapter 6 Lactams. In Comprehensive Chemical Kinetics, Bamford, C. H.; Tipper, C. F. H., Eds. Elsevier: 1976; Vol. 15, pp 379-471. 37. Puffr, R.; Kubanek, V., Lactam-based Polyamides Volume II Modification, Technology, and application. CRC Press: 1991; p 368. 38. Brydson, J. A., 18 - Polyamides and Polyimides. In Plastics Materials (Seventh Edition), Brydson, J. A., Ed. Butterworth-Heinemann: Oxford, 1999; pp 478-530. 39. Puffr, R.; Kubanek, V., Lactam-based Polyamides: Polymerization Structure. CRC Press: 1991; Vol. 1. 40. Kang, K.-S.; Hong, Y.-K.; Kim, Y. J.; Kim, J. H., Synthesis and properties of Nylon 4/5 copolymers for hydrophilic fibers. Fibers and Polymers 2014, 15 (7), 1343-1348. 41. Rusu, G.; Rusu, E., Caprolactam-Laurolactam (Nylon 6/12) Copolymers: Synthesis and Characterization. High Performance Polymers 2004, 16 (4), 569-584. 42. Kim, N. C.; Kim, J.-H.; Kim, J. H.; Nam, S. W.; Jeon, B. S.; Kim, Y. J., Preparation of Nylon 4 microspheres via heterogeneous polymerization of 2-pyrrolidone in a paraffin oil continuous phase. Journal of Industrial and Engineering Chemistry 2015, 28, 236-240. 43. Zhang, J.; Kissounko, D. A.; Lee, S. E.; Gellman, S. H.; Stahl, S. S., Access to Poly-β-Peptides with Functionalized Side Chains and End Groups via Controlled Ring-Opening Polymerization of β-Lactams. Journal of the American Chemical Society 2009, 131 (4), 1589-1597. 44. Rahman, M. A.; Renna, L.; Venkataraman, D.; Desbois, P.; J. Lesser, A., High crystalline, porous polyamide 6 by anionic polymerization. 2018; Vol. 138. 45. Telen, L.; Van Puyvelde, P.; Goderis, B., Random Copolymers from Polyamide 11 and Polyamide 12 by Reactive Extrusion: Synthesis, Eutectic Phase Behavior, and Polymorphism. Macromolecules 2016, 49 (3), 876-890. 46. Stavila, E.; Loos, K., Synthesis of lactams using enzyme-catalyzed aminolysis. Tetrahedron Letters 2013, 54 (5), 370-372. 47. Hilaire, J. C.; Guerin, R., Anhydrous process for the manufacture of polyamide powder from lactam in the presence of N,N'-alkylene bis amide. Google Patents: 1987.

133
48. Nuyken, O.; Pask, S. D., Ring-Opening Polymerization-An Introductory Review. Polymers 2013, 5 (2), 361-403. 49. Loyen, K.; Senff, H.; Pauly, F. X., Process for the manufacture of polyamide-12 powder with a high melting point. Google Patents: 2012. 50. Marchildon, K., Polyamides – Still Strong After Seventy Years. Macromolecular Reaction Engineering 2010, 5 (1), 22-54. 51. Yamazaki, N.; Matsumoto, M.; Higashi, F., Studies on reactions of the N-phosphonium salts of pyridines. XIV. Wholly aromatic polyamides by the direct polycondensation reaction by using phosphites in the presence of metal salts. Journal of Polymer Science: Polymer Chemistry Edition 1975, 13 (6), 1373-1380. 52. Yamazaki, N.; Niwano, M.; Kawabata, J.; Higashi, F., Preparation of peptides and active esters by a hydrolysis-dehydration reaction with phosphonites, and the application of the reaction to polymer synthesis. Tetrahedron 1975, 31 (7), 665-670. 53. Preston, J.; Hofferbert, W. L., Preparation of poly amides via the phosphorylation reaction. I. Wholly aromatic polyamides and polyamide-hydrazides. Journal of Polymer Science: Polymer Symposia 1978, 65 (1), 13-27. 54. Higashi, F.; Goto, M.; Nakano, Y.; Kakinoki, H., Wholly aromatic polyamides by the direct polycondensation reaction using triphenyl phosphite in the presence of poly(4-vinylpyridine). Journal of Polymer Science: Polymer Chemistry Edition 1980, 18 (3), 851-856. 55. Higashi, F.; Nakano, Y.; Goto, M.; Kakinoki, H., High-molecular-weight polyterephthalamide by direct polycondensation reaction in the presence of poly(ethylene oxide). Journal of Polymer Science: Polymer Chemistry Edition 1980, 18 (3), 1099-1104. 56. Higashi, F.; Taguchi, Y., Aromatic polyamides by phosphorylation reaction with triphenylphosphite and LiCl in the presence of polymer matrix. Journal of Polymer Science: Polymer Chemistry Edition 1980, 18 (9), 2875-2877. 57. Yokoyama, A.; Yokozawa, T., Converting Step-Growth to Chain-Growth Condensation Polymerization. Macromolecules 2007, 40 (12), 4093-4101. 58. Kawanobe, W.; Yamaguchi, K.; Rokicki, G.; Mei Sha, K.; Yamazaki, N.; Nakahama, S., Direct synthesis of polyamides by N-acyl phosphoramidites. Journal of Polymer Science: Polymer Chemistry Edition 1984, 22 (10), 2371-2380. 59. Burch, R. R.; Manring, L. E., N-Alkylation and Hofmann elimination from thermal decomposition of R4N+ salts of aromatic polyamide polyanions: synthesis and stereochemistry of N-alkylated aromatic polyamides. Macromolecules 1991, 24 (8), 1731-1735. 60. Vasiliu-Oprea, C.; Dan, F., On the relation between synthesis parameters and morphology of anionic polycaproamide obtained in organic media. I. Influence of the Na [O (CH 2) 2 OCH 3] 2 AlH 2/ isophorone diisocyanate catalytic system. Journal of applied polymer science 1996, 62 (10), 1517-1527. 61. Park, Y.; Curtis, C. W.; Roberts, C. B., Formation of Nylon Particles and Fibers Using Precipitation with a Compressed Antisolvent. Industrial & Engineering Chemistry Research 2002, 41 (6), 1504-1510. 62. Pei, A.; Liu, A.; Xie, T.; Yang, G., A new strategy for the preparation of polyamide-6 microspheres with designed morphology. Macromolecules 2006, 39 (23), 7801-7804. 63. Pei, A.; Liu, A.; Xie, T.; Yang, G., Effect of in situ synthesized macroactivator on morphology of PA6/PS blends via successive polymerization. Journal of Applied Polymer Science 2007, 105 (4), 1757-1765. 64. Wu, B.; Xie, T.; Yang, G., Investigation on particular phase morphology of immiscible polyamide 12 and polystyrene blends prepared via anionic ring-opening polymerization. Polymer Engineering & Science 2012, 52 (9), 1831-1838. 65. Ricco, L.; Monticelli, O.; Russo, S.; Paglianti, A.; Mariani, A., Fast-activated anionic polymerization of epsilon-caprolactam in suspension, 1 - Role of the continuous phase on
134
characteristics and properties of powdered PA6. Macromolecular Chemistry and Physics 2002, 203 (10-11), 1436-1444. 66. Crespy, D.; Landfester, K., Anionic polymerization of epsilon-caprolactam in miniemulsion: Synthesis and characterization of polyamide-6 nanoparticles. Macromolecules 2005, 38 (16), 6882-6887. 67. Davé, R. S.; Kruse, R. L.; Stebbins, L. R.; Udipi, K., Polyamides from lactams via anionic ring-opening polymerization: 2. Kinetics. Polymer 1997, 38 (4), 939-947. 68. Greenley, R. Z.; Stauffer, J. C.; Kurz, J. E., The Kinetic Equation for the Initiated, Anionic Polymerization of η-Caprolactam. Macromolecules 1969, 2 (6), 561-567. 69. Šittler, E.; Šebenda, J., Alkaline polymerization of 6-caprolactam. XXXII. The kinetics of polymerization activated by N,N,N',N'-tetraacetylhexamethylenediamine. Collection of Czechoslovak Chemical Communications 1968, 33 (1), 270-277. 70. Rigo, A.; Fabbri, G.; Talamini, G., Kinetic study of anionic polymerization of 6-caprolactam by differential calorimetry. Journal of Polymer Science: Polymer Letters Edition 1975, 13 (8), 469-477. 71. Malkin, A. Y.; Frolov, V. G.; Ivanova, A. N.; Andrianova, Z. S., The nonisothermal anionic polymerization of caprolactam. Polymer Science U.S.S.R. 1979, 21 (3), 691-700. 72. Malkin, A. Y.; Ivanova, S.; Frolov, V.; Ivanova, A.; Andrianova, Z., Kinetics of anionic polymerization of lactams.(Solution of non-isothermal kinetic problems by the inverse method). Polymer 1982, 23 (12), 1791-1800. 73. Bolgov, S. A.; Begishev, V. P.; Malkin, A. Y.; Frolov, V. G., Role of the functionality of activators during isothermal crystallization accompanying the activated anionic polymerization of ϵ-caprolactam. Polymer Science U.S.S.R. 1981, 23 (6), 1485-1492. 74. Udipi, K.; Davé, R. S.; Kruse, R. L.; Stebbins, L. R., Polyamides from lactams via anionic ring-opening polymerization: 1. Chemistry and some recent findings. Polymer 1997, 38 (4), 927-938. 75. Zhang, J.; Gellman, S. H.; Stahl, S. S., Kinetics of Anionic Ring-Opening Polymerization of Variously Substituted β-Lactams: Homopolymerization and Copolymerization. Macromolecules 2010, 43 (13), 5618-5626. 76. Stratula-Vahnoveanu, B.; Vasiliu-Oprea, C., Anionic Polymerization of Lactams in Microdispersion. I. Kinetic Aspects of the Process of Caprolactam Polymerization. Polymer-Plastics Technology and Engineering 2002, 41 (5), 981-995. 77. Photoelectric methods of measuring the velocity of rapid reactions I-General principles and controls. Proceedings of the Royal Society of London. Series A - Mathematical and Physical Sciences 1936, 155 (885), 258. 78. Dan, F.; Vasiliu‐Oprea, C., On the relationship between synthesis parameters and morphology of the anionic polycaproamide obtained in organic media. III. Macroporous powders obtained using CO2 and carbodiimides as activating compounds. Journal of Applied Polymer Science 1998, 67 (2), 231-243. 79. Ueda, K.; Nakai, M.; Hosoda, M.; Tai, K., Synthesis of High Molecular Weight Nylon 6 by Anionic Polymerization of ε-Caprolactam. Mechanism and Kinetics. Polymer Journal 1997, 29, 568. 80. Chrzczonowicz, S.; Wlodarczyk, M.; Ostaszewski, B., Polymerization of ϵ-caprolactam and ζ-enantholactam in non-polar solvents. Die Makromolekulare Chemie 1960, 38 (1), 159-167. 81. Chrzczonowicz, S.; Wsłodarczyk, M., Polymerization of ϵ-caprolactam in solvent. II. The infrared study of the mechanism of polymerization. Die Makromolekulare Chemie 1961, 48 (1), 135-143. 82. Chrzczonowicz, S., Zesz nauk Politech Lodz: Chemia, 1957; Vol. 5, p 65. 83. Biernacki, P.; Wlodarczyk, M., A study of molecular weight of polycaproamide obtained by anionic polymerization of caprolactam in solvent. European Polymer Journal 1975, 11 (1), 107-109. 84. Biernacki, P.; Chrzczonowicz, S.; Wlodarczyk, M., Molecular weight distribution of polycaproamide obtained by anionic polymerization of caprolactam in solvent. European Polymer Journal 1971, 7 (6), 739-747.

135
85. US Patent Application for NOVEL POWDER POLYMER, METHOD FOR THE PREPARATION THEREOF, AND USE AS A THICKENER Patent Application (Application #20160167040 issued June 16, 2016) - Justia Patents Search. 86. Vasiliu‐Oprea, C.; Dan, F., On the relation between synthesis parameters and morphology of anionic polycaproamide obtained in organic media. I. Influence of the Na [O (CH2) 2OCH3] 2AlH2/isophorone diisocyanate catalytic system. Journal of applied polymer science 1996, 62 (10), 1517-1527. 87. Stehlíček, J.; Šebenda, J., Anionic polymerization of ϵ-caprolactam-lix effect of the ratio of reacting components, of the medium and of the ring size on the initial stage of the anionic polymerization of lactams. European Polymer Journal 1986, 22 (10), 769-773. 88. Dijck, W. J. D., Process and apparatus for intimately contacting fluids. Google Patents: 1935. 89. Sergeev, S., Fluid oscillations in pipes at moderate Reynolds numbers. Fluid Dynamics 1966, 1 (1), 121-122. 90. Karr Andrew, E., Performance of a reciprocating‐plate extraction column. AIChE Journal 1959, 5 (4), 446-452. 91. Bellhouse, B. J.; Bellhouse, F. H.; Curl, C. M.; MacMillan, T. I.; Gunning, A. J.; Spratt, E. H.; MacMurray, S. B.; Nelems, J. M., A HIGH EFFICIENCY MEMBRANE OXYGENATOR AND PULSATILE PUMPING SYSTEM, AND ITS APPLICATION TO ANIMAL TRIALS. ASAIO Journal 1973, 19 (1), 72-79. 92. Sobey, I. J., On flow through furrowed channels. Part 1. Calculated flow patterns. Journal of Fluid Mechanics 1980, 96 (1), 1-26. 93. Stephanoff, K. D.; Sobey, I. J.; Bellhouse, B. J., On flow through furrowed channels. Part 2. Observed flow patterns. Journal of Fluid Mechanics 1980, 96 (1), 27-32. 94. Mackley, M., Usingocillatory flow to improve performance. Chemical engineer 1987, (433), 18-21. 95. Ni, X.; Zhang, Y.; Mustafa, I., An investigation of droplet size and size distribution in methylmethacrylate suspensions in a batch oscillatory-baffled reactor. Chemical Engineering Science 1998, 53 (16), 2903-2919. 96. Knott, G.; Mackley, M., On eddy motions near plates and ducts, induced by water waves and periodic flows. Phil. Trans. R. Soc. Lond. A 1980, 294 (1412), 599-623. 97. Brunold, C. R.; Hunns, J. C. B.; Mackley, M. R.; Thompson, J. W., Experimental observations on flow patterns and energy losses for oscillatory flow in ducts containing sharp edges. Chemical Engineering Science 1989, 44 (5), 1227-1244. 98. Dickens, A.; Mackley, M.; Williams, H., Experimental residence time distribution measurements for unsteady flow in baffled tubes. Chemical Engineering Science 1989, 44 (7), 1471-1479. 99. Mackley, M. R.; Ni, X., Mixing and dispersion in a baffled tube for steady laminar and pulsatile flow. Chemical Engineering Science 1991, 46 (12), 3139-3151. 100. Fitch, A. W.; Jian, H.; Ni, X., An investigation of the effect of viscosity on mixing in an oscillatory baffled column using digital particle image velocimetry and computational fluid dynamics simulation. Chemical Engineering Journal 2005, 112 (1), 197-210. 101. Ni, X.; Gough, P., On the discussion of the dimensionless groups governing oscillatory flow in a baffled tube. Chemical Engineering Science 1997, 52 (18), 3209-3212. 102. Sarpkaya, T., Experimental Determination of the Critical Reynolds Number for Pulsating Poiseuille Flow. Journal of Basic Engineering 1966, 88 (3), 589-598. 103. Sobey, I. J., Observation of waves during oscillatory channel flow. Journal of Fluid Mechanics 1985, 151, 395-426. 104. Jones, J. E. H.; Bajura, R. A., A Numerical Analysis of Pulsating Laminar Flow Through a Pipe Orifice. Journal of Fluids Engineering 1991, 113 (2), 199-205. 105. Ni, X.; Zhang, Y.; Mustafa, I., Correlation of polymer particle size with droplet size in suspension polymerisation of methylmethacrylate in a batch oscillatory-baffled reactor. Chemical Engineering Science 1999, 54 (6), 841-850.

136
106. Hopff Von, H.; Lüssi, H.; Gerspacher, P., Zur kenntnis der perlpolymerisation. 2. Mitt. praktische anwendung der dimensionsanalyse auf das system MMA – mowiol 70/88. Die Makromolekulare Chemie 1964, 78 (1), 37-46. 107. Erbay, E.; Blgç, T.; Karali, M.; Savaşçi, Ö. T., Polystyrene Suspension Polymerization: The Effect of Polymerization Parameters on Particle Size and Distribution. Polymer-Plastics Technology and Engineering 1992, 31 (7-8), 589-605. 108. Langner, F.; Moritz, H.; Reichert, K., On particle size of suspension polymers, II. Polymerising two-phase systems. . Ger. Chem., Engng, 1979, 2, 329-336. 109. Schroder, R.; Piotrowski, P., On particle formation during suspension polymerisation of styrene. Ger. Chem. Engng 1982, 5, 139-146. 110. Oldshue James, Y., Mixing—principles and applications, by Shinji Nagata, Published by Halsted Press, 458 pages, $32.50. AIChE Journal 1976, 22 (2), 412-413. 111. Chew, C. M.; Ristic, R. I., Crystallization by oscillatory and conventional mixing at constant power density. AIChE Journal 2005, 51 (5), 1576-1579. 112. Jealous, A. C.; Johnson, H. F., Power Requirements for Pulse Generation in Pulse Columns. Industrial & Engineering Chemistry 1955, 47 (6), 1159-1166. 113. Mackley, M. R., Process innovation using oscillatory flow within baffled tubes. Trans. IChemE 1991, 69(A), 197-199. 114. Baird, M. H. I.; Stonestreet, P., Energy dissipation in oscillatory flow within a baffled tube. Trans. IChemE 1995, 73 (5), 503-511. 115. Ni, X.; Liao, A., Effects of Cooling Rate and Solution Concentration on Solution Crystallization of l-Glutamic Acid in an Oscillatory Baffled Crystallizer. Crystal Growth & Design 2008, 8 (8), 2875-2881. 116. Ni, X.; Cosgrove, J. A.; Arnott, A. D.; Greated, C. A.; Cumming, R. H., On the measurement of strain rate in an oscillatory baffled column using particle image velocimetry. Chemical Engineering Science 2000, 55 (16), 3195-3208. 117. Abbott, M. S. R.; Harvey, A. P.; Perez, G. V.; Theodorou, M. K., Biological processing in oscillatory baffled reactors: operation, advantages and potential. Interface Focus 2013, 3 (1). 118. Baird, M. H. I.; Rao, N. V. R., Power dissipation and flow patterns in reciprocating baffle-plate columns. The Canadian Journal of Chemical Engineering 1995, 73 (4), 417-425. 119. Ni, X.; Nelson, G.; Mustafa, I., Flow patterns and oil—water dispersion in a 0.38 m diameter oscillatory baffled column. The Canadian Journal of Chemical Engineering 2009, 78 (1), 211-220. 120. Ni, X.; Mackley, M. R., Chemical reaction in batch pulsatile flow and stirred tank reactors. The Chemical Engineering Journal 1993, 52 (3), 107-114. 121. Mazlan, H. W. Y. a. S. S. B. a. N. A., Evaluation of power density on the bioethanol production using mesoscale oscillatory baffled reactor and stirred tank reactor. IOP Conference Series: Materials Science and Engineering 2018, 334 (1), 012070. 122. Montgomery, D., Design Analysis of Experiments 5ed. 123. Li Pi Shan, C.; Soares João, B. P.; Penlidis, A., Ethylene/1-octene copolymerization studies with in situ supported metallocene catalysts: Effect of polymerization parameters on the catalyst activity and polymer microstructure. Journal of Polymer Science Part A: Polymer Chemistry 2002, 40 (24), 4426-4451. 124. Chen, C.-H., Application of factorial experimental design to study the influence of polymerization conditions on the yield of polyaniline powder. Journal of Applied Polymer Science 2002, 85 (7), 1571-1580. 125. De Wet-Roos, D.; Knoetze, J. H.; Cooray, B.; Sanderson, R. D., Emulsion polymerization of an epoxy–acrylate emulsion stabilized with polyacrylate. II. Using the results of statistically designed experiments to deduce a possible polymerization mechanism. Journal of Applied Polymer Science 2000, 76 (3), 368-381. 126. Vivaldo-Lima, E.; Wood Philip, E.; Hamielec Archie, E.; Penlidis, A., Kinetic model-based experimental design of the polymerization conditions in suspension copolymerization of

137
styrene/divinylbenzene. Journal of Polymer Science Part A: Polymer Chemistry 2000, 36 (12), 2081-2094. 127. Jain, S. P.; Singh, P. P.; Javeer, S.; Amin, P. D., Use of Placket–Burman Statistical Design to Study Effect of Formulation Variables on the Release of Drug from Hot Melt Sustained Release Extrudates. AAPS PharmSciTech 2010, 11 (2), 936-944. 128. Haaland, P. D., Experimental design in biotechnology. CRC press: 1989; Vol. 105. 129. Stanbury, P. F.; Whitaker, A.; Hall, S. J., Principles of fermentation technology. Elsevier: 2013. 130. Wasserstein, R. L.; Lazar, N. A., The ASA's Statement on p-Values: Context, Process, and Purpose. The American Statistician 2016, 70 (2), 129-133. 131. Schreiber, H. P.; Waldman, M. H., Effect of temperature on molecular weight measurements in polyethylene. Journal of Polymer Science Part A: General Papers 1964, 2 (4), 1655-1668. 132. Giz, A.; Çatalgil-Giz, H.; Alb, A.; Brousseau, J.-L.; Reed, W. F., Kinetics and Mechanisms of Acrylamide Polymerization from Absolute, Online Monitoring of Polymerization Reaction. Macromolecules 2001, 34 (5), 1180-1191. 133. Haraguchi, K.; Xu, Y.; Li, G., Poly(N-isopropylacrylamide) Prepared by Free-Radical Polymerization in Aqueous Solutions and in Nanocomposite Hydrogels. Macromolecular Symposia 2011, 306-307 (1), 33-48. 134. Nigmatullin, R.; Bencsik, M.; Gao, F., Influence of polymerisation conditions on the properties of polymer/clay nanocomposite hydrogels. Soft Matter 2014, 10 (12), 2035-2046. 135. Hilaire, J.-C.; Guerin, R. Anhydrous process for the manufacture of polyamide powder from lactam in the presence of N,N'-alkylene bis amide. US4694063A, 1987/09/15/, 1987. 136. Chakraborty, J. N., 23 - Dyeing of nylon. In Fundamentals and Practices in Colouration of Textiles, Chakraborty, J. N., Ed. Woodhead Publishing India: 2014; pp 286-300. 137. Rahman, M. A.; Renna, L. A.; Venkataraman, D.; Desbois, P.; Lesser, A. J., High crystalline, porous polyamide 6 by anionic polymerization. Polymer 2018, 138, 8-16. 138. Lok, K. P.; Ober, C. K., Particle size control in dispersion polymerization of polystyrene. Canadian Journal of Chemistry 1985, 63 (1), 209-216. 139. Walbridge, D. J., Polymerization in Non-aqueous Dispersions. In Comprehensive Polymer Science and Supplements, Elsevier: 1989; pp 243-260. 140. Baudonnet, L.; Grossiord, J. L.; Rodriguez, F., Effect of Dispersion Stirring Speed on the Particle Size Distribution and Rheological Properties of Three Carbomers. Journal of Dispersion Science and Technology 2004, 25 (2), 183-192. 141. Gupta, B. S.; Afshari, M., 14 - Tensile failure of polyacrylonitrile fibers. In Handbook of Tensile Properties of Textile and Technical Fibres, Bunsell, A. R., Ed. Woodhead Publishing: 2009; pp 486-528. 142. Vasiliu-Oprea, C.; Dan, F., On the Relation Between Synthesis Parameters and Morphology of Anionic Polycaproamide Obtained in Organic Media. II. Influence of the Na [O (CH~ 2)~ 2OCH~ 3]~ 2AIH~ 2/Aliphatic Diisocyanates Catalytic Systems. Journal of applied polymer science 1997, 64 (13), 2575-2583. 143. Vacca, A.; Sabatini, A.; Bologni, L., A procedure for the calculation of enthalpy changes from continuoustitration calorimetric experiments. Journal of the Chemical Society, Dalton Transactions 1981, (6), 1246-1250. 144. Schuttlefield, J. D.; Grassian, V. H., ATR–FTIR Spectroscopy in the Undergraduate Chemistry Laboratory. Part I: Fundamentals and Examples. Journal of Chemical Education 2008, 85 (2), 279. 145. Hanford, W. E.; Joyce, R. M., Polymeric amides from epsilon-caprolactam. Journal of Polymer Science 1948, 3 (2), 167-172. 146. Cornish-Bowden, A., Chapter 2 - Introduction to enzyme kinetics. In Fundamentals of Enzyme Kinetics, Cornish-Bowden, A., Ed. Butterworth-Heinemann: 1979; pp 16-38. 147. Rushton, J. H., Power characteristics of mixing impellers Part 1. Chem. Eng. Prog. 1950, 46, 395-404. 148. Pepper, D. C., Cationic ring-opening polymerization, Part 2: Synthetic applications (Advances in Polymer Science, Volumes 68/69). By S. Penczek, P. Kubisa and K. Matyjaszewski, Springer- Verlag,

138
Berlin Heidelberg, 1985. pp. 300, price DM 188.00. ISBN 3-540-13781-5. British Polymer Journal 1986, 18 (6), 399-400. 149. Mark, J. E., Polymer Data Handbook. Oxford University Press: 2009. 150. Yan, C.; Shi, Y.; Yang, J.; Liu, J., Preparation and selective laser sintering of nylon-12 coated metal powders and post processing. Journal of Materials Processing Technology 2009, 209 (17), 5785-5792. 151. Griehl, W.; Ruestem, D., Nylon-12-Preparation, Properties, and Applications. Industrial & Engineering Chemistry 1970, 62 (3), 16-22. 152. Du, L.; Yang, G., Reactive extrusion for the synthesis of nylon 12 and maleated low-density polyethylene blends via the anionic ring-opening polymerization of lauryllactam. Journal of Applied Polymer Science 2009, 114 (5), 2662-2672. 153. F. Hughes, J., Electrostatic Powder Coating. 1984. 154. Macchio, R. A.; Russ, J. G.; Slobody, B.; Tietjen, M. Microfine cosmetic powder comprising polymers, silicone, and lecithin. US5023075A, 1991/06/11/, 1991. 155. Frunze, T. M.; Kotel'nikov, V. A.; Kurashev, V. V.; Ivanova, S. L.; Komarova, L. I.; Korshak, V. V., The relative reactivities of ε-caprolactam and ω-dodecalactam in activated anionic copolymerization. Polymer Science U.S.S.R. 1976, 18 (2), 348-353. 156. Vasiliu-Opera, C.; Dan, F.; Stratula-Vahnoveanu, B., Ultrafine Polycaproamide particles synthesis and characterisation. Buletinul Institutului Politehnic din Iaşi 2000, XLVI, 81-92. 157. Nogueira, A. L.; Quadri, M. B.; Araújo, P. H. H.; Machado, R. A. F., Influence of Semi-Batch Operations on Morphological Properties of Polystyrene Made in Suspension Polymerization. Procedia Engineering 2012, 42, 1045-1052. 158. Xing, Q.; Zhang, X.; Dong, X.; Liu, G.; Wang, D., Low-molecular weight aliphatic amides as nucleating agents for poly (L-lactic acid): Conformation variation induced crystallization enhancement. Polymer 2012, 53 (11), 2306-2314. 159. Gogolewski, S.; Czerntawska, K.; Gastorek, M., Effect of annealing on thermal properties and crystalline structure of polyamides. Nylon 12 (polylaurolactam). Colloid and Polymer Science 1980, 258 (10), 1130-1136.