An Investigation into the Effects of Gating in Artificial Host ...
283
An Investigation into the Effects of Gating in Artificial Host Systems DISSERTATION Presented in Partial Fulfillment of the Requirements for the Degree Doctor of Philosophy in the Graduate School of The Ohio State University By Stephen Edward Rieth Graduate Program in Chemistry The Ohio State University 2011 Dissertation Committee: Professor Jovica D. Badjic, Advisor Professor Craig J. Forsyth Professor Anita E. Mattson
-
Upload
khangminh22 -
Category
Documents
-
view
2 -
download
0
Transcript of An Investigation into the Effects of Gating in Artificial Host ...

An Investigation into the Effects of Gating in Artificial Host Systems
DISSERTATION
Presented in Partial Fulfillment of the Requirements for the Degree Doctor of Philosophy
in the Graduate School of The Ohio State University
By
Stephen Edward Rieth
Graduate Program in Chemistry
The Ohio State University
2011
Dissertation Committee:
Professor Jovica D. Badjic, Advisor
Professor Craig J. Forsyth
Professor Anita E. Mattson

Copyright by
Stephen Edward Rieth
2011

ii
Abstract
The translocation of molecules in natural systems is often regulated by modulation of
dynamic moieties in a process referred to as gating. In the enzyme acetylcholinesterase,
the tunnel leading to the active site is regulated by five freely-rotating aromatic residues
which serve as gates. This passageway is effectively closed off by the gates roughly 98%
of any given time, resulting in the rate of acetylcholine uptake to decrease by a factor of
two in comparison to a model system possesing no gates. Strikingly, it was found that a
guest whose volume is only 0.4 Å3 larger than acetylcholine will enter at a rate three
orders of magnitudes less, thus acetylcholinesterase, though the process of gating,
achieves a high degree of kinetic selectivity with only a small sacrifice of catalytic
efficiency.
With the goal of incorporating gating into artificial host molecules, the Badjic group
has designed and synthesized a series of molecules, termed molecular baskets, that
consist of a bowl-shaped cavity with dynamic appendages (gates) tethered to the rim. In
previous work within the Badjic group, phenol-based gates were shown to effectively
close the basket, but the dynamics of the gates prevented an effective preorganized cavity
to form and any resulting host-guest complex did not exist within a reasonable time-
frame to allow study.

iii
In an effort to more effectively close the basket and reduce gate dynamics, molecular
baskets containing pyridyl gates were synthesized and their properties were analyzed
after folding with Cu(I) (See Chapter 2). The resulting basket, however, only
encapsulated linear coordinating guest molecules, which prevented the study of its gating
properties.
Subsequently, a basket containing pyridylamido gates was synthetized and found to
form a wider variety of host guest complexes. This basket was also found to incorporate
gating successfully: the entrance and departure of guest molecules are primarily
dependent on the rate by which the gates fold/unfold. By modifying the structure of the
gates, it was found that the rates of guest ingress and egress can be controlled and
tailored.
Through the use of linear free energy relationships (LFERs) between the activation
energies for guest entrance and departure and the thermodynamic stability of the resulting
host-guest complex, it was found (See Chapter 3) that the baskets displayed kinetic
selectivity toward the size/shape of guest molecules: small molecules enter and leave at
rates faster than larger molecules. To probe the relationship between the gate dynamics
and kinetic selectivity, the experiment was repeated with molecular baskets possesing
faster and slower gates. Interestingly, a correlation was found whereby faster gate
dynamics resulted in increased kinetic selectivity.
In addition to gating, other interesting properties were found for the pyridylamido
molecular baskets. Surprisingly, cyclohexane was found to interconvert between its two
chair forms at a faster rate within the cavity than outside in the bulk solvent due to

iv
favorable interactions between the host and half-chair transition state. The baskets were
also found to effectively reversibly interconvert between the metal-chelation and
intramolecular hydrogen bond modes of folding with an added stimulus (See Chapter 4).
By studying gating in artificial host systems, unique features such as rate control and
increased kinetic selectivity can potentially be incorporated into the next generation of
supramolecular catalysts.

v
Dedication
To my wife and family

vi
Acknowledgments
I would like to first thank my advisor, Dr. Jovica Badjic, for his support and
advice over the last six years. He has brought great enthusiasm to our research and I
appreciate the independence I was granted to explore my own curiosities and ideas. I
would also like to thank Dr. Christopher M. Hadad and Dr. Gideon Fraenkel and their
corresponding group members for their collaborative efforts through the years.
I’m also thankful for the camaraderie and support offered from my own group
members past and present. I’m especially thankful to Dr. Zhiqing Yan for initially
showing me the ropes around the lab and Dr. Bao-yu Wang for our insightful discussions
and experiments with molecular baskets. It was a lot of fun working with and
brainstorming new ideas and experiments for these interesting systems. I am also
grateful to Dr. Tanya Young of the Ohio State NMR facility for unraveling much of the
mystery of those intricate instruments. I am certain such knowledge and experience will
be of benefit for years to come.
Last, but certainly not least, I would like to thank my wife, Charlotte, and my
parents for giving me support and motivation throughout the years. I’m fairly certain that
if I didn’t have these, this document would not exist.

vii
Vita
January 14, 1983 ............................................Born – Fayetteville, AR
Summer 2002 .................................................Chemistry Co-op – Pitney Bowes Inc.
Summer 2003 .................................................Chemistry Co-op – Pitney Bowes Inc.
2005 ...............................................................B.S. Polymer Chemistry
Rochester Institute of Technology
Rochester, NY
2005 - 2008 ....................................................Graduate Research and Teaching Assistant
The Ohio State University
2008 - 2011 ....................................................Graduate Research and NMR Assistant
The Ohio State University
Publications
Research Publications
Rieth, S.; Yan, Z.; Xia, S.; Gardlik, M.; Chow, A.; Fraenkel, G.; Hadad, C. M.; Badjic,
J.D. “Molecular Encapsulation via Metal-to-Ligand Coordination in a Cu(I)-Folded
Molecular Basket.” Journal of Organic Chemistry, 2008, 73, 5100 – 5109.
Wang, B.; Rieth, S.; Badjic, J.D. “Tuning the Rate of Molecular Translocation.” Journal
of the American Chemical Society, 2009, 131, 7250 – 7252.
Rieth, S.; Wang, B.; Bao, X.; Badjic, J. D. “Four-State Switching Characteristics of a
Gated Molecular Basket” Organic Letters, 2009, 11, 2495 – 2498.

viii
Gardlik, M.; Yan, Z.; Xia, S.; Rieth, S.; Gallucci, J.; Hadad, C. M.; Badjic, J. D. “A Close
Inspection of Ag(I) Coordination to Molecular Baskets. A Study of Solvation and Guest
Encapsulation in Solution and the Solid State.” Tetrahedron, 2009, 65, 7213 – 7219.
Rieth, S.; Bao, X.; Wang, B.; Hadad, C. M.; Badjic, J. D. “Gated Molecular Recognition
and Dynamic Discrimination of Guests.” Journal of the American Chemical Society,
2010, 132, 773 – 776.
Bao, X.; Rieth, S.; Stojanovic, S.; Hadad, C. M.; Badjic, J. D. “Molecular Recognition of
a Transition State.” Angewandte Chemie, International Edition, 2010, 49, 4816 – 4819.
Rieth, S.; Badjic, J. D. “The Effect of the Dynamics of Revolving Gates on the Kinetics
of Molecular Encapsulation – The Activity/Selectivity Relationship” Chemistry: A
European Journal, 2011, 17, 2562 – 2565.
Review Article Publications
Rieth, S.; Baddeley, C.; Badjic, J. D. “Prospects in Controlling Morphology, Dynamics,
and Responsiveness of Supramolecular Polymers.” Soft Matter, 2007, 3, 137 – 154.
Rieth, S.; Hermann, K.; Wang, B.; Badjic, J. D. “Gated Molecular Encapsulation”
Chemical Society Reviews, 2011, 40, 1609 – 1622.
Fields of Study
Major Field: Chemistry
ix
Table of Contents
Abstract ............................................................................................................................... ii
Dedication ........................................................................................................................... v
Acknowledgments.............................................................................................................. vi
Publications ....................................................................................................................... vii
Fields of Study ................................................................................................................. viii
Table of Contents ............................................................................................................... ix
List of Tables .................................................................................................................... xii
List of Figures ................................................................................................................... xv
List of Abbreviations ................................................................................................... xxxiii
Chapter 1: Molecular Baskets – Toward Functionalized Gated Artificial Host Systems .. 1
1.1 An Introduction to Gating ........................................................................................ 1
1.2 Artificial Host Systems as Molecular Reactors........................................................ 8
1.3 Design and Synthesis of a Molecular Basket ......................................................... 13
1.4 Chapter 1 Summary and Conclusions .................................................................... 17
Chapter 2: Molecular Baskets Folded by Metal-Chelation .............................................. 19
2.1 Introduction: Pyridyl Gated Molecular Baskets and Their Chelation to Ag(I) ...... 19

x
2.2 Chelation to Cu(I) and Encapsulation of Acetonitrile ........................................ 24
2.3 Other Encapsulation Attempts in the Cu(I)-Bound Molecular Basket .................. 38
2.4 Chapter 2 Summary and Conclusions .................................................................... 42
Chapter 3: Molecular Baskets Folded by Intramolecular Hydrogen Bonds ..................... 45
3.1 Introduction: Synthesis and Initial Studies of a New Molecular Basket................ 45
3.2 Controlling the Gate Dynamics .............................................................................. 59
3.3 The Dynamic Discrimination of Guest Molecules in Molecular Baskets .............. 68
3.4 The Effect of Gate Dynamics on Guest Selectivity: The Revolving-Door Effect . 76
3.5 Molecular Recognition of a Transition State ......................................................... 86
3.6 Chapter 3 Summary and Conclusions .................................................................... 95
Chapter 4: Interconversion Between the Two Modes of Folding ..................................... 99
4.1 A Four-State Molecular Switch.............................................................................. 99
4.2 Chapter 4 Summary and Conclusions .................................................................. 110
Chapter 5: Experimental ................................................................................................ 111
5.1 General Methods .................................................................................................. 111
5.2 Synthetic Procedures ............................................................................................ 112
References ....................................................................................................................... 130
Appendix A: Supplementary Data ................................................................................. 138
A.1 Supplementary Data for Chapter 3.2 ................................................................... 138

xi
A.2 Supplementary Data for Chapter 3.3 ................................................................... 154
A.3 Supplementary Data for Chapter 3.4 ................................................................... 176
A.4 Supplementary Data for Chapter 3.5 ................................................................... 215
A.5 Supplementary Data for Chapter 4.1 ................................................................... 229

xii
List of Tables
Table 1: Encapsulation of guest molecules by 18a in 5:3 acetone-d6:chloroform-d. ........ 40
Table 2: Thermodynamic Parameters for the Entrapment of Halomethanes 28-38 Inside
Molecular Basket 1 ........................................................................................................... 55
Table 3: Calculated electrostatic potential energies (AM1/HF (6-31G**)) at the N-H and
Pyr-N sites in model compounds and 1H NMR (400 MHz, CD2Cl2) chemical shifts of the
N-H resonance of baskets 27 and 42 – 46 containing an excess (> 60 mol equiv) of t-
BuBr .................................................................................................................................. 61
Table 4: Table 4: Kinetic parameters for the revolving of gates (krac, 1H NMR line-shape
analysis) in molecular baskets 27 and 42 – 46 (CD2Cl2), at 226.0 ± 0.1 K. ..................... 62
Table 5: Kinetic parameters for the translocation of t-BuBr (kf, kd, 2-D EXSY NMR) in
molecular baskets 27 and 42 – 46 (CD2Cl2), at 226.0 ± 0.1 K. Thermodynamic stabilities
(ΔG°, 226.0 K) of the encapsulation complexes. .............................................................. 65
Table 6: Activation parameters for the trafficking of guests 28, 39 – 41, and 47 – 49 (2D
EXSY NMR, CD2Cl2, 250.0 ± 0.1 K) in (kf, ΔGf‡) and out (kd, ΔGd
‡) from basket 45 and
the 45 A/B interconversion (ΔGrac‡; see Figure 28) as well as thermodynamic stabilities
(ΔG°, 250.0 ± 0.1 K) of [45 guest] encapsulation complexes. ..................................... 70
Table 7: Rates of racemization (krac) of molecular baskets 27, 45, and 46 in CD2Cl2 at
(250.0 ± 0.1) K representing the interconversion between two dynamic enantiomers
(Figure 28) measured using dynamic NMR spectroscopy and the values of ρ and δ for the
entrance and departure of the homosteric guest series following the free energy
relationship ΔG‡
f/d = ρΔG° + δ. ........................................................................................ 77

xiii
Table 8: Gibbs free energies of activation corresponding to the entrance (ΔG‡
f) and
departure (ΔG‡
d) of guests along with the thermodynamic stabilities (ΔG°) of each
complex at (250.0 ± 0.1) K in CD2Cl2. Data were obtained from quantitative NMR
magnetization transfer experiments; each data point was obtained from six independent
EXSY measurements with the error margin corresponding to the standard deviation of
those measurements. ......................................................................................................... 80
Table 9: Difference in the experimental activation energy ΔG‡
f/d of guests 41 and 49
entering/departing baskets 46 (R = CF3), 45 (R = Ph), and 27 (R = Me), and computed
ΔΔG‡
f/d of hypothetical guests having the same affinity (ΔG°) for the encapsulation as 41
and 49 but the size and shape corresponding to the isosteric guest series. ....................... 84
Table 10: Activation parameters ΔH‡, ΔS
‡, and ΔG
‡ (188.8 K) for the conformational
interconversion of cyclohexane-d11(2-D EXSY NMR, 400 MHz, CD2Cl2, 188.8 ± 0.1 K)
inside baskets 27, 45, and 46 in CS2, the gas phase, CD2Cl2, and C6D5CD3. ................... 88
Table 11: Thermodynamic parameters ΔH°, ΔS°, and ΔG° for the binding of
cyclohexane-d11 to baskets 27, 45, and 46 (ΔG° and K at 188.8 K) in CD2Cl2 obtained
from variable-temperature 1H NMR data (186–228 K) and van’t Hoff plots. .................. 89
Table 12: Computed energies (M06-2X/6-311++G(d,p)//M06-2X/6-31G(d)) for the
conformational interconversion of cyclohexane in a vacuum and inside basket 27. ........ 94
Table 13: Activation Parameters for the Trafficking of Guests (2D EXSY NMR, CD2Cl2,
250.0 ± 0.1 K) in (kf, ΔGf ‡) and out (kd, ΔGd
‡) from Basket 45 and the 45A/B
Interconversion (ΔGrac‡) as well as Thermodynamic Stabilities (250.0 ± 0.1 K) of
Encapsulation Complexes obtained from 2D EXSY measurements (ΔGºEXSY, KEXSY) and
the Integration of 1H NMR Signals (ΔGºNMR, KNMR). .................................................... 164
Table 14: Equilibrium concentrations of 45, C(CH3)Br3, [45 C(CH3)Br3] and
magnetization exchange rate constants obtained from 1H NMR integration and 2-D
1H
EXSY spectroscopic measurements, respectively (400 MHz, 250 ± 0.1 K). ................. 165
Table 15: Rate constants kf and kd measured for guests in basket 46 at 250.0 K in CD2Cl2
and the corresponding association constants obtained by NMR (KNMR) or by kf/kd. ...... 178

xiv
Table 16: Rate constants kf and kd measured for guests in basket 45 at 250.0 K in CD2Cl2
and the corresponding association constants obtained by NMR (KNMR) or by kf/kd. ...... 179
Table 17: Rate constants kf and kd measured for guests in basket 27 at 250.0 K in CD2Cl2
and the corresponding association constants obtained by NMR (KNMR) or by kf/kd. ...... 179

xv
List of Figures
Figure 1: The Gibbs Free Energies associated with a host guest complex are the intrinsic
binding energy, equivalent to the thermodynamic stability of the complex (ΔG°), and
constrictive binding energy, equivalent to the energy required for guest entry (ΔG‡
f). The
sum of the magnitudes of intrinsic binding energy and constrictive binding energy is
equivalent to the energy required for guest departure (ΔG‡
d). ............................................ 3
Figure 2. A) Synthesis of a carcerand B) A hemicarcerand .............................................. 4
Figure 3: A) Two chair-to-boat interconversions allow gating of guest molecules to
occur in hemicarcerands. B) Schematic representations of the French and sliding door
mechanisms for the exchange of guests to and from hemicarcerands. ............................... 5
Figure 4: A) Chemical structure of a self-folding cavitand. B) Upon heating, the
cavitand interconverts between the “vase” conformer (left) and “kite” conformer (right).
Guest exchange is only observed in the kite conformation. ............................................... 6
Figure 5: Schematic representation of a tetrahedral M4L6 capsule .................................... 8
Figure 6: Proposed mechanism for catalyzed hydrolysis of acetals with 1 ...................... 10
Figure 7: Schematic representation of molecular cage 2 .................................................. 11
Figure 8: Diels-Alder reaction between anthracene 3 and maleimide 4 .......................... 12
Figure 9: Molecular structure of a molecular basket (left) and a x-ray crystal structure of
a molecular basket with benzyl gates encapsulating a molecule of chloroform (right).
Reprinted with permission from J. Am. Chem. Soc. 2006, 128, 5887 – 5894. Copyright
2006 American Chemical Society. ................................................................................... 13
Figure 10: Synthesis of tris-anhydride 7. Conditions: a) heavy wall sealed vessel, 180oC
b) Br2, 150oC c) excess potassium t-butoxide, 0
oC d) DMAD, 120
oC e) DDQ f) LDA,
-78oC g) SnMe3Cl, warm to rt h) Cu(NO3)2·2.5H2O, 50
oC i) LiOH, 80
oC j) 10% HCl k)
acetic anhydride, 150oC .................................................................................................... 15
Figure 11: Synthesis of pyridyl gated baskets 15, 16, and 17.......................................... 19

xvi
Figure 12: A series of 1H NMR spectra (500 MHz, 298 K, 1:1 CDCl3:CD3OD) of a
solution of 16 (5.4 mM) recorded after addition of a 124.0 mM standard of AgOTf (1:1
CDCl3:CD3OD). Reprinted from “A Close Inspection of Ag(I) coordination to molecular
baskets. A study of salvation and guest encapsulation in solution and the solid state”
Tetrahedron, 2009, 65, 7213 – 7219, with permission from Elsevier. ............................. 20
Figure 13: Energy minimized (DFT, BP86) conformations of Ag(I):16 complexes. The
calculated potential energy diagram for the interconversion of dynamic enantiomers 16a
and 16b via synchronized rotation of pyridine flaps about their N-C-C-C dihedral angle.
Reprinted with permission from Org. Lett. 2007, 9, 2301 - 2304. Copyright 2007
American Chemical Society. ............................................................................................ 21
Figure 14: The energy-minimized structures (DFT, BP86) of Ag(I):16, 17a, and 17b.
Reprinted from “A Close Inspection of Ag(I) coordination to molecular baskets. A study
of salvation and guest encapsulation in solution and the solid state” Tetrahedron, 2009,
65, 7213 – 7219, with permission from Elsevier. ............................................................. 22
Figure 15: A) A series of 1H NMR spectra (400 MHz, 300 K, 5:3 acetone-d6:chloroform-
d) of a solution of 16 (2.60 mM) recorded after the gradual addition of a 53.0 mM
solution of Cu(CH3CN)4PF6 B) A nonlinear curve fitting of the 1H NMR chemical shifts
of the Ha/Hc/Hd resonances to a 1:1 equilibrium model. .................................................. 25
Figure 16: A) Low resolution MALDI-TOF mass spectrum of an equimolar mixture of 16
and Cu(CH3CN)4PF6, with a major signal at m/z = 963.14 amu, corresponding to the
[18]+ cation. B) Isothermal calorimetry data for the incremental addition of a 1.00 mM
standard solution of Cu(CH3CN)4PF6 to a 0.10 mM solution of 16 in CH3CN under an
atmosphere of nitrogen. .................................................................................................... 26
Figure 17: Variable temperature 1H NMR spectra (400 MHz, 5:3 acetone:d6:chloroform-
d) of an equimolar solution of 16 and Cu(CH3CN)4PF6 (3.20 mM) ................................. 27
Figure 18: A) 1H NMR spectroscopic assignment of Cu(I)-folded molecular baskets 18a
(blue) and 18b (red). The corresponding ROESY assignments are marked with green
arrows. B) Selected regions of a 1H-
1H COSY spectrum (400 MHz, 5:3 acetone-
d6:chloroform-d, 190 K) of a 2.60 mM solution of 18a/b. C) Selected regions of a 1H-
1H
ROESY spectrum (400 MHz, 5:3 acetone-d6:chloroform-d, 190K) of a 2.60 mM solution
of 18a/b. .............................................................................................................................. 28
Figure 19: A) Selected regions of 1H NMR spectra (400 MHz, 5:3 acetone-
d6:chloroform-d, 300 K) of a solution of a) Cu(CH3CN)4PF6 (3.20 mM), b) CH3CN (12.8
mM), and c) 18a/b (3.20 mM). B) 1H NMR chemical shifts for the methyl group in
acetonitrile (400 MHz, 5:3 acetone-d6:chloroform-d) as a function of temperature: () a
solution of acetonitrile (12.8 mM), and () a solution of 18a/b (3.20 mM). .................... 30

xvii
Figure 20: Variable temperature 1H NMR spectra (400 MHz, 5:3 acetone-d6:chloroform-
d) of a 2.60 mM solution of 16 with 53.0 eq of acetonitrile showing the exclusive
formation of 18b. ............................................................................................................... 31
Figure 21: Energy minimized (DFT, BP86) conformations of 18a and 18b. Synchronized
rotation of the pyridine flaps about their N-C-C-C dihedral angle (α) was calculated to
require 4.52 and 1.65 kcal/mol in 18a and 18b respectively. ............................................ 33
Figure 22: A) Van’t Hoff plot and B) the thermodynamic parameters for the 18a/b
interconversion .................................................................................................................. 34
Figure 23: A) Eyring plot and B) activation parameters for the 18a/b interconversion. C)
Experimental and simulated (Maple 11) signals for the Hb protons in 18b and 18a,
respectively. Apparent second- and first- order (k1 and k-1) rate constants for the 18a/b
interconversion at different temperatures. ........................................................................ 35
Figure 24: A) Gated and B) slippage-based mechanisms for the 18a/b interconversion
have been proposed, and further assessed by DFT (BP86) calculations. ......................... 36
Figure 25: Variable temperature NMR (400 MHz) of a 1.66 mM solution of 18a in 5:3
acetone-d6:chloroform-d obtained after several evaporation/redissolving cycles under
nitrogen to remove acetonitrile (see text for details). ....................................................... 39
Figure 26: Variable temperature 1H NMR spectra (400 MHz, 5:3 acetone-d6:chloroform-
d) of a 1.94 mM solution of 18a with 1.20 eq of CH3NC. ................................................ 41
Figure 27: Chemical structure and synthesis of molecular basket 27. Top and side views
of energy-minimized (DFT, B3LYP) structure of folded 27. ........................................... 46
Figure 28: Clockwise and counterclockwise arrangements of the seam of hydrogen
bonds in dynamic enantiomers 27a and 27b respectively. ................................................. 47
Figure 29: A) Selected regions of variable temperature 1H NMR spectra (400 MHz,
CD2Cl2) of a solution of 27 (2.4 mM) and CCl4 (3.7 mM). B) A selected region of VT 13
C NMR spectra (100 MHz) of a solution of 27 (13.1 mM) and 13
CCl4 (19.6 mM). C)
van’t Hoff plot and thermodynamic parameters for the 27(solvent)/27(CCl4) equilibrium.
Reprinted with permission from J. Am. Chem. Soc. 2008, 130, 15127 - 15133. Copyright
2008 American Chemical Society. ................................................................................... 48
Figure 30: Eyring plot and the activation parameters for CCl4 departing 27(CCl4) obtained
from dynamic 1H NMR measurements in CD2Cl2. Reprinted with permission from J.
Am. Chem. Soc. 2008, 130, 15127 - 15133. Copyright 2008 American Chemical Society.
........................................................................................................................................... 50

xviii
Figure 31: Energy diagram showing the partitioned standard (ΔG°), at 298 K, for
synchronized gated transfer of CCl4 in/out of molecular basket 27. Reprinted with
permission from J. Am. Chem. Soc. 2008, 130, 15127 - 15133. Copyright 2008 American
Chemical Society. ............................................................................................................. 51
Figure 32: Electrostatic potential surface map of A) 27 and B) halomethanes 28 - 38
calculated using AM1 method with Spartan. Reprinted with permission from Org. Lett.
2008, 10, 5361 - 5364. Copyright 2008 American Chemical Society. ............................ 54
Figure 33: A) Van’t Hoff plot(s) for the encapsulation of guests 28-38 inside molecular
basket 27. B) Experimental enthalpic changes for the encapsulation of halomethanes 28-
38 (Table 2), as a function of their volumes (the dash line serves to guide the eye).
Reprinted with permission from Org. Lett. 2008, 10, 5361 - 5364. Copyright 2008
American Chemical Society. ............................................................................................ 56
Figure 34: Chemical structures of 28 and 39 – 41, and the corresponding thermodynamic
parameters for the encapsulation within molecular basket 27. Computed binding energies
(ΔE, kcal/mol), at the M05-2X/6-31+G(d,p)//M05-2X/6-31G(d) level of theory.
Reprinted with permission from Org. Lett. 2008, 10, 5361 - 5364. Copyright 2008
American Chemical Society. ............................................................................................ 57
Figure 35: Synthesis and chemical structure of molecular baskets 27 and 42 – 46 that
each possesses different amido-R groups. ........................................................................ 60
Figure 36: Linear free energy relationship (LFER) for the revolving of gates (A) in
baskets 27 and 42 – 46. The correlation was obtained using Taft’s two-parameter
regression model with polar (σ*) and steric (Es) substituent constants (B). ..................... 64
Figure 37: (A) Linear free energy relationship (LFER) for the dissociation of t-BuBr
from baskets 27 and 42 – 46 (B). The correlation was obtained using Taft’s two
parameter regression model with polar (σ*) and steric (Es) substituent constants (Figure
36B)................................................................................................................................... 66
Figure 38: Schematic representation of gated molecular baskets 27 and 42 – 46 capable
of controlling time (t) that t-BuBr spends in their cavity (right). By choosing a proper R
substituent, one can now tune this “residing” time to a desired value. ............................. 67
Figure 39: A) Reaction coordinate diagram showing an equilibrium with homosteric
guest series 28, 39 – 40, and 47 – 48 (CBr4 is displayed) entering (kf) and departing (kd)
gated molecular basket 45 (internal volume: 220 Å3). Solvent molecules (CD2Cl2, right)
occupy basket 45 devoid of external guests. B) Energy minimized structures (B3LYP/3-
21G) of guests 28, 39 – 41, and 47 – 49. .......................................................................... 69

xix
Figure 40: Activation energies for isosteric guests 28, 39, 40, 47, and 48 (106 – 107 Å3)
entering (ΔG‡
f) and departing (ΔG‡
d) basket 45 were found to be a linear function of the
corresponding binding energies (ΔG°, 250.0 ± 0.1 K). The kinetic behavior of smaller 49
(93 Å3) and bigger 41 (121 Å
3) deviates from the observed linear free energy
relationships (ΔG‡ = ρΔG° + δ). The activation energies characterizing the revolving of
gates (ΔG‡
rac) also exhibit a LFER. .................................................................................. 72
Figure 41: Snapshots of CBr4 departing 45, along a force vector aligned with the
basket’s side aperature, obtained from steered molecular dynamics (SMD) simulations of
the process (0, 440, and 1000 ps; top). The variation of intramolecular N---H distances
(assigned as I, II, and III) in basket 45 as a function of time during the SMD simulation
(bottom)............................................................................................................................. 74
Figure 42: Chemical structures of guest molecules grouped according to volume. The
homosteric guest series 28, 48, 39, 40, and 47 are spherical and of the same volume due
to the identical van der Waals radius of bromine and methyl groups. Heterosteric guest
molecules 49, 41, and 50 are used as examples of guest molecules that reside outside of
this size/shape profile. ....................................................................................................... 79
Figure 43: The activation energies for the entrapment (ΔG‡
f) and the departure (ΔG‡
d) of
isosteric guests 4–8 (black circles) abide to a linear free energy relationship described
with the equation ΔG‡
f/d = ρΔG° + δ. Note that the experimental data were fit to a linear
function corresponding to A) basket 46 (R2 = 0.69; R
2 = 1.00), B) basket 45 (R
2 = 0.93; R
2
= 0.99) and C) basket 27 (R2 = .94; R
2 = 0.99). The kinetic data for the exchange of
heterosteric guest molecules 41, 49, and 50 are shown in blue. The computed 90 %
confidence bands (SigmaPlot) of the linear regression lines are also shown in blue. ...... 81
Figure 44: An energy diagram for the conformational interconversion of cyclohexane.
The interconversion of ground- and transition-state conformers can be described with two
degrees of freedom ϕ1 and ϕ2. Note that only one cycle of the pseudorotation is shown.
........................................................................................................................................... 87
Figure 45: A 2-D NMR EXSY spectrum (400 MHz, 188.8 ± 0.1 K) of a 14.0 mM
solution (CD2Cl2) of cyclohexane-d11 and basket 2 (1.40 mM). The volumes of the
diagonal and cross-signals were used to extract the magnetization rate constant k*obs that
characterized the conformational interconversion. ........................................................... 90
Figure 46: Energy-optimized structures of chair (left) and half-chair (right) conformers
inside gated molecular basket 27 (M06-2X/6-31G(d)); note that some structural features
are omitted for clarity. Host–guest C-H⋅⋅⋅π contacts and the dihedral angle ϕ (Δϕ = 4.1°)
are also shown. .................................................................................................................. 92

xx
Figure 47: Chemical structures of hydrogen bonded (27A/B, A) and Cu(I) folded
(27:Cu(I), B) basket 27. Side views of energy minimized (DFT, B3LYP) structures of
27A/B (top) and 27:Cu(I) (bottom). .................................................................................. 100
Figure 48: (A) Selected regions of 1H NMR spectra (400 MHz, 298 K) of 27 (1.9 mM,
CD2Cl2/C6D6 = 2:1) recorded after addition of: (a) 6, (b) 12, (c) 18, (d) 24, (e) 30, (f) 36,
(g) 42, (h) 48, and (i) 54 μL of 17.4 mM solution of (CuOTf)2PhMe. (B) 1H NMR
chemical shifts of the Hf resonance in 27 (1.9 mM) as a function of the titrated
(CuOTf)2PhMe (17.4 mM). (C) 1H NMR chemical shifts of the Ha resonance in 16 (2.5
mM) as a function of the titrated (CuOTf)2PhMe (32.5 mM). ....................................... 101
Figure 49: Selected regions of 1H NMR spectra (400 MHz, 243 K) of a solution of
basket 27 (1.22 mM, CD2Cl2/C6D5CD3 = 2:1) containing CH3CBr2CH3 (19.5 mM) and
CH3NC (1.22 mM), and recorded after an addition of 13.0 mM (CuOTf)2PhMe and 26.0
mM CH3NC. Molar equivalents of Cu(I) and CH3NC are shown on the left. ................ 103
Figure 50: Stoichiometrically balanced equations describing the products obtained
during the addition events in Figure 47, including A) the first 0.125 molar equivalents of
Cu2(PhMe)OTf2, B) the additional 0.375 molar equivalents of Cu2(PhMe)OTf2, and C)
the addition of three molar equivalents of CH3NC. The chemical structures of D)
27:C(CH3)2Br2 and E) [27:Cu(I):CH3NC]OTf. .............................................................. 105
Figure 51: Series of 1H NMR spectra (400 MHz, 243 K) of a solution of 27 (1.3 mM,
CD2Cl2) containing CH3CBr2CH3 (2.2 mM) and recorded after addition of 65.0 mM
standard solution of TFA. Diffusion coefficients (Dobs) and the corresponding
hydrodynamic radii (rH) were obtained from 1H NMR DOSY measurements (500 MHz,
300 ± 1 K). ...................................................................................................................... 107
Figure 52: (A) Variable temperature 1H NMR spectra (500 MHz) of a CD2Cl2 solution of
27 (0.7 mM) containing 34.0 mM CH3CBr2CH3 and 2.7 mM TFA. (B) Integration
proportion (1H NMR) of Ha or Hb resonances in 27 and the proton nuclei in the
encapsulated CH3CBr2CH3 were used to obtain basket/guest ratio as a function of
temperature. (C) Top and side views of energy minimized (MMFF) structure of
[272 3H]3+
. ..................................................................................................................... 109
Figure 53: 2-D EXSY Spectrum (400 MHz, 250.0 ± 0.1 K) of a 2.4 mM solution of
basket 46 containing 4.1 molar equivalents of t-BuBr (9.84 mM) in CD2Cl2; the
concentration of “free” basket [basket] = 1.7 ± 0.2 mM, was obtained by integrating 1H
NMR signals for the guest (t-BuBr) and solvent occupied 46. Note that k*ba = k*d and
k*ab = k*f. ........................................................................................................................ 140
Figure 54: 2-D EXSY Spectrum (400 MHz, 243.0 ± 0.1 K) of a 2.4 mM Solution of
Basket 46 containing 4.5 molar equivalents of t-BuBr (10.8 mM) in CD2Cl2; the
concentration of “free” basket [basket] = 1.8 ± 0.2 mM, was obtained by integrating 1H

xxi
NMR signals for the guest (t-BuBr) and solvent occupied 46. Note that k*ba = k*d and
k*ab = k*f. ........................................................................................................................ 140
Figure 55: 2-D EXSY Spectrum (400 MHz, 235.0 ± 0.1 K) of a 2.4 mM Solution of
Basket 46 containing 4.1 molar equivalents of t-BuBr (9.84 mM) in CD2Cl2; the
concentration of “free” basket [basket] = 1.5 ± 0.2 mM, was obtained by integrating 1H
NMR signals for the guest (t-BuBr) and solvent occupied 46. Note that k*ba = k*d and
k*ab = k*f. ........................................................................................................................ 141
Figure 56: An Eyring Plot describing the temperature dependence of k*d. The exchange
rate at 226.0 K was estimated to be 0.068 ± 0.022 s-1
. ................................................... 142
Figure 57: An Eyring Plot describing the temperature dependence of kf. The exchange
rate at 226.0 K was thus estimated to be 0.69 ± 0.15 M-1
s-1
. .......................................... 142
Figure 58: 2-D EXSY Spectrum (400 MHz, 226.0 ± 0.1 K) of a 1.1 mM Solution of
Basket 27 containing 2.3 molar equivalents of t-BuBr (2.53 mM) in CD2Cl2; the
concentration of “free” basket [basket] = 0.84 ± 0.08 mM, was obtained by integrating 1H
NMR signals for the guest (t-BuBr) and solvent occupied 27. Note that k*ba = k*d and
k*ab = k*f. ........................................................................................................................ 143
Figure 59: 2-D EXSY Spectrum (400 MHz, 226 .0 ± 0.1 K) of a 1.9 mM solution of
basket 42 containing 2.6 molar equivalents of t-BuBr (4.94 mM) in CD2Cl2; the
concentration of “free” basket [basket] = 1.0 ± 0.1 mM, was obtained by integrating 1H
NMR signals for the guest (t-BuBr) and solvent occupied 42. Note that k*ba = k*d and
k*ab = k*f. ........................................................................................................................ 143
Figure 60: 2-D EXSY Spectrum (400 MHz, 226.0 ± 0.1 K) of a 1.9 mM solution of
basket 43 containing 3.3 molar equivalents of t-BuBr (6.27 mM) in CD2Cl2; the
concentration of “free” basket [basket] = 0.097 ± 0.010 mM, was obtained by integrating 1H NMR signals for the guest (t-BuBr) and solvent occupied 43. Note that k*ba = k*d and
k*ab = k*f. ........................................................................................................................ 144
Figure 61: 2-D EXSY Spectrum (400 MHz, 226.0 ± 0.1 K) of a 1.3 mM solution of
basket 44 containing 3.3 molar equivalents of t-BuBr (4.29 mM) in CD2Cl2; the
concentration of “free” basket [basket] = 0.086 ± 0.009 mM, was obtained by integrating 1H NMR signals for the guest (t-BuBr) and solvent occupied 44. Note that k*ba = k*d and
k*ab = k*f. ........................................................................................................................ 145
Figure 62: 2-D EXSY Spectrum (400 MHz, 226 .0 ± 0.1 K) of a 1.8 mM Solution of
Basket 45 containing 3.7 molar equivalents of t-BuBr (6.66 mM) in CD2Cl2; the
concentration of “free” basket [basket] = 0.083 ± 0.008 mM, was obtained by integrating 1H NMR signals for the guest (t-BuBr) and solvent occupied 45. Note that k*ba = k*d and
k*ab = k*f. ........................................................................................................................ 146

xxii
Figure 63: Simulated and experimental (WINDNMR-Pro)53
resonances for the Ha/b
protons in 27 (2.98 mM) in CD2Cl2 containing 100.0 molar equivalents of t-BuBr (298
mM)................................................................................................................................. 148
Figure 64: Eyring plot for 27A/27B interconversion, obtained with krac from dynamic 1H
NMR measurements above; krac at 226.0 K (with an error margin of 20 %) was obtained
from the linear least square analysis of the experimental data above. ............................ 149
Figure 65: Eyring plot for 42A/42B interconversion, obtained from dynamic 1H NMR
measurements of 42 (3.31 mM) in CD2Cl2 containing 60.0 molar equivalents of t-BuBr;
krac at 226.0 K (with an error margin of 20 %) was obtained from the linear least-square
analysis of the experimental data above (in this particular case, however, krac at 226 K
was reported (Table 4) as a mean of three independent measurements: 83 ± 17, 91 ± 18
and 59 ± 12 s-1). ............................................................................................................. 150
Figure 66: Eyring plot for 43A/43B interconversion, obtained from dynamic 1H NMR
measurements of 43 (1.41 mM) in CD2Cl2 containing 150.0 molar equivalents of t-BuBr;
krac at 226.0 K (with an error margin of 20 %) was obtained from the linear least-square
analysis of the experimental data above. ........................................................................ 151
Figure 67: Eyring plot for 44A/44B interconversion, obtained from dynamic 1H NMR
measurements of 44 (1.41 mM) in CD2Cl2 containing 100.0 molar equivalents of t-BuBr;
krac at 226.0 K (with an error margin of 20 %) was obtained from the linear least-square
analysis of the experimental data above. ........................................................................ 152
Figure 68: Eyring plots for 45A/45B interconversion, obtained from dynamic 1H NMR
measurements of 45 in CD2Cl2 (2.14 mM) containing 74.0 (red), 125.0 (blue), 175.0
(green) and 225.0 (gray) molar equivalents of t-BuBr; krac at 226.0 K (with an error
margin of 20 %) was obtained from the linear least-square analysis of the experimental
data below. (red, slope = -5633.7322 and intercept = 22.1632); blue, slope = - 4956.9507
and intercept = 19.4412; green, slope = -4791.6522 and intercept = 18.8017; gray, slope =
- 4854.2705 and intercept = 19.1374). ............................................................................ 153
Figure 69: Eyring plot for 46A/46B interconversion, obtained from dynamic 1H NMR
measurements of 46 (1.16 mM) in CD2Cl2 containing 250.0 molar equivalents of t-BuBr;
krac at 226.0 K (with an error margin of 20 %) was obtained from the linear least-square
analysis of the experimental data above. ........................................................................ 154
Figure 70: 2-D 13
C EXSY Spectrum (126 MHz, 250.0 ± 0.1 K) of a 2.6 mM solution of
basket 45 containing 1.5 molar equivalents of 28 (13
CBr4, 3.9 mM) in CD2Cl2. The
sample spectrum shown has been symmetrized for clarity. Note k*out = k*d. ............... 156

xxiii
Figure 71: 2-D 1H EXSY Spectrum (400 MHz, 250.0 ± 0.1 K) of a 2.5 mM solution of
basket 45 containing 1.0 molar equivalent of 48 (C(CH3)Br3, 2.5 mM) in CD2Cl2. The
concentration of “free” basket, [basket] = 0.57 mM ± 0.06 mM, was obtained by 1H
NMR integration. The sample spectrum shown has been symmetrized for clarity. Note
k*out = k*d and k*in = k*f. ................................................................................................ 157
Figure 72: 2-D 1H EXSY Spectrum (400 MHz, 250.0 ± 0.1 K) of a 2.5 mM solution of
basket 45 containing 2.0 molar equivalents of 39 (C(CH3)2Br2, 5.0 mM) in CD2Cl2. The
concentration of “free” basket, [basket] = 0.83 mM ± 0.08 mM, was obtained by 1H
NMR integration. The sample spectrum shown has been symmetrized for clarity. Note
k*out = k*d and k*in = k*f. ................................................................................................ 158
Figure 73: 2-D 1H EXSY Spectrum (400 MHz, 250.0 ± 0.1 K) of a 2.5 mM solution of
basket 45 containing 10.2 molar equivalents of 40 (C(CH3)3Br, 25.5 mM) in CD2Cl2.
The concentration of “free” basket, [basket] = 0.83 mM ± 0.08 mM, was obtained by 1H
NMR integration. The sample spectrum shown has been symmetrized for clarity. Note
k*out = k*d and k*in = k*f. ................................................................................................ 159
Figure 74: 2-D 1H EXSY Spectrum (400 MHz, 250.0 ± 0.1 K) of a 2.5 mM solution of
basket 45 containing 7.0 molar equivalents of 47 (C(CH3)4, 17.5 mM) in CD2Cl2. The
concentration of “free” basket, [basket] = 1.36 mM ± 0.14 mM, was obtained by 1H
NMR integration. The sample spectrum shown has been symmetrized for clarity. Note
k*out = k*d and k*in = k*f. ................................................................................................ 160
Figure 75: 2-D 1H EXSY Spectrum (400 MHz, 250.0 ± 0.1 K) of a 2.5 mM solution of
basket 45 containing 2.75 molar equivalents of 41 (Si(CH3)4, 6.9 mM) in CD2Cl2. The
concentration of “free” basket, [basket] = 1.96 mM ± 0.20 mM, was obtained by 1H
NMR integration. The sample spectrum shown has been symmetrized for clarity. Note
k*out = k*d and k*in = k*f. ................................................................................................ 161
Figure 76: 2-D 1H EXSY Spectrum (400 MHz, 250.0 ± 0.1 K) of a 0.2 mM solution of
basket 45 containing 9.9 molar equivalents of 49 (C(CH3)Cl3, 2.2 mM) in CD2Cl2. The
concentration of “free” basket, [basket] = 0.11 mM ± 0.01 mM, was obtained by 1H
NMR integration. The sample spectrum shown has been symmetrized for clarity. Note
k*out = k*d and k*in = k*f. ................................................................................................ 162
Figure 77: A series of 1H NMR (left column, 500 MHz) and
13C NMR (right column,
126 MHz) spectra of a 3.40 mM solution of 45 containing 0.78 molar equivalents (2.6
mM) of 13
CBr4 in CD2Cl2; note two sets of signals, one set corresponding to
[45 CD2Cl2] and another to [4513
CBr4]. ..................................................................... 162
Figure 78: Van’t Hoff plot describing the temperature dependence of the natural
logarithm of equilibrium constant K, for the encapsulation of 13
CBr4. The 1H NMR
integration of the amide N H signals of basket 45 (δ = 11.6 and 11.3 ppm) was used to

xxiv
obtain the value for K (see the equation below). The error bar was calculated as the 95%
prediction interval. .......................................................................................................... 163
Figure 79: The magnetization rate constant k*f as a function of the concentration of 45.
Note that the fitted curve has a slope, which in accord with the equation A2 above, is
equivalent to kf. The intercept of 0.27 is close to 0. ........................................................ 166
Figure 80: Simulated (WinDNMR-Pro)53
and experimental 1H NMR (400 MHz)
resonances for the Hd/e protons in 45 (2.5 mM) in CD2Cl2 containing 53.0 molar
equivalents of CBr4 (133 mM); please note that kAB = krac. ............................................ 168
Figure 81: Eyring plot describing the temperature dependence of krac of a 2.5 mM
solution of 45 containing 53.0 molar equivalents of CBr4 (133 mM) in CD2Cl2. Please
note kb = krac. ................................................................................................................... 169
Figure 82: Eyring plot describing the temperature dependence of krac of a 2.5 mM
solution of 45 containing 120.0 molar equivalents of C(CH3)Br3 (300 mM) in CD2Cl2.
Please note kb = krac. ........................................................................................................ 170
Figure 83: Eyring plot describing the temperature dependence of krac of a 2.5 mM
solution of 45 containing 60.0 molar equivalents of C(CH3)2Br2 (150 mM) in CD2Cl2.
Please note kb = krac ......................................................................................................... 171
Figure 84: Eyring plot describing the temperature dependence of krac of a 2.14 mM
solution of 45 containing 150.0 molar equivalents of C(CH3)3Br (231 mM) in CD2Cl2.
Please note kb = krac ......................................................................................................... 172
Figure 85: Eyring plot describing the temperature dependence of krac of a 1.6 mM
solution of 45 containing 275.0 molar equivalents of C(CH3)4 (440 mM) in CD2Cl2.
Please note kb = krac ......................................................................................................... 173
Figure 86: Eyring plot describing the temperature dependence of krac of a 1.4 mM
solution of 45 containing 180.0 molar equivalents of C(CH3)Cl3 (252 mM) in CD2Cl2.
Please note kb = krac ......................................................................................................... 174
Figure 87: Eyring plot describing the temperature dependence of krac of a 1.4 mM
solution of 45 containing 200.0 molar equivalents of Si(CH3)4 (280 mM) in CD2Cl2.
Please note kb = krac ......................................................................................................... 175
Figure 88: Eyring plot describing the temperature dependence of krac of a 1.5 mM
solution of 45 in CD2Cl2. ................................................................................................ 175
Figure 89: 2-D 1H EXSY Spectrum (400 MHz, 266.0 ± 0.1 K) of a 0.60 mM solution of
basket 46 containing 0.83 molar equivalents of 48 (C(CH3)Br3, 0.50 mM) in CD2Cl2.

xxv
The sample spectrum shown has been symmetrized for clarity. Please note k*out = k*d.
......................................................................................................................................... 180
Figure 90: 2-D 1H EXSY Spectrum (400 MHz, 271.0 ± 0.1 K) of a 0.60 mM solution of
basket 46 containing 0.83 molar equivalents of 48 (C(CH3)Br3, 0.50 mM) in CD2Cl2.
The sample spectrum shown has been symmetrized for clarity. Please note k*out = k*d.
......................................................................................................................................... 181
Figure 91: 2-D 1H EXSY Spectrum (400 MHz, 276.0 ± 0.1 K) of a 0.60 mM solution of
basket 46 containing 0.83 molar equivalents of 48 (C(CH3)Br3, 0.50 mM) in CD2Cl2.
The sample spectrum shown has been symmetrized for clarity. Please note k*out = k*d.
......................................................................................................................................... 182
Figure 92: Eyring plot describing the temperature dependence of kd of a 0.60 mM
solution of 46 containing 0.83 molar equivalents of 48 (C(CH3)Br3, 0.50 mM) in CD2Cl2.
......................................................................................................................................... 183
Figure 93: A series of 1H NMR Spectra (400 MHz) of a 0.60 mM solution of basket 46
containing 0.83 molar equivalents of 48 (C(CH3)Br3, 0.50 mM) in CD2Cl2. ................. 184
Figure 94: Van’t Hoff plot describing the temperature dependence of the natural
logarithm of equilibrium constant K, for the encapsulation of 48 in basket 46. The 1H
δ = 12.7 and 12.5 ppm) was used
to obtain the value for K.................................................................................................. 185
Figure 95: 2-D 1H EXSY Spectrum (400 MHz, 250.0 ± 0.1 K) of a 0.60 mM solution of
basket 46 containing 4.05 molar equivalents of 39 (C(CH3)2Br2, 2.43 mM) in CD2Cl2.
The sample spectrum shown has been symmetrized for clarity. The concentration of free
basket, [basket], was determined to be 0.32 ± 0.03 mM by NMR integration. Please note
k*out = k*d and k*in = k*f. ................................................................................................ 185
Figure 96: 2-D 1H EXSY Spectrum (400 MHz, 250.0 ± 0.1 K) of a 0.60 mM solution of
basket 46 containing 7.50 molar equivalents of 40 (C(CH3)3Br, 4.5 mM) in CD2Cl2. The
sample spectrum shown has been symmetrized for clarity. The concentration of free
basket, [basket], was determined to be 0.45 ± 0.05 mM by NMR integration. Please note
k*out = k*d and k*in = k*f. ................................................................................................ 186
Figure 97: 2-D 1H EXSY Spectrum (400 MHz, 250.0 ± 0.1 K) of a 0.60 mM solution of
basket 46 containing 15.9 molar equivalents of 47 (C(CH3)4, 9.54 mM) in CD2Cl2. The
sample spectrum shown has been symmetrized for clarity. The concentration of free
basket, [basket], was determined to be 0.53 ± 0.05 mM by NMR integration. Please note
k*out = k*d and k*in = k*f. ................................................................................................ 187

xxvi
Figure 98: 2-D 1H EXSY Spectrum (400 MHz, 250.0 ± 0.1 K) of a 0.60 mM solution of
basket 46 containing 7.8 molar equivalents of 49 (C(CH3)Cl3, 4.7 mM) in CD2Cl2. The
sample spectrum shown has been symmetrized for clarity. The concentration of free
basket, [basket], was determined to be 0.38 ± 0.04 mM by NMR integration. Please note
k*out = k*d and k*in = k*f. ................................................................................................ 188
Figure 99: Experimental 1H selective inversion-recovery NMR (400 MHz, 250 K) data
and the corresponding fittings for free (left) and encapsulated (right) 41 (Si(CH3)4) in a
0.56 mM solution of 46 containing 29.43 molar equivalents of 10 (16.5 mM) in CD2Cl2.
The concentration of free basket, [basket], was determined to be 0.46 ± 0.05 mM by
NMR integration. ............................................................................................................ 189
Figure 100: 2-D 1H EXSY Spectrum (400 MHz, 266.0 ± 0.1 K) of a 0.56 mM solution of
basket 46 containing 1.18 molar equivalents of 50 (C(CH3)Br2Cl, 0.66 mM) in CD2Cl2.
The sample spectrum shown has been symmetrized for clarity. Please note k*out = k*d.
......................................................................................................................................... 189
Figure 101: 2-D 1H EXSY Spectrum (400 MHz, 271.0 ± 0.1 K) of a 0.56 mM solution of
basket 46 containing 1.18 molar equivalents of 50 (C(CH3)Br2Cl, 0.66 mM) in CD2Cl2.
The sample spectrum shown has been symmetrized for clarity. Please note k*out = k*d.
......................................................................................................................................... 190
Figure 102: 2-D 1H EXSY Spectrum (400 MHz, 276.0 ± 0.1 K) of a 0.56 mM solution of
basket 46 containing 1.18 molar equivalents of 50 (C(CH3)Br2Cl, 0.66 mM) in CD2Cl2.
The sample spectrum shown has been symmetrized for clarity. Please note k*out = k*d.
......................................................................................................................................... 191
Figure 103: Eyring plot describing the temperature dependence of kd of a 0.56 mM
solution of 46 containing 1.18 molar equivalents of 50 (C(CH3)Br2Cl, 0.66 mM) in
CD2Cl2............................................................................................................................. 192
Figure 104: A series of 1H NMR Spectra (400 MHz) of a 0.56 mM solution of basket 46
containing 1.18 molar equivalents of 50 (C(CH3)Br2Cl, 0.50 mM) in CD2Cl2. ............. 193
Figure 105: Van’t Hoff plot describing the temperature dependence of the natural
logarithm of equilibrium constant K, for the encapsulation of 50 in basket 46. The 1H
ket 1 (δ = 12.7 and 12.5 ppm) was used
to obtain the value for K.................................................................................................. 194
Figure 106: 2-D 13
C EXSY Spectrum (126 MHz, 250.0 ± 0.1 K) of a 2.60 mM solution
of basket 45 containing 1.5 molar equivalents of 28 (13
CBr4, 3.9 mM) in CD2Cl2. The
sample spectrum shown has been symmetrized for clarity. Please note k*out = k*d. ..... 194

xxvii
Figure 107: A series of 1H NMR Spectra (400 MHz) of a 3.40 mM solution of basket 45
containing 0.78 molar equivalents of 28 (13
CBr4, 2.6 mM) in CD2Cl2. .......................... 195
Figure 108: Van’t Hoff plot describing the temperature dependence of the natural
logarithm of equilibrium constant K, for the encapsulation of 28 in basket 45. The 1H
δ = 11.6 and 11.3 ppm) was used
to obtain the value for K.................................................................................................. 195
Figure 109: 2-D 1H EXSY Spectrum (400 MHz, 250.0 ± 0.1 K) of a 2.5 mM solution of
basket 45 containing 1.0 molar equivalents of 48 (CBr3CH3, 2.5 mM) in CD2Cl2. The
sample spectrum shown has been symmetrized for clarity. The concentration of free
basket, [basket], was determined to be 0.57 ± 0.06 mM by NMR integration. Please note
k*out = k*d and k*in = k*f. ................................................................................................ 196
Figure 110: 2-D 1H EXSY Spectrum (400 MHz, 250.0 ± 0.1 K) of a 2.5 mM solution of
basket 45 containing 2.0 molar equivalents of 39 (CBr2(CH3)2, 5.0 mM) in CD2Cl2. The
sample spectrum shown has been symmetrized for clarity. The concentration of free
basket, [basket], was determined to be 0.83 ± 0.08 mM by NMR integration. Please
note k*out = k*d and k*in = k*f.......................................................................................... 197
Figure 111: 2-D 1H EXSY Spectrum (400 MHz, 250.0 ± 0.1 K) of a 2.5 mM solution of
basket 45 containing 10.2 molar equivalents of 40 (C(CH3)3Br, 25.5 mM) in CD2Cl2.
The sample spectrum shown has been symmetrized for clarity. The concentration of free
basket, [basket], was determined to be 0.83 ± 0.08 mM by NMR integration. Please note
k*out = k*d and k*in = k*f. ................................................................................................ 197
Figure 112: 2-D 1H EXSY Spectrum (400 MHz, 250.0 ± 0.1 K) of a 2.5 mM solution of
basket 45 containing 7.0 molar equivalents of 47 (C(CH3)4, 17.5 mM) in CD2Cl2. The
sample spectrum shown has been symmetrized for clarity. The concentration of free
basket, [basket], was determined to be 1.36 ± 0.14 mM by NMR integration. Please note
k*out = k*d and k*in = k*f. ................................................................................................ 198
Figure 113: 2-D 1H EXSY Spectrum (400 MHz, 250.0 ± 0.1 K) of a 1.64 mM solution of
basket 45 containing 9.68 molar equivalents of 49 (C(CH3)Cl3, 15.9 mM) in CD2Cl2. The
sample spectrum shown has been symmetrized for clarity. The concentration of free
basket, [basket], was determined to be 0.55 ± 0.06 mM by NMR integration. Please note
k*out = k*d and k*in = k*f. ................................................................................................ 199
Figure 114: 2-D 1H EXSY Spectrum (400 MHz, 250.0 ± 0.1 K) of a 2.5 mM solution of
basket 45 containing 2.75 molar equivalents of 41 (Si(CH3)4, 6.9 mM) in CD2Cl2. The
sample spectrum shown has been symmetrized for clarity. The concentration of free
basket, [basket], was determined to be 1.96 ± 0.20 mM by NMR integration. Please note
k*out = k*d and k*in = k*f. ................................................................................................ 200

xxviii
Figure 115: 2-D 1H EXSY Spectrum (400 MHz, 250.0 ± 0.1 K) of a 1.65 mM solution of
basket 45 containing 1.08 molar equivalents of 50 (C(CH3)Br2Cl, 1.78 mM) in CD2Cl2.
The sample spectrum shown has been symmetrized for clarity. The concentration of free
basket, [basket], was determined to be 0.59 ± 0.06 mM by NMR integration. Please note
k*out = k*d and k*in = k*f. ................................................................................................ 200
Figure 116: 2-D 13
C EXSY Spectrum (126 MHz, 250.0 ± 0.1 K) of a 2.36 mM solution
of basket 27 containing 0.70 molar equivalents of 28 (13
CBr4, 1.65 mM) in CD2Cl2. The
sample spectrum shown has been symmetrized for clarity. Please note k*out = k*d. ..... 202
Figure 117: A series of 1H NMR Spectra (400 MHz) of a 2.36 mM solution of basket 27
containing 0.70 molar equivalents of 28 (13
CBr4, 1.65 mM) in CD2Cl2. ........................ 203
Figure 118: Van’t Hoff plot describing the temperature dependence of the natural
logarithm of equilibrium constant K, for the encapsulation of 28 in basket 27. The 1H
δ = 11.4 and 11.2 ppm) was used
to obtain the value for K.................................................................................................. 204
Figure 119: 2-D 1H EXSY Spectrum (400 MHz, 250.0 ± 0.1 K) of a 0.69 mM solution of
basket 27 containing 1.19 molar equivalents of 48 (CBr3CH3, 0.83 mM) in CD2Cl2. The
sample spectrum shown has been symmetrized for clarity. The concentration of free
basket, [basket], was determined to be 0.18 ± 0.02 mM by NMR integration. Please note
k*out = k*d and k*in = k*f. ................................................................................................ 205
Figure 120: 2-D 1H EXSY Spectrum (400 MHz, 250.0 ± 0.1 K) of a 0.69 mM solution of
basket 27 containing 1.31 molar equivalents of 39 (CBr2(CH3)2, 0.90 mM) in CD2Cl2.
The sample spectrum shown has been symmetrized for clarity. The concentration of free
basket, [basket], was determined to be 0.48 ± 0.05 mM by NMR integration. Please
note k*out = k*d and k*in = k*f.......................................................................................... 206
Figure 121: 2-D 1H EXSY Spectrum (400 MHz, 250.0 ± 0.1 K) of a 0.69 mM solution of
basket 27 containing 4.59 molar equivalents of 40 (C(CH3)3Br, 3.17 mM) in CD2Cl2.
The sample spectrum shown has been symmetrized for clarity. The concentration of free
basket, [basket], was determined to be 0.56 ± 0.06 mM by NMR integration. Please note
k*out = k*d and k*in = k*f. ................................................................................................ 207
Figure 122: Experimental 1H selective inversion-recovery NMR (400 MHz, 250 K) data
and the corresponding fittings for free (left) and encapsulated (right) 49 (CCl3CH3) in a
1.64 mM solution of 27 containing 6.65 molar equivalents of 9 (11.81 mM) in CD2Cl2.
......................................................................................................................................... 208
Figure 123: A series of 1H NMR Spectra (400 MHz) of a 1.64 mM solution of basket 27
containing 6.65 molar equivalents of 49 (C(CH3)Cl3, 11.81 mM) in CD2Cl2. .............. 209

xxix
Figure 124: Van’t Hoff plot describing the temperature dependence of the natural
logarithm of equilibrium constant K, for the encapsulation of 49 in basket 27. The 1H
δ = 11.6 and 11.3 ppm) was used
to obtain the value for K (see the equation below). ........................................................ 210
Figure 125: Experimental 1H selective inversion-recovery NMR (400 MHz, 250 K) data
and the corresponding fittings for free (left) and encapsulated (right) 41 (Si(CH3)4) in a
2.36 mM solution of 27 containing 3.05 molar equivalents of 10 (7.20 mM) in CD2Cl2.
The concentration of free basket, [basket], was determined to be 1.92 ± 0.19 mM by
NMR integration. ............................................................................................................ 211
Figure 126: 2-D 1H EXSY Spectrum (400 MHz, 250.0 ± 0.1 K) of a 0.69 mM solution of
basket 27 containing 0.93 molar equivalents of 50 (C(CH3)Br2Cl, 0.64 mM) in CD2Cl2.
The sample spectrum shown has been symmetrized for clarity. The concentration of free
basket, [basket], was determined to be 0.38 ± 0.04 mM by NMR integration. Please note
k*out = k*d and k*in = k*f. ................................................................................................ 212
Figure 127: Simulated (WinDNMR-Pro)53
and experimental 1H NMR (400 MHz)
resonances for the He/f protons in 45 (2.0 mM) in CD2Cl2; please note that kAB = krac. .. 214
Figure 128: Eyring plot describing the temperature dependence of krac of a 1.1 mM
solution of 46 in CD2Cl2. ................................................................................................ 214
Figure 129: Eyring plot describing the temperature dependence of krac of a 2.0 mM
solution of 45 in CD2Cl2. ................................................................................................ 215
Figure 130: 2-D 1H EXSY Spectrum (400 MHz, 188.8 ± 0.1 K) of a 1.4 mM solution of
basket 27 containing 10.6 molar equivalents of cyclohexane-d11 (14.8 mM) in CD2Cl2.
......................................................................................................................................... 217
Figure 131: 2-D 1H EXSY Spectrum (400 MHz, 188.8 ± 0.1 K) of a 1.4 mM solution of
basket 45 containing 10.0 molar equivalents of cyclohexane-d11 (14.0 mM) in CD2Cl2.
......................................................................................................................................... 217
Figure 132: 2-D 1H EXSY Spectrum (400 MHz, 188.8 ± 0.1 K) of a 1.1 mM solution of
basket 46 containing 35.0 molar equivalents of cyclohexane-d11 (38.5 mM) in CD2Cl2.
......................................................................................................................................... 218
Figure 133: 2-D 1H EXSY Spectrum (400 MHz, 188.8 ± 0.1 K) of a 200.1 mM solution
of cyclohexane-d11 in C6D5CD3. Please note k*flip = k*obs......................................... 219
Figure 134: A series of 1H NMR (400 MHz) spectra of a 1.4 mM solution of basket 27
containing 10.6 molar equivalents of cyclohexane-d11 (14.8 mM) in CD2Cl2. .............. 220

xxx
Figure 135: Van’t Hoff plot describing the temperature dependence of the natural
logarithm of equilibrium constant K, for the encapsulation of cyclohexane-d11. The 1H
NMR integration of the amide N-H signals of basket 27 (δ = 11.6 and 11.3 ppm) was
used to obtain the value for K. The error was calculated as the 95% prediction interval.
......................................................................................................................................... 220
Figure 136: A series of 1H NMR (400 MHz) spectra of a 1.7 mM solution of basket 45
containing 10.0 molar equivalents of cyclohexane-d11 (16.7 mM) in CD2Cl2. .............. 221
Figure 137: Van’t Hoff plot describing the temperature dependence of the natural
logarithm of equilibrium constant K, for the encapsulation of cyclohexane-d11. The 1H
NMR integration of the amide N-H signals of basket 45 (δ = 11.6 and 11.3 ppm) was
used to obtain the value for K. The error was calculated as the 95% prediction interval.
......................................................................................................................................... 222
Figure 138: A series of 1H NMR (400 MHz) spectra of a 1.1 mM solution of basket 46
containing 35.0 molar equivalents of cyclohexane-d11 (38.5 mM) in CD2Cl2. .............. 223
Figure 139: Van’t Hoff plot describing the temperature dependence of the natural
logarithm of equilibrium constant K, for the encapsulation of cyclohexane-d11. The 1H
NMR integration of the amide N-H signals of basket 46 (δ = 11.6 and 11.3 ppm) was
used to obtain the value for K. The error was calculated as the 95% prediction interval.
......................................................................................................................................... 223
Figure 140: Simulated (WINDNMR-Pro)53
and experimental 1H NMR (400 MHz)
resonances of cyclohexane-d11 (200.1 mM) in C6D5CD3. .............................................. 226
Figure 141: Eyring plot describing the temperature dependence of k of a 200.1 mM
solution of cyclohexane-d11 in C6D5CD3. The reported error margins are the standard
errors from the linear least-squares analysis. .................................................................. 227
Figure 142: Simulated (WINDNMR-Pro) and experimental 1H NMR (400 MHz)
resonances of cyclohexane-d11 (200.1 mM) in CD2Cl2. ................................................. 228
Figure 143: Eyring plot describing the temperature dependence of k of a 100 mM
solution of cyclohexane-d11 in CD2Cl2. The reported error margins are the standard errors
from the linear least-squares analysis. ............................................................................ 229
Figure 144: 1H-
1H COSY NMR spectrum (400 MHz, 300 K) of a 1.9 mM solution
(CD2Cl2:C6D6 = 2:1) of 27:Cu(I). ................................................................................... 230
Figure 145: 1H-
1H NOESY NMR spectrum (400 MHz, 200 ms mixing time, 300 K) of a
1.9 mM solution (CD2Cl2:C6D6 = 2:1) of 27:Cu(I). ....................................................... 231

xxxi
Figure 146: A selected 1H DOSY NMR (500 MHz, 300 ± 1 K) spectrum of a 1.9 mM
solution (CD2Cl2:C6D6 = 2:1) of 27:Cu(I). The resulting mean average diffusion
coefficient (average of three experiments) is shown below. ........................................... 232
Figure 147: Low Resolution MALDI-TOF mass spectrum of 27 containing 0.75 equiv.
of (CuOTf)2PhMe. .......................................................................................................... 233
Figure 148: Variable Temperature (VT) 1H NMR (400 MHz) spectra of a 0.71 mM
(CD2Cl2:C6D5CD3 = 2:1 ) solution of 27. ....................................................................... 234
Figure 149: The simulated (WINDNMR-Pro)1 and the experimental signals for the
exchange of spins corresponding to Hd/e nuclei in 27. The apparent first-order rate
constants k1/k-1 are shown on the right. ........................................................................... 235
Figure 150: A series of 1H NMR (400 MHz, 243 K) spectra of a 2.2 mM solution of 27
(CD2Cl2:C6D5CD3 = 2:1), containing 0.5 molar equivalents of (CuOTF)2PhMe, 10.0
molar equivalents of CH3CBr2CH3, and 1.5 molar equivalents of CH3NC, and recorded
after an addition of 18.6 molar equivalents of Na2S·9H2O. The heterogenous mixture was
shaken in between the measurements. ............................................................................ 236
Figure 151: A series of 1H NMR (400 MHz, 243 K) spectra of a 0.71 mM solution of 27
(CD2Cl2:C6D5CD3 = 2:1) containing 1.0 molar equivalent of (CuOTF)2PhMe and
recorded after addition of (A) 0.0, (B) 4.0, (C) 8.0, and (D) 12.0 molar equivalents of
CH3CBr2CH3. .................................................................................................................. 237
Figure 152: 1H-
1H COSY NMR (400 MHz, 300 K) spectrum of a 1.0 mM solution
(CD2Cl2) of [27 H]+. ...................................................................................................... 238
Figure 153: 1H-
1H NOESY NMR (400 MHz, 200 ms mixing time, 300 K) spectrum of a
1.0 mM solution (CD2Cl2) of [27 H]+. .......................................................................... 239
Figure 154: Variable Temperature (VT) 1H NMR (400 MHz) spectra of a 1.0 mM
solution (CD2Cl2) of [27 H]+. ........................................................................................ 240
Figure 155: 19
F NMR (376 MHz, 300 K, CD2Cl2) spectra of 1.0 mM solution of (A)
[27 H]+ and (B) pyridinium trifluoroacetate, both containing α,α,α-trifluorotoluene
(standard). Please note [1 H]+ CF3CO2
- = [27 H]
+ CF3CO2
-. ...................................... 241
Figure 156: Variable Temperature 1H NMR (400 MHz) spectra of a 0.7 mM solution
(CD2Cl2) of 27 containing 1.0 molar equivalent of CH3SO3H (inset: the singlet
corresponds to unperturbed CH3 in methanesulfonate anion). ....................................... 241
Figure 157: 1H-
1H EXSY NMR (400 MHz, 200 ms mixing time, 300 K) spectrum of 1.6
mM solution of 27 (CD2Cl2) containing 3.2 molar equivalents of TFA. ........................ 242

xxxii
Figure 158: 1H-
1H NOESY NMR (400 MHz, 250 ms mixing time, 243 K) spectrum of a
0.8 mM solution of 27 containing 50 molar equivalents of CH3CBr2CH3 and 3.5 molar
equivalents of TFA. ........................................................................................................ 243
Figure 159: A series of 1H NMR (400 MHz, 243 K, CD2Cl2) spectra of a 1.3 mM
solution of 27, containing 2.2 molar equivalents of CH3CBr2CH3 and 3.4 molar
equivalents of TFA, and recorded after addition of 140 molar equivalents of K2CO3. The
mixture was shaken in between the measurements. ........................................................ 244
Figure 160: A selected 1H DOSY NMR (500 MHz, 300 ± 1K) spectrum of a 2.3 mM
solution (CD2Cl2) of 27. The resulting mean average diffusion coefficient (D) and the
hydrodynamic radius were calculated (from three independent measurements) to be 8.7 ±
0.6 x 10⁻¹⁰
m2s
-1 and 6.1 ± 0.4 Å, respectively. ............................................................... 245
Figure 161: A selected 1H DOSY NMR (500 MHz, 300 ± 1K) spectrum of a 2.3 mM
solution (CD2Cl2) of [27 H]+. The resulting mean average diffusion coefficient (D) and
hydrodynamic radius were calculated (from three independent measurements) to be 8.3 ±
0.9 x 10⁻¹⁰
m2s
-1 and 6.4 ± 0.7 Å, respectively. ............................................................... 246
Figure 162: A selected 1H DOSY NMR (500 MHz, 300 ± 1K) spectrum of a 2.3 mM
solution (CD2Cl2) of 27 containing 3.5 molar equivalents of TFA. The resulting mean
average diffusion coefficient (D) and hydrodynamic radius was calculated (from three
independent measurements) to be 5.7 ± 0.5 x 10⁻¹⁰
m2s
-1 and 9.4 ± 0.4 Å, respectively.247

xxxiii
List of Abbreviations
Å angstrom (1 x 10⁻¹⁰
m)
AM1 Austin Model 1
AMBER Assisted Model Building with Energy Refinement
br broad (NMR)
COSY Correlation Spectroscopy (NMR)
CPK 3-dimensional space-filling molecular modeling. Named after Robert
Corey, Linus Pauling, and Walter Koltun
d doublet (NMR)
dd doublet of doublets (NMR)
dt doublet of triplets (NMR)
DDQ 2,3-dichloro-5,6-dicyano-1,4-benzoquinone
DFT Density Functional Theory
DMA N,N-dimethylacetamide
DMAD dimethylacetylene dicarboxylate
DMF N,N-dimethylformamide
DOSY Diffusion-Ordered Spectroscopy (NMR)
ESI electrospray ionization
eu entropy unit (cal / mol·K)
EXSY Exchange Spectroscopy (NMR)

xxxiv
h hour
IR infrared
ITC Isothermal Calorimetry
kd rate constant describing the departure of a guest molecule from a host
kf rate constant describing the entrance of a guest molecule into a host
krac rate constant describing the dynamic interconversion between the two
closed stats in molecular baskets presented in Chapter 3.
LAH lithium aluminum hydride
LDA lithium diisopropylamide
LFER linear free energy relationship
M moles per liter
m meter; multiplet (NMR)
MALDI matrix-assisted laser desorption/ionization
MD molecular dynamics
min minute
MMFF Merck Molecular Force Field
MS mass spectrometry
NOE Nuclear Overhauser Effect
NOESY Nuclear Overhauser Effect Spectroscopy
NMR nuclear magnetic resonance
OTf trifluoromethanesulfonate (triflate)
PC packing coefficient ([volume of guest / volume of host cavity] * 100)
PES potential energy surface

xxxv
PM3 parameterized model number 3
rds rate determining step
ROESY Rotating Frame Overhauser Effect Spectroscopy
s second; singlet (NMR)
t triplet (NMR)
t time
THF tetrahydrofuran
TFA trifluoroacetic acid
TLC thin-layer chromatography

1
Chapter 1: Molecular Baskets – Toward Functionalized Gated Artificial Host Systems
1.1 An Introduction to Gating
The control of the translocation of molecules is of significant importance to the
functioning of living organisms. Cell membranes, for example, regulate the kinetics of
molecules or ions passing in and out of the cell with respect to their size, shape, or
functionality.1-3
Likewise, access to an active site of an enzyme is often regulated by the
dynamic modulation of the entrance to its active site.4-6
Such processes, commonly
referred to as gating, are akin to a traffic gate opening and closing at a constant rate, thus
restricting how fast species may pass.
A particular example of an enzyme exhibiting gating is found in acetylcholinesterase
(AchE), which is capable of efficiently hydrolyzing acetylcholine (Ach).7 The X-ray
crystal structure of the enzyme reveals a 20 Å deep gorge leading to its active site8
whose access is regulated by five freely rotating aromatic rings which must reorientate
themselves to allow the entrance of a guest molecule. McCammon and coworkers
utilized molecular dynamics methods to ascertain the particular effects these gates have
on the uptake of Ach and whether they contribute to the efficiency by which the enzyme
operates.4,8
Thus, it was calculated that the probability of the gates being fully open to
allow the binding of Ach was small (2.4%). Despite this small fraction of time the gates

2
are open, however, the rate coefficient corresponding to the uptake of Ach was
surprisingly found to only decrease by roughly a factor of two (from 1.7 x 10⁹ M
-1s
-1 to
0.7 x 10⁹ M
-1s
-1). To account for this result, the authors suggested that the small
probability of the gorge’s open state is likely compensated by a fast transition between
the open and closed states. Worded differently, the gorge leading to the active site opens
quickly numerous times and, during a binding event, Ach would make repeated attempts
to enter until an attempt coincides with an opening, thus resulting in entry. Using a
similar model, it was found that a slightly bulkier substrate possessing an additional 0.4
Å3 volume would enter the active site at a rate three orders of magnitude less than Ach.
Thus, through the process of gating, AchE achieves a high degree of kinetic selectivity
among molecules of slightly different sizes without sacrificing much catalytic efficiency.
Prior to discussing the application of gating to artificial host systems, it is important
to discuss the concepts of constrictive binding energy and intrinsic binding energy, which
are fundamental to the field of host-guest chemistry. Intrinsic binding energy, equivalent
to a host-guest complex’s thermodynamic stability (ΔG°), arises from non-covalent
contacts between a host and guest (e.g. hydrogen bonding, electrostatics, C-H…
π
interactions) as well as desolvation effects. Constrictive binding energy,9 equivalent to
the energy required for guest entry (ΔG‡
f), includes the energy associated with physical
barriers such as dynamic appendages obstructing an entry or small openings in a host that
guest molecules must squeeze through prior to entry. Thus, the constrictive binding
energy can be seen primarily as the energy required for a host molecule to distort or
rearrange itself to make encapsulation possible and is intrinsically related to gating. The

3
energy for a guest molecule to leave (ΔG‡
d) is equivalent to the energy required to
overcome both the intrinsic and constrictive binding energies (ΔG° + ΔG‡
f) (Figure 1).
Figure 1: The Gibbs Free Energies associated with a host guest complex are the intrinsic
binding energy, equivalent to the thermodynamic stability of the complex (ΔG°), and
constrictive binding energy, equivalent to the energy required for guest entry (ΔG‡
f). The
sum of the magnitudes of intrinsic binding energy and constrictive binding energy is
equivalent to the energy required for guest departure (ΔG‡
d).
Similar to enzymes, artificial host molecules can also utilize gating by modulating
constrictive binding energy. The regulation of guest uptake and dissociation can be due
to dynamic structural units, but may also be imparted into hosts via molecules squeezing
through small windows (aperatures) between the interior cavity and bulk solvent. These

4
two methods of gating in artificial host systems were first recognized during the study of
hemicarcerand systems originally developed by Cram and co-workers.
In the 1980s, small molecules were trapped within host molecules derived from two
resorcinarene-based bowls connected by four aliphatic or aromatic chains called
carcerands.10
This irreversible encapsulation was achieved by synthesizing the complex
in the presence of excess guest molecules, which served to template the reaction. The
release of guest molecules to yield an empty host, however, was not observed even at
high temperatures. Presumably, guest exchange, whereby the guest leaves the host and
another guest or solvent molecule takes its place, is not possible unless the strong
covalent bonds holding the capsule together are ruptured (Figure 2A).11
Figure 2. A) Synthesis of a carcerand B) A hemicarcerand
The question that arises is how does one create a stable host-guest system, but still
allow the potential for guest exchange? Cram solved this problem by developing
hemicarcerands, or carcerands that either lack one of the four linkers or whose linkers are
elongated and conformationally flexible (Figure 1B).12
Thus, a variety of host-guest

5
complexes were synthesized by heating a solution of hemicarcerand in the presence of
excess guest molecules in a solvent whose volume is too large to occupy the interior. It is
important to note that encapsulation of guest molecules was not observed at room
temperature and thus, guest uptake is actually regulated by a barrier, termed constrictive
binding energy, which must be overcome if guest molecules are to enter, and
subsequently leave, the cavity of the hemicarcerand.9
Figure 3: A) Two chair-to-boat interconversions allow gating of guest molecules to
occur in hemicarcerands. B) Schematic representations of the French and sliding door
mechanisms for the exchange of guests to and from hemicarcerands.
What is the mechanism by which hemicarcerands regulate the guest exchange?
Houk and co-workers researched this by performing a series of molecular dynamics
calculations on a hemicarcerand with a series of guest molecules to determine the
activation energies associated with their encapsulation and departure.13
Of interest were
two intrahemispheric OCH2O linkages in the hemicarcerand changing from the chair
conformer to the boat form (Figure 3A), which was estimated to be 17.5 kcal mol-1
.
When the facing OCH2O units block guest molecules DMF and DMA from departing the

6
hemicarerand, the activation barrier was computed to be 60.5 and 55.4 kcal mol-1
,
respectively. Opening the OCH2O gates, however, caused the overall barrier to drop to
32.4 kcal mol-1
for DMF and 27.7 kcal mol-1
for DMA, which was comparable to the
experimentally measured activation energies. Thus, it was concluded that the guest
exchange process is mediated by the constrictive binding energy imparted by the OCH2O
gates operating in what was defined as a French door mechanism. Additional constrictive
binding energy is provided by the host slightly distorting to dilate the resulting aperture
upon encapsulation in a sliding door mechanism (Figure 3B).13
Figure 4: A) Chemical structure of a self-folding cavitand. B) Upon heating, the
cavitand interconverts between the “vase” conformer (left) and “kite” conformer (right).
Guest exchange is only observed in the kite conformation.
Guest exchange resulting from conformational change is not required to arise from a
subunit as is the case of hemicarcerands, but can also arise from the dynamics of the
entire system. For example, Rebek and co-workers have synthesized a resorcorcinarene-
derived cavitand that possesses eight amido groups tethered to the periphery (Figure
4A).14
When these groups associate via hydrogen bonding, the cavitand will fold from a

7
flat “kite” conformation into a bowl-shaped “vase” conformation possessing a deep-
cavity to accommodate appropriately sized guest molecules (Figure 4B).14,15
During a
typical encapsulation experiment, the host is mixed with a guest molecule, such as
adamantane, using a bulky solvent (p-xylene). As was the case with hemicarcerands, the
choice of a bulky solvent is important because its large size makes it unfavorable toward
encapsulation (the hypothetical host-solvent complex would possess low intrinsic binding
energy), thus preventing a competing host-solvent exchange equilibrium when a more
desirable guest is added.
Strikingly, the activation energy of folding/unfolding (ΔG‡ = 17.4 ± 0.5 kcal/mol,
295 K) and the activation energy required for adamantane to depart the host (ΔG‡
d = 16.9
± 0.4 kcal/mol, 295 K) are very similar. To explain this, one must take into account the
likely mechanism of the guest exchange by which the cavitand must first unfold into the
kite structure before guest exchange is possible (Figure 4B). While exchange should be
hypothetical possible while in the vase conformation, such a process would lead to a
desolvated host and is energetically costly. Clearly, the dynamics associated with the
formation/deformation of the cavity itself is controlling the rate of guest self-
exchange.15,16
Although inherit control of guest exchange has been observed in hemicarcerands,
cavitands, and many other diverse hosts, the full utilization of gating in artificial systems
to impart the unique properties found in enzymes (control of reaction rate, kinetic
selectivity based on size/shape) is yet to be realized. Given the unique nature of reactions
that can be performed within a confined environment (presented in the next section),

8
development of gating in artificial hosts offers the potential for the creation of
sophisticated supramolecular catalysts with a greater degree of efficiency and selectivity.
1.2 Artificial Host Systems as Molecular Reactors
Among their unique features, artificial host molecules achieve a separation between
its interior and the external environment and thus, guest molecules will experience a
different local environment as compared to the outside bulk solvent.17
Reactions that
occur inside may be accelerated in some cases or they may yield products of different
regiochemistry than expected.
Figure 5: Schematic representation of a tetrahedral M4L6 capsule
An example of a host molecule catalyzing reactions is found in the metal
coordination complexes developed by Raymond, Bergman, and co-workers. These
tetrahedral capsules (M4L6) contain metal cations (M = AlIII
, GaIII
, InIII
, TiIV
, GeIV
, FeIII
at
its corners and bis-catechol ligands at the sides (L = N,N’-bis(2,3-dihydroxybenzoyl)-1,5-

9
diaminonapthalene) (Figure 5).18
In this system, it was found that the guest exchange is
mediated by slippage, akin to the sliding door mechanism in Figure 3B, whereby the
apertures are dilated by distortions in the ligand conformations around the capsule, which
allow the guest to squeeze through to enter/depart the host.19
These anionic water-soluble capsules provide an interior with a relatively high charge
density. Thus small positively charged organic molecules were found to possess a high
affinity for their interior, both due to electrostatic interactions and the hydrophobic effect.
This selectivity in encapsulation was utilized in the catalyzed hydrolysis of acetals with
capsule 1 (M = GaIII
) under conditions where normally the reaction would not occur
(basic aqueous solution, pH = 10) due to the fact that the capsule stabilizes the positively
charged intermediates formed throughout the course of the reaction (Figure 6).
Interestingly, negative entropy of activation and an inverse secondary kinetic isotope
effect with regard to the guest molecule was observed. Thus, it was rationalized that the
rate determining step is not the initial protonation of the acetal, but rather a nucleophilic
attack of water inside of the host.20

10
Figure 6: Proposed mechanism for catalyzed hydrolysis of acetals with 1
As aforementioned, host molecules may also impart unusual regioselectivity in
chemical reactions. For example, Fujita and co-workers developed a self-assembled
metal-ligand architecture 2, or molecular cage, which self-assembles in water and
encapsulates a wide variety of organic molecules (Figure 7).21
Diels-Alder reactions
were found to be catalyzed within the interior due to the dramatic increase in the effective
concentration, i.e. two reactant molecules inside will collide much more frequently than
those solvated outside, which are separated by solvent molecules, and are thus more
likely to react.22

11
Figure 7: Schematic representation of molecular cage 2
Interestingly, when Diels-Alder reactions were performed between anthracene
derivative 3 and maleimide 4 inside 2, the addition takes place at the 1,4 position of the
terminal benzene ring of anthracene giving 5 (Figure 8).23
If the reaction was run with
the same reactants without the presence of 2, it would result in the addition at the more
electron-rich 9,10 position, resulting in the otherwise expected Diels-Alder adduct 6. The
unusual regioselectivity inside of the host can be attributed as a consequence of the early
transition state of the Diels-Alder reaction: the reactant molecules fit inside the container
is such a way that the double bond of 4 will not interact with the 9,10 carbons of the
anthracene.23

12
Figure 8: Diels-Alder reaction between anthracene 3 and maleimide 4
In summary, the inner space of artificial host molecules provides an isolated local
environment that can alter various aspects of a reaction such as regiochemistry, reaction
conditions, and reaction rates. At the heart of enzymatic rate acceleration is Menger’s
spatiotemporal postulate: the longer two reactants reside within a critical distance, the
greater the rate of reaction between the two.24,25
By utilizing gating in artificial host
systems, control over the period of time molecules are in close proximity to one another
can be achieved and thus, as was seen in the case of Diels-Alder reactions within Fujita’s
molecular cage, rates can be accelerated.22
In the enzyme acetylcholinesterase, it was
calculated that gating also greatly increases the kinetics selectivity of encapsulation
without sacrificing much catalytic efficiency.8 The prospect of tailoring gated host
molecules to serve as reactors with the purpose of selectively and efficiently obtaining
desireable molecules under mild conditions that would otherwise be difficult or
impossible to synthesize is an attractive one. Research into the incorporation and
utilization of gating within the context of artificial hosts, however, has been lacking.
With the goal of implementing the full potential of gating into functionalized artificial
hosts, the Badjic group has designed, synthesized and studied artificial host molecules
called molecular baskets, which allowed for the study of the fundamental aspects.

13
1.3 Design and Synthesis of a Molecular Basket
The structure of a molecular basket can be divided into three segments: a syn tris-
norbornene concave scaffold that provides a cavity for the encapsulation of guest,
phthalimide-like arms that act as walls for the cavity, and customizable gates that are
envisioned to rotate about a CH2 hinge to effectively regulate the guest traffic going into
and out of the cavity (Figure 9).26
Figure 9: Molecular structure of a molecular basket (left) and a x-ray crystal structure of
a molecular basket with benzyl gates encapsulating a molecule of chloroform (right).
Reprinted with permission from J. Am. Chem. Soc. 2006, 128, 5887 – 5894. Copyright
2006 American Chemical Society.
The common precursor to all molecular baskets thus far is the tris-anhydride 7,
which allows the condensation of a variety of gates with amino functionalities. The
current synthesis of 7 (Figure 10) first involves a Diels-Alder reaction between cis-1,4-

14
dichlorobutene and cyclopentadiene to form norbornene 8. Free radical bromination with
bromine in nonane at high temperature furnishes 9, which is then dehydrohalogenated
with an excess of potassium t-butoxide to obtain tri-alkene 10. Another Diels-Alder
reaction is performed with DMAD to afford 11 after aromatization with DDQ. The
resulting product is then stannylated by deprotonation with LDA and reacting the
corresponding anion with trimethyltin chloride to yield 12, which is then cyclotrimerized
with copper(II) nitrate27-31
to afford hexaester 13. The hexaester is saponificated with
lithium hydroxide and acidified to obtain hexacid 14, which is then dehydrated with hot
acetic anhydride to give tris-anhydride 7.26,32

15
Figure 10: Synthesis of tris-anhydride 7. Conditions: a) heavy wall sealed vessel, 180oC
b) Br2, 150oC c) excess potassium t-butoxide, 0
oC d) DMAD, 120
oC e) DDQ f) LDA,
-78oC g) SnMe3Cl, warm to rt h) Cu(NO3)2·2.5H2O, 50
oC i) LiOH, 80
oC j) 10% HCl k)
acetic anhydride, 150oC
With a scaffold by which gates can be tethered to by condensation with amines, our
group focused their efforts on designing gates which can associate with one another to
transiently close the system and thus mimic the gates found in enzymes. One of the first

16
such baskets was one which possessed phenol gates (Figure 9) whereby it was envisioned
that folding would be induced by the formation of three intramolecular hydrogen bonds.26
Indeed, based on ab initio calculations and experimental data obtained by infrared
spectroscopy, it was found that the conformer in which all three gates associate to fully
close the basket to be prevalent. Unfortunately, guest molecules that were envisioned to
effectively fill the cavity such as chloroform were not observed to occupy the interior
using low temperature NMR spectroscopy. Evidently, even though the lowest energy
closed-basket conformation dominates the conformational equilibrium, the gates were
still too dynamic, i.e. they possessed numerous degrees of freedom by which to rotate,
resulting ultimately in a poorly defined cavity for guest molecules to occupy for long
periods of time.26
Utilization of NMR spectroscopy is a powerful in the study of host-guest complexes
and we envisioned that kinetic measurements by NMR would be crucial for studying the
gating phenomenon. Thus, we set out to synthesize gates that would not only have strong
intramolecular interactions to heavily favor a closed conformation, but would also have
constraints on their dynamics. It was postulated that the interior cavity of such a system
would be better preorganized and the resulting kinetic stability of the resulting host-guest
complexes would be increased. The successful gates we have found to accomplish these
methods can be divided according to their method of folding: either by metal-chelation or
intramolecular hydrogen bonding.

17
1.4 Chapter 1 Summary and Conclusions
Gating is widely seen in nature. Among the advantages imparted is the ability to
significantly enhance kinetic selectivity of molecules of varying size and shape while still
maintaining catalytic efficiency, as observed in enymes such as acetylcholinesterase. In
artificial systems, gating also presents itself as a means of controlling the guest exchange
in host-guest complexes, as observed in Cram’s hemicarcerand host systems using
molecular dynamics calculations by Houk and co-workers. A full utilization of gating in
artificial systems offers the potential of regulating the traffic of guest molecules,
controlling the kinetic stability of encapsulation complexes, and imposing kinetic
selectivity among guest molecules of varying size and shape.
Artificial host systems can also serve as molecular reactors whereby reactions can
differ in regiochemistry, reaction conditions, and/or rate with respect to the external bulk
solvent, primarily due to the isolated local environment within the capsule that differs
from the external environment found in the bulk solvent. The prospect of tailoring host
molecules to serve as reactors with the purpose of selectively and efficiently obtaining
molecules that would otherwise be difficult or impossible to synthesize is an attractive
one and gating could play a crucial role. Its full implementation into artificial systems
remains elusive, however, primarily due to a deficiency of knowledge regarding its
incorporation into hosts and the quantitative relationships governing the process.
Thus, our group has synthesized a family of host molecules, named molecular
baskets, which possesses a cavity formed by a tris-norbornene scaffold and phthalimide-

18
like arms. The precursor to any molecular basket is tris-anhydride 7 to which gates are
tethered via condensation reactions with amines. Our initial attempts at synthesizing
gated molecular baskets involved the use of phenol gates. The corresponding basket was
found to heavily favor the closed conformation, however, host-guest complexes were not
observed with low-temperature NMR leading to the conclusion that the gates’ dynamics
substantially lowered the complex’s kinetic stability. We have successfully solved the
problem by utilizing gates, which will be presented in the next few chapters, that heavily
favor the closed conformer and whose dynamics are minimized while closed.

19
Chapter 2: Molecular Baskets Folded by Metal-Chelation
2.1 Introduction: Pyridyl Gated Molecular Baskets and Their Chelation to Ag(I)
Figure 11: Synthesis of pyridyl gated baskets 15, 16, and 17
One method we envisioned to heavily favor a closed position in molecular baskets
while substantially lowering the corresponding gate dynamics was to utilize metal-
chelation instead of hydrogen bonding as the means of folding. Thus, we synthesized a
series of pyridyl molecular baskets (Figure 11) which we envisioned would chelate to
transition metal cations such as Ag(I) and Cu(I) resulting in the basket closing and
creating a preorganized cavity for guest molecules to occupy.33,34
An advantage of this
system is that a host-guest complex can potentially be further stabilized by the addition of
a small chelating molecule as a guest, which will act as a fourth ligand while residing in

20
the interior. The Badjic group has previously explored how these systems respond to
Ag(I) and the results of these studies will be presented briefly in this section.
Addition of AgOTf to a 1:1 CDCl3:CD3OD solution of basket 15 resulted in
negligible changes in the 1H NMR chemical shifts of the basket. Interestingly however,
the resonances corresponding to the protons of the gates broadened considerably which is
indicative of aggregate formation whereby the gates of the basket are present in a wide
variety of spatial orientations that interconvert at a fast rate relative to the NMR
timescale.34
Figure 12: A series of 1H NMR spectra (500 MHz, 298 K, 1:1 CDCl3:CD3OD) of a
solution of 16 (5.4 mM) recorded after addition of a 124.0 mM standard of AgOTf (1:1
CDCl3:CD3OD). Reprinted from “A Close Inspection of Ag(I) coordination to molecular
baskets. A study of salvation and guest encapsulation in solution and the solid state”
Tetrahedron, 2009, 65, 7213 – 7219, with permission from Elsevier.
Basket 16 showed more promising results, in that the addition of AgOTf resulted in
considerable changes in the 1H NMR chemical shifts in 1:1 CDCl3:CD3OD (Figure 12)

21
indicating the basket is indeed interacting with silver and there exists a fast rate of
exchange between the silver-bound basket and silver-free basket. After one equivalent of
silver, no further alterations were observed in the spectrum indicating the formation of a
1:1 complex. The proposed was verified by measuring the hydrodynamic radius using 1H
DOSY35,36
, which gave a value consistent with a non-aggregating system (7.4 ± 0.2 Å).
Through use of ITC, the binding constant, Ka, was found to be high (1.9 ± 0.3 x 10⁵ M
-1)
and, interestingly, the complexation was found to be entropically driven (ΔH° = 3.0 ± 0.1
kcal / mol ; ΔS° = 34.0 eu).33
Figure 13: Energy minimized (DFT, BP86) conformations of Ag(I):16 complexes. The
calculated potential energy diagram for the interconversion of dynamic enantiomers 16a
and 16b via synchronized rotation of pyridine flaps about their N-C-C-C dihedral angle.
Reprinted with permission from Org. Lett. 2007, 9, 2301 - 2304. Copyright 2007
American Chemical Society.

22
Through use of density functional theory (DFT, BP86 functional) calculations, the
optimized geometry of 16 bound to Ag(I) shows that the three pyridine gates are twisted
with a propeller-like geometry, with either a P or M sense of twist (Figure 13). The
activation barrier for the interconversion between these two dynamic enantiomers (16a
and 16b) was calculated to be 2.7 kcal/mol. This low energy value was consistent with
experimental data, whereby no decoalescence of the 1H NMR signal corresponding to the
CH2 hinge (protons He/Hf) was observed at low temperature (200 K).33
Figure 14: The energy-minimized structures (DFT, BP86) of Ag(I):16, 17a, and 17b.
Reprinted from “A Close Inspection of Ag(I) coordination to molecular baskets. A study
of salvation and guest encapsulation in solution and the solid state” Tetrahedron, 2009,
65, 7213 – 7219, with permission from Elsevier.
Upon addition of Ag(I) to 17, significant changes in chemical shift in the 1H NMR
spectra is again observed. These changes ceased to occur beyond one equivalent of
Ag(I), suggesting the formation of a 1:1 complex. Interestingly, the resonance

23
corresponding to the bridge protons of the scaffold decoalesces from a singlet to an AB
quartet upon complexation, which may be interpreted as the scaffold rigidifying once
Ag(I) is bound. DFT calculations of the silver complex suggested the presence of two
achiral confirmations: 17a and 17b (Figure 14). In contrast to Ag(I):16, the process of
silver binding to 17 was found to be enthalpically driven through use of ITC (ΔH° = -
13.2 ± 0.8 kcal / mol ; ΔS° = -20 eu). This discrepancy can be rationalized by comparing
the structures of each molecular basket complexed with Ag(I) (Figure 14). In the case of
17a and 17b, the silver is toward the edge of the outer-rim of the basket and is thus more
susceptible to solvation, which is consistent with a negative folding entropy. For 16a and
16b, the silver is more buried within the interior of the basket and thus, solvent molecules
are less capable of approaching the cation. Therefore, in the assembly process, solvent
molecules are released thus yielding a positive change in entropy upon folding.34
By using pyridinyl gates, molecular baskets 16 and 17 were able to fold and
effectively close via metal-coordination upon addition of Ag(I). This resulted in a less
dynamic host compared to that with phenol gates, although the pyridine rings on the gates
still maintained the ability to rotate based on DFT calculations. In an effort to observe a
host guest complex, a variety of small chelating molecules such as acetonitrile, methyl
isocyanide, and imdazole were mixed in various proportions with Ag(I):16.
Unfortunately, none were found to occupy the interior and the stronger chelators
(isocyanides, imidazoles, and amines) were found to favor the removal Ag(I) from the
basket, rather than encapsulation.

24
2.2 Chelation to Cu(I) and Encapsulation of Acetonitrile
Reproduced in part with permission from Rieth, S.; Yan, Z.; Xia, S.; Gardlik, M.; Chow,
A.; Fraenkel, G.; Hadad, C. M. and Badjic, J. D. J. Org. Chem. 2008, 73, 5100 – 5109.
Copyright 2008 American Chemical Society.
We postulated that using a different transition metal other than Ag(I) may possibly
yield stable host-guest complexes. Upon addition of Cu(CH3CN)4PF6 to a solution of
basket 16 in 5:3 acetone-d6:chloroform-d, dramatic changes in the 1H NMR chemical
shifts corresponding to the scaffold and gates were observed (Figure 15). All of the
spectroscopic changes occurred before one equivalent was added; afterwards, no
significant changes were observed, thus suggesting the formation of a 1:1 complex 18. It
should be noted that we did not observe a new set of resonances appear upon the initial
addition of Cu(I), but rather the resonances corresponding to 16 shifted toward the
positions corresponding to 18 until one equivalent was added. As was previously seen
with silver, apparently Cu(I) is exchanged quickly between 16 and 18 relative to the
NMR timescale resulting in the average chemical shift between each proton involved in
the exchange to be observed. However, in contrast to the addition of Ag(I) (See Figure
12), we found that the signals corresponding to the gates significantly broaden upon
addition of Cu(I) and would not re-sharpen until the host is saturated. Thus, relative to
the NMR timescale, it appears the exchange rate of Ag(I) between baskets 16 and
Ag(I):16 is faster than that of Cu(I) between 16 and 18, suggesting that the Cu(I)-basket
complex possesses greater kinetic stability toward other ligands dissociating the metal.

25
Figure 15: A) A series of 1H NMR spectra (400 MHz, 300 K, 5:3 acetone-d6:chloroform-
d) of a solution of 16 (2.60 mM) recorded after the gradual addition of a 53.0 mM
solution of Cu(CH3CN)4PF6 B) A nonlinear curve fitting of the 1H NMR chemical shifts
of the Ha/Hc/Hd resonances to a 1:1 equilibrium model.
The formation of a 1:1 complex was verified through use of MALDI mass
spectrometry (Figure 16A).37,38
An evaluation of the binding constant, Ka, through use of
a nonlinear curve fitting of the 1H NMR chemical shifts (Figure 15B)
39,40 and ITC (Figure
16B) showed that the basket possesses a high affinity for Cu(I) (1.8 x 10⁵ M
-1 and 1.7 ±
0.1 x 10⁵ M
-1 respectively). In contrast to Ag(I), the binding of Cu(I) to 16 is
enthalpically driven (ΔH° = -7.2 ± 0.1 kcal / mol ; ΔS° = -0.25 eu). This can possibly be
due to the inherit size difference between Ag(I) (1.29 Å) and Cu (0.8 Å), but caution
should be exercised when directly comparing the values of these two systems due to the
measurements taking place in different solvents (acetonitrile for Cu(I) and 1:1
CHCl3:MeOH for Ag(I)).

26
Figure 16: A) Low resolution MALDI-TOF mass spectrum of an equimolar mixture of 16
and Cu(CH3CN)4PF6, with a major signal at m/z = 963.14 amu, corresponding to the
[18]+ cation. B) Isothermal calorimetry data for the incremental addition of a 1.00 mM
standard solution of Cu(CH3CN)4PF6 to a 0.10 mM solution of 16 in CH3CN under an
atmosphere of nitrogen.
A variable temperature 1H NMR study was conducted on an equimolar solution of 16
and Cu(CH3CN)PF6 and a decoalescence of signals was observed at 248.1 K resulting in
two sets of peaks, which we later found corresponded to two C3 symmetrical baskets 18a
and 18b, whose ratio changes with temperature (Figure 17). Furthermore, an upfield
singlet (-1.7 ppm) is observed corresponding to a guest molecule residing within the
interior of one of the baskets due to the imposed diamagnetic anisotropy of the four
benzene rings surrounding the cavity. Upon integration of all of the signals, it was clear
that one basket, herein defined as 18b, encapsulated the guest molecule, which possessed
three protons. It was deduced that the likely guest molecule was acetonitrile, given its
size, shape, and coordinating properties. To verify this hypothesis, we performed a
similar variable temperature experiment using deuterated acetonitrile as the solvent. In
this experiment, the same signal splitting is observed, thus showing the formation of 18a

27
and 18b. However, no upfield signal is observed, thus verifying acetonitrile is indeed the
guest.
Figure 17: Variable temperature 1H NMR spectra (400 MHz, 5:3 acetone:d6:chloroform-
d) of an equimolar solution of 16 and Cu(CH3CN)4PF6 (3.20 mM)

28
Figure 18: A) 1H NMR spectroscopic assignment of Cu(I)-folded molecular baskets 18a
(blue) and 18b (red). The corresponding ROESY assignments are marked with green
arrows. B) Selected regions of a 1H-
1H COSY spectrum (400 MHz, 5:3 acetone-
d6:chloroform-d, 190 K) of a 2.60 mM solution of 18a/b. C) Selected regions of a 1H-
1H
ROESY spectrum (400 MHz, 5:3 acetone-d6:chloroform-d, 190K) of a 2.60 mM solution
of 18a/b.
In an effort to fully assign the 1H NMR resonances for 18a and 18b,
1H-
1H COSY and
1H-
1H ROESY were performed at low temperature (190 K, Figure 18). The COSY
spectrum revealed J-coupling between the signals corresponding to pyridine protons Ha,
Hb, and Hc as well as between the bridge and bridgehead protons Hh and Hi/j. Utilizing
this information, we assigned each proton resonance for both molecular baskets (See

29
Figure 18A). Further characterization with the ROESY spectrum revealed cross-peaks
resulting from the magnetization transfer through space unsurprisingly between bridge
and bridgehead protons Hh and Hi/j and between bridgehead Hh and aryl proton Hg.
Interestingly, another cross-peak is observed between hinge protons He/f and pyridine
proton Hd in basket 18b, but not 18a. A more dynamic system in the absence of
acetonitrile would result in a substantial drop in the NOE cross-peak, which may explain
this observation.
Also of note are the chemical shifts of pyridine protons Ha and Hb. The Ha resonance
in 18b experiences a considerable upper-field shift of 0.40 ppm with respect to the same
proton in 18a. This can be interpreted as the pyridine flaps in 18b being positioned
further into the cavity, and hence the shielding region, due to the coordination of
acetonitrile. As a consequence, Hd must assume a position in between the hinge protons
He/f, whereby a magnetization transfer through space is facilitated. In contrast, Ha must
be more remotely positioned with respect to the basket’s interior. Thus, the structure of
18a is likely to resemble basket 16 coordinated to Ag(I) (See Figure 13).

30
Figure 19: A) Selected regions of 1H NMR spectra (400 MHz, 5:3 acetone-
d6:chloroform-d, 300 K) of a solution of a) Cu(CH3CN)4PF6 (3.20 mM), b) CH3CN (12.8
mM), and c) 18a/b (3.20 mM). B) 1H NMR chemical shifts for the methyl group in
acetonitrile (400 MHz, 5:3 acetone-d6:chloroform-d) as a function of temperature: () a
solution of acetonitrile (12.8 mM), and () a solution of 18a/b (3.20 mM).
On the basis of our experiments, it is evident that 18b consists of a tetracoordinate
Cu(I) with a molecule of acetonitrile in the interior. The question that soon arises,
however, is what is the nature of Cu(I) in 18a? That is to say, is a molecule of acetonitrile
coordinated to Cu(I) located outside of the cavity in 18a or are the pyridine gates aligned
around Cu(I) in a trigonal-planar fashion? The CH3 protons of acetonitrile in
Cu(CH3CN)4PF6 and completely metal free acetonitrile resonate at 2.16 and 2.01 ppm
(300 K, 5:3 acetone-d6:chloroform-d) respectively. At 300 K, the 1H NMR spectrum of
18a/b revealed a broad methyl signal at 1.98 ppm, indicating an intermediate
interconversion rate between free and encapsulated acetonitrile (Figure 19A). When the
solution is cooled and the interconversion between free and encapsulated acetonitrile
becomes slow (below 248 K), the remaining acetonitrile 1H NMR signal became identical

31
to that of free acetonitrile (Figure 19B), thus showing 18a to be a tricoordinated Cu(I)
complex and verifying the equilibrium presented in Figure 18A. This equilibrium is
further verified by running a variable temperature NMR with an excess (50.0 equivalents)
of acetonitrile, which resulted in 18b exclusively in accordance with Le Chatelier’s
Principle (Figure 20).
Figure 20: Variable temperature 1H NMR spectra (400 MHz, 5:3 acetone-d6:chloroform-
d) of a 2.60 mM solution of 16 with 53.0 eq of acetonitrile showing the exclusive
formation of 18b.
With experimental evidence as to the structures of 18a and 18b, we collaborated with
the Hadad group to further investigate these structures and the underlying mechanistic
details for their interconversion. Thus, utilizing DFT methods and the BP86
functional,41,42
it was revealed that 18b is more stable than 18a by -11.0 kcal/mol (ΔE). If
one presumes that acetonitrile replaces that of a coordinating solvent molecule (e.g.

32
acetone) on the outside of the basket, then this number is increased to -3.5 kcal/mol, with
18b still being more thermodynamically stable. Furthermore, it was revealed that both
18b and 18a are helically twisted as was seen with Ag(I):16 and can be arranged in an M
or P orientation. As was suggested by experimental evidence, the complexation of
acetonitrile in 18b resulted in the relocation of Cu(I) to a deeper position within the cavity
of the assembly. Interestingly, it was also found that the barrier for interconversion
between the M and P forms via synchronized rotation of the pyridine flaps about their N-
C-C-C dihedral angle for each basket to be relatively small (1.65 kcal/mol for 18b and
4.52 kcal/mol for 18a; Figure 21), which is consistent with the observation of a singlet for
He/f in the 1H NMR spectra rather than an AB quartet.

33
Figure 21: Energy minimized (DFT, BP86) conformations of 18a and 18b. Synchronized
rotation of the pyridine flaps about their N-C-C-C dihedral angle (α) was calculated to
require 4.52 and 1.65 kcal/mol in 18a and 18b respectively.
With evidence of the inner workings of the interconversion of baskets 18a and 18b,
we focused our efforts on trying to determine the likely mechanism by which acetonitrile
enters the basket to form 18b. An integration analysis of our initial variable temperature
experiment (Figure 17) yielded equilibrium association constants, Ka, over a wide range

34
of temperatures. By plotting the natural logarithm of each value of Ka vs. their
corresponding inverse temperatures, a van’t Hoff plot was generated (Figure 22) whereby
the slope and intercept yielded thermodynamic parameters (ΔH° = -3.3 ± 0.1 kcal/mol ;
ΔS° = -6.9 ± 0.4 e.u.).
Figure 22: A) Van’t Hoff plot and B) the thermodynamic parameters for the 18a/b
interconversion
The binding of acetonitrile within the basket is strongly driven by enthalpy. The
negative value of ΔH° can be rationalized by the formation of an additional metal-to-
ligand bond relative to tricoordinate basket 18a. Importantly, the value of -3.3 kcal/mol is
comparable to that obtained by theoretical methods (-3.5 kcal/mol; see page 31). The
observed loss in entropy is congruent with the immobilization of acetonitrile inside of the
basket and the release of a loosely bound encapsulated solvent molecule.

35
Figure 23: A) Eyring plot and B) activation parameters for the 18a/b interconversion. C)
Experimental and simulated (Maple 11) signals for the Hb protons in 18b and 18a,
respectively. Apparent second- and first- order (k1 and k-1) rate constants for the 18a/b
interconversion at different temperatures.
Proton Hb for both compounds 18a and 18b in the 1H NMR spectrum should consist
of a 1:1 doublet due to coupling to a neighboring proton Hc. With increasing temperature
the two doublets progressively average to a singly doublet (see Figure 17). Clearly, this
is a result of a fast equilibrium exchange process whose rate lies on the NMR timescale.
Thus, we performed a complete band-shape analysis to obtain apparent rate constants
k1/k-1 which describe the process by which acetonitrile enters and leaves the basket
respectively.43-47
The significantly broadened Hb resonance in 18a (Figure 23C), likely
due to the relatively higher dynamics associated with this system, was accounted for.
With apparent rate constants k1/k-1 for a range of temperatures in hand, we were able to

36
obtain the activation parameters (ΔH‡ = 6.5 ± 0.5 kcal/mol; ΔS
‡ = -20 ± 2 e.u.) describing
the dynamic 18a/b equilibrium through use of an Eyring plot (Figure 23A/B). The large
decrease in entropy associated with the transition state is in agreement with a mechanism
whereby a molecule of acetonitrile combines with the basket in the reaction’s rate-
determining step.
Figure 24: A) Gated and B) slippage-based mechanisms for the 18a/b interconversion
have been proposed, and further assessed by DFT (BP86) calculations.
What is the mechanism of the interconversion between 18a and 18b? Two
mechanisms, one of which involves the gates playing an active role in the uptake of
acetonitrile and one where they do not, can be envisioned (Figure 24). In the first
mechanism, acetonitrile first coordinates to Cu(I) outside of the molecular basket. One
pyridine gate will then dissociate resulting in a tri-coordinated Cu(I) complex and a

37
sizeable aperature for acetonitrile to enter the cavity before the cavity is sealed again
upon association of the pyridine gate. If this mechanism were operating, the system
would be gated in the sense that the energy required for dissociation of one gate would be
equivalent to the constrictive binding energy required for guest entry. Thus, modifying
the energy of dissociation by changing the electronic characteristics of the pyridine would
offer the ability to control the rates of encapsulation. The second plausible mechanism is
one whereby acetonitrile would squeeze through the aperatures present without the
dissociation of a gate. Such a pathway would require the dilation of the narrow aperature
and thus some conformation strain, akin to the sliding doors mechanism presented in
Section 1.1.
Experimental and theoretical evidence is in favor of the second mechanism. There is
little evidence of the outer coordination of acetonitrile and, based on DFT calculations,
the energy required for dissociation of a pyridine unit coordinated to Cu(I) and
internalization of the acetonitrile guest requires at least 10.3 kcal/mol. This value is
considerably different from the experimental value of ΔH‡ = 6.5 kcal/mol. Furthermore,
gas-induced dissociation experiments by Rodgers and co-workers revealed that the bond
dissociation energy (ΔH°, 0 K) for the removal of one pyridine unit from the
Cu+(pyridine)3 complex to be on the order of 20 kcal/mol.
47,48 For the second
mechanism, DFT calculations (BP86) probing the energy required for passage of
acetonitrile through one of the side apertures revealed that it requires roughly 5 kcal/mol
to drive the methyl group through without a considerable coordination-bond rupture to

38
Cu(I). This energy barrier is in better agreement with our experimentally measured value
and thus, it is believed that this mechanism is operating.
2.3 Other Encapsulation Attempts in the Cu(I)-Bound Molecular Basket
By knowing that the likely mechanism is one whereby acetonitrile enters the basket
through one of the side aperatures in 18a, the constrictive binding energy (equivalent to
ΔG‡
f ; see Figure 1) for this system can then be defined as the energy required for a guest
molecule to squeeze through a dilated aperature to enter the system (sliding door
mechanism). Thus, it is envisioned that the rate of encapsulation entering and leaving the
capsule will vary considerably with minor changes in size of the guest. Furthermore, the
intrinsic binding energy (ΔG°) would vary considerably depending on how strong the
guest coordinates to Cu(I). In order to probe the interplay between these factors in 18a,
we attempted to encapsulate a variety of small coordinating guest molecules.
The preparation of 18a, however, requires the use of Cu(CH3CN)4PF6, which will
inherently add four equivalents of the undesired guest acetonitrile upon addition of one
equivalent of copper. This problem was circumvented by first preparing a 1:1 mixture of
basket 16 and Cu(CH3CN)4PF6 in degassed 5:3 acetone:chloroform and subsequently
evaporating the solvent in vacuo under an atmosphere of nitrogen. The resulting solid
was then redissolved in degassed 5:3 acetone:chloroform and evaporated once more
before being dissolved in degassed 5:3 acetone-d6:chloroform-d for any NMR studies.

39
Variable temperature NMR of this solution revealed the exclusive presence of 18a with
no acetonitrile present (Figure 25).
Figure 25: Variable temperature NMR (400 MHz) of a 1.66 mM solution of 18a in 5:3
acetone-d6:chloroform-d obtained after several evaporation/redissolving cycles under
nitrogen to remove acetonitrile (see text for details).
To assess the propensity of basket 18a to encapsulate guest molecules 19-26, a small
amount of guest (1.0 – 2.0 molar equivalents) was first added to a 3.4 mM solution of 18a
in 5:3 acetone-d6:chloroform-d. 1H NMR spectra were acquired at low temperature (200
K > T > 300 K) to monitor any changes in the chemical shifts of the basket as well as to
observe any potential upfield signals associated with an encapsulated guest molecule (> 0

40
ppm). If no encapsulation event was observed, the experiment was repeated with a
higher concentration of guest (~ 50 molar equivalents).
Table 1: Encapsulation of guest molecules by 18a in 5:3 acetone-d6:chloroform-d. Potential Guest Structure Volume (Å
3) Result
- CH3CN 53.2 Encapsulation
19 CH3CH2CN 71.5 No Encapsulation Observed
20 ClCH2CN 67.0 No Encapsulation Observed
21 FCH2CN 58.1 No Encapsulation Observed
22 CH2CHCN 68.6 No Encapsulation Observed
23 CH3NC 58.9 Encapsulation
24 CH3CH2NC 77.5 Disassociates Cu(I) From Basket
25 CH3NH2 43.9 Disassociates Cu(I) From Basket
26 NH2CN 46.1 Disassociates Cu(I) From Basket
The first series of guests we trialed were ones who possess a larger volume than
acetonitrile. Propionitrile 19 and chloroacetonitrile 20 were both found not to interact
considerably with 18a. With either high or low concentrations of guest, no change in the
basket 1H NMR chemical shifts were observed. Interestingly, the same result was found
for fluoroacetonitrile 21, whose volume is only 5 Å3 larger than acetonitrile. Besides the
ability to squeeze through the side aperature of the basket, the other factors to consider
with regards to the coordination/encapsulation of guest molecules is how the molecule
may fit inside of the host and how strong it will coordinate to Cu(I). By examining the
CPK model of the resulting host-guest complex with fluoroacetonitrile, it is clear that the
van der Waal’s radii of the fluorine atom of the guest and the aryl ring on the sides of the
host will be very close to one another. Also of note is that the fluorine atom will
withdraw electron density away from the nitrile group and thus, fluoroacetonitrile will

41
coordinate weaker to Cu(I) with respect to acetonitrile. Likely, one of these factors, or a
combination of both, is the reason why no host-guest complex was observed.
Figure 26: Variable temperature 1H NMR spectra (400 MHz, 5:3 acetone-d6:chloroform-
d) of a 1.94 mM solution of 18a with 1.20 eq of CH3NC.
Since it appeared that nitriles bulkier than acetonitrile will not form stable host-guest
complexes, we focused our efforts on small guests who are able to coordinate to Cu(I)
strongly. Our first choice was acetonitrile’s constitutional isomer, methyl isocyanide 23.
Unsurprisingly, 23 was encapsulated within 18a with an even greater affinity then that
observed for acetonitrile (Ka,23,238 K = 7.5 x 10³ M
-1 ; Ka,CH3CN,238 K = 34 M
-1)(Figure 26).
When a larger isocyanide, ethyl isocyanide 24, was attempted, however, it was found that

42
the isocyanide will actually remove Cu(I) from 18a and presumably form isocyanide-
Cu(I) complexes. This effect was also observed when methylamine 25 and cyanamide 26
was attempted.
Overall, it was found that 18a was very selective in regards to the guest molecules it
would form stable host-guest complexes with. It appears that only small, linear,
coordinating ligands such as acetonitrile and methyl isocyanide can be encapsulated.
Since the size/shape of these two molecules do not vary considerably, it is likely methyl
isocyanide’s greater affinity toward 18a is due to the more favorable intrinsic binding
energy (ΔG°) as a result of the stronger coordination to Cu(I) while inside.
2.4 Chapter 2 Summary and Conclusions
In an effort to close a basket basket effectively and to minimize gate dynamics,
metal-chelating gates were tethered to tris-anhydride 7. It was conceived that upon
addition of a metal cation such as Ag(I) and Cu(I) the gates would chelate to the metal,
effectively close the basket, and provide a cavity for which a small ligating guest may
enter and act as a fourth ligand in the interior. Thus, pyridyl gated baskets 15-17 were
synthesized.
Basket 15 was found to aggregate upon addition of Ag(I), while baskets 16 and 17
were found to form 1:1 complexes. DFT calculations of these complexes suggested that
the Ag(I) cation rests above the rim and is partially solvated in basket 17 and is lowered
deeper into the cavity and desolvated in basket 16. Although Ag(I):16 seemed to be ideal

43
for encapsulating small chelating guest molecules, none were found to form stable host-
guest complexes. We next tried a different transition metal, Cu(I), in the hopes of
observing stable host-guest complexes.
Compound 16 was indeed found to bind to Cu(I) effectively (Ka = 1.8 x 10⁵ M
-1).
Upon cooling a 1:1 mixture of 16 and Cu(CH3CN)4PF6 in 5:3 acetone-d6:chloroform-d,
the 1H NMR resonances of the basket decoalesced into two sets of NMR signals
corresponding to molecular baskets 18a and 18b. Through NMR integration and
assignments by 1H-
1H COSY and
1H-
1H ROESY, it was found that 18b contained a
molecule of acetonitrile and 18a presumably loosely held one solvent molecule. Careful
inspection of the variable temperature NMR data also led to the conclusion that a
molecule of acetonitrile is not binding to Cu(I) in 18a outside of the host, but rather the
three pyridine gates are bound to Cu(I) in a trigonal-planar fashion. In an evaluation of
the structure and dynamics of 18a and 18b, DFT calculations revealed that the pyridine
gates are helically twisted and can be arranged in either M or P fashion. The
interconversion barrier for both 18a and 18b was found to be very low, however, making
this process difficult to observe by NMR. In an effort to identify the mechanism for
18a/18b interconversion, we utilized the NMR integration and a complete band-shape
analysis to generate a Van’t Hoff plot and Eyring plot respectively. Both experimental
and theoretical data were in favor of a mechanism whereby acetonitrile is encapsulated
by squeezing through one of the side aperatures. Importantly, gate dissociation is not a
prerequisite for acetonitrile entry.

44
With knowledge of the likely mechanism, a series of small coordinating molecules
were attempted to be encapsulated inside of 18a in order to probe the relationships
between size, shape, coordinating ability, and the squeezing mechanism by which guests
enter. However, 18a proved to be exceedingly selective, whereby only acetonitrile and
methyl isocynaide, which possesses the same linear geometry, were found to form a
stable host-guest complex. Methyl isocyanide coordinates more strongly to Cu(I) than
acetonitrile, thus the binding affinity was observed to be much higher.
Due to the apparent lack of variety in guest molecules that can be encapsulated in
18a, studies of the effects of gating in this system were severely hampered. In light of
this, we refocused our efforts toward studying molecular baskets whose gates fold by
means of hydrogen bonding. As was discussed in Chapter 1, our first attempts of
utilizing this type of folding involved phenol gates. Unfortunately, the phenol gates
revealed to be too dynamic to form stable host guest complexes. While studying the
mechanism of encapsulation of acetonitrile in 18a/b, our group worked in parallel on the
synthesis of a molecular basket which folds via intramolecular hydrogen bonding, but
used dramatically less dynamic gates. Our results and observations for this system will
be presented in the following chapter.

45
Chapter 3: Molecular Baskets Folded by Intramolecular Hydrogen Bonds
3.1 Introduction: Synthesis and Initial Studies of a New Molecular Basket
In the interests of creating a molecular basket that can fold by intramolecular
hydrogen bonds to occlude space, encapsulate a variety of guest molecules, and regulate
the rates of guest exchange, we targeted the synthesis of molecular basket 27, which we
envisioned may close through the formation of either a clockwise or counterclockwise
seam of intramolecular hydrogen bonds (Figure 27).49
Importantly, due to the hydrogen
bonding occurring within two separate regions of the gate (the pyridyl nitrogen and
amido hydrogen), the gate dynamics is substantially reduced relative to the molecular
baskets folded by metal chelation presented in Chapter 2. It was postulated that the
resulting decreased gate dynamics would lead to a better preorganized cavity, which
should consequently result in slower guest dissociation rates.
We initially obtained this basket by condensation of tris-anhydride 7 and acetylated
(aminomethyl)pyridine, but we eventually found that 27 can be more easily obtained
through the scheme found in Figure 27, which, as we will later see, opened the door to a
variety of amido-substituted molecular baskets.50
Thus, commercially available 28 was
first reacted with thionyl chloride in methanol to obtain methyl ester 29, which was
stirred in concentrated ammonium hydroxide to obtain amide 30.51
LAH reduction

46
afforded diamine 31, which was subsequently condensed with tris-anhydride 7 to obtain
tris-amine 32. Finally, the tris-amine is reacted with acetic anhydride in the presence of
triethylamine to afford 27.50
Figure 27: Chemical structure and synthesis of molecular basket 27. Top and side views
of energy-minimized (DFT, B3LYP) structure of folded 27.
The 1H NMR (400 MHz, CDCl3 298 K) spectrum of 27 contains a downfield singlet
at approximately 10.98 ppm corresponding to the amido N-H proton, which remained
consistent regardless of concentration (0.5 to 20 mM). Additionally, this peak also
remained fairly constant with varying temperature (298 to 197 K, Δδ/ΔT = 6.1 ppb/K).
1H NMR DOSY
35,36 measurements (500 MHz, 298 K) also revealed that the apparent
diffusion coefficients are practically invariant (5.6 and 5.9 x 10⁻¹⁰
m2s
-1) at concentrations

47
of 13.0 and 0.7 mM respectively. These observations are consistent with a molecular
basket folded intramolecularly to form monomeric units, rather than aggregates.
Figure 28: Clockwise and counterclockwise arrangements of the seam of hydrogen
bonds in dynamic enantiomers 27a and 27b respectively.
Interestingly, upon cooling a CDCl3 solution of 27, the 1H NMR spectra revealed the
decoalescence of hinge protons He/Hd from a singlet to an AB quartet at 225 K. This
observation is indicative of the formation of two dynamic enantiomers, 27a and 27b,
whose seam of intramolecular hydrogen bonds fold either clockwise or counterclockwise
(Figure 28). In CD2Cl2, however, the decoalescence was observed to be less than 183 K.
This observation is surprising since the interconversion process must entail the rupture of
the hydrogen bonds, for which the stability should be similar in these two, non-
coordinating, and low-polarity solvents. We thus hypothesized that the more sizeable
chloroform (75 Å3) fits better inside of 27 (~ 221 Å
3 cavity) than smaller
dichloromethane (61 Å3). In a computational study (PM3, CAChe), it was found that the
egress of dichloromethane along a reaction coordinate directed through the center of an

48
aperature of the folded host52
demands a lower activation energy (~ 7 kcal/mol) than the
expulsion of chloroform (~ 14 kcal/mol). Thus, it was concluded that dichloromethane is
much less competitive for occupying the inner space of the basket and would be better to
use as a solvent for investigating host-guest complexes.
Figure 29: A) Selected regions of variable temperature 1H NMR spectra (400 MHz,
CD2Cl2) of a solution of 27 (2.4 mM) and CCl4 (3.7 mM). B) A selected region of VT 13
C NMR spectra (100 MHz) of a solution of 27 (13.1 mM) and 13
CCl4 (19.6 mM). C)
van’t Hoff plot and thermodynamic parameters for the 27(solvent)/27(CCl4) equilibrium.
Reprinted with permission from J. Am. Chem. Soc. 2008, 130, 15127 - 15133. Copyright
2008 American Chemical Society.

49
Upon the addition of CCl4 to a solution of 27 (2.98 mM) in CD2Cl2, considerable
changes were observed in its 1H NMR (400 MHz) spectrum. The amido N-H resonance
shifted to a lower field (Δδ = 0.5 ppm) as the concentration of CCl4 was gradually
increased. By utilizing a nonlinear-curve fitting of the binding isotherm to a 1:1
stoichiometric model39,40
, the apparent association constant, Ka, was found to be 109 ± 1
M-1
at 298 K. After cooling a solution of 27 (2.4 mM) containing 13
CCl4 (3.7 mM) in
CD2Cl2, decoalescence of signals were observed at ~ 260 K (Figure 29). Two different
sets of peaks were ultimately observed at low temperature whose intensity ratio changes
with temperature. Accordingly, each set was assigned as a C3-symmetrical basket: one
occupied with solvent (CD2Cl2) and another with CCl4. When 13
CCl4 was employed in
such an experiment, the decoalesence of signals in the 13
C NMR spectra (100 MHz) was
found to occur at practically the same temperature as that of the previously taken 1H
NMR spectra (260 K).
The integration of the N-H signals at each temperature afforded the corresponding
association constants and thermodynamic parameters for the conversion of 27(CD2Cl2) into
27(CCl4) (Figure 29C). The encapsulation of CCl4 is driven by enthalpy (ΔH° = -3.1 ± 0.2
kcal/mol) with a negligible loss in entropy (ΔS° = -1.2 ± 0.8 eu) which is in accordance
with an exchange of an encapsulated dichloromethane molecule with CCl4.
To probe the kinetics of the folding process and, consequently, CCl4 translocation,
the decoalescence of He/Hd, a result of the conformational equilibrium of 27a/27b (Figure
28), in the presence of excess CCl4 was subjected to a total band-shape analysis43-47
yielding apparent first-order rate constant krac for a range of temperatures.53
The excess

50
of CCl4 was used to fully populate the host and thus the corresponding activation
parameters obtained from the Eyring plots (ΔH‡
rac = 10.4 ± 0.3 kcal/mol ; ΔS‡
rac = 1.4 ±
0.1 e.u.) describes the interconversion process of molecular basket 27 with a molecule of
CCl4 occupying the interior. Furthermore, we examined the apparent rate constants for
guest departure, kd, by simulating the line shapes of the two exchanging and unequally
populated N-H spins (Figure 29A): one corresponding to 27(solvent) and another to 27(CCl4)
basket.43-47,53
From the corresponding Eyring plots (Figure 30), the activation parameters
corresponding to CCl4 departure were obtained (ΔH‡
d = 8.6 ± 0.5 kcal/mol ; ΔS‡
d = -15.0
± 0.8 e.u.).
Figure 30: Eyring plot and the activation parameters for CCl4 departing 27(CCl4) obtained
from dynamic 1H NMR measurements in CD2Cl2. Reprinted with permission from J.
Am. Chem. Soc. 2008, 130, 15127 - 15133. Copyright 2008 American Chemical Society.
The question arises as to whether the opening/closing motions of the basket,
expressed as the 27a/27b interconversion, regulate the kinetics of the egress/ingress of
CCl4. Note that using the acquired activation parameters for the 27a/27b interconversion

51
yields a value of Gibbs free energy of activation at 298 K (ΔG‡
rac,298K = ΔH‡ - [298
K]ΔS‡) to be approximately 10.0 kcal/mol. Strikingly, this value is comparable to the
energy value obtained by subtracting the thermodynamic bias of encapsulation (ΔG° =
2.7 kcal/mol) from the Gibbs free energy of activation of CCl4 departure at 298 K
(ΔG‡
d,298K ~ 13.1 kcal/mol). This correlation in energy values supports a mechanism
whereby guest departure demands that the basket must unfold via dissociation of the
three intramolecular hydrogen bonds in order for CCl4 to depart the cavity (Figure 31).
The constrictive binding energy, equivalent to the energy for guest entrance (ΔG‡
f, see
Figure 1), appears to primarily arise from the unfolding motions of the basket.
Figure 31: Energy diagram showing the partitioned standard (ΔG°), at 298 K, for
synchronized gated transfer of CCl4 in/out of molecular basket 27. Reprinted with

52
permission from J. Am. Chem. Soc. 2008, 130, 15127 - 15133. Copyright 2008 American
Chemical Society.
With data in support of the mechanism shown in Figure 31, it can be concluded that
the basket does indeed regulate the association and dissociation of guest molecules (in
this case CCl4) and this property is regulated by the opening/closing dynamics provided
by the gates. Before further study could be performed on the effects of gating on
molecular encapsulation, however, it was necessary to first perform a complete
evaluation on the propensity of basket 27 to encapsulate guest molecules.54
The
questions that needed to be answered were (1) what are the three-dimensional
requirements (i.e. size/shape) for encapsulation, (2) is there a relationship between the
steric/electronic properties of the guest and its affinity toward 27, and (3) can we predict
the propensity of future molecules to be encapsulated from our resulting data?
For encapsulations that are guided by nonspecific host/guest intermolecular contacts,
Rebek and co-workers have noted that, in an ideal situation, a guest’s volume will occupy
55.0 ± 0.8% of the host cavity. This ratio between the guest volume and cavity volume is
referred to as the packing coefficient (PC).55,56
Thus, it is reasonable that an analysis of
the volume of basket 27 would impart information regarding the types of molecules that
may be encapsulated. Accordingly, it was found that the volume of an optimized
structure of folded 27 obtained through density functional theory (DFT, B3LYP/6-
31G(d)) possesses an estimated interior volume of 221 ± 9 Å3 (Spartan) with an error
corresponding to six independent computations.56
It should be noted that there is likely
an added uncertainly due to the transient nature of the cavity (c.a. 10%) contributing to a

53
fluctuation in volume.55
Regardless, based on the 55% rule, guests possessing a volume
of 80 – 120 Å3 (36 – 55% of the total volume of fully closed 27) would be favored to
reside within the cavity.
Although there are no strong non-covalent contact points (e.g. hydrogen bonding
donors/acceptors) within the cavity, the interior is surrounded by three phthalimide rings
on the sides and one benzene ring in the bottom. These functionalities could impart
increased intrinsic binding energy (ΔG°) through the use of favorable interactions with
the guest, including electrostatic and C-H…
π interactions.57
To characterize this
component, the electrostatic potential surface of the host surface was calculated (Spartan,
Figure 32A). The basket was observed to possess domains with a negative potential, -17
kcal/mol at the center of its bottom, -5 kcal/mol on the sides, and -10 kcal/mol on the top.
With knowledge regarding the size/shape and electrostatic potential surface of the
interior, it is clear that halomethane derivates, such as 28-38, would make excellent
cadidate guests due to their volume, spherical shape, and electrostatic potential surface
that qualitatively complements the basket’s interior (Figure 32B).

54
Figure 32: Electrostatic potential surface map of A) 27 and B) halomethanes 28 - 38
calculated using AM1 method with Spartan. Reprinted with permission from Org. Lett.
2008, 10, 5361 - 5364. Copyright 2008 American Chemical Society.
The capacity of these guest molecules for occupying molecular basket 27 was
examined by NMR spectroscopy in a similar manner to that previously used for CCl4
(34). Thus, upon cooling a CD2Cl2 solution of guest, two sets of resonances, one
corresponding to a solvent-filled 27 and the other to guest-filled 27, was observed in the
1H NMR spectra. Integration of the resonances afforded the binding constant (K), and
from a Van’t Hoff plot (Figure 33A), the thermodynamic parameters (ΔH°, ΔS°) for the
encapsulation were obtained (Table 2).

55
Table 2: Thermodynamic Parameters for the Entrapment of Halomethanes 28-38 Inside
Molecular Basket 1 Guest Volume
(Å3)
a
PCb
(%)
ΔH°
(kcal/mol)c
ΔS°
(kcal/mol)c
ΔG°
(kcal/mol)c,d
28 CBr4 106.2 48 -4.85 ± 0.09 -0.2 ± 0.4 -4.8 ± 0.1
29 CBr3Cl 101.9 46 -6.8 ± 0.2 -7.6 ± 0.8 -4.5 ± 0.1
30 CBr2Cl2 97.5 44 -5.42 ± 0.06 -5.8 ± 0.2 -3.7 ± 0.1
31 CBr3F 94.3 43 -5.3 ± 0.1 -7.3 ± 0.4 -3.1 ± 0.2
32 CCl3Br 92.9 42 -5.5 ± 0.1 -7.2 ± 0.4 -3.4 ± 0.2
33 CBr2ClF 89.6 41 -4.1 ± 0.4 -5 ± 2 -2.6 ± 0.9
34 CCl4 88.3 40 -3.1 ± 0.2 -1.2 ± 0.8 -3 ± 1
35 CBr3H 87.8 40 -1.73 ± 0.08 -2.3 ± 0.4 -1.0 ± 0.1
36 CBr2ClH 83.5 38 n/a n/a n/a
37 CCl3F 80.8 37 n/a n/a n/a
38 CCl3H 74.4 34 n/a n/a n/a a Calculated with Spartan.
b Packing coefficients were computed following a published
procedure. c Obtained from the corresponding van’t Hoff plots. The error margins in
ΔH° and ΔS° were propogated from a linear least-squares analysis of the experimental
data (SigmaPlot 10.0) and represent one standard deviation in the values. d At 298 K.
Notably, the propensity of the basket for sequestering halomethanes is a function of
their size (Figure 33). Thus, CBr4, the largest guest, showed the highest affinity for
occupying 27 (Table 2). However, the enthalpic contribution (ΔH°) for this guest was
found to be less favorable than that of slightly smaller tribromochloromethane (ΔΔH° =
2.0 kcal / mol; Table 2). In fact, when the binding enthalpies for 28-38 is plotted as a
function of guest volume (Figure 33B), an apparent bell-shaped dependence was
obtained.58
Evidently, molecules with a “distorted” spherical shape present a better
match for the egg-shaped pocket of the basket, affording more favorable non-covalent
contacts. Importantly, the size-based selectivity is in good agreement with Rebek’s “55%
rule”53
as encapsulation is observed to occur for guests possessing a volume of 84 – 110
Å3.

56
Figure 33: A) Van’t Hoff plot(s) for the encapsulation of guests 28-38 inside molecular
basket 27. B) Experimental enthalpic changes for the encapsulation of halomethanes 28-
38 (Table 2), as a function of their volumes (the dash line serves to guide the eye).
Reprinted with permission from Org. Lett. 2008, 10, 5361 - 5364. Copyright 2008
American Chemical Society.
Interestingly, guests 31 and 33 were encapsulated, but the apparent stabilities were
somewhat lower than expected on the basis of guest size (Table 2). Notably, the two
molecules contain a fluorine atom, each with a negative potential at its northern pole
(Figure 32). It can be reasoned that the adverse electrostatic forces disfavored the
host/guest interaction.59,60

57
Figure 34: Chemical structures of 28 and 39 – 41, and the corresponding thermodynamic
parameters for the encapsulation within molecular basket 27. Computed binding energies
(ΔE, kcal/mol), at the M05-2X/6-31+G(d,p)//M05-2X/6-31G(d) level of theory.
Reprinted with permission from Org. Lett. 2008, 10, 5361 - 5364. Copyright 2008
American Chemical Society.
Subsequently, guest molecules 28 and 39 – 41 were closely examined to compare
guests who encompass comparable volumes and shapes, albeit each with a different
number of methyl groups. As before, the thermodynamics of the encapsulations was
studied by use of variable temperature 1H NMR spectroscopy. Strikingly, the stabilities
of the complexes (ΔG°, 298 K) changed radically along the series (Figure 34). A closer

58
examination of the thermodynamic parameters revealed that although the change in
enthalpy upon association (ΔH°) is fairly constant (~ -4 kcal/mol), the entropies (ΔS°)
vary considerably: the greater the number of methyl groups, the more negative the
entropic contribution was (0 to -11 e.u.). Evidently, swapping the bromines in CBr4, with
methyl groups in 39 – 41 did not cause considerable disparities in the host/guest contacts:
the two groups are almost identical in size and polarizability to account for comparable
enthalpic outputs.
Indeed, the results of density functional theory (Figure 34) calculations verified this
experimental observation. With the assistance of the hybrid exchange-correlation density
functional (M05-2X), which has been optimized for dispersive interactions61
, the binding
energies (ΔE) were computed to parallel the experimental enthalpies. The restricted
motion of the rotatable methyl groups within a guest, perhaps obstructed the binding,
giving rise to the observed unfavorable entropies. Markedly, the entropic “forces” direct
the overall stability of these sort of encapsulation complexes: the effect is additive, and
increases with the number of methyl groups.62
Overall, the guests that were identified to preferentially occupy the cavity of
molecular basket 27 were halomethane guests whose volume lies within the range of ~ 80
to 120 Å3, such as 28 – 35. Based on the above analysis, the primary contributions
toward the intrinsic binding energy (ΔG°), are the electrostatic interactions between the
host and guest and the complementary size of the guest to that of the cavity (packing
coefficient of 38 – 55%) relative to that of the solvent (dichloromethane, PC = 28%).
The substitution of bromine with methyl groups, despite their similar van der Waals size,

59
results in a considerable decrease in affinity primarily due to the unfavorable entropy
likely associated with an obstruction of the rotation of the methyl groups.
3.2 Controlling the Gate Dynamics
Reproduced in part with permission from Wang, B.; Rieth, S. and Badjic, J. D. J. Am
Chem. Soc. 2009, 131, 7250 - 7252. Copyright 2009 American Chemical Society.
With proof that the folding/unfolding motions in molecular basket 27 regulates the
egress/ingress of guest molecules and the identification of several suitable guest
molecules, it was now possible to study the gating properties of this system. To
effectively study the effects of gating as a function of gate dynamics, and thus
constrictive binding energy, however, a means of controlling the rates of
unfolding/folding must be achieved. This may be accomplished by simply modifying the
temperature, but, given the vast differences in the temperature-dependent thermodynamic
and kinetic parameters unique to each host-guest system, this simple method would also
alter the intrinsic binding energy (ΔG°) and actually complicate the overall analysis.
Thus, a method was needed to observe the effects of folding/unfolding at various rates,
but at the same temperature to allow direct comparison of various guest molecules. Such
control of the gate dynamics would effectively result in a host-guest series of similar
intrinsic binding energies (ΔG°), but variable constrictive binding energies (ΔGf‡). To
accomplish this task, molecular basket 27 was modified such that the R substituent of the

60
amide is varied sterically and electronically to vary the strength of the resulting hydrogen
bond array and, consequently, the rate of folding/unfolding (Figure 28).
Figure 35: Synthesis and chemical structure of molecular baskets 27 and 42 – 46 that
each possesses different amido-R groups.
Thus, six R groups were deliberately chosen and installed to give baskets 27 and 42 –
46. The synthesis proceeded via the previously presented methodology whereby tris-
anhydride 7 was reacted with 5-(aminomethyl)pyridine-3-amine 31 to yield modular tris-
amine 32. Subsequently, an alkanoylation of 32 gave desired 27 and new hydrogen-bond
folded baskets 42 – 46 in satisfactory yields (70 – 85%; Figure 35).

61
The electron density perturbation in these molecular baskets, caused by substituents
R, ought to anisotropically impact the electrostatic N-H…N contacts and thereby have an
effect on the intramolecular hydrogen bonding.60,63,64
That is to say, the depletion (or
build up) of the charge at the HB-donor position (N-H) must be accompanied by a
negligible charge perturbation at the HB-acceptor site (Pyr-N). Indeed, the electrostatic
potentials of the energy minimized model compounds (AM1/HF(6-31G**), Spartan)65
suggested a fluctuation in the charge density at the donor but rather consistent values at
the acceptor atom (Table 3).
Table 3: Calculated electrostatic potential energies (AM1/HF (6-31G**)) at the N-H and
Pyr-N sites in model compounds and 1H NMR (400 MHz, CD2Cl2) chemical shifts of the
N-H resonance of baskets 27 and 42 – 46 containing an excess (> 60 mol equiv) of t-
BuBr R N-H
a (kcal/mol) Pyr-N
a
(kcal/mol)
δ (N-H)b (ppm) δ (N-H)
c (ppm)
(CH3)3C 58 -49 9.7 10.4
CH3 62 -48 10.8 11.4
CH3CH=CH 61 -49 10.8 11.4
C6H5 59 -49 11.2 11.8
CF3 69 -44 12.2 12.6 a Model compounds consist of one phthalimide “arm”.
b 298 K.
c 213 K.
1H NMR chemical shifts of the N−H signals in 27 and 42 - 46 are indicators for the
strength and the proportion of the intramolecular hydrogen bonding (Table 3). Markedly,
bulky (CH3)3C− groups enforced weaker (δN−H = 9.7−10.4 ppm) whereas all other
substituents stronger (δN−H = 10.8−12.6 ppm) noncovalent contacts. FT-IR spectroscopic
studies of 27, 42, and 46, in addition, suggested the existence of a fully closed C3
symmetric basket with other conformers populating the equilibrium to a lesser degree.

62
These findings are, importantly, supported by Schneider’s suggestion66
that ~2 kcal/mol
of the free energy (ΔG°, 298 K, CDCl3) is to be attributed to a hydrogen bond lacking
secondary electrostatic interactions; that is to say, ΔG° (298 K, CDCl3) of ~6 kcal/mol
can be expected to describe the formation of a “fully closed” basket.
To quantify the effect the R groups impart on the opening/closing motions of the
baskets, the first-order rate constants (krac) for the interconversion of dynamic
enantiomers A and B (Figure 28) were determined by completing the line-shape analysis
of the diastereotopic Hd/e resonances at variable temperatures. Importantly, an excess of
t-BuBr (guest) was used in each experiment to ensure a sole exchange of the guest-
populated baskets. The rate constants (krac) for “averaging” the Ha/b signals, i.e.,
revolving of the gates, were further incorporated into an Eyring plot to afford krac’s at
226.0 K (Table 4). It is obvious that substituents had an effect on the gates’ dynamics:
the electron-withdrawing CF3 retarded (4 ± 0.4 s−1
) while the electron-donating CH3 (108
± 22 s−1
) accelerated the rotation of the gates.
Table 4: Table 4: Kinetic parameters for the revolving of gates (krac, 1H NMR line-shape
analysis) in molecular baskets 27 and 42 – 46 (CD2Cl2), at 226.0 ± 0.1 K.
Basket R krac
(s-1
)a,b
ΔGrac‡ (kcal/mol)
27 CH3 108 ± 22 11.0 ± 0.1
42 (CH3)3C 78 ± 16 11.1 ± 0.1
43 CH3(CH2)5 97 ± 20 11.0 ± 0.1
44 (E)-CH3CH=CH 83 ± 17 11.1 ± 0.1
45 C6H5 20 ± 4 11.7 ± 0.1
46 CF3 4 ± 1 12.4 ± 0.1 a Error margins (20%) were obtained on the basis of four independent measurements.
b
Each measurement was repeated twice, and the error margins were propagated from the
linear least-squares analysis of the experimental data.

63
The dependence of the reaction’s free energy (ΔG° or ΔG‡) on the reactant’s
substituents is described with substituent constants (σ) and accounted for by proportional
free energy relationships (LFERs).67
The concept has, interestingly, been used for
examining noncovalent interactions, and typically, the electronic effects are solely
evaluated.68
In the case of these baskets, however, the gates’ dynamics seems to be a
function of not only electronic but also steric factors (Table 4). Moreover, the ground and
the excited states for the A/B interconversion appear crowded when sizable R groups are
introduced (Figure 28). Taft’s LFER scale, conveniently, defines polar (σ*) and steric
(Es) substituent constants and has been recommended for studying aliphatic systems.69,70
We used this two-parameter model to fit a plot of log(krac(subs.)
/krac(Me)
) versus ρ*σ* + δEs
(Figure 36). The correlation was acceptable (R2 = 0.94), with the revolving rates
susceptible to both inductive/field (ρ* = −0.5) and steric (δ = 0.13) factors. Molecular
basket 42 with the sterically demanding (CH3)3C− group, thus, underwent a rather “slow”
A/B interconversion (krac = 78 ± 16 s−1
) despite its weak N−H···N hydrogen bonding
contacts (Table 3).

64
Figure 36: Linear free energy relationship (LFER) for the revolving of gates (A) in
baskets 27 and 42 – 46. The correlation was obtained using Taft’s two-parameter
regression model with polar (σ*) and steric (Es) substituent constants (B).
The rate constants for t-BuBr (guest) entering (kf) and departing (kd) baskets 27 and
42 - 46 were ascertained by completing quantitative 1H−
1H EXSY NMR
measurements.71,72
The volumes of the cross and diagonal peaks for proton resonances of
t-BuBr inside and outside the basket were evaluated to give first-order magnetization rate
constants (k*f and k*d) for the exchange, at different mixing times (τm); τm’s were
originally estimated by measuring T1 relaxations of t-BuBr protons.36,71,72
The
association kf and dissociation kd rate constants were then obtained as kf = k*f/[basket]
and kout = k*d (Table 5).

65
Table 5: Kinetic parameters for the translocation of t-BuBr (kf, kd, 2-D EXSY NMR) in
molecular baskets 27 and 42 – 46 (CD2Cl2), at 226.0 ± 0.1 K. Thermodynamic stabilities
(ΔG°, 226.0 K) of the encapsulation complexes.
Basket R kf
(M-1
s-1
)a
kd
(s-1
)a
ΔGd‡
(kcal/mol)
ΔG°
(kcal/mol)
27 CH3 524 ± 110 4.7 ± 0.7 12.4 ± 0.1 -2.1 ± 0.1
42 (CH3)3C 1964 ± 392 11.5 ± 0.9 12.0 ± 0.1 -2.3 ± 0.1
43 CH3(CH2)5 407 ± 73 4.3 ± 0.4 12.4 ± 0.1 -2.0 ± 0.1
44 (E)-
CH3CH=CH
239 ± 68 2.8 ± 0.1 12.6 ± 0.1 -2.0 ± 0.1
45 C6H5 38 ± 12 0.4 ± 0.1 11.7 ± 0.1 -2.0 ± 0.2
46 CF3 0.7 ± 0.1 0.07 ± 0.02 14.2 ± 0.2 -1.0 ± 0.2
a The error margins represent the standard deviation of eight independent measurements
Taft’s linear free energy scale was used to correlate the kinetic data for the departure
(kout) of t-BuBr (Figure 37).69,70
A plot of log(kd(subs.)
/kd(Me)
) versus ρ*σ* + δEs correlates
well (R2 = 0.95). The polar (ρ* = −0.6) and steric (δ = 0.21) sensitivity factors
characterizing the rate of t-BuBr dissociating from the molecular baskets are similar to
the factors describing the rotation of the gates (ρ* = −0.5 and δ = 0.13). The result,
importantly, validates the interdependence between the internal dynamics of the gates
(rotary motion) and the kinetic stability of guests (translation). Thus far, the electron-
withdrawing CF3 retarded (kout = 0.07 ± 0.02 s−1
) while the electron-donating CH3 (kout =
4.7 ± 0.7 s−1
) accelerated the departure of t-BuBr from the baskets. The behavior of
basket 42 containing bulky (CH3)3C− units, however, did not follow the linear trend
described in Figure 37. The guest (t-BuBr) departed this basket at a rate (kd = 11.5 ± 0.9
s−1
) higher than expected considering the “slow” flipping of its gates (krac = 78 ± 16 s−1
).
It is, perhaps, that weaker hydrogen bonds at the seam of this basket (Table 3) authorized
the guest departure by an alternative mechanism. One scenario could involve the slipping

66
of t-BuBr through an aperture created by single-gate unfolding, but this remains to be
further investigated.
Figure 37: (A) Linear free energy relationship (LFER) for the dissociation of t-BuBr
from baskets 27 and 42 – 46 (B). The correlation was obtained using Taft’s two
parameter regression model with polar (σ*) and steric (Es) substituent constants (Figure
36B).
The stability of t-BuBr complexes with 27 and 42 - 46 (ΔG°, Table 5) remained fairly
consistent (~ -2.0 kcal/mol) with the notable exception of trifluoro substituted 46.
Possibly, the resulting strong hydrogen bonds result in a more tightly closed basket with a
“smaller” inner space, and thereby higher affinity toward solvent and lower toward t-
BuBr. More importantly, the lack of deviation in thermodynamic stability is indicative
that altering the steric and electronics of the R group in the gates greatly alters the
constrictive binding energy (ΔGf‡) without modifying the intrinsic binding energy (ΔG°)
considerably.

67
Figure 38: Schematic representation of gated molecular baskets 27 and 42 – 46 capable
of controlling time (t) that t-BuBr spends in their cavity (right). By choosing a proper R
substituent, one can now tune this “residing” time to a desired value.
The lifetime t (1/kd) of the encapsulated t-BuBr is clearly a function of the basket’s
dynamics (Figure 38) and can, in this gated environment, be controlled and predicted by
choosing a proper R substituent. With explicit control over the constrictive binding
energy, it was now possible to eventually investigate the gating properties of this system
using a series of guest molecules with varying gate dynamics at the same temperature.

68
3.3 The Dynamic Discrimination of Guest Molecules in Molecular Baskets
Reproduced in part with permission from Rieth, S.; Xiaguang, B.; Wang, B.; Hadad, C.
M. and Badjic, J. D. J. Am. Chem. Soc. 2010, 132, 773 - 776. Copyright 2010
American Chemical Society.
One of the most fundamental properties of gating in natural systems is the ability to
dynamically discriminate between guest molecules of varying size and shape.1,4,5,7,13
As
illustrated in Chapter 1, the gates of acetylcholinesterase are only open a small fraction of
time (~ 2.4%), which results in a decrease in the rate of binding of acetylcholine by a
factor of two. However, a slightly bulkier substrate whose volume is only 0.4 Å3 greater
than acetylcholine will enter at a rate three orders of magnitude less than acetylcholine,
resulting in a system that possesses very high selectivity without sacrificing much
catalytic efficiency.13
Molecular baskets can be viewed as model systems that possess
gates that can open/close at varying rates. With an effective means of tailoring the
dynamics of the gates and knowledge of a variety of molecules of differing sizes and
shapes that could be encapsulated, it was now possible to study (1) whether or not the
gating phenomenon can be incorporated into artificial systems and (2) if there is a
relationship between encapsulation selectivity and gate dynamics. For both of these
objectives, an experimental protocol first needed to be developed to provide quantitative
relationships between the kinetics of encapsulation, the kinetics of the opening/closing
motions of the gates, and the intrinsic binding energy (ΔG°).

69
Figure 39: A) Reaction coordinate diagram showing an equilibrium with homosteric
guest series 28, 39 – 40, and 47 – 48 (CBr4 is displayed) entering (kf) and departing (kd)
gated molecular basket 45 (internal volume: 220 Å3). Solvent molecules (CD2Cl2, right)
occupy basket 45 devoid of external guests. B) Energy minimized structures (B3LYP/3-
21G) of guests 28, 39 – 41, and 47 – 49.
For this study, we chose phenyl basket 45 and molecules 28, 39 – 41, and 47 – 49 as
guests (Figure 39B). The guest series 47, 40, 39, 48, and 28 have identical volume (size)
with van der Waals volumes of Br and CH3 groups contributing to uniform size (106−107

70
Å3) and spherical shape across the series. Two heterosteric guests molecules, 41 and 49,
were also included to identify any changes in the encapsulated kinetics upon deviating
from the size/shape profile of the isosteric guest series. Basket 45 (Figure 39A) was used
in the study, and its affinity (ΔG°) toward the isosteric guests was more favorable (more
exoergic) as the number of CH3 units decreased (Table 6). As elucidated previously, the
encapsulation limits the rotational and vibrational degrees of freedom of CH3 groups,
which obstructs the binding via an unfavorable entropy (ΔS° < 0; See Figure 34).
Notably, the range of binding energies ΔG° (250 K, Table 6) spans 4 kcal/mol for these
very similar guests, thereby allowing a critical evaluation of the possible linear free
energy relationships (LFER).67
Table 6: Activation parameters for the trafficking of guests 28, 39 – 41, and 47 – 49 (2D
EXSY NMR, CD2Cl2, 250.0 ± 0.1 K) in (kf, ΔGf‡) and out (kd, ΔGd
‡) from basket 45 and
the 45 A/B interconversion (ΔGrac‡; see Figure 28) as well as thermodynamic stabilities
(ΔG°, 250.0 ± 0.1 K) of [45 guest] encapsulation complexes. Entry Guest kf
(M-1
s-1
)b
kd
(s-1
)
ΔGf‡
(kcal/mol)
ΔGd‡
(kcal/mol)
ΔGrac‡
(kcal/mol)a
ΔG°
(kcal/mol)
47 (CH3)4C 1100 ±
115
30.3 ±
0.9
11.03 ±
0.05
12.81 ±
0.01
11.5 ± 0.1 -1.77 ±
0.05
40 (CH3)3CBr 1160 ±
134
16.2 ±
0.8
11.00 ±
0.06
13.12 ±
0.02
11.8 ± 0.1 -2.11 ±
0.06
39 (CH3)2CBr2 1525 ±
200
3.41 ±
0.23
10.87 ±
0.07
13.89 ±
0.03
11.9 ± 0.1 -3.02 ±
0.07
48 (CH3)CBr3 2460 ±
251
0.48 ±
0.01
10.63 ±
0.05
14.86 ±
0.01
12.3 ± 0.1 -4.23 ±
0.05
28 CBr4 8500 ±
3010
0.10 ±
0.03
10.02 ±
0.18
15.63 ±
0.15
12.6 ± 0.1 -5.6 ± 0.1
49 (CH3)CCl3 8040 ±
873
22.8 ±
0.8
10.04 ±
0.05
12.95 ±
0.02
11.6 ± 0.1 -2.90 ±
0.06
41 (CH3)4Si 480 ±
48
14.4 ±
0.5
11.44 ±
0.05
13.17 ±
0.02
12.5 ± 0.1 -1.73 ±
0.06 a Error margins were obtained on the basis of four independent measurements.
b Each
measurement was repeated twice.

71
Two-dimensional 1H−
1H and
13C−
13C NMR magnetization transfer measurements
(EXSY)70,72
were completed to obtain the rate coefficients for the homosteric guests
entering (kf) and departing (kd) basket 45 in CD2Cl2 at 250.0 ± 0.1 K (Table 6). The
encapsulation (Figure 39A) was in accord with an dissociative mechanism73
whereby the
association was first order in the guest (vf = kf [guest][basket]) while the dissociation
process was zeroth order in the guest (vd = kd [basket guest]).

72
Figure 40: Activation energies for isosteric guests 28, 39, 40, 47, and 48 (106 – 107 Å3)
entering (ΔG‡
f) and departing (ΔG‡
d) basket 45 were found to be a linear function of the
corresponding binding energies (ΔG°, 250.0 ± 0.1 K). The kinetic behavior of smaller 49
(93 Å3) and bigger 41 (121 Å
3) deviates from the observed linear free energy
relationships (ΔG‡ = ρΔG° + δ). The activation energies characterizing the revolving of
gates (ΔG‡
rac) also exhibit a LFER.

73
After the host−guest affinities (ΔG° = kf/kd) were plotted against the corresponding
free energies of activation (ΔGf/d‡), well-correlated linear relationships were observed
(Figure 40); note that the binding energies ΔG° from the EXSY measurements match
those obtained by the integration of 1H NMR signals. Evidently, there exists quantitative
relationships between the thermodynamic potential for the encapsulation and the free
energy of activation for the isosteric guest series entering/exiting basket 45 in
competition with the solvent (CD2Cl2). We analyzed these relationships with the
following equation ΔG‡ = ρΔG° + δ. The slopes of the fitted lines, which we denote as
ρ,74
correspond to the susceptibility by which the free energies of activation respond to
the change in the thermodynamic affinity of guests toward molecular basket 45. For the
values of ρ, the ingress of guests generates a smaller slope (ρf = 0.25), while the egress
has a larger magnitude of its slope (|ρd| = 0.74, Figure 40). An early transition state would
suggest that the guest entrapment (ΔGf‡) would be less responsive to ΔG° than ΔGd
‡, as is
observed. The intercept of the fitted lines, which we denote as δ, represents the activation
barrier (ΔG‡) for the encapsulation of a hypothetical guest possessing the same size/shape
as the isosteric guest series and a binding energy of ΔG° = 0; note that under this
circumstance, δ = ΔGf‡ = ΔGd
‡ = 11.56 ± 0.14 kcal/mol.
First-order rate constants (krac) for the interconversion of dynamic enantiomers 45A
and 45B (Figure 28) were obtained by completing NMR line-shape simulations of the
coalescence of diastereotopic Hd/e resonances at variable temperatures (220−270 K, Table
6). After the data were placed into the free energy correlation plot (Figure 40), the
activation energies for 45A/B interconversion (ΔGrac‡) were shown as well to be a linear

74
function (R2 = 0.972) of the thermodynamic stability of the host-guest complexes. The
slope of the fitted line is small (|ρrac| = 0.26) while the intercept (11.13 ± 0.09 kcal/mol) is
very similar to the δ value above (11.56 ± 0.14 kcal/mol, Figure 40). The existing LFER
corroborates the synergy between the internal dynamics of the gates and the
thermodynamic stability of guests bound in the cavity of host 45. Furthermore, the energy
required for revolving the gates at ΔG° = 0 is almost equal to the constrictive binding
(ΔGin‡ = ΔGout
‡ = 11.56 ± 0.14 kcal/mol)−physical barrier that a guest encounters in
escaping the basket.75
The host’s conformational change, i.e., gating, is evidently
controlling the uptake/release of guest molecules.
Figure 41: Snapshots of CBr4 departing 45, along a force vector aligned with the
basket’s side aperature, obtained from steered molecular dynamics (SMD) simulations of
the process (0, 440, and 1000 ps; top). The variation of intramolecular N---H distances
(assigned as I, II, and III) in basket 45 as a function of time during the SMD simulation
(bottom).

75
The departure of sizable CBr4 (or any guest of the isosteric guest series for that
matter), via a trajectory along the side aperture of the basket, was computed using steered
molecular dynamics (SMD)76
and the AMBER program. Importantly, a simultaneous
cleavage of all three N−H---N hydrogen bonds is required for a guest (106−107 Å3) to
leave the basket’s cavity (Figure 41). Furthermore, the results of the SMD simulation
indicated that smaller CHCl3 (75 Å3) can enter and exit 45, without considerably
perturbing the position of the gates. If the trafficking of smaller guests does not require a
considerable perturbation of the gates, then one could expect a faster 45A/B
interconversion (Figure 28) on the account of greater effective space available to the
revolving gates and weaker (distance-dependent) basket-to-guest electrostatic
interactions. Indeed, our experimental studies suggested a more rapid rotation of gates in
[45-CD2Cl2]: ΔGrac‡ = 9.2 ± 0.1 kcal/mol at 250.0 K.
The relationships described in Figure 40 pertain to guests (28, 39, 40, 47, and 48) that
have the same size and shape. Will guest molecules, having profiles slightly different
from these obey the ΔG°/ΔG‡ linear correlations? Guests 41 and 49 were chosen to
examine this aspect (Figure 39B). 1,1,1-Trichloroethane 49 is a nonspherical compound
and is smaller (93 Å3) than the homosteric guest series ( 107 Å
3). Interestingly, 49
entered/departed basket 45 faster than one would predict on the basis of the LFER in
Figure 40. Larger tetramethylsilane 41 (120 Å3) was, however, found to access/leave the
basket’s cavity at a rate slower than expected on the basis of the LFER in Figure 40. The
results of the kinetic measurements for 41 and 49 can be interpreted by considering the
mechanism of conformational gating in acetylcholinesterase (AChE).8 A guest will make

76
repeated attempts to access the cavity of dynamic [45-CD2Cl2] via Brownian motion.
The gates switch between open and closed states and, when an attempt coincides with the
open state, the encapsulation happens (Figure 41). The likelihood that the gates open
wide enough to admit a substrate is evidently related to the substrate’s size. Hence,
larger substrate 41 has a lower probability while smaller substrate 49 has a higher
probability for entering “the transient aperture” created by the gates.
Thus, the experimental results suggest that the encapsulation kinetics mediated by
gated basket 45 is governed by the guest’s profile and the host/guest interaction potential
(ΔG°). When the size/shape of guests is kept constant, the encapsulation potential (ΔG°)
is a linear function of the rate by which they enter/depart basket 45 (ΔG‡
f/d). However,
when the potential is fixed, basket 45 discriminates guests on a basis of their size/shape
via dynamic modulation of the binding site’s access, thereby resembling enzymes such as
acetylcholinesterase.4,7,8
3.4 The Effect of Gate Dynamics on Guest Selectivity: The Revolving-Door Effect
The following is adapted from the pre-peer reviewed version of the following article:
Rieth, S. and Badjic, J. D. “The Effect of Gate Dynamics of Revolving Gates on the
Kinetics of Molecular Encapsulation – The Activity/Selectivity Relationship” Chem. Eur.
J. 2011, 17, 2562 - 2565. Copyright 2011 Wiley-VCH verlag GmbH & Co. KGaA.
Reproduced in part with permission.
In the previous section, an experimental protocol to identify and quantify the kinetic
selectivity of encapsulation imparted into the system as a result of gating was developed.
Importantly, it was verified that, much like the enzyme acetylcholinesterase,8 gating plays

77
a crucial role in the kinetic selectivity of the encapsulation of guest molecules with
varying size and shape. With this new methodology, it was now possible to study the
changes in this phenomenon as a function of the gate dynamics. In other words, if we
increase krac (related to the motion of the gates), will the differences in entrance and
departure rates (kf and kd) of guest molecules of differing size and shape increase or
decrease? If such an effect is quantifiable, the answer gained will be of critical
importance in the future design of artificial hosts incorporating gating.
Thus, we used baskets 27, 45, and 46 that have R residues with different steric and
electronic characteristics within the amido groups (Figure 35) for controlling the
hydrogen-bonding array and thereby the dynamics of the gates (krac, Table 7).50
Thus,
basket 46 (R=CF3) had its gates opening and closing at a lower rate, whereas basket 27
(R=CH3) had its gates opening and closing at a higher rate in dichloromethane at (250.0 ±
0.1) K (Table 7); the gates’ dynamics gradually increased from 46 to 45 to 27 as the
strength of the hydrogen bonding around the rim was decreased (Table 7).
Table 7: Rates of racemization (krac) of molecular baskets 27, 45, and 46 in CD2Cl2 at
(250.0 ± 0.1) K representing the interconversion between two dynamic enantiomers
(Figure 28) measured using dynamic NMR spectroscopy and the values of ρ and δ for the
entrance and departure of the homosteric guest series following the free energy
relationship ΔG‡
f/d = ρΔG° + δ.
Basket krac (s-1
) ρf ρd δ (kcal/mol)
46 (R = CF3) 2.95 x 10³ 0.08 ± 0.04 -0.93 ± 0.04 12.4 ± 0.1
45 (R = Ph) 4.85 x 10⁴ 0.25 ± 0.04 -0.75 ± 0.04 11.6 ± 0.1
27 (R = CH3) > 5 x 10⁴ 0.24 ± 0.04 -0.77 ± 0.04 10.7 ±0.1

78
We have chosen eight guests, 28, 39 – 41, and 47 – 50, for our study (Figure 42).
Compounds 28, 48, 39, 40, and 47 are isosteric (≈106 Å3), having analogous size and
shape. On the other hand, compounds 49 (93 Å3), 41 (120 Å3
) and 50 (102 Å3) differ.
Notably, each of these guests was trapped by baskets 27, 45, and 46 (interior cavity ≈ 220
Å3) at 250 K in dichloromethane, as observed by an upfield
1H/
13C NMR chemical shift
of the encapsulated nuclei surrounded with the host’s aromatic arms. Moreover, almost
each guest itself was found to have a comparable affinity (ΔG°) for occupying both less
dynamic 46 and more dynamic 45 and 27 (Table 8 and Figure 43). Importantly, it is
evident that the current study is showing the changes in encapsulation behavior as a
function of constrictive binding energy (ΔG‡
f, related to ΔG‡
rac) as opposed to intrinsic
binding energy (ΔG°). The encapsulation affinities of the largest guest 41, which perhaps
forms the closest contacts with the molecular baskets, presented a notable exception from
such a trend. The noncovalent guest-to-basket contacts60
have thus remained fluctuating
to a small degree, despite increasingly greater gate dynamics and somewhat different
electrostatics characteristics of the hosts. The encapsulation favorability (ΔG°) of the
isosteric guests toward baskets 27, 45, and 46, however, showed an apparent trend
whereby carbon tetrabromide (28) was the strongest binder (Table 8). This phenomenon
was addressed earlier and described as entropic in its origin: a guest molecule with a
greater number of CH3 rotors possesses a lower propensity for residing inside the basket.

79
Figure 42: Chemical structures of guest molecules grouped according to volume. The
homosteric guest series 28, 48, 39, 40, and 47 are spherical and of the same volume due
to the identical van der Waals radius of bromine and methyl groups. Heterosteric guest
molecules 49, 41, and 50 are used as examples of guest molecules that reside outside of
this size/shape profile.
The rate coefficients corresponding to the guests entering (kf) and departing (kd)
baskets 27, 45, and 46 were obtained with quantitative 1H–
1H or
13C–
13C NMR exchange
spectroscopy (EXSY)71,72
and 1H NMR selective inversion recovery measurements
77 at
250.0 ± 0.1 K (Table 8); note that we used the selective inversion recovery method for
measuring the encapsulation kinetics in cases when considerable T1 noise limited an
accurate evaluation of the EXSY cross-peak integrals.77
The NMR data were fit to the
host/guest exchange mechanism in which a guest replaces a solvent molecule inside the
basket during association (νf=kf[guest][basket]), whereas exactly the opposite occurs
upon dissociation (νd=kd [basket⊂guest]).

80
Table 8: Gibbs free energies of activation corresponding to the entrance (ΔG‡
f) and
departure (ΔG‡
d) of guests along with the thermodynamic stabilities (ΔG°) of each
complex at (250.0 ± 0.1) K in CD2Cl2. Data were obtained from quantitative NMR
magnetization transfer experiments; each data point was obtained from six independent
EXSY measurements with the error margin corresponding to the standard deviation of
those measurements. Basket Guest ΔG
‡f (kcal/mol)
a ΔG
‡d (kcal/mol)
a ΔG° (kcal/mol)
b
46 CBr3CH3 12.14 ± 0.08 16.34 ± 0.06 -4.20 ± 0.05
46 CBr2(CH3)2 12.17 ±0.07 15.14 ± 0.06 -2.97 ± 0.09
46 CBr(CH3)3 12.39 ± 0.06 14.32 ± 0.02 -1.93 ± 0.06
46 C(CH3)4 12.30 ± 0.08 13.66 ± 0.03 -1.37 ± 0.09
46 CCl3CH3 12.21 ± 0.06 14.39 ± 0.13 -2.19 ± 0.14
46 Si(CH3)4 12.69 ± 0.06 13.74 ± 0.03 -1.05 ± 0.06
46 CBr2ClCH3 12.11 ± 0.10 15.59 ± 0.09 -3.48 ± 0.04
45 CBr4 10.0 ± 0.2 15.6 ± 0.1 -5.6 ± 0.1
45 CBr3CH3 10.63 ± 0.05 14.86 ± 0.01 -4.23 ± 0.05
45 CBr2(CH3)2 10.87 ± 0.07 13.89 ± 0.03 -3.02 ± 0.07
45 CBr(CH3)3 11.00 ± 0.06 13.12 ± 0.02 -2.11 ± 0.06
45 C(CH3)4 11.03 ± 0.05 12.81 ±0.01 -1.77 ± 0.05
45 CCl3CH3 10.65 ± 0.05 13.06 ± 0.04 -2.41 ± 0.05
45 Si(CH3)4 11.42 ± 0.05 13.24 ± 0.01 -1.81 ± 0.06
45 CBr2ClCH3 10.46 ± 0.05 14.27 ± 0.03 -3.80 ± 0.06
27 CBr4 9.2 ± 0.2 15.0 ± 0.2 -5.8 ± 0.1
27 CBr3CH3 9.66 ± 0.06 14.05 ± 0.02 -4.39 ± 0.06
27 CBr2(CH3)2 9.76 ± 0.07 13.07 ± 0.06 -3.31 ±0.09
27 CBr(CH3)3 10.24 ± 0.07 12.40 ± 0.05 -2.16 ± 0.08
27 CCl3CH3 9.68 ± 0.10 11.94 ± 0.04 -2.26 ± 0.09
27 Si(CH3)4 10.65 ± 0.06 12.36 ± 0.04 -1.71 ± 0.07
27 CBr2ClCH3 9.86 ± 0.06 13.53 ± 0.02 -3.67 ± 0.06 a The experimental rate coefficients kf/d were converted to ΔG
‡f/d by using the Eyring
equation. b The free energies of interaction ΔG° = -RTln (kf/kd) were calculated from the
NMR magnetization transfer experiments and are in good agreement with those obtained
from NMR integration and van’t Hoff plots.

81
Figure 43: The activation energies for the entrapment (ΔG‡
f) and the departure (ΔG‡
d) of isosteric guests 4–8 (black circles) abide
to a linear free energy relationship described with the equation ΔG‡
f/d = ρΔG° + δ. Note that the experimental data were fit to a
linear function corresponding to A) basket 46 (R2 = 0.69; R
2 = 1.00), B) basket 45 (R
2 = 0.93; R
2 = 0.99) and C) basket 27 (R
2 =
.94; R2 = 0.99). The kinetic data for the exchange of heterosteric guest molecules 41, 49, and 50 are shown in blue. The computed
90 % confidence bands (SigmaPlot) of the linear regression lines are also shown in blue.
81

82
In accord with our prior study presented in section 3.3, we found that isosteric 28, 48,
39, 40, and 47 enter/depart baskets 46, 45, and 27 at rates corresponding to the linear free
energy relationship (LFER)67
ΔG‡
f/d = ρΔG° + δ, (Figure 43): the activation energies for
the entrance (ΔG‡
f) and departure (ΔG‡
d) of these guests were strictly a linear function of
the binding energies (ΔG°). We reason that the slope (ρ) of the fitted lines depicts the
susceptibility by which ΔG‡
f/d responds to the changes in ΔG°, therefore reporting on the
nature of the encapsulation’s transition state; thus, a small slope ρin would concur with an
early transition state. Second, the intercept (δ) describes the energy required for the
entry/departure of a hypothetical guest having the same size/shape as the isosteric guest
series, but no binding affinity (ΔG°=0). For each host, the two ΔG‡
f/d/ΔG° regression
lines converge at δ, whose value increased with slower gate dynamics (Figure 43).
Interestingly, baskets 27 and 45, having more dynamic gates (R = CH3 and Ph),
exhibited similar ρ values of roughly ρf = 0.25 for the ingress and ρd = −0.76 for the
egress of the isosteric guests (Table 7). Basket 46, however, with slower revolving gates
(R = CF3) showed distinctively different values: ρf = 0.08 and ρd = −0.93. Evidently, host
46 with gates revolving at the slowest rate had also the lowest capacity for distinguishing
between guests in the isosteric guest series. That is to say, the encapsulation of 28, 48,
39, 40, and 47 by basket 46 occurred at more similar rates than by baskets 27 and 45.
The greater gate activity is therefore associated with greater encapsulation selectivity and
vice versa. The binding of the isosteric guest series to basket 46 (R = CF3) is furthermore
slowed down when compared to basket 27 (R = CH3). A trend whereby a host with more
dynamic gates also exchanges guests at a faster rate ought to be reasoned from the

83
standpoint of the gate dynamics. Namely, the aromatic gates revolving at a slower rate,
that is, 46, would spend longer time in the “closed” position, hence more effectively
restricting the access to the host’s inner space.
To further inspect the relationship between the entrapment selectivity and the
basket’s gate dynamics, we scrutinized the rates describing the entrance/departure of
guests 41, 49, and 50 (Figure 42). Comparatively smaller 49 (93 Å3) was found to
enter/exit baskets 27, 45, and 46 at rates greater than expected from the linear relationship
established for the isosteric guest series (106–107 Å3, Figure 43). The entrance/departure
of bigger tetramethylsilane (41) would, however, take place at slower rates. At this point,
we reasoned that the magnitude of the deviation of the exchange rate of heterosteric guest
molecules 41, 49, and 50 from the established linear relationship for the isosteric guests
(described with the equation ΔG‡
f/d = ρΔG° + δ) would suggest the selectivity by which
the basket operates. In other words, a gated basket incapable of effectively
discriminating guests on the basis of the size/shape would solely promote their in/out
exchange on the basis of the encapsulation potential ΔG°, and closely abiding to the
established LFER.

84
Table 9: Difference in the experimental activation energy ΔG‡
f/d of guests 41 and 49
entering/departing baskets 46 (R = CF3), 45 (R = Ph), and 27 (R = Me), and computed
ΔΔG‡
f/d of hypothetical guests having the same affinity (ΔG°) for the encapsulation as 41
and 49 but the size and shape corresponding to the isosteric guest series. Guest Basket ΔΔG
‡f (kcal/mol) ΔΔG
‡d (kcal/mol)
CCl3CH3 46 0.07 ± 0.06 0.08 ± 0.13
CCl3CH3 45 0.30 ±0.05 0.31 ±0.04
CCl3CH3 27 0.46 ± 0.10 0.46 ± 0.04
Si(CH3)4 46 0.32 ± 0.06 0.33 ± 0.06
Si(CH3)4 45 0.32 ± 0.01 0.31 ± 0.01
Si(CH3)4 27 0.38 ± 0.06 0.39 ± 0.04
To quantitatively ascertain the distribution of the encapsulation rates for 41, 49, and
50, we first computed 90 % confidence band (SigmaPlot) for each of the fitted regression
lines pertaining to the isosteric guests entering/departing baskets 27, 45, and 46 (Figure
43). This particular statistical method is useful for revealing the distribution of data
having 90 % certainty with reference to the experimental values. Accordingly, the
activation energies ΔG‡
f/d of the heterosteric guests entering/exiting the less dynamic
basket 46 (R = CF3) appeared more within the band when compared to those regarding
baskets 45 (R = Ph) and 27 (R = CH3)(Figure 43); the rates for 1,1-dibromo-1-
chloroethane (50) were, for all three baskets, positioned quite close to the fitted lines,
which is likely due to the very small difference in volume between this (102 Å3) and the
guests from the isosteric series (106–107 Å3). Furthermore, we determined the difference
(ΔΔG‡
f/d) between the experimental activation energy, ΔG‡
f/d, for the entrance/departure
of 41/49 and the corresponding hypothetical guests having identical ΔG° while abiding to
the free energy relationship ΔG‡
f/d = ρΔG° + δ (Table 9). In particular, one notes an
increasingly larger |ΔΔG‡
f/d| values and, therefore, greater deviations for non-spherical

85
guest 1,1,1-trichloroethane (49) going from the less dynamic 46 to the more dynamic 27
(Table 9). The spherical tetramethylsilane (41), akin to the isosteric guests), however,
was to a much smaller degree (if any) discriminated by baskets 27, 45, and 46.
Nonetheless, the experimental observations still indicate a feasible correlation between
the dynamics of the gates and the basket’s kinetic selectivity such that more dynamic
gates afford greater entrapment selectivity with regard to size and shape.
Thus, our results are all in favor of the notion that baskets with more dynamic gates
(activity) are also capable of greater kinetic discrimination (selectivity) in trapping
compounds. Indeed, the effect appeared small, but is quantifiable and its
generality/magnitude remains to be investigated.78
The observed correlation between
size selectivity and gate dynamics can be rationalized by envisioning a revolving door.
When the door rotates around its axis at a relatively slow rate, small and large objects can
easily translocate through. When the rotation rate is increased, however, larger objects
will have greater difficulty passing through without being hit by the door due to a
decrease in the resulting “dynamic aperature”.
Interest toward understanding the gating79
of molecules and quantitative rules80
that
describe the process continues. The phenomenon could indeed be useful for controlling
chemical reactions occurring in artificial hosts81,82
and developing new ways for the
delivery of active compounds.83

86
3.5 Molecular Recognition of a Transition State
Bao, X.; Rieth, S.; Stojanovic, S.; Hadad, C. M. and Badjic, J. D. “Molecular
Recognition of a Transition State” Angew. Chem. Int. Ed. 2010, 49, 4816 - 4819.
Copyright 2011 Wiley-VCH verlag GmbH & Co. KGaA. Reproduced in part with
permission.
The conformational interconversion of encapsulated guest(s) has been previously
studied in artificial hosts,84-86
and complexation was almost uniformly identified to retard
or to have no effect, relative to a proper reference system. The deceleration has been
speculated to arise from steric and electronic characteristics of the hosts affecting the
reactant as well as the transition state(s) of the interconverting guest. The activation
barrier for the ring flipping of 1,4-thioxane and 1,4-dioxane required an additional 1.6–
1.8 kcal mol−1
(ΔΔG‡) within the restrictive interior of carcerands.
84 The chair–chair
interconversion process for cyclohexane was noted to occur slower in “jelly doughnut”
(ΔΔG‡
≈ 0.3 kcal mol−1
)85
and resorcin[4]arene (ΔΔG‡
= 0.25 ± 0.10 kcal mol−1
) based
cavitands.86
In the first case, this was rationalized by invoking favorable C-H⋅⋅⋅π
interactions to stabilize the chair ground state. Analogous studies on the rotation of the
amide bond in encapsulated environments showed such an interconversion occurred at a
faster/slower rate in hydrophobic, supramolecular assemblies87
than in polar or nonpolar
(ΔΔG‡
≈ 1–3 kcal mol−1
) solvents, respectively. In light of these discoveries, we chose to
investigate the ring-flipping process of cyclohexane-d11 within molecular baskets.
Surprisingly, ring-flipping rate acceleration is observed rather than retardation. We thus
measured the kinetics of the conformational interconversion of cyclohexane-d11 by

87
quantitative NMR spectroscopy and used electronic structure methods to identify the
origin of the observed acceleration.
Figure 44: An energy diagram for the conformational interconversion of cyclohexane.
The interconversion of ground- and transition-state conformers can be described with two
degrees of freedom ϕ1 and ϕ2. Note that only one cycle of the pseudorotation is shown.
The potential energy surface (PES) for the interconversion of cyclohexane, which has
been intensively studied both theoretically and computationally,88
is described with two
degrees of freedom (ϕ1 and ϕ2, Figure 44)88
and contains D3d-symmetric chair and D2-
symmetric twist-boat conformations as energy minima connected by C2-symmetric half-
chair and C2v-symmetric boat transition states (Figure 44). The chair-to-chair
interconversion is characterized by the first-order rate constant k, which on the basis of

88
the mechanism is twice the value of the experimental kobs.89
By using NMR
spectroscopy, Anet et al. measured the interconversion of C6D11H in CS2 as a solvent and
found that it occurs with an activation enthalpy (ΔH‡) of (10.71 ± 0.04) kcal mol
−1 and an
activation entropy (ΔS‡) of (2.2 ± 0.2) eu (Table 10).
90 Importantly, the activation energy
(ΔG‡) for the process is barely a function of the liquid phase (methylcyclohexane,
acetone, and CS2);91
although the value of ΔG‡ is somewhat higher in the gas phase
(Table 10).92
Table 10: Activation parameters ΔH‡, ΔS
‡, and ΔG
‡ (188.8 K) for the conformational
interconversion of cyclohexane-d11(2-D EXSY NMR, 400 MHz, CD2Cl2, 188.8 ± 0.1 K)
inside baskets 27, 45, and 46 in CS2, the gas phase, CD2Cl2, and C6D5CD3.
Solvent ΔH‡ (kcal/mol) ΔS
‡ (eu) ΔG
‡ (kcal/mol) k (s
-1)
CS2a 10.71 ± 0.04 2.2 ± 0.2 10.29 ± 0.06 4.7 ± 0.7
Gas phaseb 12.1 ± 0.5 5.7 ± 0.5 10.6 ± 0.5 2.1 ± 1.5
Basket 27 - - 9.43 ± 0.03 43 ± 3
Basket 45 - - 9.45 ± 0.02 41 ± 2
Basket 46 - - 9.56 ± 0.04 30 ± 3
CH2Cl2c 10.2 ± 0.1 0.4 ± 0.4 10.1 ± 0.1 6.9 ± 2.2
C6D5CD3c 10.3 ± 0.2 1.2 ± 0.7 10.1 ± 0.2 7.9 ± 4.3
a See Ref. 90
b See Ref. 92
c Obtained from Eyring plots and line-shape analysis of
1H
NMR signals (197 to 236 K).
There is moderate thermodynamic affinity for cyclohexane-d11 occupying the interior
of baskets 27 (R = Me), 45 (R = Ph), and 46 (R = CF3) (Table 11). The binding free
energy ΔG° is less favorable as more electron-withdrawing R groups (EWGs) are
installed at the amide position. It could be that the EWGs render the host’s shell less
polarizable, thereby disrupting its dispersion interactions with the guest; these
interactions, together with other factors, contribute to the ΔG° values.

89
Table 11: Thermodynamic parameters ΔH°, ΔS°, and ΔG° for the binding of
cyclohexane-d11 to baskets 27, 45, and 46 (ΔG° and K at 188.8 K) in CD2Cl2 obtained
from variable-temperature 1H NMR data (186–228 K) and van’t Hoff plots.
Basket ΔH° (kcal/mol) ΔS° (eu) ΔG° (kcal/mol) K (M-1
)a
27 -3.88 ± 0.07 -9.2 ± 0.3 -2.15 ± 0.03 314 ± 29
45 -3.92 ± 0.04 -10.3 ± 0.2 -1.96 ± 0.02 191 ±13
46 -3.31 ± 0.05 -9.7 ± 0.2 -1.48 ± 0.04 52 ± 5
a Obtained from ln K versus 1/T linear functions at 188.8 K.
The rate coefficient k for cyclohexane-d11 undergoing a chair flipping motion inside
baskets 27, 45, and 47 was determined by using 1H-
1H NMR EXSY spectroscopy
71,72 at
(188.8 ± 0.1) K (Table 10): the first-order magnetization rate constant k*obs (k*obs = kobs
= 1/2 k) was obtained for the chemical exchange of the proton residing at the axial and the
equatorial positions (Figure 45). At this low temperature, the rates for the entrapment
and the release of cyclohexane by the host were reduced below the EXSY detection limit,
as evidenced by the absence of the appropriate cross-signal in the spectrum (Figure 45).
The interconversion kinetics of cyclohexane-d11 in bulk dichloromethane (CD2Cl2) and
toluene (C6H5CD3) were measured concurrently by using both the classical line-shape
and the EXSY methodology: the results from both analyses are consistent and in good
agreement with published data (Table 10).89,90
On the basis of the measurements (Table
10), it was determined that the interconversion of cyclohexane occurs roughly five times
faster inside baskets 27, 45, and 46 than in the reference bulk solvents CD2Cl2 and
C6D5CD3. What is the origin of the acceleration?

90
Figure 45: A 2-D NMR EXSY spectrum (400 MHz, 188.8 ± 0.1 K) of a 14.0 mM
solution (CD2Cl2) of cyclohexane-d11 and basket 2 (1.40 mM). The volumes of the
diagonal and cross-signals were used to extract the magnetization rate constant k*obs that
characterized the conformational interconversion.
An elevated pressure was earlier demonstrated to facilitate the interconversion of
cyclohexane.91
Originally, the stochastic model for isomerization reactions88g,f
was used
to explain such a result. In contrast to conventional transition-state theory, this model
takes into account the recrossing of the activation barrier and proposes a dependence of
the transmission coefficient κ (the fraction of successful trajectories) on the collisional
frequency of molecules; in conventional transition-state theory κ=1. That is to say, the
reaction coordinate becomes coupled to the surrounding medium through collisions
between solvent and solute molecules. The unimolecular kinetics that describes the

91
isomerization of cyclohexane88c
in the liquid phase conflicts with statistical RRKM
theory, and the transmission coefficient κ is a function of the external pressure or
coupling of the solvent and solute. As the framework of the basket is in intimate and
prolonged contact with the entrapped and rapidly fluctuating cyclohexane, the collisional
contribution to the reaction coordinate could be sufficient to affect the interconversion
and thereby control the isomerization rate. Computational results obtained through
collaboration with the Hadad Group, however, offer an alternative explanation.
The acceleration of cyclohexane’s interconversion in the interior of these molecular
baskets is due to a) a reduced energy barrier from the chair local minimum to the half-
chair transition state or b) to a more efficient transmission coefficient κ.88b
The basket
could contribute energetically in two ways: the destabilization of the chair conformer and
the stabilization of the half-chair transition state (Figure 46).

92
Figure 46: Energy-optimized structures of chair (left) and half-chair (right) conformers
inside gated molecular basket 27 (M06-2X/6-31G(d)); note that some structural features
are omitted for clarity. Host–guest C-H⋅⋅⋅π contacts and the dihedral angle ϕ (Δϕ = 4.1°)
are also shown.
The Hadad Group first employed the ONIOM94
(MP2/6-31G(d):AM1) method to
investigate the complex formed between the basket and cyclohexane as a guest.
Unfortunately, only very small differences in the geometry and energy for both the chair
and half-chair conformers were seen between calculations on cyclohexane in a vacuum
and in the basket. They speculated an inadequate treatment of the host–guest interactions
may be the main reason for the inability of the ONIOM method to provide an explanation
to this experimental observation. Unfortunately, it was difficult to evaluate the system
with the MP2 level of theory because of its size.95
Thus, they employed density
functional theory (DFT) calculations using the M06-2X functional,96,97
as this method has
been optimized for studying noncovalent interactions between organic molecules. To
assess the role of the basket as a host, they obtained optimized geometries for the
cyclohexane guest inside the basket (for chair and half-chair TS structures) and then

93
recomputed the energies of the static chair and half-chair in a vacuum (that is, without the
basket) relative to fully optimized M06-2X calculations of cyclohexane in a vacuum.
According to the DFT results, the chair is slightly destabilized in the basket relative to the
isolated chair conformer in a vacuum (ΔE = 0.25 kcal mol−1
; Figure 46B). Further
inspection of the interatomic distances (Figure 46A) reveal three (cyclohexane) C-H⋅⋅⋅π
(basket) contacts (<2.7 Å from hydrogen to the π centroid)98
for the encapsulated chair
conformation, which leads to the C1 symmetry of the chair in the basket but a D3d
symmetry in a vacuum. Conversely, relative to the half-chair conformer in a vacuum, the
half-chair transition state of the guest is a more stabilized structure (ΔE = −0.90
kcal mol−1
) in the interior of basket 27. Examination of the encapsulated half-chair
conformation (Figure 46C) showed that three dihedral angles of the carbon skeleton
changed significantly as a consequence of the “fourth” C-H⋅⋅⋅π interaction with the upper
pyridine gate. This additional C-H⋅⋅⋅π contact may play a role in assisting the
“distortion” of the half-chair conformation, thereby moving it along the reaction
coordinate to more closely resemble the twist-boat product. The Hadad Group’s
computational studies implied that the encapsulated chair conformation is slightly
destabilized and that the half-chair TS is stabilized in the basket relative to that in a
vacuum. The activation barrier ΔE‡ for the interconversion of cyclohexane was thus
computed to be 10.87 kcal mol−1
in the interior of basket 1 (Table 12), which is a
significant reduction from the calculated barrier (12.02 kcal mol−1
) in a vacuum. A more
favorable conversion of the chair into the half-chair TS while inside the basket (ΔΔE‡ =

94
1.15 kcal mol−1
, Figure 46B) is somewhat consistent with the experimental finding (ΔΔG‡
≈ 0.5 kcal mol−1
).
Table 12: Computed energies (M06-2X/6-311++G(d,p)//M06-2X/6-31G(d)) for the
conformational interconversion of cyclohexane in a vacuum and inside basket 27.
Conformation Vacuum (kcal / mol) Basket 27 (kcal / mol)
Chair 0a 0
Half-chair 12.02 10.87
Twist-boat 6.19 6.05
Boat 7.51 - a For comparison, the computed energy corresponding to the chair conformational state
was in each case set at zero.
The computational study revealed two Heq atoms and one Hax atom of the chair
conformation making C-H⋅⋅⋅π contacts with the basket (Figure 46A). This result is in
agreement with a greater difference in the chemical shift Δδax/eq of the axial/equatorial
protons of cyclohexane-d11 inside baskets 27, 45, and 46 (227 Hz) than in bulk solvent
(190 Hz, Figure 45). Moreover, the splitting pattern of the 1H NMR signals of the
entrapped cyclohexane-d11 did not alter at lower temperatures, thus suggesting a low
activation barrier for this compound tumbling in the interior of 27, 45, and 46. The
results of molecular dynamics (MD) simulations are consistent with this observation,
disclosing a random fluctuation of cyclohexane (111 Å3) inside closed baskets (ca. 221
Å3) over a period of 10 ns.
Overall, the acceleration of the ring-flipping process of cyclohexane is found to be a
result of more favorable noncovalent binding, and hence stabilization of the transition
state, of the encapsulated compound. Incorporation of such control elements into the

95
design of artificial hosts with the purpose of facilitating dynamical change is desireable,
but remains challenging given the subtle nature of weak noncovalent contacts.
Serendipitous discoveries, however, provide critical information for enhancing our
understanding of the fine details pertaining to the rational design of encapsulation-based
catalysts.
3.6 Chapter 3 Summary and Conclusions
From our previous developments of molecular baskets folded by intramolecular
hydrogen bonds using phenol groups (Section 1.3) and by metal chelation (Chapter 2) it
was clear that in order to create kinetically stable host-guest complexes, the dynamics of
the gates had to be minimized to create a better preorganized cavity. Thus, a family of
molecular baskets folded by intramolecular hydrogen bonds using pyridinyl-amido gates
were synthesized. The gates of these baskets possess two hydrogen bond contact points
(the pyridine nitrogen and amido hydrogen) to aid in reducing dynamics. The folding of
the baskets resulted in a pair of dynamic enantiomers whereby the resulting hydrogen
bond array can be orientated clockwise or counterclockwise. Throughout our studies,
dynamic NMR studies have been utilized to quantify the barrier to interconversion, which
is related to the barrier of the basket opening and closing.
Through our initial studies of the new molecular baskets, it was found that the
encapsulation of guest molecules follows an associative mechanism whereby the gates
must unfold prior to guest exchange. Indeed, it was found that the dissociation of guest

96
molecule CCl4 is roughly the sum of the intrinsic binding energy (ΔG°) and the energy
required for the interconversion (opening) of the gates.
Additionally, a series of guest molecules were trialed with the molecular basket to
identify what critical structures/features were necessary to drive the encapsulation. From
the electrostatic potential surface of the host, it was clear that halocarbons would exhibit
favorable electrostatic interactions within the interior. Furthermore, it was found that
molecules possessing a packing coefficient of 40 – 48% (roughly 88 to 106 Å3) fit nicely
inside. Overall, the ideal guest molecules, which were used in further studies, were found
to be spherical halogenated methanes as well as spherical molecules within the
aforementioned packing coefficient range. An important observation is the addition of
methyl groups to isosteric guest molecules (e.g. tetrabromomethane and t-butyl bromide)
results in a decrease of host-guest affinity primarily due to a relative disfavorable entropy
of formation.
With knowledge of the types of guests that can be effectively encapsulated within the
interior of basket 27, we then sought to modify how fast the basket opens and closes. To
accomplish this, the R group of the amide tethered to the gates was modified with a
variety of substituents of differing steric and electronic effect such that they would
perturb the resulting hydrogen bond array upon folding. Through the use of Taft plots, it
was found that electron withdrawing groups slowed the rate of unfolding considerably
while sterics had little effect.
Possessed with a means of obtaining molecular baskets with the same cavity volume,
but with gates opening/closing at different rates at the same temperature, it was now

97
possible to evaluate the gating properties of this system. Thus, linear free energy
relationships were constructed between the rates of ingress and egress of isosteric guest
molecules (Δ‡Gf and ΔG‡d) and the corresponding host-guest affinity (ΔG°). After
comparing the rates against guest molecules who differ in profile (i.e. they possess a
different size/shape) it is found that the basket kinetically discriminates according to the
size of a molecule whereby molecules smaller in volume enter/leave the cavity at a faster
rate than larger molecules. After studying this phenomenon in molecular baskets that
open/close at a variety of rates, it was found that the more dynamic baskets (krac is high)
discriminates between guest sizes more effectively than those with less dynamics.
Another interesting property found in molecular basket 27 is its unusual ability to
catalyze the rate of interconversion between the two chair states in cyclohexane within its
interior. Previously, such processes were observed to be slower within the confined
environment of a host. Through a computational study performed by the Hadad Group, it
was found that the rate acceleration is primarily due to the stabilization of the half-chair
transition state and slight destabilization of the chair ground state within the interior.
As discussed in Chapter 1, gating provides natural systems, such as the enzyme
acetylcholinesterase, with the ability to dramatically increase the size/shape selectivity of
guest molecules while sacrificing little catalytic efficiency. In our studies with the
intramolecular hydrogen bond folded baskets presented within this chapter, it was found
that the consequences of gating are not unique to natural systems, but these properties
manifest themselves into simple artificial host systems as well. The development of
novel, useful, efficient, and selective artificial supramolecular reactors demands a

98
fundamental understanding of the functions that give rise to desired properties in natural
systems. Progress in the understanding and application of one of these critical functions,
gating, will aide in the development of future sophisticated artificial systems.

99
Chapter 4: Interconversion Between the Two Modes of Folding
4.1 A Four-State Molecular Switch
Reproduced in part with permission from Rieth, S.; Wang, B.; Bao, X. and Badjic, J. D.
Org. Lett. 2009, 11, 2495 - 2498. Copyright 2009 American Chemical Society.
Chapters 2 and 3 described molecular baskets folded by metal chelation and
intramolecular hydrogen bonds respectively. Of importance, is the fact that each mode of
folding presented a unique size/shape selectivity among guests (e.g. for Cu(I) coordinated
basket 18, small linear coordinating molecules such as acetonitrile are preferred32
, as
opposed to spherical halomethane molecules for hydrogen-bond folded 27).54
Interestingly, the gate structures for these two baskets (3-pyridyl and 3-pyridyl-5-amido
respectively) are remarkably similar and, since both are pyridine-based, can be
potentially folded with metal cations. Thus, we studied whether we could achieve a
stimulus-mediated interconversion99
between the two folded states using basket 27
(Figure 47).

100
Figure 47: Chemical structures of hydrogen bonded (27A/B, A) and Cu(I) folded
(27:Cu(I), B) basket 27. Side views of energy minimized (DFT, B3LYP) structures of
27A/B (top) and 27:Cu(I) (bottom).
As described previously, molecular basket 27 has been designed to contain three
pyridine-based gates, linked via intramolecular hydrogen bonding from meta amido
groups, to occlude space and thus form a dynamic and gated environment (Figure 47A).
The downfield 1H NMR chemical shift (δ = 10.8 ppm, Figure 48A) of the N−H
resonances indicates the intramolecular HB contacts. The “hinge” Hd/e spins appeared as
a singlet at high temperatures and as an AB quartet at low temperatures, thus
demonstrating the interconversion of two C3 symmetric enantiomers, 27A and 27B, each
containing hydrogen bonds displayed in the clockwise or the counter-clockwise

101
orientation. In essence, the 27A/B interconversion necessitates that each of the gates
revolve 180° about the “vertical” axis. The activation energy (ΔG‡
rac,298) for this internal
motion was found to be on the order of 10.8 kcal/mol, from NMR line-shape analysis.
Figure 48: (A) Selected regions of 1H NMR spectra (400 MHz, 298 K) of 27 (1.9 mM,
CD2Cl2/C6D6 = 2:1) recorded after addition of: (a) 6, (b) 12, (c) 18, (d) 24, (e) 30, (f) 36,
(g) 42, (h) 48, and (i) 54 μL of 17.4 mM solution of (CuOTf)2PhMe. (B) 1H NMR
chemical shifts of the Hf resonance in 27 (1.9 mM) as a function of the titrated
(CuOTf)2PhMe (17.4 mM). (C) 1H NMR chemical shifts of the Ha resonance in 16 (2.5
mM) as a function of the titrated (CuOTf)2PhMe (32.5 mM).
Upon an incremental addition of a standard solution of (CuOTf)2PhMe to 27A/B in 2:1
CD2Cl2:C6D6, the basket’s 1H NMR spectrum changed: (a) the N−H resonance shifted
upfield (Δδ = 2.0 ppm) and (b) the aromatic Hb/c/f resonances moved downfield (Figure

102
48A). Evidently, the addition of Cu(I) disrupted the intramolecular N−H…
N contacts in
27A/B and promoted the formation of another C3 symmetric assembly. Indeed, the results
of 1H NMR DOSY,
35,36 COSY, NOESY spectroscopic and MALDI
37,38 spectrometric
measurements suggested the existence of 27:Cu(I) (Figure 47). When the chemical shift
for the Hf resonance was plotted against the molar equivalents of Cu(I) added to 27A/B, a
sigmoidal dependence was evident (Figure 48B). Perhaps, the formation of the 27:Cu(I)
complex occurred stepwise with some degree of cooperativity.100,101
Molecular basket
16, with freely rotating pyridine gates (i.e., without amido groups), was previously shown
to bind Cu(I), thereby yielding the 18a complex (Figure 48C, see section 2.2 and 2.3).
Interestingly, the assembling of 18a (Figure 48C) required a greater quantity of copper
than the formation of 27:Cu(I) (Figure 48B) in this solvent system. The finding that it is
“easier” to coordinate 27 than 16 to Cu(I) is intriguing; the electronic/steric substituent
effects of the meta amides, evidently, played a role in the binding thermodynamics.

103
Figure 49: Selected regions of 1H NMR spectra (400 MHz, 243 K) of a solution of
basket 27 (1.22 mM, CD2Cl2/C6D5CD3 = 2:1) containing CH3CBr2CH3 (19.5 mM) and
CH3NC (1.22 mM), and recorded after an addition of 13.0 mM (CuOTf)2PhMe and 26.0
mM CH3NC. Molar equivalents of Cu(I) and CH3NC are shown on the left.
Basket 27A/B trapped 2,2-dibromopropane in the presence of methyl isocyanide
(Figure 49). The upfield 1H NMR singlet at δ ~−0.7 ppm, corresponding to C3H6Br2
inside of 27, corroborated such an occurrence. Upon addition of Cu(I) to 27A/B, however,
the basket transformed into 27:Cu(I) entrapping CH3NC inside its cavity. The
disappearance of the resonance at −0.7 ppm and the appearance of another singlet at −0.3
ppm (CH3NC) is in accord with that scenario (Figure 49). Interestingly, during the
titration, the emergence of Cu(CH3NC)4+ (δ = 3.3 ppm, Figure 49) was observed to
precede the formation of 27:Cu(I):CH3NC. An excess of CH3NC, however, led to the

104
reappearance of 27A/B (Figure 49). The removal of Cu(I) from 27:Cu(I):CH3NC, along
with the re-encapsulation of C3H6Br2, was also accomplished with the addition of Na2S.
Evidently, the basket can be reversibly switched between two structural states with
comparable interior volumes of 221 Å3 and each expressing a unique functional
behavior of encapsulation: 27:Cu(I) showed no affinity for trapping 2,2-dibromopropane,
while 27A/B was not amenable toward encapsulating CH3NC. Stoichiometrically
balanced equations for the guest-mediated interconversion of Cu(I) folded and hydrogen
bonded baskets are shown in Figure 50.

105
Figure 50: Stoichiometrically balanced equations describing the products obtained during the addition events in Figure 47,
including A) the first 0.125 molar equivalents of Cu2(PhMe)OTf2, B) the additional 0.375 molar equivalents of Cu2(PhMe)OTf2,
and C) the addition of three molar equivalents of CH3NC. The chemical structures of D) 27:C(CH3)2Br2 and E)
[27:Cu(I):CH3NC]OTf.
105

106
Presumably, the internal basket’s dynamics (in addition to other factors) played an
important role for expressing the guest selectivity via preorganization.102
The 27A/B
interconversion (Figure 47) necessitates the cleavage of N−H…
N hydrogen bond(s) and is
energetically demanding (expt ΔG‡
rac,298 = 10.8 kcal/mol). The analogous conformational
change in 27:Cu(I):CH3NC, however, is more facile and can occur without rupturing the
Cu−N coordinative bonds. This dynamic process was not observed experimentally, but
computed (DFT, B3LYP) to require a small activation energy (ΔG‡ = 3.9 kcal/mol).
The basket’s stimuli-responsive characteristics were further examined under acidic
conditions. The nitrogen atoms, at the pyridine gates in 27A/B, were expected to abstract
hydrogen(s) from strong proton donors thereby obstructing the internal hydrogen bonding
at the rim of the basket and the encapsulation. An incremental addition of CF3CO2H
(TFA) to a solution of 27A/B, containing 2,2-dibromopropane, prompted considerable 1H
NMR spectroscopic changes (Figure 51). The addition of one molar equivalent of TFA
led to the formation of [27 H]+; note the occurrence of red-colored signals in Figure 51.
1H NMR DOSY, COSY and NOESY spectroscopic measurements suggest the existence
of [27 H]+. The single protonation, interestingly, initiated the expulsion of 2,2-
dibromopropane (Figure 51). At first, the entrapment of trifluoroacetate anion was
suspected for contributing to the guest’s dismissal. However, the CF3 fluorine resonance
(19
F NMR) remained unaffected during the titration, indicating the absence of the TFA
encapsulation. In fact, the shape complementary CH3SO3− anion (from CH3SO3H) was
also shown to reside outside of [27 H]+. A molecule of solvent (CD2Cl2) must,
therefore, be occupying the singly protonated basket.

107
Figure 51: Series of 1H NMR spectra (400 MHz, 243 K) of a solution of 27 (1.3 mM,
CD2Cl2) containing CH3CBr2CH3 (2.2 mM) and recorded after addition of 65.0 mM
standard solution of TFA. Diffusion coefficients (Dobs) and the corresponding
hydrodynamic radii (rH) were obtained from 1H NMR DOSY measurements (500 MHz,
300 ± 1 K).
Variable temperature 1H NMR spectra of [27 H]
+ exhibited a set of resonances
corresponding to a C3 symmetric compound. In particular, a sharp singlet for the hinge
Hd/e protons and a downfield shifted N−H resonance (δ = 11.2 ppm) were prominent: the
protonated basket comprises a set of rapidly revolving gates interacting via hydrogen
bonds; alternatively, more elaborate 1H NMR spectra, corresponding to less symmetric
structure(s), would be expected.
A Monte Carlo conformational study of [27 H]+ (MMFF force field) provided an
insight into the host’s dynamics. Three hydrogen bonded and Cs symmetric conformers,

108
with a comparable thermodynamic stability of Esteric = 0−3 kcal/mol, were found.
Accordingly, the experimental 1H NMR results could be interpreted by a rapid gate-
flipping motion assisted with proton shuttling that averaged the hydrogen spins to give a
spectrum corresponding to a C3 symmetric structure. The enhanced dynamics at the rim
of [27 H]+ contributed to the development of a poorly preorganized inner space
102 and,
evidently, altered the basket’s capacity for acting as a host.
Further protonation of [27 H]+ caused the appearance of a new set of
1H NMR
signals, representing another C3 symmetric assembly on average, as shown in blue in
Figure 51. Notably, the addition of TFA restored the capacity for entrapping 2,2-
dibromopropane, whose 1H NMR signal shifted further downfield (δ = −0.8 ppm, Figure
51). Evidently, 2,2-dibromopropane experienced less diamagnetic shielding inside the
newly formed host. The trend in the hydrodynamic radii (Figure 51) pointed to the
basket’s aggregation, and possibly assembling into a more sizable dimer. Indeed, when
2,2-dibromopropane was used in excess (to saturate the host), the encapsulation was
complete and the integrated basket:guest signal ratio was 2:1 (Figure 52B)! Moreover,
the C3 symmetric nature of [272 H3]3+
concurred with the recorded 1H NMR spectrum:
two equally strong signals, for each of the Hb/Hc/Hf protons, correspond to the nuclei
residing in the northern and the southern portion of the dimer (Figure 52A). A close
proximity of the Hb and Hc protons was also manifested by the NOE cross signal. The
inner volume of [272 H3]3+
, with the gates pointing to the bulk solvent, was estimated to
be 307 Å3. Guests such as 2,2-dibromopropane (105 Å
3) and dichloromethane (83 Å
3)
occupy ~61% of the inner space of [272 H3]3+
, accounting for the experimentally

109
observed encapsulation. Ultimately, the addition of K2CO3 to [272 H3]3+
led to the
formation of 27A/B, with the transient appearance of [27 H]+ The guest-exchange
capacity of the basket can thus be reversibly controlled at yet another level using an
acid/base stimulus.
Figure 52: (A) Variable temperature 1H NMR spectra (500 MHz) of a CD2Cl2 solution of
27 (0.7 mM) containing 34.0 mM CH3CBr2CH3 and 2.7 mM TFA. (B) Integration
proportion (1H NMR) of Ha or Hb resonances in 27 and the proton nuclei in the
encapsulated CH3CBr2CH3 were used to obtain basket/guest ratio as a function of
temperature. (C) Top and side views of energy minimized (MMFF) structure of
[272 3H]3+
.

110
4.2 Chapter 4 Summary and Conclusions
Molecular basket 27, composed of a semi-rigid C3V symmetric tris-norbornadiene
platform and three pyridine gates with acetamide groups was evaluated as to whether it
can interconvert between the intramolecular hydrogen bond mode of folding to metal
chelation through use of an added stimulus. Thus, the pyridine gates have been shown to
fold via intramolecular hydrogen bonds such that tert-butyl bromide is effectively
encapsulated. Upon addition of Cu(I), the mode of folding switches to that of metal
chelation, resulting in the expulsion of the tert-butyl bromide and the exclusive
encapsulation of methyl isocyanide; a process that may be reversed by addition of Na2S.
The hydrogen-bond assembly was also found to be easily disrupted by addition of
trifluoroacetic acid, forming a hightly dynamic system with one equivalent and a dimer
encapsulating one molecule of tert-butyl bromide and one molecule of dichloromethane
with 1.5 equivalents. The transformations involving TFA have also been found to be
readily reversible with K2CO3, thus showing the original basket may function as a unique
four-state molecular switch.
The design and preparation of switchable systems with stimuli-responsive
behavior gives access to a variety of versatile materials.103
The results of our study
contribute to such efforts, and demonstrate the adaptive nature of dynamic and gated
hosts. Furthermore, the implementation of function into artificial structures demands a
tunable element of design making the described four-state mode of action here a useful
paradigm.

111
Chapter 5: Experimental
5.1 General Methods
All chemicals were purchased from commercial sources, and used as received unless
stated otherwise. All solvents were dried prior to use according to standard literature
protocols. Chromatography purifications were performed using silica gel 60 (Sorbent
Technologies 40- 75μm, 200 x 400 mesh). Thin-layer chromatography (TLC) was
performed on silica-gel plate w/UV254 (200μm). Chromatograms were visualized by
UV-light and stained using 20% phosphomolybdic acid in ethanol if needed. Melting
points were determined on an Electrothermal melting point apparatus in open capillaries
and are reported uncorrected. 1H and
13C NMR spectra were recorded, at 400 MHz and
100 MHz respectively, on a Bruker DPX-400 spectrometer unless otherwise noted. They
were referenced using the solvent residual signal as an internal standard. NMR samples
were prepared using CD2Cl2 and CDCl3 purchased from Cambridge Isotope Laboratories.
The chemical shift values are expressed as δ values and the couple constants values (J)
are in Hertz (Hz). The following abbreviations were used for signal multiplicities: s,
singlet; d, doublet; t, triplet; m, multiplet; and br, broad. Temperatures were corrected
through use of a 100% methanol standard.

112
5.2 Synthetic Procedures
7.26
A solution of 14 (15 mg, 0.03 mmol) and Ac2O (2 mL) was heated at 130 ºC
for 2 h. The solvent was removed in high vacuo to afford 7 as a white solid (13.0 mg, 90
%). M.p. >300 ºC; 1H NMR (400 MHz, CD3SOCD3, 25 ºC): δ =7.99 (s, 6H), 4.77 (s,
6H), and 2.56 ppm (s, 6H); 13
C NMR (100 MHz, CD3SOCD3, 25 ºC): δ =163.0 (C),
159.8 (C), 138.0 (C), 129.4(C), 117.9 (CH), 65.0 (CH2), 48.3 (CH); HRMS(ESI): m/z
calcd for C39H18O9Na 653.0843 [M+Na]+; found: 653.0826.
8.26
A mixture of freshly distilled cyclopentadiene (2.65 g, 0.04 mol) and cis-1,4-
dichloro-2-butene (4.16 g , 0.033 mol) in benzene (3 mL) was heated at 180 ºC for 5 h in
a sealed tube. The reaction mixture was cooled to room temperature and benzene was

113
evaporated under reduced pressure. The remaining residue was distilled in vacuo to
afford 8 as a colorless oil (4.5 g, 71 %). B.p. = 85.0 ºC at 0.5 mm Hg; 1H NMR (400
MHz, CDCl3, 25 ºC): δ = 6.25 (dd,2H, J1 = J2 = 1.8 Hz), 3.31 (dd, 2H, J1 = 5.7 Hz, J2 =
10.7 Hz), 3.14-3.09 (m, 4H), 2.63-2.60 (m,2H), 1.55 (m, 1H), and 1.37 ppm (d, 1H, J =
8.6 Hz); 13
C NMR (100 MHz, CDCl3, 25 ºC): δ =135.6 (CH), 48.4 (CH2), 46.6 (CH),
45.6 (CH), and 45.0 ppm (CH2). MS(ESI): m/z calcd for C9H12Cl2Na: 213.0 [M+Na]+;
found: 213.0.
9. To a solution of 8 (21.6 g, 113 mmol) in 390 mL of n-nonane at 150oC was added Br2
(5.80 mL, 18.1 g, 113 mmol) dropwise. The resulting mixture was heated/stirred for an
additional 15 min before being cooled to 0oC. The resulting precipitate was collected by
vacuum filtrated and washed with cold hexanes (2 x 100 mL) to yield 9 (14.0 g, 35%) as
a white solid. Any unreacted starting material may be recovered via column
chromatography (5:1 hexanes:dichloromethane). M. p. 96 ºC; 1H NMR (400 MHz,
CDCl3, 25 ºC): δ =4.46 (d, 2H, J = 2.0 Hz), 3.66 (dd, 2H, J1 = 6.6 Hz, J2 = 11.4 Hz),
3.41 (dd, 2H, J1 = 9.8 Hz, J2 = 11.3 Hz), 2.89 (t, 2H, J = 1.8 Hz), 2.54-2.51 (m, 2H),
2.40 (d, 1H, J = 11.0 Hz), and 1.56 ppm (dt, 1H, J1 = 1.6 Hz, J2 = 11.0 Hz); 13
C NMR
(100 MHz, CDCl3, 25 ºC): δ = 52.7 (CH), 50.9 (CH), 43.5 (CH), 40.9 (CH2), and 34.4
ppm (CH2); HRMS(ESI): m/z calcd for C9H12Br2Cl2Na: 372.8558 [M+Na]+; found:
372.8571.

114
10.26
To a solution of 9 (2.4 g, 6.8 mmol) in THF (68 mL) at 0 ºC, potassium tert-
butoxide (14.5 g, 0.14 mol) was added under an argon atmosphere. The reaction mixture
was left to stir for 2 h, before being quenched with water (6 mL) and extracted with
hexanes (3 x 50 mL). The organic phase was dried (MgSO4) and evaporated under
reduced pressure. The solid residue was purified by column chromatography (SiO2,
hexanes) to afford 10 as a colorless oil (1.1 g, 82%). 1H NMR (400 MHz, CDCl3, 25 ºC):
δ = 6.20 (d, 1H, J = 3.1 Hz), 5.31 (s, 1H), 5.25 (s, 1H), 5.13 (s, 1H), 5.00 (s, 1H), 3.36 (s,
1H), and 3.30 ppm (s, 1H); 13
C NMR (100 MHz, CDCl3, 25 ºC): δ = 135.4 (CH), 103.4
(CH2), 102.4 (CH2), 58.7 (CH), 52.2 (CH) and 50.9 ppm (CH2); HRMS(ESI): m/z calcd
for C9H10Br: 196.9960 [M+H]+; found: 197.0033.
11.32
A carbon tetrachloride (150 mL) solution of 10 (5.37 g, 27.2 mmol) and freshly
distilled dimethyl acetylenedicarboxylate (5.32 g, 37.4 mmol) was allowed to stir at
reflux for 12 h. The solvent was removed under reduced pressure to yield an amber oil
(9.24 g). The oil was dissolved in dichloromethane (200 mL) and solid 2,3-dichloro-5,6-
dicyano-p-benzoquinone (7.10 g, 31.3 mmol) was added. The mixture was mechanically

115
stirred under argon (12 h, rt), before it was “washed” with a saturated aqueous NaHCO3
solution (3 × 200 mL) and dried (MgSO4), and the organic layer was concentrated in
vacuo. The solid residue was purified by column chromatography (SiO2, CH2Cl2) to yield
11 (6.54 g, 71%) as a colorless oil. 1H NMR (400 MHz, CDCl3, 298 K): δ 2.35 (1H, d, J
= 7.6 Hz), 2.63 (1H, d, J = 8.0 Hz), 3.85 (1H, s), 3.88 (6H, s), 4.00 (1H, s), 6.73 (1H, d, J
= 3.2 Hz), 7.51 (1H, s), and 7.65 ppm (1H, s); 13
C NMR (100 MHz, CDCl3, 298 K): δ
51.7, 52.6, 52.7, 58.2, 68.8, 121.5, 122.1, 128.9, 130.1, 135.8, 139.8, 153.3, 153.9, 168.1,
and 168.4 ppm; HRMS (EI): m/z calcd for C15H14BrO4 337.0075 [M + H]+; found
337.0061.
12.32
To a solution of dry diisopropylamine (830 μL, 5.90 mmol) in THF (20 mL) at −78
°C was added n-butyl lithium (1.6 M in hexanes, 3.60 mL, 5.76 mmol), and the mixture
was stirred for 40 min under an atmosphere of argon. A solution of 11 (1.50 g, 4.45
mmol) in THF (10 mL) was then added dropwise over a period of 10 min, and the
resulting mixture was stirred for an additional 30 min. Following, a solution of
trimethyltin chloride (937 mg, 4.76 mmol) in THF (10 mL) was added dropwise over a
period of 10 min, and the resulting mixture was gradually warmed to room temperature
over a period of 3 h. Aqueous NH4Cl (4 mL) was used to quench the base, followed with
the removal of the organic layer in vacuo. The solid residue was washed with water (60

116
mL) and extracted with diethyl ether (2 × 70 mL). The combined organic phase was dried
(MgSO4) and concentrated in vacuo. The solid residue was purified by column
chromatography (SiO2, hexanes/ethyl acetate, 2:1) to yield 12 as a white solid (1.59 g,
72%). Mp 139−140 °C; 1H NMR (400 MHz, CDCl3, 27 °C): δ 0.24 (9H, t, J = 40 Hz),
2.27 (1H, d, J = 7.6 Hz), 2.57 (1H, d, J = 7.6 Hz), 3.91 (7H, s), 4.09 (1H, s), 7.47 (1H, s),
and 7.65 ppm (1H, s); 13
C NMR (100 MHz, CDCl3, 27 °C): δ −9.3, 52.5, 52.6, 57.0, 60.2,
68.4, 121.1, 122.0, 129.0, 129.8, 147.0, 152.2, 153.6, 154.0, 168.4, and 168.5 ppm;
HRMS (EI): m/z calcd for C16H16BrO4Sn 500.9723 [M + H]+; found 500.9687.
13.32
A mixture of 12 (1.09 g, 2.18 mmol) and Cu(NO3)2·2.5H2O (2.53 g, 10.9 mmol) in
acetone (53 mL) was stirred at 50 °C overnight. The solvent was removed in vacuo and
the remaining residue was washed with a 10% aqueous NH3 solution (60 mL) and
extracted with diethyl ether (3 × 100 mL). The combined phase was dried (MgSO4) and
concentrated in vacuo. The solid residue was purified by column chromatography (SiO2,
dichloromethane/acetone, 9:1) to yield 13 (75.8 mg, 13.6%) as a white solid. Mp 215 °C;

117
1H NMR (400 MHz, CDCl3, 27 °C): δ 2.54 (6H, s), 3.80 (18H, S), 4.43 (6H, s), and 7.45
ppm (6H, s); 13
C NMR (100 MHz, CDCl3, 27 °C): δ 48.8, 52.3, 65.4, 121.6, 129.8, 137.8,
152.8, and 168.1 ppm. HRMS (ESI): m/z calcd for C45H36O12Na 791.2099 [M + Na]+;
found 791.2098.
14.26
An aqueous solution of LiOH · xH2O (60 mg, 1.43 mmol; 2 mL) was added to a
solution of 13 (30 mg, 0.04 mmol) in THF (2 ml), and subsequently heated at 80 ºC for 2
h. The aqueous phase was acidified with a 10% aqueous HCl solution (1 mL), and the
resulting precipitate filtered, washed with water (2 mL), and dried at 90 ºC under high
vacuum to yield 14 as a white solid (25.4 mg, 95 %). M.p. >300 ºC; 1H NMR (400 MHz,
CD3SOCD3, 25 ºC): δ = 12.67 (br, 6H), 7.46 (s, 6H), 4.62 (s, 6H), and 2.42 ppm (s, 6H);
13C NMR (100 MHz, CD3SOCD3, 25 ºC): δ =168.8 (C), 153.3 (C), 138.3 (C), 130.6 (C),
121.5 (CH), 5.3 (CH2), and 48.3 ppm (CH); HRMS(ESI): m/z calcd for C39H24O12Na
707.1150 [M+Na]+; found: 707.1165.

118
18.33
To a solution of trisanhydride 7 (2.5 mg, 0.004 mmol) in toluene (1.0 ml), was
added a solution of 3-(aminomethyl)pyridine (2.6 mg, 0.024 mmol) in toluene (0.5 ml).
Then neat pyridine (150.0 μl) was added, before the solution was heated to reflux for 12
h. The reaction mixture was then cooled to room temperature, evaporated in vacuo, and
the residue purified by column chromatography (SiO2, benzene/acetone, 3:1) to yield 18
as a white solid (3.6 mg, 87 %). 1H NMR (500 MHz, CDCl3, 27 ºC): δ = 8.25 (s, 3H),
8.16 (s, 3H), 7.46 (d, 3H), 7.30 (s, 6H), 7.03 (dd, 3H), 4.44 (s, 6H), 4.32 (s, 6H), and 2.34
(s, 6H) ppm; 13
C NMR (100 MHz, CDCl3, 27 ºC): δ = 167.6 (C=O), 156.8 (CH), 137.8
(CH), 136.3 (C), 129.0 (CH), 128.2 (CH), 125.3 (CH), 123.4 (C), 122.7 (C), 118.5 (C),
68.2 (CH2), 49.3 (CH), and 42.7 (CH2) ppm. MALDI-TOF m/z calcd for C57H36N6O6Na:
923.260 [M+Na]+, found: 923.331.
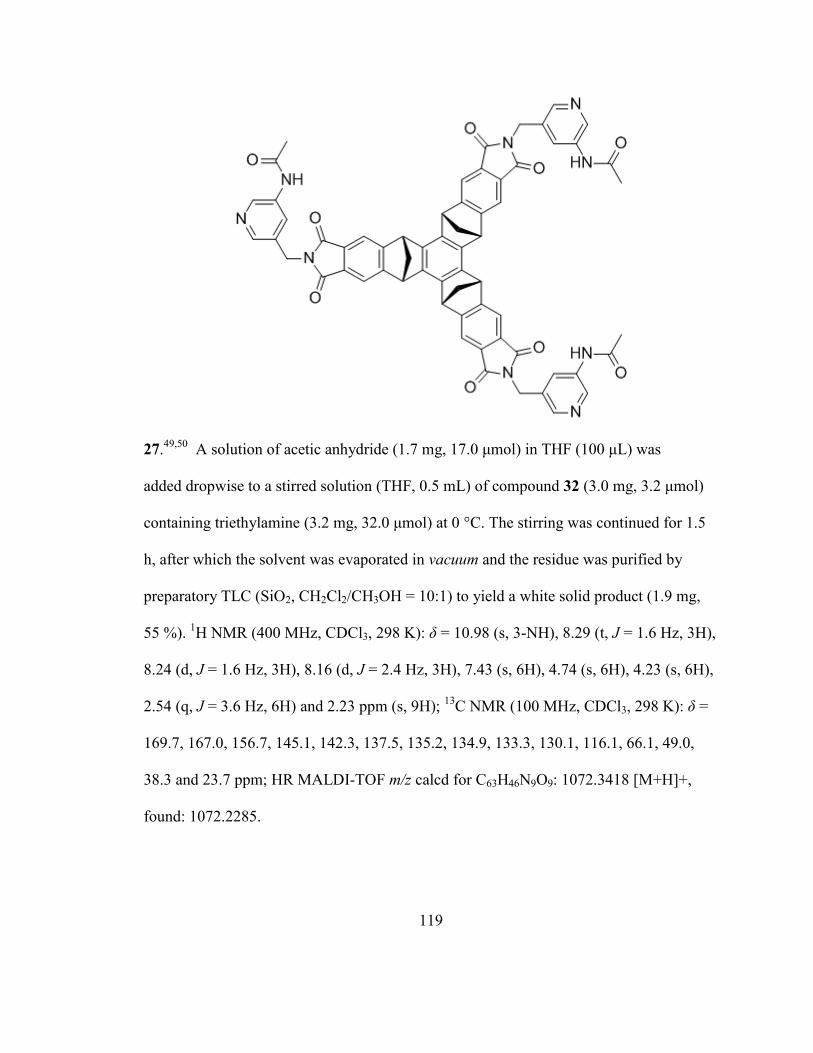
119
27.49,50
A solution of acetic anhydride (1.7 mg, 17.0 μmol) in THF (100 μL) was
added dropwise to a stirred solution (THF, 0.5 mL) of compound 32 (3.0 mg, 3.2 μmol)
containing triethylamine (3.2 mg, 32.0 μmol) at 0 °C. The stirring was continued for 1.5
h, after which the solvent was evaporated in vacuum and the residue was purified by
preparatory TLC (SiO2, CH2Cl2/CH3OH = 10:1) to yield a white solid product (1.9 mg,
55 %). 1H NMR (400 MHz, CDCl3, 298 K): δ = 10.98 (s, 3-NH), 8.29 (t, J = 1.6 Hz, 3H),
8.24 (d, J = 1.6 Hz, 3H), 8.16 (d, J = 2.4 Hz, 3H), 7.43 (s, 6H), 4.74 (s, 6H), 4.23 (s, 6H),
2.54 (q, J = 3.6 Hz, 6H) and 2.23 ppm (s, 9H); 13
C NMR (100 MHz, CDCl3, 298 K): δ =
169.7, 167.0, 156.7, 145.1, 142.3, 137.5, 135.2, 134.9, 133.3, 130.1, 116.1, 66.1, 49.0,
38.3 and 23.7 ppm; HR MALDI-TOF m/z calcd for C63H46N9O9: 1072.3418 [M+H]+,
found: 1072.2285.

120
29.51
To a solution of 5-amino-nicotinic acid (450 mg, 3.26 mmol) in 20 mL of methanol
at 0°C was added thionyl chloride (4.50 mL, 7.37 g, 61.9 mmol) dropwise. The resulting
mixture was refluxed and the reaction monitored by TLC (10:1
dichloromethane:methanol). After completion (c.a. 2 h), the mixture was cooled to room
temperature and the solvent was removed in vacuo. 15 mL of water was added to the
resulting residue and the mixture is neutralized by careful addition of 7 mL of a saturated
sodium bicarbonate solution. The mixture is extracted with ethyl acetate (5 x 30 mL) and
the combined organic fractions were dried (Na2SO4) and concentrated in vacuo to yield
crude 29 (328.5 mg, 66%) as a white solid which was used without further purification.
1H NMR (DMSO-d6, 400 MHz, 300 K) δ = 8.04 (1H, d, J = 5.4 Hz), 6.95 (1H, s), 6.87
(1H, dd, J = 1.5, 5.4 Hz), 6.28 (2H, s), 3.83 (3H, s); 13
C NMR (DMSO-d6, 100 MHz, 300
K) δ = 165.72, 160.51, 148.91, 137.75, 109.99, 107.4, 52.3.
30.51
Ester 29 (328.5 mg, 2.16 mmol) was stirred in 13 mL of concentrated ammonium
hydroxide at room temperature for 24 h. The solvent was removed in vacuo and resulting
residue was purified by column chromatography (5:1 dichloromethane:methanol + 1%

121
triethylamine) to yield 30 (260.6 mg, 88%) as a white solid. NMR (DMSO-d6, 400 MHz,
300 K) δ = 7.97-7.93 (2H, m), 7.43 (1H, s), 6.83-6.81 (2H, d, J = 5.7 Hz), 6.08 (2H, s);
13C NMR (DMSO-d6, 100 MHz, 300 K) δ = 167.23, 160.21, 148.09, 142.77, 109.31,
106.22.
31.49
To a solution of 30 (100.0 mg, 0.729 mmol) in 150 mL of THF at 58°C was added
60 mg (1.58 mmol) of lithium aluminum hydride (LAH). The mixture was stirred for
three days with monitoring by TLC (1:1 dichloromethane:methanol) and adding 60 mg
more of LAH every 24 h (180 mg total). The completed reaction is cooled to 0°C,
carefully quenched with 1.0 mL of water, filtered with methanol rinsings, and
concentrated in vacuo. The resulting crude mixture was purified by column
chromatography (5:1 dichloromethane:methanol + 1% triethylamine to isolate any
starting material followed by 1:1 dichloromethane:methanol + 1% triethylamine to eluate
the product) to yield 31 (32.5 mg, 36%) as a yellow oil. NMR (DMSO-d6, 400 MHz, 300
K) δ = 7.11 (1H, s), 7.02 (1H, s), 6.20 (1H, s), 4.54 (2H, s), 3.00 (2H, s, br), 2.92 (2H, s).

122
32.50
Tris-anhydride 7 (6.3 mg, 10.0 μmol) was added portionwise to a stirred solution of
dry DMSO (1.0 mL) containing 31 (4.9 mg, 40.0 μmol) at room temperature. After 2 h,
neat pyridine (0.1 mL) was added dropwise and the temperature was raised to 115 ºC.
The reaction was allowed to complete over ~12 h (overnight), after which the solvent was
evaporated in vacuum and the residue was purified by column chromatography (SiO2,
CH2Cl2/CH3OH = 6:1) to yield a white solid product (6.6 mg, 70 %). 1H NMR (500
MHz, DMSO-d6, 300 K): δ = 7.81 (s, 6H), 7.79 (s, 3H), 7.63 (s, 3H), 6.64 (s, 3H), 5.24
(s, 6-NH), 4.73 (s, 6H), 4.48 (s, 6H), 2.52 (s, 6H); 13
C NMR (126 MHz, DMSO-d6, 300
K): δ = 167.5, 157.8, 144.7, 137.9, 135.9, 135.5, 132.2, 129.7, 118.0, 116.2, 65.2, 48.2,
38.3 ppm; HR MALDI-TOF m/z calcd for C57H39N9O6K: 984.266 [M+K]+, found:
984.229.

123
42.50
A solution of trimethylacetyl chloride (2.3 mg, 19.2 μmol) in THF (100 μL) was
added dropwise to a stirred solution of 32 (3.0 mg, 3.2 μmol) in THF (0.5 mL) containing
triethylamine (3.2 mg, 32.0 μmol) at 0 °C. The stirring was continued for 1.5 h, after
which the solvent was evaporated in vacuum and the residue was purified by preparatory
TLC (SiO2, CH2Cl2/CH3OH = 15:1) to yield a white solid product (3.3 mg, 85 %). 1H
NMR (400 MHz, CDCl3, 300 K): δ = 10.09 (s, 3-NH), 8.29 (d, J = 2.4 Hz, 3H), 8.20 (d, J
= 1.6 Hz, 3H), 8.12 (dd, J = 1.6 Hz, 2.4 Hz, 3H), 7.39 (s, 6H), 4.69 (s, 6H), 4.43 (s, 6H),
2.55 (s, 6H); 13
C NMR (63 MHz, CDCl3, 300 K): δ = 178.8, 167.0, 156.7, 146.2, 143.9,
137.6, 136.1, 135.0, 132.7, 130.1, 116.0, 66.7, 48.9, 39.3, 38.3, 27.7 ppm; HR MALDI-
TOF m/z calcd for C72H63N9O9Na: 1220.465 [M+Na]+, found: 1220.456.

124
43.50
A solution of n-heptanoyl chloride (2.9 mg, 19.2 mmol) in THF (100 μL) was
added dropwise to a stirred solution (THF, 0.5 mL) of compound 32 (3.0 mg, 3.2 μmol)
containing triethylamine (3.2 mg, 32.0 μmol) at -10 °C. The stirring was continued for
1.5 h, after which the solvent was evaporated in vacuum and the residue was purified by
preparatory TLC (SiO2, CH2Cl2/CH3OH = 13:1) to yield a white solid product (3.3 mg,
80 %). 1H NMR (400 MHz, CDCl3, 300 K): δ = 10.87 (s, 3-NH), 8.28 (s, 3H), 8.22
(s,3H), 8.18 (s, 3H), 7.42 (s, 6H), 4.73 (s, 6H), 4.42 (s, 6H), 2.54 (dd, J = 12.0, 6.7 Hz,
6H), 2.43 (t, J = 6.6 Hz, 6H), 1.76 (m, 6H), 1.33 (m, 18H), 0.89 (s, 9H); 13
C NMR (126
MHz, CDCl3, 300 K): δ = 173.0, 167.0, 156.7, 145.1, 142.4, 137.5, 135.3, 135.0, 133.2.
130.2, 116.1, 66.1, 49.0, 38.3, 37.0, 31.6, 29.1, 25.5, 22.5, 14.1 ppm; HR MALDI-TOF
m/z calcd for C78H75N9O9Na: 1304.559 [M+Na]+, found: 1304.715.
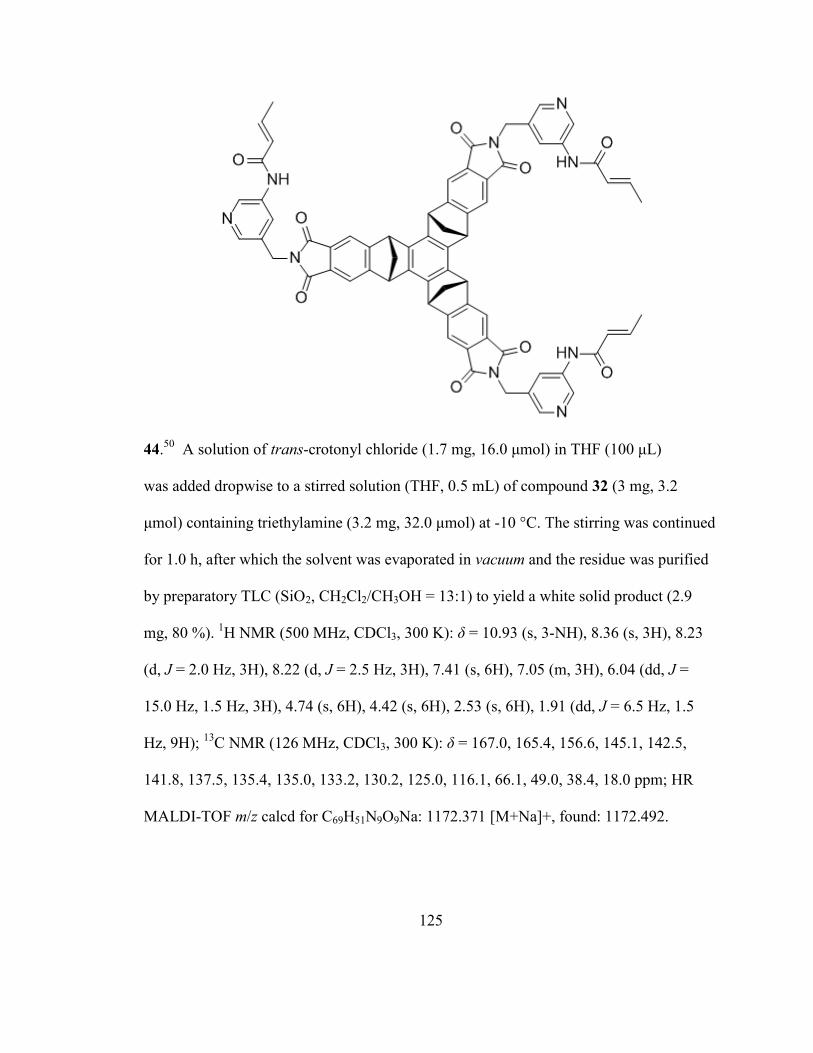
125
44.50
A solution of trans-crotonyl chloride (1.7 mg, 16.0 μmol) in THF (100 μL)
was added dropwise to a stirred solution (THF, 0.5 mL) of compound 32 (3 mg, 3.2
μmol) containing triethylamine (3.2 mg, 32.0 μmol) at -10 °C. The stirring was continued
for 1.0 h, after which the solvent was evaporated in vacuum and the residue was purified
by preparatory TLC (SiO2, CH2Cl2/CH3OH = 13:1) to yield a white solid product (2.9
mg, 80 %). 1H NMR (500 MHz, CDCl3, 300 K): δ = 10.93 (s, 3-NH), 8.36 (s, 3H), 8.23
(d, J = 2.0 Hz, 3H), 8.22 (d, J = 2.5 Hz, 3H), 7.41 (s, 6H), 7.05 (m, 3H), 6.04 (dd, J =
15.0 Hz, 1.5 Hz, 3H), 4.74 (s, 6H), 4.42 (s, 6H), 2.53 (s, 6H), 1.91 (dd, J = 6.5 Hz, 1.5
Hz, 9H); 13
C NMR (126 MHz, CDCl3, 300 K): δ = 167.0, 165.4, 156.6, 145.1, 142.5,
141.8, 137.5, 135.4, 135.0, 133.2, 130.2, 125.0, 116.1, 66.1, 49.0, 38.4, 18.0 ppm; HR
MALDI-TOF m/z calcd for C69H51N9O9Na: 1172.371 [M+Na]+, found: 1172.492.

126
45.50
A solution of benzoyl chloride (2.3 mg, 16.4 μmol) in THF (100 μL) was
added dropwise to a stirred solution (THF, 0.5 mL) of compound 32 (3.0 mg, 3.2 μmol)
containing triethylamine (3.2 mg, 32.0 μmol) at 0 °C. The stirring was continued for 1.5
h, after which the solvent was evaporated in vacuum and the residue was purified by
preparatory TLC (SiO2, CH2Cl2/CH3OH = 15:1) to yield a white solid product (3.2 mg,
80 %). 1H NMR (400 MHz, CDCl3, 300 K): δ = 11.38 (s, 3-NH), 8.53 (s, 6H), 8.06 (s,
3H), 8.04 (s, 3H), 7.98 (s, 3H), 7.40-7.55 (m, 15H), 4.66 (s, 6H), 4.41 (s, 6H), 2.53 (s,
6H); 13
C NMR (63 MHz, CDCl3, 27 °C): δ = 167.2, 166.9, 156.7, 145.6, 143.1, 137.5,
135.4, 135.3, 133.9, 133.1, 132.0, 130.1, 128.5, 127.8, 116.0, 65.8, 49.0, 38.3 ppm; HR
MALDI-TOF m/z calcd for C78H51N9O9Na: 1280.371 [M+Na]+, found: 1280.404.

127
46.50
A solution of trifluoroacetic anhydride (8.4 mg, 40.0 μmol) in THF (100 μL)
was added dropwise to a stirred solution (THF, 0.8 mL) of compound 32 (4.7 mg, 5.0
μmol) containing triethylamine (5.1 mg, 50.0 μmol) at 0 °C. The stirring was continued
for 1.0 h, after which the solvent was evaporated in vacuum and the residue was purified
by preparatory TLC (SiO2, CH2Cl2/CH3OH = 20:1) to yield a white solid product (4.3
mg, 70 %). 1H NMR (400 MHz, CDCl3, 300 K): δ = 12.22 (s, 3-NH), 8.32 (s, 3H), 8.31
(s, 6H), 7.42 (s, 6H), 4.78 (s, 6H), 4.44 (s, 6H), 2.55 (dd, J = 11.6 Hz, 8.4 Hz, 6H); 13
C
NMR (126 MHz, CDCl3, 300 K): δ = 166.8, 156.9, 157 (q, CF3C=O), 147.0, 142.5,
137.6, 135.7, 133.9, 132.7, 130.1, 117 (q, CF3), 116.1, 66.0, 49.0, 38.1 ppm; HR
MALDI-TOF m/z calcd for C63H36F9N9O9K: 1272.213 [M+K]+, found: 1272.207.

128
48.105
To a solution of diisopropylamine (3.0 mL, 2.2 g, 21.4 mmol) in dry THF (30 mL)
at −30°C was added dropwise n-butyllithium (1.6 M in hexanes, 13.0 mL, 20.8 mmol).
The resulting solution was warmed to 0°C, stirred for 10 min, and then cooled to −95°C.
Bromoform (1.75 mL, 5.06 g, 20.0 mmol) was added dropwise and the mixture was
stirred for 10 min before a solution of methyl iodide (1.4 mL, 3.2 g, 22.5 mmol) in THF
(10 mL) was added dropwise. The resulting mixture was stirred at −95° for 1.5 hr, slowly
warmed to −70°C, quenched with 1.0 mL of aqueous NH3/NH4Cl buffer (pH 9.0), and
warmed to room temperature. The mixture was partitioned with 1:1 H2O:Et2O (80 mL),
separated, and the aqueous layer was washed once with Et2O (40 mL). The organic
fractions were combined, dried with Na2SO4, concentrated in vacuum, and the resulting
crude mixture was purified by Kügelrohr distillation (50°C, 80 mm Hg, the product
deposits unto dry-ice cooled bulbs) to yield 1,1,1-tribromoethane (3.17 g, 59%) as a
colorless liquid. 1H NMR (400 MHz, CDCl3, 300 K): δ = 3.38 (s) ppm;
13C NMR (100
MHz, CDCl3, 300 K): δ = 51.9, 31.4 ppm.
50.106
To a solution of diisopropylamine (3.0 mL, 2.2 g, 21.4 mmol) in dry THF (30 mL)
at −30°C was added dropwise n-butyllithium (2.5 M in hexanes, 8.0 mL, 20.0 mmol).
The resulting solution was warmed to 0°C, stirred for 10 min, and then cooled to −95°C.

129
Dibromochloromethane (1.53 mL, 3.75 g, 18.0 mmol) was added dropwise and the
mixture was stirred for 10 min before a solution of methyl iodide (1.31 mL, 2.98 g, 21.0
mmol) in THF (10 mL) was added dropwise. The resulting mixture was stirred at −95°
for 30 min, slowly warmed to −70°C, quenched with 3.0 mL of a saturated aqueous
NH4Cl solution and warmed to room temperature. The mixture was concentrated under
reduced pressure and the residue was partitioned with 1:1 H2O:Et2O (80 mL), separated,
and the aqueous layer was washed once with Et2O (40 mL). The organic fractions were
combined, dried with Na2SO4, concentrated under reduced pressure, and the resulting
crude mixture was purified by distillation (55 − 58°C, 70 mm Hg) to yield 1,1-dibromo-
1-chloroethane (872 mg, 22%) as a colorless liquid. 1H NMR (400 MHz, CDCl3, 300 K):
δ = 3.13 (s) ppm; 13
C NMR (100 MHz, CDCl3, 300 K): δ = 54.7, 49.9 ppm.

130
References
1. Voet, D. and Voet, J. G. Biochemistry Volume One: Biomolecules, Mechanisms
of Enzyme Action, and Metabolism, 3rd
ed.; John Wiley & Sons, Inc.: United
States, 2004. Pages 750 – 752.
2. Tombola, F.; Pathak, M. M.; Isacoff, and Ehud, Y. Annu. Rev. Cell. Dev. Biol.
2006, 22, 23 – 52.
3. Bezanilla, F. and Peroza, Eduardo. Adv. Protein Chem. 2003, 63 (Membrane
Proteins), 211 – 241.
4. Zhou, H. and McCammon, J. A. Trends Biochem. Sci. 2010, 35, 179 – 185.
5. Raushel, F. M.; Thoden, J. B. and Holden, H. M. Acc. Chem. Res. 2003, 36,
539 – 548.
6. Huang, X.; Holden, H. M. and Raushel, F. M. Annu. Rev. Biochem. 2001, 70,
149 – 180.
7. Tongye, S.; Tai, K.; Henchman, R. H.and McCammon, J. A. Acc. Chem. Res.
2002, 35, 332 – 340.
8. Zhou, H.; Wlodek, S. T. and McCammon, J. A. Proc. Natl. Acad. Sci. USA,
1998, 95, 9280 – 9283.
9. Cram, D. J.; Tanner, M. E. and Knobler, C. B. J Am. Chem. Soc. 1991, 113,
7717 – 7727.
10. Cram, D. J.; Karbach, S.; Kim, Y. H.; Bacynsky, L. and Kallemeyn, G. W. J.
Am. Chem. Soc. 1985, 107, 2575.
11. Bryant, J. A.; Blanda, M. T.; Vincenti, M. and Cram, D. J. J. Am. Chem. Soc.
1991, 113, 2167 – 2172.
12. Tanner, M. E.; Knobler, C. B. and Cram, D. J. J. Am. Chem. Soc. 1990, 112,
1659 – 1660.

131
13. Houk, K. N.; Nakamura, K.; Chimin, S. and Keating, A. E. Science, 1996, 273,
627 – 629.
14. Rudkevich, D. M.; Hilmersson, G. and Rebek, J. J. Am. Chem. Soc. 1998, 120,
12216 – 12225.
15. Rudkevich, D. M.; Himersson, G. and Rebek, J. J. Am. Chem. Soc. 1997, 119,
9911 – 9912.
16. Hooley, R. J.; Shenoy, S. R. and Rebek, J. Org. Lett. 2008, 10, 5397 – 5400.
17. See for example: Schneider, H. Angew. Chem. Int. Ed. 1991, 1417 – 1436.
18. Caulter, D. L. and Raymond, K. N. Acc. Chem. Res. 1999, 32, 975 – 982.
19. Davis, A. V. and Raymond, K. N. J. Am. Chem. Soc. 2005, 127, 7912 – 7919.
20. Pluth, M. D.; Bergmand, R. G. and Raymond, K. N. J. Org. Chem. 2009, 74, 58
– 63.
21. Kusukawa, T. and Fujita, M. J. Am. Chem. Soc. 1999, 121, 1397 – 1398.
22. Kusukawa, T.; Nakai, T.; Okano, T. and Fujita, M. Chem. Lett. 2003, 32, 284 –
285.
23. Yoshizawa, M.; Tamura, M. and Fujita, M. Science, 2006, 312, 251 – 254.
24. Menger, F. M. Acc. Chem. Res. 1985, 18, 128 – 134.
25. Menger, F. M. Pure Appl. Chem. 2005, 77, 1873 – 1886.
26. Maslak, V.; Yan, Z.; Xia, S.; Galluci, J.; Hadad, C. M. and Badjic, J. D. J. Am.
Chem. 2006, 128, 5887 – 5894.
27. Ghosal, S.; Luke, G. P and Kyler, K. S. J. Org. Chem. 1987, 52, 4296 – 4298.
28. Beddoes, R. L.; Cheeseright, T.; Wang, J. and Quayle, P. Tetrahedron Lett.
1995, 36, 283 – 286.
29. Durr, R.; Cossu, S.; Lucchini, V. and De Lucchi, O. Angew. Chem. Int. Ed.
1997, 36, 2805 – 2807.
30. Zonta, C.; Cossu, S.; Peluso, P. and De Lucchi, O. Tetrahedron Lett. 1999, 40,
8185 – 8188.

132
31. Peluso, P.; De Lucchi, O. and Cossu, S. Eur. J. Org. Chem. 2002, 23, 4032 –
4036.
32. Rieth, S.; Yan, Z.; Xia, S.; Gardlik, M.; Chow, A.; Fraenkel, G.; Hadad, C. M.
and Badjic, J. D. J. Org. Chem. 2008, 73, 5100 – 5109.
33. Yan, Z.; Xia, S.; Gardlik, M.; Seo, W.; Maslak, V.; Gallucci, J.; Hadad, C. M.
and Badjic, J. D. Org. Lett. 2007, 9, 2301 – 2304.
34. Gardlik, M.; Yan, Z.; Xia, S.; Rieth, S.; Gallucci, J.; Hadad, C. M. and Badjic, J.
D. Tetrahedron, 2009, 65, 7213 – 7219.
35. Cohen, Y.; Avram, L. and Frish, L. Angew. Chem. Int. Ed. 2005, 44, 520.
36. Zuccaccia, D.; Pirondini, L.; Pinalli, R.; Dalcanale, E. and Macchiono, A.
J.Am. Chem. Soc. 2005, 127, 7025.
37. Zenobi, R.; Breuker, K.; Knochenmuss, R.; Lehmann, E. and Stevenson, E.
Adv. Mass Spectrom. 2001, 15, 143 – 149.
38. Schalley, C. A. Mass Spectrom. Rev. 2001, 20, 253 – 309.
39. Wilcox, C. Frontiers in Supramolecular Organic Chemistry and
Photochemistry; Schneider, H.-J., Durr, H., Eds.; Wiley-VCH: Weinheim, 1991;
pp 123 – 143.
40. Connors, K. A. Binding Constants, The Measurement of Molecular Complex
Stability; Wiley-Interscience: New York, 1987; pp 24 – 28.
41. Perdew, J. P. Phys. Rev. B 1986, 33, 8822.
42. Becke, A. D. Phys. Rev. A 1998, 38, 3098-4100.
43. Kaplan, J. J. and Fraenkel, G. In NMR of Chemically Exchanging Systems;
Academic Press: New York, 1980.
44. Pons, M. and Millet, O. Prog. Nucl. Magn. Reson. Spectros. 2001, 38, 267 –
324.
45. Bain, A. D.; Rex, D. M. and Smith, R. N. Magn. Reson. Chem. 2001, 39, 122 –
126.
46. Bain, A. D. Prog. Nucl. Magn. Reson. Spectros. 2003, 43, 63 – 103.

133
47. Vitale, G.; Valina, A. B.; Huang, H.; Amunugama, R. and Rodgers, M. T. J.
Phys. Chem. A 2001, 105, 11351 – 11364.
48. Rannulu, N. S. and Rodgers, M. T. J. Phys. Chem. A. 2007, 111, 3465 – 3479.
49. Wang, B.; Bao, X.; Yan, Z.; Maslak, V.; Hadad, C. M. and Badjic, J. D. J. Am.
Chem. Soc. 2008, 130, 15127 – 15133.
50. Wang, B.; Rieth, S. and Badjic, J. D. J. Am. Chem. Soc. 2009, 131, 7250 –
7252.
51. Boovanahalli, S. K.; Jin, X.; Jin, Y.; Kim, J. H.; Dat, N. T.; Hong, Y.; Lee, J.
H.; Jung, S.; Lee, K. and Lee, J. J. Biorg. Med. Chem. Lett. 2007, 17, 6305 –
6310.
52. Sheu, C. and Houk, K. N. J. Am. Chem. Soc. 1996, 118, 8056 – 8070.
53. Reich, H. J. WinDNMR: Dynamic NMR Spectra for Windows; J. Chem. Ed.:
Software, Series D, 1996.
54. Wang, B.; Bao, X.; Stojanovic, S.; Hadad, C. M. and Badjic, J. D. Org. Lett.
2008, 10, 5361 – 5364.
55. Mecozzi, S. and Rebek, J. Chem. Eur. J. 1998, 4, 1016 – 1022.
56. Hamann, B. C.; Shimizu, K. D. and Rebek, J. Angew. Chem. Int. Ed. 1996, 35,
1326 – 1329.
57. Kamieth, M.; Klarner, F.-G. and Diederich, F. Angew. Chem. Int. Ed. 1998, 37,
3303 – 3305.
58. Fiedler, D.; Leung, D. H.; Bergman, R. G. and Raymond, K. N. Acc. Chem.
Res. 2005, 38, 349 – 358.
59. Mecozzi, S.; West, A. P. and Dougherty, D. J. Am. Chem. Soc. 1996, 118, 2307
– 2308.
60. Hunter, C. A. Angew. Chem. Int. Ed. 2004, 43, 5310 – 5324.
61. Zhao, Y.; Schultz, N. E. and Truhlar, D. G. J. Chem. Theory Comput. 2006, 2,
364 – 382.

134
62. For the role of entropic forces in self-assembly, see for instance: Jadhav, V. D.
and Schmidtchen, F. P. Org. Lett. 2005, 7, 3311 – 3314.
63. Neder, K. M. and Whitlock, H. W. J. Am. Chem. Soc. 1990, 112, 9412 – 9414.
64. Reynisson, J. and McDonnald, E. J. Comput. Aided. Mol. Des. 2004, 18, 421 –
431.
65. Wilcox, C. S.; Kim, E.-I.; Romano, D.; Kuo, L. H.; Burt, A. L. and Curran, D.
P. Tetrahedron 1995, 51, 621 – 634.
66. Sartorius, J. and Schneider, H.-J. Chem. Eur. J. 1996, 2, 1446 – 1452.
67. Free Energy Relationships in Organic and Bio-Organic Chemistry; Williams,
A.; The Royal Society of Chemistry: Cambridge, 2003.
68. See, for instance: a) Mecozzi, S.; West, A. P. and Dougherty, D. A. J. Am.
Chem. Soc. 1996, 118, 2307 – 2308. b) Ashton, P. A.; Fyfe, M. C. T.;
Hickingbottom, S.; Stoddart, J. F.; White, A. J. P. and Williams, D. J. J. Chem.
Soc., Perkin Trans. 2 1998, 2117 – 2128. c) Chang, S.-Y.; Kim, H. S.; Chang,
K.-J. and Jeong, K.-S. Org. Lett. 2004, 6, 181 – 184.
69. Pavelich, W. A. and Taft, R. W. J. J. Am. Chem. Soc. 1957, 79, 4935.
70. Modern Physical Organic Chemistry; Anslyn, E.; Dougherty, D. A. University
Science Books: 2006; p 455.
71. Jeener, K.; Meier, B. H.; Bachmann, P. and Ernst, R. R. J. Chem. Phys. 1979,
71, 4546 – 4553.
72. Perrin, C. L. and Dwyer, T. J. Chem. Rev. 1990, 90, 935 – 967.
73. Detellier, C.; Complexation Mechanisms. In Comprehensive Supramolecular
Chemistry; Gokel, G. W., Ed.; Elsevier: Oxfore, UK 1996, 35, 7 – 375.
74. The slope ρ is akin to the Hammond-Leffler α value (α = δΔG‡/δΔG°). See: a)
Leffler, J. E. Science 1953, 117, 340 – 341. b) Hammond, G. S. J. J. Am.
Chem. Soc. 1955, 77, 334 – 338.
75. Cram, D. J.; Blanda, M. T.; Paek, K. and Knobler, C. B. J. Am. Chem. Soc.
1992, 114, 7765 – 7773.
76. Izrailev, S.; Stepaniants, S.; Balsera, M.; Oono, Y. and Schulten, K. Biophys. J.
1997, 72, 1568 – 1581.

135
77. Led, J. J.; Gesmar, H. and Abildgaard, F. Methods Enymol. 1989, 176, 311 –
329.
78. Mayr, H. and Ofial, A. R. Angew. Chem. Int. Ed. 2006, 45, 1844.
79. Helgeson, R. C.; Hayden, A. E. and Houk, K. N. J. Org. Chem. 2010, 75, 570.
80. Cox, B. G. and Schneider, H. Pure Appl. Chem. 1990, 62, 2259.
81. Gibb, C. L. D.; Sundaresan, A. K.; Ramamurthy, V. and Gibb, B. C. J. Am.
Chem. Soc. 2008, 130, 4069.
82. Hastings, C. J.; Pluth, M. D.; Bergman, R. G. and Raymond, K. N. J. Am.
Chem. Soc. 2010, 132, 6938.
83. Fox, M. E.; Szoka, F. C. and Frechet, J. M. J. Acc. Chem. Res. 2009, 42, 1141.
84. Chapman, R. G. and Sherman, J. C. J. Org. Chem. 2000, 65, 513 – 516.
85. O’Leary, B. M.; Grotzfeld, R. M. and Rebek, J. J. Am. Chem. Soc. 1997, 119,
11701 – 11702.
86. Gottschalk, T.; Jarowski, P. D. and Diederich, F. Tetrahedron 2008, 64, 8307 –
8317.
87. Pluth, M. D.; Bergman, R. G. and Raymond, K. N. J. Org. Chem. 2008, 73,
7132 – 7136.
88. a) Schneider, H. J.; Gschwendtner, W. and Weigand, E. F.; J. Am. Chem. Soc.
1979, 101, 7195 – 7198. b) Leventis, N.; Hanna, S. B. and Sotirou-Leventis, C.
J. Chem. Educ. 1997, 74, 813 – 814. c) Kakhiani, K.; Lourderag, U.; Hu, W.;
Birney, D. and Hase, W. L. J. Phys. Chem. A 2009, 113, 4570 – 4580. d)
Pickett, H. M. and Strauss, H. L. J. Am. Chem. Soc. 1977, 99, 8127 – 8134. e)
Allinger, N. L. J. Am. Chem. Soc. 1977, 99, 8127 – 8134. f) Kuharski, R. A.;
Chandler, D.; Mongomery, J. A.; Rabii, F. and Singer, S. J. J. Phys Chem. 1988,
92, 3261 – 3267. g) Singer, S. J.; Kuharski, R. A. and Chandler, J. J. Phys.
Chem. 1986, 90, 6015 – 6017. h) Strauss, H. L. J. Chem. Educ. 1997, 74, 221
– 223.
89. Anet, F. A. L. and Bourn, A. J. R. J. Am. Chem. Soc. 1967, 89, 760 – 768.

136
90. Anet, F. A. L. and Anet, R. in Dynamic Nuclear Magnetic Resonance
Spectroscopy (Eds.: L. M. Jackman, F. A. Cotton), Academic Press, New York,
1975, pp. 543 – 620.
91. Hasha, D. L.; Eguchi, T. and Jonas, J. J. Am. Chem. Soc. 1982, 104, 2290 –
2296.
92. Ross, B. D. and True, N. S. J. Am. Chem. Soc. 1983, 105, 1382 – 1383.
93. Saunders, M. Helv. Chim. Acta 2003, 86, 1001 – 1007.
94. Svensson, M.; Humbel, S.; Froese, R. D. J.; Matsubara, T.; Sieber, S. and
Morokuma, K. J. Phys. Chem. 1996, 100, 19357.
95. Dixon, D. A. and Komornicki, A. J. Phys. Chem. 1990, 94, 5630 – 5636.
96. Zhao, Y. and Truhlar, D. G. Theor. Chem. Acc. 2008, 120, 215 – 241.
97. Zhao, Y. and Truhlar, D. G. Acc. Chem. Res. 2008, 41, 157 – 167.
98. Tsuzuki, S.; Honda, K.; Uchimaru, T.; Mukami, M. and Tanabe, K. J. Am.
Chem. Soc. 2000, 122, 3746 – 3753.
99. a) Molecular Switches; Feringa, B. L.; Wiley-VCH: Weinheim, 2001. b)
Moonen, N. N. P.; Flood, A. H.; Fernandez, J. M. and Stoddart, J. F. Top. Curr.
Chem. 2005, 262, 99-132. c) Cheng, K.-W.; Lai, C.-C.; Chiang, P.-T. and
Chiu, S.-H. Chem. Comm. 2006, 2854 – 2856. d) de Silva, A. P. Nature 2008,
454, 417 – 418.
100. Ercolani, G. J. J. Am. Chem. Soc. 2003, 125, 16097 – 16103
101. Riddle, J. A.; Jiang, X. and Lee, D. Analyst 2008, 133, 417 – 422.
102. Cram, D. J. Angew. Chem. Int. Ed. 1986, 25, 1039 – 1057.
103. See, for example: a) Amrhein, P.; Shivanyuk, A.; Johnson, D. W. and Rebek,
J. J. Am. Chem. Soc. 2002, 124, 10349 – 10358. b) Kerckhoffs, J. M. C. A.;
van Leeuwen, F. W. B.; Spek, A. L.; Kooijman, H.; Crego-Calama, M. and
Reinhoudt, D. N. Angew. Chem. Int. Ed. 2003, 42, 5717 – 5722. c) Badjic, J.
D.; Balzani, V.; Credi, A.; Silvi, S. and Stoddart, J. F. Science 2004, 303, 1845
– 1849. d) Abe, H.; Masuda, N.; Waki, M. and Inouye, M. J. Am. Chem. Soc.
2005, 127, 16189 – 16196. e) Browne, W. R. and Feringa, B. L. Nat.
Nanotechnol. 2006, 1, 25 – 35. f) Chakrabarti, K.; Mukhopadhyay, P.; Lin, S.
and Isaacs, L. Org. Lett.2007, 9, 2349 – 2352.

137
104. Zaolnai, Z.; Juranic, N.; Vikic-Topic, D.; and Macura, S. J. Chem. Inf. Comput.
Sci. 2000, 40, 611 – 621.
105. Rieth, S.; Bao, X.; Wang, B.; Hadad, C. M. and Badjic, J. D. J. Am. Chem. Soc.
2010, 132, 773 – 776.
106. Rieth, S. and Badjic, J. D. Chem. Eur. J. 2011, 17, 2562 – 2565.

138
Appendix A: Supplementary Data
A.1 Supplementary Data for Chapter 3.2
Sample Preparation for 2-D EXSY Experiments
All NMR solutions and standards were prepared under nitrogen atmosphere in a glove
box. All NMR samples were prepared in J. Young NMR tubes purchased from Norell.
CD2Cl2 was degassed using the freeze-thaw method and stored under nitrogen in a glove
box.
General Procedure for 2-D EXSY Measurements of k*f and k*d
A solution of basket and t-butyl bromide in CD2Cl2 (J. Young NMR tube) was cooled to
226.0 ± 0.1 K inside the NMR probe and allowed to equilibrate for 1.0 h. The 1H spin-
lattice relaxation times (T1) for the free and encapsulated guest molecules were
determined by a standard inversion-recovery pulse sequence with a relaxation delay (τd)
of at least 5*T1. Following, a series of gradient NOESY experiments were run with a
relaxation delay of 5*T1 and mixing times (τm) of 0 ms and four others ranging from 25 to
450 ms such that the crosspeaks were clearly resolved. Each of the 128 F1 increments
was the accumulation of 2 scans. The peak volumes were determined using XWinNMR

139
software from Bruker, after phase and baseline corrections in both dimensions. The
magnetization exchange rate constant (k*f and k*d) were, at each mixing time τm,
calculated using the EXSYCalc program (Mestrelab Research).104
The association kf and
dissociation kd rate constants were then obtained as: kf = k*f/[basket] and kd = k*d. The
mean value was reported using the standard deviation as an experimental error. For each
basket, the quantitative NOESY experiments were repeated twice.
EXSY k*f and k*d for Basket 46. 2-D EXSY experiment described above was for basket
46 performed at 235.0 ± 0.1, 243.0 ± 0.1, and 250.0 ± 0.1 K, yielding k*f and k*d at each
temperature (see table below). The rate constants at 226.0 K were then estimated by
extrapolation of an Eyring plot from a linear and weighted least-squares analysis.
Temperature (K)
kf
(M-1
s-1
)
k*d
(s-1
)
235 ± 0.1 2.7 ± 0.7 0.17 ± 0.08
243 ± 0.1 19.3 ± 3.9 0.66 ± 0.12
250 ± 0.1 36 ± 6 1.3 ± 0.1

140
Figure 53: 2-D EXSY Spectrum (400 MHz, 250.0 ± 0.1 K) of a 2.4 mM solution of
basket 46 containing 4.1 molar equivalents of t-BuBr (9.84 mM) in CD2Cl2; the
concentration of “free” basket [basket] = 1.7 ± 0.2 mM, was obtained by integrating 1H
NMR signals for the guest (t-BuBr) and solvent occupied 46. Note that k*ba = k*d and
k*ab = k*f.
Figure 54: 2-D EXSY Spectrum (400 MHz, 243.0 ± 0.1 K) of a 2.4 mM Solution of
Basket 46 containing 4.5 molar equivalents of t-BuBr (10.8 mM) in CD2Cl2; the

141
concentration of “free” basket [basket] = 1.8 ± 0.2 mM, was obtained by integrating 1H
NMR signals for the guest (t-BuBr) and solvent occupied 46. Note that k*ba = k*d and
k*ab = k*f.
Figure 55: 2-D EXSY Spectrum (400 MHz, 235.0 ± 0.1 K) of a 2.4 mM Solution of
Basket 46 containing 4.1 molar equivalents of t-BuBr (9.84 mM) in CD2Cl2; the
concentration of “free” basket [basket] = 1.5 ± 0.2 mM, was obtained by integrating 1H
NMR signals for the guest (t-BuBr) and solvent occupied 46. Note that k*ba = k*d and
k*ab = k*f.

142
Figure 56: An Eyring Plot describing the temperature dependence of k*d. The exchange
rate at 226.0 K was estimated to be 0.068 ± 0.022 s-1
.
Figure 57: An Eyring Plot describing the temperature dependence of kf. The exchange
rate at 226.0 K was thus estimated to be 0.69 ± 0.15 M-1
s-1
.

143
Figure 58: 2-D EXSY Spectrum (400 MHz, 226.0 ± 0.1 K) of a 1.1 mM Solution of
Basket 27 containing 2.3 molar equivalents of t-BuBr (2.53 mM) in CD2Cl2; the
concentration of “free” basket [basket] = 0.84 ± 0.08 mM, was obtained by integrating 1H
NMR signals for the guest (t-BuBr) and solvent occupied 27. Note that k*ba = k*d and
k*ab = k*f.
Figure 59: 2-D EXSY Spectrum (400 MHz, 226 .0 ± 0.1 K) of a 1.9 mM solution of
basket 42 containing 2.6 molar equivalents of t-BuBr (4.94 mM) in CD2Cl2; the

144
concentration of “free” basket [basket] = 1.0 ± 0.1 mM, was obtained by integrating 1H
NMR signals for the guest (t-BuBr) and solvent occupied 42. Note that k*ba = k*d and
k*ab = k*f.
Figure 60: 2-D EXSY Spectrum (400 MHz, 226.0 ± 0.1 K) of a 1.9 mM solution of
basket 43 containing 3.3 molar equivalents of t-BuBr (6.27 mM) in CD2Cl2; the
concentration of “free” basket [basket] = 0.097 ± 0.010 mM, was obtained by integrating 1H NMR signals for the guest (t-BuBr) and solvent occupied 43. Note that k*ba = k*d and
k*ab = k*f.

145
Figure 61: 2-D EXSY Spectrum (400 MHz, 226.0 ± 0.1 K) of a 1.3 mM solution of
basket 44 containing 3.3 molar equivalents of t-BuBr (4.29 mM) in CD2Cl2; the
concentration of “free” basket [basket] = 0.086 ± 0.009 mM, was obtained by integrating 1H NMR signals for the guest (t-BuBr) and solvent occupied 44. Note that k*ba = k*d and
k*ab = k*f.

146
Figure 62: 2-D EXSY Spectrum (400 MHz, 226 .0 ± 0.1 K) of a 1.8 mM Solution of
Basket 45 containing 3.7 molar equivalents of t-BuBr (6.66 mM) in CD2Cl2; the
concentration of “free” basket [basket] = 0.083 ± 0.008 mM, was obtained by integrating 1H NMR signals for the guest (t-BuBr) and solvent occupied 45. Note that k*ba = k*d and
k*ab = k*f.
1H Line Shape Analysis of the A/B Interconversion
First-order rate constants kf and kb, for the A/B interconversion of 27 and 42-46 (see
below), were obtained by simulating the line-shapes of Ha/b signals at various
temperatures (WINDNMR-Pro).53
A statistical correction was not applied, assuming that
the A/B interconversion does include any intermediate state. The exchange rate constants
from the simulation were, importantly, shown to be independent on the concentration of
the guest (t-BuBr). Accordingly, they were made equivalent to the chemical rate constant
describing the A/B interconversion (krac). krac at 226.0 K was, for each basket 27, 42-46,
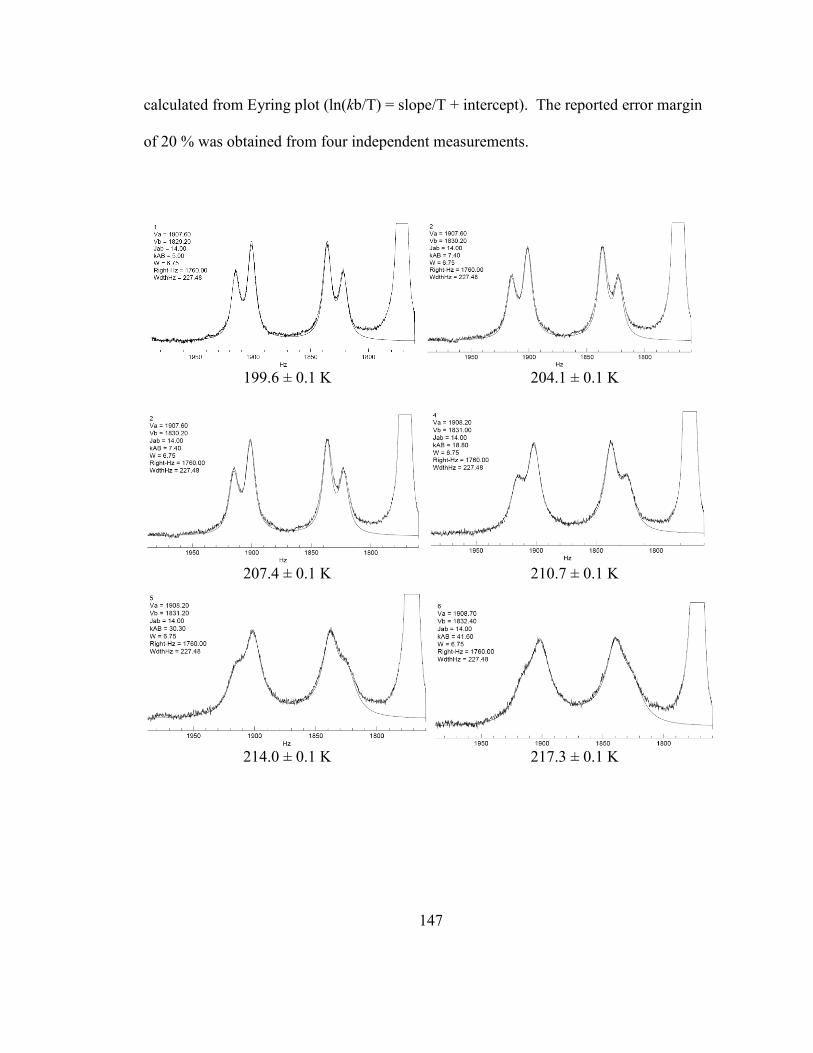
147
calculated from Eyring plot (ln(kb/T) = slope/T + intercept). The reported error margin
of 20 % was obtained from four independent measurements.
199.6 ± 0.1 K 204.1 ± 0.1 K
207.4 ± 0.1 K 210.7 ± 0.1 K
214.0 ± 0.1 K 217.3 ± 0.1 K

148
220.7 ± 0.1 K 224.0 ± 0.1 K
227.4 ± 0.1 K 230.4 ± 0.1 K
233.4 ± 0.1 K 237.3 ± 0.1 K
Figure 63: Simulated and experimental (WINDNMR-Pro)53
resonances for the Ha/b
protons in 27 (2.98 mM) in CD2Cl2 containing 100.0 molar equivalents of t-BuBr (298
mM).

149
Figure 64: Eyring plot for 27A/27B interconversion, obtained with krac from dynamic 1H
NMR measurements above; krac at 226.0 K (with an error margin of 20 %) was obtained
from the linear least square analysis of the experimental data above.

150
Figure 65: Eyring plot for 42A/42B interconversion, obtained from dynamic
1H NMR
measurements of 42 (3.31 mM) in CD2Cl2 containing 60.0 molar equivalents of t-BuBr;
krac at 226.0 K (with an error margin of 20 %) was obtained from the linear least-square
analysis of the experimental data above (in this particular case, however, krac at 226 K
was reported (Table 4) as a mean of three independent measurements: 83 ± 17, 91 ± 18
and 59 ± 12 s-1).

151
Figure 66: Eyring plot for 43A/43B interconversion, obtained from dynamic
1H NMR
measurements of 43 (1.41 mM) in CD2Cl2 containing 150.0 molar equivalents of t-BuBr;
krac at 226.0 K (with an error margin of 20 %) was obtained from the linear least-square
analysis of the experimental data above.

152
Figure 67: Eyring plot for 44A/44B interconversion, obtained from dynamic 1H NMR
measurements of 44 (1.41 mM) in CD2Cl2 containing 100.0 molar equivalents of t-BuBr;
krac at 226.0 K (with an error margin of 20 %) was obtained from the linear least-square
analysis of the experimental data above.

153
Figure 68: Eyring plots for 45A/45B interconversion, obtained from dynamic 1H NMR
measurements of 45 in CD2Cl2 (2.14 mM) containing 74.0 (red), 125.0 (blue), 175.0
(green) and 225.0 (gray) molar equivalents of t-BuBr; krac at 226.0 K (with an error
margin of 20 %) was obtained from the linear least-square analysis of the experimental
data below. (red, slope = -5633.7322 and intercept = 22.1632); blue, slope = - 4956.9507
and intercept = 19.4412; green, slope = -4791.6522 and intercept = 18.8017; gray, slope =
- 4854.2705 and intercept = 19.1374).

154
Figure 69: Eyring plot for 46A/46B interconversion, obtained from dynamic 1H NMR
measurements of 46 (1.16 mM) in CD2Cl2 containing 250.0 molar equivalents of t-BuBr;
krac at 226.0 K (with an error margin of 20 %) was obtained from the linear least-square
analysis of the experimental data above.
A.2 Supplementary Data for Chapter 3.3
Sample Preparation for 2-D EXSY Experiments
All NMR solutions and standards were prepared under nitrogen in a glove box. All NMR
samples were prepared in J. Young NMR tubes purchased from Norell. CD2Cl2 was
degassed using the freeze-thaw method and stored under nitrogen in a glove box.

155
Procedure for 2-D 1H EXSY Experiment
A solution of basket and guest in CD2Cl2 (J. Young NMR tube) was cooled to 250.0 ± 0.1
K inside the NMR probe and allowed to equilibrate for 1.0 h. The 1H spin-lattice
relaxation times (T1) for the free and encapsulated guest molecules were determined by a
standard inversion-recovery pulse sequence with a relaxation delay (τd) of at least 5*T1.
Following, a series of gradient NOESY experiments were run with a relaxation delay of
5*T1 and mixing times (τm) of 0 ms and three others ranging from 40 ms to 250 ms such
that the cross-peaks were clearly resolved. Each of the 128 F1 increments was the
accumulation of 2 scans. The peak amplitudes were determined using XWinNMR
software from Bruker, after the phase and baseline corrections in both dimensions. The
magnetization exchange rate constant (k*f and k*d) were, at each mixing time τm,
calculated using the EXSYCalc program (Mestrelab Research).104
The association kin and
dissociation kd rate constants were then obtained as: kf = k*f/[basket] and kd = k*d. All
quantitative NOESY experiments were repeated twice. The mean value was reported with
standard deviation as an experimental error.
Procedure for 2-D 13
C EXSY Experiment
A solution of basket and guest in CD2Cl2 (J. Young NMR tube) was cooled to 250.0 ± 0.5
K inside the NMR probe and allowed to equilibrate for 1.0 h. The 13
C spin-lattice
relaxation times (T1) for the free and encapsulated guest molecules were determined by a
standard inversion-recovery pulse sequence with a relaxation delay (τd) of at least 5*T1.

156
Following, a series of gradient NOESY experiments were run with a relaxation delay of
5*T1 and mixing times (τm) of 0 ms, 350 ms, and 400 ms. Each of the 128 F1 increments
was the accumulation of 28 scans. The peak amplitudes were determined using
XWinNMR software from Bruker, after the phase and baseline corrections in both
dimensions. The magnetization exchange rate constant (k*d) was, at each mixing time τm,
calculated using the EXSYCalc program (Mestrelab Research).104
The dissociation kout
rate constant was then obtained as: kd = k*d. The mean value was reported with standard
deviation as an experimental error. The quantitative NOESY experiments were repeated
twice. The association kin rate constant was obtained as kf = (k*d)(K), where K is the
equilibrium constant obtained from a Van’t Hoff Plot.
Figure 70: 2-D 13
C EXSY Spectrum (126 MHz, 250.0 ± 0.1 K) of a 2.6 mM solution of
basket 45 containing 1.5 molar equivalents of 28 (13
CBr4, 3.9 mM) in CD2Cl2. The
sample spectrum shown has been symmetrized for clarity. Note k*out = k*d.

157
Figure 71: 2-D 1H EXSY Spectrum (400 MHz, 250.0 ± 0.1 K) of a 2.5 mM solution of
basket 45 containing 1.0 molar equivalent of 48 (C(CH3)Br3, 2.5 mM) in CD2Cl2. The
concentration of “free” basket, [basket] = 0.57 mM ± 0.06 mM, was obtained by 1H
NMR integration. The sample spectrum shown has been symmetrized for clarity. Note
k*out = k*d and k*in = k*f.

158
Figure 72: 2-D 1H EXSY Spectrum (400 MHz, 250.0 ± 0.1 K) of a 2.5 mM solution of
basket 45 containing 2.0 molar equivalents of 39 (C(CH3)2Br2, 5.0 mM) in CD2Cl2. The
concentration of “free” basket, [basket] = 0.83 mM ± 0.08 mM, was obtained by 1H
NMR integration. The sample spectrum shown has been symmetrized for clarity. Note
k*out = k*d and k*in = k*f.

159
Figure 73: 2-D 1H EXSY Spectrum (400 MHz, 250.0 ± 0.1 K) of a 2.5 mM solution of
basket 45 containing 10.2 molar equivalents of 40 (C(CH3)3Br, 25.5 mM) in CD2Cl2.
The concentration of “free” basket, [basket] = 0.83 mM ± 0.08 mM, was obtained by 1H
NMR integration. The sample spectrum shown has been symmetrized for clarity. Note
k*out = k*d and k*in = k*f.

160
Figure 74: 2-D 1H EXSY Spectrum (400 MHz, 250.0 ± 0.1 K) of a 2.5 mM solution of
basket 45 containing 7.0 molar equivalents of 47 (C(CH3)4, 17.5 mM) in CD2Cl2. The
concentration of “free” basket, [basket] = 1.36 mM ± 0.14 mM, was obtained by 1H
NMR integration. The sample spectrum shown has been symmetrized for clarity. Note
k*out = k*d and k*in = k*f.

161
Figure 75: 2-D 1H EXSY Spectrum (400 MHz, 250.0 ± 0.1 K) of a 2.5 mM solution of
basket 45 containing 2.75 molar equivalents of 41 (Si(CH3)4, 6.9 mM) in CD2Cl2. The
concentration of “free” basket, [basket] = 1.96 mM ± 0.20 mM, was obtained by 1H
NMR integration. The sample spectrum shown has been symmetrized for clarity. Note
k*out = k*d and k*in = k*f.

162
Figure 76: 2-D 1H EXSY Spectrum (400 MHz, 250.0 ± 0.1 K) of a 0.2 mM solution of
basket 45 containing 9.9 molar equivalents of 49 (C(CH3)Cl3, 2.2 mM) in CD2Cl2. The
concentration of “free” basket, [basket] = 0.11 mM ± 0.01 mM, was obtained by 1H
NMR integration. The sample spectrum shown has been symmetrized for clarity. Note
k*out = k*d and k*in = k*f.
Van’t Hoff Analysis of Basket 45 Encapsulating 13
CBr4
Figure 77: A series of 1H NMR (left column, 500 MHz) and
13C NMR (right column,
126 MHz) spectra of a 3.40 mM solution of 45 containing 0.78 molar equivalents (2.6

163
mM) of 13
CBr4 in CD2Cl2; note two sets of signals, one set corresponding to
[45 CD2Cl2] and another to [4513
CBr4].
1 / T
0.0032 0.0034 0.0036 0.0038 0.0040 0.0042
ln (
K)
8.5
9.0
9.5
10.0
10.5
11.0
11.5
12.0
Slope: 4221.67Intercept: -5.54
Figure 78: Van’t Hoff plot describing the temperature dependence of the natural
logarithm of equilibrium constant K, for the encapsulation of 13
CBr4. The 1H NMR
integration of the amide N H signals of basket 45 (δ = 11.6 and 11.3 ppm) was used to
obtain the value for K (see the equation below). The error bar was calculated as the 95%
prediction interval.
K250K = 8.5 x 10⁴ ± 1.6 x 10
4 M
-1

164
Table 13: Activation Parameters for the Trafficking of Guests (2D EXSY NMR, CD2Cl2,
250.0 ± 0.1 K) in (kf, ΔGf ‡) and out (kd, ΔGd
‡) from Basket 45 and the 45A/B
Interconversion (ΔGrac‡) as well as Thermodynamic Stabilities (250.0 ± 0.1 K) of
Encapsulation Complexes obtained from 2D EXSY measurements (ΔGºEXSY, KEXSY) and
the Integration of 1H NMR Signals (ΔGºNMR, KNMR).
Neo-Pentane
t-Butyl Bromide 2,2-
Dibromopropane
1,1,1-
Tribromoethane
kf 1100 ± 115 s-1
M-1
1161 ± 134 s-1
M-1
1525 ± 200 s-1
M-1
2460 ± 251 s-1
M-1
kd 30.3 ± 0.9 s-1
16.2 ± 0.8 s-1
3.41 ± 0.23 s-1
0.48 ± 0.01 s-1
ΔG‡f 11.03 ± 0.05
kcal/mol
11.00 ± 0.06
kcal/mol
10.87 ± 0.07 kcal/mol 10.63 ± 0.05 kcal/mol
ΔG‡d 12.81 ± 0.01
kcal/mol
13.12 ± 0.02
kcal/mol
13.89 ± 0.03 kcal/mol 14.86 ± 0.01 kcal/mol
krac 426 ± 85 244 ± 49 186 ± 37 87 ± 17
ΔG‡rac 11.50 ± 0.10
kcal/mol
11.77 ± 0.10
kcal/mol
11.91 ± 0.10 kcal/mol 12.28 ± 0.10 kcal/mol
KEXSY 36 ± 4 71 ± 9 447 ± 66 5125 ± 534
KNMR 51 ± 9 85 ± 15 615 ± 107 5277 ± 914
ΔG°EXSY -1.77 ± 0.05
kcal/mol
-2.11 ± 0.06
kcal/mol
-3.02 ± 0.07 kcal/mol -4.23 ± 0.05 kcal/mol
ΔG°NMR -1.95 ± 0.08
kcal/mol
-2.20 ± 0.09
kcal/mol
-3.18 ± 0.09 kcal/mol -4.24 ± 0.09 kcal/mol
CBr4
kf 8500 ± 3010 s-1
M-1
kd 0.10 ± 0.03 s-1
ΔG‡f 10.02 ± 0.18 kcal /
mol
ΔG‡d 15.63 ± 0.15 kcal /
mol
krac 50 ± 10
ΔG‡rac 12.56 ± 0.10
kcal/mol
KVan’t Hoff Plot 8.5 x10⁴ ± 1.6 x10
4
M-1
ΔG°Van’t Hoff
Plot
-5.6 ± 0.1 kcal /
mol
Tetramethylsilane 1,1,1-
Trichloroethane
kf 480 ± 48 s-1
M-1
8040 ± 873 s-1
M-1
kd 14.4 ± 0.5 s-1
22.8 ± 0.8 s-1
ΔG‡f 11.44 ± 0.05 kcal/mol 10.04 ± 0.05 kcal/mol
ΔG‡d 13.17 ± 0.02 kcal/mol 12.95 ± 0.02 kcal/mol
krac 59 ± 12 321 ± 64
ΔG‡rac 12.5 ± 0.1 kcal/mol 11.6 ± 0.1 kcal/mol
KEXSY 33 ± 4 353 ± 40
KNMR 45 ± 6 428 ± 74
ΔG°EXSY -1.73 ± 0.06 kcal/mol -2.90 ± 0.06 kcal/mol
ΔG°NMR -1.88 ± 0.07 kcal/mol -3.00 ± 0.09 kcal/mol

165
Rate Law Analysis
Here is our rate law analysis: A. From the EXSY measurement rate low(forward) = k*f
[C(CH3)Br3] so if we assume rate low(forward) = kf [C(CH3)Br3] [1] (equation A1) then k*f
= kf [1] (equation A2); (B) From the EXSY measurement rate low(backward) = k*d [1-
C(CH3)Br3] so if assume rate low(backward) = kd [1- C(CH3)Br3] (equation A1) then k*d = kd
(equation A3).
We varied the concentration of guest 48 (C(CH3)Br3) and measured the rates (EXSY) for
it entering and departing basket 45. The magnetization rate constant k*d was found to be
independent on any concentration. The magnetization rate constant k*f was, however,
found to be a linear function of the concentration of 45. Accordingly, the data fits the
kinetic model with the forward reaction being first and the backward zeroth order in the
guest (see equation A1)
(A1)
(A2)
(A3)
Table 14: Equilibrium concentrations of 45, C(CH3)Br3, [45 C(CH3)Br3] and
magnetization exchange rate constants obtained from 1H NMR integration and 2-D
1H
EXSY spectroscopic measurements, respectively (400 MHz, 250 ± 0.1 K). Sample [C(CH3)Br3] 48 [45] [45 ·
C(CH3)Br3]
k*f k
*d
1 0.29 ± 0.03 mM 0.66 ± 0.07 mM 0.73 ± 0.07 mM 1.90 ± 0.06 s-1
0.58 ± 0.01 s-1
2 0.65 ± 0.07 mM 0.57 ± 0.06 mM 1.94 ± 0.19 mM 1.63 ± 0.01 s-1
0.56 ± 0.01 s-1
3 0.58 ± 0.06 mM 0.43 ± 0.04 mM 0.96 ± 0.10 mM 1.33 ± 0.05 s-1
0.56 ± 0.01 s-1

166
[45]
0.0003 0.0004 0.0005 0.0006 0.0007 0.0008
k* f
1.0
1.2
1.4
1.6
1.8
2.0
2.2
Slope: 2449.1 +/- 232.1Intercept: 0.27 +/- 0.13
Figure 79: The magnetization rate constant k*f as a function of the concentration of 45.
Note that the fitted curve has a slope, which in accord with the equation A2 above, is
equivalent to kf. The intercept of 0.27 is close to 0.
1H NMR Line-Shape Analysis of the A/B Interconversion
First-order rate constants kA and kB, for the A/B interconversion of 45 (Figure 28) were
obtained by simulating the line-shapes of diastereotopic Hd/e signals at various
temperatures (WINDNMR-Pro)53
in the presence of guest molecules in excess. First-
order rate constant krac was, for each system, calculated from Eyring plot (250 K). The
reported error margin of 20% was obtained from four independent measurements.

167
227.5 ± 0.1 K 234.0 ± 0.1 K
238.5 ± 0.1 K 241.2 ± 0.1 K
244.0 ± 0.1 K 246.8 ± 0.1 K
249.5 ± 0.1 K 252.3 ± 0.1 K

168
255.0 ± 0.1 K 257.8 ± 0.1 K
260.5 ± 0.1 K 263.3 ± 0.1 K
266.0 ± 0.1 K 268.8 ± 0.1 K
Figure 80: Simulated (WinDNMR-Pro)53
and experimental 1H NMR (400 MHz)
resonances for the Hd/e protons in 45 (2.5 mM) in CD2Cl2 containing 53.0 molar
equivalents of CBr4 (133 mM); please note that kAB = krac.

169
krac,250K = 50 ± 10 s-1
Figure 81: Eyring plot describing the temperature dependence of krac of a 2.5 mM
solution of 45 containing 53.0 molar equivalents of CBr4 (133 mM) in CD2Cl2. Please
note kb = krac.

170
1 / T
0.0037 0.0038 0.0039 0.0040 0.0041 0.0042 0.0043 0.0044
ln (
kb / T
)
-3.5
-3.0
-2.5
-2.0
-1.5
-1.0
-0.5
0.0
0.5
Slope: -6645.3Intercept: 25.5
krac,250K = 87 ± 17 s-1
Figure 82: Eyring plot describing the temperature dependence of krac of a 2.5 mM
solution of 45 containing 120.0 molar equivalents of C(CH3)Br3 (300 mM) in CD2Cl2.
Please note kb = krac.

171
1 / T
0.0038 0.0039 0.0040 0.0041 0.0042 0.0043 0.0044 0.0045
ln (
kb / T
)
-3.0
-2.5
-2.0
-1.5
-1.0
-0.5
0.0
0.5
1.0
Slope: -5023.6Intercept: 19.8
krac,250K = 186 ± 37 s-1
Figure 83: Eyring plot describing the temperature dependence of krac of a 2.5 mM
solution of 45 containing 60.0 molar equivalents of C(CH3)2Br2 (150 mM) in CD2Cl2.
Please note kb = krac

172
1 / T
0.0039 0.0040 0.0041 0.0042 0.0043 0.0044 0.0045 0.0046
ln (
kb / T
)
-2.5
-2.0
-1.5
-1.0
-0.5
0.0 Slope: -4680.8Intercept: 18.7
krac,250K = 244 ± 49 s-1
Figure 84: Eyring plot describing the temperature dependence of krac of a 2.14 mM
solution of 45 containing 150.0 molar equivalents of C(CH3)3Br (231 mM) in CD2Cl2.
Please note kb = krac

173
1 / T
0.0041 0.0042 0.0043 0.0044 0.0045 0.0046
ln (
kb / T
)
-3.0
-2.5
-2.0
-1.5
-1.0
-0.5
0.0
Slope: -6041.9Intercept: 24.7
krac,250K = 426 ± 85 s-1
Figure 85: Eyring plot describing the temperature dependence of krac of a 1.6 mM
solution of 45 containing 275.0 molar equivalents of C(CH3)4 (440 mM) in CD2Cl2.
Please note kb = krac

174
1 / T
0.0039 0.0040 0.0041 0.0042 0.0043 0.0044 0.0045 0.0046
ln (
kb / T
)
-3.5
-3.0
-2.5
-2.0
-1.5
-1.0
-0.5
0.0
0.5
Slope: -6366.99Intercept: 25.72
krac,250K = 321 ± 64 s-1
Figure 86: Eyring plot describing the temperature dependence of krac of a 1.4 mM
solution of 45 containing 180.0 molar equivalents of C(CH3)Cl3 (252 mM) in CD2Cl2.
Please note kb = krac

175
1 / T
0.0038 0.0039 0.0040 0.0041 0.0042 0.0043
ln (
kb / T
)
-4
-3
-2
-1
0
Slope: -8557.88Intercept: 32.79
krac,250K = 59 ± 12 s-1
Figure 87: Eyring plot describing the temperature dependence of krac of a 1.4 mM
solution of 45 containing 200.0 molar equivalents of Si(CH3)4 (280 mM) in CD2Cl2.
Please note kb = krac
krac,250K = 4.85 · 104 s
-1
Figure 88: Eyring plot describing the temperature dependence of krac of a 1.5 mM
solution of 45 in CD2Cl2.

176
A.3 Supplementary Data for Chapter 3.4
Sample Preparation for 2-D EXSY Experiments
All NMR solutions and standards were prepared under nitrogen in a glove box. All NMR
samples were prepared in J. Young NMR tubes purchased from Norell. CD2Cl2 was
degassed using the freeze-thaw method and stored under nitrogen in a glove box.
Procedure for 2-D 1H EXSY Experiment
A solution of basket and guest in CD2Cl2 (J. Young NMR tube) was cooled to 250.0 ± 0.1
K inside the NMR probe and allowed to equilibrate for 1.0 h. The 1H spin-lattice
relaxation times (T1) for the free and encapsulated guest molecules were determined by a
standard inversion-recovery pulse sequence with a relaxation delay (τd) of at least 5*T1.
Following, a series of gradient NOESY experiments were run with a relaxation delay of
5*T1 and mixing times (τm) of 0 ms and three others ranging from 40 ms to 250 ms such
that the cross-peaks were clearly resolved. Each of the 128 F1 increments was the
accumulation of at least 2 scans. The corresponding integrals were determined using
MestReNova software from Mestrelab Research, after the phase and baseline corrections
in both dimensions. The magnetization exchange rate constants (k*f and k*d) were, at
each mixing time τm, calculated using the EXSYCalc program (Mestrelab Research).104
The association kf and dissociation kd rate constants were then obtained as: kf =
k*f/[basket] and kd = k*d. All quantitative NOESY experiments were repeated twice. The
mean value was reported with standard deviation as an experimental error.

177
Procedure for 2-D 13
C EXSY Experiment
A solution of basket and guest in CD2Cl2 (J. Young NMR tube) was cooled to 250.0 ± 0.5
K inside the NMR probe and allowed to equilibrate for 1.0 h. The 13
C spin-lattice
relaxation times (T1) for the free and encapsulated guest molecules were determined by a
standard inversion-recovery pulse sequence with a relaxation delay (τd) of at least 5*T1.
Following, a series of gradient NOESY experiments were run with a relaxation delay of
5*T1 and mixing times (τm) of 0 ms and either 350 ms or 400 ms. Each of the 128 F1
increments was the accumulation of at least 28 scans. The corresponding integrals were
determined using MestReNova software from Mestrelab Research, after the phase and
baseline corrections in both dimensions. The magnetization exchange rate constant (k*d)
was, at each mixing time τm, calculated using the EXSYCalc program (Mestrelab
Research).104
The dissociation kd rate constant was then obtained as: kd = k*d. The mean
value was reported with standard deviation as an experimental error. The quantitative
NOESY experiments were repeated twice. The association kin rate constant was obtained
as kf = (k*d)(K), where K is the equilibrium constant obtained from a Van’t Hoff Plot
Procedure for 1H Selective Inversion-Recovery Experiment
A solution of basket and guest in CD2Cl2 (J. Young NMR tube) was cooled to 250.0 ± 0.1
K inside the NMR probe and allowed to equilibrate for 1.0 h. The 1H spin-lattice
relaxation times (T1) for the free and encapsulated guest molecules were determined by a
standard inversion-recovery pulse sequence with a relaxation delay (τd) of at least 5*T1.

178
Using a selective 1D inversion-recovery pulse sequence [τd - 180° (selective) - τm - 90°
(nonselective)], 32 transients is obtained for each mixing time (τm) with a relaxation
delay (τd) of at least 5*T1. The absolute integrals corresponding to encapsulated and free
guest molecules were, at each mixing time, determined using TopSpin software from
Bruker and the resulting data was fitted using the two-site exchange equations described
by Led et al77
to obtain magnetization exchange rate constants k*f and k*d. The
association kf and dissociation kd rate constants were then obtained as: kf = k*f/[basket]
and kd = k*d.
Rate Constant Tables
Guests:
28 – CBr4 48 – CBr3CH3 39 – CBr2(CH3)2 40 – CBr(CH3)3
47 – C(CH3)4 49 – CCl3(CH3) 41 – Si(CH3)4 50 – CBr2Cl(CH3)
Table 15: Rate constants kf and kd measured for guests in basket 46 at 250.0 K in CD2Cl2
and the corresponding association constants obtained by NMR (KNMR) or by kf/kd. Guest 48 39 40 47 49 41 50
kf (s-1
M-1
) 116 ± 19 109 ± 19 69.8 ± 7.9 85 ± 14 102 ± 12 38.4 ± 4.5 124 ± 25
kd (s-1
) 0.024 ±
0.003
0.27 ±
0.03
1.42 ±
0.07
5.39 ±
0.37
1.23 ±
0.31
4.60 ±
0.30
0.11 ±
0.02
KNMR (M-1
) 4.85 ±
0.49 x 10³
397 ± 69 51 ± 9 14.3 ± 2.5 84 ± 15 13.2 ± 2.3 1125 ±
96
kf/kd (M-1
) 4.85 ±
0.49 x 10³
403 ± 71 49 ± 6 15.8 ± 2.9 83 ± 23 8.3 ± 1.1 1125 ±
96

179
Table 16: Rate constants kf and kd measured for guests in basket 45 at 250.0 K in CD2Cl2
and the corresponding association constants obtained by NMR (KNMR) or by kf/kd. Guest 28 48 39 40 47 49 41 50
kf (s-1
M-1
) 7609 ±
2240
2460 ±
251
1525 ±
200
1161 ±
134
1100 ±
115
2381 ±
239
494 ±
50
3438 ±
354
kd (s-1
) 0.09 ±
0.02
0.48 ±
0.01
3.41 ±
0.23
16.2 ±
0.8
30.3 ±
0.9
18.1 ±
0.1
12.5 ±
0.2
1.58 ±
0.10
KNMR (M-1
) 8.5 ±
1.6 x
104
5277 ±
914
615 ±
107
85 ± 15 51 ± 9 133 ±
23
43 ± 7 2541 ±
440
kf/kd (M-1
) 8.5 ±
1.6 x
104
5125 ±
534
447 ± 66 71 ± 9 36 ± 4 131 ±
13
39 ± 4 2176 ±
263
Table 17: Rate constants kf and kd measured for guests in basket 27 at 250.0 K in CD2Cl2
and the corresponding association constants obtained by NMR (KNMR) or by kf/kd. Guest 28 48 39 40 49 41 50
kf (s-1
M-1
) 4.4 ± 1.8 x
104
1.74 ± 0.21
x 104
1.42 ± 0.21
x 104
5393 ±
748
1.68 ± 0.32
x 104
2376 ±
285
11610 ±
1234
kd (s-1
) 0.40 ± 0.13 2.44 ± 0.12 17.9 ± 0.07 69 ±
6.6
173 ± 13 74.5 ±
5.5
7.04 ±
0.29
KNMR (M-1
) 1.1 ± 0.3
x 105
8784 ±
1521
605 ± 105 78 ± 14 97 ± 17 34.1 ±
5.9
2419 ±
419
kf/kd (M-1
) 1.1 ± 0.3
x 105
7146 ± 923 795 ± 149 78 ± 13 97 ± 17 31.9 ±
4.5
1649 ±
188
Experimental Data: Molecular Basket 46 (R = CF3)
Guests 39, 40, 47, and 49: Rate constants kf and kd were obtained through a 2-D EXSY
experiment at 250.0 K as outlined in page 176.
Guest 41: Rate constants kf and kd were obtained through an 1-D selective inversion-
recovery experiment at 250.0 K as outlined in page 176.
Guests 48 and 50: The exchange at 250.0 K was found to be too slow to be quantified by
NMR. Thus, the 2-D EXSY experiment outlined in page 176 was performed at 266.0,

180
271.0, and 276.0 K and k*d,250K was obtained by extrapolation of an Eyring Plot. The
association rate constant, kf, was obtained as kf = (k*d)(K), where K is the equilibrium
constant obtained from a Van’t Hoff Plot.
Figure 89: 2-D 1H EXSY Spectrum (400 MHz, 266.0 ± 0.1 K) of a 0.60 mM solution of
basket 46 containing 0.83 molar equivalents of 48 (C(CH3)Br3, 0.50 mM) in CD2Cl2.
The sample spectrum shown has been symmetrized for clarity. Please note k*out = k*d.

181
Figure 90: 2-D 1H EXSY Spectrum (400 MHz, 271.0 ± 0.1 K) of a 0.60 mM solution of
basket 46 containing 0.83 molar equivalents of 48 (C(CH3)Br3, 0.50 mM) in CD2Cl2.
The sample spectrum shown has been symmetrized for clarity. Please note k*out = k*d.

182
Figure 91: 2-D 1H EXSY Spectrum (400 MHz, 276.0 ± 0.1 K) of a 0.60 mM solution of
basket 46 containing 0.83 molar equivalents of 48 (C(CH3)Br3, 0.50 mM) in CD2Cl2.
The sample spectrum shown has been symmetrized for clarity. Please note k*out = k*d.

183
kd,250K = 0.024 ± 0.003 s-1
Figure 92: Eyring plot describing the temperature dependence of kd of a 0.60 mM
solution of 46 containing 0.83 molar equivalents of 48 (C(CH3)Br3, 0.50 mM) in CD2Cl2.

184
Figure 93: A series of 1H NMR Spectra (400 MHz) of a 0.60 mM solution of basket 46
containing 0.83 molar equivalents of 48 (C(CH3)Br3, 0.50 mM) in CD2Cl2.
K250K = 4.85 ± 0.49 x 10³ M
-1

185
Figure 94: Van’t Hoff plot describing the temperature dependence of the natural
logarithm of equilibrium constant K, for the encapsulation of 48 in basket 46. The 1H
δ = 12.7 and 12.5 ppm) was used
to obtain the value for K.
Figure 95: 2-D 1H EXSY Spectrum (400 MHz, 250.0 ± 0.1 K) of a 0.60 mM solution of
basket 46 containing 4.05 molar equivalents of 39 (C(CH3)2Br2, 2.43 mM) in CD2Cl2.
The sample spectrum shown has been symmetrized for clarity. The concentration of free
basket, [basket], was determined to be 0.32 ± 0.03 mM by NMR integration. Please note
k*out = k*d and k*in = k*f.

186
Figure 96: 2-D 1H EXSY Spectrum (400 MHz, 250.0 ± 0.1 K) of a 0.60 mM solution of
basket 46 containing 7.50 molar equivalents of 40 (C(CH3)3Br, 4.5 mM) in CD2Cl2. The
sample spectrum shown has been symmetrized for clarity. The concentration of free
basket, [basket], was determined to be 0.45 ± 0.05 mM by NMR integration. Please note
k*out = k*d and k*in = k*f.

187
Figure 97: 2-D 1H EXSY Spectrum (400 MHz, 250.0 ± 0.1 K) of a 0.60 mM solution of
basket 46 containing 15.9 molar equivalents of 47 (C(CH3)4, 9.54 mM) in CD2Cl2. The
sample spectrum shown has been symmetrized for clarity. The concentration of free
basket, [basket], was determined to be 0.53 ± 0.05 mM by NMR integration. Please note
k*out = k*d and k*in = k*f.

188
Figure 98: 2-D 1H EXSY Spectrum (400 MHz, 250.0 ± 0.1 K) of a 0.60 mM solution of
basket 46 containing 7.8 molar equivalents of 49 (C(CH3)Cl3, 4.7 mM) in CD2Cl2. The
sample spectrum shown has been symmetrized for clarity. The concentration of free
basket, [basket], was determined to be 0.38 ± 0.04 mM by NMR integration. Please note
k*out = k*d and k*in = k*f.
k*f = 0.0179 ± 0.0011 s-1
k*d = 4.60 ± 0.30 s-1

189
Figure 99: Experimental 1H selective inversion-recovery NMR (400 MHz, 250 K) data
and the corresponding fittings for free (left) and encapsulated (right) 41 (Si(CH3)4) in a
0.56 mM solution of 46 containing 29.43 molar equivalents of 10 (16.5 mM) in CD2Cl2.
The concentration of free basket, [basket], was determined to be 0.46 ± 0.05 mM by
NMR integration.
Figure 100: 2-D 1H EXSY Spectrum (400 MHz, 266.0 ± 0.1 K) of a 0.56 mM solution of
basket 46 containing 1.18 molar equivalents of 50 (C(CH3)Br2Cl, 0.66 mM) in CD2Cl2.
The sample spectrum shown has been symmetrized for clarity. Please note k*out = k*d.

190
Figure 101: 2-D 1H EXSY Spectrum (400 MHz, 271.0 ± 0.1 K) of a 0.56 mM solution of
basket 46 containing 1.18 molar equivalents of 50 (C(CH3)Br2Cl, 0.66 mM) in CD2Cl2.
The sample spectrum shown has been symmetrized for clarity. Please note k*out = k*d.

191
Figure 102: 2-D 1H EXSY Spectrum (400 MHz, 276.0 ± 0.1 K) of a 0.56 mM solution of
basket 46 containing 1.18 molar equivalents of 50 (C(CH3)Br2Cl, 0.66 mM) in CD2Cl2.
The sample spectrum shown has been symmetrized for clarity. Please note k*out = k*d.

192
kd,250K = 0.11 ± 0.02 s-1
Figure 103: Eyring plot describing the temperature dependence of kd of a 0.56 mM
solution of 46 containing 1.18 molar equivalents of 50 (C(CH3)Br2Cl, 0.66 mM) in
CD2Cl2.

193
Figure 104: A series of 1H NMR Spectra (400 MHz) of a 0.56 mM solution of basket 46
containing 1.18 molar equivalents of 50 (C(CH3)Br2Cl, 0.50 mM) in CD2Cl2.
K250K = 1.13 ± 0.10 x 10³ M
-1

194
Figure 105: Van’t Hoff plot describing the temperature dependence of the natural
logarithm of equilibrium constant K, for the encapsulation of 50 in basket 46. The 1H
δ = 12.7 and 12.5 ppm) was used
to obtain the value for K.
Experimental Data: Molecular Basket 45 (R = Ph)
Guests 28, 48, 39, 40, 47, 49, 41, and 50: Rate constants kf and kd were obtained through
a 2-D EXSY experiment at 250.0 K as outlined in page 176.
Figure 106: 2-D 13
C EXSY Spectrum (126 MHz, 250.0 ± 0.1 K) of a 2.60 mM solution
of basket 45 containing 1.5 molar equivalents of 28 (13
CBr4, 3.9 mM) in CD2Cl2. The
sample spectrum shown has been symmetrized for clarity. Please note k*out = k*d.

195
Figure 107: A series of 1H NMR Spectra (400 MHz) of a 3.40 mM solution of basket 45
containing 0.78 molar equivalents of 28 (13
CBr4, 2.6 mM) in CD2Cl2.
K250K = 8.5 ± 1.6 x 10⁴ M
-1
Figure 108: Van’t Hoff plot describing the temperature dependence of the natural
logarithm of equilibrium constant K, for the encapsulation of 28 in basket 45. The 1H

196
NMR integration of the am δ = 11.6 and 11.3 ppm) was used
to obtain the value for K.
Figure 109: 2-D 1H EXSY Spectrum (400 MHz, 250.0 ± 0.1 K) of a 2.5 mM solution of
basket 45 containing 1.0 molar equivalents of 48 (CBr3CH3, 2.5 mM) in CD2Cl2. The
sample spectrum shown has been symmetrized for clarity. The concentration of free
basket, [basket], was determined to be 0.57 ± 0.06 mM by NMR integration. Please note
k*out = k*d and k*in = k*f.

197
Figure 110: 2-D 1H EXSY Spectrum (400 MHz, 250.0 ± 0.1 K) of a 2.5 mM solution of
basket 45 containing 2.0 molar equivalents of 39 (CBr2(CH3)2, 5.0 mM) in CD2Cl2. The
sample spectrum shown has been symmetrized for clarity. The concentration of free
basket, [basket], was determined to be 0.83 ± 0.08 mM by NMR integration. Please
note k*out = k*d and k*in = k*f.
Figure 111: 2-D 1H EXSY Spectrum (400 MHz, 250.0 ± 0.1 K) of a 2.5 mM solution of
basket 45 containing 10.2 molar equivalents of 40 (C(CH3)3Br, 25.5 mM) in CD2Cl2.
The sample spectrum shown has been symmetrized for clarity. The concentration of free

198
basket, [basket], was determined to be 0.83 ± 0.08 mM by NMR integration. Please note
k*out = k*d and k*in = k*f.
Figure 112: 2-D 1H EXSY Spectrum (400 MHz, 250.0 ± 0.1 K) of a 2.5 mM solution of
basket 45 containing 7.0 molar equivalents of 47 (C(CH3)4, 17.5 mM) in CD2Cl2. The
sample spectrum shown has been symmetrized for clarity. The concentration of free
basket, [basket], was determined to be 1.36 ± 0.14 mM by NMR integration. Please note
k*out = k*d and k*in = k*f.

199
Figure 113: 2-D 1H EXSY Spectrum (400 MHz, 250.0 ± 0.1 K) of a 1.64 mM solution of
basket 45 containing 9.68 molar equivalents of 49 (C(CH3)Cl3, 15.9 mM) in CD2Cl2. The
sample spectrum shown has been symmetrized for clarity. The concentration of free
basket, [basket], was determined to be 0.55 ± 0.06 mM by NMR integration. Please note
k*out = k*d and k*in = k*f.

200
Figure 114: 2-D 1H EXSY Spectrum (400 MHz, 250.0 ± 0.1 K) of a 2.5 mM solution of
basket 45 containing 2.75 molar equivalents of 41 (Si(CH3)4, 6.9 mM) in CD2Cl2. The
sample spectrum shown has been symmetrized for clarity. The concentration of free
basket, [basket], was determined to be 1.96 ± 0.20 mM by NMR integration. Please note
k*out = k*d and k*in = k*f.
Figure 115: 2-D 1H EXSY Spectrum (400 MHz, 250.0 ± 0.1 K) of a 1.65 mM solution of
basket 45 containing 1.08 molar equivalents of 50 (C(CH3)Br2Cl, 1.78 mM) in CD2Cl2.
The sample spectrum shown has been symmetrized for clarity. The concentration of free

201
basket, [basket], was determined to be 0.59 ± 0.06 mM by NMR integration. Please note
k*out = k*d and k*in = k*f.
Experimental Data: Molecular Basket 27 (R = Me)
Guests 28, 48, 39, 40, and 50: Rate constants kf and kd were obtained through a 2-D
EXSY experiment at 250.0 K as outlined in page 176.
Guest 49 and 41: Rate constants kf and kd were obtained through an 1-D selective
inversion-recovery experiment at 250.0 K as outlined in page 176. For guest 49, the
association rate constant, kf, was obtained as kf = (k*d)(K), where K is the equilibrium
constant obtained from a Van’t Hoff Plot.

202
Figure 116: 2-D 13
C EXSY Spectrum (126 MHz, 250.0 ± 0.1 K) of a 2.36 mM solution
of basket 27 containing 0.70 molar equivalents of 28 (13
CBr4, 1.65 mM) in CD2Cl2. The
sample spectrum shown has been symmetrized for clarity. Please note k*out = k*d.

203
Figure 117: A series of 1H NMR Spectra (400 MHz) of a 2.36 mM solution of basket 27
containing 0.70 molar equivalents of 28 (13
CBr4, 1.65 mM) in CD2Cl2.

204
\
K250K = 1.1 ± 0.3 x 10⁵ M
-1
Figure 118: Van’t Hoff plot describing the temperature dependence of the natural
logarithm of equilibrium constant K, for the encapsulation of 28 in basket 27. The 1H
δ = 11.4 and 11.2 ppm) was used
to obtain the value for K.

205
Figure 119: 2-D 1H EXSY Spectrum (400 MHz, 250.0 ± 0.1 K) of a 0.69 mM solution of
basket 27 containing 1.19 molar equivalents of 48 (CBr3CH3, 0.83 mM) in CD2Cl2. The
sample spectrum shown has been symmetrized for clarity. The concentration of free
basket, [basket], was determined to be 0.18 ± 0.02 mM by NMR integration. Please note
k*out = k*d and k*in = k*f.

206
Figure 120: 2-D 1H EXSY Spectrum (400 MHz, 250.0 ± 0.1 K) of a 0.69 mM solution of
basket 27 containing 1.31 molar equivalents of 39 (CBr2(CH3)2, 0.90 mM) in CD2Cl2.
The sample spectrum shown has been symmetrized for clarity. The concentration of free
basket, [basket], was determined to be 0.48 ± 0.05 mM by NMR integration. Please
note k*out = k*d and k*in = k*f.

207
Figure 121: 2-D 1H EXSY Spectrum (400 MHz, 250.0 ± 0.1 K) of a 0.69 mM solution of
basket 27 containing 4.59 molar equivalents of 40 (C(CH3)3Br, 3.17 mM) in CD2Cl2.
The sample spectrum shown has been symmetrized for clarity. The concentration of free
basket, [basket], was determined to be 0.56 ± 0.06 mM by NMR integration. Please note
k*out = k*d and k*in = k*f.

208
k*out = 173 ± 13 s-1
Figure 122: Experimental 1H selective inversion-recovery NMR (400 MHz, 250 K) data
and the corresponding fittings for free (left) and encapsulated (right) 49 (CCl3CH3) in a
1.64 mM solution of 27 containing 6.65 molar equivalents of 9 (11.81 mM) in CD2Cl2.

209
Figure 123: A series of 1H NMR Spectra (400 MHz) of a 1.64 mM solution of basket 27
containing 6.65 molar equivalents of 49 (C(CH3)Cl3, 11.81 mM) in CD2Cl2.

210
K250K = 97 ± 17
Figure 124: Van’t Hoff plot describing the temperature dependence of the natural
logarithm of equilibrium constant K, for the encapsulation of 49 in basket 27. The 1H
s of basket 3 (δ = 11.6 and 11.3 ppm) was used
to obtain the value for K (see the equation below).
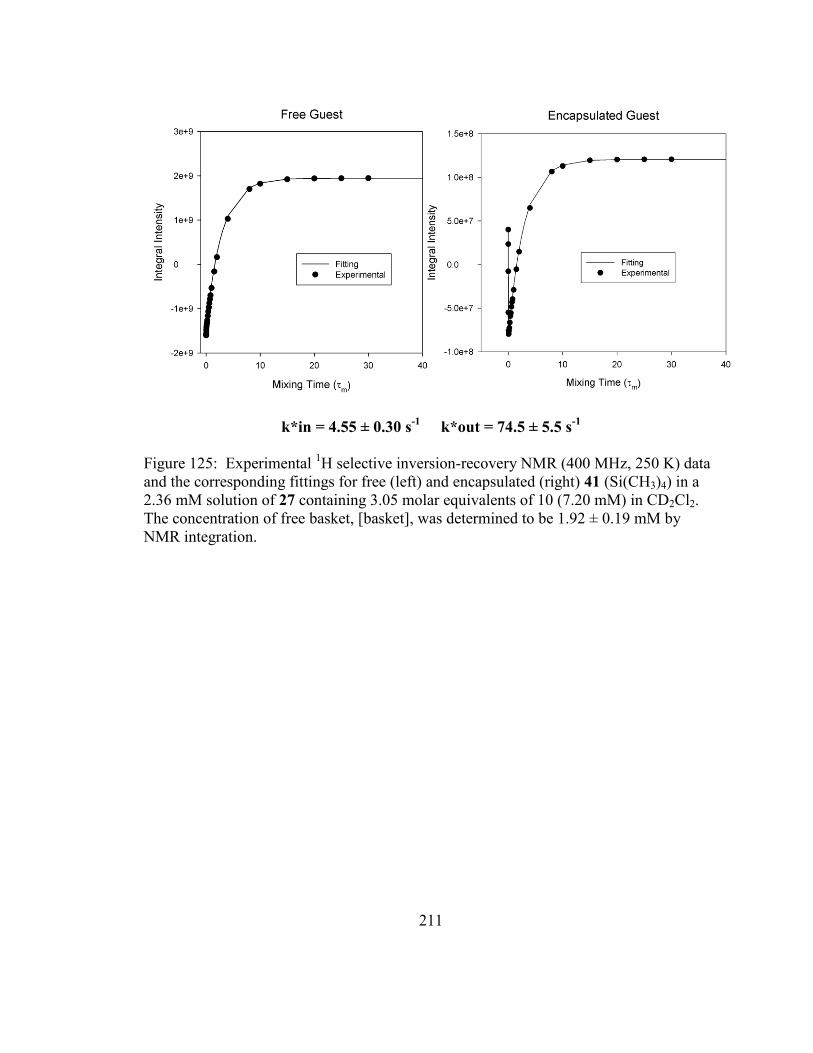
211
k*in = 4.55 ± 0.30 s-1
k*out = 74.5 ± 5.5 s-1
Figure 125: Experimental 1H selective inversion-recovery NMR (400 MHz, 250 K) data
and the corresponding fittings for free (left) and encapsulated (right) 41 (Si(CH3)4) in a
2.36 mM solution of 27 containing 3.05 molar equivalents of 10 (7.20 mM) in CD2Cl2.
The concentration of free basket, [basket], was determined to be 1.92 ± 0.19 mM by
NMR integration.

212
Figure 126: 2-D 1H EXSY Spectrum (400 MHz, 250.0 ± 0.1 K) of a 0.69 mM solution of
basket 27 containing 0.93 molar equivalents of 50 (C(CH3)Br2Cl, 0.64 mM) in CD2Cl2.
The sample spectrum shown has been symmetrized for clarity. The concentration of free
basket, [basket], was determined to be 0.38 ± 0.04 mM by NMR integration. Please note
k*out = k*d and k*in = k*f.
1H NMR Line-Shape Analysis of the A/B Interconversion
First-order rate constants kA and kB, for the A/B interconversion of baskets 46 and 45
were obtained by simulating the line-shapes of diastereotopic He/f signals at various
temperatures (WINDNMR-Pro).53
First-order rate constant krac = kA = kB was, for each
system, calculated from an Eyring plot (250 K).

213
184.0 ± 0.1 K 186.3 ± 0.1 K
188.5 ± 0.1 K 190.7 ± 0.1 K
192.9 ± 0.1 K 195.1 ± 0.1 K
197.3 ± 0.1 K 199.6 ± 0.1 K

214
201.8 ± 0.1 K 205.1 ± 0.1 K
Figure 127: Simulated (WinDNMR-Pro)53
and experimental 1H NMR (400 MHz)
resonances for the He/f protons in 45 (2.0 mM) in CD2Cl2; please note that kAB = krac.
krac,250K ~ 2.95 x 10³ s
-1
Figure 128: Eyring plot describing the temperature dependence of krac of a 1.1 mM
solution of 46 in CD2Cl2.

215
krac,250K ~ 4.85 x 10⁴ s
-1
Figure 129: Eyring plot describing the temperature dependence of krac of a 2.0 mM
solution of 45 in CD2Cl2.
A.4 Supplementary Data for Chapter 3.5
Sample Preparation for 2-D EXSY Experiments
All NMR solutions and standards were prepared under nitrogen in a glove box. All NMR
samples were prepared in J. Young NMR tubes purchased from Norell. CD2Cl2 and
C6D5CD3 were degassed using the freeze-thaw method and stored under nitrogen in a
glove box.

216
Procedure for 2-D 1H EXSY Experiment
The sample solution (J. Young NMR tube) was cooled to 188.8 ± 0.1 K inside the NMR
probe and allowed to equilibrate for 1.0 h. The 1H spin-lattice relaxation times (T1) for
the free and encapsulated guest molecules were determined by a standard inversion-
recovery pulse sequence with a relaxation delay (τd) of at least 5*T1. Following, a series
of gradient NOESY experiments were run with a relaxation delay of 5*T1 and mixing
times (τm) of 0 ms and 100 ms. Each of the 128 F1 increments was the accumulation of 2
scans. The peak integrals were determined using XWinNMR software from Bruker, after
the phase and baseline corrections in both dimensions. The magnetization exchange rate
constants (k*obs) between the axial and equatorial protons of cyclohexane-d11 residing
outside (k*outside) and inside (k*inside) the cavity were calculated using the EXSYCalc
program (Mestrelab Research).104
The chair-to-chair interconversion rate constants (k)
were calculated as k = (2)(k*outside) for cyclohexane residing outside the cavity and k =
(2)(k*inside) for cyclohexane residing inside the cavity. The mean value was reported with
standard deviation as an experimental error. The quantitative NOESY experiments were
repeated twice.

217
Figure 130: 2-D 1H EXSY Spectrum (400 MHz, 188.8 ± 0.1 K) of a 1.4 mM solution of
basket 27 containing 10.6 molar equivalents of cyclohexane-d11 (14.8 mM) in CD2Cl2.
Figure 131: 2-D 1H EXSY Spectrum (400 MHz, 188.8 ± 0.1 K) of a 1.4 mM solution of
basket 45 containing 10.0 molar equivalents of cyclohexane-d11 (14.0 mM) in CD2Cl2.

218
Figure 132: 2-D 1H EXSY Spectrum (400 MHz, 188.8 ± 0.1 K) of a 1.1 mM solution of
basket 46 containing 35.0 molar equivalents of cyclohexane-d11 (38.5 mM) in CD2Cl2.

219
Figure 133: 2-D 1H EXSY Spectrum (400 MHz, 188.8 ± 0.1 K) of a 200.1 mM solution
of cyclohexane-d11 in C6D5CD3. Please note k*flip = k*obs.
Van’t Hoff Analysis of Baskets Encapsulating Cyclohexane-d11

220
Figure 134: A series of 1H NMR (400 MHz) spectra of a 1.4 mM solution of basket 27
containing 10.6 molar equivalents of cyclohexane-d11 (14.8 mM) in CD2Cl2.
K188.8K = 313.6 ± 29.0 M-1
Figure 135: Van’t Hoff plot describing the temperature dependence of the natural
logarithm of equilibrium constant K, for the encapsulation of cyclohexane-d11. The 1H

221
NMR integration of the amide N-H signals of basket 27 (δ = 11.6 and 11.3 ppm) was
used to obtain the value for K. The error was calculated as the 95% prediction interval.
Figure 136: A series of 1H NMR (400 MHz) spectra of a 1.7 mM solution of basket 45
containing 10.0 molar equivalents of cyclohexane-d11 (16.7 mM) in CD2Cl2.

222
K188.8K = 191.4 ± 12.6 M-1
Figure 137: Van’t Hoff plot describing the temperature dependence of the natural
logarithm of equilibrium constant K, for the encapsulation of cyclohexane-d11. The 1H
NMR integration of the amide N-H signals of basket 45 (δ = 11.6 and 11.3 ppm) was
used to obtain the value for K. The error was calculated as the 95% prediction interval.

223
Figure 138: A series of 1H NMR (400 MHz) spectra of a 1.1 mM solution of basket 46
containing 35.0 molar equivalents of cyclohexane-d11 (38.5 mM) in CD2Cl2.
K188.8K = 51.8 ± 5.2 M-1
Figure 139: Van’t Hoff plot describing the temperature dependence of the natural
logarithm of equilibrium constant K, for the encapsulation of cyclohexane-d11. The 1H

224
NMR integration of the amide N-H signals of basket 46 (δ = 11.6 and 11.3 ppm) was
used to obtain the value for K. The error was calculated as the 95% prediction interval.
1H NMR Line-Shape Analysis of Cyclohexane-d11
First order rate constants, k, describing the interconversion between the two chair
conformers of cyclohexane-d11 were obtained by simulating the line-shapes at various
temperatures (WINDNMR-Pro)53
in C5H6CD3 and CD2Cl2. k at 188.8 K was, for each
solvent, calculated from an Eyring plot.
235.6 ± 0.1 K 232.8 ± 0.1 K
230.0 ± 0.1 K 227.2 ± 0.1 K

225
224.5 ± 0.1 K 221.7 ± 0.1 K
218.9 ± 0.1 K 216.2 ± 0.1 K
213.4 ± 0.1 K 210.6 ± 0.1 K
207.9 ± 0.1 K 205.1 ± 0.1 K

226
202.3 ± 0.1 K 199.6 ± 0.1 K
196.8 ± 0.1 K
Figure 140: Simulated (WINDNMR-Pro)53
and experimental 1H NMR (400 MHz)
resonances of cyclohexane-d11 (200.1 mM) in C6D5CD3.
1 / T
0.0042 0.0044 0.0046 0.0048 0.0050 0.0052
ln (
k /
T)
-3
-2
-1
0
1
2
3
Slope: -5198.04 +/- 78.17Intercept: 24.36 +/- 0.36
k, 188.8K = 7.9 ± 4.3 s-1

227
Figure 141: Eyring plot describing the temperature dependence of k of a 200.1 mM
solution of cyclohexane-d11 in C6D5CD3. The reported error margins are the standard
errors from the linear least-squares analysis.
238.3 ± 0.1 K 232.8 ± 0.1 K
227.2 ± 0.1 K 224.5 ± 0.1 K
221.7 ± 0.1 K 218.9 ± 0.1 K

228
216.2 ± 0.1 K 213.4 ± 0.1 K
210.6 ± 0.1 K 207.9 ± 0.1 K
205.1 ± 0.1 K
Figure 142: Simulated (WINDNMR-Pro) and experimental 1H NMR (400 MHz)
resonances of cyclohexane-d11 (200.1 mM) in CD2Cl2.

229
1 / T
0.0040 0.0042 0.0044 0.0046 0.0048 0.0050
ln (
k /
T)
-2
-1
0
1
2
3
Slope: -5150.91 +/- 46.32Intercept: 23.98 +/- 0.21
kflip, 188.8K = 6.9 ± 2.2 s-1
Figure 143: Eyring plot describing the temperature dependence of k of a 100 mM
solution of cyclohexane-d11 in CD2Cl2. The reported error margins are the standard errors
from the linear least-squares analysis.
A.5 Supplementary Data for Chapter 4.1
Sample Preparation for NMR Studies Involving Cu(I)
All NMR solutions and standards were prepared and handled under nitrogen in a glove
box. All NMR samples were prepared in J. Young Valve NMR Tubes purchased from
Norell. CD2Cl2, C6D6, and C6D5CD3 were degassed using the freeze-thaw method and
stored under nitrogen in a glove box.

230
Figure 144: 1H-
1H COSY NMR spectrum (400 MHz, 300 K) of a 1.9 mM solution
(CD2Cl2:C6D6 = 2:1) of 27:Cu(I).

231
Figure 145: 1H-
1H NOESY NMR spectrum (400 MHz, 200 ms mixing time, 300 K) of a
1.9 mM solution (CD2Cl2:C6D6 = 2:1) of 27:Cu(I).

232
Figure 146: A selected 1H DOSY NMR (500 MHz, 300 ± 1 K) spectrum of a 1.9 mM
solution (CD2Cl2:C6D6 = 2:1) of 27:Cu(I). The resulting mean average diffusion
coefficient (average of three experiments) is shown below.

233
Figure 147: Low Resolution MALDI-TOF mass spectrum of 27 containing 0.75 equiv.
of (CuOTf)2PhMe.

234
Figure 148: Variable Temperature (VT) 1H NMR (400 MHz) spectra of a 0.71 mM
(CD2Cl2:C6D5CD3 = 2:1 ) solution of 27.

235
Figure 149: The simulated (WINDNMR-Pro)1 and the experimental signals for the
exchange of spins corresponding to Hd/e nuclei in 27. The apparent first-order rate
constants k1/k-1 are shown on the right.

236
Figure 150: A series of 1H NMR (400 MHz, 243 K) spectra of a 2.2 mM solution of 27
(CD2Cl2:C6D5CD3 = 2:1), containing 0.5 molar equivalents of (CuOTF)2PhMe, 10.0
molar equivalents of CH3CBr2CH3, and 1.5 molar equivalents of CH3NC, and recorded
after an addition of 18.6 molar equivalents of Na2S·9H2O. The heterogenous mixture was
shaken in between the measurements.

237
Figure 151: A series of 1H NMR (400 MHz, 243 K) spectra of a 0.71 mM solution of 27
(CD2Cl2:C6D5CD3 = 2:1) containing 1.0 molar equivalent of (CuOTF)2PhMe and
recorded after addition of (A) 0.0, (B) 4.0, (C) 8.0, and (D) 12.0 molar equivalents of
CH3CBr2CH3.

238
Figure 152: 1H-
1H COSY NMR (400 MHz, 300 K) spectrum of a 1.0 mM solution
(CD2Cl2) of [27 H]+.

239
Figure 153: 1H-
1H NOESY NMR (400 MHz, 200 ms mixing time, 300 K) spectrum of a
1.0 mM solution (CD2Cl2) of [27 H]+.

240
Figure 154: Variable Temperature (VT) 1H NMR (400 MHz) spectra of a 1.0 mM
solution (CD2Cl2) of [27 H]+.

241
Figure 155: 19
F NMR (376 MHz, 300 K, CD2Cl2) spectra of 1.0 mM solution of (A)
[27 H]+ and (B) pyridinium trifluoroacetate, both containing α,α,α-trifluorotoluene
(standard). Please note [1 H]+ CF3CO2
- = [27 H]
+ CF3CO2
-.
Figure 156: Variable Temperature 1H NMR (400 MHz) spectra of a 0.7 mM solution
(CD2Cl2) of 27 containing 1.0 molar equivalent of CH3SO3H (inset: the singlet
corresponds to unperturbed CH3 in methanesulfonate anion).

242
Figure 157: 1H-
1H EXSY NMR (400 MHz, 200 ms mixing time, 300 K) spectrum of 1.6
mM solution of 27 (CD2Cl2) containing 3.2 molar equivalents of TFA.

243
Figure 158: 1H-
1H NOESY NMR (400 MHz, 250 ms mixing time, 243 K) spectrum of a
0.8 mM solution of 27 containing 50 molar equivalents of CH3CBr2CH3 and 3.5 molar
equivalents of TFA.

244
Figure 159: A series of 1H NMR (400 MHz, 243 K, CD2Cl2) spectra of a 1.3 mM
solution of 27, containing 2.2 molar equivalents of CH3CBr2CH3 and 3.4 molar
equivalents of TFA, and recorded after addition of 140 molar equivalents of K2CO3. The
mixture was shaken in between the measurements.

245
Figure 160: A selected 1H DOSY NMR (500 MHz, 300 ± 1K) spectrum of a 2.3 mM
solution (CD2Cl2) of 27. The resulting mean average diffusion coefficient (D) and the
hydrodynamic radius were calculated (from three independent measurements) to be 8.7 ±
0.6 x 10⁻¹⁰
m2s
-1 and 6.1 ± 0.4 Å, respectively.

246
Figure 161: A selected 1H DOSY NMR (500 MHz, 300 ± 1K) spectrum of a 2.3 mM
solution (CD2Cl2) of [27 H]+. The resulting mean average diffusion coefficient (D) and
hydrodynamic radius were calculated (from three independent measurements) to be 8.3 ±
0.9 x 10⁻¹⁰
m2s
-1 and 6.4 ± 0.7 Å, respectively.

247
Figure 162: A selected 1H DOSY NMR (500 MHz, 300 ± 1K) spectrum of a 2.3 mM
solution (CD2Cl2) of 27 containing 3.5 molar equivalents of TFA. The resulting mean
average diffusion coefficient (D) and hydrodynamic radius was calculated (from three
independent measurements) to be 5.7 ± 0.5 x 10⁻¹⁰
m2s
-1 and 9.4 ± 0.4 Å, respectively.