
An Interactive Performance-Based Expert System for ...
233
An Interactive Performance-Based Expert System for Daylighting in Architectural Design by Jaime M.L. Gagne Bachelor of Arts, Engineering Sciences (2003) Harvard University Master of Architecture (2006) University of Pennsylvania Master of Science, Architecture (2007) University of Pennsylvania Submitted to the Department of Architecture in Partial Fulfillment of the Requirements for the Degree of Doctor of Philosophy in Architecture : Building Technology at the Massachusetts Institute of Technology February 2011 c 2011 Massachusetts Institute of Technology. All rights reserved. Signature of Author: Department of Architecture January 7, 2011 Certified by: Leslie K. Norford Professor of Building Technology Thesis Supervisor Certified by: Marilyne Andersen Associate Professor of Sustainable Construction Technologies, EPFL Thesis Co-Supervisor Accepted by: Takehiko Nagakura Associate Professor of Design and Computation Chairman, Department Committee on Graduate Students
-
Upload
khangminh22 -
Category
Documents
-
view
4 -
download
0
Transcript of An Interactive Performance-Based Expert System for ...

An Interactive Performance-Based Expert System forDaylighting in Architectural Design
by
Jaime M.L. Gagne
Bachelor of Arts, Engineering Sciences (2003)Harvard University
Master of Architecture (2006)University of Pennsylvania
Master of Science, Architecture (2007)University of Pennsylvania
Submitted to the Department of Architecturein Partial Fulfillment of the Requirements for the Degree of
Doctor of Philosophy in Architecture : Building Technologyat the
Massachusetts Institute of Technology
February 2011
c© 2011 Massachusetts Institute of Technology. All rights reserved.
Signature of Author:
Department of ArchitectureJanuary 7, 2011
Certified by:
Leslie K. NorfordProfessor of Building Technology
Thesis Supervisor
Certified by:
Marilyne AndersenAssociate Professor of Sustainable Construction Technologies, EPFL
Thesis Co-Supervisor
Accepted by:
Takehiko NagakuraAssociate Professor of Design and Computation
Chairman, Department Committee on Graduate Students

2

Thesis Committee
Leslie K. NorfordProfessor of Building TechnologyDepartment of ArchitectureMassachusetts Institute of TechnologyThesis Supervisor
Marilyne AndersenAssociate Professor of Sustainable Construction TechnologiesSchool of Architecture, Civil and Environmental EngineeringÉcole Polytechnique Fédérale de LausanneThesis Co-Supervisor
Luisa CaldasAssociate Professor of ArchitectureFaculty of ArchitectureTechnical University of LisbonReader
3

4

An Interactive Performance-Based Expert System for Daylighting inArchitectural Design
by
Jaime M.L. Gagne
Submitted to the Department of Architecture on January 7th, 2011in partial fulfillment of the requirements for the degree of
Doctor of Philosophy in Architecture: Building Technology
Abstract
Design practitioners are increasingly using digital tools during the design process; how-ever, building performance simulation continues to be more commonly utilized for anal-ysis rather than as a design aid. Additionally, while simulation tools provide the userwith valuable information, they do not necessarily guide the designer towards changeswhich may improve performance. For designing with daylighting, it is essential that thedesigner consider performance during the early design stage, as this is the stage when themost critical design decisions are made, such as the overall building geometry and façadeelements. This thesis proposes an interactive, goal-based expert system for daylightingdesign, intended for use during the early design phase. The system gives the user theability to input an initial model and a set of daylighting performance goals. Performanceareas considered are illuminance and glare risk from daylighting. The system acts as a“virtual daylighting consultant,” guiding the user towards improved performance whilemaintaining the integrity of the original design and of the design process itself.
This thesis consists of three major parts: development of the expert system, implementa-tion of the system including a user interface, and performance assessment. The two majorcomponents of the expert system are a daylighting-specific database, which contains in-formation about the effects of a variety of design conditions on resultant daylighting per-formance, and a fuzzy rule-based decision-making logic, which is used to determine thosedesign changes most likely to improve performance for a given design. The expert systemhas been implemented within Google SketchUp along with a user interface which allows adesigner to fully participate in the design process. Performance assessment is done in twoways: first by comparing the effectiveness of the system to a genetic algorithm, a knownoptimization method, and second by evaluating the success of the user interactivity of thetool, its use within the design process, and its potential to improve the daylighting perfor-mance of early stage designs.
Thesis Supervisor: Leslie K. NorfordTitle: Professor of Building Technology
Thesis Co-Supervisor: Marilyne AndersenTitle: Associate Professor of Sustainable Construction Technologies, EPFL
5

6

Dedication
This thesis is dedicated to the memory of my mother, June Warren Lee, whose gentlestrength is ever with me.
7

8

Acknowledgments
The work presented in this dissertation would not have been possible without the helpand support of a great number of people. First and foremost, I would like to thank Mari-lyne Andersen for being a wonderful advisor and mentor and for inspiring this research.It was a privilege to work with her, and I would like to thank her for her excellent advice,attention to detail, sense of humor, and endless support.
I would also like to thank Les Norford and Luisa Caldas for their constructive and in-sightful feedback, with special thanks to Les Norford for embracing his late hour role asa co-advisor and for always helping me to remember the bigger picture. Thank you to allthree of my committee members for always believing in my work and pushing my researchone step further.
Thank you to the many people who worked on the Lightsolve program and who helpedto provide the framework for my research: Barb Cutler and Yu Sheng from RensselaerPolytechnic Institute for all their work on the Lightsolve rendering program, Phil Seatonfor creating the Lightsolve and expert system interfaces, and especially Sian Kleindienstfor implementing Lightsolve and for truly paving the way.
I would like to thank the MIT Department of Architecture, the Building Technology pro-gram, and Marilyne Andersen for financial support, as well as the Martin Family Societyof Fellows for Sustainability.
Although I cannot name them directly, I would like to thank all the participants of my userstudy for testing my system and for providing me with valuable feedback.
One of the best things about doing research at MIT is having the opportunity to meet somany talented and interesting people. I had a wonderful time working in the BuildingTechnology Lab, and I would like to thank all the BT faculty, students, and staff for cre-ating such a warm and supportive environment. Thank you to my fellow daylighters,Sian Kleindienst, Shreya Dave, Kevin Thuot, and Siobhan Rockcastle, for the many con-versations about our work, and in particular to Shreya and Kevin for feedback on the userstudy design. Thanks to David Quinn for introducing me to LATEX, and to Steve Ray forbeing such a friendly lab neighbor. I would especially like to thank Jennifer Zessin, CarrieBrown, and Alejandra Menchaca, who were with me from the beginning until the end, andwho were always available to help me work through new ideas, despite our differences inresearch areas.
A huge thank you goes to my family and friends for the many hugs along the way. Thankyou to my father, William Lee, who instilled in me a love of knowledge and who taughtme the value of education. Thanks also to my brother, Daniel Lee, who never doubted mefor a moment. Most of all, I would like to thank my husband Josh, whose support andencouragement never wavered and whose patience is apparently boundless. I could nothave done it without him.
9

10

Contents
I Introduction 23
1 Introduction 25
1.1 Motivation for Daylighting . . . . . . . . . . . . . . . . . . . . . . . . . . . . 25
1.2 Digital Tools for Daylighting Design . . . . . . . . . . . . . . . . . . . . . . . 27
1.3 The Need for a New Method . . . . . . . . . . . . . . . . . . . . . . . . . . . 28
1.4 Thesis Outline . . . . . . . . . . . . . . . . . . . . . . . . . . . . . . . . . . . . 31
2 Digital Methods for Performance-Based Building Design 33
2.1 Introduction . . . . . . . . . . . . . . . . . . . . . . . . . . . . . . . . . . . . . 33
2.2 Optimization Methods . . . . . . . . . . . . . . . . . . . . . . . . . . . . . . . 33
2.2.1 Optimization Methods for Building Performance and Design . . . . 34
2.2.2 Examples of Lighting Performance Optimization . . . . . . . . . . . 36
2.3 Expert Systems . . . . . . . . . . . . . . . . . . . . . . . . . . . . . . . . . . . 37
2.3.1 Expert Systems for Building Performance and Design . . . . . . . . . 38
2.3.2 Examples of Expert Systems for Lighting . . . . . . . . . . . . . . . . 39
2.4 Self-Guided Search . . . . . . . . . . . . . . . . . . . . . . . . . . . . . . . . . 40
2.5 Chapter Summary . . . . . . . . . . . . . . . . . . . . . . . . . . . . . . . . . . 41
3 The Architectural Design Process 43
3.1 Introduction . . . . . . . . . . . . . . . . . . . . . . . . . . . . . . . . . . . . . 43
3.2 The Traditional Design Process . . . . . . . . . . . . . . . . . . . . . . . . . . 43
3.2.1 The Nature of Design . . . . . . . . . . . . . . . . . . . . . . . . . . . 43
3.2.2 Stages of the Design Process . . . . . . . . . . . . . . . . . . . . . . . . 44
11

3.2.3 Design Heuristics . . . . . . . . . . . . . . . . . . . . . . . . . . . . . . 45
3.3 Incorporating Daylighting Goals Into the Design Process . . . . . . . . . . . 46
3.4 Generative and Performance-Based Design . . . . . . . . . . . . . . . . . . . 47
3.4.1 Generative Design . . . . . . . . . . . . . . . . . . . . . . . . . . . . . 48
3.4.2 Performance-Based Design . . . . . . . . . . . . . . . . . . . . . . . . 48
3.5 Features of the Proposed Expert System Design Process . . . . . . . . . . . . 49
3.6 Chapter Summary . . . . . . . . . . . . . . . . . . . . . . . . . . . . . . . . . . 51
II An Expert System for Daylighting Design 53
4 A Daylighting-Specific Database 55
4.1 Introduction . . . . . . . . . . . . . . . . . . . . . . . . . . . . . . . . . . . . . 55
4.2 Knowledge Acquisition . . . . . . . . . . . . . . . . . . . . . . . . . . . . . . 56
4.2.1 Design of Experiments Methodology . . . . . . . . . . . . . . . . . . 57
4.2.2 Daylighting Simulation Engine . . . . . . . . . . . . . . . . . . . . . . 58
4.2.3 Illuminance and Glare Daylighting Metrics . . . . . . . . . . . . . . . 58
4.2.4 Default Building Description . . . . . . . . . . . . . . . . . . . . . . . 61
4.2.5 Facade Design Variables . . . . . . . . . . . . . . . . . . . . . . . . . . 62
4.3 Design of Experiments Results . . . . . . . . . . . . . . . . . . . . . . . . . . 64
4.4 Illuminance-Based Analysis . . . . . . . . . . . . . . . . . . . . . . . . . . . . 66
4.5 Glare Risk Evaluation . . . . . . . . . . . . . . . . . . . . . . . . . . . . . . . . 69
4.6 Influence of Climate . . . . . . . . . . . . . . . . . . . . . . . . . . . . . . . . 71
4.7 Interaction Effects . . . . . . . . . . . . . . . . . . . . . . . . . . . . . . . . . . 73
4.8 A DoE-Based Design Guide . . . . . . . . . . . . . . . . . . . . . . . . . . . . 74
4.9 Chapter Summary . . . . . . . . . . . . . . . . . . . . . . . . . . . . . . . . . . 76
5 A Fuzzy Rule-Based Expert System 77
5.1 Introduction . . . . . . . . . . . . . . . . . . . . . . . . . . . . . . . . . . . . . 77
5.2 Fuzzy Logic . . . . . . . . . . . . . . . . . . . . . . . . . . . . . . . . . . . . . 77
5.2.1 Introduction to Fuzzy Logic . . . . . . . . . . . . . . . . . . . . . . . 77
5.2.2 Fuzzy Rule-Based Systems . . . . . . . . . . . . . . . . . . . . . . . . 79
12

5.3 Expert System Structure . . . . . . . . . . . . . . . . . . . . . . . . . . . . . . 80
5.4 General Description of Assumptions and Logic . . . . . . . . . . . . . . . . . 81
5.5 Required Expert System Inputs . . . . . . . . . . . . . . . . . . . . . . . . . . 82
5.5.1 User Inputs . . . . . . . . . . . . . . . . . . . . . . . . . . . . . . . . . 83
5.5.2 Calculated Data . . . . . . . . . . . . . . . . . . . . . . . . . . . . . . 86
5.5.3 Customized Daylighting Database . . . . . . . . . . . . . . . . . . . . 91
5.6 Expert System Fuzzy Variables . . . . . . . . . . . . . . . . . . . . . . . . . . 92
5.6.1 Fuzzy Variables Calculated Before Rule Firing . . . . . . . . . . . . . 92
5.6.2 Fuzzy Variables Calculated During Rule Firing . . . . . . . . . . . . . 96
5.7 Fuzzy Rules . . . . . . . . . . . . . . . . . . . . . . . . . . . . . . . . . . . . . 97
5.7.1 Rule Base 1: Determine Sensor Priorities . . . . . . . . . . . . . . . . 97
5.7.2 Rule Base 2: Determine Desired Change . . . . . . . . . . . . . . . . 97
5.7.3 Rule Base 3: Evaluate Actions . . . . . . . . . . . . . . . . . . . . . . 99
5.7.4 Rule Base 4: Rank All Actions . . . . . . . . . . . . . . . . . . . . . . 100
5.8 An Example Scenario . . . . . . . . . . . . . . . . . . . . . . . . . . . . . . . . 100
5.9 Chapter Summary . . . . . . . . . . . . . . . . . . . . . . . . . . . . . . . . . . 102
6 System Implementation 105
6.1 Introduction . . . . . . . . . . . . . . . . . . . . . . . . . . . . . . . . . . . . . 105
6.2 System Structure . . . . . . . . . . . . . . . . . . . . . . . . . . . . . . . . . . 105
6.3 User Interface . . . . . . . . . . . . . . . . . . . . . . . . . . . . . . . . . . . . 107
6.4 Building Data Model . . . . . . . . . . . . . . . . . . . . . . . . . . . . . . . . 111
6.4.1 Logic for Automated Model Population . . . . . . . . . . . . . . . . . 112
6.4.2 Logic for Automated Design Changes . . . . . . . . . . . . . . . . . . 113
6.5 Chapter Summary . . . . . . . . . . . . . . . . . . . . . . . . . . . . . . . . . . 115
III Results 117
7 Expert System Performance Evaluation 119
7.1 Introduction . . . . . . . . . . . . . . . . . . . . . . . . . . . . . . . . . . . . . 119
7.2 Comparison Study: Expert System vs. a Genetic Algorithm . . . . . . . . . . 120
13

7.2.1 A Micro-Genetic Algorithm . . . . . . . . . . . . . . . . . . . . . . . . 121
7.2.1.1 Single Objective Micro-GA . . . . . . . . . . . . . . . . . . . 121
7.2.1.2 Multi-Objective Micro-GA . . . . . . . . . . . . . . . . . . . 122
7.2.2 Micro-GA System Description . . . . . . . . . . . . . . . . . . . . . . 123
7.2.2.1 Micro-GA System Process . . . . . . . . . . . . . . . . . . . 123
7.2.2.2 Micro-GA Model Generation . . . . . . . . . . . . . . . . . . 124
7.2.3 Case Study Procedures . . . . . . . . . . . . . . . . . . . . . . . . . . . 126
7.2.4 Single Performance Goal Case Studies . . . . . . . . . . . . . . . . . . 128
7.2.4.1 Case Study #1: Maximum Only Illuminance Goal . . . . . . 130
7.2.4.2 Case Study #2: Minimum Only Illuminance Goal . . . . . . 133
7.2.4.3 Case Study #3: Glare Only Illuminance Goal . . . . . . . . . 134
7.2.4.4 Case Study #4: Wide Range Illuminance Goal . . . . . . . . 135
7.2.4.5 Case Study #5: Narrow Range Illuminance Goal . . . . . . 136
7.2.5 Complex Case Studies: Multiple Performance Goals . . . . . . . . . . 138
7.2.5.1 Case Study #6: Two Illuminance Goals – Sensors Parallel toFacades . . . . . . . . . . . . . . . . . . . . . . . . . . . . . . 139
7.2.5.2 Case Study #7: Two Illuminance Goals – Sensors Perpen-dicular to Facades . . . . . . . . . . . . . . . . . . . . . . . . 141
7.2.5.3 Case Study #8: Conflicting Illuminance Goals . . . . . . . . 143
7.2.5.4 Case Study #9: Conflicting Illuminance and Glare Goals . . 147
7.2.6 Comments on the Stopping Criteria . . . . . . . . . . . . . . . . . . . 151
7.2.7 Discussion . . . . . . . . . . . . . . . . . . . . . . . . . . . . . . . . . . 152
7.3 Effect of Initial Facade Constraints . . . . . . . . . . . . . . . . . . . . . . . . 155
7.3.1 Specificity of Initial Facade Design . . . . . . . . . . . . . . . . . . . . 156
7.3.2 Window Uniformity Scheme . . . . . . . . . . . . . . . . . . . . . . . 159
7.4 Expert System Strengths and Limitations . . . . . . . . . . . . . . . . . . . . 161
7.5 Chapter Summary . . . . . . . . . . . . . . . . . . . . . . . . . . . . . . . . . . 163
8 An Expert System Design Process 165
8.1 Introduction . . . . . . . . . . . . . . . . . . . . . . . . . . . . . . . . . . . . . 165
8.2 Guided Design Process . . . . . . . . . . . . . . . . . . . . . . . . . . . . . . . 166
14

8.3 User Study: An Expert System Design Tool . . . . . . . . . . . . . . . . . . . 167
8.3.1 Profile of Participants . . . . . . . . . . . . . . . . . . . . . . . . . . . 168
8.3.2 Study Procedure . . . . . . . . . . . . . . . . . . . . . . . . . . . . . . 169
8.3.3 Design Problem . . . . . . . . . . . . . . . . . . . . . . . . . . . . . . . 171
8.3.4 Procedure for Modeling Designs . . . . . . . . . . . . . . . . . . . . . 174
8.4 Quantitative Results . . . . . . . . . . . . . . . . . . . . . . . . . . . . . . . . 176
8.4.1 Performance of First Session Designs . . . . . . . . . . . . . . . . . . 176
8.4.2 Performance of Designs Generated by the Expert System . . . . . . . 177
8.4.3 Performance of Final Designs . . . . . . . . . . . . . . . . . . . . . . . 179
8.4.4 Comparison of Results Between Participants With and Without Pre-vious Daylighting Experience . . . . . . . . . . . . . . . . . . . . . . . 179
8.5 Qualitative Results of Using the Expert System . . . . . . . . . . . . . . . . . 183
8.5.1 Influence of the Expert System on Design . . . . . . . . . . . . . . . . 183
8.5.2 Educational Value . . . . . . . . . . . . . . . . . . . . . . . . . . . . . 185
8.5.3 The Expert System as a Design Tool . . . . . . . . . . . . . . . . . . . 186
8.5.4 Additional Participant Feedback . . . . . . . . . . . . . . . . . . . . . 187
8.5.5 Observed Behavior . . . . . . . . . . . . . . . . . . . . . . . . . . . . . 188
8.6 Strengths and Limitations of the Expert System for Design . . . . . . . . . . 189
8.7 Chapter Summary . . . . . . . . . . . . . . . . . . . . . . . . . . . . . . . . . . 192
IV Conclusions 193
9 Conclusions and Future Work 195
9.1 Summary of Results . . . . . . . . . . . . . . . . . . . . . . . . . . . . . . . . . 195
9.1.1 Daylighting Expert System Methodology . . . . . . . . . . . . . . . . 195
9.1.2 Assessment of the Expert System as a Decision-Making Algorithm . 196
9.1.3 The Expert System as a Design Tool . . . . . . . . . . . . . . . . . . . 197
9.2 Future Work . . . . . . . . . . . . . . . . . . . . . . . . . . . . . . . . . . . . . 197
9.3 Broader Outlooks . . . . . . . . . . . . . . . . . . . . . . . . . . . . . . . . . . 199
9.4 Final Remarks . . . . . . . . . . . . . . . . . . . . . . . . . . . . . . . . . . . . 200
15

V Appendices 203
A Expert System Modeling Guidelines 205
B User Study Materials 207
Bibliography 223
16

List of Figures
1.1 The Lightsolve program interface, which displays renderings of views (rightside) and performance data in the form of temporal maps (left side). . . . . 30
2.1 Example interfaces from the Leso-DIAL tool (Paule and Scartezzini, 1997) . 40
4.1 Factor levels for the first 64 experiments in the 2-level fractional factorialResolution V orthogonal array . . . . . . . . . . . . . . . . . . . . . . . . . . . 59
4.2 Factor levels for the final 64 experiments in the 2-level fractional factorialResolution V orthogonal array . . . . . . . . . . . . . . . . . . . . . . . . . . . 60
4.3 (a) Axonometric view and (b) plan view of model with five illuminance sen-sor plane zones and glare sensors array shown. . . . . . . . . . . . . . . . . 62
4.4 Schematic representation of the two levels tested for each design factor inthe DoE study . . . . . . . . . . . . . . . . . . . . . . . . . . . . . . . . . . . . 63
4.5 Schematic diagram of main effects databases . . . . . . . . . . . . . . . . . . 65
4.6 Illuminance main effects averaged over all zones, all times, and all seasons . 67
4.7 Illuminance main effects averaged for AM times, averaged over all zonesand all seasons . . . . . . . . . . . . . . . . . . . . . . . . . . . . . . . . . . . . 67
4.8 Illuminance main effects for north zone and AM times, averaged over allseasons . . . . . . . . . . . . . . . . . . . . . . . . . . . . . . . . . . . . . . . . 67
4.9 Glare main effects for south views averaged over all zones, times, and seasons 70
4.10 Glare main effects for south views and summer season, averaged over allzones and times . . . . . . . . . . . . . . . . . . . . . . . . . . . . . . . . . . . 70
4.11 Glare main effects for south views in the west zone, summer evenings only 70
4.12 Main effects for glare for north views from the north and core zones duringa school year schedule in Boston, MA . . . . . . . . . . . . . . . . . . . . . . 72
4.13 Main effects for glare for north views from the north and core zones duringa school year schedule in Siem Reap, Cambodia . . . . . . . . . . . . . . . . 72
17

4.14 Examples of major two-way interaction effects for illuminance, averagedover all zones, seasons, and times of day, in Boston, MA . . . . . . . . . . . . 73
4.15 Example design guide for Boston, MA with cardinal facade orientations con-sidered (specific for views looking towards north from the north and corezones as well as illuminance in the north and core zones for a school schedule) 75
5.1 Example crisp (a) and fuzzy (b) sets for short, average, and tall men. . . . . 78
5.2 Schematic diagram of the expert system structure and information flow . . 80
5.3 Example 3d model which meets expert system modeling criteria. Horizontalilluminance sensor planes are colored red, vertical glare sensor planes arecolored yellow. . . . . . . . . . . . . . . . . . . . . . . . . . . . . . . . . . . . . 83
5.4 Interface for illuminance goal range inputs. . . . . . . . . . . . . . . . . . . . 84
5.5 Interface for glare threshold goal inputs. . . . . . . . . . . . . . . . . . . . . . 84
5.6 Interface for goal priority inputs. . . . . . . . . . . . . . . . . . . . . . . . . . 85
5.7 Interface for selecting times and seasons of interest. . . . . . . . . . . . . . . 85
5.8 Example triangulated 3d model. The goal-based performance is calculatedindividually for each triangle on a sensor plane. . . . . . . . . . . . . . . . . 86
5.9 Goal-based performance metrics for illuminance and glare. . . . . . . . . . . 87
5.10 Schematic structure for simple building data model generated by the expertsystem. . . . . . . . . . . . . . . . . . . . . . . . . . . . . . . . . . . . . . . . . 88
5.11 Example floorplan with one sensor plane and perimeter zone weights indi-cated. . . . . . . . . . . . . . . . . . . . . . . . . . . . . . . . . . . . . . . . . . 90
5.12 Example floorplan with three windows and one sensor. Windows (a) and(c) have large sensor weights and window (b) has a small sensor weight. . 91
5.13 Fuzzy set for user-input priorities. . . . . . . . . . . . . . . . . . . . . . . . . 93
5.14 Fuzzy set for sensor performance. . . . . . . . . . . . . . . . . . . . . . . . . 93
5.15 Fuzzy set for illuminance performance. . . . . . . . . . . . . . . . . . . . . . 94
5.16 Fuzzy set for distance from goal. . . . . . . . . . . . . . . . . . . . . . . . . . 95
5.17 Fuzzy set for glare performance. . . . . . . . . . . . . . . . . . . . . . . . . . 95
5.18 Fuzzy set for action result. . . . . . . . . . . . . . . . . . . . . . . . . . . . . . 95
5.19 Schematic diagram of the fuzzy rule sets and their inputs and outputs. . . . 98
5.20 Example model with two illuminance sensors. . . . . . . . . . . . . . . . . . 101
5.21 Example model with window groups highlighted. . . . . . . . . . . . . . . . 102
18

6.1 Schematic diagram of expert system structure and process . . . . . . . . . . 106
6.2 Expert system user interface after first run. The user may choose to makethe first suggested design change (“Make the South windows larger”) or toskip to a different suggested design change. . . . . . . . . . . . . . . . . . . . 108
6.3 Expert system user interface after one design step (south windows wereincreased). The user must choose one of the three different magnitudes ofchange indicated in the interactive graph. . . . . . . . . . . . . . . . . . . . . 109
6.4 Expert system user interface after four design steps. The progression of de-signs explored during the process is shown in the interactive graph. . . . . . 110
7.1 First five steps used to generate models in the micro-GA system . . . . . . . 125
7.2 The performance and designs of the first four design steps of an exampleproblem. The performance goal considered is a wide illuminance range (de-scribed further as case study #4). The “perfect user” selections are 1c, 2a, 3c,and 4a. . . . . . . . . . . . . . . . . . . . . . . . . . . . . . . . . . . . . . . . . 127
7.3 Box massing model for case studies 1 through 5 with (a) illuminance sensorin the core zone or (b) glare sensors in the core zone with a view towardssouth . . . . . . . . . . . . . . . . . . . . . . . . . . . . . . . . . . . . . . . . . 128
7.4 Comparison of best performing final designs from the expert system andmicro-GA for case studies #1 through #5 . . . . . . . . . . . . . . . . . . . . . 129
7.5 Case study #1 - Maximum illuminance goal: Performance for the micro-GAand expert system . . . . . . . . . . . . . . . . . . . . . . . . . . . . . . . . . 131
7.6 Case Study #1 - Maximum only illuminance goal: Best performing designsfrom three micro-GA runs . . . . . . . . . . . . . . . . . . . . . . . . . . . . . 131
7.7 Case study #2 - Minimum illuminance goal: Performance for the micro-GAand expert system . . . . . . . . . . . . . . . . . . . . . . . . . . . . . . . . . 132
7.8 Case study #2 - Minimum only illuminance goal: Best performing designsfrom three micro-GA runs . . . . . . . . . . . . . . . . . . . . . . . . . . . . . 133
7.9 Case study #3 - Glare threshold goal: Performance for the micro-GA andexpert system . . . . . . . . . . . . . . . . . . . . . . . . . . . . . . . . . . . . 134
7.10 Case study #4 - Wide illuminance range goal: Performance for the micro-GAand expert system . . . . . . . . . . . . . . . . . . . . . . . . . . . . . . . . . . 135
7.11 Case study #5 - Narrow illuminance goal: Performance for the micro-GAand expert system . . . . . . . . . . . . . . . . . . . . . . . . . . . . . . . . . 137
7.12 Comparison of best performing final designs from the expert system andmicro-GA for case studies #6 and #7 . . . . . . . . . . . . . . . . . . . . . . . 138
19

7.13 Case study #6 - L-shaped massing model with two illuminance sensors in-dicated . . . . . . . . . . . . . . . . . . . . . . . . . . . . . . . . . . . . . . . . 139
7.14 Case study #6 - Two illuminance goals with sensors located parallel to fa-cades: Performance for the micro-GA and expert system . . . . . . . . . . . 140
7.15 Case study #7 - Trapezoidal massing model with two illuminance sensorsindicated . . . . . . . . . . . . . . . . . . . . . . . . . . . . . . . . . . . . . . . 141
7.16 Case study #7 - Two illuminance goals with sensors located perpendicularto facades: Performance for the micro-GA and expert system . . . . . . . . 142
7.17 Case study #8 - U-shaped model for conflicting illuminance goals study: (a)Original massing model with sensors shown, (b) Generic starting model forthe expert system . . . . . . . . . . . . . . . . . . . . . . . . . . . . . . . . . . 143
7.18 Case study #8 - Conflicting illuminance goals: Performance for the expertsystem for three different goal priority scenarios . . . . . . . . . . . . . . . . 144
7.19 Case study #8 - Conflicting illuminance goals: Performance for the expertsystem for three different goal priority scenarios over the entire solutionspace (upper) and over the approximated Pareto front (lower). . . . . . . . 145
7.20 Case study #8 - Conflicting illuminance goals: Comparison of designs forbest average, north, and south sensor performance for the expert systemand the micro-GA . . . . . . . . . . . . . . . . . . . . . . . . . . . . . . . . . 146
7.21 Case study #9 - Z-shaped model for conflicting illuminance and glare goalsstudy: (a) Original massing model with sensors shown, (b) Generic startingmodel for the expert system . . . . . . . . . . . . . . . . . . . . . . . . . . . . 147
7.22 Case study #9 - Conflicting illuminance and glare goals: Performance forthe expert system for three different goal priority scenarios . . . . . . . . . . 148
7.23 Case study #9 - Conflicting illuminance and glare goals: Performance forthe expert system for three different goal priority scenarios over the entiresolution space (upper) and over the approximated Pareto front (lower). . . 149
7.24 Case study #9 - Conflicting illuminance and glare goals: Comparison of de-signs for best average, glare, and illuminance sensor performance for theexpert system and the micro-GA . . . . . . . . . . . . . . . . . . . . . . . . . 150
7.25 Micro-GA runs for 10 and 25 generations for case study #7 . . . . . . . . . . 153
7.26 Performance over ten design steps for facades of varying specificity and fortwo levels of goal ranges . . . . . . . . . . . . . . . . . . . . . . . . . . . . . . 157
7.27 Starter and best designs for four levels of facade specificity and two levelsof goal ranges . . . . . . . . . . . . . . . . . . . . . . . . . . . . . . . . . . . . 158
7.28 Expert system performance for L-shaped and trapezoidal models (from casestudies #6 and #7) with two window uniformity schemes . . . . . . . . . . . 160
20

7.29 Comparison of best performing final designs from the expert system for L-shaped and trapezoidal models (from case studies #6 and #7) with two dif-ferent uniformity schemes . . . . . . . . . . . . . . . . . . . . . . . . . . . . . 161
8.1 Breakdown of participants’ previous experience working with daylighting . 168
8.2 Library massing model with (a) example facades and (b) three sensors shown.172
8.3 Temporal maps for the three sensor planes in the example library model. . . 173
8.4 Example template sheet with facade design drawn. . . . . . . . . . . . . . . 175
8.5 SketchUp model based on the filled-in template sheet in Figure 8.4. . . . . . 175
8.6 Performances for session 1 designs. . . . . . . . . . . . . . . . . . . . . . . . . 178
8.7 Performances for designs from sessions 1 and 2. . . . . . . . . . . . . . . . . 180
8.8 Performances for designs from all three sessions. . . . . . . . . . . . . . . . . 181
8.9 Mean performance for Groups A, B, and C for each design session. . . . . . 182
8.10 Participant responses to questions asking them to compare their final designto their initial design. . . . . . . . . . . . . . . . . . . . . . . . . . . . . . . . . 184
8.11 Participant responses to question asking them if their final design was in-fluenced by the process of using the expert system. . . . . . . . . . . . . . . 184
8.12 Participant responses to questions about the educational value of the expertsystem. . . . . . . . . . . . . . . . . . . . . . . . . . . . . . . . . . . . . . . . . 186
8.13 Participant responses to questions asking them if they would consider usingthe expert system again. . . . . . . . . . . . . . . . . . . . . . . . . . . . . . . 187
B.1 Design Session 1 brief, page 1. . . . . . . . . . . . . . . . . . . . . . . . . . . . 208
B.2 Design Session 1 brief, page 2. . . . . . . . . . . . . . . . . . . . . . . . . . . . 209
B.3 Design Session 1 brief, page 3. . . . . . . . . . . . . . . . . . . . . . . . . . . . 210
B.4 Design Session 1 brief, page 4. . . . . . . . . . . . . . . . . . . . . . . . . . . . 211
B.5 Design Session 2 brief. . . . . . . . . . . . . . . . . . . . . . . . . . . . . . . . 212
B.6 Design Session 3 brief. . . . . . . . . . . . . . . . . . . . . . . . . . . . . . . . 213
B.7 Design template, sheet 1. . . . . . . . . . . . . . . . . . . . . . . . . . . . . . . 214
B.8 Design template, sheet 2. . . . . . . . . . . . . . . . . . . . . . . . . . . . . . . 215
B.9 Introductory questionnaire, page 1. . . . . . . . . . . . . . . . . . . . . . . . . 216
B.10 Introductory questionnaire, page 2. . . . . . . . . . . . . . . . . . . . . . . . . 217
B.11 Introdcutory questionnaire, page 3. . . . . . . . . . . . . . . . . . . . . . . . . 218
21

B.12 Final questionnaire, page 1. . . . . . . . . . . . . . . . . . . . . . . . . . . . . 219
B.13 Final questionnaire, page 2. . . . . . . . . . . . . . . . . . . . . . . . . . . . . 220
B.14 Final questionnaire, page 3. . . . . . . . . . . . . . . . . . . . . . . . . . . . . 221
22

Part I
Introduction
23

24

Chapter 1
Introduction
1.1 Motivation for Daylighting
Throughout history, daylighting has been integral to architectural design, and its impor-tance to occupant health and comfort has long been understood in the contexts of both ar-chitectural theory and practice. Daylighting strategies may enhance occupant experienceof a space by providing light, views, temporal and seasonal cues, and interesting visualeffects such as sun patches and shadow patterns. Successful strategies will also maintainoccupant comfort by shading direct sunlight, controlling glare, and limiting solar ther-mal gains. Illumination or shadow can be used to complement architectural features andaugment the total visual effect of the space. Due to its influence on architecture throughhistory, daylight is often considered a critical design element.
The earliest architects understood the importance of daylighting in their designs. Vitru-vius, writing in the first century BC, believed that one should determine the function ofinterior rooms based on their orientations towards the sun, considering both daily andannual cycles (1960). Renaissance architects such as Alberti reiterated that idea, whileadding that when orienting spaces, one must also consider the specific climate and siteof the building (Alberti, 1988). During the 20th century, Le Corbusier and Frank LloydWright both expressed their belief that light was essential to one’s perception of a workof architecture. Wright referred to a building as “a creation of interior space in light” andbelieved that all spaces within a house should receive daylight at some point during theday (1955). Le Corbusier agreed, calling architecture “the masterly, correct and magnifi-cent play of masses brought together in light” (1986). At a design level, there has alwaysbeen reason for architects to consider daylight when creating spaces.
In recent decades, architects have been presented with additional motivation to use day-lighting in buildings. Our concerns about global energy use have inspired many to inves-tigate the potentials for daylighting and solar heat to replace or offset electric lighting andmechanical heating. In 2006, electric lighting accounted for an average of 17% of total site
25

energy and 25% of total primary energy use in commercial buildings in the United States(U.S.DOE, 2009). The energy used for electric lighting also accounted for 25% of total car-bon emissions from commercial buildings. The primary energy used for lighting is roughlyequal to primary energy expenditures for space heating and space cooling combined.
As buildings consume more primary energy than any other sector in the U.S. (39% of theU.S. total) and as the U.S. consumes more primary energy than any other country (22%of the world total) (U.S.DOE, 2009), it is clear that there is the potential for significantenergy savings by reducing the use of artificial lighting. Studies have shown that with thesuccessful use of daylighting and lighting controls, one can provide adequate amounts oflight in commercial buildings while reducing the use of electric lights by up to 80% (Bodartand Herde, 2002; Li and Lam, 2003; Ihm et al., 2009). Additionally, careful use of shadingstrategies may decrease a building’s heating and cooling loads (Kolokotroni et al., 2004),thus further reducing the total primary energy consumption of the building.
An additional benefit of daylighting is the potential for improved productivity, learning,and overall health. Although this area of research is still new, early studies and surveyshave shown positive effects of daylighting on office employees, such as improved moods,increased productivity and performance, and a decrease in common health problems suchas headaches and eye strain (Rashid and Zimring, 2008). Studies have also found bene-fits for office management, such as decreased rates of employee absenteeism, decreasedturnover rates, and increased profits due to improved productivity (Edwards and Tor-cellini, 2002).
Similar health and performance benefits have been found for students in daylit schools. Al-though direct causality is not yet known, several studies have shown that students in daylitschools may outperform students in non-daylit schools on standardized tests (Heschonget al., 2002; Plympton et al., 2000). Students in daylit schools may also experience healthbenefits, such as strengthened immune systems, increased growth, better eyesight, andfewer dental cavities (Edwards and Torcellini, 2002). Research in this area is still ongoing.
There are numerous additional possible benefits of daylight over artificial light for humanhealth and healing. Recent studies indicate that the distinct spectral properties of daylightmay control our circadian system, thus influencing our mood and behavior (Webb, 2006).A relationship has been found between the prevailing amount of bright sunlight and thebrain’s production of serotonin, which has been linked to disorders such as depressionand seasonal affective disorder (Lambert et al., 2002). Case studies indicate that patientswith these types of illnesses may recover faster in sunny hospital rooms than in dim rooms(Beauchemin and Hays, 1996). Sunlight also aids in our production of vitamin D, whichsome researchers believe may help protect humans from breast, ovarian, prostate, andcolon cancers (Freedman et al., 2002; Lefkowitz and Garland, 1994). Finally, it has beenshown that patients recovering from spinal surgeries may experience less stress and re-quire less pain medication if their hospital rooms receive sunlight (Walch et al., 2005).
One final benefit of daylighting is that humans often express a preference for natural lightover artificial light. One study of office workers found that 95% of those polled preferred
26

daylight to artificial light, and that those employees seated closer to windows were moresatisfied than those seated further from windows (Markus, 1967). Other studies have sug-gested links between daylighting and job satisfaction or even overall psychological well-being (Boyce et al., 2003b; Edwards and Torcellini, 2002).
In summary, designers have long considered daylight an important element for architec-tural expression. In recent decades, we have come to understand that daylighting mayprovide additional benefits, such as reduced energy consumption and improved occupanthealth and well-being. Detailed summaries of such benefits may be found in (Boyce et al.,2003a; Edwards and Torcellini, 2002; Rashid and Zimring, 2008). Nevertheless, simply pro-viding daylight in a building will not always result in positive results. Daylighting is onlyas good as its delivery system, so careful design is necessary to ensure that enough light isavailable and that glare, shadows, and reflections are controlled (Boyce et al., 2003b). Un-fortunately, it is often a challenge to create a successfully daylit building. The next sectiondescribes current digital tools used by architects and engineers to aid in designing withdaylight.
1.2 Digital Tools for Daylighting Design
Successful daylighting schemes are difficult to achieve as architects must balance multipleissues such as energy, visual comfort, aesthetics, space planning, engineering, client need,and cost. To help designers deal with such complex situations, many different tools havebeen developed for daylighting design and analysis. Traditional tools include scale mod-els, heuristics (rules of thumb or knowledge obtained from previous experience), designguides, and case studies. Such tools remain popular today, especially heuristics, which aremore commonly used in the early design stage than other methods (Galasiu and Reinhart,2008).
Over the past few decades, daylighting simulation software programs have been intro-duced as an additional tool for daylighting design. Recent surveys have indicated thatsimulation tools have gained acceptance for both professional (Reinhart and Fitz, 2006) andeducational use (Sarawgi, 2006). These computer tools are varied in scope, accuracy, com-plexity, and intended user. Input may be numerical, geometrical, or both. Outputs rangefrom purely quantitative (for example, calculated lighting metrics in tables or graphs) topurely qualitative (for example, photorealistic rendered images).
Tools developed for use in the early design stages tend to be simpler to learn and fasterto use than tools developed for later design stages or for analysis. Such tools typicallyrestrict the geometrical form of the simulated building or offer a finite number of geometrychoices, and results are often limited to simple quantitative metrics (Hitchcock and Carroll,2003; Lehar and Glicksman, 2007; Hviid et al., 2008). These tools seem primarily aimed forthose who would like to estimate interior illuminance levels, solar heat gains, and energyconsumption due to artificial lights, and they may be more useful for educational purposes
27

than as design tools. Ecotect, a more advanced simulation tool which is still accessibleto most designers, allows the user to explore more varied geometries, but displays onlyquantitative information about the space (Marsh, 2008b). Other tools allow the user toexplore more complex geometries and aesthetic effects such as direct sunlight and shadows(Bund and Do, 2005; Google, 2008), providing qualitative information without quantitativedata.
For later design phases, designers may use rendering software packages to produce pho-torealistic images from complex CAD-based models. Tools such as Autodesk’s 3ds Max,Autodesk’s VIZ, and AGi32 are examples of commercially available software which arepopular among design students (Sarawgi, 2006). For professional use, the most commonlyused tools are based on Radiance, which has long been the preferred lighting simulationengine for lighting experts despite its complexity (Roy, 2000; Reinhart and Fitz, 2006; Gala-siu and Reinhart, 2008). All these tools require a significant time commitment for both theinitial modeling and the simulation process itself. Commonly used simulation outputsfrom these tools include interior illuminance, daylight factor (DF), photorealistic images,interior luminance, electric lighting use, glare indices, and daylight autonomy (DA) (Rein-hart and Fitz, 2006).
1.3 The Need for a New Method
While it is clear that simulation-based tools have gained acceptance among design practi-tioners, such tools have yet to achieve total integration into the design process. Experienceand heuristics continue to be used more often than simulation tools during the conceptualand schematic design phases, the periods during which most major design decisions re-lating to daylighting are made (Galasiu and Reinhart, 2008). These early design phases,however, should be the ones where feedback is received and where the overall designproposal is first assessed (even roughly) against performance goals.
One reason why simulation tends to be used more often for analysis of a near-completeddesign than for early design exploration may be that most simulation tools generally do notprovide designers with the means to easily gauge their specific early design options againstperformance objectives, or with some kind of feedback about how they might change theirdesigns to meet these goals. Due to this issue, designers may not want to take the risk ofwasting time exploring options that do not improve performance. Furthermore, creatingmodels and running simulations can become prohibitively time-consuming if generatinga comprehensive understanding of the performance requires too extensive an analysis.This combination of unguided search with time-intensive simulations may make the wholeprocess of integrating daylighting considerations early on too tedious and inefficient fordesigners.
One method for improving efficiency in design exploration is the use of an intelligentguided design approach. As will be discussed in Chapter 2, optimization algorithms are
28

a common solution to this problem, largely because they have the capabilities necessaryto find or generate high performing design solutions. However, these methods generallydo not allow for user interaction. As it is highly unlikely for a designer to simply accept adesign generated by an optimization algorithm, a better approach would be a more inter-active search method, which would accept input from a designer and grant the designer alarger degree of control.
An example of such an approach is a knowledge-based or expert system. An expert systemis one in which human expert knowledge about a specific domain is encoded in an algo-rithm or computer system (Luger, 2004). Such systems will be discussed in further detailin Chapter 2. In the daylighting domain, such a system would function as a virtual light-ing consultant, guiding the designer towards design modifications which improve overalldaylighting performance. Knowledge-based systems have already been successfully im-plemented for artificial lighting scenarios (Jung et al., 2003). For daylighting, a few simpleexpert systems exist. The Leso-DIAL tool provides users with a “qualitative diagnosis” us-ing an expert system based on fuzzy logic rules (Paule and Scartezzini, 1997). The EcotectShading Design Wizard is capable of automatically generating an overhang shape whichwill shade a window for a user-specified period of time (Marsh, 2008a). These systemsrepresent first steps in expert systems for daylighting in design, but they do not allow fora comprehensive understanding of daylighting or an investigation of user-defined perfor-mance goals.
This thesis will describe a user-interactive expert system approach which enables such acomprehensive analysis of daylighting. This system will be described in detail in Chapters4 and 5. The proposed approach includes two climate-based performance metrics, one forilluminance and one for daylighting-specific glare, in order for the designer to have an un-derstanding of both the amount of light and the visual comfort in the space. This methoduses a designer’s own initial design and performance goals, enabling a search process thatis highly specific to the user’s design problem. The method will evaluate the performanceof the design and create a series of suggestions for design changes which are likely to re-sult in improved performance. Decisions are made using an expert system which is com-prised of a pre-calculated database of daylighting-specific information connected to a setof fuzzy daylighting expert rules. Validation of the decision making logic will be describedin Chapter 7. Any design decision that the designer chooses to allow will be automaticallygenerated in the original model and the new performance will be calculated. The designeris able to interact with the system during an iterative search process that is intended to beagreeable to the designer and likely to improve the performance of the design.
User interaction in the proposed system is enabled through the use of a highly interac-tive interface which allows multiple types of input and provides the user with a variety ofmodes for visualizing both the design and the performance data. This interface has beenintegrated into the the Lightsolve program, which was developed to meet these criteriaand to fully integrate the expert system method within the overall user process (Andersenet al., 2008). The interface and its integration into Lightsolve will be discussed in Chapter 6.
29

Figure 1.1: The Lightsolve program interface, which displays renderings of views (rightside) and performance data in the form of temporal maps (left side).
Lightsolve uses Google SketchUp (Google, 2008), an intuitive modeling software which al-lows for easy geometrical modeling and material specifications for the initial design input.Goals and constraints are input in a simple and clear interface within SketchUp. An effi-cient simulation and rendering engine is used within Lightsolve to calculate performanceand to create renderings of views. The Lightsolve interface (Figure 1.1) provides a clear vi-sualization of renderings and performance data, and the expert system interface has beenembedded within the general Lightsolve program to allow users to interact with the expertsystem and visualize the aesthetics and performance of their design as it changes duringdesign search process. An analysis of the user interactivity of the expert system processwill be given in Chapter 8.
30

1.4 Thesis Outline
This thesis will describe the development and validation of the expert system for use as aperformance-driven search method and as a design tool. Part I consists of an introduction(the present chapter) and literature review. Chapter 2 will present current methods forgenerating designs based on performance criteria, including optimization methods andexpert systems. Chapter 3 will describe the architectural design process and the knownmethods for introducing performance-based information into the design process.
Part II will focus on the methods used for the development of the expert system. Chap-ter 4 will describe the population of a database of daylighting-specific information usingthe Design of Experiments method. Chapter 5 will include an introduction to fuzzy logicand describe the fuzzy logic expert system variables and rules used to make design deci-sions within the system. Chapter 6 will focus on implementation of the system within theLightsolve framework and will include descriptions of the expert system interface and themethods used to automate design changes.
Part III will describe the expert system as a search method and as a design tool. Chap-ter 7 will evaluate the performance and behavior of the expert system decision-makinglogic based on a series of case studies. The main set of case studies will compare of theperformance of designs generated by the expert system to those generated by a geneticalgorithm, a popular optimization method. Chapter 8 will discuss the expert system as auser-interactive design tool based on the results of an experiment which studied the use ofthe expert system during the architectural design process.
Chapter 9 will conclude the thesis with a summary of findings and a description of futurework.
31

32

Chapter 2
Digital Methods forPerformance-Based Building Design
2.1 Introduction
This chapter presents a literature review and state of the art in two different types of digitalmethods used to improve the performance of architectural design or building systems: op-timization methods and expert systems. Although this thesis focuses on the developmentof an expert system, it is useful to provide a review of optimization methods used withinthe building design context, as these algorithms have historically been more widely imple-mented than expert systems. This chapter also summarizes examples of previous expertsystems used for building design.
In addition to this chapter, further information about expert systems and genetic algo-rithms may be found in Chapters 5 and 7, respectively.
2.2 Optimization Methods
A traditional optimization scheme, such as one used in mathematical programming, is analgorithm which finds the minima or the maxima of a given function, typically knownas the objective function. The objective function may depend on any number of param-eters, and these parameters may either be unconstrained (any value is legal) or may besubject to one or more constraints. The set of constraints will define the search space ofthe problem, and any combination of parameter values within the defined search space isconsidered a feasible solution. The optimal solution will be the feasible set of parameterswhich minimizes (or maximizes) the objective function. A problem will not necessarilyhave one unique solution. It may have no optimal solutions at all, a finite number of solu-tions, or an infinite number of solutions, which can be defined as a more specific subset of
33

the search space. A more detailed explanation of optimization techniques can be found in(Papalambros and Wilde, 2000).
The two major categories of optimization algorithms are gradient-based and heuristicsearch algorithms. A gradient-based optimization algorithm is a “true” optimization al-gorithm in that its use guarantees that the final solution found will be an optimal one.Examples of gradient-based optimization algorithms are Newton’s method, steepest de-scent, conjugate gradient, and sequential quadratic programming (SQP). These algorithmsuse information about the gradient of the objective function, either directly or as an ap-proximation. These algorithms are most appropriate when one has a closed-form equationor set of equations at hand.
For problems which involve simulation engines or other scenarios in which such a set ofclosed-form equations would be difficult or impossible to obtain, heuristic search algo-rithms are a more appropriate choice. Heuristic search algorithms include genetic algo-rithms, simulated annealing, particle swarm, ant colonies, tabu search, and many otheralgorithms which do not require gradient information. In general, such algorithms arebased on concepts found in nature (for example, genetic algorithms are based on principlesof evolution). These algorithms are considered heuristic because they are not necessarilybased on strict mathematical theory and as such, they are not guaranteed to converge totrue optimal solutions. However, most of these algorithms do find solutions which arevery close to optimal, and they have the additional benefits of being able to effectivelysearch difficult solutions spaces that gradient-based algorithms may struggle with, suchas large, multi-modal, and/or non-continuous spaces.
Within each of these two major groups of optimization methods, there are many differentindividual algorithms, and one generally chooses an algorithm based on the type of func-tion one wishes to optimize and based on certain characteristics of the search space. Forexample, one may select an algorithm based on whether the problem is linear or non-linear,whether the search space is continuous or discrete (for example, integers only), and so on.For problems involving architectural design or building systems, heuristic algorithms area popular choice as they are more suitable to the large, multi-modal solution spaces andsimulation engines that frequently appear in such problems.
2.2.1 Optimization Methods for Building Performance and Design
In architectural design, optimization may be used in many domains and may include awide variety of parameters. Performance domains include energy consumption, lighting(both daylighting and artificial lighting), heat transfer, natural ventilation, mechanical sys-tems, materials, structure, and safety (such as evacuation). One might also consider vari-ous architectural design domains, such as the floor plan layout or the overall aesthetic ofthe building. The number of possible parameters can range from a single parameter (for ex.the angle of a blind) to a comprehensive set of parameters which defines an entire build-ing, including geometry, materials, occupant schedule, mechanical systems, lighting and
34

equipment specifications, and general program. Constraints for architectural problemsmay be based on codes and regulations, programmatic necessities, design intent, clientrequests, budget, and so on. Constraints may also be based on external characteristicssuch as weather patterns, site conditions, loads and other structural concerns, or availableconstruction technologies.
While many optimization algorithms exist, they can generally all be classified as eithergradient-based or heuristic. Gradient-based methods are often used for problems whichhave a small, well-defined, convex solution space. In building performance domains, thesemethods can typically only be used for smaller problems. For example, Park et al. opti-mized visual comfort by varying a single variable (louver angle) in a double facade systemusing sequential quadratic programming (SQP), a gradient-based method (2003). How-ever, most problems related to building performance are more complex, requiring the useof many variables and encompassing large, non-linear, and non-convex design spaces.Due to this complexity, many researchers have chosen to use heuristic search methods forbuilding performance optimization.
The genetic algorithm (GA) (Goldberg, 1989) is one of the more commonly used heuristicsearch techniques and has been applied to many types of architectural problems. A GAis one in which a set of initial feasible solutions is chosen or generated at random. Eachis evaluated and those solutions that do not result in good performance are discarded.The remaining feasible solutions are used as “seeds” for a new generation. Since this newgeneration is based on the best performing feasible solutions in the previous solutions,we assume that some members of the new generation will perform better. Once evalu-ated, the poor performers are again discarded while the good performers are used as seedvalues. The cycle is continued until a suitable solution or set of solutions is found. GAshave been successfully used in numerous simulation domains, including single domainssuch as thermal (Coley and Schukat, 2002; Chen et al., 2008) and daylighting (Wright andMourshed, 2009; Chutarat, 2001) as well as in multiple domains at once, for example CFDand thermal (Malkawi et al., 2005), natural and mechanical ventilation (Lee, 2007), lightingand thermal (Caldas and Norford, 2002; Caldas, 2008), energy consumption and initial cost(Znouda et al., 2007; Adamski, 2007), and life cycle cost and environmental impact (Wanget al., 2005; Geyer, 2008). GAs have also been used in design domains such as floorplanlayout (Michalek et al., 2002; Brintrup et al., 2006).
In addition to genetic algorithms, numerous other heuristic algorithms have been appliedtowards architectural optimization problems. Examples include shape annealing (Sheaet al., 2005), pattern search (Wetter and Polak, 2005), co-evolution (Xiyu et al., 2005), andalgorithms based on neural networks (Yeh, 2006), cellular automata (Herr and Kvan, 2007),and cellular analogies (Fischer et al., 2005). The GenOpt system allows users to choosefrom a wide variety of different optimization algorithms which can be coupled with manydifferent simulation programs, such as EnergyPlus, TRNSYS, SPARK, IDA-ICE, DOE-2,or any user-written program (Wetter, 2001). Additionally, hybrid methods may be usedto achieve the advantages of both heuristic and gradient-based methods. For example,Monks et al. used a heuristic method (simulated annealing or SA) as an initial global
35

search and then followed up with a gradient-based method (steepest descent) as a localsearch for an acoustical design optimization problem (2000). Michalek et al. used a similarapproach for architectural layout optimization, combining two methods, one based ongenetic algorithms and another which is a hybrid SA/SQP algorithm (2002). Many otherpossibilities may exist in addition to these strategies which have yet to be studied.
Despite the numerous previous studies in performance-based optimization, most have notconsidered a goal-driven or user-interactive approach. For example, only a few studies(Caldas and Norford, 2002; Monks et al., 2000) propose tools which allow the user to inputspecific performance goals for their designs. Likewise, few studies have addressed theissue of user-interactivity or design intent. One of the major roles for an architect in thedesign and construction process is the architectural design itself, and it is unlikely that anarchitect would choose a computer-generated design as a final solution, regardless of itsoptimized performance. Interaction with the tool may increase the chances of the architectactually considering the design as a potential option. Some studies have attempted toaddress this issue by producing multiple final designs from which the user can choose(Coley and Schukat, 2002; Yeh, 2006; Znouda et al., 2007). While this method will providethe designer with several options instead of one, it does not allow him to truly interactwith the system, and there is always the possibility that the designer will not accept anyof the options presented to him. Others have implemented interfaces which allow theuser to interact with the tool while it is still processing (Monks et al., 2000; Michalek et al.,2002; Malkawi et al., 2005). These systems may allow the user to shift the progress of theoptimization process by modifying goals or constraints (for example, Monks et al., 2000),or they may simply allow the user to visualize new designs as they are generated (forexample, Malkawi et al., 2005). Such systems represent first steps towards the integrationof optimization tools into the design process.
An additional constraint when using optimization algorithms for design purposes is thatthey can often be considered “black box” algorithms. A “black box” is a system in whichthe user deals only with the inputs and outputs, while the inner algorithm or logic is“opaque” and hidden from the user. Designers who use such a system to optimize aperformance-based design problem will receive an output (an optimized design or set ofdesigns) with little to no explanation of the underlying principles used to generate suchoutputs.
2.2.2 Examples of Lighting Performance Optimization
Several studies have demonstrated the potential for optimization algorithms to facili-tate facade design exploration for daylighting and related performance areas. Severalresearchers have considered photovoltaic-integrated facade systems and examined thetrade-off between facade area used for daylighting and that used for electricity genera-tion (Vartiainen et al., 2000; Charron and Athienitis, 2006). Park et al. considered doublefacade systems with integrated blinds and found optimal blind angles for several visual
36

comfort metrics (2004). Shea et al. optimized the effect of the glazing type of roof pan-els on lighting performance and cost (2005). Several studies have optimized window sizeand placement while considering both daylighting and energy (Caldas and Norford, 2002;Wright and Mourshed, 2009). In the GENE_ARCH system, lighting and energy are opti-mized in a generative system which can also incorporate an architect’s specific aestheticdesign intent (Caldas, 2008). Other studies have considered daylighting performance froma visual comfort standpoint. For example, Chutarat’s system allowed multiple objectiveswithin the daylighting domain such as illuminance, glare, and direct sunlight (2001), andTorres and Sakamoto’s study found facade solutions resulting in high illuminance andminimal glare due to daylighting (2007).
In addition to the studies described above, there also exist related problems in computergraphics which may prove relevant to daylighting optimization. The inverse lighting prob-lem describes a situation in which a user wishes to illuminate an image or a 3d modelwith certain effects. For example, in this type of problem, the user would use his mouseto highlight the area in the scene which he would like to illuminate (Schoeneman et al.,1993). The problem is considered “inverse” because the user is actually providing theend result, while an algorithm must determine the surrounding conditions which wouldcreate such a result in the image or model. Because the user inputs a desired illumina-tion into the program, this type of problem can be considered both user-interactive andgoal-driven. Like performance-based optimization, there are multiple ways of solving theinverse lighting problem. Optimization schemes which have been used to attempt to solvethis type of problem include least squares (Schoeneman et al., 1993; Do and Gross, 2004),Newton’s method for simple unconstrained minimization (Kawai et al., 1993), and geneticalgorithms (Tena and Goldberg, 1997). Similar inverse problems which have been stud-ied include a user-guided design of a reflector (Patow et al., 2007) and an automatic lightsystem for rendering 3d models (Shacked and Lischinski, 2001).
2.3 Expert Systems
One potential limitation to most optimization schemes is that the algorithms generallyhave no relationship to the problem or system that they are trying to optimize. In con-trast, a knowledge-based or expert system is a system in which human expert knowledgeabout the design domain is encoded in an algorithm or computer system (Luger, 2004).While optimization methods originated in the field of mathematics, expert systems areusually considered to be an application of artificial intelligence. Due to these origins, atraditional optimization algorithm is often generic enough to be potentially applicable to abroad range of problems, while an expert system is created for one specific problem. Suchsystems are typically designed to emulate a human expert and are used in situations wheresuch an expert is needed but not available due to cost, risk, or scarcity.
Expert systems and optimization methods may both potentially be used to improve or op-timize a building’s design. However, expert systems differ from optimization in several
37

key ways. The most obvious is that expert systems assume that there is a user involvedand cannot perform without a certain amount of user input. In general, the user mustprovide the answers to a series of questions about the problem before the expert systemcan operate. This user involvement is different from an optimization algorithm, which of-ten performs most efficiently when there is no user input during the optimization process.Another difference between the two methods is that the creation of an expert system re-quires a great deal of domain-specific knowledge. This means that a human expert mustbe employed to provide knowledge to populate the expert system and help with decisionmaking.
Knowledge-based or expert systems typically consist of a knowledge base, which containsdomain-specific knowledge, and an inference engine, which applies the knowledge to auser-specified problem in order to determine a solution. Rule-based systems are a commontype of knowledge-based system. In these systems, the knowledge base is represented inthe form of if-then rules. Due to this structure, one final benefit of expert systems is anexplanation capability. Because any action or decision made by an expert system is basedon logical reasoning using a set of domain-specific rules, an expert system can explain whyit chose to act in a certain way based on an initial set of user input. This feature potentiallymakes expert systems valuable as educational tools. Optimization algorithms, particu-larly heuristic search methods which function mostly as “black boxes,” do not possess thisquality.
2.3.1 Expert Systems for Building Performance and Design
There is great potential for expert systems to be used for building design decisions, par-ticularly as the nature of architectural practice is one in which expert consultants are fre-quently used in specialized domains. Expert systems have been developed for a variety ofproblems related to architectural and building systems design. These systems have beenparticularly popular in the areas of mechanical and structural systems engineering.
Early developments of expert systems in the domain of energy and thermal comfort wereprimarily rule-based and focused on the design of building envelopes and mechanicalsystems. For example, IDABES was proposed as an expert system used to develop schemesfor mechanical systems based on preliminary design goals and constraints (Doheny andMonaghan, 1987). BEADS was developed to make decisions about the building envelopebased on a building’s climate zone and ASHRAE standards (Fazio et al., 1989). Shavivet al. developed a system that designs the floorplan and building envelope for passivesolar buildings (1996). The SETIS project, a collaboration between a research laboratoryand a civil engineering firm, was designed to support decision making about the buildingenvelope and HVAC system design based on the building’s climate and specific designgoals (Robin et al., 1993). The EKSPRO system was aimed to be a complete system whichselected layouts, materials, and mechanical equipment to minimize energy costs due toheating and lighting (Pau and Nielsen, 1990).
38

In addition to areas of design, rule-based expert systems in the building energy and ther-mal comfort domain have also been developed for diagnostics and system controls. Sev-eral researchers have developed systems to diagnose moisture, dampness, or condensa-tion problems (Matsumoto and Toyoda, 1994; Allwood et al., 1988; Sachdeva, 1985). Duand Jin’s system detects and diagnoses faults in VAV systems (2007). Doukas et al. pro-posed an integrated energy management system which considers occupant preferencesand sensor inputs in addition to a building energy knowledge database (2007).
Expert systems have been used frequently in the domain of structural engineering. A com-mon problem in this domain is that of structural frame design, and several types of expertsystems have been developed for various framing problems. Example of these problemsinclude preliminary design of tall buildings (Sabouni and Al-Mourad, 1997; Maher, 1987),large spans (Golabchi, 2008), lattice dome design (Lin and Albermani, 2001), and liquid-retaining structural design (Chau and Albermani, 2005). In addition to structural framedesign, expert systems have been used for the design of individual structural members,such as cold-formed steel column cross-sectional shapes (Liu et al., 2004). They have alsobeen proposed as a method to help structural engineers develop structural solutions basedon early architectural designs (Mora et al., 2006).
Expert systems have been created for more general building design, and developmentof such tools seems to have peaked in the late 1980s to mid 1990s. Architectural codecompliance checking was a popular early expert system type which was developed bymany researchers (Oey and Passchier, 1988; Rosenman and Gero, 1985; Dym et al., 1988;Mitusch, 1989; Chun and Lai, 1997). Generative design systems were also popular duringthis time, and they were based on a variety of different rules sets. Such systems have beenproposed based on residential design heuristics (Garijo and de Garrido, 1988), ChristopherAlexander’s “pattern language” rules for design generation (Gullichsen and Chang, 1985),and general building typology (Lutton, 1995). A more recent study by Mashood et al. hascombined an expert system with a genetic algorithm to optimize the layout planning ofmulti-story buildings (Mashood et al., 2007).
2.3.2 Examples of Expert Systems for Lighting
In the lighting domain, a small number of expert systems have been developed. LightPen, a system used for artificial lighting design and luminaire selection, allows the user toindicate where he or she would like light to fall in a space and automatically selects oneor more options for lighting schemes which may achieve the desired effect (Jung et al.,2003). iPlot is a similar system used to aid theatrical lighting designers select the numberand type of luminaires necessary to realize their lighting concept goals (Perelson, 2005).RetroLite is a system designed to aid designers with lighting retrofit problems for energyconservation (Guo et al., 1993).
Expert systems for daylighting also exist, although these systems have remained limitedin scope and in capabilities. Shaviv et al.’s system considered shading as a performance
39

Figure 2.1: Example interfaces from the Leso-DIAL tool (Paule and Scartezzini, 1997)
area in their passive solar expert system (1996). The EKSPRO system considered the day-light factor when determining energy due to electric lighting (Pau and Nielsen, 1990). TheNewFacades approach considers energy and visual comfort based on a prescription en-ergy code for hot climates to suggest a range of facade solutions to the designer (Ochoaand Capeluto, 2009).
The Leso-DIAL and DIAL-Europe tools represent the previous work which is the mostrelevant to the expert system approach described in this thesis. The Leso-DIAL tool usesdaylighting performance data with a fuzzy logic rule set to determine if the lighting ina space is satisfactory and to suggest changes to the basic design if it is not (Paule andScartezzini, 1997). DIAL-Europe, an expansion of Leso-DIAL, includes artificial lightingand overheating modules in addition to daylighting intelligence (de Groot et al., 2003). TheDIAL tools thus offer a first attempt to provide design “diagnostics” based on daylightingperformance data. However, these tools only consider performance based on the diffuseportion of daylight (skylight), and they impose specific geometry restrictions in terms ofmodel geometries. They do not allow the designer to view renderings of their design andthey offer only a limited set of possible design diagnoses.
2.4 Self-Guided Search
While this chapter has focused on formal search and decision-making algorithms, it isworth noting that many designers may use their own self-guided search processes asthey work towards improving performance in the early design stages. A common wayof searching is by using parametric studies, which allow designers to understand howperformance may change when they vary one or more design parameters. Because theyare generally completely self-guided, parametric studies may be used with virtually anytype of simulation or analysis tool. While they may not enable designers to find optimal
40

solutions, these types of studies provide a simple and easy way to search the solution spaceand find better performing designs.
Because parametric studies are popular, some tools have begun to incorporate featureswhich allow designers to more easily compare the performances of different designswithin the tools themselves. The Decision Desktop is a visualization tool which is con-nected to two different simulation and evaluation programs and allows for side-by sidecomparison of the energy use and code compliance of three different designs (Reichardand Papamichael, 2005). The MIT Design Advisor allows users to compare up to four dif-ferent scenarios at once based on energy, thermal comfort, cost, and daylighting availabil-ity metrics (Urban and Glicksman, 2007). The Daylighting Dashboard has been proposedto allow a user to compare different designs as well as variants of the same space (blindsopen or closed, passive vs active occupants) for a variety of metrics which consider day-light availability, comfort, and energy use (Reinhart and Wienold, 2011). While these toolsdo not provide optimization or expert system support, they are valuable in that they do of-fer a more structured way for designers to consider how different design parameters mayinfluence performance.
2.5 Chapter Summary
This chapter has presented introductions to optimization algorithms and expert systemsand has reviewed the states of the art of both of these algorithms for use in domains relatedto building design. Chapter 3 will present an overview of the architectural design processand the ways in which computer algorithms such as optimization or expert systems maybe integrated into it.
41

42

Chapter 3
The Architectural Design Process
3.1 Introduction
This chapter presents a review of the traditional architectural design process, a descrip-tion of the ways in which daylighting considerations are included during design, and abrief outline of trends in digital tools which have affected the design process. The chapterconcludes with a summary of key features that support the user-interactive performance-driven daylighting design process described in this thesis.
3.2 The Traditional Design Process
This section includes a review of the traditional architectural design process, including anexamination of the nature of design in comparison to that of optimization methods, anoutline of the various stages of the design process, and a list of design heuristics used bydesigners.
3.2.1 The Nature of Design
The architectural design process is inherently similar to a traditional optimization or searchprocess. During the design process, the architect will come up with an initial design orset of designs, based on a set of constraints and goals specific to the current architecturalproblem. He (or she) will go through an iterative process during which he will refine anddevelop his design scheme. He will stop when he reaches a final solution which satisfiesboth the constraints of the project and its goals.
Unlike optimization problems, however, the architectural design process cannot be de-fined by a formal algorithm. Because it is a process which may vary by individual designer,one can only determine certain typical characteristics of the process based on observation
43

of the process itself and interviews with designers. There have been several large stud-ies in which the architectural design process has been researched (Lawson, 2006; Schon,1983; Akin, 1986). These studies have shown that the design process and the optimiza-tion process differ in several critical ways. For example, Akin has categorized the varioussearch methods used during the design process that are are analogous to optimization al-gorithms (1986). However, Akin notes that the architect, unlike an optimization algorithm,can never fully explore the entire search space. There are an infinite number of solutions toany design problem, so the architect must always limit his or her search to a small subsetof possibilities. While an optimization algorithm will find the best possible solution to theobjective function, an architect will attempt to find a solution which merely satisfies allconstraints. This mechanism is called “satisficing.” A satisficing solution is essentially afeasible solution which is arrived at based on the initial designs the architect chose to de-velop. Had the architect chosen different early designs, the satisficing solution could thusalso be different. Hence, we note that the criteria for the solution of a design problem tendto be less strict than those of an optimization problem, since the final result may be one ofan infinite number of possible satisficing solutions.
In addition to the differences in solution criteria, Akin also points out that the entire prob-lem of design is different from that of optimization. Traditional optimization problemsare considered “well-defined” because all areas of the problem, including the objectivefunction, parameters, and constraints, are defined by mathematical functions. The goalof the problem is clear: one wishes to minimize or maximize the given objective functionwithin the given search space. In contrast, an architectural design problem is considered“ill-defined” because the problem is almost always too complex to fully define. It is nearimpossible to define a clear set of specific objective functions because in nearly any givendesign problem, an architect may wish to meet dozens or even hundreds of goals, manyof which may be subjective (for example, achieving a certain aesthetic or ambiance).
The design process may also be influenced by many additional external factors whichwould never affect a purely mathematical optimization problem. For example, the clientmay desire a certain aesthetic at first and later shift towards a different aesthetic, or anarchitect may experience a moment of inspiration mid-way through the design processand completely redefine his or her design scheme. These types of factors will be reflectedin both the architect’s design process and in the final design. Due to the ill-defined andchanging nature of the design problem, it is not possible to fully predict the design pro-cess.
3.2.2 Stages of the Design Process
Despite the unpredictable nature of design, the process can still be categorized into a se-ries of general stages, each of which may inform our understanding of the total process.Lawson (2006) has developed a model which divides the process loosely into the follow-ing steps, where each category refers to one or more skills typically used during the designprocess:
44

1. Formulating - This stage includes the architect’s initial analysis and understandingof the problem, including identification of key elements and framing the problemwithin a larger context.
2. Representing - This stage refers to ways architects choose to communicate their de-sign ideas (whether as drawings, models, or in digital form). It also refers to thedesigner’s skill identifying ideas from representations and in understanding a singledesign even if it is represented in multiple ways.
3. Moving - This stage involves what many consider “creativity” or “inspiration” indesign. During the “Moving” stage, an architect generates design ideas based on theinitial problem statement and other relevant information. “Moving” also refers tothe development or interpretation of previous designs to inform the current one.
4. Bringing Problems and Solutions Together - In this stage, the architect attempts tocreate design solutions which will solve the problem at hand. This skill set is notnecessarily a design stage but is actually present throughout the design process. Thedesigner is capable of handling problems which occur throughout the design pro-cess, not just at the beginning, and he can also choose to solve separate problems onparallel lines of thought before converging to a single solution.
5. Evaluating - This stage refers to both objective and subjective analysis of a potentialsolution based on the design problem. The architect must not only be able to suc-cessfully evaluate his own work, but he also must know when these evaluations willbe most fruitful.
6. Reflecting - This final stage refers to the point during the design process in which anarchitect must determine if his design is actually progressing in the correct way. Ifnecessary, he may have to reformulate his design strategy. This stage also includesa designer’s use of his own guiding principles as well as reference material from thearchitectural community to judge a design.
Although an architect may generally follow these stages in the order presented, it is impor-tant to keep in mind that during the design process the architect may in fact continuallymove back and forth between multiple stages until the point is reached when he or she issatisfied with the final design scheme.
3.2.3 Design Heuristics
We can further our understanding of the design process by examining a set of heuristicsused by architects for decision making during the design process. Akin has compiled acomprehensive list of these heuristics based on observation of architects at work (1986).Some heuristics of note include:
45

• Decision hierarchy - Early decisions may act as constraints in later decisions.
• Most constrained first - Work on the most restrictive or constrained issues first.
• Solution testing - Partial solutions developed based on early constraints must betested later in the design process if constraints have been modified or added.
• Search in uncertainty - If a piece of information is unavailable, make an assumptionand consider it correct until the information become available.
• Sequential processing - If alternative solutions are available, choose one and exploreit fully before exploring the others.
• Constraint hierarchy - If some constraints are inclusive of others, satisfy the generalconstraints before moving on to the more specific ones.
• Least promising first - Work on solutions with potential problems first so that if prob-lems do arise, they will arise quickly and one can immediately discard the solutionand move on.
These heuristics can be considered the design process analogy to the various algorithmswhich can be chosen for a given optimization problem. Although not as well-defined as aformal algorithm, they can provide a logic describing decision-making during the designprocess.
3.3 Incorporating Daylighting Goals Into the Design Process
Incorporating daylighting performance as a goal into the design process is a difficult taskdue to the complexity of the design process itself and due to the dynamic nature of day-light. It becomes even more difficult when one considers the many other design constraintsthat an architect must meet, such as client preferences or initial costs. In Sunlighting as For-mgiver for Architecture, Lam lists five design objectives which apply to general design andwhich can be extended to daylighting design (1986):
1. Providing user comfort and delight in the interior environment.
2. Satisfying programmatic needs of users.
3. Minimizing the building energy cost.
4. Optimizing the public architectural image.
5. Minimizing the initial building construction cost.
46

Lam warns that a balance among all five objectives must be maintained in order to achievea healthy design, and that those who focus only on daylighting for minimizing buildingenergy costs and who ignore visual comfort and satisfying programmatic needs will endup with an ugly “Solar Shoebox” (Lam, 1986). Although different projects will have dif-ferent daylighting goals, Lam writes that designs should be judged by the quality, not thequantity, of light. He indicates two major concepts that the designer should consider whenassessing a daylighting scheme: visibility and perception. Visibility refers to whether theamount of light is appropriate to the occupant’s tasks. Perception refers to the amount of“visual noise”, including brightness or contrast, glare, and gloom, and its effect (positiveor negative) on the occupant’s comfort
Because it is difficult to achieve a successful daylighting scheme, there are numerous typesof methods and tools used by architects during the design process to help them create bet-ter daylighting schemes. Two major sources are the IESNA’s Lighting Handbook (Rea, 2000)and the CIBSE’s Code for Lighting (CIBSE, 2002), which provide useful information suchas lists of recommended illuminance ranges for a variety of building and space functions.Heuristics have evolved based on experience or simplified calculations of known metrics.These rules of thumb act as quick checks for a designer in early design stages and may helpguide a design towards those forms most likely to produce good daylighting (Reinhart,2005; Reinhart and LoVerso, 2010). For the designer who requires more comprehensiveinformation, design guides may be used. These guides generally include heuristics alongwith numerous other tips, including explanation of metrics used to assess performance,design strategies to achieve certain effects, situations to avoid, and case study buildings(O’Connor et al., 1997; Canada, 2002; CHPS, 2006).
In recent years, simulation tools have also gained popularity, as these tools have the ca-pability to predict year-round performance and to create photo-realistic images (Sarawgi,2006; Reinhart and Fitz, 2006). However, designers continue to use heuristics and experi-ence more often during the early design stages than simulation tools (Galasiu and Rein-hart, 2008). It is during these stages that major decisions regarding the building site, roomlayouts, envelope, and shading should be made, and an architect who would like to in-corporate daylighting into his design should make decisions about these elements withlighting already in mind (O’Connor et al., 1997).
This thesis proposes a new method of incorporating daylighting into the early designstages: a generative and performance-based design process guided by an expert system.The next section describes the concepts of performance-based and generative design.
3.4 Generative and Performance-Based Design
Over the past few decades, digital tools have become increasingly widespread in architec-tural practice and education. Some claim that digital tools are changing the design processitself (Chastain et al., 2002) and that the use of these tools over traditional design methods
47

(drawings and physical models) will allow architects to design in ways which were notpreviously considered (Marx, 2000).
3.4.1 Generative Design
An extreme example of digital design is that of generative design, where forms are pro-duced based on an algorithm or logic, sometimes with almost no input from the designer.Several studies have attempted to mitigate between the human design process and thegenerative design process by enabling user interaction in a generative design tool (Chase,2002; Herr and Kvan, 2007; Talbott, 2007). Chase evaluated a number of generative toolsfor use by designers and concluded that generative design tools can be used as teachingaids for beginning designers under the following conditions (2005):
• The tool teaches specific design concepts and allows the designer to quickly explorea number of design possibilities.
• The tool uses clear and fast representation.
• The tool uses a classical mode of process, i.e. one that can be understood by a de-signer and not one that is not easily explained.
• The tool can be used in conjunction with manual methods.
3.4.2 Performance-Based Design
Another idea for the digital design process is that of performance-based design. In thisparadigm, “performance” is considered “the desirability of the confluence between formand function in a given context” (Kalay, 1999). Design itself is considered an iterativeprocess of exploration, in which forms are continuously updated and evaluated for per-formance. An example approach, the Fenestration IDeA (Intelligent Design Assistant), isdescribed as a hypothetical expert system scenario in which a variety of performance ar-eas are considered based on different fenestration choices (Kalay, 1999). In such a system,the IDeA would give advice to the designer on design changes to make if the design wereunder-performing. In this paradigm, the computer does not generate the design but acts asa “partner” with the designer during the design process. The performance-based designparadigm has been proposed as a way of structuring the design process to enable design-ers to make better informed decisions in the early design stages (Petersen and Svendsen,2010). The expert system described in this thesis also takes such an approach, by provid-ing designers with useful feedback about potential design decisions that aim to improveperformance and by allowing the designers themselves to choose which design changes totry.
Since the early 1990’s, expert systems have been used as a possible support system fora performance-based approach, and many researchers have sought to understand how
48

they could be best incorporated into the design process. Carrara and Novembri proposedKAAD (Knowledge-based Assistant for Architectural Design) as a method that featuresseveral key characteristics which allow for successful integration into the design process:an extremely flexible definition of the current design, which can easily be modified at var-ious stages during the process; an ability for the system to integrate user-provided inputswith known or assumed information; and the capability to modify values of various de-sign attributes (1990). Other researchers have focused on effective communication of in-formation, particularly information about the design of the building, as a critical featureof any knowledge-based approach (Rutherford and Maver, 1994; Pohl and Myers, 1994).In his proposal for a general framework for integrated building performance feedbackin early design stages, Augenbroe states that an Intelligent Integrated Building DesignSystem (IIBDS) should have two major components: a set of design support tools undercomplete control of the designer and a system in which the tools are embedded (1992).Petersen and Svendsen propose that an expert system should present to the designer a setof possible design changes and their predicted effect on performance as a means of sup-porting early design decisions and reducing the number of design iterations necessary tofind a good design (2010).
3.5 Features of the Proposed Expert System Design Process
The daylighting expert system proposed in this thesis has been developed to be compatiblewith the traditional architectural design process based on the principles of performance-based design. The system is intended for early stage design exploration and decision sup-port using daylighting performance criteria. Based our knowledge of the design processand conclusions from the previous work of researchers who have explored performance-based and generative approaches, the proposed system features the following characteris-tics:
1. Intuitive and robust implementation:
• The system has been implemented in Google SketchUp (Google, 2008), a popular 3dmodeling environment that many designers and consultants already use.
• The system features an intuitive, interactive interface which allows the designer toview his 3d model, renderings of the interior, and performance metrics all on thesame screen (described further in Chapter 6).
2. Ability for the designer to customize his design problem:
• The designer can start the process with an original 3d model of his or her own design(he is not forced to conform to highly specific geometry rules or accept a defaultmodel).
49

• The designer determines the number, type, and specific details of his or her daylight-ing goals.
• The designer selects the climate and applicable times of day and year for the systemto evaluate.
3. Clear communication of ideas:
• The system indicates the performance of the design using easy-to-read temporalmaps and graphs.
• The system proposes design changes using regular language (for example, “MakeSouth windows larger”).
• The designer can examine 3d views of his design from multiple angles at all timesduring the process.
4. Designer control of the process:
• The designer is allowed to accept or deny any proposed design change.
• The designer can stop the process at any time if he or she is satisfied with a finaldesign.
• The designer can stop the process at any time to manually change in his or her 3dmodel before continuing with the process.
5. Efficient, performance-driven exploration of the design space:
• The system automatically generates new designs and computes their performance,which allows the designer to explore the design space more efficiently than if he orshe had to make each model manually.
• The system uses an expert system to suggest design changes most likely to improveperformance, allowing the designer to search more effectively.
The expert system described in this thesis is not intended to replace traditional designmethods, but rather to supplement them by providing additional information to the de-signer during the design process. The system should help designers discover better per-forming solutions than they otherwise would during the early design stages. It may alsoinform designers about how different design elements affect the overall daylighting per-formance. Such information is valuable because even designers who do not accept the de-signs generated by the expert system may ultimately incorporate elements which improvedaylighting performance into revised designs of their own. Designers may also receive aneducational benefit by using the tool and gain intuition about working with daylighting.These phenomena will be demonstrated in the discussion of the user studies in Chapter 8.
50

3.6 Chapter Summary
This chapter reviewed the nature of architectural design and the various stages that archi-tects go through during the design process. This chapter also discussed the integrationof daylighting goals into the design process and described the performance-based designparadigm. The chapter concluded with a summary of critical features of the expert sys-tem described in this thesis and the ways in which these features help to integrate such asystem into the design process and support a performance-driven approach.
Chapter 4 will describe the first major component of the expert system, a daylighting-specific database which acts as a core source of daylighting knowledge in the expert systemalgorithm.
51

52

Part II
An Expert System for DaylightingDesign
53

54

Chapter 4
A Daylighting-Specific Database
4.1 Introduction
Many of the expert systems mentioned in Chapter 2 are traditional systems in the sensethat they are populated using knowledge from a human expert, and as a result, such sys-tems are restricted in terms of accuracy and complexity. To create an expert system capableof more sophisticated analyses, this thesis uses a daylighting-specific database, or “knowl-edge base,” which has been populated using data from a set of completed daylightingsimulations.
This database contains information about the relative effects of various facade conditionson the mean illuminance levels on a workplane and on the probability of glare for viewsin various directions within a space. Such effects are available for design conditions onfacades oriented towards each of the four cardinal directions, for five different zones (fourperimeter zones and one core zone), for three different periods of day (morning, mid-day, and afternoon), and for three different seasons of year (summer, autumn/spring, andwinter). For the glare metric, we consider views in each of the four cardinal directionsfrom locations within each of the five zones described.
By using calculated data rather than heuristics to populate the knowledge base, the expertsystem can consider highly specific goals and multiple sets of goals for the same design,which can differ based on the daily time period(s), season(s), or zone(s) of interest within aspace. This type of knowledge base also allows for more logical and accurate comparisonsof multiple design options than mere heuristics.
This chapter describes the methodology used to populate the daylighting-specific knowl-edge database. It includes examples of database results for Boston, Massachusetts (USA)and a brief comparison of database results from two different climates.
55

4.2 Knowledge Acquisition
The core of an expert system is the knowledge base, a database in which the main domain-related information is encoded. Traditionally, the knowledge acquisition process used topopulate a knowledge base involves two people (or groups of people): an expert in thedomain and a knowledge engineer. The human expert provides information to the knowl-edge engineer, who then encodes it as data in the knowledge base.
The most common way of storing such information is in a rule-base, a series of “if-then”statements or a decision tree that roughly reproduces the logic that the human expertwould use to solve a problem. However, in daylighting, such knowledge is likely to belimited to only general scenarios. For example, a human expert could predict that increas-ing the area of a window or raising the window-head-height will increase the illuminancein a space due to daylight. However, it would be difficult or impossible for a human ex-pert to predict whether a change to the aspect-ratio or a horizontal translation of a windowwould increase glare from a certain viewpoint and at a specific time of day and year. Ahuman expert would also have difficulty quantifying the effects of specific design changes,and such difficulty would be compounded when issues of climate are considered.
For this thesis, a daylighting-specific database was created using a set of completed simu-lation results. Populating the knowledge base using this approach enables a quantitativecomparison of various design changes to the facade and their effects on daylighting per-formance inside the space. The completed simulations used to create the knowledge basedata were selected using the Design of Experiments (DoE) approach (Montgomery, 2004).
DoE is a formal method of experimentation which has previously been used in a varietyof building technology applications. For example, DoE has been used to create simplemodels based on building simulation results in domains such as thermal comfort (Hwanget al., 2009), heating demand prediction (Jaffal et al., 2009), and thermal behavior of adobewalls (Parra-Saldivar and Batty, 2006). The DoE method has also been proposed to supporta design methodology for designing low energy buildings (Chlela et al., 2009) and as ameans of determining the most significant design parameters to consider when designing adouble-skin facade (Seok et al., 2009). The DoE method used for populating the knowledgebase developed for this thesis is described in the section 4.2.1.
Three steps were necessary to populate the knowledge base using simulation data. First, aset of models was created based on the facade variables of interest using the DoE method-ology. Both the illuminance and glare metrics were then calculated by the simulation en-gine. Finally, the main effects of each design variable on the chosen daylighting perfor-mance metrics were calculated.
In this study, simulations were performed for two locations: Boston, Massachusetts, USA(temperate climate, latitude 42º North) and Siem Reap, Cambodia (tropical climate, lati-tude 13º North). However, one can obtain data for any other location by simulating thesame models with the appropriate weather data and by re-calculating the main effects. In
56

this way, one could build an extended knowledge base which contains information rele-vant to multiple locations and climates.
4.2.1 Design of Experiments Methodology
Design of Experiments (DoE) is a formal method of experimentation which allows the ex-perimenter to obtain information about how independent factors (variables) affect a givenoutput, relative to each other (Montgomery, 2004). In this thesis, a two-level DoE approachwas used. Two-level designs involve the study of two different values, also called levels, ofeach factor. Results of the DoE method include main effects, two-level interaction effects,and higher level interaction effects.
The knowledge base described in this thesis uses the main effect, which describes the effectof one level of a given variable, averaged across all values of all other variables, on theoutput. The main effect is calculated as the difference in average response between thetwo levels of a factor. For a two-level design, the absolute values of the main effects of twodifferent levels of the same factor will be the same; the main effect for one level will bepositive and the main effect of the other level will be negative. A positive effect indicatesthat the output is, on average, increased when the factor is at the specific level tested,while a negative effect indicates that the output is, on average, reduced by the tested valueor group of values. The magnitude of the absolute value indicates the magnitude of theeffect of that variable on the output. This allows for a useful comparison of all values of allvariables on the tested outputs.
Before calculating the main effects, one must first run a set of experiments. These experi-ment sets may be “full factorial,” which require all combinations of factors and levels, orthey may be “fractional factorial,” which include a smaller number of experiments basedon an orthogonal matrix of level combinations. For a given set of variables, there may ex-ist several different fractional factorial schemes, each with a different number of requiredexperiments. Those schemes with a higher number of experiments will have a higherresolution, which refers to the quality of information obtained by the set of experiments,specifically the amount of possible confounding with higher order interaction effects. Forexample, the main effects of a Resolution III or Resolution IV design may be confoundedwith two-level or three-level interaction effects, respectively, and all higher-order interac-tion effects will also be confounded. A Resolution V design results in non-confoundedmain effects and two-level interaction effects; however, to achieve Resolution V, more ex-periments must be run.
For the proposed expert system, the chosen study design was a two-level fractional fac-torial Resolution V design. To achieve this level of resolution, 128 unique models wererequired, each with a different set of design variables. The levels used for each factor inthis DoE scheme are indicated in Figures 4.1 and 4.2. For a given set of 128 models, onlyone facade orientation at a time was allowed to have windows (the other facades wereopaque). By using this design, the database could contain information about how a certain
57

design variable on a facade facing one orientation differed from the same design variableson a different orientation. Details about these design variables will be discussed further insection 4.2.5. To understand the effects of the design variables on each of the four cardinalorientations, a full set of 128 models was created for each orientation. Therefore, a total of512 simulations were run to populate the complete knowledge base.
The final knowledge base contains the main effect of each level of the ten design variablesconsidered on illuminance and glare. The effects were calculated for facades oriented to-wards each of the four cardinal directions, for five different zones (four perimeter zonesand one core zone), for three different periods of day (morning, mid-day, and afternoon),and for three different seasons of year (summer, autumn/spring, and winter).
4.2.2 Daylighting Simulation Engine
The engine used to simulate the daylighting performance of each DoE model, the Light-solve Viewer (LSV), is a hybrid global rendering method which combines forward raytracing with radiosity and shadow volumes rendering (Cutler et al., 2008). This engine isthe native engine of the Lightsolve program and was chosen because it allows for rapidcalculation of the full-year, climate-based daylighting metrics described in section 4.2.3.
To make the whole-year simulation more efficient, the LSV engine divides the year into 56periods and calculates the illuminance and glare during each time period under four dif-ferent sky types ranging from overcast to clear using the method described in (Kleindienstet al., 2008). The climate-based metrics are calculated using a weighted sum of the resultsof each of the four different sky types, weighted by the frequency of each sky condition fora given climate at a given time of year. This metric is a modification of the ASRC-CIE skymodel by Perez, which is generally considered to be one of the most accurate sky modelsavailable (Perez et al., 1992).
In addition to calculation, the LSV engine also creates color renderings of the interior ofspaces. Cutler et al. found that a rendered scene in LSV took approximately 3.3% of thetime that it took to complete an analogous “fast rendering” in Radiance (2008). Early val-idation results indicated that rendered images by LSV displayed a pixel difference of lessthan 10% from Radiance for a variety of scenes, camera positions, and daylighting condi-tions (Cutler et al., 2008).
4.2.3 Illuminance and Glare Daylighting Metrics
The two metrics considered in this thesis were illuminance and glare. These metrics werechosen to enable the system to consider daylighting performance in terms of both visualperformance and visual comfort.
58

Figure 4.1: Factor levels for the first 64 experiments in the 2-level fractional factorial Reso-lution V orthogonal array
59

Figure 4.2: Factor levels for the final 64 experiments in the 2-level fractional factorial Res-olution V orthogonal array
60

Illuminance Metric
The illuminance metric is a climate-based, whole-year metric calculated for each time pe-riod as a weighted average of illuminances from each sky type. An analysis comparingilluminance data calculated on point sensors in Radiance with area-based patch sensorsin LSV indicated similar values (5% median, 7% mean, and 28% maximum relative differ-ence) for a model similar to those considered in this thesis (Lee et al., 2009).
For each model in the DoE scheme, the LSV engine was used to calculate the meanclimate-based illuminance due to daylight on the five sensor plane zones over the wholeyear. For our system, results from these 56 periods were averaged into a total of ninegeneral time periods: morning, mid-day, and afternoon for winter, autumn/spring, andsummer. The autumn and spring seasons are combined because results from these twoseasons in preliminary trials revealed near symmetry. This combination also enabled thesize of the knowledge base to be reduced, resulting in greater efficiency of memory andcalculation time within the system.
Glare Metric
The glare metric used for this thesis was developed by Kleindienst and Andersen (2009)and is a model-based approximation of Daylighting Glare Probability (DGP). The DGPwas originally introduced by Wienold and Christoffersen (2006) and indicates the percentof occupants disturbed by a daylighting glare situation. Like the original DGP and itssimplified variant DGPs (Wienold, 2007, 2009), the model-based approximation method(DGPm) is based on the vertical illuminance on each glare sensor plane. While the DGPsmetric is solely dependent on vertical illuminance, the DGPm also assumes a user-defineddirection of view, and it is dependent on the position of each sensor relative to each glaresource as well as the luminance of each of these glare sources. Because this method isspecific to daylit situations, windows are currently considered the only glare sources. Themodel-based approximation method has been found to perform within a 10% error of theDGP over 90% of the time for rectangular models which do not include window frames(Kleindienst and Andersen, 2009). The default model used in this thesis (section 4.2.4)conforms to these modeling limitations.
4.2.4 Default Building Description
The models created for the DoE method all have the same overall massing form, a genericrectangular base model. Each model features a single exterior facade through which day-light can enter the space, based on a set of the 10 design variables described in section 4.2.5.The facade design (windows, shading devices, and glazing type) vary in each model. Thebase model is a single height space which is 9.1m by 9.1m in area and 3.1m in height (30ftx 30ft x 10ft). The four facades are oriented towards the four cardinal directions. Interiormaterials are entirely diffuse with reflectances of 80%, 50%, and 20% for the ceiling, walls,and floor, respectively.
61

(a) Axonometric View (b) Plan View
Figure 4.3: (a) Axonometric view and (b) plan view of model with five illuminance sensorplane zones and glare sensors array shown.
Illuminance is measured on a horizontal sensor plane located at a workplane height of0.9m (3ft) above the floor. The illuminance sensor plane is divided into five zones, one foreach perimeter zone and a core zone which is 3.1m by 3.1m (10ft x 10ft) in area (see Figure4.3). This zone separation was based on the well-known window-head-height heuristicthat has recently been validated with annual simulations (Reinhart, 2005): light from awindow may penetrate into the space a distance that is up to 1.5 times the window headheight for windows with shading devices and up to 2.5 times the window head height forunshaded windows. The zone boundaries occur at depths of 1, 2, and 3 times the windowhead height for windows located at the maximum height, which roughly correspond to adaylit zone, a drop-off zone, and a deep zone.
The DGPm is measured on vertical sensor planes arranged in arrays of glare sensor“boxes”, with each box face oriented towards one of the four cardinal directions, as il-lustrated in Figure 4.3. Each box face is 0.3m by 0.3m in area (1ft x 1ft). The center ofeach glare sensor face is located 1.4m (4.5ft) above the floor. The boxes are arrayed in agrid pattern within each zone with a distance of 0.8m (2.5ft) between then. Using the glareboxes, glare is calculated in four different directional views within each of the five zones(20 views in total).
For both metrics, the differentiation between the effect of individual design changes ondifferent zones in the room allows the knowledge base to be more customizable than ifinformation was only obtained in one zone (such as the whole space). Additionally, thefour-sided glare sensors enable one to differentiate between different views within thesame zone.
4.2.5 Facade Design Variables
Ten different design variables were examined in this study, selected because they are typ-ically early design decisions which may greatly affect daylighting performance. These
62

10% of Wall Area
Two Windows
1:1.5 Height-to-Width
1.1m from Ground
1.5m from Left Edge
Close Together
None
None
High (85%)
Specular
Design of Experiments Parameters TestedLevel 0 Level 1
1. Window Area
2. Number of Windows
3. Window Aspect Ratio
4. Vertical Location of Centroid
5. Horizontal Location of Centroid
6. Window Distribution
7. Horizontal Shading
8. Vertical Shading
9. Glass Transmissivity
10. Glass Type
Diffuse
Low (40%)
Two Fins
Overhang
Far Apart
1.5m from Right Edge
2.0m from Ground
1.5:1 Height-to-Width
Three Windows
20% of Wall Area
Figure 4.4: Schematic representation of the two levels tested for each design factor in theDoE study
63

variables include window geometry, location, and distribution on the facade, shading de-vice geometry, and glazing material properties. Two levels of each variable are illustratedin Figure 4.4.
Geometry-based window variables consisted of: total window area, window aspect ratio(narrow or wide), vertical location of windows on the facade, horizontal location on thefacade, number of windows, and window distribution on the facade. The “number ofwindows" variable does not affect the total area; for the larger number of windows, eachindividual window area is decreased so that the total area remains the same. The win-dow distribution variable refers to the distance between each window. Shading devicevariables consist of: existence of a horizontal overhang and existence of vertical fins. Thehorizontal overhangs are dimensioned to block direct sunlight on the equinox at noon inthe location considered (in this case, Boston, MA). The vertical fins have the same lengthas the overhangs.
The material variables considered are glazing transmissivity and type. The glazing trans-missivities correspond to clear glass and tinted glass, while the types correspond to spec-ular and diffuse (translucent) transmission.
The values examined for each design factor are also indicated in Figure 4.4: a high valueand a low value, as required for a two-level DoE study (see section 4.2.1).
4.3 Design of Experiments Results
The knowledge base holds the main effects results calculated after completing the set ofsimulations described in section 4.2. The knowledge base consists of two large databases,one for illuminance and one for glare, whose basic structure is represented in Figure 4.5.The illuminance database is a 45x80 matrix containing the main effects for eighty designconditions total (two different values of ten variables on each of four facades) on the meanilluminance specific to three seasons, three periods of day, and five zones. The glaredatabase is a 180x80 matrix containing the main effects of 80 design conditions on theapproximated model-based DGP during the three seasons and three periods of day. Foreach of the five zones, glare information is available for four different views (the cardinaldirections), obtained from an array of glare sensors distributed across each zone.
In order to use the information in the knowledge base in a design setting, it is necessaryto interpret the main effects data by considering both the magnitude and sign for eacheffect. The meaning of the sign of a main effect is intuitive and indicates whether a result(either illuminance or glare) will go up (positive) or down (negative). For example, highlypositive main effects in the illuminance database indicate that the corresponding designcondition will result in a higher mean illuminance on the relevant work plane relativeto other design conditions, while highly negative values indicate that the correspondingdesign condition will result in a lower mean illuminance on the work plane relative toother design conditions. In general, unless they have highly specific aesthetic lighting
64

MAIN EFFECTS DATA
South Facade
Win
ter
5 Zo
nes
(x 4
Vie
ws
for G
lare
Onl
y)
10 Design Parameters x 2 Levels Each
Fall/
Spr
ing
Sum
mer
East Facade North Facade West Facade
AM
Mid
PM
AM
Mid
PM
AM
Mid
PM
Figure 4.5: Schematic diagram of main effects databases
effects already in mind, most designers will be interested in facade designs that have apositive value for illuminance and a negative value for glare, as these elements will resultin higher illuminance with lower glare.
When comparing two main effects of the same sign, the design change with the highermagnitude is more likely to result in a higher mean illuminance if both are positive ora lower mean illuminance if both are negative. For example, if the main effects for both“large window area” and “high transmissivity glass” are positive but the value for “largewindow area” is higher, then one is likely to see a greater increase in illuminance in thespace if one increases the window area than if one increases the glass transmissivity. Like-wise, highly positive main effects in the glare database indicate that the correspondingdesign condition will result in a higher glare probability from the relevant viewpoint rela-tive to other design conditions, and so on.
The actual value of each main effect refers to the difference you can expect between a situ-ation with one particular parameter value and the average of all situations. For example,if the effect of large windows on the south facade on a south perimeter zone at a certaintime of day and year is 500, one can predict the zone will receive 500 more lux with largerather than small windows. However, these values are only truly relevant for buildingdesigns which have the same general characteristics as the test model described in section4.2.4. For use within the expert system, it is the relative difference between main effectsfor different design parameters that should be considered. The relative difference betweendesign parameters should indicate whether one design change is more likely to have aneffect on the building performance than another and in what direction, but it will not allowus to predict what that actual magnitude of the change will be.
65

It is important to note that main effects are calculated over all combinations of design vari-ables in the DoE set. This characteristic is powerful because one can apply the informationwithin it to a wide variety of designs. One can consider the experiments as a collectionof case study designs and the knowledge base itself as an aggregate of those case studies.In this way, the knowledge base was designed to be customizable to specific design situa-tions. This means that one can pull out the information most relevant to a specific designscenario while ignoring the rest of the data. For example, if the design were a school roomwith a single south-facing facade, one would consider only south-facade information dur-ing the school schedule (morning and mid-day, autumn through spring). Specific zonesand views can also be identified for further customization.
This customization is one important way in which the knowledge base results are usedwithin the expert system. Within the system, a customized database of information mostrelevant to the user’s design is created. This database is formed using the combinationof views, zones, facades, times of day, and seasons most relevant to the user’s input andinitial building design.
The second important way that the knowledge base is used in the expert system is to helpcreate a ranked list of design changes to be proposed by the system before a design iter-ation. The suggested design changes are determined by first comparing the performanceof the current design to the user’s goals, then by using the customized knowledge basewithin a fuzzy logic rule set to select and rank those design changes that are most likelyto affect the performance in a positive way. The logic and algorithms used to create thecustomized database and to select design changes are described further in Chapter 5.
The next sections contain example results from the illuminance and glare databases.
4.4 Illuminance-Based Analysis
The illuminance database contains information about how changing the selected designparameters will affect the mean illuminance on sensor plane in each of the five zones,for the three different times of day and three different seasons. As mentioned in section4.3, the data can be customized based on specific scenarios. In this section, a selection ofexample customizations are shown based on the main effects database created for Boston,MA. These examples demonstrate the variety of information that is available within thedatabase.
Three examples are shown with different sets of zones, times, and seasons. They rangefrom general to highly specific. In each example, the main effects for all four differentfacades are shown on the same chart. Positive main effects indicate that the given designcondition is likely to increase the illuminance in the zone(s) considered, and negative maineffects indicate that the given design condition is likely to decrease the illuminance. Themagnitude of the main effect indicates the magnitude of the expected illuminance effect.
66

-200
-100
0
100
200
0 1 0 1 0 1 0 1 0 1 0 1 0 1 0 1 0 1 0 1
Illum
inan
ce M
ain
Effe
ct [l
x]North Facade East Facade South Facade West Facade
Window Area
Number of WIndows
Window Shape
Vertical Location
Horizontal Location
Window Distribution
Overhang Fins GlassTransmissivity
Glass Type
Morning Mid-Day Afternoon
WinterSpring & Autumn Summer
N
Figure 4.6: Illuminance main effects averaged over all zones, all times, and all seasons
Morning Mid-Day Afternoon
WinterSpring & Autumn Summer
N
-200
-100
0
100
200
0 1 0 1 0 1 0 1 0 1 0 1 0 1 0 1 0 1 0 1
Illum
inan
ce M
ain
Effe
ct [l
x]
North Facade East Facade South Facade West Facade
Window Area
Number of WIndows
Window Shape
Vertical Location
Horizontal Location
Window Distribution
Overhang Fins GlassTransmissivity
Glass Type
Figure 4.7: Illuminance main effects averaged for AM times, averaged over all zones andall seasons
-200
-100
0
100
200
0 1 0 1 0 1 0 1 0 1 0 1 0 1 0 1 0 1 0 1
Illum
inan
ce M
ain
Effe
ct [l
x]
North Facade East Facade South Facade West Facade
Morning Mid-Day Afternoon
WinterSpring & Autumn Summer
N
Window Area
Number of WIndows
Window Shape
Vertical Location
Horizontal Location
Window Distribution
Overhang Fins GlassTransmissivity
Glass Type
Figure 4.8: Illuminance main effects for north zone and AM times, averaged over all sea-sons
67

The first example shows the average main effects for all zones, all times, and all seasons.The second example shows the average main effects for all zones and seasons, but onlyduring morning times. The third example shows the main effects for only the north zoneduring morning times, averaged across all seasons.
Example 1: Main effects averaged over all conditions
This example, shown in Figure 4.6, represents the most general application of the illumi-nance database, as it indicates the main effects of the various design parameters whenaveraged over all possible cases: all five zones, three times of day, and three seasons. FromFigure 4.6, it is clear that in general, the design parameters likely to have the largest overalleffect on illuminance are the window area, shading devices, and glass type and transmis-sivity. Geometric properties of the windows such as shape, distribution, and location onthe facade have almost no effect on illuminance.
This example also demonstrates the differences in main effects among windows on eachof the four cardinal facades. From the chart, we see that for a given level of a given de-sign parameter, the main effects for each facade orientation have the same sign (positiveor negative). However, the magnitude of the main effects vary based on orientation. Ingeneral, windows on the south facade have the greatest effect on illuminance, while north-facing windows have the least effect. The east and west orientations have roughly thesame magnitude of effects in all cases. These results are expected given that this databaseis for a location in the Northern Hemisphere and that the effects from the whole year wereaveraged.
Example 2: Main effects for morning only
This example, shown in Figure 4.7, represents a more specific customization of thedatabase which considers only information about the morning, averaged over all zonesand all seasons. In this example, we see somewhat different results than the whole-yearscenario in Example 1. The design parameters which result in the highest magnitude ofeffects are the same as the previous example, but we note a large difference between theeffects for the different facade orientations. In this scenario, windows on the east facadehave a much larger magnitude of effect than in the previous case, where the south-facingwindows had the largest effects. These results seem reasonable since this case considersa morning-only scenario, which means that the only direct sunlight considered will becoming from the east.
Example 3: Main effects for north zone, morning only
This example, shown in Figure 4.8, demonstrates a highly specific customization of thedatabase results. In this scenario, only the north zone is considered for morning times,averaged over all seasons. Here we find that for the five major design parameters (basedon window area, shading devices, and glazing type), both the north and east facade orien-tations have large effects on illuminance while the west- and south-facing windows haverelatively little effect. These results are expected, given that the north windows are mostlikely to affect the north zone and the east windows will have a large effect during themorning.
68

This example is dramatically different from the previous two examples in that the verticaland horizontal location of windows, two design factors which had little effect on illumi-nance in the more general cases, are shown to have a very large effect in this more specificexample. These effects indicate that illuminance in the north zone will increase dramati-cally when the east-facing windows are shifted horizontally on the facade towards north,or when the east-facing windows are higher on the facade. Both of these design actions al-low direct morning sunlight from the east or south-east to penetrate further into the northzone.
4.5 Glare Risk Evaluation
The glare database contains information about how changing the selected design param-eters will affect the mean DGPm for views towards each of the four cardinal direction ineach of the five zones during the three different times of day and three different seasons.Similarly to the illuminance database, the glare database can be customized so as to berelevant to a variety of situations ranging from general to highly specific. In this section,three examples are shown based on the main effects database created for Boston, MA.
When using the glare database, it is important to recall that a positive main effect indicatesthat the given design condition is likely to increase the probability of glare seen based onthe view(s) considered, and a negative main effect indicates that the given design conditionis likely to decrease the probability of glare. As before, the magnitude of the main effectindicates the magnitude of the expected effect on glare probability.
Three examples are shown, each for views towards the south. As with the illuminance ex-amples, the glare database examples range from general to more specific. The first exampleindicates the average main effects for south-facing views averaged over all zones, times,and seasons. The second example shows the average main effects for south-facing viewsduring the summer months, averaged over all zones and all times of day. The third exam-ple shows the main effects for south-facing views from the west zone during evenings inthe summer months.
Example 1: Main effects for south views averaged over all conditions
This example, shown in Figure 4.9, demonstrates the most general customization of theglare database. It indicates the main effects for south-facing views averaged over all zones,seasons, and times of day. We note that for all design parameters, the north-facing win-dows had no effect on glare, which is reasonable given that these results are for viewstowards south. Likewise, some of the largest main effects are seen for windows on thesouth facade. We note that the glass type on the south, west, and east facing windows hasa large effect on glare probability; for all three orientations, the use of translucent glass islikely to reduce the probability of glare. Lowering the transmissivity on the south facingwindows and adding fins to the east and west windows are also shown to decrease glare
69

-0.02
-0.01
0
0.01
0.02
0 1 0 1 0 1 0 1 0 1 0 1 0 1 0 1 0 1 0 1
Gla
re M
ain
Effe
ct [%
]
North Facade East Facade South Facade West Facade
Morning Mid-Day Afternoon
WinterSpring & Autumn Summer
N
Window Area
Number of WIndows
Window Shape
Vertical Location
Horizontal Location
Window Distribution
Overhang Fins GlassTransmissivity
Glass Type
Views
Views
Figure 4.9: Glare main effects for south views averaged over all zones, times, and seasons
-0.02
-0.01
0
0.01
0.02
0 1 0 1 0 1 0 1 0 1 0 1 0 1 0 1 0 1 0 1
Gla
re M
ain
Effe
ct [%
]
North Facade East Facade South Facade West Facade
Morning Mid-Day Afternoon
WinterSpring & Autumn Summer
N
Window Area
Number of WIndows
Window Shape
Vertical Location
Horizontal Location
Window Distribution
Overhang Fins GlassTransmissivity
Glass Type
Views
Views
Figure 4.10: Glare main effects for south views and summer season, averaged over allzones and times
-0.02
-0.01
0
0.01
0.02
0 1 0 1 0 1 0 1 0 1 0 1 0 1 0 1 0 1 0 1
Gla
re M
ain
Effe
ct [l
x]
North Facade East Facade South Facade West Facade
Morning Mid-Day Afternoon
WinterSpring & Autumn Summer
N
Window Area
Number of WIndows
Window Shape
Vertical Location
Horizontal Location
Window Distribution
Overhang Fins GlassTransmissivity
Glass Type
Views
Views
Figure 4.11: Glare main effects for south views in the west zone, summer evenings only
70

probability. Other design parameters which may have an effect on glare are window area,window shape, vertical location, and horizontal location.
Example 2: Main effects for south views in the summer
In this example, shown in Figure 4.10, south views during the summer months were con-sidered, averaged over all zones and all times of day. This example is striking because thedesign parameters of the north, east, and west windows have almost no effect on glarein this specific scenario. Instead, only a few parameters on the south facade windows areshown to affect glare. These parameters are window shape (aspect ratio), vertical location,shading devices, and glass transmissivity and type. As expected, lower glass transmissiv-ity and translucent glass will reduce the probability of glare. A less intuitive result seen inthis example is that adding shading devices to the south facade is likely to increase glarefor a view towards south. This result is likely due to the shading devices reducing thevertical illuminance at the sensor plane while not dramatically decreasing the luminanceat the window itself, thus creating a greater amount of contrast in the view direction thanthe unshaded case.
Example 3: Main effects for south views from the west zone, during summer evenings
The final glare example, shown in Figure 4.11, is highly specific. This example indicates themain effects for glare for views towards south from the west zone, during only eveningsin the summer. As expected, the two facade orientations which most effect glare in thiscase are south and west. However, this example is interesting because for several designparameters, the west and south orientations display opposite effects on glare. For example,adding an overhang or fins to the west facade is likely to reduce the probability of glare,while adding shading devices to the south facade is likely to increase it. Window area andvertical location display a similar pattern. Changes to the glazing transmissivity and typehave the same effect for windows on both orientations, as expected.
4.6 Influence of Climate
Because the knowledge base is populated using simulation data based on one specificlocation, the results should be most relevant to that location, which means that, in orderto consider additional locations, new knowledge bases must be created. The previousexamples were all created using data from a knowledge base for Boston, MA, USA. In thissection, some example results are shown from two different databases: one for Boston,MA, and one for Siem Reap, Cambodia. The daylighting conditions in these locationsare different from one another, as Boston has a latitude of 42 degrees N and a continentalclimate while Siem Reap has a latitude of 13 degrees N and a tropical climate. The twoclimates also differ based on sky type, which is largely overcast in Cambodia during themonsoon season (from May through October), while it is generally intermediate or turbidduring those months in Boston.
71

Morning Mid-Day Afternoon
WinterSpring & Autumn Summer
N
-0.06
-0.04
-0.02
0
0.02
0.04
0.06
0 1 0 1 0 1 0 1 0 1 0 1 0 1 0 1 0 1 0 1
Gla
re M
ain
Effe
ct [
lx]
North Facade East Facade South Facade West Facade
Window Area
Number of WIndows
Window Shape
Vertical Location
Horizontal Location
Window Distribution
Overhang Fins GlassTransmissivity
Glass Type
Views
Views
Figure 4.12: Main effects for glare for north views from the north and core zones during aschool year schedule in Boston, MA
-0.06
-0.04
-0.02
0
0.02
0.04
0.06
0 1 0 1 0 1 0 1 0 1 0 1 0 1 0 1 0 1 0 1
Gla
re M
ain
Effe
ct [l
x]
North Facade East Facade South Facade West Facade
Morning Mid-Day Afternoon
WinterSpring & Autumn Summer
N
Window Area
Number of WIndows
Window Shape
Vertical Location
Horizontal Location
Window Distribution
Overhang Fins GlassTransmissivity
Glass Type
Views
Views
Figure 4.13: Main effects for glare for north views from the north and core zones during aschool year schedule in Siem Reap, Cambodia
To illustrate the difference between the knowledge base results for these two locations, anexample set of data is shown in Figures 4.12 and 4.13. These figures indicate main effectsfor glare for north views from the north and core zones during a school year schedule(morning through mid-day, autumn through spring).
One obvious difference between the two charts is that the magnitude of effects is muchgreater in general for the Cambodia data. This is partially indicative of direct sun fromthe north, which occurs far more often in Siem Reap than in Boston, due to Cambodia’sproximity to the equator. Another large difference is the influence of east and west facingwindows on glare in the north direction, which is much larger for Siem Reap than forBoston. This is likely due to the difference in solar altitude between the two locations,which results in a stronger amount of light in Siem Reap during the fall, winter, and springmonths. This example shows how different the daylighting conditions may be for the same
72

0
50
100
150
200
100
200
300
400
500
50
100
150
200
250
300
350
400
50
100
150
200
250
300
350
400
30
60
90
120
150
100
150
200
250
300
350
400
100
150
200
250
300
30
60
90
120
150
100
200
300
400
500
50
100
150
200
250
300
350
North Facade Windows
South Facade Windows
East Facade Windows
West Facade Windows
North Facade Windows
South Facade Windows
East Facade Windows
North Facade WIndows
South Facade Windows
West Facade Windows
100
150
200
250
300
West Facade Windows50
100
150
200
250
300
350
East Facade WIndows
WINDOW AREA & OVERHANG WINDOW SHAPE & FINS OVERHANG &TRANSMISSIVITY
Figure 4.14: Examples of major two-way interaction effects for illuminance, averaged overall zones, seasons, and times of day, in Boston, MA
building if it is sited in a different latitude and climate. This example also demonstratesthe need for climate-specific knowledge bases which are accurate for specific locations.
4.7 Interaction Effects
Two-way interaction effects are similar to main effects, except instead of providing an un-derstanding of how a single variable affects illuminance or glare, they indicate how theinteraction between two different design parameters affects performance. Although inter-action effects are not included in the current version of the daylighting knowledge base,the DoE scheme used in this thesis has a sufficiently high resolution such that they couldbe included in future work. Interaction effects are important because they can indicate toa designer a variety of combinations of design conditions that may have a large effect ondaylighting performance. Like the main effects, the interaction effects can be calculatedfor situations which range from general to specific.
73

In this section, one example of interaction effects is demonstrated: the two-way interactioneffects for illuminance, averaged over all zones, seasons, and times of day, for Boston, MA.Figure 4.14 shows interaction plots for three of the design parameter pairs which havethe largest interaction effects for windows on all four facade orientations. The first twointeractions, window area/overhangs and window shape/fins, serve as reminders thatthe sizing of shading devices relative to window geometry can greatly affect daylightingperformance by limiting direct sunlight. The third interaction, glass transmissivity andtranslucency, indicates that care must be taken when choosing a glass type, as using atranslucent glazing will have a different effect depending on whether the transmissivity ishigh or low.
4.8 A DoE-Based Design Guide
Although the daylighting knowledge base has been created specifically for use within theexpert system described in this thesis, this database may also be used as a stand-alone re-source. This section describes a simulation-based, climate-specific design guide, createdusing the knowledge-base results. To generate such a guide, one must first determine thespecific set of zones, views, seasons, and times of day most relevant to the given projectand pull out the corresponding data from the knowledge-base. The main effects and in-teraction effects should then be sorted according to the desired performance, such as highilluminance or low glare. Those design parameters or pairs of design parameters which areknown to result in the desired performance can then be presented to the designer. One canalso consider both illuminance and glare at the same time, and sort the design parametersbased on both metrics.
An example guide is shown in Figure 4.15. This guide is for Boston, MA and considersviews looking towards north from the north and core zones as well as illuminance in thenorth and core zones for a school schedule (morning to mid-day, autumn to spring).
The example guide has been created to suggest design conditions which result in high il-luminance and low glare at the same time. It includes individual design conditions (forexample, “wide windows”) as well as combinations of design conditions. The design sug-gestions are grouped by facade orientation so the designer can understand how differentdesign conditions may be appropriate for one facade orientation and not another. Thelayout of the guide aims to simplify the knowledge-base results so that a designer canquickly identify design characteristics which will help him to achieve the desired perfor-mance. The single design elements that are likely to have the desired performance effectare located closest to each facade. Lines connect these elements with others to indicatepairs of design characteristics that, combined, should result in good performance. Thedata is presented in a clear way, much like traditional design guides, but, as the guide isbased on simulation results, it is also applicable to more specific situations than simpleheuristics.
74

N
S
EW
Illuminance Zone
View
LEGEND:
Increase window area
Move windows higher on facade
Move windows closer together
Make windows wider
Move windows to the left side of the facade
Remove or shorten overhangs
Remove or shorten vertical fins
Use low transmis-sivity glass
Use high transmis-sivity glass
Use trans-lucent glass
Figure 4.15: Example design guide for Boston, MA with cardinal facade orientations con-sidered (specific for views looking towards north from the north and core zones as well asilluminance in the north and core zones for a school schedule)
75

4.9 Chapter Summary
This chapter discussed the generation of a daylighting-specific database, or “knowledgebase,” using the Design of Experiments methodology. This knowledge base will act as thecore set of knowledge for use in the expert system.
The daylighting knowledge base contains information about the relative effects of ten dif-ferent facade parameters on the mean illuminance levels on a workplane and on the prob-ability of glare for views from within the space. The effects are available for design con-ditions on facades oriented towards each of the four cardinal directions, for five differentzones (four perimeter zones and one core zone), three different periods of day (morning,mid-day, and afternoon), and three different seasons of year (summer, autumn/spring,and winter). For the glare metric, views were considered in each of the four cardinal direc-tions from locations within each of the five zones described.
This chapter described a set of examples of illuminance and glare main effects results forBoston, MA. The results indicate how the main effects for these metrics differ based on thelevel of specificity desired and how the knowledge base can be used for design scenarioswhich range from general to highly specific. This chapter also illustrated the difference be-tween the main effects data for two different locations, Boston and Siem Reap, Cambodia,which demonstrated the need for climate-specific knowledge bases.
Chapter 5 will discuss the logic by which the knowledge base is incorporated into andutilized by the expert system.
76

Chapter 5
A Fuzzy Rule-Based Expert System
5.1 Introduction
The goal of an expert system is to emulate the logic and decision making capabilities ofa human expert when given a problem in a certain domain. The expert system describedin this thesis has been designed to act as a daylighting consultant, one which can guide adesigner towards design decisions which will help improve the daylighting performanceof a space based on the designer’s own goals for illuminance and glare.
The proposed daylighting expert system contains two major components: the daylighting-specific database described in Chapter 4 and a set of fuzzy rules which act as the decisionmaking logic within the system. Fuzzy logic is a type of logic which is used to describeideas or values which are not as black and white as the concepts used in classical logic.This type of logic is commonly incorporated into expert systems so as to better representthe way that humans (as opposed to computers) think and solve problems.
This chapter describes the expert system as a whole, including the various inputs into thesystem, the fuzzy logic variables and rule set, and the means by which the daylightingdatabase is incorporated into the process.
5.2 Fuzzy Logic
This section provides a brief overview of fuzzy logic and fuzzy rule-based expert systems.
5.2.1 Introduction to Fuzzy Logic
Fuzzy logic was first developed in the 1930s by philosophers who wished to explore con-cepts of “vagueness” and extend classical logic from having only two values (0 and 1, or
77

65 70 75 8060 85
Height (inches)
Deg
ree
of M
embe
rshi
p
0.2
0.4
0.0
0.6
0.8
1.0
(a)
65 70 75 8060 85
Height (inches)
Deg
ree
of M
embe
rshi
p
0.2
0.4
0.0
0.6
0.8
1.0
(b)
Short Average Tall
Short Average Tall
Figure 5.1: Example crisp (a) and fuzzy (b) sets for short, average, and tall men.
“true” and “false”) to a continuous set of values between 0 and 1 (Lukasiewicz, 1930; Black,1937). It was re-discovered in 1965 by Zadeh, who expanded it into a formal system formathematical logic (1965).
The main idea of fuzzy logic is to represent vague or non-perfect membership within a set.Using classical or “crisp” logic, an element may either belong to a set or not, so the degreeof membership in a set can only be either 0 or 1. Using fuzzy logic, an element may belongto multiple sets, and the degree of membership in a set can be any real number between 0and 1. The use of fuzzy sets thus allows the representation of partial membership in a setand of simultaneous membership in seemingly conflicting sets. Fuzzy logic enable thosewho use them to think in “shades of gray”, as opposed to the “black and white” of classicallogic.
A common example of fuzzy logic is that of categorizing men based on their heights (Fig-ure 5.1, adapted from Negnevitsky, 2005). Using crisp logic, a man who is 5’7” is con-sidered “average” and a man who is 6’2” is considered “tall.” Using fuzzy logic, a manwho is 5’7” has a degree of membership of 0.3 for “short” and 0.4 for “average.” A manwho is 6’2” is considered 0.2 “average” and 0.7 “tall.” Using the fuzzy sets, one can beginto understand the degree of “short,” “average,” or “tall” in a more intuitive and humanway than using the strict crisp sets. Additionally, because membership is not mutually ex-clusive, the degrees of membership do not need to sum to 1 as would be necessary usingclassical logic.
78

Because fuzzy logic has been developed to be a formal logic system, many of the sameoperations can be done using fuzzy sets as with crisp sets; for example, complements,intersections, and unions. Both types of sets also have the same properties, such as com-mutativity, associativity, distributivity, identity, and transitivity. A good overview of fuzzylogic theory can be found in (Gaines, 1976).
5.2.2 Fuzzy Rule-Based Systems
Rule-based expert systems are a common type of expert system in which decision makinglogic is written as a series of if-then statements. An example rule-based expert system isone which chooses the appropriate accessories for someone to wear or carry based on theweather. Below are two example rules which might exist in such a system:
IF sky is cloudy
AND predicted_weather is rain
THEN necessary_accessory is umbrella
IF sky is clear
AND predicted_weather is sun
THEN necessary_accessory is sunglasses
A fuzzy rule-based system works in a similar way, except that some or all of the variablesare fuzzy instead of crisp. In the example above, the weather could be somewhat cloudyand somewhat clear. In general, a fuzzy rule-based system uses the following steps (Neg-nevitsky, 2005):
1. Fuzzification - In this step, crisp inputs are converted to fuzzy variables based onfuzzy logic similar to that explained in section 5.2.1. For example, a crisp input mightbe the amount of cloud cover in the sky, and the result of the fuzzification would bethe degree of membership in each of the categories “cloudy” and “clear.”
2. Rule evaluation - In this step, the fuzzified inputs from step 1 are applied as theantecedents of the fuzzy rules. Just as each of the antecedents is fuzzy in these rules,the rule outputs will also be fuzzy values. For example, in the rule set above, itmight be possible for the outputs to be: necessary_accessory is 0.8 umbrella and 0.1sunglasses.
3. Aggregation of the rule outputs - In this step, the outputs of all the rules are com-bined into a single fuzzy set.
4. Defuzzification - In this step, the fuzzy results are defuzzified so that the final outputis a crisp value. For example, the final output from the example rule set above mightbe: “Definitely bring an umbrella. You may want to consider bringing sunglasses.”
79

Fuzzy Rule-BaseDaylighting Database
Inference Engine
Expert System
Crisp Inputs:
- User Goals and Preferences- Building Geometry- Daylighting Performance
Crisp Outputs:
- List of Suggested Design Changes for Facade Elements
Fuzzified Inputs
FuzzyResults
Customized Database
Zone, Time, and Season Information
Figure 5.2: Schematic diagram of the expert system structure and information flow
In addition to the set of fuzzy rules, an important component in a fuzzy expert systemis an inference engine. The inference engine acts as the “brain” of the expert system byconnecting the various components. For example, the inference engine is what determineswhich rules to fire based on available inputs.
In the system described in this thesis, the inference engine connects the fuzzy rule-baseand the daylighting database. Additionally, it handles inputs from the user interface, the3d modeler, and the simulation engine.
5.3 Expert System Structure
The general structure of the expert system is indicated in Figure 5.2. The general processis described below:
1. The user creates an initial 3d model of a design and specifies performance goals andpreferences.
2. Daylighting performance for the current model is calculated using the LSV enginedescribed in section 4.2.2.
3. The inference engine “fuzzifies” the crisp inputs into fuzzy variables. These variablesrefer to user goals and preferences as well as current daylighting performance for thedesign.
80

4. The inference engine creates a customized database using the general daylightingdatabase described in Chapter 4. The customized database contains only the infor-mation most relevant to the current design.
5. Fuzzy rules are fired using the customized database and fuzzy variables. The resultsare a set of suggested design changes that the system will propose to the user in orderto improve performance.
6. Results are presented to the user in the user interface.
7. The user selects a design change to make, and new 3d models are created automati-cally.
8. Go to step 2.
Steps 1-5 will be discussed in further detail in this chapter. Steps 6 and 7, which refer tothe user interface and system automation, will be discussed in Chapter 6.
5.4 General Description of Assumptions and Logic
This section provides a brief general overview of some of the major assumptions and logicthat the expert system uses to decide which design changes are most likely to improveperformance of a given design. Further details of the expert system logic are provided insections 5.5, 5.6, and 5.7.
Selecting Which Windows to Target
The expert system assumes that the design changes made to the facade closest to a givensensor will affect the sensor more than design changes made to facades further from thatsensor. Similarly, the expert system assumes that on a given facade, some windows willbe closer to a sensor plane than other windows, and changes to those windows will havea greater effect on the sensor plane than other windows on the same facade. The expertsystem uses these assumptions to help determine which windows should be changedduring a given design iteration.
Dealing with Multiple Performance Goals
If there are multiple sensors within a model, the expert system will attempt to find designchanges which are likely to improve the performance of all sensors at once. However, insituations where the user’s goals are conflicting, the expert system will choose to improveone sensor at a time, perhaps at the expense of performance of another sensor. In thesescenarios, the expert system uses the following logic: goals which the user has specifiedas high priority take precedence over lower priority goals, and sensor planes which have
81

the lowest current performance have priority over sensor planes with good current per-formance.
Dealing with Illuminance Goal Ranges
Illuminance goals are based on ranges, which means that the user is allowed to specifyboth lower and upper bounds. As a result, an illuminance sensor plane may see illumi-nance that is too low, within range, or too high. Dealing with a sensor plane which seesilluminance that is both too high and too low at the same time is a complicated problem.The expert system chooses to deal with this problem in two ways: it determines if othersensors would benefit more from moving towards higher illuminance or lower, and ittakes into account whether the amount of illuminance which is too high is greater than orsmaller than the amount of illuminance which is too low.
Determining an Appropriate Magnitude of Change
A problem similar to that of dealing with illuminance goal ranges is selecting an appropri-ate magnitude of change. For example, the system may wish to increase the illuminanceon a sensor plane a small amount so as to reach the user’s goal range; however, an increasewhich is too large will result in decreased performance due to the illuminance being toohigh on the sensor plane. The expert system deals with this issue by determining whethera change should be “small” or “large,” and by selecting design changes from the day-lighting knowledge base which are deemed most appropriate for that magnitude. It thencreates design changes in three increments and allows the user to select the version he orshe prefers. For example, if the design change were to increase the overhang length on agroup of windows, the system would test out three different models, each with a differentoverhang length, and the user would choose one of the three models to accept based onthe resultant performance and aesthetics.
5.5 Required Expert System Inputs
This section describes the crisp inputs that the expert system requires. The crisp inputshelp the system establish the context of the design problem by providing the system withthe information it needs to understand about the initial design, the performance goals,the performance of the initial design based on those goals, and the user’s preferences.These inputs include those which are provided directly by the user and those which arecalculated by the simulation engine or within the inference engine.
82

Figure 5.3: Example 3d model which meets expert system modeling criteria. Horizontalilluminance sensor planes are colored red, vertical glare sensor planes are colored yellow.
5.5.1 User Inputs
Before the expert system process begins, a large number of user inputs are required fromthe user. The major user input is a 3d model, which must be created in Google SketchUp.Simple pop-up interfaces within Google SketchUp allow the user to input the remaininginformation, including performance goals, priorities, and other preferences.
3d Model
One innovation within the expert system is to allow users to specify their design by cre-ating a 3d massing model in Google SketchUp instead of requiring them to define theirbase model using a text-based approach or choose from a set of default options. Thisuser-defined massing model should indicate the general form of the space and all desiredopaque material properties, i.e. wall, floor, and ceiling reflectances, as well as glazing typesand shading device geometry.
Within the 3d model, the user must also specify 2d sensor planes on which either illumi-nance or glare will be calculated. The user may elect to have any number of illuminanceand/or glare sensors and goals. The sensor planes may be any size and they may be ori-ented vertically or horizontally. For glare goals, the user may elect to model an array ofsmall sensor planes (like those in the default model described in section 4.2.4, Figure 4.3).If all glare sensors in an array are modeled using the same material name, they will beconsidered as a single “glare sensor group.”In order for the system to correctly interpretthe massing model, the model should conform to a few basic guidelines which enablethe model to be understood by the Lightsolve system. These guidelines allow the systemto differentiate opaque from transparent materials, materials location outside the interior
83

Figure 5.4: Interface for illuminance goal range inputs.
Figure 5.5: Interface for glare threshold goal inputs.
space (such as shading devices), and special surfaces used as sensors for illuminance orglare. The guidelines are described in detail in Appendix A.
One important requirement for models is that all facades that are modeled with windowsmust be parallel or orthogonal to the cardinal axes in SketchUp. The expert system logicalso does not currently take internal walls into account. Figure 5.3 shows an examplemodel in SketchUp that meets the expert system modeling criteria.
Performance Goals
For each sensor plane within the 3d model, the user must specify performance goals. Foreach illuminance sensor plane, the user must specify a desired illuminance goal range inlux, including the actual desired range and a buffer zone of acceptable values (Figure 5.4).For example, the user may desire the illuminance of a given sensor plane to fall between400 lux and 1200 lux, but he or she may also accept illuminances as low as 200 lux and ashigh as 1500 lux. For each glare sensor or glare sensor group, the user must choose a glaretolerance. The glare tolerance options are “zero” (which means that no glare is tolerated),“medium,” and “high” (which means that a high amount of glare is allowed). The DGPvalues corresponding to these tolerance levels are described further in section 5.5.2. Theuser can input these goals into a simple interface in Google SketchUp (Figure 5.5).
84

Figure 5.6: Interface for goal priority inputs.
Figure 5.7: Interface for selecting times and seasons of interest.
Goal Priorities
In addition to the performance goals, the user may also specify a priority level for eachindividual goal. The user may choose to set different priorities for all goals, the samepriority for all goals, or a combination. Priorities are input using a simple ranking system:“1” indicates the highest priority goal(s), “2” is the second highest priority goal(s), and soon. The user may specify values in any range from 1 to n, where n is the total number ofsensors included in the model. The user priority interface is shown in Figure 5.6.
Window Uniformity Scheme
One of the functionalities of the expert system is to automate changes to facade elementson the user’s original model. Because the user may wish to maintain a certain aesthetic, heor she must select one choice from from the following window uniformity options from apull-down menu in SketchUp:
• All windows in the model should look the same.
• All windows on a facade should look the same.
• Windows can look different from other windows on the same facade.
85

Figure 5.8: Example triangulated 3d model. The goal-based performance is calculatedindividually for each triangle on a sensor plane.
Times of Interest
The user is allowed to select which seasons and times of day he or she is interested in.The user is allowed choose from: winter, fall/spring, summer, morning, mid-day, andafternoon (Figure 5.7). For example, a designer who is working on a school design maychoose only to consider fall, winter, and spring during morning and mid-day. Selecting allseasons and times of day will allow the system to consider performance during all daylithours over the whole year. The expert system will only consider performance duringthose times of day and year which correspond to the user’s selections.
Weather and Location
A final critical input is the location of the design and its corresponding weather file. Thelocation information includes latitude, longitude, and timezone. The weather file is aLightsolve-native file with a .wea extension. If an appropriate .wea file is not available,an .epw (EnergyPlus) file can be automatically converted into a .wea file from within theLightsolve system.
5.5.2 Calculated Data
Once the user has input the required information, the system must calculate some addi-tional crisp inputs. The goal-based performance is calculated using the LSV engine (de-scribed in section 4.2.2). The building data model and geometric information are deter-mined by the inference engine.
86

100%
0%
ILLU
MIN
AN
NC
E C
RED
IT
ILLUMINANCE
Acceptable Low
Desired Low
Desired High
Acceptable High
100%
0%
GLA
RE C
RED
IT
DGPm
Imperceptible Glare Threshold
Desired Upper Glare Threshold
Figure 5.9: Goal-based performance metrics for illuminance and glare.
Goal-Based Daylighting Performance
Goal-based performance for all glare and illuminance sensors are calculated using the 3dmodel, the location and weather information, the performance goals (illuminance rangesand goal thresholds), and the times of interest.
As mentioned in section 5.5.1, the goal-based illuminance metric requires the user to inputfour illuminance values: acceptable low, desired low, desired high, and acceptable high.To calculate the goal-based illuminance, the LSV engine first triangulates each sensor intosmall patches (Figure 5.8), then calculates the climate-based illuminance (section 4.2.3) oneach patch over 56 time periods which represent a whole year. For a single patch, the goal-based illuminance metric is defined as the percentage of the user’s times and seasons ofinterest during which daylight provides an illuminance within the user’s specified range.The final goal-based illuminance for a sensor plane is an average of the performance overall patches on a sensor plane. For illuminance levels which fall between the “acceptable”and “desired” values, partial credit is given (Figure 5.9). A value of 100% indicates thatthe entire area of the sensor plane sees an illuminance in the user’s desired range over allperiods of day and seasons of interest.
Similarly, the DGPm (section 4.2.3) is calculated on each glare sensor over 56 time pe-riods which represent a whole year. To evaluate glare risks, this thesis uses the glarethresholds described by Wienold (2009), where any value below 0.33 (imperceptible glare)
87

Building
Fins
Building Component Attributes
MaterialOrientationGeometryLocation on Model
Ceiling Wall(s) Floor
Window(s)
Overhang
Sensor(s)
Illuminance Sensor(s)
Glare Sensor Group(s)
Sensor Attributes
NameLocation in Model (Zone Weights)Orientation (View Weights)
Figure 5.10: Schematic structure for simple building data model generated by the expertsystem.
is considered a “no glare” situation and given a glare credit of 100%. The user choosesfrom three tolerances: “zero”, which corresponds to an upper glare threshold value of0.37; “medium”, which corresponds to a threshold value of 0.42; and “high”, which corre-sponds to a threshold value of 0.53. Any calculated glare value above the upper thresholdis given a glare credit of 0% (Figure 5.9). These glare credits are averaged across all glaresensors in each glare sensor group within the model. A value of 100% indicates that thespecified view direction is unlikely to see glare due to daylighting.
Simple Building Data Model
In addition to performance, it is necessary for the expert system to understand the ge-ometry and materials of the design. To accommodate this, a simple building data modelwas developed whose values are automatically assigned once the process is initiated. Themodel contains information about each building element in a 3d model and the relation-ships between them. The general structure of the data model is indicated in Figure 5.10.Each building element object contains information about its location, geometry, orienta-tion, and material. The building data model allows the expert system to understand whichwalls have windows, how large those windows are and where they are oriented relativeto each other, as well the shading devices and glazing associated with each window.
In the proposed approach, the user creates a 3d model in SketchUp as an initial input anda simple building data model is automatically created by the system. During the expertsystem process, the building data model is also updated each time a design change is made
88

to the facade. The logic for the automatic model population is defined in detail in section6.4.1. Identification of each building element occurs using a series of logic statements re-garding the geometry and material of each modeled component. Element attributes arethen determined using information available from SketchUp about each face. The logicassumes that the model conforms to a few basic guidelines (Appendix A). The use of thebuilding data model is necessary because SketchUp is a geometric modeling tool and nota building information model (BIM).
Once the building data model has been populated, a few pieces of critical informationabout the building geometry can then be determined by the inference engine. This infor-mation helps the system understand where the sensors, facades, and windows are locatedin relation to each other. These metrics are described in the next three sections.
Perimeter Zone Weights
Each sensor in the model is assigned a zone weight for each of four perimeter zones (cor-responding to the four cardinal orientations) and for the core zone. Perimeter zones areconsidered to be the area within one wall height away from each facade. Perimeter zonesmay overlap, and the sensor weights take these overlappings into account. The weightsrepresent how much of the total area of the sensor is located within each zone, and theweights from all five zones sum to 1. Figure 5.11 shows the perimeter and core zones foran example floorplan with one illuminance sensor. In this example, the zone weights forthe sensor are: 0.09 North, 0.11 East, 0.17 South, 0.27 West, and 0.36 Core.
The perimeter zone weights are calculated at the beginning of the expert system processand will remain constant regardless of changes to the facade design that occur during theexpert system process. These weights are then used to create the customized daylightingdatabases described in section 5.5.3 and to rank possible design actions during the expertsystem decision making process.
Window-Sensor Weights
It is also important for the system to understand which windows are most likely to affectthe various sensor planes within the system. Within the building data model, each win-dow object is assigned a sensor weight for each sensor or sensor group in the model. Thewindow-sensor weights represent a rough estimate of how much of the total area of thesensor plane is affected by a given window. In order to calculate the weights, the widthof each window is projected orthogonally back into the space a total distance of two timesthe window-head-height, and the area of the projection which falls onto each sensor planeis calculated. The window-sensor weight for a given pair of one window and one sensorplane is calculated as the ratio of the projected area over a maximum possible projectedarea, defined as the window width times the sensor length in the orthogonal direction.The values that the window-sensor weights can take therefore range from 0 to 1.
89

North
Sensor Plane
Figure 5.11: Example floorplan with one sensor plane and perimeter zone weights indi-cated.
An example with three windows is shown in Figure 5.12, where window-sensor weightsfor each window are: (a) 0.67, (b) 0.13, and (c) 0.69. Based on the weights, the system canassume that windows (a) and (c) will both affect the sensor plane more than window (b).
Unlike the perimeter zone weights, the window-sensor weights may change during theexpert system process if window geometries are modified. These weights must be recal-culated and updated after each iteration of the expert system process. These weights areused to determine the window groups described in the next section, and they are onlyused by the system when a user allows the expert system to make changes to individualwindows on a facade instead of requiring a uniform facade aesthetic to be maintained.
Window Groups
In addition to determining which design changes to propose to the user, the expert systemmust also decide which windows the change should be applied to. This choice is in partdetermined by the user’s window uniformity selection: if the user selects “All windowsin the model should look the same” or “All windows on a facade should look the same,”then the window groups will always consist of either all windows or all windows on eachfacade, respectively.
However, if the user selects “Windows can look different from other windows on the samefacade,” then the expert system may elect to choose only a subset of windows on a given
90

North
Sensor Plane
a.
b.
c.
Figure 5.12: Example floorplan with three windows and one sensor. Windows (a) and (c)have large sensor weights and window (b) has a small sensor weight.
facade to be modified. The determination of window groups is based on the window-sensor weights. If, for a given window, the window-sensor weight is greater than 0.15,that window is added into the window group for the appropriate sensor. This means thatonly those windows which are located close to the sensor will be included. This thresholdvalue was chosen based on trial and error in early studies. For example, in Figure 5.12,the only west facing window that would be selected would be window (a), as window (b)has a window-sensor weight which is too small to qualify. Because the window groupsare based on the window-sensor weights, they must be updated after each design changeduring the expert system process.
5.5.3 Customized Daylighting Database
An important component of the expert system is the ability to create customized daylight-ing databases. A customized database features a subset of the information contained inthe full daylighting database described in Chapter 4 which includes only that data whichis most relevant to the user’s current design scenario. In order to create the customizeddatabase, only the data corresponding to the seasons and times of interest given by theuser are taken from the original database.
This subset is further customized for each individual sensor based on the zones in whicheach sensor is located. The knowledge base data contains different information for each
91

of the five zones (four perimeter zones and one core zone) and for four views from withineach zone. For each sensor plane, the data for each zone is multiplied by the sensor’scorresponding perimeter zone weight. Additionally, only the relevant views are includedfor glare sensors. The weighted data is added together to create a single database which ismore relevant to that particular sensor plane than to sensor planes located in other zonesor for other views within the same model. Therefore, for designs with multiple goals,multiple customized databases are created.
5.6 Expert System Fuzzy Variables
This section describes the fuzzy variables used within the expert system. Fuzzy or “lin-guistic” variables such as those demonstrated in Figure 5.1 allow an expert system to un-derstand the degree of membership in a set in a less strict way than crisp variables, whichcan only take the values “true” or “false.”
5.6.1 Fuzzy Variables Calculated Before Rule Firing
This section describes the fuzzy sets that are created using the crisp inputs described insection 5.5.
userPriority
The userPriority set is based on the user-input sensor priorities, described in section 5.5.1.The user is allowed to input integer values from 1 to n, where n is the total number ofsensors. After the user enters the integer values, they are normalized using the followingequation:
p = 1 − [P/(1 + Pmax)]
where p is the normalized value, P is the user-input value, and Pmax is the largest value of Pinput by the user. For example, if a user enters values [1, 2, 3] for 3 sensors, the normalizedvalues are calculated to be [0.75, 0.5, 0.25]. If the user enters values [1, 2, 2] for 3 sensors,the normalized values are calculated to be [0.667, 0.333, 0.333]. The higher normalizedvalues indicate higher priority.
Once the values have been normalized, the fuzzy variables highPriority and lowPriorityare calculated for each sensor. If the highPriority variable has a high value (approaching1.0), then the given sensor has a high priority. If the lowPriority variable has a high value,then the given sensor has a low priority. The membership functions are indicated in Figure5.13, with an example scenario in which the normalized priority value is 0.6, which resultsin a 0.6 degree of membership for high priority and 0.4 for low priority.
92

0.4 0.6 0.8 1.00.2
Normalized Priority
Deg
ree
of M
emb
ersh
ip0.2
0.4
0.0
0.6
0.8
1.0
High Priority
Fuzzy Set - UserPriority
0.0
Low Priority
Figure 5.13: Fuzzy set for user-input priorities.
40% 60% 80% 100%20%
% in Illuminance Goal Range or % below Glare Threshold
Deg
ree
of M
emb
ersh
ip
0.2
0.4
0.0
0.6
0.8
1.0
Good Performance
Fuzzy Set - SensorPerformance
0%
Bad Performance
Figure 5.14: Fuzzy set for sensor performance.
sensorPerformance
The sensorPerformance set is based on the current performance of the sensor and is ageneral set which is applicable to both illuminance and glare sensors. The crisp inputnecessary to calculate this set is either the average percent in goal range for an illuminancesensor plane or the average percent below the glare threshold for a glare sensor plane,over all the times and seasons of interest, as calculated by the LSV engine. Two fuzzyvariables, goodPerformance and badPerformance, are calculated. The sets are indicated inFigure 5.14. The example value in Figure 5.14 indicates a sensor plane which is 80% in thegoal range, which results in degrees of membership of 0.8 for good performance and 0.2for bad performance.
illuminancePerformance
The illuminancePerformance set is based on the current performance of an illuminancesensor plane. This set uses two crisp inputs from the LSV engine: the percentage of the
93

0.5 0.75 1.0 1.250.25
(% Too High)/(% Too High + % Too Low)
Deg
ree
of M
emb
ersh
ip
0.2
0.4
0.0
0.6
0.8
1.0
Too High
Fuzzy Set - IlluminancePerformance
0.0
Too Low
Figure 5.15: Fuzzy set for illuminance performance.
illuminance sensor plane area that sees illuminance that is higher than the goal range, andthe percentage of the illuminance sensor plane area that sees illuminance that is lower thanthe goal range. These values are both averaged over the desired times and seasons. Beforeobtaining the fuzzy outputs, the crisp inputs are combined into a ratio:
Ratio = %high/(%high + %low)
The ratio is then used to calculate two fuzzy variables, tooHigh and tooLow, as indicatedin Figure 5.15. The example in Figure 5.15 demonstrates a situation in which the calculatedratio is 0.3, which results in degrees of membership of 0.9 for too low and 0.1 for too high.
distanceFromGoal
This set is also based on the current performance of an illuminance sensor plane andrequires the same two crisp inputs as the illuminancePerformance set: percent too highand percent too low on an illuminance sensor plane. This set qualifies whether the sen-sor is close to achieving the desired performance goal or far from it. The four variablescalculated are: tooHigh_Far, tooHigh_Close, tooLow_Far, tooLow_Close. Figure 5.16demonstrates an example in which the % too high on a sensor plane is 12%, which resultsin degrees of membership of 0.8 for far from goal and 0.2 for close to goal.
glarePerformance
Similarly to the illuminancePerformance set, the glarePerformance set is calculated forglare sensor planes and uses inputs from the LSV engine. In this case, the system re-quires the percentage of glare sensors which see glare that is higher than the desired glarethreshold, averaged over the desired times and seasons. One fuzzy variable, tooHigh,is determined, as indicated in Figure 5.17. Figure 5.17 includes with an example case inwhich 40% glare has been found to be above the glare threshold, which results in a degreeof membership of 0.8 glare too high.
94

0.10 0.15 0.20 0.250.05
% Too High or % Too Low
Deg
ree
of M
emb
ersh
ip
0.2
0.4
0.0
0.6
0.8
1.0
Far From Goal
Fuzzy Set - DistanceFromGoal
0.0
Close To Goal
Figure 5.16: Fuzzy set for distance from goal.
0.5 0.75 1.00.25
% of Glare Above Threshold
Deg
ree
of M
emb
ersh
ip
0.2
0.4
0.0
0.6
0.8
1.0
Glare Too High
Fuzzy Set - GlarePerformance
0.0
Figure 5.17: Fuzzy set for glare performance.
- Mean Main Effect
0 + Mean Main Effect
Max Main Effect
Min Main Effect
Main Effect for Design Action
Deg
ree
of M
emb
ersh
ip
0.2
0.4
0.0
0.6
0.8
1.0
Large Increase
Fuzzy Set - ActionResult
0
Small Increase
No Change
Small Decrease
Large Decrease
Figure 5.18: Fuzzy set for action result.
95

actionResult
The actionResult set is used for both illuminance and glare sensor planes. It is used to de-termine whether a given design action is likely to increase illuminance or glare, decreaseilluminance or glare, or do nothing. The necessary crisp inputs are all obtained from thecustomized knowledge base described in section 5.5.3. These inputs include the main ef-fect of the given design action, the values of the design actions with the highest and lowestmain effects, and the mean of the absolute values of all main effects in the customizedknowledge base.
The fuzzy variables calculated are: largeIncrease, smallIncrease, noChange, smallDe-crease, largeDecrease. These values are calculated as indicated in Figure 5.18.
5.6.2 Fuzzy Variables Calculated During Rule Firing
A number of fuzzy variables are calculated during the process of rule firing. These vari-ables are described below, and the logic by which they are determined is described insection 5.7.
sensorPriority
This set describes the general priority of each sensor, based on a combination of userpriorities and current performance. In general, sensors which have high user priority andlow performance are given the highest overall priority. The fuzzy variables in this set arehighPriority and lowPriority. These variables are calculated in Rule Base 1.
desiredChange
This set describes the desired performance change(s) that will be most beneficial to theoverall performance of the design, based on the current performance and the user’sgoals. The fuzzy variables in this set include: “Increase illuminance by a large amount,”“Increase illuminance by a small amount,” “Decrease illuminance by a large amount,”“Decrease illuminance by a small amount,” and “Decrease glare.” These variables arecalculated in Rule Base 2.
actionPrediction
This set describes whether a design action is predicted to result in good performance for agiven sensor, based on the desired performance change necessary to reach the user’s goaland the performance change likely to result from that particular design action. The fuzzyvariable associated with this set is goodForSensor, which is calculated in Rule Base 3.
96

5.7 Fuzzy Rules
This section describes the fuzzy rule sets used to determine which design changes to sug-gest to a user based on a given design scenario. A diagram of the inputs and outputs forthese rules is shown in Figure 5.19.
To evaluate these rules, the expert system uses the Zadeh operators (Siler and Buckley,2005), which are defined as follows:
• x AND y = min(x, y)
• x OR y = max(x, y)
It is important to remember that these rules use fuzzy rather than classical logic, whichmeans that the resultant values will necessarily not be equal to 0 or 1 (true or false). Eachrule will be fired once, and each fuzzy variable will be given a value between 0 and 1. Forexample, in Rule Base 1, the fuzzy set SensorPriority may contain values that are non-zerofor both High and Low.
5.7.1 Rule Base 1: Determine Sensor Priorities
The first set of rules determines priorities for each sensor based on a combination of theuser priorities and the current performance of each sensor. The rule set is fired once foreach sensor plane. The rules are:
1. IF SensorPerformance is Bad AND UserPriority is High, THEN SensorPriority isHigh.
2. IF SensorPerformance is Good AND UserPriority is Low, THEN SensorPriority isLow.
5.7.2 Rule Base 2: Determine Desired Change
The second set of rules determines the change(s) in illuminance or glare that the systemshould aim for to improve performance based on the user’s goals. This rule set helps to de-termine whether the system should attempt to increase illuminance, decrease illuminance,and/or decrease glare. It also attempts to determine the magnitude of change that will bemost helpful for overall performance. Because illuminance goals may include a range ofdesired values, it is possible that an illuminance sensor will have multiple positive values(for example a single sensor may have positive values for “Increase illuminance by a largeamount”, “Increase illuminance by a small amount,” and “Decrease illuminance by a smallamount”). The use of fuzzy variables allows such a condition to be correctly understoodby the system.
97

Ranked List of Suggested Design Changes
User Inputs
3d ModelPerformance GoalsGoal Priorities Window Uniformity Scheme Times of Interest Location and Weather
Calculated Inputs
Performance-Based MetricsSimple Building Data ModelPerimeter Zone Weights Window-Sensor WeightsWindow GroupsCustomized Daylighting Database
Fuzzy Sets
userPrioritysensorPerformanceilluminancePerformancedistanceFromGoalglarePerformanceactionResult
Rule Base 1:Determine priority of each sensor.
userPriority and sensorPerformance for each sensor
Rule Base 2:Determine desiredperformance change oneach sensor.
sensorPriority for each sensor
illuminancePerformance,distanceFromGoal, and
glarePerformance for each sensor
Rule Base 3:Evaluate each action to determine if it could produce desired change(s).
desiredChange for each sensor
Customized Daylighting Database
Rule Base 4:Rank all actions based on predicted effect on all sensors.
goodForSensor for each action and sensor pairsensorPriority for each sensor
Perimeter Zone WeightsWindow Groups
actionResult for each action
Figure 5.19: Schematic diagram of the fuzzy rule sets and their inputs and outputs.
98

This rule set is fired once for each sensor plane. The rules in this rule base are:
1. IF SensorPriority is High AND SensorType is Illuminance AND IlluminancePerfor-mance is TooLow:
(a) IF distanceFromGoal_Low is Far, THEN DesiredChange is “Increase illumi-nance by a large amount.”
(b) IF distanceFromGoal_Low is Close, THEN DesiredChange is “Increase illumi-nance by a small amount.”
2. IF SensorPriority is High AND SensorType is Illuminance AND IlluminancePerfor-mance is TooHigh:
(a) IF distanceFromGoal_High is Far, THEN DesiredChange is “Decrease illumi-nance by a large amount.”
(b) IF distanceFromGoal_High is Close, THEN DesiredChange is “Decrease illumi-nance by a small amount.”
3. IF SensorPriority is High AND SensorType is Glare AND GlarePerformance isTooHigh, THEN DesiredChange is “Decrease glare.”
5.7.3 Rule Base 3: Evaluate Actions
The third set of rules determines whether a given action is likely to produce the desiredperformance change (calculated in Rule Base 2). These rules are fired once for each poten-tial design change and for each sensor plane.
The rules in this rule base are:
1. IF SensorType is Illuminance:
(a) IF DesiredChange is “Increase illuminance by a large amount” AND ActionRe-sult is LargeIncrease, THEN actionPrediction is GoodForSensor.
(b) IF DesiredChange is “Increase illuminance by a small amount” AND ActionRe-sult is SmallIncrease, THEN actionPrediction is GoodForSensor.
(c) IF DesiredChange is “Decrease illuminance by a large amount” AND ActionRe-sult is LargeDecrease, THEN actionPrediction is GoodForSensor.
(d) IF DesiredChange is “Decrease illuminance by a small amount” AND Action-Result is SmallDecrease, THEN actionPrediction is GoodForSensor.
99

2. IF SensorType is Glare:
(a) IF DesiredChange is “Decrease glare” AND ActionResult is LargeDecrease,THEN actionPrediction is GoodForSensor.
If the sensor is a glare sensor, the value GoodForSensor is used as is. If the sensor is anilluminance sensor, the value of GoodForSensor is calculated using Sugeno-style inference(Sugeno, 1985). Using this method, the output of each fuzzy rule from 1a through 1d is rep-resented by a single value. These values are then added together to represent a weightedapproximation of how the proposed change will affect the sensor in all possible ways.
5.7.4 Rule Base 4: Rank All Actions
The final rule base allows the system to rank all the actions based on the predicted effects ofeach action, the sensor priorities, the window groups, and the sensor weights. The generalalgorithm used is:
• For all possible design actions:
– For all sensors:
* Calculate for the design action and sensor: actionRank[sensor] = (sensor-Priority) x (GoodForSensor) x (sensorWeight for relevant facade)
– Find the total actionRank value when summed over all sensors.
The final step is to sort the set of design actions from highest to lowest actionRank. The firstdesign actions in the list will be those actions most likely to produce positive performanceresults in the current design, while those actions at the end of the list are likely to decreaseoverall performance.
5.8 An Example Scenario
This section demonstrates an example design scenario with expert system results. Themodel used in this example is shown in Figure 5.20. There are two illuminance sensorplanes, each with different goals.
100

West Sensor South Sensor
Figure 5.20: Example model with two illuminance sensors.
The major inputs are:
• Performance Goals:
– West Sensor - Illuminance range: Maximum 800 lux desired, 1000 lux accept-able; minimum 200 lux desired, 0 lux acceptable.
– South Sensor - Illuminance range: No maximum; minimum 500 lux desired, 400lux acceptable.
• Goal Priorities:
– West Sensor - 1 (higher priority)
– South Sensor - 2 (lower priority)
• Window Uniformity Scheme: Windows can look different from other windows onthe same facade.
• Times of Interest: Full year
• Location: Boston, MA
• Performance calculated by the simulation engine:
– West Sensor - 40% in range, 59% too high, 1% too low
– South Sensor - 90% in range, 0% too high, 10% too low
Due to the location of sensors within the space, the customized daylighting database forthe west sensor contains only information about the west zone. The customized databasefor the south sensor contains information about the south and west zones (with the southzone information weighted more heavily).
101

West Window Group
South Window Group
Figure 5.21: Example model with window groups highlighted.
Based on the goals, current performance, and geometry of this scenario, the expert systemproposes to change only those windows indicated in Figure 5.21. The first eight proposedchanges are calculated to be (in order of likelihood to improve performance):
1. Add an overhang to the west window group.
2. Decrease the area of the west window group.
3. Add fins to the west window group.
4. Make the west window group glazing more translucent.
5. Make the west window group glazing less transmissive.
6. Add an overhang to the south window group.
7. Decrease the area of the south window group.
8. Add fins to the south window group.
These design changes all focus on decreasing the illuminance on the West sensor in orderto improve its performance.
5.9 Chapter Summary
This chapter discussed the logic used by the expert system in order to determine whichdesign changes to suggest to a user based on a given design scenario and a given set ofperformance criteria. The expert system uses fuzzy logic instead of classical logic in orderto better emulate the human thought process.
This chapter outlined the various inputs used by the system in order to make decisions,including user goals and preferences, model and sensor geometry, and a customized
102

database of daylighting-specific information created from the knowledge base describedin Chapter 4. Fuzzy variables and rule sets are used in order to deal with multiple sets ofgoals and different levels of goal priorities. The output of the fuzzy rule set is a rankedlist of possible design changes which are likely to improve the daylighting performanceof the current design. In situations where a user allows the system to create non-uniformfacades, the system also selects a subset of windows on each facade which are most likelyto affect the higher priority sensors.
The fuzzy expert system has been designed to be a flexible system which has the capabil-ities to deal with a wide variety of design scenarios, including different types of buildingfootprints and various combinations of illuminance and glare goals, including possiblyconflicting goals. The system has also been designed to allow for user interaction so asto be compatible with the architectural design process. A performance evaluation of theexpert system as an algorithm which can improve performance in the absence of user in-teractivity will be discussed in Chapter 7. Assessment of the system of as a design tool willbe described in Chapter 8.
Chapter 6 will discuss the implementation of the expert system using SketchUp and willdemonstrate the expert system user interface.
103

104

Chapter 6
System Implementation
6.1 Introduction
One of the main goals of this thesis was to develop a daylighting expert system whichcould be fully integrated into the architectural design process. To enable this integration,it was necessary to create a functional tool which allows users to interact with the expertsystem during the design process. This chapter describes the overall system structure ofthe tool and the user interface which connects the user to the system.
This chapter also describes several key features which enable the user to efficiently and ef-fectively design with the tool. One important feature of the system is to allow the designerto analyze his or her own initial design using a 3d model that he or she created (instead ofa generic box model). Another important feature is that if the user elects to make a designchange during the expert system process, the system will automatically make the appro-priate change to the 3d model. To implement these two features, a simple building datamodel was developed which allows the expert system to correctly interpret the geometryof the user’s model. This chapter describes the building data model structure, the logic forits population, and the logic for automated design changes.
6.2 System Structure
The expert system tool was developed as a part of the original Lightsolve project (Ander-sen et al., 2008) and has been integrated into the Lightsolve system. The general systemstructure is shown in Figure 6.1. Google SketchUp (Google, 2008) is used as the 3d mod-eler, and the embedded Ruby application programming interface (API) within SketchUpis used to create the pop-up interfaces which allow the user to enter the initial inputs
105

3d Modeler(SketchUp)
Pop-Up Interfaces(SketchUp)
GOOGLE SKETCHUP ENVIRONMENT
Rendering and Simulation (LSV
Engine)
Automated Building Model Population
(Ruby)
Goal-Based Metrics Calculation (Ruby)
EXPERT SYSTEM (Ruby)
User Interface (Adobe Flash)
Automated Design Changes (Ruby)
User Initiates Process
3d Model
Illuminance and Glare Data
Goal-Based Performance
UserPreferences
Building Data Model
Performance Data &List of Suggested Design Changes
Renderings of Views
User Selects Design Change to Try
User Selection
Command to Change Design
3d Model & Performance Goals
ORIGINAL LIGHTSOLVE
Figure 6.1: Schematic diagram of expert system structure and process
106

and to perform the major processes and calculations. The LSV simulation engine (section4.2.2) is a stand-alone executable which is called directly from within the SketchUp/Rubyenvironment. The user interface has been implemented using Adobe Flash and communi-cates with SketchUp by sending commands through the SketchUp Bridge (labs.plugins.ro,2006).
The expert system process is initiated from within the Google SketchUp modeling envi-ronment, where the user creates an initial 3d model and specifies his or her goals andpreferences using the pop-up interfaces shown in section 5.5.1. The 3d model is used bythe LSV simulation engine to create renderings of views from within the model and tocalculate full-year, climate based illuminance and glare (DGPm) on all sensor planes. The3d model is also used to populate a simple building data model (described in section 6.4).The goal-based performance metrics are then calculated using information about the user’sgoals and data from the LSV engine.
The goal-based performance data, the building data model, and the user’s preferences areall used as input into the expert system (described in section 5.5.1). Once the expert systemhas determined a list of possible design changes to suggest to the user, the interface dis-plays this information, along with performance data and renderings of views. Using theinterface, the user selects a design change to make to his or her design. The system thenautomatically makes three different models, each representing a different magnitude ofthe selected design change (for example, the window area may increase by 10%, 20%, and30%). The logic regarding the calculation of these magnitudes of change will be discussedfurther in section 6.4.2. Each of these three models is then simulated and the expert systemis used to produce a new list of suggested design changes for all three models. This in-formation is then displayed in the user interface, where the user will first select one of thethree models to accept before selecting the next design change. The process will continueuntil the user’s goals are met or until the user ends the process.
6.3 User Interface
The user interface for the expert system is shown in Figures 6.2, 6.3, and 6.4. There are fourmajor components to the interface:
• Views of the current design: In this window, the user can scroll through four dif-ferent views of the current design (southeast, southwest, northwest, and northeastviews). The images of the views indicate the user’s current design choice and areupdated to display any design changes that occur during the process.
• Temporal maps of all illuminance and glare sensor planes: In this window, the usercan scroll through all available temporal maps. Like the views of the current design,the temporal maps are updated at each design step to display current performancedata.
107

Figure 6.2: Expert system user interface after first run. The user may choose to make thefirst suggested design change (“Make the South windows larger”) or to skip to a differentsuggested design change.
108

Figure 6.3: Expert system user interface after one design step (south windows were in-creased). The user must choose one of the three different magnitudes of change indicatedin the interactive graph.
109

Figure 6.4: Expert system user interface after four design steps. The progression of designsexplored during the process is shown in the interactive graph.
110

• Suggested design changes: This window displays one design change at a time, inorder of highest rank (most likely to improve performance) to lowest rank (Figure6.2, lower right section of interface). The user can choose to skip ahead to select de-sign changes that appear later in the list, and they can go back to select an earlier one.Once the user selects a design change, that change will automatically be applied tothe model in SketchUp for three different magnitudes (for example, three differentoverhang lengths will be tried). In situations where the user has allowed the expertsystem to change individual windows on a facade (instead of keeping all windowsuniform), the edges of those windows that are to be changed are highlighted in yel-low (Figure 6.2).
• An interactive graph indicating the performance of the design over all design iter-ations: This window allows the user to view the performance of each sensor plane(averaged over all relevant times and seasons) in a bar as well as the average of allsensor plane performances together as a dot. After the user selects to make a designchange, the results for the three different magnitude of change are shown in this win-dow (Figure 6.3). The user will select which of the three magnitudes he or she prefersby clicking on the dot which refers to the preferred design (at this point, that dot be-comes filled in). As the process continues, this graph will display the progression ofdesign changes selected by the user along with the performance of each new design(Figure 6.4). At any point during the process, if the user selects one design iterationin this window (by clicking on the appropriate dot), the rest of the interface will au-tomatically update to display the information specific to that design. The user cango backwards to a previous design iteration simply by selecting the dot that refers tothat design.
The user interface supports the design process described in section 3.5 by providing theuser with clear views of the current design and by allowing the designer to browse per-formance information in an intuitive way. The user is able to see the progression of his orher design using the interactive graph and can quickly move between previous iterationsof the design and the current version. The suggested design changes are specified in regu-lar language that the designer can easily understand. The automatic generation of designchanges along with the intelligent design suggestions allow the user to efficiently explorethe design space and identify designs with improved performance.
6.4 Building Data Model
The simple building data model used by the expert system (section 5.5.2) allows the systemto understand the geometry and materials of the user’s design. Using this model, thesystem knows which shading devices belong to which windows, what type of glass isused for a given window, how many windows are on a given facade, and so on. Thebuilding data model is not only important to the expert system logic itself, but it also
111

enables the expert system tool to determine the design boundary conditions and makeautomated design changes. The following sections describe the logic used to populatingthe building data model and for automating the design changes.
6.4.1 Logic for Automated Model Population
The expert system process begins with a user-defined 3d model. The user may modelalmost any initial design, as long as the model meets the guidelines described in AppendixA. Assuming these guidelines are met, the logic used to identify each element is as follows(assume all elements are faces):
1. If the face is called “GLASS_[name]”, it is a window.
2. If the face is opaque and called “EXTERNAL_[name]”, it is a shading device.
(a) If the normal points up or down, it is an overhang.
(b) Else, it is a fin.
3. If the face is opaque and not called “EXTERNAL_[name]”.
(a) If the normal points up, it is a floor.
(b) If the normal points down, it is a ceiling.
(c) Else, it is a wall.
4. If the face is called “SENSOR_[name]”, it is a sensor plane.
(a) If it is called “GLARE_SENSOR_[name]”, it is a glare sensor.
(b) Else, it is an illuminance sensor.
Once the individual building elements have been identified, a second set of logic is usedto determine the appropriate relationships between elements. This logic determines thechild-parent relationships between walls and windows and between windows and shad-ing devices. The logic for determining these relationships is as follows:
1. Assigning windows to walls: For each window, cycle through all walls. If both ele-ments have the same orientation, and if the window location lies between the edgeboundaries of the wall, assign that window to that wall.
2. Assigning shading devices to windows: For each shading device, consider each win-dow and if two vertices of the overhang are located 1 inch [0.025 m] or less from twovertices of the window (top two vertices for overhangs, right or left vertices for fins),assign that shading device to that window. A given window may have at most oneoverhang and two fins.
112

3. Assigning glare sensors to sensor groups: Cycle through all glare sensors. Any glaresensors that have the same material name are assigned to a glare sensor group.
Once the building data model has been populated, the system will also calculate the sen-sor perimeter zones, window-sensor weights, and window groups as described in section5.5.2. A new building model is created every time the original model changes, either man-ually by the user or automated by the system.
6.4.2 Logic for Automated Design Changes
Each time a user selects a design change from the expert system interface, the system willautomatically produce three new models, each with a different magnitude of change. Acritical set of calculations during this part of the process is the determination of the maxi-mum change allowed, given the geometry of the original model. The system assumes thatthe general massing model will stay the same while the facade elements may change, so itis important to ensure that a given design change does not result in windows are locatedoutside the facade boundaries or windows that overlap each other.
The system also determines if a given design change can legally be applied to a model. Ifa design change cannot be applied to the design, that design change will not be displayedin the user interface. For example, if the design change is “move windows to the southend of the facade,” but the windows are already located as far south as is possible giventhe geometry of that facade, then the design change will be removed from the list that isdisplayed to the user.
The determination of the maximum change allowed is calculated based on the windowgroups described in section 5.5.2. The system assumes that a given design change willbe made to all windows in a window group. Windows that are on the same facade as awindow group but not included in that group are considered as boundary conditions.
The following sections describe the logic used to calculate the maximum change allowedand the three different magnitudes of change for all available design change options.
Aperture Location on Facade
Four different design changes involving translation are possible: moving windows higher,lower, right, and left on the facade. Shading devices associated with the window groupare translated as well.
To determine the three different magnitudes of change, the system first calculates themaximum possible translation. The maximum translation is that which results in thewindow group being located 2 inches [0.05m] from either the facade boundary or anotherset of windows. The maximum translation is then divided by three. For example, if it ispossible to move a window group 3 ft higher on the facade, the system will create threemodels with 1ft, 2ft, and 3ft translation.
113

Window Distribution
Two changes are available based on window distribution: moving windows in a windowgroup closer together or further apart. Shading devices associated with the windows aremoved as well. The system recognizes that windows may not be spaced uniformly onthe facade, so it attempts to retain the original characteristics of the window spacing bymaintaining the same relative distance between each set of adjacent windows.
To determine the highest magnitude of change, the system determines the maximum pos-sible change in distribution. The maximum change in distribution is that which resultsin the windows in the window group being located 2 inches [0.051 m] from each other (ifthey are moving closer together) or two inches from the facade boundary or another set ofwindows. The maximum translation is then divided by three.
Aperture Aspect Ratio
The two available aspect ratio (height-to-width ratio) design changes are: increasing theratio (narrower windows) or decreasing the ratio (wider windows). This change involveschanging the aspect ratio of all windows in the window group while keeping the originalarea of each window the same. Shading devices are also scaled appropriately.
The maximum possible change is that which allows all windows to fit on the facade with-out overlapping each other and without moving beyond the facade boundary conditions.The maximum change is divided by three to determine the three different magnitudes ofchange. For example, if it is possible to make a window 60% wider, the system will createthree models with increasing wideness of 20%, 40%, and 60%.
Total Number of Apertures
Changing the total number of apertures involves either increasing or decreasing the num-ber of windows in a window group while keeping the same total area of the group and thesame aspect ratio of each individual window. This change assumes that all windows arethe same general size and shape. Shading devices are also removed or added along withthe windows.
For this change, the system assumes that it will add or subtract one window per designchange. For example, if the window group begins with 2 windows and the design changeis to increase the number of windows, the system will create three models with 3, 4, and 5windows respectively.
Total Area of Glazing
Two options are available for changing the total window area: increasing the area anddecreasing the area. This change assumes that the area of each window in the windowgroup will change while the aspect ratio of each individual window will stay the same.Shading devices are also scaled appropriately.
The system calculates the maximum amount that it can increase windows based on thelargest window that it can create without having the windows overlap or move outside the
114

facade boundary. The system assumes that the maximum amount it can decrease the areaof all windows is 100%, i.e. the final magnitude of change will be to remove the windowscompletely. The three magnitudes of change are calculated by dividing the maximumamount of change by 3. Therefore, if the system is decreasing the area of a window group,the three magnitudes of change will always be 33%, 66%, and 100% smaller. If the systemis increasing the area of a window group, and the maximum amount is calculated to be30%, it will create three models with 10%, 20%, and 30% increases in area.
Glazing Type
Four possible design changes are available which involve glazing type: increase transmis-sivity, decrease transmissivity, make more translucent (as opposed to transparent), or makeless translucent. All window glazing is defined using a percentage of “regular” (specular)transmissivity and a percentage of diffuse (translucent) transmissivity.
The maximum possible total transmissivity is allowed to be 90% and the minimum allow-able transmissivity is 5%. The maximum allowable percentage of regular transmissivity is100% (completely clear transparent glass) and the maximum allowable percentage of dif-fuse transmissivity is 100% (completely translucent). For example, if the current glazingis 60% clear glass and the design change is “increase transmissivity”, the three new mod-els will have glass with 70%, 80%, and 90% transmissivity, all clear glass. If the currentglazing is 60% regular glass and the design change is “increase translucency”, the threenew models will have glass with a total transmissivity is 60%, but the ratio of diffuse tospecular transmission will be 0.33, 0.66, and 1.0.
Shading Devices
Four possible design changes involve shading devices: increasing or decreasing the lengthof horizontal overhangs and increasing or decreasing the length of vertical fins. In thecurrent version of the system, the maximum possible shading device length that the systemwill create is 4ft [1.2m]; however, it is possible that this value could be adjusted based onthe height of the space or a user-defined limit. The minimum possible length is 0ft, i.e.the shading device is removed completely. The three different magnitudes of change aredetermined by subtracting the current length form the maximum (or minimum) length anddividing by 3. For example, if the current overhang length is 1ft and the design change is“increase overhang length,” then the new models will have overhangs will lengths of 2ft,3ft, and 4ft respectively.
6.5 Chapter Summary
This chapter discussed the implementation of the expert system as a functional designtool with an intuitive user interface. The expert system tool and its interface have beendesigned to be compatible with the architectural design process and to support an efficientand intelligent performance-driven search. The tool includes many key functionalities,including the ability for the designer to model his or her own design (instead of relying
115

on a default model), the ability for the designer to interact with the system by choosingwhich design changes to try and which magnitude of change to accept, and the ability forthe designer to clearly understand the performance of his or her design over a series ofdesign iterations. A study which demonstrates the user compatibility of the tool has beenconducted and will be described in Chapter 8.
This chapter also discussed the simple building data model used by the expert system andthe logic used to automatically populate the data model from a user’s original 3d model.The building data model is a critical component of the system as it contains informationabout the user’s geometry and materials which is used by the expert system rule base tohelp it determine which design changes to suggest to the user. This information is alsoused by the system to determine the maximum possible design change that it can make toa given model and to calculate the three different magnitudes of change that the systemwill attempt.
Chapter 7 will describe the validation of the expert system performance when comparedto that of a genetic algorithm for a variety of case studies.
116

Part III
Results
117

118

Chapter 7
Expert System PerformanceEvaluation
7.1 Introduction
The main function of the expert system described in this thesis is to effectively guide auser towards improved daylighting performance of an original design. It is of criticalimportance that users have confidence in the advice given to them by the system, so a highlevel of performance is requisite. Although the expert system differs from a traditionaloptimization algorithm due to its domain-specific and user-interactive nature, it should becapable of performing similarly to an optimization algorithm in a best case scenario.
In order to assess the behavior of the expert system, a series of case studies were com-pleted which compare the performance of designs found using the expert system to high-performing benchmark designs generated using a genetic algorithm, a popular optimiza-tion method. The case studies include problems with a variety of initial conditions andgoal criteria, ranging from a single performance goal for a simple box model to multipleperformance goals in more complex models.
Two additional short studies were completed to demonstrate the relationship between theexpert system behavior and the facade design or constraints imposed by a user. The firstof these two studies demonstrates how performance may be related to the specificity ofthe initial facade designed by the user. The second study considers how performance maybe affected by the window uniformity scheme selected by the designer.
The goal of the case studies described in this chapter is to examine a variety of different sce-narios and to determine the strengths and limitations of the expert system as an algorithmwhich can effectively work towards finding improved performance. For all case studies,the user-interactive element of the expert system was removed to allow for fair and consis-tent comparisons of results. The performance of the expert system when user-interactivityis allowed will be discussed in Chapter 8.
119

This chapter describes the genetic algorithm which was implemented for the major setof case studies and present the case study results in order of increasing levels of designproblem complexity. This chapter also presents an analysis of the performance and be-havior of the expert system based on the various case studies considered. The chapterconcludes with a general discussion of the strengths and limitations of the expert systemas a performance-driven algorithm.
7.2 Comparison Study: Expert System vs. a Genetic Algorithm
This section presents the major set of case studies used to evaluate the performance of theexpert system. In each case study, the performance of a “best case” design generated by theexpert system is compared to a “best case” design generated by an optimization algorithm.Due to the generic nature of the expert system, which allows the user to input almost anyinitial design and set of performance goals, it is difficult to precisely determine the overallperformance of the expert system algorithm. The purpose of this set of case studies is thusto demonstrate the behavior of the expert system over a selection of problems with a rangeof initial design geometries and performance goals.
For this study, it was necessary to choose an optimization algorithm which would be ap-propriate for comparison with the expert system. The genetic algorithm (GA) was chosenfor a number of reasons, particularly because the GA has been previously used for a widevariety of building-related problems (see section 2.2 for examples). Additionally, the GAis one which is similar to the expert system as it is a generic algorithm, one which can beapplied to a large assortment of initial designs and performance goal scenarios withoutneeding to be customized. Finally, the GA is one which is known to be consistent, reliable,and does often not get trapped in local minima or maxima. While the GA may not alwaysfind the global minima or maxim, it will always provide a very good benchmark.
The GA is an algorithm which works by imitating the process of natural evolution. Duringthe GA process, a set of initial solutions (a population) is chosen or generated at random.Each member is evaluated for “fitness” (performance) and members that result in goodperformance are used as “parents” for a new generation. Parent members are combinedusing a genetic operator called crossover to create a new generation of “child” memberswhich have characteristics of the parent members. Since this new generation is based onthe best performing solutions in the previous solutions, it is assumed that some membersof the new generation will perform better. Once evaluated, again the good performers areused as parents while the poor performers are discarded. The cycle is continued until asuitable solution or set of solutions is found or until a predetermined number of genera-tions have been completed.
Multi-objective GAs work in a similar way except that in these cases, one might considertwo or more objectives which are conflicting. In such cases, increasing the fitness of oneobjective may decrease the fitness of another, which means that a single optimal solution
120

for all objectives may not exist. Instead, it is traditional to try to find the Pareto front,which is the set of all solutions in the solution space that are non-dominated, or Pareto-optimal. If for a given solution, one can find another one within the solution space that isbetter for both objectives, that solution is considered strongly dominated. Pareto-optimalor non-dominated solutions are those which are not dominated by any others within thesolution space.
7.2.1 A Micro-Genetic Algorithm
GAs typically require large population sizes and numbers of generations to converge, par-ticularly for multi-objective problems where the desired result is not a single solution but aset of Pareto-optimal solutions. The GA used for the case studies described in this chapterwas a micro-genetic algorithm (micro-GA), a GA which uses a very small population sizewhen compared to a classical GA. This small population size reduces the computationaltime necessary to simulate each generation, which means that several generations of themicro-GA can be run using the same number of simulations as a single generation of aclassical GA. Micro-GAs have also been shown in some studies to require fewer total func-tion evaluations than a classical GA to converge to the near-optimal region (Krishnakumar,1989; Carroll, 1996). For this thesis, the micro-GA was selected because the LSV engine re-quires a relatively large amount of time necessary for to complete one climate-based, fullyear daylighting simulation (1-5 minutes on the author’s computer).
Micro-GAs have been successfully implemented for building performance optimizationbased on building energy criteria, lighting, and thermal behavior (Caldas and Norford,2002; Caldas, 2008). The micro-GA system implemented for this thesis can be used forboth single- and multi-objective problems. The single-objective problem considers illumi-nance or glare only, while the multi-objective problem considers two conflicting illumi-nance goals at once or both illuminance and glare.
7.2.1.1 Single Objective Micro-GA
Single-objective optimization problems aim to optimize a single function, i.e. those whichhave a single performance goal. Problems which have multiple non-conflicting goals mayalso be modeled as single-objective problems by averaging or adding the performance ofall goals into a single function. The single-objective micro-GA used in this thesis is theoriginal algorithm as described by Krishnakumar (1989), encoded using binary strings.The process is as follows:
1. Generate a random population of five binary strings.
2. Evaluate fitness and carry over best string into the next generation (elitist strategy).
121

3. Use deterministic tournament selection for adjacent pairs to select remaining fourstrings for reproduction, i.e. the member of each pair with the best fitness is used toproduce the next generation. The current best string is also allowed to compete.
4. Apply uniform crossover with no mutation. This strategy creates two child stringsfrom two parent strings by swapping individual bits with a probability of 0.5.
5. Check for bitwise convergence (which occurs when all strings differ by 5% or less).If converged, keep best string and randomly generate 4 new ones.
6. Go to step 2.
A micro-GA differs from a traditional GA in several ways. The most obvious is the smallpopulation size, which tends to cause the micro-GA population to reach bitwise conver-gence within only a few generations. At this point, the micro-GA resets the populationby creating a new random population. It is of note that this algorithm does not use muta-tion, as it is assumed that enough diversity will be maintained in the population throughthe generation of new random strings upon bitwise convergence, which is likely to occurnumerous times during the optimization process.
For the single-objective case studies described in this thesis, fitness is defined as the goal-based illuminance for a single sensor plane or the goal-based glare for a glare sensor array.For problems which have multiple goals that are not considered to be conflicting, fitnessis defined as the average goal-based illuminance or glare over multiple sensor planes. An“optimal” solution will be one in which fitness is found to be 100%, which indicates thatthe performance goals are met over 100% of the sensor plane area and over 100% of thetime during a year. For a simple problem, it may be possible that multiple solutions withinthe solution space meet the goal criteria (an example of this phenomenon is described insection 7.2.4).
7.2.1.2 Multi-Objective Micro-GA
For problems in which multiple conflicting performance goals are considered, a multi-objective algorithm is required. The micro-GA has previously been successfully used formulti-objective problems by including external memory which stores non-dominated so-lutions generated over the course of the process (Coello and Pulido, 2001). For this study,the algorithm used is similar to that described for single-objective problems (Krishnaku-mar, 1989), with the addition of an external memory similar to that described by Coelloand Pulido (2001). A binary Pareto fitness ranking is used, and at each step, the memoryis updated to include new non-dominated solutions, and any previous solutions whichare dominated by new ones are then removed. A pseudo-Pareto front is approximated bythose solutions contained within the external memory after a certain number of genera-tions. The multi-objective process is essentially the same as the single-objective process
122

except it works towards finding non-dominated solutions instead of working towards asingle solution with the highest fitness.
It is important to note that while this process does produce a set of non-dominated so-lutions which may approximate the Pareto front, it does not necessarily generate a truePareto front with evenly distributed solutions. However, as this study aims only to evalu-ate the performance of the expert system and not to find true Pareto fronts, it is assumedthat an approximated Pareto front will still provide an adequate level of accuracy for com-parison purposes.
7.2.2 Micro-GA System Description
The micro-GA was implemented into the Lightsolve system so that results from both themicro-GA and the expert system could be directly comparable. The micro-GA was createdto have the same or similar features to the expert system in the following areas:
• 3d Modeling - Both systems use Google SketchUp to model the geometry and mate-rials of the design.
• Performance Goals - Both systems require illuminance and glare sensors to be mod-eled within the 3d model and require the user to input performance goals in the in-terfaces described in section 5.5.1. Calculation of the goal-based performance metricsis the same for both systems.
• Simulation Engine - Both systems use the Lightsolve Viewer (LSV) simulation andrendering engine.
• Design Variables - Both systems consider the same ten variables. The expert systemallows two directions of change for each variable (for example, the system mightsuggest to increase or decrease the area of windows). The micro-GA system allowsa range of possible values as indicated in Table 7.1. The full set of values is encodedinto a string of 30 bits for each separate facade considered.
7.2.2.1 Micro-GA System Process
The process of using the micro-GA system is as follows:
1. A massing model is created with sensor planes modeled. This massing model staysthe same through the process while the facades are generated by the system. Theinitial massing model should not have any windows modeled.
2. The performance goals are input using the interfaces shown in section 5.5.1.
123

Façade Parameter Min Max StepWindow-to-Wall Ratio 0.1 0.8 0.1Number of Windows 1 8 1Aspect Ratio* Thinnest Widest -
Vertical Location* Lower Bounds
Upper Bounds -
Horizontal Location* Right Bounds
Left Bounds -
Window Distribution* Windows Touching Far Apart -
Overhang No Yes -Fins No Yes -Length of Shading Devices 0.5ft 4ft 0.5ftTotal Glass Transmissivity 10% 85% 5%Percent (Specular) Transmission 0% 100% 12.5%
* Absolute values of max and min for these parameters will depend on user-defined geometry
Table 7.1: Design parameters used in the micro-GA system
3. The system generates a random initial population of binary strings.
4. 3d model representations of each binary string are created using the logic describedin section 7.2.2.2.
5. The population is simulated using the LSV engine. Goal-based performance metricsare calculated for each member of the population.
6. The micro-GA uses the results of the previous generation and their binary strings togenerate a new population of binary strings.
7. Return to step 4 and repeat until the fixed number of generations is completed.
7.2.2.2 Micro-GA Model Generation
The micro-GA system created for this thesis automatically generates 3d model represen-tations of the binary strings created during the GA process, i.e. it creates and saves newSketchUp models for all population members. Like the automated design changes de-scribed for the expert system in section 6.4.2, the micro-GA system uses a simple buildingdata model based on the original massing model in order to understand the dimensions ofeach building element (section 6.4).
The generated models are created using the following process (steps 1-5 are demonstratedfor an example facade in Figure 7.1):
124

Step 0Original Facade
Step 1Add single window
Step 2Divide into correct number of windows
Step 3Change height-to-width ratio
Step 4Change window distribution
Step 5Change vertical and horizontal location
Figure 7.1: First five steps used to generate models in the micro-GA system
125

1. Add a single window of the given window-to-wall ratio (window area) to the facadeusing the width as the wall itself to ensure fit.
2. Divide into the given number of windows.
3. Calculate the highest and lowest possible aspect ratios that the windows can takebased on the window size and wall dimensions. Change aspect ratio of all windowsbased on given value.
4. Calculate the largest distance that can exist between each window based on windowsize and wall dimensions (assume smallest distance is 2 inches [0.05 m]). Changedistribution based on given value.
5. Determine upper, lower, left, and right wall boundaries. Change window grouplocation based on given value.
6. Add shading devices of the given length, if applicable.
7. Change window material given values.
Because the geometric parameters (window aspect ratio, location, and distribution) arecalculated based on the boundary conditions of a given facade instead of being based onabsolute values, the proposed approach can generate models using any type of originalmassing geometry that features vertical walls facing cardinal directions. This limitation isthe same as that of the expert system.
7.2.3 Case Study Procedures
A set of study procedures was developed to more appropriately compare results from theexpert system to the GA, given their differences in algorithm type. While a GA is one thatgenerates designs, the expert system always assumes that an initial design is given andsuggests design changes based on the current design. The following procedure was usedfor each algorithm type:
Micro-GA
An initial massing model with no windows was used to create a new model of each designgenerated by the micro-GA. The algorithm was run either until a perfect solution wasfound or for ten generations before stopping. If a perfect solution was not found, the bestdesign was considered that with the highest performance found over all generations.
Expert system
An initial model was created with generic rectangular windows. To avoid starting out witha design whose performance was very poor or very good, all initial models were designedto have mediocre performance (between 40% and 60%). For these case studies, a “perfectuser” scenario was used. The “perfect user” was defined as one who would select the
126

Example Case Study - Performance of First Four Design Iterations
0%
20%
40%
60%
80%
100%
0 1 2 3 4Design Step
Per
form
ance
(%
)
Original ModelStep 1:
Shorten South Overhangs
Step 2: Increase South Window Area
Step 3: Shorten East Overhangs
Step 4: Move East
Windows Up
49.0% 57.4%
69.6%
BEST: 78.9%
BEST: 94.9%
55.3%
24.6%
96.0%
96.5%
BEST: 96.7%
BEST: 98.1%
97.7%
96.1%
0 1a 2a 3a 4a
1b 2b 3b 4b
1c 2c 3c 4c
01a
1b
1c2a
2b
2c
3a-c 4a-c
Figure 7.2: The performance and designs of the first four design steps of an example prob-lem. The performance goal considered is a wide illuminance range (described further ascase study #4). The “perfect user” selections are 1c, 2a, 3c, and 4a.
127

(a) Massing Model with Illuminance Sensor (b) Massing Model with Glare Sensors
Figure 7.3: Box massing model for case studies 1 through 5 with (a) illuminance sensor inthe core zone or (b) glare sensors in the core zone with a view towards south
first suggested design change at each iteration and the best performing magnitude of eachdesign change. The “perfect user” scenario was also one in which the process was allowedto continue even if performance decreased after a given design iteration. The algorithmwas run until a perfect solution was found or for ten design iterations before stopping. Aswith the GA study, if a perfect solution was not found, the best design was considered thatwith the highest performance found over all completed iterations. The first four steps ofan example case study (which will be discussed further as case study #4) are indicated inFigure 7.2, along with the performance and look of each generated model. In this example,for the “perfect user” scenario, the models chosen at each step were: 1c, 2a, 3c, 4a. Afterfour steps, the best performing design found is 4a.
For the case studies which involved multiple conflicting goals, it was not possible to selecta “best” performing design from either the GA or the expert system. In these cases, anapproximate Pareto front was created by the multi-objective GA to demonstrate the rangeof possible designs and their performances for each of the conflicting goals. The designproduced by the expert system were compared with those along the approximated Paretofront.
For all case studies, the window uniformity scheme selected for the expert system was“uniform facades.” This selection ensured that the designs generated by the expert systemwould be comparable to those generated by the micro-GA, as the micro-GA was imple-mented such that all windows on the same facade would have the same properties (area,aspect ratio, glazing type, and shading devices). A short study which considers the effectof allowing the expert system to create non-uniform facades is described in section 7.3.2.
7.2.4 Single Performance Goal Case Studies
This section describes five simple case studies which each have a single performance goal.Each of these five case studies considers a box model with the same dimensions as thebase model used to create the knowledge base results (described in section 4.2.4). For
128

PerformanceGoal
Expert SystemStarter Design
Expert SystemBest Design
Micro-GABest Design
Case Study #1
Maximum Illuminance Only
Case Study #2
Minimum Illuminance Only
Case Study #3
MaximumGlare Threshold
Case Study #4
Wide Illuminance Goal Range
Case Study #5
NarrowIlluminance Goal Range
50.5% In Range 100.0% In Range 100.0% In Range
49.5% In Range 100.0% In Range 99.4% In Range
60.1% In Range 100.0% In Range 98.0% In Range
49.0% In Range 99.8% In Range 99.9% In Range
49.2% In Range 94.4% In Range 97.3% In Range
Figure 7.4: Comparison of best performing final designs from the expert system and micro-GA for case studies #1 through #5
129

the illuminance case studies, a single illuminance sensor plane was modeled in the corezone of the space (Figure 7.3a). For the glare case study, an array of glare sensors wasmodeled in the core zone of the space with a view towards south (Figure 7.3b). The firstthree case studies consider a single threshold (a maximum or minimum allowable valuefor illuminance or glare). The final two case studies consider illuminance ranges (wherethe allowable values include both maximum and minimum values). All case studies wereconsidered for Boston, MA.
The first two case studies were considered validation studies for the micro-GA implemen-tation. In these studies, three different GA runs were completed, resulting in three differ-ent final solutions. These two studies demonstrated that the micro-GA was performing asexpected. In subsequent studies, only a single GA run was completed.
The results of the first five case studies are shown in Figure 7.4. This chart indicates theperformance and the design of three models in each case study: the initial design used bythe expert system (a generic design with mediocre performance), the best design found bythe expert system, and the best design generated by the micro-GA.
7.2.4.1 Case Study #1: Maximum Only Illuminance Goal
The first case study had a single performance goal for illuminance, where the maximumilluminance values were 200 lux (desired) and 400 lux (acceptable); no minimum valueswere specified. All seasons and periods of day were considered. To verify that at leastone design within the solution space was able to meet the desired performance goal, theauthor tested a small number of models manually. Although the author did not examinethe entire solution space, more than one “perfect” solution were found. The designs whichwere found to meet the goal criteria all shared the characteristics of small window areaswith large shading devices. This case study was considered the most basic because manydesigns within the search space meet the illuminance goal range (including a box with nowindows).
Because this study was one of two validation studies for the micro-GA implementation,three micro-GA runs were completed. The micro-GA was highly successful at determiningsolutions to this problem, finding a “perfect” solution on each of the three separate runs,each time within 10 generations (Figure 7.5). The best performing designs from each of thethree runs are shown in Figure 7.6. Because the solution space was known to be highlymulti-modal, it is not surprising that the three solutions found all met the goal criteria yetall had different forms. The different final solutions are due mainly to the fact that eachrun began with a different random initial population, although the probabilistic nature ofthe algorithm contributes to this diversity as well. It is possible that additional runs wouldhave produced even more varied results, although it is likely that any additional solutionswould feature similar characteristics of small window area with large shading devices.
For the comparison case study, the expert system started with a generic design with aperformance of 50.5% within the desired illuminance range, averaged over all times and
130

Case Study #1: Maximum Illuminance Goal - GA
0%
20%
40%
60%
80%
100%
1 2 3 4 5 6 7 8 9 10Generation
Bes
t P
erfo
rman
ce (
%)
Study 1 Study 2 Study 3
Case Study #1: Maximum Illuminance Goal - EXPERT SYSTEM
0%
20%
40%
60%
80%
100%
0 1 2 3 4Design Step
Bes
t Per
form
ance
(%)
Figure 7.5: Case study #1 - Maximum illuminance goal: Performance for the micro-GAand expert system
(a) (b) (c)
Figure 7.6: Case Study #1 - Maximum only illuminance goal: Best performing designs fromthree micro-GA runs
131

Case Study #2: Minimum Illuminance Goal - GA
0%
20%
40%
60%
80%
100%
1 2 3 4 5 6 7 8 9 10Generation
Bes
t P
erfo
rman
ce (
%)
Study 1 Study 2 Study 3
Case Study #2: Minimum Illuminance Goal - EXPERT SYSTEM
0%
20%
40%
60%
80%
100%
0 1 2 3Design Step
Bes
t P
erfo
rman
ce (
%)
Figure 7.7: Case study #2 - Minimum illuminance goal: Performance for the micro-GA andexpert system
seasons. From this initial design, the expert system was able to find a “perfect” solutionvery efficiently, within only 4 design iterations. As indicated in Figure 7.5, the performanceof the expert system design improved at each design iteration, i.e. the expert system neverproposed design changes which made the performance worse in this case study.
The initial and final designs of the expert system are shown in Figure 7.4. It is clear fromthis chart that the design generated by the expert system resembles its starting point designmore than it resembles the design generated by the micro-GA. However, it is clear that boththe expert system and the micro-GA found perfect designs for the maximum illuminancegoal scenario which matched the known solutions, with large shading devices and a smallwindow area.
132

(a) (b) (c)
Figure 7.8: Case study #2 - Minimum only illuminance goal: Best performing designs fromthree micro-GA runs
7.2.4.2 Case Study #2: Minimum Only Illuminance Goal
This case study used the same model and sensor plane as the previous study, but the goalin this problem was to obtain a desired 400 lux minimum (200 lux minimum accepted)with no maximum values. Again, all seasons and periods of day were considered. Aswith the previous case study, the author manually searched a section of the solution spacebefore running the GA to verify that at least one design which met the goal criteria existed.In the small subset of models examined, the author was only able to find one “perfect”solution, although it is possible that more solutions exist. In this case, the known solutionfeatured a large window with a high glass transmissivity and no shading devices. Thiscase study was considered more difficult than the previous one because there were fewerknown solutions within the search space.
In this case study, the micro-GA came very close to finding the known solution after tengenerations but never found one in which the illuminance goals were met over 100% ofthe sensor plane area and over the whole year (Figure 7.7). The most successful of thethree final solutions generated has the same features as the known solution. All three so-lutions feature very large window area (Figure 7.8); however, it is interesting to note thatthe second solution got “stuck” in a search space that only included shaded designs, sothe final solution in this case is the worst performer of the three. It is likely that this solu-tion would have become “unstuck” if the algorithm had been allowed to continue runningfor more generations, which would have introduced new random solutions into the pop-ulation upon convergence. Nevertheless, all three final designs found good designs afteronly a few generations, indicating that the micro-GA was again successful at efficientlyconverging on good designs.
For the comparison case study, the expert system again began with a generic design ofmediocre performance. The initial design had a performance of 49.5% within the illumi-nance goal range, averaged over all times and seasons. As with the first case study, theexpert system was able to find a “perfect” solution very efficiently, within only three de-sign iterations (Figure 7.7), and it was able to suggest design changes which resulted inimproved performance at every design iteration. The final design generated by the ex-pert system has the same characteristics as the known solution and as the best performingmicro-GA design (Figure 7.4).
133

Case Study #3: Glare Threshold - GA
50%
60%
70%
80%
90%
100%
1 2 3 4 5 6 7 8 9 10Generation
Bes
t P
erfo
rman
ce (
%)
Case Study #3: Glare Threshold - EXPERT SYSTEM
50%
60%
70%
80%
90%
100%
0 1 2 3 4 5 6 7Design Step
Bes
t P
erfo
rman
ce (
%)
Figure 7.9: Case study #3 - Glare threshold goal: Performance for the micro-GA and expertsystem
7.2.4.3 Case Study #3: Glare Only Illuminance Goal
In this case study, the same box model was used as with the previous two studies, but theperformance metric considered was glare instead of illuminance. An array of glare sensorswas modeled in the core zone of the model facing south (Figure 7.3b) and the performancegoal for this glare sensor group was to keep glare below the “medium” threshold, i.e.below the value of DGP that corresponds to perceptible glare.
In this case study, the micro-GA generated a design that was 98% in range after ten gen-erations were run. The expert system found a solution that was 100% in range after sevendesign iterations. Both final designs are shown in Figure 7.4. While the designs generatedby the expert system and the micro-GA look very different from each other, they do sharesome similar characteristics in that they both have small windows with shading devices,and windows clustered towards the north end of the east-facing facade.
134
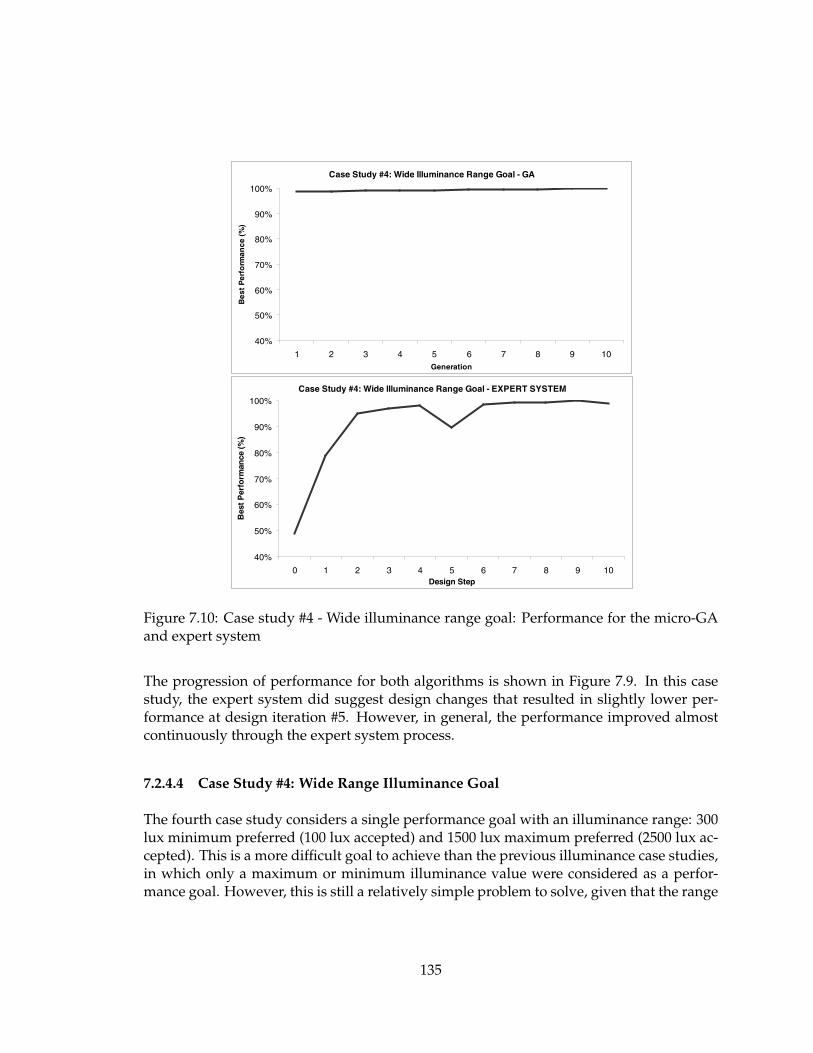
Case Study #4: Wide Illuminance Range Goal - GA
40%
50%
60%
70%
80%
90%
100%
1 2 3 4 5 6 7 8 9 10Generation
Bes
t P
erfo
rman
ce (
%)
Case Study #4: Wide Illuminance Range Goal - EXPERT SYSTEM
40%
50%
60%
70%
80%
90%
100%
0 1 2 3 4 5 6 7 8 9 10Design Step
Bes
t P
erfo
rman
ce (
%)
Figure 7.10: Case study #4 - Wide illuminance range goal: Performance for the micro-GAand expert system
The progression of performance for both algorithms is shown in Figure 7.9. In this casestudy, the expert system did suggest design changes that resulted in slightly lower per-formance at design iteration #5. However, in general, the performance improved almostcontinuously through the expert system process.
7.2.4.4 Case Study #4: Wide Range Illuminance Goal
The fourth case study considers a single performance goal with an illuminance range: 300lux minimum preferred (100 lux accepted) and 1500 lux maximum preferred (2500 lux ac-cepted). This is a more difficult goal to achieve than the previous illuminance case studies,in which only a maximum or minimum illuminance value were considered as a perfor-mance goal. However, this is still a relatively simple problem to solve, given that the range
135

of acceptable illuminance values is fairly wide. To make this case study slightly more spe-cific, only the school schedule was considered (morning through mid-day, autumn throughspring).
In this case study, it is interesting to note that the micro-GA generated an extremely gooddesign in the very first generation (98.5% in range for the times and seasons considered).After ten generations, the micro-GA algorithm was able to find a solution that was essen-tially “perfect” (99.9% in range). This design is shown in Figure 7.4. The expert system wasalso able to find a near-perfect solution (99.8% in range) after ten design iterations. Bothfinal designs feature smaller windows on the south facade and larger windows on the eastfacade, and both designs have small or no shading devices on either facade.
In this case study, it is interesting to note the progression of performance of the expert sys-tem (Figure 7.10), as performance takes a significant drop after the fifth design iteration,although the system is ultimately able to correct this error. This drop is a result of the sys-tem working within an illuminance range, instead of towards a maximum or minimum:the system determined that the illuminance on the sensor plane was too low, so it pro-posed a change to increase illuminance, but the resultant increase pushed the illuminancevalues outside the desired performance range. This behavior of the expert system is moreapparent for strict illuminance ranges (such as that considered in the next case study).
7.2.4.5 Case Study #5: Narrow Range Illuminance Goal
In the previous example, a wide illuminance goal range was considered. In this case study,the performance goal is a narrow illuminance range: 300 lux minimum preferred (100 luxaccepted) and 800 lux maximum preferred (1200 lux accepted). Because the illuminancerange is more strict than the previous case study, the problem is more difficult to solve.Like the previous case study, a school schedule was considered for this problem.
In this case study, the micro-GA was able to find a design with excellent performance(97.3% in range, for the times and seasons considered) after 10 generations (Figure 7.11).The expert system was also able to find a design with very good performance (94.4% inrange), but as indicated in Figure 7.11, the expert system behavior exhibited a see-saweffect as it tried to work within the strict illuminance range. The system did not neces-sarily always suggest changes which improved the performance of the design, but it wasable to correct itself successfully when the performance became too low. The final designsproduced by the two algorithms both have large shading devices on the south facing win-dows; however, the east facades are visually very different. This difference may be thecause of the 3% difference in performance between the final designs found by the twosystems.
136

Case Study #5: Narrow Illuminance Range Goal - GA
40%
50%
60%
70%
80%
90%
100%
1 2 3 4 5 6 7 8 9 10Generation
Bes
t P
erfo
rman
ce (
%)
Case Study #5: Narrow Illuminance Range Goal - EXPERT SYSTEM
40%
50%
60%
70%
80%
90%
100%
0 1 2 3 4 5 6 7 8 9 10Design Step
Bes
t P
erfo
rman
ce (
%)
Figure 7.11: Case study #5 - Narrow illuminance goal: Performance for the micro-GA andexpert system
137

PerformanceGoal
Expert SystemStarter Design
Expert SystemBest Design
Micro-GABest Design
Case Study #6
Two Illuminance Goals:Sensors Parallel to Facades
64.5% In Range 96.1% In Range 95.3% In Range
61.3% In Range 82.6% In Range 87.0% In Range
Case Study #7
Two Illuminance Goals:Sensors Perpendicular to Facades
Figure 7.12: Comparison of best performing final designs from the expert system andmicro-GA for case studies #6 and #7
7.2.5 Complex Case Studies: Multiple Performance Goals
This section describes four case studies which each have two performance goals. The firsttwo case studies consider sets of goals which are considered non-conflicting because thereexist design solutions which come reasonably close to meeting both goals at once. Thefinal two case studies are both examples of conflicting goal scenarios, as there are no truesolutions which meet both performance goals at once. All case studies were considered forBoston, MA.
For the first two case studies, the performances of both sensor planes are averaged togetherto simplify the scenarios into single-objective problems. In these cases, it is still possible todirectly compare the performance of the final “best case” designs produced by the micro-GA and by the expert system. Three designs for these two cases are shown in Figure 7.12:the starting expert system design, the best design found by the expert system, and the bestdesign generated by the micro-GA.
For the final two case studies, it is not possible to isolate a “best case” design due to the con-flicting nature of the performance goals. For these studies, a multi-objective micro-GA wasrun for 50 generations to approximate the Pareto front. The expert system was run threedifferent times: first, with equal priority for all goals, then two additional times where eachof the two goals was given priority over the other. Designs generated during these threeexpert system runs were compared against the designs located along the approximatedPareto front to determine how well the expert system could deal with a conflicting goalsituation.
138

West Sensor South Sensor
Figure 7.13: Case study #6 - L-shaped massing model with two illuminance sensors indi-cated
7.2.5.1 Case Study #6: Two Illuminance Goals – Sensors Parallel to Facades
The first non-conflicting goals case study features an L-shaped space with two illuminancegoals. The two facades of interest are oriented towards the south and west, and the twoilluminance sensors are located parallel to these facades (Figure 7.13). The illuminancegoals for each sensor are:
• South zone: 400 lux minimum preferred (200 lux accepted); No maximum.
• West zone: No minimum; 500 lux maximum preferred (800 lux accepted).
Based on these goals, the known design solutions to this problem featured small, shadedwindows on the west facade and larger windows on the south facade.
The performances of the micro-GA and the expert system system are shown in Figure 7.14.In these charts, the performance shown represents the average performance of the two il-luminance goals. It is clear from the chart that the expert system proposes a design changewhich results in a significant decrease in performance at design iteration #4; however, theexpert system is able to correct itself and find a design solution that is an average of 96.1%in range by the 8th design iteration. The micro-GA finds a similarly good solution withan average performance of 95.3% after ten generations. As expected, both “best” designshave either very small or highly shaded windows on the west facade with larger or lessshaded windows on the south facade (Figure 7.12).
139

Case Study #6: Two Goals, Sensors Parallel to Facades - GA
60%
70%
80%
90%
100%
1 2 3 4 5 6 7 8 9 10Generation
Bes
t P
erfo
rman
ce (
%)
Case Study #6: Two Goals, Sensors Parallel to Facades - EXPERT SYSTEM
60%
70%
80%
90%
100%
0 1 2 3 4 5 6 7 8 9 10Design Step
Bes
t P
erfo
rman
ce (
%)
Figure 7.14: Case study #6 - Two illuminance goals with sensors located parallel to facades:Performance for the micro-GA and expert system
140

West Sensor East Sensor
Figure 7.15: Case study #7 - Trapezoidal massing model with two illuminance sensorsindicated
7.2.5.2 Case Study #7: Two Illuminance Goals – Sensors Perpendicular to Facades
The second non-conflicting goals case study features a trapezoidal space with a slopedroof. The two facades considered are oriented towards the south and north, and the twoilluminance sensors are located perpendicular to these facades in the east and west ends ofthe space (Figure 7.15). In this case study, the height of the north facade is twice the heightof the south facade. The illuminance goals for each sensor are:
• East zone: 200 lux minimum preferred (100 lux accepted); 800 lux maximum pre-ferred (1200 lux accepted)
• West zone: 400 lux minimum preferred (200 lux accepted); No maximum.
The performances of the micro-GA and the expert system system are shown in Figure7.16. As with the previous case study, these charts consider the average performance ofthe two illuminance goals. The micro-GA was able to find a solution with an averageperformance of 87.0% while the expert system’s best design had an average performanceof 82.6% (Figure 7.12).
It is evident from Figure 7.16 that the expert system struggled with this case study, exhibit-ing a see-sawing effect similar to that seen in the narrow illuminance range case study.This behavior is due to the window uniformity scheme selected for the expert system (allwindows on the facade must be uniform) and the univariate (“step-by-step”) nature ofthe expert system algorithm. While the micro-GA finds a design solution that featureswindows clustered towards the west end of both facades, the expert system focuses onchanging the properties of the windows without moving them. The option to translatethe windows towards one end of the facade does appear on the list of suggested designchanges, but this option was never the first one presented to the user during the ten designiterations considered, so it was never chosen.
This type of design scenario is one in which the ability to change the window uniformityscheme will greatly enhance the performance of the expert system, as it would allow the
141

Case Study #7: Two Goals, Sensors Perpendicular to Facades - GA
60%
70%
80%
90%
100%
1 2 3 4 5 6 7 8 9 10Generation
Bes
t P
erfo
rman
ce (
%)
Case Study #7: Two Goals, Sensors Perpendicular to Facades - EXPERT SYSTEM
60%
70%
80%
90%
100%
0 1 2 3 4 5 6 7 8 9 10Design Step
Bes
t P
erfo
rman
ce (
%)
Figure 7.16: Case study #7 - Two illuminance goals with sensors located perpendicular tofacades: Performance for the micro-GA and expert system
142

(a) Massing Model with Illuminance Sensors (b) Starting Model for Expert System
Figure 7.17: Case study #8 - U-shaped model for conflicting illuminance goals study: (a)Original massing model with sensors shown, (b) Generic starting model for the expertsystem
system to work only with the windows directly in front of a given sensor instead of work-ing with all windows on each facade. The effect of changing the uniformity scheme forthis case study will be discussed in section 7.3.2.
7.2.5.3 Case Study #8: Conflicting Illuminance Goals
The first conflicting goals case study has two illuminance goals, one with a goal range oflow illuminance values and one with a goal range of high illuminance values. This casestudy considers a space with a U-shaped floorplan, and the three facades of interest facesouth, west, and north (Figure 7.17a). The two illuminance sensors planes are located inthe north and south zones, and the illuminance goals for each sensor are:
• South zone: 1000 lux minimum preferred (800 lux accepted); No maximum.
• North zone: 200 lux minimum preferred (0 lux accepted); 500 lux maximum pre-ferred (700 lux accepted).
This case study had an additional constraint that all facades must be uniform and that allthree facades must be identical. This constraint ensured that the performance goals wouldbe conflicting.
Because there cannot be a single “best” solution to a problem with conflicting goals for thiscase study, an approximated Pareto front was generated using the multi-objective micro-GA described in section 7.2.1. The approximated Pareto front demonstrates the range ofpossible solutions which are considered non-dominated. By examining the set of all non-dominated solutions, one can begin to understand the relationship between the two con-flicting performance goals.
To compare the results of the expert system to those generated by the multi-objectivemicro-GA, the expert system was run three different times, each for five design iterations,
143

Case Study #8: Conflicting Illuminance Goals - Equal Priority
0%
20%
40%
60%
80%
100%
0 1 2 3 4 5Design Step
Bes
t Per
form
ance
(%)
South Performance North Performance Average Performance
Case Study #8: Conflicting Illuminance Goals - South Priority
0%
20%
40%
60%
80%
100%
0 1 2 3 4 5Design Step
Bes
t Per
form
ance
(%)
South Performance North Performance Average Performance
Case Study #8: Conflicting Illuminance Goals - North Priority
0%
20%
40%
60%
80%
100%
0 1 2 3 4 5Design Step
Bes
t Per
form
ance
(%)
South Performance North Performance Average Performance
Figure 7.18: Case study #8 - Conflicting illuminance goals: Performance for the expertsystem for three different goal priority scenarios
144

Case Study #8 Solution Space - GA and Expert System
0%
20%
40%
60%
80%
100%
0% 20% 40% 60% 80% 100%
North Sensor Performance
So
uth
Sen
sor
Per
form
ance
GA Results
Expert System Results
Case Study #8 - Non-Dominated Solutions Found - GA and Expert System
0%
20%
40%
60%
80%
100%
0% 20% 40% 60% 80% 100%North Sensor Performance
So
uth
Sen
sor
Per
form
ance
GA Non-Dominated
Expert System Starting Point
Expert System Non-Dominated
Figure 7.19: Case study #8 - Conflicting illuminance goals: Performance for the expertsystem for three different goal priority scenarios over the entire solution space (upper)and over the approximated Pareto front (lower).
145

Created by Expert System Generated by Micro-GACase
Best AveragePerformance
Best North Sensor Performance
Best South Sensor Performance
Average: 62.6%North: 66.9%South: 58.2%
Average: 65.4%North: 70.5%South: 60.5%
Average: 50.3%North: 82.5%South: 18.1%
Average: 54.9%North: 80.8%South: 29.0%
Average: 49.2%North: 0.0%South: 97.7%
Average: 49.9%North: 0.0%South: 99.5%
Figure 7.20: Case study #8 - Conflicting illuminance goals: Comparison of designs for bestaverage, north, and south sensor performance for the expert system and the micro-GA
146

(a) Massing Model with Illuminance and Glare Sensors
(b) Starting Model for Expert System
Figure 7.21: Case study #9 - Z-shaped model for conflicting illuminance and glare goalsstudy: (a) Original massing model with sensors shown, (b) Generic starting model for theexpert system
with a different sensor priority given for each of the three runs. The performance of theexpert system over each of these three runs is shown in Figure 7.18. The generic initialstarting point model for the expert system is shown in Figure 7.17b.
As is clear from the charts in Figure 7.18, the conflicting goals presented a challenge forthe expert system, which tended to see-saw from working towards one goal to workingtowards the other. This behavior resulted in the average performance staying relativelyconstant throughout the process. However, when all the designs generated by the expertsystem over the three runs are compared to those generated by the micro-GA over 50generations (Figure 7.19), it is clear that the set of expert system designs do cover a widearea within the solution space and offer a way of approximating the Pareto front usingfewer total simulations than those required by the micro-GA.
Although the expert system does not generate a Pareto front itself, it is interesting to com-pare three designs generated by each algorithm: the design with the best average perfor-mance, the design with the best north sensor performance, and the design with the bestsouth sensor performance (Figure 7.20). The expert system was able to find designs withsimilar performance and somewhat similar design characteristics to those generated bythe micro-GA in each of these cases. Such designs may provide the user with an under-standing of the trade-offs between one performance goal and the other in a conflicting goalscenario.
7.2.5.4 Case Study #9: Conflicting Illuminance and Glare Goals
The second conflicting goals case study has one illuminance goal with a desired rangeof high illuminance values and one glare goal. The goals are conflicting because in thisparticular case, achieving the illuminance goal is likely to cause glare to increase for theviews considered. This case study considers a Z-shaped floorplan, and the two facadesof interest face east and west (Figure 7.21a). Two illuminance sensors planes are located
147

Case Study #9: Conflicting Illuminance and Glare - Equal Priority
0%
20%
40%
60%
80%
100%
0 1 2 3 4 5Design Step
Bes
t Per
form
ance
(%)
Illuminance Performance Glare Performance Average Performance
Case Study #9: Conflicting Illuminance and Glare - Illuminance Priority
0%
20%
40%
60%
80%
100%
0 1 2 3 4 5Design Step
Bes
t Per
form
ance
(%)
Illuminance Performance Glare Performance Average Performance
Case Study #9: Conflicting Illuminance and Glare - Glare Priority
0%
20%
40%
60%
80%
100%
0 1 2 3 4 5Design Step
Bes
t Per
form
ance
(%)
Illuminance Performance Glare Performance Average Performance
Figure 7.22: Case study #9 - Conflicting illuminance and glare goals: Performance for theexpert system for three different goal priority scenarios
148

Case Study #9 - Solution Space - GA and Expert System
0%
20%
40%
60%
80%
100%
0% 20% 40% 60% 80% 100%
Illuminance Performance
Gla
re P
erfo
rman
ce
GA Results
Expert System Results
Case Study #9 - Non-Dominated Solutions Found - GA and Expert System
0%
20%
40%
60%
80%
100%
0% 20% 40% 60% 80% 100%Illuminance Performance
Gla
re P
erfo
rman
ce
GA Non-Dominated
Expert System Starting Point
Expert System Non-Dominated
Figure 7.23: Case study #9 - Conflicting illuminance and glare goals: Performance forthe expert system for three different goal priority scenarios over the entire solution space(upper) and over the approximated Pareto front (lower).
149

Created by Expert System Generated by Micro-GACase
Best AveragePerformance
Best GlareSensor Performance
Best IlluminanceSensor Performance
Average: 80.9%Glare: 75.8%Illuminance: 86.0%
Average: 86.4%Glare: 85.5%Illuminance: 87.0%
Average: 60.3%Glare: 97.7%Illuminance: 22.8%
Average: 58.7%Glare: 98.1%Illuminance: 19.3%
Average: 63.6%Glare: 27.2%Illuminance: 100.0%
Average: 67.2%Glare: 34.5%Illuminance: 100.0%
Figure 7.24: Case study #9 - Conflicting illuminance and glare goals: Comparison of de-signs for best average, glare, and illuminance sensor performance for the expert systemand the micro-GA
150

in the east and west zones and glare arrays are located within the same zones with viewsfacing outwards. The performance goals for the two sensor groups are:
• Illuminance: 200 lux minimum preferred (0 lux accepted); No maximum.
• Glare: Zero glare tolerance (only imperceptible glare allowed).
As with the previous case study, this case study had an additional constraint that all fa-cades must be uniform and that all facades must be identical to ensured that the perfor-mance goals would be conflicting.
The behavior of the expert system during this case study displays a similar see-saw effectas the previous case study (Figure 7.22). Again, the three expert system runs produce a setof designs that provide a good representation of the solution space and of the Pareto frontfor this problem (Figure 7.23).
A comparison of three designs (the design with the best average performance, the designwith the best glare sensor performance, and the design with the best illuminance sensorperformance) is shown in Figure 7.24. In this case study, the micro-GA was able to find adesign with an average performance that is over 5% better than the design found by theexpert system, and in general, it is clear from Figure 7.23 that the expert system designstended to have slightly lower glare performance than the micro-GA designs in the middlearea of the Pareto front. However, the expert system is still able to effectively provide theuser with a rough approximation of the Pareto front and a set of designs that explores thetrade-offs between illuminance and glare performance.
7.2.6 Comments on the Stopping Criteria
For the case studies described in sections 7.2.4 and 7.2.5, both the expert system and themicro-GA were run until a “perfect” solution was found or for ten generations or designiterations. The maximum number of design iterations was chosen to be ten based on initialruns which indicated that the best performing designs for the expert system case studieswere found relatively quickly and within ten design iterations. In the case studies pre-sented in this section, the best designs were found after the following number of designiterations:
1. Maximum only illuminance goal: 4 Iterations (100%)
2. Minimum only illuminance goal: 3 Iterations (100%)
3. Glare only goal: 7 Iterations (100%)
4. Wide illuminance range goal: 9 Iterations (99.8%)
5. Narrow illuminance range goal: 8 Iterations (94.4%)
151

6. Two illuminance goals - Sensors parallel to facades: 8 Iterations (96.1%)
7. Two illuminance goals - Sensors perpendicular to facades: 9 Iterations (82.6%)
The nature of the expert system is such that the fastest improvement is generally seen inthe first few design iterations. After a certain number of design iterations have been com-pleted, the design changes suggested by the expert system become less likely to improveperformance. In each of the case studies considered, the performance of designs had al-ready begun to worsen by the time the tenth design iteration was completed. If additionaldesign iterations had been completed, it is likely that performance would have continuedto decline.
This behavior is different from that of the micro-GA. Due to the elitist strategy used in themicro-GA, design performance will always improve or stay the same as more generationsare completed. Although the micro-GA process was stopped after ten generations for thecase studies considered, it should be noted that the micro-GA may have found slightlybetter performing designs if it had been allowed to continue for more generations.
As an example, the micro-GA was allowed to run for an additional 15 generations for casestudy #7 (trapezoidal design), which was the most difficult case study for both the micro-GA and the expert system. The original ten generation run produced a design that wasan average of 87.0% within the goal range. After 25 generations, the micro-GA was ableto generate a design with an average performance of 90.2%, an increase of 3.2% (Figure7.25). However, this case study was the only one in which either the micro-GA or theexpert failed to produce a design which performed higher than 94% after ten iterations orgenerations. Therefore, although the micro-GA may have been able to find slightly betterdesigns if it had been allowed to run for more generations for the other case studies, thedifference in performance could not have been higher than a few percentage points.
7.2.7 Discussion
The nine case studies discussed in sections 7.2.4 and 7.2.5 have demonstrated that theexpert system can produce designs which perform similarly to those generated by a micro-GA for a variety of different design scenarios and problem types when a “perfect user” isassumed. The behavior of the expert system was found to differ based on the complexityof the problem, and the following trends were observed:
• For problems with a single goal threshold (for example, only a minimum desiredilluminance value) such as case studies #1 through #3, the expert system was ableto propose design changes which resulted in improved performance at almost everydesign iteration. The expert system was able to find “perfect” solutions to theseproblems.
• For problems with an illuminance goal range, the expert system displayed trendsof see-sawing. For example, the expert system might note that the illuminance was
152

Case Study #7: Ten Generations
60%
70%
80%
90%
100%
1 2 3 4 5 6 7 8 9 10
Generation
Bes
t Per
form
ance
(%)
Case Study #7: 25 Generations
60%
70%
80%
90%
100%
1 2 3 4 5 6 7 8 9 10 11 12 13 14 15 16 17 18 19 20 21 22 23 24 25Generation
Bes
t P
erfo
rman
ce (
%)
Figure 7.25: Micro-GA runs for 10 and 25 generations for case study #7
153

too low and propose a change to increase illuminance, and the subsequent changesmight decrease performance by pushing the illuminance values past the maximumallowable illuminance threshold. The see-sawing trend was more evident for a nar-row goal range (case study #5) than for a wide goal range (case study #4). However,the see-sawing behavior indicates that the expert system always corrects itself whenit discovers that a previous suggested design change has decreased performance, sogood performing solutions were still found for goals of this type.
• For problems with two non-conflicting goals such as case studies #6 and #7, the ex-pert system may exhibit a similar see-sawing behavior as it tries to work with twodifferent goals at once. Again, it was found that the system can effectively correctitself and that good solutions may be found using the system for these types of prob-lems. The worse comparison case study was for case study #7, where the micro-GAwas able to more effectively propose designs within the “uniform facade” constraintthan the expert system. However, even in this case, the expert system was able tofind a solution which performed within 4% of the performance of the best designgenerated by micro-GA (and within 7.5% if the 25 generation micro-GA run is takeninto consideration).
• For problems with conflicting goals such as case studies #8 and #9, the expert systemstruggled to find solutions which met both goals at once. The behavior of the expertsystem is similar to that with non-conflicting goals but more extreme, as the processgenerally alternates from working towards one goal and working towards the other,which results in the average performance remaining relatively constant through alldesign iterations. Such behavior is not unexpected, given the nature of the problemand the fact that there is generally not a single perfect solution to a multi-objectiveproblem. While a single “best” solution was not found, it was discovered that theexpert system could produce a set of designs which provide a reasonable approx-imation of the Pareto front generated by the micro-GA. Such a set of designs mayprovide a designer with an understanding of the trade-offs between the two perfor-mance goals for a conflicting goal design scenario. In these types of problems, it isclear that the expert system has an educational potential, which will be discussedfurther in Chapter 8.
It is important to note that the purpose of the comparison study was not to directly com-pare the expert system algorithm to the micro-GA, as the two algorithms are inherentlydifferent. In these case studies, the micro-GA was used to verify that a reasonable solutionexisted for each case study by generating a very good (although not necessarily “perfect”)benchmark solution for each problem. The purpose of the case studies was to evaluatethe performance and behavior of the expert system and to confirm that the proposed de-sign changes made by the expert system can improve performance for a variety of designscenarios. As it was shown that the expert system could find designs that were withinan average of about 1% (and a maximum of 7.5%) of the performance of the best designsgenerated by the micro-GA in each case study, a potential user can have confidence in
154

the advice given by the expert system and can assume that by making the suggested de-sign changes, the performance of his or her design will improve over a series of designiterations.
Although the performance of the expert system was slightly lower than that of the micro-GA in some cases, this small degree of performance is sacrificed for the purposes of al-lowing user-interactivity into the expert system process. Although the studies presentedin this chapter do not consider any user-interactivity, Chapter 8 will describe a user studywhich demonstrates that the expert system can improve the performance of designs evenwhen human behavior is included in the process. In the user study, it was found that par-ticipants never acted as a “perfect user,” and that the degree of improvement found bythe expert system was influenced by the choices made by participants during the process.The value of the interactivity allowed during the expert system process will be discussedfurther in Chapter 8.
7.3 Effect of Initial Facade Constraints
While the previous set of case studies was able to demonstrate that the expert systemcan indeed produce designs that are comparable to those produced by a micro-GA, thebehavior and performance of the expert system is also dependent on several variablesthat do not affect the micro-GA. One important difference between the micro-GA and theexpert system is that the micro-GA generates its own designs while the expert systembegins with an initial design and suggests changes to be made to that specific design basedon its current performance. This feature was designed purposefully based on the expertsystem design process described previously in section 3.5. The best design produced bythe expert system is thus highly dependent on the initial design given to the system.
The expert system also allows the user to select a uniformity scheme for the windows inhis or her design. In the micro-GA comparison studies, both the micro-GA and the expertsystem designs were constrained to have uniform facades, which meant that all windowson a single facade had the same characteristics. However, the expert system also includesthe option of having non-uniform facades. Selecting this option would allow the systemto make changes to individual windows on a facade instead of all of them at once. Forcertain types of design scenarios, selection of the non-uniform window option will resultin greater performance improvement than the uniform window option.
This section presents two brief case studies which examine the effects of the initial facadedesign and the window uniformity scheme on the overall improvement found by the ex-pert system.
155

7.3.1 Specificity of Initial Facade Design
This study examines the relationship between the performance of the expert system andthe initial facade design. For this study, the problems in the micro-GA case studies #4 and#5 are considered: a simple box model with an illuminance sensor in the core zone, facadeson the east and south, and an illuminance range as a performance goal (Figure 7.3a). Thetwo case studies differ as the performance goal for one is a wider illuminance goal rangethan the other, which is therefore an easier problem to solve. These case studies werechosen for comparison because they enable a comparison of the expert system behaviorfor different facade types on two different levels of goal difficulty. The two illuminancegoal ranges are:
• Wide range: 300 lux minimum preferred (100 lux accepted); 1500 lux maximum pre-ferred (2500 lux accepted).
• Narrow range: 300 lux minimum preferred (100 lux accepted); 800 lux maximumpreferred (1200 lux accepted).
In the original case studies presented, the expert system process began with a relativelygeneric facade design with mediocre performance (around 50%). In this study, four differ-ent facade designs are considered. The four different starting facades are shown in Figure7.27 and have varying levels of specificity: the first is the generic facade used for the micro-GA studies with square windows, the second has slightly more elongated windows, thethird has extremely elongated windows, and the fourth has elongated windows clusteredtowards one end of each facade.
In this study, the expert system process was run for each of the four initial facade typesand for each of the two illuminance goal ranges. The expert system was run for ten designiterations in all cases, and the “uniform facade” scheme was selected. The performance ofthe expert system for all cases is shown in Figure 7.26.
For the wide illuminance range scenario, it is clear that during the first four design itera-tions, the starting facade does affect performance: the most generic facade improves themost quickly while the more stylized designs see a lower amount of improvement. Afterall ten generations, however, it is seen that very good designs are found for all four startingdesigns, with performances ranging from 94.5% to 99.8%. There is one significant drop inperformance for one of the four cases, but in general, the expert system displays similarbehavior for all four starting models. The final models are shown in Figure 7.27 and it isclear that in each case, the final design is similar in aesthetics to the initial design.
In the narrow illuminance range case, an interesting phenomenon is seen as the see-sawingeffect that was noted during the micro-GA case studies becomes smoothed out as the start-ing design becomes more stylized (Figure 7.26). This behavior is likely due to the fact thatthe expert system can make larger design changes to the generic facades than to the morestylized facades, based on the constraints of the original designs, and therefore it can ex-plore a range of facade designs with a potentially wider range of performances. The expert
156

Wide Illuminance Goal Range
40%
50%
60%
70%
80%
90%
100%
0 1 2 3 4 5 6 7 8 9 10Design Step
Bes
t Per
form
ance
(%)
Case 1: Generic Case 2: Somewhat Stylized Case 3: More Stylized Case 4: Most Stylized
Narrow Illuminance Goal Range
40%
50%
60%
70%
80%
90%
100%
0 1 2 3 4 5 6 7 8 9 10Design Step
Bes
t P
erfo
rman
ce (
%)
Case 1: Generic Case 2: Somewhat Stylized Case 3: More Stylized Case 4: Most Stylized
Figure 7.26: Performance over ten design steps for facades of varying specificity and fortwo levels of goal ranges
157

Facade Type
Starter DesignBest Design: Wide Range
Best Design: Narrow Range
Generic
Wide: 49.0%Narrow: 49.2%
99.8% In Range 94.4% In Range
Somewhat Stylized
MoreStylized
MostStylized
Wide: 49.1%Narrow: 49.2%
94.5% In Range 92.3% In Range
Wide: 47.8%Narrow: 47.3%
95.1% In Range 93.4% In Range
Wide: 52.0%Narrow: 51.6%
98.3% In Range 88.4% In Range
Figure 7.27: Starter and best designs for four levels of facade specificity and two levels ofgoal ranges
158

system is again able to find good solutions from all four starting designs, with performanceranging from 88.4% to 94.4%. Similarly to the wide illuminance range case, the best de-signs found during each of these runs greatly resembles the starting design (Figure 7.27).
From this brief study, it is clear that the starting facade design given to the expert systemdoes have an effect on the behavior of the system and on the total improvement that canbe found over a course of ten design iterations. In both studies, the final model that wasgenerated starting with the most generic model had a higher performance than the finalmodels generated by any of the more stylized facades; however, the difference betweenthe best and worst final design in each case was less than 6%, and the most stylized initialmodels did not always result in the worse performance. The initial design was found togreatly influence the designs that the expert system considered. This study has shown thatthe expert system may work towards improved performance while maintaining an initialdesign aesthetic provided by the user, which was the intended behavior of the systembased on the expert system as discussed in section 3.5.
7.3.2 Window Uniformity Scheme
In addition to being heavily influenced by the initial facade design, the expert system’ssearch process is also dependent on the window uniformity scheme selected by the userat the beginning of the process. In this section, the models from case studies #6 and #7from the micro-GA comparison studies were considered, once with the uniformity of thefacade maintained and once with non-uniform facades allowed. These models were cho-sen for this study because it was hypothesized that the uniformity of the facade would bemore influential on designs with more than one goal sensor than for single-goal scenarios.These two design problems each have two illuminance sensor planes with different perfor-mance goals, but they are considered non-conflicting goals because reasonable solutionsexist which meet both goals at once. For the L-shaped room case study, the known goodsolutions featured small windows with shading devices on the west facade and largerwindows on the south facade. For the trapezoidal case study, the known good solutionsfeatures windows clustered towards the west end of both facades. The performance of theexpert system for both uniform and non-uniform facades for both case studies is shown inFigure 7.28.
It is clear from these charts that the non-uniform window scheme produces significantlybetter results for the trapezoidal case study, where the sensor planes are located perpen-dicular to the facades of interest. This improved performance is due to the fact that thenon-uniform window scheme allows the expert system to target the two illuminance sen-sors individually by making different changes to the windows that are located closest toeach one instead of making the same design change to all windows. This difference inthe handling of windows based on their location relative to the different sensors is ap-parent in the final designs produced in each case (Figure 7.29). The final design for thenon-uniform scheme still resembles the initial facade design, but the facades have eachbeen divided into two, based on the locations of the two sensors. This final design has an
159

L-Shaped Model - Two Goals, Sensors Parallel to Facades
60%
70%
80%
90%
100%
0 1 2 3 4 5 6 7 8 9 10Design Step
Bes
t Per
form
ance
(%)
Uniform Facades Non-Uniform Facades
Trapezoidal Model - Two Goals, Sensors Perpendicular to Facades
60%
70%
80%
90%
100%
0 1 2 3 4 5 6 7 8 9 10Design Step
Bes
t P
erfo
rman
ce (
%)
Uniform Facades Non-Uniform Facades
Figure 7.28: Expert system performance for L-shaped and trapezoidal models (from casestudies #6 and #7) with two window uniformity schemes
160

PerformanceGoal Starter Design
Uniform Facade Best Design
Non-Uniform Facade Best Design
Two Illuminance Goals:Sensors Parallel to Facades
64.5% In Range 96.1% In Range 97.5% In Range
61.3% In Range 82.6% In Range 96.4% In Range
Two Illuminance Goals:SensorsPerpendicular to Facades
Figure 7.29: Comparison of best performing final designs from the expert system for L-shaped and trapezoidal models (from case studies #6 and #7) with two different uniformityschemes
average performance of 96.4%, which is 13.8% better than the performance of the uniformfacade design.
In the L-shaped case study, where the sensor planes are located parallel to the facadesof interest, the non-uniform facade scheme produced slightly better performance, but thefinal best designs for both schemes are within 1.1% of each other. In this case, the expertsystem process was exactly the same for the first four design iterations and followed asimilar trend for the final six iterations (Figure 7.28).
It is clear from this set of case studies that the use of the non-uniform window scheme canproduce dramatically better results for certain types of designs, particularly those where afacade could be effectively divided so that different windows would target different sensorplanes. However, for designs such as the L-shaped room, where the facades are alreadylocated parallel to the sensor planes, the uniform and non-uniform window schemes pro-duce similar results.
7.4 Expert System Strengths and Limitations
Based on the case studies presented in this chapter, several general conclusions may bemade regarding the strengths and limitations of the expert system as an algorithm whichworks towards improving the daylighting performance of an initial design.
161

The strengths of the expert system are the following:
• The expert system can find designs which perform similarly to designs generated bya micro-GA for a variety of design scenarios.
– It can work towards improved designs for single and multiple performancegoals and for illuminance and/or glare metrics.
– It is effective for a variety of initial models, including different types of build-ing footprints and situations where some facades are of a different height thanothers.
– It can solve for multiple goals at the same time and produce designs which havea high average performance.
– For conflicting goal scenarios, it can produce a set of designs which provide theuser with an understanding of the trade-offs between the conflicting goals.
• The expert system tends to improve designs very quickly (within fewer than tendesign iterations).
• The expert system can find similarly good solutions for starting models with a rangeof different facade designs, including highly stylized facades. The system also main-tains the initial design aesthetic during the design iteration process, so that final de-signs still resemble the initial design.
• The expert system can improve an initial design regardless of the window uniformityscheme selected, and it may find significantly better designs if the “non-uniformwindow” scheme is allowed.
The limitations of the expert system are:
• The expert system may not perform as well as a micro-GA in all situations, partic-ularly those with narrow illuminance goal ranges and/or multiple goals, especiallyconflicting goals. However, this sacrifice in performance is necessary in order to in-clude user-interactivity into the process.
• Unlike the micro-GA, which will always improve performance if allowed to run formore generations, the expert system may worsen the performance of a design if toomany design iterations are completed.
• The expert system has a tendency to display a see-sawing behavior when faced withnarrow illuminance ranges and/or multiple goals. This behavior is most extremefor conflicting goals, as the system may maintain a constant average performance asit alternates between working on one goal and the other. In such cases, the expertsystem may not find design scenarios with improved average performance.
162

• The expert system is greatly influenced by the design of the initial facade, whichmeans that it does not explore as many design options as a GA. This is a limita-tion in cases where the initial facade design severely restricts the actions that theexpert system can perform and the subsequent performance improvement that canbe achieved.
• The expert system may perform very differently based on the window uniformityscheme selected by the user. The best performing design found by the system maybe much worse for constrained designs than for unconstrained designs, which meansthat a user may not find the best performing designs if he or she constrains the prob-lem.
7.5 Chapter Summary
This chapter presented an evaluation of the expert system performance based on a series ofcase studies. The first set of case studies compared the performance of designs created bythe expert system to those generated by a micro-GA. These case studies demonstrated thatthe expert system was successful at improving the performance of designs for a variety ofinitial conditions and performance goal scenarios. The purpose of the comparison studieswas to evaluate the performance of the expert system relative to a known optimizationalgorithm which could be relied upon to consistently generate designs with very good, ifnot globally optimal, performance. One early hypothesis of this thesis was that the expertsystem would likely not perform as well as a GA, particularly for problems with complexgeometries or difficult performance goals. In order to accommodate the user-interactivitythat would allow the expert system to be more naturally integrated into the design processthan an algorithm such as a GA, it seemed likely that some degree of performance was tobe sacrificed. The results of the case studies indicate that in some situations, the GA doesindeed find designs which perform better than the expert system; however, the differencein performance between the designs found by the two algorithms in the case studies wassmall (a maximum of 4%, or 7.5% if extra micro-GA generations were included).
This chapter also presented a brief set of studies which demonstrated the effect of initialfacade conditions and constraints on the performance of the expert system. It was shownthat while the specificity of the initial facade design does affect the outcome of the expertsystem process, the expert system was able to find improved designs in all cases. The dif-ference in performance between the best and worst final designs in these case studies was6%, which was small relative to the total performance improvement. A second brief studyinvestigated the effect of the window uniformity scheme on the resultant expert systembehavior, and in this study, a more significant potential difference was found. For designswhere the sensor planes are located parallel to the facades of interest, the selected windowuniformity scheme had little effect on the performance of the expert system. However, for
163

designs where the sensor planes were located perpendicularly from the facades of inter-est, the non-uniform window scheme selection was found to significantly improve expertsystem performance.
Based on the case studies discussed in this chapter, the expert system has been found toperform successfully. A potential user can have confidence that the design changes sug-gested by the system will improve the performance of his or her initial design if a numberof design iterations are completed. However, the case studies described in this chapter allassumed that a “perfect user” was involved with the process. The “perfect user” scenariowas one in which the “user” would always select the first design change suggested by theexpert system and the magnitude of design change with the highest performance. Chapter8 will evaluate the performance and success of the expert system when user-interactivityis included in the process and will describe a study in which human designers were askedto complete a design problem using the expert system.
164

Chapter 8
An Expert System Design Process
8.1 Introduction
A major goal of this thesis was to develop an intuitive tool and a performance-driven de-sign process which could be used by designers to improve daylighting performance inthe early design stages. In order to engage designers in the process, a high level of user-interactivity was integrated into the expert system. While optimization schemes often actas “black box” algorithms, producing designs with little or no input from a user, the expertsystem process requires user input in order to produce new designs. This level of interactiv-ity was included to allow the user to be in control of the changes made to his or her designat all times and to enable the expert system to be more compatible with the traditionalarchitectural design process. Because the user is fully involved in the decision-makingprocess, it is also possible that the expert system will provide an educational value to thedesigner by informing him or her about how different design elements affect performance.
While the previous chapter investigated the expert system behavior and performance inthe absence of human inputs, this chapter describes the results of a study which evaluatedthe performance of the expert system as a user-interactive process and as a design tool.During the study, designers were asked to interact with the expert system and to solvea brief design problem while focusing on daylighting performance. Several importantresults were obtained from this study. The first is an assessment of the ability of the expertsystem to find designs with improved daylighting performance when a human user isallowed to interact with it in an independent way. The second is an evaluation of the expertsystem process as a method for educating designers about daylighting and influencingtheir designs to include design elements which result in good daylighting performance.A final evaluation focuses on user satisfaction and the acceptance of the expert system bydesigners.
This chapter presents the details of the user study, including: the profile of participants, thestudy procedure, a description of the design problem that each participant was asked to
165

solve, and the quantitative and qualitative results of the study. The chapter also describesthe guided design process that a human user experiences when he or she works with theexpert system. The chapter concludes with a discussion of the expert system as a user-driven and user-interactive design tool.
8.2 Guided Design Process
The expert system described in this thesis is intended to supplement the traditional designprocess by engaging designers in a guided, performance-driven search process. The expertsystem interface, described in section 6.3, provides an intuitive way for designers to viewperformance data and to interact with the expert system. The main steps involved withthe expert system process are the following:
1. The user creates a 3d SketchUp model of his or her initial design which conforms tothe guidelines specified in Appendix A.
2. The user initializes the expert system from a pull-down menu in Google SketchUp.The user is prompted to enter the following inputs (described in further detail insection 5.5.1):
(a) Performance goals for all illuminance and/or glare sensors in the 3d model.
(b) A priority level for each goal.
(c) A window uniformity scheme.
(d) Times of day and seasons of interest.
(e) Location data and corresponding weather file.
3. The LSV engine simulates the initial model and calculates the goal-based perfor-mance metrics (described in section 5.5.2). Once the simulations are complete, theLightsolve program opens automatically, and the expert system interface can be se-lected from within the Lightsolve program. Upon opening, the expert system inter-face is automatically populated with data from the user’s initial model.
4. From the expert system interface, the user can view a list of suggested design changesthat can be made to his or her initial model. The user may skip forward or go back-wards between the various options on the list before choosing one.
5. After the user selects one design change to try, the expert system automaticallymakes the selected change to the 3d model in SketchUp. The expert system makesthree different magnitudes of the selected change, using the logic described in sec-tion 6.4.2. For each change, the expert system creates and saves a new 3d model, runsthe LSV engine, and calculates the goal-based performance.
166

6. After the three different magnitudes of change have been simulated, the expert sys-tem displays all three results in the interactive graph within the interface (Figure 6.3).The user may browse the views of the current design and the temporal maps to seehow the performance and design have changed in each of the three options. Theuser must choose one of the three possibilities before continuing to the next designiteration.
7. After one or more design iterations have been made, the user may then choose eitherto select a new design change to try from the list presented by the expert system,or the user may return to a previous iteration of the design (including the initialmodel). Returning to a previous iteration will allow the user to investigate a newpath of design iterations. Once the user elects to make another design change, steps5 and 6 repeat.
8. After several iterations, the user should be able to view the progressive performanceof the design, as in Figure 3 (in Chapter 6). The user may stop the process at anypoint.
This guided process, along with the corresponding tool and interface, was developed tosupport the design process by enabling the features described in section 3.5. The userstudy presented in this chapter was conducted to test how well real designers respondedto this guided design process.
8.3 User Study: An Expert System Design Tool
To evaluate the performance of the expert system when incorporated into the design pro-cess, a user study was conducted during which participants were asked to interact with thesystem and solve a daylighting design problem. The study was designed to help answerthe following questions:
• Can the expert system still improve the performance of a design when independenthuman interaction is included into the process?
• Can the process of working with the expert system positively influence a designer’sfinal design, if the final design is one designed strictly by the designer and not gen-erated by the expert system?
• Can the process of working with the expert system educate a designer about day-lighting for a specific design problem? Can it educate a designer about general day-lighting concepts?
• If there is a benefit to using the expert system design process, is this benefit greaterto participants who have had little to no experience working with daylighting or toparticipants who have had more substantial experience?
167

Self-Rated Experience Working with Daylighting
0
1
2
3
4
5
Experienced Intermediate Novice None
Num
ber o
f Par
ticip
ants
Figure 8.1: Breakdown of participants’ previous experience working with daylighting
• Do the participants accept the expert system as a design tool? Would they use it foran actual design project?
8.3.1 Profile of Participants
Twelve participants were included in the user study. Because the goal of the study was toevaluate the expert system for use by designers, only those with at least one prior degreein architecture and with at least one year of experience working for an architectural designor architectural consulting firm were allowed to participate. The median work experiencein a design firm was 3.8 years (minimum 1 year, maximum 8 years). The breakdown of thehighest previously completed degrees was:
• Bachelor’s level degree in architecture: 4 participants
• Master’s level degree in architecture: 8 participants
Additionally, most participants were in the process of completing a second or third degreein architecture or a related field (building technology or computation) at the time of thestudy. The breakdown of the current status of participants was:
• Master’s level student in architecture or related field: 5 participants
• Doctoral level student in architecture or related field: 6 participants
• Architectural design faculty: 1 participant
168

The participants were also selected so as to represent a variety of backgrounds in day-lighting. They were asked to rate their experience level in working with daylighting usingone of four categories: experienced, intermediate, novice, or none. The distribution of re-sponses are shown in Figure 8.1. The group was fairly evenly split, with a total of four(self-ranked) experienced daylighters, three intermediates, and five novices. No partici-pant chose the final option of “no daylighting experience.”
Finally, participants were asked to describe their previous experiences working with day-lighting simulation tools for different stages of the design process. In general, most par-ticipants had relatively little experience working with daylighting simulation programs.Additionally, although participants were asked to differentiate between programs usedduring the early, later, and final design stages, most participants did not respond differ-ently based on the different stages of design.
The breakdown of participant responses were the following (please note that some partic-ipants indicated that they used multiple simulation programs):
• No experience using daylighting simulation at any time during the design process:6 participants
• Daylighting simulation during early and later design phases:
– Radiance and Daysim: 3 participants
– Ecotect: 3 participants
– Lightsolve: 1 participant
– 3d Studio Max: 1 participant
• Daylighting simulation during final phase (for analysis only):
– Radiance and Daysim: 2 participants
– Ecotect: 1 participant
8.3.2 Study Procedure
The user study was conducted as a series of brief segments, which included three designsessions and two questionnaires. The total amount of time used for each participant wasapproximately two hours. The design problem will be described in detail in section 8.3.3,and the questionnaires, design briefs, and template sheets are included in Appendix B.The same design problem was solved by each participant three times: first by hand, thenusing the expert system, and finally by hand again. During all sessions, participants wereallowed access to pencils, blank paper, a calculator, and a sun course diagram for Boston,MA. Participants were also allowed to re-visit the two tutorial PowerPoint slides at anypoint during the study.
169

The sessions of the study were the following:
1. Introductory Questionnaire: The participant filled out a basic information question-naire about his or her previous education and experience in design, daylighting, andsimulation-based tools.
2. General Tutorial: The participant viewed a PowerPoint slideshow tutorial. The tuto-rial introduced the participant to:
(a) A description of the tasks he or she was expected to perform during the study.(b) A description of the design rules that the participant should follow during the
design sessions.(c) A brief explanation of basic daylighting information and metrics.
3. Design Session #1: The participant was asked to complete a design problem. For thisproblem, the participant was given an initial massing model and a set of daylightingperformance goals. The participant was asked to design two facades on the massingmodel and attempt to meet the daylighting performance goals as well as satisfy him-or herself as a designer. An example of a previous facade design was also provided,along with the performance of that example design (Figure 8.2a). In this design ses-sion, the participant was asked to sketch his or her design by hand and to draw thefinal design on a template sheet (Figures B.7 and B.8, Appendix B, ). The participantwas given as much time as necessary to read through the design brief and 20 minutesto sketch his or her design.
4. Expert System Tutorial: The participant viewed a PowerPoint slideshow tutorial thatintroduced him or her to the expert system and its interface.
5. Design Session #2: The participant was asked to complete the same design problemas the previous design session using only the expert system. For this session, theparticipant began the process with the same example model shown to them in theprevious session (Figure 8.2a). During this session, the participant was allowed tochoose to accept or decline design changes suggested by the expert system, to choosethe magnitude of the design change, and to return to previous design iterations. Theparticipant was also allowed to explore designs which resulted in decreased perfor-mance if desired. During this session, the participant was not allowed to change thedesign by hand or in SketchUp. This session lasted for 40 minutes, after which theparticipant was asked to choose a “favorite” design.
6. Design Session #3: The participant was asked to complete the design problem forthe third time and was told that this design would be considered the “final” versionof the design. The participant was told that he or she could re-visit either or bothof the designs produced during the first two sessions or completely start over. Theparticipant was given 15 minutes to sketch by hand and draw the final design on aprovided template sheet.
170

7. Final Questionnaire: The participant filled out a final questionnaire about his or hersatisfaction with the final design, the experience of using the expert system, andwhether he or she would use the tool in a real design context.
The purpose of the three design session format was to determine if the process of using theexpert system was able to positively influence each participant’s final design. During thefirst design session, participants relied primarily on their own intuition and understandingof daylighting in order to create an initial design. Participants were not told how wellthese initial designs performed based on the daylighting goals. During the second session,participants all worked with the same starting design, which in many cases was quitedifferent from their own initial design. During this session, however, participants wereable to view the performance of the model after they applied various changes to it.
One hypothesis of this study was that if participants choose design changes that resultedin improved performance during the expert system session, they might choose to applysome of those design changes to their own designs during the third session. A corollaryof this hypothesis was that if participants made these design changes to their own initialdesigns, the performance of those designs should improve. This improved performancewould indicate that participants were able to learn something about working with day-lighting by using the expert system, and that the process of using the expert system, evenfor a seemingly unrelated model, could influence participants to incorporate certain designelements into their own designs.
8.3.3 Design Problem
This section describes the design problem that participants were asked to work throughduring the user study. This design problem was developed to be of medium level diffi-culty so that designers who were experienced with daylighting concepts could create avery good solution using only their intuition. The problem was meant to be challengingfor those designers who were not experienced with daylighting, but not so difficult as todiscourage them.
The participants were asked to work through a conceptual design for the facade of a schoollibrary wing in Boston, MA which should use natural light instead of artificial light asmuch as possible. Participants were informed that they were taking over the project froma colleague who had already started working on the design. They were required to keepthe original massing model that their colleague had designed (footprint, wall heights, andinterior walls). However, they were allowed to change the facade elements as necessaryto meet the daylighting goals. They were allowed to choose the size and placement ofwindows, the types of glass used, and the types, size, and placement of shading devices.The two facades that were considered were those oriented towards South and East.
The library space has three main areas: 1. A double-height main study area, which shouldreceive lots of light; 2. A smaller study area that overlooks the main study area, which
171

a.
b.
Figure 8.2: Library massing model with (a) example facades and (b) three sensors shown.
172

MONTH Jan Dec
12 am
12 pm
6 am
6 pm
Main Study Room Small Study Room Rare Book Room
MONTH Jan Dec
12 am
12 pm
6 am
6 pm
MONTH Jan Dec
12 am
12 pm
6 am
6 pm
Figure 8.3: Temporal maps for the three sensor planes in the example library model.
should receive an adequate amount of light; 3. A rare book room, in which light must becarefully controlled. The original design and the location of sensors within the space areshown in Figure 8.2. Participants were told that, based on the client’s description of thespace, their firm had decided that the specific daylighting goals they should work towardswere:
• Main Study Space:
– Minimum illuminance levels: 500 lx (desired) down to 400 lx (acceptable).
– No maximum illuminance levels.
• Small Study Space:
– Minimum illuminance levels: 200 lx (desired) down to 0 lx (acceptable).
– Maximum illuminance levels: 800 lx (desired) up to 1000 lx (acceptable).
• Rare Book Room:
– No minimum illuminance levels.
– Maximum illuminance levels: 200 lx (desired) up to 400 lx (acceptable).
Participants were told that if the illuminance on the entire area of a sensor plane falls withinthe desired range during all daylit times of the year, the performance of that sensor wouldbe 100%. As an example, participants were shown temporal maps of the performance ofthe three sensor planes for their colleague’s design (Figure 8.3). From these maps, it is clearthat the main study space has the best performance, although the illuminance is too lowduring parts of the year. The rare book room performs fairly well but the illuminance istoo high during the morning hours throughout the year, except for December and January.
173

The small study space performs the least well out of the three, and it does not receiveenough illuminance during the afternoon over most of the year.
The average performance of each sensor in the colleague’s design were also provided tothe participants:
• Main Study Space: 80%
• Small Study Space: 65%
• Rare Book Room: 70%
• Average of All Spaces: 72%
Finally, the participants were informed that the client had requested a certain aestheticwhich must be maintained. The following design rules were given:
• Windows must be rectangular or square.
• Glass may be normal or translucent, but not tinted with color.
• Shading devices must be opaque, and must be vertical or horizontal.
• Both vertical and horizontal shading devices may be used on the same window.
• No advanced systems may be used.
• It is up to the designer to determine if a uniform facade aesthetic should be main-tained.
• The design should achieve the daylighting goals and also satisfy the designer.
8.3.4 Procedure for Modeling Designs
For this study, it was necessary to determine the performance of models from all three de-sign sessions, including those which the participants completed by hand. Following eachparticipant’s study session, the author constructed SketchUp models of the participant’sinitial and final designs and calculated the performance on all sensor using the LSV sim-ulation engine. The dimensions and locations of windows and shading devices on eachfacade were modeled based on the template sheet drawings. An example template sheetand the corresponding SketchUp model are shown in Figures 8.4 and 8.5, respectively.
174

Figure 8.4: Example template sheet with facade design drawn.
Figure 8.5: SketchUp model based on the filled-in template sheet in Figure 8.4.
175

For glazing types, participants were allowed to check one option in each of two categories,“View” and “Amount of Light Let In,” as described below. The corresponding materialvalues for each choice are:
• View:
– Transparent (Clear View): All specular transmittance.
– Translucent/Frosty (Blurred View): Equal contributions of specular and diffusetransmittance.
– Opalescent/Milky (No View): All diffuse transmittance.
• Amount of Light Let In:
– Most (For ex., Single-Glazed Clear): Total transmissivity = 80%
– Intermediate (For ex., Double-Glazed Low-E): Total transmissivity = 60%
– Least (For ex., Grey Tinted): Total transmissivity = 40%
For example, if a participant selected “Translucent/Frosty” and “Intermediate,” the glaz-ing would be modeled as 30% specular transmissivity and 30% diffuse transmissivity.
8.4 Quantitative Results
To determine performance of each model produced during the three design sessions, theLSV simulation engine was used. For each design, the performance was considered to bethe percentage of the total area of each sensor plane that the illuminance was calculated tofall within the desired goal range, averaged over the whole year. The performance of eachsensor plane was averaged into a single value which represented the total performance ofeach design over the whole year. A design which met all goals would be one for whichthis average value would equal 100%.
8.4.1 Performance of First Session Designs
In the first design session, participants were asked to complete the design problem byhand, using only their intuition. The results of this session are shown in Figure 8.6, wherethe designs have been ordered from least successful to most successful in terms of averagewhole-year performance across all three illuminance goals. Despite staying within fairlyrigid aesthetic constraints, the designers produced a wide variety of designs.
The mean performance of these twelve designs was 73.9%, which is similar to the perfor-mance of the example design shown to each participant (71.9%). As indicated in the chart,six participants produced designs that performed at least 10% above the example, three
176

participants produced designs that performed similarly to the example, and three partic-ipants produced designs that performed well below the example. It is interesting to notethat while the best performing designs were created by participants who rated themselvesas either “experienced” or “intermediate” in working with daylighting, there was no clearcorrelation between the self-rated daylighting experience ranking and performance of theinitial design.
8.4.2 Performance of Designs Generated by the Expert System
In the second design session, participants were asked to use the expert system for a fixedamount of time, starting with the example model. In general, most participants were ableto make four design iterations during the session (one participant was able to make fiveiterations and one was only able to make three iterations). The designs produced and theirperformances during the first two sessions are shown in Figure 8.7.
The mean performance of these twelve designs was 87.6%, and the performances of alltwelve designs were higher than that of the example model, which indicates that everyparticipant was able to improve the performance of the starting model by using the expertsystem. Additionally, eleven out of twelve designs were improved by 10% or more; thedesign which saw the smallest improvement was created by the participant who was onlyable to complete three design iterations during the session. This participant also statedduring the session that he or she consciously choose to explore worse performing optionsdue to aesthetic preferences.
The result that every participant was able to find a better performing design than the start-ing model is important because it demonstrates that the expert system can improve theperformance of designs even when the participants’ unique sets of design choices wereintroduced into the process. Although participants only had a short amount of time tointeract with the system, and although participants were not specifically told to choosedesign changes which improved performance, the expert system was able to find goodsolutions nevertheless.
The range of designs found during this session also hints at how one cannot predict howdesigners will interact with the tool: although all twelve participants began with the sameinitial model and design problem, no two resultant designs were the same after only asmall number of design iterations. This result demonstrates how unique a designer’s indi-vidual set of design decisions may be, even for a simple problem such as that presented inthe user study, and it underlines the value of the user interactivity of the expert system. Itis also apparent from the results of this session that the designs that the expert system canproduce are limited by the starting geometry: all twelve designs shown in Figure 8.7 areclearly derivative of the example model. Nevertheless, it can be seen as a positive result ofthe expert system that the initial geometry is respected in such a way.
Another interesting result of this session is that the performances of the designs found bythe expert system were more uniform than those designed strictly by the participants in
177

A
B
C
D
E
F
G
H
I
J
K
L
0%
25%
50%
75%
100%
A: I
nter
med
iate
Par
ticip
ant
B: E
xper
ienc
edP
artic
ipan
t
C: N
ovic
eP
artic
ipan
t
D: E
xper
ienc
edP
artic
ipan
t
E: I
nter
med
iate
Par
ticip
ant
F: N
ovic
eP
artic
ipan
t
G: N
ovic
eP
artic
ipan
t
H: N
ovic
eP
artic
ipan
t
I: N
ovic
eP
artic
ipan
t
J: E
xper
ienc
edP
artic
ipan
t
K: I
nter
med
iate
Par
ticip
ant
L: E
xper
ienc
edP
artic
ipan
t
Session 1 Original Design
Figure 8.6: Performances for session 1 designs.
178

the first session. Using the expert system, those participants who struggled during thefirst session were able to find designs which performed similarly to the designs generatedby those who were successful in the first session. Additionally, nine out of twelve of thesecond session designs outperformed the designs created by the same participant duringthe first session. In this session, it was found that the expert system was able to effec-tively guide both novices and more experienced daylighting designers towards improvedperformance.
8.4.3 Performance of Final Designs
In the final design session, participants were asked to re-visit the same problem for a thirdtime and to draw their final design by hand. Participants were not restricted and wereallowed to draw inspiration from either or both of the first two design sessions. Theycould also completely start over if desired. It was the hope of the author that participantswould combine their initial design with elements from the expert system design duringthis session to create a better performing final design.
This positive scenario occurred in many of the twelve studies. The results of all three ses-sions are shown in Figure 8.8, and it is clear from this graph that in many cases, particularlyfor those participants who struggled with the first design session, the final design had ahigher performance than the initial design. The mean performance of these twelve designswas 82.9%, which was 9.0% higher than the mean performance of the initial set of designs.
These results are interesting because participants completed both the first and third ses-sions by hand, with no performance feedback. During the second session, participants didnot work with their own initial design, but instead with an example design that may havehad little in common aesthetically with their own initial design. Nevertheless, nine outof twelve designers were able to produce final designs which performed better than theirinitial designs. In many cases, a participant’s final design demonstrated aesthetic quali-ties that reflected both the first and second designs (Figure 8.8, to compare with Figures8.6 and 8.7). This result indicates that the process of using the expert system, even witha generic example instead of their own design, was able to educate some of the designersabout ways in which performance could be improved.
8.4.4 Comparison of Results Between Participants With and Without PreviousDaylighting Experience
One hypothesis of this study was that participants with little to no previous daylighting ex-perience would benefit more from the process of using the expert system than participantswho had more substantial previous experience working with daylighting. The results ofthis study instead indicate that those who benefited the most from the process of usingthe expert system were those who produced the least successful initial designs, and that
179

A
B
C
D
E
F
G
H
I
J
K
L
0%
25%
50%
75%
100%
A: I
nter
med
iate
Parti
cipa
nt
B: E
xper
ienc
edPa
rtici
pant
C: N
ovic
ePa
rtici
pant
D: E
xper
ienc
edPa
rtici
pant
E: In
term
edia
tePa
rtici
pant
F: N
ovic
ePa
rtici
pant
G: N
ovic
ePa
rtici
pant
H: N
ovic
ePa
rtici
pant
I: N
ovic
ePa
rtici
pant
J: E
xper
ienc
edPa
rtici
pant
K: I
nter
med
iate
Parti
cipa
nt
L: E
xper
ienc
edPa
rtici
pant
Session 1 Session 2 (Expert System) Original Design
Figure 8.7: Performances for designs from sessions 1 and 2.
180

A
B
C
D
E
F
G
H
I
J
K
L
0%
25%
50%
75%
100%
A: I
nter
med
iate
Parti
cipa
nt
B: E
xper
ienc
edPa
rtici
pant
C: N
ovic
ePa
rtici
pant
D: E
xper
ienc
edPa
rtici
pant
E: In
term
edia
tePa
rtici
pant
F: N
ovic
ePa
rtici
pant
G: N
ovic
ePa
rtici
pant
H: N
ovic
ePa
rtici
pant
I: N
ovic
ePa
rtici
pant
J: E
xper
ienc
edPa
rtici
pant
K: I
nter
med
iate
Parti
cipa
nt
L: E
xper
ienc
edPa
rtici
pant
Session 1 Session 2 (Expert System) Session 3 Original Design
Figure 8.8: Performances for designs from all three sessions.
181

0%
25%
50%
75%
100%
Session 1 Session 2 Session 3
Group A Mean Group B Mean Group C Mean Original Design Performance
Figure 8.9: Mean performance for Groups A, B, and C for each design session.
these participants did not necessarily consider themselves inexperienced at working withdaylighting.
Based on the performance of their initial designs, the participants can be divided into threegeneral groups: Group A consists of three participants whose initial designs performedworse (more than 20% lower) than the example design, Group B consists of three partici-pants whose initial designs performed about the same as the example (within 3.5%), andGroup C consists of six participants whose initial designs performed better than the ex-ample by 10% or higher. The performance of each of the three groups were the following(also shown in Figure 8.9):
• Group A:
– Mean initial performance: 47.2%
– Mean improvement between sessions 1 & 3: 28.7% (min 21.5%, max 34.4%)
• Group B:
– Mean initial performance: 74.1%
– Mean improvement between sessions 1 & 3: 9.5% (min 2.6%, max 22.7%)
• Group C:
– Mean initial performance: 87.1%
– Mean improvement between sessions 1 & 3: -1.1% (min -10.0%, max 6.4%)
182

These results indicate that the greatest benefits from using the expert system occurred forthose participants whose initial designs performed the least successfully. These resultsare intuitive as there was more room for improvement if participants began with a lowerperforming design than if they began with a high performing design. However, theseresults also demonstrate that the expert system was able to allow those participants whoproduced the weakest initial designs to ultimately produce designs whose performanceapproached those developed by the more successful designers. While the difference inmean performance between Groups A and C was close to 40% for the initial designs, theprocess of using the expert system reduced this difference to only 10% for the final designs.
Additionally, the results show that the mean performance of the Group A final designswas about the same as the mean performance of the Group B initial designs, and like-wise, the mean performance of the Group B final designs was about the same as the meanperformance of the Group C initial designs. Such results indicate that the process of work-ing with the expert system between the first and third design sessions effectively allowedparticipants in the lower two groups to “move up” one group.
It is interesting to note that Groups A and B each consisted of one self-rated novice, oneintermediate and one experienced daylighter. Group C consisted of three novices, one in-termediate, and two experienced daylighters. It is clear that for this particular study, theself-rated experience level of each participant had little to no correlation with the perfor-mance of his or her initial design.
8.5 Qualitative Results of Using the Expert System
In addition to quantitative results based on design performance, the user study producedqualitative results, based primarily on the participants’ responses on the final question-naire and observed behavior of participants during the study. This section includes thesequalitative results as well as a brief analysis of the influence of the expert system on theaesthetics of each participant’s final design.
8.5.1 Influence of the Expert System on Design
The first two questions on the final questionnaire asked the participants how they feltabout their final design, as compared to their first design, when they considered perfor-mance and aesthetics. These two questions were designed to help determine how theprocess of using the expert system during the second design session influenced each par-ticipant’s final design. The participants responses to these questions are shown in Figure8.10. Additionally, each participant was asked directly if the process of using the expertsystem influenced their final design (Figure 8.11).
183

When compared to my initial design, my final design is...
0
1
2
3
4
5
Much better Somewhatbetter
About thesame
Somewhatworse
Much worse
Nu
mb
er o
f Par
ticip
ant R
eplie
s Aesthetics
Performance
Figure 8.10: Participant responses to questions asking them to compare their final designto their initial design.
Did using the expert system influence your final design?
0
2
4
6
8
Greatly Somewhat Not at all
Nu
mb
er o
f P
arti
cip
ant
Rep
lies
Figure 8.11: Participant responses to question asking them if their final design was influ-enced by the process of using the expert system.
184

From Figure 8.11, one can note that eleven out of the twelve participants felt that they wereat least somewhat influenced by the process of using the expert system, and that four par-ticipants were greatly influenced. Figure 8.10 indicates that, in general, the participantsfelt that their final designs performed better or the same as their initial designs, but thatthe aesthetics of their final designs were the same or worse than their initial designs. Theseresponses indicate that in many cases, the expert system may have influenced the design-ers to sacrifice aesthetics in some way for performance, despite the fact that they were toldduring each design session that they were supposed to try to meet the daylighting goalsand to satisfy themselves as a designer.
Additionally, it is worth noting that the designers did not actually know if their final de-sign outperformed their initial design; instead, the final questionnaire asked them onlyif they “felt” that their final design performed better. In nine out of twelve studies, theparticipant’s response about whether their final design performed better was correct. Thisresult is interesting because it indicates that the process of using the expert system mayhave helped the designers develop a small amount of intuition about the design problem.
An analysis of the aesthetics of the designs themselves confirms that in many cases, theparticipants seem to have been influenced by the design changes proposed to them by theexpert system during the second session. It is striking that in most cases, the initial andfinal designs do resemble each other more than they resemble the second design. Throughthe three sessions, the initial design aesthetic of almost all participants was maintained. Inmany cases, certain elements of the second design appear to have also been incorporatedinto the final design. One clear example is removal or minimizing of windows on thenorthern end of the east facade, which is a common characteristic of many of the designsgenerated in the second session by the expert system. In designs A, B, C, D, F, I, K andL, such a design change is visible between the first and final models (Figures 8.6 and 8.8).In seven out of those eight cases, the performance of the final design was also found to bebetter than that of the initial design (and in the one case where performance was decreased,it was only lowered by 1%).
8.5.2 Educational Value
It was shown using quantitative data that the process of using the expert system helpedmany of the participants improve their designs, particularly those whose initial design didnot perform successfully. Participants were also asked two questions on the final question-naire about the educational value of using the expert system: first, whether they thoughtthat they learned something new which helped them approach the specific design prob-lem, and second, whether they thought that they learned something new about daylight-ing in general. The responses to these questions are shown in Figure 8.12.
It is clear from Figure 8.12 that the majority of participants responded that they learned a“small amount” about both the specific design problem and about daylighting in general.That they learned a “small amount” rather than a “large amount” may be partially the
185

Did you learn something new?
0
2
4
6
8
10
Large amount Small amount No
Nu
mb
er o
f P
arti
cip
ant
Rep
lies
About the specific design problem About daylighting in general
Figure 8.12: Participant responses to questions about the educational value of the expertsystem.
result of having only a limited amount of time (40 minutes) to work with the tool. Addi-tionally, it is likely that if the question had been re-phrased to include one or two otherpossible responses (for example, “moderate amount”), the diversity of responses wouldhave increased.
Nevertheless, the fact that the majority of participants claimed to learn even a smallamount during their limited time with the expert system is a positive result. It is alsointeresting to note that although two participants claimed that they did not learn anythingnew about the design problem by using the expert system, these two participants werethose who saw the highest amount of improvement between their initial and final designs(30.2% and 34.4%). These two participants also both responded that their final design per-formed “much better” than this initial design, so the fact that they claimed to have learnednothing from the expert system is puzzling.
8.5.3 The Expert System as a Design Tool
Participants were asked two questions on the final questionnaire which helped determinewhether they were satisfied with the expert system as a design tool: first, whether theywould consider using the expert system again for a studio project, and second, whetherthey would consider using the expert system again for a professional design project. Theparticipants’ responses to these questions are shown in Figure 8.13.
186

Would you use the expert system again?
0
1
2
3
4
Definitely Probably Undecided Probably Not Definitely Not
Nu
mb
er o
f P
arti
cip
ant
Rep
lies
Studio Project Professional Project
Figure 8.13: Participant responses to questions asking them if they would consider usingthe expert system again.
For both studio and professional projects, about two-thirds of the participants respondedthat they would consider using the expert system. Given the limited amount of time andcontrol that participants had in using the expert system during the study, this is a positiveresult. Additionally, although some participants were “undecided”, there were no partic-ipants who responded that they would “definitely not” use the tool for a future project,and only two participants replied that they would “probably not” use the tool for a pro-fessional project. The reasons given for these negative responses were the lack of complexgeometries that the expert system was able to consider, and in one case, a lack of trust inthe expert system advice. It is worth noting that the participant who lacked trust in the toolwas able to improve the performance of his or her design by more than any other partici-pant, so this lack of trust was without cause. In general, the responses to these questionsindicated mostly positive reception of the expert system.
8.5.4 Additional Participant Feedback
The final questionnaire allowed participants to comment on their responses to the multiplechoice questions and to write in their general likes and dislikes about the expert systemtool.
187

In general, the most popular responses were:
• Likes:
– The interactive graph with bar representation of performance, which provideda way to track performance over multiple iterations.
– That the expert system provided a way to test the relationship between a certaindesign change and performance.
– The interface itself and the ease of its use.
• Dislikes:
– The limited number of design changes that the expert system could suggest.
– The limited geometry that the expert system could handle.
• Some participants liked, some disliked:
– The speed of simulations (in general, those who were familiar with more ad-vanced simulation programs were impressed, while novices thought the systemwas slow).
– Temporal maps representation of performance (some preferred a spatial map).
– The automated design changes (some would have preferred to make their owndesign changes by hand).
Overall, most of the responses were positive, and the participants seemed to respond wellto the expert system design process and interface.
8.5.5 Observed Behavior
During the study, the participants were not asked to explain their design decisions or thechoices they made while interacting with the expert system, but many participants choseto talk about their thought process aloud nonetheless. Additionally, the author was able toobserve the behavior of the participants when they used the expert system.
One result that became apparent after several user studies had been completed was thateach participant behaved differently and made different choices. For example, one partic-ipant mentioned explicitly that he or she did not plan to use the expert system to improveperformance, but rather to simply explore aesthetic changes that might actually decreaseperformance. Another participant chose not to change anything about his or her initialdesign when asked to create a final design, stating that the process of using the expertsystem had verified his or her original design ideas. Several participants had specific de-sign changes in mind to try out with the expert system and used the tool to test out thoseoptions.
188

In general, the following behavior was observed of nearly all participants:
• They selected a design change that was the first presented by the expert system forthe first iteration.
• They selected a design change that wasn’t the first presented by the expert system forsubsequent iterations.
• They selected a design change with lower performance than another option due toaesthetic preference.
• They did not return to a previous iteration of the design (likely due to limited timeallotment).
As mentioned previously in section 8.4.2, one unexpected outcome of the study was thatno two participants used the expert system in exactly the same way, i.e. all participantsmade different sets of decisions. One consequence of this behavior was that the final de-sign found by each participant was unique. This result was somewhat surprising becausethe author assumed that some of the novice users might use the expert system as an opti-mization method rather than as a design tool by choosing only the first design suggestiongiven at each step and by always accepting the best performing option. Instead, however,it was found that all participants had strong opinions of their own about which designchanges to try and about how their final design should look. This type of behavior helpsto demonstrate why many designers would not readily accept a design solution generatedby a “black box” algorithm. Instead, the highly interactive nature of the expert systemallowed each participant to remain actively involved in the expert system design processby retaining control over design decisions. It is the belief of the author that the mostlypositive responses given during the final questionnaire were due to the interactive natureof the expert system tool.
One possible limitation of the user study presented in this chapter is the short amountof time that each participant was able to spend designing and interacting with the expertsystem. Because the sessions were restricted to a maximum of two hours, the designersmay not have been able to respond as creatively as they may have been with more time. Inmany design situations, the designer is allowed to assess and re-design many times beforeselecting a final design (see Chapter 3). Therefore, some of the observed behavior may nothave been indicative of how participants would have reacted in a less formal and less time-constrained environment. Nevertheless, the study was able to provide a small glimpse atthe nature of the human design process and how human designers might respond to a toolsuch as the expert system.
8.6 Strengths and Limitations of the Expert System for Design
The user study provided valuable feedback on the use of the expert system as a methodthat can improve performance and as a design tool. Overall, the results of the study were
189

mostly positive. Based on these results, conclusions can be made about the expert systemas a user-interactive method and as a potential design tool.
The strengths of the expert system for use as a design tool are the following:
• The expert system was able to find better performing solutions than the initial designeven when human interactions and unique sets of design decisions were added intothe process.
– In the second design session, all twelve participants made unique sets of designdecisions, producing twelve different designs which all performed better thanthe initial design.
– Improved performance occurred even when participants explicitly stated thatthey were working towards aesthetics that they preferred instead of perfor-mance.
• The expert system provided some educational value to most participants.
– The majority of participants reported learning at least a “small amount” aboutboth the specific design problem at hand and about daylighting in general.
– Those participants that didn’t report learning anything about the specific designproblem were able to improve the performances of their designs by an averageof over 30%, indicating that they may indeed have learned something but notrealized it.
• The expert system positively influenced the final designs of most participants.
– Most participants reported that their final design was influenced by the processof using the expert system.
– The aesthetics of many of the final designs are reminiscent of the aesthetics ofthe initial designs with certain specific elements influenced by the designs pro-duced by the expert system.
– The mean performance of the set of final designs was closer to the mean perfor-mance of the designs produced by the expert system than of the performance ofthe initial designs.
• By using the expert system, designers with poor initial daylighting intuition maybe able to produce designs which perform similarly to those produced by designerswith good daylighting intuition.
– The designers with the lowest initial performances achieved the highest amountof improvement with their final designs.
190

• Many participants would use the expert system again in a studio or professionaldesign context.
The limitations of the expert system for use as a design tool are the following:
• The expert system only considers performance, not aesthetics.
– Close to half of the participants responded that the aesthetics of their final de-sign was worse than that of their initial design. The expert system process seemsto have influenced some of the participants to sacrifice aesthetics for perfor-mance.
• The expert system has a limited number of design changes in its knowledge base thatit can offer as suggestions.
– This limitation was cited by nearly all participants who responded that theyprobably would not use the expert system for an actual design project.
– Some participants had design changes in mind that were not offered in the list(for example, adding blinds instead of overhangs).
• The expert system only works on a restricted set of initial geometries.
– Some participants liked the expert system but did not believe that they coulduse it for the more complex types of projects that they typically would design.
• Due to the user-interactivity allowed, the expert system will not always improveperformance.
– Users may elect the explore only those design changes which decrease perfor-mance, and the expert system currently has no checks in place to discourageusers from doing so. This is actually a a positive feature because it allows de-signers freedom to explore and may provide educational value even if perfor-mance is decreased; however, it could also be seen as a limitation in scenarioswhere designers have a limited amount to time to work with the system andcannot find good solutions efficiently.
• The expert system may not be helpful to those designers who already have very gooddaylighting intuition. However, the extent of this limitation is strongly dependenton both the daylighting intuition of the designer and the complexity of the designproblem, which was about average for the user study.
191

8.7 Chapter Summary
This chapter presented an evaluation of the expert system as a user-interactive method forperformance-driven exploration and as a design tool, based on the results of a user study.During the user study, twelve designers were asked to solve a design problem with multi-ple daylighting goals, first using their own intuition, and second, using the expert system.The designers were then asked to solve the design problem a third time, again using theirown intuition. This study procedure was developed to discover if the expert system hadpositively influenced the performance and aesthetics of the final designs, as compared tothe initial designs. The study participants were also asked to fill out a questionnaire whichallowed them to assess their own designs and their experiences using the expert system.
The results of the user study were generally positive and indicated that many of the majorgoals of the expert system as a user-interactive tool were met. One important result wasthat every participant was able to find a design with improved performance during theirsession with the expert system. While Chapter 7 verified that the expert system couldsuccessfully work towards improved designs in the absence of a human user, this studydemonstrated that the expert system algorithm is also successful when human input isincluded in the process.
Another important result of the user study was that many of the participants were posi-tively influenced by the process of using the expert system. Most participants also seemto have learned something about the specific design problem which allowed them to intu-itively develop better performing designs after they had interacted with the expert system.These results were supported by both the data and by participant response. A final impor-tant result is that the majority of the participants responded that they would use the expertsystem again for a studio or professional design project. These responses demonstrate thatthe participants may have accepted the expert system as a design tool.
In this chapter, the results of a limited evaluation demonstrated that the expert system wasgenerally successful as a performance-driven design tool and as a method for influencingand educating designers in ways that they can improve the daylighting performance oftheir designs.
192

Part IV
Conclusions
193

194

Chapter 9
Conclusions and Future Work
9.1 Summary of Results
This dissertation presented a new user-interactive expert system approach which enablesarchitects to consider daylighting goals in the early design stages by engaging them in aperformance-driven design exploration process. The main results of this project can bediscussed in three parts: 1.) the development of the expert system methodology, includingthe daylighting knowledge base and fuzzy logic rules; 2.) an assessment of the expertsystem as a decision-making algorithm, as compared to a true optimization algorithm;and 3.) the application of the expert system as a design tool and as a method which can beintegrated into the design process.
9.1.1 Daylighting Expert System Methodology
The expert system developed for this dissertation was a fuzzy rule-based system combinedwith an external database of previously computed daylighting simulation data, also calledthe daylighting knowledge base. Below is a summary of each of the major components ofthe system:
• The daylighting knowledge base, described in detail in Chapter 4, was populated us-ing simulations from a set of 512 models with differing facade characteristics basedon the Design of Experiments method. For each model, illuminance and a model-based approximation of the daylight glare probability (DGPm) were calculated infive different zones within the space (and four different views from within eachzone for the glare metric), over the whole year. These climate-based metrics werecalculated using LSV, the simulation engine native to the Lightsolve program. Theknowledge base contains information about the relative effects of ten different facadeparameters on each of the two daylighting metrics from the various zones and viewswithin the space.
195

• The expert system rule base, described in detail in Chapter 5, is a decision-makingalgorithm that assesses a specific design situation and generates a list of suggesteddesign changes which should improve the current performance. This list is basedon a large number of initial inputs, including a 3d model of an original design, userpreferences for performance goals and goal priorities, the simulated goal-based per-formance metrics, and a customized daylighting database, populated using only themost relevant data found in the daylighting knowledge base. The rule base usesfuzzy logic, which allows it to better emulate the human thought process than clas-sical logic, and it has been developed to be a flexible algorithm which can accommo-date a wide variety of initial design scenarios. The system was also created in such away that it requires user interaction and user inputs in order to function.
• The expert system has been implemented within the framework of the Lightsolveproject and has a functional, stand-alone interface which allows designers to interactwith the system. The interface has been designed to provide a clear and intuitiveway of communicating the current performance of a model and the list of designchanges suggested by the expert system. The interface also allows designers to viewthe performance of their design over multiple iterations of the exploration process.Within the system, a simple building data model has been developed to enable au-tomated design changes and to provide additional information about the geometryand material properties of the current design to the decision-making algorithm. Theimplementation of the system is described in detail in Chapter 6.
9.1.2 Assessment of the Expert System as a Decision-Making Algorithm
The expert system was shown to be successful at making design decisions which improvedthe daylighting performance of various case study designs, described in detail in Chapter7. In these case studies, the performances of designs found using the expert system werecompared to baseline examples generated by a micro-genetic algorithm (micro-GA). Thepurpose of the comparison studies was to evaluate the performance of the expert systemrelative to a known optimization algorithm which could be relied upon to consistentlygenerate designs with very good, if not globally optimal, performance. Nine scenarioswere considered, ranging from simple designs with a single performance goal to morecomplex designs with multiple conflicting goals. The results of these case studies indicatedthat the expert system was successful at improving the performance of designs for a varietyof initial conditions and performance goal scenarios. In some situations, the micro-GA wasable to find designs which performed slightly better than those found using the expertsystem, but this difference in performance was small (7.5% at most for all case studiesconsidered) and acceptable given the fact that the expert system was designed with user-interactivity in mind, which the micro-GA was not.
Two additional short studies were completed which investigated the effect of initial facadeconditions and the effect of user-selected window uniformity constraints on the perfor-mance of the expert system. In the first study, it was found that although the initial facade
196

design may affect the expert system performance, the system was still able to improve per-formance for even highly designed facades. Additionally, the difference between the bestperforming design found using on a generic facade and that which was generated basedon a highly designed facade was small (6% for the case studies considered). In the secondstudy, it was found that the window uniformity scheme selected by a user can have a sig-nificant effect for certain types of model geometries. For models in which the sensor planesare located parallel to the facades of interest, the selected window uniformity scheme hadlittle effect on the performance of the expert system. For models in which the sensor planesare located perpendicular to the facades of interest, the non-uniform window scheme se-lection was found to significantly improve expert system performance (by over 10% in thecase study considered).
9.1.3 The Expert System as a Design Tool
Because the expert system was developed to be a user-interactive tool, a critical part of thisdissertation was to assess the system for use by human designers. Chapter 8 describeda user study which was conducted to determine how well the expert system decision-making algorithm would work when independent human interactions and decisions wereincluded into the process. The study also tested how well designers responded to thesystem and if they were able to benefit from it.
The results of this study were largely positive and indicated that the expert system wassuccessful as a user-interactive design tool. One important result was that all participantswere able to improve the performance of an initial design, despite each making a uniqueset of choices while using the tool. Many participants reported being influenced by theprocess of using the system, and these responses were verified by the aesthetic choicesthat the participants made. Many participants also responded that they felt they learnedsomething about the specific design problem and about daylighting in general while usingthe expert system tool, and this result was confirmed by the performance improvementsthat were achieved by many participants. Finally, many of the participants claimed thatthey would use the expert system again for either a studio or professional project, whichsupports the idea that the expert system may have been accepted by many of the designersas a design tool.
9.2 Future Work
While the expert system was found to be successful at providing a guided design explo-ration process based on daylighting goals, it also provides a foundation for future work:
• Expansion of the current system: The expert system developed for this dissertation wasa prototype tool which can consider two daylighting metrics, illuminance and glare,
197

for designs specifically located in Boston, MA (USA). The current system could actas a framework for future expansion in areas such as:
– Addition of more locations, which can be added in one of two ways: a.) the cre-ation of new climate-specific knowledge bases using the method described inChapter 4, or b.) the creation of a more generic meta-database, which could po-tentially be designed to be applicable to multiple locations using weight factorsbased on climate and latitude.
– Addition of a larger set of possible design changes and geometries, which couldbe added by creating an expanded knowledge base. Such a database couldbe populated in a similar way to the current knowledge base, using the DoEmethod with a larger set of variables. Due to the structure of the expert sys-tem, which reads the knowledge base data from a text file kept separate fromthe coded logic, an expanded knowledge base could be added into the currentsystem with only a small amount of editing to the code, mostly to accommo-date the addition of new automated design changes. The addition of a signifi-cantly larger knowledge base could potentially increase calculation time; how-ever, such an increase would likely be negligible compared to the simulationtime.
– Introduction of two-way interaction effects data into the knowledge base. Theraw data used to create the knowledge base can yield two-way interaction ef-fects, as described in section 4.7. This data could be introduced into the main ef-fects database directly and each pair could be considered as one “design action”(for example, remove overhangs and make windows larger). Alternatively, itcould be used by the expert system decision-making algorithm to better deter-mine which design changes to suggest based on a previously selected designchange.
• Performance metrics for perception and visual interest: One missing piece of informationin the current system is the perceived quality of light, i.e. the level of visual interestthat an occupant might have in the space. Although the expert system does producerenderings of views within the space, it is the responsibility of the designer to deter-mine whether the quality of light in the space is high. One possible area of futurework is the design of a method which would guide designers towards improved vi-sual interest in addition to daylighting performance. Due to the highly subjectivenature of the idea of visual interest and the many different ways in which quality oflight may be defined, such research would be difficult to develop. Quality of light isdependent on a variety of factors, including quantitative metrics such as those con-sidered in this thesis as well as more general information such as the type of building,the programmatic use of a space, the cultural context (i.e. the visual preferences of thelocal population), and the preferences of individual occupants. Other factors whichmay affect light quality and visual interest include the color(s) of light, the patternsof light distribution across a space, the changing of light distributions over time, and
198

the ways in which the light supports the architectural design and organization of thespace.
• Addition of thermal or energy metrics: While the current system considers only day-lighting performance, it could be possible to expand the system to consider perfor-mance in other domains by considering solar thermal gains or building energy use.The solar thermal gains metric can already be calculated using the LSV engine, whilebuilding energy use could be calculated using an existing Google SketchUp func-tionality such as the EnergyPlus plug-in (OpenStudio, 2010). The addition of newmetrics would require a substantial expansion of the current system, including thedevelopment of new knowledge bases and new fuzzy logic rules to work with theadditional information. More research would be required to assess the feasibility ofsuch a scheme.
• Introduction of the system into the design community: The current system has been testedin a limited study involving a small group of participants who have design experi-ence but who are all currently working in an academic environment. In the future,it would be beneficial to test the expert system with more designers in more variedsettings. For example, the system could be tested by students in a course setting foreducational value, or it could be tested by designers who are currently practicing. Agoal of the author’s is to ultimately introduce the expert system tool in the designcommunity as an extension of the Lightsolve project.
9.3 Broader Outlooks
The earliest expert systems developed for architectural problems were introduced close to30 years ago. Unfortunately, such systems have yet to gain the popularity of other digitaldesign tools, such as 3d modeling or simulation programs. At this stage in time, thereexists a very large number of digital building design and simulation tools, and they covera tremendous range in terms of simulation domains, features and functionalities, ease ofuse, and target user type. At present, certain types of “intelligent” tools are gaining pop-ularity, such as Building Information Models (BIMs) and computer-based design methodssuch as algorithmic, generative, and parametric design. Designers are increasingly lookingtowards computer programs to aid in their design process, and there is an opportunity forexpert systems to become more prevalent in architectural practice.
There are many ways in which expert systems could be useful to designers today. How-ever, any new systems must consider the digital design environment and the demands ofthe modern designer. One way in which this thesis attempted to create a more designer-friendly expert system tool was to combine it with a known 3d modeler, Google SketchUp,and to allow users to model their own design instead of relying on a set of generic choices.Because the method proposed in this thesis was created to be relevant to specific designs,it was necessary to rely on a simulation engine which many of the user study participants
199

found too slow for use in a professional environment. A possible alternative to the pro-posed system could be a very fast expert system tool which uses generic designs and isable to provide feedback in many different domains at once (for example, daylighting,energy consumption, energy costs, and LEED compliance). Instead of calculating quanti-tative data, such a system could generate qualitative diagnostic information, similarly tothe Leso-DIAL tool (Paule and Scartezzini, 1997). A quick diagnostic expert system couldquickly gain popularity if it could be combined with a popular BIM, such as Revit (Au-todesk, 2010).
Another possibility for the future of expert systems is to use such systems to help designerswork more accurately with simulation programs. Because expert systems are traditionallyrule-based, they are well-suited to diagnostic problems, such as determining when a usermay have input incorrect values into a simulation program or when the simulation resultsare not of the correct order of magnitude based on a building’s program, square footage,and climate. Simple diagnoses could also be included to guide designers towards betterdesign decisions at a more general level than the method presented in this thesis.
Finally, as shown in this thesis, expert systems may be valuable as tools which can engagedesigners and interactively guide them towards improved performance. One possibilityfor including expert systems into the design process in a different way is to combine themwith other types of guided digital design processes, such as parametric or generative de-sign. While some parametric design methods, such as DIVA (Lagios et al., 2010), havealready begun to include performance information, there are no current systems whichfeed performance information back into the algorithm itself, and there is great potentialfor expert systems to be used as a guide for parametric algorithms to help them explorebetter performing designs. As the expert system proposed in this study was only able toexplore relatively traditional architectural forms (floorplans and window shapes with or-thogonal angles only), a system which combines an expert system with a parametric toolwould have the additional benefit of being able to explore more interesting forms.
As a final note, the questions of how designers interact with expert systems and how suchtools can be evaluated should be considered more broadly. This dissertation included ashort study involving designers to evaluate the proposed daylighting expert system tool,but more work in this area would be beneficial for all new systems. Such research couldconsist of surveys or interviews with designers, or studies or workshops in which design-ers are asked to interact with digital tools. The results could be used to determine howresearchers can make future expert systems more designer-friendly and thus, more likelyto be used.
9.4 Final Remarks
This dissertation has presented a user-interactive expert system for improving daylightingin architectural designs. Although much of this work has focused on the development
200

of the method and accompanying tool, it is important to point out that the position of thearchitect as the final decision maker in any design process was fundamental to the develop-ment of this work. The expert system was designed to respect the designer and to supporthis or her process by providing performance information and intelligent design proposals.Ultimately, the goal of this work was to inspire the creative process in a novel way, not bydeveloping a tool that would replace the role of the designer, but by establishing a newtype of dialogue between the designer and the expert system tool.
201

202

Part V
Appendices
203

204

Appendix A
Expert System Modeling Guidelines
In order for the expert system to understand a 3d massing model correctly, the model mustconform to the following guidelines.
• Modeling a Space:
– All walls, floors, and ceilings must be opaque. Windows must be transparent ortranslucent.
– The normal vectors of walls, windows, floors, and ceilings should point towardsthe interior of the space.
– Facades must all face cardinal directions and must be orthogonal to each other.
– All models must be watertight.
– At present, interior walls can be modeled and simulated correctly but the expertsystem will not recognize or consider them.
• Special Materials:
– Any plane that represents an external shading device must have the word “EX-TERNAL” in its material name. External shading devices must be completelyopaque.
– Any plane that represents a window must have the word “GLASS” in its ma-terial name. Users may specify normal transmissivity using the opacity valueof the material in SketchUp (for example, opacity of 20% will result in glasstransmissivity of 80%). Alternatively, users may specify both specular and dif-fuse transmissivity using the following naming convention: “GLASS_Sx_Dy”,where x is the percentage of regular transmissivity and y is the percentage ofdiffuse transmissivity. The sum of x and y cannot exceed 100%. For example,“GLASS_S60_D20” refers to a glass type which have 80% total transmissivity,which includes 60% specular transmission and 20% diffuse transmission.
205

• Modeling Sensors:
– The normal vectors of sensors should point towards the direction in which illu-minance or glare will be measured (for example, to measure illuminance on ahorizontal surface from above, the sensor should point upwards).
– Illuminance sensor planes must be vertical or horizontal 2D planes and mustinclude the word “SENSOR” in their material names. A valid material name foran illuminance sensor is “SENSOR_Classroom.”
– Glare sensor planes must be vertical 2D planes and must include the term“GLARE_SENSOR” in their material names. A valid material name is “SEN-SOR_SouthView.”
– Sensors may be opaque or transparent. Opaque sensors will block light likenormal opaque surfaces, while transparent sensors will measure illuminance orglare over a surface which does not block light. A transparent sensors must bemodeled with its material opacity set to 0% and must include the word “INVIS-IBLE” in its material name. For example, valid transparent sensor names are“INVISIBLE_SENSOR_Classroom” and “INVISIBLE_SENSOR_SouthView.”
206

Appendix B
User Study Materials
This appendix contains the materials used during the user studies, including the designbriefs, template sheets, and questionnaires.
207

Design Session 1 You are an architect in a design firm and have been assigned to work through a conceptual design for the façade of a school library wing for a building in Boston, MA. The client wishes to use natural light instead of artificial light as much as possible. You will be taking over the project from a colleague who has already started working on the design. You have been told that you must keep the original massing model (footprint, wall heights, and interior walls). You may change the façade elements as much as you need to in order to create a design which meets the daylighting goals. This means that you can choose the size and placement of windows, the types of glass used, and the types, size, and placement of shading devices. The two façades you will be working with face South and East. The client has indicated that a certain aesthetic must be maintained: - Windows must be rectangular or square. - Glass may be normal or translucent, but not tinted or colored. - Shading devices must be opaque, and must be vertical or horizontal. - Both vertical and horizontal shading devices may be used on the same window. It is up to you to determine if the windows on each façade should all be the same or if some of them are different. No advanced systems may be used. The library space has three main areas:
1. A double-height main study area, which should receive lots of light 2. A smaller study area which overlooks the main study area, which should receive
an adequate amount of light 3. A rare book room, in which light must be carefully controlled
On the attached sheet, you will find an image of the current design, along with the specific illuminance goals you should try to meet and the location of the illuminance sensors within the space. Sensors are all at workplane height. Please spend 20 minutes working on a design for this space. At the end of this time, you will need to draw your final facade design on the provided template sheet and submit it to the investigator. You may use any of the provided materials if desired; however, it is not required that you do so. You should mainly be designing using your own knowledge and intuition about daylighting. Please remember that this design is one intended to achieve the daylighting goals and also satisfy you as the designer.
Figure B.1: Design Session 1 brief, page 1.
208

Current Design
Figure B.2: Design Session 1 brief, page 2.
209

Figure B.3: Design Session 1 brief, page 3.
210

Illuminance Goals for Library Based on the client’s description of the space, your firm has decided that the specific daylighting goals you should work towards are:
1. Main Study Space: a. Minimum illuminance levels: 500 lx (desired) down to 400 lx (acceptable) b. No maximum illuminance levels
2. Small Study Space a. Minimum illuminance levels: 200 lx (desired) down to 0 lx (acceptable) b. Maximum illuminance levels: 800 lx (desired) up to 1000 lx (acceptable)
3. Rare Book Room a. No minimum illuminance levels b. Maximum illuminance levels: 200 lx (desired) up to 400 lx (acceptable)
If the illuminance on the entire area of a sensor plane falls within the desired range during all daylit times of the year, the performance of that sensor will be 100%.
Performance of Current Design The current design has been previously simulated to evaluate performance. The average performance over the whole year is: Main Study Space: 80% Small Study Space: 65% Rare Book Room: 70% Average of All Spaces: 72%
The temporal maps for each space look like this:
Main Study Room Small Study Room Rare Book Room Red indicates illuminance that is too high on the sensor plane. Yellow indicates illuminance in range on the sensor plane. Blue indicates illuminance that is too low on the sensor plane.
MONTH Jan Dec
12 am
12 pm
6 am
6 pm
MONTH Jan Dec
12 am
12 pm
6 am
6 pm
MONTH Jan Dec
12 am
12 pm
6 am
6 pm
Figure B.4: Design Session 1 brief, page 4.
211

Design Session 2
Your supervisor has just come by your desk to tell you that she would like you to try out a new performance-based design system that her friends at MIT have developed. The system will start with an original design and suggest design changes that should improve the daylighting performance. If you select a design change, the system will automatically make that change for you in the model and simulate the performance. You will be able to see the performance of the current design at all times. Your supervisor would like you to put your design aside for awhile and start over with your colleague’s previous design. She says that you may accept or decline any design change, perform as many design changes as you’d like within the time limit, or go backwards to a previous design if you find that you do not like where the design process takes you. Please interact only with the interface for this exercise, and do not attempt to change the model yourself in SketchUp. You are allowed 40 minutes to use the design system. At the end of that time, your supervisor would like you to choose your favorite design and report it to the investigator. Please note: It is more likely that a suggested design change will improve performance if you do not skip the first suggested change or if you only skip once. Simulations may take up to 10 minutes until completion. While simulations are running, you are welcome to relax, sketch, or read any of the provided reading materials. Please refrain from using your cell phone or other devices during this time. If you encounter any difficulties using the software, please do not hesitate to ask the investigator for assistance.
Figure B.5: Design Session 2 brief.
212

Design Session 3 Your supervisor would like you to submit a final design to move into the schematic design phase. You are allowed to re-visit your original design, to re-visit the design that was generated using the expert system, or to completely start over. You are allowed 15 minutes to create this final design. At the end of this time, you will need to draw your final design on the provided template sheet and submit it to the investigator. As before, you may use any of the provided materials if desired; however, it is not required that you do so. You should mainly be designing using your own knowledge and intuition about daylighting. Please remember that this design is one intended to achieve the daylighting goals and also satisfy you as the designer.
Figure B.6: Design Session 3 brief.
213

East Facade Elevation
South Facade Elevation
FACADE DESIGN TEMPLATE - ELEVATIONS
1 ft1 ft
Scale:
Please draw windows and shading devices on each elevation. Please draw shading devices on each plan view. Please label each window with a letter.
East Facade Plan View (For Shading Devices)
South Facade Plan View (For Shading Devices)
Figure B.7: Design template, sheet 1.
214

Shading Devices - Draw one section per shading device type.
Glass Types - Check the appropriate box in each section. Use one column per glass type.
FACADE DESIGN TEMPLATE - SHADING DEVICES AND GLASS TYPES1 ft
1 ft
Scale:
Window(s): Window(s): Window(s):
Window(s):
Transparent (Clear View)
Translucent/Frosted (Blurred View)
Opalescent/Milky (No view)
Specify the appropriate windows using the letters from the elevation drawings.
View (Choose One):
Most (For ex. Single-Glazed Clear)
Intermediate (For ex. Double-Glazed Low-E)
Least (For ex. Grey Tinted)
Amount of Light Let In (Choose One):
Window(s):
Transparent (Clear View)
Translucent/Frosted (Blurred View)
Opalescent/Milky (No view)
View (Choose One):
Most (For ex. Single-Glazed Clear)
Intermediate (For ex. Double-Glazed Low-E)
Least (For ex. Grey Tinted)
Amount of Light Let In (Choose One):
Window(s):
Transparent (Clear View)
Translucent/Frosted (Blurred View)
Opalescent/Milky (No view)
View (Choose One):
Most (For ex. Single-Glazed Clear)
Intermediate (For ex. Double-Glazed Low-E)
Least (For ex. Grey Tinted)
Amount of Light Let In (Choose One):
Figure B.8: Design template, sheet 2.
215

INTRODUCTORY SURVEY: I. Please tell us about your experiences in design, daylighting, and simulation: 1. Please circle Yes or No: a. I have completed one or more architectural studio courses. Yes / No If Yes, how many?__________________ b. I have experience working in an architecture firm. Yes / No If Yes, for how long? ________________ c. I have considered daylighting during one or more studio projects. Yes / No d. I have considered daylighting during one or more professional projects. Yes / No e. I have used daylighting simulation for one or more studio projects. Yes / No f. I have used daylighting simulation for one or more professional projects. Yes / No 2. Please select the most appropriate statement: a. ___ I consider myself to be an experienced designer. ___ I consider myself to be an intermediate designer. ___ I consider myself to be a novice designer. ___ I do not consider myself to be a designer. b. ___ I consider myself to be experienced at working with daylighting. ___ I consider myself to be intermediate at working with daylighting. ___ I consider myself to be a novice at working with daylighting ___ I do not consider myself to be someone who works with daylighting.
Figure B.9: Introductory questionnaire, page 1.
216

3. Please rate your level of experience using the following simulation programs by checking the appropriate box (please check only one per row):
Software Title
I consider myself
an expert at
using this
program.
I have used this
program frequently
and am comfortable
using it.
I have used this
program infrequently
and am comfortable
using it.
I have used this
program infrequently
and I am not
comfortable using it.
I have heard of
this program
but never
used it.
I have never
heard of this
program.
Radiance DaySim Ecotect AGI32 3D Studio Max Mental Ray Daylight
Lightscape LESODial Lightsolve Other (please specify: __________)
4. Do you use any daylighting simulation programs during the early design stages (conceptual or schematic)? If so, which one(s)? 5. Do you use any daylighting simulation programs during the later design stages (design development)? If so, which one(s)? 6. Do you use any daylighting simulation programs for analysis only during the final stage of design? If so, which one(s)?
Figure B.10: Introductory questionnaire, page 2.
217

II. Please tell us about your education level: 1. I have previously completed (please check all that apply): __ B.Arch. __ B.A. or B.S. in Architecture __ B.A. or B.S. in Architecture with Building Technology concentration __ B.A. or B.S. in Other Major (please specify): __________________ __ M.Arch. __ M.A. or M.S. in Architecture __ MS in Building Technology, Building Science, or similar __ SMarchS (please specify which area): _________________ __ Other Master’s level degree (please specify): ________________ __ PhD in Architecture __ PhD in Building Technology __ Other degree not listed (please specify): __________________ 2. I am currently working towards (please check all that apply): __ B.Arch. __ B.A. or B.S. in Architecture __ B.A. or B.S. in Architecture with Building Technology concentration __ B.A. or B.S. in Other Major (please specify): __________________ __ M.Arch. __ M.A. or M.S. in Architecture __ MS in Building Technology, Building Science, or similar __ SMarchS (please specify which area): _________________ __ Other Master’s level degree (please specify): ________________ __ PhD in Architecture __ PhD in Building Technology __ Other degree not listed (please specify): __________________ 3. Please select the most appropriate statement (please check one): __ I have never taken a course that involves daylighting in architecture __ I have learned about daylighting in one or more studio or survey courses __ I have taken one or more courses devoted exclusively to daylighting
Figure B.11: Introdcutory questionnaire, page 3.
218

FINAL QUESTIONNAIRE
1. Given the aesthetic constraints, when compared to my first design, I feel that my final design is… __ Much more aesthetically pleasing __ Somewhat more aesthetically pleasing __ About the same __ Somewhat less aesthetically pleasing __ Much less aesthetically pleasing Comments: 2. Given the daylighting goals, when compared to my first design, I feel that my final design performs… __ Much better __ Somewhat better __ About the same __ Somewhat worse __ Much worse Comments: 3. I feel that the process of using the expert system… __ Greatly influenced my final design __ Somewhat influenced my final design __ Did not influence my final design Comments:
Figure B.12: Final questionnaire, page 1.
219

4. Do you feel that by using the expert system, you learned something new which helped you approach the design problem? __ Yes, I learned a large amount. __ Yes, I learned a small amount. __ No, I did not learn anything new. Comments: 5. Do you feel that by using the expert system, you learned something new about daylighting in general? __ Yes, I learned a large amount. __ Yes, I learned a small amount. __ No, I did not learn anything new. Comments: 6. Would you consider using the expert system for a studio project? Please explain your answer. __ Definitely __ Probably __ Undecided __ Probably not __ Definitely not Please explain:
Figure B.13: Final questionnaire, page 2.
220

7. Would you consider using the expert system for a professional project? Please explain your answer. __ Definitely __ Probably __ Undecided __ Probably not __ Definitely not Please explain: 8. What did you like about the expert system? 9. What did you dislike about the expert system? 10. Any additional comments?
Figure B.14: Final questionnaire, page 3.
221

222

Bibliography
M. Adamski. Optimization of the form of a building on an oval base. Building and Envi-ronment, 42(4):1632–1643, Apr. 2007.
O. Akin. Psychology of Architectural Design. Pion Ltd, 1986.
L. B. Alberti. On the Art of Building in Ten Books, translated by Joseph Rykwert. MIT Press,Cambridge, MA, 1988.
R. J. Allwood, M. R. Shaw, J. L. Smith, D. J. Stewart, and E. G. Trimble. Building dampnessdiagnosing the causes. Building Research & Information, 16(1):37–42, 1988.
M. Andersen, S. Kleindienst, L. Yi, J. Lee, M. Bodart, and B. Cutler. An intuitive daylightingperformance and optimization approach. Building Research & Information, 36(6):593–607,Nov. 2008.
G. Augenbroe. Integrated building performance evaluation in the early design stages.Building and Environment, 27(2):149–161, Apr. 1992.
Autodesk. Autodesk revit architecture. http://usa.autodesk.com/adsk/servlet/pc/ in-dex?id=3781831&siteID=123112, 2010. URL http://usa.autodesk.com/adsk/servlet/
pc/index?id=3781831&siteID=123112.
K. M. Beauchemin and P. Hays. Sunny hospital rooms expedite recovery from severe andrefractory depressions. Journal of Affective Disorders, 40(1-2):49–51, Sept. 1996.
M. Black. Vagueness. an exercise in logical analysis. Philosophy of Science, 4(4):427–455, Oct.1937.
M. Bodart and A. D. Herde. Global energy savings in offices buildings by the use of day-lighting. Energy and Buildings, 34(5):421–429, June 2002.
P. Boyce, C. Hunter, and O. Howlett. The benefits of daylight through windows. Technicalreport, U.S. Department of Energy, Sept. 2003a.
P. R. Boyce, J. H. Heerwagen, C. C. Jones, J. A. Veitch, and G. R. Newsham. Lighting qualityand office work: A field simulation study. Technical report, Pacific Northwest NationalLaboratory, 2003b.
223

A. M. Brintrup, H. Takagi, and J. Ramsden. Evaluation of sequential, multi-objective, andparallel interactive genetic algorithms for multi-objective floor plan optimisation. InApplications of Evolutionary Computing, Lecture Notes in Computer Science, pages 586–598. Springer-Verlag, Berlin, 2006.
S. Bund and E. Y. L. Do. SPOT! fetch light: Interactive navigable 3D visualization of directsunlight. Automation in Construction, 14(2):181–188, Mar. 2005.
L. Caldas. Generation of energy-efficient architecture solutions applying GENE_ARCH:an evolution-based generative design system. Advanced Engineering Informatics, 22(1):59–70, Jan. 2008.
L. G. Caldas and L. K. Norford. A design optimization tool based on a genetic algorithm.Automation in Construction, 11(2):173–184, Feb. 2002.
P. W. Canada. Daylighting guide for canadian commercial buildings. Technical report,Public Works and Government Services Canda (PWGSC), Ottawa, Canada, 2002.
G. Carrara and G. Novembri. Knowledge assistants in the process of architectural design.Building and Environment, 25(3):199–207, 1990.
D. L. Carroll. Genetic algorithms and optimizing chemical oxygen-iodine lasers. Develop-ments in theoretical and applied mechanics, 18(3):411–424, 1996.
R. Charron and A. K. Athienitis. Optimization of the performance of double-facades withintegrated photovoltaic panels and motorized blinds. Solar Energy, 80(5):482–491, May2006.
S. C. Chase. A model for user interaction in grammar-based design systems. Automationin Construction, 11(2):161–172, Feb. 2002.
S. C. Chase. Generative design tools for novice designers: Issues for selection. Automationin Construction, 14(6):689–698, Dec. 2005.
T. Chastain, Y. E. Kalay, and C. Peri. Square peg in a round hole or horseless carriage?reflections on the use of computing in architecture. Automation in Construction, 11(2):237–248, Feb. 2002.
K. Chau and F. Albermani. A knowledge-based system for liquid retaining structure de-sign with blackboard architecture. Building and Environment, 40(1):73–81, Jan. 2005.
H. Chen, R. Ooka, and S. Kato. Study on optimum design method for pleasant outdoorthermal environment using genetic algorithms (GA) and coupled simulation of convec-tion, radiation and conduction. Building and Environment, 43(1):18–30, Jan. 2008.
F. Chlela, A. Husaunndee, C. Inard, and P. Riederer. A new methodology for the design oflow energy buildings. Energy and Buildings, 41(9):982–990, Sept. 2009.
224

CHPS. High performance schools best practices manual volume II: design. Technicalreport, 2006.
H. W. Chun and E. M. K. Lai. Intelligent critic system for architectural design. IEEE Trans-actions on Knowledge and Data Engineering, 9(4):625–639, Aug. 1997.
A. Chutarat. Experience of Light: The Use of an Inverse Method and a Genetic Algorithm inDaylighting Design. PhD thesis, Massachusetts Institute of Technology, Cambridge, MA,2001.
CIBSE. Code for Lighting. Butterworth-Heinemann, Oxford, UK, 2002.
C. A. C. Coello and G. P. Pulido. A micro-genetic algorithm for multiobjective optimiza-tion. In Evolutionary Multi-Criterion Optimization, volume 1993 of Lecture Notes in Com-puter Science, pages 126–140. 2001.
D. A. Coley and S. Schukat. Low-energy design: combining computer-based optimisationand human judgement. Building and Environment, 37(12):1241–1247, Dec. 2002.
L. Corbusier. Towards a New Architecture, translated by Frederick Etchells. Dover, New York,1986.
B. Cutler, Y. Sheng, S. Martin, D. Glaser, and M. Andersen. Interactive selection of opti-mal fenestration materials for schematic architectural daylighting design. Automation inConstruction, 17(7):809–823, Oct. 2008.
E. de Groot, L. Zonneveldt, and B. Paule. Dial europe: A decision support tool for earlylighting design. In Proceedings of Building Simulation, pages 421–426, Eindhoven, Nether-lands, 2003.
E. Y. L. Do and M. D. Gross. Let there be light! Knowledge-Based 3-D sketching designtools. International Journal of Architectural Computing, 2(2):211–227, June 2004.
J. G. Doheny and P. F. Monaghan. IDABES: an expert system for the preliminary stages ofconceptual design of building energy systems. Artificial Intelligence in Engineering, 2(2):54–64, Apr. 1987.
H. Doukas, K. D. Patlitzianas, K. Iatropoulos, and J. Psarras. Intelligent building energymanagement system using rule sets. Building and Environment, 42(10):3562–3569, Oct.2007.
Z. Du and X. Jin. Detection and diagnosis for multiple faults in VAV systems. Energy andBuildings, 39(8):923–934, Aug. 2007.
C. L. Dym, R. P. Henchey, E. A. Delis, and S. Gonick. A knowledge-based system forautomated architectural code checking. Computer-Aided Design, 20(3):137–145, Apr. 1988.
225

L. Edwards and P. A. Torcellini. A literature review of the effects of natural light on buildingoccupants. National Renewable Energy Laboratory, 2002.
P. Fazio, C. Bedard, and K. Gowri. Knowledge-based system approach to building enve-lope design. Computer-Aided Design, 21(8):519–527, Oct. 1989.
T. Fischer, M. Burry, and J. Frazer. Triangulation of generative form for parametric designand rapid prototyping. Automation in Construction, 14(2):233–240, Mar. 2005.
D. M. Freedman, M. Dosemeci, and K. McGlynn. Sunlight and mortality from breast,ovarian, colon, prostate, and non-melanoma skin cancer: a composite death certificatebased case-control study. Occupational & Environmental Medicine, 59(4):257, 2002.
B. R. Gaines. Foundations of fuzzy reasoning. International Journal of Man-Machine Studies,8(6):623–668, Nov. 1976.
A. D. Galasiu and C. Reinhart. Current daylighting design practice: a survey. BuildingResearch & Information, 36(2):159–174, Mar. 2008.
F. J. Garijo and L. A. de Garrido. A knowledge based system for house design. In Pro-ceedings of the 1988 IEEE International Conference on Systems, Man, and Cybernetics, pages806–809, Aug. 1988.
P. Geyer. Multidisciplinary grammars supporting design optimization of buildings. Re-search in Engineering Design, 18(4):197–216, Jan. 2008.
M. Golabchi. A knowledge-based expert system for selection of appropriate structuralsystems for large spans. Asian Journal of Civil Engineering, 9(2):179–191, 2008.
D. E. Goldberg. Genetic Algorithms in Search, Optimization, and Machine Learning. Addison-Wesley, 1989.
Google. Google SketchUp. http://sketchup.google.com/, 2008. URL http://sketchup.
google.com/.
E. Gullichsen and E. Chang. Generative design in architecture using an expert system. TheVisual Computer, 1(3):161–168, Nov. 1985.
B. Guo, C. Belcher, and W. Roddis. RetroLite: an artificial intelligence tool for lightingenergy-efficiency upgrade. Energy and Buildings, 20(2):115–120, 1993.
C. M. Herr and T. Kvan. Adapting cellular automata to support the architectural designprocess. Automation in Construction, 16(1):61–69, Jan. 2007.
L. Heschong, R. L. Wright, and S. Okura. Daylighting impacts on human performance inschool. Journal of the Illuminating Engineering Society, 31(2):101–111, 2002.
R. Hitchcock and W. Carroll. DElight: a daylighting and electric lighting simulation engine.In Proceedings of Building Simulation, pages 483–488, Eindhoven, Netherlands, Aug. 2003.
226

C. A. Hviid, T. R. Nielsen, and S. Svendsen. Simple tool to evaluate the impact of daylighton building energy consumption. Solar Energy, 82(9):787–798, Sept. 2008.
R. L. Hwang, T. P. Lin, H. H. Liang, K. H. Yang, and T. C. Yeh. Additive model for thermalcomfort generated by matrix experiment using orthogonal array. Building and Environ-ment, 44(8):1730–1739, Aug. 2009.
P. Ihm, A. Nemri, and M. Krarti. Estimation of lighting energy savings from daylighting.Building and Environment, 44(3):509–514, Mar. 2009.
I. Jaffal, C. Inard, and C. Ghiaus. Fast method to predict building heating demand basedon the design of experiments. Energy and Buildings, 41(6):669–677, June 2009.
T. Jung, M. Gross, and E. Do. Light pen, sketching light in 3D. In Proceedings of the 10thInternational Conference on Computer Aided Architectural Design Futures, Tainan, Taiwan,2003.
Y. E. Kalay. Performance-based design. Automation in Construction, 8(4):395–409, Apr. 1999.
J. K. Kawai, J. S. Painter, and M. F. Cohen. Radioptimization: goal based rendering. In SIG-GRAPH 93 Proceedings of the 20th Annual Conference on Computer Graphics and InteractiveTechniques, pages 147–154, 1993.
S. Kleindienst and M. Andersen. The adaptation of daylight glare probability to dynamicmetrics in a computational setting. In Proceedings of LuxEuropa, Istanbul, 2009.
S. Kleindienst, M. Bodart, and M. Andersen. Graphical representation of climate-baseddaylight performance to support architectural design. LEUKOS - The Journal of the Illu-minating Engineering Society of North America, 5(1):39 – 61, July 2008.
M. Kolokotroni, S. Robinson-Gayle, S. Tanno, and A. Cripps. Environmental impact anal-ysis for typical office facades. Building Research & Information, 32(1):2–16, Jan. 2004.
K. Krishnakumar. Micro-genetic algorithms for stationary and non-stationary functionoptimization. SPIE Proceedings: Intelligent Control and Adaptive Systems, 1989.
labs.plugins.ro. SketchUp bridge. http://plugins.ro/labs/bridge_tut.htm, 2006. URLhttp://plugins.ro/labs/bridge_tut.htm.
K. Lagios, J. Niemasz, and C. F. Reinhart. Animated building performance simulation(ABPS) - linking Rhinoceros/Grasshopper with Radiance/Daysim. In Proceedings of Sim-build, New York City, Aug. 2010.
W. Lam. Sunlighting as Formgiver for Architecture. Van Nostrand Reinhold, New York, 1986.
G. W. Lambert, C. Bedard, D. M. Kaye, G. L. Jennings, and M. D. Esler. Effect of sunlightand season on serotonin turnover in the brain. The Lancet, 360(9348):1840–1842, Dec.2002.
227

B. Lawson. How Designers Think: The Design Process Demystified. Architectural Press, 2006.
J. H. Lee. Optimization of indoor climate conditioning with passive and active methodsusing GA and CFD. Building and Environment, 42(9):3333–3340, Sept. 2007.
J. M. Lee, M. Andersen, Y. Sheng, and B. Cutler. Goal-based daylighting design using aninteractive simulation method. In Proceedings of Building Simulation, Glasgow, Scotland,2009.
E. S. Lefkowitz and C. F. Garland. Sunlight, vitamin d, and ovarian cancer mortality ratesin US women. International Journal of Epidemiology, 23(6):1133–1136, Dec. 1994.
M. Lehar and L. Glicksman. Rapid algorithm for modeling daylight distributions in officebuildings. Building and Environment, 42(8):2908–2919, Aug. 2007.
D. H. W. Li and J. C. Lam. An investigation of daylighting performance and energy savingin a daylit corridor. Energy and Buildings, 35(4):365–373, May 2003.
S. P. Lin and F. Albermani. Lattice-dome design using a knowledge-based system ap-proach. Computer-Aided Civil and Infrastructure Engineering, 16(4):268–286, July 2001.
H. Liu, T. Igusa, and B. W. Schafer. Knowledge-based global optimization of cold-formedsteel columns. Thin-Walled Structures, 42(6):785–801, June 2004.
G. F. Luger. Artificial Intelligence: Structures and Strategies for Complex Problem Solving. Ad-dison Wesley, Boston, 5th edition, 2004.
J. Lukasiewicz. Philosophical remarks on many-valued systems of propositional logic.Polish Logic, 1939:40–63, 1930.
L. Lutton. HYPEREX - a generic expert system to assist architects in the design of routinebuilding types. Building and Environment, 30(2):165–180, Apr. 1995.
M. L. Maher. Expert systems for structural design. Journal of Computing in Civil Engineering,1(4):270–283, 1987.
A. M. Malkawi, R. S. Srinivasan, Y. K. Yi, and R. Choudhary. Decision support and de-sign evolution: integrating genetic algorithms, CFD and visualization. Automation inConstruction, 14(1):33–44, Jan. 2005.
T. A. Markus. The significance of sunshine and view for office workers. In Sunlight inBuildings. Boewcentrum International, Rotterdam, The Netherlands, 1967.
A. Marsh. ECOTECT: shading design. http://www.squ1.com/products/ecotect/features/shadingdesign, 2008a. URL http://www.squ1.com/products/ecotect/
features/shadingdesign.
A. Marsh. Ecotect. http://www.squ1.com/products/ecotect, 2008b. URL http://www.
squ1.com/products/ecotect.
228

J. Marx. A proposal for alternative methods for teaching digital design. Automation inConstruction, 9(1):19–35, Jan. 2000.
P. K. Mashood, C. S. Krishnamoorthy, and K. Ramamurthy. KB-GA-Based hybrid systemfor layout planning of multistory buildings. Journal of Computing in Civil Engineering, 21(4):229–237, July 2007.
H. Matsumoto and S. Toyoda. A knowledge-based system for condensation diagnostics inhouses. Energy and Buildings, 21(3):259–266, 1994.
J. Michalek, R. Choudary, and P. Papalambros. Architectural layout design optimization.Engineering Optimization, 34(5):461–484, 2002.
P. Mitusch. Expert system for the norwegian building regulations. Building Research &Information, 17(4):223–227, 1989.
M. Monks, B. M. Oh, and J. Dorsey. Audioptimization: Goal-Based acoustic design. IEEEComputer Graphics and Applications, 20(3):76–90, June 2000.
D. C. Montgomery. Design and Analysis of Experiments. John Wiley & Sons, 6 edition, 2004.
R. Mora, H. Rivard, S. Parent, and C. Bedard. Interactive Knowledge-Based assistance forconceptual design of building structures. Advances in Engineering Structures, Mechanics& Construction, 140(5):571–582, 2006.
M. Negnevitsky. Fuzzy expert systems. In Artificial Intelligence: A Guide to Intelligent Sys-tems, pages 87–129. Addison-Wesley, Essex, UK, 2nd edition, 2005.
C. E. Ochoa and I. G. Capeluto. Advice tool for early design stages of intelligent facadesbased on energy and visual comfort approach. Energy and Buildings, 41(5):480–488, May2009.
J. O’Connor, E. Lee, F. Rubinstein, and S. Selkowitz. Tips for daylighting with windows:The integrated approach. Technical Report LBNL-39945, Lawrence Berkeley NationalLaboratory, Berkeley, CA, 1997.
K. H. Oey and E. Passchier. Complying with practice codes. Building Research & Information,16(1):30–36, 1988.
OpenStudio. OpenStudio plug-in for google SketchUp. http://apps1.eere.energy.gov/buildings/energyplus/openstudio.cfm, 2010. URL http://apps1.eere.energy.gov/
buildings/energyplus/openstudio.cfm.
P. Y. Papalambros and D. J. Wilde. Principles of Optimal Design: Modeling and Computation.Cambridge University Press, 2nd edition, 2000.
C. S. Park, G. Augenbroe, and T. Messadi. Daylighting optimization in smart facade sys-tems. In Proceedings of Building Simulation, pages 1001–1008, Eindhoven, Netherlands,2003.
229

C. S. Park, G. Augenbroe, N. Sadegh, M. Thitisawat, and T. Messadi. Real-time optimiza-tion of a double-skin facade based on lumped modeling and occupant preference. Build-ing and Environment, 39(8):939–948, Aug. 2004.
M. L. Parra-Saldivar and W. Batty. Thermal behaviour of adobe constructions. Building andEnvironment, 41(12):1892–1904, Dec. 2006.
G. Patow, X. Pueyo, and A. Vinacua. User-guided inverse reflector design. Computers &Graphics, 31(3):501–515, June 2007.
L. F. Pau and S. S. Nielsen. A knowledge-based system for computer-aided architecturaldesign for energy savings and thermal comfort. Artificial Intelligence for Engineering,Design, Analysis and Manufacturing, 4(2):71–88, 1990.
B. Paule and J. Scartezzini. Leso-DIAL, a new computer-based daylighting design tool. InProceedings of Right Light 4, pages 93–97, Copenhagen, Denmark, 1997.
A. J. Perelson. iPlot: an intelligent lighting design assistant. PhD thesis, Massachusetts Insti-tute of Technology, 2005.
R. Perez, J. Michalsky, and R. Seals. Modeling sky luminance angular distribution for realsky conditions: experimental evaluation of existing algorithms. Journal of the IlluminatingEngineering Society, 21(2):84–92, 1992.
S. Petersen and S. Svendsen. Method and simulation program informed decisions in theearly stages of building design. Energy and Buildings, 42(7):1113–1119, July 2010.
P. Plympton, S. Conway, and K. Epstein. Daylighting in schools: improving student per-formance and health at a price schools can afford. In Proceedings of the American SolarEnergy Society Conference, Madison, Wisconsin, June 2000.
J. Pohl and L. Myers. A distributed cooperative model for architectural design. Automationin Construction, 3(2-3):177–185, July 1994.
M. Rashid and C. Zimring. A review of the empirical literature on the relationships be-tween indoor environment and stress in health care and office settings: Problems andprospects of sharing evidence. Environment and Behavior, 40(2):151–190, Mar. 2008.
M. S. Rea. The IESNA Lighting Handbook: Reference & Application. Illuminating EngineeringSociety of North America, 2000.
G. Reichard and K. Papamichael. Decision-making through performance simulation andcode compliance from the early schematic phases of building design. Automation inConstruction, 14(2):173–180, Mar. 2005.
C. F. Reinhart. A simulation-based review of the ubiquitous window-head-height to daylitzone depth rule-of-thumb. In Proceedings of Building Simulation, Montreal, Canada, 2005.
230

C. F. Reinhart and A. Fitz. Findings from a survey on the current use of daylight simula-tions in building design. Energy & Buildings, 38(7):824–835, July 2006.
C. F. Reinhart and V. M. LoVerso. A rules of thumb based design sequence for diffuselighting. Lighting Research & Technology, 42(1):7–31, Mar. 2010.
C. F. Reinhart and J. Wienold. The daylighting dashboard - a simulation-based designanalysis for daylit spaces. Building and Environment, 46(2):386–396, Feb. 2011.
C. Robin, J. Brau, and J. Roux. Integration of expert knowledge and simulation tools forthe thermal design of buildings and energy systems. Energy and Buildings, 20(2):167–175,1993.
M. A. Rosenman and J. S. Gero. Design codes as expert systems. Computer-aided design, 17(9):399–409, 1985.
G. G. Roy. A comparative study of lighting simulation packages suitable for use in archi-tectural design. Technical report, Murdoch University, Perth, Australia, 2000.
J. H. Rutherford and T. W. Maver. Knowledge-based design support. Automation in Con-struction, 3(2-3):187–202, July 1994.
A. R. Sabouni and O. M. Al-Mourad. Quantitative knowledge based approach for pre-liminary design of tall buildings. Artificial Intelligence in Engineering, 11(2):143–154, Apr.1997.
P. Sachdeva. DAMP - a diagnostic system for architectural moisture damage problems.Australian Computer Journal, 17(1):27–32, 1985.
T. Sarawgi. Survey on the use of lighting design software in architecture and interiordesign undergraduate education. International Journal of Architectural Computing, 4(4):91–108, Dec. 2006.
C. Schoeneman, J. Dorsey, B. Smits, J. Arvo, and D. Greenburg. Painting with light. In SIG-GRAPH 93 Proceedings of the 20th Annual Conference on Computer Graphics and InteractiveTechniques, pages 143–146, 1993.
D. A. Schon. The Reflective Practitioner: How Professionals Think in Action. Basic Books, 1983.
H. T. Seok, J. H. Jo, and K. W. Kim. Establishing the design process of double-skin facadeelements through design parameter analysis. Journal of Asian Architecture and BuildingEngineering, 8(1):251–258, 2009.
R. Shacked and D. Lischinski. Automatic lighting design using a perceptual quality metric.Computer Graphics Forum, 20(3):215–227, Sept. 2001.
E. Shaviv, A. Yezioro, I. G. Capeluto, U. J. Peleg, and Y. E. Kalay. Simulations andknowledge-based computer-aided architectural design (CAAD) systems for passive andlow energy architecture. Energy and Buildings, 23(3):257–269, Mar. 1996.
231

K. Shea, R. Aish, and M. Gourtovaia. Towards integrated performance-driven generativedesign tools. Automation in Construction, 14(2):253–264, Mar. 2005.
W. Siler and J. J. Buckley. Fuzzy expert systems and fuzzy reasoning. John Wiley and Sons,2005. ISBN 9780471388593.
M. Sugeno. Industrial Applications of Fuzzy Control. North-Holland, 1985.
K. Talbott. Context-sensitivity and visual engagement in generative systems. Automationin Construction, 16(1):54–60, Jan. 2007.
J. E. Tena and I. R. Goldberg. An interactive system for solving inverse illumination prob-lems using genetic algorithms. Proceedings of Computacion Visual, 1997.
S. L. Torres and Y. Sakamoto. Facade design optimization for daylight with a simple geneticalgorithm. In Proceedings of Building Simulation, Beijing, China, 2007.
B. J. Urban and L. R. Glicksman. A rapid building energy model and interface for non-technical users. In Proceedings of the 10th ORNL Thermal Performance of the Exterior En-velopes of Whole Buildings International Conference, Clearwater, FL, Dec. 2007.
U.S.DOE. 2009 buildings energy data book. http://buildingsdatabook.eren.doe.gov/,2009. URL http://buildingsdatabook.eren.doe.gov/.
E. Vartiainen, K. Peippo, and P. Lund. Daylight optimization of multifunctional solar fa-cades. Solar Energy, 68(3):223–235, Mar. 2000.
Vitruvius. The Ten Books on Architecture. Dover, New York, 1960.
J. M. Walch, B. S. Rabin, R. Day, J. N. Williams, K. Choi, and J. D. Kang. The effect ofsunlight on postoperative analgesic medication use: A prospective study of patientsundergoing spinal surgery. Psychosomatic Medicine, 67(1):156–163, 2005.
W. Wang, R. Zmeureanu, and H. Rivard. Applying multi-objective genetic algorithms ingreen building design optimization. Building and Environment, 40(11):1512–1525, Nov.2005.
A. R. Webb. Considerations for lighting in the built environment: Non-visual effects oflight. Energy and Buildings, 38(7):721–727, July 2006.
M. Wetter. GenOpt - a generic optimization program. In Proceedings of Building Simulation,Rio de Janeiro, Aug. 2001.
M. Wetter and E. Polak. Building design optimization using a convergent pattern searchalgorithm with adaptive precision simulations. Energy & Buildings, 37(6):603–612, June2005.
J. Wienold. Dynamic simulation of blind control strategies for visual comfort and energybalance analysis. In Proceedings of Building Simulation, Beijing, China, 2007.
232

J. Wienold. Dynamic daylight glare evaluation. In Proceedings of Building Simulation, Glas-gow, Scotland, 2009.
J. Wienold and J. Christoffersen. Evaluation methods and development of a new glareprediction model for daylight environments with the use of CCD cameras. Energy andBuildings, 38(7):743–757, July 2006.
F. Wright. An American Architecture. Horizon Press, New York, 1955.
J. Wright and M. Mourshed. Geometric optimization of fenestration. In Proceedings ofBuilding Simulation, Glasgow, Scotland, 2009.
L. Xiyu, T. Mingxi, and J. H. Frazer. An eco-conscious housing design model based onco-evolution. Advances in Engineering Software, 36(2):115–125, Feb. 2005.
I. C. Yeh. Architectural layout optimization using annealed neural network. Automation inConstruction, 15(4):531–539, July 2006.
L. A. Zadeh. Fuzzy sets. Information and Control, 8(3):338–353, June 1965.
E. Znouda, N. Ghrab-Morcos, and A. Hadj-Alouane. Optimization of mediterranean build-ing design using genetic algorithms. Energy & Buildings, 39(2):148–153, Feb. 2007.
233