An Insight into the Entropy and Redundancy of the English Dictionary
11
960 IEEE TRANSACTIONS ON PATTERN ANALYSIS AND MACHINE INTELLIGENCE, VOL. 10, NO. 6, NOVEMBER 1988 [3] H. Samet, “A top-down quadtree traversal algorithm,” IEEE Trans. Pattern Anal. Machine Infell., vol. PAMI-7, no. 1, Jan. 1985. [4] M. Oliver and N. Wiseman, “Operations on quadtree encoded im- ages,” Compuf. J., vol. 26, no. 1, 1983. [5] I. Gargantini, “An effective way to represent quadtrees,” Commun. ACM, vol. 25, no. 12, Dec. 1982. [6] H. Samet, A. Rosenfeld, C. Shaffer, and R. Webber, “A geographic information system using quadtrees,” Parrern Recognition, vol. 17, no. 6, 1984. [7] G. Hunter, “Efficient computation and data structures for graphics,” Ph.D. dissertation, Princeton Univ., Princeton, NJ, 1978. An Insight into the Entropy and Redundancy of the English Dictionary E. J. YANNAKOUDAKIS AND G. ANGELIDAKIS Abstract-This correspondence investigates the inherent statistical characteristics, including the economy, entropy, and redundancy, of a very large set containing 93,681 words from the Shorter Oxford English Dictionary. Analytical n-gram statistics are also presented for appli- cations in natural language understanding, text processing, text compression, error detection and correction, and speech synthesis and recognition. Experimental results show how the distribution of n-grams in the dictionary varies from the ideal as n increases from 2 to 5, that is, from bigrams to pentagrams; it is shown that the corresponding redundancy also increases from 0.1067 to 0.3409. The results pre- sented here are interesting because, 1) the dictionary provides a finite list for deterministic analyses, 2) each entry (word) appears once, com- pared to free-running text where words are repeated, and 3) all en- tries, even rarely occurring ones, have equal weight. Zndex Terms-Entropy of text, language understanding, n-gram sta- tistics, text processing, word analysis. I. INTRODUCTION Language is a conventional symbolic activity and its main func- tion is to help us think and influence the behavior of others without too much effort. This leads to the principle of economy of words applied ever since humans were able to communicate and it is ap- parent in the sense that very frequent words tend to be very short. There have been many attempts to utilize this principle. in 1605 Bacon anticipated the binary notation for numbers and also the five-unit code: A = 00000, B = 00001, C = 00010, etc. In 1617 Napier provided the first use of the binary system for cal- culation. In 1832 Morse designed his code in which the most fre- quent letters were given short codes (e.g., E = “.”, T = ‘‘ ”, A = “.-”) and the least frequent letters were given the longestcodes (e.g., Q = “--.-.”). The length of each code was designed to be inversely related to its frequency of occurrence. Of course this was not a compression technique but an attempt to minimize the length of the message transmitted. A year later, in 1833, Weber and Gauss invented the international teleprinter five-unit alphabet where the most frequent letters were the easiest to represent; for example, compare the representation of two frequent letters, “E” and “T” where E = “1, 0, 0, 0, 0”, T = “0, 0, 0, 0, l”, with the repre- sentation of the letter “X” where X = “1, 0, 1, 1, 1”. Manuscript received August 27, 1986; revised June 30, 1987. Recom- The authors are with the Postgraduate School of Computer Science, IEEE Log Number 8823849. mended for acceptance by C. Y. Suen. University of Bradford, Bradford BD7 IDP, West Yorkshire, England. In the beginning of this century, R. C. Eldridge produced a cat- alog of 6000 common English words. As he stated in 1911, the ultimate aim of the work was the introduction of a limited vocab- ulary for universal use. The various word lists contained in this catalog were made from random columns of random pages of the BUFFALO SUNDAY NEWS in 1909. A few years later, in 1921, Dr. Irving Lorge and Edward L. Thorndike produced the Teacher’s Word Book which, in a later edition published in 1943 with the title The Teacher’s Word Book of 30,000 Words, contained 30,000 most frequently occurring English words. In 1948 Zipf [9] introduced the principle of “least-effort’’ and tried to apply this in order to study the economy of words. How- ever, one of the most important contributions to the application of this principle for the transmission of information and the develop- ment of communications in general was the presentation of the mathematical theory of communication by Shannon [2] in 1948 and the introduction of a method for estimating the entropy and the redundancy of a language [3]. The relative entropy, symbolized by H-relative, is a statistical parameter which measures how much information is produced, on average, for each letter of a text in a language. Also, sets of vari- able length keys with high relative entropy provide a high degree of discrimination among words and therefore facilitate the process of on-line searching. Recent developments in the new information technology which includes cable-technology , mobile radio, and satellite communica- tions, together with increasing use of very large integrated data- bases, have highlighted the need for a very effective method of storing and transmitting information. The study of language statis- tics has a variety of real and potential applications and it can play the principal role in the design of suitable methods for intelligent man-machine interaction. The analysis of the English dictionary itself can give an insight into the origin, constituent parts, and hu- man preferences in the use of specific sounds and thematic struc- tures. During the last ten years there has been an increasing interest in n-gram (n consecutive and naturally occurring letters) statistics and their potential as units of identifiable information. A number of researchers have utilized the statistical results obtained, and var- ious methods have been implemented for automatic correction of text, speech recognition, translation, information retrieval, text compression, and others. Besides, n-grams generated from some source data have been used to calculate the redundancy associated with that data. Note that the source data used in all studies so far were based on free-running text rather than a finite list of well de- fined entries such as the words in our dictionary. The present work investigates the inherent statistical character- istics, including the economy, entropy, and redundancy of a very large subset of the English dictionary, based on the Shorter Oxford English Dictionary. It contains 93,681 unique words in alphabeti- cal order, separated by spaces within multiword records each 80 characters maximum. The name of the file is CDAZ which stands for Complete Dictionary from A to Z. Nonalphabetic characters and a small number of words which are obsolete have been removed. Preliminary analyses established that the longest word is AN- THROPOMORPHOLOGICALLY with 23 letters, and the most frequent word lengths are: 9 characters with 13,171 occurrences, 8 characters with 13,041, 10 characters with 11,848, and 7 char- acters with 11.319 occurrences. 11. n-GRAMS AND THEIR USAGE An n-gram is a string of n consecutive letters all belonging to a standard alphabet. It can be formed by retrieving n consecutive letters from any dictionary or general text which contains words formed by the same alphabet. For example, “OUNT” is a tetra- gram that can be extracted from the words COUNT, COUNTER, ENCOUNTER, etc. 0162-8828/88/1100-0960$01 .OO 0 1988 IEEE
Transcript of An Insight into the Entropy and Redundancy of the English Dictionary
960 IEEE TRANSACTIONS ON PATTERN ANALYSIS AND MACHINE INTELLIGENCE, VOL. 10, NO. 6, NOVEMBER 1988
[3] H. Samet, “A top-down quadtree traversal algorithm,” IEEE Trans. Pattern Anal. Machine Infel l . , vol. PAMI-7, no. 1, Jan. 1985.
[4] M. Oliver and N. Wiseman, “Operations on quadtree encoded im- ages,” Compuf. J . , vol. 26, no. 1, 1983.
[ 5 ] I. Gargantini, “An effective way to represent quadtrees,” Commun. ACM, vol. 25, no. 12, Dec. 1982.
[6] H. Samet, A. Rosenfeld, C. Shaffer, and R. Webber, “A geographic information system using quadtrees,” Parrern Recognition, vol. 17, no. 6, 1984.
[7] G. Hunter, “Efficient computation and data structures for graphics,” Ph.D. dissertation, Princeton Univ., Princeton, NJ, 1978.
An Insight into the Entropy and Redundancy of the English Dictionary
E. J. YANNAKOUDAKIS AND G. ANGELIDAKIS
Abstract-This correspondence investigates the inherent statistical characteristics, including the economy, entropy, and redundancy, of a very large set containing 93,681 words from the Shorter Oxford English Dictionary. Analytical n-gram statistics are also presented for appli- cations in natural language understanding, text processing, text compression, error detection and correction, and speech synthesis and recognition. Experimental results show how the distribution of n-grams in the dictionary varies from the ideal as n increases from 2 to 5 , that is, from bigrams to pentagrams; it is shown that the corresponding redundancy also increases from 0.1067 to 0.3409. The results pre- sented here are interesting because, 1) the dictionary provides a finite list for deterministic analyses, 2) each entry (word) appears once, com- pared to free-running text where words are repeated, and 3) all en- tries, even rarely occurring ones, have equal weight.
Zndex Terms-Entropy of text, language understanding, n-gram sta- tistics, text processing, word analysis.
I. INTRODUCTION Language is a conventional symbolic activity and its main func-
tion is to help us think and influence the behavior of others without too much effort. This leads to the principle of economy of words applied ever since humans were able to communicate and it is ap- parent in the sense that very frequent words tend to be very short. There have been many attempts to utilize this principle.
in 1605 Bacon anticipated the binary notation for numbers and also the five-unit code: A = 00000, B = 00001, C = 00010, etc. In 1617 Napier provided the first use of the binary system for cal- culation. In 1832 Morse designed his code in which the most fre- quent letters were given short codes (e.g., E = “.”, T = ‘‘ ”, A = “.-”) and the least frequent letters were given the longestcodes (e.g., Q = “--.-.”). The length of each code was designed to be inversely related to its frequency of occurrence. Of course this was not a compression technique but an attempt to minimize the length of the message transmitted. A year later, in 1833, Weber and Gauss invented the international teleprinter five-unit alphabet where the most frequent letters were the easiest to represent; for example, compare the representation of two frequent letters, “E” and “T” where E = “1, 0, 0, 0, 0”, T = “0, 0, 0, 0, l ” , with the repre- sentation of the letter “X” where X = “1, 0, 1, 1, 1”.
Manuscript received August 27, 1986; revised June 30, 1987. Recom-
The authors are with the Postgraduate School of Computer Science,
IEEE Log Number 8823849.
mended for acceptance by C. Y. Suen.
University of Bradford, Bradford BD7 IDP, West Yorkshire, England.
In the beginning of this century, R. C. Eldridge produced a cat- alog of 6000 common English words. As he stated in 1911, the ultimate aim of the work was the introduction of a limited vocab- ulary for universal use. The various word lists contained in this catalog were made from random columns of random pages of the BUFFALO SUNDAY NEWS in 1909. A few years later, in 1921, Dr. Irving Lorge and Edward L. Thorndike produced the Teacher’s Word Book which, in a later edition published in 1943 with the title The Teacher’s Word Book of 30,000 Words, contained 30,000 most frequently occurring English words.
In 1948 Zipf [9] introduced the principle of “least-effort’’ and tried to apply this in order to study the economy of words. How- ever, one of the most important contributions to the application of this principle for the transmission of information and the develop- ment of communications in general was the presentation of the mathematical theory of communication by Shannon [2] in 1948 and the introduction of a method for estimating the entropy and the redundancy of a language [3].
The relative entropy, symbolized by H-relative, is a statistical parameter which measures how much information is produced, on average, for each letter of a text in a language. Also, sets of vari- able length keys with high relative entropy provide a high degree of discrimination among words and therefore facilitate the process of on-line searching.
Recent developments in the new information technology which includes cable-technology , mobile radio, and satellite communica- tions, together with increasing use of very large integrated data- bases, have highlighted the need for a very effective method of storing and transmitting information. The study of language statis- tics has a variety of real and potential applications and it can play the principal role in the design of suitable methods for intelligent man-machine interaction. The analysis of the English dictionary itself can give an insight into the origin, constituent parts, and hu- man preferences in the use of specific sounds and thematic struc- tures.
During the last ten years there has been an increasing interest in n-gram (n consecutive and naturally occurring letters) statistics and their potential as units of identifiable information. A number of researchers have utilized the statistical results obtained, and var- ious methods have been implemented for automatic correction of text, speech recognition, translation, information retrieval, text compression, and others. Besides, n-grams generated from some source data have been used to calculate the redundancy associated with that data. Note that the source data used in all studies so far were based on free-running text rather than a finite list of well de- fined entries such as the words in our dictionary.
The present work investigates the inherent statistical character- istics, including the economy, entropy, and redundancy of a very large subset of the English dictionary, based on the Shorter Oxford English Dictionary. It contains 93,681 unique words in alphabeti- cal order, separated by spaces within multiword records each 80 characters maximum. The name of the file is CDAZ which stands for Complete Dictionary from A to Z . Nonalphabetic characters and a small number of words which are obsolete have been removed. Preliminary analyses established that the longest word is AN- THROPOMORPHOLOGICALLY with 23 letters, and the most frequent word lengths are: 9 characters with 13,171 occurrences, 8 characters with 13,041, 10 characters with 11,848, and 7 char- acters with 11.319 occurrences.
11. n-GRAMS AND THEIR USAGE
An n-gram is a string of n consecutive letters all belonging to a standard alphabet. It can be formed by retrieving n consecutive letters from any dictionary or general text which contains words formed by the same alphabet. For example, “OUNT” is a tetra- gram that can be extracted from the words COUNT, COUNTER, ENCOUNTER, etc.
0162-8828/88/1100-0960$01 .OO 0 1988 IEEE
IEEE TRANSACTIONS ON PATTERN ANALYSIS AND MACHINE INTELLIGENCE, VOL. 10. NO. 6, NOVEMBER 1988 96 1
There is an ever-increasing need for knowledge of language characteristics, particularly n-gram statistics for use in intelligent knowledge based systems (IKBS). A number of techniques [4] make use of such statistics for efficient information processing, in a lim- ited sense, due to the lack of global statistics. The use of n-grams has certain advantages over the use of dictionaries which require substantial secondary storage as well as unacceptably long pro- cessing times. Unfortunately, most of the statistical lists available include only the 50 most frequently occurring n-grams, although the sources used varied in size from 10,000 words to the very im- pressive of 1 million words [4].
When Shannon [3] tried to apply his new method of calculating the entropy of a set of symbols, words, etc., he stressed the im- portance of n-grams and the need for accurate lists, particularly with n-grams where n > 3 which were not available at the time.
The lack of such statistical lists generated from the English dic- tionary forced Yannakoudakis [7] to apply the minimum space (MS), the longest fragment first (LFF) and the longest match (LM) compression algorithms on CDAZ using n-grams produced from bibliographic records [ 5 ] . The maximum compression ratio ob- tained was 29.903 percent. There are two reasons why such a low ratio was achieved:
1) the n-grams were based on a specialized source, and 2) the number of n-grams used was very limited. On CDAZ for example the combinations “LY-” and “ESS” are the two most frequently occurring trigrams, but neither appears in the list of the top 50 trigrams generated and utilized for compression. These findings demonstrate very clearly the peculiar nature of the English dictio- nary which does require special consideration.
It is also interesting to note here that Yannakoudakis et al. [5] proved that it is possible to get reasonable compression ratios with a set of n-grams derived from specialized sources (e.g., biblio- graphic) even when these are applied to general material (e.g., computer programs and newspaper articles).
In theory, using the whole range of bigrams with spaces 50 per- cent compression can be achieved, but then there will be 601 (max- imum rank of bigrams) additional symbols and the need for a very large look-up table will incur overheads in the efficiency of the compression algorithm. Similarly, large tables will be required when the whole range of trigrams, tetragrams, etc. is used. The majority of n-gram compression techniques employ 128 most fre- quently occurring n-grams but this depends on the algorithm and quite frequently key-sets of 256 symbols are generated. This ap- proach works satisfactorily.
There does not appear to be a need for hexagrams, heptagrams, etc., because they are not frequent enough to justify their use as symbols in their own right. Lynch et al. [ l ] attempted to include heptagrams, octagrams, etc., but discovered that the INSPEC da- tabase contained only 142 octagrams (for a key-set limit of 30) and only 9 octagrams for a key-set limit of 100.
111. n-GRAMS FOUND I N THE ENGLISH DICTIONARY In general, there are two methods for generating sets of n-grams. Method A : This method involves the following steps: 1) Calculate unigram frequencies. 2) Calculate the most frequently occurring bigrams and set an
arbitrary lower limit. 3) Calculate the most frequently occurring trigrams on the basis
of bigram frequencies above the lower limit. 4) Continue for tetragrams using trigram limits, for pentagrams
using tetragram limits, etc., as in step 3) above. Method B: This method involves moving a “window” of fixed
length n across each word. Here, all possible n-grams can be re- trieved, sorted, and analyzed, and the most frequent can then be used to form appropriate sets. This method was used by Yannak- oudakis et al. [5] who generated lists of n-grams for n = 1, . ‘ . , 8.
If Method A is used it becomes very difficult to establish a rea- sonable lower frequency limit for each set of n-grams, and there is always a possibility to miss certain n-grams, particularly where n > 2. However, if Method B is used all possible n-grams can be
generated and analyzed. The problem here is the vast storage space that is required to hold the lists of n-grams. The implementation of each of these methods is discussed in the following sections. Note that, during the creation of the various lists of n-grams it was as- sumed that each word started with a letter and terminated with a space, and therefore the n-grams produced are of the form N- and not -N.
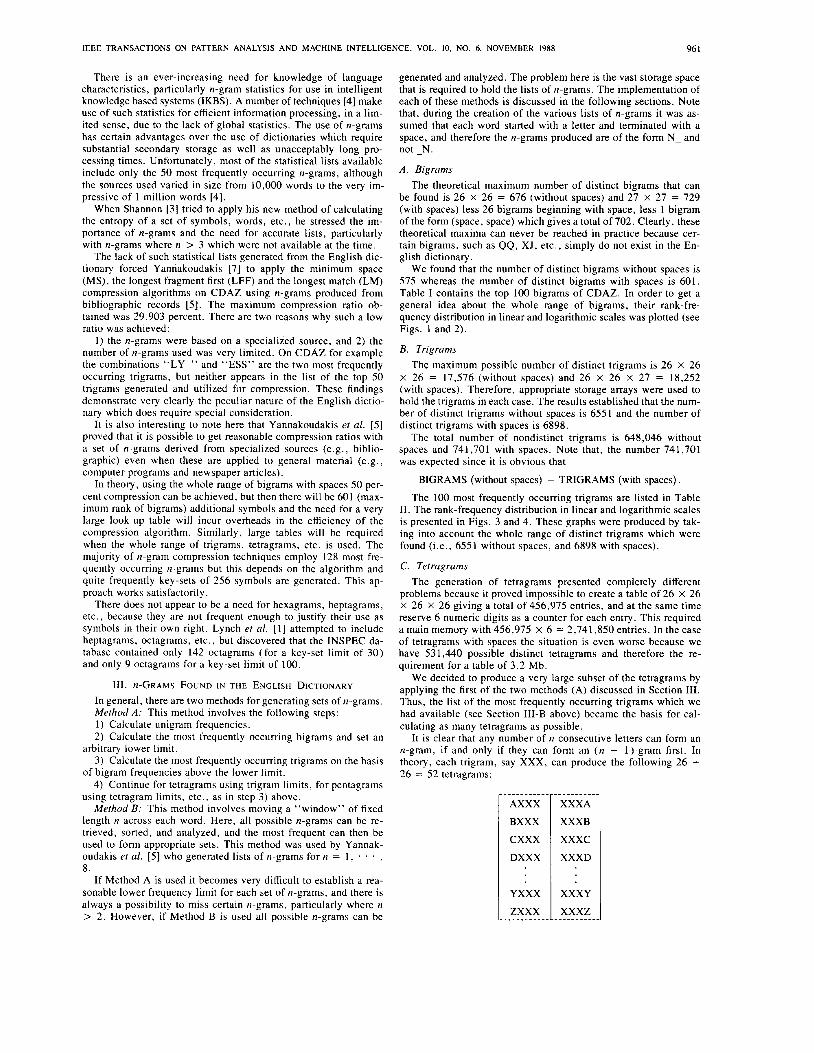
A . Bigrams The theoretical maximum number of distinct bigrams that can
be found is 26 X 26 = 676 (without spaces) and 27 X 27 = 729 (with spaces) less 26 bigrams beginning with space, less 1 bigram of the form (space, space) which gives a total of 702. Clearly, these theoretical maxima can never be reached in practice because cer- tain bigrams, such as QQ, XJ, etc., simply do not exist in the En- glish dictionary.
We found that the number of distinct bigrams without spaces is 575 whereas the number of distinct bigrams with spaces is 601. Table I contains the top 100 bigrams of CDAZ. In order to get a general idea about the whole range of bigrams, their rank-fre- quency distribution in linear and logarithmic scales was plotted (see Figs. 1 and 2).
B. Trigrams The maximum possible number of distinct trigrams is 26 x 26
X 26 = 17,576 (without spaces) and 26 X 26 X 27 = 18,252 (with spaces). Therefore, appropriate storage arrays were used to hold the trigrams in each case. The results established that the num- ber of distinct trigrams without spaces is 6551 and the number of distinct trigrams with spaces is 6898.
The total number of nondistinct trigrams is 648,046 without spaces and 741,701 with spaces. Note that, the number 741,701 was expected since it is obvious that
BIGRAMS (without spaces) = TRIGRAMS (with spaces).
The 100 most frequently occurring trigrams are listed in Table 11. The rank-frequency distribution in linear and logarithmic scales is presented in Figs. 3 and 4. These graphs were produced by tak- ing into account the whole range of distinct trigrams which were found (i.e., 6551 without spaces, and 6898 with spaces).
C. Tetragrams The generation of tetragrams presented completely different
problems because it proved impossible to create a table of 26 X 26 X 26 X 26 giving a total of 456,975 entries, and at the same time reserve 6 numeric digits as a counter for each entry. This required a main memory with 456,975 X 6 = 2,741,850 entries. In the case of tetragrams with spaces the situation is even worse because we have 53 1,440 possible distinct tetragrams and therefore the re- quirement for a table of 3.2 Mb.
We decided to produce a very large subset of the tetragrams by applying the first of the two methods (A) discussed in Section 111. Thus, the list of the most frequently occurring trigrams which we had available (see Section 111-B above) became the basis for cal- culating as many tetragrams as possible.
It is clear that any number of n consecutive letters can form an n-gram, if and only if they can form an (n - 1)-gram first. In theory, each trigram, say XXX, can produce the following 26 + 26 = 52 tetragrams:
_ _ _ _ _ _ _ _ _ _ AXXX
BXXX
cxxx DXXX
YXXX
zxxx _ _ _ _ _ _ _ _ _ _

IEEE TRANSACTIONS ON PATTERN ANALYSIS AND MACHINE INTELLIGENCE, VOL. IO. NO. 6, NOVEMBER 1988
AXX
BXX
cxx DXX
YXX
zxx ....................
I eoooj
XXA
XXB
xxc XXD
XXY
xxz
TABLE I THE MOST FREQUENTLY OCCURRING BICRAMS (WITH SPACES)
2-GRAn FREQUENCt KAHK
E-
U-
ER
IN TI TE AT AL EN ON AN IC LE S
NE ES RE RA ST RI
NT L I AR OR
ss LY
IT RO
tiN ELI CO
CA IO LA OU us DE D I NI NC T A EL TO LL TR ME LO ET I A NA V t CH MA OL HE
SE I L PE OH S I A 8 AC BL Ti l C t bC UL M I PH H I UK .\D AS EA no G t NU OP P A iii so OG
EC OS 1 2 PO CI SH EX AM
NS
I3
N-
K
T-
4_
L-
C-
8-
G-
I8149 - 15470 - I4243 -- I4016 - I2592 - I1618 - 11276 - 10834 -- 10789 - IO526 -- I0117 -- IO023 -- 9712 -- 9171 -- 9103 - 9066 -- 8931 -- 8501 -- 8486 -- 8447 -- U186 -- 8181 -- 8025 -- 7639 -- 7636 -- 7472 -- 7271 -- 7078 -- 7040 -- 7030 -- 6825 -- 6701 -- 6698 -- 6527 -- 6372 -- 6259 -- 6148 -- 6145 -- 6019 -- 5913 -- 5849 -- 5748 -- 5643 -- 5280 -- 5216 -- 5143 -- 4983 -- 4907 -- 4877 -- 4869 -- 4845 -- 4818 -- 4688 -- 4609 -- 4549 -- 4494 -- 4492 -- 4462 -- 4427 -- 4358 -- 4317 -- 4208 -- 4133 -- GUM6 -- 4Ub7 ~- n u l l -- 40Uj -- w u 3 -- 3985 -- 3961 -- 3976 -- 39b3 -- 3902 -- 3783 -- 1753 -- 3120 -- 3658 -- 3594 -- 3537 --
3277 -- 3233 -- 3098 -- 30bq -- 3U5Y -- 3024 -- 3019 -- 3010 --
2962 -- 2 Y 3 1 -- 29111 -- 2901 --
2789 -- 2717 -- 2703 -- 2669 -- 2649 --
3389 --
314a --
2981 --
2884 --
I 2 3 4 5 6 7 8 9
IO I 1 I2 13 I4 I5 I6 17 18 19 20 21 22 23 24 25 26 27 28 29 30 31 32 33 34 35 36 37 38 39 40 4 1 42 41 44 45 46 47 48 49 50 51 52 53 54 55 56 57 58 59 60 bI 62 bJ 64 65 b6 b7 68 b9 70 71 12 73 74 15 76 77 76 79 SO 81 82 81
n s
n i
89
84
86
88
90 9 1 92 93 94 95 Yb 97 98 99 100
Fig. 1 . Bigrams.
100 ' 101' 102' 4
LOG IRANKI
Fig. 2. Bigrams
Now, it is obvious that the following combinations of letters must be trigrams at the same time:

IEEE TRANSACTIONS ON PATTERN ANALYSIS AND MACHINE INTELLIGENCE, VOL. 10, NO. 6, NOVEMBER 1988 963
6000
5000
4000-
TABLE I1 THE MOST FREQUENTLY OCCURRING TRIGRAMS (WITH SPACES)
3 - G M FREQUEXCY RANK
LY-
ER- ss- ED- A L
‘C-
‘E- ON-
ESS
AT1 ION
0u s NES
ING ENT TI0 LE- ATE TEK
ICA TIC BLE 1ST CAL
“S-
NG- ABL N T- I N E
ALL
ANT
CON IVE
€NE TOR PER 1 sn
STI LLY RAT UIS 1 T Y
ITE LIT ALI IAN U T KEN TRI TRA ER1 LIN TIV TED NTE AT0 GRA
TIN LOG LES OLO ON1 VER R E S HER NT1 INT I Z E THE RAN DER IAL STE NCE RIC STR NAT ERA PKO ISH MAN AST 1LI NU€ ARI RIN INA MAT IT1
ECT ROU LEN
AN-
R L
ST-
n-
NE-
SH-
VEL
CE-
b389 -- I 5616 -- 2 5297 -- 1 4912 -- 4 4318 -- 5 0249 -- 6 4148 -- 7 4140 -- 8 4062 -- 9
3966 -- I 1 3 8 6 5 -- 12 3808 -- 1 3 3773 -- 1 4 3558 -- 1 5 i W 7 -- 16 3478 -- I7 344Y -- IS 3332 -- 19 395u -- 2u
1981 -- 10
2 ~ 8 4 -- 21 287U -- 22 2 7 3 5 -- 23 2712 -- 24 2 b i 9 -- 2 5 2 4 6 1 -- 26 2429 -- 2 1 2 3 5 2 -- 2U 2309 -- 29 2210 -- 3u 2 1 4 4 -- 3 1 2061 -- 32 2328 -- 33 2004 -- 34 194? -- 3 5 1938 -- 36 1926 -- 37 1833 -- 38 1723 -- 39 1661 -- 40 1653 -- 41 1651 -- 4 2 1629 -- 4 3 1627 -- 4 4 1596 -- 4 5 1589 -- 4 b 1579 -~ 47 15% -- 48 1543 -- h9 1523 -- W I519 -- 51 1489 -- 52 1454 - 53 1 4 4 5 -- y1 1433 -- 5 5 1423 -- 56 1418 -- 57 1400 -- 58 1368 -- 5Y 1 3 6 5 -- 60 13Y) - 61 1338 -- 62 1322 -- 63 1320 -- 64 1318 -- 6 5 1292 -- 66 1277 -- 67 1 2 7 3 -- 68 1262 -- 69 I 2 6 0 -- 70 1 2 4 5 -- 71 1 2 3 5 -- 72 1 2 3 1 - 73 1 2 2 5 -- 74 1221 -- 7 5 1214 -- 76 1 2 1 1 -- 7 7 1 1 9 5 -- 7 8 1179 -- 79 1174 -- 80 1172 -- 81
1167 -- 8 3 1161 -- 84 1147 -- 8 5 1140 -- 86 1 1 3 5 -- 87 1135 -- M M 1131 -- 89 1126 -- 90 1125 -- 91 1124 -- 92 1119 -- 9 3 1116 -- 94 1102 -- 9 5 1100 -- 96 1082 -- 97 1070 -- 98 1066 -- 99 10% -- 100
1 1 7 1 -- 82
Fig. 3 . Trigrams.
Fig. 4. Trigrams.
On the basis of these considerations, we decided that the only way to overcome the problem of defining enormous files was to create two tables, the TOTAL-TETRAGRAMS-TABLE-A (200, 26) and the TOTAL-TETRAGRAMS-TABLE-B (26, 200) with 5200 entries of 6 digits each. It was then easy to keep counters of tetragrams of the form XXXA and BXXX, respectively ( “ X X X ” being a trigram, “ A ” any letter after “ X X X ” , and “B” any letter before “XXX”) . So, whenever a trigram XXX was found, either the tetragram BXXX or the tetragram XXXA was also assumed to exist. Then it became necessary to search through the table of the top 200 trigrams using the binary-chop technique to locate any tri- gram with an average of (log, 200) + 1 = 8 accesses, the only extra requirement being the use of indexed tables.
The following steps describe the logic necessary to produce the most frequent tetragrams:
1) Form an indexed table consisting of the 200 most frequently occurring trigrams (ascending key is “trigram”):

964 IEEE TRANSACTIONS ON PATTERN ANALYSIS AND MACHINE INTELLIGENCE, VOL. 10, NO. 6, NOVEMBER 1988
........................... IIIIIII TOP~~-TRIGRAMS-TABLE~ ............................
2) Get a record at a time from the dictionary-file (until E-0-F): _ _ _ _ _ _ _ _ _ _ _ _ _ _ _ _ _ _ _ _ _ _ _ _ _ _ _ _ [ DICTIONARY -RECORD] ____________________-- - - - - - -
3) Get a word at a time from the dictionary-record (until E-O- R):
,-WORD-l
---------- 4) Get a tetragram at a time from the word (until E-0-W): ---------_-__ [ XaXbXcXd ] - _ _ _ _ _ _ _ _ _ _ _ _ 5) Get the trigram XaXbXc from the tetragram and search the
5.1) If “found,” let the index of this table be stored on vari- able i. Assign a number to j from Xd by searching the ALPHA- BET-TABLE. Update the TOTAL-TETRAGRAMS-TABLE-A by adding 1 to the entry (i, j ).
TOP200-TRIGRAMS-TABLE.
< --------- > 26 < _ _ _ _ _ _ _ _ _ >
5.2) If “not-found,” get the trigram XbXcXd and search the
5.2.1) If “found,” let the index of this table be stored on variable n. Assign a number to m from Xa and update the TOTAL- TETRAGRAMS-TABLE-B by adding 1 to the entry (m, n) .
TOP200-TRIGRAMS-TABLE.
< --------------- -> 200 _-------_----_ ->
26 $ 1 5.2.2) If “not-found,” continue processing. This means that
the tetragram XaXbXcXd is not frequent enough to be included in our list of the most frequent tetragrams.
6) End-of-looping. 7) Transfer both tables into a file for further processing. The theoretical maximum number of distinct tetragrams that
could exist in the dictionary is 26 x 200 + 26 x 200 = 10,400 without spaces and 27 X 200 + 27 x 200 = 10,800 with spaces. When the dictionary was analyzed we found that the number of distinct tetragrams was 6026 without spaces and 5821 with spaces. This was not expected because, normally, the number of tetragrams with spaces is greater than the number of tetragrams without spaces. One explanation for this is the fact that although the number of tetragrams with spaces is very large compared to the number of tetragrams without spaces, there are many tetragrams which belong to the first category, but they are terminating parts of many words. Therefore, they are repeated without being distinct at the same time. This obviously depends on the top 200 trigrams that are actually used in each case.
Using a simple formula (introduced later in Section 111-E), we found that the theoretical total number of tetragrams is 554,486
without spaces and 648,046 with spaces. The actual total number of tetragrams we processed was 284,887 without spaces and 338,814 with spaces. Therefore, the results were produced by ana- lyzing approximately half the tetragrams which actually exist.
The lists of the most frequently occumng tetragrams which were produced using Method A are more than adequate for applications like key-set generation and compression techniques on the dictio- nary. However, for certain other applications, like spelling correc- tors, they may not be adequate because the more n-grams are known the more effective the corresponding methods become. So, we de- cided to implement Method B although the storage requirements here were 10 times larger than had been the case previously.
Method B produced 554,486 tetragrams without spaces and 648,046 tetragrams with spaces. The distinct number of tetragrams were: 35,921 without spaces and 38,651 with spaces. In the first case (without spaces) the lists of the 100 most frequently occurring tetragrams which were produced by both Methods A and B were identical, whereas in the second case (with spaces), Method B also produced the tetragrams “USLY” and “SHIP” with ranks 81 and 100, respectively.
The 100 most frequently occurring tetragrams produced by Method B are listed in Table 111. Their rank-frequency distribution in linear and logarithmic scales is presented in Figs. 5 and 6.
D. Pentagrams Storage of the theoretical maximum number of pentagrams re-
quires an enormous table of 27 x 27 x 27 x 27 X 27 = 14,348,900 distinct entries. However, with Method A the list of 200 most frequently occurring tetragrams was used to generate 4012 distinct pentagrams without spaces and 3906 distinct pentagrams with spaces. Note that only 109,495 and 148,181 pentagrams were processed in each case.
With Method B we processed 461,789 pentagrams without spaces and 554,486 with spaces and found 89,114 distinct penta- grams without spaces and 99,590 distinct pentagrams with spaces. The number of 99,590 pentagrams implies that, on average, there is more than one unique combination of 5 letters (pentagrams) in each of the 93,681 unique words of the English dictionary we have used. It is worth pointing out here some of the peculiar pentagrams of the English language. The pentagrams “ZZETT”, “ZZART”, and “ZZOUL” with frequency 1 were extracted from the dictio- nary, and these are associated with the words “MOZZETTA”, “IZZART” , and ‘‘POZZOULANA”, respectively.
The lists of the 100 most frequently occurring pentagrams pro- duced by Methods A and B were quite different. The list produced by Method B contained some newcomers, as for example “ACEOU”, “FULLY”, “OSCOP” (in the list without spaces), and “SHIP-”, “IZATI” (in the list with spaces).
The 100 most frequently occurring pentagrams produced by Method B are presented in Table IV. Their rank-frequency distri- bution incorporating the full range of 89,114 pentagrams without spaces and 99,590 pentagrams with spaces, is presented in Figs. 7 and 8. Note that the graphs involve a maximum rank of 55,000 because the rest of the pentagrams have all frequency 1.
E. Calculation of Expected Number of n-Grams There are many instances where it is very useful to be able to
calculate, theoretically, the number of n-grams that exist in a given text or dictionary. This can, for example, enable the selection of an appropriate compression technique, or even predict how many n-grams will be necessary for its effective implementation.
We found it necessary to calculate, theoretically, the number of n-grams in the dictionary in order to verify the empirical results already obtained by the various programs. It is easy to establish that the total number of n-grams in a given text or dictionary can be given by the formula:
m
N(n) = c (w - n + c) f(w) w - n

IEEE TRANSACTIONS ON PATTERN ANALYSIS AND MACHINE INTELLIGENCE, VOL. IO, NO. 6, NOVEMBER 1988
TABLE 111
4 - G M FREQUENCY RANK
ESS- NESS TION ION-
INC- AT10 ATE- ICAL
ABLE
ous-
BLE-
LLY- I T
IST- ENT-
ISM- TlC- ALLY CAL- TIVL TER- IT€- TED- ENES
MEN1
LESS OLOG
IN€- ATOR CALL ROUS INGL LITY IOUS
TICA STIC
NCE- NGLY NTER
RAPH G W INTE TOR- OGRA
LOG I LATE ATIV RAT I ILIT TING
LING SNES INES IONA
ATED ISH- B I L I RATE STER ISTI
LENE TAT1 ETER ENTI FORH ORY- OUSL ULAT
ICAT USLY ENT4 TRIC NDEK NIC- ATIC DLY- RING PLAT1 ENCE ON& THER BLEN AGE- INAT NATE EOUS R E S S TLY- S H I P
'AN-
IVE-
IZE-
ELY-
GLY-
'a-
SLY-
ANT-
my-
BLY-
N A L
4775 - 3726 - 3288 -- 3096 -- 2838 -- 2316 -- 2302 -- 2209 - 2087 -- 2029 -- 1983 -- 1596 - 1554 -- 152U -- 1%) -- 1499 -- 1498 -- 1324 -- 1232 -- 1171 -- 1153 -- 1151 -- 1134 -- 1117 -- lU96 -- I061 -- 1051 -- 994 -- 97u -- 959 -- 884 -- 351 -- 844 -- 837 -- Sib -- 815 -- 809 -- 790 -- 787 -- 78U -- 776 -- 770 -- 762 -- 729 -- 725 -- 709 -- 699 -- 691 -- 659 -- 657 -- 655 - 654 - 633 -- 641 - 625 -- 618 - 614 - 603 - 602 -- 595 - 591 - 580 - 573 -- 570 -- 569 -- 565 - 551 - 541 -- 534 -- 533 -- 531 -- 529 -- 525 -- 522 -- 522 -- 519 -- 519 -- 517 -- 514 -- 514 -- 513 - 512 -- 509 -- W 5 -- W O -- W O -- 497 -- 495 -- 490 -- 487 -- 480 -- 479 -- 473 -- 472 -- 468 -- 467 -- 467 -- 467 -- 4b5 --
1286 --
I 2 3 4 5 6 7
9 10 1 1 12 13 14 15 16 17 IS 19 20 2 1 22 23 24 25 26 27 28 29 30 3 1 32 33 34 35 3b 37 38 39 43
1 12 13 44 45 46 47 48 4 9 W SI 52 53 54 55 56 57 Y) 59 60 61 62 63 64 65 66 67 68 69 70 71 72 73 74 75 76 77 78 79 80 81 82 83 84 85 86 87 88 89 90 91 92 93 94 95 96 97 98 99 100
n
5000
6000
3000 * 0 z 3 w 2
2000
1000
0 500' 1000' 1500' 2000' 2500' 3000' RAWK.10
Fig. 5 . Tetragrams.
__
965
\
.. LOG IRAWKI
Fig. 6. Tetragrams.
where
N ( n ) = Number of n-grams in the text ( n = 1 , 2 , 3 , . . . ) .
f ( w ) = Frequency of words with length w.
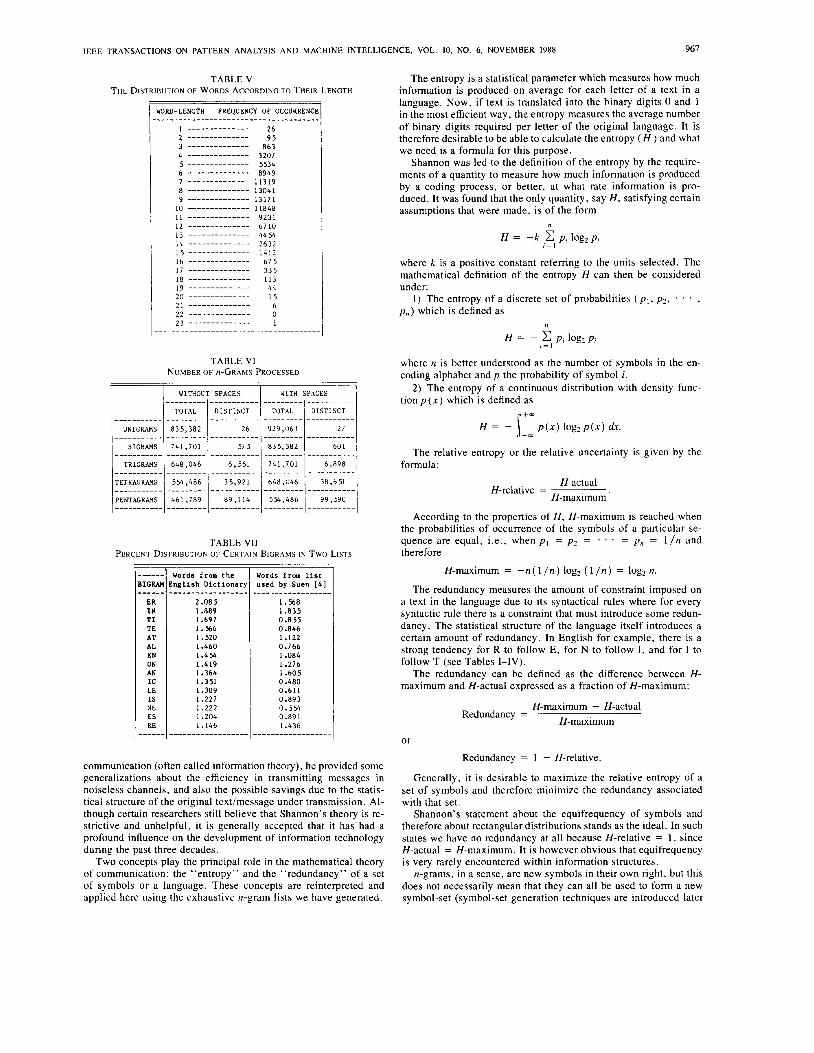
The word length distribution for the dictionary is given in Table V from which we were able to calculate the number of n-grams in each case. We found that the empirical results were identical with the results obtained theoretically (the number of n-grams processed is presented in Table VI). As it can be seen in the word length distribution (Table V ) , the most frequently occurring word length in CDAZ is 9 characters (14 percent of the words).
Suen [4] produced n-gram statistics as well as positional distri- butions from a list of carefully selected samples of natural language texts such as reportage, editorials, texts on hobbies, humor, etc. printed in America in 1961. The most frequent word length was 3 characters constituting 23 percent of the total words processed.
m = The maximum word length ( 2 3 characters for CDAZ).
c = 1 (without spaces), 2 (with spaces).

~
966
cooo-
3500-
3000
2500 - 2 U
~ Z O O O ‘ a 1
IEEE TRANSACTIONS ON PATTERN ANALYSIS AND MACHINE INTELLIGENCE, VOL. IO, NO. 6. NOVEMBER 1988
TABLE 1V THE MOST FREQUENTLY OCCURRING PENTAGRAMS (WITH SPACES)
NESS-
ABLE- ALLY-
LITI-
TION- ATION
ICAL- ENESS
CALLY TIYE- ENT- ICALL
INLLY
TLCAL CKAPH ROUS- A T I V L SYEbS U G W IHESS I L l T i ULM; I ATEQ- ISTEK
OUSLY BILIT LENhS BLENE USNES LIESHE
TORY- ERUUS SHIP-
LING-
TIOQA ISTLC
S I C -
LATE- IONAL DNESS
OLOGY IVCLY
RATE- T I NG- LOGIC CTION TABLE FORM- ABILI ABLEN IF0P.M NISM- EDLY- LNESS EXENT HATE- TATIr)
ATORY RATIO LIC4L NUUS- hTLY- NIST- IBLE- RIM- ONAL- UGlCA CATLO ETER-
ULATE ZATIO IZATI RAF”1 TIVEL EDNES ICATI E T E K
VENES SIUN- ATIC- LISM- IVENE R I N G
SGLY-
LESb-
OSLY-
ATOR-
rotis-
EWCE-
aaLy-
LOGY-
VELY-
EOUS-
ANCL-
LOUS-
u u n -
ELEG ALITY MATIC LATIO
3709 -- 2645 -- 2278 -- I602 - 1310 - I196 -- 1044 -- 816 -- 783 -- 780 -- 773 -- 766 -- 766 -- 763 -- 755 -- 715 -- 695 -- 648 -- 630 -- 59’) -- 5Y7 -- 563 -- 546 -- 545 -- 543 -- 515 -- 514 -- 513 -- w 5 -- 409 -- 453 -- 444 -- 442 -- 440 -- 434 -- 433 - 43u -- 428 -- 427 -- 414 -- 413 -- 400 - 404 - 403 -- 401 -- 390 -- 394 -- 388 -- 383 -- 378 -- 377 -- 376 -- 375 -- 371 -- 367 -- 365 -- 363 - 361 -- 354 -- 354 -- 351 -- 347 -- 346 -- 343 -- 342 -- 336 -- 323 -- 322 -- 322 -- 320 -- 315 -- 300 -- 300 -- 303 -- 302 -- 296 -- 295 -- 293 -- 291 -- 291 -- 287 -- 202 -- 202 -- 280 -- 270 -- 277 -- 276 - 271 - 260 - 268 -- 268 -- 267 -- 266 -- 263 -- 262 -- 262 -- 259 -- 257 -- 257 -- 255 --
.______. .
I 2 3 4 5 6 7 8 9
10 11 12 13 14 I5 I 6 17 10 I9 20 21 22 23 2 4 25 26 27 20 29 30 3 1 32 33 34 35 36 37 36 39 40 41 42 4 3 44 45 46 47 48 49 M 51 52 53 54 55 56 57 58 59 60 6 1 62 63 64 6 5 66 b7 68 69 70 7 1 1 2 73 74 75 76 77 76 7Y 80 01 02 03
85 86 07 00 89 90 91 92 93 94 95 96 97 98 99 LOO
a?*
.___.
1500
loo]
500
1000’ 2000’ 3000’ 4000’ 5000’ bOOOi RLWKol 0
Fig. 7 . Pentagrams.
Fig. 8 . Pentagrams
As expected, the results obtained from the analysis of CDAZ varied a great deal with those of Suen [4]. Table VI1 contains the percent distribution of bigrams in both CDAZ and the list used by Suen. It is clear that some of the most frequently occurring bigrams in CDAZ occur rarely in Suen’s list, with the exceptions of the bigrams “ I N ” , “AN”, and “ R E ” .
IV. CALCULATION OF ENTROPY A N D REDUNDANCY The statistical results obtained from the n-gram analysis can now
form the basis for the interpretation and application of Shannon’s mathematical theory of communication [2] upon the English dic- tionary. The interpretation can therefore be based on the definition of completely new symbol-sets which contain quasi-equifrequent groups [8]. Because the n-grams here are complete, the ultimate quasi-equifrequent arrangement can be formed deterministically rather than by approximation as has been the case so far.
When Shannon [ 2 ] first published his mathematical theory of
IEEE TRANSACTIONS ON PATTERN ANALYSIS AND MACHINE INTELLIGENCE, VOL. 10, NO. 6, NOVEMBER 1988 967
B I C M
ER I N T I TE AT AL EN ON AN I C LE IS NE ES RE
----_-
_ _ _ _ _ _
TABLE V THE DISTRIBUTION OF WORDS ACCORDING TO THEIR LENGTH
Words from the Words from l i s t Eng l i sh Dict ionary used by Suen [41
2.085 1.568 1 .E89 1 .E35 I .697 0.855 1.566 0 .846 1.520 1.122 I .460 0.766 1 . 4 5 4 I .084 1.419 1.276 I .364 1.605 I .351 0.480 I .309 0.611 I .227 0.893 I .222 0.554 1.204 0.891 1.146 I .436
________-_-_______
_ _ _ _ _ _ _ _ _ _ _ _ _ _ _ _ _ _ _ _ _ _ _ _ _ _ _ _ _ _ _ _ _ _ _ _
communication (often called information theory), he provided some generalizations about the efficiency in transmitting messages in noiseless channels, and also the possible savings due to the statis- tical structure of the original text/message under transmission. Al- though certain researchers still believe that Shannon’s theory is re- strictive and unhelpful, it is generally accepted that it has had a profound influence on the development of information technology during the past three decades.
Two concepts play the principal role in the mathematical theory of communication: the “entropy” and the “redundancy” of a set of symbols or a language. These concepts are reinterpreted and applied here using the exhaustive n-gram lists we have generated.
The entropy is a statistical parameter which measures how much information is produced on average for each letter of a text in a language. Now, if text is translated into the binary digits 0 and 1 in the most efficient way, the entropy measures the average number of binary digits required per letter of the original language. It is therefore desirable to be able to calculate the entropy ( H ) and what we need is a formula for this purpose.
Shannon was led to the definition of the entropy by the require- ments of a quantity to measure how much information is produced by a coding process, or better, at what rate information is pro- duced. It was found that the only quantity, say H, satisfying certain assumptions that were made, is of the form
n
H = - k c p , log, p i , = I
where k is a positive constant referring to the units selected. The mathematical definition of the entropy H can then be considered under:
1) The entropy of a discrete set of probabilities ( p , , p z , . . . , p , ) which is defined as
n
where n is better understood as the number of symbols in the en- coding alphabet and p the probability of symbol i.
2) The entropy of a continuous distribution with density func- tion p ( x ) which is defined as
+ m
H = - 5 -m P ( X ) log2 P ( X ) dr.
The relative entropy or the relative uncertainty is given by the formula:
H-actual H-maximum
H-relative =
According to the properties of H, H-maximum is reached when the probabilities of occurrence of the symbols of a particular se- quence are equal, i.e., when pI = p 2 = . . . = pn = 1 / n and therefore
H-maximum = -n ( 1 /n) log, ( 1 /n) = log, n.
The redundancy measures the amount of constraint imposed on a text in the language due to its syntactical rules where for every syntactic rule there is a constraint that must introduce some redun- dancy. The statistical structure of the language itself introduces a certain amount of redundancy. In English for example, there is a strong tendency for R to follow E, for N to follow I , and for I to follow T (see Tables I-IV).
The redundancy can be defined as the difference between H- maximum and H-actual expressed as a fraction of H-maximum:
H-maximum - H-actual Redundancy = H-maximum
or
Redundancy = 1 - H-relative.
Generally, it is desirable to maximize the relative entropy of a set of symbols and therefore minimize the redundancy associated with that set.
Shannon’s statement about the equifrequency of symbols and therefore about rectangular distributions stands as the ideal. In such states we have no redundancy at all because H-relative = 1, since H-actual = H-maximum. It is however obvious that equifrequency is very rarely encountered within information structures.
n-grams, in a sense, are new symbols in their own right, but this does not necessarily mean that they can all be used to form a new symbol-set (symbol-set generation techniques are introduced later

968 IEEE TRANSACTIONS ON PATTERN ANALYSIS AND MACHINE INTELLIGENCE, VOL. IO. NO. 6, NOVEMBER 1988
LETTER
A
B
C
D
E
F
-2 -2 .__!
2 -2
J
U
N
0
TABLE VI11 INFORMATION CONTENT OF LETTERS I N THE DICTIONARY
OCCURRENCES RANK lug ( P . )
b9.281 3 U.U829 d.2Y78
15,443 I8 0.0185 11.1064
39.193 IO 0.0469 u.2111u
26,580 I 2 0.0318 u.1581
91,262 I 0.1092 0.3488
10,191 19 0.0122 0.0175
........................... .__._pi ..... I .:?i___Z....
...................................................
...................................................
...................................................
...................................................
...................................................
................................................... 18,844 I 7 0.U226 1.1235
21.653 I 5 \;-i:iij'j ' , . l ) b 5
1 5 , 5 6 1 2 0.09u5 1.313b
....................... I ...... I. -1 ........
....................... _._...._-__.I ............
................................... 1 ............
................. I ................ ~ I . I -----------
1.239 Lb U.0015 I a . l l l ad
4.727 22 0.0051 Y .U424 ....................................... I ------------
51,606 9 0.(1613
I.LS32 25,371 I 4 0.0304
59,930 4 0.0717 . . 2 1 2 5
56,696 1 0.0h7Y
................................... 1 - ~ --
...................................................
...................................................
...................
-2
-2 V
X
Y
z
in Section V). However, n-gram statistics can be used to calculate the relative entropy and the redundancy of the dictionary.
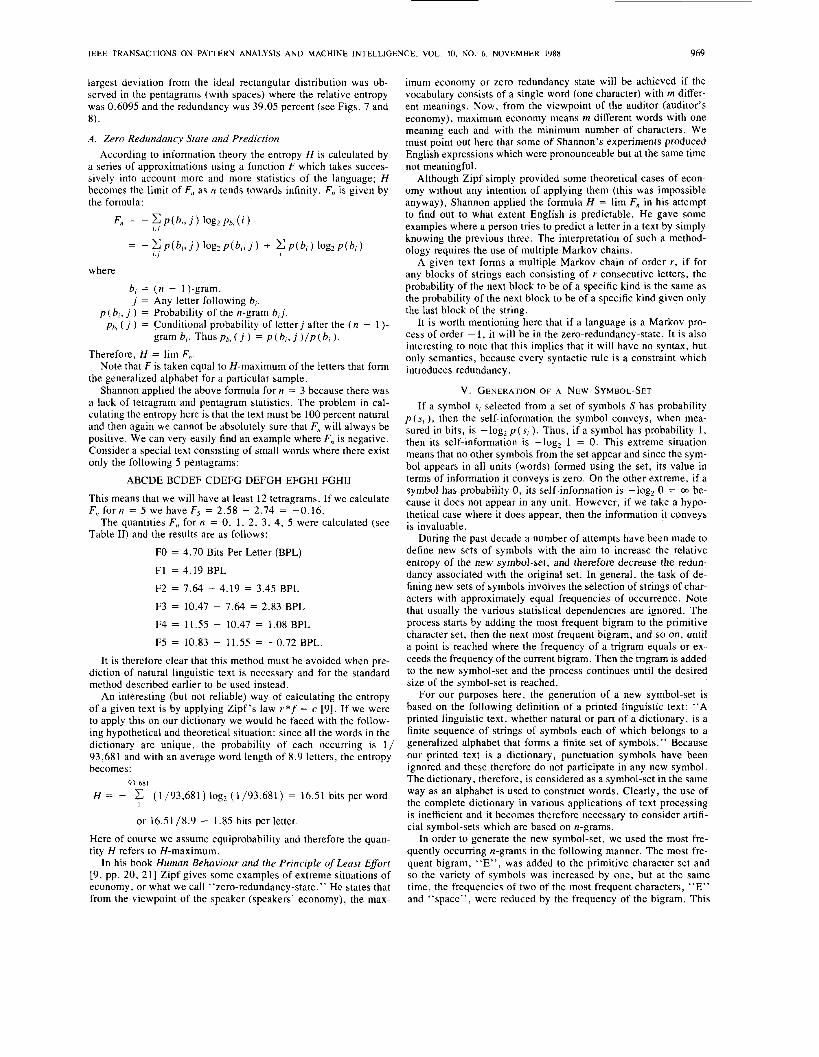
Table VI11 contains the frequency of occurrence of the letters in our dictionary of 93,681 words. The sum of the values in the last column of this table is equal to 4.19876 and is interpreted as the entropy (or uncertainty) of the ensemble. Therefore H-actual = 4.19876. Now H-maximum refers to the theoretical maximum en- tropy, this being achieved only when the letters of the alphabet are all equiprobable [8]. Consequently,
H-maximum = log, 26 = 4.70042.
Note that in practical terms the above number means that if let- ters of the English alphabet are selected randomly for inclusion in some unit of the dictionary, then on average 4.70042 attempts are required to identify any of the letters if they are all equiprobable. Thus,
................................... I ........
........................... -.-...---.-.,--.~~~4-~~--. 8,298 20 0.0099 1---1.11659
4.932 2 1 0.0059
2.618 24 0.0031 > .02 58
21,045 16 0.0252 11. I 3 3 8
3,021 23 0.0036 0.0292
................................... I ............
...................................................
...................................................
...................................................
H-actual 4.19876 H-maximum 4.70042
H-relative = - - 0.89327.
no spaces
The redundancy can then be calculated as follows:
Redundancy = 1 - 0.89327 = 0.10673
Therefore, the relative uncertainty in this ensemble is 89.3 per- cent and the redundancy is 10.7 percent. For further understanding of these findings the rank-frequency distribution of the letters is presented in Fig. 9.
It is interesting to note that the results obtained from the above analysis are similar to those obtained by Yannakoudakis [6] from a file of bibliographic records. Yannakoudakis [6] found that the relative entropy for that file was 0.899 and the redundancy was 0.101, The relative entropy and the redundancy for bigrams, tri-
575 9.1674 7.6416 0.8335 0.1665
601 ______-- ----_.-_ _ _ _ _ _ _ _ - --------.__ _____.______
'"0°01
Fig. 9. English letters.
TABLE IX ENTROPY A N D REDUNDANCY OF n-GRAMS
I n 0
grams, tetragrams, and pentagrams in CDAZ were calculated and the results will be seen in Table IX. Note that
H-maximum = -log, (MAX-RANK)
because the maximum rank is the number of distinct n-grams that exist in the dictionary.
An unexpected finding was the relatively low H-actual in the pentagrams. The reason for this is that even if the number of n- grams was large, most of these would occur once or twice and therefore their probability of occurrence would be very low. Note that from the 99,590 pentagrams that exist, 42,075 occur once, 16,665 occur twice, and 9475 occur three times.
Since it is practically impossible to achieve absolute equifre- quency among the symbols, we expected the distribution of n-grams to be far from the ideal rectangular distribution. However, given a relative entropy of 0.8335 for bigrams, the rank-frequency distri- bution was perfectly acceptable and very close to the rectangular (see Fig. 2). The deviation from the ideal was worse in the trigram rank-frequency distribution, but still acceptable (see Fig. 4). The
~
IEEE TRANSACTIONS ON PATTERN ANALYSIS AND MACHINE INTELLIGENCE. VOL. IO, NO. 6. NOVEMBER 1988 969
largest deviation from the ideal rectangular distribution was ob- served in the pentagrams (with spaces) where the relative entropy was 0.6095 and the redundancy was 39.05 percent (see Figs. 7 and 8).
A . Zero Redundancy State and Prediction According to information theory the entropy H is calculated by
a series of approximations using a function F which takes succes- sively into account more and more statistics of the language; H becomes the limit of F, as n tends towards infinity. F,, is given by the formula:
F,, = - C p ( b , , j ) l o g z P b , ( i ) ‘ . I
where
bi = (n - 1)-gram. j = Any letter following b,.
p (b , , j ) = Probability of the n-gram b, j . ph, ( j ) = Conditional probability of letterj after the ( n - 1 )-
gramb,. T h u s p , , ( j ) = p ( b , , j ) / p ( b , ) . Therefore, H = lim F,.
Note that F is taken equal to H-maximum of the letters that form the generalized alphabet for a particular sample.
Shannon applied the above formula for n = 3 because there was a lack of tetragram and pentagram statistics. The problem in cal- culating the entropy here is that the text must be 100 percent natural and then again we cannot be absolutely sure that F,, will always be positive. We can very easily find an example where F, is negative. Consider a special text consisting of small words where there exist only the following 5 pentagrams:
ABCDE BCDEF CDEFG DEFGH EFGHI FGHIJ
This means that we will have at least 12 tetragrams. If we calculate F,, for n = 5 we have F5 = 2.58 - 2.74 = -0.16.
The quantities F, for n = 0, 1, 2, 3, 4, 5 were calculated (see Table 11) and the results are as follows:
FO = 4.70 Bits Per Letter (BPL)
F1 = 4.19 BPL
F2 = 7.64 - 4.19 = 3.45 BPL
F3 = 10.47 - 7.64 = 2.83 BPL
F4 = 11.55 - 10.47 = 1.08 BPL
F5 = 10.83 - 11.55 = -0.72 BPL
It is therefore clear that this method must be avoided when pre- diction of natural linguistic text is necessary and for the standard method described earlier to be used instead.
An interesting (but not reliable) way of calculating the entropy of a given text is by applying Zipf’s law r * f = c [9]. If we were to apply this on our dictionary we would be faced with the follow- ing hypothetical and theoretical situation: since all the words in the dictionary are unique, the probability of each occurring is 1 / 93,681 and with an average word length of 8.9 letters, the entropy becomes:
93.681
H = - c (1/93,681) log, (1/93,681) = 16.51 bits per word I
or 16.51/8.9 = 1.85 bits per letter.
Here of course we assume equiprobability and therefore the quan- tity H refers to H-maximum.
In his book Human Behaviour and the Principle of Least Effort [9, pp. 20, 211 Zipf gives some examples of extreme situations of economy, or what we call “zero-redundancy-state.” He states that from the viewpoint of the speaker (speakers’ economy), the max-
imum economy or zero redundancy state will be achieved if the vocabulary consists of a single word (one character) with m differ- ent meanings. Now, from the viewpoint of the auditor (auditor’s economy), maximum economy means m different words with one meaning each and with the minimum number of characters. We must point out here that some of Shannon’s experiments produced English expressions which were pronounceable but at the same time not meaningful.
Although Zipf simply provided some theoretical cases of econ- omy without any intention of applying them (this was impossible anyway), Shannon applied the formula H = lim F, in his attempt to find out to what extent English is predictable. He gave some examples where a person tries to predict a letter in a text by simply knowing the previous three. The interpretation of such a method- ology requires the use of multiple Markov chains.
A given text forms a multiple Markov chain of order r , if for any blocks of strings each consisting of r consecutive letters, the probability of the next block to be of a specific kind is the same as the probability of the next block to be of a specific kind given only the last block of the string.
It is worth mentioning here that if a language is a Markov pro- cess of order - 1, it will be in the zero-redundancy-state. It is also interesting to note that this implies that it will have no syntax, but only semantics, because every syntactic rule is a constraint which introduces redundancy.
V . GENERATION OF A NEW SYMBOL-SE?
If a symbol si selected from a set of symbols S has probability p ( s , 1, then the self-information the symbol conveys, when mea- sured in bits, is -log, p ( s , ). Thus, if a symbol has probability l , then its self-information is -logz 1 = 0. This extreme situation means that no other symbols from the set appear and since the sym- bol appears in all units (words) formed using the set, its value in terms of information it conveys is zero. On the other extreme, if a symbol has probability 0, its self-information is -log2 0 = m be- cause it does not appear in any unit. However, if we take a hypo- thetical case where it does appear, then the information it conveys is invaluable.
During the past decade a number of attempts have been made to define new sets of symbols with the aim to increase the relative entropy of the new symbol-set, and therefore decrease the redun- dancy associated with the original set. In general, the task of de- fining new sets of symbols involves the selection of strings of char- acters with approximately equal frequencies of occurrence. Note that usually the various statistical dependencies are ignored. The process starts by adding the most frequent bigram to the primitive character set, then the next most frequent bigram, and so on, until a point is reached where the frequency of a trigram equals or ex- ceeds the frequency of the current bigram. Then the trigram is added to the new symbol-set and the process continues until the desired size of the symbol-set is reached.
For our purposes here, the generation of a new symbol-set is based on the following definition of a printed linguistic text: “A printed linguistic text, whether natural or part of a dictionary, is a finite sequence of strings of symbols each of which belongs to a generalized alphabet that forms a finite set of symbols.” Because our printed text is a dictionary, punctuation symbols have been ignored and these therefore do not participate in any new symbol. The dictionary, therefore, is considered as a symbol-set in the same way as an alphabet is used to construct words. Clearly, the use of the complete dictionary in various applications of text processing is inefficient and it becomes therefore necessary to consider artifi- cial symbol-sets which are based on n-grams.
In order to generate the new symbol-set, we used the most fre- quently occurring n-grams in the following manner. The most fre- quent bigram, “E”, was added to the primitive character set and so the variety of symbols was increased by one, but at the same time, the frequencies of two of the most frequent characters, “E” and “space”, were reduced by the frequency of the bigram. This
970 IEEE TRANSACTIONS ON PATTERN ANALYSIS AND MACHINE INTELLIGENCE, VOL. IO. NO. 6, NOVEMBER 1988
Y3681 E 91262 I 75561 A 69291 N 59930 T 58187
R 58037 U 56b96 S 52112 L 51606 C 39193 U 31702
D 26580 P 25607 M 25371 H 21653 Y 21045 C 18844
B 15443 F 10191 V 8298 U 4932 K 4727 2 3021
X 2618 Q 1546 J I239 E- 18149 ER 15170 Y- 14243
I N 14016 TI 12592 TE I1618 AT 11276 AL IO834 EN IO789
ON 1052b AN 10111 I C 10023 LE 9712 S- 9171 IS 9103
NE 9066 ES 8931 RE 8 W l RA 8486 ST 8447 RI 8186
U- 8181 UT 8 0 2 5 L l 7639 4R 1636 OR 7472 R- 7271
ss 11)w LY 104u T- 1030 IT 6628 RO 61u7 D- b698 .......... /_..._..... ........................................ U N 6521 LY- 6389 €D 0372 CO 6259 L- 6148 CA 6145
I O 6019 LA 5913 OU 5849 US 5748 DE 5643 ESS 5616
. _
.............................. ....................
........................................
............................................................
............................................................
_.________ _____--.-- -_-._..___ ---..-____ __.____-_- ---_______ ............................................................
............................................................
............................................................
............................................................
............................................................
............................................................ ER- 5297 D I 5280 NI 5216 NG 5143 TA 4983 ss- 4912
E L 4877 LL 4869 TR 4845 m 4818 ESS- 4775 .......... 4907,TO-.-.-‘.- .___._..__ -__.__.___ ____._____ -______._.
............................................................ 4494 YE 4492 CH 4462
431n AL 4249 c 4208 .................... ....... .-: ....... -= ........
4086 PE 4061 I C 4062 .............................. .................... -.= ....... OM + O l I 51 4 0 5 AB 1003!r iC 3985 BL 3981 0US 3981
TH 3976 NES 3966 CE 3963 IC 3902 TE- 3865 ON 3808
UL 3183 ING 3713 M I 3153 HESS 3726 PH 3720 NESS- 370Y .......... ,...._.____ ........................................
ATE 34491!5----3389 I ---------
........................................
............................................................
............................................................
y!----!!-ym 3594 ENT I ~ S C / N D 3537 TI0 3507 LE- 3478 ............................................
. _ _ - _ _ _ __.
TABLE X THE NEW SYMBOL-SET GENERATED
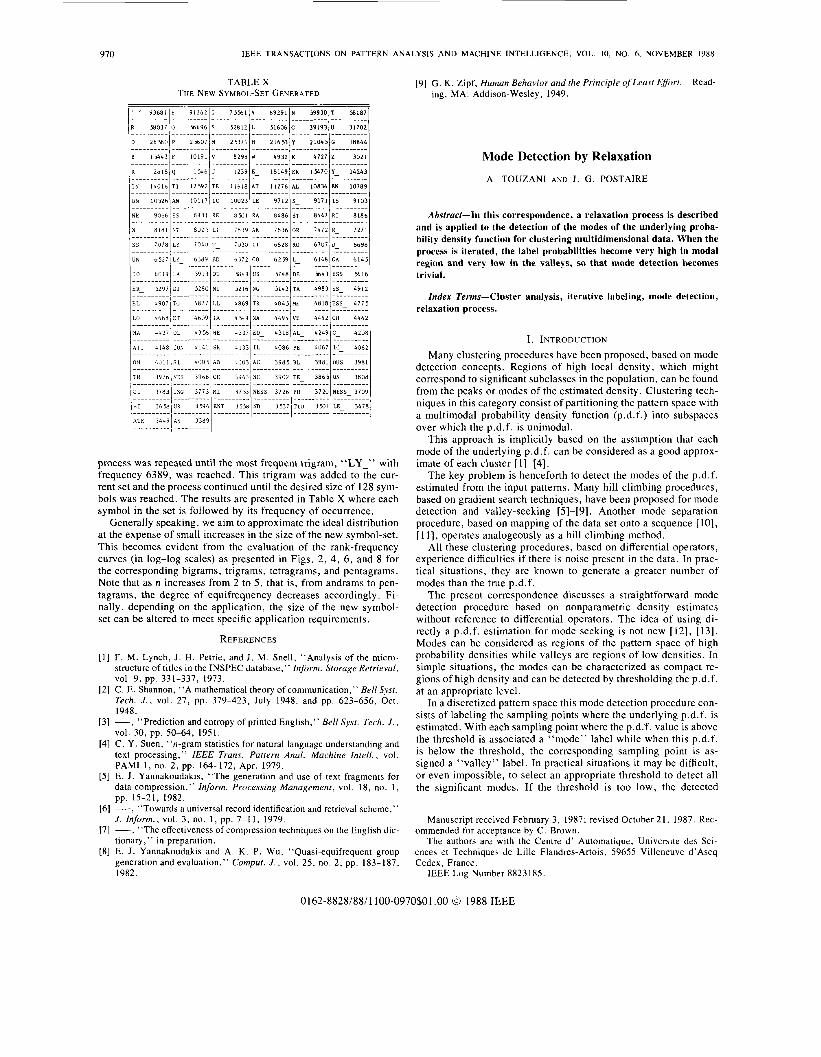
process was repeated until the most frequent trigram, “LY-” with frequency 6389, was reached. This trigram was added to the cur- rent set and the process continued until the desired size of 128 sym- bols was reached. The results are presented in Table X where each symbol in the set is followed by its frequency of occurrence.
Generally speaking, we aim to approximate the ideal distribution at the expense of small increases in the size of the new symbol-set. This becomes evident from the evaluation of the rank-frequency curves (in log-log scales) as presented in Figs. 2, 4, 6, and 8 for the corresponding bigrams, trigrams, tetragrams, and pentagrams. Note that as n increases from 2 to 5 , that is, from andrams to pen- tagrams, the degree of equifrequency decreases accordingly. Fi- nally, depending on the application, the size of the new symbol- set can be altered to meet specific application requirements.
REFERENCES
[ I ] F. M. Lynch, J . H. Petrie, and J. M. Snell, “Analysis of the micro- structure of titles in the INSPEC database,” Inform. Srorage Refrieval ,
[2] C. E. Shannon, “A mathematical theory of communication,” Bell Sysf. Tech. J . , vol. 27, pp. 379-423, July 1948, and pp. 623-656, Oct. 1948.
[3] -, “Prediction and entropy of printed English,” Bell Sysr. Tech. J . ,
[4] C. Y. Suen, “n-gram statistics for natural language understanding and text processing,” IEEE Trans. Pattern Anal. Machine Intell. , vol. PAMI-I, no. 2, pp. 164-172, Apr. 1979.
[ 5 ] E. J . Yannakoudakis, “The generation and use of text fragments for data compression,” Inform. Processing Management, vol. 18, no. 1,
161 -, “Towards a universal record identification and retrieval scheme,” J . Inform., vol. 3 , no. 1, pp. 7-11, 1979.
[7] -, “The effectiveness of compression techniques on the English dic- tionary,” in preparation.
[8] E. J. Yannakoudakis and A. K. P. Wu, “Quasi-equifrequent group generation and evaluation,” Compuf. J . , vol. 25, no. 2, pp. 183-187, 1982.
vol. 9 , pp. 331-337, 1973.
vol. 30, pp. 50-64, 1951.
pp. 15-21, 1982.
191 G. K . Zipf, Human Behavior and the Principle of Leasr Efforr. Read- ing, MA: Addison-Wesley, 1949.
Mode Detection by Relaxation
A. TOUZANI A N D J . G . POSTAIRE
Abstract-In this correspondence, a relaxation process is described and is applied to the detection of the modes of the underlying proba- bility density function for clustering multidimensional data. When the process is iterated, the label probabilities become very high in modal region and very low in the valleys, so that mode detection becomes trivial.
Index Terms-Cluster analysis, iterative labeling, mode detection, relaxation process.
I. INTRODUCTION Many clustering procedures have been proposed, based on mode
detection concepts. Regions of high local density, which might correspond to significant subclasses in the population, can be found from the peaks or modes of the estimated density. Clustering tech- niques in this category consist of partitioning the pattern space with a multimodal probability density function (p.d.f.) into subspaces over which the p.d.f. is unimodal.
This approach is implicitly based on the assumption that each mode of the underlying p.d.f. can be considered as a good approx- imate of each cluster [ 1]-[4].
The key problem is henceforth to detect the modes of the p.d.f. estimated from the input patterns. Many hill-climbing procedures, based on gradient search techniques, have been proposed for mode detection and valley-seeking [ 5 ] - [ 9 ] . Another mode separation procedure, based on mapping of the data set onto a sequence [lo], [ I 11, operates analogeously as a hill climbing method.
All these clustering procedures, based on differential operators, experience difficulties if there is noise present in the data. In prac- tical situations, they are known to generate a greater number of modes than the true p. d. f.
The present correspondence discusses a straightforward mode detection procedure based on nonparametric density estimates without reference to differential operators. The idea of using di- rectly a p.d.f. estimation for mode seeking is not new [12], [13]. Modes can be considered as regions of the pattern space of high probability densities while valleys are regions of low densities. In simple situations, the modes can be characterized as compact re- gions of high density and can be detected by thresholding the p.d.f. at an appropriate level.
In a discretized pattern space this mode detection procedure con- sists of labeling the sampling points where the underlying p.d.f. is estimated. With each sampling point where the p.d.Y. value is above the threshold is associated a “mode” label while when this p.d.f. is below the threshold, the corresponding sampling point is as- signed a “valley” label. In practical situations it may be difficult, or even impossible, to select an appropriate threshold to detect all the significant modes. If the threshold is too low, the detected
Manuscript received February 3, 1987; revised October 21, 1987. Rec- ommended for acceptance by C. Brown.
The authors are with the Centre d’ Automatique, Universite des Sci- ences et Techniques de Lille Flandres-Artois, 59655 Villeneuve d’Ascq Cedex, France.
IEEE Log Number 8823185.
0162-8828/88/1100-0970$01.00 0 1988 IEEE