
An Industrial-Based Consortium to Develop Premium Carbon ...
504
An Industrial-Based Consortium to Develop Premium Carbon Products from Coal Annual Technical Progress Report for the period October 1, 2005 through September 30, 2006 Report Prepared By: Bruce G. Miller January 2007 Work Performed Under Cooperative Agreement No. DE-FC26-03NT41874 Submitted by: The Energy Institute The Pennsylvania State University C211 Coal Utilization Laboratory University Park, Pennsylvania 16802 For: NETL ADD Document Control, Building 921 U.S. Department of Energy National Energy Technology Laboratory P.O. Box 10940 Pittsburgh, Pennsylvania 1523-0940
-
Upload
khangminh22 -
Category
Documents
-
view
3 -
download
0
Transcript of An Industrial-Based Consortium to Develop Premium Carbon ...
An Industrial-Based Consortium to
Develop Premium Carbon Products from Coal
Annual Technical Progress Report
for the period
October 1, 2005 through September 30, 2006
Report Prepared By:
Bruce G. Miller
January 2007
Work Performed Under Cooperative Agreement No. DE-FC26-03NT41874
Submitted by:
The Energy Institute
The Pennsylvania State University
C211 Coal Utilization Laboratory
University Park, Pennsylvania 16802
For:
NETL ADD Document Control, Building 921
U.S. Department of Energy
National Energy Technology Laboratory
P.O. Box 10940
Pittsburgh, Pennsylvania 1523-0940

Disclaimer
This report was prepared as an account of work sponsored by an agency of the United States
Government. Neither the United States Government nor any agency thereof, nor any of their
employees, makes any warranty, express or implied, or assumes any legal liability or
responsibility for the accuracy, completeness, or usefulness of any information, apparatus,
product, or process disclosed, or represents that its use would not infringe privately owned rights.
Reference herein to any specific commercial product, process, or service by trade name,
trademark, manufacturer, or otherwise does not necessarily constitute or imply its endorsement,
recommendation, or favoring by the United States Government or any agency thereof. The views
and opinions of authors expressed herein do not necessarily state or reflect those of the United
States Government or any agency thereof.
2

Abstract
Since 1998, The Pennsylvania State University has been successfully managing the Consortium
for Premium Carbon Products from Coal (CPCPC), which is a vehicle for industry-driven
research on the promotion, development, and transfer of innovative technology on premium
carbon produces from coal to the U.S. industry. The CPCPC is an initiative being led by Penn
State, its co-charter member West Virginia University (WVU), and the U.S. Department of
Energy’s (DOE) National Energy Technology Laboratory (NETL), who also provides the base
funding for the program, with Penn State responsible for consortium management. CPCPC began
in 1998 under DOE Cooperative Agreement No. DE-FC26-98FT40350. This agreement ended
November 2004 but the CPCPC activity has continued under the present cooperative agreement,
No. DE-FC26-03NT41874, which started October 1, 2003.
The objective of the second agreement is to continue the successful operation of the CPCPC. The
CPCPC has enjoyed tremendous success with its organizational structure, that includes Penn
State and WVU as charter members, numerous industrial affiliate members, and strategic
university affiliate members together with NETL, forming a vibrant and creative team for
innovative research in the area of transforming coal to carbon products. The key aspect of
CPCPC is its industry-led council that selects proposals submitted by CPCPC members to ensure
CPCPC target areas have strong industrial support. Base funding for the selected projects is
provided by NETL with matching funds from industry.
At the annual funding meeting held in October 2003, ten projects were selected for funding.
Subcontracts were let from Penn State to the subcontractors on March 1, 2004. Nine of the ten
2004 projects were completed during the previous annual reporting period and their final reports
were submitted with the previous annual report (i.e., 10/01/04-09/30/05). The final report for the
remaining project, which was submitted during this reporting period (i.e., 10/01/05-09/30/06), is
attached.
At the annual funding meeting held in November 2004, eleven projects were selected for
funding. Subcontracts were let from Penn State to the subcontractors on March 1, 2005. Three
additional projects were selected for funding during the April 2005 tutorial/funding meeting.
Subcontracts were let from Penn State to the subcontractors on July 1, 2005. Of these fourteen
2005 projects, eleven have been completed and the final reports are attached.
An annual funding meeting was held in November 2005 and the council selected five projects for
funding. Subcontracts were let from Penn State to the subcontractors on March 1, 2006, except
for one that started October 1, 2006.
3

Table of Contents
Disclaimer...................................................................................................................... 2
Abstract ......................................................................................................................... 3
Table of Contents .......................................................................................................... 4
Introduction................................................................................................................... 5
Executive Summary ...................................................................................................... 6
Experimental ................................................................................................................. 7
Results and Discussion .................................................................................................. 8
Conclusions.................................................................................................................. 10
References……………………………………………………………………………. ...11
Appendix A: 2004 Project Final Reports .................................................................. 12
1. Technical and Economic Assessment of Mild Coal Extraction
University of Kentucky – Subcontract # 2691-UK-DOE-1874 ............................ 13
Appendix B: 2005 Project Final Reports.................................................................... 43
1. Design of Nanoporous Carbon Derived from Coal Tar Pitch/
Polymer Blends for Ultracapacitors
Pennsylvania State University – Subcontract # 2872-TPSU-DOE-1874 ............. 44
2. Continued Development of Pitch/Nanotube Foam and
Fiber Composites
University of Kentucky – Subcontract # 2869-UK-DOE-1874 ............................ 71
3. Nanocarbons from Anthracite Coal
Pennsylvania State University – Subcontract # 2875-TPSU-DOE-1874 ............. 95
4. Adapting Anthracite Coal and Stockpiled Anthracite Fines to
Green Sand Iron Foundries
Pennsylvania State University – Subcontract # 2873-TPSU-DOE-1874 ........... 151
5. Mild Coal Extraction for the Production of Anode Coke
University of Kentucky – Subcontract # 2865-UK-DOE-1874 .......................... 224
6. Premium Carbon Products from Coal: A Sulfur-Based Approach
Pennsylvania State University – Subcontract # 2874-TPSU-DOE-1874 ........... 260
7. TiO2-Coated Activated Carbon
University of Florida – Subcontract # 2871-UF-DOE-1874............................. 275
8. Coal-Derived Nanofiber Sheet Development
Inorganic Specialists, Inc. – Subcontract # 2870-ISI-DOE-1874...................... 320
9. Coal-Derived Composites using Pitch and Fly Ash
West Virginia University – Subcontract # 2866-WVU-DOE-1874 .................... 338
10. Needle Coke from Coal-Derived Feedstock
GrafTech International Ltd. – Subcontract # 2867-GTIL-DOE-1874 ............... 379
11. Carbon Foam Production through Plasticization of Coal Tar
Pitch with Supercritical CO2
Premium Carbon Products – Subcontract # 3035-TPSU-DOE-1874................ 466
4

Introduction
Since 1998, The Pennsylvania State University has been successfully managing the Consortium
for Premium Carbon Products from Coal (CPCPC), which is a vehicle for industry-driven
research on the promotion, development, and transfer of innovative technology on premium
carbon produces from coal to the U.S. industry. The CPCPC is an initiative being led by Penn
State, its co-charter member West Virginia University (WVU), and the U.S. Department of
Energy’s (DOE) National Energy Technology Laboratory (NETL), who also provides the base
funding for the program, with Penn State responsible for consortium management. CPCPC began
in 1998 under DOE Cooperative Agreement No. DE-FC26-98FT40350. This agreement ended
November 2004 but the CPCPC activity has continued under the present cooperative agreement,
No. DE-FC26-03NT41874, which started October 1, 2003.
The objective of the second agreement is to continue the successful operation of the CPCPC. The
CPCPC has enjoyed tremendous success with its organizational structure, that includes Penn
State and WVU as charter members, numerous industrial affiliate members, and strategic
university affiliate members together with NETL, forming a vibrant and creative team for
innovative research in the area of transforming coal to carbon products. The key aspect of
CPCPC is its industry-led council that selects proposals submitted by CPCPC members to ensure
CPCPC target areas have strong industrial support.
CPCPC is promoting the use of secure, domestic coal resources to produce environmentally
benign, high-value carbon products, such as carbon fibers, activated carbons, binder pitches,
cokes for baked anodes and graphite, carbon foams, and carbon nanotubes. Although coal is the
largest domestic fossil fuel hydrocarbon resource of the U.S., estimated to last over 200 years at
the present consumption rate, most of the premium carbon products developed and manufactured
in the U.S. derive mainly from petroleum, thus creating dependence on foreign imports to
manufacture essential carbon products for the domestic market. To ensure sustainable
development of the carbon product, the inherent potential of the great abundance of coal in the
U.S. must be pursued to supply and introduce environmentally benign and affordable premium
carbon products to the general public. The CPCPC has, since 1998, strived for the recognition of
coal as a valuable resource for producing premium carbon products. Several success stories have
been funded so far including low-cost carbon fibers from coal for lighter vehicles, large
production of inexpensive activated carbon for water and air treatment, and high-quality binder
pitches and cokes from coal. Through its continuation, the industrial-driven consortium is
committed to further promote projects that use coal to ensure a sustainable development of the
U.S. carbon industry.
The scope of Penn State’s activities includes managing the process of attracting and maintaining
consortium members, soliciting proposals, providing the forum for the CPCPC council in
selecting proposals from members for technical work in the subject area, awarding and
monitoring subcontracts to members to accomplish the selected technical work, and
disseminating the results of the technical work via meetings of the consortium.
5

Executive Summary
Since 1998, The Pennsylvania State University has been successfully managing the Consortium
for Premium Carbon Products from Coal (CPCPC), which is a vehicle for industry-driven
research on the promotion, development, and transfer of innovative technology on premium
carbon produces from coal to the U.S. industry. The CPCPC is an initiative being led by Penn
State, its co-charter member West Virginia University (WVU), and the U.S. Department of
Energy’s (DOE) National Energy Technology Laboratory (NETL), who also provides the base
funding for the program, with Penn State responsible for consortium management. CPCPC began
in 1998 under DOE Cooperative Agreement No. DE-FC26-98FT40350. This agreement ended
November 2004 but the CPCPC activity has continued under the present cooperative agreement,
No. DE-FC26-03NT41874, which started October 1, 2003.
The objective of the second agreement is to continue the successful operation of the CPCPC. The
CPCPC has enjoyed tremendous success with its organizational structure, that includes Penn
State and WVU as charter members, numerous industrial affiliate members, and strategic
university affiliate members together with NETL, forming a vibrant and creative team for
innovative research in the area of transforming coal to carbon products. The key aspect of
CPCPC is its industry-led council that selects proposals submitted by CPCPC members to ensure
CPCPC target areas have strong industrial support. Base funding for the selected projects is
provided by NETL with matching funds from industry.
At the annual funding meeting held in October 2003, ten projects were selected for funding.
Subcontracts were let from Penn State to the subcontractors on March 1, 2004. Nine of the ten
2004 projects were completed during the previous annual reporting period and their final reports
were submitted with the previous annual report (i.e., 10/01/04-09/30/05). The final report for the
remaining project, which was submitted during this reporting period (i.e., 10/01/05-09/30/06), is
attached.
At the annual funding meeting held in November 2004, eleven projects were selected for
funding. Subcontracts were let from Penn State to the subcontractors on March 1, 2005. Three
additional projects were selected for funding during the April 2005 tutorial/funding meeting.
Subcontracts were let from Penn State to the subcontractors on July 1, 2005. Of these fourteen
2005 projects, eleven have been completed and the final reports are attached.
An annual funding meeting was held in November 2005 and the council selected five projects for
funding. Subcontracts were let from Penn State to the subcontractors on March 1, 2006, except
for one which started October 1, 2006.
6

Experimental
No experimental work was performed. The project requires management activities from Penn
State.
7

Results and Discussion
During this reporting period, the last final report of the 2004 projects was submitted. It is
contained in Appendix A.
A meeting was held at GrafTech International, Ltd., in Parma, Ohio on May 18-19, 2005 to
review proposals, perform technology transfer by providing updates on the 2004 projects, and
participate in tours at GrafTech’s facilities. Three projects were selected by the council for
funding and subcontracts were let by Penn State on July 1, 2005. The project funding periods are
July 1, 2005 to June 30, 2006. The projects, principal investigators, and proposing organizations
are:
“Activated Carbons for CO2 Capture from Coal-Derived Pitch/Polymer Blends,” Rodney
Andrews, University of Kentucky
“Mechano-Thermal Method to Produce Carbon Nanotubes from Anthracite Coal,”
Caroline Burgess Clifford, The Pennsylvania State University
“Carbon Foam Production through Plasticization of Coal Tar Binder Pitch with
Supercritical CO2,” Joseph M. Stoffa, Premium Carbon Products LLC
Eleven of the fourteen 2005 projects (These 14 projects were selected at the fall funding meeting
in November 2004 and the GrafTech meeting in May 2005.) have been completed. The final
reports are contained in Appendix B.
During this reporting period, an annual funding meeting was held at the Penn Stater Hotel &
Conference Center in State College, Pennsylvania on November 9-10, 2005. Five projects were
selected by the council and subcontracts were let by Penn State on March 1, 2006, except for one
which started October 1, 2006. The project funding periods are for one year. The projects,
principal investigators, and proposing organizations are:
“Preparation and Characterization of Coal-Derived Carbon Materials as Novel
Adsorbents for Sulfur Removal from Liquid Fuels,” Chunshan Song, The Pennsylvania
State University
“Novel Electrochemical Capacitors using Coal-Derived Carbons,” Stephen Lipka,
University of Kentucky
“Removal of SO2 and NOx over Coal/Petroleum-Based Activated Carbons,” Parvana
Aksoy, The Pennsylvania State University
“Investigation of Carbon Foams Produced from Pitch via Blowing Agents,” Joseph M.
Stoffa, Premium Carbon Products LLC
“Premium Carbon Products from Coal: Continuation of a Sulfur-Based Approach,” Paul
Painter, The Pennsylvania State University
8

A spring meeting was held on April 12-13, 2006 in Lexington, Kentucky. All on-going projects
were reviewed and meeting attendees were given a tour of the University of Kentucky’s Center
for Applied Energy Research.
One recruiting trip was made by attending the 31st International Technical Conference on Coal
Utilization & Fuel Systems from May 21-25, 2006 in Clearwater, Florida. A booth was set-up to
introduce CPCPC to the attendees, highlight projects and achievements, and attract new
members.
9

Conclusions
A second contract was executed with DOE NETL starting in October 2003 to continue the
activities of CPCPC. An annual funding meeting was held in October 2003 and the council
selected ten projects for funding. Nine of the ten 2004 projects were completed during the
previous annual reporting period (i.e., 10/01/04-09/30/05) and their final reports were submitted
with the previous annual report. The final report for the remaining project, which was submitted
during this reporting period (i.e., 10/01/05-09/30/06), is appended to this report.
At the annual funding meeting held in November 2004, eleven projects were selected for
funding. Subcontracts were let from Penn State to the subcontractors on March 1, 2005. Three
additional projects were selected for funding during the April 2005 tutorial/funding meeting.
Subcontracts were let from Penn State to the subcontractors on July 1, 2005. Of these fourteen
2005 projects, eleven have been completed and the final reports are appended to this report.
An annual funding meeting was held in November 2005 and the council selected five projects for
funding. Subcontracts were let from Penn State to the subcontractors on March 1, 2006, except
for one which started October 1, 2006.
10

References
None.
11

Appendix A: 2004 Project Final Reports
1. Technical and Economic Assessment of Mild Coal Extraction
University of Kentucky – Subcontract # 2691-UK-DOE-1874 ............................ 13
12
CONSORTIUM FOR PREMIUM CARBON PRODUCTS FROM COAL
Technical and Economic Assessment of Mild Coal Extraction
Subcontract No. 2691-UK-DOE-1874
Final Report
University of Kentucky
Center for Applied Energy Research
&
NewCarbon LLC
October 2005
13

CPCPC 6: New Carbon
ii
Disclaimer
This report was prepared as an account of work sponsored by an agency of the United States
Government. Neither the United States Government nor any agency thereof, nor any of their
employees, makes any warranty, express or implied, or assumes any legal liability or
responsibility for the accuracy, completeness, or usefulness of any information, apparatus,
product, or process disclosed, or represents that its use would not infringe privately owned rights.
Reference herein to any specific commercial product, process, or service by trade name,
trademark, manufacturer, or otherwise does not necessarily constitute or imply its endorsement,
recommendation, or favoring by the United States Government or any agency thereof. The views
and opinions of authors expressed herein do not necessarily state or reflect those of the United
States Government or any agency thereof.
14

CPCPC 6: New Carbon
iii
Abstract
A study has been conducted aimed at generating reliable data to enable a technical and economic
evaluation of the process for the production of high quality pitch by the solvent extraction of coal
to be made. The results of the laboratory and supporting technical assessments conducted under
DOE Subcontract No. 2691-UK-DOE-1874 are reported. This contract is with the University of
Kentucky Research Foundation, which supports work with the University of Kentucky Center
for Applied Energy Research and NewCarbon LLC. The work involves a technical and economic
assessment of mild coal extraction for the production of pitch, coke and low cost carbon fiber. A
quantitative process flow diagram has been produced together with process economics to
determine the cost of producing the pitch at a rate of 100t/day in a pilot plant study.
15

CPCPC 6: New Carbon
iv
Table of Contents
Abstract ................................................................................................................................. iii
Introduction .............................................................................................................................3
Experimental............................................................................................................................4
Results and Discussion.............................................................................................................6
(i) Solvent Extraction............................................................................................................6
(ii) Mass Balance Data..........................................................................................................8
(iii) Filtration Rate ................................................................................................................8
(iv) Pitch and Coke ...............................................................................................................9
Techno-Economic Process Evaluation ...................................................................................17
(i) Process Mass Balance ....................................................................................................17
(ii) Process Economics........................................................................................................18
Conclusions ...........................................................................................................................19
References .............................................................................................................................20
Tables
Table 1 Coal and Solvent Analysis...........................................................................................4
Table 2 Summary of Solvent Extraction Data for Three US Coals .........................................10
Table 3 Solvent Extraction of a Western Kentucky Coal (WKy #9) .......................................11
Table 4 Pitch Analysis ...........................................................................................................12
Table 5 Analysis of Calcined Cokes.......................................................................................13
Table 6 Sector 100: Coal Handling System............................................................................21
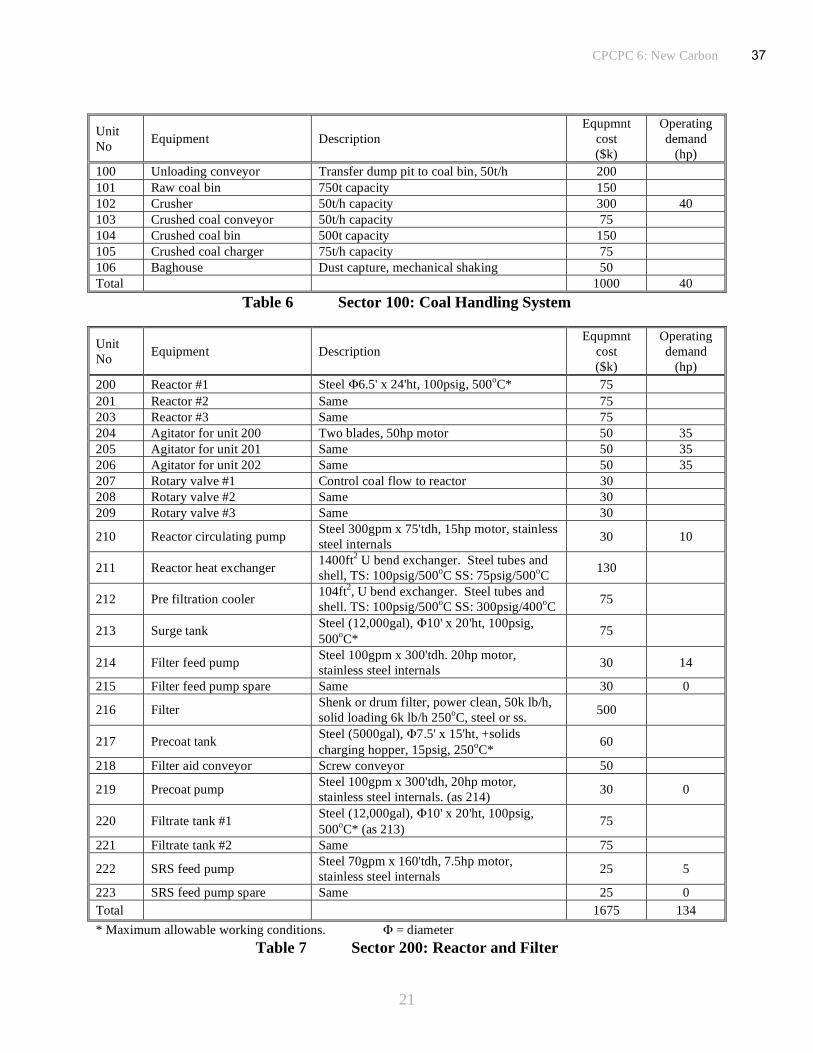
Table 7 Sector 200: Reactor and Filter ...................................................................................21
Table 8 Sector 300: Distillation..............................................................................................22
Table 9 Sector 400: Liquid Storage and Distribution..............................................................22
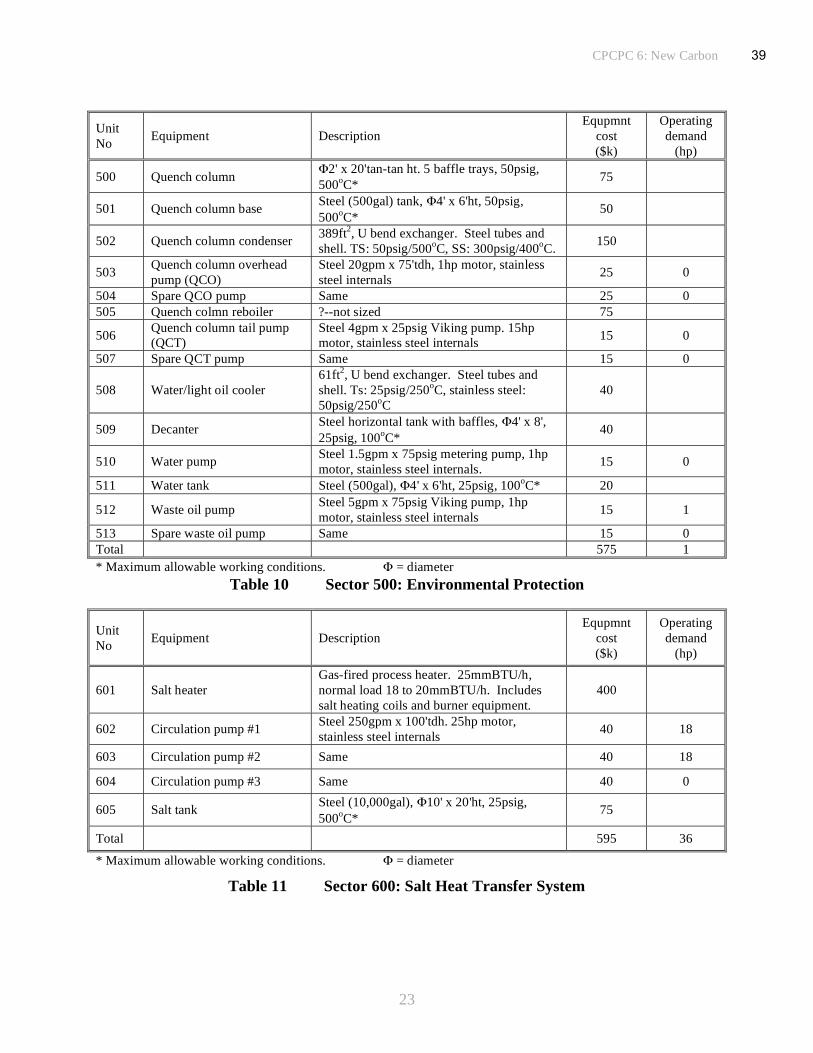
Table 10 Sector 500: Environmental Protection .......................................................................23
Table 11 Sector 600: Salt Heat Transfer System ......................................................................23
Table 12 Summary of Equipment Costs ...................................................................................24
Table 13 Variable Costs...........................................................................................................25
Table 14 Operations Staffing ...................................................................................................26
Table 15 Product Cost Analysis for 100t/day Pitch Production ................................................26
Table 16 Sensitivity to Coal Price............................................................................................26
Figures
Figure 1 Process for the Production of Pitch by the Solvent Extraction of Coal - Schematic......3
Figure 2 Filtrate Viscosity.........................................................................................................5
Figure 3 Filtration of PENC1 Digest .......................................................................................14
Figure 4 Filtration of PENC2 Digest .......................................................................................15
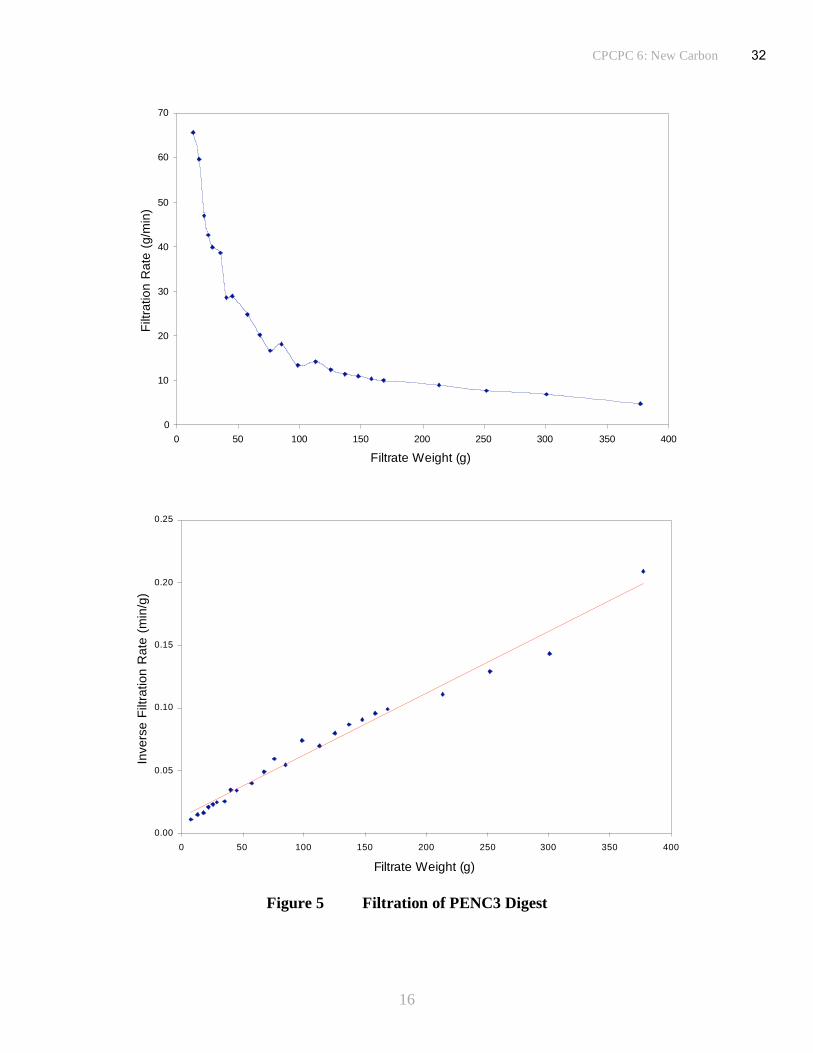
Figure 5 Filtration of PENC3 Digest .......................................................................................16
16

CPCPC 6: New Carbon
1
Summary
A suite of four bench-scale tests have been conducted to assess the processing facility for
preparing high quality pitch by the solvent extraction of US coals. A reaction temperature of
400oC was used with a residence time of 60minutes at a solvent to coal ratio of 2:1. Selection of
process conditions was influenced by the maximum working conditions of reactors available at a
prospective industrial facility identified as a site for possible pilot plant studies. The resultant
digests were filtered at 250oC to separate the coal solution from the undissolved solids. In
addition, a series of three solvent extraction tests using a Western Kentucky reference coal were
carried out under similar conditions for comparison. In one of the tests the process conditions
used were identical, 400oC/60min, while in the other tests more severe conditions were used,
either the reaction temperature was raised to 425oC or the residence time was increased to
120minutes.
At 400oC there is a risk that the conditions used in the coal dissolution stage may too mild,
generating a proportion of incompletely dissolved particles that form an impervious cake with
high resistance. Increasing the reaction temperature could be used to increase filtration rates.
Increasing residence time has a similar, but smaller affect.
Pitches were prepared from the coal solutions by vacuum distillation. Ash contents in the pitches
were low with high softening points principally aimed at the carbon fiber market. Alternatively,
the coal solutions were converted into coke suitable for use in the manufacture of carbon anodes.
A consistent set of mass balance data across the sequential independent steps that comprises the
conversion of coal to pitch have been assembled. The mass balances for each step, solvent
extraction, filtration and vacuum distillation or coking were determined independently and
assembled into a unified form for the complete process.
The data generated in the experimental phase of the program has allowed the principal units and
operating parameters for the process to be defined. This has enabled an estimate of probable
equipment and operating costs to be made for a pilot plant producing pitch at the rate of
100t/day. The cost of producing pitch in a dedicated pilot plant on this scale is probably
uneconomic under the constraints imposed on the proposed process conditions of the pilot unit.
An alternative proposition is to include pitch production as a small part in a much larger
co-generation plant.
17

CPCPC 6: New Carbon
2
SECTION ONE
UNIVERSITY OF KENTUCKY
CENTER FOR APPLIED ENERGY RESEARCH
18

CPCPC 6: New Carbon
3
Introduction
The principal objective of this project is to determine the technical and economic viability of
producing high quality pitch on a commercial scale by a simple, low severity process based on
the solvent extraction of coal. No catalysts are used to promote hydrogenation of the coal and the
use of costly, obscure or esoteric solvents is avoided. The aim is to produce pitches that can be
used both as binders and as a resource in the manufacture of high grade coke for anode
production, fundamental to the aluminum industry. They will also be assessed as a feedstock for
the synthesis of low cost carbon fiber, with the potential for offering material performance that is
a competitive and economically attractive alternative to those currently available. The project
was devised to address the inherent problems associated with other extraction processes under
development. These include, processes that require solvent hydrogenation (and regeneration) or
that operate at high hydrogen over pressure making them economically unattractive.
CAER has developed a bench scale solvent extraction process for producing coal derived pitches
from indigenous coals, Figure 1. Previous studies have demonstrated that the conversion of coal
to pitch can be achieved at high efficiency using anthracene oil (a coal tar distillate) as the
solvent at mild extraction conditions and without recourse to the introduction of a hydrogen
atmosphere at high pressure, expensive catalysts or the use of exotic solvents(1-3)
. Dissolution of
the coal in the digestion reactor allows the mineral matter and undissolved coal fraction to be
removed from the coal solution by the following solids separation step. Filtration is commonly
used for this purpose as the ill-defined separation between the dissolved coal and the boiling
point distribution of the heavy solvent make the use of alternative anti-solvent de-ashing
techniques impractical. Virtually all of the mineral matter present in the coal is removed during
the filtration stage. Samples of pitch derived by this process have low mineral matter content and
are inherently isotropic.
Coal
Solvent
Residue
Recycle Solvent
Gas & Light
Distillate
Coal
Digest
Coal
Solution
Coal Feed
from Mill
Make -up
Solvent
CoalHopper
SolventTank
ReactorSolids
Separation
Low softening pitch
(Anode binder)
High softening pitch
(Carbon Fibers)
Vacuum Column
Figure 1 Process for the Production of Pitch by the Solvent Extraction of Coal - Schematic
The objectives of the current project are to determine process conditions and identify the
principal elements needed to undertake a pilot plant study of the process. To optimize process
economics it is planned to determine if a viable process can be developed at the minimum
operating temperature required for coal dissolution. It was intended to conduct a
19

CPCPC 6: New Carbon
4
techno-economic evaluation alongside the experimental program which could be continuously
updated as more data were obtained. A process flow diagram, including material and heat
balances has been prepared in order to identify process equipment requirements and to produce a
practical design for pilot scale operation of the process.
Experimental
Four candidate bituminous coals were selected for testing. These included two low sulfur coals,
one obtained from Pond Creek (Pontiki mine) in Eastern Kentucky and the second from Alex
Energy (Stockton mine) in West Virginia, a Pittsburgh seam coal from the Bailey Plant in
western Pennsylvania supplied by CONSOL Energy and a reference coal from western
Kentucky, (WKy #9) used in previous studies. Approximately 15kg samples of each coal were
air dried and then crushed to <60mesh (-250μm). Samples of the crushed coals were
characterized by determination of proximate and ultimate analyses, Table 1.
Coals Solvent
Analysis E.Ky
Pond
Creek
WV
Alex
Energy
Pittsburgh
Bailey
Plant
W.Ky #9 Anthracene
Oil
Moisture % 3.0 2.1 1.4 4.4 -
Ash % 8.9 25.8 8.1 19.7 -
Volatile Matter % 36.1 28.1 38.5 33.3 -
Fixed Carbon % 52.0 44.0 51.9 42.6 -
Pro
xim
ate
GCV MJ/kg 30.6 25.0 32.1 23.6 39.0
Carbon % 83.8 84.3 83.9 78.0 90.7
Hydrogen % 5.8 6.1 5.0 5.2 6.3
Oxygen by diff % 7.8 7.2 6.8 10.1 2.5
Nitrogen % 1.8 1.5 1.6 1.7 0.23
Sulfur % 0.9 0.9 2.7 5.0 0.25
%
Pyritic Sulfur % 0.3 0.1 1.2 0.9 -
Sulfate % <0.01 <0.01 <0.01 2.1 - Ult
imat
e (d
af b
asis
)
Organic Sulfur % 0.6 0.8 1.5 2.0 -
Table 1 Coal and Solvent Analysis
Process conditions for the tests were selected through consultation with NewCarbon LLC.
Decisions were influenced by the specifications and operating conditions of reactors that were
available at a prospective industrial facility identified as a site for possible pilot plant studies
(which are not part of this project). After discussions with NewCarbon LLC a temperature of
400oC was chosen with an initial residence time of 60minutes at a solvent to coal ratio of 2:1.
The economics of solvent extraction processes dictate that the coal content of the slurry is
maximized in order to minimize solvent consumption and to reduce the energy expended in
repetitive heating and cooling cycles. However, the ability to mix and transport the slurry, digest
and coal solution imposes limitations on the maximum viscosity that can be tolerated and hence
restricts the amount of coal that can be dissolved in the solvent. A solids content of ~30%
probably defines a compromise for these types of materials using conventional mixers and
20

CPCPC 6: New Carbon
5
pumps at typical operating temperatures, although lower values have been commonly used in
large scale plant operations to reduce potential problems.
A series of coal extraction tests were conducted using a Parr Instruments 2liter stirred autoclave.
Anthracene oil supplied by Reilly Industries was used as the solvent, Table 1; the boiling range
of the solvent is approximately 250 to 450oC. After charging the reactor with ~900g of
coal/solvent slurry and purging with nitrogen, it was rapidly brought to the operating temperature
to commence the digestion stage for the specified residence time. The pressure was maintained at
1.4MPa (200psi) by venting gas and light distillate evolved through a manual control valve and
into the condensate traps and gas collection system. At completion (60minutes residence time)
the reactor was allowed to cool to ~280oC and residual gas vented through the collection train to
de-pressurize the reactor. The digest was then drained through a valve at the bottom of the
reactor into a collection vessel, weighed, sampled and transferred to a heated filter unit.
The digest was filtered at ~250oC through a ‘GFA’ glass fiber membrane (particle retention of
1μm) mounted on a support grid using ~70kPa (10psi) nitrogen pressure differential across the
filter. Once a cake is formed the membrane plays no active role and in industrial practice would
be replaced by a screen. The openings in the screen are optimized to ensure cake formation while
being large enough to make a robust and inexpensive screen construction and facilitate cleaning.
The initial flow of filtrate, containing some solids before cake filtration is fully effective, would
normally be recycled back to the filter inlet. However, for laboratory studies it is more practical
to ensure that the filtrate is essentially solids-free by employing a fine membrane, as here.
Filtration rate was continuously recorded. The filtrates were set aside for further testing to
convert them into pitch or coke and the filtrate viscosity measured as a function of temperature
using a Brookfield viscometer, Figure 2. The filter cakes were recovered and subjected to
analysis.
0
100
200
300
400
500
600
700
100 120 140 160 180 200 220
Temperature, (o
C)
Vis
co
sit
y, (m
Pa s
)
HFNC1
HFNC3
HFNC2
HFNC4
Figure 2 Filtrate Viscosity
21

CPCPC 6: New Carbon
6
Filtration can be characterized by calculation of the specific cake resistance, derived from
models of fluid flow through packed beds. The relationship between filtration rate of a slurry and
the parameters that influence it are described by Darcy’s equation(4)
.
PA
R
PA
cv
dv
dt
QRate+==
μμ2)(
1 (i)
where dv/dt is the volume flow rate at an applied pressure differential across the filter P. is
the specific cake resistance and is dependent upon the nature and size distribution of the particles
forming the cake and the way in which they pack together to control cake voidage. The solids
concentration, c and the fluid viscosity, μ are properties of the slurry. The filter area, A and the
resistance of the filter membrane, R are properties of the filter assembly. Following integration
and insertion of boundary conditions
( )PA
R
PA
vvc
vv
tt o
o
o ++
=μμ
22 (ii)
plotting (t-to)/(v-vo) against (v+vo) gives a straight line with a slope, m and intercept, b. Thus,
c
PmA
μ=
22 (iii)
μ
PbAR = (iv)
Determination of the specific cake resistance ( ) and the fluid viscosity (μ) effectively define
filtration characteristics of the slurry.
Results and Discussion
(i) Solvent Extraction
The data collected from four solvent extraction tests have been summarized to show the principal
results from the investigation, Table 2. The data sets relate to the solvent extraction of three
coals, Pittsburgh seam (Bailey plant), Eastern Kentucky (Pond Creek) and West Virginia (Alex
Energy) in anthracene oil at 400oC for a residence time of 1hour. Duplicate tests were performed
on the Pittsburgh coal. Three sets of data relating to the solvent extraction of a Western
Kentucky coal in anthracene oil under a range of digestion conditions have been similarly treated
to provide comparative data, Table 3.
In order to assemble a consistent set of mass balance data across a process that comprises a series
of independent steps, as in the conversion of coal to pitch, a number of assumptions have to be
made. The mass balances for each step, solvent extraction, filtration and vacuum distillation (or
coking when required) are determined independently with few assumptions, but their assembly
into a unified form for the complete process requires some data manipulation. In the first phase,
the solvent extraction (digestion) of coal, a faulty gas metering device prevented the acquisition
of reliable gas evolution data. This deficiency has since been rectified as part of a complete
22

CPCPC 6: New Carbon
7
refurbishment and upgrading of the equipment. The total amount of digest made includes any
known amount of material not transferred from the reactor or held-up in the intermediate transfer
equipment, and is assumed to have the same composition as the digest. Distillate collected from
the cold traps was determined separately.
At the end of the filtration phase presaged by gas breakthrough, the filter is allowed to drain and
then blown with nitrogen to recover coal solution from the cake; no attempt has been made to
wash the cake with solvent and vacuum dry to recover all of the useful products from the ‘wet’
cake, as would be required in a viable process. Rather, the ‘wet’ cake yield was determined and
analysis of the cake performed (including proximate, ultimate and quinoline solubility) to
determine the composition of the cake and potential for recovery of the coal solution it
contained. The calculations of dissolved coal and solvent content of the cake are included in the
product slate for the purposes of the solvent balance, pitch yield and coal conversion data. A
correction factor is used to apportion the total amount of digest made between the filtrate and
filter cake. Its value is calculated from the ratio of the actual amount fed to the filter to the total
digest produced. The collected filtrate has been sub-sampled so that a series of distillations could
be carried out to produce pitches with a range of different softening points or to provide a
feedstock for coking tests. The mass balance data from one of the distillation tests were used to
complete the balance for the whole process, again using a factor to apportion the pitch and
distillate fractions to values that correspond to a total transfer of filtrate to the vacuum distillation
phase. No allowance is made for unknown losses in the mass balance.
The conversion of coal to soluble products has been calculated by three different methods. All
are based upon the determination of the undissolved material, either in the digest or the filter
cake. Quinoline is used as the solvent to separate the dissolved coal from the insoluble material
(insoluble organic matter (IOM) and mineral matter) in the products as it is an excellent solvent
for the dissolution products from coal extraction and does not normally result in precipitation of
any of the dissolved coal. Of the three methods, the determination from the QI on the digest can
be prone to error as it is very dependent upon obtaining a representative sample of the digest and
hence sensitive to sampling errors. This method is preferred when small samples of digest are
prepared and the whole amount subjected to the analysis, thus precluding the inclusion of errors
as result of sampling problems. The second method, measurement of the QI on the filter cake is
probably the most reliable, provided virtually all the digest is transferred to the filter, enabling an
accurate determination of cake yield to be made. The third method in which the ash content of
the filter cake is compared to that of the feed coal (ash enrichment) is a useful technique for
corroborating the results from the other methods, since it is based upon a different premise to the
other techniques. The coal conversion results are expressed on a dry ash-free basis. It is worth
noting that no distinction has been made between ash and mineral matter content of the coals or
products. Mineral matter is the greater of the two by virtue of the carbonates, sulfates and
nitrates, which are not determined in the measurement of ash. However, as only the organic coal
matter is available for conversion to useful products these should be omitted from the coal
conversion determination. Thus, coal conversion expressed on a dry mineral matter-free basis
would be marginally higher than the values presented here on a dry ash-free basis.
Coal conversions for all three coals are all high, 75 to 85%daf coal with good agreement between
the different methods used in the determinations, Table 2. Where no value is given for the
23

CPCPC 6: New Carbon
8
measurement from the digest QI, either no sample was taken or the sample was not
representative of the material and gave an erroneous result. The duplicate tests with the
Pittsburgh Coal also showed good agreement between the two tests both giving values around 85
to 88%daf coal. However, there are some significant differences in the composition of the
various filter cakes. The cake from PENC4 contained far less coal liquids compared to its
duplicate, PENC1, although for the mass balance and coal conversion data it is assumed that all
of the coal liquids would be recovered from the cake. The high ash content of the PENC3 filter
cake reflects the similarly high ash content of the feed coal, Alex Energy coal from West
Virginia. The results from the tests with a Western Kentucky coal at a range of digestion
conditions are more difficult to interpret. A high conversion, ~80%daf coal, was obtained at the
reference conditions 400oC for 60minutes, but when either the temperature or residence time
were increased a significant fall in conversion to around 50% was observed, Table 3. This may
be attributed to polymerization of the soluble species at the more severe conditions used,
resulting in an increase in precipitated material, although the decrease is more than would be
expected under these conditions. However, for the test performed at 425oC the decrease in
conversion was accompanied by an unexpected increase in specific cake resistance. This is
contrary to that which would normally be anticipated. One method often used to improve
filtration of coal slurries is to increase the thermal treatment specifically to generate solids by
polymerization and thereby assist in the formation of a porous cake. This effect is seen in the test
performed at extended residence time where a low specific cake resistance was found. Replicate
tests are required to support (or otherwise) these results before definitive conclusions can be
drawn.
(ii) Mass Balance Data
Mass balance closures are generally very acceptable. Solvent extraction balances were 97 to
99%, including a small estimate for gas evolution of around 1.5% of the daf coal. Filtration
balances were generally 96 to 97% with one run at a low of 94%. Losses can be largely
attributed to uncontained vapor emissions during transfer of the digest from the reactor to the
filter and during filter cake blowing, performed to recover the coal solution from the cake. Other
losses can be assigned to accidental spillage on transfer between the sequence of separate stages
that comprise the process. Few losses are encountered during distillation, mass balance >99%.
The cumulative balance for the whole process, conversion of coal to pitch, is 93 to 95% with a
net loss of solvent of 13 to 18%. Most of this material will be retained in the pitch. If all of the
solvent were recovered from the filtrate the softening point of the resultant residue, comprising
dissolved coal only, would be too high for the purposes for which it is intended, (and would
polymerize rapidly if attempted). However, where the conversion to coke for anode production is
required, much more of the solvent can be recovered.
(iii) Filtration Rate
Specific cake resistances are generally high, ~100x1010
m/kg, although not unworkable with flow
rates in the range 30 to 50kg/m2/h. Flow rates are mean values calculated over the complete
filtration cycle (since the rate progressively falls as more solids are deposited, Figures 3, 4 & 5)
and are based on a notional system in which filters are operated in parallel with one set
on-stream while the other is stripped and cleaned, allowing 30minutes for each part of the cycle.
Values of <10x1010
m/kg are preferred, since when in this range, rapid filtration is assured with
flow rates of ~100kg/m2/h. Values <100x10
10m/kg are acceptable although filtration will be
24
CPCPC 6: New Carbon
9
slower and an increased filtration surface area may be required to achieve an acceptable flow rate
for a viable process. At values significantly greater than 100x1010
m/kg filtration becomes
progressively more difficult and actions to improve filtration may be required. These could
include measures to produce a more open filter cake by the use of filter aids, for example.
However, control of the digestion conditions is a more effective means of producing a porous
cake with a low pressure drop and high throughput. The conditions used in the coal dissolution
stage, 400oC for 1hour, are probably on the cusp between producing solids that form a fairly
open cake with good filtration properties and ‘sticky’ particles that form an impervious cake with
high resistance. Increasing the reaction temperature by as little as 10oC can have a pronounced
effect upon coal dissolution, yielding residual solids that collectively form a porous filter cake.
Increasing residence time has a similar, but smaller affect.
(iv) Pitch and Coke
Vacuum distillation of samples taken from the stock of coal filtrates were conducted under
various conditions (temperature, time and absolute pressure) to yield pitches with a range of
softening points. The melting characteristics of samples of pitch were assessed by direct
observation during heating and by dynamic mechanical analysis (DMA). Analysis of the pitches
is shown in Table 4. Ash contents are low, 0.2 to 0.3% mostly attributable to the clay minerals
(Al, Si, Ca and Ti). In the early stages of filtration some very fine mineral particles may pass
through the filter membrane, (1μm retention) before cake filtration has been established. At plant
scale, the initial contaminated filtrate produced before bridging of the openings occurs, would be
returned to the filter inlet. That option is not practiced in laboratory testing and the small amount
of mineral inclusion could be accounted for by this mechanism. In addition, some of the mineral
matter in the coal, measured as ash, is organically bound and cannot be removed by filtration. In
practice these may only make a very small contribution to the ash content of the pitch or coke.
The metals content of the coal extract pitches and cokes should follow the same downward trend
as the ash content.
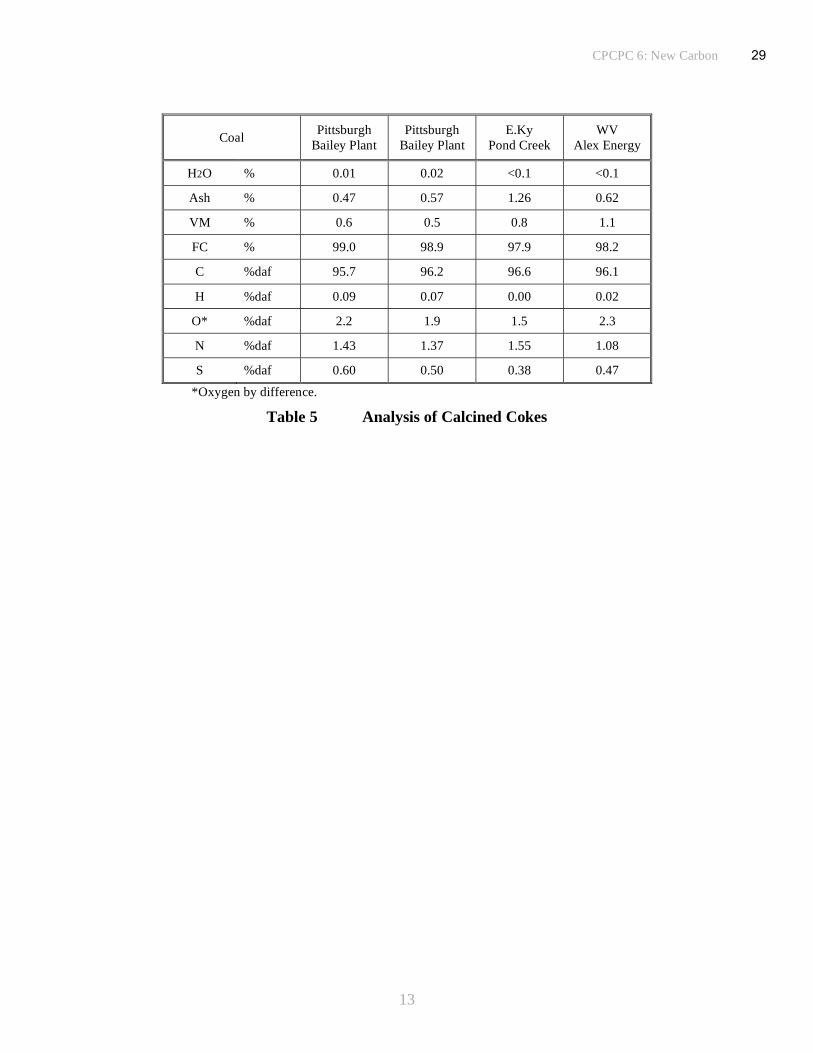
Samples of coal solution (filtrate) have also been converted into coke by heating to 550oC in a
nitrogen atmosphere. Samples were held at a temperature of ~450oC for several hours to promote
the coalescence and growth of mesophase from the feedstock while in a fluid state. To assist in
the development of structured anisotropy in the coke, mixing and fluid shear were imposed by
sparging with nitrogen gas through the polymerizing coal extract solution. Cokes were calcined
by heating to 1350oC in nitrogen in a horizontal tube furnace. Analysis of the cokes is given in
Table 5. The amount of ash in the calcined coke samples, generally around 0.5 to 0.6% (with one
sample over 1%), was higher than expected and is probably attributable to contamination from
the walls of the steel coking drum. The ash content expected in the coke can be calculated from
the pitch ash contents and the relative yields of pitch and coke derived from the same coal
solution (vacuum distillation to produce pitch is conducted in glassware and hence there is less
risk from metal contamination). The predicted values are well below the measured values,
generally by factors of between 50 and 100% implying that the samples are indeed contaminated
during coking. On an industrial scale the increase in volume to surface area ratio of several
orders of magnitude, renders wall effects insignificant for the coke from a delayed coker. Metal
contents are somewhat variable although the concentrations will naturally follow the trend set by
the ash content.
25

CPCPC 6: New Carbon
10
Experiment No PENC1 PENC2 PENC3 PENC4
Coal
Pittsburgh
Bailey
Plant
E.Ky
Pond
Creek
WV
Alex
Energy
Pittsburgh
Bailey
Plant
Solvent A.oil A.oil A.oil A.oil
Solvent : Coal 2 to 1 2 to 1 2 to 1 2 to 1
Temperature oC 400 400 400 400
Residence Time min 60 60 60 60
Ex
tra
ctio
n C
on
dit
ion
s
Pressure psi 200 200 200 200
Coal g 297.3 296.4 296.0 299.2
coal (db) g 293.0 287.6 289.8 295.0
coal (daf) g 268.9 261.2 213.4 270.8
solvent g 594.5 592.9 592.1 598.4
slurry g 891.8 889.3 888.1 897.6
ash g 24.1 26.4 76.4 24.2
Coal Conversion (1)
%daf coal 82.0 73.5 - -
Coal Conversion (2)
%daf coal 86.3 77.5 79.1 88.2
Coal Conversion (3)
%daf coal 83.5 77.1 76.1 86.0
gas (estimated) g 4.0 4.4 3.2 4.1
distillates g 53.8 117.1 41.0 69.8
digest g 812.8 750.2 838.8 817.5
Dig
esti
on
Mass Balance Extraction % 97.2 97.5 99.1 98.9
Filter Charge g 812.8 750.2 838.8 817.5
Dry Cake (IOM+ash)(4)
g 55.2 82.4 117.0 51.7
Total Filtrate g 731.7 648.0 672.4 733.5
Cake QI % 55.5 52.6 89.9 83.0
Cake ash % 19.3 15.7 55.8 32.1
Specific cake resistance 1010
m/kg 166 75 122 -
Filtration Rate kg/m2/h 45 49 33 -
Fil
tra
tio
n
Mass Balance Filtration % 96.8 97.4 94.1 96.0
Distillation Charge g 731.7 648.0 672.4 733.5
Distillate g 434.1 389.6 471.0 449.8
Pitch (Residue) g 296.8 254.9 197.0 276.2
Pitch Softening Point oC 240 252 239 285
Dis
till
ati
on
Mass Balance Distillation % 99.9 99.5 99.4 99.0
Solvent IN g 594.5 592.9 592.1 598.4
Distillates OUT g 487.9 506.7 512.0 519.6
IN - OUT g 106.7 86.2 80.0 78.8
Solvent Balance (OUT/IN) % 82.1 85.5 86.5 86.8 So
lven
t
Ba
lan
ce
Solvent Loss % 17.9 14.5 13.5 13.2
coal (daf) g 268.9 261.2 213.4 270.8
solvent g 594.5 592.9 592.1 598.4
Total IN g 891.8 889.3 888.1 897.6
Dry Cake (IOM+ash) g 55.2 82.4 117.0 51.7
Pitch OUT g 296.8 254.9 197.0 276.2
Total Distillate OUT g 487.9 506.7 512.0 519.6
Solvent loss g 106.7 86.2 80.0 78.8
Total OUT g 839.9 844.0 826.1 847.5
Ov
era
ll
Overall Mass Balance % 94.2 94.9 93.0 94.4
(1) Coal conversion from digest QI. (3) Coal conversion by ash enrichment.
(2) Coal conversion from Filter cake QI. (4) IOM = Insoluble organic matter.
Table 2 Summary of Solvent Extraction Data for Three US Coals
26

CPCPC 6: New Carbon
11
Experiment No PE50 PE3 PE51
Coal Wky Wky Wky
Solvent A.oil A.oil A.oil
Solvent : Coal 2 to 1 2 to 1 2 to 1
Temperature oC 400 425 400
Residence Time min 60 60 120
Ex
tra
ctio
n
Co
nd
itio
ns
Pressure psi 200 200 200
coal g 300.6 292.4 296.8
coal (db) g 285.0 277.3 281.5
coal (daf) g 227.8 221.6 224.9
solvent g 601.1 584.9 593.6
slurry g 901.7 877.3 890.4
ash g 57.2 55.7 56.5
Coal Conversion (1)
%daf coal - 47.1 -
Coal Conversion (2)
%daf coal 80.4 52.5 61.5
Coal Conversion (3)
%daf coal 77.2 39.3 55.5
gas (estimated) g 3.4 3.3 3.4
distillates g 63.7 53.3 70.3
digest g 804.5 780.1 772.1
Dig
esti
on
Mass Balance Extraction % 96.3 95.0 94.6
Filter Charge g 804.5 780.1 772.1
Dry Cake (IOM+ash) g 88.0 140.1 126.5
Total Filtrate g 694.3 616.0 630.2
Cake QI % 52.0 59.6 50.3
Cake ash % 26.4 16.6 17.4
Specific cake resistance 1010
m/kg 40 267 10
Filtration rate kg/m2/h 73 21 108
Fil
tra
tio
n
Mass Balance Filtration % 97.2 97.5 98.0
Distillation Charge g 694.3 616.0 630.2
Distillate g 437.3 385.0 419.7
Pitch (Residue) g 250.7 228.3 209.6
Pitch Softening Point oC 270 255 290
Dis
till
ati
on
Mass Balance Distillation % 99.1 99.6 99.9
Solvent IN g 601.1 584.9 593.6
Distillates OUT g 501.0 442.9 490.0
IN - OUT g 100.2 141.9 103.6
Solvent Balance (OUT/IN) % 83.3 75.7 82.6 So
lven
t
Ba
lan
ce
Solvent Loss % 16.7 24.3 17.4
coal (daf) g 227.8 221.6 224.9
solvent g 601.1 584.9 593.6
Total IN g 901.7 877.3 890.4
Dry Cake (IOM+ash) g 88.0 140.1 126.5
Pitch OUT g 250.7 228.3 209.6
Total Distillate OUT g 501.0 442.9 490.0
Solvent loss g 83.3 75.7 82.6
Total OUT g 839.7 811.4 826.1
Ov
era
ll
Overall Mass Balance % 93.1 92.5 92.8
(1) Coal conversion from digest QI. (3) Coal conversion by ash enrichment.
(2) Coal conversion from Filter cake QI. (4) IOM = Insoluble organic matter.
Table 3 Solvent Extraction of a Western Kentucky Coal (WKy #9)
27

CPCPC 6: New Carbon
12
Coal Pittsburgh
Bailey Plant
Pittsburgh
Bailey Plant
E.Ky
Pond Creek
WV
Alex Energy
Sample ID NC 1/1 NC 4/1 NC 2/3 NC 3/3
Softening Temp oC 240 285 250 285
Pitch Yield % of feed 40.6 37.7 39.3 30.1
H2O % 0.04 0.10 0.14 0.18
Ash % 0.17 0.20 0.30 0.23
VM % 42.1 39.3 37.4 36.0
FC % 57.7 60.4 62.2 63.6
C %daf 89.1 88.5 89.7 89.4
H %daf 4.73 4.74 4.75 4.75
O* %daf 3.4 4.1 3.1 3.5
N %daf 1.84 1.78 2.02 1.76
S %daf 0.88 0.87 0.49 0.65
Na ppm <10 <10 <10 <10
Mg ppm <10 <10 <10 <10
Al ppm 20 20 45 40
Si ppm 30 250 90 35
P ppm <10 <10 <10 <10
K ppm <10 <10 <10 <10
Ca ppm 55 55 115 <10
Ti ppm 55 40 150 190
V ppm <10 <10 <10 <10
Cr ppm <10 <10 <10 <10
Mn ppm <10 <10 <10 <10
Fe ppm <10 <10 540 <10
Ni ppm <10 <10 <10 <10
Cu ppm <10 <10 <10 <10
Zn ppm <10 <10 <10 <10
*Oxygen by difference. Metals analysis by X-ray Fluorescence (XRF).
Table 4 Pitch Analysis
28
CPCPC 6: New Carbon
13
Coal Pittsburgh
Bailey Plant
Pittsburgh
Bailey Plant
E.Ky
Pond Creek
WV
Alex Energy
H2O % 0.01 0.02 <0.1 <0.1
Ash % 0.47 0.57 1.26 0.62
VM % 0.6 0.5 0.8 1.1
FC % 99.0 98.9 97.9 98.2
C %daf 95.7 96.2 96.6 96.1
H %daf 0.09 0.07 0.00 0.02
O* %daf 2.2 1.9 1.5 2.3
N %daf 1.43 1.37 1.55 1.08
S %daf 0.60 0.50 0.38 0.47
*Oxygen by difference.
Table 5 Analysis of Calcined Cokes
29

CPCPC 6: New Carbon
14
0
20
40
60
80
100
120
140
0 50 100 150 200 250 300 350 400 450
Filtrate Weight (g)
Filt
ratio
n R
ate
(g
/min
)
0.00
0.02
0.04
0.06
0.08
0.10
0.12
0.14
0.16
0 50 100 150 200 250 300 350 400 450
Filtrate Weight (g)
Inve
rse
Filt
ratio
n R
ate
(m
in/g
)
Figure 3 Filtration of PENC1 Digest
30

CPCPC 6: New Carbon
15
0
20
40
60
80
100
120
0 50 100 150 200 250 300 350 400 450 500
Filtrate Weight (g)
Filt
ratio
n R
ate
(g
/min
)
0.00
0.02
0.04
0.06
0.08
0.10
0.12
0.14
0 50 100 150 200 250 300 350 400 450 500
Filtrate Weight (g)
Inve
rse
Filt
ratio
n R
ate
(m
in/g
)
Figure 4 Filtration of PENC2 Digest
31
CPCPC 6: New Carbon
16
0
10
20
30
40
50
60
70
0 50 100 150 200 250 300 350 400
Filtrate Weight (g)
Filt
ratio
n R
ate
(g
/min
)
0.00
0.05
0.10
0.15
0.20
0.25
0 50 100 150 200 250 300 350 400
Filtrate Weight (g)
Inve
rse
Filt
ratio
n R
ate
(m
in/g
)
Figure 5 Filtration of PENC3 Digest
32

CPCPC 6: New Carbon
17
Techno-Economic Process Evaluation
(i) Process Mass Balance
Based upon the data provided from the experimental part of the program a techno-economic
evaluation of the process to convert coal to high quality pitch by solvent extraction has been
undertaken. A summary of the results are presented graphically in a process flow diagram,
Figure 6. The data used to compile this figure were derived from a spreadsheet calculation that
uses the information from the separate phases of the process; digestion, overhead condensate
recovery, gas, water and light oil handling, filtration cycles with associated cake processing and
vacuum distillation to produce a balanced flow sheet. The bottom line is aimed at producing
pitch at the rate of 100t/day. This requires a coal feed of 128t/day, subdivided into its main
components, dry-ash free coal, inherent moisture, ash and sulfur (pyritic and organic). A solvent
to coal ratio of 2:1 has been used requiring a total solvent supply of 256t/day, most of which is
recycled from either the distillation stage or the rector vent condensation and water separation
system. A continuous replacement of solvent is required amounting to ~35t/day, as a proportion
of the solvent is retained in the pitch to give a defined softening point. The calculation is based
upon a number of defined or implicit assumptions. These include:
(i) Reactor Vent - All water generated either from the coal moisture or through condensation
reactions is ejected during digestion through the venting system. The remaining material emitted
to vent is principally composed of a low boiling fraction from the anthracene oil and a small
amount of light oil produced by thermal cleavage reactions that separate small species from the
coal. The fraction of the anthracene oil lost to vent is based upon the presumed vapor pressure of
the solvent at the selected process conditions, 400oC and 15bar and the remainder is composed of
light oil to make up the difference. Separation of the water, light oil and solvent fractions allow
the valuable solvent to be returned to the process as part of the recycle solvent process stream.
All of the water and light oil are discharged overhead.
Solvent
Recovery
Vent
Recovery
Coal Storage
&
Crusher
Extractors
400oC
Filter
200oC
Filter cake
51t/day*
Pitch
100t /day
Recovered solvent
206t /day
Water
6t/day
Light oils
6t/day
Vent
27t /day
Recycle solvent
15t/day
Heat
3MW
Coal
128t/day
Make -up solvent
35t /day
Filter aid
Digest
357t/day
Heat
0 .3MW
Heat
2 .4MW
*Filter aid free basis
Filtrate
306t /day
Figure 6 Heat and Mass Balance Scheme for a Conceptual Coal to Pitch 100t/day Pilot Plant
33

CPCPC 6: New Carbon
18
(ii) Reactor Effluent – All of the remaining material (digest) that does not go to vent is
transferred to the filter assembly. In practice this will be via surge and holding tanks for
controlled feed to individual filter units. The amount of undissolved solids in the feed to the filter
assembly is based on coal conversion data from the experimental program and will be composed
of insoluble organic matter (IOM), mineral matter and pyritic sulfur inherent in the feed coal.
(iii) Filter – It is assumed that cake washing and drying cycles are used to recover all of the
dissolved coal and most of the solvent from the cake and hence the cake is composed solely of
unconverted coal, mineral matter and pyritic sulfur with a small amount of residual heavy
solvent. Provision has been made to include a filter aid feed either as a pre-coat and/or a body aid
to enable efficient solids separation at high flow rates. The filter aid has not been included in the
mass balance configuration across the filter.
(iv) Vacuum distillation – To produce a pitch of the required softening point it is assumed
that the final product is composed of 67% dissolved coal and 33% heavy anthracene oil. All of
the organic sulfur appears in the pitch. Based on these assumptions a solvent recycle flow rate
from the distillation columns can be calculated. The total recycle solvent stream is composed of
the return material from the distillation columns and a proportion recovered from the reactor
overhead vent capture system. The difference between the total recycle solvent flow rate and the
amount required to slurry the feed coal at a ratio of 2:1 defines the amount of supplementary
make-up solvent required to achieve a solvent balance, 35t/day.
(v) Vent recovery – The flow rates in the quench column and reflux system are adjusted to
satisfy the energy balance for the reactor overheads. It is assumed that separation of water and oil
layers is 100% efficient with all of the light oil recovered from the organic layer (light oil and a
fraction of the anthracene oil) and the total water made appearing in the aqueous layer for
discharge into the waste water system for process recycling or disposal.
(ii) Process Economics
The principal units and operating parameters have been defined to enable an estimate of probable
equipment and operating costs to be made for a pilot plant producing pitch at the rate of 100t/day
by the solvent extraction of coal. The major equipment has been subdivided into six operating
groups, coal handling, reactor and filter assemblies, distillation, liquid storage and distribution,
environmental protection and heat transfer facilities, Tables 6 to 11. A summary of the
equipment costs is given in Table 12 and includes the other major costs associated with the site
preparation, engineering and installation of the plant. It also includes a factor to cover the cost of
all the ancillary equipment and a contingency allowance. Variable costs, Table 13, include all the
estimated power requirements, both electrical and gas, and the cost of raw materials, principally
coal, anthracene oil and filter aid. Credits have been factored to give an allowance for the value
of by-products generated in the process, including light oil and distillates from the reactor.
Estimated manpower requirements for a pilot plant of this scale are given in Table 14. The
assumptions, contingencies and estimated allowances for ill-defined variables are included in the
tables. For example, a 50% allowance is made for all of the ancillary equipment that does not
comprise the principal functions of the pilot plant. The other factors used to define the equipment
costs are estimates based upon previous experience in chemical engineering and process plant
design. A factor of 6 is allowed for major equipment installation costs and an additional 25% for
all engineering works. From these data and the projected flow rates in the conceptual 100t/day
coal to pitch pilot plant, Figure 6, a product cost analysis slate can be computed, Table 15. When
all factors are taken into account, except for recovery of investment principal, the cost of
34

CPCPC 6: New Carbon
19
producing pitch in a dedicated pilot plant on this scale amounts to ~$320/t. This is based on a
coal feed cost of $50/t. However, when recoup of investment capital is applied the cost rises to
an uneconomic ~$900/t. Increasing the amortization period from four to seven years reduces the
cost to $650/t and over ten years to $550/t. Greater economies can be made if the scale of the
operation is increased but a better option with more likelihood of success would be to include the
pitch production facility as an integral part of a much larger co-generation plant, making it a
much more attractive prospect. Analysis of the economic data shows that, as might be expected,
most of the costs are engendered in the processing functions and the sensitivity to raw material
prices, the cost of coal, is not particularly significant, Table 16.
Conclusions
Coal conversions of 75-85%daf coal were achieved for the three US coals tested at the process
conditions used, 400oC with 60minutes residence time. Good agreement was obtained between
the methods of measurement. The duplicate tests with Pittsburgh coal produced coal conversions
of 85 & 88%daf coal. Process conditions were selected based upon performance data of
equipment identified at the site of potential pilot plant trials.
Filtration rates of 30 to 50kg/m2/h were marginal for acceptable plant-scale operation, with
specific cake resistances of ~100x1010
m/kg. The conditions used in the coal dissolution stage,
400oC for 1hour, are probably on the cusp between producing solids that form a fairly open cake
with good filtration properties and ‘sticky’ particles that form an impervious cake with high
resistance. Increasing the reaction temperature by as little as 10oC, could be used increase
filtration rates.
Mass balance data have been determined for the sequential process steps: solvent extraction,
filtration and vacuum distillation or coking and assembled into a unified form for the complete
process. Mass balance closures were 93 to 95% for the complete process, while for the individual
elements, values of 97-99% were obtained for solvent extraction, around 96% for filtration (with
uncontained losses of vapor while filter blowing) and 99% for distillation. Ash contents in the
pitches were in the range 0.2-0.3% with softening points generally in the range 250-280oC.
The major equipment required for a pilot plant producing pitch at the rate of 100t/day by the
solvent extraction of coal, its cost and operating parameters have been identified. A coal feed
rate of 128t/day would be required with a total solvent supply of 256t/day, most of which is
recycled from either the distillation stage or the rector vent condensation and water separation
system. A continuous replacement of solvent is required amounting to ~35t/day, as a proportion
of the solvent is retained in the pitch to give a defined softening point.
Most of the costs of pitch production are engendered in the processing functions and the
sensitivity to raw material prices, the cost of coal, is not particularly significant. The operating
cost of a pilot plant dedicated to producing 100t/day of clean pitch was estimated as ~$320/t of
pitch. However, when capital recovery costs are included the pitch production cost increases to
~$900/t. This is based on a coal feed cost of $50/t. Hence, this is not an economically viable
proposition as a stand alone facility. An alternative approach that could be considered is to
include the pitch facility as a small part of a large co-generation plant.
35

CPCPC 6: New Carbon
20
References
(1) Mishra S & Sharma DK, Fuel, 1990, 69, 1377.
(2) Rosal R, Diez FV & Sastre H, Ind Eng Chem Res, 1992, 31, 2407.
(3) Cloke M & Wang C, Energy and Fuels, 1995, 9, 560.
(4) Purchase DB, “Industrial Filtration of Liquids”2nd
edition, CRC press, 1971.
36
CPCPC 6: New Carbon
21
Unit
No Equipment Description
Equpmnt
cost
($k)
Operating
demand
(hp)
100 Unloading conveyor Transfer dump pit to coal bin, 50t/h 200
101 Raw coal bin 750t capacity 150
102 Crusher 50t/h capacity 300 40
103 Crushed coal conveyor 50t/h capacity 75
104 Crushed coal bin 500t capacity 150
105 Crushed coal charger 75t/h capacity 75
106 Baghouse Dust capture, mechanical shaking 50
Total 1000 40
Table 6 Sector 100: Coal Handling System
Unit
No Equipment Description
Equpmnt
cost
($k)
Operating
demand
(hp)
200 Reactor #1 Steel 6.5' x 24'ht, 100psig, 500oC* 75
201 Reactor #2 Same 75
203 Reactor #3 Same 75
204 Agitator for unit 200 Two blades, 50hp motor 50 35
205 Agitator for unit 201 Same 50 35
206 Agitator for unit 202 Same 50 35
207 Rotary valve #1 Control coal flow to reactor 30
208 Rotary valve #2 Same 30
209 Rotary valve #3 Same 30
210 Reactor circulating pump Steel 300gpm x 75'tdh, 15hp motor, stainless
steel internals 30 10
211 Reactor heat exchanger 1400ft
2 U bend exchanger. Steel tubes and
shell, TS: 100psig/500oC SS: 75psig/500
oC
130
212 Pre filtration cooler 104ft
2, U bend exchanger. Steel tubes and
shell. TS: 100psig/500oC SS: 300psig/400
oC
75
213 Surge tank Steel (12,000gal), 10' x 20'ht, 100psig,
500oC*
75
214 Filter feed pump Steel 100gpm x 300'tdh. 20hp motor,
stainless steel internals 30 14
215 Filter feed pump spare Same 30 0
216 Filter Shenk or drum filter, power clean, 50k lb/h,
solid loading 6k lb/h 250oC, steel or ss.
500
217 Precoat tank Steel (5000gal), 7.5' x 15'ht, +solids
charging hopper, 15psig, 250oC*
60
218 Filter aid conveyor Screw conveyor 50
219 Precoat pump Steel 100gpm x 300'tdh, 20hp motor,
stainless steel internals. (as 214) 30 0
220 Filtrate tank #1 Steel (12,000gal), 10' x 20'ht, 100psig,
500oC* (as 213)
75
221 Filtrate tank #2 Same 75
222 SRS feed pump Steel 70gpm x 160'tdh, 7.5hp motor,
stainless steel internals 25 5
223 SRS feed pump spare Same 25 0
Total 1675 134
* Maximum allowable working conditions. = diameter
Table 7 Sector 200: Reactor and Filter
37

CPCPC 6: New Carbon
22
Unit
No Equipment Description
Equpmnt
cost
($k)
Operating
demand
(hp)
300 Solvent recovery still (SRS) 4' x 35'tan-tan ht. 10 sieve trays, 50psig,
500oC*
350
301 SRS condenser 129ft
2, U bend exchanger. Steel tubes and
shell. TS: 50psig/500oC SS: 300 psig/400
oC
100
302 SRS overhead pump Steel 100gpm x 160'tdh. 10hp motor,
stainless steel internals 30 7
303 Spare overhead pump Same 30 0
304 SRS reboiler 293ft
2, U bend exchanger. Steel tubes and
shell. TS: 50psig/500oC SS: 75psig/500
oC
120
305 Pitch pump Steel 20gpm x 175'tdh. 3hp motor, stainless
steel internals 25 2
306 Spare pitch pump Same 25 0
307 Pitch product cooler ? 75
Total 755 9
* Maximum allowable working conditions. = diameter
Table 8 Sector 300: Distillation
Unit
No Equipment Description
Equpmnt
cost
($k)
Operating
demand
(hp)
400 Cold solvent tank Steel (50,000gal), 16' x 32'ht, 25psig,
300oC*
100
401 Cold solvent tank coil Steel pipe coil in tank 15
402 Cold solvent tank pump Steel 100gpm x 300'tdh, 20hp motor,
stainless steel internals 30 13
403 Spare Solvent Pump Same 30 0
404 Hot solvent tank Steel (6,000gal), 6.5' x 24'ht, 50psig
500oC*
75
405 Hot solvent tank coil Steel pipe coil in tank 15
406 Hot solvent tank pump Steel 350gpm x 300'tdh, 60hp motor,
stainless steel internals 60 47
407 Spare solvent pump Same 60 0
408 Solvent heater 367ft
2, U bend exchanger. Steel tubes and
shell. TS: 75psig/500oC SS: 75psig/500
oC
100
409 Solvent unloading pump Steel 200gpm x 150'tdh, 15hp motor,
stainless steel internals 30 0
410 Pitch tank Steel (50,000gal), 16' x 32'ht, 25psig,
300oC*
100
410 Pitch tank coil Steel pipe coil in tank 15
411 Pitch tank pump Steel 200gpm x 150'tdh, 15hp motor,
stainless steel internals 30 12
412 Spare pitch pump Same 30
413 Waste oil tank Steel (50,000gal), 16' x 32'ht, 25psig,
300oC*
100
414 Waste oil tank pump Steel 200gpm x 150'tdh. 15hp motor,
stainless steel internals 30
Total 820 72
* Maximum allowable working conditions. = diameter
Table 9 Sector 400: Liquid Storage and Distribution
38
CPCPC 6: New Carbon
23
Unit
No Equipment Description
Equpmnt
cost
($k)
Operating
demand
(hp)
500 Quench column 2' x 20'tan-tan ht. 5 baffle trays, 50psig,
500oC*
75
501 Quench column base Steel (500gal) tank, 4' x 6'ht, 50psig,
500oC*
50
502 Quench column condenser 389ft
2, U bend exchanger. Steel tubes and
shell. TS: 50psig/500oC, SS: 300psig/400
oC.
150
503 Quench column overhead
pump (QCO)
Steel 20gpm x 75'tdh, 1hp motor, stainless
steel internals 25 0
504 Spare QCO pump Same 25 0
505 Quench colmn reboiler ?--not sized 75
506 Quench column tail pump
(QCT)
Steel 4gpm x 25psig Viking pump. 15hp
motor, stainless steel internals 15 0
507 Spare QCT pump Same 15 0
508 Water/light oil cooler
61ft2, U bend exchanger. Steel tubes and
shell. Ts: 25psig/250oC, stainless steel:
50psig/250oC
40
509 Decanter Steel horizontal tank with baffles, 4' x 8',
25psig, 100oC*
40
510 Water pump Steel 1.5gpm x 75psig metering pump, 1hp
motor, stainless steel internals. 15 0
511 Water tank Steel (500gal), 4' x 6'ht, 25psig, 100oC* 20
512 Waste oil pump Steel 5gpm x 75psig Viking pump, 1hp
motor, stainless steel internals 15 1
513 Spare waste oil pump Same 15 0
Total 575 1
* Maximum allowable working conditions. = diameter
Table 10 Sector 500: Environmental Protection
Unit
No Equipment Description
Equpmnt
cost
($k)
Operating
demand
(hp)
601 Salt heater
Gas-fired process heater. 25mmBTU/h,
normal load 18 to 20mmBTU/h. Includes
salt heating coils and burner equipment.
400
602 Circulation pump #1 Steel 250gpm x 100'tdh. 25hp motor,
stainless steel internals 40 18
603 Circulation pump #2 Same 40 18
604 Circulation pump #3 Same 40 0
605 Salt tank Steel (10,000gal), 10' x 20'ht, 25psig,
500oC*
75
Total 595 36
* Maximum allowable working conditions. = diameter
Table 11 Sector 600: Salt Heat Transfer System
39

CPCPC 6: New Carbon
24
Sector Facility Factor Cost ($k)
Major Equipment
100 Coal Handling System 1000
200 Extractor and Filter 1675
300 Distillation 755
400 Liquid Storage and Distribution 820
500 Environmental Protection 575
600 Salt Heat Transfer System 595
Total 5420
Unlisted Equipment Factor 0.5
Total Equipment Cost 8130
Installation Factor 6
Buildings, controls, etc 5000
Site Prep, rail service, etc 10000
Installed Cost 47520
Engineering 0.25 11880
Subtotal 59400
Contingencies 0.3 17820
Project Total 77220
Table 12 Summary of Equipment Costs
40

CPCPC 6: New Carbon
25
Source Rate Cost Annual Cost
($k)
Major equipment power use
Sector
100 Coal handling 40 hp
200 Extractor and filter 134 hp
300 Distillation 9 hp
400 Liquid storage / distribution 72 hp
500 Environmental protection 1 hp
600 Salt heat transfer 36 hp
Total electrical 292 hp 50 $/mkWh 87.1
Fuel gas
Fired heater efficiency 0.6
Fuel use 30 mmBTU 7.0 $/mmBTU 1680
By-product stream credits
200# 19,300 lb/h 4.0 $/1000lb -617.6
75# 2000 lb/h 3.0 $/1000lb -48.0
Total -665.6
Raw materials
Coal 8,747 lb/h 50 $/t 1749.4
Anthracene oil 2,948 lb/h 0.08 $/lb† 1845.8
Filter Aid (0.25lb/lb cake) 1062 lb/h 0.05 $/lb 424.9
Total 4020.1
By-product Sales
Filter cake 4249 lb/h 0.00 $/lb* 0
Light oil 499 lb/h 0.10 $/lb* -399.2
Total by-product sales -399.2
Total operating cost 4722
† 0.80$/gal * Value less freight $/lb
Table 13 Variable Costs
41

CPCPC 6: New Carbon
26
Manpower Annual cost
($k/position)
Annual cost
($k)
Operations 3 400 1200
Maintenance Labor 15 100 1500
Maintenance Material* 386
Technical Support 5 200 1000
Plant Overheads† 2043
Total Period Cost 6129
* 5% of investment † 50% of period costs
Table 14 Operations Staffing
Costs $/t pitch
Raw Material* 119.65
Utilities 32.78
Byproduct Sales -11.88
Period 182.42
Cash 322.96
Capital Recovery Charges† 574.55
Total Cost of product 897.52
* $50/t coal price † 25% of capitol investment
Table 15 Product Cost Analysis for 100t/day Pitch Production
Coal price $/t Raw materials
$/t pitch
Cash cost
$/t pitch
Total cost
$/t pitch
$40 109 313 887
$50 120 323 898
$60 130 333 908
* 5% of investment † 50% of period costs
Table 16 Sensitivity to Coal Price
42

Appendix B: 2005 Project Final Reports
1. Design of Nanoporous Carbon Derived from Coal Tar Pitch/
Polymer Blends for Ultracapacitors
Pennsylvania State University – Subcontract # 2872-TPSU-DOE-1874 ............. 44
2. Continued Development of Pitch/Nanotube Foam and
Fiber Composites
University of Kentucky – Subcontract # 2869-UK-DOE-1874 ............................ 71
3. Nanocarbons from Anthracite Coal
Pennsylvania State University – Subcontract # 2875-TPSU-DOE-1874 ............. 95
4. Adapting Anthracite Coal and Stockpiled Anthracite Fines to
Green Sand Iron Foundries
Pennsylvania State University – Subcontract # 2873-TPSU-DOE-1874 ........... 151
5. Mild Coal Extraction for the Production of Anode Coke
University of Kentucky – Subcontract # 2865-UK-DOE-1874 .......................... 224
6. Premium Carbon Products from Coal: A Sulfur-Based Approach
Pennsylvania State University – Subcontract # 2874-TPSU-DOE-1874 ........... 260
7. TiO2-Coated Activated Carbon
University of Florida – Subcontract # 2871-UF-DOE-1874............................. 275
8. Coal-Derived Nanofiber Sheet Development
Inorganic Specialists, Inc. – Subcontract # 2870-ISI-DOE-1874...................... 320
9. Coal-Derived Composites using Pitch and Fly Ash
West Virginia University – Subcontract # 2866-WVU-DOE-1874 .................... 338
10. Needle Coke from Coal-Derived Feedstock
GrafTech International Ltd. – Subcontract # 2867-GTIL-DOE-1874 ............... 379
11. Carbon Foam Production through Plasticization of Coal Tar
Pitch with Supercritical CO2
Premium Carbon Products – Subcontract # 3035-TPSU-DOE-1874................ 466
43

Design of nanoporous carbon derived from coal tar pitch/polymer blends for
ultracapacitors
Final Report
July 31, 2006
Ramakrishnan Rajagopalan and Henry C. Foley
Subcontract No. 2872-TPSU-DOE-1874
Project Starting Date: 03/01/2005
Project Ending Date: 07/31/2006
Pennsylvania State University
University Park, PA 16802
44

2
Disclaimer
This report was prepared as an account of work sponsored by an agency of the United
States Government. Neither the United States Government nor any agency thereof, nor
any of their employees, makes any warranty, express or implied, or assumes any legal
liability or responsibility for the accuracy, completeness, or usefulness of any
information, apparatus, product or process disclosed, or represents that its use would not
infringe privately owned rights. Reference herein to any specific commercial product,
process, or service by trade name, trademark, manufacturer, or otherwise does not
necessarily constitute or imply its endorsement, recommendation, or favoring by the
United States Government or any agency thereof. The views and opinion of authors
expressed herein do not necessarily state or reflect those of the United States
Government or any agency thereof.
45
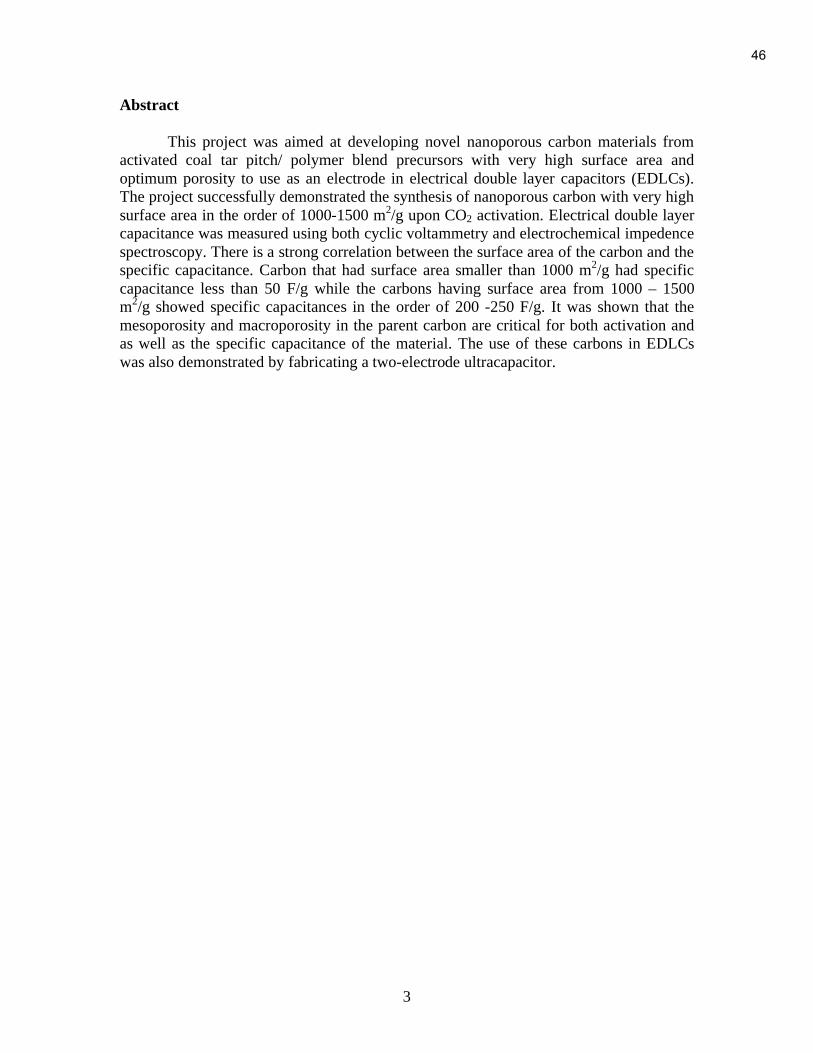
3
Abstract
This project was aimed at developing novel nanoporous carbon materials from
activated coal tar pitch/ polymer blend precursors with very high surface area and
optimum porosity to use as an electrode in electrical double layer capacitors (EDLCs).
The project successfully demonstrated the synthesis of nanoporous carbon with very high
surface area in the order of 1000-1500 m2/g upon CO2 activation. Electrical double layer
capacitance was measured using both cyclic voltammetry and electrochemical impedence
spectroscopy. There is a strong correlation between the surface area of the carbon and the
specific capacitance. Carbon that had surface area smaller than 1000 m2/g had specific
capacitance less than 50 F/g while the carbons having surface area from 1000 – 1500
m2/g showed specific capacitances in the order of 200 -250 F/g. It was shown that the
mesoporosity and macroporosity in the parent carbon are critical for both activation and
as well as the specific capacitance of the material. The use of these carbons in EDLCs
was also demonstrated by fabricating a two-electrode ultracapacitor.
46

4
TABLE OF CONTENTS
Executive Summary ----------------------------------------------------------------------------- 5
Experimental ------------------------------------------------------------------------------------- 8
i. Synthesis of Coal tar pitch derived carbons------------------------------------- 8
a. Coal tar pitch blends----------------------------------------------------------- 8
b. Modification of Coal tar pitch------------------------------------------------ 8
ii. Synthesis of Polymer derived carbons------------------------------------------- 8
a. Synthesis of Polyethylene glycol diacid------------------------------------- 8
b. Synthesis of Polyfurfuryl alcohol/Polyethylene glycol diacid blend---- 9
iii. CO2 activation of carbon----------------------------------------------------------- 9
iv. Characterization of activated carbon--------------------------------------------- 9
a. Pore size distribution----------------------------------------------------------- 9
b. Surface area measurements---------------------------------------------------- 9
c. Electrochemical measurements----------------------------------------------- 9
Electrode preparation----------------------------------------------------------- 9
Cyclic voltammetry------------------------------------------------------------- 10
Electrochemical Impedance Spectroscopy---------------------------------- 10
v. Fabrication of double layer Electrochemical Capacitor----------------------- 10
Results and Discussion-------------------------------------------------------------------------- 11
i. Carbon derived from Coal tar pitch---------------------------------------------- 11
ii. Carbon derived from PFA/PEG diacid blend----------------------------------- 12
iii. Demonstration of double layer electrochemical capacitor-------------------- 14
Conclusions-------------------------------------------------------------------------------------- 15
References---------------------------------------------------------------------------------------- 15
Figures-------------------------------------------------------------------------------------------- 16
47
5
Executive Summary
The main physical properties of interest while designing a carbon materials as use
as electrodes in EDLCs are surface area, pore volume, pore size distribution, density and
surface functional groups. We began our quest for developing novel nanoporous carbon
with these properties in mind. Our goals were to synthesize a carbon that has the
following properties:
i) High surface area in the order of 1000 – 1500 m2/g
ii) Adequate micro- and mesoporosity
iii) High micropore volume (> 0.5 cc/g)
We employed two distinct approaches to synthesize the carbon with desired
properties. The first approach was to use coal tar pitch (supplied by Koppers Inc.), which
has about 16% quinoline insoluble (QI) content and has a softening point of 110°C as a
precursor and blend it with polymer precursor like polyethylene glycol diacid (pore
former) and carbonize. The resultant carbon was then activated using CO2 at 900°C. The
second approach was to activate the carbon formed using blends/copolymer of
polyfurfuryl alcohol (micropore former) and polyethylene glycol diacid (mesopore
former). Both these methods resulted in carbons with very high surface area (1000 – 1500
m2/g).
Our choice of coal tar pitch with high QI content (16%) was based on the fact that
the presence of QI impedes the development of mesophases in the pitch. Since our
primary goal was to develop high surface area carbon, we thought that the high QI
content would aid in the formation of disordered carbon. Carbonization of CTP by itself
yielded a carbon (~50% yield) that has no micro-/mesoporosity. Our initial approach was
to just blend the coal tar pitch with different polymer precursors such as polyfurfuryl
alcohol, polyethylene glycol and sucrose and vary the composition of the polymer blends.
This resulted in carbon with very few micropores, which was very resistant to CO2
activation. The surface area of these carbons was in the order of 10 -15 m2/g. Our next
goal was to change the character of the pitch. We achieved this by blending the pitch with
polyethylene glycol diacid and adding sulfuric acid (oxidizing agent) to the mixture. The
addition of sulfuric acid to CTP results in oxidation of low volatile aliphatic compounds
to form organic acid and phenol structures. Upon heat treatment in the presence of
48

6
H2SO4, they can further undergo polycondensation and thereby increase the yield of
condensed aromatic structures [1]. Indeed, the carbonization of these materials showed
almost 90 -100% yield/g of CTP. We also saw that these materials could now be easily
activated using CO2 at 900°C. The resulting carbon had surface areas in the order of 600
– 900 m2/g. The next step was to isolate the component of the CTP that upon
carbonization could be activated. We did this by first extracting and separating the
soluble and insoluble components of CTP in tetrahydrofuran. Both the components were
then mixed separately with polyethylene glycol diacid and H2SO4, carbonized and then
activated. The THF soluble fraction yielded carbon with surface area in the order of 900
m2/g while the THF insoluble fraction resulted in carbon with surface area upto 1500
m2/g. The micropore volume in these carbons was as high as 0.8 cc/g.
In our second approach, we start with polyfurfuryl alcohol, which upon
carbonization yields a carbon that is microporous (4 - 5Å). Blending with another
polymer like polyethylene glycol results in inducing mesoporosity in the carbon along
with microporosity. In the past, we have shown that the mesoporous volume scales with
the molecular weight of polyethylene glycol. We set out to improve on the properties of
the carbon derived from these blends. The first important objective is to ensure good
miscibility of both the polymer components. Hydrogen bonding is the main interaction
between the two polymers. We enhanced the possibility of hydrogen bonding and also
promote possible covalent bonding between the two polymers by using polyethylene
glycol diacid instead of polyethylene glycol. The carbon synthesized using polyfurfuryl
alcohol/polyethylene glycol diacid blends were easy to activate. The surface area of the
activated carbon were in the order of 1000 – 1500 m2/g. The micropore volume of these
carbons was as high as 0.6 cc/g. We also varied the molecular weight of polyethylene
glycol diacid (PEG acid). The time required for activation in order to synthesize high
surface area carbon (> 1000 m2/g) decreased with increase in the molecular weight of
PEG acid.
The synthesized high surface area carbons were then analyzed using cyclic
voltammetry and electrochemical impedance spectroscopy. Carbons with surface area
ranging from 300 m2/g – 1500 m
2/g were tested using both these methods. The specific
capacitances of the carbon were 10 – 50 F/g for carbon with surface area less than 1000
49

7
F/g. As the surface area of the carbon increased above 1000 m2/g, the specific
capacitance increased dramatically and was about 200 – 250 F/g for carbons derived from
both PFA/PEG diacid and CTP/PEG diacid blends. Finally, the use of these carbon
materials as electrodes in EDLCs was successfully demonstrated by fabricating a two-
electrode electrochemical capacitor.
In this report, we have successfully demonstrated the use of polymer-derived
carbons and coal tar pitch derived carbon as use as electrodes for electrical double layer
capacitors using aqueous electrolyte. There is enormous commercial potential to engineer
the physical properties of these carbons to extend its use in organic electrolytes, which
would increase the energy density of the capacitor.
50

8
Experimental
i) Synthesis of coal tar pitch derived carbons
a) Coal tar pitch polymer blends
Blends of coal tar pitch and polymer precursors such as sucrose, polyfurfuryl
alcohol and polyethylene glycol were prepared by simply mixing them in a ratio of 1:3 by
weight. They were then placed in a quartz boat, which was in turn placed in a tube
furnace under flowing argon atmosphere. The samples were then heated to 800°C slowly
and maintained at 800°C for 8 hours.
b) Modification of coal tar pitch
3g of coal tar pitch was mixed with 9g of PEG600 diacid and 3ml of H2SO4. The
resultant mixture was then allowed to stir overnight. As the reaction proceeded, the
viscosity of the solution increased. The viscous solution was then transferred onto the
quartz boat for carbonization at 800°C.
In another experiment, 5g of coal tar pitch was dissolved in 50 ml of
tetrahydrofuran (THF) and allowed to stir for 2 hours. The dissolved mixture was then
filtered using suction filtration and the residue (THF insoluble) and the filtrate (THF
soluble) were collected separately. After the extraction, 3g of THF insoluble and THF
soluble were separately mixed with 10g of PEG600 diacid and 2ml of H2SO4. The
solution was stirred overnight and the mixture was carbonized at 800°C.
ii) Synthesis of polymer derived carbons
a) Synthesis of polyethylene glycol diacid
PEG diacid (PEG with end carboxylic acid groups instead of alcohol groups) were
synthesized according to the procedure introduced by Ferruti et al [2]. 10 mmol of PEG
(MW: 1000, 2000, 3350 and 6000 g/mol) , 50 mmol succinic anhydride, and 50 mmol of
pyridine also from Aldrich were mixed in Chloroform for 48 hours at 55 °C. The reacted
solution was then evaporated and redissolved in a 10% sodium bicarbonate solution and
filtered to remove residue. The mixture was then chilled to 0 °C - 5 °C and acidified
using 0.3 mol of hydrochloric acid. The product was then extracted using chloroform and
recrystallized using diethyl ether.
51

9
b) Synthesis of polyfurfuryl alcohol/polyethylene glycol diacid
0.1M p-toluenesulfonic acid (p-TSA) was dissolved in 5 ml THF and cooled
down to 0°C using an ice bath. 10 ml of furfuryl alcohol was slowly added to this
solution using a syringe pump at 10 ml/hr. The solution was then stirred and the reaction
was allowed to proceed for 48 hours. To this solution, polyethylene glycol diacid (600
g/mol) was mixed in a ratio of 1:2 by weight. The polymer blend was then carbonized at
800°C.
iii) CO2 activation of carbon
The carbon was placed in a quartz boat and placed in a tube furnace. The sample
was heated under argon atmosphere to 900°C in one hour and soaked for another hour.
This was followed by activating under CO2 atmosphere at 900°C. After activation, the
sample was cooled down to room temperature under argon atmosphere.
iv) Characterization of activated carbon
a) Pore size distribution
The pore size distribution of the carbon was calculated using a methyl chloride
adsorption tests. The pore size was calculated using H-K model described elsewhere [3].
b) Surface area measurements (BET)
The surface area measurements were made using BET equation using nitrogen
adsorption experiments at 77K. Approximately, 0.2 g of sample was used for the
experiment and the samples were baked at 100°C overnight before the experiment.
c) Electrochemical characterization
Electrode preparation
0.2g of carbon was mixed with polyvinyledene powder (0.02g) and grinded using
a mortar and pestle. The resultant powder was dispersed in 1 ml of N-methylpyrrolidone.
The solution was ultrasonicated for half hour and the resultant paste was applied onto a
gold foil (1 cm2) and blow dried to form a thin carbon film. The weight of the carbon film
was ~ 20 mg for every experiment.
52
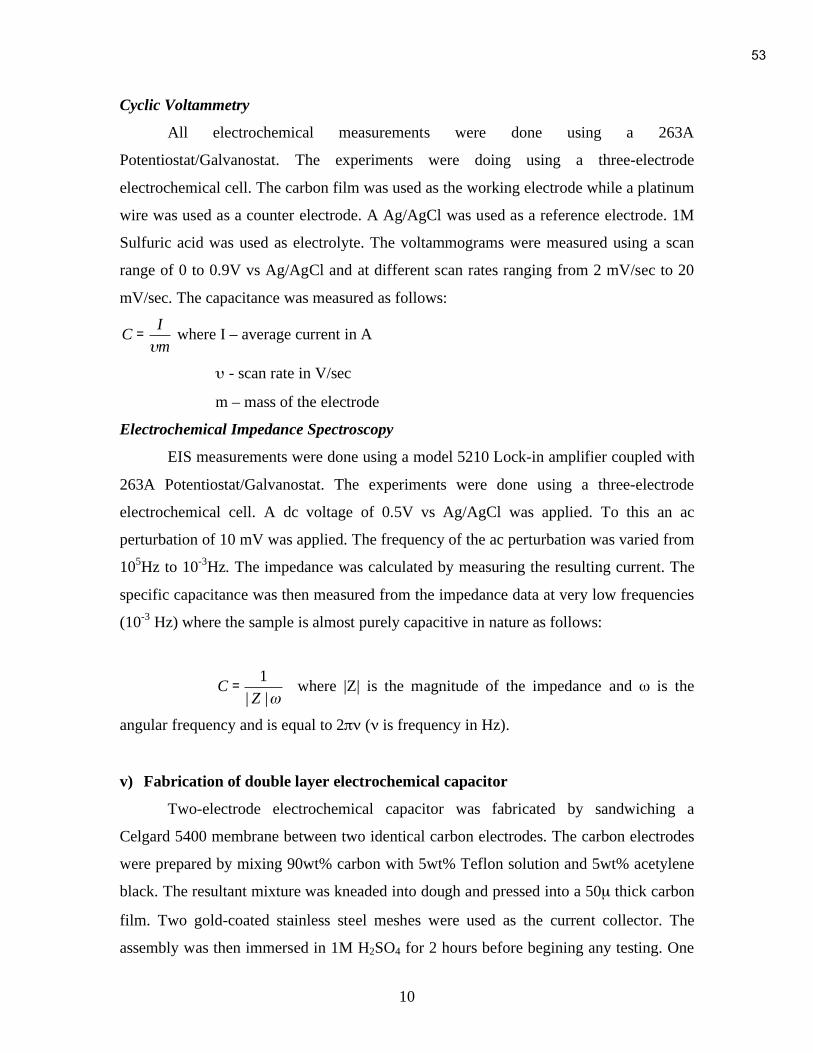
10
Cyclic Voltammetry
All electrochemical measurements were done using a 263A
Potentiostat/Galvanostat. The experiments were doing using a three-electrode
electrochemical cell. The carbon film was used as the working electrode while a platinum
wire was used as a counter electrode. A Ag/AgCl was used as a reference electrode. 1M
Sulfuric acid was used as electrolyte. The voltammograms were measured using a scan
range of 0 to 0.9V vs Ag/AgCl and at different scan rates ranging from 2 mV/sec to 20
mV/sec. The capacitance was measured as follows:
C =I
m where I – average current in A
- scan rate in V/sec
m – mass of the electrode
Electrochemical Impedance Spectroscopy
EIS measurements were done using a model 5210 Lock-in amplifier coupled with
263A Potentiostat/Galvanostat. The experiments were done using a three-electrode
electrochemical cell. A dc voltage of 0.5V vs Ag/AgCl was applied. To this an ac
perturbation of 10 mV was applied. The frequency of the ac perturbation was varied from
105Hz to 10
-3Hz. The impedance was calculated by measuring the resulting current. The
specific capacitance was then measured from the impedance data at very low frequencies
(10-3
Hz) where the sample is almost purely capacitive in nature as follows:
C =1
| Z | where |Z| is the magnitude of the impedance and is the
angular frequency and is equal to 2 ( is frequency in Hz).
v) Fabrication of double layer electrochemical capacitor
Two-electrode electrochemical capacitor was fabricated by sandwiching a
Celgard 5400 membrane between two identical carbon electrodes. The carbon electrodes
were prepared by mixing 90wt% carbon with 5wt% Teflon solution and 5wt% acetylene
black. The resultant mixture was kneaded into dough and pressed into a 50μ thick carbon
film. Two gold-coated stainless steel meshes were used as the current collector. The
assembly was then immersed in 1M H2SO4 for 2 hours before begining any testing. One
53
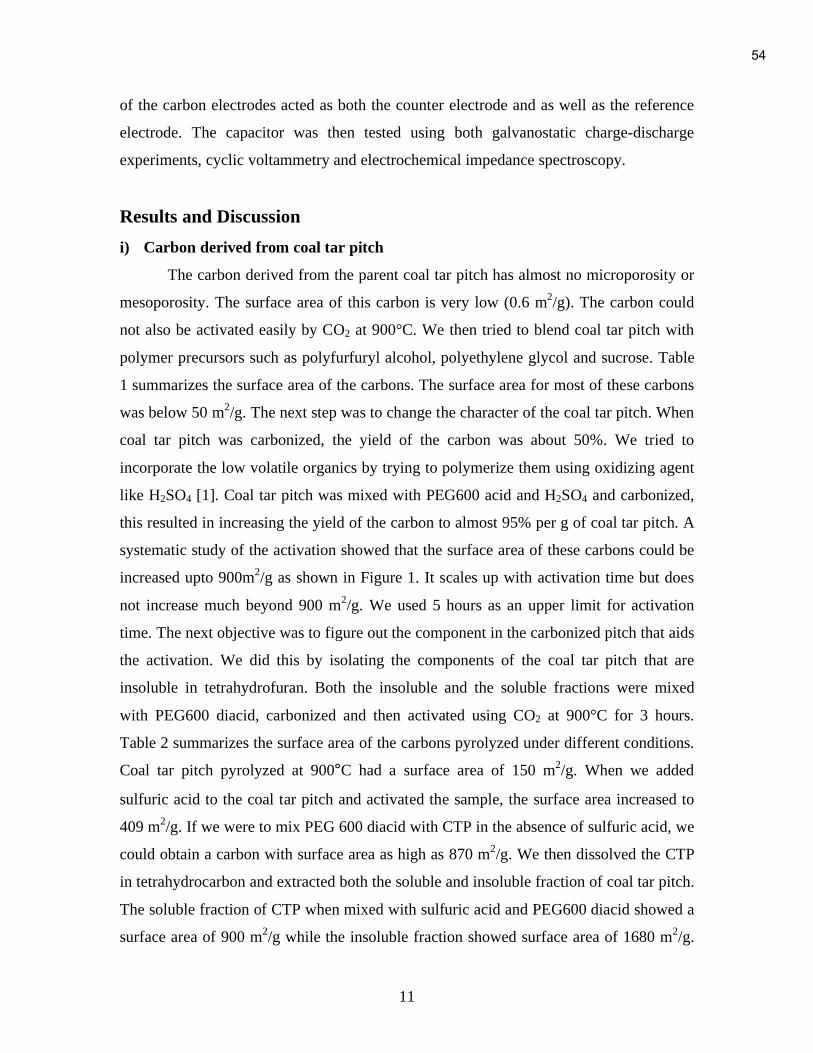
11
of the carbon electrodes acted as both the counter electrode and as well as the reference
electrode. The capacitor was then tested using both galvanostatic charge-discharge
experiments, cyclic voltammetry and electrochemical impedance spectroscopy.
Results and Discussion
i) Carbon derived from coal tar pitch
The carbon derived from the parent coal tar pitch has almost no microporosity or
mesoporosity. The surface area of this carbon is very low (0.6 m2/g). The carbon could
not also be activated easily by CO2 at 900°C. We then tried to blend coal tar pitch with
polymer precursors such as polyfurfuryl alcohol, polyethylene glycol and sucrose. Table
1 summarizes the surface area of the carbons. The surface area for most of these carbons
was below 50 m2/g. The next step was to change the character of the coal tar pitch. When
coal tar pitch was carbonized, the yield of the carbon was about 50%. We tried to
incorporate the low volatile organics by trying to polymerize them using oxidizing agent
like H2SO4 [1]. Coal tar pitch was mixed with PEG600 acid and H2SO4 and carbonized,
this resulted in increasing the yield of the carbon to almost 95% per g of coal tar pitch. A
systematic study of the activation showed that the surface area of these carbons could be
increased upto 900m2/g as shown in Figure 1. It scales up with activation time but does
not increase much beyond 900 m2/g. We used 5 hours as an upper limit for activation
time. The next objective was to figure out the component in the carbonized pitch that aids
the activation. We did this by isolating the components of the coal tar pitch that are
insoluble in tetrahydrofuran. Both the insoluble and the soluble fractions were mixed
with PEG600 diacid, carbonized and then activated using CO2 at 900°C for 3 hours.
Table 2 summarizes the surface area of the carbons pyrolyzed under different conditions.
Coal tar pitch pyrolyzed at 900°C had a surface area of 150 m2/g. When we added
sulfuric acid to the coal tar pitch and activated the sample, the surface area increased to
409 m2/g. If we were to mix PEG 600 diacid with CTP in the absence of sulfuric acid, we
could obtain a carbon with surface area as high as 870 m2/g. We then dissolved the CTP
in tetrahydrocarbon and extracted both the soluble and insoluble fraction of coal tar pitch.
The soluble fraction of CTP when mixed with sulfuric acid and PEG600 diacid showed a
surface area of 900 m2/g while the insoluble fraction showed surface area of 1680 m
2/g.
54

12
The micropore volume of this material was about 0.6 cc/g while the mesopore volume
was about 0.1 cc/g as shown in Figure 2.
Figure 3 (a) shows the cyclic voltammogram of carbon that has a surface area of
1476 m2/g. The specific capacitance measured was a function of scan rate (Figure 3(b)).
This suggested that although the surface area of the carbon was very high, the specific
capacitance of the carbon was limited by the diffusion of the electrolyte anion into the
pores. We believe that this could be due to the blockage of pores by PVDF, the binder.
Nevertheless at very low scan rates (2 mV/sec), specific capacitance was as high as 170
F/g. The diffusion limitation was also seen from the Electrochemical Impedance
Spectroscopy (EIS) measurements. Figure 4 shows the magnitude and phase angle plot of
the impedance versus frequency. It was seen that at very high frequencies, the electrode is
completely resistive but as the frequency is lowered, the anions start to permeate through
the pores and the double layer capacitance is measured. Interestingly, the phase angle
does not become 90° as is the case with purely capacitive material. There seems to be
another resistive component, which seems to impede this behavior. This might be due to
the pore resistance offered by the blockage of the micropores and hence the diffusion
limitation. By reducing the concentration of PVDF from 10wt% to 5wt%, we saw that the
capacitance increased from 81 F/g to 147 F/g (Figure 5). Capacitance as measured using
EIS was 265 F/g for 5wt% binder and 135 F/g for 10wt% binder.
Our results are in agreement with our primary hypothesis that the presence of high
QI content aids in development of microporous carbon by forming disordered carbon.
Previous investigations have shown that THF soluble fraction was almost QI free and
generally consisted of low molecular mass compounds [4]. However, the exact
composition of the THF insoluble fraction is very difficult to study and might be worth
studying to prepare better microporous carbon.
ii) Carbon derived from PFA/PEG diacid blend
Table 3 summarizes the results of activation, the corresponding surface area and
specific capacitances achieved. These carbons did not have any diffusion limitations. We
believe that this might be due to the fact that the bulk density (presence of macropores) of
these carbons were very low and hence the binder does not block the pores. Another
55

13
noticeable feature was that the activation required considerably very less time. It took
only about two hours of activation to achieve a surface area of about 1500 m2/g. As we
increased the molecular weight of PEG diacid, it even took lesser time to activate.
Figure 7 shows the pore size distribution of carbon derived from PFA/PEG600
diacid blend. We chose three different carbons activated for different times to compare.
The surface areas of the carbon were 330 m2/g, 920 m
2/g and 1360 m
2/g. It is seen that
the micropore volume increases with increase in the surface area of the carbon. The
micropore volume for the 1360 m2/g was about 0.6 cc/g and the mesopore volume was
0.11 cc/g. Both the micropore and the mesopore volumes increased with increase in the
surface area. The ratio of the mesopore/micropore volume was 0.069, 0.072 and 0.1474
respectively.
We also looked at the effect of pyrolysis temperature on the surface area of the
activated carbon. Figure 8 shows a plot of the surface area of carbons activated under
similar conditions versus the pyrolysis temperature of the precursor. The samples were
pyrolyzed from 900°C - 1800°C. It was seen that the surface area of the sample increased
with increase in the pyrolysis temperature upto 1200°C. The surface area of the carbons
were as high as 2300 m2/g. However, when the pyrolysis temperature was increased
further, the surface area begins to decrease due to the collapse of the pores in the carbon
at such high temperatures.
Figure 9 shows the overall plot of specific capacitance versus surface area made
from different precursors. It was seen that the specific capacitance was proportional to the
surface area. For surface areas less than 1000 m2/g, the specific capacitance was less than
100 F/g. However, when the surface area was increased above 1000 m2/g, the specific
capacitance increased appreciably to 200 – 250 F/g. We see that the mesopore/micropore
volume in this material almost doubles for carbon greater than 1000 m2/g as compared to
carbon less than 1000 m2/g. This suggests that the presence of mesopores is very critical
to have higher specific capacitance.
Carbon derived from PFA/PEG diacid shows lot of promise to develop high
surface area carbon for capacitors. Our experiments show that the role of functional
groups on PEG (-OH or –COOH) plays an important role in determining the character of
the derived carbon. The –OH terminated PEG when blended with PFA leads to carbon
56

14
with very little macroporosity and mesoporosity. This material is difficult to activate
using CO2. On the other hand, -COOH terminated PEG results in carbon with very high
surface area. The mechanism for this dramatic difference is still unknown and is under
study. Our hypothesis is that there is change in the nature of interaction of PEG with
PFA. With PEG diacid, there could be more hydrogen bonding, possible covalent
bonding (ester formation) resulting in better mixing with PFA. The better-mixed blend
can then undergo much more controlled reaction induced phase separation at higher
temperatures.
Figure 10 shows the comparison of the pore size distribution of our carbon with a
commercial activated carbon (BP-20) used in ultracapacitors. The experiments were done
in Rohm and Haas using Argon porosimetry and DFT analysis. Based on the DFT
analysis the coal tar pitch blend samples and polymer blend samples have similar peak in
the distribution as BP-20 near 14Å. However, the polymer blend sample has a broad peak
in the range 100 - 2500Å while the coal tar pitch have a small tail in the region extending
upto 1000 Å. This suggests that the coal tar pitch sample can be used for high energy
density capacitor applications while the carbon derived from polymer blend sample can
be used for fast charge/discharge capacitor applications.
iii) Demonstration of double layer electrochemical capacitor
The capacitor was tested using Galvanostatic charge/discharge experiments,
Cyclic voltammetry and Electrochemical Impedance Spectroscopy. We tested the
capacitors made using both coal tar pitch/PEG 600 diacid blends and polymer blends.
The capacitor was made using a carbon prepared using PFA/PEG600 diacid that has a
surface area of 1360 m2/g while the coal tar pitch/PEG600 diacid had a surface area of
1500 m2/g. Our electrochemical measurements showed that carbon derived from polymer
blends had a specific capacitance of 180 F/g while carbon derived from coal tar pitch
blends had a specific capacitance of 130 F/g. Figure 11, 12 and 13 shows the cyclic
voltammogram, Bode plot of the tested capacitor and Constant current charge/discharge
measurements.
57
15
Conclusions
Nanoporous carbons were derived from two different precursors such as
CTP/PEG diacid blend and PFA/PEG diacid. Our investigation showed that surface areas
ranging from 1500 – 2000 m2/g could be achieved upon activation of these carbons using
CO2. The specific capacitances for these carbons can be as high as 250 F/g. THF
insoluble fraction of CTP when carbonized can be activated to yield a very high surface
area carbon that can be potentially used as electrodes in capacitors. We believe that this
carbon can be used to make high energy density capacitors as the bulk density of these
carbons can be as high as 0.5 – 0.8 g/cc. PFA/PEG diacid blends also acts as excellent
precursor to develop high surface area carbons. This carbon can be used to make
capacitors that have fast charging/discharging capabilities. The developed carbons were
systematically studied using cyclic voltammetry and electrochemical impedance
spectroscopy. We have also fabricated a two-electrode electrochemical double layer
capacitor using these carbons as electrodes. Using sulfuric acid as electrolyte, we were
able to make capacitors with capacitances as high as 150 -180 F/g. These are very
promising and we believe that there is potential to extend the use of these capacitors in
organic electrolyte system to achieve higher energy densities.
References
1. Ferruti, P.; Tanzi, M. C.; Koleske, L.; Cecchi, R.; Makromol. Chem. 182, 2183
(1981).
2. Petrova B., Budinova T., Petrov N., Yardim M.F., Ekinci E. and Razvigorova M.,
Carbon, 43, 261 (2005).
3. R.K. Mariwala and H.C. Foley, Ind. Eng. Chem. Res., 33, 2314-2321 (1994).
4. Andresen J.M., Martin Y., Moinelo S.R., Maroto-Valer M.M. and Snape C.E.,
Carbon, 36, 1043 (1998).
.
58

16
Figure 1. Surface area of carbon derived from CTP/PEG600 diacid blend mixed with
H2SO4 as a function of activation time using CO2 at 900°C
59

17
Figure 2 Pore size distribution of carbon derived from coal tar pitch
60

18
-2.5
-2
-1.5
-1
-0.5
0
0.5
1
1.5
2
2.5
0 0.2 0.4 0.6 0.8 1
Applied Potential (V vs Ag/AgCl)
Cu
rre
nt
de
nsity (
A/g
)2mV/sec
5mV/sec
10mV/sec
20mV/sec
0
20
40
60
80
100
120
140
160
0 5 10 15 20 25
Scanrate (mV/sec)
Ca
pa
cita
nce
(F
/g)
Figure 3 (a) Cyclic voltammogram of carbon derived from CTP having a surface area of
1476 m2/g using 10wt% PVDF as binder and (b) Specific capacitance of carbon derived
from CTP having a surface area of 1476 m2/g using 10wt% PVDF as binder
61
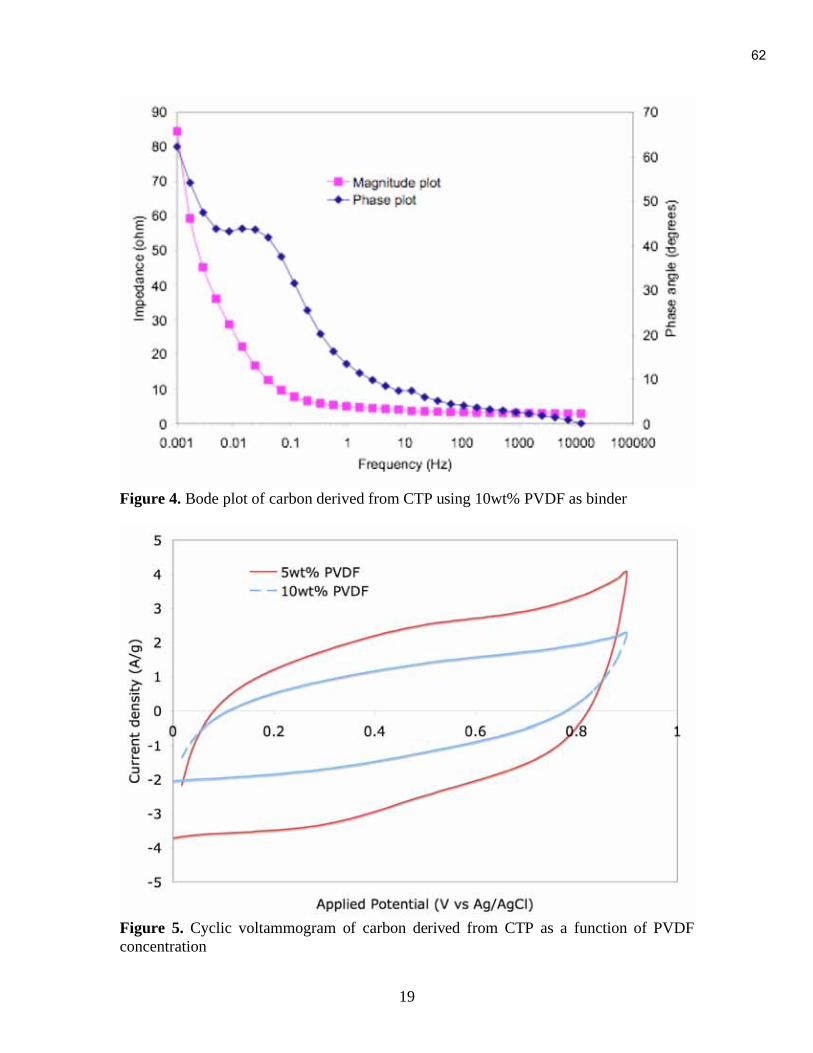
19
Figure 4. Bode plot of carbon derived from CTP using 10wt% PVDF as binder
Figure 5. Cyclic voltammogram of carbon derived from CTP as a function of PVDF
concentration
62

20
Figure 6. Comparison of bode plot of carbon derived from CTP that has a surface area of
1476 m2/g using two different binder concentrations
63

21
Figure 7. Pore size distribution of carbon derived from PFA/PEG600 diacid blend
64

22
Figure 8. Surface area of the activated carbon as a function of pyrolysis temperature of
polyfurfuryl alcohol/polyethylene glycol diacid blend precursors
Figure 9. Specific capacitance of different carbons and their corresponding surface area.
65

23
Figure 10. Comparison of the Pore size distribution using DFT analysis of carbon
derived from coal tar pitch blends, polymer blends and commercial activated carbon BP-
20
66

24
(a)
(b)
Figure 11. Cyclic voltammogram of a capacitor made with a) PFA/PEG 600 diacid
carbon and b) CTP/PEG 600 diacid carbon
67

25
0
20
40
60
80
100
120
0.001 0.01 0.1 1 10 100 1000 10000 100000
Frequency (Hz)
Impedance (
ohm
)
0
10
20
30
40
50
60
70
80
Ph
as
e a
ng
le (
de
gre
es
)
magnitude
phase angle
Figure 12. Bode plot of a capacitor made with carbon that has a surface area of 1360
m2/g
Figure 13. Constant current charge-discharge measurements on a capacitor under a
constant current load of 1A/g
68

26
Samples
Surface area (m2/g)
CTP
0.3
CTP_PEG2k
0.46
CTP_PEG6k
1.07
CTP air activated
20
CTP_PFA 13
CTP_PFA_KOH
37.23
CTP_sucrose 18
Table 1. Surface area of coal tar pitch and coal tar pitch/polymer blend
Samples Surface area (m2/g)
Coal tar pitch 115
Coal tar pitch + H2SO4 409
Coal tar pitch + PEG600 diacid 873
THF soluble + PEG 600 diacid + H2SO4 920
THF insoluble + PEG 600 diacid + H2SO4 1680
Table 2. Surface area of activated coal tar pitch/polymer blends
69

27
PFA blended with Activation time
(min)
Surface area (m2/g) Specific
Capacitance (F/g)
PEG 600 - 330 7
PEG 600 120 920 77.6
PEG 600 135 1360 276
PEG 1000 120 1330 235
PEG 2000 60 1180 264.7
PEG 2000 120 1650 242.35
PEG 3350 45 1200 -
Table 3. Specific capacitance and surface area of carbon derived from PFA/PEG600
diacid
70

CONSORTIUM FOR PREMIUM CARBON PRODUCTS FROM COAL
Continued Development of Pitch/Nanotube Foam and Fiber Composites
Subcontract No. 2869-UK-DOE-1874
Final Report
1st March 2005 – 30
th June 2006
University of Kentucky
Center for Applied Energy Research
&
West Virginia University
November 2006
71

CPCPC 9 Final Report: Pitch/NT Foams II
ii
Disclaimer
This report was prepared as an account of work sponsored by an agency of the United States
Government. Neither the United States Government nor any agency thereof, nor any of their
employees, makes any warranty, express or implied, or assumes any legal liability or
responsibility for the accuracy, completeness, or usefulness of any information, apparatus,
product, or process disclosed, or represents that its use would not infringe privately owned rights.
Reference herein to any specific commercial product, process, or service by trade name,
trademark, manufacturer, or otherwise does not necessarily constitute or imply its endorsement,
recommendation, or favoring by the United States Government or any agency thereof. The views
and opinions of authors expressed herein do not necessarily state or reflect those of the United
States Government or any agency thereof.
72

CPCPC 9 Final Report: Pitch/NT Foams II
iii
Abstract
The principal objectives of the program were to develop new carbon materials to satisfy the
increasingly exacting requirements needed for thermal management of electronic and electric
power devices. Such high performance carbon materials offer attractive potential alternative
solutions to other more severe duty applications, including blast mitigation and nuclear/chemical
warfare protection. The inclusion of carbon nanotubes in a range of pitches was studied and the
conversion of the derived composite materials to foams and/or fibers was expected to open up
opportunities for developing other high performance carbon materials. The key to achieving
these aims and to more fully exploit the extraordinary physical properties of the carbon
nanotubes was to generate MWNT/carbon composites from a range of different pitches
containing well dispersed carbon nanotubes. It was planned to promote the interaction between
the nanotubes and the continuous matrix by surface activation of the nanotubes and in particular
for the synthesis of carbon fibers to ensure that nanotube dispersion was complete by separating
the nanotubes down to individual tube level.
These studies were conducted under DOE Subcontract No. 2869-UK-DOE-1874. This contract is
with the University of Kentucky Research Foundation, which supports work with the University
of Kentucky Center for Applied Energy Research and West Virginia University.
73

CPCPC 9 Final Report: Pitch/NT Foams II
iv
Table of Contents
Abstract .................................................................................................................................... iii
Summary.....................................................................................................................................v
Introduction ................................................................................................................................1
Experimental...............................................................................................................................1
Feedstocks ............................................................................................................................1
Preparation of Multiwall Carbon Nanotubes .........................................................................1
Nanotube Surface Activation ................................................................................................2
Pitch Sources ........................................................................................................................3
Methods of Nanotube Dispersion..........................................................................................5
Preparation of MWNT/Pitch Composite Materials................................................................6
Preparation of Carbon Foams................................................................................................9
Carbon Fiber Synthesis .......................................................................................................10
Results and Discussion..............................................................................................................12
Carbon Foams.....................................................................................................................12
Carbon Fibers .....................................................................................................................17
Conclusions ..............................................................................................................................18
References ................................................................................................................................19
Figures
Figure 1 MWNT Produced at CAER......................................................................................2
Figure 2 DMA Controlled Force Determination of Softening Characteristics .........................3
Figure 3 The Production of Pitch by the Solvent Extraction of Coal - Schematic....................5
Figure 4 Torque Generated by Dispersing MWNTs into a Common Pitch..............................7
Figure 5 Apparatus used for Measuring Electrical Resistivity...............................................10
Figure 6 Scanning Electron Microscope at West Virginia University. ..................................12
Figure 7 Koppers Coal Tar Pitch Foam (0.5wt%MWNT), (a) Green (b) Carbonized............13
Figure 8 Electrical Resistivity & Bulk Density of Carbon Foams .........................................14
Figure 9 Carbonized WVU Synpitch Foam, (a) 0wt% MWNT, (b) 2.5wt% MWNT. ...........15
Figure 10 HSP Koppers CTP with (a) 2.5wt% HNO3 MWNT, (b) 2.5wt% MWNT...............15
Figure 11 EMI Shielding of MWNT/Carbon Foams...............................................................16
Figure 12 Tensile Strength & Elastic Modulus of MWNT/Carbon Fibers...............................17
74

CPCPC 9 Final Report: Pitch/NT Foams II
v
Summary
A series of nanotube/pitch composite materials were prepared using three samples of isotropic
pitch, a low QI pitch, a coal tar pitch and a Koppers low volatile pitch with softening points
ranging from 120 to 170oC. Synthesis of the nanotubes was carried out at CAER using the
continuous reactor developed on-site. Multiwall carbon nanotubes (MWNTs) were dispersed into
the pitches at concentrations of 0.5, 1.0 and 2.5wt% using conventional melt processing
techniques. A reference sample without the addition of nanotubes was also prepared from each
pitch using the same mixing conditions. An additional composite was prepared using surface
treated nanotubes at a concentration of 2.5wt% in one of the pitches. Surface activation of the
nanotube sample was carried out by refluxing in concentrated nitric acid. The MWNT/pitch
composite samples were converted into carbon foams through a carefully controlled heating and
pressure control regime designed to regulate the fluidity of the pitches and the development of a
stable bubble structure. The foams were carbonized at 1000°C for testing and characterization.
A different approach was used to prepare MWNT/pitch composite materials for carbon fiber
synthesis. The presence of any agglomerates in the composite disrupts the fiber forming process
during melt spinning and introduces stress concentration defects into the fiber. Although melt
mixing is a method that is able to generate carbon nanotube (CNT) composites with a uniform
distribution of MWNTs, it is unlikely to yield a pitch composite with the quality of CNT
dispersion required for the synthesis of carbon fibers that exhibit significantly enhanced
properties. Hence, a more complex approach was used that had better prospects for achieving the
required aims. This involved the dispersion of nanotubes in a carrier solvent followed by
accelerated sedimentation to remove any agglomerates. The supernatant fraction was then mixed
with a solution of the pitch to produce a nanotube/pitch composite following solvent recovery.
This material was then melt spun into fine filament and converted into carbon fiber by thermal
processing. The properties of the carbon fibers were measured and compared to similar fibers
produced from the parent pitch.
75
CPCPC 9 Final Report: Pitch/NT Foams II
1
Introduction
It is the exceptional mechanical strength and stiffness and high thermal and electrical
conductivity of carbon nanotubes that provide the basis for generating new high performance
materials. The tensile strength of carbon nanotubes has been reported to be as high as 200GPa
with an elastic modulus of up to 1TPa. Nanotubes also possess one of the highest thermal
conductivities known, lending themselves for use in thermal management and flame suppression
applications. Their dispersion into a continuous matrix allows the production of new composite
materials with exciting properties. The current program, “Continued Development of
Pitch/Nanotube Foam and Fiber Composites” was initiated in order to build upon the promising
results obtained in earlier studies(1)
. The main objectives were to promote the fabrication of a
range of pitch/nanotube based composites, particularly aimed at the development of new
materials for thermal management and electromagnetic shielding applications. Such carbon
based composite materials also offer distinct advantages as construction materials, including
strength, toughness, impact resistance, EMI shielding and high thermal conductivity. Hence, they
could be used to produce lighter, stronger, cheaper and more effective materials. Multifunctional
carbon materials based on carbon foams could be developed for modular assembly as wall
treatments to provide blast mitigation and nuclear/chemical warfare protection as well as
enhanced electronic security. An important feature in the synthesis of the foams and fiber
composites is that they are derived from coal, a low cost feedstock with extensive domestic
reserves.
In the previous study(1)
, carbon nanotubes were dispersed into isotropic pitches and the derived
composites used to produce fibers and foams. In this current study, it was intended to further
develop this approach by producing pitch/nanotube composites with different properties and
explicitly to explore methods that promote the interaction between the pitch matrix and the
embedded nanotubes in order to more fully exploit the extraordinary properties of carbon
nanotubes. It was expected that the work conducted in this project would produce results that
could be used to demonstrate how the formation of coal-derived carbon fibers and foams
containing well dispersed nanotubes could be fabricated, exhibiting enhanced structural, thermal
management and electrical shielding properties. The component materials, coal extract pitches
from WVU and UK and high purity multiwall carbon nanotubes from UK, were produced,
blended and formed into fibers (UK) and foams (WVU). The materials were heat treated and
tested for their physical, electrical and thermal properties.
Experimental
Feedstocks
Preparation of Multiwall Carbon Nanotubes
CAER has developed a chemical vapor deposition process for selectively producing high purity
(>95%) multiwall carbon nanotubes (MWNTs); virtually no amorphous carbon is co-generated
with the nanotubes. The pilot-scale unit operates in a truly continuous manner without the need
for difficult and expensive post-synthesis purification of the product, producing ~2.5kg of
MWNTs per day. The synthesis proceeds by the reaction of a hydrocarbon vapor over a
dispersed iron catalyst that is deposited in situ on quartz substrates(2)
. Commonly, a xylene-
ferrocene liquid mixture is injected continuously into a pre-heater zone and is swept into the
reactor by an argon or nitrogen carrier gas. Operating conditions are varied to control the type
76
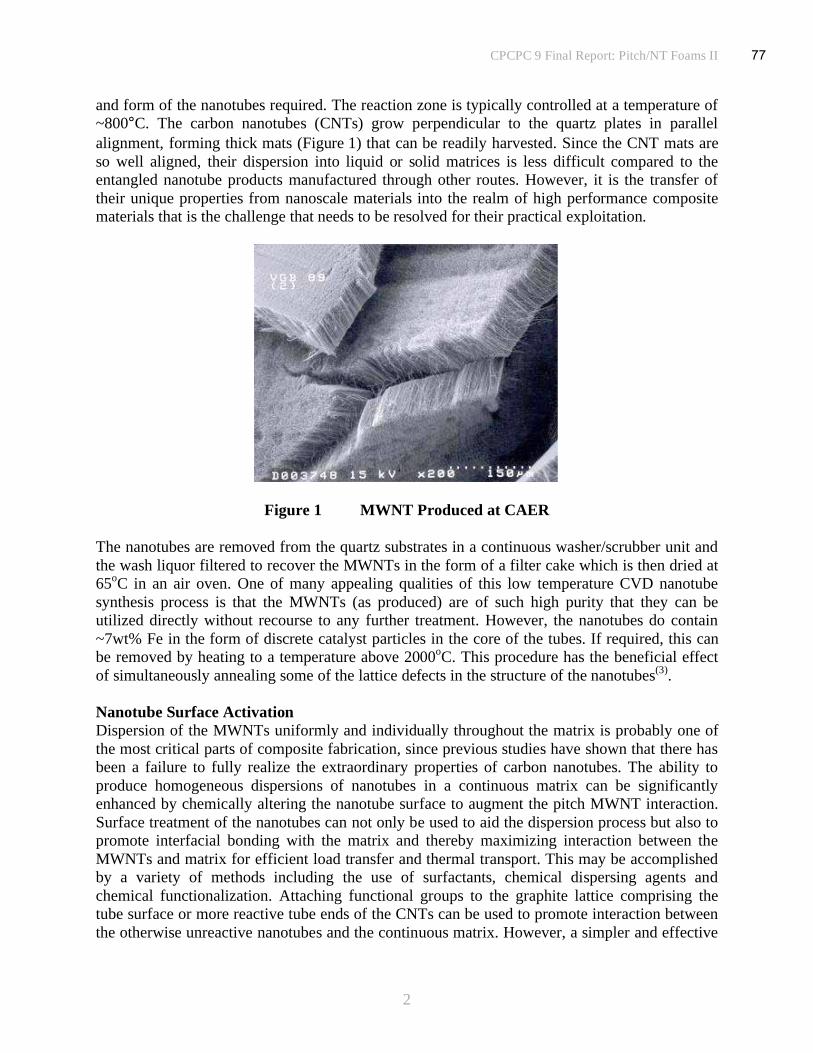
CPCPC 9 Final Report: Pitch/NT Foams II
2
and form of the nanotubes required. The reaction zone is typically controlled at a temperature of
~800°C. The carbon nanotubes (CNTs) grow perpendicular to the quartz plates in parallel
alignment, forming thick mats (Figure 1) that can be readily harvested. Since the CNT mats are
so well aligned, their dispersion into liquid or solid matrices is less difficult compared to the
entangled nanotube products manufactured through other routes. However, it is the transfer of
their unique properties from nanoscale materials into the realm of high performance composite
materials that is the challenge that needs to be resolved for their practical exploitation.
Figure 1 MWNT Produced at CAER
The nanotubes are removed from the quartz substrates in a continuous washer/scrubber unit and
the wash liquor filtered to recover the MWNTs in the form of a filter cake which is then dried at
65oC in an air oven. One of many appealing qualities of this low temperature CVD nanotube
synthesis process is that the MWNTs (as produced) are of such high purity that they can be
utilized directly without recourse to any further treatment. However, the nanotubes do contain
~7wt% Fe in the form of discrete catalyst particles in the core of the tubes. If required, this can
be removed by heating to a temperature above 2000oC. This procedure has the beneficial effect
of simultaneously annealing some of the lattice defects in the structure of the nanotubes(3)
.
Nanotube Surface Activation
Dispersion of the MWNTs uniformly and individually throughout the matrix is probably one of
the most critical parts of composite fabrication, since previous studies have shown that there has
been a failure to fully realize the extraordinary properties of carbon nanotubes. The ability to
produce homogeneous dispersions of nanotubes in a continuous matrix can be significantly
enhanced by chemically altering the nanotube surface to augment the pitch MWNT interaction.
Surface treatment of the nanotubes can not only be used to aid the dispersion process but also to
promote interfacial bonding with the matrix and thereby maximizing interaction between the
MWNTs and matrix for efficient load transfer and thermal transport. This may be accomplished
by a variety of methods including the use of surfactants, chemical dispersing agents and
chemical functionalization. Attaching functional groups to the graphite lattice comprising the
tube surface or more reactive tube ends of the CNTs can be used to promote interaction between
the otherwise unreactive nanotubes and the continuous matrix. However, a simpler and effective
77
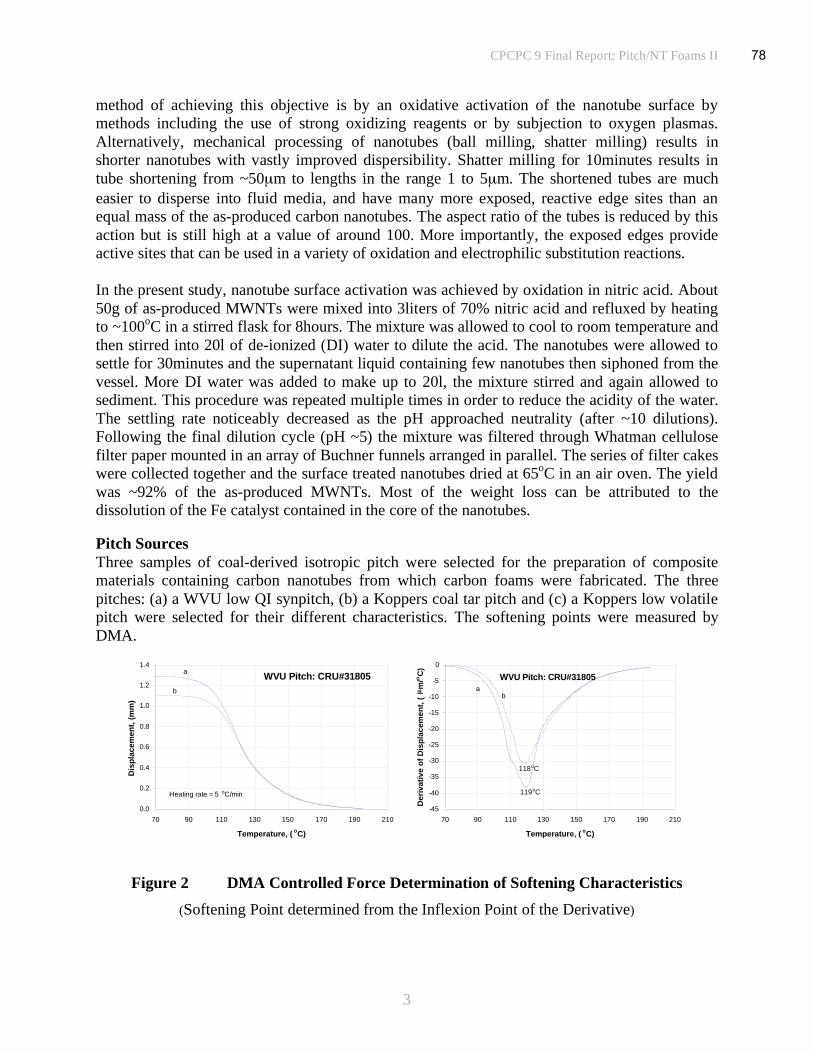
CPCPC 9 Final Report: Pitch/NT Foams II
3
0.0
0.2
0.4
0.6
0.8
1.0
1.2
1.4
70 90 110 130 150 170 190 210
Temperature, (oC)
Dis
pla
cem
en
t,
(m
m)
b
WVU Pitch: CRU#31805a
Heating rate = 5 oC/min
-45
-40
-35
-30
-25
-20
-15
-10
-5
0
70 90 110 130 150 170 190 210
Temperature, (oC)
Deriv
ativ
e o
f D
isp
lacem
en
t,
(μ
m/o
C)
118oC
119oC
WVU Pitch: CRU#31805
ab
method of achieving this objective is by an oxidative activation of the nanotube surface by
methods including the use of strong oxidizing reagents or by subjection to oxygen plasmas.
Alternatively, mechanical processing of nanotubes (ball milling, shatter milling) results in
shorter nanotubes with vastly improved dispersibility. Shatter milling for 10minutes results in
tube shortening from ~50μm to lengths in the range 1 to 5μm. The shortened tubes are much
easier to disperse into fluid media, and have many more exposed, reactive edge sites than an
equal mass of the as-produced carbon nanotubes. The aspect ratio of the tubes is reduced by this
action but is still high at a value of around 100. More importantly, the exposed edges provide
active sites that can be used in a variety of oxidation and electrophilic substitution reactions.
In the present study, nanotube surface activation was achieved by oxidation in nitric acid. About
50g of as-produced MWNTs were mixed into 3liters of 70% nitric acid and refluxed by heating
to ~100oC in a stirred flask for 8hours. The mixture was allowed to cool to room temperature and
then stirred into 20l of de-ionized (DI) water to dilute the acid. The nanotubes were allowed to
settle for 30minutes and the supernatant liquid containing few nanotubes then siphoned from the
vessel. More DI water was added to make up to 20l, the mixture stirred and again allowed to
sediment. This procedure was repeated multiple times in order to reduce the acidity of the water.
The settling rate noticeably decreased as the pH approached neutrality (after ~10 dilutions).
Following the final dilution cycle (pH ~5) the mixture was filtered through Whatman cellulose
filter paper mounted in an array of Buchner funnels arranged in parallel. The series of filter cakes
were collected together and the surface treated nanotubes dried at 65oC in an air oven. The yield
was ~92% of the as-produced MWNTs. Most of the weight loss can be attributed to the
dissolution of the Fe catalyst contained in the core of the nanotubes.
Pitch Sources
Three samples of coal-derived isotropic pitch were selected for the preparation of composite
materials containing carbon nanotubes from which carbon foams were fabricated. The three
pitches: (a) a WVU low QI synpitch, (b) a Koppers coal tar pitch and (c) a Koppers low volatile
pitch were selected for their different characteristics. The softening points were measured by
DMA.
Figure 2 DMA Controlled Force Determination of Softening Characteristics
(Softening Point determined from the Inflexion Point of the Derivative)
78

CPCPC 9 Final Report: Pitch/NT Foams II
4
This is a very simple, accurate and repeatable method for determining the softening
characteristics of a pitch and has been used to determine the optimum conditions for dispersing
the nanotubes into the pitch matrix by high shear mixing. In the method, “Controlled Force
Mode” a single particle of the pitch is subjected to a static load of typically 0.2N and the
displacement monitored as the temperature is increased at a rate of 5oC/min over the temperature
range of interest. A typical DMA displacement plot is shown in Figure 2. The derivative of this
function with respect to temperature can be used to determine the inflexion point and define a
characteristic softening temperature, Table 1.
Sample No Pitch Type Softening Point
(oC)
WVU#012506 Low QI Synpitch 140
CRU#031805 Koppers Coal Tar Pitch 120
WVU#031706 Koppers Low Volatile Pitch 170
Table 1 Pitch Softening Point
Unfortunately, the pitches and MWNT/pitch composite materials produced for the fabrication of
carbon foams were not ideal for conversion into carbon fibers. The softening temperature needs
to be as high as practicable without introducing insuperable problems for the fiber forming step.
In practice, a compromise is found by producing a pitch with a softening temperature in the
range 230 to 300oC, required to facilitate conversion of the pitch matrix into carbon without
melting, usually achieved through an oxidative stabilization step. A pitch with characteristics
suitable for conversion to carbon fiber was produced by vacuum distillation of a coal solution
prepared by the solvent extraction of a Western Kentucky coal, WKy#6. UKCAER has
developed a bench scale mild solvent extraction process for converting bituminous and sub-
bituminous coals to pitch(4)
. A simplified schematic of the process is shown in Figure 3. Previous
studies have demonstrated that the conversion of coal to pitch can be achieved at high efficiency
using anthracene oil (a coal tar distillate) as the solvent at mild extraction conditions and without
recourse to the introduction of a hydrogen atmosphere at high pressure, expensive catalysts or
the use of exotic solvents. Dissolution of the coal in the digestion reactor allows the mineral
matter and undissolved coal fraction to be removed from the coal solution by a solids separation
step. Filtration is generally used for this purpose as the ill-defined separation between the
dissolved coal and the boiling point distribution of the heavy process solvent make the use of
alternative anti-solvent de-ashing techniques impractical. Virtually all of the mineral matter
present in the coal is removed during the filtration stage.
A 2liter reactor was used to prepare the coal solution from a slurry of WKy#6 in anthracene oil.
The conditions used 410oC with a residence time of 60minutes and a solvent to coal ratio of 2:1
produced a digest that was filtered without difficulty. The specific cake resistance was
<25x1010
m/kg with a filtration rate of ~70kg/m2/h. Flow rates are based on a notional system in
which filters are operated in parallel with one set on-stream while the others are off-line for cake
discharge, stripping and cleaning, allowing 30minutes for each part of the cycle. At the end of
the filtration phase the filter was allowed to drain and then blown with nitrogen to recover the
coal solution from the cake; no attempt was made to wash the cake with solvent and vacuum dry
to recover the useful products from the ‘wet’ cake. However, analysis of the cake (proximate,
79

CPCPC 9 Final Report: Pitch/NT Foams II
5
ultimate and quinoline insolubles QI) allowed calculation of the dissolved coal and solvent
content. The conversion of the coal WKy#6 to liquid products during solvent extraction was
high, yielding a conversion of around 85%daf.
Coal
Solvent
Residue
Recycle Solvent
Gas & Light
Distillate
Coal
Digest
Coal
Solution
Coal Feed
from Mill
Make -up
Solvent
Coal
Hopper
Solvent
Tank
ReactorSolids
Separation
Low softening pitch
(Anode binder )
High softening pitch
(Carbon Fibers )
Vacuum
Column
Figure 3 The Production of Pitch by the Solvent Extraction of Coal - Schematic
The amount of residual solids in the coal solution was determined by measurement of the
quinoline insolubles. Quinoline is an excellent solvent for the dissolution products from coal
extraction and does not normally result in precipitation of any of the dissolved coal. The value,
<0.1% showed that the filtration was effective, removing virtually all of the undissolved solids to
yield a coal solution that was suitable as a feedstock for the preparation of a ‘clean’ pitch. A
sample of the coal solution was vacuum distilled to remove most of the solvent to generate a
pitch with the required softening characteristics. The softening point (~270oC) of the sample
produced for these experiments was again measured by DMA.
Methods of Nanotube Dispersion
The purpose of dispersion is to homogeneously distribute individual nanotubes throughout the
matrix material. By this means the extraordinary properties of CNTs can be fully exploited,
allowing an applied load to be uniformly distributed among the nanotube population for
example. The same argument applies to the development of CNT composite materials in thermal
management applications. The melt mixing used here relies on the shearing forces generated
during the mixing of molten pitch to disperse the nanotubes(5)
. Nanotubes, however, are known
to increase the viscosity of fluids due to their large aspect ratio, high stiffness, and ability to form
entangled networks(6,7)
. An alternative method for dispersing the CNTs throughout the matrix,
ultrasonic stimulation uses high frequency sound waves to induce cavitation in low viscosity
fluids containing CNT agglomerates. The energy released upon cavity collapse breaks up the
CNT agglomerates dispersing the nanotubes into the carrier fluid(8,9)
. Pitch can be dissolved into
the CNT/solvent dispersion to produce a CNT/pitch composite material once the solvent has
been removed. In either case the quality of CNT dispersions has a profound impact on the
resulting composite properties. Initial property enhancements at low loadings, ~1wt% CNT often
do not continue or are reduced at higher loading(10,11)
. Agglomerates of CNTs can act as a stress
concentrating points and reduce the mechanical properties of the matrix(12)
. However, once
80
CPCPC 9 Final Report: Pitch/NT Foams II
6
dispersed in the continuous melt or solution, dispersions of CNTs can be processed via
conventional processing techniques such as fiber spinning.
Nanotube shortening through fracture and breakage is an unavoidable result in all dispersive
processes, a result of the forces acting on the CNTs. However, this effect may enhance the
dispersion of the CNTs as their ability to entangle is dependent on their aspect ratio. Conversely,
reduction of the CNT length may negatively impact their reinforcing capacity. A reduction in
MWNT length was previously found to accompany shear mixing, but CNT aspect ratios of >200
remained.
The orientation of the embedded CNTs relative to the direction of the applied load or thermal
gradient, as in all fiber composites, has a major influence on the properties that are measured.
The process of shear-mixing or ultrasonic stimulation results in random orientation of the CNTs
throughout the pitch matrix. Without the intervention of strong uni-directional shear, this random
orientation is preserved throughout further processing. However, a high degree of CNT
alignment within a pitch matrix can be achieved through the action of a shear field, by forcing
the composite material through a spinneret die and drawing down into fibers. Melt spun CNT
composite fibers have been shown to be very effective in aligning the CNTs with the direction of
flow, i.e., the fiber axis. However, the ability to sustain stable CNT-pitch composite fiber
spinning is largely dependent on the homogeneity of the dispersion. CNT agglomerates can
disrupt the flow as fiber attenuation is applied leading to breakage during processing, or in the
case of large agglomerates, complete blockage of the small diameter orifices through which the
fibers are extruded. Achieving large attenuations or draw ratios, which serve to orient the CNTs
with the fiber axis with resulting improvement in fiber properties, is primarily dependent on the
quality of the initial CNT dispersion. Thus, for the synthesis of carbon fibers it is crucial that
very high quality nanotube dispersion is achieved, approaching separation down to individual
nanotube level. Methods of preparing MWNT/pitch composite materials with these properties
have been developed and a significant amount of effort has been focused on the development of
MWNT/pitch precursor materials which contain an absolute minimum of MWNT agglomerates.
This work has built upon parallel studies investigating factors affecting dispersion and settling in
various liquid media.
Preparation of MWNT/Pitch Composite Materials
(i) Materials for carbon foam fabrication. For the preparation of carbon foams a simple melt
mixing procedure was used to disperse the carbon nanotubes (CNTs) into the pitch using a
Haake 3000P high shear mixer unit fitted with roller rotors. The measured softening points were
used to determine the temperature at which the unit was operated. The capacity of mixing
chamber is 310ml, although for optimum mixing conditions the unit is operated at a maximum
loading of 70%. Two batches at each condition were prepared and then combined to produce
sufficient material for the foaming tests. Composites were prepared from each pitch by
dispersing as-produced multiwall carbon nanotubes (MWNTs) into the pitches at concentrations
of 2.5, 1.0 and 0.5wt%. Previous work has shown that at the optimum pitch viscosity (controlled
by operating temperature and pitch characteristics) a residence time of 40minutes at a rotor speed
of 20rpm is adequate to produce a homogeneous composite material with well dispersed
MWNTs. Inspection of polished sections of the composite materials by optical microscopy has
shown that this is valid on the macro scale. However, it is most unlikely to produce complete
dispersion of the CNTs – there will still be many small agglomerations at the sub-μm level.
81

CPCPC 9 Final Report: Pitch/NT Foams II
7
Separate tests were performed to produce reference materials with 0% nanotubes under the same
operating conditions.
An additional experiment was conducted to prepare a composite material containing the surface
activated MWNTs. Koppers low volatile pitch was used into which 2.5wt% surface treated
nanotubes were dispersed. There was a noticeable disparity in the dispersion behavior for the two
types of nanotubes. Under virtually identical mixing conditions the torque required to achieve the
dispersion by melt shearing was significantly different for the two types of nanotubes, Figure 4.
The lower torque associated with dispersion of the acid treated MWNTs implies that they are
more readily separated than the as-prepared tubes and should therefore produce a composite
material with improved CNT dispersion.
0
10
20
30
40
50
60
70
2 3 4 5 6 7 8 9 10
Time, (min)
To
rq
ue, (N
m)
As-produced nanotubes
Acid treated nanotubes
Figure 4 Torque Generated by Dispersing MWNTs into a Common Pitch
(ii) Composite samples for carbon fiber synthesis. A more complex procedure was devised in
order to prepare nanotube/pitch composites for fiber synthesis. The CNTs were dispersed in a
solvent using ultrasonic excitation followed by accelerated sedimentation to remove any
remaining CNT agglomerates. The supernatant fraction was then mixed with a solution of the
pitch in the same solvent. In theory, recovery of the solvent from the dispersion would then yield
a MWNT/pitch composite material with the absolute minimum of agglomerates. Tests were
initiated using a petroleum derived pitch, A500 (softening point 260oC) in order to preserve the
coal derived pitch that was available for use once the procedure had been validated.
Tetrahydrofuran (THF) was selected as the solvent for the pitch rather than quinoline, as later
removal of the solvent would be more tenable with the lower boiling solvent. The effect of the
presence of a third phase, the small fraction of the pitch that was THF insoluble was accepted as
a necessary compromise in order to achieve the principal objective. A procedure was developed
that included dispersion of 0.25wt% MWNTs in THF by ultrasonic excitation for 5min using a
550w wand dismembrator (Fisher Scientific 550) at 20kHz and 250w power input, followed by
2h in an ultrasonic bath at 40kHz and then repeating the wand dismembrator application for a
further 5min. A centrifuge was then used to remove agglomerates by accelerated sedimentation.
82

CPCPC 9 Final Report: Pitch/NT Foams II
8
After centrifuging for 1hour at 10 the supernatant liquid had the same clarity as the starting
solvent; apparently there were no CNTs present in the supernatant either in a dispersed phase or
as agglomerates.
The use of a dispersant was therefore deemed to be a necessary adjunct to the procedure. A
dispersant used in the motor oil industry was selected for testing. Unwanted carbonaceous
material is produced as a byproduct of combustion within the confines of the internal combustion
engine. Some of this colloidal carbon is retained in the engine oil, where agglomeration can
occur increasing the viscosity of the oil and significantly diminishing its lubrication
performance. In time a harmful sludge can form to severely degrade the effectiveness of the
lubricant. To reduce this agglomeration dispersants are added to the oil; these adsorb on the
surface of the carbon particles thereby stabilizing them. A commonly used dispersant is a
polyamine (PAM) with a polyisobutylene succinimide (PIBSI) tail; the PAM adsorbs on the
surface of the carbon particles, while the PIBSI tail provides steric stabilization(13)
. These
function well for the purpose for which they were designed but their ability to disperse CNTs in
pitch is unknown. In addition, the temperature dependence of the efficacy of the stabilization of
the dispersant is an important issue in engineering motor oils and their performance over the
temperature range needed for spinning pitch into fiber could be crucial. PIBSI formulations are
closely guarded commercial secretes and samples are not readily available. However, a sample
solution of polyisobutylene succinimide (PIBSI) in naphtha was kindly donated by the ‘Specialty
Chemicals Division’ of BASF in Germany and has been used as a dispersant to stabilize
MWNT/THF mixtures.
The inclusion of a small amount of PIBSI to the MWNT/THF mixture was decisive –
supernatant dispersions of MWNTs in THF were produced using the procedure described above
with no evidence of CNT agglomeration. To produce sufficient MWNT/pitch composite material
for the carbon fiber synthesis tests four mixtures were prepared by adding 0.25wt% MWNTs to
~100g of THF containing PIBSI at a concentration of 4wt% relative to the weight of MWNTs
used. The ultrasonic dispersion technique was used. After centrifuging for 1 hour at 10 the
supernatant fraction contained only well dispersed MWNTs with few, if any agglomerates. The
four supernatant fractions were then combined and the CNT concentration determined by
thermal gravimetric analysis (TGA). For an accurate determination it was necessary to monitor
the weight loss from the sample immediately on transfer to the weighing pan and prior to weight
stabilization for the instrument to initiate the temperature ramp, as evaporation of the THF at
room temperature was significant. By this means the weight lost as a function of time was
determined, enabling calculation of the original composition of the supernatant dispersion by
extrapolation to zero time (before the TGA commenced logging the weight change of the
sample). The concentration of MWNTs in the supernatant fraction was determined as 0.05wt%,
compared to the 0.25wt% in the original mixture, showing that 80% of the CNTs were lost in the
sedimentation process, either as agglomerates or through capture by the migrating agglomerates.
Sufficient pitch was crushed such that when combined with the supernatant fraction it would
yield a MWNT/pitch composite containing 0.5wt% MWNTs, following removal of the carrier
solvent (THF). A finely divided sample of the pitch was dissolved in THF and mixed for 2h in an
ultrasonic bath. The solution was further mixed at 5000rpm for 10minutes using a Silverson high
shear mixer. This instrument is capable of milling any remaining particles of pitch to produce a
83

CPCPC 9 Final Report: Pitch/NT Foams II
9
pitch solution containing a dispersion of minute insoluble particles. The supernatant fraction of
the MWNT/THF dispersion was then combined with the pitch solution and the resulting
dispersion further mixed for 1 hour in an ultrasonic bath and then at 5000rpm for 10minutes
using the Silverson. The resulting dispersion was poured into a shallow glass dish floating in the
ultrasonic bath in order to evaporate most of the THF while inhibiting agglomeration of the
MWNTs. To remove the last of the THF from the pitch/MWNT dispersion the glass dish was
heated in an oven at 120ºC for 30minutes in a nitrogen atmosphere. Any residual volatiles,
including the naphtha originally in the PIBSI were removed by vacuum distillation at 200ºC and
2.5torr. Removal of the naphtha and THF was confirmed from TGA analysis of the resulting
MWNT/ pitch composite. This convoluted process was necessary to produce a MWNT/pitch
composite containing ~0.5wt% of MWNTs that was in a condition that had promise for
conversion to a MWNT/carbon composite fiber.
Preparation of Carbon Foams
For the successful fabrication of carbon foams it is crucial that the test material exhibit specific
characteristics in terms of the fluidity and dilatation rate in a defined temperature range. During
the foaming process the volatiles from the light fractions and decomposition products serve as
the blowing agent. However, the fluidity of the test material needs to be in a narrow well defined
range at a temperature where the onset of polymerization reactions promotes the stabilization of
bubble shape and structure, resulting in the formation of a stable foam(14)
. Unfortunately,
commercially available Koppers coal tar pitch and WVU SynPitch were not suitable for making
carbon foam directly because the average molecular weight is not high enough, and the fluidity is
too high for adequate foaming. Therefore, the pitches were modified to increase their molecular
weight and viscosity (decrease their fluidity). Heat treatment is a simple and effective way of
modifying the properties of pitches to meet the requirements of foaming. It can be used to
increase molecular weight and fluid viscosity mainly through polymerization and condensation
reactions but also via de-hydrogenation and de-volatilization. The heat treatment is performed
under an inert atmosphere (nitrogen) prior to initiation of the foaming operation.
Tests were performed on the pitches and MWNT/pitch composite materials prepared at CAER.
The pitches were weighed and transferred to aluminum pans for insertion into the pressure vessel
used for the foaming process. The vessel consisted of 200mm diameter stainless steel pipe with
flanges welded at both ends to enable closure of the reactor. Grafoil® gaskets were used as seals
between the end plates and the flanges with bolts tightened to a torque of 95Nm. The pressure
vessel was installed in a kiln and purged with nitrogen before the temperature was raised to
350°C at 4°C/min. The pitch was held at this temperature for 45minutes to reduce its fluidity.
Following this heat soak period the pressure was increased to 700kPa (100psi) using nitrogen
and the temperature further increased to 550°C at 4°C/min and held at this temperature for
1hour. At the end of this process the furnace was turned off and allowed to cool to room
temperature while the sample was retained under 700kPa (100psi) nitrogen. At completion the
carbon foam samples were carbonized by heating to 1000°C in nitrogen for 1 hour. The samples
were then allowed to cool before recovery for testing and characterization.
The electrical resistivity of the carbonized foams was measured by a method conforming to
ASTM C611-98 using the apparatus is shown in Figure 5.
84

CPCPC 9 Final Report: Pitch/NT Foams II
10
Figure 5 Apparatus used for Measuring Electrical Resistivity.
The resistivity of the carbonized foams was calculated from:
( ) ( )10001000IL
VA
L
AR ==
where,
= resistivity, (μ -m), R = resistance, ( )I
V= ,
V = electric potential between probes (volts), I = current passing through foam (amps),
A = sample cross-section area (mm2), L = distance between probes (mm)
The voltage drop (V) was measured between probes a known distance apart, L, with a current (I)
passing through the sample. The resistance, R, is the quotient of the voltage and the current and
A, is the cross-sectional area of the sample face through which the current is applied.
Compressive strength and modulus of samples cut from the carbon foams were also determined
using an Instron 5869 load frame.
Electromagnetic shielding measurements were conducted on carbon foam samples cut to the
specification required by ASTMS D4935. Measurements were made at room temperature over
the frequency range 100 to 1500MHz.
Carbon Fiber Synthesis
Samples of the parent pitch and the MWNT/pitch composite were crushed to provide a size
fraction (0.2 to 1.2mm) suitable as a feed to a Wayne single screw bench-scale extruder fitted
with a 6.2mm diameter screw and 0.3mm diameter x 1mm capillary die. Tests were conducted
to determine the conditions under which the samples could be successfully extruded to produce
a continuous thread. Feed size distribution and the temperature profile along the barrel and die
zone were crucial to this task. Samples were melt spun to produce continuous filament by
85

CPCPC 9 Final Report: Pitch/NT Foams II
11
forcing the molten pitch through the die. The extruded thread was attached to a wind-up drum
rotating at speeds up to 1700rpm (12m/s) to draw filament of 15 to 40μm diameter. In the
normal approach to fiber spinning it is essential to remove any entrained particulates by a solids
separation process as the ability to produce fine filaments from a pitch is very sensitive to the
rheological properties of the pitch. Here, a foreign material (the MWNT) was deliberately
introduced into the pitch matrix and unless well dispersed could pose additional problems to
successful fiber formation.
Tows of green fiber cut from the drum were thermally processed into carbon fiber. In an initial
step the ‘green’ pitch fibers were rendered infusible (stabilized) to prevent the fibers melting
during carbonization. The most practical and economic method of stabilization is by oxidation in
air at a progressively increasing temperature to about 300°C, resulting in weight increases of
typically 5 to 10%. To avoid fiber softening and deformation, the cross-linking reactions must
be initiated below the glass transition temperature, Tg typically about 50°C lower than the
measured softening temperature. As oxidative cross linking reactions proceed Tg and the
softening temperature both increase, and hence the reaction temperature can be raised until the
fibers are rendered infusible. For these ‘green’ fibers produced from a high softening pitch
stabilization was achieved by heating in air to 200ºC at 5ºC/min and then at 1ºC/min to 310ºC
with a dwell of 1 hour at this temperature. Once stabilized the fibers were carbonized by heating
in an inert atmosphere (nitrogen) to a temperature of 1000°C at a heating rate of 20oC/min and
held at this temperature for 1 hour. The yield and linear dimensions of the fibers were measured
after each stage to monitor the major changes that were occurring during stabilization and
carbonization.
The physical properties of the carbonized fibers, including diameter (by optical microscopy),
tensile strength, elastic modulus were then measured using a single fiber tensile testing method,
(ASTM D3379, D638M). A random selection of ten single filaments was made from the tow of
fiber. The filaments were center-line mounted on custom-made slotted paper frames using epoxy
resin. The frames were gripped so that the test specimen was aligned axially in the jaws of a
constant-speed movable crosshead test machine. The sides of the paper frames were then cut to
leave the fiber spanning the gap between the jaws. The fibers were stressed to failure at a
constant strain rate of 1mm/min.
Gauge lengths of 20, 30, 40 & 50mm were used in the tests in order to adjust the results for
system compliance. Carbon fibers can fail at very low imposed strain and hence small strains in
the load cell and mounting system need to be allowed for in order to determine the true elastic
modulus of the fiber. System compliance can be determined from the change in measured
compliance with the gauge length.
AE
LC
a
a.
= where Ca is the apparent compliance, Ea is the measured (apparent) elastic
modulus, L is the gauge length and A is the cross sectional area of the fiber. By plotting Ca
against L the system compliance Cs can be determined by extrapolation to L = 0, and the true
fiber compliance (C) and hence true modulus determined from sa CCC = and AE
LC
.=
86

CPCPC 9 Final Report: Pitch/NT Foams II
12
Results and Discussion
Carbon Foams
The foam samples were weighed between each processing step in order to monitor the loss of
volatile matter during foaming and thermal processing. The concentration of nanotubes in each
sample increased as a result of the loss of volatile matter during processing, Table 2
Wt loss during Initial Nanotube
Content Foaming Carbonization
Final Nanotube
Content Foam Precursor
(wt%) (wt%) (wt%) (wt%)
0.0 14.4 4.1 0.0
0.5 12.0 4.4 0.6
1.0 12.4 4.4 1.2 Koppers CTP
2.5 14.2 3.8 3.2
0.0 28.9 5.0 0.0
0.5 28.6 5.0 0.8
1.0 28.8 5.2 1.5 WVU Synpitch
2.5 31.4 6.2 3.9
0.0 ND ND ND
2.5* 28.9 4.5 3.7 Koppers Low Vol Pitch
2.5
# 20.3 4.3 3.3
* untreated nanotubes, # HNO3 treated nanotubes ND = Not determined
Table 2 Weight loss During Foaming and Thermal Processing
The high softening point coal tar pitch from Koppers (Koppers Low Vol) was only foamed with
nanotubes in the pitch. The sample labeled “untreated nanotubes” contains the same type of
untreated nanotubes as used in the previous experiments. The other low volatility sample from
Koppers includes nanotubes that were surface activated in nitric acid before they were
introduced into the pitch.
Figure 6 Scanning Electron Microscope at West Virginia University.
87

CPCPC 9 Final Report: Pitch/NT Foams II
13
The adhesion between the nanotubes and the pitch matrix is critical to the enhancement of the
foam properties. Otherwise, the nanotubes become discontinuities within the foam matrix and
serve as physical weaknesses within the structure. Scanning Electron Microscopy was used to
visually inspect whether the nanotubes bond well with the foam matrix. The Hitachi S-4700
field emission SEM used at West Virginia University is shown in Figure 6.
SEM images were taken before and after carbonization to observe if thermal expansion created a
substantial problem with the foam/nanotube adhesion. Figure 7 shows SEM micrographs of both
green and carbonized Koppers Coal Tar Pitch foam with 0.5 % wt nanotube addition.
Figure 7 Koppers Coal Tar Pitch Foam (0.5wt%MWNT), (a) Green (b) Carbonized
Inspection of the SEM micrographs suggests that there is an interaction between the foam matrix
and the dispersed nanotubes. This is apparent in both images where wetting of the CNTs by the
matrix at the base of the nanotubes can be seen and where the foam matrix seems to be drawn up
the nanotube wall. This observation suggests that the foam matrix is bonding to the nanotubes
and therefore some enhancement of the foam properties should be observed.
Initial Nanotube
Content Resistivity Bulk Density
Foam Precursor
(wt%) (μ Ohm-m) (g/cm3)
0.0 366 0.47
0.5 328 0.40
1.0 359 0.38 Koppers CTP
2.5 277 0.44
0.0 257 0.41
0.5 250 0.45
1.0 333 0.37 WVU Synpitch
2.5 354 0.53
0.0 ND ND
2.5* 241 0.52 Koppers Low Vol Pitch
2.5
# 229 0.54
* untreated nanotubes, # HNO3 treated nanotubes ND = not determined
Table 3 Resistivity of Foam Samples
(a)
(b)
88

CPCPC 9 Final Report: Pitch/NT Foams II
14
All Data
200
250
300
350
400
0.30 0.35 0.40 0.45 0.50 0.55 0.60
Bulk Density (g/ml)
Re
sis
tiv
ity
(μ
m)
All Data
0.20
0.25
0.30
0.35
0.40
0.45
0.50
0.55
0.60
0 0.5 1 1.5 2 2.5
MWNT content (%)
Bu
lk D
en
sit
y(g
/ml)
Carbonization significantly changes the properties of the foams by removing volatile matter to
fix the carbon structure, resulting in increases in strength and electrical conductivity (lower
resistivity). The resistivity measurements for the foam samples are summarized in Table 3.
The results from the resistivity measurements are somewhat confusing. For the foams fabricated
from the Koppers coal tar pitch containing nanotubes there is apparently a small beneficial
decrease in resistivity with increasing nanotube content. However, the opposite trend is observed
for the WVU Synpitch. The problem of interpretation of the data is that any small changes in
resistivity due to the inclusion of CNTs in the pitch precursors is masked by the dominating
influence that changes in foam bulk density has on the measured values of the resistivity. With
the exception of two outliers in the complete data set there is a strong correlation between
resistivity and bulk density, the resistivity declining as the bulk density increases. Further there is
no correlation between bulk density and CNT concentration. Thus, under the conditions studied
here there is no evidence for improvement in electrical conductivity of the carbon foams due to
the inclusion of the MWNTs into the pitch matrix.
Figure 8 Electrical Resistivity & Bulk Density of Carbon Foams
Inferences can be drawn by studying the SEM micrographs of the carbonized Synpitch foams.
Figure 9 shows that the matrix of the foam becomes more ordered than the coal tar pitches. It is
apparent from Figure 9a that the Synpitch matrix forms plate-like structures, which is more
conducive to forming graphite at high temperature. Unfortunately, the interfacial bonding
between the nanotubes and the matrix does not appear to have been sustained during the foaming
process and particularly carbonization, Figure 9b. The matrix has not bonded with the
nanotubes, instead holes are visible where the nanotubes have pulled out.
89

CPCPC 9 Final Report: Pitch/NT Foams II
15
(b) (a)
Figure 9 Carbonized WVU Synpitch Foam, (a) 0wt% MWNT, (b) 2.5wt% MWNT.
The Koppers high softening point pitch with the nanotube additions did not seem to show much
difference between the treated nanotubes and the untreated nanotubes. The SEM micrographs in
Figure 10 show that there visually does not seem to be much, if any, difference in the matrix-
nanotube interactions between the two surface treatments.
Figure 10 HSP Koppers CTP with (a) 2.5wt% HNO3 MWNT, (b) 2.5wt% MWNT.
Compression testing was performed on the foams using an Instron 5869 load frame to determine
if the nanotubes increased the mechanical compressive strength of the materials, Table 4. The
method(15)
developed by Carpenter at West Virginia University was employed to complete these
measurements since there is no current ASTM method for compression testing for carbon foams.
Unfortunately, there was not enough material to run more than one test per sample and two of the
original foam samples (Koppers CTP 0.0wt% and Synpitch 2.5wt%) were not large enough for
the sample preparation used for the compression test.
(b) (a)
90
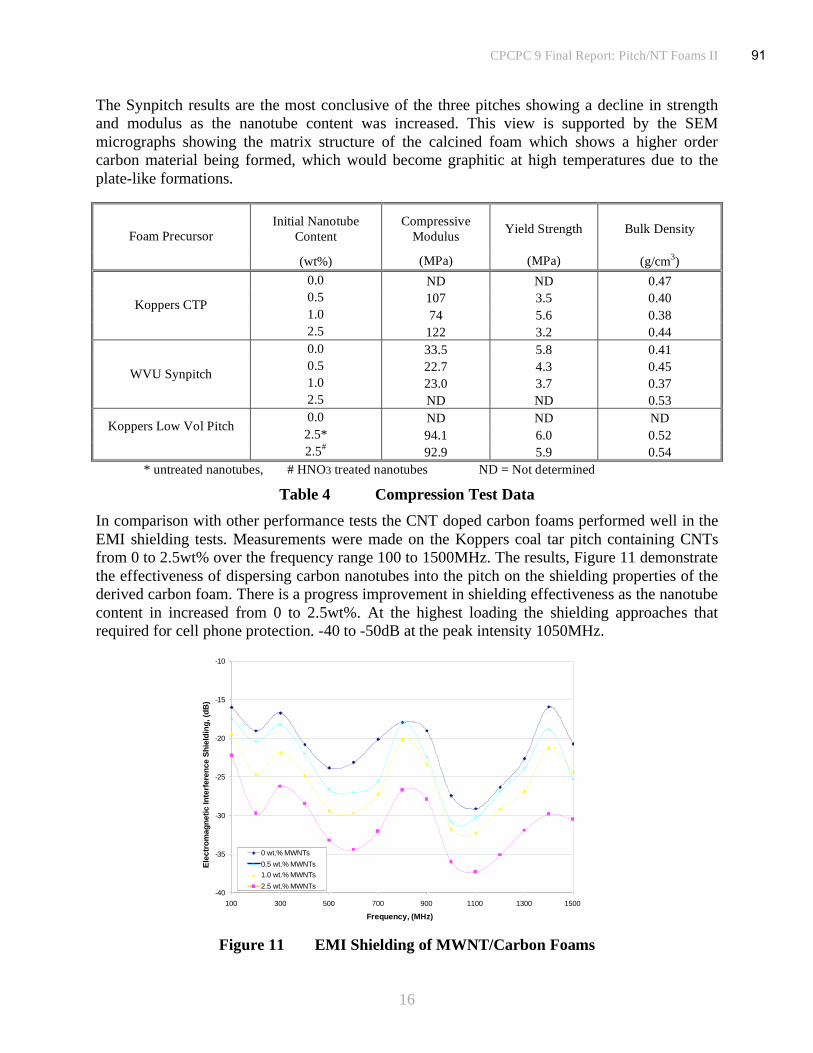
CPCPC 9 Final Report: Pitch/NT Foams II
16
The Synpitch results are the most conclusive of the three pitches showing a decline in strength
and modulus as the nanotube content was increased. This view is supported by the SEM
micrographs showing the matrix structure of the calcined foam which shows a higher order
carbon material being formed, which would become graphitic at high temperatures due to the
plate-like formations.
Initial Nanotube
Content
Compressive
Modulus Yield Strength Bulk Density
Foam Precursor
(wt%) (MPa) (MPa) (g/cm3)
0.0 ND ND 0.47
0.5 107 3.5 0.40
1.0 74 5.6 0.38 Koppers CTP
2.5 122 3.2 0.44
0.0 33.5 5.8 0.41
0.5 22.7 4.3 0.45
1.0 23.0 3.7 0.37 WVU Synpitch
2.5 ND ND 0.53
0.0 ND ND ND
2.5* 94.1 6.0 0.52 Koppers Low Vol Pitch
2.5
# 92.9 5.9 0.54
* untreated nanotubes, # HNO3 treated nanotubes ND = Not determined
Table 4 Compression Test Data
In comparison with other performance tests the CNT doped carbon foams performed well in the
EMI shielding tests. Measurements were made on the Koppers coal tar pitch containing CNTs
from 0 to 2.5wt% over the frequency range 100 to 1500MHz. The results, Figure 11 demonstrate
the effectiveness of dispersing carbon nanotubes into the pitch on the shielding properties of the
derived carbon foam. There is a progress improvement in shielding effectiveness as the nanotube
content in increased from 0 to 2.5wt%. At the highest loading the shielding approaches that
required for cell phone protection. -40 to -50dB at the peak intensity 1050MHz.
-40
-35
-30
-25
-20
-15
-10
100 300 500 700 900 1100 1300 1500
Frequency, (MHz)
Ele
ctro
mag
netic
In
terferen
ce S
hie
ldin
g, (d
B)
0 wt.% MWNTs
0.5 wt.% MWNTs
1.0 wt.% MWNTs
2.5 wt.% MWNTs
Figure 11 EMI Shielding of MWNT/Carbon Foams
91

CPCPC 9 Final Report: Pitch/NT Foams II
17
0
100
200
300
400
500
600
700
0 10 20 30 40 50 60 70
Fiber Diameter (μ
m)
Ten
sile S
tren
gth
(M
Pa)
Pitch + 0.5wt% MWNT
Parent Pitch
0
10
20
30
40
50
60
70
80
90
100
0 10 20 30 40 50 60 70 80
Fiber Diameter (μ
m)
Tru
e E
lastic
Mo
du
lus (
MP
a)
Pitch + 0.5wt% MWNT
Parent Pitch
Carbon Fibers
The complexity of the methods developed for preparing a pitch containing 0.5wt% CNTs with an
absolute minimum of agglomerates surprisingly did not hinder the fabrication of carbon fibers.
Extrusion of the pitch through a narrow die was achieved with few problems, producing ‘green’
fibers with diameters in the range 15 to 40μm. Fiber diameter was controlled by varying the
speed of the wind-up spool in the range 20 to70% of maximum. These were successfully
converted to carbon fibers by the thermal program defined above and characterized by
measurement of their physical properties, (diameter, tensile strength, elastic modulus and strain
energy to break). Unfortunately, the results were disappointing. There was no improvement in
the physical properties compared with fibers prepared from the parent pitch. Tensile strengths
increased as fiber diameter decreased but within the range of values previously determined for
the carbon fibers derived from the parent pitch, Figure 12. Similarly the elastic modulus of the
carbon fibers fabricated from the MWNT/pitch composite were indistinguishable from those
produced from the untreated pitch.
Figure 12 Tensile Strength & Elastic Modulus of MWNT/Carbon Fibers
The elastic modulus measurements have been adjusted to remove errors introduced by system
compliance. This was achieved by measurement of fiber properties using samples with a wide
range of gauge lengths, 20 to 50mm. The true elastic strain was approximately half of the
measured value and the modulus therefore twice the measured value. Although these
experiments have not produced the desired improvement in the physical properties of the fibers
the work has shown how an agglomerate-free dispersion of carbon nanotubes in a pitch can be
produced and could be the first step towards generating high performance fibers. It may be
necessary to use the embedded carbon nanotubes as templates to build a graphitic structure from
within the fiber by thermal processing at much higher temperatures (>2000oC) and
simultaneously imposing strain to retain the CNT alignment with the fiber axis. However, time
did not allow for this theory to be tested under the current program.
92

CPCPC 9 Final Report: Pitch/NT Foams II
18
Conclusions
Multiwall carbon nanotubes (MWNTs) were dispersed into three discrete samples of isotropic
pitch at concentrations of 0.5, 1.0 and 2.5wt% by a conventional melt mixing technique.
Reference samples of pitch containing no MWNTs were also prepared under the same
conditions. One composite was also prepared using surface activated MWNTs at a concentration
of 2.5wt%. The nanotubes were refluxed in concentrated nitric acid to promote surface
interaction between the MWNTs and the pitch matrix. These composites materials were
converted into carbon foams by a precisely controlled heating and pressure regulated process,
followed by carbonization to 1000oC.
Characterization of the Koppers Coal Tar Pitch showed some small improvement in physical
properties due to the inclusion of the MWNTs, but little significance could be drawn as the effect
was masked by the dominating influence of other variables. For example the small decrease in
resistivity of the carbon foam (or increase in conductivity) was certainly measurable but was
masked by changes in bulk density which had a more significant affect on resistivity. The
inclusion of MWNTs in the pitch apparently had no effect on the mechanical properties of the
derived carbon foam. However, other factors can affect the mechanical strength such as bulk
density interior bulk matrix and precision of sample preparation. Ideally, the dimensional
tolerance of the samples should be to less than 0.25mm. However, this was not possible with the
equipment and methods that were available and could have an adverse affect on the
characterization measurements. In contrast, measurement of the electromagnetic interference
shielding gave very encouraging results with a progressive increase in the shielding performance
as the concentration of MWNTs in the carbon foam was increased from 0 to 2.5wt%. At the peak
frequency, 1050MHz the shielding achieved with carbon foam containing the 2.5wt% MWNTs
approached that required for cell phone protection. -40 to -50dB.
There was no significant difference in the results from tests with the Koppers high softening
point pitch containing surface activated MWNTs and the carbon foam containing as-produced
nanotubes. The electrical resistivity, compressive modulus and the yield stress values were all
similar. Analysis of the SEM images provides no evidence to prove otherwise. It appears that
the untreated nanotubes adhere to the foam matrix just as well as the HNO3 treated nanotubes.
A complex method for preparing MWNT/pitch composite materials suitable for the synthesis of
high performance carbon fibers has been developed. The technique was based on dispersion of
the MWNTs in a carrier solvent using ultrasonic excitation and a PIBSI dispersing agent
followed by accelerated sedimentation to produce a high quality stable dispersion containing an
absolute minimum of nanotube agglomerates. The procedure was completed by mixing a
solution of the pitch in the same solvent with the supernatent fraction and recovering the solvent
by evaporation and distillation. This series of steps enabled the required MWNT/pitch composite
material to be derived. The synthesis of carbon fibers from the composite followed established
methods with carbonization to 1000oC. Unfortunately, measurement of the physical properties of
the fibers produced disappointing results with no improvement in tensile strength or elastic
modulus of the fibers compared with measurement of the fibers derived from the parent pitch
alone. It may be necessary to thermally promote aligned graphitic structure within the composite
fibers by heating to a temperature of >2000oC while imposing strain to retain alignment with the
fiber axis.
93

CPCPC 9 Final Report: Pitch/NT Foams II
19
References
(1) “Nanotube Enhancement of Coal Extract Pitches: Fibers and Foams”, CPCPC Report No
2480-UK-DOE-0350, August 2004.
(2) Andrews R, Jacques D, Rao A.M, Derbyshire F, Qian D, Fan X, Dickey E.C & Chen J,
“Continuous production of aligned carbon nanotubes: A step closer to commercial realization”.
Chemical Physics Letters 1999, 303, 467-474.
(3) Andrews R, Jacques D, Qian D & Dickey E.C, “Purification and Structural Annealing of
Multiwalled Carbon Nanotubes at Graphitization Temperatures”. Carbon 2001, 39, 1681-1687.
(4) “Technical and Economic Assessment of Mild Coal Extraction”, CPCPC Report No 2691-
UK-DOE-1874, October 2005.
(5) Gorga R.E & Cohen R.E, “Toughness enhancements in poly(methyl methacrylate) by
addition of oriented multiwall carbon nanotubes”. J. Polym. Sci.: Part B: Polym. Phys. 42,
2690–2702 (2004).
(6) Advani S.G & Fan Z, “Materials Processing and Design: Modeling, Simulation, and
Applications”, NUMIFORM 2004 (eds. Ghosh, S., Castro, J. C. & Lee, J. K.) 1619–1623
(American Institute of Physics, 2004).
(7) Shaffer M.S.P & Windle A.H, “Analogies between polymer solutions and carbon nanotube
dispersions. Macromolecules” 32, 6864–6866, (1999).
(8) Weisenberger, M.C, Grulke E.A, Jacques D, Rantell T. & Andrews R. “Enhanced
mechanical properties of polyacrylonitrile/ multiwall carbon nanotube composite fibers”. J.
Nanosci. Nanotechnol. 3, 535–539, (2003).
(9) Ding W. et al., “Direct observation of polymer sheathing in carbon nanotube-polycarbonate
composites”. NanoLett. 3, 1593–1597, (2003).
(10) Zeng J, Saltysiak B, Johnson, W.S, Schiraldi D.A & Kumar S, “Processing and properties
of poly(methyl methacrylate)/carbon nano fiber composites”. Compos. Part B: Eng. 35, 173–178,
(2004).
(11) Fisher F.T, Bradshaw R.D & Brinson L.C, “Fiber waviness in nanotube-reinforced polymer
composites-I: Modulus predictions using effective nanotube properties”. Compos. Sci. Technol.
63, 1689–1703, (2003).
(12) Hammel, E. et al, “Carbon nanofibres for composite applications”, Carbon 42, 1153–1158,
(2004).
(13) Kearns J.C. & Shambaugh, R.L, “Polypropylene fibers reinforced with carbon nanotubes”.
J. Appl. Polym. Sci. 86, 2079–2084, (2002).
(14) Chen C, Kennel E.B, Stiller A.H, Stansberry P.G & Zondlo J.W. “Carbon Foam Derived
from Various Precursors”, Carbon 44, (2006), 1535-154.
(15) Carpenter, S.P, “Development of a Constrained Piston Method for Compression Testing of
Carbon Foams”, Master's Thesis, West Virginia University, (2005).
94

NANOCARBONS FROM ANTHRACITE COAL
Final Report
Start Date: March 1, 2005
End Date: June 30, 2006
Principle Investigator: Dr. Caroline E. Burgess Clifford
Co-Principal Investigator: Dr. Angela Lueking
Contributors: Apurba Sakti. Puja Jain, Humberto Guitierrez, Dania Fonseca Alvarez
Report Issue: July 31, 2006
Internal Agreement No. 2875-TPSU-DOE-1874,
For Award No.: DE-FC26-03NT41874
The Energy Institute
Penn State University
C205 Coal Utilization Laboratory
University Park PA 16802
95

DISCLAIMER
This report was prepared as an account of work sponsored by an agency of the UnitedStates Government. Neither the United States Government nor any agency thereof, norany of their employees, makes any warranty, express or implied, or assumes any legalliability or responsibility for the accuracy, completeness, or usefulness of anyinformation, apparatus, product, or process disclosed, or represents that its use would notinfringe privately owned rights. Reference herein to any specific commercial product,process, or service by trade name, trademark, manufacture, or otherwise does notnecessarily constitute or imply its endorsement, recommendation, or favoring by theUnited States Government or any agency thereof. The views and opinions of authorsexpressed herein do not necessarily state of reflect those of the United States Governmentor any agency thereof.
96

iii
ABSTRACT
Anthracite can be processed to make several different types of carbon materials. Based on previous research of thermally annealed ball-milled Buck Mountain anthracite coal, SEM micrographs of the samples indicated carbon-based tubes. Initially it was thought that these tubes could be multi-wall or single-wall carbon nanotubes, but the SEM data were not conclusive. The goal of this project was to more thoroughly characterize the products from the process in order to begin to understand the reaction process.
In this final report, we report information with regards to product characterization and how it has benefited identification of various nanocarbons in ball milled anthracite coal. Buck Mountain anthracite coal was milled, with and without cyclohexene, and was thermally annealed at 1400°C. Several carbons have been identified in our samples, particularly the sample milled in cyclohexene and thermally annealed. Several characterization techniques were used to identify these structures, including X-ray diffraction spectroscopy, temperature programmed oxidation, temperature programmed desorption, Raman spectroscopy, scanning electron microscopy, and transmission electron microscopy. While nanotubes have not been specifically identified, we have identified nanographene ribbons, graphitic carbon, precursors to nanocrystalline diamond (NCD), NCD, hydrogen, and metal alloys of Fe, C, and Si. We believe that milling in cyclohexene is causing the anthracite to react with cyclohexene, causing some sp2 carbon to become sp3 and forming “seed” crystals for NCD formation. Some of the carbon becomes more amorphous upon milling, but after thermal annealing, the samples become more crystalline and even graphitic in some cases, with greater formation of NCD. Most interesting is the production of hydrogen during the thermal annealing. We also believe that differences in the graphitic nature of the thermally annealed samples may be due to structural changes caused by the milling.
97

iv
TABLE OF CONTENTS:
DISCLAIMER ii
ABSTRACT iii
INTRODUCTION 1
EXECUTIVE SUMMARY 2
EXPERIMENTAL 2
Synthesis of Samples – Ball Milling and Heat Treatment 2
Characterization of Samples 3
RESULTS AND DISCUSSION 4
A. Graphitization behavior of milled anthracite 5
B. Synthesis of Nanocrytalline Diamond, Bucky Diamond,
From Milled Anthracite Coal 11
C. Combined Hydrogen Production and Storage with
Subsequent Carbon Crystallization 17
CONCLUSIONS 21
ACKNOWLEDGMENTS 22
REFERENCES 23
TABLES AND FIGURES 28
98

1
INTRODUCTION
Anthracite coal is an abundant and inexpensive natural resource. Whereas initially its main use was for home heating, its carbon content is high and could be useful to produce premium carbon materials. Most anthracites contain 92–98% carbon, virtually all of which is present as aromatic carbon in large polycyclic sheets.1-5 These sheets may contain thirty or more fused aromatic rings,1,2 but unlike graphite, anthracite is a non-graphitic carbon (although highly ordered carbon) that may graphitize upon thermal annealing. For many years, researchers at Penn State have been exploring modifying the structure of anthracite to produce value-added marketable products. The range of projects includes the use of anthracite in synthetic graphite production,3-9 the possibility of making an anthracite-based pitch,9,10 and processes to produce activated carbons and other materials.9,11-17 Along with these materials, anthracite has been explored as a carbon precursor for hydrogen storage materials.18 Ball milling of carbon materials has been used as a strategy to produce carbon-based hydrogen storage materials,19-22 and carbon-metal hydrogen storage composites.23-37 The performance of ball milled carbon composites is generally a function of ball-milling time, the presence of a solvent during processing,23-27 and the breakdown of the graphitic structure.25, 31, 38 Graphitic carbon becomes rapidly amorphitized during milling, evidenced by a rapid decrease in the characteristic graphite 002 (2θ=26º) reflection in X-ray diffraction (XRD).39 It is thought that any chemical transformations that occur in a ball milling process are due to a liquefaction at the interface to facilitate reaction,40, 41 although this is not generally agreed upon. The initial objectives of this research were to explore the substitution of highly graphitic anthracite coal into both carbon- and carbon-metal composites formed via a high energy ball milling process.18 The use of anthracite carbon is based on its similarity to graphite and polycondensed ring compounds (e.g., anthracene, perylene and chrysene). Anthracite coals are known to be somewhat crystalline in nature compared to lower rank coals and thus have similarities to graphite in terms of structure and thermodynamics, yet the substitution of heteroatoms and certain cross-linkages within anthracite make anthracite slightly less stable than true graphite. In our analysis of these ball-milled anthracite products we have observed the formation of several carbonaceous compounds, including nanographene ribbons, graphitic carbon, metal composites and nanocrytalline diamond (NCD). We also observed hydrogen produced during the formation of these composites.
In this final report, we are reporting the results of characterization of ball milling the coal (with and without cyclohexene). We have identified the following in our samples: (1) before thermal annealing, we observe unusual XRD, Raman spectra and temperature programmed oxidation (TPO) as well as incorporation of cyclohexene into the structure, and (2) after thermal annealing, we observe tubular structures, graphitic carbon, nanographene ribbons, and NCD. Initially, from SEM, we thought we might be forming multi-wall nanotubes (MWNT) or single-wall nanotubes (SWNTs), but with further characterization, we have not been able to establish that these samples contain MWNTs or SWNTs. The work will be discussed with respect to four projects that took place simultaneously: (1) observation of the graphitizing behavior to monitor structural changes,42 (2) observation of the NCD formation, (3) observation of the hydrogen production as NCD forms, and (4) observations of changes to the solvent interaction before and after milling.
99

2
EXECUTIVE SUMMARY
The major accomplishments in the project have been to identify most of the major products in the samples produced from the ball-milling of Buck Mountain coal with and without cyclohexene and after thermally annealing the sample at 1400°C. In a separate CPCPC project, we are varying the process conditions to determine of how the milling and thermal treatments affect the coal structure.
Several carbons have been identified in our samples, particularly the sample milled in cyclohexene and thermally annealed. While nanotubes have not been specifically identified, we have identified nanographene ribbons, graphitic carbon, precursors to NCD, NCD, hydrogen, and metal alloys of Fe, C, and Si. We believe that milling in cyclohexene is causing the anthracite to react with cyclohexene, causing some sp2 carbon to become sp3 and forming “seed” crystals for NCD formation. Some of the carbon becomes more amorphous upon milling, but after thermal annealing, the samples become more crystalline and even graphitic in some cases. Most interesting is the production of hydrogen during the thermal annealing. We also believe that differences in the graphitic nature of the thermally annealed samples may be due to structural changes caused by the milling. EXPERIMENTAL
Synthesis of Samples – Materials, Ball Milling and Heat Treatment:
The coal used is PSOC-1468, from the Penn State University coal sample bank. The coal is an anthracite coal from the Buck Mountain seam, bottom of the Llewellyn formation, collected from Luzerne Co., PA, near Eckley. Henceforth, it will be labeled as BMT. It is a fairly low ash content coal, with low volatile matter content and high fixed carbon content. Details of the ultimate and proximate analysis are included in Table 1. Cyclohexene (99 % purity) was purchased from JT Baker. In the literature, it was reported that samples of graphite needed to be ball-milled for 150 h or longer in order to obtain carbon nanotubes during heat treatment.43, 44 BMT was milled both under dry conditions and in the presence of a cyclohexene solvent as a wetting agent. All milling occurred with an argon purge to minimize oxidation effects and water contamination during processing. Ball milling was done on a Fritsch Pulveristte LC-106A at 400 rpm, using 6 g of BMT and 20 mL of cyclohexene solvent in the 250 mL bowl and 15 balls (each 15 mm diameter) in the mill. The grinding bowl and balls were made of 316 Stainless Steel. The coal was ball-milled for 80 h, with and without cyclohexene, and denoted as BMT-dry and BMT-wet, respectively. The ball milling time was selected based on work with a different focus, in order to create defects within the anthracite structure.18, 19, 25
Ball-milled samples were then heated in a tube furnace using a 2.5°C/min heating rate, holding at 1400°C for 3 h, and under 1 L/min of argon. The 1400°C annealing temperature was selected based on previous reports of annealing ball-milled graphite to form multi-wall nanotubes (MWNTs).43,44 The thermally-annealed samples are labeled BMT-dry-HT and BMT-wet-HT, respectively. Selected samples were purified using: 4 M HCl for 24 h at room temperature, extensive washing with deionized water, a 10 M NaOH treatment for 24 h at room temperature followed by extensive washing with deionized water. A schematic of the work done on this project is shown in Figure 1.
100

3
Modifications to Synthesis:
Removal of Volatile Components After Ball-Milling: Approximately 0.5 g of BMT-wet was ground in a mortar and pestle and vacuum treated at 80-100°C for 24 h.
Soxthlet extraction was carried out on ~1 g of BMT-wet, using ~250 mL of dichloromethane for 24 h. The liquid sample was removed from the extractor, the solvent was removed by rotoevaporation and blowing nitrogen through the sample. The liquid was analyzed by gas chromatography/mass spectrometry (GC/MS) using a temperature program of a temperature program of 40 °C for 5 min, with a ramp rate of 4°C/min to 320°C for 15 min. The remaining solid matrix was analyzed by pyrolysis GC/MS, using 710°C for the pyrolysis temperature and a temperature program of 40 °C for 5 min, with a ramp rate of 4°C/min to 320°C for 10 min.
Modification to Cyclohexene to Coal Ratio: During ball milling, the solvent concentration was varied by keeping the amount of coal constant (6 g) and using 10 mL, 20 mL, and 40 mL of cyclohexene.
Characterization of Samples:
Electron Spectroscopy and Analysis:
Several electron spectroscopy methods were used to examine the ball-milled samples. In previous work, scanning electron microscopy (SEM) was used for analysis of ball-milled coal.18 Samples were analyzed on a Hitachi S 3000-H, under high vacuum and 20 eV. Transmission electron microscopy was done on a JEOL 2020F 200kV field emission transmission electron microscope (TEM) at the Materials Research Institute at the Penn State University for more detailed analysis of selected products. Temperature Programmed Oxidation
Temperature programmed oxidation (TPO) is a technique used to determine carbon morphology and may be helpful in distinguishing between carbons that are graphite (crystalline), amorphous, nanofiber, or nanotubes, as each carbon may have distinctive temperatures of burn-off. TPO could also be used to purify samples that could have more than one type of carbon, along with other methods of purification processes.45-47 Several samples were used as standards to distinguish potential types of carbons in produced samples. Samples were analyzed on a Perkin Elmer 7 thermogravimetric analyzer (TGA) using purified air as the oxidant and an initial heating rate of 10°C/min. All graphs of TPO are of the derivative of the mass versus the temperature in order to enhance areas of oxidation.
Temperature Programmed Desorption Coupled With Mass Spectrometer
Temperature programmed desorption (TPD) is a thermal method used to observe gases evolving from a sample, with the mass spectrometer the method to identify the gases evolving. This technique was mainly used to observe the loss of hydrogen from our samples. The instrument used was a TGA 2050 coupled with a Pfeiffer Thermostar D-35614 mass spectrometer. The sample was heated under argon, although the system still may have contained very small quantities of water that might have affected the outcome of results. A heating rate of 10°C/min from 30-1000°C was used.
101
4
Raman Spectroscopy
Raman spectroscopy was performed using an instrument in the Chemistry Department at Penn State, under the supervision of Dr. John Badding and Jacob Calkins. Raman spectroscopy was done on a Renishaw inVia spectrometer with a confocal Leica DM LM microscope and a Peltier cooled RenCam dd-CCD. It is currently equipped with both a green (514 nm) Ar ion and a red (633 nm) HeNe laser. The software for the instrument is WiRE 2.0. Additional spectra were obtained using UV Raman with a laser at 257 nm wavelength. XRD
X-Ray diffraction (XRD) was performed on raw and thermally annealed samples in order to monitor changes in both the carbon structure and metals inherent in the coal. XRD measurements were taken with a Scintag Model X2 θ/θ goniometer with Cu radiation Ka1/Ka2 with Si(Li) Peltier detector operated at 30 kV and 50 mA. Proximate and Ultimate Analyses
Proximate analysis was done on a Thermogravimetric Analyzer LECO MAC 400, and was used to determine the ash and volatile content of the coal and products. The moisture temperature was set at 105ºC, the temperature for measurement of volatiles was wet at 950 ºC, and the ash temperature was set at 750 ºC. Neutron activation analysis (NAA) was done using the following procedure. The sample was placed near the reactor core so that could be bombarded by a beam of neutrons. After a predetermined amount of time, the sample was removed and taken to the counting laboratory. Measurements were taken using a multi-channel analyzer HPGe detector system and the unknown elements were determined using the gamma ray energies detected. A comparative method was used to convert the output of the analyzer, which is in gamma ray energies, to parts per million (ppm) or weight percent. The coal samples were transferred from the sealed packaging to clean Pyrex evaporating bowls and dried in an oven for approximately 2 hours; the samples were then placed into clean, pre-weighed polyethylene vials and the weight of each sample determined. Depending on the sample, the irradiation time used was 30 seconds or 1 h, the reactor power was set at 25, 50, or 200 kW, and the reactor flux was set at 1.7 x 10¹² -8.5x10¹¹ n/cm2-sec. The decay time was 10 minutes or 7 days and the count time was 2, 4, or 167 minutes. RESULTS AND DISCUSSION
As mentioned in the introduction, anthracite has been explored as a carbon precursor for hydrogen storage materials;18 we observed carbon tubes in SEM micrographs of BMT-wet-HT. Based on these results, further work was done to characterize the produced samples. The work will be discussed in four different parts.
102
5
1. Graphitization behavior of milled anthracite: Contributions by C.E. Burgess-Clifford,
D.L. Narayanan, D.T. Van Essendelft, P. Jain, A. Sakti, and A.D. Lueking (see
acknowledgements)
Background
It has been known for many years that, while anthracite is a non-graphitic carbon, anthracites will graphitize.2-17,48-60 Most researchers have suggested that two factors must be present for anthracite to graphitize: 1) the carbon structure in the anthracite, while non- graphitic, must have some sort of alignment to allow for graphitization and 2) certain minerals must be present to catalyze graphitization of anthracite by carbide formation and decompostion. Franklin first classified anthracite as a special non-graphitic carbon that would graphitize upon thermal annealing at temperatures of 1700-2500°C.48,49 As suggested in her work, a non-graphitic carbon that can graphitize must have an inherent structure that will be amenable to graphitization, more alignment than a non-graphitizing carbon will have. Figure 2 represents the basic differences in these structures, where 2A represents the structure of a graphitizing (but non-graphitic) carbon and 2B represents the structure of a non-graphitizing carbon, showing significantly more cross-links that occur between layers. Oberlin et al. built upon this theory suggesting that how well anthracite graphitizes depends mainly on pore shape (anthracite with spherical pores would not graphitize as well as an anthracite with flattened pores) and possibly on the catalytic graphitization (carbide crystal formation and decomposition).50-52 Bustin et al.58 and Cohaut et al.59 supported the pore shape theory by examining the pore shape and microtexture of anthracites. They found that the weakly graphitizing coals were isotropic with spherical pores and the strongly graphitizing coals were anisotropic with flattened pores. Evans et al. suggested an alternative theory, that minerals may play the dominant role in graphite formation from anthracite, using XRD and transmission electron microscopy (TEM) to monitor the onset of graphitization at 1400°C.60 Recent work by Pappano et al. and González et al. supported the catalysis theory.3-5,9,55-57 They both report that one of the critical factors in anthracite graphitizing was related to mineral matter content in the coal. 3-5,9,55-57 González et al. reported the minerals of illite (clay), ankerite (iron carbonate), and siderite (iron carbonate) were the major contributors to graphite formation.57 In particular, Pappano et al. reported the silica, iron, and titanium in minerals of the raw coal would form carbides during heating.3-5,9 Pappano’s work showed that the best graphitizing anthracite coal out of four coals had a higher percentage of volatile matter (hence a greater amount of “fragmented” carbon, ~10% of the organic matter) and a high mineral matter content, particularly silica (18%). They showed that addition of the minerals to a non-graphitizing coal allowed it to graphitize, and that removal of the minerals from a strongly graphitizing coal caused it to become non-graphitizing. They were not able to correlate how the pore shape may relate to graphitization, but thought an important factor was that anthracite coals have the basic structural units that could align as well as a mechanism for cross-links and “fragments” of carbon to interact with the catalyst.
While anthracite is known to graphitize upon thermal annealing, it is not used as a component in synthetic graphite production commercially because of a lack of knowledge about the quality of graphite that can be produced from anthracite. Atria took a different approach, by adding a processing step in order to increase the quality of graphite produced from anthracite.7,8 He did so by hydrogenating anthracite with hydrogen donor solvents and suggested this approach increased the available carbon by hydrogenating and liquefying fragments of the anthracite.7,8 Atria found that the hydrogenated anthracites graphitized better than the non-hydrogenated
103

6
anthracites. He also found that lower oxygen content could lead to greater degrees of graphitization, and suggested that reduced particle size could lead to greater anthracite hydrogenation and therefore a higher degree of graphitization. González et al. found that an increased H/C ratio in the coal appeared to improve the graphitization of the coal, but found that reduced particle size slightly inhibited graphite formation.55-57
This project explored how milling anthracite with or without solvent affects the graphitization behavior upon thermal annealing.61-65 The work presented here reports significant differences in graphitization behavior upon thermal annealing depending on whether milling the anthracite with and without cyclohexene. Results and Discussion for Graphitization of Milled Anthracite Coal
Figure 1 is a schematic of the experimental process. The discussion will focus on examining the products of the coal before and after heat treatment, by separating the discussion into the different milling parameters, i.e., before milling (BMT and BMT-HT), after milling 80 h (BMT-dry and BMT-dry-HT), and after milling 80 h in cyclohexene (BMT-wet and BMT-wet-HT).
Examination of BMT and BMT-HT
The nominal particle size of BMT as received is–60 mesh, or 250 µm and smaller. SEM (Figure 3a and b) of the surface of the particles indicates that after thermal annealing, gases have evolved and the surface is rougher. The XRD of BMT and BMT-HT are in Figure 4a, and parameters for the XRD are shown in Table 2. For BMT, the spectrum is fairly typical for an anthracite coal, with broad peaks at 26, 40-45, 53, and 78º representing carbon. The other peaks are representative of mineral matter inherent in the coal and could represent a variety of minerals, including silica and iron sulfide or oxide. The carbon peaks are broad, an indication of the sample containing amorphous carbon, with a d-spacing of 3.42 Å, Lc of 12 Å, and a La of 38 Å. When the sample is heated to 1400 ºC, the d-spacing does not change significantly (3.41 Å), and Lc (20 Å) and La (40 Å) increase a little as would be expected with heating, but the sample is still not considered graphitic. The mineral peaks have been preliminarily identified; the candidate minerals include SiO2, SiC, FexOy, FexSiy, FexCy and other minerals that could be composites of the elements associated in the sample. The TPO of BMT and BMT-HT are in Figure 5a. As mentioned in the experimental section, the TPO figures shown are graphs of the negative of the derivative of the mass loss over time. TPO shown this way indicates where there are maxima and minima in the loss of sample, which includes CO, CO2, and H2O. For BMT, the sample oxidizes from 500-750 ºC, a relatively broad oxidizing region and the oxidation occurring at a temperature higher than coals of lower rank. The major peak occurs at ~575 ºC, but there are numerous peaks in this sample. Since the sample is relatively heterogeneous, this was not unexpected. However, after thermal annealing at 1400 ºC, the oxidation curve of BMT-HT shifts to 600-1000 ºC, the major peak at ~900 ºC, even higher than a typical peak for graphite at ~850 ºC.
104

7
Examination of BMT-dry and BMT-dry-HT Milling BMT-dry produced a typical particle size of ~5 µm (SEM micrographs in Figure 3c). After heat treatment (BMT-dry-HT, Figure 3d), some of the smaller particles agglomerated to form large particles, on the order of 100 µm. One interesting feature was the formation of small rod-like spikes, although very few. The XRD of BMT-dry and BMT-dry-HT are in Figure 4b, and parameters for the XRD are shown in Table 2. For BMT-dry, the spectrum is similar to BMT, with broad peaks at 26, 40-45, 53, and 78º representing carbon; however, the mineral peaks that were in the BMT spectrum are not there, so minerals have become more amorphous. For this sample, the d-spacing (3.40 Å), Lc (18 Å), and La (36 Å) is not significantly different from the raw coal, BMT. However, after thermal annealing (BMT-dry-HT), there are more mineral peaks, but the d-spacing (3.45 Å) suggests the sample is less graphitic than the sample before heating or BMT-HT, an indication that milling may be destroying any crystalline structure within the coal. The mineral peaks have been preliminarily identified; the candidate minerals include SiO2, SiC, FexOy, FexSiy, FexCy and other minerals that could be composites of the elements associated in the sample. The TPO of BMT-dry and BMT-dry-HT are in Figure 5b. For BMT-dry, the sample oxidizes from 450-600 ºC, the oxidizing region much less broad than BMT. The major peak occurs at ~540 ºC. The sample appears less heterogeneous, and as this sample has been milled and has smaller particles, this was not unexpected. After thermal annealing at 1400 ºC, the oxidation curve of BMT-HT shifts to 500-900 ºC, with two major peaks at ~650 and 825 ºC. The sample has become more crystalline, with one peak similar to graphite at 850 ºC, but the other peak at 650 ºC suggests this sample is less crystalline, and the XRD supports this. BMT-dry-HT also has a significantly higher metal content at 13.10 wt% and a slightly higher iron content at ~0.8 wt%. These metals are known to catalyze oxidation, and could explain why the temperatures have shifted a little compared to BMT-HT. Examination of BMT-wet and BMT-wet-HT
Milling BMT-wet produced particles on the order of 100-200 µm (SEM in Figure 3e),18,
61 much larger than BMT-dry and approximately the same as the as received material. However, agglomeration appeared to be taking place, and several smaller size particles seem to be attached to the large particle surface, particles less than 1 µm. After thermal annealing (BMT-wet-1400, SEM in Figure 3f), the surface of the larger particles looked very different.18, 61-62 Upon closer examination, there are amorphous, round (denoted on micrograph as *1), and tubular particles (*2, *3). The tubular particles appear to be attached to the round particles, and vary in size from ~50-500 nm. EDS of the sample indicated the round particles are iron, the tubes are carbon, and background particle is silicon.18, 61-62 Figure 6 is an EDS map showing this.
The XRD of BMT-wet and BMT-wet-HT are in Figure 4c, and parameters for the XRD are shown in Table 2. For BMT-wet, the spectrum is similar to BMT, with broad peaks at 26, 40-45, 53, and 78º representing carbon; however, the mineral peaks that were in the BMT spectrum are not there, so minerals have become more amorphous, and the carbon peaks appear broader. For this sample, the d-spacing (3.49 Å) is different, suggesting the sample has become more amorphous; however, Lc (12 Å), and La (40 Å) are not significantly different. After thermal annealing (BMT-wet-HT), there are more mineral peaks, but the d-spacing (3.39 Å)
105

8
suggests the sample is becoming more graphitic than the sample before heating or the other two heat treated samples. The mineral peaks have also become much more prominent in this sample. The mineral peaks have been preliminarily identified; the candidate minerals include FexOy, FexSiy, FexCy SiO2, SiC, and other minerals that could be composites of the elements in the original sample. BMT-wet and BMT-wet-HT both have significantly higher metal contents, as evidenced by the ash contents listed in Table 3. For BMT-wet, the ash content is 10.82 wt%, with NAA showing the increase in metal almost entirely iron, with an iron content for BMT ~0.5 wt% increasing to 3.84 wt% in BMT-wet. It is evident that significant attrition of the milling container occurred in BMT-wet. The metal content could also have affected the graphitic nature of the heat treated sample, as it has been suggested that these minerals participate in catalyzing the graphitizing of carbon.
The TPO of BMT and BMT-HT are in Figure 5c. For BMT-wet, the sample oxidizes in two regions, from 150-400 ºC and from 450-700 ºC (this region appears to have two maxima), the oxidizing region is broader than BMT and BMT-dry. The major peaks occur at ~275, 550, and 650 ºC. The sample appears more heterogeneous. The peak at 275 ºC indicates either a more amorphous carbon or evolution of volatiles. In a recent publication, we report a loss of hydrogen at this temperature in temperature programmed desorption.66 This aspect will be discussed in greater detail in the next section. After thermal annealing at 1400 ºC, the oxidation curve of BMT-wet-HT shifts to 450-775 ºC, with no low temperature peak. There again appear to be two major peaks, in this case at ~550 and 700 ºC. The sample has become more crystalline, as evidenced by XRD, but the lower temperature of oxidation can suggest a less crystalline material. As discussed in the previous paragraph, the metal content of both BMT-wet and BMT-wet-HT is significantly higher, 10.82 and 22.20 wt% These metals are known to catalyze oxidation, and could explain why the temperatures have shifted compared to the other samples. Further characterization with TEM was done on this sample because of the unusual structures seen in SEM.
BMT-wet-1400 was selected for TEM characterization due to the variety of structures. TEM of BMT-wet-1400 (Figure 7) has confirmed many types of structures, including nanographene ribbons.41 In addition to the nanographene ribbons represented, TEM images indicated several other graphitic forms of carbon, such as multiwalled nanopolyhedral particles, a common byproduct in nanotube formation42 and curved graphitic regions (Figure 5b-c). In many of the TEM images, it was impossible to distinguish between the different types of graphitic carbon due to sample overlap (Figure 3f). Tubes (~100 nm) were also observed in the sample via TEM (Figure 5e), and energy loss spectroscopy (EELS) distinguished these as silicon carbide based tubes. These silicon carbide tubes were highly irregular with variable diameter along the tube length. Other carbons have been identified in the sample by TEM, such as nanocrystalline diamond (NCD), and will be discussed in greater detail in the next section.
Raman Spectroscopy of BMT and Heat-treated Samples
The Raman spectra of BMT and the heat-treated samples are shown in Figure 8. We focus here on the thermally annealed samples. Raman indicates that BMT-dry-HT and BMT-wet-HT are more crystalline than BMT-HT, as evidenced by the ID/IG ratios of 0.5, 0.5, and 1.2 respectively. However, Raman focuses on much smaller areas than XRD or TPO, so it is difficult to assess the Raman compared to XRD and TPO. In subsequent sections, Raman is used
106

9
to identify other carbon and metal components in thermally annealed samples and will be discussed in greater depth.
Effect of Milling With and Without Cyclohexene Solvent
It is evident that both the milling and thermal annealing play different roles in the formation of the nanocarbons, depending on whether or not a hydrocarbon solvent in involved in the milling process. This study examined how the ball milling may be participating in the reaction process.
In ball milling, as with any grinding process, both physical and chemical changes take place.67 From the physical perspective, particles can agglomerate, particularly with grinding of coal into hyperfine particles. SEM micrographs indicate that the physical agglomeration of particles is facilitated in the presence of cyclohexene; the resulting particles of BMT-wet are approximately 200 µm, significantly larger than the particles resulting from dry grinding BMT-dry particles estimated at 1-5 µm. The particle morphology of BMT-wet suggests that several smaller particles have become agglomerated or accreted in the presence of the solvent. Some of the smaller particles that appear as “bumps” on the surface of BMT-wet are as small as 1 µm, the size of the particles in BMT-dry. Agglomeration occurs due to particle-particle interactions such as van der Waals forces, electrostatic interactions, or capillary phenomena. A solvent can coat the particle, cause “cold welding,” and even pelleting.67
Mechanochemistry, or chemistry brought about by mechanical milling, also plays a role in mechanical grinding of organic materials.67-68 Bond scission can occur during mechanical action that can lead to breaking bonds to reduce the molecular weight and even to cross-linking, a suggestion of free radical chemistry.67 Improved hydrogenation and/or liquefaction occurs upon mechanochemical activation of a lower rank coal with iron-based catalysts in a ball-milling process;69 ball-milling participated by breaking down the coal structure and possibly activating new sites for further processing. However, anthracite coals may behave differently than coals used for liquefaction, mainly because anthracite coal structure is much less amenable to liquefaction.
Anthracites are characterized by high carbon content and low volatile matter content, with low H/C and O/C ratios. The precursor BMT was of low volatile matter content (3.65 wt %, dry) and high fixed carbon content (89.52 wt %, dry, see Table 1). BMT anthracite was chosen for the milling study due to its more crystalline nature (compared with other anthracites), and previous studies have demonstrated formation of MWNTs, graphite nanofibers (GNF) and other curved graphite structures from ball-milled graphite.43-44 The graphite structure breaks down during ball milling, with the characteristic XRD reflection of graphite (i.e. 2θ~26°) decreasing significantly,23-27 with a corresponding increase of the disordered to graphitic carbon ratio in Raman spectroscopy.23-27 However, anthracites are known to contain relatively stable free radical systems due to the large condensed ring systems within highly aromatic coals,70-71 which could provide active sites for solvent to interact with during milling. Milling anthracite may expose these stable free radicals and/or create new free radical sites.
Cyclohexene was introduced into the milling process based on similar studies of ball milling of graphite.23-27 These studies showed the presence of a solvent inhibited the degradation of the graphite in the ball milling process. In these previous studies, solvent inhibited the amorphitization process of graphite upon milling; in the absence of a solvent, ball milling of
107

10
graphite led to complete amorphitization (evidenced by the 002 XRD peak) within ~1 hour, whereas the addition of a solvent increased this time to more than 30 h.19, 25 This effect was dependent upon the chemical identity of the solvent.19, 25 We have generally observed the opposite effect for milled anthracite -- the 002 XRD reflection (Figure 4) is not significantly changed in the milling of anthracite unless there is solvent present.18 Graphitizing versus non-graphitizing behavior of milled anthracite
As suggested in the background section, Franklin has shown that with thermal annealing,
some non-graphitic carbons will graphitize and others are non-graphitizing.48-49 She suggested that the hard, non-graphitic carbon can only graphitize and turn into a soft carbon if the crystallites have cross-links that will break upon thermal anneal at 1700-2500°C; others suggest that there must be a catalyst available to promote crystallite growth through carbide formation and decomposition.3-5, 55-57, 60 Graphitization is much less likely to occur if the cross-links are numerous and between layers, even with available catalyst. We examined our data in comparison with this work.
When coal was thermally annealed without any milling, there is evidence that while the material may be losing volatile matter and becoming more difficult to oxidize, it is a non-graphitizing material, probably due to cross-links inherent in the coal.
When milling the coal without solvent (BMT-dry), the particle size of the coal is reduced. Upon thermal annealing at 1400°C (BMT-dry-1400), it clearly evident from XRD and TPO that the carbon is beginning to crystallize, although the carbon is non-graphitic carbon.
However, when milling the coal in cyclohexene (BMT-wet), our particle size is significantly larger, the result of agglomeration and possibly reaction of cyclohexene with the coal. Upon thermal annealing at 1400°C (BMT-wet-HT), it is evident from XRD that carbon is more crystalline and approaching graphite. Silicon carbides and iron silicides are clearly observed in XRD in BMT-wet-HT, materials known to catalyze graphite formation and even overcome barriers to graphite formation.3-5,9,55-57,60 However, TPO indicates a less crystalline material. Clearly there are structural differences in the three thermally annealed samples. And as shown in SEM and TEM, other types of graphitic carbons are forming in BMT-wet-HT, such as nanographene ribbons, multiwalled nanopolyhedral particles, curved graphitic regions, silicon carbide tubes, and possibly sp3 based carbons.61-66 These types of carbons will oxidize at a lower temperature than graphite. We also believe the high metal content in BMT-wet-HT that may be catalyzing graphite formation (XRD) can also be catalyzing oxidation as seen in TPO and why the results appear contradictory.
The key seems to be with the addition of cyclohexene and the interaction during ball milling. If anthracene (3-ring aromatic carbon compound) were reacted with cyclohexene, it may be possible to react as in a Diels-Alder reaction. If the center ring reacted with cyclohexene, a sp2 carbon could form a sp3 carbon and could be creating a relatively unreactive type of crosslink.55 Upon thermal annealing, this could explain the formation of more graphitic carbon, retrogressive Diels-Alder to produce vapors that could form nanographene ribbons and other carbons.55
Thermal annealing of anthracite coal that has been ball-milled in cyclohexene leads to a variety of nanocarbons, including non-graphitic carbon and nanographene ribbons. Minerals present in the coal and introduced during milling form metal complexes that crystallize during thermal annealing, as noted by XRD. These crystalline metals appear to catalyze graphitic
108

11
carbon formation and nanographene ribbon formation in BMT-wet-HT. Milling BMT without solvent reduced the particle size of the coal (SEM, TPO) and led to a decrease in graphitic carbon upon thermal annealing; milling dry may increase the incidence of forming cross-links that do not break easily and therefore reduce the coal’s ability to graphitize. Milling in cyclohexene modified the products after thermal annealing. The materials in BMT-HT and BMT-dry-HT are non-graphitic when compared to BMT-wet-HT according to XRD, and while TPO indicates BMT-wet-HT may be less crystalline than the other heat treated samples, the sample contains graphitic nanocarbons and metals that can decrease the oxidation temperature. Milling in cyclohexene appears to cause an increase in quasi-graphitic carbon upon thermal annealing. This appears to be due increased attrition of metals into the sample when the anthracite was milled with cyclohexene, metals that have been shown to catalyze graphitization. 2. Synthesis of Nanocrystalline Diamond (NCD), Bucky Diamond, and Hydrogen From
Milled Anthracite Coal: Contributions by A.D. Lueking, H.R. Gutierrez, D.L. Narayanan,
C.E.B. Clifford, D. Van Essendelft (see acknowledgements)
Background
Natural diamond is produced in high pressure and high temperature volcanic shafts, and the scarcity and cost of natural diamond has stimulated synthetic diamond research for over 100 years. Diamond synthesis requires high energy inputs, as diamond is not the thermodynamically stable form of carbon at ambient conditions. Diamond is, however, more thermodynamically stable than amorphous carbon. Generally, diamond is synthesized at high pressure (~1-10 GPa) where diamond is the thermodynamically preferred form of carbon, and at high temperatures (T>2000 K) to overcome the kinetic barriers of the solid-phase conversion of graphite to diamond. In addition to the high-pressure, high-temperature conversion from graphite into diamond, synthetic diamond is currently produced via either chemical vapor deposition or explosive detonation. There have been some reports of low-pressure diamond synthesis via hydrothermal processing,72 but these methods are not commercialized. In 1992, the estimated production of synthetic diamond was 70 tons at an estimated market value of $500 million.73
Synthetic diamond that is less than 1 mm is used for grinding and polishing due to the high strength of diamond;73 likewise, nanocrystalline diamond (NCD) is used in high-precision polishing applications and, when combined with polymers, as surface coatings for aircrafts, cars, and ships. Chemical vapor deposition (CVD) diamond is used to make diamond coatings for improved electrical, optical, mechanical, and chemical properties.73 NCD is used in the electronics industry: as an additive to magnetic recording systems to reduce friction and increase the wear resistance of the magnetic materials74, in field electron emission materials (i.e. flat panel displays)75-80, in nanoelectro-mechanical resonant structures (NEMS), 81-83 and in biosensors.84
One route for NCD formation is currently the explosive detonation process (commercialized by Dupont), as it leads to diamond particles generally on the order of 5-60 nm. The explosive detonation process for diamond synthesis relies on a 20–30 GPa shock wave over a 10-6 to 10-7 second duration for the essentially immediate conversion of graphite into diamond.85 This high energy process may also cause the curvature of the graphite to form graphite ribbons. NCD content of ‘as synthesized’ NCD formed via explosive detonation are on the order of 1-9 % by weight NCD.85 Commercial NCD is further purified via acid oxidation to remove amorphous carbon.
109

12
Ball milling of carbon materials has been used as a strategy to produce carbon-based hydrogen storage materials,19-22 and carbon-metal hydrogen storage composites.23-37 The performance of ball milled carbon composites is generally a function of ball-milling time, the presence of a solvent during processing,23-27 and the breakdown of the graphitic structure.25, 31, 38 Graphitic carbon becomes rapidly amorphitized during milling, evidenced by a rapid decrease in the characteristic graphite 002 (2θ=26º) reflection in XRD.39 It is thought that any chemical transformations that occur in a ball milling process are due to a liquefaction at the interface to facilitate reaction,40, 41 although this is not generally agreed upon. Previously, the objective of this research was to explore the substitution of highly graphitic anthracite coal in place of graphite into both carbon- and carbon-metal composites formed via a high energy ball milling process;18 the current objective is to identify the carbons structures formed as they appear to be different than expected. The use of anthracite carbon was based on its similarity to graphite and polycondensed ring compounds (e.g., anthracene, perylene and chrysene). Anthracite coals are known to be more crystalline in nature than coals of lower rank and thus have some similarities to graphite in terms of structure and thermodynamics, yet the substitution of heteroatoms and certain cross-linkages within anthracite make anthracite less stable than true graphite (but much harder). In our analysis of these ball-milled anthracite products, we have observed the formation of NCD, and this part of the report discusses these initial observations as well as complementary data to support these findings. To explain the unusual and unexpected observation of NCD after a low-temperature and low-pressure (but high energy) synthesis route, we propose a preliminary reaction pathway based on the findings to date. Results and Discussion for NCD and Hydrogen Production
Evidence for the formation of NCD via High Energy Ball Milling
Nanocrystalline diamond (NCD) particles are observed in HRTEM images of the highly
graphitic anthracite coal precursor after 80 hours of milling in a cyclohexene wetting agent (BMT-wet) (Figures 9a and b). The NCD particle is embedded in a region of amorphous carbon; during HRTEM analysis, this amorphous carbon region was converted to the graphitic nanocarbon onions, similar to that reported previously (Figure 9c).66 The lattice spacing in the HRTEM images is 2.0 Å, characteristic of diamond, and EDS spectra indicated that this sample was primarily carbon. Only limited TEM analysis was performed on these samples, with more complete characterization performed on the more stable thermally annealed samples. However, the presence of the NCD (surrounded by amorphous carbon) in the sample prior to thermal
annealing indicates that the NCD is formed in the ball milling process, rather than the subsequent processing steps.
After thermal annealing at 1400 °C (i.e. BMT-wet-HT), observed NCD particles were encapsulated in a graphitic carbon outer-layer (Figure 10). This type of carbon structure, with a sp3 hybridized carbon core surrounded by a sp2 hybridized fullerene-like coating has been previously referred to as bucky diamond.86 Once again, the lattice spacing in the HR-TEM images is characteristic of diamond (2.0 Å), and the reciprocal-space lattice corresponds to the diamond crystal structure with the 3.57 Å lattice constant (Figure 11). Several NCD particles were observed in this sample, with particle sizes ranging from approximately 5 to 35 nm (Figure 10a-d). The high contrast of these images indicates the NCD particles have an equal dimension parallel to the electron beam, and are thus approximately spherical. Additional thin regions
110
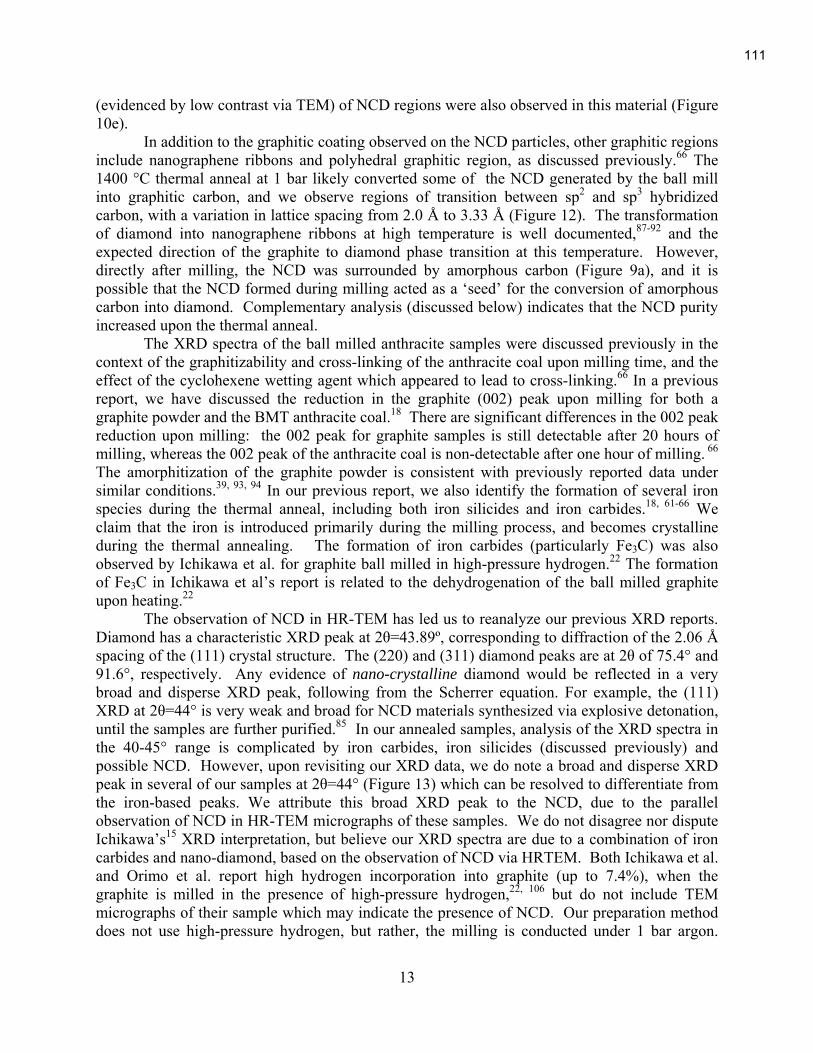
13
(evidenced by low contrast via TEM) of NCD regions were also observed in this material (Figure 10e).
In addition to the graphitic coating observed on the NCD particles, other graphitic regions include nanographene ribbons and polyhedral graphitic region, as discussed previously.66 The 1400 °C thermal anneal at 1 bar likely converted some of the NCD generated by the ball mill into graphitic carbon, and we observe regions of transition between sp2 and sp3 hybridized carbon, with a variation in lattice spacing from 2.0 Å to 3.33 Å (Figure 12). The transformation of diamond into nanographene ribbons at high temperature is well documented,87-92 and the expected direction of the graphite to diamond phase transition at this temperature. However, directly after milling, the NCD was surrounded by amorphous carbon (Figure 9a), and it is possible that the NCD formed during milling acted as a ‘seed’ for the conversion of amorphous carbon into diamond. Complementary analysis (discussed below) indicates that the NCD purity increased upon the thermal anneal.
The XRD spectra of the ball milled anthracite samples were discussed previously in the context of the graphitizability and cross-linking of the anthracite coal upon milling time, and the effect of the cyclohexene wetting agent which appeared to lead to cross-linking.66 In a previous report, we have discussed the reduction in the graphite (002) peak upon milling for both a graphite powder and the BMT anthracite coal.18 There are significant differences in the 002 peak reduction upon milling: the 002 peak for graphite samples is still detectable after 20 hours of milling, whereas the 002 peak of the anthracite coal is non-detectable after one hour of milling. 66 The amorphitization of the graphite powder is consistent with previously reported data under similar conditions.39, 93, 94 In our previous report, we also identify the formation of several iron species during the thermal anneal, including both iron silicides and iron carbides.18, 61-66 We claim that the iron is introduced primarily during the milling process, and becomes crystalline during the thermal annealing. The formation of iron carbides (particularly Fe3C) was also observed by Ichikawa et al. for graphite ball milled in high-pressure hydrogen.22 The formation of Fe3C in Ichikawa et al’s report is related to the dehydrogenation of the ball milled graphite upon heating.22
The observation of NCD in HR-TEM has led us to reanalyze our previous XRD reports. Diamond has a characteristic XRD peak at 2θ=43.89º, corresponding to diffraction of the 2.06 Å spacing of the (111) crystal structure. The (220) and (311) diamond peaks are at 2θ of 75.4° and 91.6°, respectively. Any evidence of nano-crystalline diamond would be reflected in a very broad and disperse XRD peak, following from the Scherrer equation. For example, the (111) XRD at 2θ=44° is very weak and broad for NCD materials synthesized via explosive detonation, until the samples are further purified.85 In our annealed samples, analysis of the XRD spectra in the 40-45° range is complicated by iron carbides, iron silicides (discussed previously) and possible NCD. However, upon revisiting our XRD data, we do note a broad and disperse XRD peak in several of our samples at 2θ=44° (Figure 13) which can be resolved to differentiate from the iron-based peaks. We attribute this broad XRD peak to the NCD, due to the parallel observation of NCD in HR-TEM micrographs of these samples. We do not disagree nor dispute Ichikawa’s15 XRD interpretation, but believe our XRD spectra are due to a combination of iron carbides and nano-diamond, based on the observation of NCD via HRTEM. Both Ichikawa et al. and Orimo et al. report high hydrogen incorporation into graphite (up to 7.4%), when the graphite is milled in the presence of high-pressure hydrogen,22, 106 but do not include TEM micrographs of their sample which may indicate the presence of NCD. Our preparation method does not use high-pressure hydrogen, but rather, the milling is conducted under 1 bar argon.
111
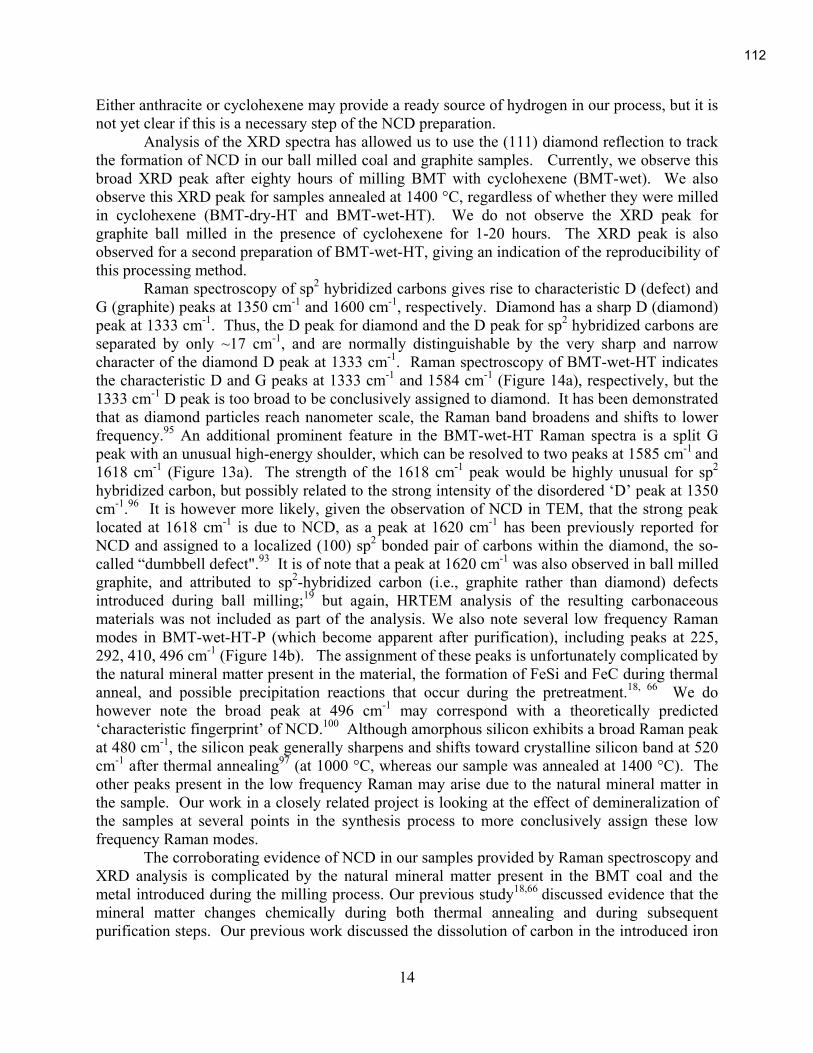
14
Either anthracite or cyclohexene may provide a ready source of hydrogen in our process, but it is not yet clear if this is a necessary step of the NCD preparation.
Analysis of the XRD spectra has allowed us to use the (111) diamond reflection to track the formation of NCD in our ball milled coal and graphite samples. Currently, we observe this broad XRD peak after eighty hours of milling BMT with cyclohexene (BMT-wet). We also observe this XRD peak for samples annealed at 1400 °C, regardless of whether they were milled in cyclohexene (BMT-dry-HT and BMT-wet-HT). We do not observe the XRD peak for graphite ball milled in the presence of cyclohexene for 1-20 hours. The XRD peak is also observed for a second preparation of BMT-wet-HT, giving an indication of the reproducibility of this processing method.
Raman spectroscopy of sp2 hybridized carbons gives rise to characteristic D (defect) and G (graphite) peaks at 1350 cm-1 and 1600 cm-1, respectively. Diamond has a sharp D (diamond) peak at 1333 cm-1. Thus, the D peak for diamond and the D peak for sp2 hybridized carbons are separated by only ~17 cm-1, and are normally distinguishable by the very sharp and narrow character of the diamond D peak at 1333 cm-1. Raman spectroscopy of BMT-wet-HT indicates the characteristic D and G peaks at 1333 cm-1 and 1584 cm-1 (Figure 14a), respectively, but the 1333 cm-1 D peak is too broad to be conclusively assigned to diamond. It has been demonstrated that as diamond particles reach nanometer scale, the Raman band broadens and shifts to lower frequency.95 An additional prominent feature in the BMT-wet-HT Raman spectra is a split G peak with an unusual high-energy shoulder, which can be resolved to two peaks at 1585 cm-1 and 1618 cm-1 (Figure 13a). The strength of the 1618 cm-1 peak would be highly unusual for sp2 hybridized carbon, but possibly related to the strong intensity of the disordered ‘D’ peak at 1350 cm-1.96 It is however more likely, given the observation of NCD in TEM, that the strong peak located at 1618 cm-1 is due to NCD, as a peak at 1620 cm-1 has been previously reported for NCD and assigned to a localized (100) sp2 bonded pair of carbons within the diamond, the so-called “dumbbell defect".93 It is of note that a peak at 1620 cm-1 was also observed in ball milled graphite, and attributed to sp2-hybridized carbon (i.e., graphite rather than diamond) defects introduced during ball milling;19 but again, HRTEM analysis of the resulting carbonaceous materials was not included as part of the analysis. We also note several low frequency Raman modes in BMT-wet-HT-P (which become apparent after purification), including peaks at 225, 292, 410, 496 cm-1 (Figure 14b). The assignment of these peaks is unfortunately complicated by the natural mineral matter present in the material, the formation of FeSi and FeC during thermal anneal, and possible precipitation reactions that occur during the pretreatment.18, 66 We do however note the broad peak at 496 cm-1 may correspond with a theoretically predicted ‘characteristic fingerprint’ of NCD.100 Although amorphous silicon exhibits a broad Raman peak at 480 cm-1, the silicon peak generally sharpens and shifts toward crystalline silicon band at 520 cm-1 after thermal annealing97 (at 1000 °C, whereas our sample was annealed at 1400 °C). The other peaks present in the low frequency Raman may arise due to the natural mineral matter in the sample. Our work in a closely related project is looking at the effect of demineralization of the samples at several points in the synthesis process to more conclusively assign these low frequency Raman modes.
The corroborating evidence of NCD in our samples provided by Raman spectroscopy and XRD analysis is complicated by the natural mineral matter present in the BMT coal and the metal introduced during the milling process. Our previous study18,66 discussed evidence that the mineral matter changes chemically during both thermal annealing and during subsequent purification steps. Our previous work discussed the dissolution of carbon in the introduced iron
112
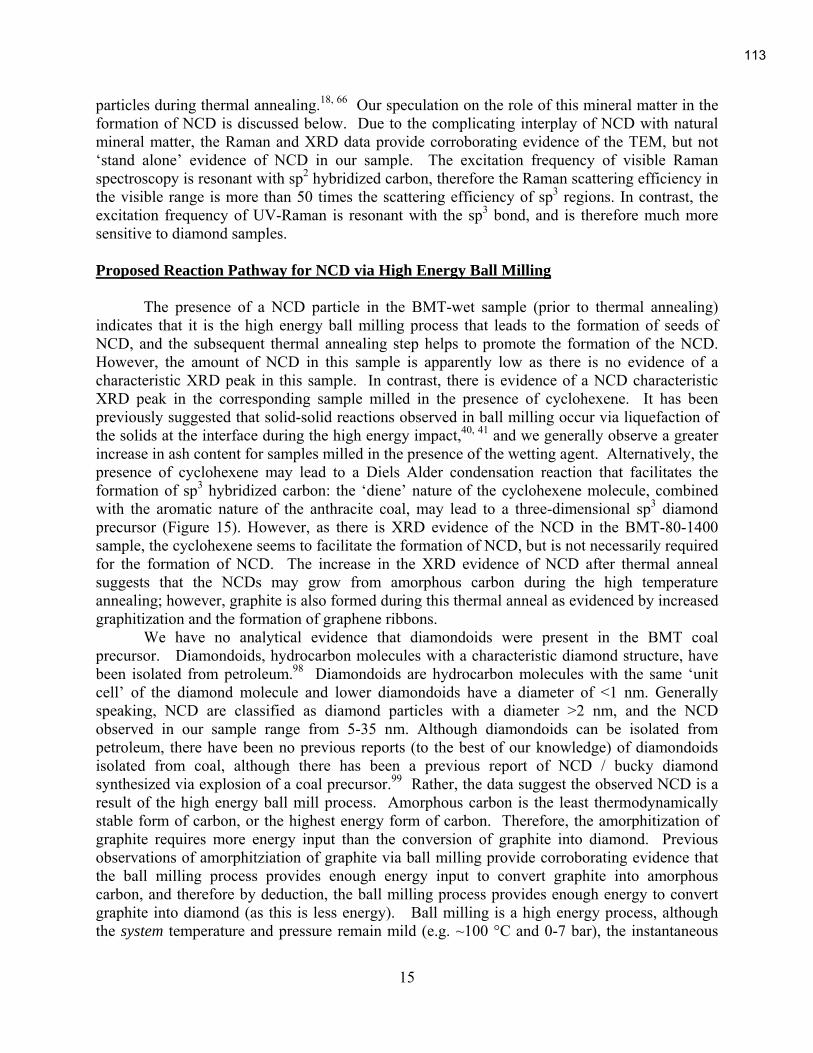
15
particles during thermal annealing.18, 66 Our speculation on the role of this mineral matter in the formation of NCD is discussed below. Due to the complicating interplay of NCD with natural mineral matter, the Raman and XRD data provide corroborating evidence of the TEM, but not ‘stand alone’ evidence of NCD in our sample. The excitation frequency of visible Raman spectroscopy is resonant with sp2 hybridized carbon, therefore the Raman scattering efficiency in the visible range is more than 50 times the scattering efficiency of sp3 regions. In contrast, the excitation frequency of UV-Raman is resonant with the sp3 bond, and is therefore much more sensitive to diamond samples.
Proposed Reaction Pathway for NCD via High Energy Ball Milling
The presence of a NCD particle in the BMT-wet sample (prior to thermal annealing)
indicates that it is the high energy ball milling process that leads to the formation of seeds of NCD, and the subsequent thermal annealing step helps to promote the formation of the NCD. However, the amount of NCD in this sample is apparently low as there is no evidence of a characteristic XRD peak in this sample. In contrast, there is evidence of a NCD characteristic XRD peak in the corresponding sample milled in the presence of cyclohexene. It has been previously suggested that solid-solid reactions observed in ball milling occur via liquefaction of the solids at the interface during the high energy impact,40, 41 and we generally observe a greater increase in ash content for samples milled in the presence of the wetting agent. Alternatively, the presence of cyclohexene may lead to a Diels Alder condensation reaction that facilitates the formation of sp3 hybridized carbon: the ‘diene’ nature of the cyclohexene molecule, combined with the aromatic nature of the anthracite coal, may lead to a three-dimensional sp3 diamond precursor (Figure 15). However, as there is XRD evidence of the NCD in the BMT-80-1400 sample, the cyclohexene seems to facilitate the formation of NCD, but is not necessarily required for the formation of NCD. The increase in the XRD evidence of NCD after thermal anneal suggests that the NCDs may grow from amorphous carbon during the high temperature annealing; however, graphite is also formed during this thermal anneal as evidenced by increased graphitization and the formation of graphene ribbons.
We have no analytical evidence that diamondoids were present in the BMT coal precursor. Diamondoids, hydrocarbon molecules with a characteristic diamond structure, have been isolated from petroleum.98 Diamondoids are hydrocarbon molecules with the same ‘unit cell’ of the diamond molecule and lower diamondoids have a diameter of <1 nm. Generally speaking, NCD are classified as diamond particles with a diameter >2 nm, and the NCD observed in our sample range from 5-35 nm. Although diamondoids can be isolated from petroleum, there have been no previous reports (to the best of our knowledge) of diamondoids isolated from coal, although there has been a previous report of NCD / bucky diamond synthesized via explosion of a coal precursor.99 Rather, the data suggest the observed NCD is a result of the high energy ball mill process. Amorphous carbon is the least thermodynamically stable form of carbon, or the highest energy form of carbon. Therefore, the amorphitization of graphite requires more energy input than the conversion of graphite into diamond. Previous observations of amorphitziation of graphite via ball milling provide corroborating evidence that the ball milling process provides enough energy input to convert graphite into amorphous carbon, and therefore by deduction, the ball milling process provides enough energy to convert graphite into diamond (as this is less energy). Ball milling is a high energy process, although the system temperature and pressure remain mild (e.g. ~100 °C and 0-7 bar), the instantaneous
113

16
and localized forces present in the ball mill provide high energy collisions. In this sense, ball milling may be not unlike the explosive detonation processes used to form diamond in which 20-30 GPa are typical over the course of 10-6 to 10-7 seconds.85 It is of note that iron catalysts facilitate diamond synthesis via explosive detonation and significant iron is introduced to our samples via break down of the stainless steel milling materials. As discussed above, the formation of iron carbides has been observed previously in the dehydrogenation of graphite ball milled in high-pressure hydrogen.22 It is also of note that the hydrothermal diamond growth has been reported at low pressures, in which a diamond phase “precipitates out” of a metal carbon due to a change in solubility or electrochemical potential. For example Zhao et al. report diamond nucleation upon diamond seeds in a carbon, water, and metal environment.72 It is not currently clear what role the metals—either inherent to the coal or introduced via the breakdown of the stainless steel milling materials—play in the formation of NCD in our samples. Visually, however, observed NCD particles are not found adjacent to the many metal particles observed in the HRTEM micrographs of the various samples.
A sufficient energy input to convert graphite into thermodynamically less stable forms does not explain the apparent entropy increase in forming diamond preferentially (or in addition to) the more disordered amorphous carbon. However, the traditional conceptualizations of thermodynamic carbon stability (Gf,graphite < Gf,diamond < Gf,amorphous C), or the carbon phase diagram, are currently being reexamined at the nanoscale. Barnard has theoretically predicted that NCD is the most stable form of carbon in the range of 1.9-5.2 nm: below 1.9 nm fullerene type carbons become the most stable form, whereas above 5.2 nm graphite is the most thermodynamically stable form of carbon. Other experimental observations indicate that the transition of nanocrystalline diamond into carbon onions appears to be a function of the particle size: NCD is readily transformed into carbon onions at high temperature,90 the reverse transformation from onions into nanocrystalline diamond has been observed upon electron irradiation.101-104 Kuznetsov et al. have extensively studied the mechanism of the nanocrystalline diamond to carbon onion transition, and proposed a mechanism for this transition.92 Experimentally, the number of observations of graphite encapsulated nanodiamonds, or bucky diamonds, exceeds the number of observations of ‘true’ NCD or carbon onions. Recently, the conversion of carbon nanotubes directly into nanocrystalline diamond has been observed at high pressure.105
In conclusion, we have observed nanocrystalline diamond formation via high energy ball milling of a highly graphitic anthracite precursor. Direct evidence for NCD may be provided by HRTEM and FT of the HRTEM images, while corroborating supporting evidence of NCD is provided via XRD and Raman spectroscopy. The formation of nanocrystalline diamond in the particle size of 5 to 35 nm provides experimental support of a recent theoretical prediction that nanocrystallline diamond is the most stable form of carbon on the nanoscale, in a particular stability region. The NCD are formed during the high energy ball milling, but corroborating analytical evidence suggests the NCD content of the samples increase via thermal anneal. The thermal anneal also serves to increase the stability of the NCD via the formation of encapsulating fullerene-like graphitic onions, otherwise known as bucky diamonds. Although the ball milling process is high energy, the overall system can be considered a low temperature, low-pressure process. Thus, a novel method to synthesize nano-crystalline diamond from graphitic precursors has been outlined. The precursor material is naturally occurring anthracite coal, suggesting a low cost feedstock for the formation of NCD. Although the exact synthesis pathway needs further
114

17
elucidation, a wetting agent during milling and natural or introduced transition metals (particularly iron) appear to play a role in synthesis. 3. Combined Hydrogen Production and Storage with Subsequent Carbon Crystallization:
Contributions by A.D. Lueking, H.R. Gutierrez, D.A. Fonseca, D.L. Narayanan, D.T. Van
Essendelft, P Jain, and C.E. Burgess-Clifford (see acknowledgements)
Background
Development of a hydrogen economy will require significant advances in methods by which to produce, store, transport, and distribute hydrogen in an economically viable manner. Centralized hydrogen production methods currently in use are limited by an inefficient means to transport hydrogen to its point of use.107 Compressed and cryogenic storage methods do not meet density targets and incremental advances in candidate solid-state storage materials are not likely to meet density or cost targets. 108 Here we provide evidence of a combined hydrogen production and storage process that utilizes a low cost carbon precursor that slowly evolves hydrogen at room temperature. Our process draws hydrogen from dehydrogenation of a hydrocarbon donor, with simultaneous trapping of molecular hydrogen, as evidenced by Raman-active molecular hydrogen vibrations. The evolution of the trapped hydrogen is kinetically-limited and continues in excess of one year; heating the material to modest temperatures accelerates hydrogen evolution. The presence of a nanocrystalline diamond by-product suggests hydrogen-induced carbon crystallization and corroborates theoretical predictions109-112 of sp3-rehybridization of nanocarbon structures upon hydrogen exposure. Results and Discussion of Hydrogen Production
Reactive ball milling of Buck Mountain anthracite coal (BMT) with a cyclohexene
hydrogen donor led to a carbon structure (referred to as BMT-wet) that decomposes upon heating to give molecular hydrogen. The term ‘hydrogen donor’ is applied to cyclohexene as its dehydrogenation during milling leads to the following observations of molecular hydrogen evolution via temperature desorption spectroscopy (TDS) measurements. The TDS indicates the following qualitative hydrogen evolution (m/z=2) for three samples (Figure 16): an immediate increase in the hydrogen baseline (Type I) 113, followed by an increase at ~60 °C with a local maxima at ~150 °C (Type II), and a third increase at ~300 °C with a maxima at ~400 °C (Type III). Samples were exposed to air during sample transfer and/or during storage. The Type III hydrogen evolution is similar to previous reports of carbons ball milled in high-pressure molecular hydrogen: Hydrogen evolved from milled graphite at ~330°C,21, 114 activated carbon at ~300 °C22, and SWNT at ~230 °C.21 No previous report showed evidence of low temperature hydrogen evolution (Types I and II), and this may be due in part to cyclohexene desorption and subsequent catalytic dehydrogenation, although the active catalytic sites have not yet been determined. Type I and II hydrogen evolution at atmospheric pressure from the various BMT-wet samples ranges from 0.4 wt%-0.8% depending on sample age (inset, Figure 16); however these quantifications do not capture hydrogen evolution during storage and sample transfer. Overall hydrogen evolution from the onset of sample heating to 750 °C is as much as 2.1 wt% after 3 days of storage under atmospheric conditions (inset, Figure 16). In comparison, hydrogen
115

18
evolution from the BMT precursor ensues at 550 °C, and is 0.5 wt%, with no significant Type I baseline increase (Figure 16d).
After heating, crystalline regions are observed at several locations in BMT-wet and range in size from 5-35 nm. The crystalline regions are embedded in a graphitic carbon outer-layer (Figure 17), and Fourier transform (FT) reveals a reciprocal-space lattice corresponding to the diamond crystal structure observed along the [011] zone axis and a lattice constant of 3.57 Å (Figures 17c-d). The 3.3 Å spacing of the shells surrounding the core are consistent with graphite, but discontinuities with periodicity of 2.0 Å (close to the (111) interplanar distance of diamond) suggest a sp2-sp3 hybridization transition. These diamond-graphite structures are similar to those reported previously after electron irradiation,89, 104 and have been referred to as bucky diamond. Transition regions similar to Figure 17a are also observed that lack the inner core structure. Corresponding changes in the visible Raman spectra (633 nm, Figure 17e) may be attributed to structural doping (increased D’ reflection at 2652 cm-1) and localized sp2 defects within sp3 hybridized carbon, the so-called “dumbbell defect" (at 1620 cm-1).93-94 Low frequency Raman modes arise that are consistent with the ‘characteristic fingerprint’ of NCD at 496 cm-
1,100 and the low energy tail for tetrahedral carbon at ~600 cm-1.115, 116 Although diamondoids22 and nanocrystalline diamond (NCD)89 have been isolated from petroleum, there have been no previous reports of the isolation from coal. No analytical evidence was found for NCD in the BMT precursor and quasi-amorphous carbon structures (see Figure 18d) are typical for BMT-wet immediately directly after milling, prior to heating.
Re-hybridization of sp2 nanocarbons upon the introduction of hydrogen has been theoretically predicted: Hydrogen adsorption on planar graphite leads to distortion,117 doped nanocarbons will restructure and partially re-hybridize to sp3 carbon upon hydrogen exposure109,
110 leading to an increased adsorption energy and stretching of the molecular hydrogen bond.118 These effects may be more pronounced upon the application of high pressure111 or resulting from hydrogen chemisorption.112 These prior results are based on molecular simulations, and sp3 re-hybridization due to hydrogen exposure in carbon has not been previously observed experimentally although hydrogen-induced crystallization has been reported for amorphous silicon.119
Photoluminescence of BMT-wet (Figure 18a-b) in visible Raman relative to the coal precursor (Figure 18c) is consistent with hydrogenation, as photoluminescence has been empirically correlated to hydrogen content.45 BMT-wet samples continue to fluoresce in visible Raman one year after preparation, but with decreased intensity. A perturbed Q branch vibration for molecular hydrogen (Figure 18e, near 4161 cm-1) is present after one year, despite storage and measurement in air. The Q branch hydrogen peak is perturbed (to 4125, 4166, and 4377 cm-
1) due to interactions of hydrogen with the material, similar to that demonstrated with in situ Raman hydrogen adsorption studies with carbon at cryogenic temperatures in a pressurized hydrogen atmosphere.46-47 The hydrogen vibrations in Figure 18e are a clear indication of both hydrogen production and hydrogen trapping within the material, with slow diffusion-limited evolution in excess of one year.
Although not graphitic, forthcoming graphitization studies with BMT coal42 demonstrate its quasi-crystalline nature that may graphitize upon heating. The formation of cross-linkages upon milling in cyclohexene likely promote NCD formation, as the formation of sp3 cross-linkages has previously been used to explain diamond nucleation via electron irradiation of carbon onions.104 Defects containing dangling carbon bonds are also theoretically predicted to promote NCD nucleation120 and anthracite coal is known for discontinuities and dangling bonds
116

19
within its quasi-graphite structure. BMT coal contained inherent mineral matter, and transition metals were introduced by the milling process (i.e. Fe, Ni, and Cr). Transition metals not only migrate within a ball mill to form alloys, but are known hydrogen dissociation catalysts. These metals likely catalyze cyclohexene dehydrogenation, cross-linking, and hydrogen trapping. Iron, in particular, catalyzes the graphite to diamond phase transition, and is used in the catalytic deposition of carbon to form both synthetic diamond and carbon nanotubes. Capturing carbon-metal synergy to optimize hydrogen storage is the focus of on-going hydrogen storage activities,121 including work by the authors. The metals clearly play a catalytic role at various stages; however, the 1-2% by weight hydrogen evolution can not be attributed solely to metals which make-up only 5-10% of the sample. The Raman-active molecular hydrogen vibrations in air and room temperature hydrogen evolution are atypical of metal hydrides and physical adsorption to carbon.
A crystalline carbon structure embedded in amorphous carbon (Figure 19a) was observed via HRTEM in BMT-wet prior to heat treatment, suggesting that crystallinity—at least in part—arises due to the high impact collisions in the mill. The sample had a sharp Raman peak at ~1090 cm-1, similar to that attributed previously to NCD93; the low frequency peaks (e.g. 155, 278, 714 cm-1) may be associated with metal oxides from the milling materials (Figure 19d). The six-fold symmetry of the FT from this crystalline region (Figure 19c) correlates with either a face centered cubic structure (zone axis [111]) or a close packed hexagonal structure (zone axis [0001]). The dhkl spacing of 1.99 Å does not match graphite, diamond, or lonsdaleite. EDX analysis indicates this region is primarily carbon-based (Figure 19b), as EDX is insensitive to light elements and the bulk material evolved hydrogen upon heating, the structure may be a crystalline carbon-hydrogen structure, but we are unable to conclusively identify the carbon, or carbon-hydrogen, structure of this region. The expansion of graphite along the c-axis was first proposed for hydrogen interaction with graphite nanofibers,122 and there has been some TEM and XRD evidence for c-axis expansion by another group.123 The dhkl spacing of 1.99 Å (Figure 19) is inconsistent with expansion only in the c-axis direction of graphite. Interstitial hydrogen atoms in diamond (H2* defects) are known: molecular modeling of H2* leads to a bond-inserted hydrogen atom, a second hydrogen in an "antibonding" site,124 and reduces the carbon-carbon bond order to ½, leaving to no net C-H bond.125 These particular studies do not allow carbon-carbon expansion in the model. An alternative explanation of H2* involves off-axis hydrogen-hydrogen interaction and has found carbon-carbon bond expansion.126 It remains an open question whether H2 can intercalate carbon materials and whether H2 has unique adsorption properties due to its small size and inherent ability to penetrate pores.127 Quinn has shown that under conditions of corresponding state (i.e. constant P/Pc and T/Tc), hydrogen is adsorbed to a greater extent than other gases, an observation which can be attributed only in part to its decreased molecular diameter.127 However, we suspect that hydrogen in BMT-wet is not a result of true pore penetration, but rather, hydrogen released from cyclohexene dehydrogenation is trapped as structural changes in the carbon during milling occur. On-going work is seeking to increase and understand the occurrence of Figure 19 type regions, and parallel modeling studies are underway to help characterize the structure.
In conclusion, we have evidence of trapped molecular hydrogen, slow room temperature hydrogen evolution, and subsequent carbon crystallization. Carbon crystallization has previously been tied to nanocarbon hydrogenation via molecular simulations. Samples continue to evolve hydrogen and contain Raman-active hydrogen vibrations in excess of one year, despite storage in air. The hydrogen evolution can be accelerated with moderate sample heating. The hydrogen is
117

20
derived from dehydrogenation of the cyclohexene additive, as molecular hydrogen was not added to the process. A combined hydrogen production-storage process may offer improved overall system efficiency, as separately, both hydrogen production and hydrogen storage come at an energy penalty. Modification of low-cost anthracite coals into materials that evolve hydrogen and rearrange into value-added crystalline carbon products may provide a viable alternative to solid-state hydrogen storage materials that rely on reversible thermodynamics, for which DOE storage targets are difficult, if not impossible, to achieve. A separate and unique solid-state adsorption material may be an unnecessary step for the ultimate goal of a ready supply of hydrogen to the fuel cell. 4. Modifications of Process Parameters, Contributions by C.E. Burgess Clifford, D. T. Van
Essendelft, P. Jain, and A.D. Lueking
Background
The work described in the following section discusses initial tests to attempt to determine the interaction between the coal and cyclohexene during ball milling, first by removing the solvent by extraction, then by vacuum, and then changing the solvent to coal milling ratio.
Results and Discussion
Several modifications have been done during the ball milling stage to elucidate coal and cyclohexene interactions. This work presented is preliminary.
Removal of Volatile Components After Ball-Milling
A second sample of BMT-wet was produced and is labeled BMT-wet2. The sample was vacuum-dried as described in the experimental section and named BMT-wet2-Vac. TPO was done on each sample and is shown in Figure 20. BMT-wet-Vac is plotted with BMT-wet2. TPO of BMT-wet2 does not look the same as BMT-wet. There is oxidation occurring at ~80°C (versus about 250°C for BMT-wet), the boiling point of cyclohexene, and the high temperature oxidation is 400-585°C, whereas previously, it was ~400-700°C. This indicates much less interaction of the cyclohexene with the coal in this second run. After vacuum treatment of BMT-wet2, TPO reveals changes in the oxidation profile, with no low temperature oxidation taking place and at high temperature, two definite peaks with oxidation from ~400-550°C. The profile suggests that loosely bound cyclohexene and possibly other degradation products are removed during vacuum treatment as well as a loss of other possible volatiles in the coal. BMT-wet was extracted by dichloromethane as described in the experimental section. GC/MS of the extracted liquid (Figure 21) is mainly oxygenated derivatives of cyclohexene. As dichloromethane was removed, the sample was not protected from the atmosphere, therefore it is difficult to determine if cyclohexene was oxygenated during ball milling or during evaporation of the solvent. The low cyclohexene content in the sample may have been are result of evaporation. Another problem is dichloromethane typically contains a small amount of the stabilizer of cyclohexane, which could interfere with the products upon evaporation of the solvent.
118
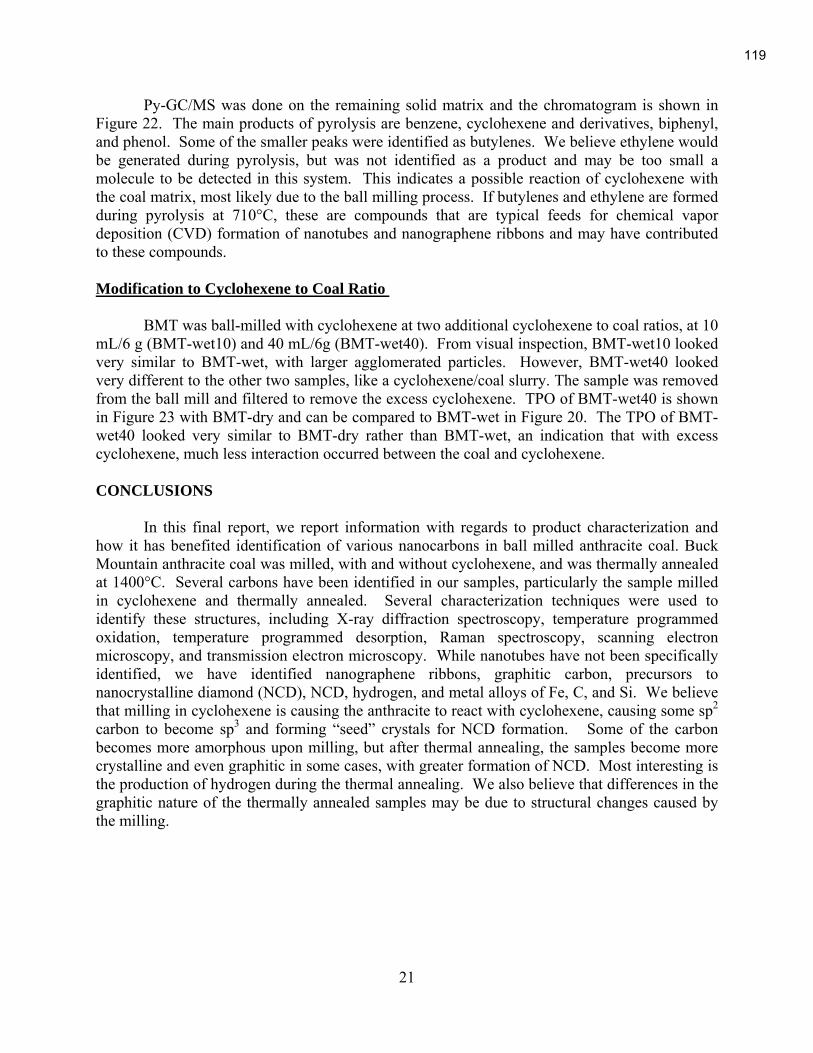
21
Py-GC/MS was done on the remaining solid matrix and the chromatogram is shown in Figure 22. The main products of pyrolysis are benzene, cyclohexene and derivatives, biphenyl, and phenol. Some of the smaller peaks were identified as butylenes. We believe ethylene would be generated during pyrolysis, but was not identified as a product and may be too small a molecule to be detected in this system. This indicates a possible reaction of cyclohexene with the coal matrix, most likely due to the ball milling process. If butylenes and ethylene are formed during pyrolysis at 710°C, these are compounds that are typical feeds for chemical vapor deposition (CVD) formation of nanotubes and nanographene ribbons and may have contributed to these compounds.
Modification to Cyclohexene to Coal Ratio
BMT was ball-milled with cyclohexene at two additional cyclohexene to coal ratios, at 10 mL/6 g (BMT-wet10) and 40 mL/6g (BMT-wet40). From visual inspection, BMT-wet10 looked very similar to BMT-wet, with larger agglomerated particles. However, BMT-wet40 looked very different to the other two samples, like a cyclohexene/coal slurry. The sample was removed from the ball mill and filtered to remove the excess cyclohexene. TPO of BMT-wet40 is shown in Figure 23 with BMT-dry and can be compared to BMT-wet in Figure 20. The TPO of BMT-wet40 looked very similar to BMT-dry rather than BMT-wet, an indication that with excess cyclohexene, much less interaction occurred between the coal and cyclohexene. CONCLUSIONS
In this final report, we report information with regards to product characterization and
how it has benefited identification of various nanocarbons in ball milled anthracite coal. Buck Mountain anthracite coal was milled, with and without cyclohexene, and was thermally annealed at 1400°C. Several carbons have been identified in our samples, particularly the sample milled in cyclohexene and thermally annealed. Several characterization techniques were used to identify these structures, including X-ray diffraction spectroscopy, temperature programmed oxidation, temperature programmed desorption, Raman spectroscopy, scanning electron microscopy, and transmission electron microscopy. While nanotubes have not been specifically identified, we have identified nanographene ribbons, graphitic carbon, precursors to nanocrystalline diamond (NCD), NCD, hydrogen, and metal alloys of Fe, C, and Si. We believe that milling in cyclohexene is causing the anthracite to react with cyclohexene, causing some sp2 carbon to become sp3 and forming “seed” crystals for NCD formation. Some of the carbon becomes more amorphous upon milling, but after thermal annealing, the samples become more crystalline and even graphitic in some cases, with greater formation of NCD. Most interesting is the production of hydrogen during the thermal annealing. We also believe that differences in the graphitic nature of the thermally annealed samples may be due to structural changes caused by the milling.
119

22
ACKNOWLEDGEMENTS
The authors wish to acknowledge Dr. Joe Kulik of the Penn State Materials Research
Institute and Dr. Humberto Gutierrez of the Penn State Physics Department for assistance in obtaining TEM micrographs, and Dr. John Badding and Mr. Jacob Caulkins of the PSU Chemistry Department for equipment time and assistance to obtain the Raman images. The authors would like to acknowledge the help of Dr. John W. Larsen and Dr. Harold H. Schobert, who participated in useful discussions about how cyclohexene might interact with coal.
The work in this project has been supplemented by another CPCPC project that was funded a few months after this project, “Mechano-Thermal Method To Produce Carbon Nanotubes,” for Award No. DE-FC26-03NT41874, Internal Agreement No. 2985-TPSU-DOE-1874. The second project provided funding for interpretation of the characterization and to understand the reactions that are taking place, which are being used to determine the limits of reactions and to help optimize the reaction conditions. Some data reported in this final report will also be included in the second project final report for purposes of cohesiveness.
120

23
REFERENCES
1. Gerstein, B.C., Murphy, P.D., Ryan, L.M., In: Coal Structure. Academic Press, New
York, 1982, Chapter 4. 2. van Krevelen, D.W., Coal: Typology–Chemistry–Physics–Constitution. Elsevier,
Amsterdam, 1981. 3. Pappano, P.J., Mathews, J.P., Schobert, H.H., Preprints, Amer. Chem. Soc. Div. Fuel
Chem. 44 (1999) 567. 4. Pappano, P.J., M.S. Thesis, The Pennsylvania State University, University Park, PA,
2000. 5. Pappano, P.J., PhD. Thesis, The Pennsylvania State University, University Park, PA,
2003. 6. Zeng, S., Rusinko, Jr., F., Schobert H.H., Penna. Energy Devel. Auth. Report, PEDA
9303-4019, 1996. 7. Atria, J.V., M.S. Thesis, The Pennsylvania State University, University Park, PA,
1995. 8. Atria, J.V., Ruskino, F., Schobert, H.H., Energy Fuels, 16 (6), 1343-1347, 2002. 9. Andrésen, J.M., Burgess, C.E., Pappano, P.J., Schobert, H.H., Fuel Proc. Tech., 85
(12), 1373-1392, 2004. 10. Andrésen, J.M., Zhang, Y., Burgess, C.E., and Schobert, H.H., Fuel Proc. Tech., 85
(12), 1361-1372, 2004. 11. Bessant, G.A.R., Walker Jr., P.L. Carbon, 32 1171, 1994. 12. Walker Jr., P.L., Almagro, A., Carbon, 33, 239, 1995. 13. Walker Jr., P.L., Imperial, G.R., Fuel, 74, 179, 1995. 14. Gergova, K., Eser, S., Schobert, H.H., Energy Fuels, 7, 661, 1993. 15. Gergova, K., Eser, S., Schobert, H.H., Klimkiewicz, M., Brown, P.W., Fuel. 74 1042,
1995. 16. Maroto-Valer, M.M., Tang, Z., Zhang, Y.Z., Fuel Proc. Tech., 86 (14-15), 1487-
1502, 2005. 17. Burgess-Clifford, C.E., Maroto-Valer, M.M., Hsaio, E., Tang, Z., and Weiss, B.,
Final Report, Consortium for Premium Carbon Products from Coal, “Understanding Anthracite Properties Towards Its Use as Intumescent Material for Polyurethane Foams,” DOE Award number: DE-FC26-03NT41874, Internal Agreement Number: 2689-TPSU-DOE-1874, August 31, 2005.
18. Lueking, A.D., Principal Investigator, Final and Quarterly Reports for “Nanostructured Anthracite-Metal Composites for Hydrogen Storage,” Internal Agreement No. 2670-TPSU-DOE-1874, for US DOE Prime Award No.: DE-FC26-03nt41874, (a) 1st Quarterly Report, June 15, 2004 (b) 2nd Quarterly Report, Sept. 15, 2004, (c) 3rd Quarterly Report, Dec. 15, 2004, (d) 4th Quarterly Report, March 31, 2005, and (e) Final Report.
19. Orimo, S., Matsushima, T., Fujii, H., Fukunaga, T., Majer, G. J Appl Phys, 90, 1545, 2001.
20. Hirscher, M., Becher, M.; Haluska, M., von Zeppelin, F., Chen, X. H., Dettlaff-Weglikowska, U., Roth, S., J Alloy Compd, 356, 433, 2003.
121

24
21. Hirscher, M., Becher, M., Haluska, M., Quintel, A., Skakalova, V., Choi, Y. M., Dettlaff-Weglikowska, U., Roth, S., Stepanek, I., Bernier, P., Leonhardt, A., Fink, J., Journal of Alloys and Compounds, 330, 654, 2002.
22. Ichikawa, T., Chen, D. M., Isobe, S., Gomibuchi, E., Fujii, H., Materials Science and
Engineering B, 108, 138, 2004. 23. Imamura, H., Sakasai, N., Kajii, Y., J Alloy Compd, 232, 218, 1996. 24. Imamura, H., Sakasai, N., Fujinaga, T., Journal of Alloys and Compounds, 253, 34,
1997. 25. Imamura, H., Takesue, Y., Tabata, S., Shigetomi, N., Sakata, Y., Tsuchiya, S., Chem
Commun, 2277, 1999. 26. Imamura, H., Tabata, S., Takesue, Y., Sakata, Y., Kamazaki, S., International
Journal of Hydrogen Energy, 25, 837, 2000. 27. Imamura, H., Tabata, S., Shigetomi, N., Takesue, Y., Sakata, Y., J Alloy Compd, 330,
579, 2002. 28. Iwakura, C., Inoue, H., Furukawa, N., Nohara, S., Mater Trans, 43, 2706, 2002. 29. Iwakura, C., Inoue, H., Furukawa, N., Nohara, S., Electrochemistry, 71, 776, 2003. 30. Janot, R., Aymard, L., Rougier, A., Nazri, G. A., Tarascon, J., M. J Mater Res, 18,
1749, 2003. 31. Bouaricha, S., Dodelet, J. P., Guay, D., Journal of Materials Research, 16, 2893,
2001. 32. Bouaricha, S., Dodelet, J. P., Guay, D., Huot, J., Boily, S., Schulz, R., J Alloy Compd,
307, 226, 2000. 33. Imamura, H., Usui, Y., Takashima, M., J Less-Common Met, 175, 171, 1991. 34. Imamura, H., Nakamura, M., Z Phys Chem, 183, 157, 1994. 35. Wu, F., Zhu, J., Ibe, K., Oikawa, T., Compos Sci Technol, 58, 77, 1998. 36. Bobet, J. L., Grigorova, E., Khrussanova, M., Khristov, M., Stefanov, P., Peshev, P.,
Radev, D., J Alloy Compd, 366, 298, 2004. 37. Dal Toe, S., Lo Russo, S., Maddalena, A., Principi, G., Saber, A., Sartori, S., Spataru,
T., Materials Science and Engineering B, 108, 24, 2004. 38. Bobet, J.-L., Journal of Alloys and Compounds 2003, In Press. 39. Fukunaga, T., Itoh, K., Orimo, S., Aoki, M., Fujii, H., J Alloy Compd, 327, 224, 2001. 40. Shantha, K., Varma, K. B. R., Mat Sci Eng B-Solid, 60, 66, 1999. 41. Bennett, K., Varma, R., Von Dreele, R. B., Scripta Mater, 40, 825, 1999. 42. Burgess-Clifford, C. E., Narayanan, D., Van Essendelft, D. T., Jain, P., Sakti, A.,
Lueking, A. D. Carbon, 2006, In Preparation. 43. Chen, Y., Conway, M.J., and Fitzgerald, J.D., Appl. Phys. A, 76, 633-636, 2003. 44. Chen, Y., Conway, M.J., Fitzgerald, J.D., Williams, J.S., and Chadderton, L.T.,
Carbon, 42, 1543-1548, 2004. 45. Casiraghi, C., Ferrari, A.C., Robertson, J., Phys. Rev. B, 72, 085401, 2005. 46. Pradhan, B.K., Sumanasekera, G.U., Adu, K., Romero, H.E., Williams, K.A., Eklund,
P.C., Physica B, 323, 115, 2002. 47. Centrone, A., Brambilla, L., Zerbi, G., Phys. Rev. B, 71, 245406, 2005. 48. Franklin, R., Acta Cryst., 4, 253, 1951. 49. Franklin, R., Proc. Roy. Soc. Ser. A., 209, 196, 1951. 50. Oberlin, A., Terriere, G., Carbon, 13 367, 1975. 51. Oberlin, A., Carbon, 17, 7, 1979.
122

25
52. Oberlin, A., Carbon, 22, 521, 1984. 53. Conrad, B., Principal Investigator, Final Report for “Anthracite Feedstocks for
Specialty Graphite Production,” CPCPC, DOE Prime Award No.: DE-FC26-98FT40350, July 1, 2000.
54. Stansberry, P., Principal Investigator, Final Report for “Anthracite Filler and Coal Extract Binder for Development of Isostatically-Molded Graphite,” CPCPC, DOE Prime Award No.: DE-FC26-98FT40350, July 1, 2003.
55. González, D., Montes-Morán, M.A., Garcia, A.B., Energy Fuels, 17, 1324, 2003. 56. González, D., Montes-Morán, M.A., Suárez-Ruiz, I., Garcia, A.B., Energy Fuels, 18,
365, 2004. 57. González, D., Montes-Morán, M.A., Garcia, A.B., Energy Fuels, 19, 263, 2005. 58. Bustin, R., Rouzaud, J.N., Ross, J., Carbon, 33, 679, 1995. 59. Couhaut, N., Blanche, C., Dumas, D., Guet, J.M., Rouzaud, J.N., Carbon, 38, 1391,
2000. 60. Evans, E., Jenkins, J., Thomas, J., Carbon, 10, 637, 1972. 61. Burgess-Clifford, C.E., Lueking, A.D., Naranayan, D., 1st Quarterly Report,
“Nanocarbons from Anthracite Coal,” Internal Agreement No. 2875-TPSU-DOE-1874, for Award No.: DE-FC26-03NT4187, June 15, 2005
62. Burgess-Clifford, C.E., Lueking, A.D., Jain, P., Van Essendelft, D.T., Naranayan, D., 2nd Quarterly Report, “Nanocarbons from Anthracite Coal,” Internal Agreement No. 2875-TPSU-DOE-1874, for Award No.: DE-FC26-03NT4187, September 15, 2005.
63. Burgess-Clifford, C.E., Lueking, A.D., Jain, P., Van Essendelft, D.T., Naranayan, D., 3rd Quarterly Report, “Nanocarbons from Anthracite Coal,” Internal Agreement No. 2875-TPSU-DOE-1874, for Award No.: DE-FC26-03NT4187, December 15, 2005.
64. Burgess-Clifford, C.E., Lueking, A.D., Jain, P., Van Essendelft, D.T., Naranayan, D., 1st Quarterly Report, “Mechano-Thermal Method to Produce Carbon Nanotubes from Coal,” Internal Agreement No. 2875-TPSU-DOE-1874, for Award No.: DE-FC26-03NT4187, October 15, 2005.
65. Burgess-Clifford, C.E., Lueking, A.D., Jain, P., Van Essendelft, D.T., Naranayan, D., Gutierrez, H., Fonseca Alverez, D., 2nd Quarterly Report, “Mechano-Thermal Method to Produce Carbon Nanotubes from Coal,” Internal Agreement No. 2875-TPSU-DOE-1874, for Award No.: DE-FC26-03NT4187, January 15, 2005.
66. Lueking, A.D., Gutierrez, H.R., Fonseca, D.A., Narayanan, D.L., Van Essendelft, D.T., Jain, P., Clifford, C.E.B., J. Amer. Chem. Soc., 128 (24), 7758-7760, 2006.
67. Dyrkacz, G.R., Bloomquist, C.A.A., Energy Fuels, 8, 680-689, 1994. 68. Barambiom, N.K., In Mechanochemistry of Polymers, Ed. W.F. Watson, Macalaren:
London, 1964. 69. Kuznetsov, P.N., Kuznetsova, L.I., Chumakov, V.G., Moiseeva, G.A., Mat Res
Innovat, 3, 340-346, 2000. 70. Sanada, Y. Sasaki, M., Kumagai,H. Aizawa, S., Nishizawa, T., Mineo, T., Chiba, T.,
Fuel, 81, 1397-1402, 2002. 71. Sanada, Y., Kumagai, H., Sasaki, M., Fuel, 73, 840, 1994. 72. Zhao, X. Z., Roy, R., Cherian, K. A., Badzian, A., Nature, 385, 513, 1997. 73. Pierson, H. O., Handbook of Carbon, Graphite, Diamond and Fullerenes: Properties,
Processing and Applications. ed.; Noyes Publications: Mill Road, Park Ridge, New Jersey, 1993.
123

26
74. Kurmashev, V.I., Timoshkov, Y.V., Orehovskaja, T.I., Timoshkov, V.Y., Physics of
the Solid State, 46, 696, 2004. 75. Zhang, W.J., Wu, Y., Chan, C.Y., Wong, W.K., Meng, X.M., Bello, I., Lifshitz, Y.,
Lee, S.T., Diam. Relat. Mater., 13, 1037, 2004. 76. Alimova, A. N., Chubun, N.N., Belobrav, P. I.; Detkov, P. Y.; Zhirnov, V. V., J. Vac.
Sci. Technol. B, 17, 715, 1999. 77. Show, Y., Witek, M. A., Sonthalia, P., Swain, G. M., Chem. Mater., 15, 879, 2003. 78. Choi, W. B., Cuomo, J. J., Zhirnov, V. V., Myers, A. F., Hren, J. J., Appl. Phys. Lett.,
68, 720, 1996. 79. Ralchenko, V., Karabuto, A., Vlasov, I., Frolov, V., Konov, V., Gordeer, S., Zhukov,
S., Dementjev, A., Diamond Relat. Mater., 8, 1496, 1999. 80. Jiang, N., Eguchi, K., Noguchi, S., Inaoka, T., Shintani, Y., J. Cryst. Growth, 236,
577, 2002. 81. Wang, J., Butler, J. E., Hsu, D. S., Nguyen, C.T.-C., 15th IEEE Int. Conf. Micro
Electromechan. Syst, 657, 2002. 82. Sekaric, L., Parpia, J. M., Craighead, H. G., Feygelson, T., Houston, B. H., Butler, J.,
E. Appl. Phys. Lett., 81, 4455, 2002. 83. Philip, J., Hess, P., Feygelson, T., Butler, J. E., Chattopadhyay, S., Chen, K. H.,
Chen, L.C., J. Appl. Phys.., 93, 2164, 2003. 84. Yang, W., Auciello, O., Butler, J. E., Cai, W., Carlisle, J. A., Gerbi, J. E., Gruen, D.
M., Knickerbocker, T., Lasseter, T. L., Russel, J. N., Jr., Smith, L. M., Hamers, R. J., Nat. Mater., 1, 253, 2002.
85. Chen, P. W., Huang, F. L., Yun, S. R., Carbon, 41, 2093, 2003. 86. Raty, J. Y., Galli, G., Bostedt, C., van Buuren, T. W., Terminello, L. J., Phys Rev
Lett, 90, 2003. 87. Affoune, A. M., Prasad, B. L. V., Sato, H., Enoki, T., Kaburagi, Y., Hishiyama, Y.,
Chem Phys Lett, 348, 17, 2001. 88. Kuznetsov, V. L., Chuvilin, A. L., Moroz, E. M., Kolomiichuk, V. N., Shaikhutdinov,
S. K., Butenko, Y. V., Malkov, I. Y., Carbon, 32, 873, 1994. 89. Kuznetsov, V. L., Chuvilin, A. L., Butenko, Y. V., Malkov, I. Y., Titov, V. M.,
Chem Phys Lett, 222, 343. 1994. 90. Kuznetsov, V. L., Chuvilin, A. L., Butenko, Y. V., Stankus, S. V., Khairulin, R. A.,
Gutakovskii, A. K., Chem Phys Lett, 289, 353, 1998. 91. Kuznetsov, V. L., Zilberberg, I. L., Butenko, Y. V., Chuvilin, A. L., Segall, B., J Appl
Phys, 86, 863, 1999. 92. Kuznetsov, V. L., Butenko, Y. V., Zaikovskii, V. I., Chuvilin, A. L., Carbon, 42,
1057–1061, 2004. 93. Prawer, S., Nugent, K. W., Jamieson, D. N., Orwa, J. O., Bursill, L. A., Peng, J. L.,
Chem Phys Lett, 332, 93, 2000. 94. Orwa, J. O., Nugent, K. W., Jamieson, D. N., Prawer, S., Phys Rev B, 62, 5461, 2000. 95. Wen, C., Jin, Z. H., Liu, X. X., Li, X., Guan, J. Q., Sun, D. Y., Lin, Y. R., Tang, S.
Y., Zhou, G., Lin, J. D., Spectrosc Spect Anal, 25, 681, 2005. 96. Dresselhaus, M. S., Dresselhaus, G., Pimenta, M. A., Eklund, P. C., Raman Scattering
in Carbon Materials. In Analytical Applications of Raman Spectroscopy, ed.; Pelletier, M. J., Eds., Blackwell Science: Ann Arbor, 1999; pp 367.
97. Ribeiro, M., Pereyra, I., Alayo, M. I., Thin Solid Films, 426, 200, 2003.
124

27
98. Dahl, J. E., Liu, S. G., Carlson, R. M. K., Science, 299, 96, 2003. 99. Donnet, J.B., Lemoigne, C., Wang, T.K., Peng, C.M., Samirant, M., Eckhardt, A.,
BULLETIN DE LA SOCIETE CHIMIQUE DE FRANCE, 134, 875, 1997. 100. Zhang, D. J., Zhang, R. Q., J Phys Chem B, 109, 9006, 2005. 101. Banhart, F., Ajayan, P. M., Nature, 382, 433, 1996. 102. Banhart, F., Ajayan, P. M., Adv Mater, 9, 261, 1997. 103. Zaiser, M., Lyutovich, Y., Banhart, F., Phys Rev B, 62, 3058, 2000. 104. Zaiser, M., Banhart, F., Phys Rev Lett, 79, 3680, 1997. 105. Yusa, H., Diam Relat Mater, 11, 87, 2002. 106. Orimo, S., Majer, G., Fukunaga, T., Zuttel, A., Schlapbach, L., Fujii, H., Appl Phys
Lett, 75, 3093, 1999. 107. U.S. Department of Energy, Office of Hydrogen, Fuel Cells and Infrastructure
Technologies. Fact Sheet Series: Hydrogen Production from Coal. 108. U.S. Department of Energy, Office of Hydrogen, Fuel Cells and Infrastructure
Technologies. Hydrogen Storage "Think Tank" Report.; Washington, DC, March 14, 2003.
109. Froudakis, G. E., J Phys-Condens Mat, 14, R453, 2002. 110. Dillon, A.C. et al., Nanostructured Carbon and Carbon/Metal Hybrid Materials for
Vehicular Hydrogen Storage. 111. Yildirim, T., Gulseren, O., Kilic, C., Ciraci, S., Phys Rev B, 62, 12648, 2000. 112. Yildirim, T., Gulseren, O., Ciraci, S., Phys Rev B, 6407, 075404, 2001. 113. No increase in baseline is observed upon loading the TiH2 calibration standards nor
the BMT coal precursor. 114. Orimo, S., Zuttel, A., Schlapbach, L., Majer, G., Fukunaga, T., Fujii, H., J Alloy
Compd, 356, 716, 2003. 115. Bacsa, W. S., Lannin, J. S., Pappas, D. L., Cuomo, J., J. Phys Rev B, 47, 10931, 1993. 116. Ferrari, A. C., Robertson, J., J. Phys Rev B, 64, 075414, 2001. 117. Ferro, Y., Marinelli, F., Allouche, A., J Chem Phys, 116, 8124, 2002. 118. Cheng, H., Pez, G. P., Cooper, A. C., J. Am. Chem. Soc., 123, 5845, 2001. 119. Sriraman, S., Agarwal, S., Aydil, E. S., Maroudas, D., Nature, 418, 62, 2002. 120. Barnard, A. S.;, Terranova, M. L., Rossi, M., Chemistry of Materials, 17, 527, 2005. 121. Zhao, Y. F., Kim, Y. H., Dillon, A. C., Heben, M. J., Zhang, S. B., Phys Rev Lett, 94,
155504, 2005. 122. Chambers, A., Park, C., Baker, R. T. K., Rodriguez, N. M., J Phys Chem B, 102,
4253, 1998. 123. Gupta, B. K., Srivastava, O. N., Int J Hydrogen Energ, 26, 857, 2001. 124. Anderson, A. B., Kostadinov, L. N., Angus, J. C., Phys Rev B, 67, 233402, 2003. 125. Mehandru, S. P., Anderson, A. B., Angus, J. C., J Mater Res, 7, 689, 1992. 126. Saada, D., Adler, J., Kalish, R., Phys Rev B, 61, 10711, 2000. 127. Quinn, D. F., Carbon, 40, 2767, 2002.
125

28
Table 1: Ultimate and proximate analysis of Buck Mountain (BMT) anthracite coal, provided by the Penn State coal sample bank. Analytical Method Value
Moisture, as received 6.53
Ash, wt %, dry 6.83
Volatile Matter, wt %, dry 3.65
Fixed Carbon, wt%, dry 89.52
Carbon, wt %, dmmf 88.85
Hydrogen, wt %, dmmf 1.29
Nitrogen, wt %, dmmf 0.78
Sulfur, wt %, dmmf 0.49
Oxygen (by difference), wt %, dmmf 1.76
Vitrinite reflectance, % 5.45
Inertinite reflectance, % 14.1
Table 2: XRD parameters of BMTsamples, before and after milling, before and after heat treatment.
Processing Method d-spacing (Å) Lc (Å) La (Å) BMT 3.42 12 38
BMT-HT 3.41 (±0.4) 20 40 BMT-dry 3.40 18 36
BMT-dry-HT 3.45 29 40 BMT-wet 3.49 12 44
BMT-wet-HT 3.39 50 44 Table 3: Ash content of BMT samples, before and after milling, before and after heat treatment.
Processing of PSOC 1468
Total Ash
(wt%)
Ironc
(wt%)
Magnesiumc
(wt %)
Aluminumc
(wt%)
BMT 6.60a 0.494 0.060 1.337
BMT-1400 8.23 n.d. n.d. n.d.
BMT-80 6.80a 0.78 0.027 1.200
BMT-80-1400 13.10 n.d. n.d. n.d.
BMT-80CH 10.82a 3.84 0.041 0.982
BMT-80CH-1400 22.20 n.d. n.d. n.d.
a Ash content measured by Proximate Analysis on different sample than earlier PSU characterization b Ash content measured by TGA c Individual metal content measured by Neutron Activation Analysis
126

29
Figure 1: Schematic of process conditions.
Dry
80 h milling
Heat Treatment
1400°C, argon
BMT BMT-dry BMT-wet
BMT-HT BMT-dry-HT BMT-wet-HT
Cyclohexene solvent
80 h milling
BMT-wet-HT-P
Purification with
HCl and NaOH
Heat Treatment
1400°C, argon
Heat Treatment
1400°C, argon
As received
No additional milling
127
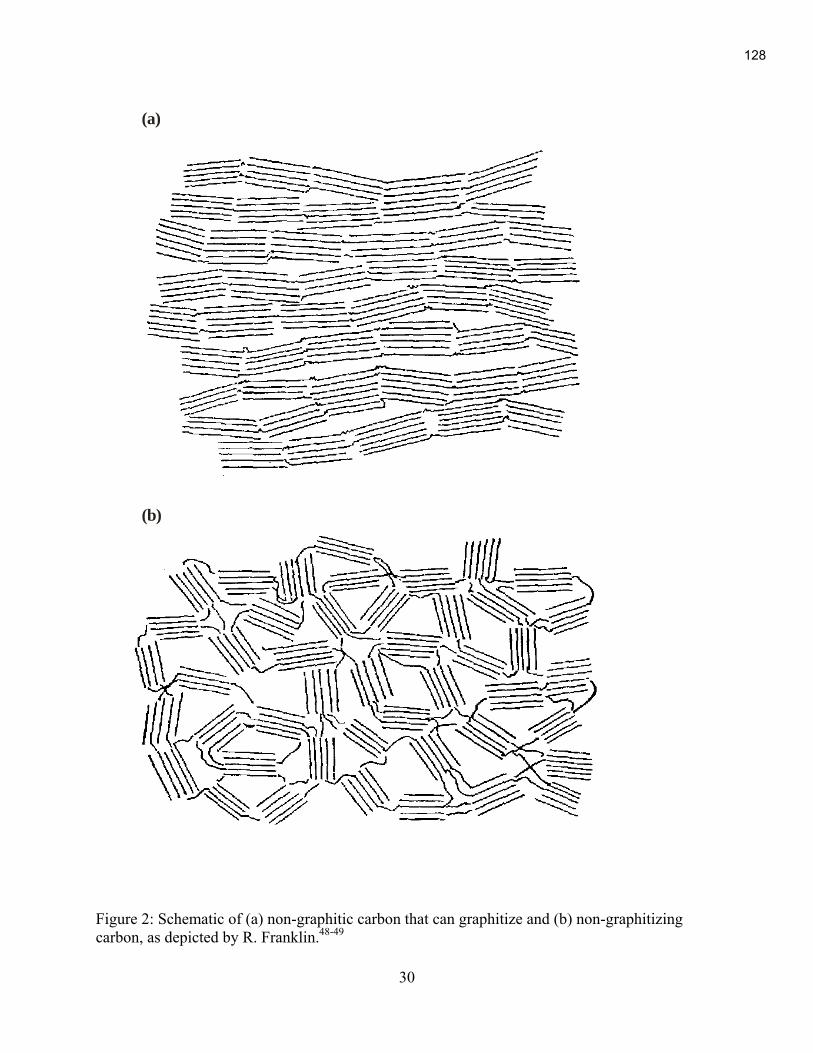
30
(a)
(b)
Figure 2: Schematic of (a) non-graphitic carbon that can graphitize and (b) non-graphitizing carbon, as depicted by R. Franklin.48-49
128
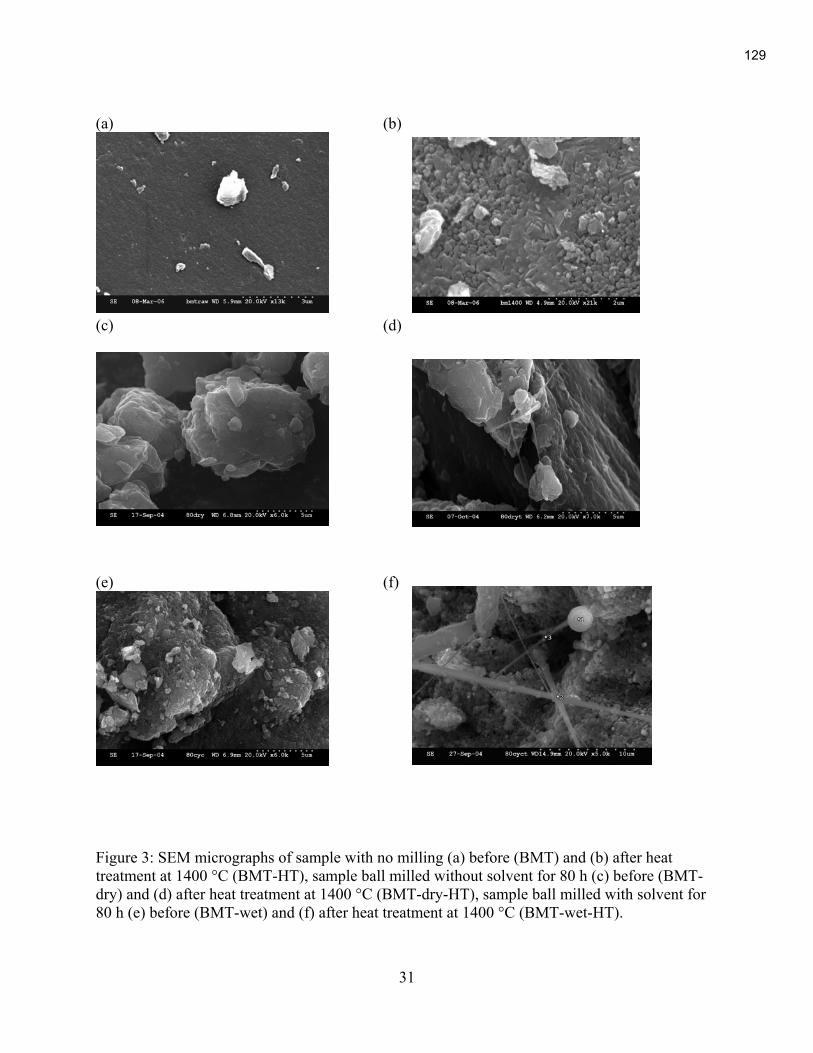
31
(a) (b) (c) (d) (e) (f) Figure 3: SEM micrographs of sample with no milling (a) before (BMT) and (b) after heat treatment at 1400 °C (BMT-HT), sample ball milled without solvent for 80 h (c) before (BMT-dry) and (d) after heat treatment at 1400 °C (BMT-dry-HT), sample ball milled with solvent for 80 h (e) before (BMT-wet) and (f) after heat treatment at 1400 °C (BMT-wet-HT).
129
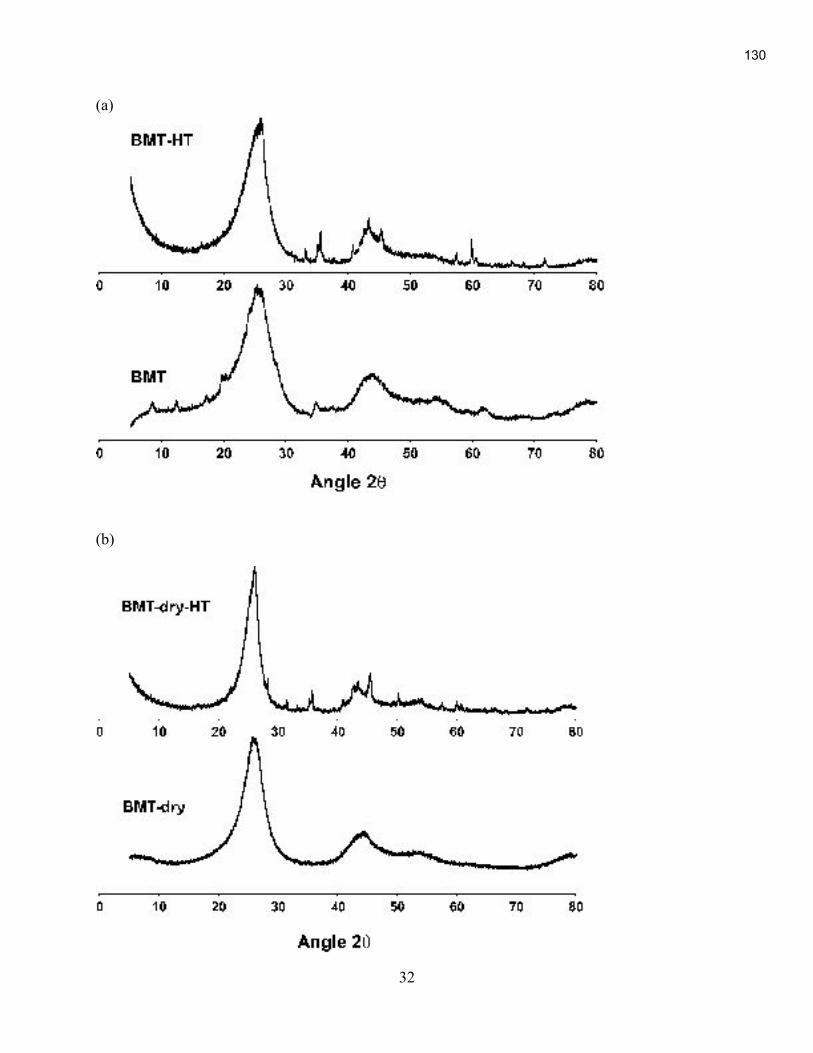
32
(a)
(b)
130
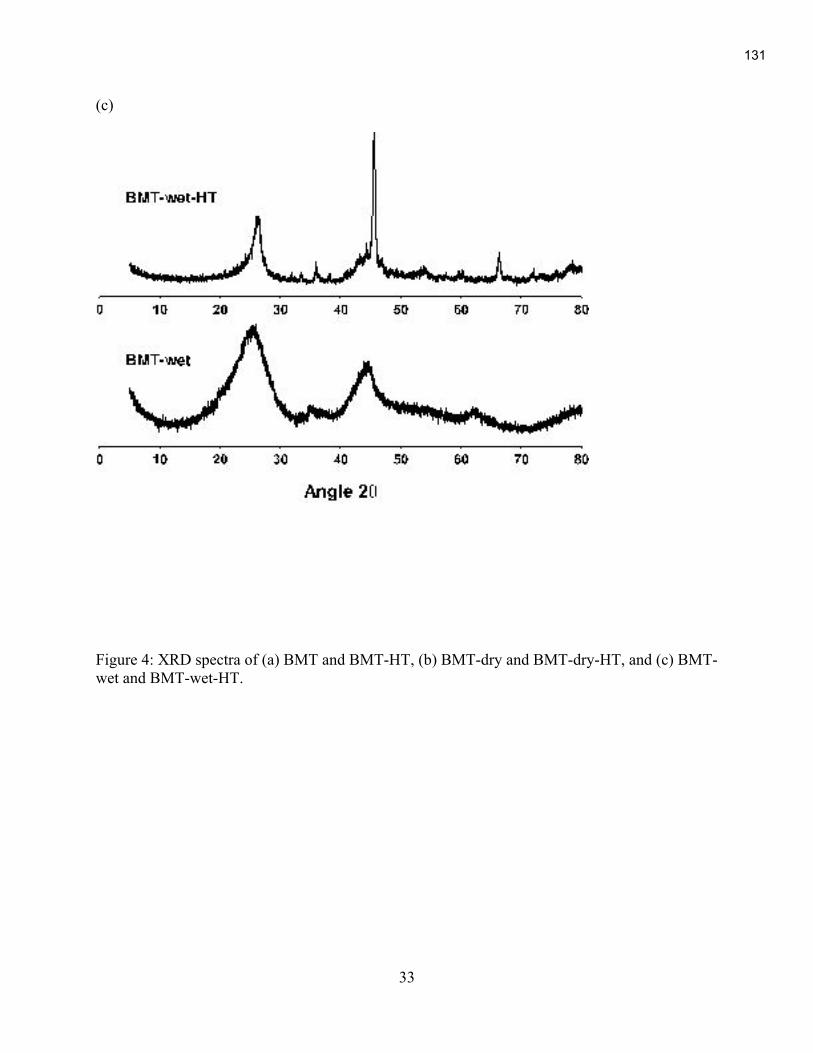
33
(c)
Figure 4: XRD spectra of (a) BMT and BMT-HT, (b) BMT-dry and BMT-dry-HT, and (c) BMT-wet and BMT-wet-HT.
131
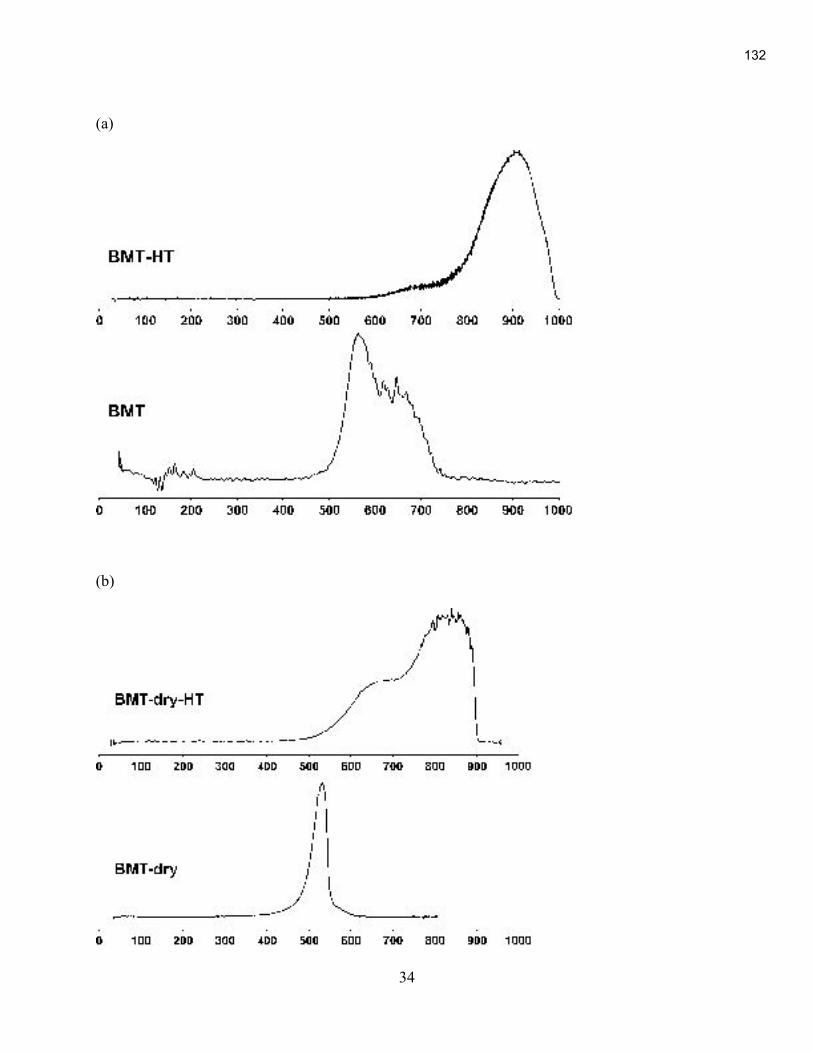
34
(a)
(b)
132

35
(c)
Figure 5: TPO, the derivative of the mass loss for (a) BMT and BMT-HT, (b) BMT-dry and BMT-dry-HT, and (c) BMT-wet and BMT-wet-HT.
Figure 6: EDS map of elements for sample BMT-wet-HT (based on SEM in Figure 3f). The elements mapped are Fe, Si, and C.
133

36
(a) (b)
(c)
5 μm5 μm
134

37
(d)
(e)
Figure 7: Structures formed upon mechano-thermal processing of anthracite sample BMT-80CH-1400. The technique resulted in range of graphitized and tubular structures, including (a) nanographitic ribbons at 5 nm and expansion of highlighted portion, (b) highly graphitic, curved regions, (c) graphitic tubes; (d) overlapping graphitic tubes; and (e) larger diameter tube representative of silicon-based structure.
135

38
Figure 8: Raman spectra of BMT and heat-treated samples.
BMT-dry-HT
BMT-wet-HT
BMT-HT
BMT
IIDD/I/IGG
0.50.5
0.50.5
1.21.2
136
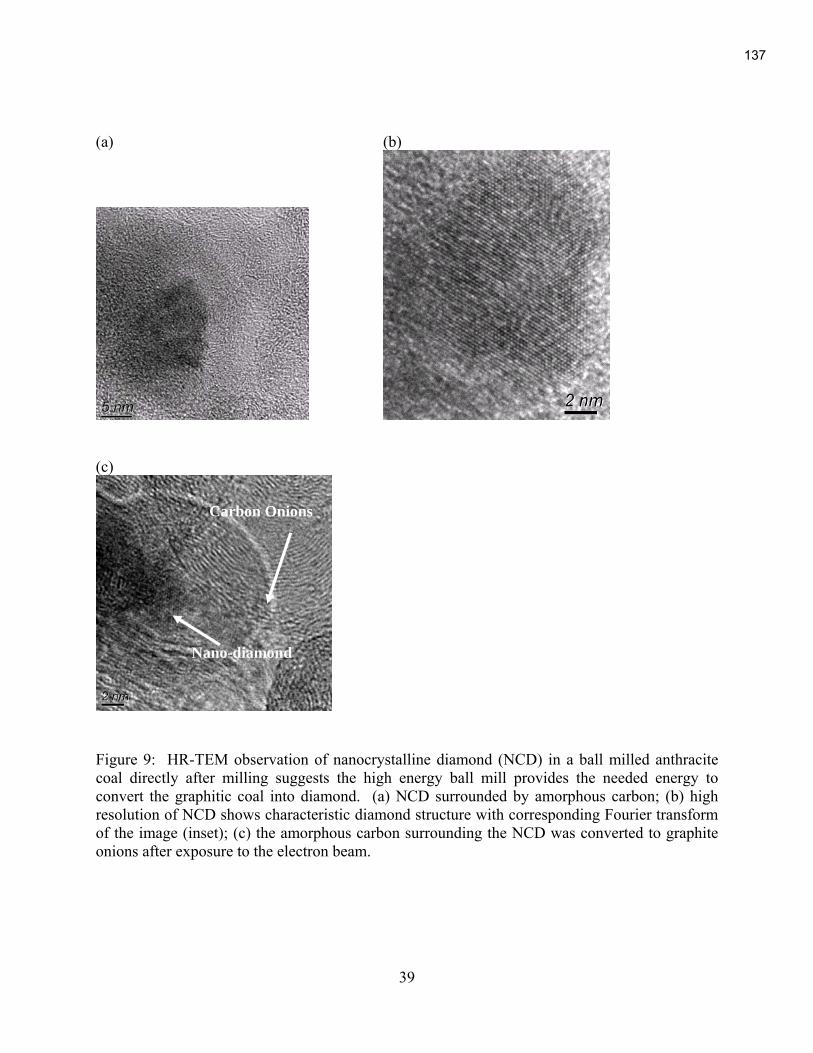
39
(a) (b)
(c)
Carbon Onions
Nano-diamond
Carbon Onions
Nano-diamond
Figure 9: HR-TEM observation of nanocrystalline diamond (NCD) in a ball milled anthracite coal directly after milling suggests the high energy ball mill provides the needed energy to convert the graphitic coal into diamond. (a) NCD surrounded by amorphous carbon; (b) high resolution of NCD shows characteristic diamond structure with corresponding Fourier transform of the image (inset); (c) the amorphous carbon surrounding the NCD was converted to graphite onions after exposure to the electron beam.
137
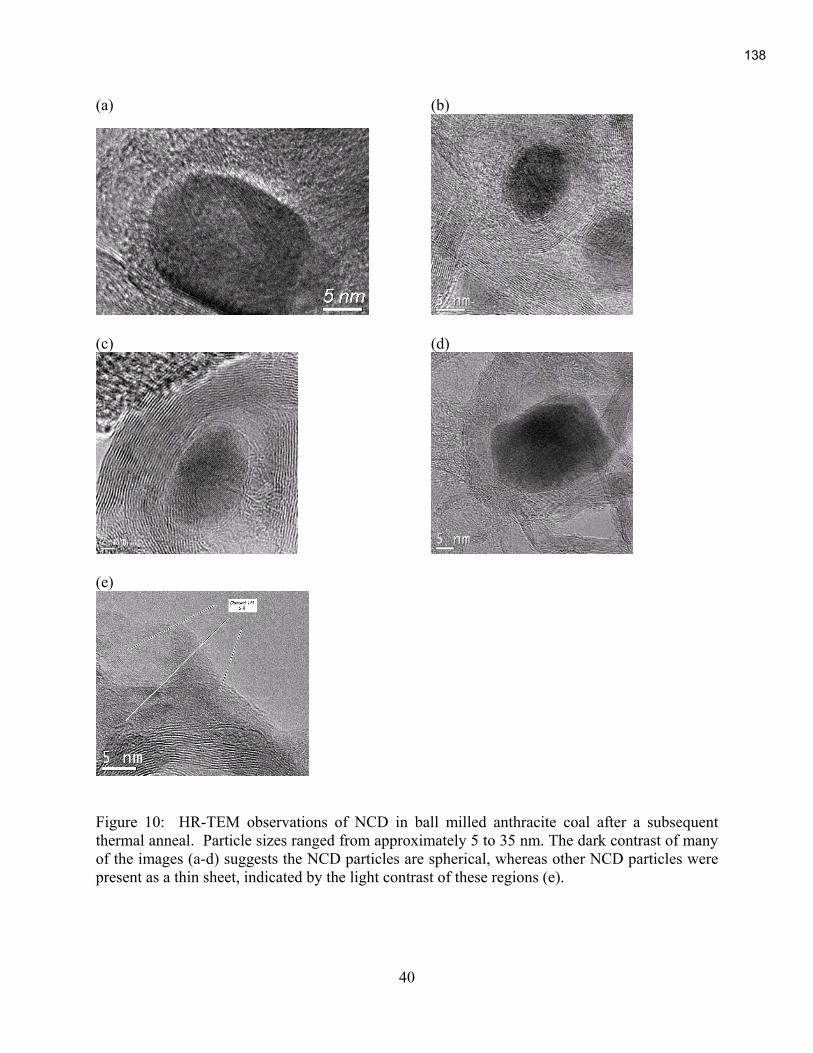
40
(a) (b)
(c) (d)
(e)
Figure 10: HR-TEM observations of NCD in ball milled anthracite coal after a subsequent thermal anneal. Particle sizes ranged from approximately 5 to 35 nm. The dark contrast of many of the images (a-d) suggests the NCD particles are spherical, whereas other NCD particles were present as a thin sheet, indicated by the light contrast of these regions (e).
138

41
111
022
111
200
f.c.c B = z = [011]
FT
Diamond
Graphite
Graphite
A B
C
Figure 11: HR-TEM of a NCD particle surrounded by a fullerene carbon onion (a). Fourier Transform of the image indicates the characteristic diamond structure (b), and high-resolution of the NCD indicates the characteristic 2.06 Å lattice of diamond.
139

42
(a) (b)
2.0 Å
3.33 Å
2.0 Å2.0 Å
3.33 Å3.33 Å
Figure 12: Region showing transition from sp3-hybridized carbon to sp2-hybridized carbon. The boxed area in (a) is shown in high resolution in (b).
140
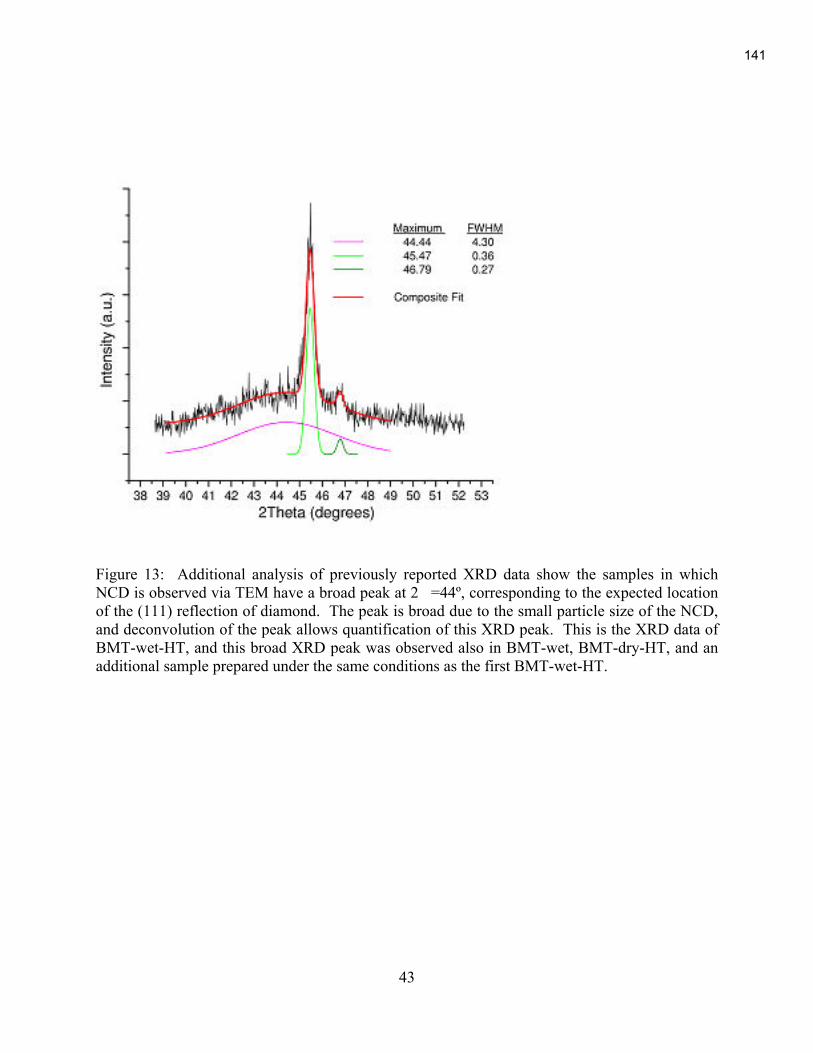
43
Figure 13: Additional analysis of previously reported XRD data show the samples in which NCD is observed via TEM have a broad peak at 2=44º, corresponding to the expected location of the (111) reflection of diamond. The peak is broad due to the small particle size of the NCD, and deconvolution of the peak allows quantification of this XRD peak. This is the XRD data of BMT-wet-HT, and this broad XRD peak was observed also in BMT-wet, BMT-dry-HT, and an additional sample prepared under the same conditions as the first BMT-wet-HT.
141

44
(a) (b)
Figure 14: Raman spectroscopy of BMT-wet-HT-P provided corroborating evidence for the formation of NCD. The D (diamond) peak at 1333 cm-1 is too broad to be conclusively assigned to diamond, however a peak at 1620 cm-1 has been previously observed in NCD, and a peak at 480 cm-1 has been claimed to be the ‘signature peak for NCD. The analysis of the low frequency Raman peaks is complicated by the presence of the natural mineral matter of the coal.
Figure 15: Schematic of the Diels Alder Condensation Reaction as one possible contributor to NCD formation. An olefin can add 1,4 across the central ring of acenes as shown for anthracene. The cyclohexene wetting agent may have precipitated with the sp2 hybridized coal end groups to provide a three-dimensional sp3 structure that lead to NCD formation. Particles milled with cyclohexene have appear to have more NCD (based on XRD), but NCD is also observed for samples milled without cyclohexene after annealing (contributions by Dr. John W. Larsen and Dr. Harold H. Schobert).
142

45
Figure 16. TDS Hydrogen evolution for several preparations of BMT-wet (a-c) relative to the BMT coal precursor (d). The table (inset) summarizes the released hydrogen amount and the storage conditions. All samples were exposed to air prior to H2 TDS.
143
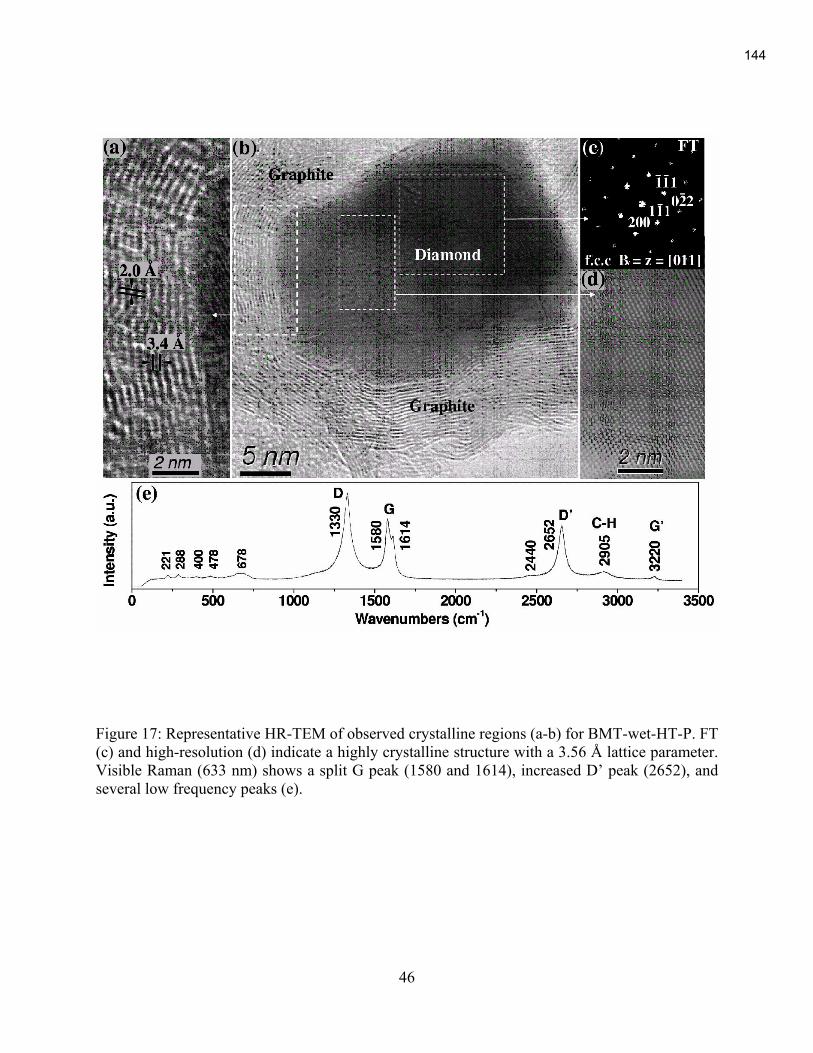
46
Figure 17: Representative HR-TEM of observed crystalline regions (a-b) for BMT-wet-HT-P. FT (c) and high-resolution (d) indicate a highly crystalline structure with a 3.56 Å lattice parameter. Visible Raman (633 nm) shows a split G peak (1580 and 1614), increased D’ peak (2652), and several low frequency peaks (e).
144
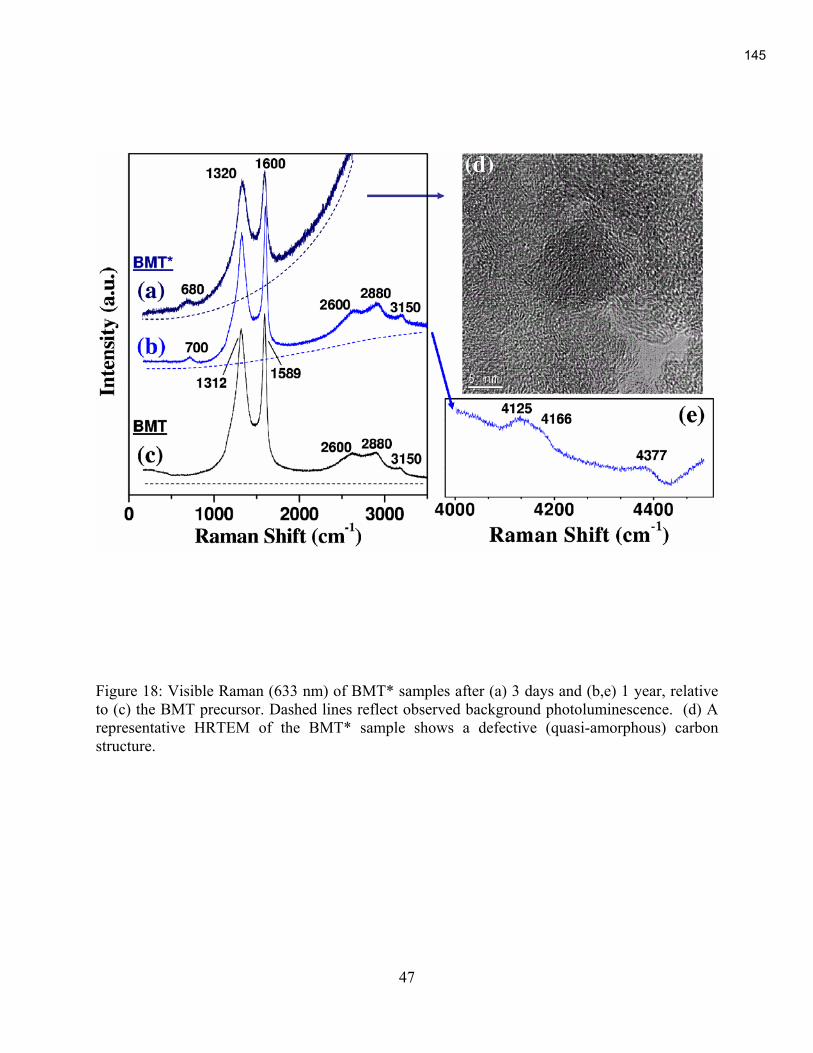
47
Figure 18: Visible Raman (633 nm) of BMT* samples after (a) 3 days and (b,e) 1 year, relative to (c) the BMT precursor. Dashed lines reflect observed background photoluminescence. (d) A representative HRTEM of the BMT* sample shows a defective (quasi-amorphous) carbon structure.
145
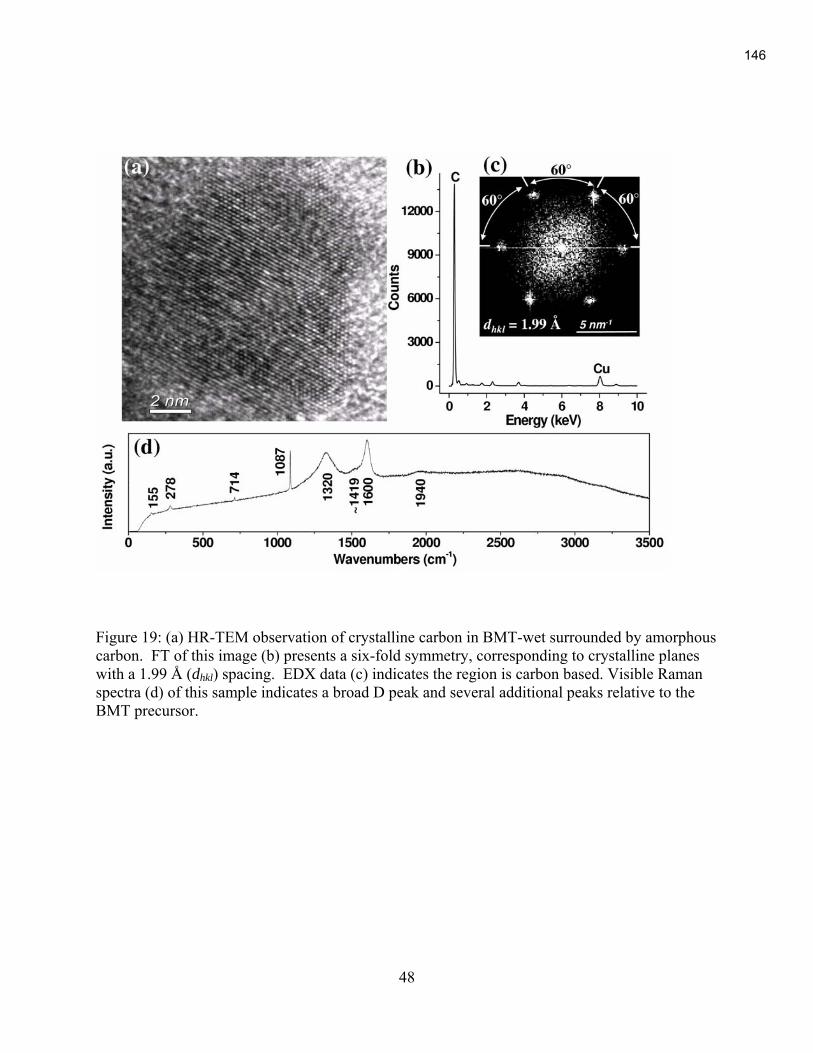
48
Figure 19: (a) HR-TEM observation of crystalline carbon in BMT-wet surrounded by amorphous carbon. FT of this image (b) presents a six-fold symmetry, corresponding to crystalline planes with a 1.99 Å (dhkl) spacing. EDX data (c) indicates the region is carbon based. Visible Raman spectra (d) of this sample indicates a broad D peak and several additional peaks relative to the BMT precursor.
146

49
(a)
(b)
(c)
Figure 20: TPO of (a) BMT-wet2, (b) BMT-wet-Vac, and (c) BMT-wet-HT.
147

50
Figure 21: GC/MS of extract from BMT-wet-extracted.
148

51
Figure 22: Py-GC/MS of remaining coal matrix after extraction from BMT-wet-extracted.
149

52
(a)
(b)
Figure 23: TPO of (a) BMT-dry and (b) BMT-wet40.
150
- i -
ADAPTING ANTHRACITE COAL AND STOCKPILED
ANTHRACITE FINES TO GREEN SAND IRON FOUNDRIES
CPCPC Final Report
Reporting Period Start Date: March 1, 2005 Reporting Period End Date: June 30, 2006
Principal Author(s) from Penn State: Fred Cannon He Huang Yujue Wang Robert Voigt
Jason Clobes
Principal Author(s) from Neenah Foundry: Jeff Goudzwaard
Report Issued: July 2006 DOE Award Number: 2873-TPSU-DOE-1874
Principal Investigator: Fred S. Cannon, Professor Department of Civil and Environmental Engineering
The Pennsylvania State University 212 Sackett Engineering Building
University Park, PA, 16802 Tel: 814-863-8754
Email: [email protected]
151

- ii -
DISCLAIMER
This report was prepared as an account of work sponsored by an agency of the United States Government. Neither the United States Government nor any agency thereof, nor any of their employees, makes any warranty, express or implied, or assumes any legal liability or responsibility for the accuracy, completeness, or usefulness of any information, apparatus, product, or process disclosed, or represents that its use would not infringe privately owned rights. Reference, herein to any special commercial product, process, or service by trade name, trademark, manufacturer or otherwise does not necessarily constitute or imply its endorsement, recommendation, or favoring by the United States Government or any agency thereof. The view and opinions of authors expressed therein do not necessarily state or reflect those of the United States Government or any agency thereof.
152
- iii -
Abstract
Characterization of properties and performance of bituminous coal (highly volatile) currently used in foundry green sand molds provides the baseline from which the foundry performance of anthracite coal substitution can be evaluated. Then lab scale experiments discovered that lignite-based in-situ pyrolyzed carbon can robustly contain more pore volume and surface area than bituminous coal-based and anthracite-based in-situ pyrolyzed carbon. Full scale experiments found a 32% percent removal of VOCs emission by using regenerated commercial activated carbon. The emission characteristics of the highly volatile bituminous coal and the potential substitute carbonaceous additives were evaluated. Knowledge of this would help the foundry personnel to choose the proper material, and provide guidance for process modifications in the foundry to minimize their HAP emissions.
153

- a -
Table of Contents
DISCLAIMER .......................................................................................................II
ABSTRACT .........................................................................................................III
TABLE OF CONTENTS ...................................................................................... A
1. PROJECT INTRODUCTION.............................................................................1
1.1 Advanced Oxidation Processing in Green Sand Foundries ................................................................ 1
1.2 Mold and Baghouse Dust Material Organic Materials ....................................................................... 6
1.3 In-situ Pyrolyzed Carbon for VOC Adsorption................................................................................... 8
1.4 Hydrocarbon emission characteristics of typical carbonaceous additives in green sand foundries 9
2. EXECUTIVE SUMMARY ................................................................................11
3. EXPERIMENTAL............................................................................................13
3.1 Advanced Oxidation Processing of Baghouse Dust Slurries............................................................. 13
3.2 Freeze-Drying of Suspensions.............................................................................................................. 16
3.3 Environmental SEM Imaging and Energy Dispersive Spectroscopy............................................... 17
3.4 Coal Resources...................................................................................................................................... 18
3.5 In-situ Pyrolyzed Carbon..................................................................................................................... 19
3.6 Pore Volume Distribution and Surface Area ..................................................................................... 19
3.7 Adsorption Experiment........................................................................................................................ 20
3.8 Material and Method for Evaluation of hydrocarbon emission characteristics ............................. 20 3.8.1 TGA pyrolysis of carbonaceous additives and hydrocarbon emission characterization. ................ 21 3.8.2 Flash pyrolysis of carbonaceous additives and hydrocarbon emission characterization................. 21
4. RESULTS AND DISCUSSION .......................................................................22
4.1 On Characterization of the Properties and Performance of Highly volatile bituminous coal Used
in Foundries ................................................................................................................................................ 22 4.1.1 Environmental Scanning Electron Microscopy and Energy Dispersive Spectroscopy of Treated Baghouse Dust Powders .......................................................................................................................... 22
4.2 On Searching of the Optimal Raw Material for in-situ Pyrolyzed Carbon..................................... 41
154

- b -
4.2.1 Pyrolysis of Anthracite ................................................................................................................... 41 4.2.2 Pyrolysis of highly volatile bituminous coal................................................................................... 42 4.2.3 Pyrolysis of Lignite......................................................................................................................... 45 4.2.4 Full-scale Emission Testing When Employing Activated carbon................................................... 48 4.2.5 TGAs of Bag House Dust ............................................................................................................... 49
4.3 On Searching the Optimal Pyrolysis Conditions Using Lignite as the Raw Material of in-situ
Pyrolyzed Carbon....................................................................................................................................... 52 4.3.1 The Optimal Pyrolysis Temperature............................................................................................... 52 4.3.2 Effect of Different Lignite Resources on the Final Product............................................................ 53 4.3.3 Effect of Pyrolysis Time on the Final Products .............................................................................. 55 4.3.4 In-situ Pyrolyzed Carbon V.S. Commercial Activated Carbon ...................................................... 56 4.3.5 Preliminary Test on Adsorption of VOCs on in-situ Pyrolyzed Lignite ......................................... 57
4.4 Evaluation of hydrocarbon emission characteristics of typical carbonaceous additives in green
sand foundries............................................................................................................................................. 58 4.4.1 TGA Pyrolysis of Carbonaceous Additives. ................................................................................... 58 4.4.2 Flash Pyrolysis of Carbonaceous additives..................................................................................... 60 4.4.3 Discussion....................................................................................................................................... 62
5. CONCLUSION................................................................................................65
6. REFERENCE..................................................................................................66
155

- 1 -
1. Project Introduction
1.1 Advanced Oxidation Processing in Green Sand Foundries Iron casting green sand foundries produce “green sand” molds by compacting silica sand bonded with wet bentonite clay mixtures (with dry clay content about 6-12% by weight). The bentonite clay is “activated” (hydrated) by mixing in “temper” water at approximately 35% of the weight of the clay—or about 2-5% of the total green sand weight—and by mechanically shearing the wet clay and sand mixture (“mulling”). The wet clay holds the sand particles together in the compacted mold during the casting process. Carbonaceous materials, typically highly volatile bituminous coal, are also added to the mixture at various levels (generally 2-10% of the mold), primarily to prevent the molten metal from wetting the sand and clay in order to facilitate removal of the solidified casting from the mold and to improve the casting surface finish. When molten metal is poured into a green sand mold, the heat from the metal dissipates outward into the mold. As the heat progresses into the mold, carbonaceous materials are both volatized and combusted, and the clay dries. The heat volatilizes organic gases from the bituminous coal at the mold/metal interface. These gases provide a barrier between the casting surface and the mold materials and also produce a reducing atmosphere around the casting. The coke that is produced also helps to prevent molten metal from penetrating the mold. The bentonite clays “dry” in three ways: (i) the external surface water is readily lost at low temperatures (<110°C); (ii) water adsorbed around the cations in the interlayer is also lost at relatively low temperatures (~100-150°C); and (iii) at temperatures greater than about 500°C, a portion of the clay can also “calcine”, where the hydroxyls in the clay combine to release water (dehydroxylation), and the clay is changed into a non-functional aluminosilicate ( Cartage.org, 1984). Advanced oxidation (AO) processing in green sand foundries is designed to facilitate the recycling of used clay and coal materials in sand system baghouse dusts and to decrease volatile organic compound (VOC) emissions during molten iron pouring and casting cooling and shakeout processes. Typical AO processing in the foundry employs ozone aeration and hydrogen peroxide additions to tap water or blackwater slurries (aqueous mixtures of green sand system fines recycled from baghouses); combined with acoustic sonication and hydro-cavitation of the water/slurry to produce advanced oxidant-containing water/slurry. Ozone (O3) aeration is produced through electric discharge ozone generators that produce a concentration of about 1-3% ozone in streaming oxygen (American Foundrymen’s Society, Inc, 1976). The ozone aeration is intended to produce aqueous saturation of ozone at about 5-10 ppm. The hydrogen peroxide is added with typical concentrations of 100-500 ppm H2O2. Acoustic cavitation, or “sonication,” is produced within the water/slurry by submersion of acoustic horns that are vibrating at frequencies typically ranging from 10 to 40 kHz at a total energy input of over 10 kW (American Foundrymen’s Society, Inc, 1976). “Hydro-cavitation” is produced by forcing the water/slurry from high pressure to low pressure through a Venturi nozzle. Additionally, some AO units utilize underwater plasma and/or ultraviolet (UV) radiation units for hydroxyl radical generation. Chemically, the processing goal of the AO green
156

- 2 -
sand foundry systems is to produce large amounts of highly reactive hydroxyl radicals, OH•, for use in reactions with green sand mold components both at room temperature and at elevated temperature (during metal pouring and mold cooling). There are two different AO system designs currently used in full-scale foundries—the AO-clean water system (“AO-CW”) and the AO-dry dust to black water system (“AO-BW” or “AO-DBW”). The AO-CW system treats tap water with the advanced oxidation processes described previously, and the resulting “clean water” is added to the sand system at the sand coolers and/or the sand muller instead of tap water. A schematic of the AO-CW system is presented in Figure 1-1. AO-BW processing utilizes chemical and physical treatment of recovered mold materials (primarily baghouse dusts, which are rich in clay and coal), and separates valuable, reusable materials (clay and coal) from waste silica and silicate materials (including calcined or “dead” clay). Foundry AO-BW systems directly treat slurries (10-17 volume% solids (American Foundrymen;s Society, Inc., 1994) of baghouse dust in water with the advanced oxidation processes described previously. A gravitational clarifier separates suspended particles (which are returned to the system in the temper water) from larger, higher density particles (which are removed from the system as sediment sludge via a drag chain). The suspended particles are a collection of clay, organic materials (mainly coal), and some silica fines, while the waste sludge consists mainly of larger silica fines and other silicates, with little clay or organic materials. Figure 1-2 presents a schematic of the AO-BW system. An example of the clay and coal recovery possible from an AO-BW clarifier is presented in Table 1-1.
Figure 1-1: Simplified schematic of the SonoperoxoneTM AO-clean water system (modified from Cannon, Furness, and Voigt, 2000 (Cannon et al., 2000).
157

- 3 -
The advanced oxidation system can be incorporated into a green sand foundry process as shown schematically in Figure 1-3. In AO-CW systems, tap water is subjected to AO treatment, and the AO-treated tap water is added to the sand mullers and/or the sand coolers. In AO-BW systems, foundry baghouse dust is added to tap water. This slurry is then subjected to AO treatment, and the AO-treated slurry of suspended particles from the top of the blackwater clarifier is added to the sand mullers and/or the sand coolers. Green sand returning from the sand coolers is physically mixed with new makeup sand, clay, and coal (as well as other additives), and AO-treated water or slurry in the muller. The conditioned green sand is subsequently compacted by high pressure molding machines into the desired mold shapes, and then any cores are added. Molten metal is poured into the mold cavity, and the casting solidifies and cools in the mold as the heat transfers outward from the casting. Once the casting is sufficiently cooled, the mold is broken off from around the casting, and vibrating machines shake the green sand off of
Figure 1-2: Simplified schematic of the SonoperoxoneTM AO blackwater system (modified from Cannon, Furness, Voigt, 2000 (Cannon et al., 2000))
Table 1-1: An example of clay and coal recovery in a foundry AO-BW system. (Glowacki et al., 2003)
Weight Percent of Solids
Silica and Silicates Bentonite Clays Carbonaceous
Materials
Baghouse dust (source) 30-50% 34-45% 20-23%
Blackwater solids (returned)* 5-30% 50-65% 20-30%
Waste sludge (disposed) >85% 1-4% 4-11%
* Blackwater solids content was approximately 5-6% by weight in water
158

- 4 -
the casting (“shakeout”). The loose sand is then cooled and sent to the muller to be reused. Exhaust systems draw fine particles along with the exhaust air from the pouring, cooling and shakeout areas and the sand cooling and muller system to prevent the buildup of silica fines within the green sand. The exhaust passes through baghouse particulate collection systems before being exhausted through the stacks. The particulate fines collected in the baghouses (termed baghouse dust) are then reusable in AO-BW systems.
159

- 5 -
Figu
re 1
-3: S
chem
atic
of a
foun
dry
cast
ing
proc
ess (
mod
ified
from
Nei
ll et
al.,
200
1 a
nd G
low
acki
et a
l., 2
003
160
- 6 -
1.2 Mold and Baghouse Dust Material Organic Materials Organic materials, typically coal, are also mixed into the green sand for iron casting. These materials can provide a non-wetting barrier between the molten iron and the mold surface and can improve casting finish, eliminate surface defects, and improve sand handling characteristics. Additionally, organic-bonded sand matrix core residuals (often phenolic urethane-bonded sand) are a component of green sand systems when complex, cored castings are produced in the foundry. Carbonaceous materials improve the casting process in many ways. These materials liberate volatile matter at the mold/metal interface and also deposit a film of pyrolitic graphite at the mold surface when contacted with hot molten metal. Coking of these materials (loss of the volatiles) also swells the carbon, filling voids between the sand grains. Each of these processes helps to prevent the metal from wetting the mold surface. The decomposition of the carbonaceous materials also creates a reducing atmosphere that combats metal oxidation and reduces the extent of iron-silica reactions. However, due to the low carbon content necessary for steels, cereals instead of carbonaceous materials (such as highly volatile bituminous coal) are usually used for steel casting. The main carbonaceous material used in iron casting green sand foundries is “highly volatile bituminous coal,” which is mainly bituminous coal with amorphous carbon. A schematic model of this bituminous coal is presented in Figure 1-4. Bituminous coal contains a large amount of aromatic material in the form of linked compact aromatic clusters. Because bituminous coal is not a high-grade coal, it inherently contains a greater concentration of nitrogen, oxygen, and hydrogen atoms than anthracite.
161

- 7 -
Highly volatile bituminous coal can also be replaced in part by asphalt or gilsonite, causticized lignite, or other carbon-based materials. Asphalt and gilsonite release high amounts of volatile matter quickly and therefore cause excessive air pollution; however they have been used to improve casting peel, and also produce low amounts of ash. However, excessive use may “waterproof the green sand.” Causticized lignite can be added to enhance clay dispersion and reduce the viscosity of the sand system. It also acts as a “cushion material” to reduce mold expansion defects. Other petroleum distillates are also occasionally used in foundries as partial highly volatile bituminous coal replacements. Other types of organic materials are also used in metal green sand casting, such as cellulose (fibrous plant matter), which is used as a cushioning agent, to control sand expansion defects, and to improve sand shakeout and flowability; cereals and starches (gelatinized organic carbohydrates), which are used to enhance the ease of pattern drawing and reduce sand erosion; and synthetic polymers, which are used to improve dispersion of the clays into the sand mixture. Additionally, cellulose, cereals and starches absorb water, and thus broaden the water temper range at which acceptable mold properties can be achieved. Mold release agents, such as silicones, fatty acids, paraffins combined with hydrocarbons, or linseed oils may also be used in small quantities to enhance pattern/mold separation during mold making.
Figure 1-4: Model of bituminous coal.
162

- 8 -
Other green sand system additives may be used to enhance either the mulling or molding performance of green sand systems. Soda ash (sodium carbonate) is a common inorganic additive which is added mainly to keep the sand system from becoming acidic due to the recycled spent core/mold sand or the degraded organic sand additives. Organic or inorganic wetting agents (non-ionic, cationic, or anionic) can be added to the temper water to allow the water to better infiltrate the clay during mulling, or to enhance clay dispersion.
1.3 In-situ Pyrolyzed Carbon for VOC Adsorption Air pollution is one of the most important environmental issues in iron foundries, and volatile organic compounds (VOCs) represent a major component of air pollutants. VOCs can be produced both from the coal and the phenolic urethane cores that are included in the green sand mold during the process. Foundries are required by EPA to diminish the air pollution. Activated carbon can be used to adsorb these emissions in the foundries, but using commercial activated carbon would pose a cost problem to the foundries. In conventional iron foundries, in order to melt the iron, high temperatures are required in the cupola. The exhaust gas from the cupola travels through a drop-out box, and then cools in an air-to-air heat exchanger followed by a wet scrubber system. Commonly these extra heat sources in the foundries are wasted. The temperature in the drop-out box is 815-1150˚C, and this compares favorably to the 800-1000˚C temperature at which activated carbon is commercially manufactured. Also, in some foundries, nitrogen gas is used to provide a gas blanket to protect the molten metal against oxidation during iron pouring. This operation heats the nitrogen temperature to 1300˚C. This gas flow could also be valuably reclaimed as heat and protection of the carbon pyrolysis. One objective of our research is to investigate the feasibility of reclaiming this commonly wasted heat and nitrogen gas, and use it to produce in-situ pyrolyzed carbon. This in-situ pyrolyzed carbon could be used to treat the air pollution in foundries. The proposed raw material of this in situ pyrolyzed carbon is coal, and we have thus far tested anthracite, bituminous, and lignite coals. We observed that pyrolysis will induce less mass loss for anthracite coal than for bituminous or lignite. Our field scale proposal in foundries is to protrude a heat exchanger tube (HEX) through the drop box, and then pass coal, and wasted hot nitrogen gas through this tube. The first step has been to investigate the pyrolysis of the coals in the lab scale, in order to get the best operation conditions. In the lab scale experiments, thermogravimetric analyzer (TGA) was used to simulate the proposed situation of a drop-out box with heat exchange tube. Thus, our field-scale aim has been to: (a) Use the waste heat from cupola exhaust air and the heated waste nitrogen gas from the metal nitrogen blanket, (b) pass waste nitrogen gas and pulverized coal through a HEX that resides within the drop box, (c) employ pyrolysis conditions (i.e. without added gas streams of CO2, H2O or air), which facilitates a rather uniform robust product over a broad range of temperature and contact time, (d) although the pyrolyzed coal product may have less pore volume and surface area than conventional activated carbon, it robustly and inexpensively contains enough porosity to adsorb the VOCs.
163
- 9 -
1.4 Hydrocarbon emission characteristics of typical carbonaceous additives in green sand foundries Hazardous air pollutant (HAP) emissions from green sand foundries pose considerable hazards to the environment and human health. Among the 189 HAPs listed in the 1990 Clean Air Act Amendment (CAAA), some 40 compounds have been identified in the air emissions from the foundry (Technikon, 2000). And organic HAPs that are released from mold making, metal pouring, casting shakeout comprise over 90% (by weight) of the total HAPs in the typical foundry emissions (Schifo et al., 2003). Research has shown that one of the major sources of the HAPs is the pyrolysis of carbonaceous additives that are added into the green sand mold to improve casting quality and facilitates casting shakeout (Allen et al., 1991; McKinley et al., 1993; Fox et al., 2002; Schifo et al., 2003). Although there are many different theories on the functions of carbonaceous additives in casting process, most of them rely on the ability of carbonaceous additives to release volatiles during the pyrolysis (Wang et al., 1973; Green et al., 1980; Dempsey et al., 1997). Upon casting heat, carbonaceous additives undergo pyrolysis reaction and release large quantities of volatiles. These volatiles are rich in hydrocarbon gases, together with certain amount of CO, CO2, and etc. These gases form a gaseous blanket between the molten metal and the sand, and thus prevent their direct contact (Green et al. 1980). The hydrocarbon gases are further pyrolyzed to deposit a thin graphitic carbon layer (called as lustrous carbon in foundries) at the metal-mold interface. This lustrous carbon film keeps sand grains from sticking to the castings and prevents the formation of iron silicate (Wang et al. 1973).The pyrolysis of the carbonaceous additives and hydrocarbon gases also provide a reducing atmosphere at the metal-mold interface and prevent the oxidation of the hot casting surface (Green et al. 1980). From many years’ experience, foundry personnel perceive that a certain amount of volatiles from the carbonaceous additives must be present in the green sand for the production of quality castings. When there are insufficient carbonaceous additives in the green sand to provide the volatiles, the extent of sand adherence to the casting surface increases (Volkmar et al., 2000); while when there are excessive carbonaceous additives, castings surface may generate wrinkles due to the piling up of lustrous carbon film (Naro, 2002). The most commonly used carbonaceous additive is finely crushed high volatile bituminous coal due to its superiority to release large quantities of volatiles during pyrolysis. However, it was found that significant amount of hazardous air pollutants (HAPs) are present in the volatile emissions of the highly volatile bituminous coal, with benzene, toluene, xylene (BTX) compounds composing the major part. As a response to the ever stringent regulations on air emissions, foundries are seeking alternative carbonaceous additives to partially or totally replace the highly volatile bituminous coal in the green sand. Among many highly volatile bituminous coal replacements that have been tested in foundries or pre-production foundries, anthracite, lignite, and cellulose have shown some promising results of producing casting with acceptable quality (LaFay et al., 2004; Thiel et al., 2005). However, few emission data are available regarding the HAP emission characteristics of these materials. The reliabilities of the stack emission tests are generally poor. Considerable variations in HAP emissions were often observed
164

- 10 -
for stack tests (Lafay, et al. 2004; Thiel et al., 2005; Land et al., 2004; Schifo et al., 2003). This unavoidable variability in stack test results makes it difficult to estimate true emission levels and verify the emission reduction. In addition, many samples must be taken because of the large variation from one test to the next, which makes stack test expensive and time consuming to conduct. In comparison, laboratory analytical pyrolysis can be easily conducted under strictly controlled conditions that closely simulate the thermal conditions that carbonaceous additives experience in the green sand mold. And the emissions can be easily analyzed with laboratory instrument. These laboratory evaluations delivered key information to the present understanding of actual metal casting process (Bachmann et al., 1982; LaFay et al., 2000). Our previous study has shown thermogravimetric analyzer (TGA) was capable of simulating the emission trends that were observed in the full-scale foundry (Wang et al., 2004). In this light, the objective of this research is to evaluate the emission characteristics of the highly volatile bituminous coal and the potential substitute carbonaceous additives with laboratory facilities. Knowledge of this would help the foundry personnel to choose the proper material, and provide guidance for process modifications in the foundry to minimize their HAP emissions.
165
- 11 -
2. Executive Summary
At first, initial experimental work characterizing the properties and performance of highly volatile bituminous coal currently used in foundry green sand molds has been completed. This characterization provides the baseline from which the foundry performance of anthracite coal substitution can be evaluated. The work summarized here includes ESEM characterization of highly volatile bituminous coal-containing baghouse dusts from a typical production foundry before and after treatment with advanced oxidants. ESEM and EDS measurements confirmed that AO and sonication treatments greatly separate surface clays from the large particles of silica and coal and reduce the size of the clay agglomerates. The physical characteristics of baseline bituminous coal particles in these baghouse dust suspensions have been characterized so that the relative performance of anthracite-based green sand mixtures can be similarly characterized in the later portions of the study. Bench-Scale experiments regarding producing in-situ pyrolyzed carbon and full-scale tests using activated carbon to adsorb VOCs in Neenah foundry were studied. It was found that lignite will develop more surface area and pore volume during pyrolysis than did the anthracite and the highly volatile bituminous coal. Also, the pores developed in lignite are more robustly generated at a broad range of temperatures; and this is more favorable than for the highly volatile bituminous coal which yields considerable less pore volume at 600 ˚C or 900˚C than it does at 800 ˚C. Full-scale test shows that the VOCs emission in Neenah foundry can be diminished by 32% by applying reactivated carbon from NORIT Americas. Further lab scale experiments were conducted to produce in-situ pyrolyzed carbon by using lignite as raw material with focuses on the different lignite resources, the effect of temperature and the effect of pyrolysis time on final product. The lignite from Sabine Mine provide the highest micro-pore volume and surface due to its highest fixed carbon contents among the lignites tested. It was also found that the in-situ pyrolyzed carbon contains the highest pore volume and surface area after being treated at 800 °C. As the pyrolysis time increases, the pore volume and surface area of the in-situ pyrolyzed carbon decrease. The best in-situ pyrolyzed carbon produced in the experiments so far contains surface about as much as 80% of the commercial activated carbon HD4000. Preliminary adsorption experiment using the in-situ pyrolyzed carbon suggests the in-situ pyrolyzed carbon is feasible to be used as an adsorbent for VOCs adsorption. Finally, experiments were conducted to evaluate the emission characteristics of the highly volatile bituminous coal and the potential substitute carbonaceous additives, such as anthracite, lignite, and cellulose, with laboratory facilities. It is found that the hydrocarbon gas yields in the TGA slow pyrolysis are much lower than them in the flash pyrolysis for all the samples tested herein. Also, it is found that the heating rates have a more pronounced effect on the cellulose compared with other carbonaceous additives. Knowledge of this would help the foundry personnel to choose the proper material, and provide guidance for process modifications in the foundry to minimize their HAP emissions. As shown, the cellulose HAP emissions are much lower than them of other
166

- 12 -
carbonaceous additives tested herein. This would offer a great opportunity for the foundry to cut down the HAP emissions.
167
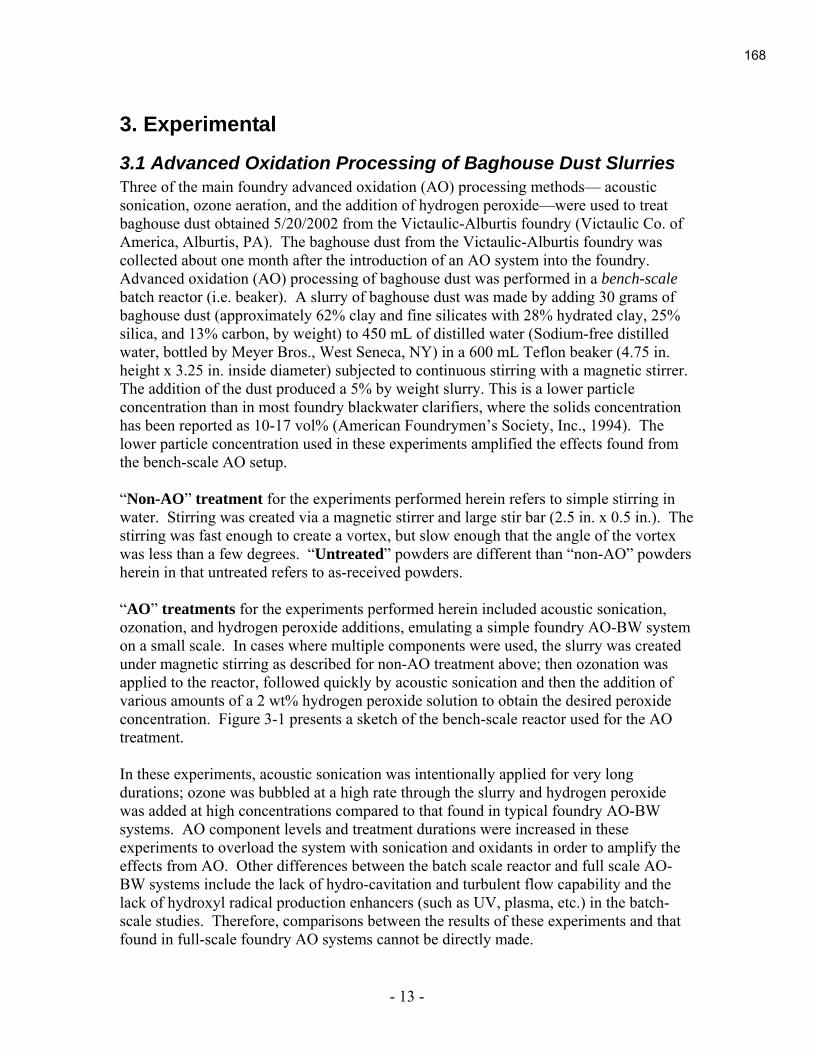
- 13 -
3. Experimental
3.1 Advanced Oxidation Processing of Baghouse Dust Slurries Three of the main foundry advanced oxidation (AO) processing methods— acoustic sonication, ozone aeration, and the addition of hydrogen peroxide—were used to treat baghouse dust obtained 5/20/2002 from the Victaulic-Alburtis foundry (Victaulic Co. of America, Alburtis, PA). The baghouse dust from the Victaulic-Alburtis foundry was collected about one month after the introduction of an AO system into the foundry. Advanced oxidation (AO) processing of baghouse dust was performed in a bench-scale batch reactor (i.e. beaker). A slurry of baghouse dust was made by adding 30 grams of baghouse dust (approximately 62% clay and fine silicates with 28% hydrated clay, 25% silica, and 13% carbon, by weight) to 450 mL of distilled water (Sodium-free distilled water, bottled by Meyer Bros., West Seneca, NY) in a 600 mL Teflon beaker (4.75 in. height x 3.25 in. inside diameter) subjected to continuous stirring with a magnetic stirrer. The addition of the dust produced a 5% by weight slurry. This is a lower particle concentration than in most foundry blackwater clarifiers, where the solids concentration has been reported as 10-17 vol% (American Foundrymen’s Society, Inc., 1994). The lower particle concentration used in these experiments amplified the effects found from the bench-scale AO setup. “Non-AO” treatment for the experiments performed herein refers to simple stirring in water. Stirring was created via a magnetic stirrer and large stir bar (2.5 in. x 0.5 in.). The stirring was fast enough to create a vortex, but slow enough that the angle of the vortex was less than a few degrees. “Untreated” powders are different than “non-AO” powders herein in that untreated refers to as-received powders. “AO” treatments for the experiments performed herein included acoustic sonication, ozonation, and hydrogen peroxide additions, emulating a simple foundry AO-BW system on a small scale. In cases where multiple components were used, the slurry was created under magnetic stirring as described for non-AO treatment above; then ozonation was applied to the reactor, followed quickly by acoustic sonication and then the addition of various amounts of a 2 wt% hydrogen peroxide solution to obtain the desired peroxide concentration. Figure 3-1 presents a sketch of the bench-scale reactor used for the AO treatment. In these experiments, acoustic sonication was intentionally applied for very long durations; ozone was bubbled at a high rate through the slurry and hydrogen peroxide was added at high concentrations compared to that found in typical foundry AO-BW systems. AO component levels and treatment durations were increased in these experiments to overload the system with sonication and oxidants in order to amplify the effects from AO. Other differences between the batch scale reactor and full scale AO-BW systems include the lack of hydro-cavitation and turbulent flow capability and the lack of hydroxyl radical production enhancers (such as UV, plasma, etc.) in the batch-scale studies. Therefore, comparisons between the results of these experiments and that found in full-scale foundry AO systems cannot be directly made.
168
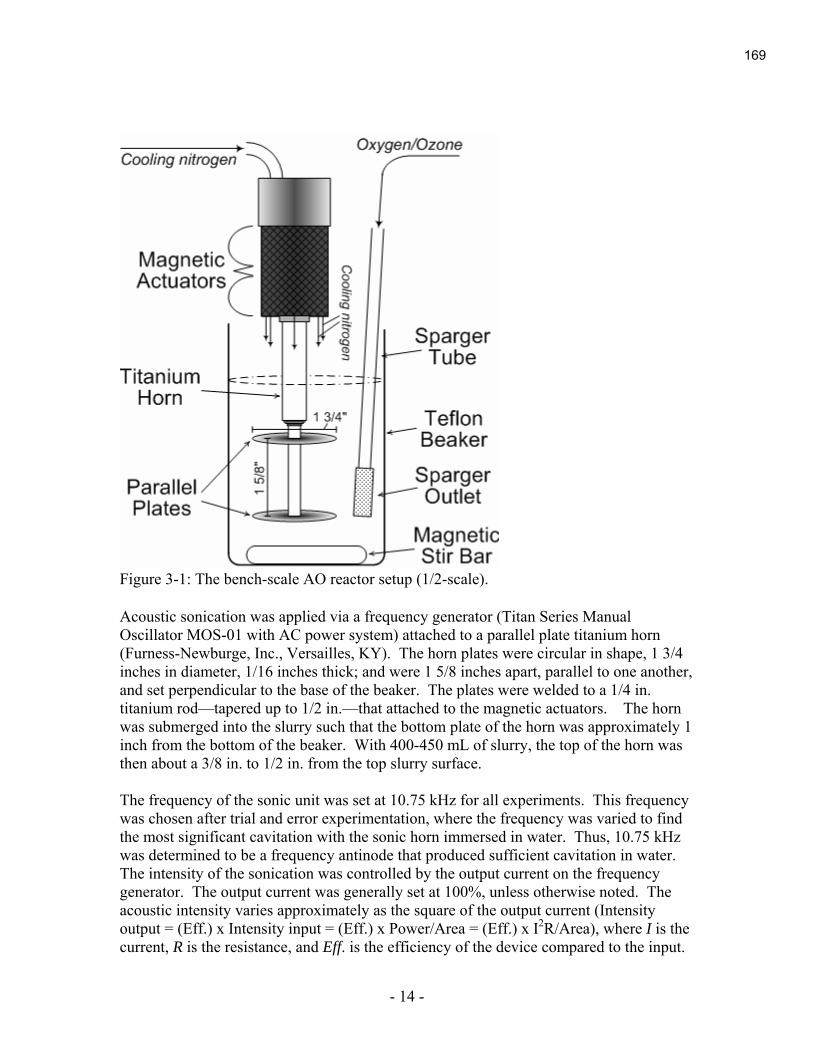
- 14 -
Acoustic sonication was applied via a frequency generator (Titan Series Manual Oscillator MOS-01 with AC power system) attached to a parallel plate titanium horn (Furness-Newburge, Inc., Versailles, KY). The horn plates were circular in shape, 1 3/4 inches in diameter, 1/16 inches thick; and were 1 5/8 inches apart, parallel to one another, and set perpendicular to the base of the beaker. The plates were welded to a 1/4 in. titanium rod—tapered up to 1/2 in.—that attached to the magnetic actuators. The horn was submerged into the slurry such that the bottom plate of the horn was approximately 1 inch from the bottom of the beaker. With 400-450 mL of slurry, the top of the horn was then about a 3/8 in. to 1/2 in. from the top slurry surface. The frequency of the sonic unit was set at 10.75 kHz for all experiments. This frequency was chosen after trial and error experimentation, where the frequency was varied to find the most significant cavitation with the sonic horn immersed in water. Thus, 10.75 kHz was determined to be a frequency antinode that produced sufficient cavitation in water. The intensity of the sonication was controlled by the output current on the frequency generator. The output current was generally set at 100%, unless otherwise noted. The acoustic intensity varies approximately as the square of the output current (Intensity output = (Eff.) x Intensity input = (Eff.) x Power/Area = (Eff.) x I2R/Area), where I is the current, R is the resistance, and Eff. is the efficiency of the device compared to the input.
Figure 3-1: The bench-scale AO reactor setup (1/2-scale).
169
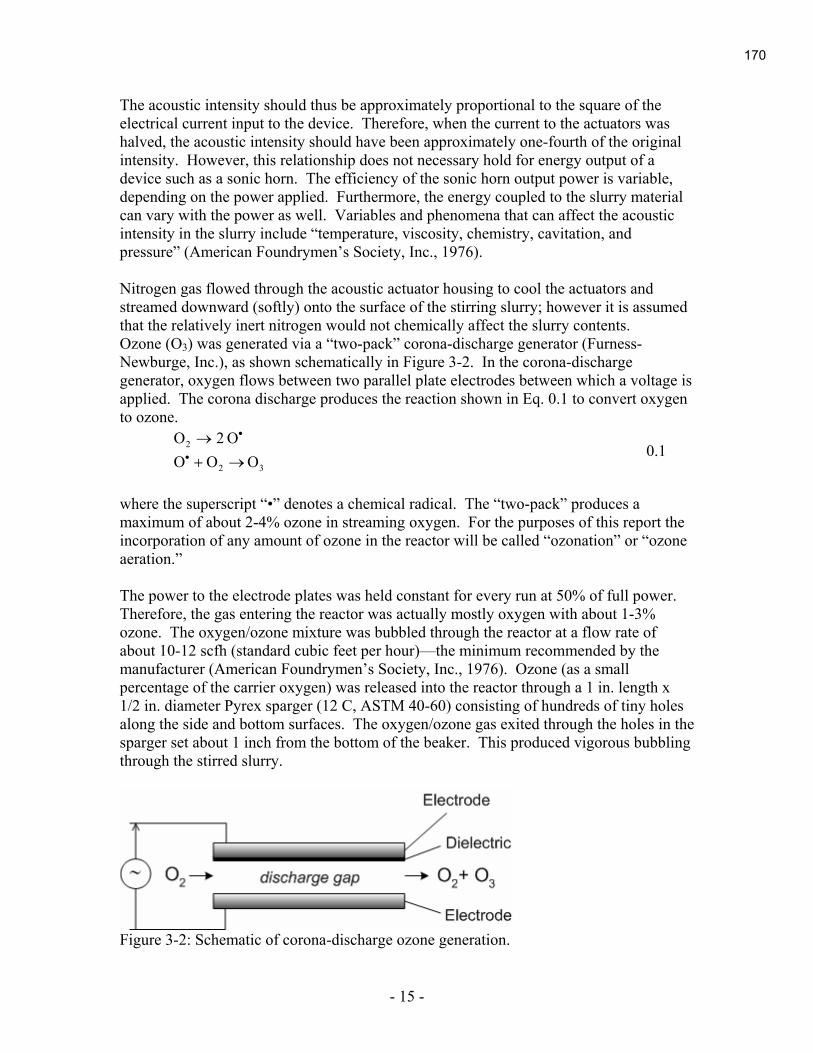
- 15 -
The acoustic intensity should thus be approximately proportional to the square of the electrical current input to the device. Therefore, when the current to the actuators was halved, the acoustic intensity should have been approximately one-fourth of the original intensity. However, this relationship does not necessary hold for energy output of a device such as a sonic horn. The efficiency of the sonic horn output power is variable, depending on the power applied. Furthermore, the energy coupled to the slurry material can vary with the power as well. Variables and phenomena that can affect the acoustic intensity in the slurry include “temperature, viscosity, chemistry, cavitation, and pressure” (American Foundrymen’s Society, Inc., 1976). Nitrogen gas flowed through the acoustic actuator housing to cool the actuators and streamed downward (softly) onto the surface of the stirring slurry; however it is assumed that the relatively inert nitrogen would not chemically affect the slurry contents. Ozone (O3) was generated via a “two-pack” corona-discharge generator (Furness-Newburge, Inc.), as shown schematically in Figure 3-2. In the corona-discharge generator, oxygen flows between two parallel plate electrodes between which a voltage is applied. The corona discharge produces the reaction shown in Eq. 0.1 to convert oxygen to ozone.
where the superscript “•” denotes a chemical radical. The “two-pack” produces a maximum of about 2-4% ozone in streaming oxygen. For the purposes of this report the incorporation of any amount of ozone in the reactor will be called “ozonation” or “ozone aeration.” The power to the electrode plates was held constant for every run at 50% of full power. Therefore, the gas entering the reactor was actually mostly oxygen with about 1-3% ozone. The oxygen/ozone mixture was bubbled through the reactor at a flow rate of about 10-12 scfh (standard cubic feet per hour)—the minimum recommended by the manufacturer (American Foundrymen’s Society, Inc., 1976). Ozone (as a small percentage of the carrier oxygen) was released into the reactor through a 1 in. length x 1/2 in. diameter Pyrex sparger (12 C, ASTM 40-60) consisting of hundreds of tiny holes along the side and bottom surfaces. The oxygen/ozone gas exited through the holes in the sparger set about 1 inch from the bottom of the beaker. This produced vigorous bubbling through the stirred slurry.
•→ O 2O 2 32 O OO →+•
0.1
Figure 3-2: Schematic of corona-discharge ozone generation.
170
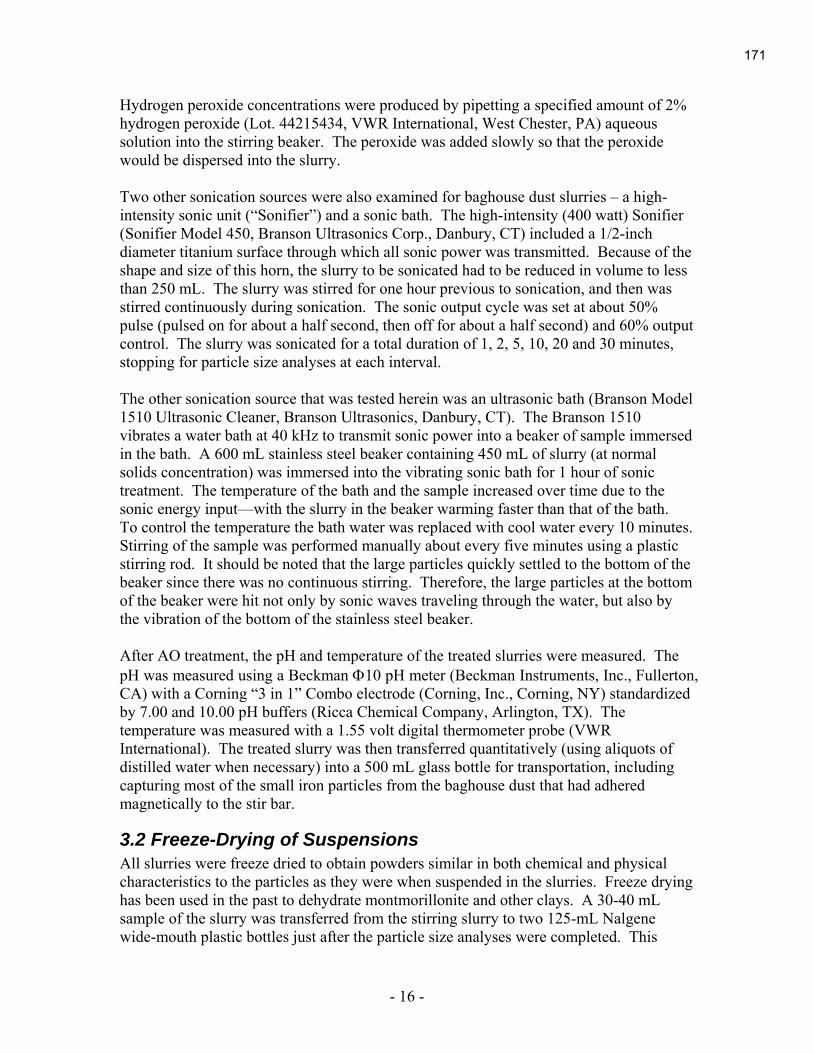
- 16 -
Hydrogen peroxide concentrations were produced by pipetting a specified amount of 2% hydrogen peroxide (Lot. 44215434, VWR International, West Chester, PA) aqueous solution into the stirring beaker. The peroxide was added slowly so that the peroxide would be dispersed into the slurry. Two other sonication sources were also examined for baghouse dust slurries – a high-intensity sonic unit (“Sonifier”) and a sonic bath. The high-intensity (400 watt) Sonifier (Sonifier Model 450, Branson Ultrasonics Corp., Danbury, CT) included a 1/2-inch diameter titanium surface through which all sonic power was transmitted. Because of the shape and size of this horn, the slurry to be sonicated had to be reduced in volume to less than 250 mL. The slurry was stirred for one hour previous to sonication, and then was stirred continuously during sonication. The sonic output cycle was set at about 50% pulse (pulsed on for about a half second, then off for about a half second) and 60% output control. The slurry was sonicated for a total duration of 1, 2, 5, 10, 20 and 30 minutes, stopping for particle size analyses at each interval. The other sonication source that was tested herein was an ultrasonic bath (Branson Model 1510 Ultrasonic Cleaner, Branson Ultrasonics, Danbury, CT). The Branson 1510 vibrates a water bath at 40 kHz to transmit sonic power into a beaker of sample immersed in the bath. A 600 mL stainless steel beaker containing 450 mL of slurry (at normal solids concentration) was immersed into the vibrating sonic bath for 1 hour of sonic treatment. The temperature of the bath and the sample increased over time due to the sonic energy input—with the slurry in the beaker warming faster than that of the bath. To control the temperature the bath water was replaced with cool water every 10 minutes. Stirring of the sample was performed manually about every five minutes using a plastic stirring rod. It should be noted that the large particles quickly settled to the bottom of the beaker since there was no continuous stirring. Therefore, the large particles at the bottom of the beaker were hit not only by sonic waves traveling through the water, but also by the vibration of the bottom of the stainless steel beaker. After AO treatment, the pH and temperature of the treated slurries were measured. The pH was measured using a Beckman Φ10 pH meter (Beckman Instruments, Inc., Fullerton, CA) with a Corning “3 in 1” Combo electrode (Corning, Inc., Corning, NY) standardized by 7.00 and 10.00 pH buffers (Ricca Chemical Company, Arlington, TX). The temperature was measured with a 1.55 volt digital thermometer probe (VWR International). The treated slurry was then transferred quantitatively (using aliquots of distilled water when necessary) into a 500 mL glass bottle for transportation, including capturing most of the small iron particles from the baghouse dust that had adhered magnetically to the stir bar.
3.2 Freeze-Drying of Suspensions All slurries were freeze dried to obtain powders similar in both chemical and physical characteristics to the particles as they were when suspended in the slurries. Freeze drying has been used in the past to dehydrate montmorillonite and other clays. A 30-40 mL sample of the slurry was transferred from the stirring slurry to two 125-mL Nalgene wide-mouth plastic bottles just after the particle size analyses were completed. This
171

- 17 -
bottle was then mixed and immediately put into a bath of liquid nitrogen. The liquid nitrogen has a theoretical temperature of about -196°C. The freeze-dryer (Lyph-Lock 6 Freeze Dry System, Labconco, Kansas City, MO) chamber was large enough to dry up to about 8 125-mL bottles at the same time. The refrigerated collection coils cooled to -50°C; and the vacuum pump (GE Motors) brought the pressure inside the dryer to less than 10 x 10-3 mbar (however, the pressure in the chamber rose as ice collected on the coils). The samples inside the vacuum chamber were not refrigerated, however the applied vacuum and the endothermic sublimation of the ice (~ +46.7 kJ/mol) kept the samples below the melting point until the ice fully sublimated. The freeze dryer was typically run for 48-72 hours to sublime the 30-40 mL of ice from each bottle. The dry powder residue was then stored in capped bottles in desiccators.
3.3 Environmental SEM Imaging and Energy Dispersive Spectroscopy Environmental scanning electron microscopy (ESEM) was used to view the microstructure of treated and untreated dusts. The ESEM is similar in use to a standard SEM, however the ESEM does not require high vacuum and its specimens do not need to be electrically conducting. The ESEM permits a low pressure of a variety of gases within the sample chamber. Therefore, the ESEM is a nearly ideal instrument for use in imaging materials containing hydrated, hydrophilic clays. The ESEM focuses on a specimen with a primary electron beam, which causes the specimen to emit secondary electrons. The secondary (or backscattered electrons) are then detected and an image is formed from the intensity of the detected electrons. Energy Dispersive Spectroscopy (EDS) can also be performed simultaneously with ESEM imaging to determine the relative concentration of an element within the selected beam area. EDS works by the detection of characteristic x-rays (using a solid state detector) produced by a sample bombarded with an electron beam. The depth of penetration for EDS is about 1µm and the spatial resolution is also about 1µm (both depending on sample composition, beam accelerating voltage, etc.), therefore the composition returned by EDS is representative of the sample within a few cubic microns of the area of focus. Samples for ESEM imaging and EDS were produced by taking a standard SEM aluminum mounting stub and applying either carbon or copper double-sided tape to the surface. The stubs were then pressed softly into the sample powder to get a “random” particle distribution adhering to the surface. Excess particles were then blown off of the stub using a canister of compressed air. The copper tape was used for baghouse dust samples because it had a lower carbon content (though not “zero” carbon because of the adhesive) than the standard carbon tape often used in SEM mounting. The lower carbon content in the tape was useful when performing EDS elemental analyses—especially with respect to carbon on the particle surface—to attempt to lessen scattering contamination from the mounting tape itself. For the bentonite samples, standard carbon tape was used and carbon peaks during EDS were simply removed from the analyses.
172

- 18 -
The ESEM (FEI Quanta 200, FEI Company, Hillsboro, OR) uses a tungsten electron source filament and a gaseous secondary electron detector (“lower fill detector”). (The backscatter detector was not used in this research.) The samples were placed into the ESEM chamber and the system was set to “low-vacuum” with a typical pressure of 0.62 torr water vapor. The working distance (focal distance) was set at about 8.0 mm. The accelerating voltage was 20 kV and the spot size was generally set at “3.5”. The image resolution was set to 1024x884 and an average of 16 frames was used to obtain better image quality. A variety of treated and untreated freeze-dried powder samples were viewed under the ESEM. Simultaneous to the ESEM imaging, EDS was performed to determine the constituents of the sample being viewed. The EDS instrument (Oxford Inca 200, Oxford Instruments Analytical, Concord, MA) spectra acquisition time was set at 60 or 90 seconds and the process time was 5 seconds with a spectral range of 0-10 keV.
3.4 Coal Resources Three types of coal were studied, anthracite, bituminous and lignite. The grain size distribution and the composition of the anthracite we used are listed in Table 3-1 and Table 3-2 respectively.
Table 3-1 The grain size distribution of anthracite
Mesh number Retained % Passing % 28 (0.60 mm) 60.0 40.0 35 (0.42 mm) 18.5 21.5 60 (0.25 mm) 14.5 7.0 100 (0.15 mm) 4.5 2.5 200 (0.075 mm) 1.5 1.0 300 (0.045 mm) 0.5 0.5
Table 3-2 Composition of anthracite Contents Weight Percentage (%) Moisture 13.25
Ash 11.00 Sulfur 0.38
Volatile 4.33 Fixed Carbon 71.42
The bituminous coal we tested is the highly volatile bituminous coal that has been used at Neenah Foundry (Neenah, WI). The grain size distribution and the composition of the highly volatile bituminous coal we used are listed in Table 3-3 and Table 3-4 respectively.
173
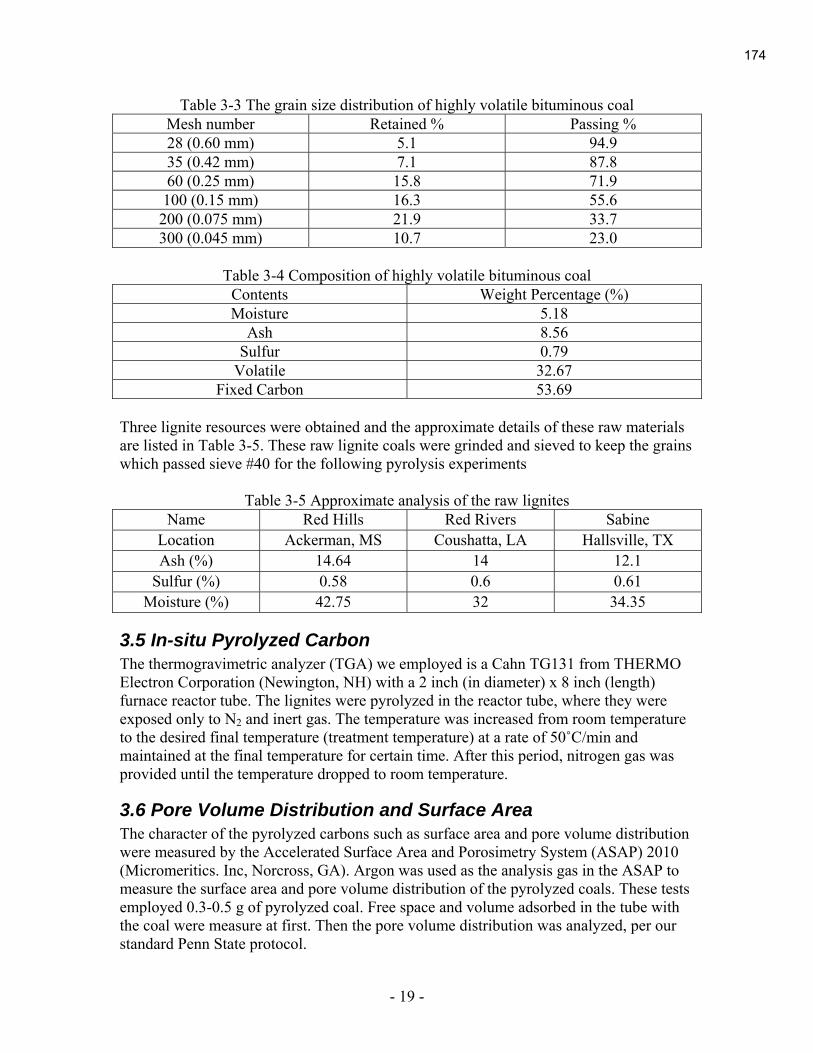
- 19 -
Table 3-3 The grain size distribution of highly volatile bituminous coal Mesh number Retained % Passing % 28 (0.60 mm) 5.1 94.9 35 (0.42 mm) 7.1 87.8 60 (0.25 mm) 15.8 71.9 100 (0.15 mm) 16.3 55.6 200 (0.075 mm) 21.9 33.7 300 (0.045 mm) 10.7 23.0
Table 3-4 Composition of highly volatile bituminous coal
Contents Weight Percentage (%) Moisture 5.18
Ash 8.56 Sulfur 0.79
Volatile 32.67 Fixed Carbon 53.69
Three lignite resources were obtained and the approximate details of these raw materials are listed in Table 3-5. These raw lignite coals were grinded and sieved to keep the grains which passed sieve #40 for the following pyrolysis experiments
Table 3-5 Approximate analysis of the raw lignites Name Red Hills Red Rivers Sabine
Location Ackerman, MS Coushatta, LA Hallsville, TX Ash (%) 14.64 14 12.1
Sulfur (%) 0.58 0.6 0.61 Moisture (%) 42.75 32 34.35
3.5 In-situ Pyrolyzed Carbon The thermogravimetric analyzer (TGA) we employed is a Cahn TG131 from THERMO Electron Corporation (Newington, NH) with a 2 inch (in diameter) x 8 inch (length) furnace reactor tube. The lignites were pyrolyzed in the reactor tube, where they were exposed only to N2 and inert gas. The temperature was increased from room temperature to the desired final temperature (treatment temperature) at a rate of 50˚C/min and maintained at the final temperature for certain time. After this period, nitrogen gas was provided until the temperature dropped to room temperature.
3.6 Pore Volume Distribution and Surface Area The character of the pyrolyzed carbons such as surface area and pore volume distribution were measured by the Accelerated Surface Area and Porosimetry System (ASAP) 2010 (Micromeritics. Inc, Norcross, GA). Argon was used as the analysis gas in the ASAP to measure the surface area and pore volume distribution of the pyrolyzed coals. These tests employed 0.3-0.5 g of pyrolyzed coal. Free space and volume adsorbed in the tube with the coal were measure at first. Then the pore volume distribution was analyzed, per our standard Penn State protocol.
174
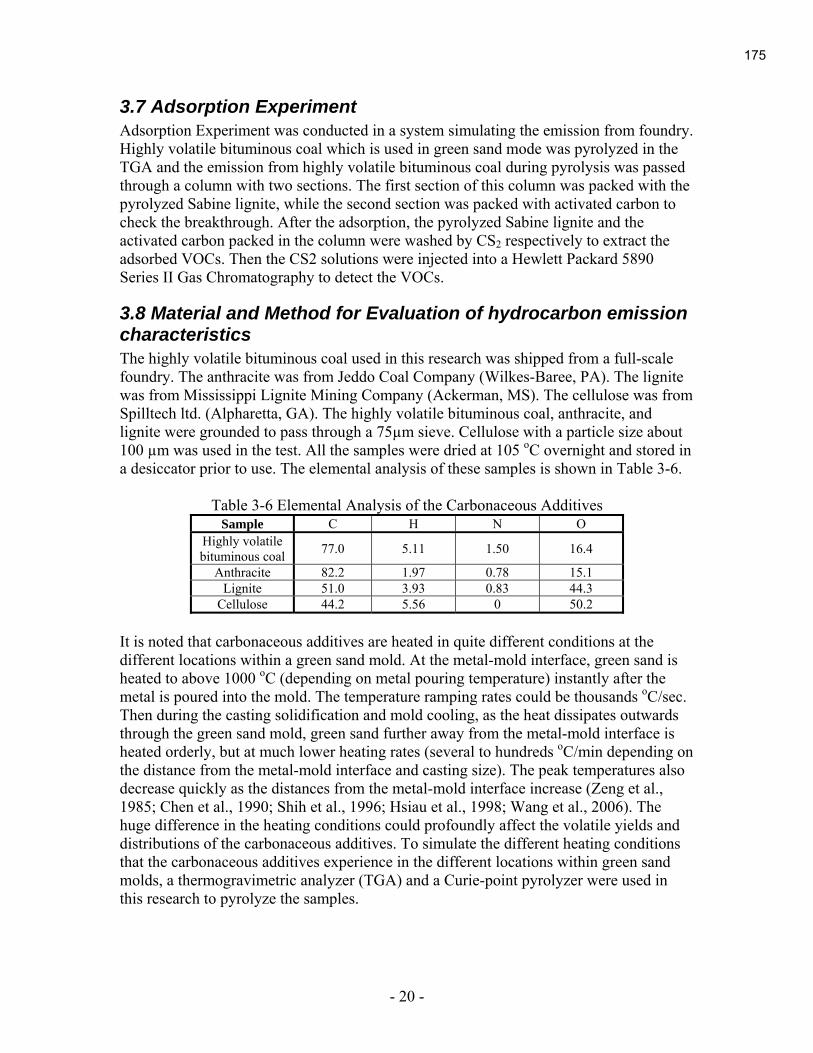
- 20 -
3.7 Adsorption Experiment Adsorption Experiment was conducted in a system simulating the emission from foundry. Highly volatile bituminous coal which is used in green sand mode was pyrolyzed in the TGA and the emission from highly volatile bituminous coal during pyrolysis was passed through a column with two sections. The first section of this column was packed with the pyrolyzed Sabine lignite, while the second section was packed with activated carbon to check the breakthrough. After the adsorption, the pyrolyzed Sabine lignite and the activated carbon packed in the column were washed by CS2 respectively to extract the adsorbed VOCs. Then the CS2 solutions were injected into a Hewlett Packard 5890 Series II Gas Chromatography to detect the VOCs.
3.8 Material and Method for Evaluation of hydrocarbon emission characteristics The highly volatile bituminous coal used in this research was shipped from a full-scale foundry. The anthracite was from Jeddo Coal Company (Wilkes-Baree, PA). The lignite was from Mississippi Lignite Mining Company (Ackerman, MS). The cellulose was from Spilltech ltd. (Alpharetta, GA). The highly volatile bituminous coal, anthracite, and lignite were grounded to pass through a 75µm sieve. Cellulose with a particle size about 100 µm was used in the test. All the samples were dried at 105 oC overnight and stored in a desiccator prior to use. The elemental analysis of these samples is shown in Table 3-6.
Table 3-6 Elemental Analysis of the Carbonaceous Additives
Sample C H N O Highly volatile bituminous coal 77.0 5.11 1.50 16.4
Anthracite 82.2 1.97 0.78 15.1 Lignite 51.0 3.93 0.83 44.3
Cellulose 44.2 5.56 0 50.2
It is noted that carbonaceous additives are heated in quite different conditions at the different locations within a green sand mold. At the metal-mold interface, green sand is heated to above 1000 oC (depending on metal pouring temperature) instantly after the metal is poured into the mold. The temperature ramping rates could be thousands oC/sec. Then during the casting solidification and mold cooling, as the heat dissipates outwards through the green sand mold, green sand further away from the metal-mold interface is heated orderly, but at much lower heating rates (several to hundreds oC/min depending on the distance from the metal-mold interface and casting size). The peak temperatures also decrease quickly as the distances from the metal-mold interface increase (Zeng et al., 1985; Chen et al., 1990; Shih et al., 1996; Hsiau et al., 1998; Wang et al., 2006). The huge difference in the heating conditions could profoundly affect the volatile yields and distributions of the carbonaceous additives. To simulate the different heating conditions that the carbonaceous additives experience in the different locations within green sand molds, a thermogravimetric analyzer (TGA) and a Curie-point pyrolyzer were used in this research to pyrolyze the samples.
175
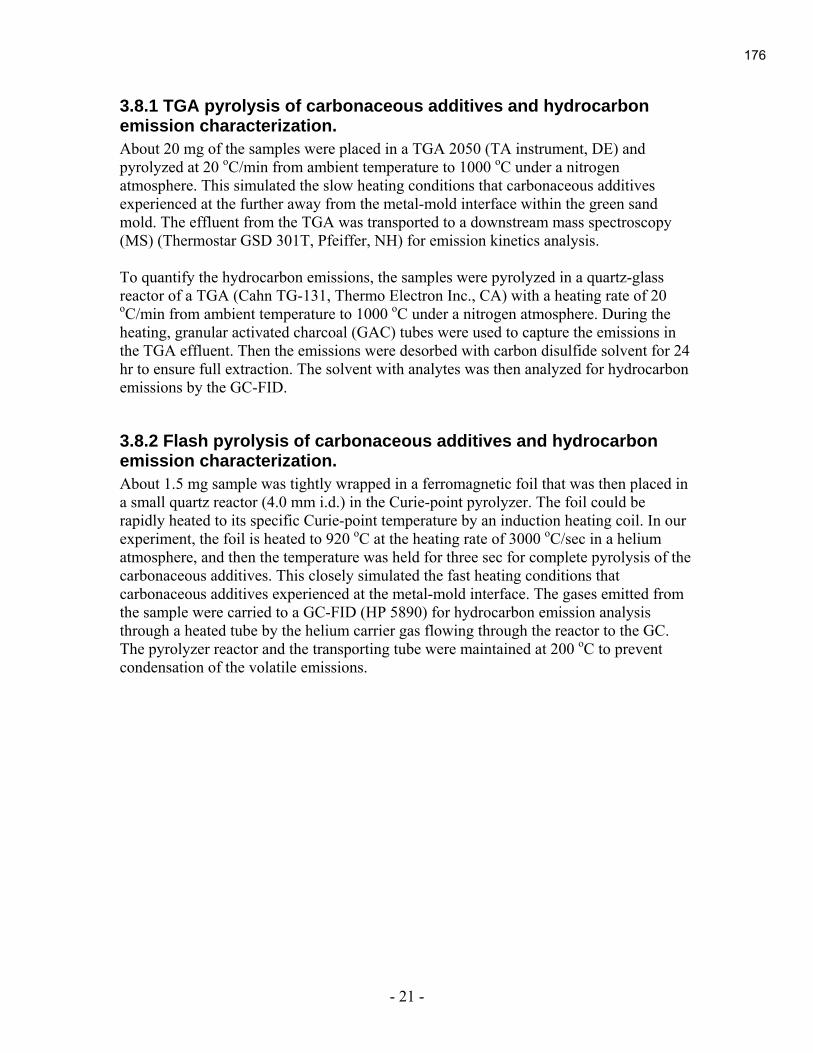
- 21 -
3.8.1 TGA pyrolysis of carbonaceous additives and hydrocarbon
emission characterization.
About 20 mg of the samples were placed in a TGA 2050 (TA instrument, DE) and pyrolyzed at 20 oC/min from ambient temperature to 1000 oC under a nitrogen atmosphere. This simulated the slow heating conditions that carbonaceous additives experienced at the further away from the metal-mold interface within the green sand mold. The effluent from the TGA was transported to a downstream mass spectroscopy (MS) (Thermostar GSD 301T, Pfeiffer, NH) for emission kinetics analysis. To quantify the hydrocarbon emissions, the samples were pyrolyzed in a quartz-glass reactor of a TGA (Cahn TG-131, Thermo Electron Inc., CA) with a heating rate of 20 oC/min from ambient temperature to 1000 oC under a nitrogen atmosphere. During the heating, granular activated charcoal (GAC) tubes were used to capture the emissions in the TGA effluent. Then the emissions were desorbed with carbon disulfide solvent for 24 hr to ensure full extraction. The solvent with analytes was then analyzed for hydrocarbon emissions by the GC-FID.
3.8.2 Flash pyrolysis of carbonaceous additives and hydrocarbon
emission characterization.
About 1.5 mg sample was tightly wrapped in a ferromagnetic foil that was then placed in a small quartz reactor (4.0 mm i.d.) in the Curie-point pyrolyzer. The foil could be rapidly heated to its specific Curie-point temperature by an induction heating coil. In our experiment, the foil is heated to 920 oC at the heating rate of 3000 oC/sec in a helium atmosphere, and then the temperature was held for three sec for complete pyrolysis of the carbonaceous additives. This closely simulated the fast heating conditions that carbonaceous additives experienced at the metal-mold interface. The gases emitted from the sample were carried to a GC-FID (HP 5890) for hydrocarbon emission analysis through a heated tube by the helium carrier gas flowing through the reactor to the GC. The pyrolyzer reactor and the transporting tube were maintained at 200 oC to prevent condensation of the volatile emissions.
176

- 22 -
4. Results and Discussion
4.1 On Characterization of the Properties and Performance of Highly volatile bituminous coal Used in Foundries
4.1.1 Environmental Scanning Electron Microscopy and Energy
Dispersive Spectroscopy of Treated Baghouse Dust Powders
Environmental Scanning Electron Microscopy (ESEM) imaging was performed to determine any visual differences in the bentonite particles due to the various AO component treatments. ESEM was performed using the secondary electron detector to obtain 3-dimensional images of the treated particles. Simultaneous with the imaging, Energy Dispersive Spectroscopy (EDS) was performed to determine the relative elemental concentration of the particles being imaged. The depth of penetration of the EDS is approximately 1µm, and the spatial resolution is also about 1µm—therefore the composition returned by the EDS is representative of the sample in the corresponding ESEM image within a few cubic microns of the area of focus. EDS elemental analysis of these fine particles should only be considered semi-quantitative, particularly for the non-uniform baghouse dust samples. Several different treated baghouse dusts were viewed under the ESEM, and hundreds of images were captured and many EDS spectra were acquired. Representative images and spectra representative are presented herein. ESEM images and EDS analyses were performed on the as-received baghouse dust (BHD) in order to obtain information on the starting material before any treatment. Figure 4-1 presents a representative ESEM image of the untreated baghouse dust, along with a corresponding EDS analysis. Figures 4-2 shows some typical montmorillonite agglomerates within the as-received baghouse dust. The as-received baghouse dust is generally a conglomeration of large silica and coal particles that are surrounded and coated with montmorillonite clay. The untreated BHD particles were generally quite spherical in shape. The EDS spectra were dominated by silicon and oxygen from the silica; carbon (and other impurities, including sulfur) from the coal; and silicon, oxygen, aluminum and magnesium from the montmorillonite. The lesser identified elements generally included sodium, calcium and iron from the clay, sulfur from the coal, and iron from the iron castings themselves. The as-received BHD particles are light and porous with a low bulk density. The porosity inherent in the dust was evident in some ESEM images. The porosity within some of the BHD agglomerates could partially be due to carbon volatilization from inside the particles, or due to the expansion and/or contraction of wet and dry montmorillonite. The initial thickness of the clay layers that surrounds most of the untreated BHD particles is not known with accuracy, but from the particle size analyses discussed previously, it likely ranges up to 25µm in radius. The thickness of the clay coating is greater than 1 µm
177

- 23 -
(the typical depth of penetration for EDS), as the EDS spectra of the untreated BHD consistently showed a large concentration of montmorillonite elements.
Figure 4-1: ESEM image and EDS analysis of an as-received BHD particle (3000x).
178
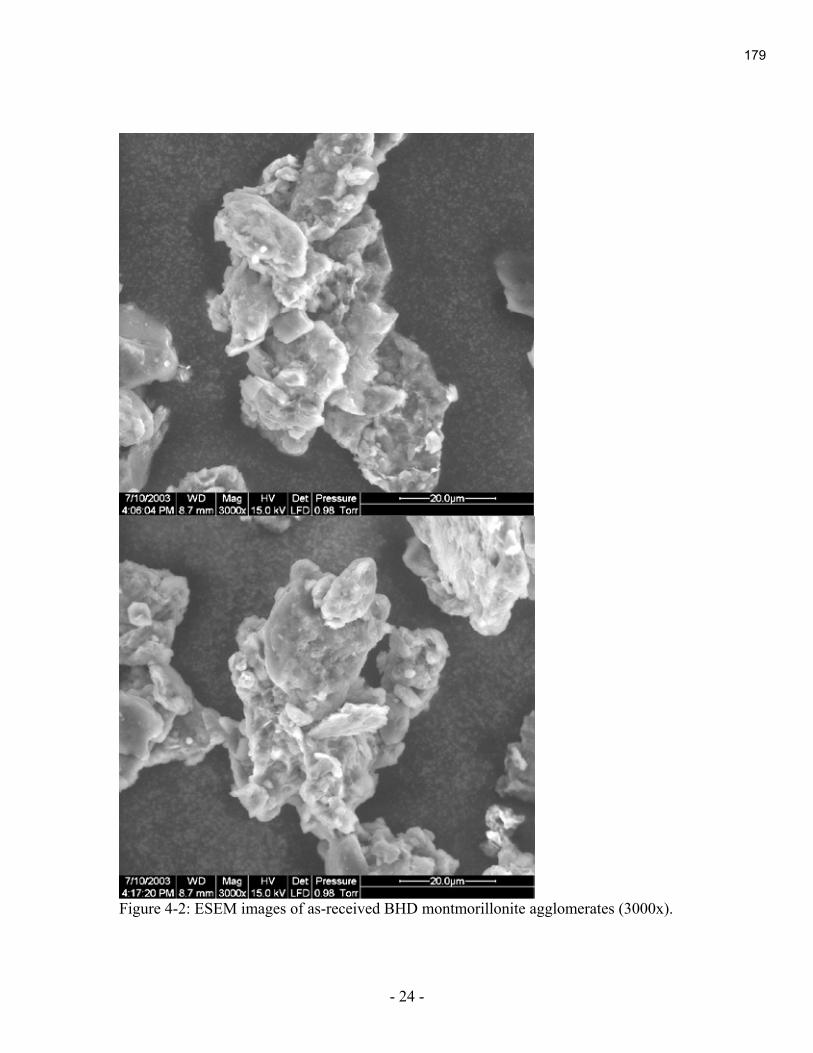
- 24 -
Figure 4-2: ESEM images of as-received BHD montmorillonite agglomerates (3000x).
179

- 25 -
ESEM/EDS of Non-AO (Stirred) Baghouse Dust
Numerous ESEM images and EDS analyses were obtained for the 60 min. stirred baseline baghouse dusts to maintain a baseline for comparison between the various treatments. Figures 4-3 to 4-10 present representative ESEM images of the stirred (and subsequently freeze-dried) BHD, along with corresponding EDS analyses. Figure 4-3 is a representation of the smaller montmorillonite particles that could be found in the freeze-dried slurry. Figures 4-4 to Figure 4-7 are representative images and elemental spectra of the common agglomerates found in the stirred BHD. The low-shear stirring does not produce enough force to break apart the bulk of the particles, and therefore much clay agglomeration is present in these particles. Figures 4-8 to 4-10 show examples of the large silica and coal particles within the BHD. Coal particles were generally free from clay coatings. On the other hand, silica particles were sometimes found clean (Figure 4-10), and other times found with some degree of montmorillonite coating on the surface (Figure 4-8). The images clearly show that stirring alone can clean much of the clay coating off of a significant amount of the large silica and coal particles in the dust. The EDS-determined carbon concentration at the surface of the non-AO treated BHD “montmorillonite” agglomerates was approximately 25-35 wt% for the typical BHD montmorillonite agglomerate. The EDS-determined carbon concentration on the surface of silica particles was significantly less than on that of the montmorillonite agglomerates, as shown by comparisons of the EDS results in Figures 4-8 and 4-10 with those in, i.e., Figure 4-4.
180

- 26 -
Figure 4-3: ESEM images of montmorillonite particles for non-AO (stirred) BHD.
181

- 27 -
Figure 4-4: ESEM image/EDS analysis of a montmorillonite agglomerate for non-AO (stirred) BHD. (σ is the standard deviation for the weight analysis.)
Element Weight% Wt% σ Atomic%
C 31.9 1.25 42.5
O 44.7 1.11 44.7
Na 0.6 0.15 0.4
Mg 1.0 0.13 0.7
Al 5.5 0.24 3.2
Si 13.4 0.4 7.6
Ca 0.9 0.12 0.4
Fe 2.0 0.24 0.6
182

- 28 -
Figure 4-5: ESEM image/EDS analysis of an agglomerate for non-AO (stirred) BHD.
Element Weight% Wt% σ Atomic%
C 15.4 3.71 22.6
O 51.9 2.39 57.1
Na 1.3 0.19 1.0
Mg 1.2 0.16 0.8
Al 7.4 0.41 4.8
Si 19.9 0.97 12.5
S 0.1 0.09 0.1
K 1.0 0.12 0.5
Ca 0.4 0.11 0.2
Fe 1.5 0.24 0.5
183

- 29 -
Figure 4-6: ESEM image/EDS analysis of an agglomerate for non-AO (stirred) BHD.
Element Weight% Wt% σ Atomic%
C 25.8 1.76 36.0
O 44.9 1.46 47.0
Na 1.0 0.2 0.7
Mg 1.2 0.2 0.8
Al 6.7 0.35 4.1
Si 17.2 0.63 10.2
Ca 1.1 0.17 0.5
Fe 2.2 0.39 0.7
184

- 30 -
Figure 4-7: ESEM image/EDS analysis of an agglomerate for non-AO (stirred) BHD.
Element Weight% Wt% σ Atomic%
C 34.4 2.67 44.5
O 46.1 1.99 44.8
Na 0.7 0.15 0.4
Mg 0.9 0.13 0.6
Al 4.6 0.26 2.6
Si 11.5 0.54 6.4
S 0.3 0.08 0.1
K 0.2 0.07 0.1
Ca 0.4 0.08 0.2
Fe 1.0 0.17 0.3
185
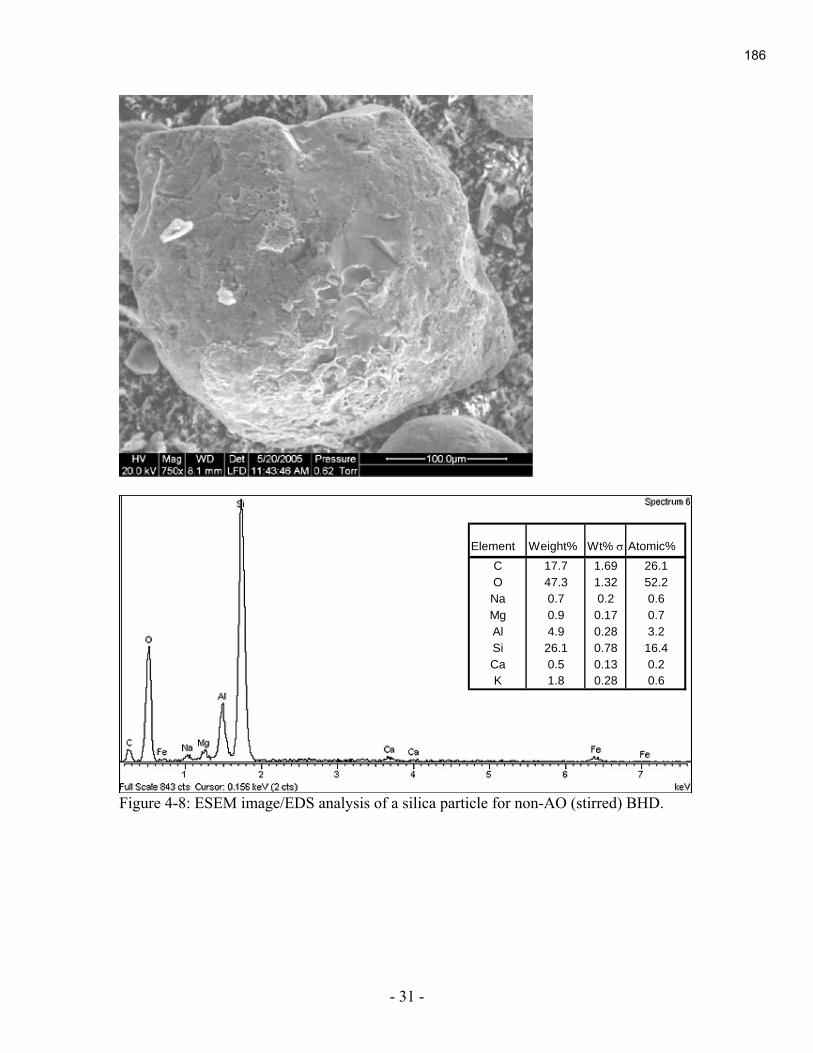
- 31 -
Figure 4-8: ESEM image/EDS analysis of a silica particle for non-AO (stirred) BHD.
Element Weight% Wt% σ Atomic%
C 17.7 1.69 26.1
O 47.3 1.32 52.2
Na 0.7 0.2 0.6
Mg 0.9 0.17 0.7
Al 4.9 0.28 3.2
Si 26.1 0.78 16.4
Ca 0.5 0.13 0.2
K 1.8 0.28 0.6
186

- 32 -
Figure 4-9: ESEM image/EDS analysis of a coal particle for non-AO (stirred) BHD.
Element Weight% Wt% σ Atomic%
C 62.7 1.16 71.2
O 29.6 1.18 25.2
Mg 0.5 0.1 0.3
Al 1.8 0.14 0.9
Si 4.1 0.19 2.0
S 0.3 0.08 0.1
Ca 0.2 0.07 0.1
Fe 0.9 0.2 0.2
187

- 33 -
ESEM/EDS of Treated Baghouse Dust
Various treatments of AO and AO components were applied to the baghouse dusts, as described throughout. The following is a selection of ESEM images and EDS spectra meant to compliment the discussion provided throughout the rest of this report. It should be noted that the montmorillonite particles became much too small with sufficient
Figure 4-10: ESEM image/EDS analysis of a silica particle for non-AO (stirred) BHD.
Element Weight% Wt% σ Atomic%
C 12.5 1.89 19.1
O 47.8 1.39 55.0
Na 0.5 0.17 0.4
Mg 0.4 0.14 0.3
Al 2.1 0.21 1.4
Si 35.8 1.05 23.5
Ca 0.2 0.11 0.1
Fe 0.8 0.29 0.3
188
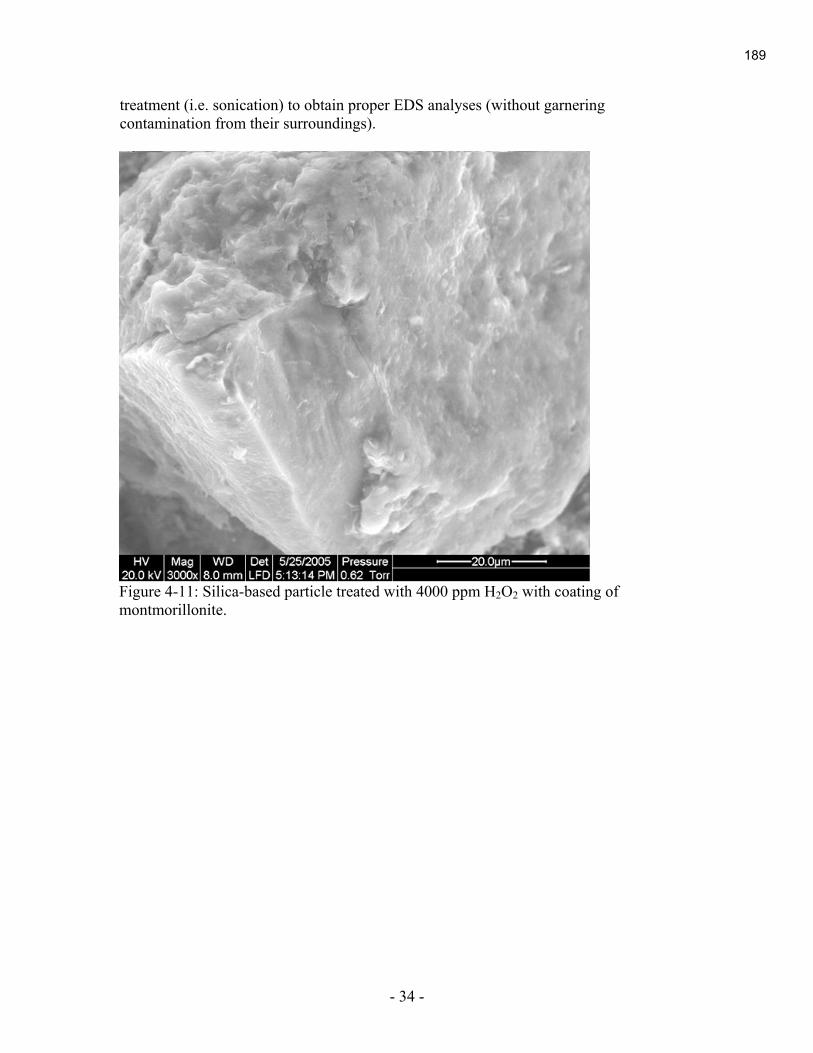
- 34 -
treatment (i.e. sonication) to obtain proper EDS analyses (without garnering contamination from their surroundings).
Figure 4-11: Silica-based particle treated with 4000 ppm H2O2 with coating of montmorillonite.
189

- 35 -
Hydrogen peroxide has been shown to have little to no effect on the physical properties of the baghouse dusts. As shown in Figure 4-12, (a) shows a large montmorillonite agglomerate, (b) shows the inner porosity inherent in the BHD particles, (c) shows a chunk of montmorillonite that has cleaved off of the bulk particle surface, and (d) shows another such particle where cleavage has not yet fully occurred.
a (3000x) b (3000x)
c (1000x) d (1000x) Figure 4-12: Hydrogen peroxide-treated BHD (4000 ppm).
190

- 36 -
Figure 4-13 shows the effect even 15 minutes of intense treatment has on the particle morphology. The montmorillonite particles for the 15 minutes of AO treatment are beginning to diminish in size and break apart from each other and from large particle surfaces. Image (b) shows a large coal particle surrounded by relatively small montmorillonite particles. Image (c) shows the surface of a silica particle coated with clay. Image (d) shows the morphology of montmorillonite particles as they are just beginning to be broken apart by low-intensity sonication. Figure 4-14 presents two images of BHD treated for one hour with the parallel-plate sonic horn. The particles are greatly broken apart and are starting to attain thin plate-like appearances, as were found for sonication and AO treatment of bentonite alone. The bottom image in Figure 4-14 shows a Si and K-rich particle (possibly illite) with obvious clay edge bonding at the surface of the larger particle.
a (AO, 15 min., 3000x) b (AO, 15 min., 3000x)
c (low-intensity sonication, 3000x) d (low-intensity sonication, 8000x) Figure 4-13: (a) and (b): Full AO treatment 15 minutes; (c) and (d): Sonication at only ~1/16 of normal intensity for 60 minutes.
191

- 37 -
Figure 4-14: Parallel-plate horn acoustic sonicated BHD (60 min., 100% intensity).
192
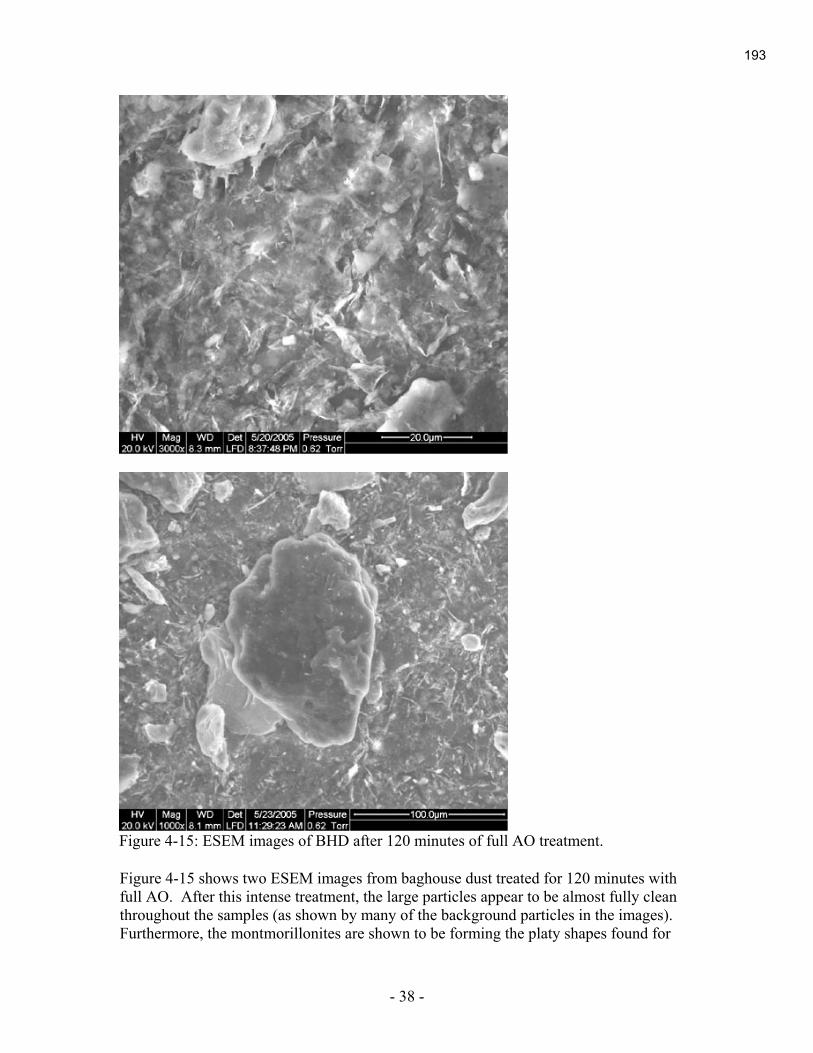
- 38 -
Figure 4-15 shows two ESEM images from baghouse dust treated for 120 minutes with full AO. After this intense treatment, the large particles appear to be almost fully clean throughout the samples (as shown by many of the background particles in the images). Furthermore, the montmorillonites are shown to be forming the platy shapes found for
Figure 4-15: ESEM images of BHD after 120 minutes of full AO treatment.
193
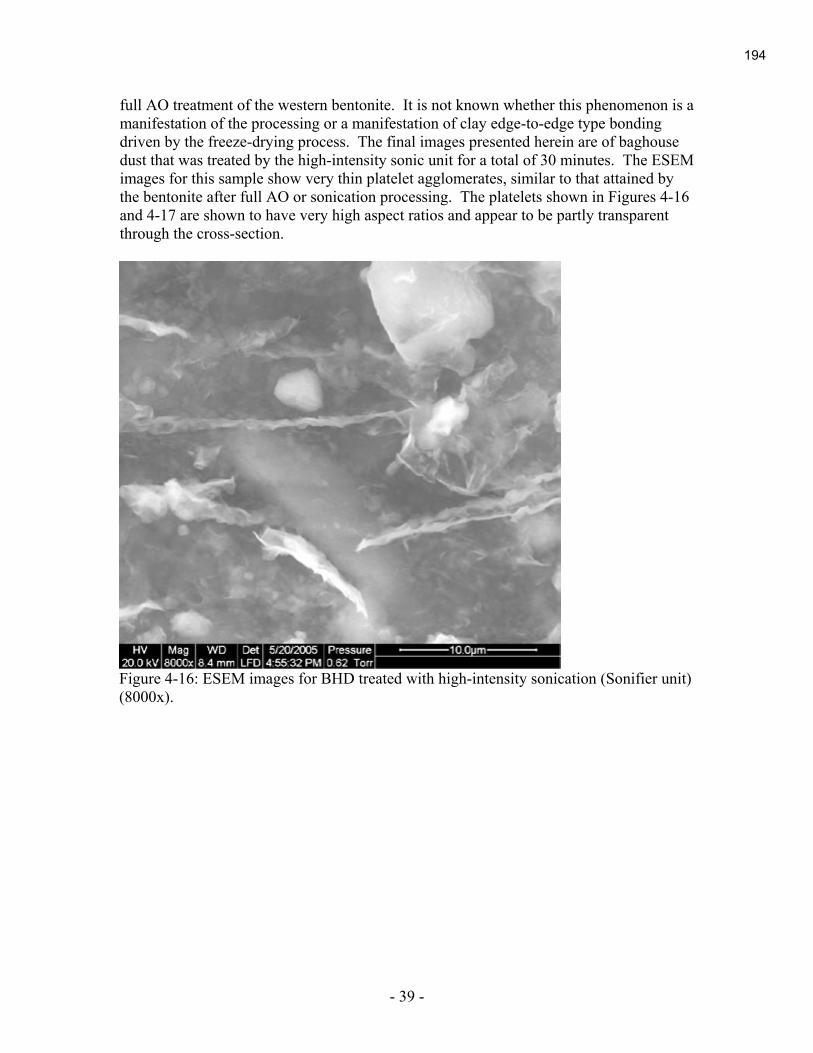
- 39 -
full AO treatment of the western bentonite. It is not known whether this phenomenon is a manifestation of the processing or a manifestation of clay edge-to-edge type bonding driven by the freeze-drying process. The final images presented herein are of baghouse dust that was treated by the high-intensity sonic unit for a total of 30 minutes. The ESEM images for this sample show very thin platelet agglomerates, similar to that attained by the bentonite after full AO or sonication processing. The platelets shown in Figures 4-16 and 4-17 are shown to have very high aspect ratios and appear to be partly transparent through the cross-section.
Figure 4-16: ESEM images for BHD treated with high-intensity sonication (Sonifier unit) (8000x).
194
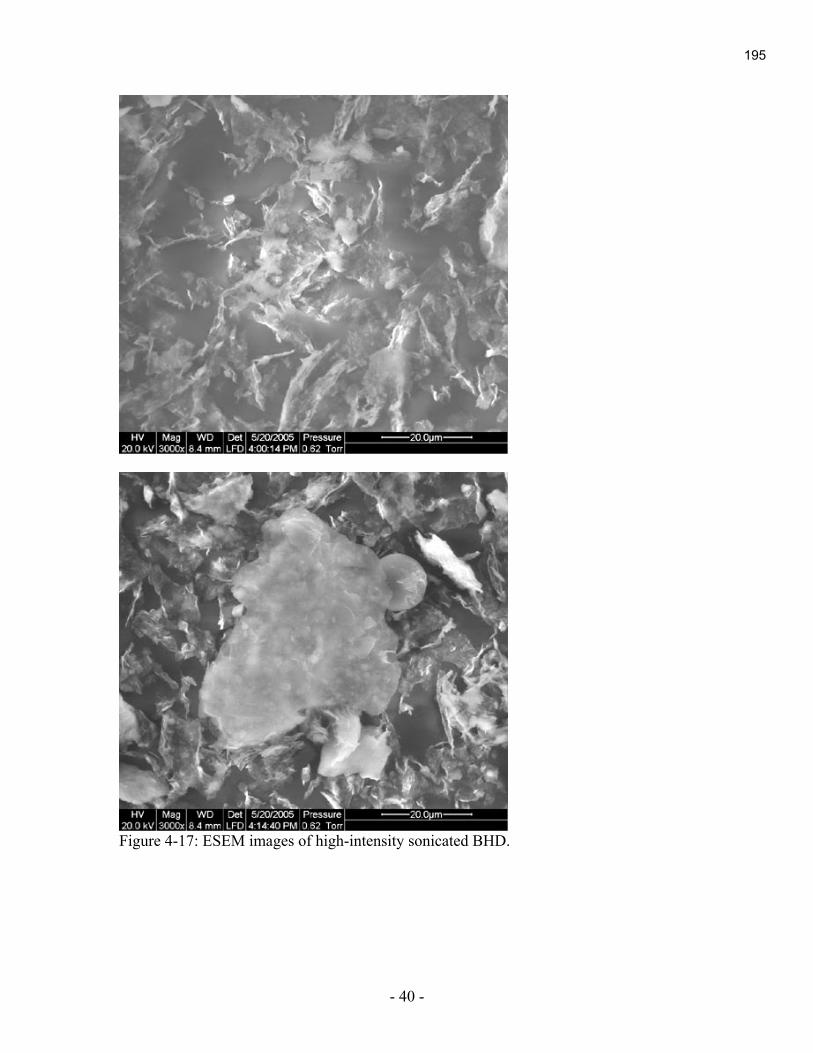
- 40 -
Figure 4-17: ESEM images of high-intensity sonicated BHD.
195

- 41 -
4.2 On Searching of the Optimal Raw Material for in-situ Pyrolyzed Carbon
4.2.1 Pyrolysis of Anthracite
Anthracite was pyrolyzed under nitrogen at 950˚C, with mass loss response as shown in Figure 4-18. The anthracite lost 6.5% of its mass during temperature ramp up, and only 0.5% more under the 1 hour pyrolysis.
Time (min)
0 20 40 60 80 100 120 140 160
Weig
ht P
erc
enta
ge %
92
94
96
98
100
Tem
pera
ture
oC
0
200
400
600
800
1000
Weight %
Temperature
Figure 4-18 Mass loss profile during pyrolysis of anthracite
196
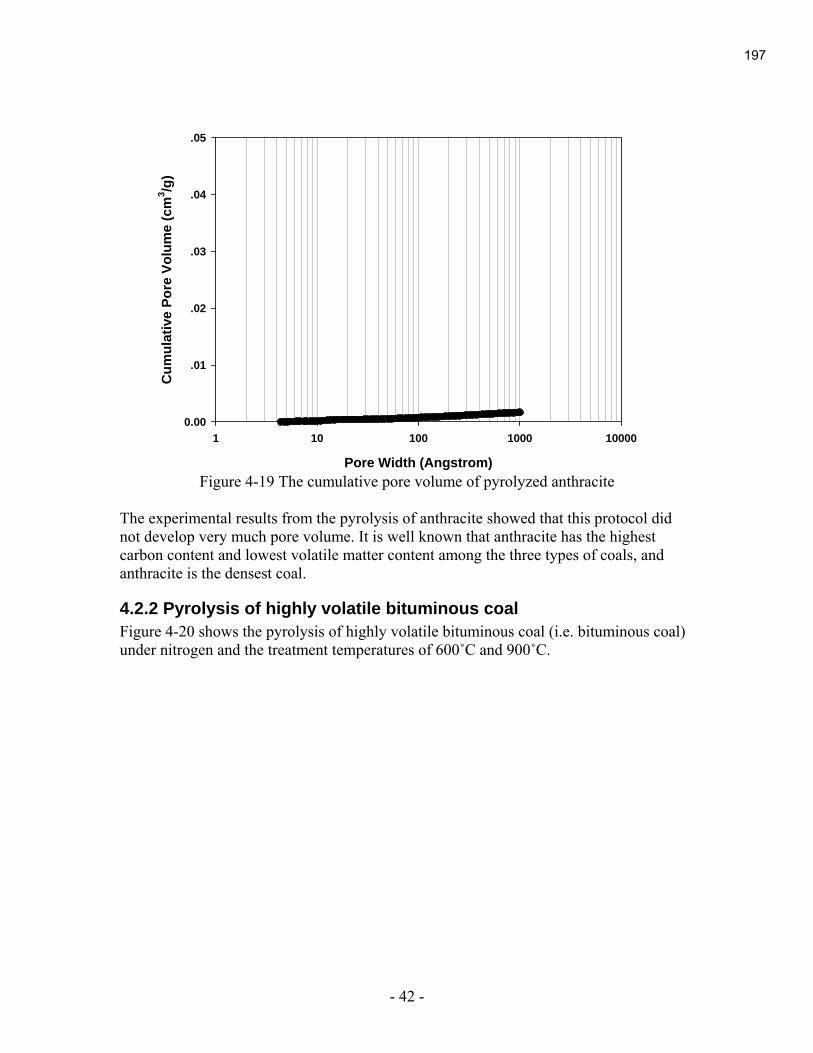
- 42 -
Pore Width (Angstrom)
1 10 100 1000 10000
Cu
mu
lativ
e P
ore V
olu
me
(cm
3/g
)
0.00
.01
.02
.03
.04
.05
Figure 4-19 The cumulative pore volume of pyrolyzed anthracite
The experimental results from the pyrolysis of anthracite showed that this protocol did not develop very much pore volume. It is well known that anthracite has the highest carbon content and lowest volatile matter content among the three types of coals, and anthracite is the densest coal.
4.2.2 Pyrolysis of highly volatile bituminous coal
Figure 4-20 shows the pyrolysis of highly volatile bituminous coal (i.e. bituminous coal) under nitrogen and the treatment temperatures of 600˚C and 900˚C.
197

- 43 -
Time (min)
0 20 40 60 80
Weig
ht P
erc
en
ta
ge
%
65
70
75
80
85
90
95
100
Te
mp
eratu
re
oC
0
200
400
600
800
1000
Weight 600 o
C
Weight 900 o
C
Temperature 900 o
C
Temperature 600 o
C
Figure 4-20 Mass loss profile during pyrolysis of highly volatile bituminous coal
During the pyrolysis, the highly volatile bituminous coal lost about 1/3 of its weight. And the mass loss of the highly volatile bituminous coal is about the same under different treatment temperatures, per Table 4-1.
Table 4-1 The mass loss of highly volatile bituminous coal during pyrolysis, with a 1-
hour holding time at the noted temperature Treatment Temperature (˚C) Mass Loss (% of Weight)
600 30.98 800 32.37 900 32.26
The authors observed that while the highly volatile bituminous coal experienced thermal treatment, the coal grains fused together to form a single chunk of pyrolyzed coal. We crushed these chunks so as to measure the surface areas and pore volume distributions. These characteristics for the pyrolyzed highly volatile bituminous coal are shown in Figure 4-21 and Figure 4-22 respectively.
198

- 44 -
Pore Width (Angstrom)
1 10 100 1000 10000
Cu
mu
lativ
e S
urfa
ce
Area
(m
2/g
)
0
20
40
60
80
100
120
140
800 oC
600 oC
900 oC
Figure 4-21 The cumulative surface area of pyrolyzed highly volatile bituminous coal at
various temperatures, listed in descending order of surface area
Pore Width (Angstrom)
1 10 100 1000 10000
Cu
mu
lativ
e P
ore V
olu
me (
cm
3/g
)
0.00
.01
.02
.03
.04
.05
800 o
C
600 o
C
900 o
C
Figure 4-22 The cumulative pore volumes of pyrolyzed highly volatile bituminous coal at
various temperatures, listed in descending order of pore volume
199

- 45 -
It can be seen that the pyrolyzed highly volatile bituminous coal provides more surface area and more pore volume than the anthracite. Under the treatment temperature of 800˚C for an hour, a cumulative surface area about 130 m2/g and a cumulative pore volume of about 0.045 cm3/g were achieved. Also, we can get from the cumulative pore volume curve that almost all the pores developed in the pyrolyzed highly volatile bituminous coal are micropores (pore with the pore width less than 20Ǻ). The effect of treatment temperatures on the surface area and pore volume distribution of pyrolyzed highly volatile bituminous coal is interesting. At first, it seems that with the increase of treatment temperature, the cumulative surface area and cumulative pore volume increase. That can be seen from the figure that more surface area and pore volume were produced under 800˚C than that of 600˚C. It is a straight forward that cracks in the carbon will increase with the increase of pyrolysis temperature. And some of the carbon content that remains at the lower temperature will be pyrolyzed at higher temperature (although the amount of this content is very small, most of the mass was lost below 600˚C). But as the treatment temperature increased to 900˚C, the pyrolyzed highly volatile bituminous coal lost 90% of it pore volume and almost all of it surface area. This phenomenon indicates that the carbon sintered and experienced some coking as temperatures progressed to 900˚C. The surface area and pore volume of the 800 ˚C pyrolyzed highly volatile bituminous coal was about 1/10 of that for conventional activated carbon. But compared to the results for anthracite, the experimental results of the highly volatile bituminous coal showed a favorable tendency, namely that coals with more volatile matter and moisture provided more surface area and pore volume during the pyrolysis.
4.2.3 Pyrolysis of Lignite
Figure 4-23 shows the pyrolysis mass loss profile for lignite under treatment temperature of 600˚C and 900˚C.
200

- 46 -
Time (min)
0 20 40 60 80
We
igh
t P
erc
en
tag
e %
30
40
50
60
70
80
90
100
Te
mp
era
ture
oC
0
200
400
600
800
1000
Weight 600 oC
Weight 900 oC
Temperature 900 oC
Temperature 600 oC
Figure 4-23 Mass loss profile during pyrolysis of Red Hill lignite
The Red Hills lignite lost 57-60% of its mass by weight during these pyrolysis conditions. Also as the mass loss effect of sustained holding at the treatment temperatures was slight (Table 4-2).
Table 4-2 The mass loss of Red Hills lignite during pyrolysis for 1 hour Treatment Temperature (˚C) Mass Loss (% of Weight)
600 57.48 800 59.96 900 56.32
The authors also observed that when the lignite grains experienced thermal pyrolysis, they remained as discrete grains, and they did not agglomerate into larger chunks. The surface areas and pore volume distributions of pyrolyzed Red Hills lignite are shown in Figure 4-24 and Figure 4-25 respectively.
201
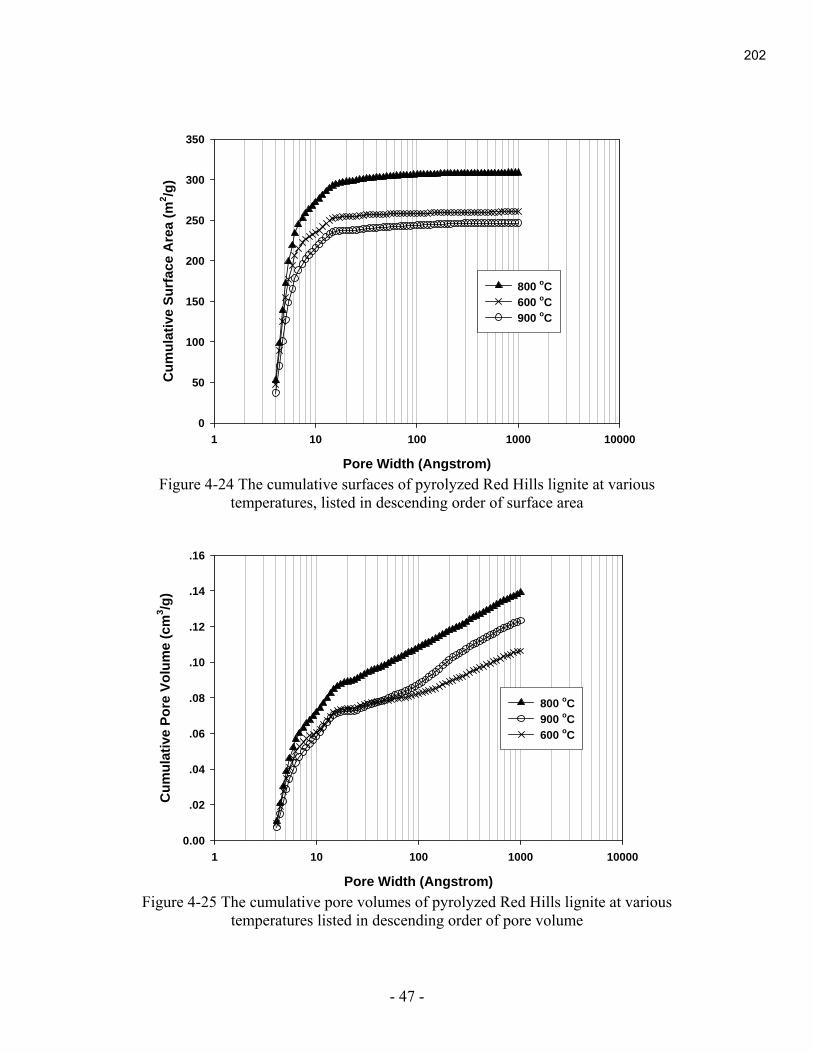
- 47 -
Pore Width (Angstrom)
1 10 100 1000 10000
Cu
mu
lativ
e S
urfa
ce
Area
(m
2/g
)
0
50
100
150
200
250
300
350
800 oC
600 oC
900 oC
Figure 4-24 The cumulative surfaces of pyrolyzed Red Hills lignite at various
temperatures, listed in descending order of surface area
Pore Width (Angstrom)
1 10 100 1000 10000
Cu
mu
lativ
e P
ore V
olu
me (
cm
3/g
)
0.00
.02
.04
.06
.08
.10
.12
.14
.16
800 oC
900 oC
600 oC
Figure 4-25 The cumulative pore volumes of pyrolyzed Red Hills lignite at various
temperatures listed in descending order of pore volume
202

- 48 -
It is clear that the pyrolyzed lignite developed yet more cumulative surface area and pore volume than did pyrolyzed highly volatile bituminous coal. Treatment temperature conditions at 800˚C yielded cumulative surface area of about 310 m2/g and a cumulative pore volume of about 0.145 cm3/g. As is shown in the cumulative pore volume curve, both micropores and mesopores were developed in the pyrolyzed lignite. This distinguishes the lignite from the highly volatile bituminous coal, where predominantly micropores developed. In general, more mesopores enhance the mass transfer of VOCs into the pyrolyzed coals, while more micropores enhance the extent of adsorption. In one way, the effect of treatment temperatures on the surface area and pore volume distribution in the pyrolyzed lignite is similar to that of the highly volatile bituminous coal. Specifically, the largest cumulative surface area and pore volume were achieved at 800˚C. Also, sintering of the micropores occurred at 900˚C for the lignite. However the lignite exhibited a far smaller decrease of cumulative surface area and pore volume at 900 ˚C than did the highly volatile bituminous coal. From the cumulative pore volume, it can be seen that only a fraction of the micropores were lost as temperature rose from 800˚C to 900˚C. From this perspective, lignite will be more robust than highly volatile bituminous coal when full-scale operations dictate somewhat variable treatment temperature.
4.2.4 Full-scale Emission Testing When Employing Activated carbon
As an in-kind contribution to this CPCPC study, Neenah foundry has conducted full-scale testing to discern how stack gas emissions can be affected by introducing activated carbon and zeolite. In this testing, activated carbon and zeolite were injected into process stack gases, collected and exhausted from a primary mold cooling process. The activated carbon was a reactivated carbon that has been provided by NORIT Americas (900 m2/g N2-BET surface area). The zeolite utilized was 100 mesh Clinoptilolite from Badger Mining. The dosage rate for zeolite was 8.0 mg/scf. The dosage rate of GAC was 3.0 mg/scf in combination in addition to 1.5 mg/scf zeolite. The location where these materials were injected was approximately 24 feet upstream of the Bag House. The contact time was approximately 0.56 s ahead of the bag houses and 0.32 seconds within the bag house fabric’s accumulated solids. This effect of injecting these materials on VOC emissions is illustrated in the following figure. All tests were performed at a production foundry while utilizing the same core resin, similar green sand properties and production parts employing similar core loading. VOC emissions were captured from the exhaust stack, after a baghouse, utilizing GAC absorbent tubes. Captured non-methane/ethane VOCs were measured as hexane with a GC-FID. Samples employing GAC /zeolite injection measured VOCs at 410 and 420 μg VOC. The test method’s reporting limit was 1.3 μg VOC. Comparative test measurements without injection are illustrated in blue. The GAC/zeolite injection samples are illustrated in pink while the zeolite injection samples are illustrated in yellow. While considerable scatter is present, the GAC samples illustrate a 32.86% reduction from the non-injection population mean. Similarly the zeolite injection samples illustrate a 6.14% reduction.
203

- 49 -
P3 Technicure Core
Primary Mold Cool Emission Profile
0.2
0.25
0.3
0.35
0.4
0.45
0.5
0.55
0.6
0.65
0.0 50.0 100.0 150.0 200.0 250.0 300.0 350.0
Core Loading #/ton Fe
Prim
ary M
old
Co
oli
ng
VO
C E
mis
sio
n F
acto
r #
/to
n F
e
VOC EF
GAC inject
Zeolite inject
These full-scale results, coupled with the Penn State bench-scale results provide us the optimism that if we were to produce pyrolyzed lignite carbon in-situ from the foundry’s waste heat, and introduce this in-situ pyrolyzed carbon into the exhaust ducts at a dose of 3 times that which was employed in these preliminary trials, then we can likewise diminish VOC’s by 1/3. Moreover, this VOC-loaded pyrolyzed carbon can provide the coal source for the make-up materials that are added to the next cycle of green sand any may provide additional adsorption of VOC emissions.
4.2.5 TGAs of Bag House Dust
Parenthetically, as part of collaborative work with Neenah foundry, we conducted some thermogravimetric analysis (TGA) of bag house dust from Neenah Foundry as shown in Figure 4-26 and 4-27.
204

- 50 -
8990919293949596979899
100
0 100 200 300 400 500 600 700 800 900 1000Temperature (
oC)
Cu
mm
ula
tiv
e M
ass
Lo
ss (
%) Old Dust, Apr. 2003
New Dust, Nov. 2005
Figure 4-26 Cumulative mass loss for bag house dusts that contain old and new core binder residues
0
0.05
0.1
0.15
0.2
0.25
0.3
0.35
0.4
0.45
0 100 200 300 400 500 600 700 800 900 1000Temperature (
oC)
Der
iva
tiv
e M
ass
Lo
ss (
mg
/g.
oC
)
Old Dust, Apr. 2003
New Dust, Nov. 2005
Figure 4-27 Derivative mass loss for bag house dusts that contain old and new core
binder residues
205

- 51 -
Neenah Foundry experienced an increase in gas-related casting defects after they employed a new core binder. One possible reason could be due to the abrupt release of excessive gases from the new core binder when the core was in contact with the molten metal. When compared the mass loss curve of an old bag house dust sample (Apr. 2003) and the new bag house dust (Nov. 2005), one could discern that the new bag house dust released more mass as gaseous products, especially above 850oC. This result suggests that it is true that the new core binder releases more gases when exposed to intense heat that might lead to the casting defects.
206
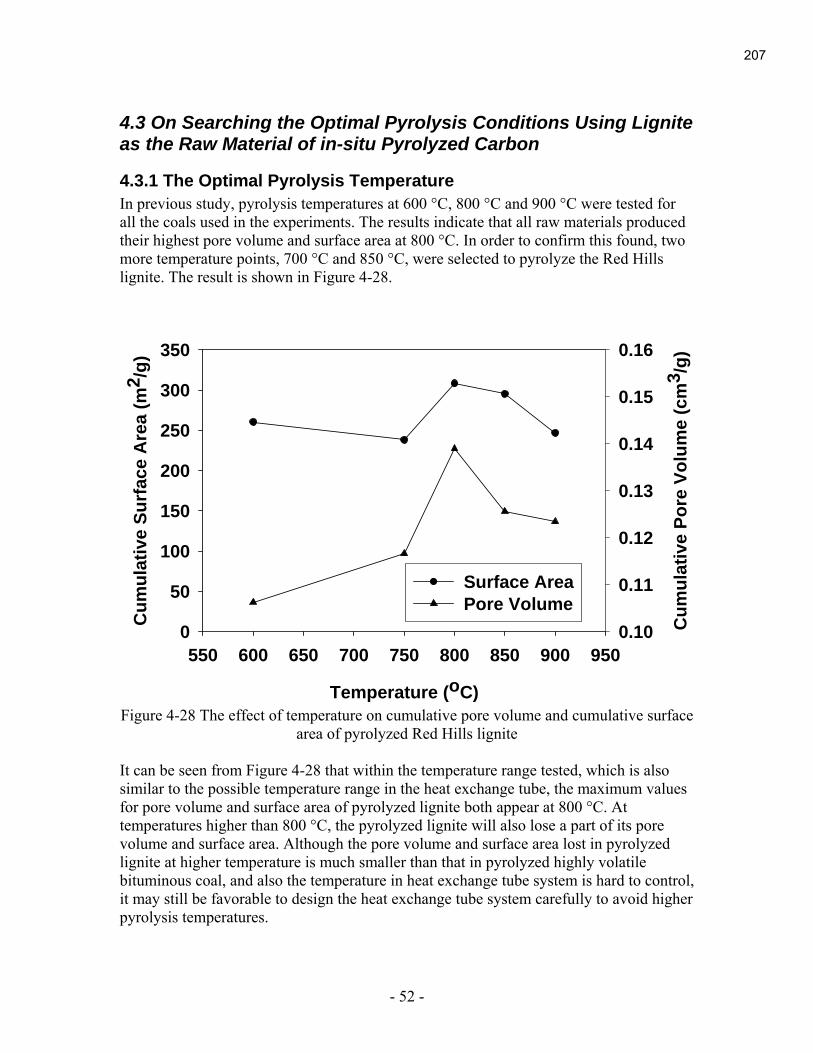
- 52 -
4.3 On Searching the Optimal Pyrolysis Conditions Using Lignite as the Raw Material of in-situ Pyrolyzed Carbon
4.3.1 The Optimal Pyrolysis Temperature
In previous study, pyrolysis temperatures at 600 °C, 800 °C and 900 °C were tested for all the coals used in the experiments. The results indicate that all raw materials produced their highest pore volume and surface area at 800 °C. In order to confirm this found, two more temperature points, 700 °C and 850 °C, were selected to pyrolyze the Red Hills lignite. The result is shown in Figure 4-28.
Temperature (o
C)
550 600 650 700 750 800 850 900 950
Cu
mu
lativ
e S
urface A
rea (
m2/g
)
0
50
100
150
200
250
300
350
Cu
mu
lativ
e P
ore V
olu
me (
cm
3/g
)
0.10
0.11
0.12
0.13
0.14
0.15
0.16
Surface Area
Pore Volume
Figure 4-28 The effect of temperature on cumulative pore volume and cumulative surface
area of pyrolyzed Red Hills lignite It can be seen from Figure 4-28 that within the temperature range tested, which is also similar to the possible temperature range in the heat exchange tube, the maximum values for pore volume and surface area of pyrolyzed lignite both appear at 800 °C. At temperatures higher than 800 °C, the pyrolyzed lignite will also lose a part of its pore volume and surface area. Although the pore volume and surface area lost in pyrolyzed lignite at higher temperature is much smaller than that in pyrolyzed highly volatile bituminous coal, and also the temperature in heat exchange tube system is hard to control, it may still be favorable to design the heat exchange tube system carefully to avoid higher pyrolysis temperatures.
207
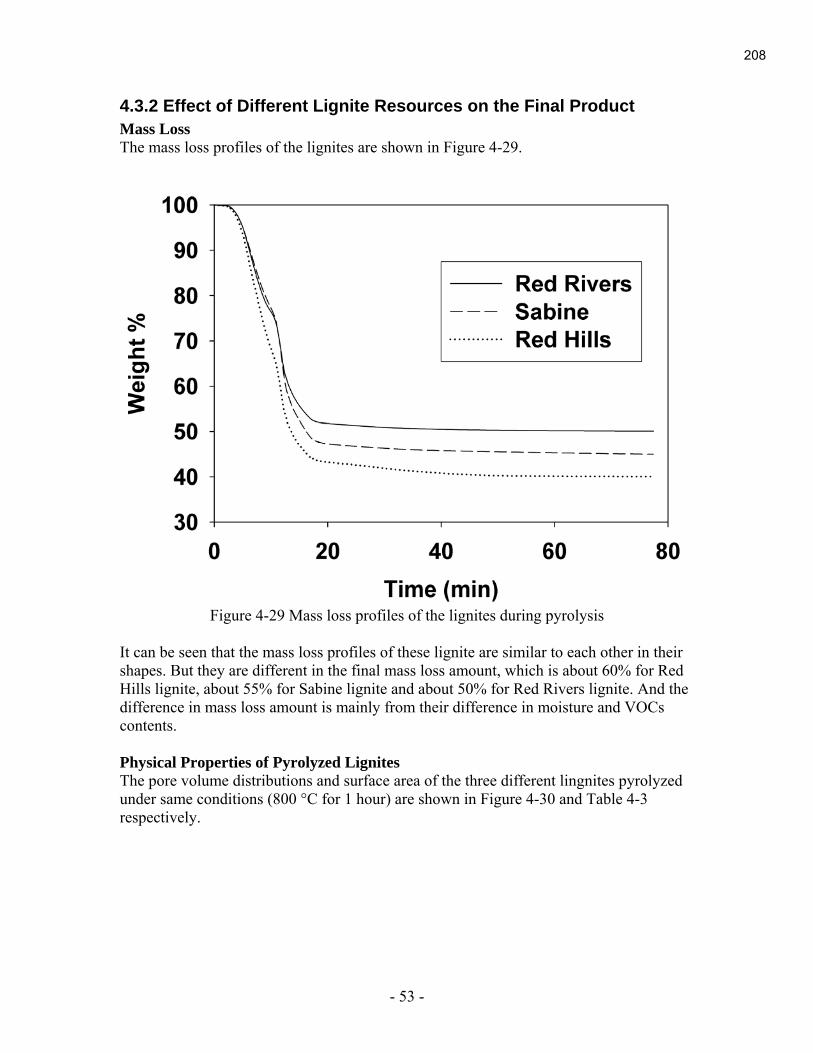
- 53 -
4.3.2 Effect of Different Lignite Resources on the Final Product
Mass Loss
The mass loss profiles of the lignites are shown in Figure 4-29.
Figure 4-29 Mass loss profiles of the lignites during pyrolysis
It can be seen that the mass loss profiles of these lignite are similar to each other in their shapes. But they are different in the final mass loss amount, which is about 60% for Red Hills lignite, about 55% for Sabine lignite and about 50% for Red Rivers lignite. And the difference in mass loss amount is mainly from their difference in moisture and VOCs contents.
Physical Properties of Pyrolyzed Lignites
The pore volume distributions and surface area of the three different lingnites pyrolyzed under same conditions (800 °C for 1 hour) are shown in Figure 4-30 and Table 4-3 respectively.
208
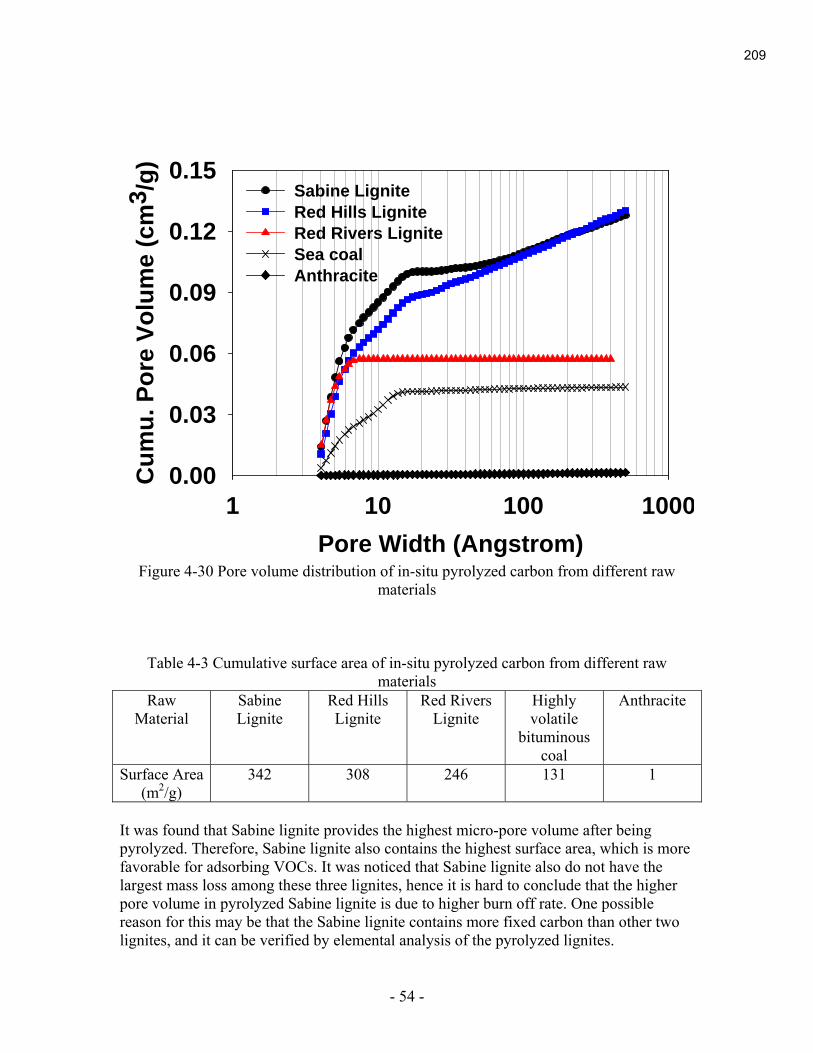
- 54 -
Pore Width (Angstrom)
1 10 100 1000
Cu
mu
. P
ore
Vo
lum
e (
cm
3/g
)
0.00
0.03
0.06
0.09
0.12
0.15Sabine Lignite
Red Hills Lignite
Red Rivers Lignite
Sea coal
Anthracite
Figure 4-30 Pore volume distribution of in-situ pyrolyzed carbon from different raw
materials
Table 4-3 Cumulative surface area of in-situ pyrolyzed carbon from different raw materials
Raw Material
Sabine Lignite
Red Hills Lignite
Red Rivers Lignite
Highly volatile
bituminous coal
Anthracite
Surface Area (m2/g)
342 308 246 131 1
It was found that Sabine lignite provides the highest micro-pore volume after being pyrolyzed. Therefore, Sabine lignite also contains the highest surface area, which is more favorable for adsorbing VOCs. It was noticed that Sabine lignite also do not have the largest mass loss among these three lignites, hence it is hard to conclude that the higher pore volume in pyrolyzed Sabine lignite is due to higher burn off rate. One possible reason for this may be that the Sabine lignite contains more fixed carbon than other two lignites, and it can be verified by elemental analysis of the pyrolyzed lignites.
209
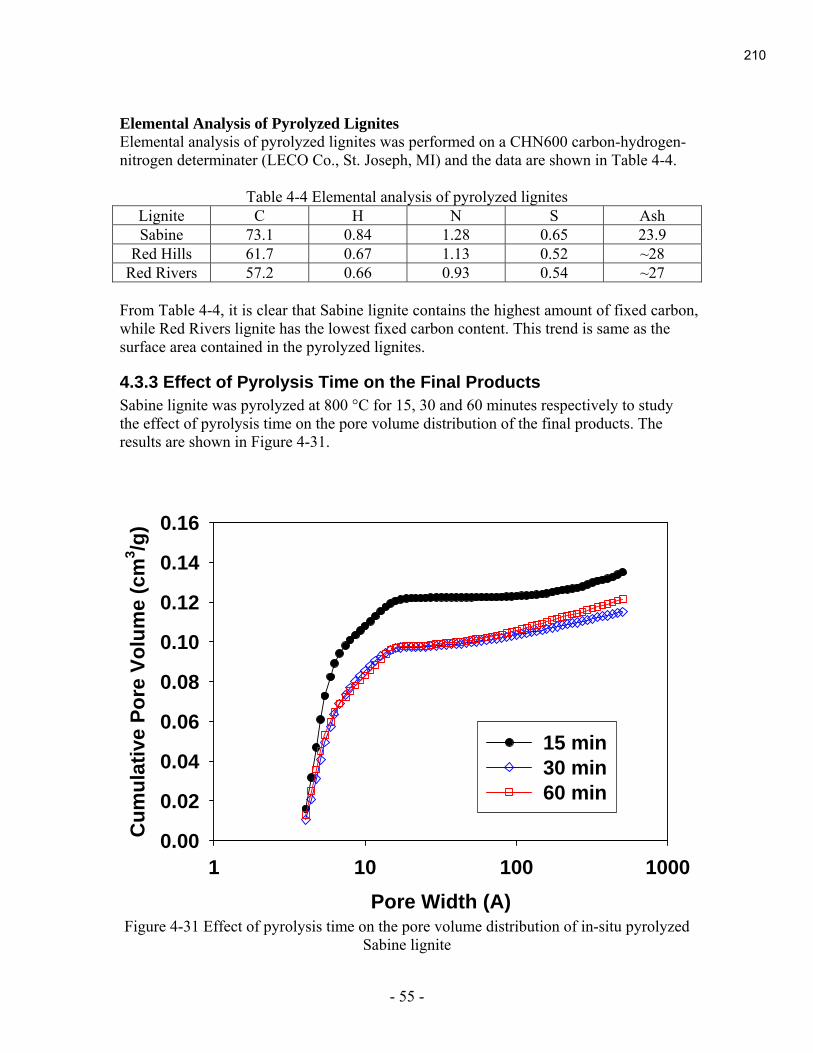
- 55 -
Elemental Analysis of Pyrolyzed Lignites
Elemental analysis of pyrolyzed lignites was performed on a CHN600 carbon-hydrogen-nitrogen determinater (LECO Co., St. Joseph, MI) and the data are shown in Table 4-4.
Table 4-4 Elemental analysis of pyrolyzed lignites Lignite C H N S Ash Sabine 73.1 0.84 1.28 0.65 23.9
Red Hills 61.7 0.67 1.13 0.52 ~28 Red Rivers 57.2 0.66 0.93 0.54 ~27
From Table 4-4, it is clear that Sabine lignite contains the highest amount of fixed carbon, while Red Rivers lignite has the lowest fixed carbon content. This trend is same as the surface area contained in the pyrolyzed lignites.
4.3.3 Effect of Pyrolysis Time on the Final Products
Sabine lignite was pyrolyzed at 800 °C for 15, 30 and 60 minutes respectively to study the effect of pyrolysis time on the pore volume distribution of the final products. The results are shown in Figure 4-31.
Pore Width (A)
1 10 100 1000
Cu
mu
lativ
e P
ore V
olu
me (
cm
3/g
)
0.00
0.02
0.04
0.06
0.08
0.10
0.12
0.14
0.16
15 min
30 min
60 min
Figure 4-31 Effect of pyrolysis time on the pore volume distribution of in-situ pyrolyzed
Sabine lignite
210
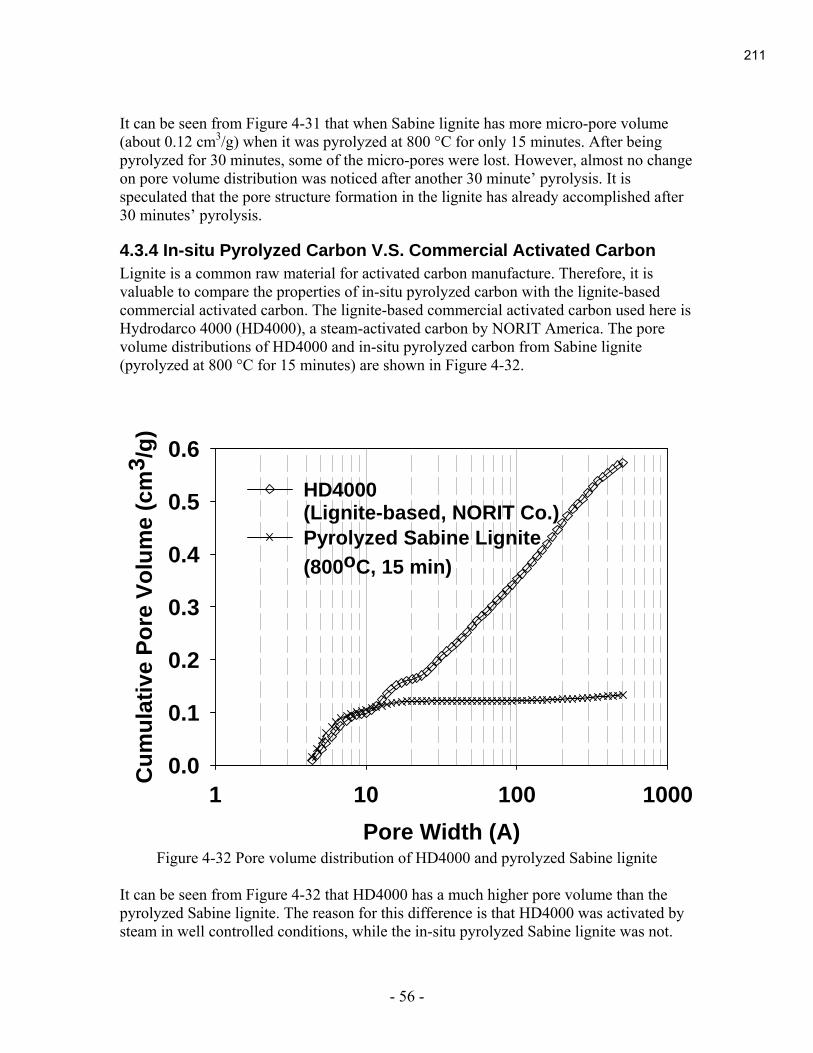
- 56 -
It can be seen from Figure 4-31 that when Sabine lignite has more micro-pore volume (about 0.12 cm3/g) when it was pyrolyzed at 800 °C for only 15 minutes. After being pyrolyzed for 30 minutes, some of the micro-pores were lost. However, almost no change on pore volume distribution was noticed after another 30 minute’ pyrolysis. It is speculated that the pore structure formation in the lignite has already accomplished after 30 minutes’ pyrolysis.
4.3.4 In-situ Pyrolyzed Carbon V.S. Commercial Activated Carbon
Lignite is a common raw material for activated carbon manufacture. Therefore, it is valuable to compare the properties of in-situ pyrolyzed carbon with the lignite-based commercial activated carbon. The lignite-based commercial activated carbon used here is Hydrodarco 4000 (HD4000), a steam-activated carbon by NORIT America. The pore volume distributions of HD4000 and in-situ pyrolyzed carbon from Sabine lignite (pyrolyzed at 800 °C for 15 minutes) are shown in Figure 4-32.
Pore Width (A)
1 10 100 1000
Cu
mu
lativ
e P
ore V
olu
me (
cm
3/g
)
0.0
0.1
0.2
0.3
0.4
0.5
0.6
HD4000
(Lignite-based, NORIT Co.)
Pyrolyzed Sabine Lignite
(800o
C, 15 min)
Figure 4-32 Pore volume distribution of HD4000 and pyrolyzed Sabine lignite
It can be seen from Figure 4-32 that HD4000 has a much higher pore volume than the pyrolyzed Sabine lignite. The reason for this difference is that HD4000 was activated by steam in well controlled conditions, while the in-situ pyrolyzed Sabine lignite was not.
211

- 57 -
However, by checking the pore volume distribution profile carefully it can be found that the micro-pore volume of in-situ pyrolyzed Sabine lignite is only slightly smaller than that of HD4000. Rendered from this high micro-pore volume, the surface area of the pyrolyzed Sabine lignite is 438 m2/g and about 82% of HD4000’s surface area, which is 535 m2/g. Therefore, predicted from the amount of surface area, the in-situ pyrolyzed lignite has a promising VOCs adsorption capacity.
4.3.5 Preliminary Test on Adsorption of VOCs on in-situ Pyrolyzed
Lignite
In the preliminary adsorption experiment Sabine lignite pyrolyzed at 800 °C for 1 hour was packed in the first section of the column. The proposal of this experiment is to test the feasibility of using the in-situ pyrolyzed carbon as adsorbent for VOCs adsorption. Meanwhile, the types of VOCs from the highly volatile bituminous coal emission can also be verified. Figure 4-33 shows the results of the adsorption experiments.
Figure 4-33 Adsorption of VOCs on pyrolyzed lignite It can be seen from Figure 4-33 that after been pyrolyzed, there is no VOCs left in the lignite. However, after the adsorption experiment, some VOCs were loaded onto the pyrolyzed lignite and only some small size VOCs were detected in the second section. The results indicate that the in-situ pyrolyzed lignite is feasible for adsorbing the VOCs from green sand mode emission. The breakthrough of the small size VOCs may due to either the capacity of the in-situ pyrolyzed carbon to adsorb these small size VOCs has already been exhausted, or the rate of the in-situ pyrolyzed carbon to adsorb these small size VOCs is not fast enough to separate all these compounds from the gas flow.
212

- 58 -
4.4 Evaluation of hydrocarbon emission characteristics of typical carbonaceous additives in green sand foundries
4.4.1 TGA Pyrolysis of Carbonaceous Additives.
The TGA profiles of the four samples are shown in Figure 4-34. The anthracite lost the lease mass and its mass loss mainly occurred above 600 oC. The highly volatile bituminous coal lost its mass mainly within the temperature range of 400-600 oC where the active thermal decomposition of coal occurred. The lignite lost its mass more gradually than the highly volatile bituminous coal. The cellulose lost most of its mass at 200-400 oC.
Figure 4-34 TGA profiles of the carbonaceous additives.
Mass spectroscopy (MS) revealed the temperature ranges where the major hydrocarbon gas products (methane) and HAPs released from the carbonaceous additives during the TGA slow heating (see Figure 4-34). The MS responses to the anthracite are relatively weak compared with other materials tested herein. No apparent peaks were detected for the anthracite except methane that shows a peak between 600-800 oC. Most of the hydrocarbon gases and major HAPs are released from the highly volatile bituminous coal in the temperature range of 400-600 oC, with the exception of benzene that exhibited a considerable increase above 800 oC. Lignite releases hydrocarbon gases at a relative wide temperature range (300-800 oC) compared with the highly volatile bituminous coal. The cellulose released methane and HAPs at relative lower temperature range (200- 600 oC). It is noted that for the coals of different ranks, i.e. the anthracite, highly volatile bituminous coal and lignite tested herein, the MS responses correlated well with the TGA test. Most of the HAPs are released in the same temperature range where the coals lost most of their mass. In comparison, the cellulose lost most of its mass before 400 oC (see Figure 4-34), while most of its HAPs are generated above 400 oC. This reflected the different pyrolysis mechanisms of the coals and the cellulose. When the coals are progressively heated, they will lose chemically combined H2O, CO, CO2 and some occluded species at relative low temperatures (<350oC). Then suddenly, considerable tar
213
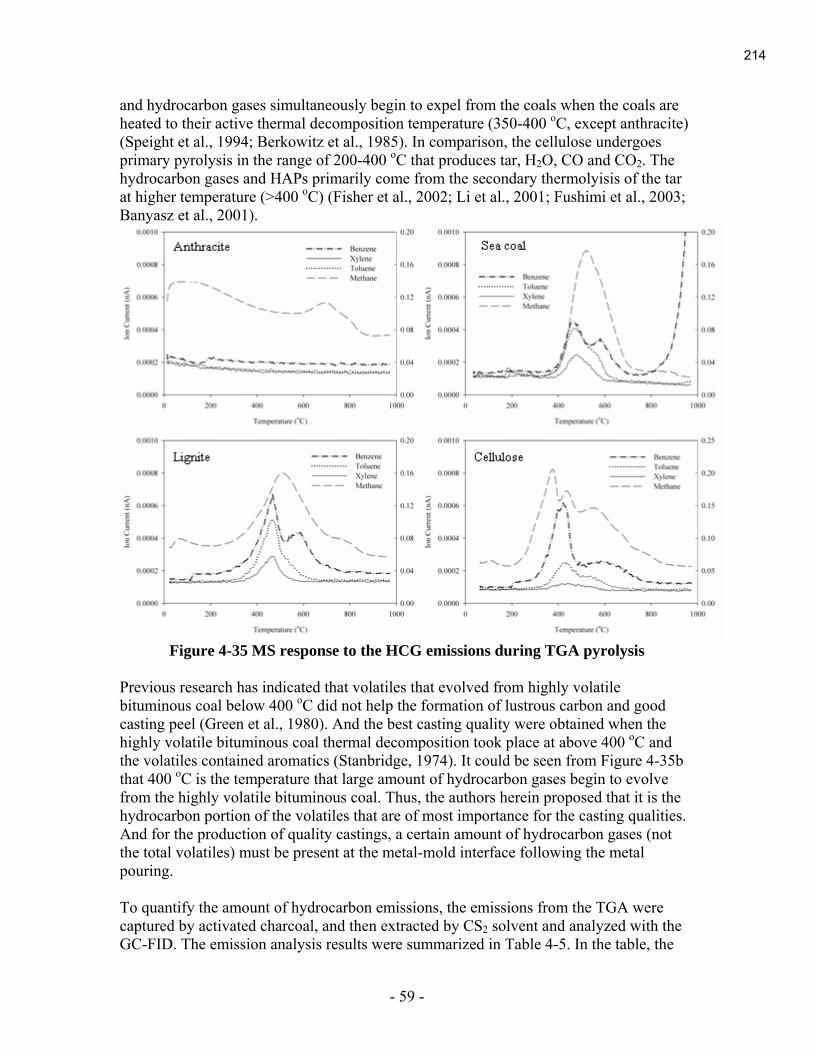
- 59 -
and hydrocarbon gases simultaneously begin to expel from the coals when the coals are heated to their active thermal decomposition temperature (350-400 oC, except anthracite) (Speight et al., 1994; Berkowitz et al., 1985). In comparison, the cellulose undergoes primary pyrolysis in the range of 200-400 oC that produces tar, H2O, CO and CO2. The hydrocarbon gases and HAPs primarily come from the secondary thermolyisis of the tar at higher temperature (>400 oC) (Fisher et al., 2002; Li et al., 2001; Fushimi et al., 2003; Banyasz et al., 2001).
Figure 4-35 MS response to the HCG emissions during TGA pyrolysis
Previous research has indicated that volatiles that evolved from highly volatile bituminous coal below 400 oC did not help the formation of lustrous carbon and good casting peel (Green et al., 1980). And the best casting quality were obtained when the highly volatile bituminous coal thermal decomposition took place at above 400 oC and the volatiles contained aromatics (Stanbridge, 1974). It could be seen from Figure 4-35b that 400 oC is the temperature that large amount of hydrocarbon gases begin to evolve from the highly volatile bituminous coal. Thus, the authors herein proposed that it is the hydrocarbon portion of the volatiles that are of most importance for the casting qualities. And for the production of quality castings, a certain amount of hydrocarbon gases (not the total volatiles) must be present at the metal-mold interface following the metal pouring. To quantify the amount of hydrocarbon emissions, the emissions from the TGA were captured by activated charcoal, and then extracted by CS2 solvent and analyzed with the GC-FID. The emission analysis results were summarized in Table 4-5. In the table, the
214

- 60 -
hydrocarbons of C1-C5 are normalized to the standard of methane, and the C6-C16 are normalized to the standard of benzene. As shown, the highly volatile bituminous coal has the highest HCG yields in the slow TGA heating situation, followed by the lignite, cellulose and anthracite. Table 4-5 Hydrocarbon Emissions (mg/g) of the carbonaceous additives during the
TGA pyrolysis
Hydrocarbon (mg/g) Representative HAPs (mg/g)
C1-C5 C6-C16 Benzene Toluene Xylene Sample
mean SD mean SD mean SD mean SD mean SD Anthracite 0.105 0.036 0.374 0.103 0.072 0.027 0.021 0.007 0.005 0.002 Highly
volatile
bituminous
coal
10.093 0.086 8.499 0.751 0.406 0.021 0.783 0.065 0.384 0.059
Lignite 5.274 0.621 4.572 0.177 0.351 0.002 0.413 0.006 0.160 0.004 Cellulose 3.838 0.466 2.602 0.297 0.213 0.015 0.298 0.038 0.077 0.009
4.4.2 Flash Pyrolysis of Carbonaceous additives.
During the flash pyrolysis, the carbonaceous additives were completely devolatilized. The remaining char or ash of the anthracite, highly volatile bituminous coal, lignite and cellulose was 89.5%, 56.3%, 47.2%, and 7.8%. Practically, the cellulose left the least amount of ash content that are usually undesirable in the casting process; and in full-scale foundries, this means that less new sand addition is needed to dilute these ash fines in the green sand system (Lafay et al., 1987). This, in turn, decreases the amount of waste sand that needs to be landfilled. A typical GC-FID response to the hydrocarbon emissions from the flash pyrolysis is shown in Figure 4-36. As shown, the hydrocarbon emission characteristics of these carbonaceous additives are very similar. This is possibly the reason that all these carbonaceous additives are capable of producing quality castings (LaFay et al., 2004; Thiel et al., 2005). Large amount of hydrocarbon emitted as methane (and ethane); benzene, toluene, xylene (BTX) compounds composed the major part of the HAP emissions. Although the compositions of the hydrocarbon emissions were similar for the four samples tested herein, the yields of the hydrocarbons varied considerably, which were summarized in Table 4-6. In the table, the hydrocarbons of C1-C5 are normalized to the standard of methane, and the C6-C16 are normalized to the standard of benzene. As shown, the cellulose has the highest HCG yields in the flash pyrolysis situation, followed by the highly volatile bituminous coal, lignite and anthracite.
215
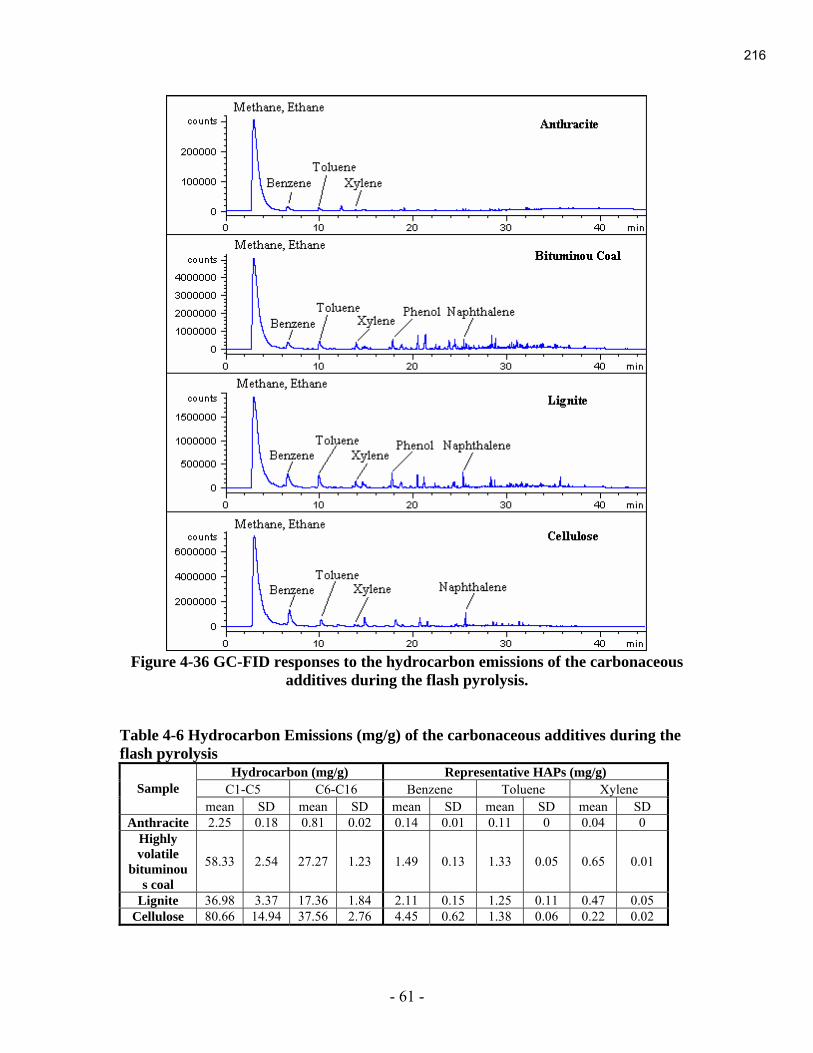
- 61 -
Figure 4-36 GC-FID responses to the hydrocarbon emissions of the carbonaceous
additives during the flash pyrolysis.
Table 4-6 Hydrocarbon Emissions (mg/g) of the carbonaceous additives during the
flash pyrolysis
Hydrocarbon (mg/g) Representative HAPs (mg/g)
C1-C5 C6-C16 Benzene Toluene Xylene Sample
mean SD mean SD mean SD mean SD mean SD Anthracite 2.25 0.18 0.81 0.02 0.14 0.01 0.11 0 0.04 0
Highly
volatile
bituminou
s coal
58.33 2.54 27.27 1.23 1.49 0.13 1.33 0.05 0.65 0.01
Lignite 36.98 3.37 17.36 1.84 2.11 0.15 1.25 0.11 0.47 0.05 Cellulose 80.66 14.94 37.56 2.76 4.45 0.62 1.38 0.06 0.22 0.02
216

- 62 -
4.4.3 Discussion
As mentioned before, a certain amount of HCGs are needed at the metal-mold interface to prevent the sand adherence to the casting surface. Thus, in full-scale foundries, this means that the amount of the carbonaceous additives in the green sand must be adjusted according to their capacity to release HCGs. The anthracite seems not an ideal carbonaceous additive in the green sand since it has very low HCG yield unless very large amount of anthracite is used in the green sand. It is noted that lustrous carbon film is formed at the metal-mold interface instantly as the molten metal is poured into the green sand mold (Naro, 2002). And rationally, the role of the volatiles and lustrous carbon film in preventing sand grains from sticking to the casting surface is only effective before the casting develops a solid skin that usually takes less than one minute after metal pouring (Hsiau et al., 1998; Shih et al., 1996). Thus, it is inferred that the lustrous carbon film is formed from the HCGs that are released from the flash pyrolysis of carbonaceous additives at the very vicinity of the metal-sand interface. The HCGs released from the slow heating of carbonaceous additives that are further away from the metal-mold interface do not help develop the lustrous carbon film and prevent sand adherence to the casting surface, while they could contain significant amount of HAPs. For example, Hsiau and Shih showed that it took about 3 and 10 minutes respectively for the green sand that was 1.0 cm and 1.5 cm away from the metal-mold interface to be heated to 400 oC, and thus to release HCGs (Hsiau et al., 1998; Shih et al., 1996). But at the moments, the solidification of the casting surface has well completed. Thus, the authors herein proposed that only the HCGs that are released from the flash pyrolysis of carbonaceous additives at the metal-mold interface are of great importance for the casting process. The HCGs released from the slow heating of carbonaceous additives at further away from the metal-mold interface has limited value in improving casting surface quality, while they may contribute the major HAP emissions. It could be seen from Figure 4-36 that HAP emissions from these carbonaceous additives mainly occur above 400 oC. And in casting practice, green sand molds are usually kept intact for about 30-60 min for casting solidification and mold cooling after the molten metal is poured in the mold. During this period, as the casting heat dissipates from the metal-mold interface outwards through the green sand mold, a considerable fraction of the green sand mold can be slowly heated to temperatures above 400 oC, and thus release HAPs (Dempsey et al., 1997; LaFay et al., 1998). From this perspective, the ideal carbonaceous additives should be able to release sufficient HCGs during the flash pyrolysis at the metal-mold interface, and release the least of HAPs during the slow heating at the major part of the green sand mold. And the authors herein perceive that the cellulose is a potential ideal carbonaceous additives as discussed below.
217
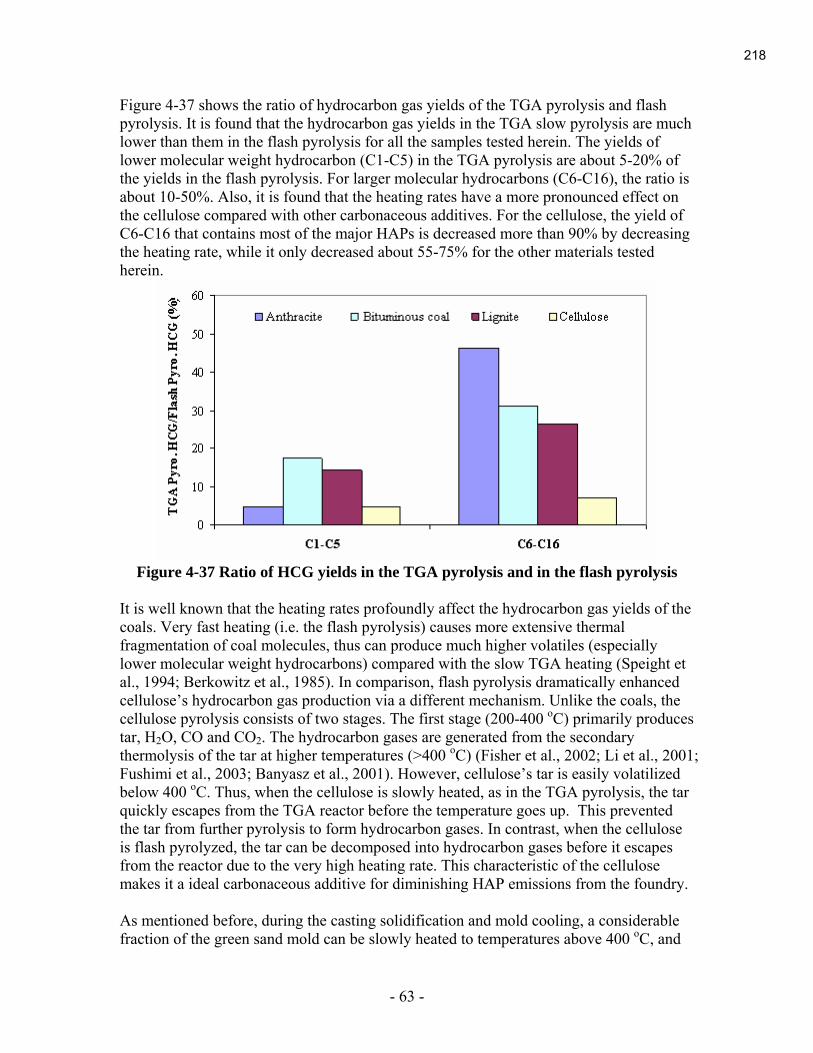
- 63 -
Figure 4-37 shows the ratio of hydrocarbon gas yields of the TGA pyrolysis and flash pyrolysis. It is found that the hydrocarbon gas yields in the TGA slow pyrolysis are much lower than them in the flash pyrolysis for all the samples tested herein. The yields of lower molecular weight hydrocarbon (C1-C5) in the TGA pyrolysis are about 5-20% of the yields in the flash pyrolysis. For larger molecular hydrocarbons (C6-C16), the ratio is about 10-50%. Also, it is found that the heating rates have a more pronounced effect on the cellulose compared with other carbonaceous additives. For the cellulose, the yield of C6-C16 that contains most of the major HAPs is decreased more than 90% by decreasing the heating rate, while it only decreased about 55-75% for the other materials tested herein.
Figure 4-37 Ratio of HCG yields in the TGA pyrolysis and in the flash pyrolysis
It is well known that the heating rates profoundly affect the hydrocarbon gas yields of the coals. Very fast heating (i.e. the flash pyrolysis) causes more extensive thermal fragmentation of coal molecules, thus can produce much higher volatiles (especially lower molecular weight hydrocarbons) compared with the slow TGA heating (Speight et al., 1994; Berkowitz et al., 1985). In comparison, flash pyrolysis dramatically enhanced cellulose’s hydrocarbon gas production via a different mechanism. Unlike the coals, the cellulose pyrolysis consists of two stages. The first stage (200-400 oC) primarily produces tar, H2O, CO and CO2. The hydrocarbon gases are generated from the secondary thermolysis of the tar at higher temperatures (>400 oC) (Fisher et al., 2002; Li et al., 2001; Fushimi et al., 2003; Banyasz et al., 2001). However, cellulose’s tar is easily volatilized below 400 oC. Thus, when the cellulose is slowly heated, as in the TGA pyrolysis, the tar quickly escapes from the TGA reactor before the temperature goes up. This prevented the tar from further pyrolysis to form hydrocarbon gases. In contrast, when the cellulose is flash pyrolyzed, the tar can be decomposed into hydrocarbon gases before it escapes from the reactor due to the very high heating rate. This characteristic of the cellulose makes it a ideal carbonaceous additive for diminishing HAP emissions from the foundry. As mentioned before, during the casting solidification and mold cooling, a considerable fraction of the green sand mold can be slowly heated to temperatures above 400 oC, and
218
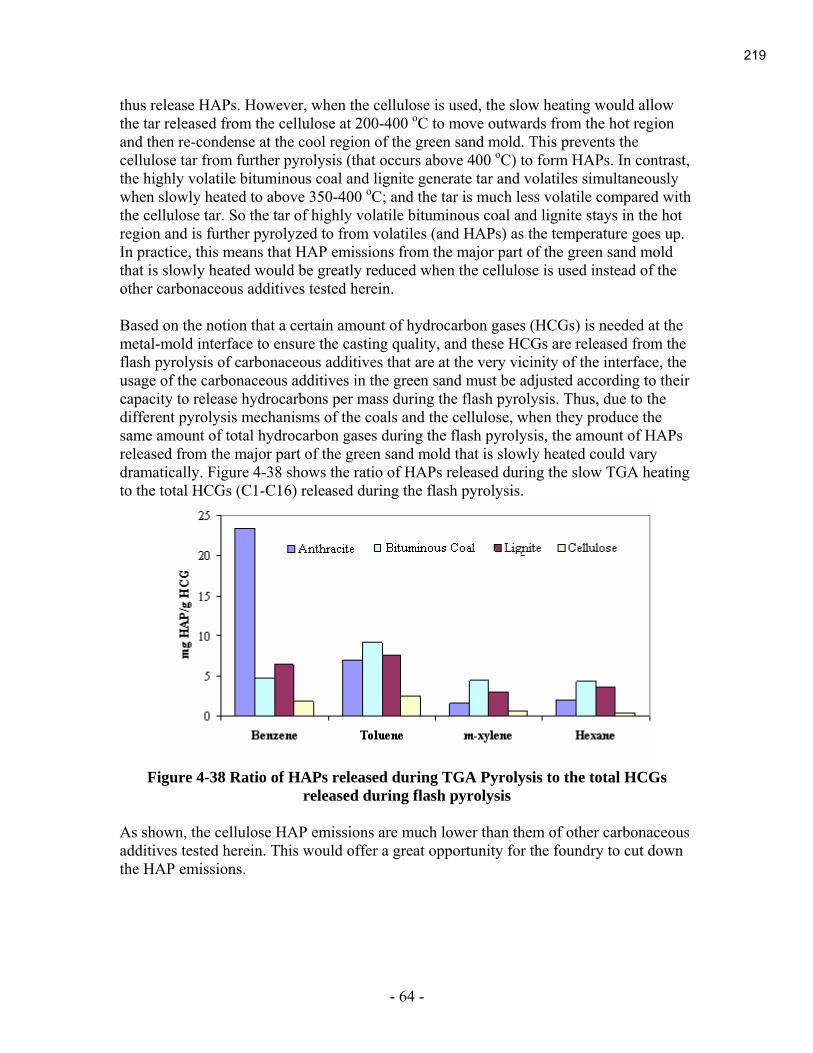
- 64 -
thus release HAPs. However, when the cellulose is used, the slow heating would allow the tar released from the cellulose at 200-400 oC to move outwards from the hot region and then re-condense at the cool region of the green sand mold. This prevents the cellulose tar from further pyrolysis (that occurs above 400 oC) to form HAPs. In contrast, the highly volatile bituminous coal and lignite generate tar and volatiles simultaneously when slowly heated to above 350-400 oC; and the tar is much less volatile compared with the cellulose tar. So the tar of highly volatile bituminous coal and lignite stays in the hot region and is further pyrolyzed to from volatiles (and HAPs) as the temperature goes up. In practice, this means that HAP emissions from the major part of the green sand mold that is slowly heated would be greatly reduced when the cellulose is used instead of the other carbonaceous additives tested herein. Based on the notion that a certain amount of hydrocarbon gases (HCGs) is needed at the metal-mold interface to ensure the casting quality, and these HCGs are released from the flash pyrolysis of carbonaceous additives that are at the very vicinity of the interface, the usage of the carbonaceous additives in the green sand must be adjusted according to their capacity to release hydrocarbons per mass during the flash pyrolysis. Thus, due to the different pyrolysis mechanisms of the coals and the cellulose, when they produce the same amount of total hydrocarbon gases during the flash pyrolysis, the amount of HAPs released from the major part of the green sand mold that is slowly heated could vary dramatically. Figure 4-38 shows the ratio of HAPs released during the slow TGA heating to the total HCGs (C1-C16) released during the flash pyrolysis.
Figure 4-38 Ratio of HAPs released during TGA Pyrolysis to the total HCGs
released during flash pyrolysis
As shown, the cellulose HAP emissions are much lower than them of other carbonaceous additives tested herein. This would offer a great opportunity for the foundry to cut down the HAP emissions.
219

- 65 -
5. Conclusion
ESEM and EDS measurements confirmed that AO and sonication treatments greatly separate surface clays from the large particles of silica and coal and reduce the size of the clay agglomerates. The physical characteristics of baseline bituminous coal particles in these baghouse dust suspensions have been characterized so that the relative performance of anthracite-based green sand mixtures can be similarly characterized in the later portions of the study. Experimental results revealed that use lignite as raw material to produce in-situ pyrolyzed carbon by reclaiming the waste heat from foundry is promising. An in-situ pyrolyzed carbon contains surface area as much as 80% of the commercial lignite-base activated carbon can be produced. And it takes much less effort and cost to produce this in-situ activated carbon than the commercial activated carbon. The result of adsorption test indicates the in-situ pyrolyzed carbon is also a good adsorbent for VOCs adsorption. It is found that the hydrocarbon gas yields in the TGA slow pyrolysis are much lower than them in the flash pyrolysis for all the samples tested herein. Also, it is found that the heating rates have a more pronounced effect on the cellulose compared with other carbonaceous additives. Knowledge of this would help the foundry personnel to choose the proper material, and provide guidance for process modifications in the foundry to minimize their HAP emissions. As shown, the cellulose HAP emissions are much lower than them of other carbonaceous additives tested herein. This would offer a great opportunity for the foundry to cut down the HAP emissions.
220

- 66 -
6. Reference
Allen, G. R.; Archibald, J. J.; Keenan, T. Hazardous air pollutants: a challenge to metal casting industry. Am. Foundry Soc. Transactions. 1991, 99, 585-593. American Foundrymen’s Society, Inc., Back to the Basics: A Green Sand Primer, 1994. American Foundrymen’s Society, Inc., Green Sand Additives, 2nd Edition, 2000. American Foundrymen’s Society, Inc., Guide to Sand Additives, 1976.
Andrews, J. ,Neenah Foundry, personal communication, 2004. Bachmann, J.; Baier, D. Some aspects of gas evolution from carbonaceous materials used in foundry molding sands. Am. Foundry Soc. Transactions. 1982, 90, 465-471. Banyasz, J. L.; Li, S.; Lyons-Hart, J.; Shafer, K. H. Gas evolution and the mechanism of cellulose pyrolysis. Fuel 2001, 80, 1757-1763. Berkowitz, N. The chemistry of coal; Elsevier Science Inc.: New York, 1985. Chen, J. H.; Tsai, H. L. An efficient and accurate numerical algorithm for multi-dimensional modeling of casting solidification, Part I: control volume method. Am.
Foundry Soc. Transactions. 1990, 98, 527-537. Cannon, F. S.; Furness, J. C. Jr. and Voigt, R. C. “Economical Use of Advanced Oxidation Systems for Green Sand Emission Reductions,” 12th AFS International Environmental, Health & Safety Conference, Lake Buena Vista, FL, Oct. 9-11, 2000, pp. 317-332. Cartage.org, “The Properties of Coal Macerals,” http://www.cartage.org.lb/en/ themes/Sciences/Earthscience/Geology/Coal/MoreaboutCoal/CoalMacerals/PropertiesofCoal/PropertiesofCoal.htm, viewed 2005; sketch modified from J. Shinn, Fuel, v. 63, 1984, 1190. Dempsey, T. C.; LaFay, V. S.; Neltner, S. L.; Taulbee, D. N. Understanding properties of carbonaceous additives and their potential to emit benzene. Am. Foundry Soc.
Transactions. 1997, 105, 109-117. Fisher, T.; Hajaligol, M.; Waymack, B.; Kellogg, D. Pyrolysis behavior and kinetics of biomass derived materials. J. Anal. Appl. Pyrolysis 2002, 62, 331-349. Fox, J. R.; Adamovits, M.; Henry, C. Strategies for reducing foundry emissions. Am.
Foundry Soc. Transactions. 2002, 110, 1299-1309. Furness, J. Jr., Furness-Newburge, Inc., personal communication, 2004-2005.
221

- 67 -
Fushimi, C.; Araki, K.; Yamaguchi, Y.; Tsutsumi, A. Effect of heating rate on steam gasification of biomass. 2. thermogravimetric-mass spectrometric (TG-MS) analysis of gas evolution. Ind. Eng. Chem. Res. 2003, 42, 3929-3936. Glowacki, C. R. ; Crandell, G. R. ; Cannon, F. S. ; Clobes, J. K. ; Voigt, R. C. ; Furness, J. C. ; McComb, B. A. and Knight, S. M. “Emissions Studies at a Test Foundry using an Advanced Oxidation-Clear Water System,” AFS Trans., v. 2003,111. Goodzwaard, J. E. ; Kurtti, C. M. ; Andrews, J. H. ; Cannon, F. S. ; Voigt, R. C. ; Firebaugh, J. E. ; Furness, J. C. and Sipple, D. L. “Foundry Emissions Effects with an Advanced Oxidation Blackwater System,” AFS Trans., v. 2003,111. Green, R. A.; Olender, A. L. An evaluation and comparison of foundry carbonaceous materials. Am. Foundry Soc. Transactions. 1980, 88, 817-822. Hsiau, S. S.; Chang, W. J. Cooling analysis of castings in green sand molds. Am. Foundry
Soc. Transactions. 1998, 106, 595-600. LaFay, V. S.; Neltner, S. L. The value of seacoal and seacoal supplements in today;s foundry industry. Am. Foundry Soc. Transactions. 1987, 95, 133-138. LaFay, V. S.; Neltner, S. L.; Dempsey, T. C.; Wellbrock, R.; Ashburn, C. Analysis of residual characteristics of carbonaceous additives. Am. Foundry Soc. Transactions. 1998, 106, 301-303. LaFay, V. S.; Neltner, S. L. Green sand without seacoal. Am. Foundry Soc. Transactions. 2004, 112, 671-681. LaFay, V. S.; Neltner, S. L.; Taulbee, D. N.; Wellbrock, R. J. Evaluating emission characteristics of seacoal and seacoal supplements using advanced analytical techniques. Am. Foundry Soc. Transactions. 2000, 108, 713-718. Li, S.; Lyons-Hart, J.; Banyasz, J.; Shafer, K. Real-time evolved gas analysis by FTIR method: an experimental study of cellulose pyrolysis. Fuel 2001, 80, 1809-1817. Mckinley, M. D.; Jefcoat, I. A.; Herz, W. J.; Frederick, C. Air emissions from foundries: a current survey of literature, suppliers and foundrymen. Am. Foundry Soc. Transactions. 1993, 101, 979-990. Naro, R. L. Formation and control of lustrous carbon surface defects in iron and steel castings. Am. Foundry Soc. Transactions. 2002, 110, 815-834. Schifo, J. F.; Radia, J. T.; Crandell, G. R.; Mosher, G. Iron foundry hazardous air pollutants “what we know and what we don’t”. Am. Foundry Soc. Transactions. 2003, 111, 1173-1190.
222

- 68 -
Neill, D.A.; Cannon, F.S.; Voigt, R.C.; Furness, J. and Bigge, R. “Effects of Advanced Oxidants on Green Sand System Performance in a Black Water System,” AFS Trans., v. , 2001,109, 937-955. Shih, T. S.; Hsiua, S. S.; Hong, C. H. Movements of vaporization interface and temperature distributions in green sand molds. Am. Foundry Soc. Transactions. 1996, 104, 481-489. Speight, J. G. The chemistry and technology of coal; Marcel Dekker: New York, 1994. Stanbridge, R. P. The replacement of seacoal in iron fourndry molding sands. Am.
Foundry Soc. Transactions. 1974, 82, 169-180. Technikon Environmental Development Center™. Pre-production air emission test report. Parts 1-3, McClellan, CA, 2000. Thiel, G.; Giese, S. R. Effects of using causticized lignite as a seacoal replacement on mold gas emissions. Am. Foundry Soc. Transactions. 2005, 113, 471-484. Volkmar, A. P.; Galloway III, H. J.; La Forest, L. T. Results of efforts to reduce benzene emissions during four years of production in an iron foundry. Am. Foundry Soc.
Transactions. 2000, 108, 663-666. Wang, C.; Heine, R. W.; Schumacher, J. S.; Green R. A. What’s the story on seacoal replacements in foundry sands? Am. Foundry Soc. Transactions. 1973, 81, 496-502. Wang, Y. J.; Cannon, F. S.; Neill, D.; Crawford, K.; Voigt, R. C.; Furness, J. C.; Glowacki, C. R. Effects of advanced oxidation treatment on green sand properties and emissions. Am. Foundry Soc. Transactions. 2004, 112, 635-648. Wang, Y. J.; Cannon, F. S.; Voigt, R.C.; Komarneni, S.; Furness, J.C. Effects of advanced oxidation on green sand properties via iron casting into green sand molds. Environ. Sci. Technol. 2006, 40, 3095-3101. Zeng, X. C.; Pehlke, R. D. Analysis of heat transfer at metal-sand mold boundaries and computer simulation of solidification of a gray iron casting. Am. Foundry Soc.
Transactions. 1985, 93, 275-282
223
CONSORTIUM FOR PREMIUM CARBON PRODUCTS FROM COAL
Mild Coal Extraction for the Production of Anode Coke
Subcontract No. 2865-UK-DOE-1874
Final Report
1st March 2005 – 30
th September 2006
University of Kentucky
Center for Applied Energy Research
&
Alcoa Inc
October 2006
224

CPCPC 8 Final Report: Alcoa Anode Coke
ii
Disclaimer
This report was prepared as an account of work sponsored by an agency of the United States
Government. Neither the United States Government nor any agency thereof, nor any of their
employees, makes any warranty, express or implied, or assumes any legal liability or
responsibility for the accuracy, completeness, or usefulness of any information, apparatus,
product, or process disclosed, or represents that its use would not infringe privately owned rights.
Reference herein to any specific commercial product, process, or service by trade name,
trademark, manufacturer, or otherwise does not necessarily constitute or imply its endorsement,
recommendation, or favoring by the United States Government or any agency thereof. The views
and opinions of authors expressed herein do not necessarily state or reflect those of the United
States Government or any agency thereof.
225

CPCPC 8 Final Report: Alcoa Anode Coke
iii
Abstract
The quality and availability of petroleum coke used in the manufacture of carbon anodes for
aluminum production is becoming of increasing concern to the industry. Coke quality and yields
have progressively declined as changes in refinery practice and the move towards processing an
increasing proportion of heavier sour crudes have affected coke properties, resulting in an
increase in the metal impurities and sulfur content of the coke. An alternative supply of anode
coke is required to supplement or eventually replace calcined petroleum coke. The significant
domestic reserves of coal could represent a viable carbon resource for anode production,
provided defined coke specifications can be met and at a cost that is economically viable.
The principal objective of this study was to examine the feasibility of producing anode grade
coke by the UKCAER process for the mild solvent extraction of coal. Selected coals were
dissolved in a high boiling solvent, the mineral matter and unreacted products removed by
filtration and the clean coal liquids converted to coke. A range of feedstocks and process
conditions were examined that offered the most likely route to producing the required result. A
simple solvent extraction screening test was established to assess potential candidate materials
and process variables without the need for prolonged and complex routines. The most promising
materials in both performance and economic viability were assessed in more detail by
conducting larger scale extraction tests to yield sufficient material for conversion to coke. The
clean coal solutions were coked in a series of tests to assess the optimum process conditions. The
green cokes were calcined and the product characterized. The composition and structure of the
calcined cokes were compared to typical petroleum coke and assessed for their use in the
fabrication of carbon anodes.
This project was managed by University of Kentucky Center for Applied Energy Research
(UKCAER) as lead contractor. Alcoa Inc provided cash and in-kind support to the project as well
as an industrial perspective to assist UKCAER in the development and evaluation of anode
cokes.
226

CPCPC 8 Final Report: Alcoa Anode Coke
iv
Table of Contents
Abstract ............................................................................................................................................................................ iii
List of Tables and Figures................................................................................................................................................ v
Summary ........................................................................................................................................................................... 1
Introduction....................................................................................................................................................................... 3
Experimental ..................................................................................................................................................................... 5
Results and Discussion................................................................................................................................................... 10
(i) Micro-Reactor Tests..................................................................................................10
(ii) 2l Reactor Tests.........................................................................................................15
(iii) Coking Tests. .........................................................................................................18
(iv) Material Balance .......................................................................................................29
Conclusions..................................................................................................................................................................... 29
References....................................................................................................................................................................... 31
227

CPCPC 8 Final Report: Alcoa Anode Coke
v
List of Tables and Figures
Table 1 Generic Coke Specifications for Anode Production
Table 2 Coal Analysis
Table 3 Solvent Analysis
Table 4 Extraction of WKy#9 Coal with Anthracene Oil
Table 5 Effect of Selecting Coal Size Fractions on Ash Content
Table 6 Extraction of WKy#6 Coal with Anthracene Oil
Table 7 Extraction of WKy#6 Coal with Decant Oil
Table 8 Extraction of WKy#6 Coal with the Lighter Petroleum Fractions
Table 9 Solvent Extraction of WKy#6 & WKy#9 Coal in 2l Reactor
Table 10 Analysis of Gas Evolved from Digestion of WKy#9 in AOil (SE3)
Table 11 Pitch & Coke Data
Table 12 Analysis of Calcined Cokes Derived from the Solvent Extraction of Coal
Table 13 Analysis of Pitch Derived from the Solvent Extraction of Coal
Table 14 Predicted Analysis of Calcined Cokes Derived from Analysis of Pitch
Table 15 Coking Tests with WKy#6 / Decant Oil Coal Solution from SE5
Table 16 Analysis of Calcined Cokes from SE5 Coal Solution (WKy#6 / Decant Oil)
Figure 1 The Production of Pitch by the Solvent Extraction of Coal - Schematic
Figure 2 The Production of Coke by the Solvent Extraction of Coal - Schematic
Figure 3 Micro-reactor used to Assess Coal Extraction Parameters
Figure 4 Laboratory Coking Reactor
Figure 5 Extraction of WKy#6 Coal with Anthracene Oil
Figure 6 Extraction of WKy#6 Coal with Decant Oil
Figure 7 Anthracene Oil derived Coal Extract Coke - Small Mozaic Anisotropy
Figure 8 Anthracene Oil derived Coal Extract Coke - Infrequent Larger Anisotropic
Domains
Figure 9 FCC Calcined Coke from Laboratory & Delayed Coker
Figure 10 CCK23 Calcined Coke (WKy#6/Decant Oil)
Figure 11 CCK24 Calcined Coke (WKy#6/Decant Oil)
Figure 12 CCK26 Calcined Coke (WKy#6/Decant Oil)
Figure 13 Large Anisotropic Domains of CCK26 Calcined Coke (WKy#6/Decant Oil)
Figure 14 Conceptual Plant Material Balance
228
CPCPC 8 Final Report: Alcoa Anode Coke
1
Summary
A simple micro-reactor test offering fast response time was established and validated and was
used to screen potential solvents and coal feedstocks for the production of anode grade coke via
the solvent extraction of coal. The test was used to monitor the extraction of a reference coal,
WKy#9 using anthracene oil as the solvent. Good agreement was obtained between these tests
and previous work under similar conditions using a 2liter reactor and associated filter. Low value
petroleum derived refinery products from a fluidized catalytic cracker unit were characterized
and assessed as potential solvents in the process. A coal sample from Western Kentucky,
KWy#6, selected by Alcoa as a candidate likely to be suitable for the process was crushed to the
required size specification and used in these tests alongside the reference coal.
A series of screening tests were completed to assess the reactivity of WKy#6 coal by solvent
extraction in anthracene oil. This coal was then used as a standard to investigate the performance
of the alternative petroleum derived process solvents and a replacement bulk supply of
anthracene oil. The Alcoa coal, WKy#6 proved to be very reactive irrespective of which sample
of anthracene oil was used to extract it, with very high coal conversions. Relatively high coal
conversions were also obtained when the anthracene oil was substituted by a petroleum derived
Decant Oil as solvent. However, in this case the conversions were obtained without encountering
the filtration problems that occur with anthracene oil extracts at low reaction temperatures. This
feature of Decant Oil extracts would allow far more flexibility in process control. A second
Decant Oil obtained from a different source showed the same effect, but at a significantly higher
level of coal conversion, similar to the value achieved with anthracene oil. Filtration was feasible
under all conditions tested for digests prepared using both Decant Oils, a significant and very
favorable result. Similar results were obtained with the heavy coker gas oil, while much lower
conversions were obtained with the vacuum gas oil with significantly higher gas yields. Overall,
these results signify that a general trend toward heavier solvents being preferred for the process.
A series of four autoclave tests were completed to assess the solvent extraction of Western
Kentucky #9 coal in anthracene oil and to prepare a large batch of coal solution from the primary
coal Western Kentucky #6 and Decant Oil ‘B’ to conduct the coking experiments. The first test
was conducted to commission the digestion and filtration equipment that had been extensively
refurbished. The extraction conditions used were selected on a false premise and proved to be too
mild to produce a digest that could be filtered. Increasing the reactor temperature produced a
digest which was filtered without problem. The two following replicate tests at the higher
temperature were conducted to find suitable process conditions and to determine the sensitivity
of the test. Very reproducible results were obtained with high filtration rates. Filtration of the
coal digest prepared from the primary coal WKy#6 and Decant Oil was fast, while the
conversion to liquid products was again high, although slightly lower than achieved in the
micro-reactor tests. Coal conversions in the three tests using WKy#9 and Anthracene Oil were
typical of bituminous coals using a non-hydrogen donor solvent, with good agreement between
the different methods used in the determinations. Mass balance closures were high for both
digestion and filtration.
Coal solutions produced during the execution of a parallel study were converted into coke as a
preliminary exercise to assess the likelihood of being able to produce anode grade coke by the
solvent extraction of coal. The solutions derived from the extraction of three US coals in
229
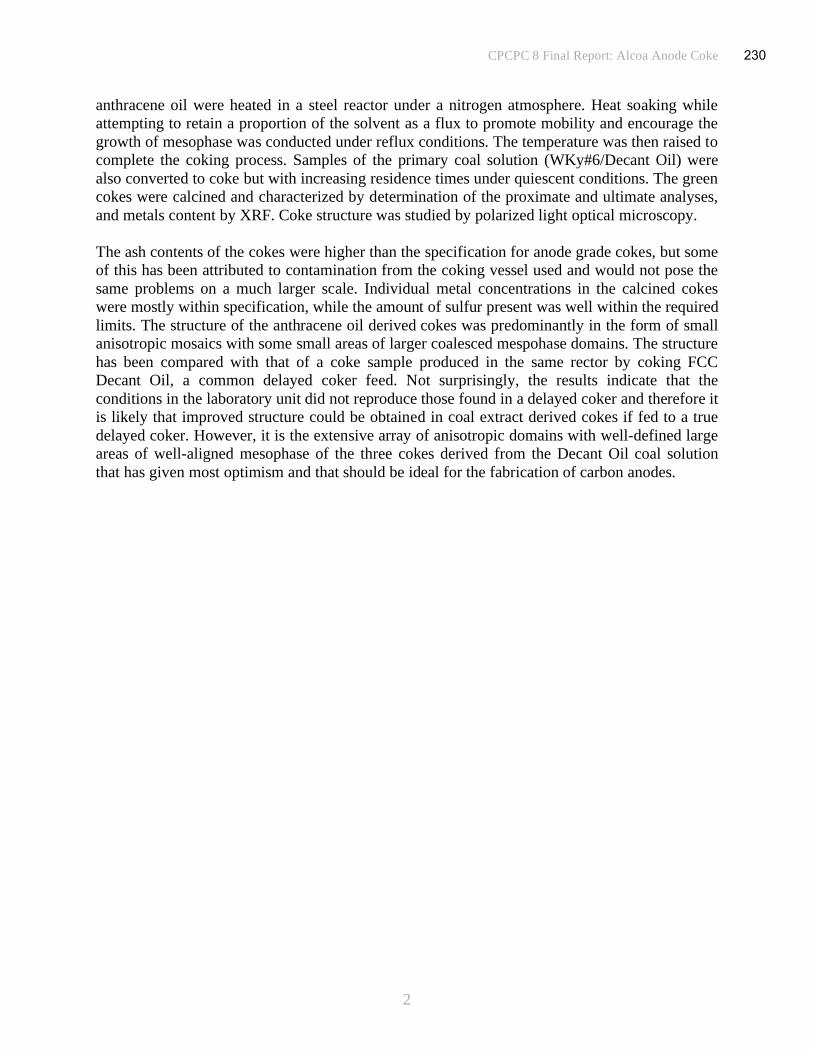
CPCPC 8 Final Report: Alcoa Anode Coke
2
anthracene oil were heated in a steel reactor under a nitrogen atmosphere. Heat soaking while
attempting to retain a proportion of the solvent as a flux to promote mobility and encourage the
growth of mesophase was conducted under reflux conditions. The temperature was then raised to
complete the coking process. Samples of the primary coal solution (WKy#6/Decant Oil) were
also converted to coke but with increasing residence times under quiescent conditions. The green
cokes were calcined and characterized by determination of the proximate and ultimate analyses,
and metals content by XRF. Coke structure was studied by polarized light optical microscopy.
The ash contents of the cokes were higher than the specification for anode grade cokes, but some
of this has been attributed to contamination from the coking vessel used and would not pose the
same problems on a much larger scale. Individual metal concentrations in the calcined cokes
were mostly within specification, while the amount of sulfur present was well within the required
limits. The structure of the anthracene oil derived cokes was predominantly in the form of small
anisotropic mosaics with some small areas of larger coalesced mespohase domains. The structure
has been compared with that of a coke sample produced in the same rector by coking FCC
Decant Oil, a common delayed coker feed. Not surprisingly, the results indicate that the
conditions in the laboratory unit did not reproduce those found in a delayed coker and therefore it
is likely that improved structure could be obtained in coal extract derived cokes if fed to a true
delayed coker. However, it is the extensive array of anisotropic domains with well-defined large
areas of well-aligned mesophase of the three cokes derived from the Decant Oil coal solution
that has given most optimism and that should be ideal for the fabrication of carbon anodes.
230

CPCPC 8 Final Report: Alcoa Anode Coke
3
Introduction
The carbon anodes used in the production of aluminum have traditionally been manufactured
from calcined petroleum coke. The electrodes are made by extruding a blend of the coke with a
small proportion of coal tar pitch as binder. The crude anodes are carbonized, and where
necessary further impregnated with more pitch and again carbonized to produce the dense anodes
needed to meet the required performance standards. Binder and impregnation pitches with high
carbon yields are needed in order to maximize anode density. Consumption rates of the anodes in
the molten fluoride salt electrolysis cell are high, approaching 0.5t of carbon for each tonne of
aluminum produced. Hence, large quantities of coke are required for carbon anode manufacture
to satisfy the demands of the indigenous aluminum industry in the USA, amounting to
~1.6m tonnes/annum of calcined petroleum coke.
Petroleum coke is a by-product from the oil refining process. Modern refinery practice,
controlled by the economics of the petroleum market, is aimed at maximizing the yield of lighter
high value products. Hence, emphasis is placed on the conversion of the heavy liquids from the
distillation columns such as middle distillate, gas oil and residuum to higher value products by
one of several cracking processes; fluid catalytic cracking (FCC), hydrocracking or thermal
cracking (coking). The heaviest material (bottoms) is fed to a delayed coker where thermal
cracking of the large molecular species occurs to yield high value lighter products. Consequent
polymerization of the residuum results in the formation of coke as a by-product. This ‘green
coke’ is mechanically removed from the coking drum and then calcined by heating to ~1300°C
to remove volatiles and produce a material suitable for anode production. Impurities in the crude
oil become concentrated in the coke and can have undesirable effects on aluminum production.
Metal impurities such as vanadium and nickel catalyze carbon oxidation reactions and hence lead
to higher carbon consumption in the electrolysis cell. Other impurities collect in the refined
aluminum and can lower its value. Impurity levels in petroleum cokes have been progressively
increasing in recent years as the refineries have been obliged to accept a higher proportion of
heavy sour crudes. This trend and changes in refinery practice have resulted in an increase in the
sulfur content of the petroleum coke. An alternative supply of anode coke is required to
supplement or eventually replace calcined petroleum coke supplies, provided defined
specifications can be met and at a cost that is economically sustainable. The significant domestic
reserves of coal could represent a viable carbon source for anode production.
The principal objective of this project was to demonstrate that indigenous coal resources could
be converted into coke suitable for anode fabrication by a mild solvent extraction process. At the
inception of the program it was also intended to determine whether the properties and
composition of the parent coal could be used to control the properties of the resulting coke. Coals
with compositions, particularly metals content that correspond to the properties required in the
resulting coke, were selected for testing. The clean coal solutions derived by this process were
either vacuum distilled to generate a pitch in which it was intended to induce the development of
anisotropic mesophase domains by a controlled thermal process or alternatively were converted
directly to coke. Green cokes so produced were further heated to produce calcined cokes.
UKCAER has developed a bench scale mild solvent extraction process for converting
bituminous and sub-bituminous coals to pitch. A simplified schematic of the process is shown in
Figure 1. Previous studies have demonstrated that the conversion of coal to pitch can be achieved
231

CPCPC 8 Final Report: Alcoa Anode Coke
4
at high efficiency using anthracene oil (a coal tar distillate) as the solvent at mild extraction
conditions and without recourse to the introduction of a hydrogen atmosphere at high pressure,
expensive catalysts or the use of exotic solvents that make alternative processes economically
unattractive. Samples of pitch derived by this process have low mineral matter content and are
inherently isotropic. It is important to demonstrate that this process can be used to produce cokes
that exhibit the properties and structure required for fabrication of carbon anodes.
Coal
Solvent
Residue
Recycle Solvent
Gas & Light
Distillate
Coal
Digest
Coal
Solution
Coal Feed
from Mill
Make -up
Solvent
Coal
Hopper
Solvent
Tank
ReactorSolids
Separation
Low softening pitch
(Anode binder )
High softening pitch
(Carbon Fibers )
Vacuum
Column
Figure 1 The Production of Pitch by the Solvent Extraction of Coal - Schematic
Dissolution of the coal in the digestion reactor allows the mineral matter and undissolved coal
fraction to be removed from the coal solution by a solids separation step. Filtration is generally
used for this purpose as the ill-defined separation between the dissolved coal and the boiling
point distribution of the heavy process solvent make the use of alternative anti-solvent de-ashing
techniques impractical. Virtually all of the mineral matter present in the coal is removed during
the filtration stage and hence it may be possible to achieve the required ash content specification
for the coke, Table 1.
Property Value Method
Real density 2.05 – 2.09 g/ml ASTM D2638-97
Vibrated bulk density* 0.80 – 0.88 g/ml ASTM D4292
Particle size +4.75mm 30 % ASTM D5709-00
Ash 0.1 % ASTM D2415
S 1.0 % Leco or XRF
Na 100 ppm ICP, AA or XRF
Fe 300 ppm ICP, AA or XRF
Si 200 ppm ICP, AA or XRF
V 200 ppm ICP, AA or XRF
Ni 200 ppm ICP, AA or XRF
Ca 50 ppm ICP, AA or XRF
P 5 ppm ICP, AA or XRF
Pb, Be, As, Cd, Cr or Hg 1 ppm ICP, AA or XRF
* (particle size range: 1.18 – 2.36mm)
Table 1 Generic Coke Specification for Anode Production
232
CPCPC 8 Final Report: Alcoa Anode Coke
5
However, in the early stages of filtration some very fine mineral particles may pass through the
filter membrane, (1μm retention) before cake filtration has been established. At plant scale,
where a robust metal or ceramic screen is used, the initial contaminated filtrate produced before
bridging of the openings occurs, would be returned to the filter inlet. In addition, some of the
mineral matter in the coal, measured as ash, is organically bound and cannot be removed by
filtration. In practice these may only make a very small contribution to the ash content of the
derived coke. The metals content of the coal extract pitches and cokes should follow the same
downward trend as the ash content. It should be possible to meet the required specifications,
Table 1 through a process of coal selection and screening to minimize the presence of sulfur and
other problem metals such as nickel, vanadium and iron.
As a proof of concept study this project was initiated in order to examine the feasibility of
producing anode grade coke by the solvent extraction of coal. It was intended to demonstrate that
the UKCAER mild solvent extraction of coal process is a viable alternative for producing anode
grade coke. The procedure developed for producing pitch would be adapted by simply feeding
the clean coal solution directly to a coking drum, from which the solvent can largely be
recovered and recycled, Figure 2. Green coke would be discharged from the coker and calcined
by heating to ~1300oC.
Coal
Solvent
Residue
Recycle Solvent
Green Coke
Gas & Light
Distillate
Coal Feed
from Mill
Make -up
Solvent
Coking
Drum
Coal
Hopper
Solvent
Tank
ReactorCoal
Digest
Coal
Solution
Solids
Separation
Figure 2 The Production of Coke by the Solvent Extraction of Coal - Schematic
Experimental
A simple test has been established that can be used to screen coals and solvents as feedstocks for
conversion to anode grade coke. The test can be completed in a short period of time and does not
require investment in significant resources or infrastructure. It has been used to determine the
optimum process conditions for the coal dissolution phase of the process. A set of micro-reactors
were constructed consisting of 200mm lengths of 12.7mm diameter stainless steel tubing
(1.25mm wall) closed at one end with a cap and at the other with a valve via a reducing union,
Figure 3.
233
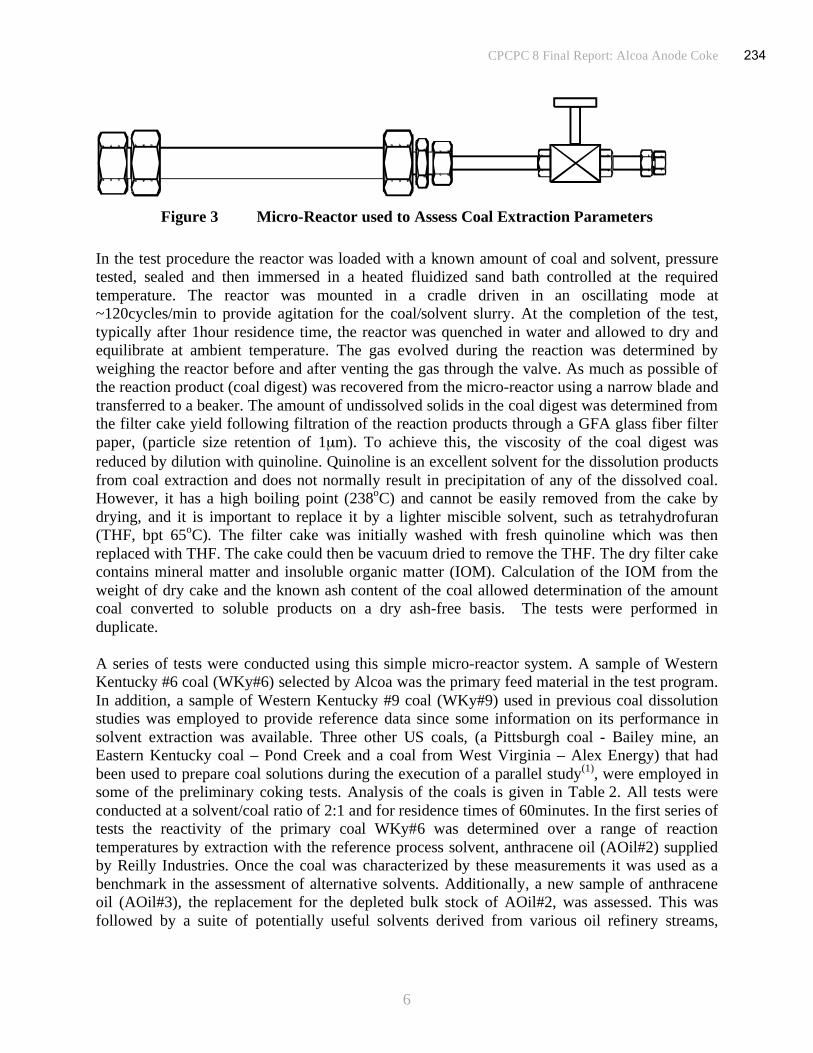
CPCPC 8 Final Report: Alcoa Anode Coke
6
Figure 3 Micro-Reactor used to Assess Coal Extraction Parameters
In the test procedure the reactor was loaded with a known amount of coal and solvent, pressure
tested, sealed and then immersed in a heated fluidized sand bath controlled at the required
temperature. The reactor was mounted in a cradle driven in an oscillating mode at
~120cycles/min to provide agitation for the coal/solvent slurry. At the completion of the test,
typically after 1hour residence time, the reactor was quenched in water and allowed to dry and
equilibrate at ambient temperature. The gas evolved during the reaction was determined by
weighing the reactor before and after venting the gas through the valve. As much as possible of
the reaction product (coal digest) was recovered from the micro-reactor using a narrow blade and
transferred to a beaker. The amount of undissolved solids in the coal digest was determined from
the filter cake yield following filtration of the reaction products through a GFA glass fiber filter
paper, (particle size retention of 1μm). To achieve this, the viscosity of the coal digest was
reduced by dilution with quinoline. Quinoline is an excellent solvent for the dissolution products
from coal extraction and does not normally result in precipitation of any of the dissolved coal.
However, it has a high boiling point (238oC) and cannot be easily removed from the cake by
drying, and it is important to replace it by a lighter miscible solvent, such as tetrahydrofuran
(THF, bpt 65oC). The filter cake was initially washed with fresh quinoline which was then
replaced with THF. The cake could then be vacuum dried to remove the THF. The dry filter cake
contains mineral matter and insoluble organic matter (IOM). Calculation of the IOM from the
weight of dry cake and the known ash content of the coal allowed determination of the amount
coal converted to soluble products on a dry ash-free basis. The tests were performed in
duplicate.
A series of tests were conducted using this simple micro-reactor system. A sample of Western
Kentucky #6 coal (WKy#6) selected by Alcoa was the primary feed material in the test program.
In addition, a sample of Western Kentucky #9 coal (WKy#9) used in previous coal dissolution
studies was employed to provide reference data since some information on its performance in
solvent extraction was available. Three other US coals, (a Pittsburgh coal - Bailey mine, an
Eastern Kentucky coal – Pond Creek and a coal from West Virginia – Alex Energy) that had
been used to prepare coal solutions during the execution of a parallel study(1)
, were employed in
some of the preliminary coking tests. Analysis of the coals is given in Table 2. All tests were
conducted at a solvent/coal ratio of 2:1 and for residence times of 60minutes. In the first series of
tests the reactivity of the primary coal WKy#6 was determined over a range of reaction
temperatures by extraction with the reference process solvent, anthracene oil (AOil#2) supplied
by Reilly Industries. Once the coal was characterized by these measurements it was used as a
benchmark in the assessment of alternative solvents. Additionally, a new sample of anthracene
oil (AOil#3), the replacement for the depleted bulk stock of AOil#2, was assessed. This was
followed by a suite of potentially useful solvents derived from various oil refinery streams,
234
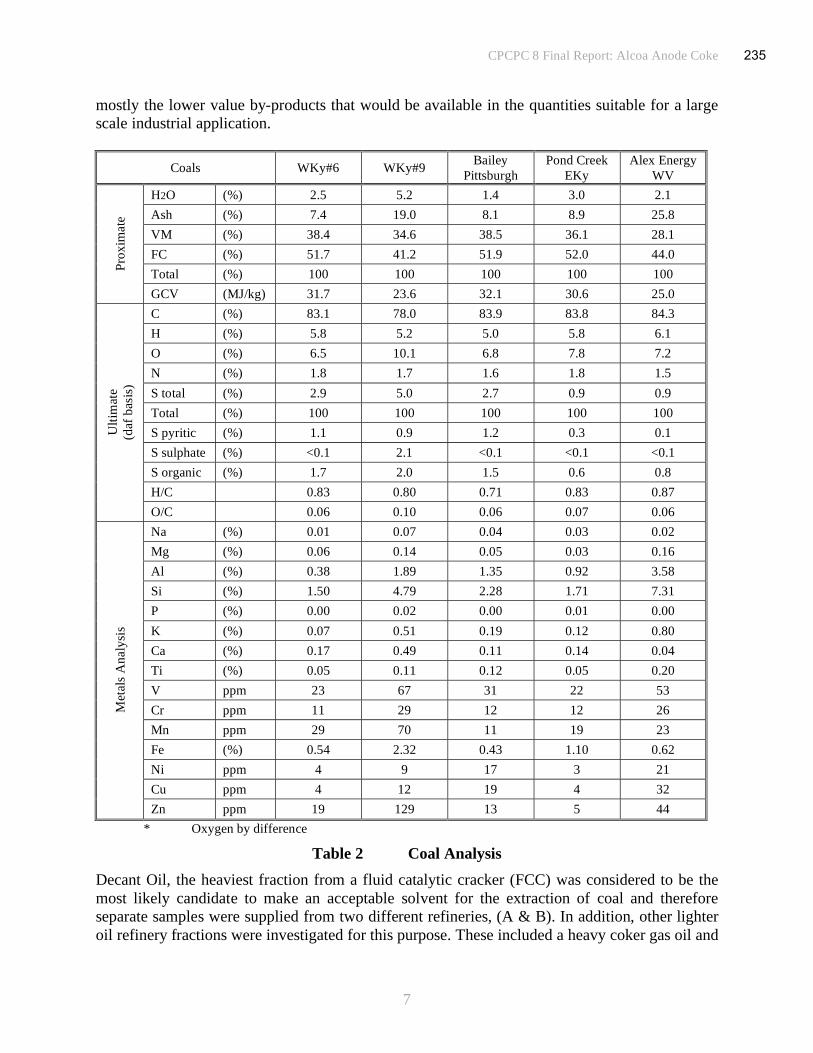
CPCPC 8 Final Report: Alcoa Anode Coke
7
mostly the lower value by-products that would be available in the quantities suitable for a large
scale industrial application.
Coals WKy#6 WKy#9 Bailey
Pittsburgh
Pond Creek
EKy
Alex Energy
WV
H2O (%) 2.5 5.2 1.4 3.0 2.1
Ash (%) 7.4 19.0 8.1 8.9 25.8
VM (%) 38.4 34.6 38.5 36.1 28.1
FC (%) 51.7 41.2 51.9 52.0 44.0
Total (%) 100 100 100 100 100
Pro
xim
ate
GCV (MJ/kg) 31.7 23.6 32.1 30.6 25.0
C (%) 83.1 78.0 83.9 83.8 84.3
H (%) 5.8 5.2 5.0 5.8 6.1
O (%) 6.5 10.1 6.8 7.8 7.2
N (%) 1.8 1.7 1.6 1.8 1.5
S total (%) 2.9 5.0 2.7 0.9 0.9
Total (%) 100 100 100 100 100
S pyritic (%) 1.1 0.9 1.2 0.3 0.1
S sulphate (%) <0.1 2.1 <0.1 <0.1 <0.1
S organic (%) 1.7 2.0 1.5 0.6 0.8
H/C 0.83 0.80 0.71 0.83 0.87
Ult
imat
e
(daf
bas
is)
O/C 0.06 0.10 0.06 0.07 0.06
Na (%) 0.01 0.07 0.04 0.03 0.02
Mg (%) 0.06 0.14 0.05 0.03 0.16
Al (%) 0.38 1.89 1.35 0.92 3.58
Si (%) 1.50 4.79 2.28 1.71 7.31
P (%) 0.00 0.02 0.00 0.01 0.00
K (%) 0.07 0.51 0.19 0.12 0.80
Ca (%) 0.17 0.49 0.11 0.14 0.04
Ti (%) 0.05 0.11 0.12 0.05 0.20
V ppm 23 67 31 22 53
Cr ppm 11 29 12 12 26
Mn ppm 29 70 11 19 23
Fe (%) 0.54 2.32 0.43 1.10 0.62
Ni ppm 4 9 17 3 21
Cu ppm 4 12 19 4 32
Met
als
An
aly
sis
Zn ppm 19 129 13 5 44
* Oxygen by difference
Table 2 Coal Analysis
Decant Oil, the heaviest fraction from a fluid catalytic cracker (FCC) was considered to be the
most likely candidate to make an acceptable solvent for the extraction of coal and therefore
separate samples were supplied from two different refineries, (A & B). In addition, other lighter
oil refinery fractions were investigated for this purpose. These included a heavy coker gas oil and
235
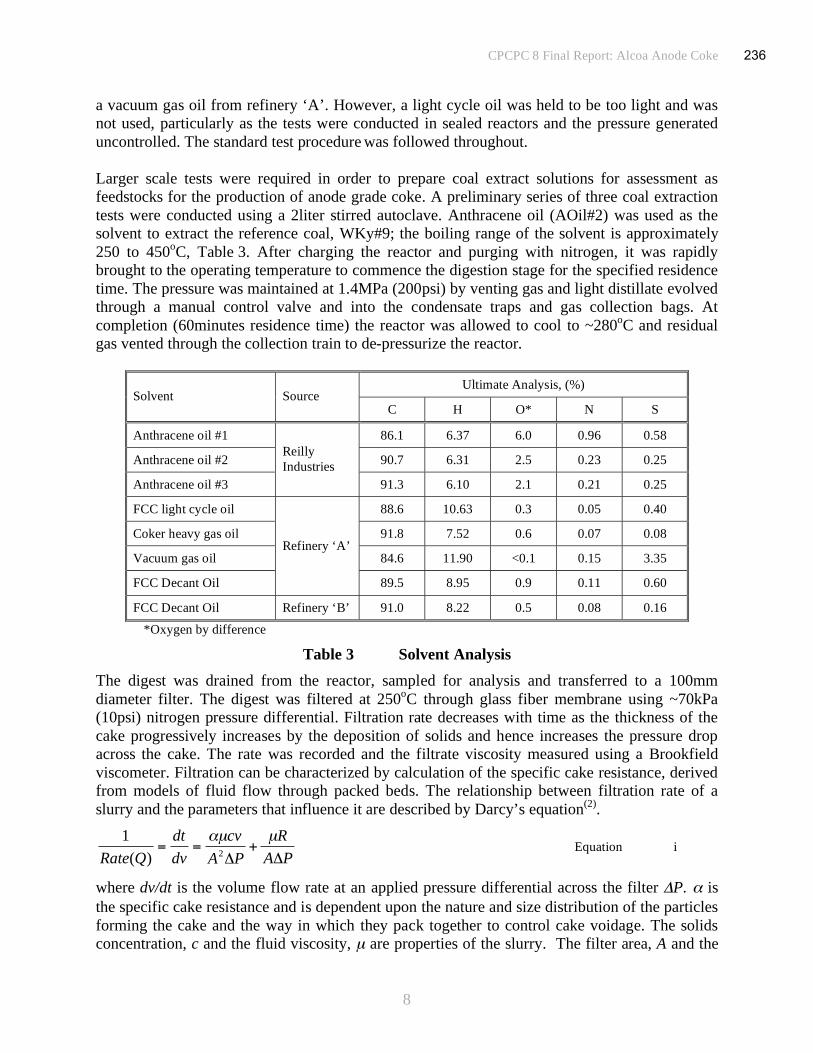
CPCPC 8 Final Report: Alcoa Anode Coke
8
a vacuum gas oil from refinery ‘A’. However, a light cycle oil was held to be too light and was
not used, particularly as the tests were conducted in sealed reactors and the pressure generated
uncontrolled. The standard test procedure was followed throughout.
Larger scale tests were required in order to prepare coal extract solutions for assessment as
feedstocks for the production of anode grade coke. A preliminary series of three coal extraction
tests were conducted using a 2liter stirred autoclave. Anthracene oil (AOil#2) was used as the
solvent to extract the reference coal, WKy#9; the boiling range of the solvent is approximately
250 to 450oC, Table 3. After charging the reactor and purging with nitrogen, it was rapidly
brought to the operating temperature to commence the digestion stage for the specified residence
time. The pressure was maintained at 1.4MPa (200psi) by venting gas and light distillate evolved
through a manual control valve and into the condensate traps and gas collection bags. At
completion (60minutes residence time) the reactor was allowed to cool to ~280oC and residual
gas vented through the collection train to de-pressurize the reactor.
Ultimate Analysis, (%) Solvent Source
C H O* N S
Anthracene oil #1 86.1 6.37 6.0 0.96 0.58
Anthracene oil #2 90.7 6.31 2.5 0.23 0.25
Anthracene oil #3
Reilly
Industries
91.3 6.10 2.1 0.21 0.25
FCC light cycle oil 88.6 10.63 0.3 0.05 0.40
Coker heavy gas oil 91.8 7.52 0.6 0.07 0.08
Vacuum gas oil 84.6 11.90 <0.1 0.15 3.35
FCC Decant Oil
Refinery ‘A’
89.5 8.95 0.9 0.11 0.60
FCC Decant Oil Refinery ‘B’ 91.0 8.22 0.5 0.08 0.16
*Oxygen by difference
Table 3 Solvent Analysis
The digest was drained from the reactor, sampled for analysis and transferred to a 100mm
diameter filter. The digest was filtered at 250oC through glass fiber membrane using ~70kPa
(10psi) nitrogen pressure differential. Filtration rate decreases with time as the thickness of the
cake progressively increases by the deposition of solids and hence increases the pressure drop
across the cake. The rate was recorded and the filtrate viscosity measured using a Brookfield
viscometer. Filtration can be characterized by calculation of the specific cake resistance, derived
from models of fluid flow through packed beds. The relationship between filtration rate of a
slurry and the parameters that influence it are described by Darcy’s equation(2)
.
PA
R
PA
cv
dv
dt
QRate+==
μμ2)(
1 Equation i
where dv/dt is the volume flow rate at an applied pressure differential across the filter P. is
the specific cake resistance and is dependent upon the nature and size distribution of the particles
forming the cake and the way in which they pack together to control cake voidage. The solids
concentration, c and the fluid viscosity, μ are properties of the slurry. The filter area, A and the
236
CPCPC 8 Final Report: Alcoa Anode Coke
9
resistance of the filter membrane, R are properties of the filter assembly. Following integration
and insertion of boundary conditions
( )PA
R
PA
vvc
vv
tt o
o
o ++
=μμ
22 Equation ii
plotting (t-to)/(v-vo) against (v+vo) gives a straight line with a slope, m and intercept, b. Thus,
c
PmA
μ=
22 Equation iii
μ
PbAR = Equation iv
Determination of the specific cake resistance, and the fluid viscosity, μ effectively define
filtration characteristics of the slurry.
An initial test, SE1 was used to commission the apparatus following extensive modifications to
the reactor and ancillary equipment. These included the replacement of the condensate collection
and gas sampling train, replacing seals and heater elements in the reactor and refurbishing the
drain valve. The filter assembly was similarly improved. Two further tests were conducted using
the same coal and solvent to provide reference data and determine the repeatability of the
method. These were followed by a definitive test (SE5) using the targeted feedstocks to provide a
material for the subsequent coking tests. Samples of these coal solutions and the coal solutions
previously prepared from the other US coals were converted into high softening point pitches by
vacuum distillation. These pitches were analyzed and were available for conversion to coke if
this route was considered to be a more viable method.
In order to establish the probable range of coking conditions that would yield a coke of the
required properties but without the need to produce large quantities of the targeted feedstock, a
preliminary series of tests were conducted using pre-existing coal solutions. These were used to
assess the viability of generating suitable coke structure by the bench-scale coking of samples of
coal solution. Coal extracts produced by the solvent extraction of three US coals as part of a
parallel study(1)
, were heated to a temperature ~550oC to generate coke. Reproducing the
conditions found in a working delayed coker on a small scale is not easy without a significant
investment in hardware. In reality the feed material is commonly pumped through a pre-heater
coil raising the temperature to above 400oC and injected at pressure obliquely into the heated
coking vessel held at a temperature of around 550oC and nominally at atmospheric pressure.
While most of the low boiling fraction / solvent flashes off from the feed and thermal cracking
yields more light material, growth and coalescence of mesophase proceeds by polymerization
reactions in the viscous turbulent melt.
In the laboratory, the tests were conducted by heating samples of coal solution batch-wise in a
steel reactor, Figure 4. The samples were heated to ~450oC and held at this temperature to allow
growth of mesophase while retaining some solvent to enhance mobility. Turbulence and shear
were established by sparging with nitrogen to induce coalescence of the mesophase. To prevent
premature loss of solvent and hence give time for growth of the mesophase domains, a reflux
237

CPCPC 8 Final Report: Alcoa Anode Coke
10
column was fitted to the reactor. The reactor was controlled under these conditions for ~3hours
in the initial tests and for longer periods in the later tests, before the temperature was raised to
~550oC to complete the coking process. Although far removed from the conditions found in an
authentic delayed coker it was considered that the coke produced by this route could be
characterized and its structure compared to a typical coker feed treated in the same way. An
additional test was conducted under the same conditions but using Decant Oil as the feedstock in
order to make this comparison. Low boiling material generated by the thermal cracking of the
feed was carried from the reactor to collection traps downstream. This material proved difficult
to capture as it sublimed without passing through the liquid phase and a proportion was lost
through the vent. To improve the mass balance closure a liquid impinger or scrubber containing a
sample of the vacuum gas oil was installed for the later tests. Samples of coke recovered from
the reactor were calcined to remove residual volatile material by heating to 1350oC in nitrogen in
a high temperature tube furnace. There was no provision to collect volatiles during calcining.
Figure 4 Laboratory Coking Reactor
Three coking tests CK23, 24 & 26 were conducted using sub-samples of the SE5 coal solution
prepared from WKy#6 coal and Decant Oil. The first test followed the procedure established
above while in the second two tests promotion of polymerization reactions to encourage
mesophase formation was engendered by a slow heating regime, whereby the coal solution was
held under quiescent conditions at 450oC for an extended period of 7h in CK24 and for 20h in
CK26. The temperature was then increased to 550oC to produce a green coke. Samples were
calcined at 1350oC and subjected to a range of analytical tests for characterization.
Results and Discussion
(i) Micro-Reactor Tests. The coal extraction process developed at CAER has
invariably used anthracene oil as the process solvent. The solvent is a high boiling (250 to
450oC) coal tar distillate, a coke oven by-product from the production of metallurgical coke.
However, if the process were to be adopted as a viable means of producing even a small
238
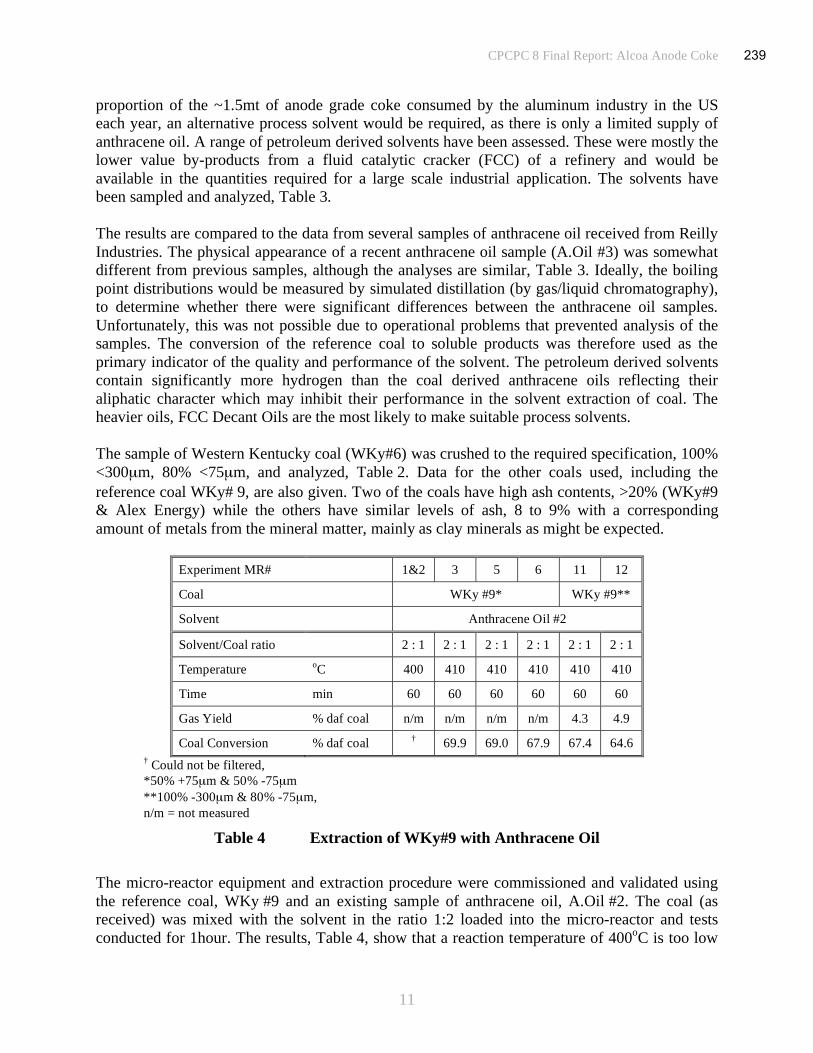
CPCPC 8 Final Report: Alcoa Anode Coke
11
proportion of the ~1.5mt of anode grade coke consumed by the aluminum industry in the US
each year, an alternative process solvent would be required, as there is only a limited supply of
anthracene oil. A range of petroleum derived solvents have been assessed. These were mostly the
lower value by-products from a fluid catalytic cracker (FCC) of a refinery and would be
available in the quantities required for a large scale industrial application. The solvents have
been sampled and analyzed, Table 3.
The results are compared to the data from several samples of anthracene oil received from Reilly
Industries. The physical appearance of a recent anthracene oil sample (A.Oil #3) was somewhat
different from previous samples, although the analyses are similar, Table 3. Ideally, the boiling
point distributions would be measured by simulated distillation (by gas/liquid chromatography),
to determine whether there were significant differences between the anthracene oil samples.
Unfortunately, this was not possible due to operational problems that prevented analysis of the
samples. The conversion of the reference coal to soluble products was therefore used as the
primary indicator of the quality and performance of the solvent. The petroleum derived solvents
contain significantly more hydrogen than the coal derived anthracene oils reflecting their
aliphatic character which may inhibit their performance in the solvent extraction of coal. The
heavier oils, FCC Decant Oils are the most likely to make suitable process solvents.
The sample of Western Kentucky coal (WKy#6) was crushed to the required specification, 100%
<300μm, 80% <75μm, and analyzed, Table 2. Data for the other coals used, including the
reference coal WKy# 9, are also given. Two of the coals have high ash contents, >20% (WKy#9
& Alex Energy) while the others have similar levels of ash, 8 to 9% with a corresponding
amount of metals from the mineral matter, mainly as clay minerals as might be expected.
Experiment MR# 1&2 3 5 6 11 12
Coal WKy #9* WKy #9**
Solvent Anthracene Oil #2
Solvent/Coal ratio 2 : 1 2 : 1 2 : 1 2 : 1 2 : 1 2 : 1
Temperature oC 400 410 410 410 410 410
Time min 60 60 60 60 60 60
Gas Yield % daf coal n/m n/m n/m n/m 4.3 4.9
Coal Conversion % daf coal †
69.9 69.0 67.9 67.4 64.6
† Could not be filtered,
*50% +75μm & 50% -75μm
**100% -300μm & 80% -75μm,
n/m = not measured
Table 4 Extraction of WKy#9 with Anthracene Oil
The micro-reactor equipment and extraction procedure were commissioned and validated using
the reference coal, WKy #9 and an existing sample of anthracene oil, A.Oil #2. The coal (as
received) was mixed with the solvent in the ratio 1:2 loaded into the micro-reactor and tests
conducted for 1hour. The results, Table 4, show that a reaction temperature of 400oC is too low
239
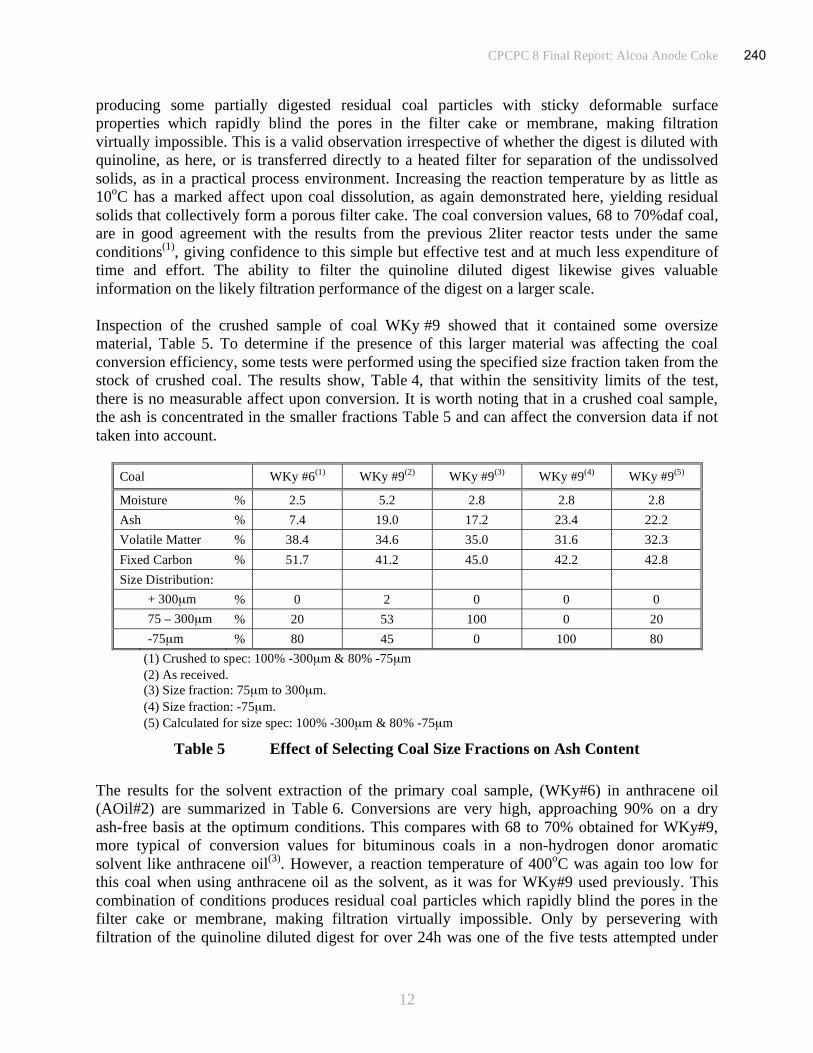
CPCPC 8 Final Report: Alcoa Anode Coke
12
producing some partially digested residual coal particles with sticky deformable surface
properties which rapidly blind the pores in the filter cake or membrane, making filtration
virtually impossible. This is a valid observation irrespective of whether the digest is diluted with
quinoline, as here, or is transferred directly to a heated filter for separation of the undissolved
solids, as in a practical process environment. Increasing the reaction temperature by as little as
10oC has a marked affect upon coal dissolution, as again demonstrated here, yielding residual
solids that collectively form a porous filter cake. The coal conversion values, 68 to 70%daf coal,
are in good agreement with the results from the previous 2liter reactor tests under the same
conditions(1)
, giving confidence to this simple but effective test and at much less expenditure of
time and effort. The ability to filter the quinoline diluted digest likewise gives valuable
information on the likely filtration performance of the digest on a larger scale.
Inspection of the crushed sample of coal WKy #9 showed that it contained some oversize
material, Table 5. To determine if the presence of this larger material was affecting the coal
conversion efficiency, some tests were performed using the specified size fraction taken from the
stock of crushed coal. The results show, Table 4, that within the sensitivity limits of the test,
there is no measurable affect upon conversion. It is worth noting that in a crushed coal sample,
the ash is concentrated in the smaller fractions Table 5 and can affect the conversion data if not
taken into account.
Coal WKy #6(1)
WKy #9(2)
WKy #9(3)
WKy #9(4)
WKy #9(5)
Moisture % 2.5 5.2 2.8 2.8 2.8
Ash % 7.4 19.0 17.2 23.4 22.2
Volatile Matter % 38.4 34.6 35.0 31.6 32.3
Fixed Carbon % 51.7 41.2 45.0 42.2 42.8
Size Distribution:
+ 300μm % 0 2 0 0 0
75 – 300μm % 20 53 100 0 20
-75μm % 80 45 0 100 80
(1) Crushed to spec: 100% -300μm & 80% -75μm
(2) As received.
(3) Size fraction: 75μm to 300μm.
(4) Size fraction: -75μm.
(5) Calculated for size spec: 100% -300μm & 80% -75μm
Table 5 Effect of Selecting Coal Size Fractions on Ash Content
The results for the solvent extraction of the primary coal sample, (WKy#6) in anthracene oil
(AOil#2) are summarized in Table 6. Conversions are very high, approaching 90% on a dry
ash-free basis at the optimum conditions. This compares with 68 to 70% obtained for WKy#9,
more typical of conversion values for bituminous coals in a non-hydrogen donor aromatic
solvent like anthracene oil(3)
. However, a reaction temperature of 400oC was again too low for
this coal when using anthracene oil as the solvent, as it was for WKy#9 used previously. This
combination of conditions produces residual coal particles which rapidly blind the pores in the
filter cake or membrane, making filtration virtually impossible. Only by persevering with
filtration of the quinoline diluted digest for over 24h was one of the five tests attempted under
240

CPCPC 8 Final Report: Alcoa Anode Coke
13
these conditions taken to fruition. Despite the problems encountered with filtration under these
particular conditions the conversion was still very high, ~89%. The ability to filter the quinoline
diluted digest gives valuable information on the likely filtration performance of the digest on a
larger scale.
Coal Western Kentucky #6
Solvent Anthracene oil
#2 #3
No of tests 5* 3 2 2* 2 2
Solvent/Coal ratio 2 : 1 2 : 1 2 : 1 2 : 1 2 : 1 2 : 1
Temperature oC 400 410 420 400 410 420
Time min 60 60 60 60 60 60
Gas yield % daf coal 3.3 3.5 4.0 2.5 2.8 3.5
Coal conversion % daf coal 89 89 81 - 90 85
* Filtration nigh impossible
Table 6 Extraction of WKy#6 with Anthracene Oil
Increasing the reaction temperature by 10oC to 410
oC again had a marked affect upon coal
dissolution. While the conversion was still very high (~90%) filtration was accomplished without
difficulty - a function of the character of the residual solids that collectively form a porous filter
cake. However, if the reaction temperature is further increased to 420oC, the conversion falls to
~80%, resulting from polymerization reactions of the dissolved coal in the non-donor solvent.
There is also a small increase in gas yield at the expense of the more valuable liquid yield
effectively allowing more side chains to be lopped from the large parent coal molecules. Very
similar results were obtained when the solvent (AOil#2) was replaced by a sample of the new
batch (AOil#3). Filtration was not possible for digests prepared at 400oC and hence no
conversion data were obtained, while at 410oC, more facile processing was found with coal
conversion of ~90%, marginally falling off to ~85% when the reaction temperature was
increased to 420oC. The complete data set is shown in Figure 5.
Coal Western Kentucky #6
Solvent FCC Decant Oil
Refinery ‘A’ Refinery ‘B’
No of tests 1 4 4 2 1 2 2 2
Solvent/Coal ratio 2 : 1 2 : 1 2 : 1 2 : 1 2 : 1 2 : 1 2 : 1 2 : 1
Temperature oC 390 400 410 420 390 400 410 420
Time min 60 60 60 60 60 60 60 60
Gas yield % daf coal 3.9 4.5 6.2 7.4 4.4 5.7 4.3 7.3
Coal conversion % daf coal 53 78 76 67 73 91 88 80
FCC: Fluid catalytic cracker
Table 7 Extraction of WKy#6 with Decant Oil
With the petroleum derived Decant Oils the coal extraction behavior was quite different. In
contrast to the digests made using anthracene oil those made with the Decant Oil surprisingly
presented no filtration problems what-so-ever over the whole range tested, 390 to 420oC, a
241
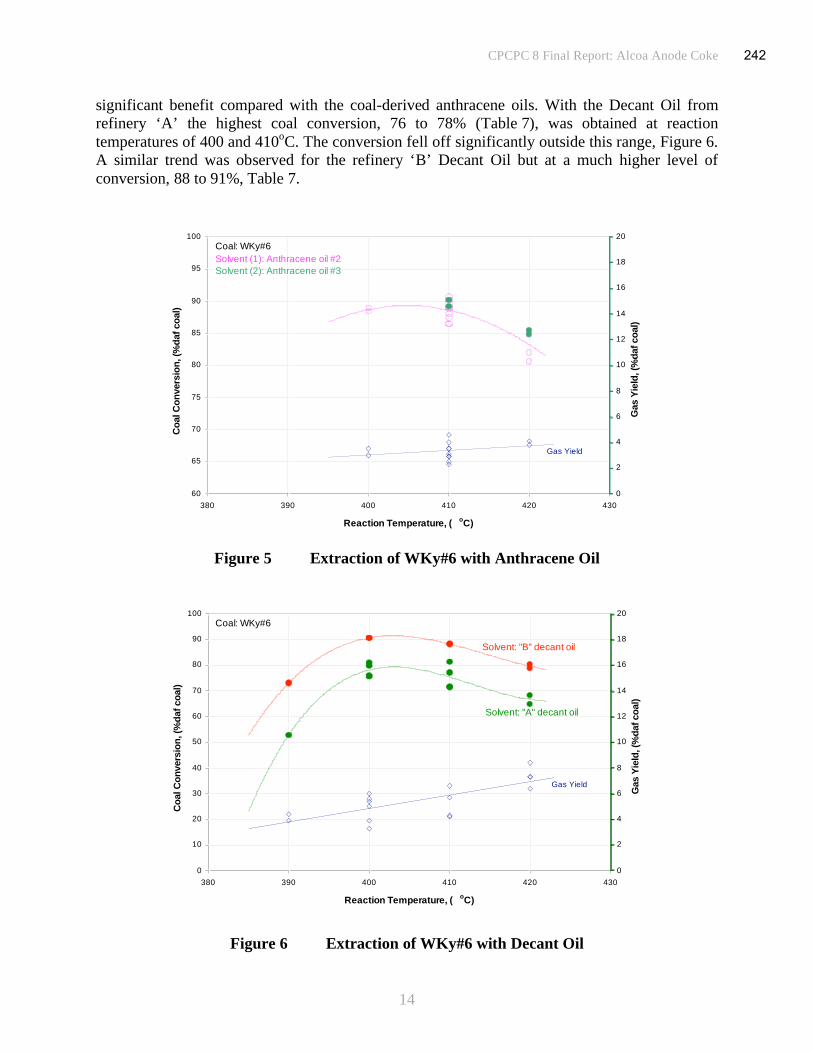
CPCPC 8 Final Report: Alcoa Anode Coke
14
significant benefit compared with the coal-derived anthracene oils. With the Decant Oil from
refinery ‘A’ the highest coal conversion, 76 to 78% (Table 7), was obtained at reaction
temperatures of 400 and 410oC. The conversion fell off significantly outside this range, Figure 6.
A similar trend was observed for the refinery ‘B’ Decant Oil but at a much higher level of
conversion, 88 to 91%, Table 7.
60
65
70
75
80
85
90
95
100
380 390 400 410 420 430
Reaction Temperature, (oC)
Co
al C
on
versio
n, (%
daf c
oal)
0
2
4
6
8
10
12
14
16
18
20
Gas Y
ield
, (%
daf
co
al)
Coal: WKy#6
Solvent (1): Anthracene oil #2
Solvent (2): Anthracene oil #3
Gas Yield
Figure 5 Extraction of WKy#6 with Anthracene Oil
0
10
20
30
40
50
60
70
80
90
100
380 390 400 410 420 430
Reaction Temperature, (oC)
Co
al C
on
versio
n, (%
daf c
oal)
0
2
4
6
8
10
12
14
16
18
20
Gas Y
ield
, (%
daf
co
al)
Coal: WKy#6
Gas Yield
Solvent: "A" decant oil
Solvent: "B" decant oil
Figure 6 Extraction of WKy#6 with Decant Oil
242

CPCPC 8 Final Report: Alcoa Anode Coke
15
Gas yields increased progressively with reaction temperature for both solvents at higher levels
than obtained with anthracene oil coal extraction, a disadvantage since conversion to liquid
products is preferred to the formation of gas. The higher viscosity of these solvents presented
different problems in handling both the solvent and the digest made using it. However, provided
the handling temperature was held slightly above ambient, sample mobility was acceptable and
no serious problems were encountered. The other two solvents, heavy coker gas oil and vacuum
gas oil were tested over the most promising temperature range, 400 to 410oC. Coal conversion
with the coker gas oil was again high, 81 to 86%, while the results for the vacuum gas oil were
much lower, 30 to 50% with significantly more gas evolution, Table 8.
Coal Western Kentucky #6
Solvent Heavy coker gas oil Vacuum gas oil
No of tests 2 2 2 2
Solvent/Coal ratio 2 : 1 2 : 1 2 : 1 2 : 1
Temperature oC 400 410 400 410
Time min 60 60 60 60
Gas yield % daf coal 2.7 4.1 4.9 9.7
Coal conversion % daf coal 86 81 47 32
Table 8 Extraction of WKy#6 with the Lighter Petroleum Fractions
(ii) 2l Reactor Tests. A 2liter reactor was used to prepare larger samples of coal solution
for the coking tests. The conditions selected for the first test SE1, 400oC with a residence time of
60minutes were based on previous experience. A solvent to coal ratio of 2:1 was used. The
economics of solvent extraction processes dictates that the coal content of the slurry is
maximized in order to minimize solvent consumption and to reduce the energy expended in
repetitive heating and cooling cycles. However, the ability to mix and transport the slurry, digest
and coal solution imposes limitations on the maximum viscosity that can be tolerated and hence
restricts the amount of coal that can be dissolved in the solvent. A solids content of ~30%
probably defines a compromise for these types of materials using conventional mixers and
pumps at typical operating temperatures, although lower values have been commonly used in
large scale plant operations to reduce potential problems. The conditions used in the first test
were not severe enough to produce an extraction product (coal digest) that could be filtered,
Table 9.
This result mirrors the findings from the micro reactor tests. The reaction temperature (400oC)
was too low producing some partially digested residual coal particles which make filtration
virtually impossible. The very high specific cake resistance, >1000x1010
m/kg and low mean
filtration rate, 15kg/m2/h reflect this observation. Increasing the reaction temperature to 410
oC
had a marked effect on filtration; specific cake resistance fell to <25x1010
m/kg with filtration
rates of ~70kg/m2/h for SE2 and SE3. Flow rates are based on a notional system in which filters
are operated in parallel with one set on-stream while the others are off-line for cake discharge,
stripping and cleaning, allowing 30minutes for each part of the cycle. The definitive test, SE5
using the primary coal WKy#6 and Decant Oil ‘B’ produced a very encouraging set of results.
The micro-reactor tests had shown that filtration of coal digests made using the Decant Oils was
243

CPCPC 8 Final Report: Alcoa Anode Coke
16
insensitive to the conditions used to prepare the digest (over the range tested). Thus, to maximize
liquid yield the digestion temperature was reduced to 405oC in order to reduce the predicted
higher gas yield with this solvent. In the event the gas yield (6.5%daf coal) was not much higher
than found in SE3 and filtration was fast, with a specific cake resistance of ~25x1010
m/kg with
filtration rates of ~90kg/m2/h.
Experiment No SE1 SE2 SE3 SE5
Coal WKy#9 WKy#9 WKy#9 WKy#6
Solvent A.oil A.oil A.oil Decant Oil ‘B’
Solvent : Coal 2 to 1 2 to 1 2 to 1 2 to 1
Temperature oC 400 410 410 405
Residence Time min 60 60 60 60
Ex
tra
ctio
n
Co
nd
itio
ns
Pressure psi 200 200 200 200
Coal g 299.8 299.7 300.2 288.8
Coal (db) g 286.6 286.5 287.0 281.6
Coal (daf) g 227.5 227.4 227.8 260.2
Solvent g 599.6 599.4 599.5 577.7
Slurry g 899.4 899.1 899.7 866.5
Ash g 59.1 59.1 59.2 21.4
Coal conversion (1)
%daf coal 28.7 67.2 66.5 82.4
Coal conversion (2)
%daf coal 68.0 68.2 64.0 81.9
Coal conversion (3)
%daf coal 70.8 68.9 66.3 82.7
Gas g 11.1 13.1 14.2 17.0
Gas yield %daf coal 4.9 5.8 6.2 6.5
Distillates g 75.9 77.4 74.6 32.5
Digest g 812.1 799.1 806.9 810.4
Dig
esti
on
Mass balance extraction % 100 98.9 99.6 99.2
Filter charge g 812.1 799.1 806.9 810.4
Dry cake (IOM+ash)(4)
g 133.9 128.2 141.2 68.3
Total filtrate g 643.1 649.2 647.1 726.5
Specific cake resistance 1010
m/kg >1000 24 16 27
Filtration rate kg/m2/h 15 69 76 90
Fil
tra
tio
n
Mass balance filtration % 95.7 97.7 97.7 98.1
(1) Coal conversion from digest QI.
(2) Coal conversion from filter cake QI.
(3) Coal conversion by ash enrichment.
(4) IOM = insoluble organic matter.
Table 9 Solvent Extraction of WKy#6 & WKy#9 in 2l Reactor
Specific cake resistances of <10x1010
m/kg are preferred, since when in this range, rapid filtration
is assured. Values <100x1010
m/kg are acceptable although filtration will be slower and an
increased filtration surface area may be required to achieve an acceptable flow rate for a viable
process. At values significantly greater than 100x1010
m/kg filtration becomes progressively more
difficult and actions to improve filtration are required. These could include measures to produce
a more open filter cake by the use of filter aids, for example. However, control of the digestion
244
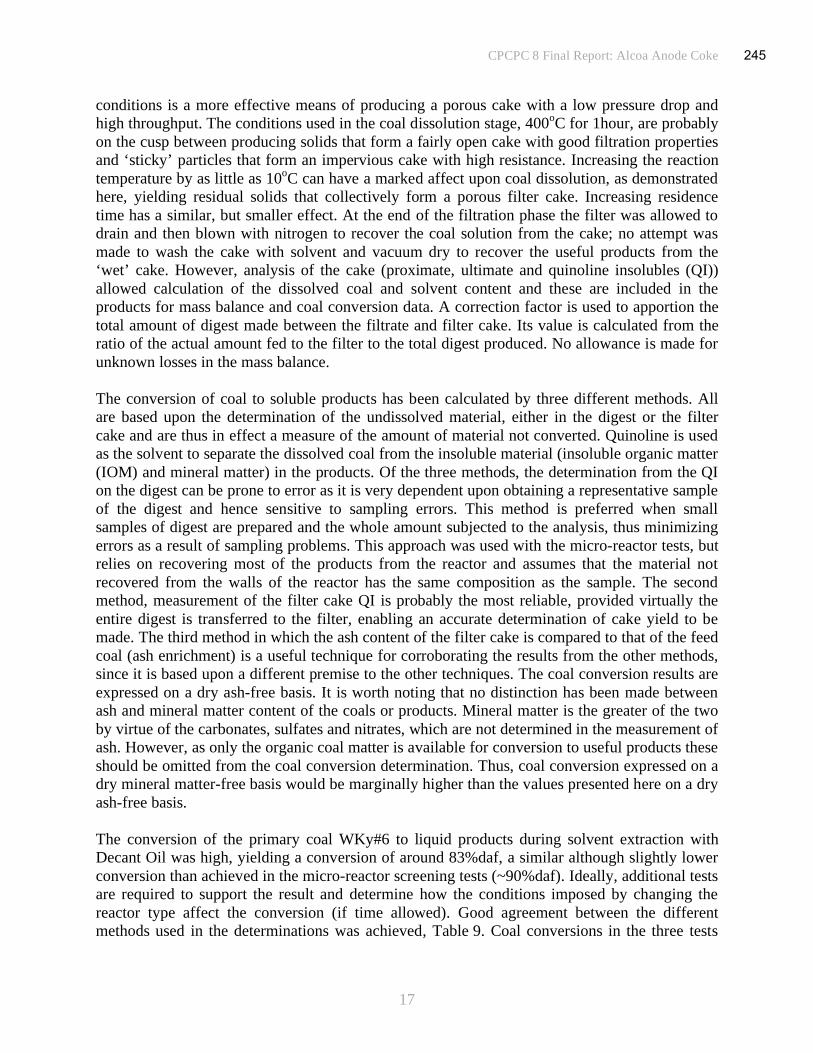
CPCPC 8 Final Report: Alcoa Anode Coke
17
conditions is a more effective means of producing a porous cake with a low pressure drop and
high throughput. The conditions used in the coal dissolution stage, 400oC for 1hour, are probably
on the cusp between producing solids that form a fairly open cake with good filtration properties
and ‘sticky’ particles that form an impervious cake with high resistance. Increasing the reaction
temperature by as little as 10oC can have a marked affect upon coal dissolution, as demonstrated
here, yielding residual solids that collectively form a porous filter cake. Increasing residence
time has a similar, but smaller effect. At the end of the filtration phase the filter was allowed to
drain and then blown with nitrogen to recover the coal solution from the cake; no attempt was
made to wash the cake with solvent and vacuum dry to recover the useful products from the
‘wet’ cake. However, analysis of the cake (proximate, ultimate and quinoline insolubles (QI))
allowed calculation of the dissolved coal and solvent content and these are included in the
products for mass balance and coal conversion data. A correction factor is used to apportion the
total amount of digest made between the filtrate and filter cake. Its value is calculated from the
ratio of the actual amount fed to the filter to the total digest produced. No allowance is made for
unknown losses in the mass balance.
The conversion of coal to soluble products has been calculated by three different methods. All
are based upon the determination of the undissolved material, either in the digest or the filter
cake and are thus in effect a measure of the amount of material not converted. Quinoline is used
as the solvent to separate the dissolved coal from the insoluble material (insoluble organic matter
(IOM) and mineral matter) in the products. Of the three methods, the determination from the QI
on the digest can be prone to error as it is very dependent upon obtaining a representative sample
of the digest and hence sensitive to sampling errors. This method is preferred when small
samples of digest are prepared and the whole amount subjected to the analysis, thus minimizing
errors as a result of sampling problems. This approach was used with the micro-reactor tests, but
relies on recovering most of the products from the reactor and assumes that the material not
recovered from the walls of the reactor has the same composition as the sample. The second
method, measurement of the filter cake QI is probably the most reliable, provided virtually the
entire digest is transferred to the filter, enabling an accurate determination of cake yield to be
made. The third method in which the ash content of the filter cake is compared to that of the feed
coal (ash enrichment) is a useful technique for corroborating the results from the other methods,
since it is based upon a different premise to the other techniques. The coal conversion results are
expressed on a dry ash-free basis. It is worth noting that no distinction has been made between
ash and mineral matter content of the coals or products. Mineral matter is the greater of the two
by virtue of the carbonates, sulfates and nitrates, which are not determined in the measurement of
ash. However, as only the organic coal matter is available for conversion to useful products these
should be omitted from the coal conversion determination. Thus, coal conversion expressed on a
dry mineral matter-free basis would be marginally higher than the values presented here on a dry
ash-free basis.
The conversion of the primary coal WKy#6 to liquid products during solvent extraction with
Decant Oil was high, yielding a conversion of around 83%daf, a similar although slightly lower
conversion than achieved in the micro-reactor screening tests (~90%daf). Ideally, additional tests
are required to support the result and determine how the conditions imposed by changing the
reactor type affect the conversion (if time allowed). Good agreement between the different
methods used in the determinations was achieved, Table 9. Coal conversions in the three tests
245

CPCPC 8 Final Report: Alcoa Anode Coke
18
using WKy#9 and Anthracene Oil were similar, 65 to 70%daf coal again with good agreement
between the different methods used in the determinations bar one, Table 9. The one exception
determined from the digest QI of SE1 can be attributed to a sample that was not representative of
the whole material and gave an erroneous result.
Although increasing the reactor temperature by 10oC had a significant and beneficial affect upon
filtration it also results in an increased gas yield, up from 5 to 6%daf coal. Increasing the severity
of the reaction conditions, temperature or time, effectively allows more side chains to be lopped
from the large parent molecules to produce gas molecules at the expense of the more valuable
liquid yield. The gas was collected in a sequence of sample bags at varying intervals during the
tests and each sampled for analysis by gas/liquid chromatography (GLC); H2S content was
determined separately by Dräger tube. The gas was composed of approximately 20% CO2, 20%
H2O, 20% H2S and the remaining ~40% of alkanes and alkenes, mostly methane and ethane,
Table 10. However, in the early stages of digestion nearly a third of the gas evolved was CO2
while the proportion of alkanes in the off-gas increases with time, showing how the more labile
carboxylic bonds are severed early in the reaction while small hydrocarbon groups are liberated
later. Duplicate samples taken from the same bag (g2a & g2b) showed good reproducibility.
Sample No g1 g2a g2b g3 Combined
CH4 wt% 7.6 19.5 18.2 22.4 16.2
C2H4 wt% 0.7 0.6 0.6 0.5 0.6
C2H6 wt% 4.4 13.9 13.0 18.7 12.0
C3H6 wt% 0.6 0.9 0.8 - 0.5
C3H8 wt% 0.2 6.0 5.6 - 2.0
C4H8 wt% - - - - -
C4H10 wt% - 0.4 0.4 - 0.1
CO wt% n/m n/m n/m n/m n/m
CO2 wt% 32.8 16.2 15.1 13.8 21.3
H2S wt% 26 19 19 19 21
H2O wt% 25.4 22.4 21.1 14.9 21.1
total wt% 97.4 98.9 94.3 89.5 95.5
Co
mp
on
ent
Air dilution wt% 37.9 0.0 0.0 37.9 25.3
density g/l 1.38 1.27 1.21 1.10 1.25
Table 10 Analysis of Gas Evolved from Digestion of WKy#9 in A.Oil (SE3)
Mass balance closures were excellent, particularly for the solvent extraction stage with values of
99 to 100%. At 98%, filtration balances were good for the latter three tests and slightly lower
96% for the first test which proved very difficult to filter. Losses can be largely attributed to
uncontained vapor emissions during transfer of the digest from the reactor to the filter and during
filter cake blowing, performed to recover the coal solution from the cake.
(iii) Coking Tests. The structure and properties of the samples of coke derived from
the different feedstocks and under a range of operating conditions were assessed.
Characterization of the cokes was carried out by determining the proximate and ultimate
analyses and through the measurement of the metals content by x-ray fluorescence (XRF).
246

CPCPC 8 Final Report: Alcoa Anode Coke
19
Samples were also set in epoxy resin, sectioned and polished to observe coke structure by
polarized light optical microscopy.
For the samples of coke derived from the pre-existing coal solutions the yield of green coke was
typically around 25 to 30% of the coal solution fed to the reactor, Table 11. Calcining yields
were in the range 90 to 95% of the green coke as a result of the loss of a small amount of residual
volatile material. The amount of ash, generally around 0.5 to 0.6% (with one sample over 1%),
was above the target specification for anode coke, <0.1%, Table 12. However, the sulfur contents
of 0.4 to 0.5% were well within the specified limit, <1wt%, required for anode grade coke,
Table 1. Metal contents were somewhat variable although the concentrations naturally follow the
trend set by the ash content. Nickel and vanadium, the metals of concern in relation to carbon
consumption and hence increased cost to the process, were both very low (<10ppm) for all of the
samples and well below the specified value of <200ppm. Sodium was present at equally low
concentrations while the phosphorus content, <10ppm appeared to meet the specification
(<5ppm) to within the sensitivity limits of the method of analysis. The same is true for the
chromium content (<10ppm compared to the spec. of <1ppm) except for the one odd sample.
The high silicon and iron contents of this same sample suggests that contamination of the sample
may have occurred. For the other coke samples the silicon content was close to meeting the
target (<200ppm) while the iron content was again somewhat variable; only for calcium was
there reason to be less than satisfied with values generally above 200ppm, well outside the target
of 50ppm and even here one of the four samples produced a value of <10ppm.
How much of the ash and hence metals in the coke can be attributed to contamination during the
coking process? Inspection of data from the analysis of pitches made from the same coal
solutions by vacuum distillation in glassware, Table 13, is very revealing. The ash contents are
now significantly lower, 0.2 to 0.3%, about half of the coke ash values, although still above the
target of <0.1%. The yields of high softening pitch and calcined coke from a common feedstock
are not too dissimilar, generally 35 to 40% compared to 25 to 30% depending on source, ie the
effect of the loss of volatile material in the conversion of high softening pitch to calcined coke
should only increase the ash by 40% at most, based on the reasonable assumption that the
volatiles lost from the pitch/coke are ash-free. The predicted ash content in the coke can be
calculated from the pitch ash contents and the relative yields of pitch and coke derived from the
same coal solution, Table 14. All of the predicted ash values are well below the measured values,
generally by factors of between 50 and 100%. The implications are that the samples are
contaminated during coking, presumably from the walls of the coking vessel. On an industrial
scale the increase in volume to surface area ratio of several orders of magnitude, renders wall
effects insignificant for the coke from a delayed coker. If the metals analysis of the pitch is used
to predict the concentrations in the calcined coke, the values are closer still to meeting the
required specifications for anode grade coke, Table 1.
The results from the coking tests performed with the primary feedstock, WKy#6 and Decant Oil
were different in some aspects from those derived from the anthracene oil coal solutions.
Although the green coke yield for test CK23 conducted under similar conditions to those
performed earlier (with the pre-existing coal solutions) was not dissimilar (33%), when the soak
time was increased to 7h and then to 20h in the last two tests (CK24 & CK26) the coke yield
increased substantially to 60 and 70% respectively, Table 15. This implies that a large proportion
of the Decant Oil was converted to coke during the extended time coking experiments, since the
247

CPCPC 8 Final Report: Alcoa Anode Coke
20
amount of dissolved coal in the feed coal solution was approximately 28%. For all of these
samples the ash content was again outside the target vale of <0.1% with values of 0.2 to 0.5% for
the three tests. The variation in the ash content values for cokes derived from a common batch of
coal solution (SE5) again suggests that some contamination from the walls of the steel coking
vessel was responsible. All of the metal contents were well within the range required for coke
used in the aluminum industry with one exception: the chromium content was above the level set
for anode coke for all three samples, Table 16. The sulfur content was again well below the
required limit.
Characterization of the calcined cokes by optical microscopy shows that the structure of those
derived through coal extraction in anthracene oil was essentially anisotropic, but with a
predominantly small mosaic infrastructure, Figure 7. However, there is some evidence of larger
mesophase domains in infrequent isolated zones in the coke, Figure 8 that offers the prospect for
developing the type of structure required for the production of coke with the required properties.
Comparison with the structure of the coke produced in the same laboratory reactor by the
polymerization of a typical coker feed, FCC Decant Oil, shows that while the latter has a more
extensively developed anisotropic domains it does not exhibit the needle like structure of typical
anode cokes produced in a delayed coker, Figure 9. It can therefore be argued that the coal
extract derived coke could be produced with a similar structure under optimum conditions found
in a true delayed coker. However, it is the structure shown by the polarized light optical
microscopy of the three cokes derived from the Decant Oil coal extract that should be given the
most consideration. The cokes display an extensive array of anisotropic domains with
particularly well-defined large areas of well-aligned mesophase that should be ideal for the
fabrication of carbon anodes. The structure became progressively more pronounced and
impressive with increasing soak time in the laboratory reactor, Figures 10-13.
248

CPCPC 8 Final Report: Alcoa Anode Coke
21
Coal source Bailey
Pittsburgh
Bailey
Pittsburgh Pond Creek
E Ky
Alex Energy
WV
Coking Charge g 151.8 152.5 138.9 151.1
Condensate g 100.3 96.1 52.5 98.1
Green Coke g 42.7 47.7 56.5 40.7
Calcined Coke g 34.8 44.3 52.9 38.3
Condensate Yield % 66.1 63.0 37.8 64.9
Green Coke Yield % 28.1 31.3 40.7 26.9
Calcined Coke Yield % 22.9 25.3 29.0 38.1
Calcining Balance % 81.5 93.0 93.6 94.1
Coking Mass Balance % 94.3 94.2 78.5 91.9
Ash in calcined coke % 0.47 0.57 1.26 0.62
Pitch from same source:
Pitch Softening Temp oC 240 285 250 285
Pitch Yield % 40.6 37.7 39.3 30.1
Ash in pitch % 0.17 0.20 0.30 0.23
Calculated values:
Ash in coal solution % 0.07 0.08 0.12 0.07
Ash in calcined coke % 0.30 0.26 0.31 0.27
Table 11 Pitch and Coke Data
249
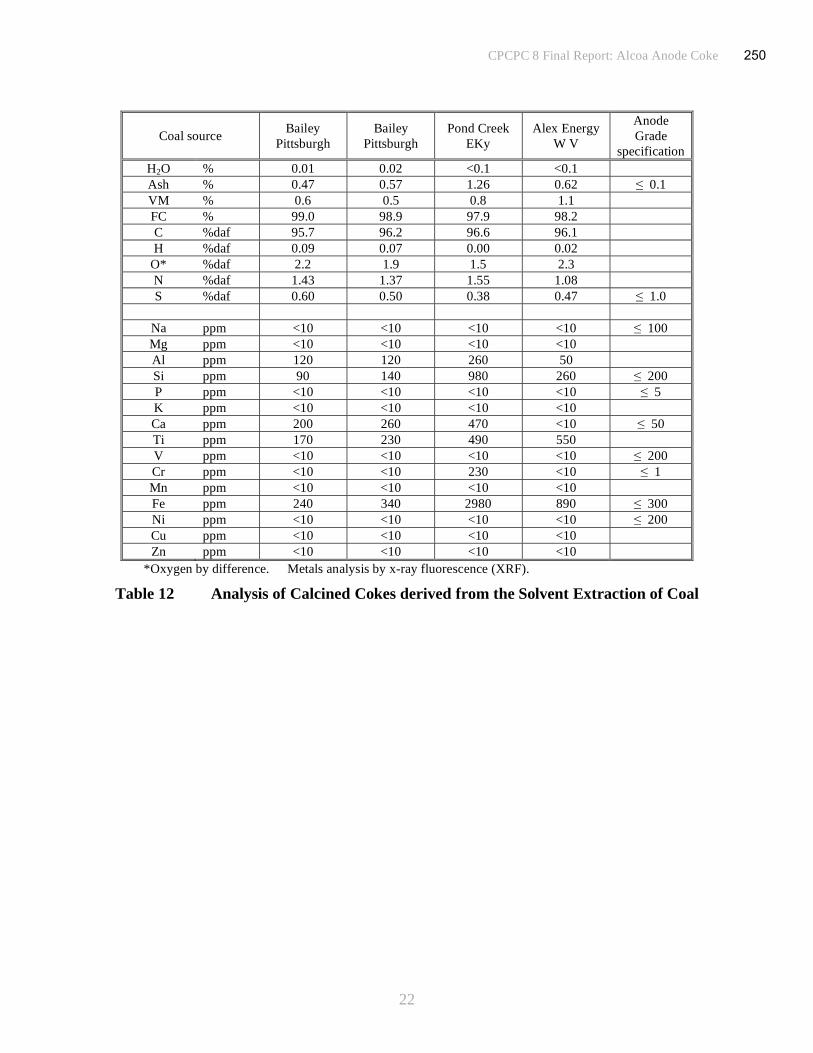
CPCPC 8 Final Report: Alcoa Anode Coke
22
Coal source Bailey
Pittsburgh
Bailey
Pittsburgh
Pond Creek
EKy
Alex Energy
W V
Anode
Grade
specification
H2O % 0.01 0.02 <0.1 <0.1
Ash % 0.47 0.57 1.26 0.62 0.1
VM % 0.6 0.5 0.8 1.1
FC % 99.0 98.9 97.9 98.2
C %daf 95.7 96.2 96.6 96.1
H %daf 0.09 0.07 0.00 0.02
O* %daf 2.2 1.9 1.5 2.3
N %daf 1.43 1.37 1.55 1.08
S %daf 0.60 0.50 0.38 0.47 1.0
Na ppm <10 <10 <10 <10 100
Mg ppm <10 <10 <10 <10
Al ppm 120 120 260 50
Si ppm 90 140 980 260 200
P ppm <10 <10 <10 <10 5
K ppm <10 <10 <10 <10
Ca ppm 200 260 470 <10 50
Ti ppm 170 230 490 550
V ppm <10 <10 <10 <10 200
Cr ppm <10 <10 230 <10 1
Mn ppm <10 <10 <10 <10
Fe ppm 240 340 2980 890 300
Ni ppm <10 <10 <10 <10 200
Cu ppm <10 <10 <10 <10
Zn ppm <10 <10 <10 <10
*Oxygen by difference. Metals analysis by x-ray fluorescence (XRF).
Table 12 Analysis of Calcined Cokes derived from the Solvent Extraction of Coal
250
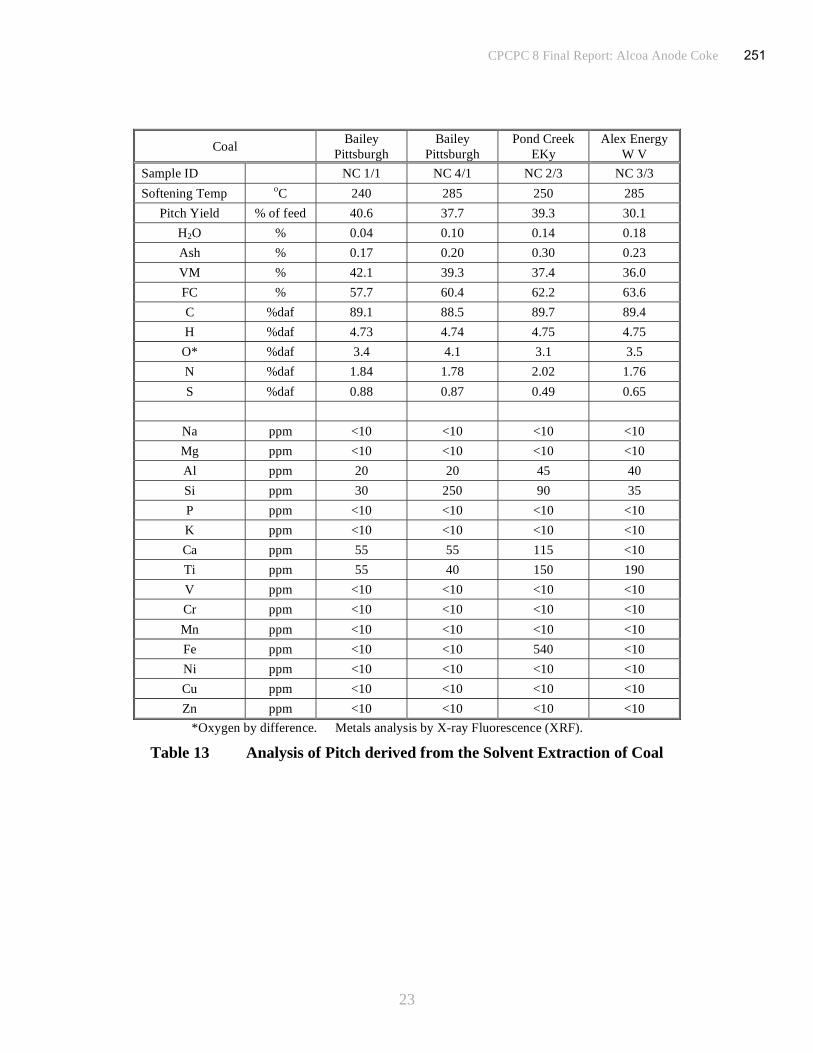
CPCPC 8 Final Report: Alcoa Anode Coke
23
Coal Bailey
Pittsburgh
Bailey
Pittsburgh
Pond Creek
EKy
Alex Energy
W V
Sample ID NC 1/1 NC 4/1 NC 2/3 NC 3/3
Softening Temp oC 240 285 250 285
Pitch Yield % of feed 40.6 37.7 39.3 30.1
H2O % 0.04 0.10 0.14 0.18
Ash % 0.17 0.20 0.30 0.23
VM % 42.1 39.3 37.4 36.0
FC % 57.7 60.4 62.2 63.6
C %daf 89.1 88.5 89.7 89.4
H %daf 4.73 4.74 4.75 4.75
O* %daf 3.4 4.1 3.1 3.5
N %daf 1.84 1.78 2.02 1.76
S %daf 0.88 0.87 0.49 0.65
Na ppm <10 <10 <10 <10
Mg ppm <10 <10 <10 <10
Al ppm 20 20 45 40
Si ppm 30 250 90 35
P ppm <10 <10 <10 <10
K ppm <10 <10 <10 <10
Ca ppm 55 55 115 <10
Ti ppm 55 40 150 190
V ppm <10 <10 <10 <10
Cr ppm <10 <10 <10 <10
Mn ppm <10 <10 <10 <10
Fe ppm <10 <10 540 <10
Ni ppm <10 <10 <10 <10
Cu ppm <10 <10 <10 <10
Zn ppm <10 <10 <10 <10
*Oxygen by difference. Metals analysis by X-ray Fluorescence (XRF).
Table 13 Analysis of Pitch derived from the Solvent Extraction of Coal
251

CPCPC 8 Final Report: Alcoa Anode Coke
24
Coal Bailey
Pittsburgh
Bailey
Pittsburgh
Pond Creek
EKy
Alex
Energy
W V
Anode Coke
Specification
Ash % 0.30 0.26 0.36 0.27 0.1
Na ppm <10 <10 <10 <10 100
Mg ppm <10 <10 <10 <10
Al ppm 30 20 50 50
Si ppm 50 340 110 40 200
P ppm <10 <10 <10 <10 5
K ppm <10 <10 <10 <10
Ca ppm 100 70 140 <10 50
Ti ppm 90 60 180 230
V ppm <10 <10 <10 <10 200
Cr ppm <10 <10 <10 <10 1
Mn ppm <10 <10 <10 <10
Fe ppm <10 <10 650 <10 300
Ni ppm <10 <10 <10 <10 200
Cu ppm <10 <10 <10 <10
Zn ppm <10 <10 <10 <10
Table 14 Predicted Analysis of Calcined Cokes derived from Pitch Analysis
Run No CK23 CK24 CK26
Soak time h 3 7 20
Coking Charge g 150.7 151.2 150.1
Condensate g 88.1 46.6 30.9
Green Coke g 49.7 89.5 107.9
Calcined Coke g 47.6 84.6 102.1
Condensate Yield % 58.5 30.8 20.6
Green Coke Yield % 33.0 59.2 71.9
Calcined Coke Yield % 31.6 56.0 68.0
Calcining Balance % 95.7 94.5 94.6
Coking Mass Balance % 91.5 90.0 92.5
Ash in calcined coke % 0.36 0.50 0.18
Table 15 Coking Tests with WKy#6 / Decant Oil Coal Solution from SE5
252

CPCPC 8 Final Report: Alcoa Anode Coke
25
Run No CCK23 CCK24 CCK26 Anode Grade
Specification
H2O % 0.01 0.06 0.01
Ash % 0.36 0.50 0.18 0.1
VM % 0.62 0.72 0.52
FC % 99.0 98.7 99.0
C %daf 98.5 93.5 97.0
H %daf 0.03 0.04 0.02
O* %daf 0.3 5.1 1.4
N %daf 0.41 0.57 0.57
S %daf 0.12 0.35 0.34 1.0
Na ppm <1 9 7 100
Mg ppm 10 3 4
Al ppm 17 20 7
Si ppm 55 103 3 200
P ppm <1 3 2 5
K ppm <1 2 <1
Ca ppm 48 7 13 50
Ti ppm 166 125 43
V ppm <1 <1 <1 200
Cr ppm 10 2 5 1
Mn ppm <1 <1 5
Fe ppm 115 11 5 300
Ni ppm <1 1 4 200
Cu ppm 27 <1 <1
Zn ppm 14 5 2
As ppm <1 <1 <1
Be ppm <1 <1 <1
Cd ppm <1 <1 <1
Hg ppm <1 <1 <1
Pb ppm <1 <1 <1
Table 16 Analysis of Calcined Cokes from SE5 Coal Solution (WKy#6 / Decant oil)
253

CPCPC 8 Final Report: Alcoa Anode Coke
26
Figure 7 Anthracene Oil derived Coal Extract Coke - Small Mozaic Anisotropy
Figure 8 Anthracene Oil derived Coal Extract Coke - Infrequent Larger Anisotropic Domains
Figure 9 FCC Calcined Coke from Laboratory & Delayed Coker
Laboratory Coker Delayed Coker
254
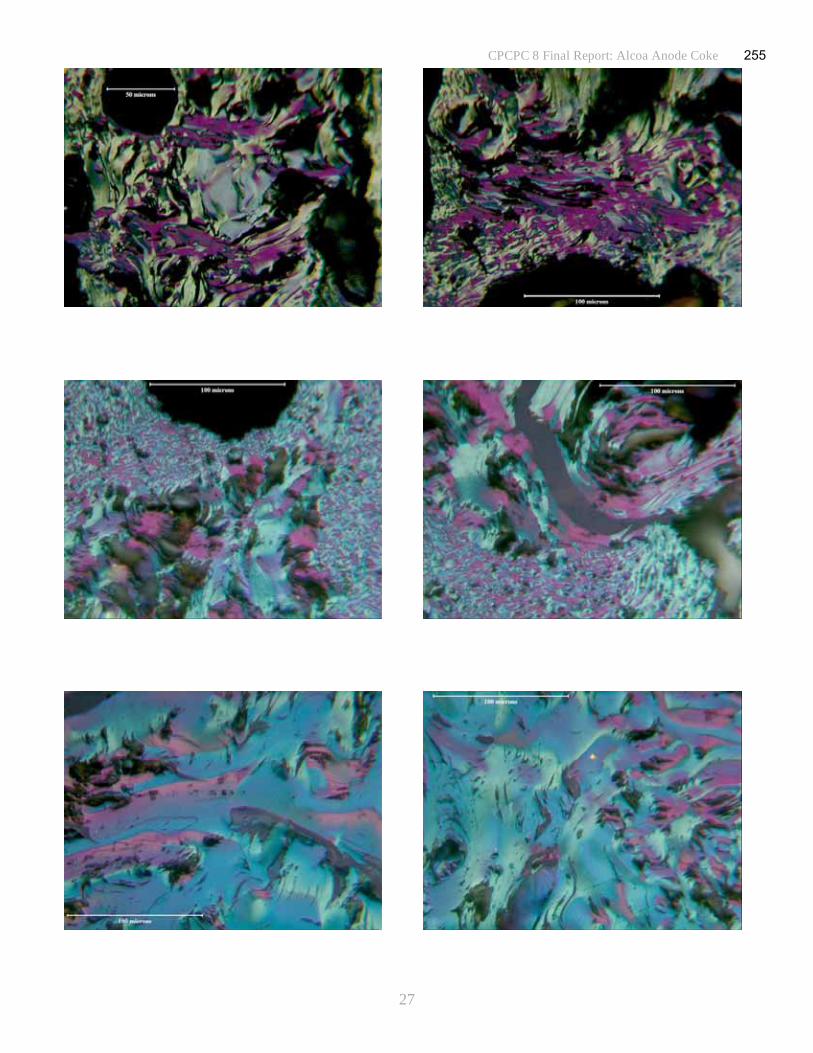
CPCPC 8 Final Report: Alcoa Anode Coke
27
255

CPCPC 8 Final Report: Alcoa Anode Coke
28
256

CPCPC 8 Final Report: Alcoa Anode Coke
29
(iv) Material Balance Based on data from the solvent extraction of WKy#6 with Decant
Oil in SE5 and the coking data from CK23 a material balance can be constructed, Figure 14. A
plant built for a coal throughput of 100t/h would produce calcined coke suitable for the
fabrication of carbon anodes at a rate of 79t/h. The reject stream of dry filter cake residue would
amount to 24t/h with a high value gas/light distillate yield of ~10t/h. However, a make-up supply
of process solvent (Decant Oil) of 35t/h would be required to maintain the solvent inventory.
Figure 12 Conceptual Plant Material Balance
Conclusions
A simple micro-reactor test to assess the dissolution of coals in process solvents has been
established and validated. A feature of the test is the fast response time giving reliable results on
the performance of coals and solvents in the conversion to soluble products. It has been used to
monitor the extraction of the primary test coal Wky#6 and a reference coal, WKy #9 using
anthracene oil as the solvent.
WKy#6 coal has proven to be very reactive, with conversions of ~90% (dry ash free coal basis)
when extracted with anthracene oil. However, filtration was virtually impossible for digests
produced at the lowest temperature used, 400oC, whereas at 410
oC filtration was achieved
without problem. Coal conversion fell at higher reaction temperature, 420oC. A similar but more
pronounced trend was observed when the Decant Oils from an FCC unit were used as the
solvent. Conversions were again ~90% for the coal when using the ‘B’ Decant Oil at reaction
temperatures in the range 400 to 410oC, but decreasing outside this temperature range. The same
trend was found for the ‘A’ Decant Oil but at a lower level of conversion, maximum ~78%.
Filtration was feasible under all conditions tested, 390 to 420oC, for digests prepared using both
257

CPCPC 8 Final Report: Alcoa Anode Coke
30
Decant Oils. This feature of Decant Oil coal digests offers the prospect for facile process control
in an area that can be problematic for anthracene oil extracts. Gas yields were higher than
observed with anthracene oil. Tests with the heavy coker gas oil also resulted in conversion of
the WKy#6 coal of 80 to 85% at 400 to 410oC, while with the vacuum gas oil conversions of
only 30 to 50% were obtained under these conditions with significantly higher gas yields.
A series of four autoclave tests have been completed to assess the solvent extraction of Western
Kentucky #9 coal in anthracene oil and to prepare a large batch of coal solution from the primary
coal Western Kentucky #6 and Decant Oil ‘B’ to conduct the coking experiments. The process
conditions used in the first test, 400oC for 60minutes (WKy#9/AOil) produced a digest that could
not be filtered. Increasing the reactor temperature by 10oC produced digests which filtered
without difficulty. Two replicate tests (WKy#9/AOil) at the higher temperature gave very
reproducible results with filtration rates of ~70kg/m2/h. Gas yields increased from 5 to 6%daf
coal at the higher temperature. Filtration of the coal digest prepared from the primary coal
WKy#6 and Decant Oil was fast ~90kg/m2/h, while the conversion to liquid products was high
(83%daf), although slightly lower than achieved in the micro-reactor tests. Coal conversions in
the three tests using WKy#9 and Anthracene Oil were similar, 65 to 70%daf coal with good
agreement between the different methods used in the determinations. Mass balance closures were
high, 99 to 100% for digestion and ~98% for filtration.
Coal solutions derived by the solvent extraction of three US coals in anthracene oil were
converted into coke using a laboratory steel reactor. The solutions were heated to a temperature
of 450oC under reflux conditions with a nitrogen sparge and held at this temperature for ~3h to
encourage the growth of mesophase, before the temperature was raised to 550oC. The green
cokes were calcined at 1350oC. Samples of the primary coal solution (WKy#6/Decant Oil) were
also converted to coke but with increasing soak time under quiescent conditions at 450oC. The
ash contents of the cokes were higher than the specification for anode grade coke, but some of
this can be attributed to contamination from the coking vessel. Metal concentrations in the
calcined cokes mostly met the specification for anode coke, rarely exceeding the defined
concentration limit for each metal, while the amount of sulfur present was well within the
specified value.
The structure of the anthracene oil derived cokes was predominantly in the form of small
anisotropic mosaics with some evidence of larger mesophase domains in infrequent isolated
zones offering the prospect for developing the type of structure required for the production of
anode coke. Comparison with the structure of the coke produced in the same laboratory steel
rector by the polymerization of FCC Decant Oil, shows that while the latter has a more
extensively developed anisotropic domains it does not exhibit the needle like structure typical of
anode cokes, showing that the conditions in the laboratory unit did not reproduce the conditions
found in a delayed coker. It can therefore be argued that the coal extract derived coke could be
produced with a similar structure under optimum conditions found in a true delayed coker.
However, it is the structure of the three cokes derived from the Decant Oil coal that should be
given the most consideration. The cokes display an extensive array of anisotropic domains with
particularly well-defined large areas of well-aligned mesophase that should be ideal for the
fabrication of carbon anodes irrespective of the non-ideal coking conditions. The structure
became progressively more pronounced and impressive with increasing soak time.
258

CPCPC 8 Final Report: Alcoa Anode Coke
31
References
(1) “Technical and Economic Assessment of Mild Coal Extraction”, CPCPC Report No 2691-
UK-DOE-1874, May 2005.
(2) Purchase DB, “Industrial Filtration of Liquids”, 2nd
edition, CRC Press, 1971.
(3) “Reactivity of British Coals in Solvent Extraction ”, Clarke JW, Kimber GM, Rantell T &
Shipley DE, ACS Symposium Series #139, 1980.
259

1
Premium Carbon Products from Coal: A Sulfur-Based Approach
Final Report
3/1/2005 – 06/30/2006
Principle Authors: P.C. Painter, J. Larsen, H. Schobert
June 14, 2006
DOE Award Number: Subcontract # 2874-TPSU-DOE-1874 under DOE Prime DE-FC26-
03NT4187
The Energy Institute
Penn State University
University Park, PA 16802
260

2
Disclaimer
This report was prepared as an account of work sponsored by an agency of the United States
Government. Neither the United States Government nor any agency thereof, nor any of their
employees, makes any warranty, express or implied, or assumes any legal liability or
responsibility for the accuracy, completeness, or usefulness of any information, apparatus,
product, or process disclosed, or represents that its use would not infringe privately owned rights.
Reference herein to any specific commercial product, process, or service by trade name,
trademark, manufacturer or otherwise does not necessarily constitute or imply its endorsement,
recommendation, or favoring by the United States Government or any agency thereof. The views
and opinions of authors expressed herein do not necessarily state or reflect those of the United
States Government or any agency thereof.
261
3
Abstract
The goal of this research is to develop methods for producing marketable forms of carbon
from coals using a sulfur dehydrogenation process. If successful, this work could have
considerable impact, allowing the development of a new, environmentally cleaner process for
coke and carbon production, expanding the number of coals that can be used to make these
products and allowing the development of a CO2 free, carbon neutral, source of H2.
Initial work focused on fundamental research to establish feasibility and an understanding of
the relationships between processing conditions, coal structure, the mechanism of
dehydrogenation, and the nature of the carbon being produced. While a continuous flow
apparatus was being assembled, batch reactions were performed. Two coals were reacted with
sulfur under a range of processing conditions. FTIR spectra of the products yielded some
unexpected results, showing the formation of carbon disulfide and some carbonyl containing
functional groups. The formation of carbon disulfide was suppressed by processing the coal
under pressure (an initial pressure of 100 psi nitrogen), while at the same time these conditions
resulted in the surprising formation of carbonyl groups.
Recent work has focused on flow reactor experiments. The results demonstrate that the extent
of dehydrogenation by sulfur at 500°C appears comparable to that obtained in the absence of
sulfur, only at much higher temperatures. This is broadly consistent with the findings of Jusino
and Schobert (2006) who produced a product much like metallurgical coke but at much lower
temperatures than in a conventional coke oven. Flow-reactor tests at 700°C also produced coke
cenospheres, which may have interesting potential applications.
262

4
Table of Contents
Page
Abstract 3
Introduction 5
Executive Summary 6
Experimental 6
Results and Discussion 8
Conclusions 14
References 14
Graphical Materials
Figure 1. Pictures of the continuous flow reactor.
Figure 2. Products formed at 600˚C. The product consisted of two phases. One phase consisted
of large lumps of material that had a coke-like appearance, while the second phase was a powder
similar to that formed at 500˚C.
Figure 3. FTIR spectra of the original coal, DECS 30 (bottom); broken-up particulate material
produced at 600˚C (middle); and the coke-like material also formed at 600˚C (top).
Figure 4. FTIR spectra of the coke-like product obtained by sulfur dehydrogenation at 500˚C
(top), powder-like product (middle) and, for comparison, the spectrum of the melted porous mass
from heating to 500˙C in the absence of sulfur (bottom).
Figure 5. SEM of original coal (top left) and clockwise broken-up particles formed at 500˚C,
coke-like lumps formed at 700˚C and coke-like lumps formed at 600˚C.
Figure 6. The SEM of carbon products formed at 500˚C (top two micrographs) and 700˚C
(bottom two micrographs) by sulfur dehydrogenation. On the left side are the micrographs of the
coke like lumps cokes, on the right side are micrographs of the powder or particle fractions.
Figure 7. Hollow spheres obtained by dehydrogenating coal with sulfur at 700˚C.
263

5
Introduction
There is much discussion of the prospect of a “hydrogen economy”, in which hydrogen
would serve as a primary energy carrier. In the short-term, it is envisioned that hydrogen will be
produced “from coal”, which actually means that coal, i.e., the carbon in coal, will be used as the
reagent for splitting water molecules in gasification processes. This is mature and well-known
technology that produces a carbon monoxide/hydrogen mixture; subsequent reaction via the
water-gas shift converts the carbon monoxide to the dioxide. Various separation processes allow
removal of the carbon dioxide leaving fairly pure hydrogen as the desired product (Kohl and
Riesenfeld, 1985). However, the stoichiometry is such that the majority of the hydrogen has
actually come from water, not from coal.
In the research reported here, a much different approach has been taken. This involves
removing the hydrogen from coal itself—that is, literally, a hydrogen from coal process. The
world’s recoverable coal reserves are thought to be about 1012
tonnes (Schobert and Song, 2002).
Assuming an average hydrogen content of 3%, not including hydrogen in moisture or mineral
matter, this amount of coal represents a source of 3x10¹⁰
tonnes of hydrogen. One requirement
for recovering this hydrogen is a reagent that effectively dehydrogenates the various organic
structures that are present in coals. While many reagents could, in principle, be used, sulfur is
particularly attractive because it will dehydrogenate alkanes, cycloalkanes, and hydroaromatics
at relatively low temperatures (Bloxam, 1913; Turner et al., 1936; Fieser and Fieser, 1944;
Rasmussen et al., 1946; Fuson, 1950; Szmant, 1957; Kleinberg et al., 1960; Bordwell, 1963;
Cram and Hammond, 1964). The dehydrogenation product is H2S. Various methods, including
pyrolysis, are available for subsequently splitting H2S to H2 and S (Roscoe and Schorlemmer,
1911; Müller, 1931; Thau, 1932; Sneed and Maynard, 1944; Sidgwick, 1950; Reeve, 1958).
Separation then allows recovery of the desired hydrogen with recycle of sulfur back through the
reactor. Cox et al. (1998) estimated that hydrogen could be produced from H2S at a cost of USD
727/ton (1997 dollars), but added that, with improvements in heat transfer and gas separation, the
process could become competitive with conventional steam-reforming of methane. We suggest
that even at this estimated price, the process would be economically attractive if high-value
carbon products were being obtained at the same time.
Jusino and Schobert (2006) reported preliminary work on this process. Using a medium-
volatile bituminous coal from Virginia, 70–75% of the hydrogen in the coal could be removed as
H2S, with 97% conversions of S to H2S. The carbonaceous solid remaining had volatile matter,
fixed carbon, ash, and friability comparable to standard samples of metallurgical coke, even
though it was produced at temperatures of only 700–800°C (vs. 950–1050°C in slot-type coke
ovens). This work suggests the potential of making both a valuable carbon product and hydrogen
from coal in a single, relatively simple process in which the active reagent can be recycled.
The goal of the research reported here is to develop methods for producing hydrogen and
marketable forms of carbon from coals using this sulfur dehydrogenation process. Initial work
has focused on fundamental research to establish feasibility and an understanding of the
relationships between processing conditions, coal structure, the mechanism of dehydrogenation,
and the nature of the carbon being produced. To this end, both batch reactions and
dehydrogenation reactions in a continuous flow reactor have been performed.
264
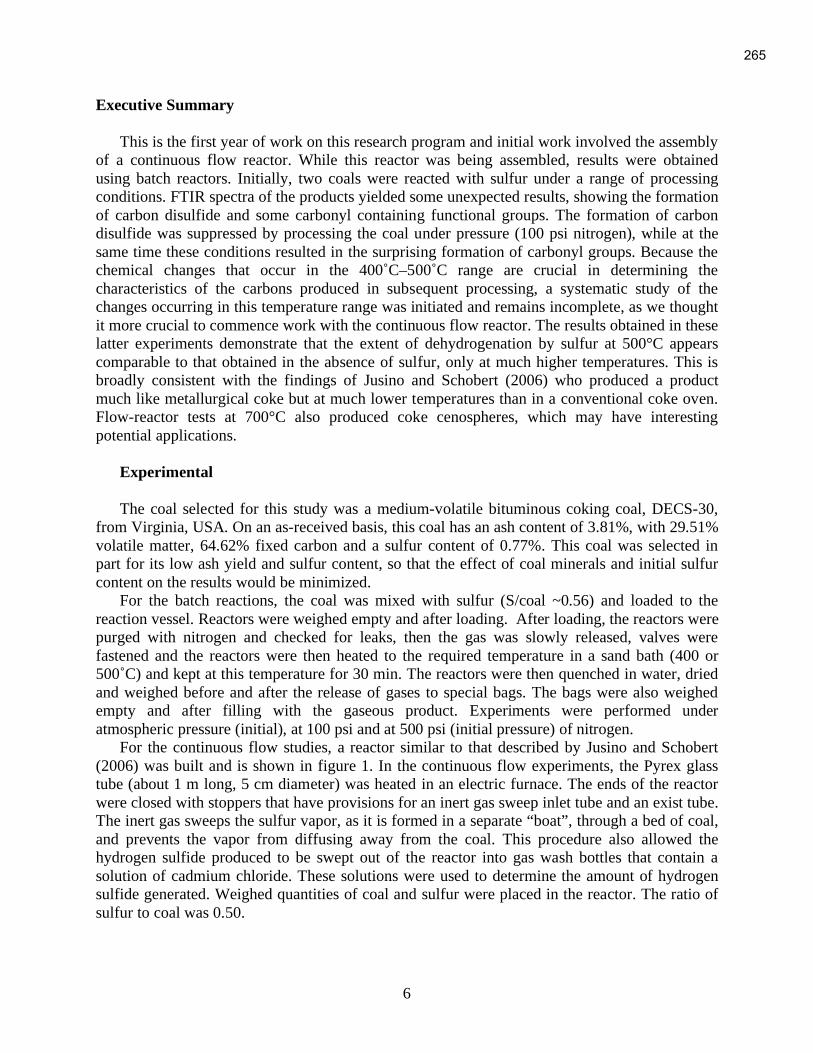
6
Executive Summary
This is the first year of work on this research program and initial work involved the assembly
of a continuous flow reactor. While this reactor was being assembled, results were obtained
using batch reactors. Initially, two coals were reacted with sulfur under a range of processing
conditions. FTIR spectra of the products yielded some unexpected results, showing the formation
of carbon disulfide and some carbonyl containing functional groups. The formation of carbon
disulfide was suppressed by processing the coal under pressure (100 psi nitrogen), while at the
same time these conditions resulted in the surprising formation of carbonyl groups. Because the
chemical changes that occur in the 400˚C–500˚C range are crucial in determining the
characteristics of the carbons produced in subsequent processing, a systematic study of the
changes occurring in this temperature range was initiated and remains incomplete, as we thought
it more crucial to commence work with the continuous flow reactor. The results obtained in these
latter experiments demonstrate that the extent of dehydrogenation by sulfur at 500°C appears
comparable to that obtained in the absence of sulfur, only at much higher temperatures. This is
broadly consistent with the findings of Jusino and Schobert (2006) who produced a product
much like metallurgical coke but at much lower temperatures than in a conventional coke oven.
Flow-reactor tests at 700°C also produced coke cenospheres, which may have interesting
potential applications.
Experimental
The coal selected for this study was a medium-volatile bituminous coking coal, DECS-30,
from Virginia, USA. On an as-received basis, this coal has an ash content of 3.81%, with 29.51%
volatile matter, 64.62% fixed carbon and a sulfur content of 0.77%. This coal was selected in
part for its low ash yield and sulfur content, so that the effect of coal minerals and initial sulfur
content on the results would be minimized.
For the batch reactions, the coal was mixed with sulfur (S/coal ~0.56) and loaded to the
reaction vessel. Reactors were weighed empty and after loading. After loading, the reactors were
purged with nitrogen and checked for leaks, then the gas was slowly released, valves were
fastened and the reactors were then heated to the required temperature in a sand bath (400 or
500˚C) and kept at this temperature for 30 min. The reactors were then quenched in water, dried
and weighed before and after the release of gases to special bags. The bags were also weighed
empty and after filling with the gaseous product. Experiments were performed under
atmospheric pressure (initial), at 100 psi and at 500 psi (initial pressure) of nitrogen.
For the continuous flow studies, a reactor similar to that described by Jusino and Schobert
(2006) was built and is shown in figure 1. In the continuous flow experiments, the Pyrex glass
tube (about 1 m long, 5 cm diameter) was heated in an electric furnace. The ends of the reactor
were closed with stoppers that have provisions for an inert gas sweep inlet tube and an exist tube.
The inert gas sweeps the sulfur vapor, as it is formed in a separate “boat”, through a bed of coal,
and prevents the vapor from diffusing away from the coal. This procedure also allowed the
hydrogen sulfide produced to be swept out of the reactor into gas wash bottles that contain a
solution of cadmium chloride. These solutions were used to determine the amount of hydrogen
sulfide generated. Weighed quantities of coal and sulfur were placed in the reactor. The ratio of
sulfur to coal was 0.50.
265

7
Figure 1. Pictures of the continuous flow reactor
The reactor was heated to the desired test temperature and allowed to run for the desired test
duration (usually 1 hour, but in one case the reaction time was prolonged to 2 hours). At the end
of the reaction, nitrogen flow through the reactor was continued for several additional minutes, to
insure that all the hydrogen sulfide in the reactor was swept through the wash bottles. The
contents of the gas wash bottles were then filtered to remove precipitated cadmium sulfide. The
amount of cadmium remaining in solution was determined by atomic absorption spectroscopic
analysis of the filtrate. Given the known amount of cadmium in solution at the start of a test, and
that remaining in solution at the end, the amount of cadmium sulfide formed, and hence the
amount of hydrogen sulfide generated, was determined by straightforward stoichiometric
calculations.
Proximate analysis of the samples (volatile matter, VM; ash; and fixed carbon, FC) were
performed using a LECO MAC-400 Proximate Analyzer. Sulfur content was determined using a
Leco SC-32 analyzer. Fourier transform infrared (FTIR) spectra were obtained using a Digilab
FTS 45 spectrometer and a diffuse reflectance attachment. A Hitachi S-35000N scanning
electron microscope (SEM) with a Princeton Gamma-Tech (PCT) energy dispersive X-ray
spectrometer (EDS) was used for analysis of selected samples.
266

8
Results and Discussion
Batch reactor results
The chemical reactions that occur in the temperature range 350˚C to 500˚C are crucial to the
subsequent formation of carbons with desirable properties. In traditional carbon formation
processes, there is a competition between condensation and cracking reactions that goes a long
way toward determining the characteristics of the final carbon product (Loison et al., 1989).
Accordingly, in initial work (while the continuous flow reactor was being assembled) we focused
on batch reactions in this temperature range and performed an FTIR analysis of the products. We
found that for reactions of DECS 30 conducted under a zero initial applied pressure of nitrogen:
• After 30 minutes at 400˚C approximately 50% of the aliphatic carbon had been
removed from the coal.
• After 30 minutes at 500˚C approximately 90% of the aliphatic carbon had been
removed from the coal.
• The aromatic hydrogen appeared unaltered in both reactions.
• A band due to carbon disulfide became apparent in the spectrum of the sample
reacted at 500˚C.
A set of experiments was also performed at an initial pressure of 100 psi of nitrogen. This
suppressed the formation of CS2, but surprisingly resulted in the appearance of a carbonyl band,
probably due to an aldehyde, in reactions performed at 500˚C.
Given these initial results, we undertook a systematic set of batch experiments, reacting the
coal with sulfur for 30 minutes at various temperatures under 0 psi initial pressure of nitrogen.
The same coal was also reacted at 500˚C for various times under an initial pressure of 100 psi
nitrogen. Proximate analysis of these samples has been completed; elemental analysis of the
samples is presently being performed.
The moisture content of the carbon products increased sharply with temperature in the
samples reacted for 30 minutes at temperatures in the range 400˚–550˚C, indicating that in
addition to dehydrogenation by sulfur, some condensation reactions have occurred (Loison et al.,
1989):
R OH + R H R R + H2O [1]
The fixed carbon content of these carbons increased with reaction temperature, leveling off at
a value of 73%. The sulfur content of the product diminishes significantly with increasing
temperature, from an initial value of 37% in the coal plus sulfur charge to the reactor, to values
of less than 10% in the sample processed at 550˚C. We anticipated significant sulfur retention in
these batch reactor studies, since the sulfur is necessarily trapped somewhere in the system.
Sulfur incorporation from H2S into coal has been reported (Polansky et al., 1961; Blayden and
Patrick, 1970); but this appears to be significant only at the last stages of reaction (Larsen and Li,
1998; Larsen et al., 2001). The most interesting questions for flow reactor work being what is the
form of this sulfur (e.g., is it residual un-reacted material?), and what is its distribution? These
questions are being addressed in on-going work. Because some of these results are intriguing and
promise to throw light on the mechanism of dehydrogenation, systematic studies involving batch
reactions will still be performed in future work, in order to elucidate the role of carbonyl
formation at intermediate times and temperatures and the mechanism and role of CS2 formation.
267

9
Flow reactor results
Turning now to the initial results obtained using a continuous flow reactor, two sets of
reactions were performed. First, the coal was heated under a flow of nitrogen alone at
temperatures of 500˚C, 600˚C and 700˚C, for one hour. The experiments were then repeated with
sulfur in the reaction vessel (in a separate vessel to the coal), so that dehydrogenation by sulfur
vapor could occur. The reaction conditions and amount of H2S formed (in the latter reactions) are
summarized in Table 1.
There are distinct differences in the visual appearance of the products. We will start by
considering the samples formed by heating in the absence of sulfur. The coal heated to 500˚C
and held at that temperature for one hour passed through the anticipated fluid stage and reformed
into a very, brittle, porous carbonaceous mass that broke into smaller particles on being removed
from the reaction vessel. At 600˚C, the product consisted of two phases. One phase consisted of
large lumps of material that had a coke-like appearance, while the second phase was similar to
that formed at 500˚C. As an example, a picture of these products is shown in figure 2. At 700˚C
only large lumps of material that had a coke like appearance were formed.
FTIR spectra of these samples were obtained. It is important to first note that infrared spectra
cannot be obtained from a highly carbonaceous material like coke; all one obtains is a sharply
sloping baseline and noise. Accordingly, we could not obtain spectra from the coke-like lumps
formed at 700˚C, but did manage to obtain spectra from the smaller, broken-up particles formed
Table1. Summary of experimental results for selected reactions of coal alone and with sulfur vapor.
Run Maximum
temp.
˚C
Time at
tmax.
min
Heat-up
rate.
˚C/min
Heat-up
time.
(min.)
Total
reaction
time.
(min.)
Weight
of coal
charged.
(gm)
H2S,
Produced.
(gm)
Ratio of
produced H2S
to charged coal
Coal 500 60 5 100 165 50.493
Coal 600 60 5 130 190 50.521
Coal 700 60 5 140 210 50.513
Coal
+
Sulfur
500 60 5 100 165 30.453 3.621 0.118
Coal
+
Sulfur
600 60 5 130 190 30.624 3.246 0.106
Coal
+
Sulfur
700 60 5 140 205 30.531 3.725 0.122
Coal
+
Sulfur
600/2h 120 5 130 250 30.548 2.4770 0.161
268
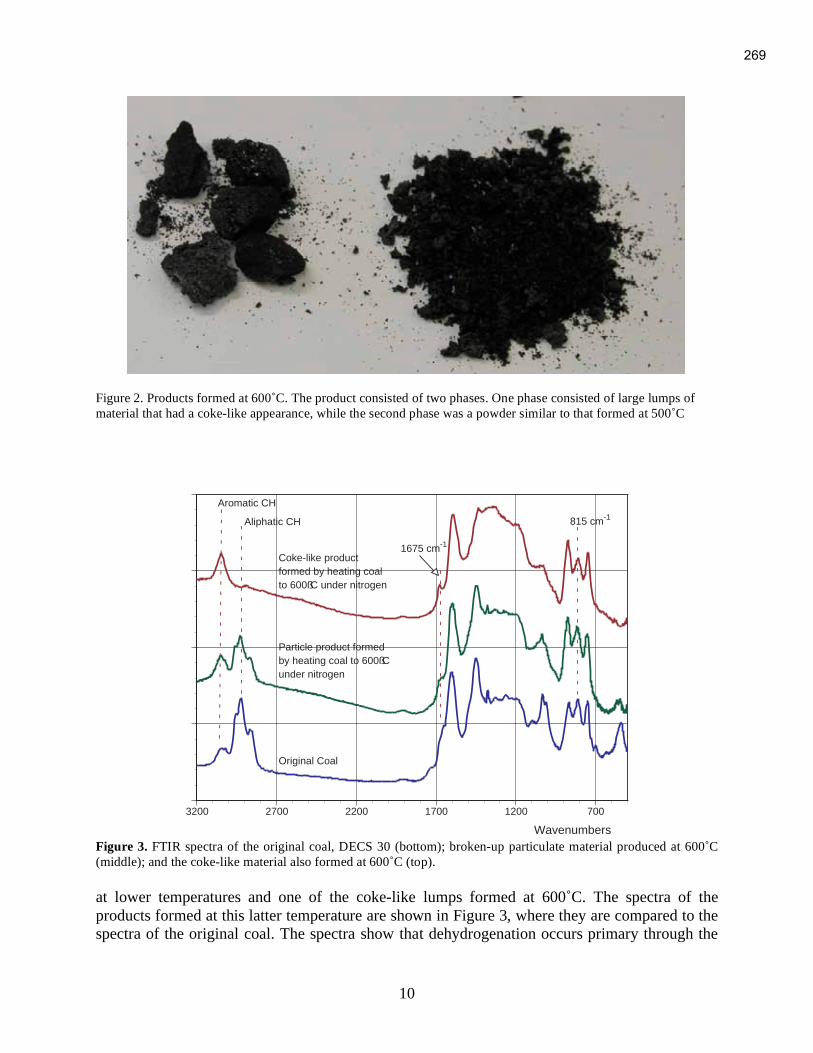
10
Figure 2. Products formed at 600˚C. The product consisted of two phases. One phase consisted of large lumps of
material that had a coke-like appearance, while the second phase was a powder similar to that formed at 500˚C
Figure 3. FTIR spectra of the original coal, DECS 30 (bottom); broken-up particulate material produced at 600˚C
(middle); and the coke-like material also formed at 600˚C (top).
at lower temperatures and one of the coke-like lumps formed at 600˚C. The spectra of the
products formed at this latter temperature are shown in Figure 3, where they are compared to the
spectra of the original coal. The spectra show that dehydrogenation occurs primary through the
3200 2700 2200 1700 1200 700
Aromatic CH
Aliphatic CH
1675 cm-1
Wavenumbers
Original Coal
Particle product formedby heating coal to 600ßCunder nitrogen
Coke-like productformed by heating coalto 600ßC under nitrogen
815 cm-1
269

11
loss of aliphatic CH groups. In the broken-up smaller particle, the aliphatic CH content (as
measured by the stretching modes near 2900 cm-1
) is less than half that of the original coal. In
the coke-like product, the aliphatic stretching modes have essentially been eliminated. The
aromatic CH groups appear to be only slightly affected by heating to this temperature, however.
In addition, a band near 1670 cm-1
, possibly due to quinone- or semiquinone-like structures,
becomes more prominent in the spectra of the products. (This latter mode may also be an
overtone or combination mode of the out-of-plane aromatic CH bending vibrations between 700
cm-1
and 900 cm-1
.) Finally, if the spectra are carefully examined in the 700 cm-1
to 900 cm-1
region of the spectrum, it can be seen that the band at 815 cm-1
, assigned to out-of-plane motions
of two adjacent aromatic CH, groups has a lower relative intensity than its two immediate
neighbors, near 975 cm-1
and 775 cm-1
, assigned to isolated CH vibrations and vibrations of three
adjacent CH groups, respectively. This suggests that such groups, presumably on the edge of
aromatic clusters, are involved in the formation of the larger molecules that, in turn, could lead to
mesophase formation.
The samples dehydrogenated by sulfur at these temperatures had a different character. At
500˚C, a two-phase system consisting of larger lumps of a product with a coke-like appearance
were formed, together with what appeared to be small particles formed by a degree of “melting”
and fusing of the even smaller coal particles originally present. Visually, these have the
appearance of a roughly ground coal. At 600˚C a similar two-phase system was occasionally
observed, although in some experiments the smaller particles were obtained with some larger
lumps. These larger lumps are extremely brittle, unlike the lumps formed in the absence of sulfur
at the same temperature. These can fall apart upon simply being touched. They look like an
agglomeration of bigger particles that are only weakly attached to one another. Similar results
were obtained for samples heated to 700˚C.
Only the FTIR spectra of samples obtained at 500˚C could be obtained and these are shown
in Figure 4, where they are compared to the spectrum of the powder-like product formed at this
temperature in the absence of sulfur.
Comparing these spectra to those shown in Figure 1, it can be seen that in the presence of
sulfur, the extent of dehydrogenation at 500˚C appears comparable to that obtained at higher
temperatures in the absence of sulfur. The fact that spectra of samples obtained by heating to
higher temperature could not be obtained at all also implies that there is a greater degree of
dehydrogenation. This conclusion is supported by the results of proximate analysis, shown in
Table 2, where it can be seen that the amount of fixed carbon is higher in the samples
dehydrogenated in the presence of sulfur.
SEM micrographs of the samples heated in the absence of sulfur are shown in figure 5. The
continuous structure that appears in the micrographs of the coke-like lumps formed by heating in
the absence of sulfur are presumably what one would expect if the coal forms a mesophase
through the condensation of aromatic molecules. Such large, continuous structures are not
formed by sulfur dehydrogenation under these conditions (see below). However, it is worth
noting that the dehydrogenative dimerization or oligomerization of aromatic ring systems with
sulfur can be facilitated in other reaction systems (Short et al., 1936; Fieser and Fieser, 1944;
Whitmore, 1951; Álvarez et al., 1989). Is the extent of condensation limited by sulfur
dehydrogenation? What would happen if we use less sulfur initially, essentially feeding it in a
more piecemeal-like fashion? Clearly, under the conditions used in these initial studies we would
not get the mechanical properties characteristic of a metallurgical coke. However, what is really
270

12
interesting are the particles formed by sulfur dehydrogenation SEM micrographs of these
samples are shown in figure 6.
Figure 4. FTIR spectra of the coke-like product obtained by sulfur dehydrogenation at 500˚C (top),
powder-like product (middle) and, for comparison, the spectrum of the melted porous mass from heating
to 500˙C in the absence of sulfur (bottom).
Table 2. Proximate analysis of carbon products
Run Sample Moistur
e
Volatile
matter
Fixed
carbon
Ash Sulfur
Coal
Coal
500oC
600oC,”coke”
600oC, “particles”
700oC,”coke”
1.93
1.32
1.12
1.23
17.46
15.41
17.01
11.47
76.05
78.76
77.01
83.06
6.49
5.83
5.78
5.47
0.47
0.53
0.58
0.45
Coal +sulfur
500oC, “particles”
500oC,”coke”0.410.49
14.613.75
80.7881.17
4.625.08
4.150.81
0.65 13.89 81.34 4.74 3.10Coal +
Sulfur
600oC “particles”
600oC,”coke” 0.60 12.37 83.01 4.56 0.80
0.63 10.99 84.68 4.33 2.89Coal +
sulfur
700oC, “particles”
700oC, “coke” 0.26 9.89 86.50 4.06 0.75
0.61 12.99 82.45 4.56 3.00Coal +
sulfur
600oC/2h,
particles
600oC/2h,”coke” 0.58 11.98 83.92 4.10 0.76
271

13
Figure 5. SEM of original coal (top left) and clockwise broken-up particles formed at 500˚C, coke-like lumps
formed at 700˚C and coke-like lumps formed at 600˚C.
Figure 6. The SEM of carbon products formed at 500˚C (top two micrographs) and 700˚C (bottom two
micrographs) by sulfur dehydrogenation. On the left side are the micrographs of the coke like lumps cokes, on the
right side are micrographs of the powder or particle fractions.
272

14
Figure 7. Hollow spheres obtained by dehydrogenating coal with sulfur at 700˚C.
The particles formed at 500˚C are smaller and “more solid” than those formed at 700˚C. The
latter appear to be hollow, as shown in Figure 7. The formation of such coke cenospheres has
been discussed by Gray (1989). Their formation is attributed to swelling of plasticized particles
of coal by gases trapped inside the particle. This is particularly the case when the heating of the
coal is relatively rapid and the coal particles are unconfined (Gray and Krupinski, 1997). Hollow
carbon spheres might prove to be useful products and we are proposing to investigate their
properties in future work.
Conclusions
In batch reactions with sulfur, 90% of the aliphatic carbon is removed in 30 minutes’ reaction
time. The aromatic hydrogen does not react at these conditions. Dehydrogenation is accompanied
by condensation reactions that likely involve oxygen functional groups, as indicated by the
formation of water in these reactions. In flow reactor experiments, the extent of dehydrogenation
by sulfur at 500°C appears comparable to that obtained in the absence of sulfur only at much
higher temperatures. This is broadly consistent with the findings of Jusino and Schobert (2006)
who produced a product much like metallurgical coke but at much lower temperatures than in a
conventional coke oven. Flow-reactor tests at 700°C also produced coke cenospheres, which may
have interesting potential applications.
References.
Álvarez, R., Barriocanal, C., Canga, C., Canga, J.S., Diez, M.A., Gaejol, O.M., Miyar, E.A.,
1989. Coke oven gas control by online gas chromatography. Chromatographia. 27, 611-616.
Blayden, H.E., Patrick, J.W., 1970. Studies of organic sulfur in coke: sulfur-carbons formed by
pyrolysis in condensed phases. Fuel. 49, 257-270.
Bloxam, C.L., 1913. Chemistry. Blakiston: Philadelphia; p. 151ff.
Bordwell, F.G., 1963. Organic Chemistry. Macmillan: New York; Chapter 23.
Cox, B.G., Clarke, P.F., Patrick, F., Pruden, B.B., 1998. Economics of thermal dissociation of
H2S to produce hydrogen. Intl. J. Hydrogen Energy. 23. 531-544.
Cram, D.J.; Hammond, G.S., 1964. Organic Chemistry. McGraw-Hill: New York; Chapter 23.
273
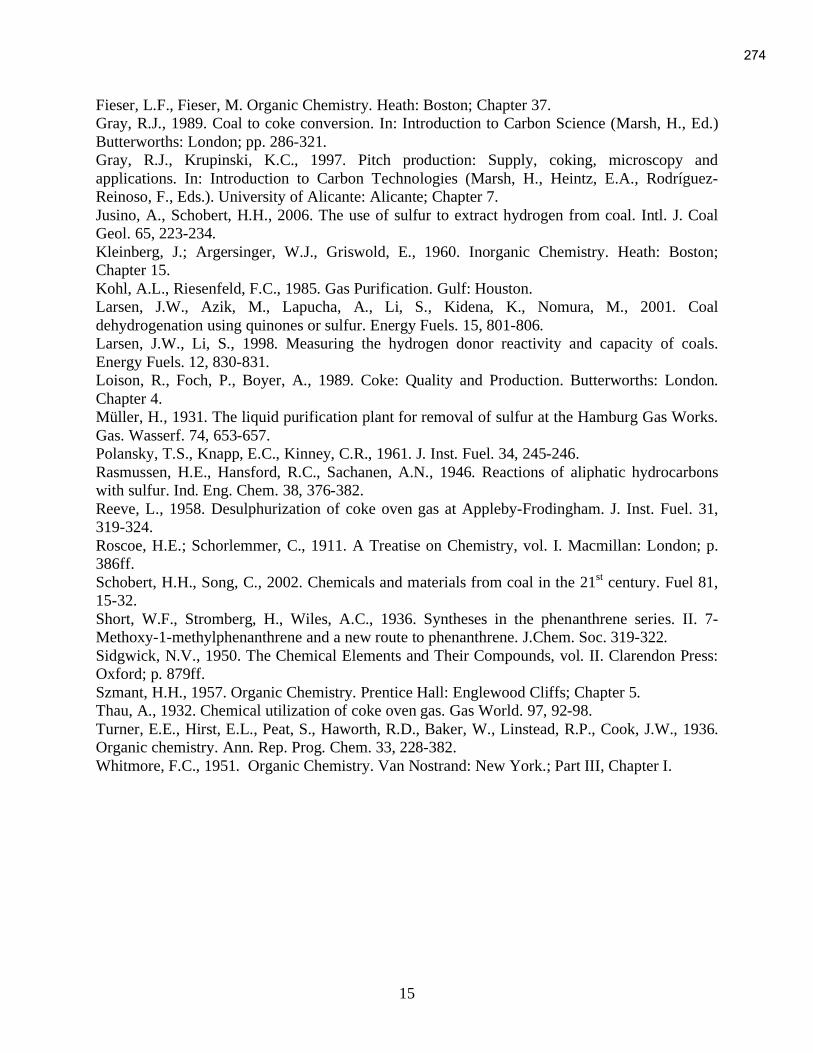
15
Fieser, L.F., Fieser, M. Organic Chemistry. Heath: Boston; Chapter 37.
Gray, R.J., 1989. Coal to coke conversion. In: Introduction to Carbon Science (Marsh, H., Ed.)
Butterworths: London; pp. 286-321.
Gray, R.J., Krupinski, K.C., 1997. Pitch production: Supply, coking, microscopy and
applications. In: Introduction to Carbon Technologies (Marsh, H., Heintz, E.A., Rodríguez-
Reinoso, F., Eds.). University of Alicante: Alicante; Chapter 7.
Jusino, A., Schobert, H.H., 2006. The use of sulfur to extract hydrogen from coal. Intl. J. Coal
Geol. 65, 223-234.
Kleinberg, J.; Argersinger, W.J., Griswold, E., 1960. Inorganic Chemistry. Heath: Boston;
Chapter 15.
Kohl, A.L., Riesenfeld, F.C., 1985. Gas Purification. Gulf: Houston.
Larsen, J.W., Azik, M., Lapucha, A., Li, S., Kidena, K., Nomura, M., 2001. Coal
dehydrogenation using quinones or sulfur. Energy Fuels. 15, 801-806.
Larsen, J.W., Li, S., 1998. Measuring the hydrogen donor reactivity and capacity of coals.
Energy Fuels. 12, 830-831.
Loison, R., Foch, P., Boyer, A., 1989. Coke: Quality and Production. Butterworths: London.
Chapter 4.
Müller, H., 1931. The liquid purification plant for removal of sulfur at the Hamburg Gas Works.
Gas. Wasserf. 74, 653-657.
Polansky, T.S., Knapp, E.C., Kinney, C.R., 1961. J. Inst. Fuel. 34, 245-246.
Rasmussen, H.E., Hansford, R.C., Sachanen, A.N., 1946. Reactions of aliphatic hydrocarbons
with sulfur. Ind. Eng. Chem. 38, 376-382.
Reeve, L., 1958. Desulphurization of coke oven gas at Appleby-Frodingham. J. Inst. Fuel. 31,
319-324.
Roscoe, H.E.; Schorlemmer, C., 1911. A Treatise on Chemistry, vol. I. Macmillan: London; p.
386ff.
Schobert, H.H., Song, C., 2002. Chemicals and materials from coal in the 21st century. Fuel 81,
15-32.
Short, W.F., Stromberg, H., Wiles, A.C., 1936. Syntheses in the phenanthrene series. II. 7-
Methoxy-1-methylphenanthrene and a new route to phenanthrene. J.Chem. Soc. 319-322.
Sidgwick, N.V., 1950. The Chemical Elements and Their Compounds, vol. II. Clarendon Press:
Oxford; p. 879ff.
Szmant, H.H., 1957. Organic Chemistry. Prentice Hall: Englewood Cliffs; Chapter 5.
Thau, A., 1932. Chemical utilization of coke oven gas. Gas World. 97, 92-98.
Turner, E.E., Hirst, E.L., Peat, S., Haworth, R.D., Baker, W., Linstead, R.P., Cook, J.W., 1936.
Organic chemistry. Ann. Rep. Prog. Chem. 33, 228-382.
Whitmore, F.C., 1951. Organic Chemistry. Van Nostrand: New York.; Part III, Chapter I.
274

“TiO2-Coated Activated Carbon” Final Report
Reporting period start: March 2005 Reporting period end: September 2006
Principal Author: David W. Mazyck Date report issued: September 30, 2006
DOE Award Number: 2871-UF-DOE-1874
Submitting organization:
University of Florida PO Box 116450
Gainesville, FL 32611
1
275

DISCLAIMER This report was prepared as an account of work sponsored by an agency of the United States Government. Neither the United States Government nor any agency thereof, nor any of their employees, makes any warranty, express or implied, or assumes any legal liability or responsibility for the accuracy, completeness, or usefulness of any information, apparatus, product, or process disclosed, or represents that its use would not infringe privately owned rights. Reference herein to any specific commercial product, process, or service by trade name, trademark, manufacturer, or otherwise does not necessarily constitute or imply its endorsement, recommendation, or favoring by the United States Government or any agency thereof. The views and opinions of authors expressed herein do not necessarily state or reflect those of the United States Government or any agency thereof.
2
276
ABSTRACT During Quarter 1, several coal-based sorbents were coated with TiO2 using a boil deposition procedure to determine if the physical and/or chemical properties of these sorbents impacted photocatalysis of phenol. It was hypothesized that as the conductivity of a sample increased, so would photocatalysis. Another variable of interest was to assess if the ash content of the samples impacted photocatalysis. Results showed that as the ash content of the samples decreased, the rate of photocatalytic oxidation increased. During Quarter 2, additional batch photocatalysis studies and characterization of the samples were completed. The objective was to learn what constituents of the ash might be responsible for enhancing photocatalytic oxidation of phenol. The results were inconclusive, for the overall performance of the various samples tested under a variety of conditions did not result in performances that were notably different. During Quarter 3, the focus switched from lower surface area carbons to commercially available carbons to investigate the impact morphology, conductivity, and carbon precursor had on phenol removal. All three variables proved to be important variables. During Quarter 4, the focus of the research was on the efficacy of using the TiO2-activated carbon in an in-situ regenerative system whereby the TiO2-activated carbon would adsorb phenol and then, once exhausted, be exposed to UV irradiation to regenerate the activated carbon surface. Results indicated that this approach was plausible, but the mechanism of regeneration is first desorption of the phenol proceeded by oxidation.
3
277

TABLE OF CONTENTS DISCLAIMER .................................................................................................................... 2 ABSTRACT........................................................................................................................ 3 TABLE OF CONTENTS.................................................................................................... 4 LIST OF TABLES.............................................................................................................. 5 LIST OF FIGURES ............................................................................................................ 6 EXECUTIVE SUMMARY ................................................................................................ 7 INTRODUCTION .............................................................................................................. 8 EXPERIMENTAL.............................................................................................................. 9 RESULTS AND DISCUSSION....................................................................................... 10 CONCLUSIONS............................................................................................................... 43 REFERENCES ................................................................................................................. 44 PAPERS PUBLISHED FROM RESEARCH................................................................... 45 PRESENTATIONS FROM RESEARCH ........................................................................ 45
4
278

LIST OF TABLES Table 1 - Comparison of raw material properties. .............................................................. 9 Table 2 - Electrical conductivity values for low surface area carbons ............................. 15 Table 3 - Elemental carbon and ash contents of low surface area carbons....................... 15 Table 4 - Average densities of 3% (m/m) titania coated carbons ..................................... 19 Table 5 - Summary of coating techniques ........................................................................ 23 Table 6 - Ash contents of ACs and mass % of titania deposited (m/m) on AC surface ... 24
5
279

LIST OF FIGURES Figure 1 - Comparison of selected samples for oxidation of phenol when coated with 3%
TiO2 (wt/wt) and added to the phenol solution on a mass basis. .............................. 11 Figure 2 - Comparison of pitch coke and graphite coated with 3% (by mole) and added to
the phenol solution on a volume basis. ..................................................................... 12 Figure 3 - Comparison of pitch coke samples that have been acid-washed for various
times. ......................................................................................................................... 13 Figure 4 - EDS scan of ash residue of uncoated anthracite coal ..................................... 16 Figure 5 - EDS scan of ash residue of uncoated bituminous coal.................................... 16 Figure 6 - EDS scan of ash residue of pitch coke............................................................. 17 Figure 7 - Adsorption studies of coated low surface area carbons and titania slurry ..... 18 Figure 8 - Batch photocatalysis studies of carbons and titania slurry (m/m) .................. 19 Figure 9 - Photocatalysis studies of titania-coated low surface area carbons in the
presence of UV (m/v) ................................................................................................ 20 Figure 10 - Photocatalysis studies of titania-coated low surface area carbons in the
presence of UV (mol/v) ............................................................................................. 21 Figure 11 - EDS of A) ash residue of uncoated Bionuchar, B) Bionuchar coated with
TiO2, C) ash residue of uncoated F400, D) F400 coated with TiO2, E) ash residue of uncoated HD4000, F) HD4000 coated with TiO2 .................................................... 26
Figure 12 - Titania coated Bionuchar with the TiO2 blocked pores circled .................... 28 Figure 13 - Bionuchar showing cellulose structure of the wood based AC ..................... 29 Figure 14 - Titania coated on the surface of F400 ........................................................... 30 Figure 15 - TiO2 agglomerate (shown circled) near a macropore on the surface of
HD4000..................................................................................................................... 31 Figure 16 - Surface of HD4000 showing uniform coating of TiO2 which tends to form
agglomerates............................................................................................................. 32 Figure 17 - Batch adsorption studies of virgin ACs in the absence of UV ....................... 33 Figure 18 - Batch adsorption studies of 3% (m/m) coated ACs in the dark compared to
TiO2 slurries.............................................................................................................. 34 Figure 19 - Batch adsorption-photocatalysis studies of 3% (m/m) coated ACs in the
presence of UV .......................................................................................................... 36 Figure 20 - Batch adsorption-photocatalysis studies of 3% (m/m) coated ACs loaded to
the reactors on a volume basis in the presence of UV .............................................. 38 Figure 21 - Batch adsorption studies: A) 3% (mol/mol) coated ACs in the absence of UV
loaded to the reactors by volume, B) Photocatalysis studies of 3% (mol/mol) coated ACs in the presence of UV loaded to the reactors on a volume basis ...................... 39
Figure 22 - Comparison of virgin and regenerated carbon for phenol removal.............. 41 Figure 23 - With and without UV regeneration (packed bed) .......................................... 42 Figure 24 - With and without UV (bubbling bed)............................................................. 42 Figure 25 - With and without UV (fluidized bed) ............................................................. 43
6
280

EXECUTIVE SUMMARY The ultimate goal of the proposed research program was to develop a cost-effective and reliable air emission control system. The focus of the research was the manufacture and testing of a composite material consisting of activated carbon coated with a photocatalyst, titanium dioxide (TiO2); herein referred to as titania-coated activated carbon. Activated carbon has been shown to be effective in removing synthetic organic chemicals (SOCs), volatile organic compounds (VOCs), and hazardous air pollutants (HAPs) from various sources, and its effectiveness is attributed to its high surface area (e.g., typically greater than 600 m2/g) and tunable surface chemistry. Despite its ability to effectively adsorb organic compounds, activated carbon does have a finite service life, and, once exhausted, regeneration is necessary to return it back, or as close as possible, to its initial capacity. The proposed system accomplishes regeneration by photocatalytically oxidizing sorbed pollutants via irradiation of the TiO2 coating. While the applications for air treatment are clear, of equal importance is its use in the purification of water where traditional treatment practices are unacceptable (e.g., space missions, military maneuvers, developing nations, disaster response, etc.). Therefore, this research contributed to the CPCPC mission through the development of a premium material manufactured from coal suitable for solving a plethora of environmental problems. The objectives of the research program were: Objective 1: Identify why the adsorption/oxidation behavior of irradiated titania-activated carbon composites differ depending upon the core carbon material, as shown in previous studies. Objective 2: Develop and optimize a titania coating procedure that (a) uniformly coats the carbon and (b) does not hinder adsorption.
Objective 3: Apply the fundamentals learned from Objectives 1 and 2 to produce a coal-based titania-activated carbon (coal raw material collected from West Virginia from a prior CPCPC project) to demonstrate the efficacy of commercialization. Research activities focused on fundamentally understanding the 3 objectives. A host of analytical techniques were employed to quantify carbon’s characteristics that explain why one particular carbon worked better than others. Afterwards, three titania coating strategies were employed and the resulting titania-activated carbons were characterized. Finally, titania-activated carbons manufactured from West Virginia coal were produced to demonstrate the efficacy of manufacturing possibilities.
7
281

INTRODUCTION Currently, various volatile organic compounds (VOCs) and hazardous air pollutants (HAPs), for example methanol, formaldehyde, acetaldehyde, and methyl ethyl ketone (MEK), are emitted into the atmosphere from industrial sources such as pulp and paper mills and the automotive industry. The Environmental Protection Agency (EPA) has mandated that these industries develop and implement air emission control strategies by December 2006 to control the current release of these potentially harmful organic chemicals.
The goal of the proposed research program herein is to develop a cost-effective and reliable air emission control system. The focus of the research is a composite material of activated carbon coated with a photocatalyst, titanium dioxide (TiO2); herein referred to as titania-coated activated carbon. Activated carbon has been shown to be effective in removing SOCs, VOCs, and HAPs from various sources, and its effectiveness is attributed to its high surface area (e.g., typically greater than 600 m2/g) and tunable surface chemistry. For example, the Department of Defense chose to use activated carbon to remove VOCs and HAPs, such as MEK and methyl isobutyl ketone (MIBK), from military paint spray booths in Barstow, CA (Cannon et al. 1996). Despite its ability to effectively adsorb organic compounds, activated carbon does have a finite service life, and, once exhausted, regeneration is necessary to return it to (or as close as possible to) its initial capacity. Typically, regeneration is performed ex-situ by exposing the carbon to high temperatures in an oxidizing environment. To minimize the down time due to regeneration and lower the energy requirements and costs associated with ex-situ regeneration, a goal of this work is to coat the activated carbon with a photocatalyst and use UV light to regenerate the carbon in-situ. In traditional thermal or microwave regeneration, pollutants are simply desorbed. Regeneration in the proposed system is achieved by photocatalytic oxidation of pollutants (Sadeghi et al. 1996; Wu et al. 1998), thus no post-treatment is needed for desorbed pollutants. Additionally, titania can photocatalytically oxidize high molecular weight organics, hence preventing the glazing coating problem commonly encountered in an adsorption bed (Fujii et al. 1997).
Many researchers (Torimoto et al. 1996, Tryba et al. 2003, Tsumura et al. 2002), including some preliminary studies by the PI (Khan et al. 2002), have focused their attention towards titania-coated activated carbon. However, even though there is great interest in this composite material and there are numerous applications for this technology, to the PI’s knowledge, titania-coated activated carbon is currently not manufactured by any carbon manufacturer throughout the world. This is likely true because (a) carbon properties (e.g., surface chemistry, pore size distribution, ash content, etc.) that are best suited for this application are unknown, (b) the coating techniques discussed in the literature lack details, thereby preventing reproducibility, and (c) there is not a full understanding of how to design a system that could utilize this composite. Therefore, this work set out to solve the first two of these fundamental questions.
8
282

EXPERIMENTAL Pitch coke, graphite, anthracite, and lignite samples were collected from Asbury Graphite Mills, Inc. and were subsequently coated with titania. These materials were chosen because of their variation in electrical conductivity and low surface area. Low surface area was desired because it was of interest to investigate just photocatalysis versus photocatalysis and adsorption. Table 1 lists the BET surface areas, carbon content, ash content, and relative conductivity for each sample.
Table 1 - Comparison of raw material properties.
Sample Carbon Content
(%)
Ash % Density1 (g/mL)
Conductivity2 (S/cm)
BET Surface
Area (m2/g) Pitch Coke 93.5 6.5 2.13 331.7 <10 Graphite 99.4 0.6 2.51 197 <10 Anthracite 89.7 10.3 1.85 50.4 <10 Lignite 74.3 25.7 1.76 NA <10 1When coated with 3% by mole TiO22Literature derived values TiO2 Coating Procedure: The carbons were coated with TiO2 via the following procedure:
1. The sample is first washed with DI water. 2. The sample (approximately 2-4 grams) along with the TiO2 (3% by mass) is
placed in a 250 mL Erlenmeyer flask. Adding the TiO2 on a mole basis was also investigated.
3. Approximately 200-220 mL of DI water is poured into the Erlenmeyer flask. 4. The mixture is then placed on a hot plate and allowed to boil until all the water
has been evaporated. 5. The flask is then placed in an oven (105 ºC) for at least 12 hours to remove any
residual water that may be present.
Phenol Batch Photocatalytic Oxidation Studies: Mass Basis: During the boil deposition step, the TiO2 was added to the carbon so that its mass was 3% of the mass of each of the carbons used. After the boil deposition step, 80 mg of each carbon which was now coated with 3% (w/w) of TiO2 was placed in its respective reactor. The reactors consisted of 100 mL syringes. In addition to the TiO2 carbons, 80 mL of phenol solution (~ 60ppm) was also added to each reactor. The reactors were then supported on a rotator capable of supporting 4 reactors at a time. The entire setup consisting of the reactors and the rotator was surrounded by 3 UV lamps (365 nm), 120° apart which were at a minimum distance of 1 cm from the reactors.
9
283

Experiments were carried out for 24 hrs after which the final concentration of phenol in each reactor was determined via GC/MS. Similar experiments were also carried out without the presence of UV in order to observe the amount of pure adsorption of phenol to each sample. Mole Basis: For coating the carbon with TiO2 on a mole basis, the amount of elemental carbon (C) in each sample was found (Table 1) by performing an ash analysis in which the carbon samples were heated to 575 – 600 °C for 4 hours . The difference between the initial mass and the final mass (of the ash) provided the amount of elemental carbon in each sample. With the amount of carbon per sample known, the carbon samples were coated with TiO2 by the boil deposition procedure introduced above. However, the samples were coated on a mole/mole basis. Hence, each carbon was coated with TiO2 such that the number of moles of TiO2 was 3% of the number of moles of elemental carbon in the sample. This was done to normalize the carbon to titania ratio in each sample. Another difference in this experiment was the fact that the TiO2 coated carbons were added to the reactors on a volume basis as opposed to a mass basis. Hence, each reactor contained 0.05 mL of the respective sample as opposed to a fixed mass. The remainder of the experimental procedure remained the same as above. The pitch coke, graphite, anthracite, and lignite samples that were collected from Asbury Graphite Mills, Inc., and were subsequently coated with titania. These materials were chosen because of their variation in electrical conductivity and low surface area. Low surface area was desired because it was of interest to investigate just photocatalysis verses photocatalysis and adsorption. Table 1 lists the BET surface areas, carbon content, ash content, and relative conductivity for each sample.
RESULTS AND DISCUSSION Preliminary research with activated carbon manufactured from different coal precursors demonstrated that the oxidation of phenol was quite different for each sample. However, because it was not possible to separate whether the phenol was simply being adsorbed or adsorbed and oxidized in these previous studies, it was desired to study the raw materials that were used to create the activated carbons. Using the bituminous coal and anthracite coal samples that were coated with TiO2 (3% by wt), they were tested for their ability to oxidize 60 ppm of phenol over 24 hours. Figure 1 demonstrates that the titania-coated bituminous coal performed significantly better than the anthracite coated sample. Also included is how the bituminous coated sample performed in the absence of UV (i.e., adsorption only). The data indicates that very little of the phenol removal can be contributed to adsorption.
10
284

0
10
20
30
40
50
60
Con
cent
ratio
n (p
pm)
Initial Concentration
Bituminous with UV
Bituminous without UV
Anthracite with UV
Figure 1 - Comparison of selected samples for oxidation of phenol when coated with 3% TiO2 (wt/wt) and added to the phenol solution on a mass basis. Because the densities of the samples are different (Table 1), it was of interest to compare the photocatalytic effectiveness of the samples when they were coated on a molar basis and added to the water volumetrically versus gravimetrically. Figure 2 plots the percent removal via photocatalysis for the pitch coke and graphite samples, and although not shown the performance of the anthracite coated sample was very similar.
11
285
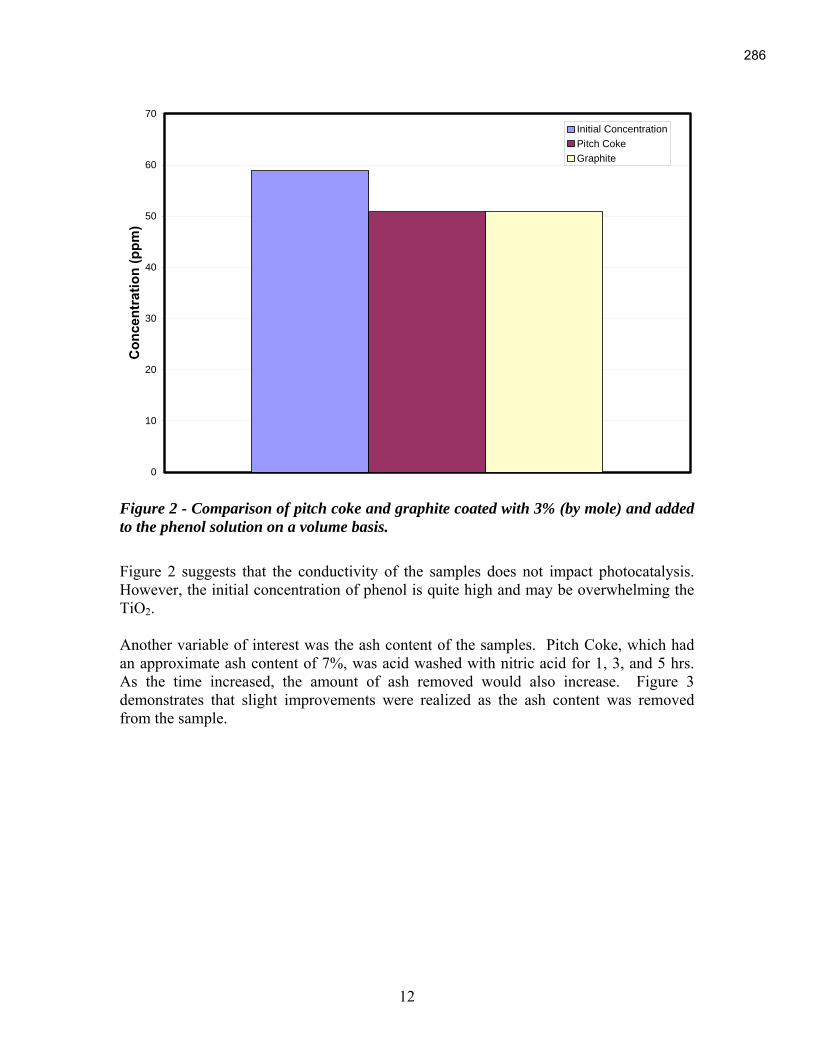
0
10
20
30
40
50
60
70
Con
cent
ratio
n (p
pm)
Initial Concentration
Pitch Coke
Graphite
Figure 2 - Comparison of pitch coke and graphite coated with 3% (by mole) and added to the phenol solution on a volume basis.
Figure 2 suggests that the conductivity of the samples does not impact photocatalysis. However, the initial concentration of phenol is quite high and may be overwhelming the TiO2. Another variable of interest was the ash content of the samples. Pitch Coke, which had an approximate ash content of 7%, was acid washed with nitric acid for 1, 3, and 5 hrs. As the time increased, the amount of ash removed would also increase. Figure 3 demonstrates that slight improvements were realized as the ash content was removed from the sample.
12
286
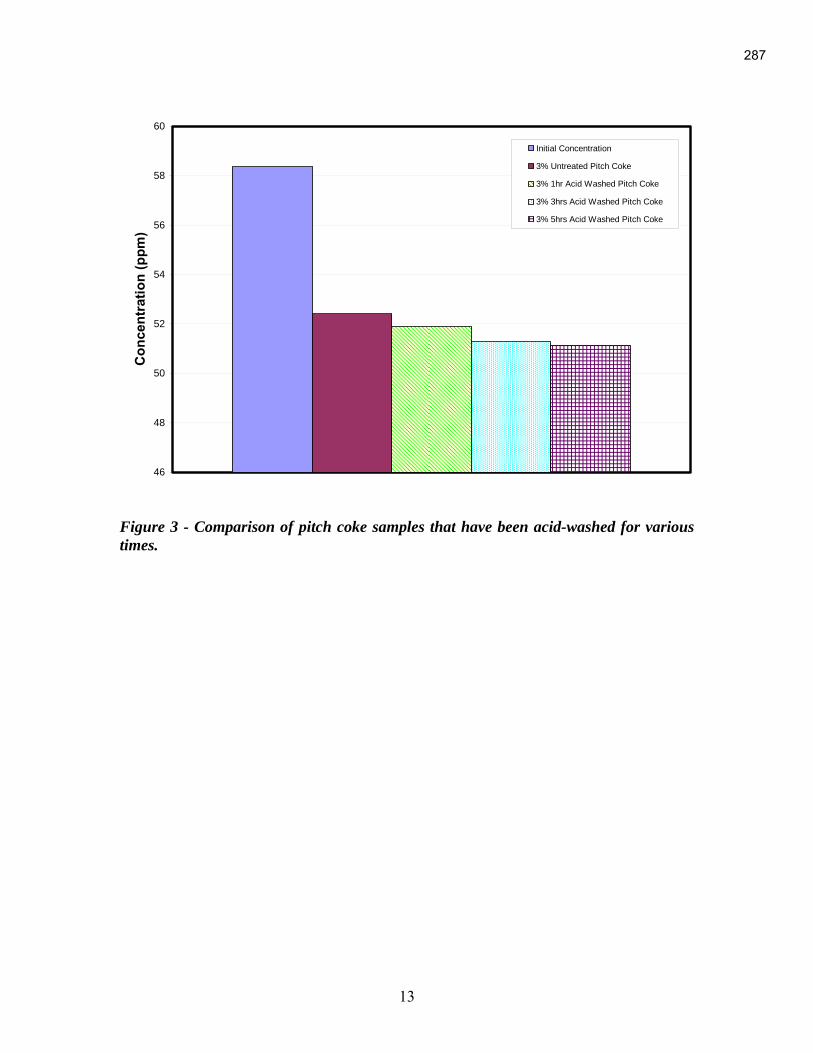
46
48
50
52
54
56
58
60
Con
cent
ratio
n (p
pm)
Initial Concentration
3% Untreated Pitch Coke
3% 1hr Acid Washed Pitch Coke
3% 3hrs Acid Washed Pitch Coke
3% 5hrs Acid Washed Pitch Coke
Figure 3 - Comparison of pitch coke samples that have been acid-washed for various times.
13
287

During first quarter activity, high carbon content materials (e.g., bituminous coal, anthracite coal, and pitch coke) were coated with TiO2 and subsequently tested for their ability to oxidize phenol (ca. 55 mg/L) via photocatalysis. During the second quarter, similar batch studies were undertaken. The multitude of variables observed in the performance of activated carbons (ACs) with respect to adsorption and photocatalysis led to the investigation of carbon substrates having low surface areas in order to separate adsorption affects from other carbon properties that may impact photocatalysis. By selecting a variety of carbons with different properties that were hypothesized to be conducive or inhibitive to photocatalysis, it would be possible to relate these specific properties of the carbons to the synergy observed with some activated carbons. As hypothesized by Khan (2003), the reason for the superior photocatalytic performance of certain titania-coated ACs is the presence of ionic metals. These metals act as electron sinks, which hinder electron-hole recombinations, thus enhancing photocatalysis. As interpreted by this author, enhanced photocatalytic activity is a function of electrical conductivity primarily due to specific sites on the carbon surface where metals are present. In theory, the presence of titania in the vicinity of a conductive site (metal) will result in a favorable difference in Fermi energies between the titania and the metal. The resulting effect is the change in the distribution of electrons of the semiconductor (titania). The formation of the Schottky barrier will cause the migration of electrons from the titania to the metal, increasing the electron-hole recombination times and therefore enhancing photocatalysis. Thus, to further test whether conductivity and metals play a role in enhancing photocatalysis, low surface area carbons (< 10 m2/g) with varying conductivities were chosen. It should be noted that, in general, the addition of conductive materials to semiconductors or insulators has a positive impact on their conductivity. This property may be approximated as a summation of the conductivities of the materials involved. However, at the same time, it is important to note that metals content is by no means the sole factor influencing electrical conductivity. In the case of graphite, a major influence of its electrical conductivity is its crystalline structure. Crystalline graphite consists of parallel sheets of carbon atoms, each sheet containing hexagonal arrays of carbon atoms. Each carbon atom exhibits sp2 hybridization and forms sigma bonds with its three nearest neighbors. There is also distributed pi bonding between the carbon atoms in the sheet. This delocalized pi system is responsible for the electrical conductivity of graphite. The disruption of this graphitic structure is the cause for a loss in electrical conductivity in carbonaceous materials. With this in mind, carbon materials having varying electrical conductivities were selected. The carbons selected for the studies were graphite, pitch coke, bituminous coal and anthracite coal. The gradient in electrical conductivity between the selected carbons, graphite being the highest and bituminous the lowest is shown in Table 2. These conductivities were measured as resistivities by compacting the carbons in a column at pressures between 125-150 psi and measuring their resistivity to charge (Data provided by Asbury Carbons, NJ). Hence the resistance of the compacted powdered carbons was measured and obtained, which was then easily translated to electrical conductivity by the reciprocal of the resistivity.
14
288
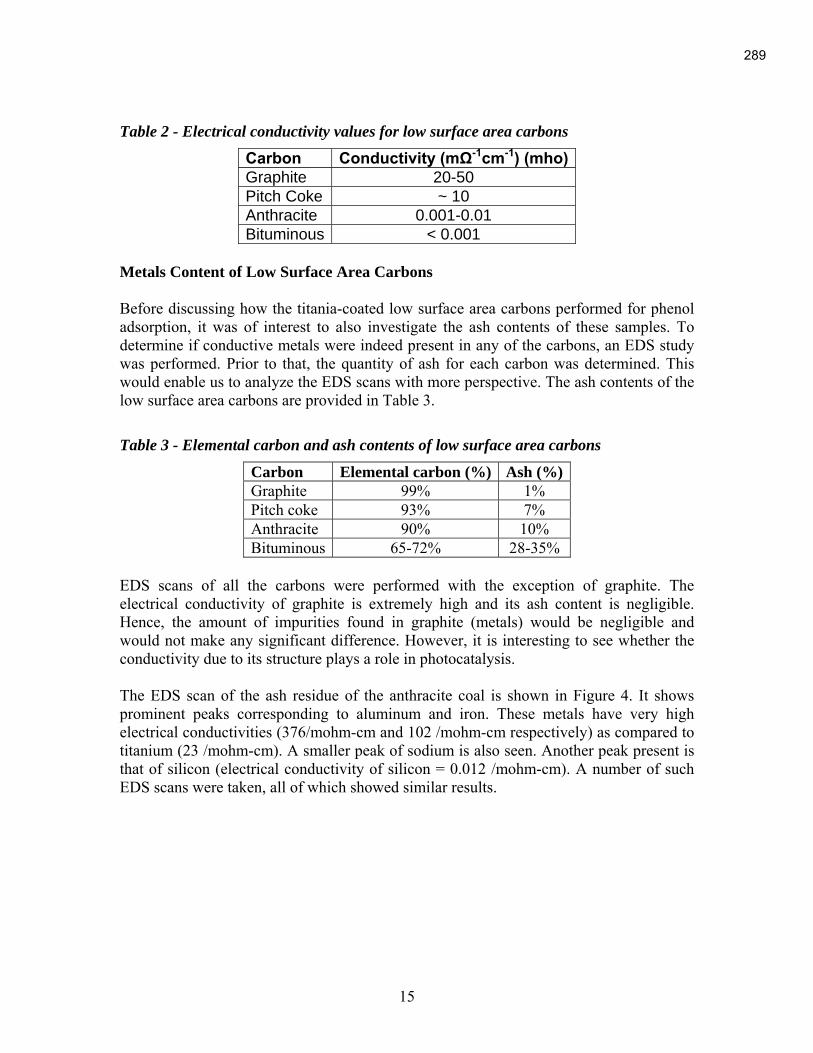
Table 2 - Electrical conductivity values for low surface area carbons
Carbon Conductivity (mΩ-1cm-1) (mho)Graphite 20-50
Pitch Coke ~ 10
Anthracite 0.001-0.01
Bituminous < 0.001
Metals Content of Low Surface Area Carbons Before discussing how the titania-coated low surface area carbons performed for phenol adsorption, it was of interest to also investigate the ash contents of these samples. To determine if conductive metals were indeed present in any of the carbons, an EDS study was performed. Prior to that, the quantity of ash for each carbon was determined. This would enable us to analyze the EDS scans with more perspective. The ash contents of the low surface area carbons are provided in Table 3.
Table 3 - Elemental carbon and ash contents of low surface area carbons
Carbon Elemental carbon (%) Ash (%)Graphite 99% 1% Pitch coke 93% 7% Anthracite 90% 10% Bituminous 65-72% 28-35%
EDS scans of all the carbons were performed with the exception of graphite. The electrical conductivity of graphite is extremely high and its ash content is negligible. Hence, the amount of impurities found in graphite (metals) would be negligible and would not make any significant difference. However, it is interesting to see whether the conductivity due to its structure plays a role in photocatalysis.
The EDS scan of the ash residue of the anthracite coal is shown in Figure 4. It shows prominent peaks corresponding to aluminum and iron. These metals have very high electrical conductivities (376/mohm-cm and 102 /mohm-cm respectively) as compared to titanium (23 /mohm-cm). A smaller peak of sodium is also seen. Another peak present is that of silicon (electrical conductivity of silicon = 0.012 /mohm-cm). A number of such EDS scans were taken, all of which showed similar results.
15
289
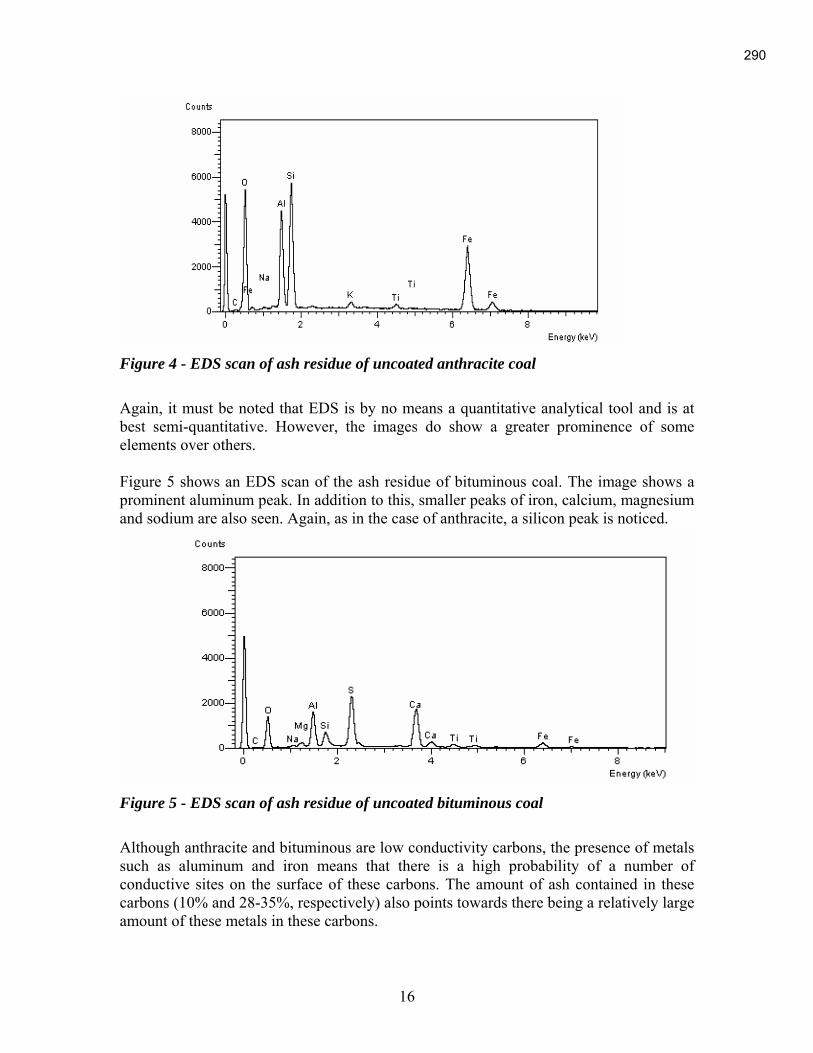
Figure 4 - EDS scan of ash residue of uncoated anthracite coal Again, it must be noted that EDS is by no means a quantitative analytical tool and is at best semi-quantitative. However, the images do show a greater prominence of some elements over others. Figure 5 shows an EDS scan of the ash residue of bituminous coal. The image shows a prominent aluminum peak. In addition to this, smaller peaks of iron, calcium, magnesium and sodium are also seen. Again, as in the case of anthracite, a silicon peak is noticed.
Figure 5 - EDS scan of ash residue of uncoated bituminous coal Although anthracite and bituminous are low conductivity carbons, the presence of metals such as aluminum and iron means that there is a high probability of a number of conductive sites on the surface of these carbons. The amount of ash contained in these carbons (10% and 28-35%, respectively) also points towards there being a relatively large amount of these metals in these carbons.
16
290
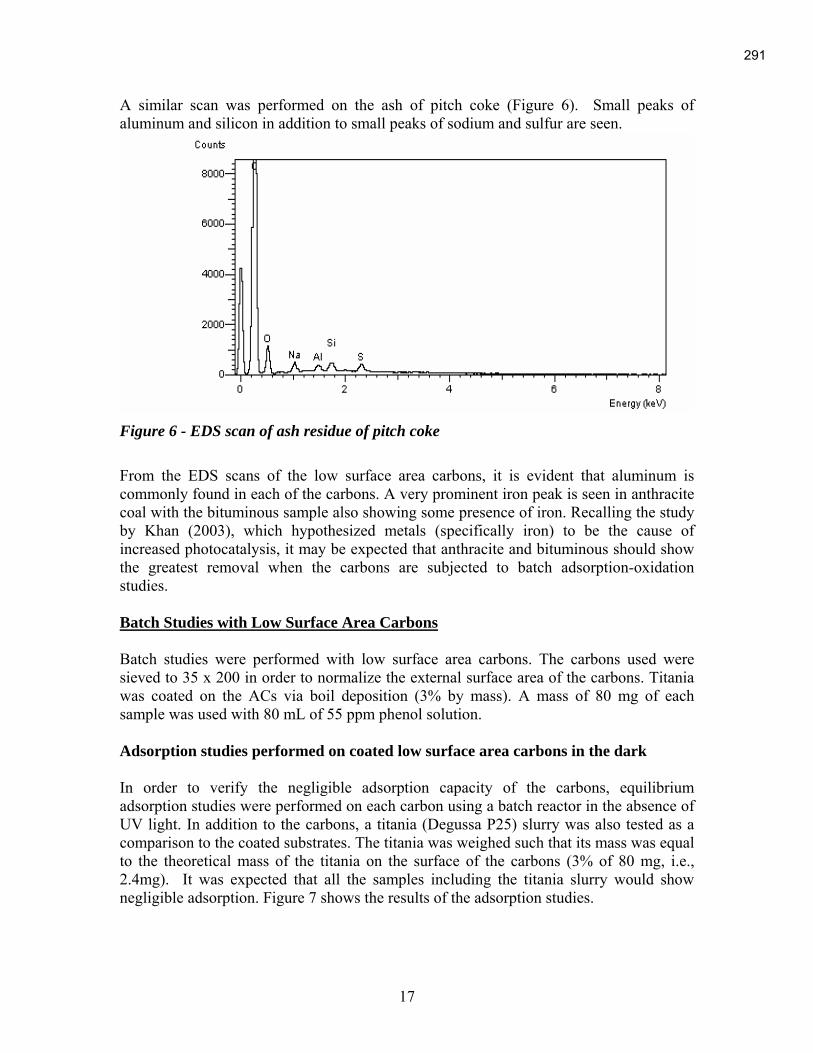
A similar scan was performed on the ash of pitch coke (Figure 6). Small peaks of aluminum and silicon in addition to small peaks of sodium and sulfur are seen.
Figure 6 - EDS scan of ash residue of pitch coke
From the EDS scans of the low surface area carbons, it is evident that aluminum is commonly found in each of the carbons. A very prominent iron peak is seen in anthracite coal with the bituminous sample also showing some presence of iron. Recalling the study by Khan (2003), which hypothesized metals (specifically iron) to be the cause of increased photocatalysis, it may be expected that anthracite and bituminous should show the greatest removal when the carbons are subjected to batch adsorption-oxidation studies. Batch Studies with Low Surface Area Carbons
Batch studies were performed with low surface area carbons. The carbons used were sieved to 35 x 200 in order to normalize the external surface area of the carbons. Titania was coated on the ACs via boil deposition (3% by mass). A mass of 80 mg of each sample was used with 80 mL of 55 ppm phenol solution.
Adsorption studies performed on coated low surface area carbons in the dark In order to verify the negligible adsorption capacity of the carbons, equilibrium adsorption studies were performed on each carbon using a batch reactor in the absence of UV light. In addition to the carbons, a titania (Degussa P25) slurry was also tested as a comparison to the coated substrates. The titania was weighed such that its mass was equal to the theoretical mass of the titania on the surface of the carbons (3% of 80 mg, i.e., 2.4mg). It was expected that all the samples including the titania slurry would show negligible adsorption. Figure 7 shows the results of the adsorption studies.
17
291
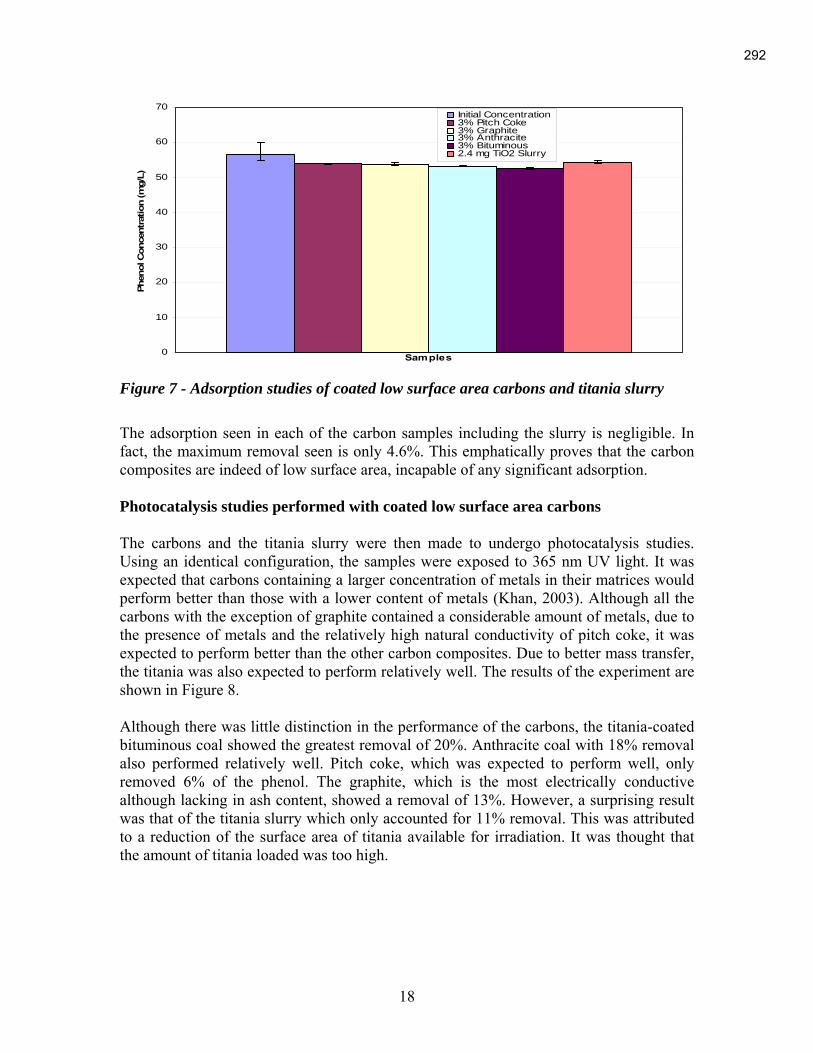
0
10
20
30
40
50
60
70
Samples
Phen
ol C
once
ntra
tion
(mg/
L)
Initial Concentration3% Pitch Coke3% Graphite3% Anthracite3% Bituminous2.4 mg TiO2 Slurry
Figure 7 - Adsorption studies of coated low surface area carbons and titania slurry The adsorption seen in each of the carbon samples including the slurry is negligible. In fact, the maximum removal seen is only 4.6%. This emphatically proves that the carbon composites are indeed of low surface area, incapable of any significant adsorption. Photocatalysis studies performed with coated low surface area carbons The carbons and the titania slurry were then made to undergo photocatalysis studies. Using an identical configuration, the samples were exposed to 365 nm UV light. It was expected that carbons containing a larger concentration of metals in their matrices would perform better than those with a lower content of metals (Khan, 2003). Although all the carbons with the exception of graphite contained a considerable amount of metals, due to the presence of metals and the relatively high natural conductivity of pitch coke, it was expected to perform better than the other carbon composites. Due to better mass transfer, the titania was also expected to perform relatively well. The results of the experiment are shown in Figure 8. Although there was little distinction in the performance of the carbons, the titania-coated bituminous coal showed the greatest removal of 20%. Anthracite coal with 18% removal also performed relatively well. Pitch coke, which was expected to perform well, only removed 6% of the phenol. The graphite, which is the most electrically conductive although lacking in ash content, showed a removal of 13%. However, a surprising result was that of the titania slurry which only accounted for 11% removal. This was attributed to a reduction of the surface area of titania available for irradiation. It was thought that the amount of titania loaded was too high.
18
292

0
10
20
30
40
50
60
70
Samples
Phe
nol C
once
ntra
tion
(mg/
L)Initial Concentration3% Pitch Coke3% Graphite
3% Anthracite3% Bituminous2.4 mg TiO2 Slurry
Figure 8 - Batch photocatalysis studies of carbons and titania slurry (m/m)
Hence for the specific configuration of the reactor, the titania concentration in the slurry was greater than the optimal loading, causing low penetration of UV through the slurry. Comparing the oxidation studies to the adsorption studies in the absence of UV, it is evident that there is photocatalysis taking place. A comparison between the carbon-titania particles shows no trend with respect to conductivity or metals content in their ash residues. However, a trend was noticed in the difference in performances being similar to the carbons’ differences in densities. Due to this, the volume of carbons and hence the amount of titania in each reactor would be different. Higher density would result in a smaller volume of that particular carbon resulting in a lower titania dose in the respective reactor. Table 4 summarizes the densities of the coated carbons.
Table 4 -Average densities of 3% (m/m) titania coated carbons
Carbon Densityg/m3
Bituminous 1.37 Anthracite 1.93 Pitch coke 2.25 Graphite 2.58
From Table 4 it can be seen that bituminous coal and anthracite coal are the two carbons with the least density. This difference in density is reflected in the difference seen between the performances of the carbons. Since the adsorption capacities for all the carbons were negligible, the coated carbons were loaded on the basis of volume in order to normalize the volumes and titania loaded to each reactor. This was expected to
19
293

magnify differences in phenol decomposition between the carbons. The following graph shows the results of the batch studies in which the carbons were coated with titania on the basis of mass and loaded to the reactors such that their volumes equaled 0.05 mL. This set, shown in Figure 9, is referred to as ‘mass-volume’ or ‘m/v’.
0
10
20
30
40
50
60
70
Samples
Phen
ol C
once
ntra
tion
(mg/
L)
Initial Concentration
3% Pitch Coke
3% Graphite
3% Anthracite
3% Bituminous
Figure 9 - Photocatalysis studies of titania-coated low surface area carbons in the presence of UV (m/v) To further verify these results and normalize the amount of carbon and titania in each reactor, tests were performed using a molar basis for coating the carbons with titania. This basis consists of coating the carbons such that the mole ratio of titania to carbon is 3%. The carbons were then loaded to their reactors on the basis of volume as in the earlier case (0.05 mL). This set of samples has been referred to as ‘mole-volume’ or ‘mol/v’. The results from these tests which were otherwise performed in an identical manner to the previous batch tests are shown in Figure 10. For the mass-volume and the mole-volume sets, it was deemed unnecessary to perform control studies in the absence of UV light as the carbons contained no internal pore structure. Hence, a higher concentration of TiO2 coated on the carbon surface would not make any noticeable difference to adsorption. The results from these tests showed a slight increase (less than 2%) in the photocatalytic degradation of phenol. However, this was seen in all the samples, resulting again in no significant distinction between the samples.
20
294

0
10
20
30
40
50
60
70
Sample
Phen
ol C
once
ntra
tion
(mg/
l)Initial Concentration
3% Pitch Coke
3% Graphite
3% Anthracite
3% Bituminous
Figure 10 - Photocatalysis studies of titania-coated low surface area carbons in the presence of UV (mol/v)
The influence of metals on photocatalysis was also questioned as clearly, there was no distinction seen in photocatalysis between the carbons even though they differed in the content and composition of metals. It may be noticed that the performances of the ACs with the exception of the ‘mole-volume’ samples which showed a slight increase in performance, remains relatively constant. The only considerable distinction can be made in the case of the ‘mass-mass’ carbons. However, this has been explained by the differences in their densities. It is evident from these studies that when titania is coated on a substrate such as carbon, adsorption plays a very important role. More importantly, what is shown by the low surface area carbon tests is that as previously hypothesized by this author, conductivity may not play any significant role in the enhancement of photocatalysis. Even though carbons were selected whose conductivities varied by orders of magnitude, there was no significant effect or even any trend that was noticed in the performance of the titania-coated carbons. Hence, the conclusion by Khan (2003) about metals such as iron enhancing photocatalysis due to their role as electron traps is uncorroborated. At the same time, the theory by Matos et al. (2001) regarding the synergy seen in the case of titania systems containing H-type ACs is also unsubstantiated. Furthermore, the experiments conducted with the AC composites and the low surface area carbonaceous composites show that a slight synergy may be noticed in titania-AC composites, primarily driven by adsorption. The difference in the electrical conductivities of the low surface area substrates did not show any considerable synergy.
21
295

Evaluation of Carbon Coating Strategies Titanium dioxide was coated on the activated carbons using 4 different coating techniques: boil deposition, pore volume impregnation (PVI), chemical attachment, and mechanical attachment.
Boil deposition was by far the easiest and most convenient coating technique as it required using a commercially available TiO2 (Degussa P25), water and heat. It was nevertheless a very inconsistent and unpredictable coating method as the TiO2 deposited not only on the AC but also on the beaker in which it was being carried out. Therefore, although a known mass of titania was used in the coating process, the actual amount of TiO2 deposited on the carbon was likely less than the targeted value. The average phenol removal observed for HD4000 coated with titania was 78%.
Pore volume impregnation resulted in the immobilization of the TiO2 within the pores of the AC. The titania depositing in the pores of the ACs was considered a disadvantage for this coating technique, particularly due to the opacity of activated carbon and the random orientation of its pores. It was hypothesized that due to titania deposition within the pores it would result in a low probability of the UV light reaching the titanium dioxide, resulting in a system with reduced photocatalytic activity. The results obtained seemed to agree with this hypothesis. The photocatalytic tests which were performed with HD4000 showed a removal of only 42%.
Chemical attachment of the TiO2 to the carbon was also attempted to manufacture a more rigid composite. Although this coating technique would provide a more consistent coating on the surface of the ACs, the performance of the ACs coated by this technique did not show any marked improvement over the boil deposition technique. The sol-gel coated HD4000 resulted in 81% removal via adsorption and photocatalysis, which was comparable to the removal seen with the boil deposition method.
Mechanical attachment was achieved through impaction using the Theta Composer instrument (Tokuju Inc., Japan) which resulted in the attrition of the granular activated carbon (GAC) particles, which originated as approximately 1 mm in size, to particles less than 45 μm (Powdered Activated Carbon or PAC). The technique also resulted in separation of the TiO2 particles from the substrate upon introduction in water. The advantages and the disadvantages of each technique are summarized in Table 5. It must be noted that multiple batches of the TiO2-AC composites were tested. Based on these results, the boil deposition technique was selected for coating the carbons with titania. This decision was predicated on its simplicity, but for full-scale manufacturing the chemical attachment sol-gel method may provide the most plausible route.
22
296

Table 5 - Summary of coating techniques
Coating technique
Performance Advantages Disadvantages
Boil deposition 78% Simple procedure Good performance
1) Inconsistent coating 2) Poor control of TiO2 loading
Pore volume impregnation (PVI)
62% Good coating control
1) Requires additional hydrolysis and calcination steps 2) Titania deposition in macropores 3) Poor performance
Good coating control
Chemical attachment
81%
Good performance
1) Requires additional hydrolysis step 2) Experimental setup is cumbersome
Mechanical attachment
-- -- 1) Attrition of AC particles 2) TiO2 separation from substrate
Analysis of Titania-Coated Activated Carbons for Phenol Removal
Khan et al. (2003) showed that F400 and HD4000 showed a synergy when coated with TiO2, whereas Bionuchar did not. The authors concluded that metals, naturally occurring in activated carbon may have been responsible for the observed synergy (i.e., removal of target pollutant increased when titania was coated on AC as compared to activated carbon alone). Nevertheless, they did not investigate this phenomenon in further detail. It was hence a viable exercise to investigate whether metals, in particular electrically conductive metals such as iron and aluminum, could be a plausible mechanism for creating the described synergy.
Ash Analyses of Activated Carbons
To determine the metallic content of Bionuchar, F400 and HD4000, the ACs used by Khan (2003), the uncoated (i.e., virgin) carbons were combusted in air at 575°C until only an ash residue remained. The ash residue of each AC was then analyzed by a scanning electron microscope (SEM) to perform an energy-dispersive spectroscopy (EDS) study. EDS was also used to verify the presence of titania on the surface of the coated ACs. Note that the ACs of which the ash residues were examined were not coated with titania prior to ashing. Even though the EDS data cannot be used as a complete
23
297
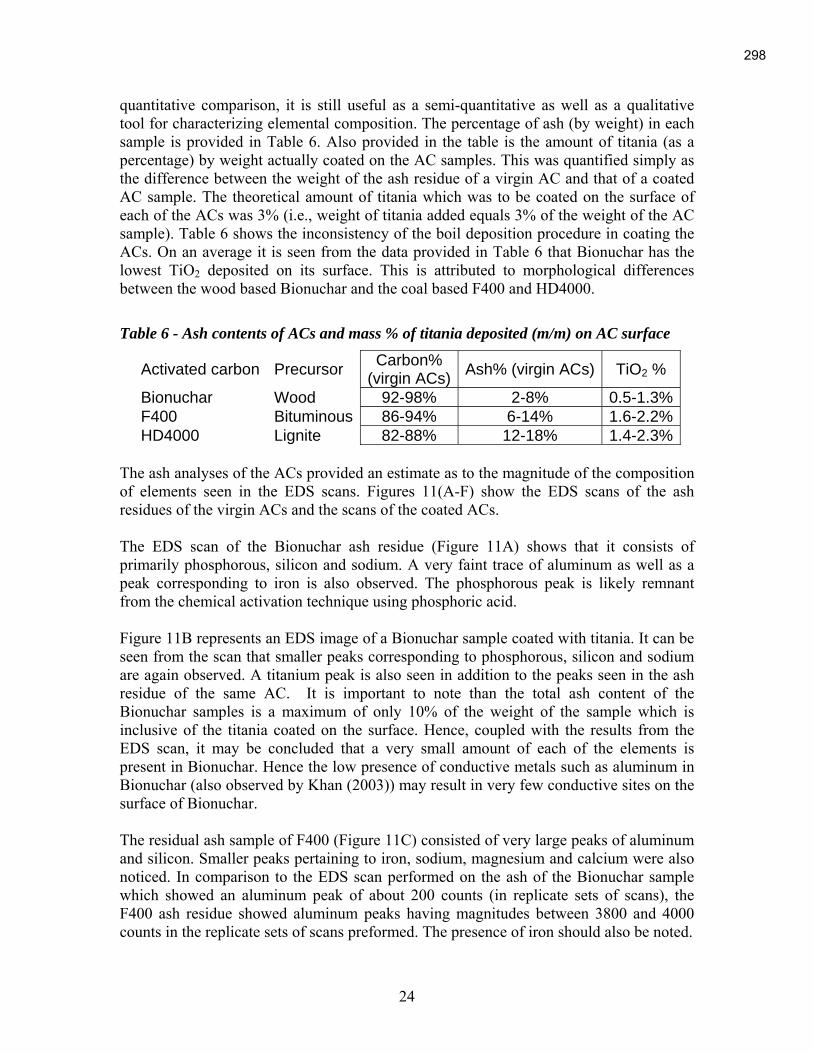
quantitative comparison, it is still useful as a semi-quantitative as well as a qualitative tool for characterizing elemental composition. The percentage of ash (by weight) in each sample is provided in Table 6. Also provided in the table is the amount of titania (as a percentage) by weight actually coated on the AC samples. This was quantified simply as the difference between the weight of the ash residue of a virgin AC and that of a coated AC sample. The theoretical amount of titania which was to be coated on the surface of each of the ACs was 3% (i.e., weight of titania added equals 3% of the weight of the AC sample). Table 6 shows the inconsistency of the boil deposition procedure in coating the ACs. On an average it is seen from the data provided in Table 6 that Bionuchar has the lowest TiO2 deposited on its surface. This is attributed to morphological differences between the wood based Bionuchar and the coal based F400 and HD4000.
Table 6 - Ash contents of ACs and mass % of titania deposited (m/m) on AC surface
Activated carbon Precursor Carbon%
(virgin ACs) Ash% (virgin ACs) TiO2 %
Bionuchar Wood 92-98% 2-8% 0.5-1.3%
F400 Bituminous 86-94% 6-14% 1.6-2.2%
HD4000 Lignite 82-88% 12-18% 1.4-2.3%
The ash analyses of the ACs provided an estimate as to the magnitude of the composition of elements seen in the EDS scans. Figures 11(A-F) show the EDS scans of the ash residues of the virgin ACs and the scans of the coated ACs.
The EDS scan of the Bionuchar ash residue (Figure 11A) shows that it consists of primarily phosphorous, silicon and sodium. A very faint trace of aluminum as well as a peak corresponding to iron is also observed. The phosphorous peak is likely remnant from the chemical activation technique using phosphoric acid.
Figure 11B represents an EDS image of a Bionuchar sample coated with titania. It can be seen from the scan that smaller peaks corresponding to phosphorous, silicon and sodium are again observed. A titanium peak is also seen in addition to the peaks seen in the ash residue of the same AC. It is important to note than the total ash content of the Bionuchar samples is a maximum of only 10% of the weight of the sample which is inclusive of the titania coated on the surface. Hence, coupled with the results from the EDS scan, it may be concluded that a very small amount of each of the elements is present in Bionuchar. Hence the low presence of conductive metals such as aluminum in Bionuchar (also observed by Khan (2003)) may result in very few conductive sites on the surface of Bionuchar.
The residual ash sample of F400 (Figure 11C) consisted of very large peaks of aluminum and silicon. Smaller peaks pertaining to iron, sodium, magnesium and calcium were also noticed. In comparison to the EDS scan performed on the ash of the Bionuchar sample which showed an aluminum peak of about 200 counts (in replicate sets of scans), the F400 ash residue showed aluminum peaks having magnitudes between 3800 and 4000 counts in the replicate sets of scans preformed. The presence of iron should also be noted.
24
298
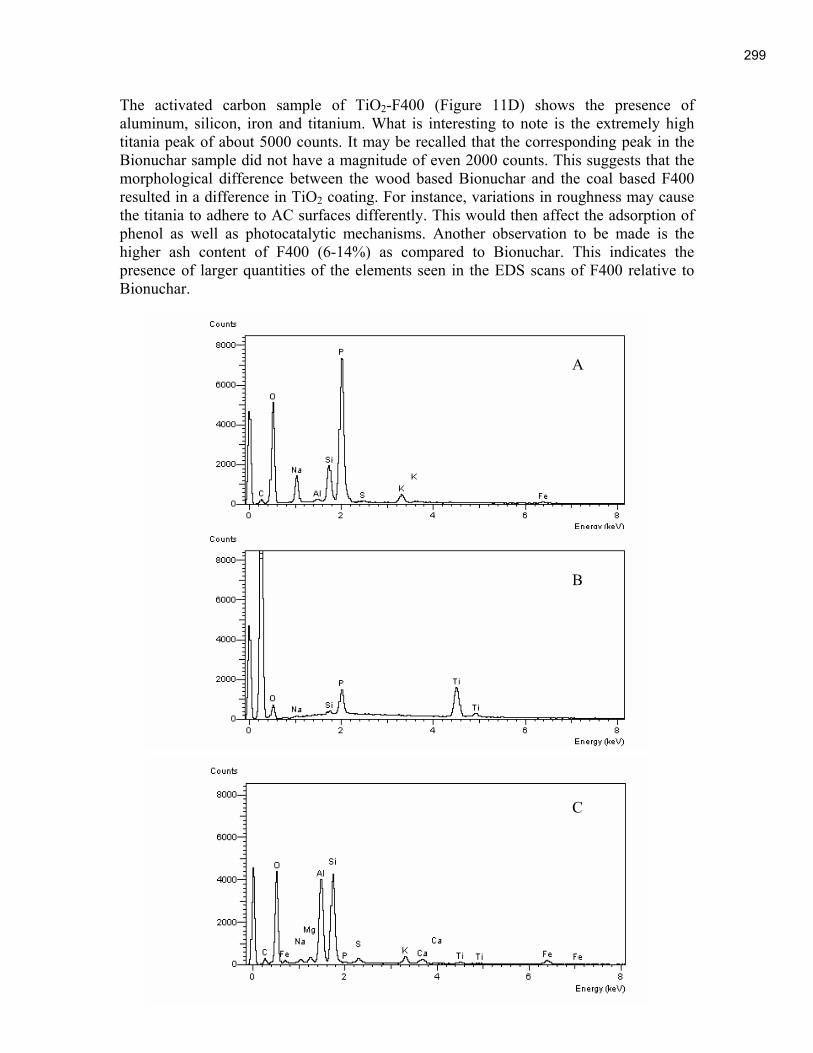
The activated carbon sample of TiO2-F400 (Figure 11D) shows the presence of aluminum, silicon, iron and titanium. What is interesting to note is the extremely high titania peak of about 5000 counts. It may be recalled that the corresponding peak in the Bionuchar sample did not have a magnitude of even 2000 counts. This suggests that the morphological difference between the wood based Bionuchar and the coal based F400 resulted in a difference in TiO2 coating. For instance, variations in roughness may cause the titania to adhere to AC surfaces differently. This would then affect the adsorption of phenol as well as photocatalytic mechanisms. Another observation to be made is the higher ash content of F400 (6-14%) as compared to Bionuchar. This indicates the presence of larger quantities of the elements seen in the EDS scans of F400 relative to Bionuchar.
25
A
B
C
299
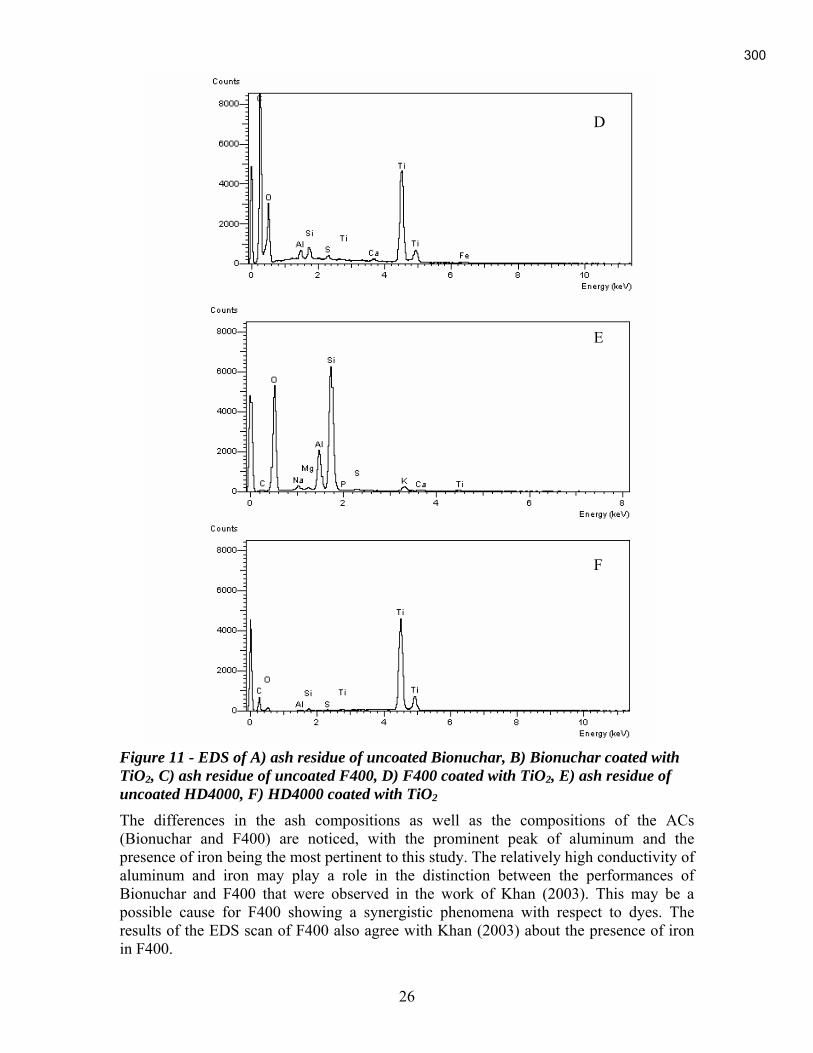
D
E
F
Figure 11 - EDS of A) ash residue of uncoated Bionuchar, B) Bionuchar coated with TiO2, C) ash residue of uncoated F400, D) F400 coated with TiO2, E) ash residue of uncoated HD4000, F) HD4000 coated with TiO2
The differences in the ash compositions as well as the compositions of the ACs (Bionuchar and F400) are noticed, with the prominent peak of aluminum and the presence of iron being the most pertinent to this study. The relatively high conductivity of aluminum and iron may play a role in the distinction between the performances of Bionuchar and F400 that were observed in the work of Khan (2003). This may be a possible cause for F400 showing a synergistic phenomena with respect to dyes. The results of the EDS scan of F400 also agree with Khan (2003) about the presence of iron in F400.
26
300

F400 would have different metals contents because it is a coal-based activated carbon that originated as bituminous coal. Therefore, metals that are present in the subterranean environment would be inherent in the coal. However, Bionuchar is a wood based activated carbon that not only would have different metals than coal-based activated carbons, but since it is chemically activated, during the chemical impregnation step at low pH, some of the metals would become soluble and leach out of the wood.
In the case of HD4000 the EDS image (Figure 11E) of the ash residue prominently consisted of silicon and aluminum. In addition, magnesium and sodium were also fairly prominent. However, iron that was hypothesized to be important for the observed synergy in the work of Khan (2003), was absent in the EDS scan.
The presence of aluminum and silicon were also detected in the TiO2 coated HD4000 sample (Figure 1F). The EDS image also showed a very high titanium peak (about 5000 counts). In replicate sets which provided reproducible results, counts as high as 8000 were found for titanium. The EDS scans for the HD4000 samples also showed a relatively low carbon peak indicating that a titanium dioxide agglomerate may have been focused on. The fact that this was the case in replicate sets between different TiO2 coated HD4000 samples may also indicate to some extent a uniform coating on the surface of this AC. Noteworthy is the fact that HD4000, like F400 is also a coal based AC. This strengthens the argument that morphology may play a role in the deposition of titania on the AC. This can also be attributed to the enhanced performances seen in the coal based carbons with respect to adsorption and photo-oxidation of dyes (Khan, 2003). The fact that HD4000 also contains highly conductive metals such as aluminum strengthens the argument that conductivity may play a role in enhanced photocatalysis. Also, the fact that the ash content of HD4000, a lignite based AC, is relatively high (12-18%) increases the probability of the coated titanium dioxide being in the vicinity of a site on the AC which possesses a higher conductivity (due to the presence of conductive metal ions).
SEM Images of Titania Coated ACs
SEM images were used to further characterize the coating of titania on the ACs. The images showed a variation in the deposition of titania on the activated carbons as well as the degree to which each AC had been coated. Figure 12 shows an image of titania coated Bionuchar.
27
301

Figure 12 - Titania coated Bionuchar with the TiO2 blocked pores circled
It can be noticed from the image that the surface of Bionuchar seems very smooth. The smooth nature of the AC surface may cause a lack of adherence of the titania to the AC surface which may result in decreased photocatalytic activity. Another notable aspect of this image is the fact that a number of pores (shown circled) appear to be partially or completely blocked by the titanium dioxide. This may in fact be due to the poor adherence of the TiO2 surface resulting in the titania being deposited inside the pores of the AC. Deposition in the pores would of course reduce the diffusion of phenol to adsorption sites, thereby decreasing the adsorption of phenol (as discussed in subsequent sections). The wood based nature of this AC is evident in Figure 13.
28
302
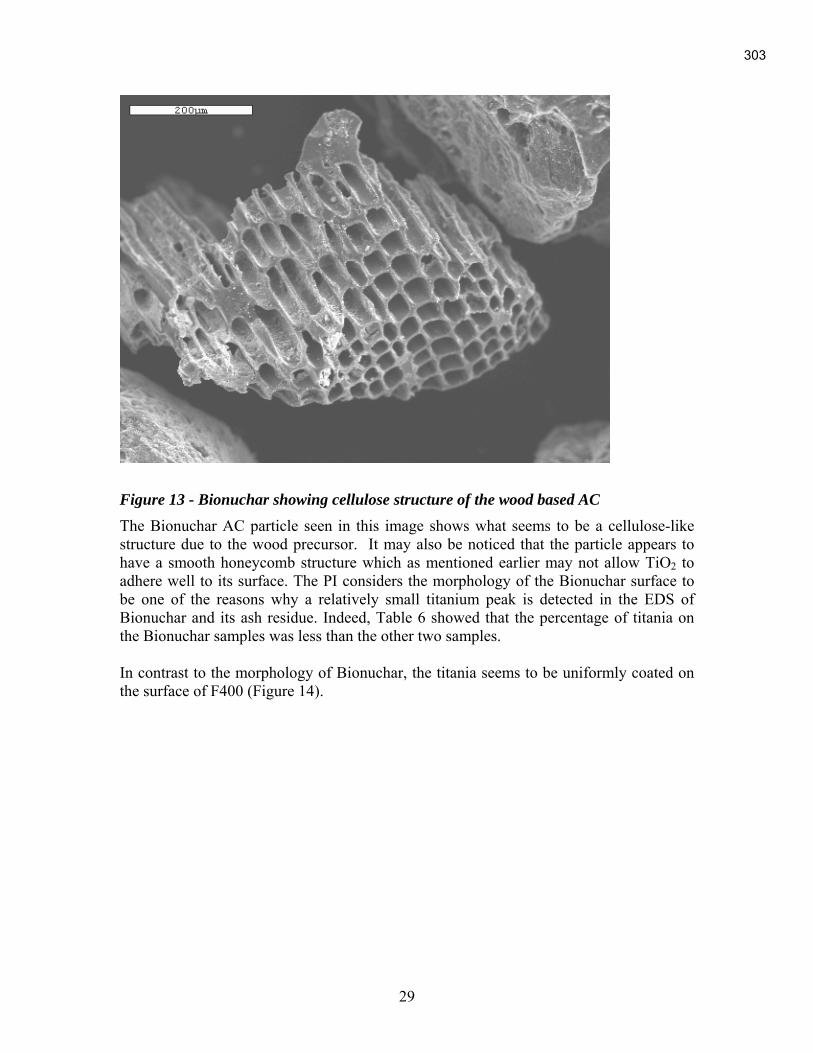
Figure 13 - Bionuchar showing cellulose structure of the wood based AC
The Bionuchar AC particle seen in this image shows what seems to be a cellulose-like structure due to the wood precursor. It may also be noticed that the particle appears to have a smooth honeycomb structure which as mentioned earlier may not allow TiO2 to adhere well to its surface. The PI considers the morphology of the Bionuchar surface to be one of the reasons why a relatively small titanium peak is detected in the EDS of Bionuchar and its ash residue. Indeed, Table 6 showed that the percentage of titania on the Bionuchar samples was less than the other two samples.
In contrast to the morphology of Bionuchar, the titania seems to be uniformly coated on the surface of F400 (Figure 14).
29
303

Figure 14 - Titania coated on the surface of F400
The uniformity in coating is thought to be an explanation for the well defined peaks of titania seen in the EDS scans of F400 and could also be an explanation for the synergy seen in the study by Khan (2003). A uniform coating would increase the probability of titania contacting metals present on the AC surface which could hypothetically improve photocatalysis.
An SEM image of HD4000 coated with titania is shown in Figure 15-16. It may be noticed that the TiO2 agglomerates on the surface of HD4000; here the TiO2 agglomerate is near the opening of a macropore (see circled region). The size of the TiO2 agglomerates (about 15 μm) is observed to be much larger than the individual TiO2 particles (i.e., 27 nm) (Li et al., 2004).
30
304
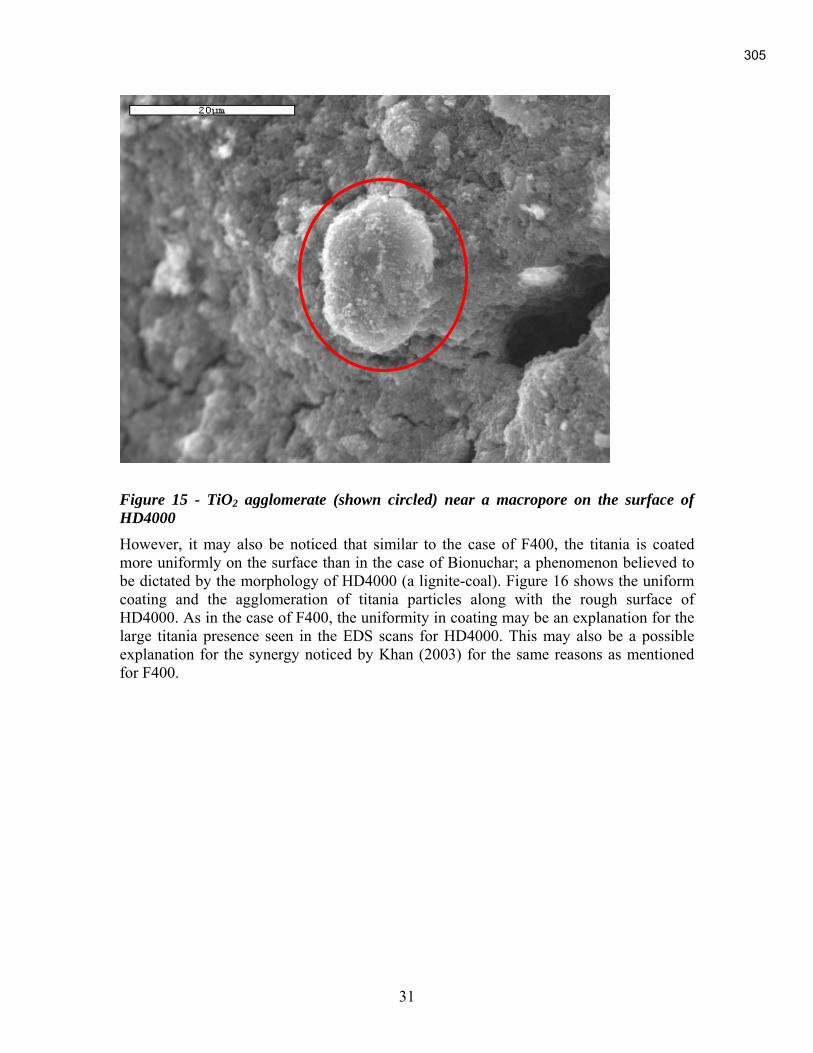
Figure 15 - TiO2 agglomerate (shown circled) near a macropore on the surface of HD4000 However, it may also be noticed that similar to the case of F400, the titania is coated more uniformly on the surface than in the case of Bionuchar; a phenomenon believed to be dictated by the morphology of HD4000 (a lignite-coal). Figure 16 shows the uniform coating and the agglomeration of titania particles along with the rough surface of HD4000. As in the case of F400, the uniformity in coating may be an explanation for the large titania presence seen in the EDS scans for HD4000. This may also be a possible explanation for the synergy noticed by Khan (2003) for the same reasons as mentioned for F400.
31
305

Figure 16 - Surface of HD4000 showing uniform coating of TiO2 which tends to form agglomerates
Hence, it may be summarized that the wood based carbon and the coal based carbons differ morphologically. Titania coated on Bionuchar seems to concentrate around the pores. It is also believed that due to the smoothness of the Bionuchar surface, there is less adherence of the TiO2 particles to the Bionuchar surface. However in the case of both F400 and HD4000, a more uniform coating of titania is observed with the titania forming agglomerates on the surface of HD4000.
The ash analysis, EDS scans and the SEM images together provide us with some possible explanations for the synergistic phenomenon of certain TiO2-AC particles observed by Khan (2003). Both F400 and HD4000 contain relatively high ash contents as compared to Bionuchar. Their EDS scans also show a very high titanium presence on their surface in addition to the higher presence of electrically conductive metals (i.e., aluminum, iron).
It may be concluded that there is a greater possibility of titania being in contact with a conductive site in the case of F400 and HD4000 relative to Bionuchar. Activated Carbon Batch Studies
The results of the batch tests conducted on the activated carbons which compared the performance of the ACs (or the TiO2-AC composites) as a function of the removal of phenol are presented. It must be noted that differences in phenol removal of less than 4-5% were not considered significant.
32
306
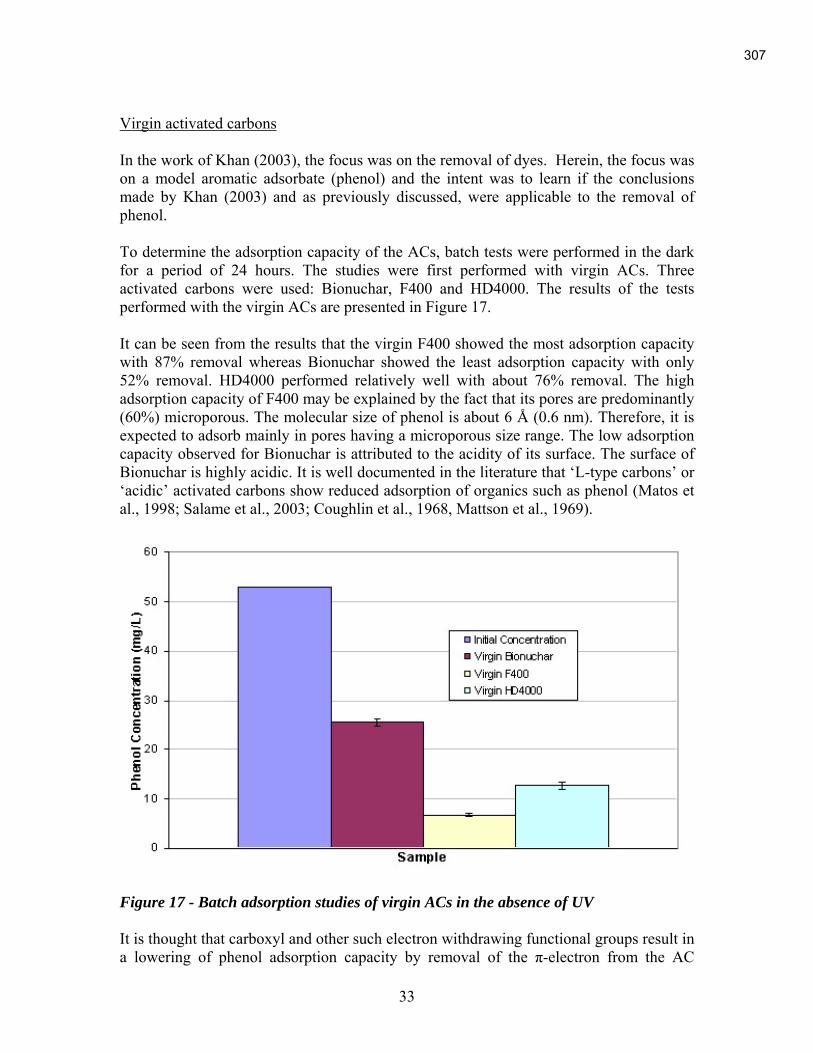
Virgin activated carbons
In the work of Khan (2003), the focus was on the removal of dyes. Herein, the focus was on a model aromatic adsorbate (phenol) and the intent was to learn if the conclusions made by Khan (2003) and as previously discussed, were applicable to the removal of phenol.
To determine the adsorption capacity of the ACs, batch tests were performed in the dark for a period of 24 hours. The studies were first performed with virgin ACs. Three activated carbons were used: Bionuchar, F400 and HD4000. The results of the tests performed with the virgin ACs are presented in Figure 17.
It can be seen from the results that the virgin F400 showed the most adsorption capacity with 87% removal whereas Bionuchar showed the least adsorption capacity with only 52% removal. HD4000 performed relatively well with about 76% removal. The high adsorption capacity of F400 may be explained by the fact that its pores are predominantly (60%) microporous. The molecular size of phenol is about 6 Å (0.6 nm). Therefore, it is expected to adsorb mainly in pores having a microporous size range. The low adsorption capacity observed for Bionuchar is attributed to the acidity of its surface. The surface of Bionuchar is highly acidic. It is well documented in the literature that ‘L-type carbons’ or ‘acidic’ activated carbons show reduced adsorption of organics such as phenol (Matos et al., 1998; Salame et al., 2003; Coughlin et al., 1968, Mattson et al., 1969).
Figure 17 - Batch adsorption studies of virgin ACs in the absence of UV It is thought that carboxyl and other such electron withdrawing functional groups result in a lowering of phenol adsorption capacity by removal of the π-electron from the AC
33
307

aromatic ring. This decrease in the density of the electron cloud in the carbon basal planes causes a decrease in the strength of interactions between the benzene ring of phenol and the basal planes of AC. Phenol also reacts with carboxylic groups on the carbon surface forming ester bonds which contributes to this phenomenon (Salame et al., 2003; Nevskaia et al., 1998). As a result, there is decreased adsorption of phenol on the basal planes of carbon. The case of HD4000 however is peculiar at first glance. HD4000 is acidic due to its activation procedure, but this acidity is a function of residual acid used for acid-washing versus the presence of oxygenated functional groups located on the edge sites. Therefore, although it displays characteristics of an L-type carbon, the manner in which this is manifested is different than “traditional” L-type carbons. At the nano-scale, HD4000 behaves more like an H-type carbon, which suggests that π-π bonding is the dominant adsorption mechanism.
Adsorption capacity for titania-coated activated carbons
Similar trends were seen when batch adsorption studies were performed in the dark with 3% (m/m) (i.e., mass of titania per mass of activated carbon) titania-coated AC samples (Figure 18). Note that the targeted titania loading was 3%, but as was shown earlier the actual amount of titania on the surface of each AC was less than 3 %.
0
10
20
30
40
50
60
Sample
Phe
nol C
once
ntra
tion
(mg/
L)
Initial Concentration
50 mg 3% Bionuchar
50 mg 3% F400
50 mg 3% HD4000
1.5 mg TiO2 Slurry
2.4 mg TiO2 Slurry
Figure 18 - Batch adsorption studies of 3% (m/m) coated ACs in the dark compared to TiO2 slurries A slight decrease in adsorption capacity as compared to the virgin ACs was observed in all the ACs. This was attributed to the partial blockage of pores and hence reduced surface area and active sites available for adsorption. In addition to the ACs, Figure 18 presents the adsorption capacities of two titania slurries (no AC). These masses of titania were chosen because they are very near the masses of titania that was present on the ACs.
34
308

Clearly the titania slurries show very low adsorption capacities (approximately 8% removal). In fact, it is noticed that even when a higher amount of titania is loaded to the reactor, the decrease in phenol concentration does not change.
Adsorption and photocatalysis for titania-coated activated carbons
The next step was to determine the performance of the coated ACs in the presence of UV light. As in the earlier experiment, performances of two titania slurries were also included. It was expected that UV would initiate photocatalysis and therefore considerably enhance the removal of phenol through the combined functions of adsorption and photocatalysis.
The tests with the titania coated ACs were conducted in a sequence which would eventually normalize the amount of carbon and titanium dioxide for each sample. The initial batch tests consisted of ACs coated with titania on the basis of mass. The AC’s were loaded to their respective reactors such that each reactor contained 50 mg of the titania-coated AC. These samples have been denoted in places as ‘mass-mass’ or ‘m/m’. The amounts of titanium dioxide for the slurry systems were 1.5 (3% of 50 mg) and 2.4 mg (3% of 80 mg as a comparison) respectively. It must be noted that the ACs do not have the same density which resulted in each reactor having different volumes of ACs. The results of the tests are shown in Figure 19.
The irradiated Bionuchar composite with only 39% removal performed poorly compared to HD4000 (78% phenol removal) and F400 (88% phenol removal). The performance of both titania-HD4000 and titania-F400 composites slightly improved in the presence of UV; a fact that is attributed to photocatalysis by UV. However, this refutes Matos et al. (1998, 2001) who claim that an L-type AC inhibits photocatalysis whereas an H-type AC enhances photocatalysis. The surface of HD4000 is acidic and can therefore be categorized as an L-type carbon, but as was previously mentioned, the manner in which HD4000 exhibits a low pH is mechanistically different than “traditional” L-type carbons.
35
309
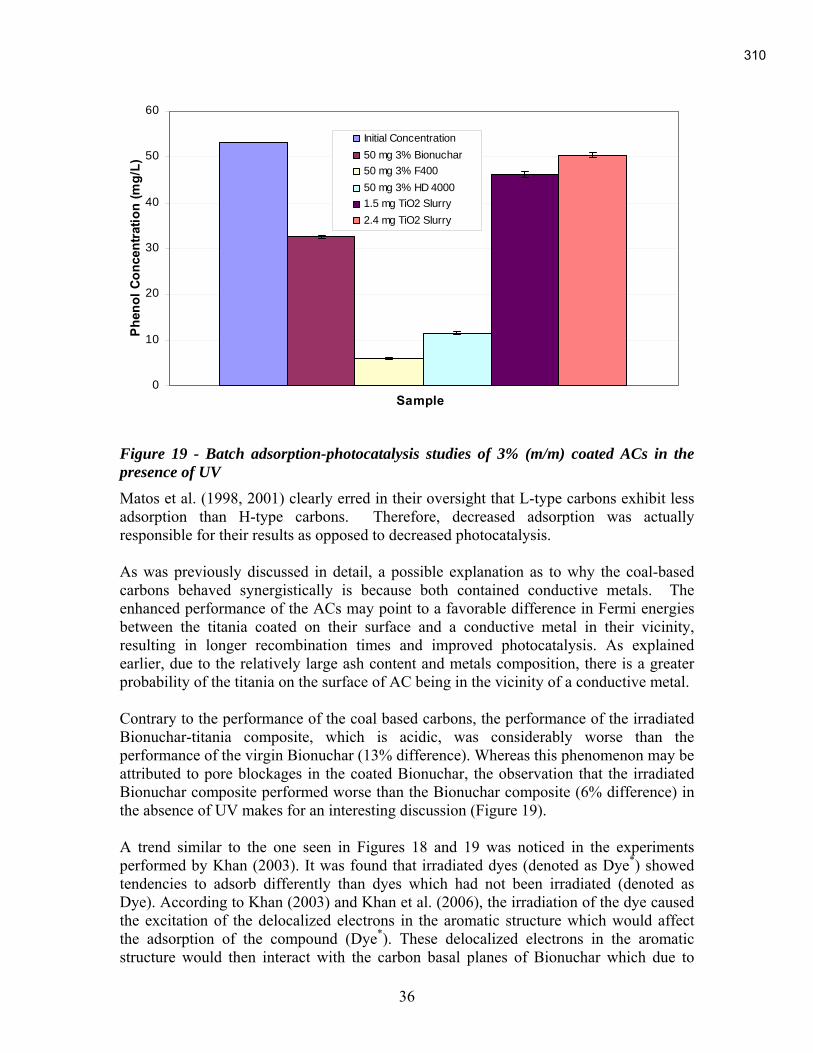
0
10
20
30
40
50
60
Sample
Phe
nol C
once
ntra
tion
(mg/
L)Initial Concentration
50 mg 3% Bionuchar
50 mg 3% F400
50 mg 3% HD 4000
1.5 mg TiO2 Slurry
2.4 mg TiO2 Slurry
Figure 19 - Batch adsorption-photocatalysis studies of 3% (m/m) coated ACs in the presence of UV
Matos et al. (1998, 2001) clearly erred in their oversight that L-type carbons exhibit less adsorption than H-type carbons. Therefore, decreased adsorption was actually responsible for their results as opposed to decreased photocatalysis.
As was previously discussed in detail, a possible explanation as to why the coal-based carbons behaved synergistically is because both contained conductive metals. The enhanced performance of the ACs may point to a favorable difference in Fermi energies between the titania coated on their surface and a conductive metal in their vicinity, resulting in longer recombination times and improved photocatalysis. As explained earlier, due to the relatively large ash content and metals composition, there is a greater probability of the titania on the surface of AC being in the vicinity of a conductive metal.
Contrary to the performance of the coal based carbons, the performance of the irradiated Bionuchar-titania composite, which is acidic, was considerably worse than the performance of the virgin Bionuchar (13% difference). Whereas this phenomenon may be attributed to pore blockages in the coated Bionuchar, the observation that the irradiated Bionuchar composite performed worse than the Bionuchar composite (6% difference) in the absence of UV makes for an interesting discussion (Figure 19).
A trend similar to the one seen in Figures 18 and 19 was noticed in the experiments performed by Khan (2003). It was found that irradiated dyes (denoted as Dye*) showed tendencies to adsorb differently than dyes which had not been irradiated (denoted as Dye). According to Khan (2003) and Khan et al. (2006), the irradiation of the dye caused the excitation of the delocalized electrons in the aromatic structure which would affect the adsorption of the compound (Dye*). These delocalized electrons in the aromatic structure would then interact with the carbon basal planes of Bionuchar which due to
36
310
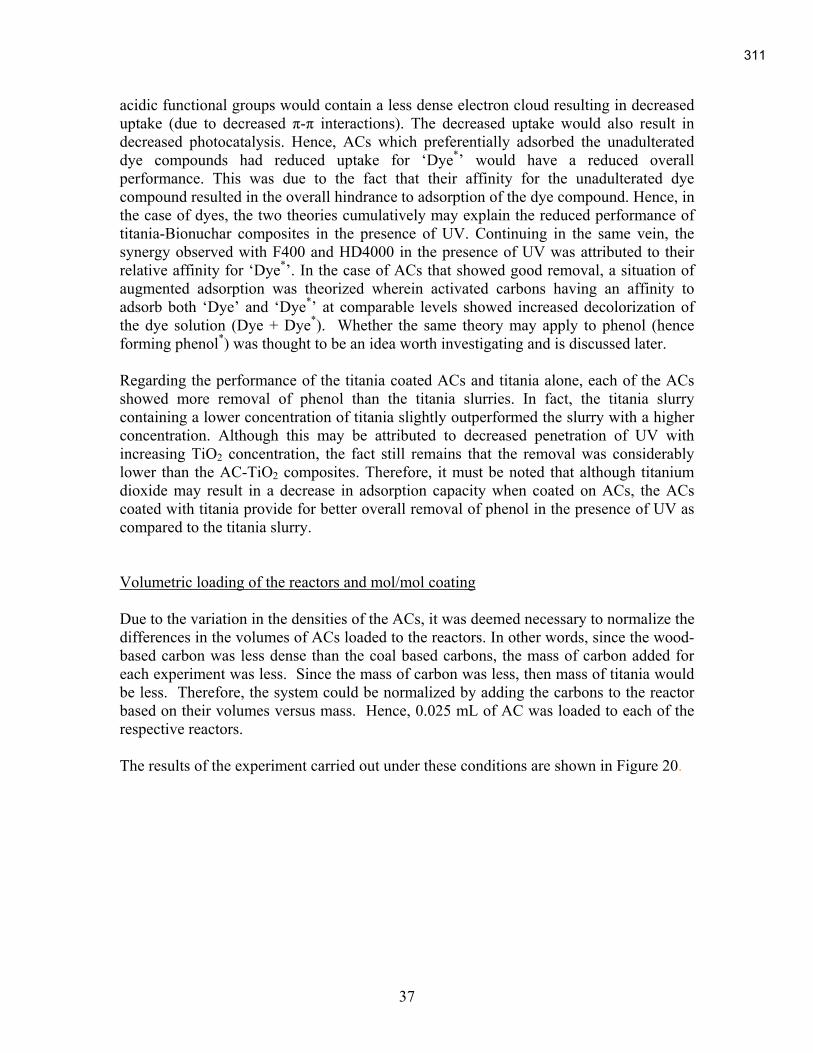
acidic functional groups would contain a less dense electron cloud resulting in decreased uptake (due to decreased π-π interactions). The decreased uptake would also result in decreased photocatalysis. Hence, ACs which preferentially adsorbed the unadulterated dye compounds had reduced uptake for ‘Dye*’ would have a reduced overall performance. This was due to the fact that their affinity for the unadulterated dye compound resulted in the overall hindrance to adsorption of the dye compound. Hence, in the case of dyes, the two theories cumulatively may explain the reduced performance of titania-Bionuchar composites in the presence of UV. Continuing in the same vein, the synergy observed with F400 and HD4000 in the presence of UV was attributed to their relative affinity for ‘Dye*’. In the case of ACs that showed good removal, a situation of augmented adsorption was theorized wherein activated carbons having an affinity to adsorb both ‘Dye’ and ‘Dye*’ at comparable levels showed increased decolorization of the dye solution (Dye + Dye*). Whether the same theory may apply to phenol (hence forming phenol*) was thought to be an idea worth investigating and is discussed later.
Regarding the performance of the titania coated ACs and titania alone, each of the ACs showed more removal of phenol than the titania slurries. In fact, the titania slurry containing a lower concentration of titania slightly outperformed the slurry with a higher concentration. Although this may be attributed to decreased penetration of UV with increasing TiO2 concentration, the fact still remains that the removal was considerably lower than the AC-TiO2 composites. Therefore, it must be noted that although titanium dioxide may result in a decrease in adsorption capacity when coated on ACs, the ACs coated with titania provide for better overall removal of phenol in the presence of UV as compared to the titania slurry.
Volumetric loading of the reactors and mol/mol coating
Due to the variation in the densities of the ACs, it was deemed necessary to normalize the differences in the volumes of ACs loaded to the reactors. In other words, since the wood-based carbon was less dense than the coal based carbons, the mass of carbon added for each experiment was less. Since the mass of carbon was less, then mass of titania would be less. Therefore, the system could be normalized by adding the carbons to the reactor based on their volumes versus mass. Hence, 0.025 mL of AC was loaded to each of the respective reactors.
The results of the experiment carried out under these conditions are shown in Figure 20.
37
311
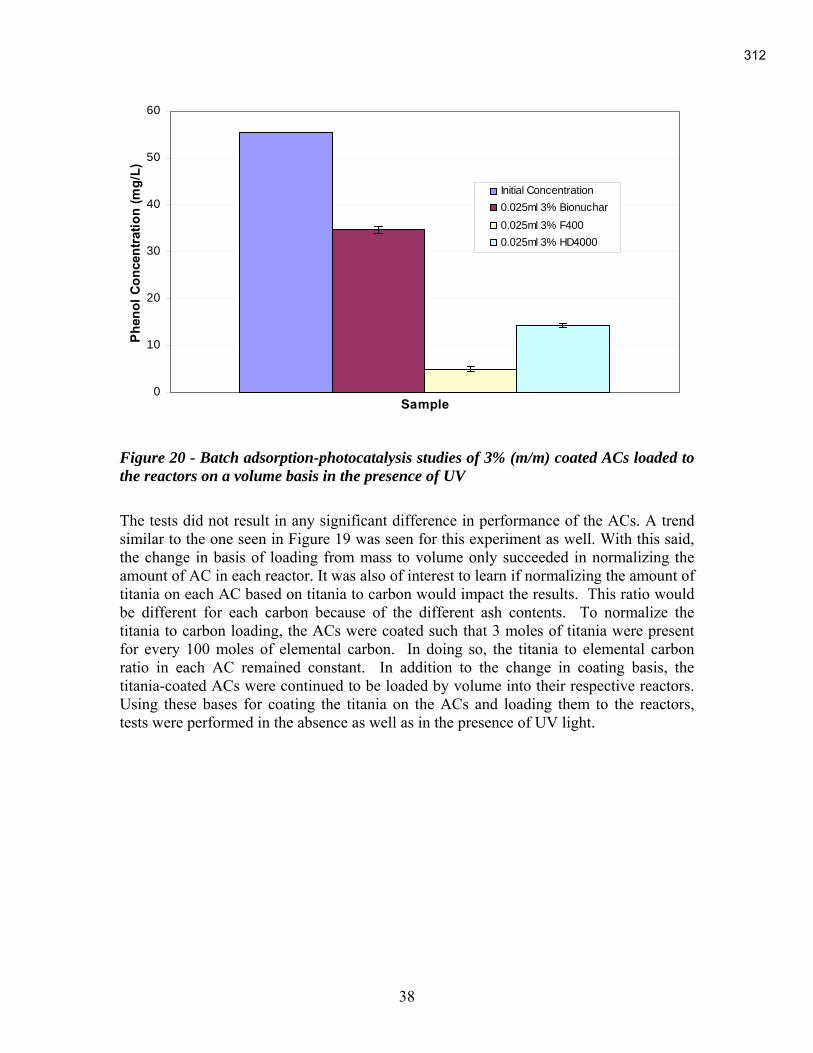
0
10
20
30
40
50
60
Sample
Phe
nol C
once
ntra
tion
(mg/
L)
Initial Concentration
0.025ml 3% Bionuchar
0.025ml 3% F400
0.025ml 3% HD4000
Figure 20 - Batch adsorption-photocatalysis studies of 3% (m/m) coated ACs loaded to the reactors on a volume basis in the presence of UV
The tests did not result in any significant difference in performance of the ACs. A trend similar to the one seen in Figure 19 was seen for this experiment as well. With this said, the change in basis of loading from mass to volume only succeeded in normalizing the amount of AC in each reactor. It was also of interest to learn if normalizing the amount of titania on each AC based on titania to carbon would impact the results. This ratio would be different for each carbon because of the different ash contents. To normalize the titania to carbon loading, the ACs were coated such that 3 moles of titania were present for every 100 moles of elemental carbon. In doing so, the titania to elemental carbon ratio in each AC remained constant. In addition to the change in coating basis, the titania-coated ACs were continued to be loaded by volume into their respective reactors. Using these bases for coating the titania on the ACs and loading them to the reactors, tests were performed in the absence as well as in the presence of UV light.
38
312

0
10
20
30
40
50
60
Samples
Phe
nol C
once
ntra
tion
(mg/
L)
Initial Concentration
3% Bionuchar (mol/mol) loaded by volume
3% F400 (mol/mol) loaded by volume
3% HD4000 (mol/mol) loaded by volume
A
0
10
20
30
40
50
60
Samples
Phe
nol C
once
ntra
tion
(mg/
L)
Initial Concentration
3% Bionuchar (mol/mol) loaded by volume
3% F400 (mol/mol) loaded by volume
3% HD4000 (mol/mol) loaded by volume
B
Figure 21 - Batch adsorption studies: A) 3% (mol/mol) coated ACs in the absence of UV loaded to the reactors by volume, B) Photocatalysis studies of 3% (mol/mol) coated ACs in the presence of UV loaded to the reactors on a volume basis Tests in the absence of UV were performed to assess as to how much the change in the basis of coating affected adsorption of phenol since in each case the amount of coated titania increased. Similarly, tests in the presence of UV were performed to assess the effect that the increased titania coating on the ACs had on simultaneous adsorption-photocatalysis. Figures 21a and 21b show the results of the experiments in the absence and presence of UV light respectively.
39
313
As in the earlier tests, an analysis of the data revealed no significant differences in the trends of their performances. Although there are signs of photocatalysis having some effect on phenol removal, the differences noticed in the trends are not of sufficient magnitude to arrive at any definite conclusion with respect to how photocatalysis was influenced by the variations.
The results seemed to show that adsorption dominated over photocatalysis as a mechanism. Hence, the extent to which photocatalysis plays a role in the removal of phenol in a co-adsorbent with high surface area was questioned. Unlike results shown by Matos et al. (1998) in the case of organic compounds and Khan (2003) in the case of dyes, the results seen herein failed to show any clear evidence of a synergy of any kind existing between ACs and TiO2 with respect to performance. The premise that a co-adsorbent with high surface area would result in an increase in photocatalytic efficiency of titania (Matos et al., 1998; Takeda et al., 1995) can hence be questioned. The theory by Matos et al. (2001) that L-type ACs inhibit photocatalysis whereas H-type ACs enhance photocatalysis has also gone unfounded based on the data that has been presented. The failure by Matos et al. (2001) to perform adsorption control studies seems to be the cause of the unverifiable hypothesis. Previous data contained in quarterly reports indicated that the TiO2-coated bituminous coal provided the most encouraging results with respect to phenol adsorption and oxidation. Therefore, it was chosen as the candidate for testing the efficacy of regenerating the activated carbon (once exhausted) with phenol in a column adsorber. Figure 22 plots the adsorption profile for the virgin TiO2-coated activated carbon and adsorption profile for two carbons that were regenerated with DI water or UV plus DI water. (The breakthrough curves were purposely designed to load the carbon with phenol rapidly, which is why there is no period where the carbons removed 100% of the influent phenol (Co =10 mg/L)). As the two regeneration curves indicated, when flowing just DI water or DI water with UV irradiation, the subsequent adsorption for the carbon was much less than for the virgin carbon. Furthermore, when operating in a single pass configuration, DI water alone (i.e., simply desorption) worked as well at removing phenol than did DI water plus UV.
40
314

Figure 22 - Comparison of virgin and regenerated carbon for phenol removal.
The regeneration experiments for Figure 22 demonstrated that desorption of phenol is a phenomena that requires a solution. Therefore, the column adsorber was operated in a recirculation mode whereby the effluent (i.e., desorbed phenol) would be reintroduced in to the influent of the reactor to be oxidized by the titania on the carbon surface. Three different approaches were tested: packed bed (Figure 23), bubbling bed (Figure 24), and fluidized bed (Figure 25). The fluidized bed was hypothesized to work the best because most of the carbon would be exposed to the UV versus in the packed bed approach whereby only the carbon nearest the UV would be irradiated.
41
315
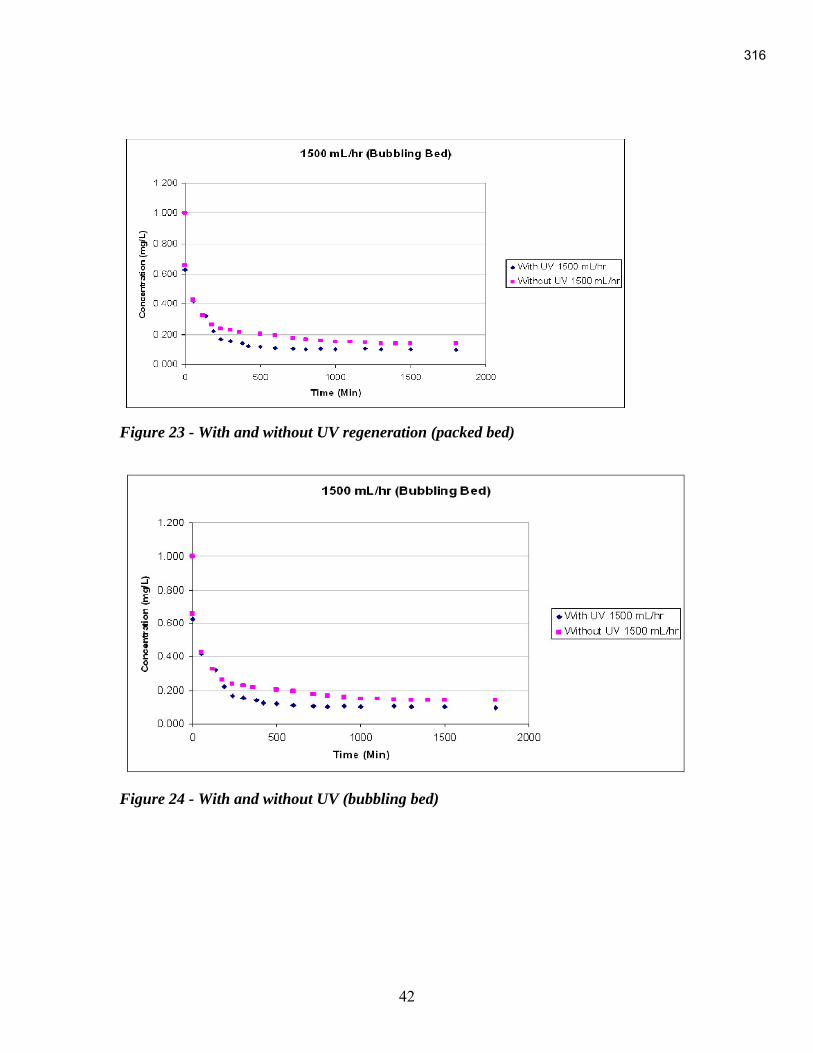
Figure 23 - With and without UV regeneration (packed bed)
Figure 24 - With and without UV (bubbling bed)
42
316

Figure 25 - With and without UV (fluidized bed) In the bubbling bed and fluidized bed scenarios, the with UV condition performed better (i.e., the effluent concentration was closer to zero). In both cases (i.e., with and without UV), the phenol was removed well from the activated carbon surface, but in the case of the with UV scenario, the phenol was oxidized to as verified with GC and spectrophotometric analyses.
CONCLUSIONS Prior to the initiation of the research presented herein, it was hypothesized that the conductivity of the carbon and/or the conductivity of metals inherent in the materials tested would enhance photocatalysis. However, this theory was disproved. On the contrary, the morphology of the carbon that is to be coated with photocatalysts is most important. A rough surface resulted in a uniform coating, which was proven to enhance photocatalysis of the test adsorbate (phenol). Contrary to the literature, adsorption was proven as the key variable responsible for the decrease in phenol concentration. Therefore, when coating activated carbon, a carbon should be selected that demonstrates the greatest uptake of the contaminant(s). Finally, a series of coating strategies were investigated to determine the efficacy of these coatings while keeping commercialization in mind. Although the boil deposition proved the simplest, it resulted in an un-even coating. Therefore, even though the performance was not as promising, the pore volume impregnation technique offers the greatest potential for commercialization.
43
317

REFERENCES Cannon FS, J Dusenbury, D Paulsen, J Singh, D Mazyck, D Maurer. Advanced Oxidant
Regeneration of Granular Activated Carbon for Controlling Air-phase VOCs. Ozone Sci. Engr.,1996, 18:417- 441.
Celzard A., Mareche JF, Payot F, Furdin G. Electrical conductivity of carbonaceous powders. Carbon 2002; 40:2801-2815.
Coughlin RW and Ezra FS. Role of surface acidity in the adsorption of organic pollutants on the surface of carbon. Environmental Science and Technology. 1968; vol.2; No. 4: 291-297 Fujii, T., T Suzuki and K Sakamoto, "Simultaneous Removal of Gases and Particulates
by Photocatalyst and UV/Photoelectron Method", Kuki Seijo, 1997, 35(3), 169-176. Khan AY, DW Mazyck, CY Wu. TiO2 Coated Activated Carbon: A Regenerative
Technology for Water Recovery. NASA ICES Conference July 2002. Khan AY. Titanium dioxide coated activated carbon: A regenerative technology for water
recovery. 2003. Masters Thesis. The University of Florida, Gainesville, FL-32611. Khan AY and Mazyck DW. The effect of UV irradiation on adsorption by activated
carbon/TiO2 composites. Letters to the Editor/Carbon. 2006; 44: 158-193. Li W, Ni C, Lin H, Huang CP, Shah IS. Size dependence of thermal stability of TiO2 nanoparticles. Journal of Applied Physics. 2004; Vol.96; No.11. Matos J, Laine J, Herrmann JM. Synergy effect in the photocatalytic degradation of
phenol on a suspended mixture of titania and activated carbon. Applied Catalysis B: Environmental. 1998; 18: 281-291.
Matos J, Laine J, Herrmann JM. Effect of the type of activated carbons on the photocatalytic degradation of aqueous organic pollutants by UV-irradiated titania. Journal of Catalysis. 2001; 200: 10-20.
Mattson JS, Harry MB Jr., Malbin MD, Weber WJ Jr., Crittenden JC. Surface chemistry of active carbon: specific adsorption of phenols. Journal of Colloid and Interfacial Science. 1969; Vol. 31; No.1; 116-130.
Nevskaia DM, Castillejos-Lopez E, Munoz V, Guererro-Ruiz A. Adsorption of aromatic compounds from water by treated carbon materials. Environmental Science and Technology. 2004; 38: 5786-5796.
Salame II and Bandosz TJ. Role of surface chemistry in adsorption of phenol on activated carbons. Journal of Colloid and Interfacial Sciences. 2003; 264: 307-312.
Sadeghi, M., W Liu, T Zhang, P Stavropoulos and B Levy, "Role of Photoinduced Charge Carrier Separation Distance in Heterogeneous Photocatalysis: Oxidative Degradation of CH3OH Vapor in Contact with Pt/TiO2 and Cofumed TiO2-Fe2O3", J. Phys. Chem., 1996, 100, 19466-19474.
Torimoto T, Ito S, Kuwabata S, Yoneyama H. Effects of adsorbents used as supports for titanium dioxide loading on photocatalytic degradation of propyzamide. Environ Sci Tech. 1996;30:1275-1281.
Tryba B, Morawski A, Masahiro T, Inagaki M. TiO2-mounted activated carbon for the elimination of organic pollutants in water. Res Adv in Water Research. 2003;4:35-42.
44
318

Tsumura T, Kojitani N, Umemura H, Toyoda M, Inagaki M. Composites between photoactive anatase-type TiO2 and adsorptive carbon. Applied Surface Science. 2002;196:429-436.
Wu, CY, TG Lee, G Tyree, E Arar and P Biswas, "Capture of Mercury in Combustion Systems by InSitu Generated Titania Particles with UV Irradiation", Env. Eng. Sci., 1998, 15(2), 137-148.
PAPERS PUBLISHED FROM RESEARCH Khan AY, Mazyck DW. The Effect of UV Irradiation on Adsorption by Activated Carbon/TiO2 Composites. Carbon 2006; 44:182-184.
PRESENTATIONS FROM RESEARCH Khan A, Shyamasundar V, Mazyck D. TiO2-Activated Carbon: A Novel Approach to the Removal of Aqueous Metals. July, 2006 The International Carbon Conference. Aberdeen, Scotland. Bach MT and Mazyck DW. Tailoring of a Powdered Activated Carbon through Manipulation of Dissolved Oxygen. July, 2006 The International Conference on Carbon. Aberdeen, Scotland.
45
319
COAL DERIVED NANOFIBER SHEET DEVELOPMENT
CONSORTIUM FOR PREMIUM CARBON PRODUCTS FROM COAL FINAL REPORT
Performance Period March 1, 2005 – August 30, 2006
Principal Author: Dr. David W. Firsich
Submitted Aug 30, 2006
Subcontract No. 2870-ISI-DOE-1874
“Coal Derived Nanofiber Sheet Development”
Inorganic Specialists, Inc.
P.O. Box 181
720 Mound Ave.
Miamisburg, Ohio
320
Disclaimer
This report was prepared as an account of work sponsored by an agency of the
United States Government. Neither the United States Government nor any agency
thereof, nor any of their employees, makes any warranty, express of implied, or
assumes any legal liability or responsibility for the accuracy, completeness, or
usefulness of any information, apparatus, product or process disclosed, or
represents that its use would not infringe privately owned rights. Reference herein
to any specific commercial product, process, or service by trade name, trademark,
manufacturer, or otherwise does not necessarily constitute or imply its endorsement,
recommendation, or favoring by the United States Government or any agency
thereof. The views and opinions of authors expressed herein do not necessarily
state or reflect those of the United States Government or any agency thereof.
i
321
Abstract
This project is focused on the development of paper sheets made from coal-derived
carbon nanofibers from Applied Sciences, Inc. (ASI). The paper form adds value to this
coal-derived product. Applied Sciences currently produces coal nanofibers from a
gasified coal feedstock; their mainstream products are nanofibers made from hydrocarbon
gases. The reaction conditions employed to make the coal material are similar to those
which produce one of ASI’s mainstream products (PR-19), and so its not surprising that
SEM characterization shows that the coal-derived nanofibers are similar (but not exactly
the same) as hydrocarbon-derived PR-19.
It has been found that coal-derived nanofiber paper has a strength comparable to its
hydrocarbon analog PR-19, which is not very strong. The ASI product PR-24 makes a
paper more than twice as strong. But even with the modest strength of the current type
of coal nanofibers, it was possible to fabricate a number of demonstration papers of coal-
derived nanofibers, including sheets that were as large as 12”x12”.
One emphasis of this project was to examine uses for coal-derived nanofiber papers.
The applications we investigated showed some promise and some drawbacks. It was
generally found that the coal-derived nanofibers of today did not perform as well as the
hydrocarbon variety. For example, a coal-derived electrochemical capacitor electrode
with good performance was synthesized, but there are caveats due to coal impurities
introducing self-discharge. We performed one test of a coal material as a fuel cell
component and observed reduced performance relative to hydrocarbon-derived
nanofibers. These issues may disappear in the future, as there is a move underway at
Applied Sciences to make coal-derived nanofibers by a process that would utilize a
relatively pure feedstock of hydrocarbon gases derived from a coal-burning power plant.
If the same gas composition as is now used in their commercial nanofiber production can
be achieved, ASI could make their current product at a much lower cost.
Since a limited amount of coal-derived nanofibers were provided to us by ASI,
development work was often done with their commercial hydrocarbon-derived nanofiber,
with the expectation that future coal-derived nanofibers would have identical properties.
Development work such as experiments with binders to add strength, studies designed to
improve paper conductivity, evaluation of filter membranes for paper manufacture, and
additional applications testing were all performed for this project.
The advances of this project include a better knowledge of binders, the development of
improved conductivity, the demonstration of various applications (fuel cells, composites,
EMI shielding, electrochemical capacitors), and a clear route to making nanofiber sheet
material on a continuous basis. Further development effort will be appropriate when
Applied Sciences implements their plans to make nanofibers that are identical to their
current products, using coal-derived hydrocarbon gases as their feedstock.
ii
322
TABLE OF CONTENTS
Page
Introduction 1
Executive Summary 3
Experimental 4
Results and Discussion 5
A) New Paper Embodiments 5
Graphitized monolith
Papers made with binders
Papers made on a conductive scrim
B) Applications Development 7
Silicon Carbide Composite
All-Coal Electrochemical Capacitor Electrodes
Fuel Cell Catalyst Support
EMI Shielding
General Development
C) Scale-up and Commercialization Activity 13
Conclusion 14
References 14
iii
323

Introduction
A method for the bulk preparation of carbon nanofibers from gasified coal has recently
been developed by Applied Sciences Inc. (ASI) in Cedarville Ohio. The synthetic
technique produces coal-derived nanofibers in the form of low-density, spongy clumps,
similar to other carbon nanofiber products made by ASI. This raw material has the
potential for use in high-value products, but only after suitable processing.
ASI nanofibers can be made into pure sheet form using a method created by Inorganic
Specialists in Miamisburg Ohio. Freestanding sheets between 2 and 20 mils thick have
been produced. It is thought that sheet form will add value and make the product
marketable for applications such as membranes, electrodes, composite pre-forms, fuel
cell components, etc. The sheet fabrication method is currently a laboratory process
similar to papermaking; it needs to be improved to make it suitable for scale-up, and
useful applications need to be demonstrated. Such development efforts are the focus of
this project, testing fabrication options to make a manufacturable product as well as
examining new applications for the product. The preparation of pure nanofiber sheets
was principally studied, although some effort pursued the incorporation of binders.
Imparting improved toughness/conductivity to these sheets will increase their commercial
appeal and improve the prospects for mechanical scale-up of sheet fabrication.
Applied Sciences Nanofibers and Coal-Derived Nanofibers
Applied Sciences “nanofibers” are actually large diameter nanotubes with an uncommon
morphology. In contrast to conventional nanotubes that consist of concentric tubes of
graphite sheets (A), the ASI nanofibers consist of stacked cups of graphite sheets (B),
with edge sites along their length.
A B
ASI produces two types of nanofibers in bulk. One is a 60 nm diameter nanofiber with
structure B, and the second consists of structure B coated with a thick layer of turbostratic
carbon (C), giving it a much larger diameter (200 nm). This distinction is noted because
to date, the nanotubes ASI has made from coal have been produced with the recipe that
produces structure C, and structure C makes a paper with different properties than
structure B.
C
-1-
- - - - - - - - - - - - - -
- - - - - - - - - - - - - -
- - - - - - - - - - - - - -
- - - - - - -
- - - - - - -
324

As synthesized by Applied Sciences, the coal-derived nanofiber contains more
contaminants (metal, soot, sulfur) than its hydrocarbon-derived analog. These can be
reduced with processing, but our study was not overly concerned with this- we did not
want to add extra processing steps to make a very pure paper, we simply wanted to
explore the basics of sheet preparation and strength. Happily, during the course of this
program, the coal-derived nanofibers made by ASI became cleaner, less contaminated
with carbon soot, as shown below.
Early batch of coal-derived nanotubes Cleaner coal nanotubes from later batch
The sheets we are producing with our papermaking procedure can vary significantly in
density, depending on the fiber used and the way it is dispersed in its stock solution. We
have observed paper densities over the range of 0.12 g/cc to 0.37 g/cc. Since the density
of an individual ASI nanotube has been calculated as ~1.5 g/cc, this corresponds to a
volume packing density of 8% to 25%.
-2-
325

EXECUTIVE SUMMARY
This project is focused on the development of paper sheets made from coal-derived
carbon nanofibers from the company Applied Sciences,Inc. (ASI). The ultimate goal is
to develop a higher-value form of coal nanofibers by finding ways to make them into
papers or monoliths, and then demonstrate applications for these materials. Applied
Sciences produces the coal nanofibers from a gasified coal feedstock instead of the
hydrocarbon gas that they normally use.
Here is a synopsis of the development activities carried out for this project:
Monolith Preparation, SiC composite preparation
A 1” thick slab of nanofiber was prepared by the papermaking route and fired to 1500 C.
It shrank uniformly without cracking, showed a high conductivity, and was subsequently
used to make a SiC composite by infiltrating the porous slab with a pre-ceramic.
Binder Development
We have previously encountered severe conductivity and flexibility reductions when the
paper is modified with binders to add strength. These problems were mitigated by
changing the binder application technique and by using a latex binder.
Scrim-Based Paper
Making the coal-derived nanofibers into a paper using a carbon fiber web reinforcement
(a nonwoven scrim) was found to be an excellent way of adding strength, flexibility, and
conductivity to coal-derived nanofiber papers.
All-Coal Electrochemical Capacitor Electrode
Carbon electrodes made out of coal nanofibers or a mixture of coal nanofibers and coal
powder were evaluated as electrochemical capacitor electrodes. The mixed electrode
showed excellent power features, but the concern is that impurities in the coal could hurt
its performance over time.
Nanofiber Paper as a Fuel Cell Catalyst Support
Hydrocarbon-derived nanofiber paper was found to have extremely beneficial properties
in both methanol and hydrogen fuel cells, showing a catalyst utilization improvement of
1600% in one case. The coal-derived paper severely underperformed these results.
EMI Shielding
Nanofiber paper has been shown to provide electromagnetic shielding at high
frequencies, but whether is provides enough shielding to be of interest to the military
remains to be seen.
Scale Up Activities
A 50 liter reactor was purchased to handle larger feedstock quantities. After much
searching, a filter medium suitable for continuous papermaking was identified. This is
the key component that will allow us to design a papermaking machine for continuous
nanofiber paper production.
-3-
326
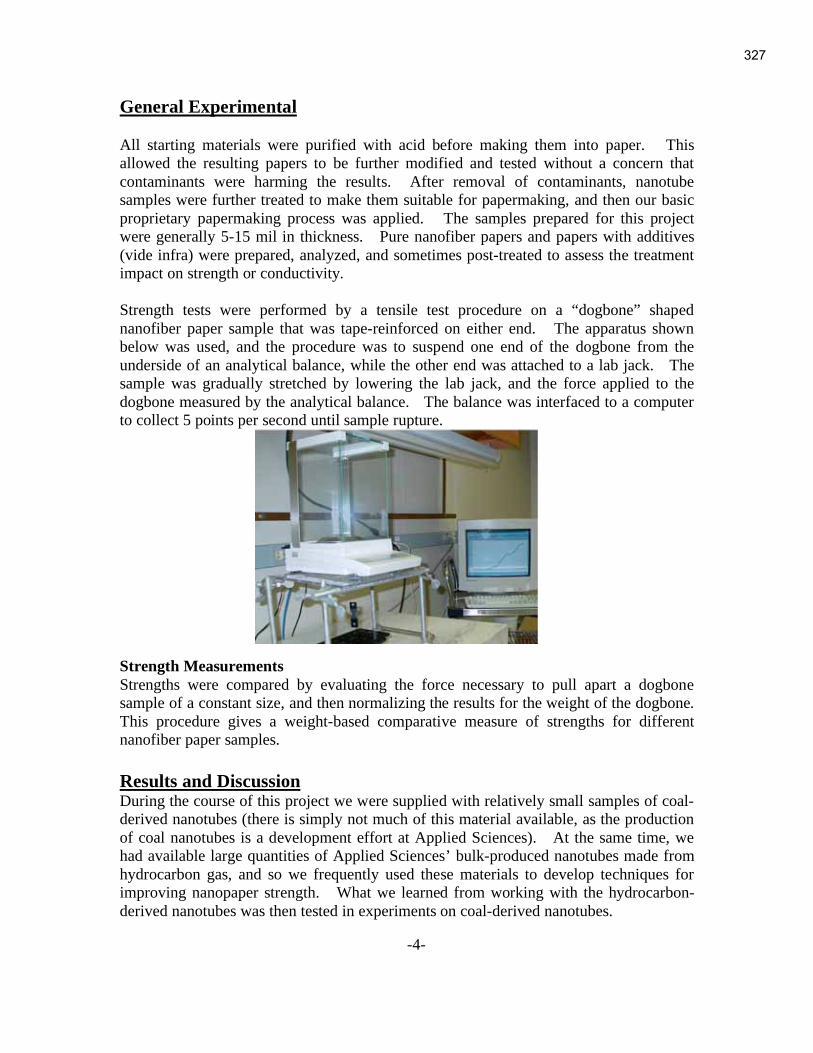
General Experimental
All starting materials were purified with acid before making them into paper. This
allowed the resulting papers to be further modified and tested without a concern that
contaminants were harming the results. After removal of contaminants, nanotube
samples were further treated to make them suitable for papermaking, and then our basic
proprietary papermaking process was applied. The samples prepared for this project
were generally 5-15 mil in thickness. Pure nanofiber papers and papers with additives
(vide infra) were prepared, analyzed, and sometimes post-treated to assess the treatment
impact on strength or conductivity.
Strength tests were performed by a tensile test procedure on a “dogbone” shaped
nanofiber paper sample that was tape-reinforced on either end. The apparatus shown
below was used, and the procedure was to suspend one end of the dogbone from the
underside of an analytical balance, while the other end was attached to a lab jack. The
sample was gradually stretched by lowering the lab jack, and the force applied to the
dogbone measured by the analytical balance. The balance was interfaced to a computer
to collect 5 points per second until sample rupture.
Strength Measurements
Strengths were compared by evaluating the force necessary to pull apart a dogbone
sample of a constant size, and then normalizing the results for the weight of the dogbone.
This procedure gives a weight-based comparative measure of strengths for different
nanofiber paper samples.
Results and Discussion During the course of this project we were supplied with relatively small samples of coal-
derived nanotubes (there is simply not much of this material available, as the production
of coal nanotubes is a development effort at Applied Sciences). At the same time, we
had available large quantities of Applied Sciences’ bulk-produced nanotubes made from
hydrocarbon gas, and so we frequently used these materials to develop techniques for
improving nanopaper strength. What we learned from working with the hydrocarbon-
derived nanotubes was then tested in experiments on coal-derived nanotubes.
-4-
327

The hydrocarbon derived nanofibers from Applied Sciences have structures A and B. B
makes a weaker paper than A. The coal-derived nanofiber paper has a strength
comparable that of fiber B, and a similar structure. Our expectation is that future coal
fiber development can produce a nanofiber comparable to A, which will lead to a
stronger coal-derived nanofiber paper.
A B
A) NEW PAPER EMBODIMENTS
1) Coal Nanofiber Block
A monolith of coal nanofibers was formed by filtering a large amount of suspension to
form a thick sample. This brick was then fired to 1500 C under vacuum to partially
graphitize it. The sample did not crumble upon firing, and in fact formed a strong
porous monolith. Its measured electrical conductivity (4-point probe) was equal to the
highest conductivity seen for analogous monoliths of hydrocarbon-derived nanofibers
(2 S/cm). As good as this result was, it was still disappointing that the bulkier coal-
derived nanofibers did not conduct better than the smaller-diameter hydrocarbon
nanofibers. It is somewhat odd that nanofibers of different diameter and structure seem
to become equivalent conductors when they are fired to a sufficiently high temperature.
Monolithic porous blocks of coal nanofibers are of interest as pre-forms for composites.
Composites would seem to be a good application for coal-derived nanofibers. Unlike
some applications where high purity is required (some battery applications), composites
are compatible with some of the naturally-occurring silicon oxides or metals in coal.
2) Conductivity Reduction by Binders, and Overcoming this Problem
As reported at the CPCPC meeting in May 2005, the incorporation of binders that
provide tensile strength enhancement can diminish the conductivity of the nanofiber
sheet, as seen in the example below.
Binder Content Relative Resistance, ohms
Plain Nanofiber Paper 0 3.2
Paper with Binder 1 .5% 400
Paper with Binder 1 1.5% 1800
Paper with Binder 1 7.0% 3300
-5-
328

This apparently happens when the binder deposits between individual nanofibers or
groups of nanofibers, creating a insulating layer between them. This can be seen in the
SEM below, where webs of binders are evident at fiber junction points.
Recent work has shown that this problem can be overcome by changing the way the
binder is applied, and by incorporating a conductive additive (‘binder 2’ in the list
below). This strategy not only allow one to overcome the resistance added by binders,
they actually make the paper more conductive than the original binderless paper. The
series of samples below shows the effect- it compares binderless paper, papers with
binders, and papers with binders combined with conductive additive.
Nanofiber Relative Relative Resistance
Paper with Resistance with Binder, Conductive Additive,
No Binder with Binder and New Processing
Binderless 200 ohm
Binder 1 460 ohm 150 ohm
Binder 2 265 ohm 76 ohm
Furthermore, by using a flexible binder such as a latex, the paper retains its flexibility.
The ability to make a nanofiber paper with the best combination of strength, flexibility,
and conductivity is what will make nanofiber paper a commercial success. Applied
Sciences, who makes the raw nanofibers, is interested in obtaining nanofiber papers for
developing a number of applications (EMI shielding, composites, host material, others).
However, instead of using papers tailored for each application, they want to work with
one variety. This illustrates how creating an optimized blend of properties is an
important goal.
-6-
329

3) Preparation of a Coal Nanofiber Sheet on a Carbon Scrim
A different approach to achieving a strong, flexible, conductive nanofiber sheet was
examined in this program, the strategy of forming the nanofiber sheet on a nonwoven
mesh of larger carbon fibers. We tested a very thin (2-mil), extremely open mesh
nonwoven as a reinforcing material, filtering the nanofiber suspension directly onto the
mesh to form the reinforced paper. This works extremely well. When a 10-mil
nanofiber sheet is prepared with the mesh reinforcement, the mesh reinforcement only
represents 10% of the weight of the paper, and yet the paper has more conductivity than
that produced by any other strategy we have tested. No binders were added in this
process. The resulting sheet is flexible and extremely strong. At this time, this appears
to be the most promising way to create a robust coal-derived nanofiber sheet that shows
excellent conductivity. This type of nanofiber paper has shown good performance as a
fuel cell catalyst support.
Graphitized Nanofibers on a Carbon Scrim
Past testing on nanofibers as lithium ion anodes has shown that the graphitized form of
the nanofiber works better than other nanofiber varieties. However, a graphitic
nanofiber by itself will not form a nanofiber paper that has good cohesion. Therefore we
tested making the material on a scrim, in a process similar to that described above. The
resulting sheet did not cleanly release from its filter backing, and so the experiment was
tried again using a 20% content of non-graphitized nanofibers as a sort of binder. This
proved more successful, creating a strong sheet that is mostly graphitized nanofibers.
Applied Sciences is currently investigating the lithium ion application in an NSF
program, with participation by General Motors.
B) APPLICATIONS DEVELOPMENT
1) A Coal Nanofiber/SiC composite
The monolith of coal nanofibers described in the Section A of this report was used as the
starting material to make a composite. This disk, ~3” in diameter and 5mm thick, was
infused with a commercial pre-ceramic organometallic for making silicon carbide (from
the Starfire corporation), and the infused monolith was fired to 8000C according to the
manufacturer’s directions to convert the liquid organosilicon to silicon carbide. After
firing, it was found that the resulting disk of nanofiber-reinforced silicon carbide was
about 15% smaller than the original disk. The infused disk had shrunk during the course
of conversion to a SiC composite, but retained its shape. It is clearly not fully dense
(density ~1.6 g/cc), but this was expected, as Starfire’s instructions call for iterations of
infusion/firing to achieve a fully dense SiC/carbon sample. We approached Applied
Sciences with this information and furnished them a sample, because ASI was doing a
project on SiC/nanofiber composites at the time. However, ASI chose not to engage us
to pursue this approach, preferring their in-house strategy of infiltrating nanofiber
compacts with SiO vapor.
-7-
330
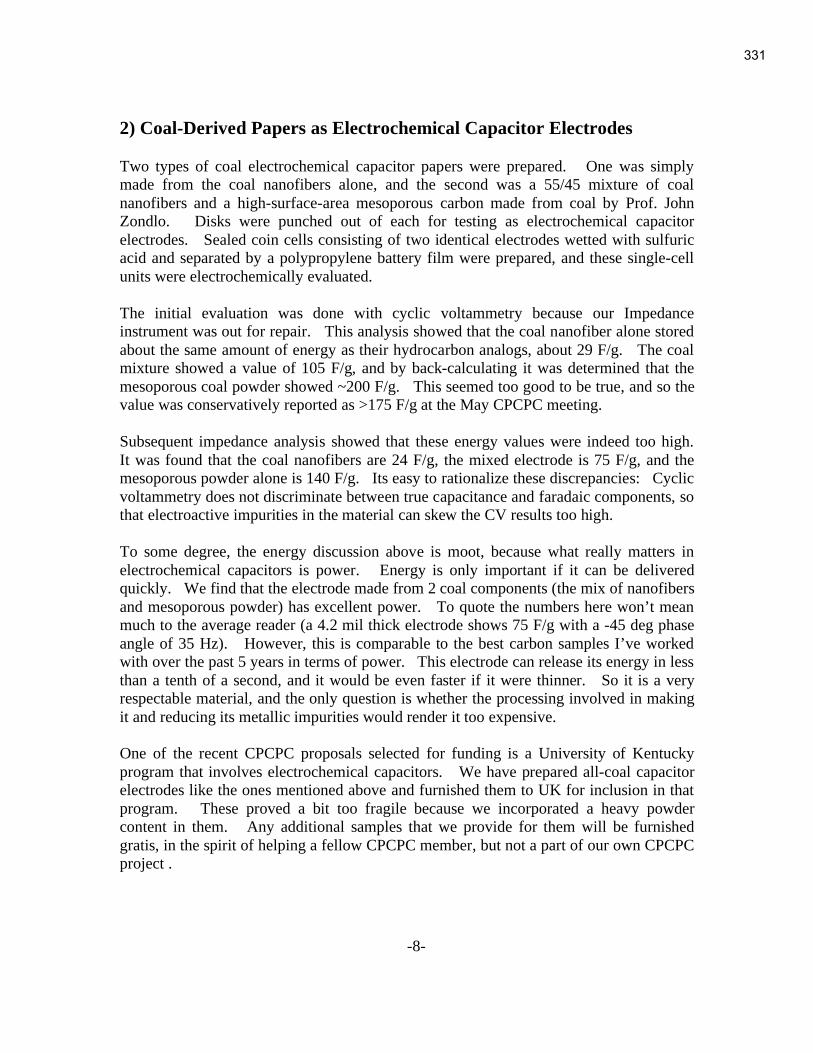
2) Coal-Derived Papers as Electrochemical Capacitor Electrodes
Two types of coal electrochemical capacitor papers were prepared. One was simply
made from the coal nanofibers alone, and the second was a 55/45 mixture of coal
nanofibers and a high-surface-area mesoporous carbon made from coal by Prof. John
Zondlo. Disks were punched out of each for testing as electrochemical capacitor
electrodes. Sealed coin cells consisting of two identical electrodes wetted with sulfuric
acid and separated by a polypropylene battery film were prepared, and these single-cell
units were electrochemically evaluated.
The initial evaluation was done with cyclic voltammetry because our Impedance
instrument was out for repair. This analysis showed that the coal nanofiber alone stored
about the same amount of energy as their hydrocarbon analogs, about 29 F/g. The coal
mixture showed a value of 105 F/g, and by back-calculating it was determined that the
mesoporous coal powder showed ~200 F/g. This seemed too good to be true, and so the
value was conservatively reported as >175 F/g at the May CPCPC meeting.
Subsequent impedance analysis showed that these energy values were indeed too high.
It was found that the coal nanofibers are 24 F/g, the mixed electrode is 75 F/g, and the
mesoporous powder alone is 140 F/g. Its easy to rationalize these discrepancies: Cyclic
voltammetry does not discriminate between true capacitance and faradaic components, so
that electroactive impurities in the material can skew the CV results too high.
To some degree, the energy discussion above is moot, because what really matters in
electrochemical capacitors is power. Energy is only important if it can be delivered
quickly. We find that the electrode made from 2 coal components (the mix of nanofibers
and mesoporous powder) has excellent power. To quote the numbers here won’t mean
much to the average reader (a 4.2 mil thick electrode shows 75 F/g with a -45 deg phase
angle of 35 Hz). However, this is comparable to the best carbon samples I’ve worked
with over the past 5 years in terms of power. This electrode can release its energy in less
than a tenth of a second, and it would be even faster if it were thinner. So it is a very
respectable material, and the only question is whether the processing involved in making
it and reducing its metallic impurities would render it too expensive.
One of the recent CPCPC proposals selected for funding is a University of Kentucky
program that involves electrochemical capacitors. We have prepared all-coal capacitor
electrodes like the ones mentioned above and furnished them to UK for inclusion in that
program. These proved a bit too fragile because we incorporated a heavy powder
content in them. Any additional samples that we provide for them will be furnished
gratis, in the spirit of helping a fellow CPCPC member, but not a part of our own CPCPC
project .
-8-
331

3) Nanofiber Paper as a Fuel Cell Catalyst Support
The data shown below is from a test of nanofiber paper as a methanol fuel cell anode. In
this test, a methanol/water fuel mixture is fed into the fuel cell.
Three different anode configurations were tested in order to compare the effect of support
material on methanol oxidation current. Each of the tests below used the standard 50:50
PtRu catalyst (Johnson Matthey). In all cases the catalyst was deposited by air spraying
a solution of 12wt% Nafion ionomer and 80mg of PtRu suspended in 600 L of
isopropanol. The different configurations are illustrated in the figure below.
A B C
Configurations A and B used the Toray Carbon Paper (CP) (0.09 mm thickness, De Nora
Inc.) as a support, whereas C used the nanofiber paper support.
Type A samples (corresponding to the traditional DMFC Nuvant standard [1-3]) were
produced by spraying the Toray CP with a carbon black (Alfa Aesar)/Nafion ionomer
solution, followed by drying, and subsequent deposition of the PtRu catalyst (4mg/cm2).
In Type B samples the Toray CP was sprayed with a solution of single-wall carbon
nanotubes (Carbon Nanotechnologies, Inc.) and Nafion ionomer (the nanotubes serving
as an alternative to carbon black as a pore-filler and catalyst-support material), followed
by drying, and subsequent deposition of the PtRu catalyst (.9mg/cm2).
For Type C samples the PtRu catalyst was directly deposited onto the nanofiber paper
(1.1 mg/cm2).
Analysis by Scanning Electron Microscopy showed that in each case the surfaces were
fairly uniform, and the catalyst well-dispersed. These samples were simultaneously
evaluated for electrochemical performance towards MeOH oxidation in the commercial
Nuvant test cell; a multi-array instrument that has been shown to yield data that correlate
well with real fuel cell performance [1].
Samples prepared as described above were analyzed simultaneously in triplicates in order
to determine their activity toward methanol oxidation. The test was run under half cell
condition in which the anode array had 0.5M Methanol flowing over the backside of each
anode at 8mL/min. The cathode had humid hydrogen gas at ~180sccm. Figure 1 shows
Linear Sweep Voltammetry (LSV), at scan conditions of 2mV/sec over the voltage range
0 to 1.0V versus Dynamic Hydrogen Electrode (DHE).
-9-
catalyst Carbon black/ionomer
catalyst
Nanotube/ionomer
catalyst
Carbon fiber
paper
Carbon fiber
paper Nanofiber paper
332
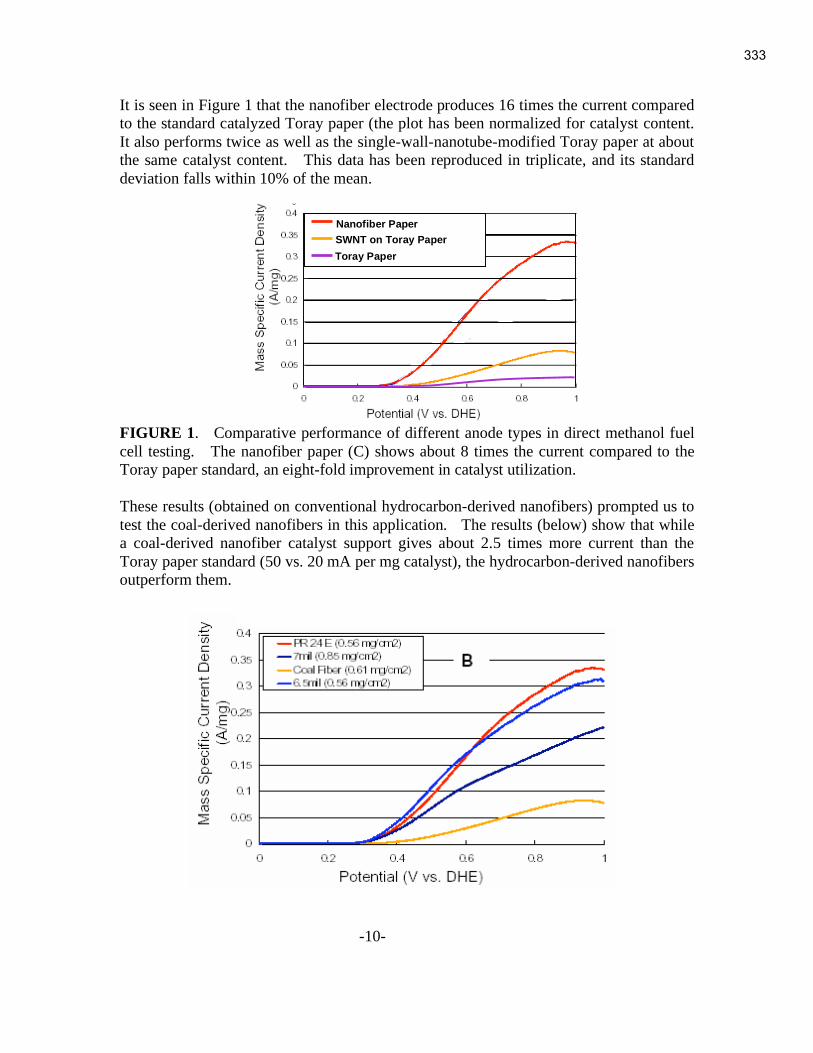
It is seen in Figure 1 that the nanofiber electrode produces 16 times the current compared
to the standard catalyzed Toray paper (the plot has been normalized for catalyst content.
It also performs twice as well as the single-wall-nanotube-modified Toray paper at about
the same catalyst content. This data has been reproduced in triplicate, and its standard
deviation falls within 10% of the mean.
FIGURE 1. Comparative performance of different anode types in direct methanol fuel
cell testing. The nanofiber paper (C) shows about 8 times the current compared to the
Toray paper standard, an eight-fold improvement in catalyst utilization.
These results (obtained on conventional hydrocarbon-derived nanofibers) prompted us to
test the coal-derived nanofibers in this application. The results (below) show that while
a coal-derived nanofiber catalyst support gives about 2.5 times more current than the
Toray paper standard (50 vs. 20 mA per mg catalyst), the hydrocarbon-derived nanofibers
outperform them.
-10-
Nanofiber Paper
SWNT on Toray Paper
Toray Paper
333

A Second Fuel Cell Application: Cathode for Oxygen Reduction
The cathode is the limiting factor in power output for a hydrogen fuel cell, so much so that the performance of a complete H2 fuel cell essentially mimics the cathode. Here we compare a commercial ELAT bi-layer support to the same material modified with a nanofiber paper layer. The same catalyst was applied in the same way to each sample, and the two samples were run at the same time in the same cell against a common anode.
It is seen that the nanofiber material exhibits about 3 times the power output per gram of
catalyst. This significant improvement was obtained using a hydrocarbon-derived
nanofiber; the coal nanofiber (as currently produced) was not deemed pure enough to test.
This data was taken at 40 C, and it was found that at 60 C the improvement dropped to a
doubling of power. It seems that in fuel cells, everything works better at higher
temperatures.
4) Nanofiber Paper EMI Shielding Data
One application for nanofibers is as an electromagnetic shielding material, in particular, a
shielding layer that operates in a very high frequency range. There is currently a
solicitation from the Dept of Defense to develop a composite material with carbon
nanofibers for shielding in the 8-18GHz range. They ask for a shielding layer that is
about 50 mils thick, which is thicker than the paper we typically make (at this thickness it
is more like cardboard), but it is readily prepared.
To see if nanofiber paper works for this purpose, a few different varieties have been
submitted to Wright Patterson Air Force Base for high-frequency shielding tests. The
data shown below is typical of the data seen over the range of 8-12GHz.
-11-
ELAT bi-layer
Nanofiber modified
Mass Specific Current (mA/mg)
Mass Specific
Power (mW/mg) Potential
(V)
Cathode at
40 C
334
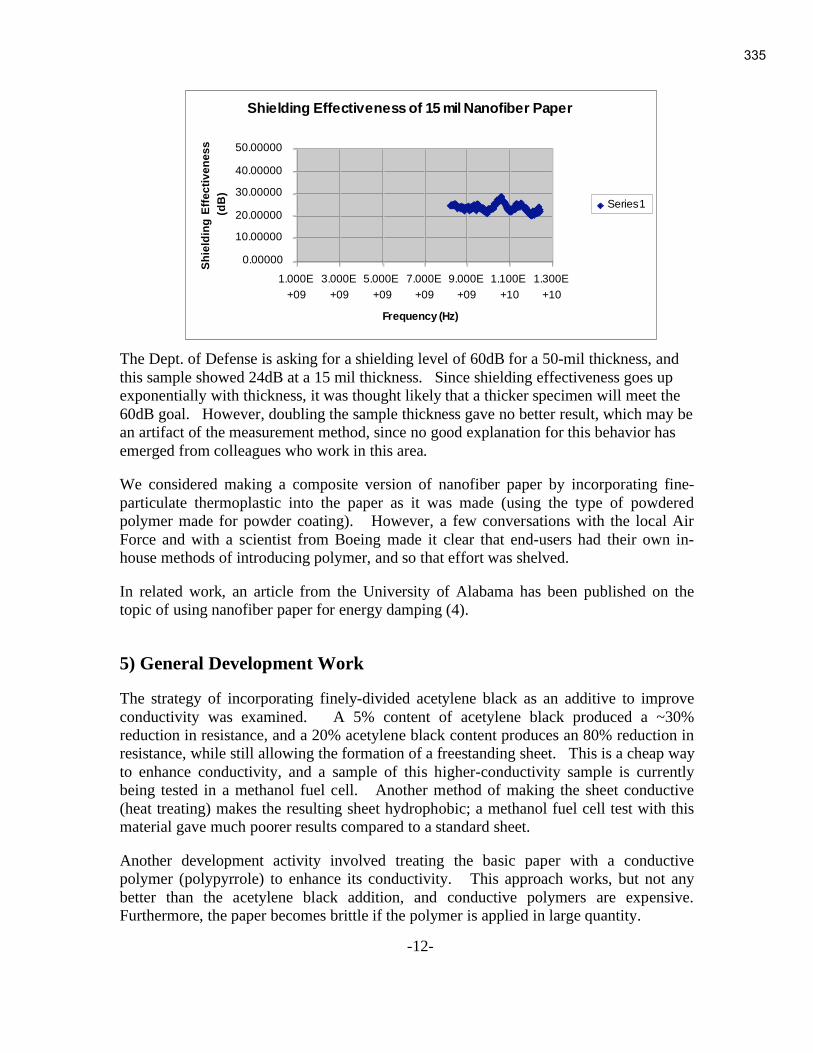
The Dept. of Defense is asking for a shielding level of 60dB for a 50-mil thickness, and
this sample showed 24dB at a 15 mil thickness. Since shielding effectiveness goes up
exponentially with thickness, it was thought likely that a thicker specimen will meet the
60dB goal. However, doubling the sample thickness gave no better result, which may be
an artifact of the measurement method, since no good explanation for this behavior has
emerged from colleagues who work in this area.
We considered making a composite version of nanofiber paper by incorporating fine-
particulate thermoplastic into the paper as it was made (using the type of powdered
polymer made for powder coating). However, a few conversations with the local Air
Force and with a scientist from Boeing made it clear that end-users had their own in-
house methods of introducing polymer, and so that effort was shelved.
In related work, an article from the University of Alabama has been published on the
topic of using nanofiber paper for energy damping (4).
5) General Development Work
The strategy of incorporating finely-divided acetylene black as an additive to improve
conductivity was examined. A 5% content of acetylene black produced a ~30%
reduction in resistance, and a 20% acetylene black content produces an 80% reduction in
resistance, while still allowing the formation of a freestanding sheet. This is a cheap way
to enhance conductivity, and a sample of this higher-conductivity sample is currently
being tested in a methanol fuel cell. Another method of making the sheet conductive
(heat treating) makes the resulting sheet hydrophobic; a methanol fuel cell test with this
material gave much poorer results compared to a standard sheet.
Another development activity involved treating the basic paper with a conductive
polymer (polypyrrole) to enhance its conductivity. This approach works, but not any
better than the acetylene black addition, and conductive polymers are expensive.
Furthermore, the paper becomes brittle if the polymer is applied in large quantity.
-12-
Shielding Effectiveness of 15 mil Nanofiber Paper
0.00000
10.00000
20.00000
30.00000
40.00000
50.00000
1.000E
+09
3.000E
+09
5.000E
+09
7.000E
+09
9.000E
+09
1.100E
+10
1.300E
+10
Frequency (Hz)
Sh
ield
ing
E
ffe
ctiv
en
es
s
(d
B)
Series1
335

C) Scale-up and Commercialization Activities
Large amounts of nanofiber feedstock are needed to pursue scale-
up activities, and so a customized 50 liter reactor was purchased for
preparative purposes. It is similar to the unit seen here, but with a
larger volume and a high-horsepower stirrer to handle viscous
solutions. This reactor was used during the CPCPC program to
process 10 liter quantities of coal nanofiber papermaking feedstock,
but it was not purchased only for the CPCPC program. We have
accordingly included only of its cost in our upcoming CPCPC
invoice.
Beyond the CPCPC work, this reactor’s capacity supports the
development activity of building a continuous papermaking
machine. Our current plan is to contract Southeast Nonwovens in
South Carolina to design and build a pilot-scale papermaking unit
that would produce a nanofiber paper roll about 12”-16” wide.
This size is large enough to produce an introductory commercial
product. The development process that we go through as we build the unit will yield
crucial information that could be applied to even larger scale-ups in the future.
We are currently seeking funding to pursue this venture, which we expect to take one
year. Cost estimates have been developed, and a confidentiality agreement with
Southeast Nonwovens is in place. We have met with Southeast Nonwovens at their plant
in South Carolina and discussed the project.
One key component of a successful unit will be the forming sheet. It needs to have the
right sheet-release properties, sufficient durability, and appropriate pore size. It also has
to be commercially available in a length and width that will allow its use on a continuous
manufacturing line that makes a sheet at least 14” in width. During this program we
examined numerous polymer membranes and nonwovens from different manufacturers.
These all had different advantages and disadvantages- some gave great release but made
a non-uniform paper. Some filtered too slowly, while others allowed nanofibers to
permeate into the membrane. After many failures, we tried to adapt some
underperforming materials by using a double thickness of a durable roll-stock filter
material to even out the inhomogeneities in filtration. But this unsatisfactory solution
was later abandoned when we finally found a suitable material, whose identity we
consider proprietary.
Consult with Commercial Papermaker
Discussions were held with a commercial papermaker (Hollingsworth and Vose) at their
R&D unit in Massachusetts. The purpose of the visit was to establish a relationship with
this specialty paper manufacturer as well as developing insight into tailoring our process
-13-
336
for compatibility with standard manufacturing methods. This company is a potential
licensee for making nanofiber paper, and they generously offered tips to further develop
the process. They suggested specialty binders suitable for carbon nanofibers, furnished
references to small developmental facilities, and provided a tour of their wet-laid pilot
operation. The pilot unit is currently used for glass-fiber papermaking, but it would be
suitable for the process used with nanofibers.
Conclusion
The limiting factor on the development of coal-derived nanofiber papermaking is the
present state of coal-nanofiber production. Applied Sciences has made a limited quantity
of nanofibers from a gasified coal feedstock, with no plans to continue that work unless
there is support for more development. They are currently pursuing a large Ohio
initiative that will integrate their nanofiber production with a fuel source from a coal-
burning power plant. If they can successfully refine that fuel so that they can make an
exact duplicate of the nanofibers they currently make from hydrocarbons, it will make
sense to revisit coal-derived nanofiber applications development.
This CPCPC program has shown that carbon nanofibers can be used in a number of
applications, and that paper made from nanofibers (coal-derived or otherwise) can be
made in a variety of ways (with either binders or a reinforcing scrim) and scaled up to a
continuous production process. In applications requiring high purity (such as fuel cells
or electrochemical capacitors), a coal-derived nanofiber paper may not be as suitable as
one made from hydrocarbons. But for composites or EMI shielding, coal derived
nanofiber papers could represent a less expensive and equally effective option.
The promise of carbon nanofibers is clear, and the ability to add value to them by making
them into a paper is a good step towards mainstream introduction. The scale-up
activities done during this program have solved most of the problems associated with
creating a continuous papermaking machine that can make nanofibers a cost effective
material available in significant quantity. The identification of a moving filtration
medium suitable for this unit was a key accomplishment of this project- it establishes the
feasibility of creating a papermaking machine, which we now anticipate building. In the
interim, our company will begin selling nanofiber paper at our website that will shortly
be operational, at inorganicspecialists.com.
References
1) Carbon, Electrochemical and Physiochemical Properties, Kim Kinoshita, Wiley
Interscience (1988).
2) Introduction to Nonwovens, Albin Turbak, Tappi Press (1998).
3) Chan, B., et al., Comparsion of High-Throughput Electrochemical Methods for
Testing Direct Methanol Fuel Cell Anode Electrocatalysts. J. Electrochem. Soc., 2005.
152(3): p. A594-A600.
4) Jihua Gou et al, Journal of Nanomaterials, Vol 2006, Article ID 32803 (2006).
-14-
337
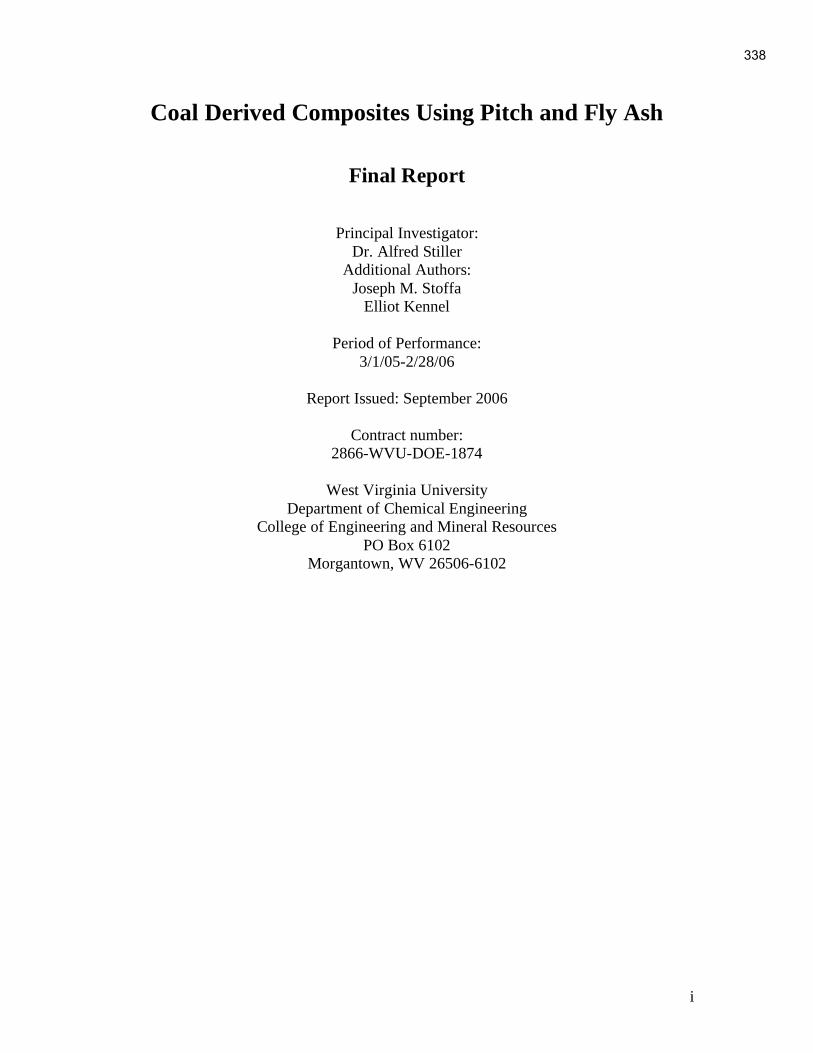
i
Coal Derived Composites Using Pitch and Fly Ash
Final Report
Principal Investigator:
Dr. Alfred Stiller
Additional Authors:
Joseph M. Stoffa
Elliot Kennel
Period of Performance:
3/1/05-2/28/06
Report Issued: September 2006
Contract number:
2866-WVU-DOE-1874
West Virginia University
Department of Chemical Engineering
College of Engineering and Mineral Resources
PO Box 6102
Morgantown, WV 26506-6102
338

ii
Disclaimer
This report was prepared as an account of work sponsored by an agency of the United
States Government. Neither the United States Government nor any agency thereof, nor
any of their employees, makes any warranty, express or implied, or assumes any legal
liability or responsibility for the accuracy, completeness, or usefulness of any
information, apparatus, product, or process disclosed, or represents that its use would not
infringe privately owned rights. Reference herein to any specific commercial product,
process, or service by trade name, trademark, manufacturer, or otherwise does not
necessarily constitute or imply its endorsement, recommendation, or favoring by the
United States Government or any agency thereof. The views and opinions of authors
expressed herein do not necessarily state or reflect those of the United States Government
or any agency thereof.
339

iii
Abstract
Carbon composites based upon fly ash and coal tar pitch were manufactured from
commercially available pitches. Processes were developed to manufacture these
composites at atmospheric pressure, in contrast to previous protocols which were
accomplished at approximately 500 psig pressure, and 500 °C. New reactors were
built for this purpose. Although the reactions were to be held at atmospheric pressure it
was decided to have thick-walled high-pressure reactors made because they might also
find application in the preparation of pitches.
Carbon foams were manufactured using high softening point pitch produced by
Koppers Inc, as well as a devolatilized coal tar pitch produced in the research laboratories
of West Virginia University. The foams produced by both of these materials showed
significant improvement over non-processed coal tar binder pitch.
Thermal properties were assessed using torch testing in order to determine
whether the addition of fly ash or other sources of silica could be used to improve the
temperature resistance of the materials.
340

iv
Table of Contents
List of Figures .........................................................................................................v
List of Tables..........................................................................................................vi
I. EXECUTIVE SUMMARY .........................................................................................7
II. INTRODUCTION .....................................................................................................7
III. EXPERIMENTAL .................................................................................................11
3.1 Manufacture of Foams at Ambient Pressure........................................................11
3.2 Experimentation .................................................................................................12
3.3 Preliminary Experiments with Coal Tar Pitch .....................................................13
3.4 Conclusions from Preliminary Experiments ........................................................14
3.5 Second set of experiments with coal tar pitches...................................................15
3.6 Silica Based Additive to Foams and Composites.................................................18
3.7 Advanced Work with Silica Oxide Composite Material (Non-foam)...................20
3.8 Calcination .........................................................................................................21
3.9 The Introduction of Fly ash to Carbon Foams and Composites............................22
3.10 Testing the Samples for Heat Shielding Properties ............................................23
IV. RESULTS AND ANALYSIS.................................................................................25
Appendix 1............................................................................................................31
V. Conclusion and Summary ........................................................................................41
VI. References..............................................................................................................41
341

v
List of Figures
Figure 1. Compressive stress-strain plot for a calcined carbon foam with fly ash
reinforcement (raw data using an Instron load frame). .....................................................8
Figure 2. Compressive stress-strain plot for an uncalcined high density (0.8 g/cm3)
carbon foam with fly ash reinforcement (smoothed data using an Instron load frame). The
observed strength is higher than that observed for other WVU carbon foams. Note also
the apparent plastic behavior at low strain. ......................................................................8
Figure 3. Plasma torch testing, with a peak temperature of thousands of degrees Kelvin,
though not scientifically rigorous, shows that carbon foam samples are exceptionally
resistant to intense heating...............................................................................................9
Figure 4. Close-up of the carbon sample, still glowing white hot after the torch is
removed. Plasma torches are able to cut through steel in seconds, but carbon foam is able
to resist cutting for several minutes..................................................................................9
Figure 5. High temperature pressure vessel...................................................................13
Figure 6. Foam made from 185 oC softening point pitch ...............................................16
Figure 7. Foam made from devolatilized binder pitch ...................................................17
Figure 8. Samples containing from 5 % to 19 % SiO2. ..................................................19
Figure 9. Diagram of Experimental Apparatus..............................................................24
Figure 10. Oxygen-acetylene torch ...............................................................................24
Figure 11. Optical pyrometer with response time of 12ms ............................................25
Figure 12. Progression of flame burning through composite sample .............................26
Figure 13. 100 % de-volatilized pitch composite...........................................................27
Figure 14. Close-up of burn through in silica containing sample...................................28
Figure 15. Relative temperature of composite cool side. ...............................................30
Figure 16. Burn through time as a function of fly ash content. ......................................32
Figure 17. Adjusted burn through time as a function of fly ash content. ........................32
Figure 18. Burn through time as a function of specific gravity. .....................................33
Figure 19. Adjusted burn through time as a function of specific gravity........................33
Figure 20. Burn through time as a function of devolatilized pitch content. ....................34
Figure 21. Adjusted burn through time as a function of devolatilized pitch content.......34
Figure 22. Burn through time as a function of binder pitch content. ..............................35
Figure 23. Adjusted burn through time as a function of binder pitch content.................35
Figure 24. Burn through time as a function of silica content. ........................................37
Figure 25. Adjusted burn through time as a function of silica content. ..........................37
Figure 26. Burn through time as a function of specific gravity. .....................................38
Figure 27. Adjusted burn through time as a function of specific gravity........................38
Figure 28. Burn through time as a function of devolatilized pitch content. ....................39
Figure 29. Adjusted burn through time as a function of devolatilized pitch content.......39
Figure 30. Burn through time as a function of binder pitch content. ..............................40
Figure 31. Adjusted burn through time as a function of binder pitch content.................40
342

vi
List of Tables
Table 1. Koppers Coal-Tar Pitch Properties .................................................................11
Table 2. Characteristics of Various Commercial Pitches ..............................................15
Table 3. Properties of the Feed Pitches. ........................................................................17
Table 4. Summary of foaming work with SiO2. ...........................................................20
Table 5. Summary of Monolithic samples....................................................................22
Table 6. Fly Ash Blends for Foams and Composites .....................................................23
Table 7. Fly Ash Composites........................................................................................31
Table 8. Silica Composites Summary. ..........................................................................36
343

I. EXECUTIVE SUMMARY
The object of this research is to make a carbon composite material containing
silica oxide based precursors to be used as a heat absorbing shield for high-temperature
applications. When carbon foam is calcined to 1000 °C its flammability is substantially
reduced despite the high enthalpy of combustion of carbon. In addition, it can be an
extremely good insulating material. Because of this fire retardant behavior and thermal
insulation property, one of the potential applications of this carbon foam material is as a
firebreak for ship-board applications. Such carbon foam material is being developed to
support the Navy Surface Warfare Center. It was hypothesized that the heat absorbing
capacity of the foam could be enhanced by the addition of reactant silica oxide materials.
At very high temperatures in reducing environment, or one that is oxygen depleted,
silicon oxide can be reduced to silicon carbide.
This concept exploits the properties of coal derived materials including coal tar
pitch derived materials and coal-derived Class F low-carbon pozzolanic fly ash as a
reinforcement. Since raw coal consists of organic hydrocarbons as well as mineral
matter, it may seem counterintuitive to go to the trouble of combining fly ash and pitch
since they were originally present together in the coal. However, data to date shows that
fly ash can indeed reinforce carbon composites derived from coal, resulting in a very low
cost, easily fabricated composite with extremely attractive material properties. Coal tar
pitch and fly ash can be used to produce carbon foams as well as monolithic composites.
These materials demonstrate excellent fire resistance, thermal insulation, mechanical
properties such as strength and modulus (particularly in compression). In addition, the
combination of carbon and silicon oxide results in the possibility of endothermically
forming silicon carbide, with an endothermic (negative) enthalpy of over -20 MJ/kg.
This enthalpy is not reversible, however. Still, this unique property results in
potential use for applications that require absorption of huge quantities of energy for a
one-time basis. Such applications can include reentry shielding for space craft.
These composite materials can be in the form of porous foams, or dense
monoliths. Preliminary data taken to date shows that these materials can be quite strong,
exhibiting compression strength and modulus significantly higher than carbon-only
composites made under similar conditions.
II. INTRODUCTION
It may seem counterintuitive to go to the trouble of combining fly ash and pitch
since they were originally present together in the coal! However, data to date shows that
fly ash can indeed reinforce carbon composites derived from coal, resulting in a very low
cost, easily fabricated composite with extremely attractive material properties. Coal tar
pitch and fly ash can be used to produce carbon foams as well as monolithic composites.
344
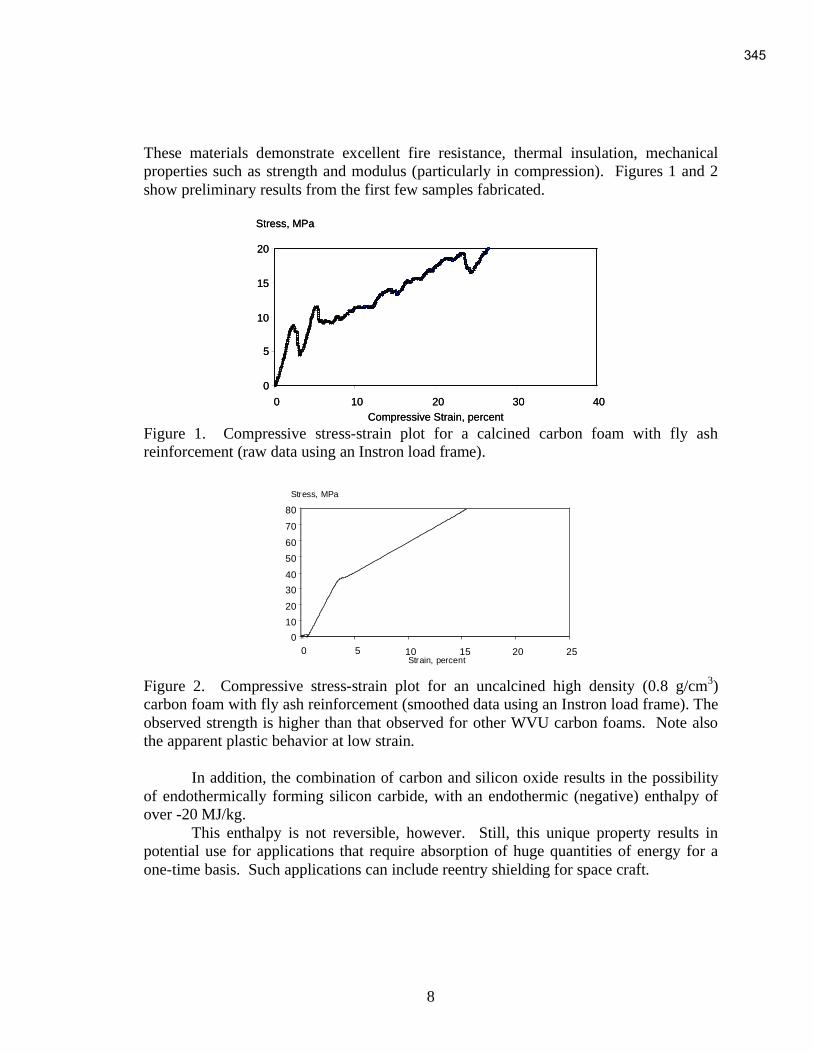
8
These materials demonstrate excellent fire resistance, thermal insulation, mechanical
properties such as strength and modulus (particularly in compression). Figures 1 and 2
show preliminary results from the first few samples fabricated.
Stress, MPa
0
5
10
15
20
0 10 20 30 40
Compressive Strain, percent
Stress, MPa
0
5
10
15
20
0 10 20 30 40
Compressive Strain, percent Figure 1. Compressive stress-strain plot for a calcined carbon foam with fly ash
reinforcement (raw data using an Instron load frame).
0
10
20
30
40
50
60
70
80
0 5 10 15 20 25 Strain, percent
Stress, MPa
Figure 2. Compressive stress-strain plot for an uncalcined high density (0.8 g/cm
3)
carbon foam with fly ash reinforcement (smoothed data using an Instron load frame). The
observed strength is higher than that observed for other WVU carbon foams. Note also
the apparent plastic behavior at low strain.
In addition, the combination of carbon and silicon oxide results in the possibility
of endothermically forming silicon carbide, with an endothermic (negative) enthalpy of
over -20 MJ/kg.
This enthalpy is not reversible, however. Still, this unique property results in
potential use for applications that require absorption of huge quantities of energy for a
one-time basis. Such applications can include reentry shielding for space craft.
345

9
Figure 3. Plasma torch testing, with a peak temperature of thousands of degrees Kelvin,
though not scientifically rigorous, shows that carbon foam samples are exceptionally
resistant to intense heating.
Figure 4. Close-up of the carbon sample, still glowing white hot after the torch is
removed. Plasma torches are able to cut through steel in seconds, but carbon foam is able
to resist cutting for several minutes.
In the case of reentry materials, the friction heat of reentry must be dissipated for
the reentry vehicle to survive. There are several strategies which can be used. Heat can
be absorbed in ablating a material (this method is used for reentry capsules such as those
used for Apollo, Gemini and Mercury space programs). A second strategy is to utilize an
aerodynamic shield which is capable of enduring high temperatures, while transferring
much of the thermal load via aerodynamic means. This method is used aboard the Space
Shuttle. In more advanced hypersonic vehicles, the reentry shock wave itself is used to
shield much of the vehicle’s surface. A third method is to accumulate heat in a thermal
energy sink. This method was considered for early projects such as the Mark 2 reentry
vehicle, in which both sensible heat and evaporative cooling were considered. A
phenolic resin first forms an insulating char and then ablates.
346

10
It is possible that a carbon composite with silicon dioxide reinforcement would
have exceptional characteristics as it is undergoes a strong endothermic reaction:
SiO2(s) + 3C (s) = SiC(s) + 2CO(g) + 624.6 kJ/mol .
In other words, this translates to 10 MJ/kg of SiO2, or far higher than possible
with any melting phase change material. By comparison, heat sinks using lithium
fluoride have a heat of fusion of 1.05 MJ/kg. Based on the literature value of heat
capacity, 1562 J/gK, a 2000 oC temperature rise would correspond to a total enthalpy of
about 4 MJ/kg, still well below the quantity which appears to be viable for SiC reinforced
carbon composites (comment: the heat capacity is extrapolated from near-ambient-
temperature data and is likely not to be accurate. Moreover T of 2000 oC would exceed
the liquid/vapor phase transition temperature. The point is that the total enthalpy of
heating is far lower than can be achieved by the SiC synthesis enthalpy of reaction).
Thus, at least from a theoretical standpoint, the potential use of silica as a reinforcement
of composites appears to be quite attractive.
Note also that the production of gaseous carbon dioxide is not a problem for a
composite with at least some porosity, because the gaseous product can be vented out. In
addition, the silicon carbide reaction product is the preferred material for high
temperature reentry shielding. Thus temperature resistance ablation and the use of
enthalpy energy sinks all work together in this concept. It is indeed an odd coincidence
that these requirements can be best met with very low cost coal-derived materials rather
than some exotic combination.
Over the wide range of temperatures seen in reentry, several other possible
reactions can take place:
SiO2(s) + C(s) = SiO(g) + CO(g)
SiO2(s) + 2C(s) = Si(s) + 2CO(g)
2CO(g) = CO2(g) + C(s)
Thus, it is necessary to determine which reactions actually occur during the
complex conditions of reentry and to determine the actual net enthalpy resultant from
those complex processes. To that end, preliminary studies have been undertaken using
oxyacetylene blow-torch testing as a means of crudely determining what reaction
products are produced during rapid heating in excess of 2000 oC range. X-Ray diffraction
tests have shown the presence of silicon carbide but not free silicon, suggesting that the
highly endothermic carbide reaction may predominate.
Requirements for reentry shielding vary depending on the design of the spacecraft
and the intended trajectory. However, in rough terms, a space-shuttle type reentry
subjects the surface of the reentry shield to a thermal flux of 50 W/cm2 for some 300
seconds.1 The total energy fluence is thus 15 kJ/cm
2. If this heat were absorbed solely
by conversion of silica to silicon carbide, about a milligram of silica per cm2 would be
347

11
consumed. Higher heat flux is of interest for higher performance devices, and this
appears to be potentially achievable.
The assertion that one-time thermal heat sinks can be of interest for aircraft
braking is also not obvious, since aircraft brakes are designed to be reused thousands of
times. However, for an emergency last-second aborted takeoff, it is permitted to ruin the
brake in order to stop the aircraft. Following the aborted takeoff the brakes and possibly
portions of the landing gear are replaced. In this sense, the thermal requirement for
aircraft brakes is similarly challenging to that for spacecraft reentry shielding.
III. EXPERIMENTAL
3.1 Manufacture of Foams at Ambient Pressure
Prior studies at West Virginia University resulted in protocols for manufacturing
carbon foams by heating coal extract materials to about 500 °C at about 500 pounds of
pressure. The coal extract materials were produced by dissolving coal in n-methyl
pyrrolidone at the solvent’s boiling point and atmospheric pressure. The solution was
then filtered to separate out the un-dissolved material, which contained all of the ash.
The solvent was then evaporated and a clean coal extract was produced. These extract
materials are ash free, but have no measurable softening point -- the material decomposes
before it softens.
For the present application it was thought that commercially available pitched
should be used instead of special coal extracts. The selected material for these initial
experiments was a coal tar binder pitch supplied by Koppers Inc. The coal tar binder
pitch from Koppers has softening point of 109 °C. The chemical description of that pitch
follows in Table 1.
Table 1. Koppers Coal-Tar Pitch Properties 2
348

12
The second issue was the method of manufacture. In previous foaming
experiments, coal derived foam samples were usually produced at about 500 pounds of
pressure, requiring thick-walled vessels or autoclaves. One of the objectives of this
research was to produce those same foams at ambient pressure. This would require a
more complete understanding of the foaming process and the effects blending pitches
with silicon oxide containing components would have on foaming.
3.2 Experimentation
Two foaming vessels were manufactured. These new foaming vessels were made
from 5/8 inch thick stainless steel tubing cut to 12 inch lengths. The outside diameter of
the tube was 16 inches. Into one of the cut surfaces two 16th inch knife-edge grooves
were milled. These knife-edge were to cut into a gasket and inshore an airtight seal in the
vessel. A stainless steel ring 58 inch thick, which fits snugly around the tube was welded
3/16" below the upper end of the tube. And octagonal pattern of bolt holes were drilled
into this ring. The top of the reactor would be held secure by bolting it to this ring. To
the opposite end of the tube was welded a 5/8 inch thick stainless steel disk 17 inches in
diameter, which was the bottom of the vessel. The top of the vessel was also a disk of
5/8 inch stainless steel. Into that desk was cut a groove 3/16" deep 5/8"-wide that was to
be the seat with a gasket. The top of the reactor would be gasket in the groove was
placed on the upper lip of the reactor so the gasket could be compressed on the knife-
edges when the top was bolted down. Into this center of the top of the reactor two 3/8
inch ports were drilled. To these ports are attached stainless steel tubing so that nitrogen
could be flushed into the reactor and exhausted. The nitrogen flushing was important to
remove any residual oxygen and to purge out any volatiles that would be produced during
the foaming process. The exhaust tubing wasted and bent in a goose necked fashion so
that condensables could be recovered and disposed of properly. In retrospect it would
have been better to have welded a flange to the top of the reactor in order to avoid having
to use long bolts to close the reactor lid. The concern is that mismatched thermal
expansion could permit the bolts to expand or contract, changing the pressure with which
the lid is sealed.
Two identical reactors were manufactured for this research. The reactor design is
shown in Figure 5.
349

13
Figure 5. High temperature pressure vessel.
3.3 Preliminary Experiments with Coal Tar Pitch
The initial experiments in this research began with attempts to foam coal tar pitch
at atmospheric pressure. In previous experiments, using coal extracts, coal extract was
heated to 350 °C in a kilns. The kilns was a Paragon model TNF82 controlled by Ortec
360223 controllers. The entire foaming system was contained in a walk-in hood equipped
with Plexiglas Doors so the entire foaming system was isolated, ensuring a safe working
environment. While the extract was heated at this temperature, nitrogen was purged
through the system. Volatiles were condensed at the end of the gooseneck. It was further
believed that components in the pitch were being cross-linked and polymerized. During
this polymerization process, the pitch became a Bingham fluid. After the pitch remained
at 350 °C for two hours, the vessel was pressurized to 500 PSIG. The vessel was then
heated to 500 °C at a rate of 2 °C per minute at pressure. During this process it was felt
that the cross-linked pitch further devolatilized. The high pressure forced the bubbles to
stay within the pitch and the Bingham nature of the pitch prevented it from collapsing.
Foam is produced. The goal of this initial phase of the research was to try to duplicate
that effect using coal tar pitch at atmospheric pressure.
100.00 grams of ground coal tar pitch was poured into trays. The coal tar pitch,
as received, was ground to -60 mesh. It is important to cool the pitch to low temperature
so it doesn't formally cake during the grinding process. Two trays were placed in the
reaction vessels described above. They were heated to 350° under a nitrogen flush and
kept at that state for 2 1/2 hours. The flow rate of the nitrogen flush is about half a cubic
foot per minute. It was after this time that the quantity of volatiles being emitted was not
visibly detected. The reactors were then heated to 500 °C at a rate of 2° per minute with
the continuous nitrogen flush. The reactors were held at 500 °C for three hours. The
reactors were permitted to cool to room temperature, opened, and the samples removed.
350
14
The products of the initial experiments overflowed from the trays. A large, low
density crown protruded over the top of the trays in a manner reminiscent of a muffin.
When the samples were removed from the trays several observations were made.
(1) The material on the bottom of the tray stuck to the aluminum. This had not
been seen before. Previous research had shown that coal based materials when
carbonized do not stick to aluminum, but in this instance there was a strong adherence to
aluminum foil.
(2) The center of the sample contained a large cavity. Around the bottom and
edges of the foil was a more foam like material with more regular light bubbles, but the
center of the muffin was a big void probably produced by a gas pocket.
(3) A crust was observed on the surface of the crown of the sample. The crust
was not very thick, about 1/16", but it probably served as a cap trapping the gases within
the system. This is what probably produced the large cavity.
(4) Judging from the texture of the materials, it appears that the pitch had
separated into two separate phases before it foamed. The material at the bottom of the
tray was very shiny and continuous. It appears as though was the liquid phase now is
simply pour evenly over the bottom of the tray. The material at the top of them crown of
the sample looked much more heterogeneous. It is possible that the carbon black, used as
a filler and coal tar pitch, might have separated from the liquid at bottom of the tray and
floated to the top where was pushed to the crown by devolatilization during the
"foaming" process.
Two more sets of experiments using coal tar binder pitch as a precursor were
attempted. In both of these attempts the soaking temperature was increased by 25°. The
results of both of these tests were very comparable to the original except that upon further
processing tendrils were seen criss-crossing the cavity. This suggests that upon further
devolatilization, increased cross-linking occurred. If so, the viscosity of the pitch may
have increased, thus reducing the separation between the phases.
3.4 Conclusions from Preliminary Experiments
The original attempts to foam coal tar binder pitch at the conditions described
above were unsuccessful, resulting in highly non-uniform, friable media. The fluid
nature of the pitch was too high, and the high volatile content of the pitch was too
extreme to produce foam ambient pressure in the normal range of the above experiments.
In order to produce more uniform foams the viscosity of the pitch would have to be
increased significantly and the volatility of the pitch would have to be decreased
significantly. Thus it was concluded that a high softening point pitch would be a much
more suitable candidate for the production of foams at atmospheric pressure than coal tar
351

15
binder pitch. Further if the binder pitch could be processed to the point that it
decomposed before it softened, and behaved in a manner similar to coal extract, and had
a significantly reduced volatile content, then foams might be made with this material at
near-ambient temperature and pressure conditions.
3.5 Second set of experiments with coal tar pitches
Based upon the previous experiments it was decided to attempt to make foam at
ambient pressure using a Koppers pitch with a softening point of 180 oC and a more
completely devolatilized pitch.
Table 2. Characteristics of Various Commercial Pitches 3
Samples of this pitch were ruled and ground to -60 mesh by the method described
above. Samples of the pitch were placed in the aluminum trays that were then inserted in
the reactor for foaming. Upon cooling the reactor and removing the foams it was
observed that these foams had bubbles ranging to about half a centimeter in diameter.
The bubbles around the edges of the tray were very small while the larger bubbles were
seen to form in the center. The foams produced did not overflow the trays; however,
some of the samples did show sinking in the center. This is very similar to the process of
a cake sinking while it is being baked. It is believe that this is probably due to the fact
that the center of the pitch, where the large bubbles are seen to form, does not have the
yield strength to support a foams structure. If that is so the pitch may be still too fluid to
make structurally sound foam. This is however a significant improvement over 110 °C
softening point coal tar pitch. Pictures of foam produced from the 185 °C softening point
pitch can be seen below.
352
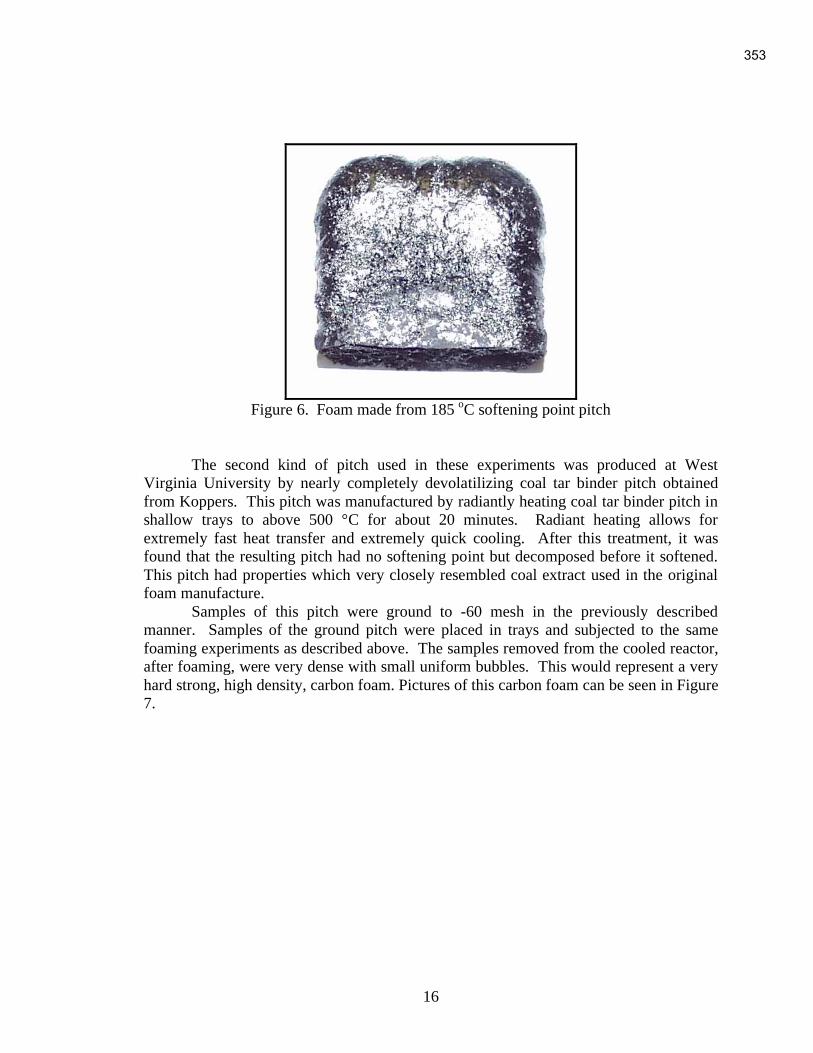
16
Figure 6. Foam made from 185
oC softening point pitch
The second kind of pitch used in these experiments was produced at West
Virginia University by nearly completely devolatilizing coal tar binder pitch obtained
from Koppers. This pitch was manufactured by radiantly heating coal tar binder pitch in
shallow trays to above 500 °C for about 20 minutes. Radiant heating allows for
extremely fast heat transfer and extremely quick cooling. After this treatment, it was
found that the resulting pitch had no softening point but decomposed before it softened.
This pitch had properties which very closely resembled coal extract used in the original
foam manufacture.
Samples of this pitch were ground to -60 mesh in the previously described
manner. Samples of the ground pitch were placed in trays and subjected to the same
foaming experiments as described above. The samples removed from the cooled reactor,
after foaming, were very dense with small uniform bubbles. This would represent a very
hard strong, high density, carbon foam. Pictures of this carbon foam can be seen in Figure
7.
353

17
Figure 7. Foam made from devolatilized binder pitch
Attempts have been made to make foam from commercially available coal tar
pitches at ambient pressure. The foams produced from 109 °C softening point coal tar
pitch are very poor quality foams. Foam manufactured from 185 °C softening point coal
tar pitches are significantly improved. The foam was made from devolatilized coal tar
pitch. These experiments have shown that foams from the gamut of low density, low
strength, large irregular bubble size foams to high density, high-strength, very small
bubble size foams can be made using commercial coal tar pitches at ambient pressures.
The next series of experiments sought to evaluate the effects of silicon oxide
additives on foaming with coal tar binder pitch.
Table 3. Properties of the Feed Pitches.
A240 petroleum
pitch
Koppers
coal-tar pitch
(filtered)
WVU coal-
extract pitch
Ash (wt%) 0.04 0.05 0.01
Mettler Softening Pt. (°C) 116.9 108.1 121.7
Density (g/cc3) 1.236 1.304 1.246
WVU Coke Yield (wt%) 50.9 53.7 56.0
Conradson Coke Yield (wt%) 47.1 48.0 52.9
Pyridine Insolubles (wt%) 0.84 11.50 0.15
354

18
3.6 Silica Based Additive to Foams and Composites
Fly ash is largely composed of silicon dioxide, which as noted previously offers
the potential for high thermal energy storage. Thus, carbon/silica composite materials
were manufactured to determine the effect of silicon oxide on thermal capacity as well as
mechanical properties.
The samples were put into a low-pressure vessel with a nitrogen purge. The
vessel was then heated inside a kiln to a temperature of 550 oC at the rate of 4
oC/min.
The samples were held at 550 oC for a period of one hour and then allowed to cool under
the nitrogen blanket.
The first set of experiments was intended to estimate the maximum percentage of
SiO2 that could be added to the pitch, without adversely affecting the physical integrity of
the foam produced from the blend. Samples of the foams can be seen in the photograph.
The pitch was Koppers 110 oC Mettler softening point Coal Tar Binder Pitch. Sample
11-17-05-1 was composed of 5 % SiO2 and 95 % CTP. Sample 11-17-05-2 was
composed of 7 % SiO2 and 93 % BP. Both of these samples resulted in uniform foams
without a top layer of powder or any fissures. The tops of both samples were dull in
appearance and were only slightly higher than the top of the pans.
Additional trials were carried out with up to 19 % silica addition by initial mass.
As can be seen from Figure 8, at lower levels of SiO2 the surface of the samples is
smooth in appearance. However, as the percentage of SiO2 is increased the surface of the
samples appeared to be less uniform. The samples exhibited phase difference. The upper
region appears dull, and the bottom region appears to be more glassy. The glassy region
is smaller as the percentage of SiO2 increases the sample begins to get a dull appearance
progressively lower within the sample until it is finally all one layer by 19 %. Figure 8
shows the progression of the eight samples from left to right, top to bottom.
355

19
Figure 8. Samples containing from 5 % to 19 % SiO2.
The next set of samples was manufactured with a different pitch from Koppers,
having a Mettler softening point of 185 oC. Sample one was comprised of 85 % CTP and
15 % SiO2. Sample two was comprised of 80 % CTP and 20 % SiO2. Both of these
samples foamed with acceptable characteristics. .
A pitch devolatilized at 550 oC was also trialed. Pitch devolatilized at such a high
temperature could actually be considered to be green coke, and thus the amount of
volatile matter might be difficult to control. The pitch created foam with no major voids.
It had pores that ranged in size from very small up to approximately one centimeter
across. The foam was glassy all the way through. A second sample was made with 80 %
of the devolatilized pitch and 20 % SiO2. Some swelling was observed.
356
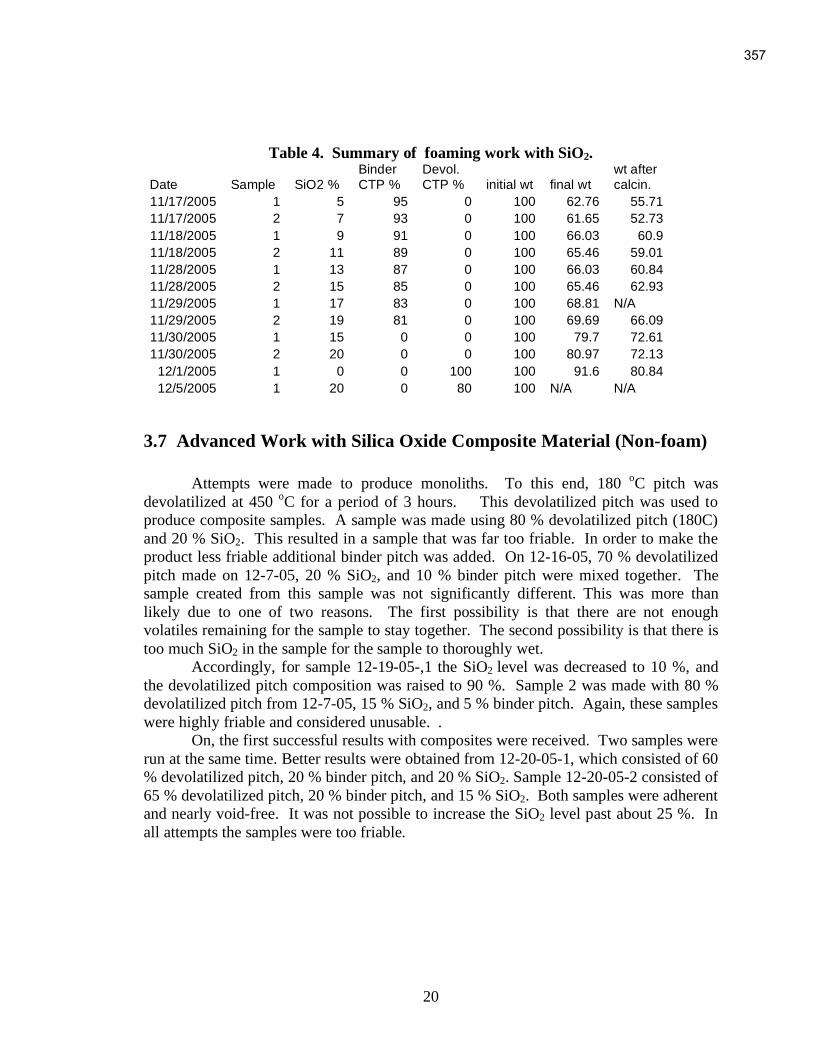
20
Table 4. Summary of foaming work with SiO2.
Date Sample SiO2 % Binder CTP %
Devol. CTP % initial wt final wt
wt after calcin.
11/17/2005 1 5 95 0 100 62.76 55.71
11/17/2005 2 7 93 0 100 61.65 52.73
11/18/2005 1 9 91 0 100 66.03 60.9
11/18/2005 2 11 89 0 100 65.46 59.01
11/28/2005 1 13 87 0 100 66.03 60.84
11/28/2005 2 15 85 0 100 65.46 62.93
11/29/2005 1 17 83 0 100 68.81 N/A
11/29/2005 2 19 81 0 100 69.69 66.09
11/30/2005 1 15 0 0 100 79.7 72.61
11/30/2005 2 20 0 0 100 80.97 72.13
12/1/2005 1 0 0 100 100 91.6 80.84
12/5/2005 1 20 0 80 100 N/A N/A
3.7 Advanced Work with Silica Oxide Composite Material (Non-foam)
Attempts were made to produce monoliths. To this end, 180 oC pitch was
devolatilized at 450 oC for a period of 3 hours. This devolatilized pitch was used to
produce composite samples. A sample was made using 80 % devolatilized pitch (180C)
and 20 % SiO2. This resulted in a sample that was far too friable. In order to make the
product less friable additional binder pitch was added. On 12-16-05, 70 % devolatilized
pitch made on 12-7-05, 20 % SiO2, and 10 % binder pitch were mixed together. The
sample created from this sample was not significantly different. This was more than
likely due to one of two reasons. The first possibility is that there are not enough
volatiles remaining for the sample to stay together. The second possibility is that there is
too much SiO2 in the sample for the sample to thoroughly wet.
Accordingly, for sample 12-19-05-,1 the SiO2 level was decreased to 10 %, and
the devolatilized pitch composition was raised to 90 %. Sample 2 was made with 80 %
devolatilized pitch from 12-7-05, 15 % SiO2, and 5 % binder pitch. Again, these samples
were highly friable and considered unusable. .
On, the first successful results with composites were received. Two samples were
run at the same time. Better results were obtained from 12-20-05-1, which consisted of 60
% devolatilized pitch, 20 % binder pitch, and 20 % SiO2. Sample 12-20-05-2 consisted of
65 % devolatilized pitch, 20 % binder pitch, and 15 % SiO2. Both samples were adherent
and nearly void-free. It was not possible to increase the SiO2 level past about 25 %. In
all attempts the samples were too friable.
357

21
3.8 Calcination
Before any of the samples can be used for heat sink testing they had to be
calcined. The method of calcination is described below. In order to calcine the foams
they had to be heated to 1000 °C. This is done by immersing the foam in graphite chips
in a stainless steel vessel. This stainless steel vessel resembles a large soup pot with a lid.
The foam with samples is arranged in the graphite chips so they do not touch each other
and horror about 1 inch from the wall. They are layered in the soup pot and covered with
at least one inch of graphite chips. Before the lid is placed on the pot an inch and a half
layer of steel wall is used to cover the graphite chips. The steel wool acts as an oxygen
getter during the heating process.
The steel vessel was placed in a kiln and heated. It is quickly heated at a rate of
10° per minute to 500 °C, and then heated to 1000 °C at a rate of 0.5° per minute. It is
maintained at 1000 °C for two hours, and then it is permitted to cool to room
temperature. After it is cooled to the samples are removed and are ready to be prepared
for the thermal heat sink measurements.
358
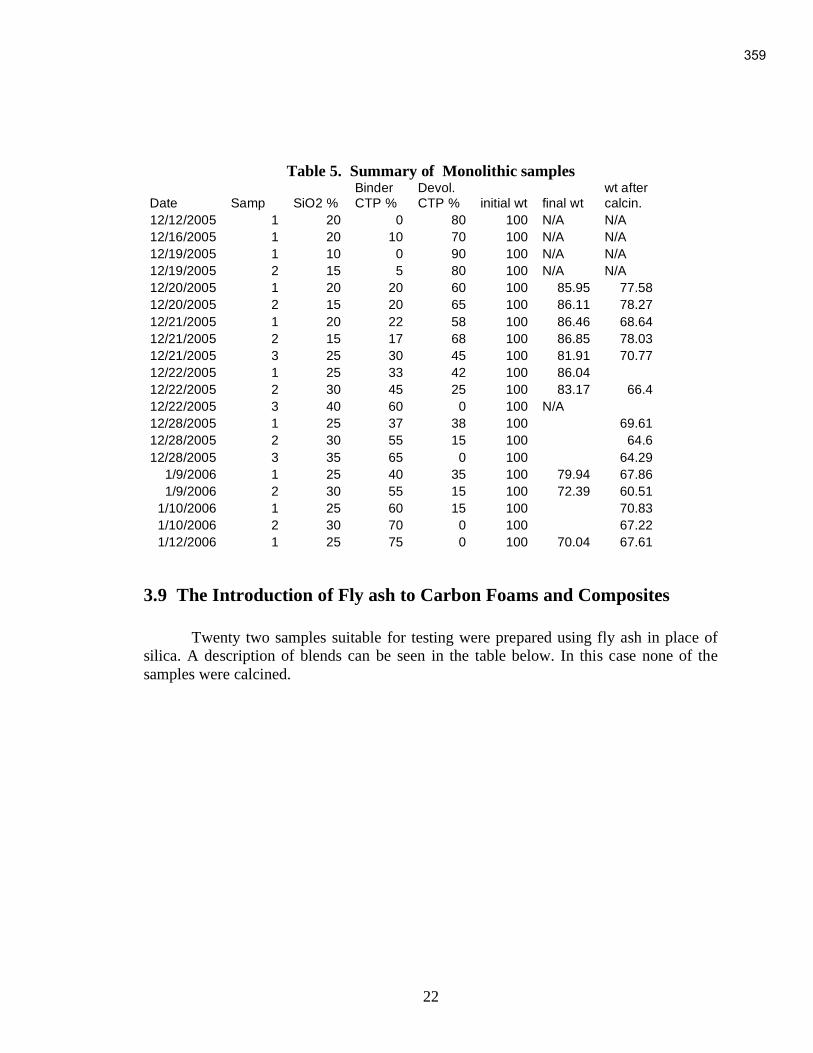
22
Table 5. Summary of Monolithic samples
Date Samp SiO2 % Binder CTP %
Devol. CTP % initial wt final wt
wt after calcin.
12/12/2005 1 20 0 80 100 N/A N/A
12/16/2005 1 20 10 70 100 N/A N/A
12/19/2005 1 10 0 90 100 N/A N/A
12/19/2005 2 15 5 80 100 N/A N/A
12/20/2005 1 20 20 60 100 85.95 77.58
12/20/2005 2 15 20 65 100 86.11 78.27
12/21/2005 1 20 22 58 100 86.46 68.64
12/21/2005 2 15 17 68 100 86.85 78.03
12/21/2005 3 25 30 45 100 81.91 70.77
12/22/2005 1 25 33 42 100 86.04
12/22/2005 2 30 45 25 100 83.17 66.4
12/22/2005 3 40 60 0 100 N/A
12/28/2005 1 25 37 38 100 69.61
12/28/2005 2 30 55 15 100 64.6
12/28/2005 3 35 65 0 100 64.29
1/9/2006 1 25 40 35 100 79.94 67.86
1/9/2006 2 30 55 15 100 72.39 60.51
1/10/2006 1 25 60 15 100 70.83
1/10/2006 2 30 70 0 100 67.22
1/12/2006 1 25 75 0 100 70.04 67.61
3.9 The Introduction of Fly ash to Carbon Foams and Composites
Twenty two samples suitable for testing were prepared using fly ash in place of
silica. A description of blends can be seen in the table below. In this case none of the
samples were calcined.
359
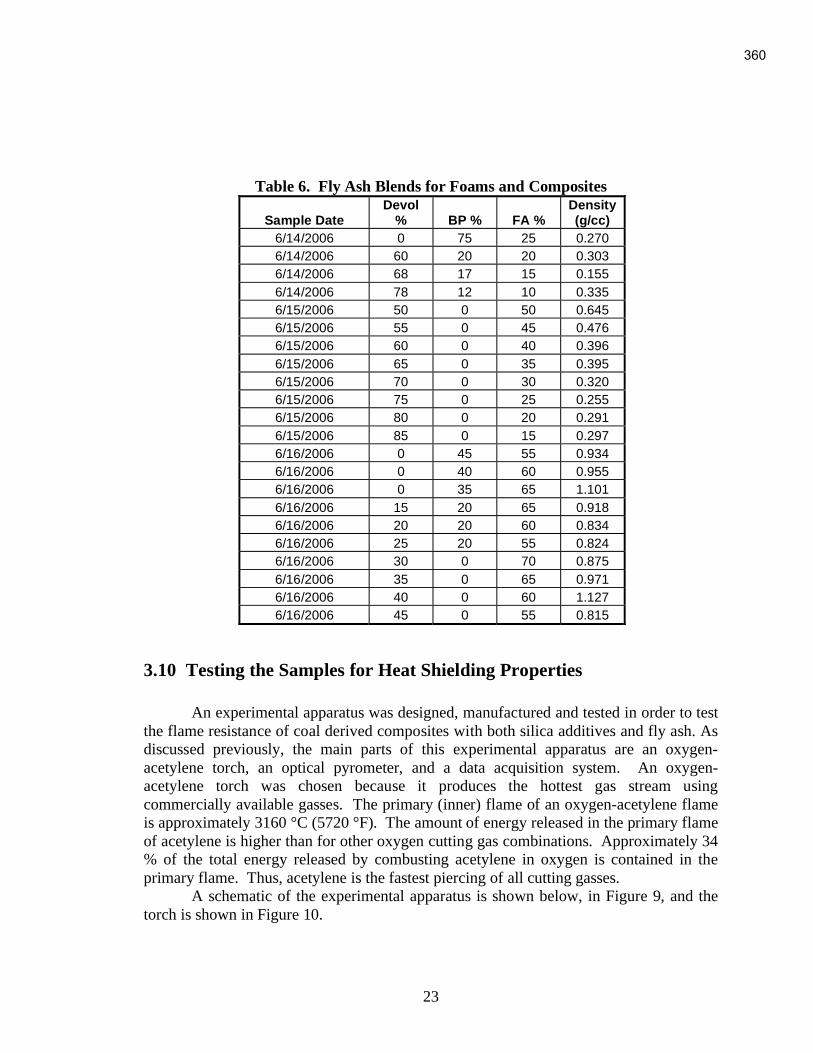
23
Table 6. Fly Ash Blends for Foams and Composites
Sample Date
Devol
% BP % FA %
Density
(g/cc)
6/14/2006 0 75 25 0.270
6/14/2006 60 20 20 0.303
6/14/2006 68 17 15 0.155
6/14/2006 78 12 10 0.335
6/15/2006 50 0 50 0.645
6/15/2006 55 0 45 0.476
6/15/2006 60 0 40 0.396
6/15/2006 65 0 35 0.395
6/15/2006 70 0 30 0.320
6/15/2006 75 0 25 0.255
6/15/2006 80 0 20 0.291
6/15/2006 85 0 15 0.297
6/16/2006 0 45 55 0.934
6/16/2006 0 40 60 0.955
6/16/2006 0 35 65 1.101
6/16/2006 15 20 65 0.918
6/16/2006 20 20 60 0.834
6/16/2006 25 20 55 0.824
6/16/2006 30 0 70 0.875
6/16/2006 35 0 65 0.971
6/16/2006 40 0 60 1.127
6/16/2006 45 0 55 0.815
3.10 Testing the Samples for Heat Shielding Properties
An experimental apparatus was designed, manufactured and tested in order to test
the flame resistance of coal derived composites with both silica additives and fly ash. As
discussed previously, the main parts of this experimental apparatus are an oxygen-
acetylene torch, an optical pyrometer, and a data acquisition system. An oxygen-
acetylene torch was chosen because it produces the hottest gas stream using
commercially available gasses. The primary (inner) flame of an oxygen-acetylene flame
is approximately 3160 °C (5720 °F). The amount of energy released in the primary flame
of acetylene is higher than for other oxygen cutting gas combinations. Approximately 34
% of the total energy released by combusting acetylene in oxygen is contained in the
primary flame. Thus, acetylene is the fastest piercing of all cutting gasses.
A schematic of the experimental apparatus is shown below, in Figure 9, and the
torch is shown in Figure 10.
360

24
Figure 9. Diagram of Experimental Apparatus.
Figure 10. Oxygen-acetylene torch
For stoichiometric combustion, 1.2 volumes of oxygen are needed per 1.0 volume
of acetylene. The flow rate of oxygen is controlled by a dial type oxygen flow meter.
The dial flow meter has an accuracy of +/-5 %. The flow rate of acetylene is controlled
by a valve on the cutting torch. Once the flow rate of the oxygen flow meter is set, the
flow of the acetylene is adjusted until the flame is combusting stoichiometrically.
The “hot side” of the coal derived composites is exposed to the oxygen acetylene
flame, while the “cool side” is monitored by an optical pyrometer, shown in Figure 11.
The optical pyrometer has a low response time (around 12ms), which allows for many
measurements per second. This resolution is necessary because the samples undergo
extremely rapid heating. The optical pyrometer’s output signal is monitored by a 22-bit
USB data acquisition system. The data acquisition system, when coupled to the optical
pyrometer, is capable of recording over a dozen measurements per second.
361

25
Figure 11. Optical pyrometer with response time of 12ms
The experimental procedure for testing a coal-derived composite is as follows.
Firstly, the composite is cut to a standard width and length, without changing the as-
received depth of the composite. Next, the composite is weighed to the nearest decigram.
The pictures of the cool side and hot side of the composite are taken. Next, the acetylene
flow is started and the torch is ignited. The oxygen flow is then introduced and the
acetylene flow is adjusted until a stoichiometric flame is achieved. The USB data
acquisition system is then begins acquiring data. The coal-derived composite is then
placed a set distance from the torch nozzle. The USB data acquisition system continues
to acquire data as the cool side of the coal-derived composite rapidly heats. Eventually,
the oxygen acetylene flame burns through the composite sample. At this time data
acquisition is stopped, and the composite sample is removed and allowed to air cool. At
this point, another sample can be tested. When a batch of composite samples is complete,
the oxygen acetylene flame is extinguished. The composite samples are then weighed
again to the nearest decigram. Pictures of the cool side and the hot side of the composite
are again taken. Results from data acquisition are imported into Microsoft Excel and
saved for analysis.
IV. RESULTS AND ANALYSIS
Exploratory experiments used an oxygen methane flame instead of an oxygen
acetylene flame. Other than the difference in flame source, the preliminary experiments
were conducted as described in the preceding Experimental section. Figure 12 is a
collage of images illustrating the oxygen methane flame as it burns though the coal
derived composite. Note that at first (frame 1) the cool side of the composite is not yet
heated. After a lag time, the first signs of heating are observed (frame 2). The hot spot
gradually increases in size (frames 3 and 4) until the flame breaks through (flame 5). As
362

26
soon as the flame breaks through, the temperature observed by the pyrometer drops
(frame 6).
Figure 12. Progression of flame burning through composite sample
All composite samples tested thus far remained in one piece, in spite of the
tremendous heat gradient they were exposed to. Pictures were taken of the cool side and
hot side of the composites, both before testing and after testing. A picture of a coal
derived composite made from 100 % devolatilized pitch follows as Figure 13. The
entrance hole is larger than the exit hole, and the path from the hot side of the composite
to the cool side is conical in shape.
363

27
Figure 13. 100 % de-volatilized pitch composite
The area surrounding the hole in the 100 % pitch based composite looks similar to
the rest of the composite. This is not the case in composite samples with silica addition.
In composite samples with silica addition, small glassy beads line the perimeter and hole
of the composite. A close up of a hole in a composite sample containing silica is
presented below in Figure 14. The peripheral and lining of the hole is white, presumably
where carbon has oxidized and silica has not. This suggests that the desired carbiding of
the silica may not have occurred.
364

28
Figure 14. Close-up of burn through in silica containing sample
The change in temperature of the cool side of the composites as a function of time
was of interest. The temperature of the cool side of the composites was measured by an
optical pyrometer. Results are presented in Figure 15 for a devolatilized pitch composite
and two binder pitch with silica composites. Note that the temperature scale is a relative
temperature scale. The pyrometer is not yet calibrated for the temperature range of
interest, so the scale and offset of the lines may change, however the trends will remain
the same. Data on the burn through rate as a function of pitch type, specific gravity,
silicon oxide concentration, and fly ash concentration, can be seen in Appendix 1. The
data are presented as both raw and adjusted – normalized for thickness. Scrapings of the
surfaces of the test samples were examined by X-Ray Diffraction.
365

29
From these data it is seen that the scrapings are mostly amorphous but the crystal
structures contained in the amorphous background are silica. This indicated that in these
experiments Silica might not have been reduced to silicon carbide. Rather, the silica
could have simply melted and recrystallized. This is supported by the round spherical
shaped clusters at the surface of the holes burned through the samples. It may be that the
true effect of the heat shielding effect can only be seen at higher tests that those used in
this evaluation.
366
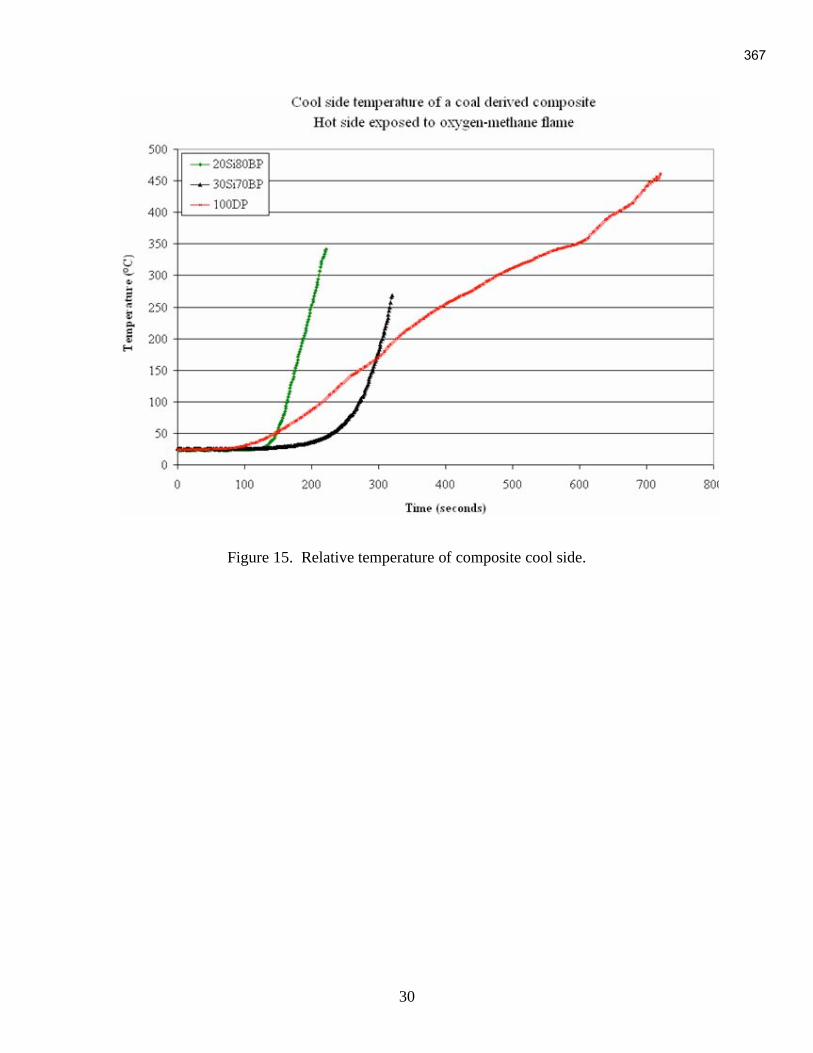
30
Figure 15. Relative temperature of composite cool side.
367

31
Appendix 1
Table 7. Fly Ash Composites
Sample
Date
Sheet
# Number Devol BP FA
Width
(mm)
Height
(mm)
Depth
(mm)
Pre-
weight
(g)
Density
(g/cc)
Post-
weight
(g)
wt
loss
TTTD
(s)
Stopwatch
(s) ABTT
6/14/2006 27 0% 75% 25% 72.63 56.51 27.41 30.36 0.270 26.63 12% 29.5 16 3.99
6/14/2006 28 60% 20% 20% 71.44 57.13 30.35 37.51 0.303 32.61 13% 54.7 20 5.95
6/14/2006 29 68% 17% 15% 72.73 55.22 45.85 28.55 0.155 25.91 9% 8.6 9 1.21
6/14/2006 30 78% 12% 10% 71.97 56.66 27.93 38.1 0.335 24.7 21 2.64
6/15/2006 31 50% 0% 50% 66.47 53.92 17.62 40.72 0.645 37.96 7% 72.4 61 6.37
6/15/2006 32 55% 0% 45% 67.69 56.78 21.28 38.95 0.476 36.74 6% 54.7 36 5.39
6/15/2006 33 60% 0% 40% 68.6 56.35 27.65 42.3 0.396 39.7 6% 37.3 39 3.40
6/15/2006 34 65% 0% 35% 71.34 56.31 24.39 38.72 0.395 36.46 6% 34.8 32 3.61
6/15/2006 35 70% 0% 30% 71.77 56.89 30.5 39.84 0.320 37.5 6% 24.9 26 2.55
6/15/2006 36 75% 0% 25% 72.28 67.55 37.05 46.05 0.255 43.82 5% 17.7 16 1.88
6/15/2006 37 80% 0% 20% 75.32 67.74 30.18 44.87 0.291 40.99 9% 30.0 24 3.41
6/15/2006 38 85% 0% 15% 73.86 65.3 32.18 46.04 0.297 42.03 9% 23.9 22 2.50
6/16/2006 39 0% 45% 55% 68.38 67.3 10.44 44.88 0.934 43.55 3% 38.3 34 3.93
6/16/2006 40 0% 40% 60% 65.14 56.36 8.61 30.18 0.955 29.18 3% 33.2 35 4.04
6/16/2006 41 0% 35% 65% 66.82 54.78 9.73 39.22 1.101 38.01 3% 44.2 33 4.13
6/16/2006 42 15% 20% 65% 63.6 62.24 12.87 46.78 0.918 44.86 4% 82.3 42 6.96
6/16/2006 43 20% 20% 60% 61.61 59.99 13.92 42.9 0.834 40.73 5% 41.0 29 3.53
6/16/2006 44 25% 20% 55% 66.92 52.54 14.34 41.54 0.824 39.55 5% 49.3 42 4.17
6/16/2006 45 30% 0% 70% 63.9 61.47 15.95 54.82 0.875 52.36 4% 43.4 32 3.11
6/16/2006 46 35% 0% 65% 62.91 47.32 13.48 38.98 0.971 37.21 5% 61.4 52 4.69
6/16/2006 47 40% 0% 60% 61.11 55.75 13.62 52.31 1.127 49.01 6% 109.9 73 7.16
6/16/2006 48 45% 0% 55% 60.7 64.96 12.05 38.72 0.815 36.39 6% 54.4 25 5.54
368
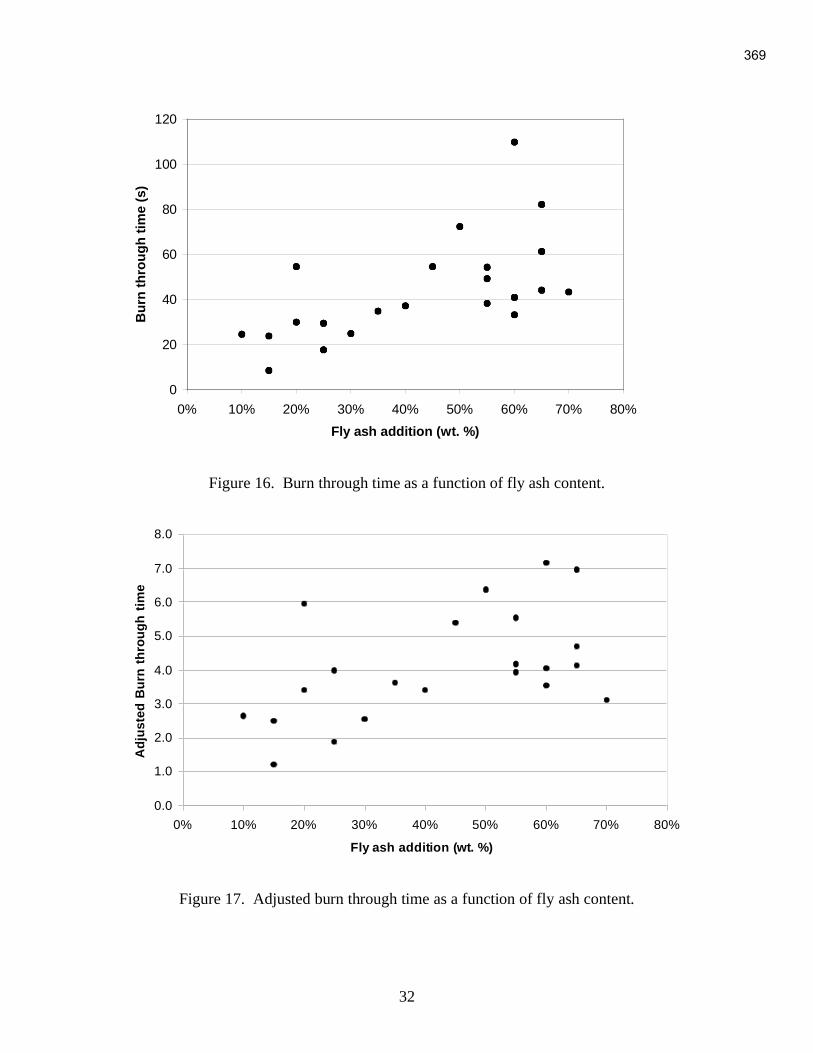
32
0
20
40
60
80
100
120
0% 10% 20% 30% 40% 50% 60% 70% 80%
Fly ash addition (wt. %)
Bu
rn
th
ro
ug
h t
ime (
s)
Figure 16. Burn through time as a function of fly ash content.
0.0
1.0
2.0
3.0
4.0
5.0
6.0
7.0
8.0
0% 10% 20% 30% 40% 50% 60% 70% 80%
Fly ash addition (wt. %)
Ad
jus
te
d B
urn
th
ro
ug
h tim
e
Figure 17. Adjusted burn through time as a function of fly ash content.
369

33
0
20
40
60
80
100
120
0.000 0.200 0.400 0.600 0.800 1.000 1.200
Specific Gravity
Bu
rn
th
ro
ug
h tim
e (s
)
Figure 18. Burn through time as a function of specific gravity.
0.0
1.0
2.0
3.0
4.0
5.0
6.0
7.0
8.0
0.000 0.200 0.400 0.600 0.800 1.000 1.200
Specific Gravity
Ad
justed
bu
rn
th
ro
ug
h t
ime
Figure 19. Adjusted burn through time as a function of specific gravity.
370
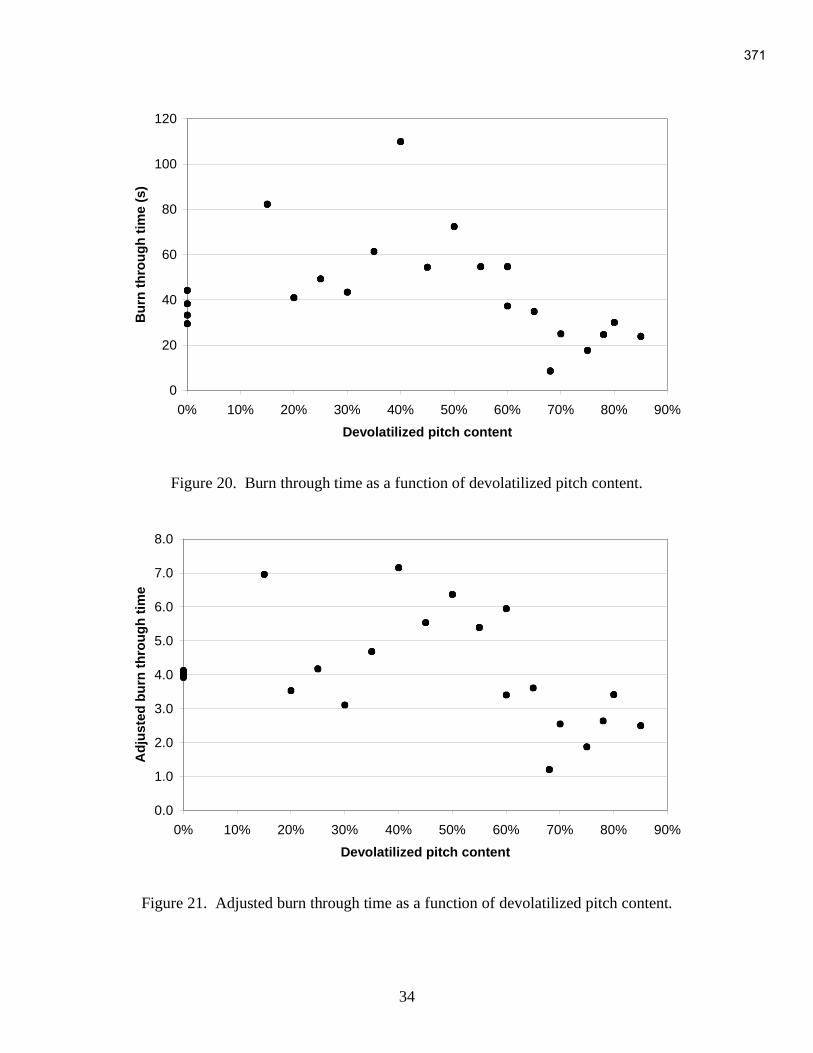
34
0
20
40
60
80
100
120
0% 10% 20% 30% 40% 50% 60% 70% 80% 90%
Devolatilized pitch content
Bu
rn
th
ro
ug
h t
ime (
s)
Figure 20. Burn through time as a function of devolatilized pitch content.
0.0
1.0
2.0
3.0
4.0
5.0
6.0
7.0
8.0
0% 10% 20% 30% 40% 50% 60% 70% 80% 90%
Devolatilized pitch content
Ad
justed
bu
rn
th
ro
ug
h t
ime
Figure 21. Adjusted burn through time as a function of devolatilized pitch content.
371

35
0
20
40
60
80
100
120
0% 10% 20% 30% 40% 50% 60% 70% 80%
Binder pitch content
Bu
rn
th
ro
ug
h t
ime (
s)
Figure 22. Burn through time as a function of binder pitch content.
0.0
1.0
2.0
3.0
4.0
5.0
6.0
7.0
8.0
0% 10% 20% 30% 40% 50% 60% 70% 80%
Binder pitch content
Ad
justed
bu
rn
th
ro
ug
h t
ime
Figure 23. Adjusted burn through time as a function of binder pitch content.
372

36
Table 8. Silica Composites Summary.
Sample Date
Sheet
#
Num-
ber De-vol BP Si
Width
(mm)
Height
(mm)
Depth
(mm)
Pre-
weight
(g)
Density
(g/cc)
Post-
weight
(g) wt loss TTTD (s)
Stopwat
ch (s) ABTT
10/29/2005 1 1 55.38 56.07 24.83 13.58 0.176 12 12% 32.7 30 7.48
11/17/2005 2 1 0% 95% 5% 49.36 54.67 27.43 8.25 0.111 6.82 17% 10.2 3 3.33
11/17/2005 3 2 0% 93% 7% 51.34 52.48 25.25 9.42 0.138 7.85 17% 20.6 22 5.90
11/18/2005 4 1 0% 91% 9% 51.38 52.5 27.2 11.42 0.156 9.54 16% 30.3 32 7.15
11/18/2005 5 2 0% 89% 11% 53.71 54.99 25 8.4 0.114 7.27 13% 19.6 20 6.88
11/28/2005 6 1 0% 87% 13% 53.68 56 24.2 12.05 0.166 10.4 14% 34.8 32 8.69
11/28/2005 7 2 0% 85% 15% 47.16 56.2 28.54 12.08 0.160 10.44 14% 38.9 34 8.53
11/29/2005 8 2 0% 81% 19% 56.11 56.24 55.59 15.06 0.086 14.05 7% 21.7 15 4.55
11/30/2005 9 1 0% 85% 15% 57.98 54.89 26.45 10.52 0.125 9.52 10% 8.0 5 2.43
11/30/2005 10 2 0% 80% 20% 55.36 62.11 25.82 16.21 0.183 14.12 13% 34.8 34 7.39
12/1/2005 11 1 100% 0% 0% 59.29 68.25 32.52 40.59 0.308 36.62 10% 92.5 73 9.22
12/20/2005 12 1 60% 20% 20% 46.93 49.23 24.7 27.43 0.481 24.63 10% 79.9 77 6.73
12/20/2005 13 2 65% 20% 15% 48.29 56.02 27.8 32.71 0.435 29.62 9% 89.8 81 7.43
12/21/2005 14 1 58% 22% 20% 51.5 56.66 26.94 30.96 0.394 27.46 11% 93.3 89 8.79
12/21/2005 15 2 68% 17% 17% 48.79 57.02 27.36 32.17 0.423 28.87 10% 90.6 82 7.83
12/21/2005 16 3 45% 30% 25% 51.38 55.51 27.17 27.98 0.361 25.03 11% 95.7 78 9.75
12/22/2005 17 1 42% 33% 25% 50.63 56.77 27.04 27.57 0.355 24.81 10% 84.7 71 8.83
12/22/2005 18 2 48.93 54.59 25.45 22.42 0.330 20.02 11% 57.1 42 6.80
12/28/2005 19 1 38% 37% 25% 46.6 56.9 27.13 28.17 0.392 24.95 11% 85.0 67 8.00
12/28/2005 20 2 15% 55% 30% 49.71 54.88 27.22 22.37 0.301 19.93 11% 56.5 38 6.90
12/28/2005 21 3 0% 65% 35% 49.21 56.73 26.35 18.87 0.257 17.04 10% 41.3 20 6.11
1/9/2006 22 1 35% 40% 25% 54.51 54.29 26.43 22.78 0.291 20.45 10% 76.9 61 9.99
1/9/2006 23 2 15% 55% 30% 46.94 57.51 26.63 22.19 0.309 20.65 7% 31.1 16 3.78
1/10/2006 24 1 15% 60% 25% 55.09 56.16 23.73 27.76 0.378 25.71 7% 60.8 45 6.78
1/10/2006 25 2 0% 70% 30% 61.95 68.73 37.59 34.54 0.216 31.65 8% 56.5 39 6.97
1/12/2006 26 1 54 54.3 26.51 27.87 0.359 25.35 9% 65.4 49 6.88
373

37
0
20
40
60
80
100
120
0% 5% 10% 15% 20% 25% 30% 35% 40%
Silica addition (wt. %)
Bu
rn
th
ro
ug
h t
ime (
s)
Figure 24. Burn through time as a function of silica content.
0.0
2.0
4.0
6.0
8.0
10.0
12.0
0% 5% 10% 15% 20% 25% 30% 35% 40%
Silica addition (wt. %)
Ad
justed
Bu
rn
th
ro
ug
h t
ime
Figure 25. Adjusted burn through time as a function of silica content.
374
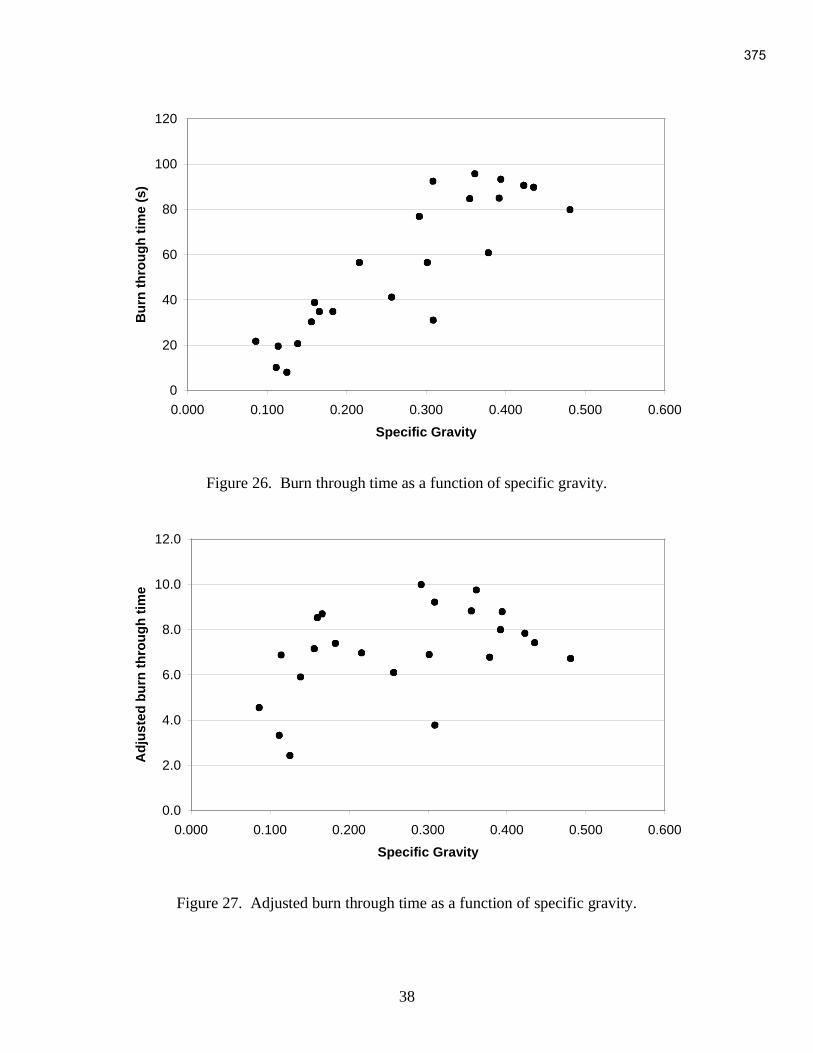
38
0
20
40
60
80
100
120
0.000 0.100 0.200 0.300 0.400 0.500 0.600
Specific Gravity
Bu
rn
th
ro
ug
h t
ime (
s)
Figure 26. Burn through time as a function of specific gravity.
0.0
2.0
4.0
6.0
8.0
10.0
12.0
0.000 0.100 0.200 0.300 0.400 0.500 0.600
Specific Gravity
Ad
justed
bu
rn
th
ro
ug
h t
ime
Figure 27. Adjusted burn through time as a function of specific gravity.
375

39
0
20
40
60
80
100
120
0% 20% 40% 60% 80% 100% 120%
Devolatilized pitch content
Bu
rn
th
ro
ug
h t
ime (
s)
Figure 28. Burn through time as a function of devolatilized pitch content.
0.0
2.0
4.0
6.0
8.0
10.0
12.0
0% 20% 40% 60% 80% 100% 120%
Devolatilized pitch content
Ad
justed
bu
rn
th
ro
ug
h t
ime
Figure 29. Adjusted burn through time as a function of devolatilized pitch content.
376

40
0
20
40
60
80
100
120
0% 20% 40% 60% 80% 100%
Binder pitch content
Bu
rn
th
ro
ug
h t
ime (
s)
Figure 30. Burn through time as a function of binder pitch content.
0.0
2.0
4.0
6.0
8.0
10.0
12.0
0% 20% 40% 60% 80% 100%
Binder pitch content
Ad
justed
bu
rn
th
ro
ug
h t
ime
Figure 31. Adjusted burn through time as a function of binder pitch content.
377
41
V. Conclusion and Summary
Foams and monoliths were manufactured using a combination of coal tar pitch
derivatives with reinforcement materials including pure silica as well as fly ash. These
materials may be of interest for structural applications.
Carbon was shown to be a heat resistant material with possible uses for reentry
shields and other very high temperature applications. However, the addition of fly ash or
silica did not make a significant enhancement in the ability of the sample to resist burn-
through in the presence of a high temperature oxyacetylene torch. It may be that
oxidation of the carbon was too rapid and prevented the samples from achieving the
necessary temperatures to form the silicon carbide phase.
VI. References
1 Maria V. Pulsonetti, Richard A. Thompson, Stephen J. Alter, Prediction of STS-107
Hypervelocity Flow Fields about the Shuttle Orbiter with Various Wing Leading Edge
Damage, NASA Langley Research Center, Hampton, Va. 2 King, Nathan Douglas (2004). Chemical and Physical Modification of Petroleum, Coal
Tar, and Coal-Extract Pitches by Air-Blowing, Master's Thesis, West Virginia
University. 3 “Final Technical Report”. Coal Based Nuclear Graphites for the New Production Gas
Cooled Reactor. Task 1: Development of Coal-Derived Isotropic Coke and Nuclear
Graphite. West Virginia University, 1994.
378
“Needle Coke from Coal-Derived Feedstock”
Final Report
December 15, 2005 to June 30, 2006
Doug J. Miller, John C. Chang
Irwin C. Lewis, Rick T. Lewis
Harold Schobert*, Maria M. Escallon*, Leslie R. Rudnick*
GrafTech International Ltd.
UCAR Carbon Company Inc.
Parma R&D Center
12900 Snow Road
Parma, OH 44130
* Pennsylvania State University
Report Issued: June 30, 2006
Contract Number: 2867-GTIL-DOE-1874
Prime Award Number: DE-FC26-03NT41874
This report was prepared as an account of work sponsored by an agency of the United States Government.
Neither the United States Government nor any agency thereof, or any of their employees, makes any
warranty, expressed or implied, or assumes any legal liability or responsibility for the accuracy,
completeness, or usefulness of any information, apparatus, product, or process disclosed, or represents that its
use would not infringe privately owned rights. Reference herein to any specific commercial product, process,
or service by trademark, manufacturer, or otherwise does not necessarily constitute or imply its endorsement,
recommendation, or favoring by the United States Government or any agency thereof. The views and
opinions of authors expressed herein do not necessarily state or reflect those of the United States Government
or any agency thereof.
379

2
ABSTRACT
The main goal of this program was to demonstrate that coal tar distillate (CTD) is a
highly suitable feedstock for needle coke. For this study, a heavy coal tar distillate from
Koppers Co. and a reference petroleum-derived decant oil were transformed to coke
using both a batch-scale autoclave at GrafTech and a continuous pilot coker at Penn.
State University. Coking was also carried out on a CTD/decant oil blend. The raw cokes
were characterized structurally and then calcined for use as filler in the production of
19mm diameter graphite electrodes. A graphite artifact produced using coke derived from
batch coking of the CTD gave an extremely low CTE value of 0.04 ppm/°C, showing that
the CTD would be an excellent needle coke feedstock. The CTD coke did show higher
puffing during graphitization than the decant oil coke due to a higher nitrogen content.
The CTD and decant oil feedstocks and the liquid byproducts from the continuous
coking runs were extensively characterized using a variety of analytical techniques. The
CTD products are considerably more aromatic and exhibit much less side chain
substitution than those from the petroleum-derived decant oil.
380

Table of Contents
ABSTRACT.................................................................................................................... 2
1. INTRODUCTION .................................................................................................. 6
2. EXPERIMENTAL.................................................................................................. 7
3. RESULTS AND DISCUSSION........................................................................... 17
4. CONCLUSIONS................................................................................................... 68
5. REFERENCES ..................................................................................................... 70
6. APPENDIX........................................................................................................... 71
Table of Figures
Figure 1: Nomograph for Calculation of Boiling Points ................................................. 9
Figure 2: Coking Reactor Schematic ............................................................................. 15
Figure 3: TGA Curve for Seadrift Decant Oil ............................................................... 21
Figure 4: TGA Curve for Koppers Coal Tar Distillate .................................................. 22
Figure 5: Temperature vs. Time for Batch Coking of Koppers Coal Tar Distillate at
100 psig in Coke Run 2............................................................................................. 23
Figure 6: Temperature vs. Time for Batch Coking of Seadrift Decant Oil at 100 psig in
Coke Run 1 ............................................................................................................... 24
Figure 7a: Temperature vs. Time for Batch Coking of CTD at 50 psig for Coke Run 3
................................................................................................................................... 25
Figure 7b: Temperature vs. Time for Batch Coking of 80/20 CTD/DO at 50 psig for
Coke Run 4 ............................................................................................................... 25
Figure 8: Polarized Light Micrograph of a Predominantly Flow Oriented Region in the
Bottom Sample from Coke Run 1 with Seadrift Decant Oil .................................... 30
Figure 9: Bright Field (a) and Polarized Light (b) Micrographs Showing Clusters of
Catalyst Fines in Top Sample from Coke Run 1 with Seadrift Decant Oil. ............. 31
Figure 10: Polarized Light Micrograph showing Flow Oriented and Small Domain
Areas in Koppers CTD Coke from Run 2................................................................. 31
Figure 11: Bright Field (a) and Polarized Light (b) Micrographs Showing a Large
Pocket of Isotropic Pitch Containing a Few Mesophase Spheres in the Bottom
Sample from Coke Run 2 with Koppers CTD. ......................................................... 32
Figure 12a: Polarized Light Photomicrograph of Region at the Top Surface of Coke
from Run 3 with CTD at 50 psig .............................................................................. 33
Figure 12b: Polarized Light Photomicrograph Showing Well-Oriented Coke in the Top
Region of Coke Obtained from Run 3 with CTD at 50 psig. .................................. 33
Figure 13: Polarized Light Photomicrograph Showing Large Domain Region in the
Middle Sample from Coke Run 3 with CTD at 50 psig. .......................................... 34
Figure 14: Polarized Light Photomicrograph Showing Flow Orientation..................... 35
In a Particle from Bottom Portion of Coke Run 3 with CTD at 50 psig................... 35
Figure 15: Polarized Light Micrograph Showing a Flow Aligned Structure in a.......... 36
Particle from the Middle Section of the 80% CTD/20% DO Raw Batch Coke from
Coke Run 4 ............................................................................................................... 36
381
4
Figure 16: Bright Field (a) and Polarized Light (b) Micrographs of a Platelet-Shaped
Particle in the Top Sample from PSU Coke Run #62 with Decant Oil Feedstock... 37
Figure 17: Bright Field (a) and Polarized Light (b) Higher Magnification Micrographs
Showing Detailed Structure of Platelet-Shaped Particles in the Top Sample from
PSU Coke Run #62 ................................................................................................... 38
Figure 18: Bright Field (a) and Polarized Light (b) Micrographs Showing Porous
Structure of Platelet –Shaped Particle Near Wall Surface in Bottom Sample from
PSU Coke Run #62 ................................................................................................... 39
Figure 19: Bright Field (a) and Polarized Light (b) Micrographs Showing a Platelet-
Shaped Particle in the Bottom Sample from PSU Coker Run #65 with Coal Tar
Distillate.................................................................................................................... 40
Figure 20: Bright Field (a) and Polarized Light (b) Micrographs Showing a Very Small
Domain Area in the Bottom Sample from PSU Coker Run #65 with Coal Tar
Distillate.................................................................................................................... 41
Figure 21: SEM Image at 250X (a), Carbon Dot Map (b) and Silicon Dot Map (c) for a
Platelet-Shaped Particle in Bottom Sample from PSU Coke Run #64..................... 42
Figure 22: EDX Spot Spectra at 5 kv Acceleration Voltage for a Location in the
Platelet-Shaped Particle Shown in Figure 21............................................................ 43
Figure 23: Bright Field (a) and Polarized Light (b) Micrographs Showing Catalyst
Fines in a Local Small Domain Area in Calcined Batch Coke Sample 3803 Made
from 100% Decant Oil .............................................................................................. 57
Figure 24: Bright Field (a) and Polarized Light (b) Micrographs Showing Very Small
Domain Areas from QI Particles in Calcined Batch Coke 5551 Made with 100%
Coal Tar Distillate..................................................................................................... 58
Figure 25: Bright Field (a) and Polarized Light (b) Micrographs Showing Loose
Agglomerate Structure of One Large Particle from Calcined Batch Coke Sample
3824 Made with Coal Tar Distillate at 100 psig ....................................................... 60
Figure 26: Bright Field (a) and Polarized Light (b) Micrographs Showing “Sintered”
Area in Calcined Batch Coke Sample 3824 Made with Coal Tar Distillate at 100
psig............................................................................................................................ 61
Figure 27: Low Magnification Bright Field (a) and Polarized Light (b) Micrographs and
High Magnification Bright Field (c) and Polarized Light (d) Micrographs of an Area
Showing Some Residual Contamination from a Platelet-Shaped Particle in One
Large Particle in Calcined Continuous PSU Coker Run #65 ................................... 63
Figure 28: Bright Field (a) and Polarized Light (b) Micrographs of a Highly Deformed
Area in a Particle from Calcined Continuous PSU Coker Run #63 with Coal Tar
Distillate.................................................................................................................... 64
382

5
List of Tables
Table I: 1H NMR Assignments for Functional Groups of Interest in Petroleum
Carbonization Chemistry ................................................................................... 11
Table II: 13
C NMR Assignments for Functional Groups of Interest in Petroleum
Carbonization Chemistry ................................................................................... 12
Table III: Hydrocarbon-Type Compounds Identified by GC/MS .................................... 18
Table IV: 1H NMR Determination of Group Types for Decant Oil and Coal-Tar Distillate
.......................................................................................................................... 18
Table V: 13
C NMR Determination of Group Types for Decant Oil and Coal-Tar Distillate
.......................................................................................................................... 19
Table VI: Simulated Distillation Results .......................................................................... 19
Table VII: Elemental Analysis for the Decant Oil and Coal-Tar Distillate...................... 20
Table VIII: Proximate Analysis for Decant Oil and Coal-Tar Distillate .......................... 20
Table IX: Asphaltene Content .......................................................................................... 20
Table X: Summary of Operating Conditions for Batch Coking Runs .............................. 26
Table XI: Summary of Green Coke Yield and Average MCC Values............................. 26
Table XII: MCC Values from Various Positions in the Coke Bed................................... 27
Table XIII: Summary of the Operating Conditions of Continuous Coking Runs ............ 28
Table XIV: Summary of the Coke and Liquid Yields for the Continuous Coking Runs . 29
Table XV: Simulated Distillation of Liquid By-products................................................. 45
Table XVI: Actual Vacuum Distillation of Liquid By-products ...................................... 45
Table XVII: Hydrocarbon-type compounds obtained by GC/MS – Gasoline.................. 46
Table XVIII: Compounds obtained by 1H NMR – Gasoline............................................ 46
Table XIX: 13
C NMR – Gasoline...................................................................................... 47
TableXX: Hydrocarbon-type compounds obtained by GC/MS - Jet Fuel........................ 48
Table XXI: Hydrocarbon-type compounds obtained by 1H NMR – Jet Fuel................... 49
Table XXII: Hydrocarbon-type compounds obtained by 13
C NMR – Jet Fuel ................ 49
Table XXIII: GC/MS – Diesel.......................................................................................... 50
Table XXIV: Hydrocarbon-type compounds obtained by 1H NMR – Diesel .................. 50
Table XXV: Hydrocarbon-type compounds obtained by 13
C NMR – Diesel .................. 51
Table XXVI: GC/MS – Fuel Oil...................................................................................... 52
Table XXVII: 1H NMR – Fuel Oil ................................................................................... 52
Table XXVIII: 13
C NMR – Fuel Oil ................................................................................. 53
Table XXIX: Summary of Raw Coke Calcining Yields from Batch Coking Runs.......... 53
Table XXX: Summary of Raw Coke Calcining Yields from Continuous Coking Runs.. 54
Table XXXI: Summary of CTE Rod Properties for Batch Cokes .................................... 55
Table XXXII: Summary of CTE Rod Properties for Continuous Cokes.......................... 55
Table XXXIII: Elemental Analyses of Green and Calcined Batch Cokes ....................... 65
Table XXXIV: Summary of Puffing Results for Calcined Batch Cokes.......................... 66
Table XXXV: Summary of Density and Porosity Results for Calcined Batch Cokes ..... 67
Table XXVI: XRD Parameters for Graphites From Batch Cokes.................................... 67
383

6
1. INTRODUCTION
Needle coke is the most important industrial raw material for producing graphite
electrodes. Graphite electrodes are used in the electric arc furnace (EAF) for making steel
from scrap metals. This EAF method of steel production is more energy efficient than the
alternate process of producing steel from iron ore. There is currently a worldwide demand
of one million metric tons of needle coke per year. Among those needle coke
requirements, less than 15% of the coke needs are supplied by coal-based feedstock. In
the United States, there is no coal-based needle coke producer at all. Two US needle coke
producers, ConocoPhillips and Seadrift Coke, LP, are using petroleum-based feedstock to
produce needle coke. Coal-based needle coke is available only in Japan and is based on a
coal tar feedstock from metallurgical coking which has been previously treated for
removal of quinoline insoluble (QI) solids.
Coal-based feedstock can have inherent advantages over petroleum-derived
precursors because of its molecular composition. Coal-based feedstock, in general is
more aromatic and has less side chains attached to the aromatic rings. If treated properly,
the coefficient of thermal expansion (CTE), a major coke quality indicator, could be
superior to that of petroleum-based needle coke. In this study, solid-free coal based
distillate was used as the precursor for needle coke. Through use of a distillate material,
the prior QI separation procedures used in Japan would not be necessary. Coal-based
distillates are also readily available from commercial coal tar distillation processes. For
comparison, a petroleum-based needle coke feedstock was also evaluated by itself and in
a blend with the coal-based distillate.
Our approach was to perform a series of batch coking experiments in the high-
pressure autoclave pilot plant at Parma using both coal and petroleum-based feedstocks
individually and in a blend. The results of these batch-coking experiments were used to
guide trial coking runs using the small continuous pilot coking unit at Pennsylvania State
University for generating liquid by-products for analysis. The value of the liquid by-
products is an important contributor to coking economics. Solid raw cokes were then
calcined at the Parma pilot facility and characterized for needle coke quality. Liquid
products were analyzed and evaluated for their suitability as fuels using the analytical
capabilities at Penn. State University.
Graphite artifacts were manufactured from all the calcined needle cokes. The
resultant coefficient of thermal expansion (CTE) was measured on these artifacts to
assess the needle coke quality. Optical microscopy was used to characterize coke
structure at various stages of production. Puffing tests of the batch processed cokes were
conducted to determine the puffing behavior during the graphitization processes. All of
the results are presented in the body of this Final Report.
384

7
2. EXPERIMENTAL
Coal and petroleum-based feedstocks were acquired for the program. The coal-
based material is a high boiling coal tar distillate obtained from the Koppers Co. We had
used this material in a previous CPCPC Program (2679-GITL-DOE-1874) as a precursor
for mesophase pitch.
The petroleum-based feedstock was a decant oil derived from catalytic cracking
of a gas oil distillate. We obtained a 55-gallon sample of this material from the Seadrift
Coke, LP, at Seadrift, Texas. This facility has been used to produce needle coke.
2.1. Analytical Characterization Tests on Feedstocks
A variety of analytical tests were carried out on the original coke
feedstocks and on coking liquid by-products using facilities at the Parma Testing
Services Lab and at Penn. State University. The methods include: Modified
Conradson Carbon (MCC), ash, C,H,N,S analyses, TGA weight loss, 1H and
13C
NMR, GC, GC-MS and vacuum distillations. A description of the test methods
used for this program follows:
2.1.1. Gas Chromatography / Mass Spectrometry (GC/MS)
The samples injected into the GC/MS were prepared as follows:
Approximately 0.02-0.03 grams of the material was dissolved in
approximately 1 gram of dichloromethane. The injection volume was
1.0 μL.
A Shimadzu QP-5000 GC/MS containing an XTi-5 column from
Restek (30m x 0.25mm x 0.25 μm) was used. The instrument was
programmed to run at 40 °C for 4 minutes, and then ramped up to 310 °C
at a rate of 4 °C/min. This final temperature was held for 10 min.
The compound identification was made using the built-in library
search and classified into eight different groups: paraffins, cycloalkanes,
alkylbenzenes, indenes, naphthalenes, tetralins, decalins and polycyclic
structures. The composition identification was made by peak to peak
comparison with the built-in library and then classified according to the
compounds mentioned above.
The summation of the area for each specific hydrocarbon type was
divided by the summation of the areas of all the peaks. Hence, the
percentage of each hydrocarbon type was obtained.
385

8
2.1.2. Simulated Distillation Gas Chromatography
Simulated distillation by gas chromatography (SimDist GC) was
utilized in an attempt to determine the boiling-cut distributions of the
original decant oil and coal-tar distillate and the liquid by-products from
pilot coking. A Hewlett Packard HP 5890 GC Series II model was
employed. The column was a Restek Sim. Dist. column (Carborane
siloxane polymer).
The data obtained from this ASTM D2887 Method determined the
yield by weight of any given fraction of liquid products examined. The
first boiling range fraction was defined as liquids that had a boiling point
of less than 175 °C. The second group was the jet fuel range and was
defined as liquids with boiling points between 175° and 300 °C. The next
group fell within the boiling range of 300-550 °C.
All of the samples were prepared as follows: Approximately 0.03-
0.04 g of the material was dissolved in 1.2-1.5 grams of carbon disulfide.
The samples were then placed in the Hewlett Packard automatic injection
tray.
The sample was injected at 40 °C and held at this temperature for 4
minutes. The oven was then ramped up to 425 °C at a rate of 10 °C/min
and held there for 15 minutes. The total run time was 57.5 minutes.
The data calibration was based on the use of n-alkanes as a
reference. This procedure has been used previously for analysis of
petroleum feedstocks, such as decant oil. However, as discussed later it
was found inappropriate for the more aromatic coal tar distillate products.
Therefore, we used regular vacuum distillation to characterize the liquids
from the pilot coking runs.
2.1.3. Vacuum Distillations
The vacuum distillations were performed on the liquid by-products
in order to obtain the true boiling point ranges. The use of vacuum
minimizes sample decomposition. The distillations were performed using
a 250 ml flask mounted in a heating mantle. A 100 ml quantity of the
liquid was poured into a 250 ml vessel and a magnetic stirrer was used to
assure a uniform temperature in the liquid inside the flask. The flask,
glass bead packed column, distillation unit and liquid receiver were
assembled; the pump hose was connected with the distillation system to
provide vacuum. As the heating power was increased, the vapors were
condensed and refluxed in the glass bead packed column. After passing
through the packed column, the vapors were condensed and collected into
the receiver flask.
386

9
Shown in Figure 1 is a nomograph, which was used to correlate the
temperature at a given pressure (under vacuum) with the temperature at
atmospheric pressure. The pressure and the temperature were constantly
monitored during the distillation process.
Figure 1: Nomograph for Calculation of Boiling Points
2.1.4. CHN Elemental Analysis
The LECO 600 CHN analyzer was used to measure total carbon,
hydrogen and nitrogen contents in solid and liquid samples.
2.1.5. Total Sulfur Determination Analysis
The LECO SC 132 analyzer was used to measure total sulfur
content in solid and liquid samples.
2.1.6. Automatic Determination of Proximate Analysis
The LECO MAC-400 analyzer was used to measure moisture,
volatile matter and ash content by the loss of weight of the samples, after
having been heated under atmospheric conditions.
387
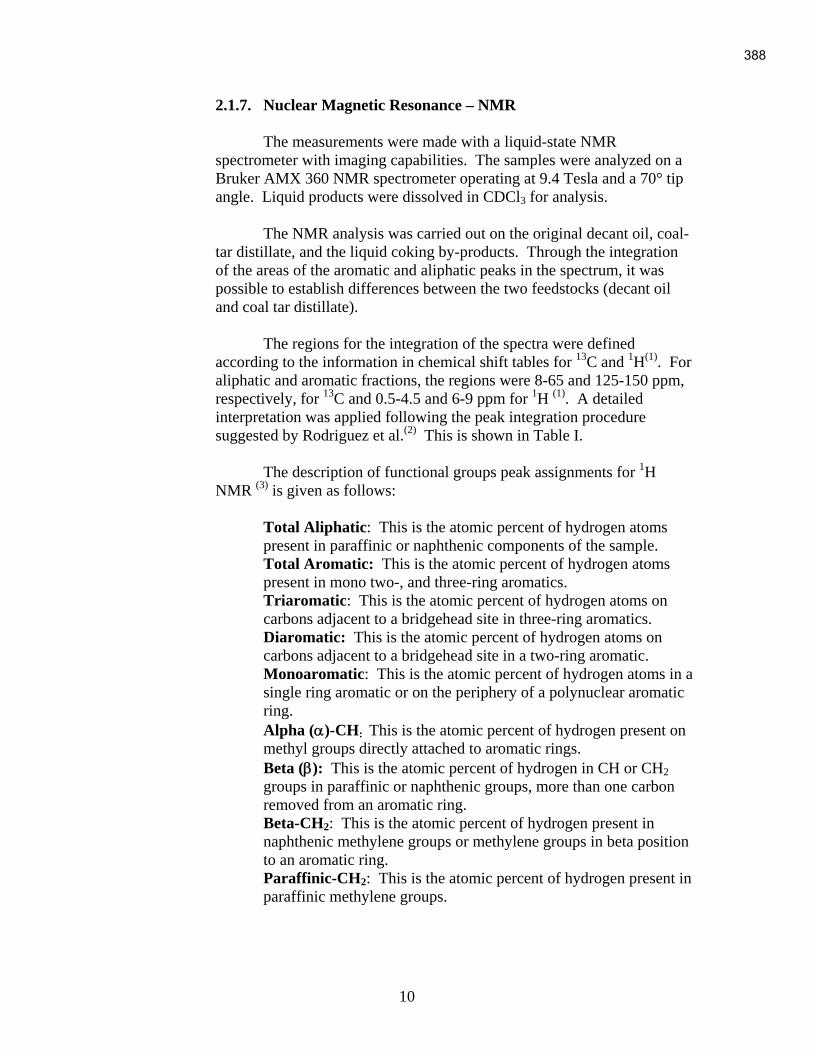
10
2.1.7. Nuclear Magnetic Resonance – NMR
The measurements were made with a liquid-state NMR
spectrometer with imaging capabilities. The samples were analyzed on a
Bruker AMX 360 NMR spectrometer operating at 9.4 Tesla and a 70° tip
angle. Liquid products were dissolved in CDCl3 for analysis.
The NMR analysis was carried out on the original decant oil, coal-
tar distillate, and the liquid coking by-products. Through the integration
of the areas of the aromatic and aliphatic peaks in the spectrum, it was
possible to establish differences between the two feedstocks (decant oil
and coal tar distillate).
The regions for the integration of the spectra were defined
according to the information in chemical shift tables for 13
C and 1H
(1). For
aliphatic and aromatic fractions, the regions were 8-65 and 125-150 ppm,
respectively, for 13
C and 0.5-4.5 and 6-9 ppm for 1H
(1). A detailed
interpretation was applied following the peak integration procedure
suggested by Rodriguez et al.(2)
This is shown in Table I.
The description of functional groups peak assignments for 1H
NMR (3)
is given as follows:
Total Aliphatic: This is the atomic percent of hydrogen atoms
present in paraffinic or naphthenic components of the sample.
Total Aromatic: This is the atomic percent of hydrogen atoms
present in mono two-, and three-ring aromatics.
Triaromatic: This is the atomic percent of hydrogen atoms on
carbons adjacent to a bridgehead site in three-ring aromatics.
Diaromatic: This is the atomic percent of hydrogen atoms on
carbons adjacent to a bridgehead site in a two-ring aromatic.
Monoaromatic: This is the atomic percent of hydrogen atoms in a
single ring aromatic or on the periphery of a polynuclear aromatic
ring.
Alpha (α)-CH: This is the atomic percent of hydrogen present on
methyl groups directly attached to aromatic rings.
Beta (β): This is the atomic percent of hydrogen in CH or CH2
groups in paraffinic or naphthenic groups, more than one carbon
removed from an aromatic ring.
Beta-CH2: This is the atomic percent of hydrogen present in
naphthenic methylene groups or methylene groups in beta position
to an aromatic ring.
Paraffinic-CH2: This is the atomic percent of hydrogen present in
paraffinic methylene groups.
388
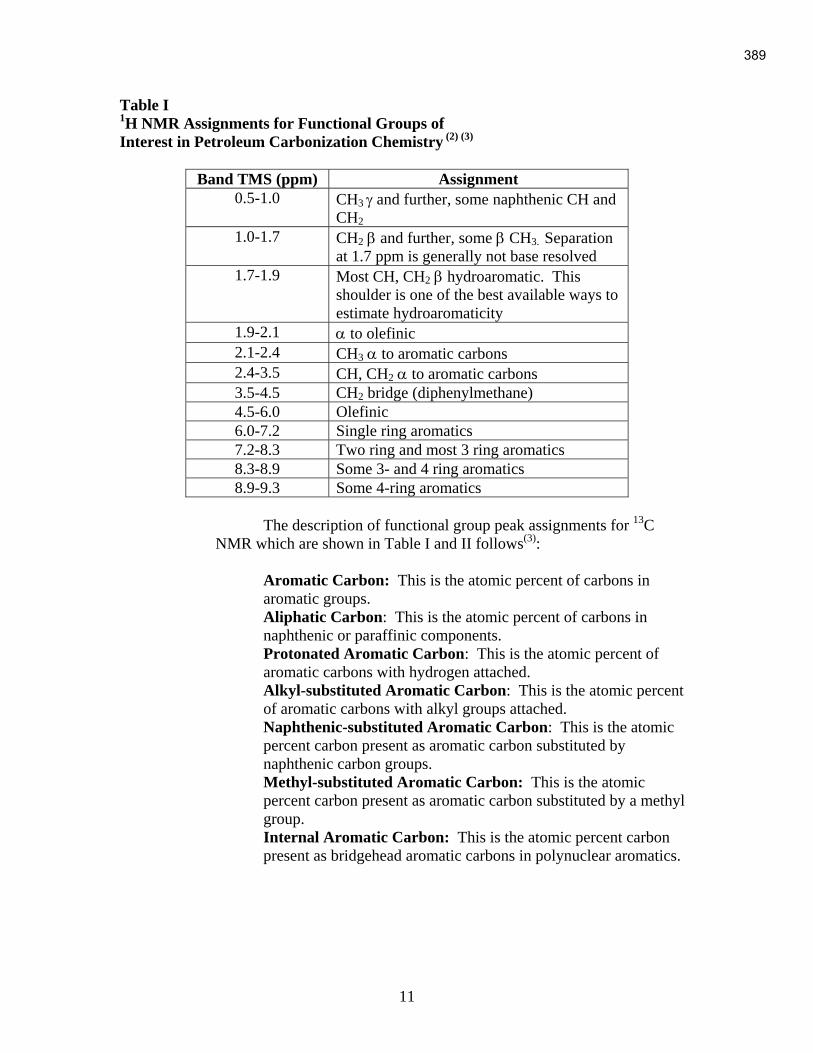
11
Table I 1H NMR Assignments for Functional Groups of
Interest in Petroleum Carbonization Chemistry (2) (3)
Band TMS (ppm) Assignment
0.5-1.0 CH3 γ and further, some naphthenic CH and
CH2
1.0-1.7 CH2 β and further, some β CH3. Separation
at 1.7 ppm is generally not base resolved
1.7-1.9 Most CH, CH2 β hydroaromatic. This
shoulder is one of the best available ways to
estimate hydroaromaticity
1.9-2.1 α to olefinic
2.1-2.4 CH3 α to aromatic carbons
2.4-3.5 CH, CH2 α to aromatic carbons
3.5-4.5 CH2 bridge (diphenylmethane)
4.5-6.0 Olefinic
6.0-7.2 Single ring aromatics
7.2-8.3 Two ring and most 3 ring aromatics
8.3-8.9 Some 3- and 4 ring aromatics
8.9-9.3 Some 4-ring aromatics
The description of functional group peak assignments for 13
C
NMR which are shown in Table I and II follows(3)
:
Aromatic Carbon: This is the atomic percent of carbons in
aromatic groups.
Aliphatic Carbon: This is the atomic percent of carbons in
naphthenic or paraffinic components.
Protonated Aromatic Carbon: This is the atomic percent of
aromatic carbons with hydrogen attached.
Alkyl-substituted Aromatic Carbon: This is the atomic percent
of aromatic carbons with alkyl groups attached.
Naphthenic-substituted Aromatic Carbon: This is the atomic
percent carbon present as aromatic carbon substituted by
naphthenic carbon groups.
Methyl-substituted Aromatic Carbon: This is the atomic
percent carbon present as aromatic carbon substituted by a methyl
group.
Internal Aromatic Carbon: This is the atomic percent carbon
present as bridgehead aromatic carbons in polynuclear aromatics.
389
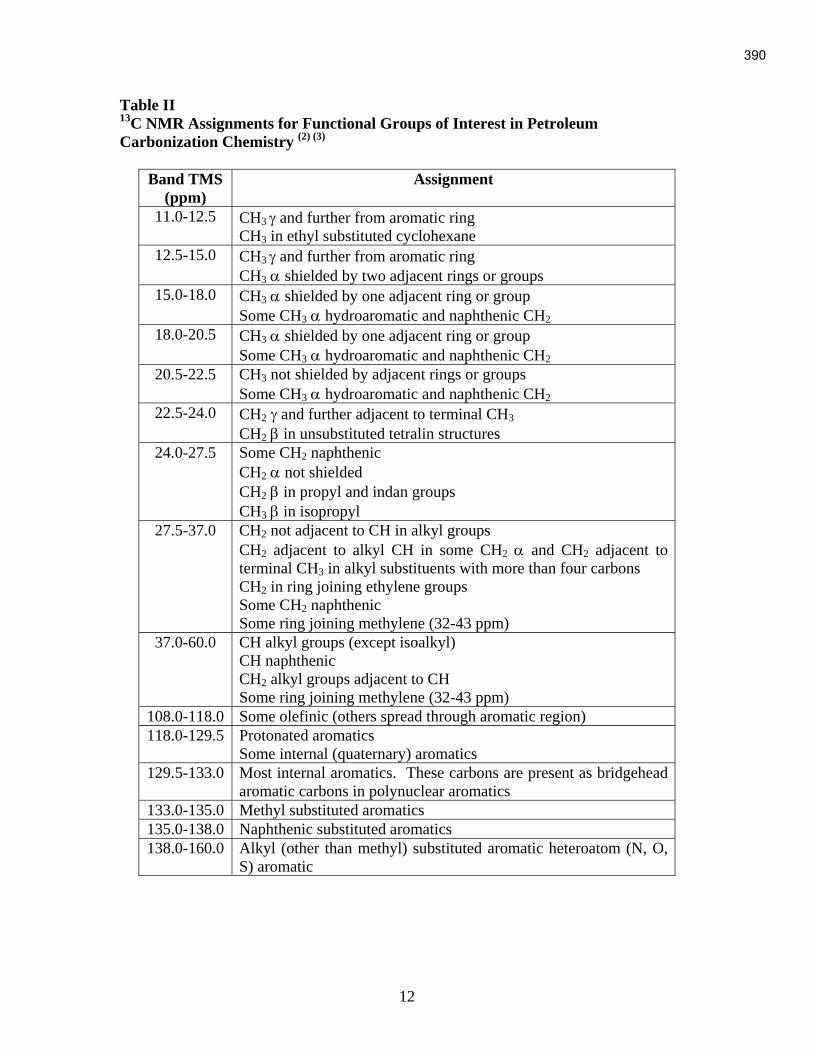
12
Table II 13
C NMR Assignments for Functional Groups of Interest in Petroleum
Carbonization Chemistry (2) (3)
Band TMS
(ppm)
Assignment
11.0-12.5 CH3 γ and further from aromatic ring
CH3 in ethyl substituted cyclohexane
12.5-15.0 CH3 γ and further from aromatic ring
CH3 α shielded by two adjacent rings or groups
15.0-18.0 CH3 α shielded by one adjacent ring or group
Some CH3 α hydroaromatic and naphthenic CH2
18.0-20.5 CH3 α shielded by one adjacent ring or group Some CH3 α hydroaromatic and naphthenic CH2
20.5-22.5 CH3 not shielded by adjacent rings or groups
Some CH3 α hydroaromatic and naphthenic CH2
22.5-24.0 CH2 γ and further adjacent to terminal CH3
CH2 β in unsubstituted tetralin structures
24.0-27.5 Some CH2 naphthenic
CH2 α not shielded
CH2 β in propyl and indan groups
CH3 β in isopropyl
27.5-37.0 CH2 not adjacent to CH in alkyl groups
CH2 adjacent to alkyl CH in some CH2 α and CH2 adjacent to
terminal CH3 in alkyl substituents with more than four carbons
CH2 in ring joining ethylene groups
Some CH2 naphthenic
Some ring joining methylene (32-43 ppm)
37.0-60.0 CH alkyl groups (except isoalkyl)
CH naphthenic
CH2 alkyl groups adjacent to CH
Some ring joining methylene (32-43 ppm)
108.0-118.0 Some olefinic (others spread through aromatic region)
118.0-129.5 Protonated aromatics
Some internal (quaternary) aromatics
129.5-133.0 Most internal aromatics. These carbons are present as bridgehead
aromatic carbons in polynuclear aromatics
133.0-135.0 Methyl substituted aromatics
135.0-138.0 Naphthenic substituted aromatics
138.0-160.0 Alkyl (other than methyl) substituted aromatic heteroatom (N, O,
S) aromatic
390

13
2.1.8. Asphaltene Content
The asphaltenes were quantified by following the ASTM Method
D-3279.
2.1.9. Modified Conradson Carbon (MCC), Ash
The MCC was measured using procedure ASTM D-2416 and the
ash content was determined employing a modification of ASTM C-561.
2.1.10. Thermogravimetric Analysis (TGA)
A special TGA method, which was adapted from ASTM E-2008,
was used to estimate the boiling range of the feedstocks. The method uses
a pan/lid assembly with a nominal 0.38 mm laser drilled hole in the lid.
The heating rate is 5 °C/min from room temperature to 500 °C in a low
flow rate of argon gas through the TGA. The measurements were made
using a TA Instruments Model 2950 TGA.
2.2. Pilot-Scale Autoclave Batch Coking (Parma Technical Center)
The pilot-scale batch coking experiments were performed in an autoclave
system with dimensions of 11.75” I.D. by 57” inside length. The autoclave is
capable of 1500 psig pressure and up to 600 °C operating temperature. The
temperature can be computer controlled for a pre-determined ramping rate, final
hold temperature and hold time. Gas pressure was maintained during a run with
an automatic control system. The pressure heat treatments were carried out on
material contained in a covered stainless steel can with a capacity of about 16
liters. The can was partially filled with approximately 8,000 grams of coal tar
distillate or petroleum-based feedstock.
The coking temperature was set to a nominal 475 °C. The autoclave was
heated at a ramping rate of 50 °C/hr to the set point temperature of the autoclave,
held at temperature for 20 hours, and then cooled down. The raw coke was
weighed to obtain the coke yield, and samples were taken for analysis for MCC
and optical microscopy.
2.3. Pilot Plant Calcination and Puffing Measurement
The raw cokes from the coking trials were crushed and heat treated
(calcined) to 1,420 °C and held at the temperature for 30 minutes in a tube
furnace. The calcined coke was then crushed and screened for further needle coke
characterization.
Puffing is an irreversible expansion of carbon artifacts during the heat
treatment to over 3,000 °C; it is attributed to the evolution of sulfur and nitrogen
391

14
containing species. A dilatometer was used to measure the expansion of the
calcined coke particles during heat treatment up to 2200°C in a tube furnace for
this project.
2.4. Coke Characterization by Microscopy
Raw and calcined coke specimens for metallographic observations by
optical microscopy were prepared by encapsulating the particles in epoxy,
grinding to a midline cross-section and polishing using standard procedures.
Optical microscopy observations and photomicrographs in bright field and
polarized light (crossed polarizers) were obtained with a Reichert MEF4
microscope. One coke specimen was also examined by a SEM JEOL JSM-
5900LV coupled with EDX Oxford Model 7274.
2.5. CTE Rod Preparation
The calcined coke flours were hot-mixed with a typical coal tar binder
pitch at 165 °C. The coke-binder mix was then extruded to a 19 mm diameter rod.
The rods were heat-treated to about 850 °C in a baking furnace, and the baked
rods were further graphitized to 3,000 °C in a tube furnace. The bulk density
(ASTM C-559), specific resistance (ASTM C-611) were then measured on the
graphitized rod.
2.6. CTE Measurement by PATE Machine
The CTE measurements of the graphitized rods were carried out using a
PATE machine (Parma Apparatus for Thermal Expansion), which is based on the
capacitance between two parallel plates of the ends of the rod. The details of the
measurement have been published.(4)
2.7. Continuous Pilot Coking Experiments (Pennsylvania State University)
The delayed coking unit was designed after a unit developed at the PARC
Technical Services, Harmarville, PA Pilot-Scale Laboratory Coker (PSLC) and
consisted of a 7.5 cm ID x 102.5 cm cylindrical reactor unit having an internal
volume of approximately 4.5 liters. The system pressure, temperature and flow
rates are monitored by a number of computer-controlled devices, and data from
these devices are recorded throughout the run.
The preheater was a 2.5cm OD x 51cm stainless steel tube fitted directly
to the bottom of the reactor. This was fed by a 3/8” feed line that was outside the
furnace and was heated to 238 °C using heating tape. This design configuration
allows for essentially trouble-free pumping of the feedstock over a wide
temperature range. The temperature gradient through this 51cm preheater is on the
order of 200 °C with an outlet temperature of 420-460 °C. The preheater was
connected to a 1/4” line that carried feedstocks from the feed pump.
392

15
The following operating conditions were used: coke drum inlet
temperature 495 °C, coke drum pressure 50 to 100 psig, and feed rate 16.7 g/min
for 6 hours. At the conclusion of feedstock Introduction period, the coke drum
was maintained at a temperature of about 500 °C for an additional 24 hours to
insure carbonization of non-volatile components. The pilot-scale laboratory coker
and associated equipment is shown in Figure 2. The coke drum product
temperature was maintained near 495 °C.
The feed is charged to a heated feedstock vessel that was continuously
mixed throughout the coking experiment to achieve and maintain homogeneity. In
these experiments the temperature was kept at 66 °C. The feed was incrementally
heated along the feed line to the preheater. Feed was heated in the lines prior to
the preheater to about 180 °C, and then to about 420 °C in the preheater. Heated
feedstock from the preheater was fed to the coker drum. Thermocouples attached
at different positions along the coke drum were used to measure and to control the
temperature during the experiment. Light hydrocarbons that vaporized exit from
the top of coker drum and pass through a series of condensers. Gases went
through a mass flow meter and were either collected or sent to vent.
1. Heated Feedstock Tank 8. Thermocouple Well
2. Feedstock Pump 9. DP Cell
3. Balance 10. Back Pressure Regulator
4. Metering Pump 11. Condenser
5. Superpreheater 12. Receiver Tank
6. Preheater 13. Mass Flow Meter
7. Coker Drum
Figure 2: Coking Reactor Schematic
393

16
Liquid by-products from the coking runs were collected and analyzed
using the following methods:
• Boiling point distributions by simulated distillation gas chromatography, with
a Hewlett Packard 5890 Series II chromatograph, following the standard
ASTM D2887 method.
• Direct vacuum distillation
• Elemental analysis using a Leco 600-CHN analyzer and a SC-132 sulfur
analyzer.
• Gas chromatography-mass spectrometry for identification of specific
compounds, using a Shimadzu QP-5000 instrument with Restek XTi-5
column .
• Solid-phase extraction for separation of polar species and their subsequent
identification by GC-MS.
• Both 13
C and 1H nuclear magnetic resonance spectrometry, for determining
aromatic and aliphatic carbon and hydrogen distribution. The instrument used
is a Bruker AMX 360.
All of this equipment is located in the laboratories of Penn State’s Energy
Institute.
2.8. X-Ray Diffraction
X-ray diffraction measurements were made on the graphite artifacts
produced from the four different batch cokes. A description of the conditions
used follows:
The samples were crushed in a Spex mill and screened to pass a ~375
mesh sieve. The powders were then loaded into holders for determining the XRD
parameters. The measurements were made on a Scintag Diffractometer X2 with a
theta-theta goniometer, graphite monochrometer, and a scintillation detector.
Samples were powdered and mixed with 3% NIST 640c Silicon, which was used
as an internal peak position standard. The samples were loaded using a front
packing method with a spinning sample holder. Measurement conditions were as
follows:
Accelerating Voltage 40 kV
Beam Current 40 mA
Slit size 0.015 mm
Step size 0.020 Deg
Count time 0.02 Sec
Range 5 to 100 Deg 2 Theta
The software used included Scintag DMSNT v 1.37 for data Acquisition
and K-Alpha 2 Stripping, Peak-Fit V-4.11, and Table-Curve v- 5.01 for peak
finding, background subtraction, goodness of fit and line fitting. Purified natural
394

17
graphite standard SP-1 was used to determine instrumental and inherent line
broadening. A shape factor of .95 was used in the Scherrer equation.
3. RESULTS AND DISCUSSION
3.1. Feedstock Characterization
Characterization of the decant oil and coal-tar distillate was carried out
using the techniques of 1H and
13C NMR, GC/MS, SimDis, elemental analysis
and asphaltene content determination. The results are summarized in Tables III to
IX.
The GC/MS date in Table III show that the coal tar distillate has a higher
content of polycyclic aromatic structures than the decant oil and a lower content
of paraffins, cycloalkanes, tetralins and decalins. In general, decant oil has more
hydrogen-containing structures compared to those of the coal tar distillate. The
results observed by GC/MS are supported by the elemental analysis where the
H/C ratio is higher for the decant oil than for the coal tar distillate.
The 1H and
13C NMR data in Tables IV and V provide additional
information about the chemical structures present in the two materials. According
to the assignments for functional groups, 1H NMR shows higher aromaticity for
CTD compared to decant oil as well as a lower hydroaromaticity and lower
degree of alkyl substitution. The number of CH, CH2 and CH3 groups attached to
aromatic carbons is higher for decant oil than for CTD.
The 13
C NMR shows more alkyl groups and CH3 α to hydroaromatic and
naphthenic CH2 for decant oil than CTD. The CTD has more internal aromatics
than decant oil.
The simulated distillation data in Table VI show that the CTD has heavier
components than the decant oil. The elemental analysis data in Table VII show
that the CTD, in addition to being more aromatic, has a higher nitrogen content
than the decant oil.
395

18
Table III
Hydrocarbon-Type Compounds Identified by GC/MS
Decant
Oil, %
Coal-Tar
Distillate, %
Paraffins 9.91 0.03
Cycloalkanes 3.52 0.29
Alkyl benzenes 3.61 2.94
Indenes 2.47 4.90
Naphthalenes 3.42 5.87
Tetralins 1.88 0.34
Decalins 0.24 0.00
Polycyclic structures 74.94 85.63
Table IV 1H NMR Determination of Group Types for Decant Oil and Coal-Tar Distillate
(Ref. Table I)
Band TMS
(ppm)
Decant
Oil
Coal-Tar
Distillate
%
0.5-1.0 13.0 5.7
1.0-1.7 29.6 12.6
1.7-1.9 1.8 0.9
1.9-2.1 1.5 1.0
2.1-2.4 5.8 11.2
2.4-3.5 19.4 28.8
3.5-4.5 1.6 1.7
4.5-6.0 0.2 0.0
6.0-7.2 4.1 4.3
7.2-8.3 20.0 28.4
8.3-8.9 2.9 5.1
8.9-9.3 0.0 0.2
0.5-4.5 72.8 61.9
6.0-9.0 27.2 38.1
396

19
Table V 13
C NMR Determination of Group Types for Decant Oil and Coal-Tar Distillate
Band TMS
(ppm)
Decant
Oil
Coal-Tar
Distillate
% 11.0-12.5 0.1 0.2
12.5-15.0 2.0 1.0
15.0-18.0 1.9 0.4
18.0-20.5 3.0 1.6
20.5-22.5 4.8 1.1
22.5-24.0 3.3 1.4
24.0-27.5 2.5 2.0
27.5-37.0 16.1 11.5
37.0-60.0 6.0 3.4
108.0-118.0 0.0 2.2
118.0-129.5 35.4 60.9
129.5-133.0 9.1 7.3
133.0-135.0 3.0 1.3
135.0-138.0 4.2 2.1
138.0-160.0 8.5 3.6
8.0-65.0 45.4 32.9
125-150.0 54.6 67.1
Table VI
Simulated Distillation Results
Decant Oil Coal-Tar
Distillate
IBP, °C 113.5 173.5
10%, °C 123.8 203.4
20%, °C 135.6 243.9
50%, °C 216.9 353.5
95%, °C 489.1 497.9
FBP, °C 522.1 522.8
IBP-180, % 40.50 2.30
180-270, % 19.04 23.41
270-FBP, % 39.53 73.34
IBP=Initial Boiling Point, FBP=Final Boiling Point
397

20
Table VII
Elemental Analysis for the Decant Oil and Coal-Tar Distillate
H,% C,% S,% N,% Atomic
H/C
Coal-Tar Distillate 5.81±0.09 92.72±0.05 0.65±0.00 1.11±0.04 0.75
Decant Oil 7.86±0.10 91.68±0.26 0.48±0.01 0.44±0.01 1.02
Table VIII
Proximate Analysis for Decant Oil and Coal-Tar Distillate
% Moist.
Sample
(As Recd.)
% Ash
(Dry)
% VM
(Dry)
%FC
(Dry)
Coal-Tar Distillate 0.10±0.02 0.00±0.00 98.00±0.03 2.00
Decant Oil 0.21±0.05 0.03±0.03 93.79±0.20 6.19
Table IX
Asphaltene Content
Wt. %
Coal-Tar Distillate 0.33
Decant Oil 1.63
398

21
3.2. Pinhole TGA Results on Feedstocks
Figure 3 shows the pinhole TGA curve for the Seadrift decant oil. The
extrapolated onset temperature of 341 °C is consistent with the expected boiling
range for a decant oil and the 7.2% residue after heating to 500 °C is also
consistent with the measured MCC value of 8.8%.
92.77% Weight Change(12.92mg)
340.68°C
-0.2
0.0
0.2
0.4
0.6
0.8
[ – –
– –
] D
eri
v. W
eig
ht
(%/°
C)
0
20
40
60
80
100
120
Weig
ht (%
)
0 100 200 300 400 500
Temperature (°C)
GrafTech International Ltd.
Sample: 2005033101 2005-02430Size: 13.9320 mgMethod: RampComment: Seadrift D.O. RT_500_5C_min PHHP Ar 35cc/min 13.933 mg
TGAFile: Seadrift D.O. RT_500_5C_min PHHP Ar 3...Operator: D.M. RiffleRun Date: 28-Apr-05 08:24Instrument: 2950 TGA V5.4A
Universal V3.7A TA Instruments
Figure 3: TGA Curve for Seadrift Decant Oil
399

22
Figure 4 shows the pinhole TGA curve for the coal tar distillate sample.
The 325 °C extrapolated onset temperature is consistent with the expected boiling
range for this distillate fraction. The very low (1.2%) residue after heating to
500 °C is consistent with the distillate origin of this material and is also consistent
with the very low MCC value of 1.4% measured for this sample.
Figure 4: TGA Curve for Koppers Coal Tar Distillate
The boiling temperatures from the TGA method are appreciably higher
than those calculated by the GC Simulation method in Table VI. The GC/Sim
method employed paraffinic compounds as reference materials, which is
apparently not appropriate for these more aromatic feedstocks.
400

23
3.3. Coking of Koppers Coal Tar Distillate and Seadrift Petroleum
Feedstock
3.3.1. Pilot-Scale Autoclave Batch Coking at Parma
The first two batch coking runs were carried out under 100-psig
gas pressure at a nominal product temperature of 475 °C with a ramping
rate of 50 °C/hr and a hold time at 475 °C of 20 hours. The temperature
vs. time curves for the thermocouples placed at the top and bottom
external positions and the internal location (product temperature within the
stainless steel can) for coking runs with the Koppers coal tar distillate and
the Seadrift decant oil are shown in Figures 5 and 6, respectively.
CTD Coke Run 2
-50
50
150
250
350
450
550
0 10 20 30 40 50 60
Time (hours
Product
Top Skin
Bottom Skin
Figure 5: Temperature vs. Time for Batch Coking of Koppers Coal Tar Distillate at
100 psig in Coke Run 2
401

24
Seadrift Decant Oil
0
100
200
300
400
500
600
0.0 10.0 20.0 30.0 40.0 50.0 60.0
Hours
Deg
re
es C
Product
Bottom Skin
Top Skin
Figure 6: Temperature versus Time for Batch Coking of Seadrift Decant Oil at
100 psig for Coke Run 1
A third batch coking run was also carried out for the coal tar
distillate (CTD) at 50 psig, and at 475°C for 20 hours. The purpose was to
determine whether the high coke yield obtained at 100 psig could be
duplicated at the lower pressure. A fourth batch coking run was performed
with a blend of 80 wt.% CTD with 20 wt.% of decant oil using the same
50 psig and temperature conditions. The decant oil component would
reduce the overall nitrogen content of the derived coke and, possibly lead
to more orientation during coking as a result of gas evolution from the
decomposing aliphatic side chains.
The temperature vs. time curves for the thermocouples placed at
the top, bottom, and internal locations of the can for these two batch
coking runs are shown in Figure 7a and 7b, respectively.
402
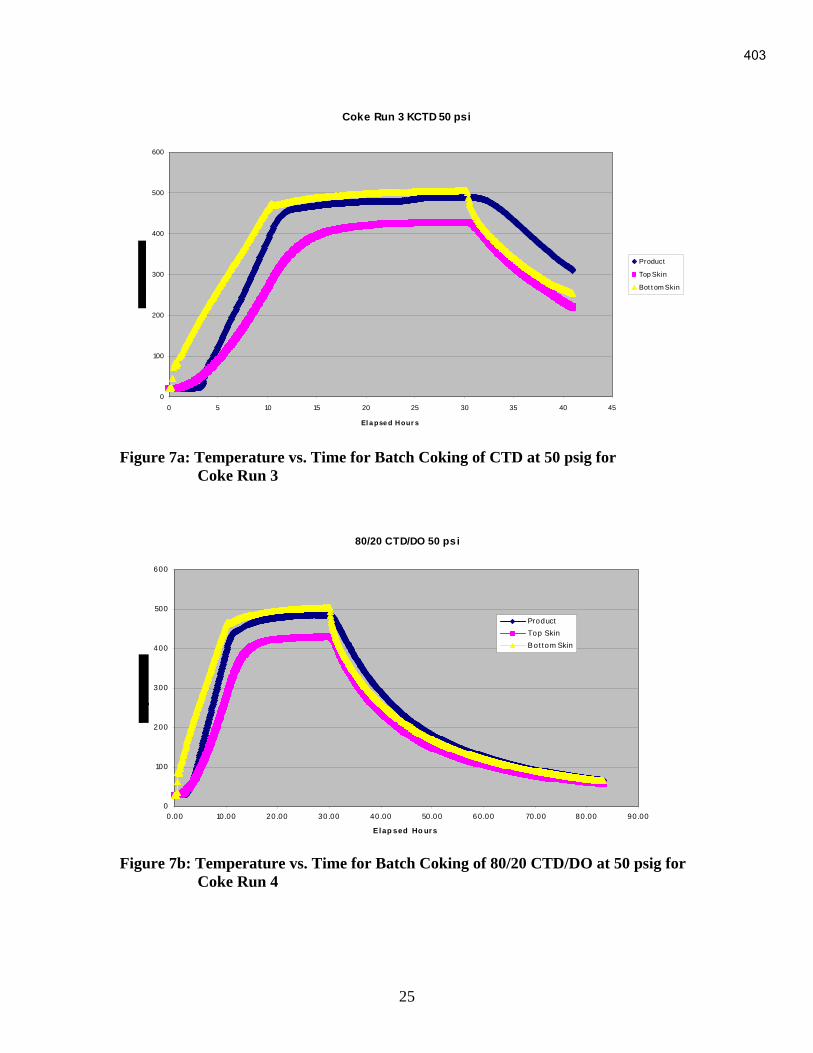
25
Coke Run 3 KCTD 50 psi
0
100
200
300
400
500
600
0 5 10 15 20 25 30 35 40 45
El a pse d Hour s
Product
Top Skin
Bot t om Skin
Figure 7a: Temperature vs. Time for Batch Coking of CTD at 50 psig for
Coke Run 3
80/20 CTD/DO 50 psi
0
100
200
300
400
500
600
0.00 10.00 20.00 30.00 40.00 50.00 60.00 70.00 80.00 90.00
Elap sed Ho ur s
Product
Top Skin
Bot tom Skin
Figure 7b: Temperature vs. Time for Batch Coking of 80/20 CTD/DO at 50 psig for
Coke Run 4
403

26
A summary of the operating conditions for the four batch coking
runs is presented in Table X.
Table X
Summary of Operating Conditions for Batch Coking Runs
Sample Pressure
(psig)
Nominal
Product
Temperature
(°C)
Coking
Time (hrs)
100% CTD
100
475
20
100% DO
100
475
20
100% CTD
50
475
20
80% CTD/
20% DO
Blend
50
475
20
The summary of the green coke yields and their average MCC
values is presented in Table XI.
Table XI
Summary of Green Coke Yields and Average MCC Values
Sample Average Coke Yield,
wt%
Average Green Coke
MCC, wt%
(3823) 100% CTD
100 psig
74.0 95.8
(3806) 100% DO
100 psig
49.2 99.3
(5152) 100% CTD
50 psig
75.3 97.3
80/20 CTD/DO Blend
50 psig
71.7 95.4*
* Average of middle and bottom sections in Table XII
Individual MCC values for different sections of each coke product
were also determined by taking samples at the top, middle, and bottom of
the coke bed in the stainless steel can. The results are shown in Table XII.
The variations from top to bottom are very small, except for the last batch
coking run with the CTD/DO blend, indicating that the temperature
appeared to be uniform throughout the coke bed. Because of the
404

27
uniformity of the MCC values for the first three coke runs, the entire raw
coke was combined and then calcined without any segregation.
Subsequent optical microscopy examinations showed that the actual
temperature was not uniformly high in some of these runs. For the fourth
coke run with the 80/20 CTD/DO blend, the top portion had a significantly
lower MCC value than the remaining material. Therefore, it was separated
and calcined separately.
Table XII
MCC Values from Various Positions in the Coke Bed
Position 100%CTD
100 psig
100% DO
100 psig
100%CTD
50 psig
80/20 CTD/DO
50 psig
Top 95.4 98.6 96.7 86.1
Middle 96.9 99.8 98.0 95.1
Bottom 95.1 99.5 97.1 95.7
Note that the coke yield for the CTD at the pressure of 50 psig is
equivalent to that obtained at the higher pressure of 100 psig. The use of a
lower 50 psig pressure would be advantageous for a commercial coking
operation.
3.3.1.1. Clausius-Clapeyron Estimate for Coal Tar Distillate
Vapor Pressure; Effect of Pressure on Coke Yield
The surprisingly high batch coke yields found at both
50 and 100 psig for the coal tar distillate motivated a modeling
effort to estimate the effective vapor pressure of distillate at the
coking temperature of 475°C.
The nominal boiling range given in the literature for
this type of distillate (heavy creosote oil) is >355°C. The literature
data for boiling points of pure aromatic hydrocarbons were
reviewed to select a suitable compound to represent this distillate.
Pyrene was selected because it has a boiling point of 404°C and
relevant thermodynamic data could be found in the literature to
estimate the heat of vaporization from the liquid state to the
gaseous state. Literature values for the heat of sublimation (22.5
kcal/mole) and the heat of fusion (4.2 kcal/mole) were combined to
obtain an estimated value of 18.3 kcal/mole for the desired heat of
vaporization. This value and the boiling point were entered into the
classical Clausius-Clapeyron equation to calculate the constant
term for pyrene.
The equation with the calculated constant was then used
to estimate the vapor pressure at various temperatures of interest
for pyrene as a model for our distillate. The result for the nominal
405

28
batch coking temperature of 475°C was 39 psig. Hence, we
estimate that the distillate would develop this pressure at 475°C
before any chemical pyrolysis and polymerization reactions
occurred. Since the applied pressures in the two batch coking runs
were 50 and 100 psig, the majority of the distillate should stay in
the liquid state and have the opportunity to polymerize and convert
to coke. This prediction is consistent with the high coke yields
found at both pressures for the 475°C batch cokes.
The equation was also used to estimate the vapor
pressure at the nominal temperature of 495°C used in the
continuous pilot coking experiments to be discussed later. The
result was 59 psig. This estimate indicates that the coke yield at
495°C could be significantly lower at 50 psig than it would be at
100 psig because a significant portion of the distillate could
volatilize without reacting at the lower pressure.
3.3.2. Pilot-Scale Continuous Coking Runs at PSU
The apparatus and general operating conditions for the continuous
pilot coking facility at PSU were described in Section 2.7. The same
feedstock samples used in the batch coking runs were used in the
continuous coking runs. The feed rate for each coking run was maintained
at 16.8 g/min. After each coking run was completed, a hold period of 24
hours was maintained for the coke drum at 500°C to assure completion of
the coking reactions.
A brief summary of the feedstocks and operating conditions for the
four continuous coking runs performed during this program is presented in
Table XIII.
Table XIII
Summary of the Operating Conditions of Continuous Coking Runs
Run
#
Feedstock Pressure
(psig)
Nominal
Product
Temperature
(°C)
Feedstock
Introduction
Time
(hrs)
62
100%
DO
50
495
6
63
100%
CTD
50
495
6
64
80/20
CTD/DO
Blend
50
495
6
65
100%
CTD
100
495
6
406

29
After each coke trial (and holding 24 hours at 500°C), the entire
raw coke log was carefully removed from the coke drum to preserve its
integrity. The length and weight of the log were measured. The log was
then shipped to Parma for further microscopy examination and subsequent
calcinations and CTE measurement. The liquid by-products from each
coking run were collected for analysis.
The coke and liquid yields are presented in Table XIV.
Table XIV
Summary of the Coke and Liquid Yields for the Continuous Coking Runs
Run
#
Feedstock Raw Coke
Yield
(Wt. %))
Liquid
Yield
(Wt. %)
Raw Coke
Length
(Inches)
62
100%
DO
28.73 56.30 14
63
100%
CTD
38.23 52.71 21
64
80/20
CTD/DO
Blend
37.76 52.50 19.5
65
100%
CTD
49.67 40.99 27
As in the case of the batch coking, the raw coke yield from decant
oil is less than that of coal tar distillate at the same pressure, 50 psig.
However, the coke yield for the continuous coking run is much less than
from the batch coking of the same feedstock (cf..Table XI).. This is
probably due to the higher coking temperature for the continuous runs
(495°C vs. 475°C). Apparently, a long residence time at lower coking
temperature is necessary to thermally react the less reactive, lower
molecular weight components before they can volatilize. This is
particularly true for the CTD feedstock.
3.4. Optical Microscopy Results on Raw Coke Samples
3.4.1. Raw Cokes from Batch Pressure Coking Runs at Parma
Optical microscopy examinations were undertaken on only a single
large particle from each of the top, middle and bottom samples taken from
the products from the first two batch pressure cokes produced at Parma.
The primary goal was to confirm whether the coking conditions
throughout the entire coke sample had been severe enough to fully convert
the feedstocks to raw coke. The secondary goal was to assess the coke
structural characteristics to verify that coking conditions were adequate for
407

30
producing needle coke from both feedstocks, which differ significantly in
thermal reactivity. The number of particles examined from each sampling
location was increased for some of the subsequent runs to provide better
statistics and more information on whether coking was complete.
All three of the samples from Coke Run 1 at 100 psig with the
Seadrift decant oil had essentially similar characteristics. No pockets of
uncoked isotropic pitch-like material were detected in any of the particles,
so the coking conditions in this run were adequate to ensure full coking of
this feedstock. This is consistent with the high MCC values measured for
all three samples. The overall structure was consistent with a needle coke
material. There were many flow oriented areas, many large domain areas
and some small domain regions. Figure 8 shows a typical area with flow
orientation areas in polarized light.
Figure 8: Polarized Light Micrograph of a Predominantly Flow Oriented Region in
the Bottom Sample from Coke Run 1 with Seadrift Decant Oil
408
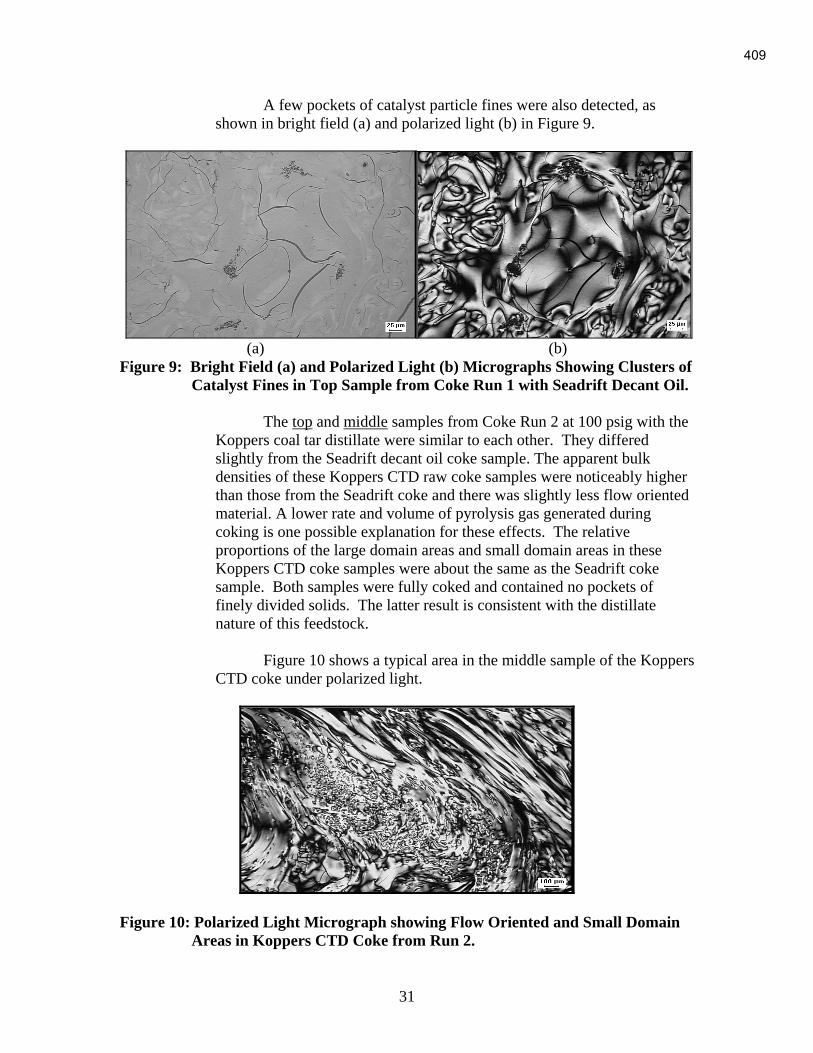
31
A few pockets of catalyst particle fines were also detected, as
shown in bright field (a) and polarized light (b) in Figure 9.
(a) (b)
Figure 9: Bright Field (a) and Polarized Light (b) Micrographs Showing Clusters of
Catalyst Fines in Top Sample from Coke Run 1 with Seadrift Decant Oil.
The top and middle samples from Coke Run 2 at 100 psig with the
Koppers coal tar distillate were similar to each other. They differed
slightly from the Seadrift decant oil coke sample. The apparent bulk
densities of these Koppers CTD raw coke samples were noticeably higher
than those from the Seadrift coke and there was slightly less flow oriented
material. A lower rate and volume of pyrolysis gas generated during
coking is one possible explanation for these effects. The relative
proportions of the large domain areas and small domain areas in these
Koppers CTD coke samples were about the same as the Seadrift coke
sample. Both samples were fully coked and contained no pockets of
finely divided solids. The latter result is consistent with the distillate
nature of this feedstock.
Figure 10 shows a typical area in the middle sample of the Koppers
CTD coke under polarized light.
Figure 10: Polarized Light Micrograph showing Flow Oriented and Small Domain
Areas in Koppers CTD Coke from Run 2.
409

32
Unexpectedly, the bottom sample from Coke Run 2 had several
reasonably large pockets of isotropic pitch-like material, in addition to the
normal fully coked areas.
Figure 11 shows area containing both types of material in bright
field and polarized light.
(a) (b)
Figure 11: Bright Field (a) and Polarized Light (b) Micrographs Showing a Large
Pocket of Isotropic Pitch Containing a Few Mesophase Spheres in the
Bottom Sample from Coke Run 2 with Koppers CTD.
The presence of these isotropic pitch pockets indicates that the
coking conditions in at least a portion of the bottom section of the coking
can were not sufficient to fully coke this feedstock, probably due to a
slightly lower temperature in this local area. The very refractory nature of
this coal tar distillate, compared to that for the decant oil, probably
exacerbates the problem somewhat. In any case, the presence of a
significant amount of uncoked pitch like material is undesirable because it
can cause some volatile evolution problems and sintering of the raw coke
particles during lab calcining.
Optical microscopy examinations were also performed on several
particles from the top, middle and bottom sections of the product from
Coke Run 3 at 50 psig with the Koppers CTD. Three particles taken from
the top portion of the coke sample contained a mixture of raw coke and
areas of isotropic phase that contained mesophase spheres. It appeared that
at least two of these particles were taken from the original upper surface
so they represent the true upper boundary of the coke sample. Either this
top surface layer was significantly cooler than the bulk material or there
was appreciable reflux of distillate at the top of the coking vessel. Figure
12a presents a polarized light photomicrograph of the top surface of the
coke showing the isotropic pitch containing mesophase spheres. Figure
12b shows another area of the top coke particle that contains only well-
oriented coke.
410
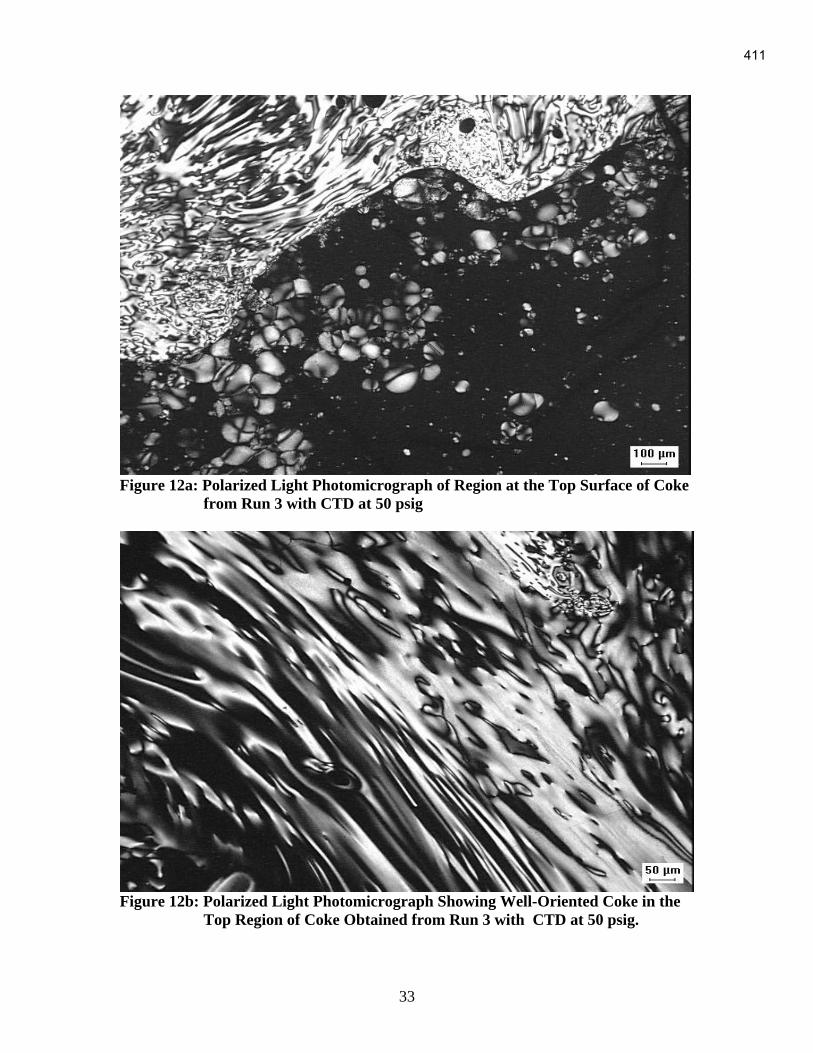
33
Figure 12a: Polarized Light Photomicrograph of Region at the Top Surface of Coke
from Run 3 with CTD at 50 psig
Figure 12b: Polarized Light Photomicrograph Showing Well-Oriented Coke in the
Top Region of Coke Obtained from Run 3 with CTD at 50 psig.
411

34
Both the middle and top sample of the coke from this run
contained only raw coke with no isotropic pitch pockets. The particles
taken from the middle section had significant amounts of both large
domain and flow or needle structures. There were also some smaller
domain areas as well, but these may be end-on or transverse sections of
flow-oriented material.
A photomicrograph of the large domain region in the middle
section of the coke is shown in Figure 13.
Figure 13: Polarized Light Photomicrograph Showing Large Domain Region in the
Middle Sample from Coke Run 3 with CTD at 50 psig.
The bottom portion had considerably more flow structure and less
large domain material than the middle sample.
412

35
A photomicrograph of a flow-oriented region in the bottom sample
is presented in Figure 14.
Figure 14: Polarized Light Photomicrograph Showing Flow Orientation
In a Particle from Bottom Portion of Coke Run 3 with CTD at 50 psig
Several large particles from the top, middle and bottom sections of
the product from Coke Run 4 with an 80% CTD/20% Decant Oil blend at
50 psig were also examined.
Two of the particles from the top sample had conventional raw
coke structures, but the third particle was essentially an isotropic pitch
with a dilute concentration of mesophase spheres. This result is consistent
with the relatively low MCC value for this top section of the coke log and
justifies the decision to exclude this portion of the overall coke sample
from the lab calcining because it could would have compromised the
entire sample if it had been allowed to sinter and flow during calcining.
Most of the particles in the middle and bottom portions of this coke
log exhibited typical needle coke structures with the expected mixture of
needle (flow aligned), large domain and small domain areas. A few areas
of uncoked material were also found in some of the particles, but the
amount of uncoked material was much lower than that found in the top
section. A photomicrograph illustrating the excellent flow oriented
structure in one area in a particle from the middle portion of blend coke
from Run 4 is shown below in Figure 15.
413

36
Figure 15: Polarized Light Micrograph Showing a Flow Aligned Structure in a
Particle from the Middle Section of the 80% CTD/20% DO Raw Batch
Coke from Coke Run 4
In general, the optical microscopy results indicated that at least
some portions of the top and bottom samples from some of the batch
pressure cokes were not fully coked. The most likely explanation is that
the top and bottom portions of the sample container were at least slightly
cooler than the bulk middle section. Refluxing of the volatiles from a
cooler lid back down to the actual sample surface could be a factor for the
top section, but the cause for the apparently cooler area at the bottom is
not obvious. Undoubtedly, the relatively unreactive refractory nature of
the CTD contributes to the incomplete coking problem.
3.4.2. Raw Cokes from Continuous Pilot Coking at PSU
Optical microscopy examinations were made on single large
particles taken from each of the top and bottom sections of the raw coke
logs produced in the PSU continuous pilot coker. Since only two
particles from each log were examined, the statistics are very limited.
The initial objective of these microscopy observations was to
verify that the logs were fully coked. In fact, all but one of the samples
was fully coked with no obvious isotropic pitch phase areas. The
exception was the top sample from the log from Run #65 at 100 psig with
the CTD alone. Fairly large isotropic regions with some coalesced
mesophase areas were detected. The only explanation that can be offered
for the incomplete coking in this case is that the higher pressure, compared
to the 50 psig level in the other runs, suppressed vaporization of more of
414

37
the CTD feedstock during the coking cycle. This is consistent with the
higher apparent coke yield at 100 psig.
A very surprising result was that all particles from both sampling
locations in all four coke logs appeared to be contaminated with an
apparently platelet-shaped material, which severely degraded the
mesophase formation behavior for a considerable distance adjacent to
these platelet particles. A second problem is that a lot fine solids were
generated or introduced in some unknown fashion during coking and
produced localized small domain (high CTE) areas in these samples, all of
which were taken from coke near the vessel walls or the upper free
surface.
Figure 16 illustrates a platelet-shaped contamination particle in
bright field and polarized light in the Top sample from PSU Coke Run #62
at 50 psig with Seadrift decant oil.
(a)
(b)
Figure 16: Bright Field (a) and Polarized Light (b) Micrographs of a Platelet-
Shaped Particle in the Top Sample from PSU Coke Run #62 with Decant
Oil Feedstock
415

38
Figure 17 shows higher magnification views of the apparently
platelet-shaped particle in the same sample. These higher magnification
views show that the platelet-shaped particles actually appear to consist of
much smaller particles loosely held together in some manner.
(a)
(b)
Figure 17: Bright Field (a) and Polarized Light (b) Higher Magnification
Micrographs Showing Detailed Structure of Platelet-Shaped Particles in
the Top Sample from PSU Coke Run #62
416
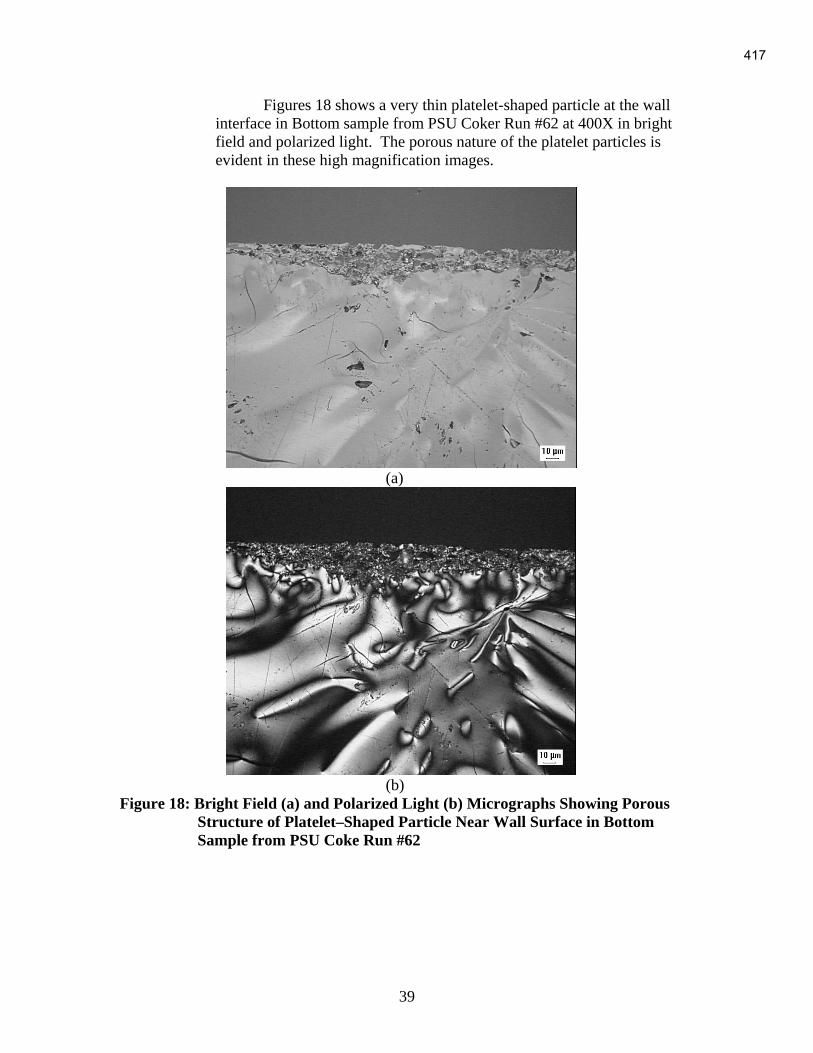
39
Figures 18 shows a very thin platelet-shaped particle at the wall
interface in Bottom sample from PSU Coker Run #62 at 400X in bright
field and polarized light. The porous nature of the platelet particles is
evident in these high magnification images.
(a)
(b)
Figure 18: Bright Field (a) and Polarized Light (b) Micrographs Showing Porous
Structure of Platelet–Shaped Particle Near Wall Surface in Bottom
Sample from PSU Coke Run #62
417

40
Figures 19 and 20 illustrate both a platelet-shaped particle and a
nearby very small domain region in the Bottom sample from PSU Coker
Run #65 at 100 psig with the Coal Tar Distillate.
(a)
(b)
Figure 19: Bright Field (a) and Polarized Light (b) Micrographs Showing a Platelet-
Shaped Particle in the Bottom Sample from PSU Coker Run #65 with
Coal Tar Distillate.
418

41
(a)
(b)
Figure 20: Bright Field (a) and Polarized Light (b) Micrographs Showing a Very
Small Domain Area in the Bottom Sample from PSU Coker Run #65
with Coal Tar Distillate
One of the very large platelet-shaped particles found in the Bottom
sample from Coker Run #64 at 50 psig with the 80/20 CTD/Decant Oil
feedstock blend was examined briefly by SEM/EDS to assess its
qualitative chemical composition to see if this would provide an
explanation for the origin of these particles. The results summarized in
Figures 21 and 22 show that the individual small particles in the larger
platelet-shaped material are rich in Si and O. Some high Al and O areas
are also present, but this may be an artifact from the alumina polishing
compound used in preparing the specimens.
419
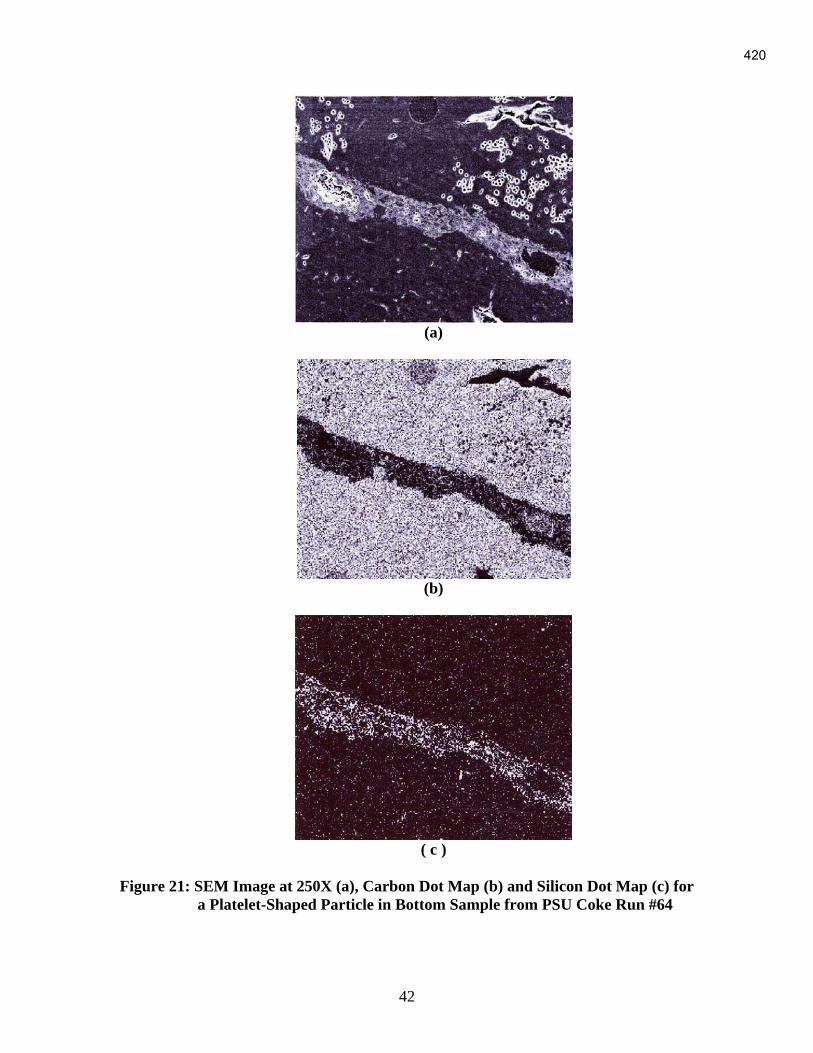
42
(a)
(b)
( c )
Figure 21: SEM Image at 250X (a), Carbon Dot Map (b) and Silicon Dot Map (c) for
a Platelet-Shaped Particle in Bottom Sample from PSU Coke Run #64
420
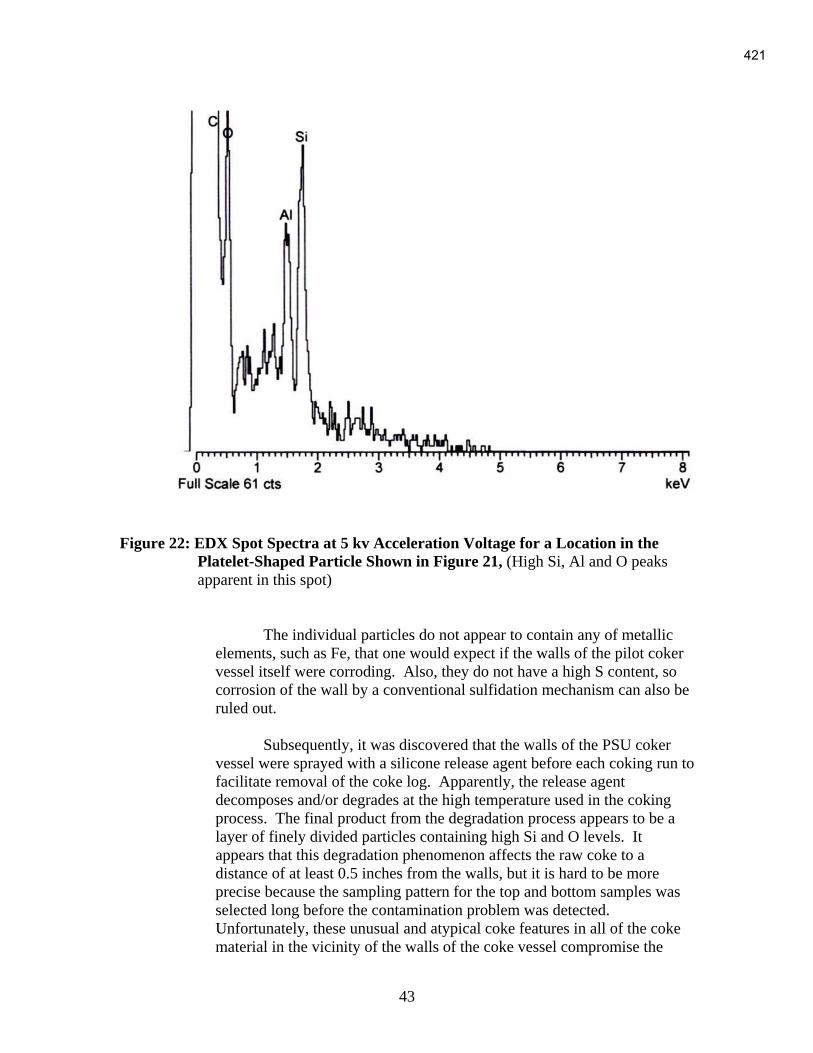
43
Figure 22: EDX Spot Spectra at 5 kv Acceleration Voltage for a Location in the
Platelet-Shaped Particle Shown in Figure 21, (High Si, Al and O peaks
apparent in this spot)
The individual particles do not appear to contain any of metallic
elements, such as Fe, that one would expect if the walls of the pilot coker
vessel itself were corroding. Also, they do not have a high S content, so
corrosion of the wall by a conventional sulfidation mechanism can also be
ruled out.
Subsequently, it was discovered that the walls of the PSU coker
vessel were sprayed with a silicone release agent before each coking run to
facilitate removal of the coke log. Apparently, the release agent
decomposes and/or degrades at the high temperature used in the coking
process. The final product from the degradation process appears to be a
layer of finely divided particles containing high Si and O levels. It
appears that this degradation phenomenon affects the raw coke to a
distance of at least 0.5 inches from the walls, but it is hard to be more
precise because the sampling pattern for the top and bottom samples was
selected long before the contamination problem was detected.
Unfortunately, these unusual and atypical coke features in all of the coke
material in the vicinity of the walls of the coke vessel compromise the
421

44
validity of the overall coke evaluations because they produce very high
CTE coke, which is NOT typical for these feedstocks.
Microscopy evaluations of randomly selected large particles (-3/+6
mesh) representing the entire (surface and central regions) of the lab-
calcined samples derived from these PSU raw cokes will be reported in a
later section of this report.
3.5. Liquid Analyses of the Continuous Pilot Coking Runs*
In a petroleum refinery, the liquid and gaseous by-products from delayed
coking can be combined with other refinery products to provide high value
materials. For example, in the production of anode coke, the liquid products have
a higher value than the original feedstock(5)
. In pressure coking of the CTD, about
25% of the original feedstock is evolved as liquid by-product. This is much lower
than obtained for the petroleum decant oil. However, the economics of using the
CTD as a needle coke precursor still depends on the commercial value of the
liquid by-products. For this reason, we have carried out detailed analysis of the
by-products collected during the continuous pilot coking trials performed at PSU.
3.5.1. Distillation Profiles
The distillation profiles were obtained for the liquid products
collected from the continuous coking runs on the CTD and the decant oil
using both the simulated GC method and by independent actual vacuum
distillation. The boiling point cuts of the oils obtained after the coking of
the decant oil alone are comparable for the two methods, as can be seen by
comparing the data in Table XV and Table XVI (simulated and actual
distillation); however, the boiling cuts of the oils obtained after the coking
of the coal tar distillate (CTD) show a large difference between the
simulated and actual distillation. The reason is that the CTD is richer in
aromatic compounds when compared to the decant oil and the simulated
distillation standard calibration is based on n-alkanes, which have lower
boiling points than their aromatic counterparts. Therefore, the use of
simulated distillation based on alkane standards for the boiling ranges is
not reliable for the highly aromatic CTD.
*Subsequent to the completion of this report, a more detailed description and analysis of the
liquid byproducts from the continuous coking was prepared by Maria Escallon of Penn State
University. This version is included as an appendix to this report.
422

45
Table XV
Simulated Distillation of Liquid By-products
Boiling Range, oC Decant Oil - DO Coal Tar Distillate - CTD
% %
ibp-180 5.46 0.86
180-270 11.11 7.26
270-332 12.80 24.27
332-fpb 69.66 66.64 ibp=initial boiling point; fbp=final boiling point
Table XVI
Actual Vacuum Distillation of Liquid By-products
Boiling Range, oC DO CTD CTD/DO 4:1
% % %
ibp-180 Gasoline 5.8 2.0 1.0
180-270 Jet Fuel 10.7 -- 6.0
270-332 Diesel 14.6 -- ---
332-fpb Fuel Oil 68.9 98.0 93.0
For the actual vacuum distillations, the liquid products are
classified as gasoline, jet fuel, diesel and fuel oil based on the boiling
ranges. Actual vacuum distillation data are also presented in Table XVI
for the liquids collected from coking of the CTD/DO blend.
The individual liquid products in Table XVI were analyzed using
GC/MS and both 1H and
13C NMR. The results are presented in the Tables
which follow.
3.5.1.1. Gasoline
The hydrocarbon types classified by GC/MS are shown
in Table XVII for the three different gasoline products. For the
CTD/DO blend the composition is expected to fall between that of
the individual feedstocks.
There are some hydrocarbon-type compounds whose
values or percentages are not in between the values shown for DO
and CTD, such as benzene/alkylbenzenes, indenes, and polar
compounds, suggesting a possible synergism by chemical
interaction when the feedstocks are blended. The synergism is also
evident in the NMR data presented in Tables XVIII and XIX.
423

46
The compound types where such synergism is possible
are highlighted in the Tables.
Table XVII
Hydrocarbon-type compounds obtained by GC/MS – Gasoline
Decant Oil, % Coal-Tar Distillate, % CTD/DO 4:1,%
Paraffins 57.70 30.47 43.42
Cycloalkanes 21.32 0.15 4.66
Benzene / alkylbenzenes 14.05 6.85 14.68
Indenes 1.67 0.79 3.05
Naphthalenes 5.25 40.00 21.67
Acenaphthylenes /
acenaphthenes -- 11.65 0.35
Hydroaromatics -- 1.79 0.03
*Polar compounds -- 2.59 7.23
*Phenols -- 5.72 4.90
Table XVIII
Compounds obtained by 1H NMR – Gasoline
Band TMS
(ppm)
DO, %
Coal-Tar Distillate,%
80CTD/20DO,
%
0.5-1.0 5.62 5.62 15.47
1.0-1.7 12.80 12.53 38.60
1.7-1.9 1.18 1.03 1.47
1.9-2.1 1.13 0.95 3.40
2.1-2.4 8.58 11.11 8.19
2.4-3.5 30.89 28.40 5.55
3.5-4.5 1.73 2.02 0.02
4.5-6.0 0.00 0.00 1.28
6.0-7.2 3.64 4.13 11.63
7.2-8.3 28.84 28.23 14.29
8.3-8.9 5.19 5.44 0.09
8.9-9.3 0.40 0.53 0.00
424

47
Table XIX 13
C NMR – Gasoline
Band TMS
(ppm)
DO,
%
Coal-Tar Distillate CTD,
%
CTD/DO 80:20,
%
11.0-12.5 0.62 0.61 0.43
12.5-15.0 4.74 4.81 5.08
15.0-18.0 1.66 1.66 1.81
18.0-20.5 5.17 5.26 2.93
20.5-22.5 4.00 4.07 2.70
22.5-24.0 4.88 4.95 5.32
24.0-27.5 4.63 4.69 2.97
27.5-37.0 27.88 28.23 25.34
37.0-60.0 11.78 11.40 5.51
108.0-118.0 0.09 0.15 3.41
118.0-129.5 20.68 21.25 29.92
129.5-133.0 4.05 4.00 4.32
133.0-135.0 3.25 3.18 4.33
135.0-138.0 2.20 2.11 1.32
138.0-160.0 4.37 3.64 4.61
The interpretation of the GC/MS and NMR data is as
follows:
By 1H and
13C NMR it is observed that olefins are
increased in the gasoline fraction when DO is blended with CTD
(1.9-2.1 and 4.5-6 ppm 1H NMR and 108-118 ppm
13C NMR).
Olefins increase the octane number and might be upgrading the
gasoline fraction; however, olefins content needs to meet
specification and these are reported in %v/v. Additional tests
(ASTM) would have to be carried out to know the olefins
composition in v/v %.
Aromatic content and single ring aromatics are higher
for the blend, according to GC/MS, 1H NMR (6.0-7.2 ppm) and
13C NMR (118.0-129.5). The aromatics increase the octane
number; however, the percentage has to be within the
specifications range. Also, there are special restrictions for benzene
(it has to be below 3% v/v).
3.5.1.2. Jet Fuel
The jet fuel in the blend should have no contribution
from the CTD according to the distillation results presented
425

48
previously in Table XVI. However as observed in Table XX, the
blend liquid product does show a contribution from the CTD in the
presence of naphthalenes, fluoranthene, fluorenes and polar
compounds. Hydrotreatment of the jet fuel fraction would lead to
hydroaromatics and/or cycloalkane components that should
improve the thermal stability of this jet fuel fraction.
Hydrotreatment would also reduce polar components which would
be beneficial for the use as jet fuel.
The GC/MS data in Table XX show that the
percentages of the functional groups for the DO and CTD/DO are
very much alike, which was expected because CTD is not
contributing to this fraction. The NMR data in Tables XXI and
XXII support this conclusion.
Table XX
Hydrocarbon-type compounds obtained by GC/MS - Jet Fuel
Decant oil ,
%
CTD/DO 4:1,
%
Paraffins 38.66 34.79
Cycloalkanes 10.00 1.75
Alkyl benzenes 7.07 5.21
Indenes 10.36 1.56
Naphthalenes 20.64 26.15
Bi-phenyls 5.91 2.93
Anthracenes /
Phenanthrenes 2.14 1.96
Hydroaromatics 1.34 0.83
Pyrenes 0.03 0.00
Polar compounds 3.86 4.10
Fluoranthene --- 16.97
Fluorene --- 3.12
426

49
Table XXI
Hydrocarbon-type compounds obtained by 1H NMR – Jet Fuel
Band TMS (ppm) DO, % CTD/DO 4:1,%
0.5-1.0 5.99 5.87
1.0-1.7 12.35 12.53
1.7-1.9 1.06 1.11
1.9-2.1 1.15 1.16
2.1-2.4 11.19 9.75
2.4-3.5 28.11 29.56
3.5-4.5 1.79 1.75
4.5-6.0 0.00 0.00
6.0-7.2 4.27 4.47
7.2-8.3 28.25 28.17
8.3-8.9 5.44 5.23
8.9-9.3 0.41 0.40
Table XXII
Hydrocarbon-type compounds obtained by 13
C NMR – Jet Fuel
Band TMS (ppm) DO, % CTD/DO 4:1, %
11.0-12.5 0.43 0.43
12.5-15.0 4.52 4.50
15.0-18.0 1.43 1.47
18.0-20.5 5.00 4.93
20.5-22.5 3.92 3.90
22.5-24.0 5.00 4.99
24.0-27.5 4.50 4.50
27.5-37.0 29.66 28.65
37.0-60.0 11.53 12.68
108.0-118.0 0.16 0.20
118.0-129.5 21.47 21.39
129.5-133.0 3.99 3.98
133.0-135.0 3.23 3.21
135.0-138.0 1.99 1.98
138.0-160.0 3.17 3.19
3.5.1.3. Diesel
The data in XVI show that no diesel oil fraction is
obtained in the coking liquids from either the CTD or the CTD/DO
blend, The GC/MS analysis for the Diesel fraction from the coking
run on the straight decant oil is presented in Table XXIII. The
NMR data for this fraction are summarized in Tables XXIV and
XXV.
427
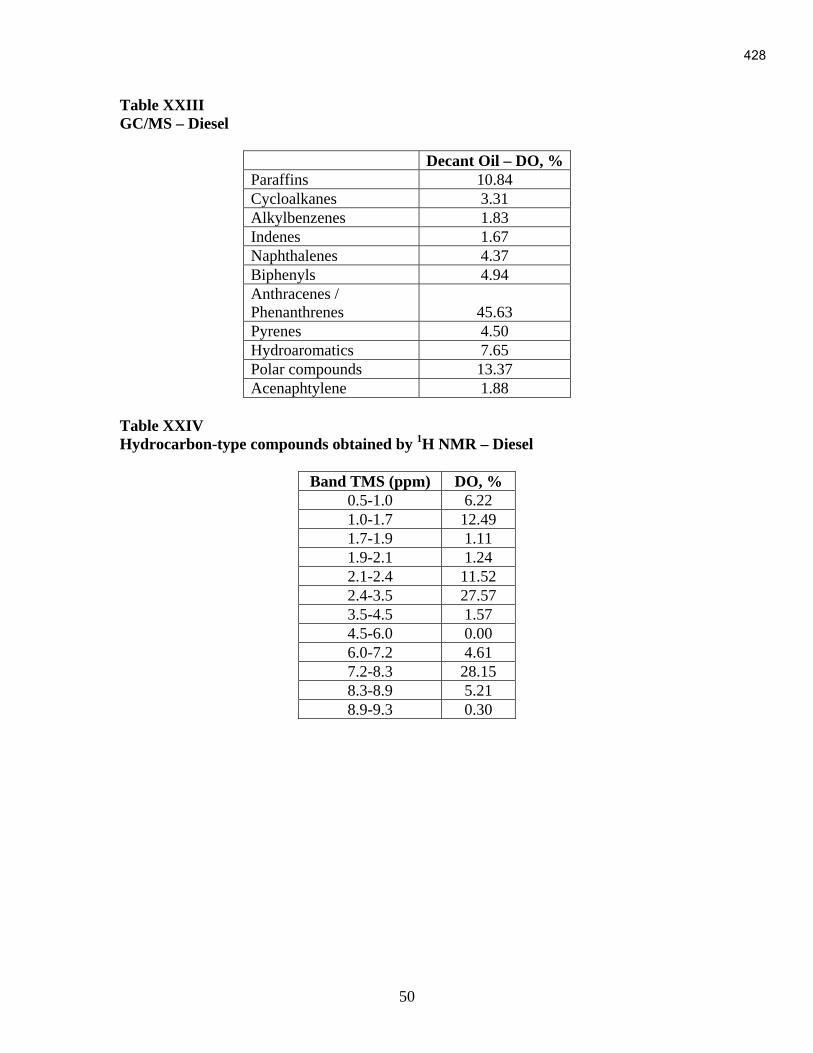
50
Table XXIII
GC/MS – Diesel
Decant Oil – DO, %
Paraffins 10.84
Cycloalkanes 3.31
Alkylbenzenes 1.83
Indenes 1.67
Naphthalenes 4.37
Biphenyls 4.94
Anthracenes /
Phenanthrenes 45.63
Pyrenes 4.50
Hydroaromatics 7.65
Polar compounds 13.37
Acenaphtylene 1.88
Table XXIV
Hydrocarbon-type compounds obtained by 1H NMR – Diesel
Band TMS (ppm) DO, %
0.5-1.0 6.22
1.0-1.7 12.49
1.7-1.9 1.11
1.9-2.1 1.24
2.1-2.4 11.52
2.4-3.5 27.57
3.5-4.5 1.57
4.5-6.0 0.00
6.0-7.2 4.61
7.2-8.3 28.15
8.3-8.9 5.21
8.9-9.3 0.30
428
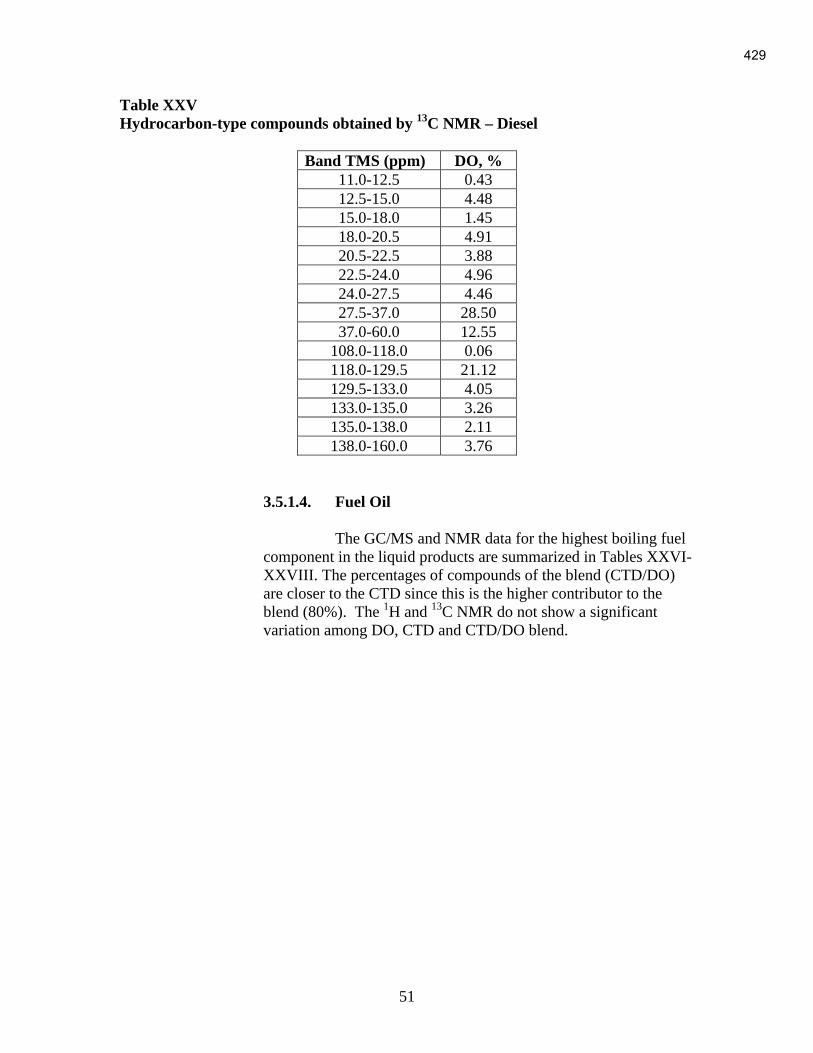
51
Table XXV
Hydrocarbon-type compounds obtained by 13
C NMR – Diesel
Band TMS (ppm) DO, %
11.0-12.5 0.43
12.5-15.0 4.48
15.0-18.0 1.45
18.0-20.5 4.91
20.5-22.5 3.88
22.5-24.0 4.96
24.0-27.5 4.46
27.5-37.0 28.50
37.0-60.0 12.55
108.0-118.0 0.06
118.0-129.5 21.12
129.5-133.0 4.05
133.0-135.0 3.26
135.0-138.0 2.11
138.0-160.0 3.76
3.5.1.4. Fuel Oil
The GC/MS and NMR data for the highest boiling fuel
component in the liquid products are summarized in Tables XXVI-
XXVIII. The percentages of compounds of the blend (CTD/DO)
are closer to the CTD since this is the higher contributor to the
blend (80%). The 1H and
13C NMR do not show a significant
variation among DO, CTD and CTD/DO blend.
429
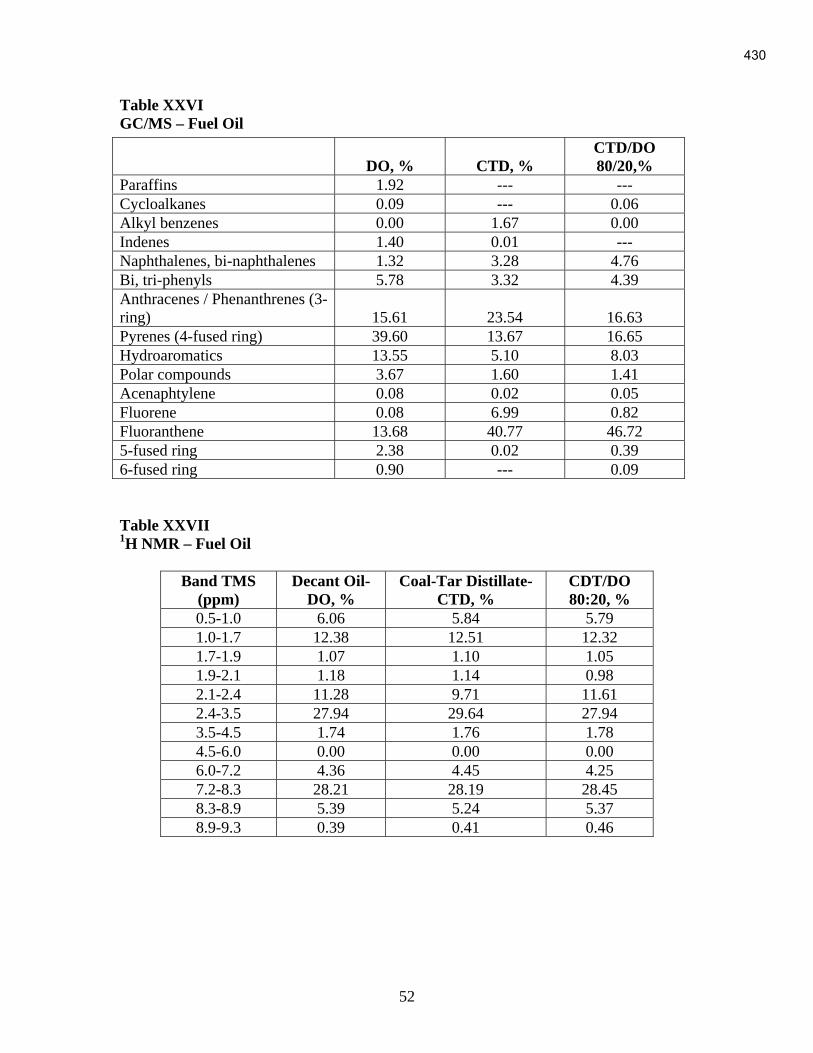
52
Table XXVI
GC/MS – Fuel Oil
Table XXVII 1H NMR – Fuel Oil
Band TMS
(ppm)
Decant Oil-
DO, %
Coal-Tar Distillate-
CTD, %
CDT/DO
80:20, %
0.5-1.0 6.06 5.84 5.79
1.0-1.7 12.38 12.51 12.32
1.7-1.9 1.07 1.10 1.05
1.9-2.1 1.18 1.14 0.98
2.1-2.4 11.28 9.71 11.61
2.4-3.5 27.94 29.64 27.94
3.5-4.5 1.74 1.76 1.78
4.5-6.0 0.00 0.00 0.00
6.0-7.2 4.36 4.45 4.25
7.2-8.3 28.21 28.19 28.45
8.3-8.9 5.39 5.24 5.37
8.9-9.3 0.39 0.41 0.46
DO, % CTD, %
CTD/DO
80/20,%
Paraffins 1.92 --- ---
Cycloalkanes 0.09 --- 0.06
Alkyl benzenes 0.00 1.67 0.00
Indenes 1.40 0.01 ---
Naphthalenes, bi-naphthalenes 1.32 3.28 4.76
Bi, tri-phenyls 5.78 3.32 4.39
Anthracenes / Phenanthrenes (3-
ring) 15.61 23.54 16.63
Pyrenes (4-fused ring) 39.60 13.67 16.65
Hydroaromatics 13.55 5.10 8.03
Polar compounds 3.67 1.60 1.41
Acenaphtylene 0.08 0.02 0.05
Fluorene 0.08 6.99 0.82
Fluoranthene 13.68 40.77 46.72
5-fused ring 2.38 0.02 0.39
6-fused ring 0.90 --- 0.09
430

53
Table XXVIII 13
C NMR – Fuel Oil
Band TMS (ppm) Decant Oil – DO,
%
Coal-Tar Distillate – CTD,
%
CTD/DO 80:20,
%
11.0-12.5 0.51 0.45 0.47
12.5-15.0 4.63 4.53 4.58
15.0-18.0 1.55 1.48 1.47
18.0-20.5 5.08 4.96 4.48
20.5-22.5 3.96 3.91 4.54
22.5-24.0 4.96 4.97 4.97
24.0-27.5 4.56 4.49 4.54
27.5-37.0 28.36 28.51 28.58
37.0-60.0 12.02 12.40 12.25
108.0-118.0 0.10 0.08 0.18
118.0-129.5 21.16 21.20 21.33
129.5-133.0 4.03 4.03 4.01
133.0-135.0 3.25 3.25 3.23
135.0-138.0 2.09 2.08 2.02
138.0-160.0 3.74 3.65 3.34
3.6. Raw Coke Calcinations
3.6.1. Calcination of Raw Cokes From Batch Coking
The calcining yields at 1420 °C for all of the raw coke from the
batch coking runs, including the separated portions of the 80/20 CTD/DO
blend, are summarized in Table XXIX.
Table XXIX
Summary of Raw Coke Calcining Yields from Batch Coking Runs
Calcining Yield, %
100% CTD 100 psig (3824) 90.3
100% DO 100 psig (3803) 94.1
100% CTD 50 psig (5551) 91.8
80/20 CTD/DO Blend (Top) (6288) 86.9
80/20 CTD/DO Blend (M&B) (6289) 91.7
As shown in Table XXIX for the 80/20 CTD/DO blend, the
calcining yield for the top portion is significantly lower than that of the
remaining material. Therefore, the mixed blend of the middle and bottom
portion was selected as representative of this coking run. The low
calcining yield of the top portion of the 80/20 CTD/DO blend is likely due
to a somewhat lower temperature at the top of the drum during coking.
431

54
Optical microscopy results discussed earlier indicated that there was a
substantial amount of uncoked pitch-like material in the top sample from
the 80/20 CTD/DO run.
3.6.2. Calcination of Raw Cokes From the Continuous Coking Runs
The raw coke logs obtained from the continuous coking runs at
PSU appeared to be reasonably uniform. It was therefore decided not to
segregate the logs into different sections, but to blend the entire log for
pilot plant calcinations. The calcinations were performed using the same
procedures employed for the batch cokes and the yields of the four runs
are presented in Table XXX.
Table XXX
Summary of Raw Coke Calcining Yields from Continuous Coking Runs
Calcining Yield, %
100% DO 50 psig (#62) 95.4
100% CTD 50 psig (#63) 94.8
80/20 CTD/DO Blend 50 psig (#64) 95.4
100% CTD 100 psig (#65) 94.8
The calcining yields for the continuous coking runs are, in general,
higher than those of the batch coking runs. This is likely due to higher
coking temperature used for all of the continuous coking runs. This is also
consistent with the microscopy results which found much less uncoked
(pitch) material in the samples from continuous coking runs.
3.7. CTE Results
3.7.1. CTE Results for Batch Cokes
A summary of the CTE results for the graphitized rods from all of
the batch coking runs is presented in Table XXXI along with the density
and specific resistance values. The data for the 80/20 CTD/DO blend are
for the mixture of middle and bottom portions of the coke drum.
The CTD was coked alone at two different pressures of 50 and 100
psig. As shown in Table XXXI, the CTE value for the 100% CTD coked
at the lower 50 psig pressure was very low at 0.038. The higher CTE
obtained at 100 psig for the CTD is the result of incomplete coking in the
batch-scale run as discussed in the microscopy results in Section 3.4.1 and
3.8.1. The CTE value for the CTD/DO blend which was also coked at 50
psig pressure, falls between the values for the 100% DO and 100% CTD
cokes. Based on the CTE values alone, the coal tar distillate could be used
to produce a “super-premium” needle coke.
432

55
Table XXXI
Summary of CTE Rod Properties for Batch Cokes
Property Unit 100% CTD
100 psig
(3824)
100% DO
100 psig
(3803)
100% CTD
50 psig
(5551)
80/20 CTD/DO
50 psig
(6289)
Bulk Density g/cc 1.44 1.42 1.42 1.41
CTE ppm/°C 0.286 0.169 0.038 0.074
Specific
Resistance
micro-
ohm-m
9.66 8.96 9.46 8.88
Evaluation data were also obtained for the separated top portion of
the 80/20 CTD/DO coke run. We obtained a very high CTE value of
0.393 for this coke demonstrating the adverse effect of incomplete coking
prior to calcining. Since this top coke sample is clearly anomalous and not
representative of true delayed coke, no further work was carried out on
this material.
3.7.2. CTE Measurement for Continuous Cokes
The calcined cokes from the continuous coking runs were
processed into graphite artifacts using the same procedures described
earlier for the batch cokes. The CTE values and the other properties for the
graphites are presented in Table XXXII.
Table XXXII
Summary of CTE Rod Properties for Continuous Cokes
Property Unit 100% DO
50 psig
(#62)
100% CTD
50 psig
(#63)
80/20 CTD/DO
50 psig
(#64)
100% CTD
100 psig
(#65)
Bulk Density g/cc 1.48 1.51 1.48 1.53
CTE ppm/°C 0.517 0.766 0.778 1.019
Specific
Resistance
micro-
ohm-m
10.74 9.58 11.05 11.22
All of the CTE values for these cokes were much higher than
expected, especially for feedstocks, which normally produce needle cokes
with low CTE’s. The causes for these anomalous results will become
apparent in the discussions of coke structure presented in the following
sections.
433
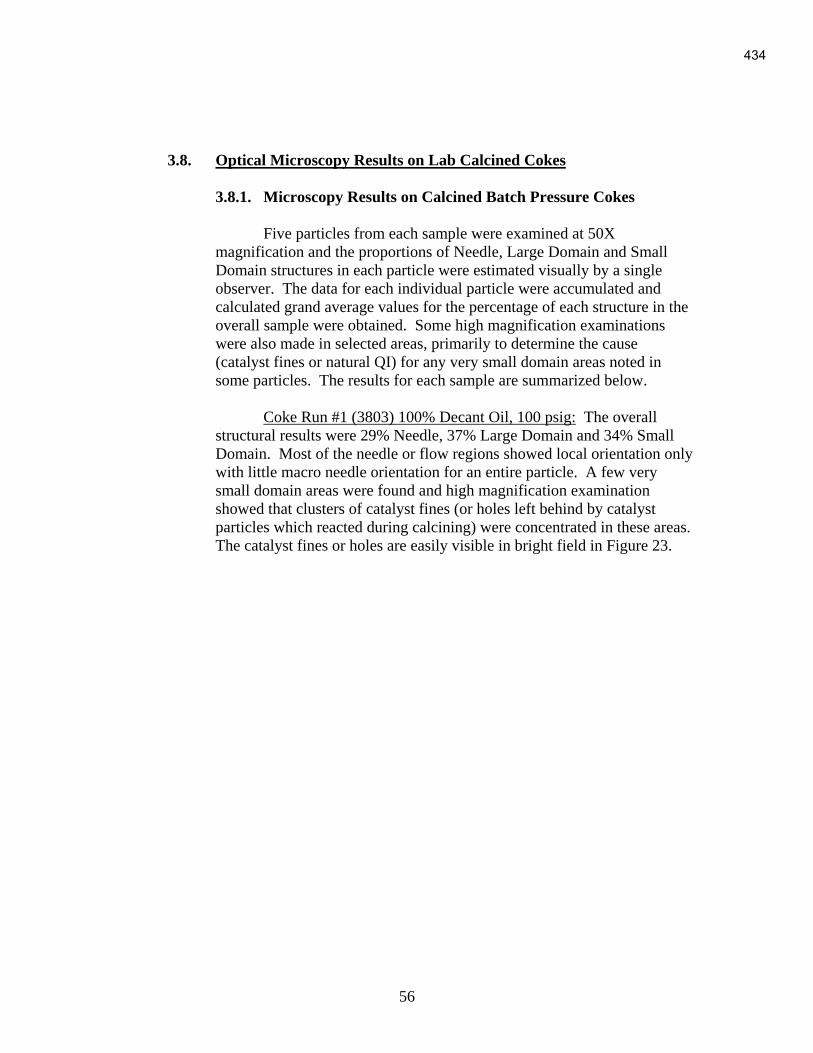
56
3.8. Optical Microscopy Results on Lab Calcined Cokes
3.8.1. Microscopy Results on Calcined Batch Pressure Cokes
Five particles from each sample were examined at 50X
magnification and the proportions of Needle, Large Domain and Small
Domain structures in each particle were estimated visually by a single
observer. The data for each individual particle were accumulated and
calculated grand average values for the percentage of each structure in the
overall sample were obtained. Some high magnification examinations
were also made in selected areas, primarily to determine the cause
(catalyst fines or natural QI) for any very small domain areas noted in
some particles. The results for each sample are summarized below.
Coke Run #1 (3803) 100% Decant Oil, 100 psig: The overall
structural results were 29% Needle, 37% Large Domain and 34% Small
Domain. Most of the needle or flow regions showed local orientation only
with little macro needle orientation for an entire particle. A few very
small domain areas were found and high magnification examination
showed that clusters of catalyst fines (or holes left behind by catalyst
particles which reacted during calcining) were concentrated in these areas.
The catalyst fines or holes are easily visible in bright field in Figure 23.
434
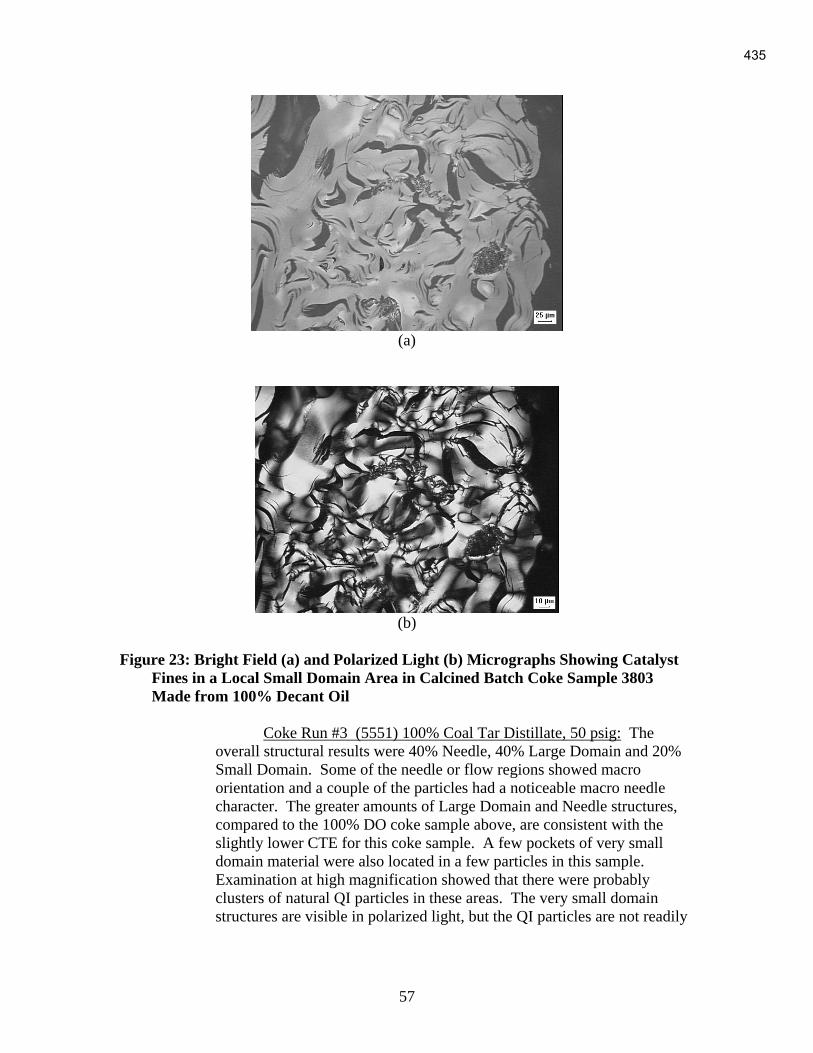
57
(a)
(b)
Figure 23: Bright Field (a) and Polarized Light (b) Micrographs Showing Catalyst
Fines in a Local Small Domain Area in Calcined Batch Coke Sample 3803
Made from 100% Decant Oil
Coke Run #3 (5551) 100% Coal Tar Distillate, 50 psig: The
overall structural results were 40% Needle, 40% Large Domain and 20%
Small Domain. Some of the needle or flow regions showed macro
orientation and a couple of the particles had a noticeable macro needle
character. The greater amounts of Large Domain and Needle structures,
compared to the 100% DO coke sample above, are consistent with the
slightly lower CTE for this coke sample. A few pockets of very small
domain material were also located in a few particles in this sample.
Examination at high magnification showed that there were probably
clusters of natural QI particles in these areas. The very small domain
structures are visible in polarized light, but the QI particles are not readily
435
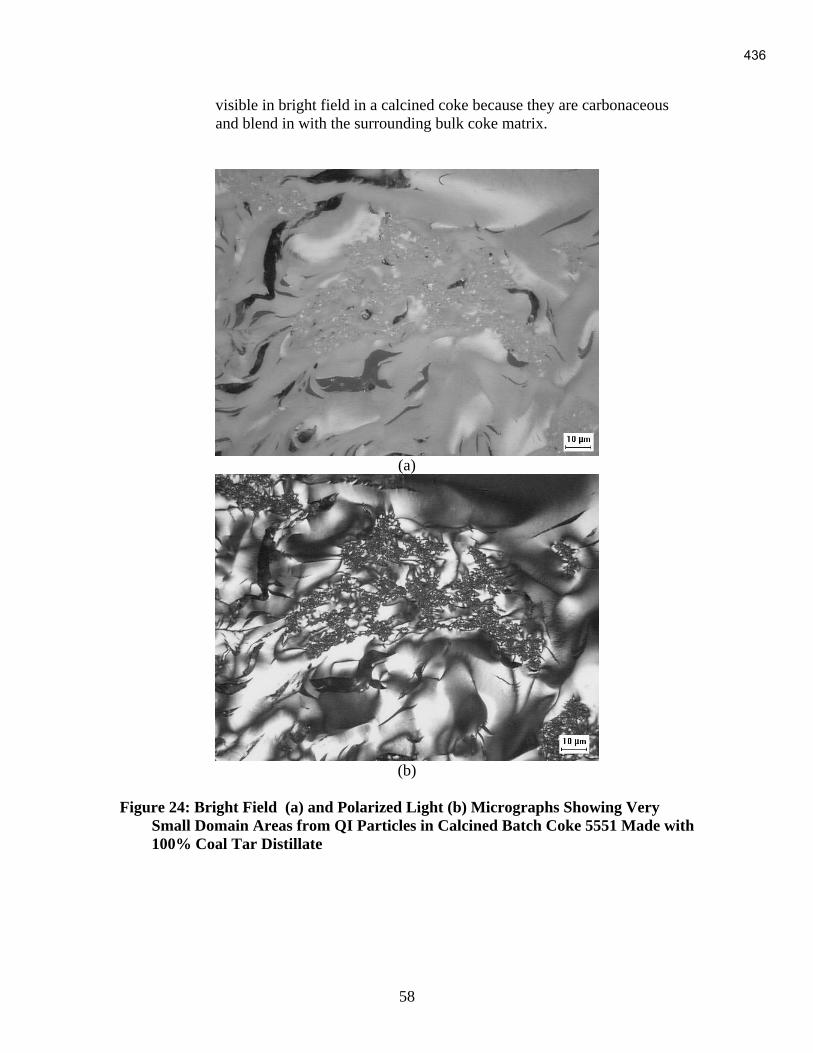
58
visible in bright field in a calcined coke because they are carbonaceous
and blend in with the surrounding bulk coke matrix.
(a)
(b)
Figure 24: Bright Field (a) and Polarized Light (b) Micrographs Showing Very
Small Domain Areas from QI Particles in Calcined Batch Coke 5551 Made with
100% Coal Tar Distillate
436

59
Coke Run #2 (3824) 100% Coal Tar Distillate, 100 psig: Several
areas in most of the particles in this sample contained a composite
structure where small individual particles of infusible raw coke had been
surrounded by incompletely coked mesophase-derived material which
flowed during the calcining process. One of the five particles contained at
least 50% of this composite material and the others contained up to 20%
of it. The texture of these composite areas is relatively small domain. The
presence of a substantial amount of this fine domain composite material
provides a very reasonable explanation for the surprisingly high CTE of
this sample.
Figure 25 shows the appearance of the composite structure in one
particle at low magnification, and Figure 26 shows the appearance of one
of the sintered areas in this particle at higher magnification. The small
individual fully coked particles cemented together by the uncoked material
which flowed during calcining is shown clearly in Figure 26.
437

60
(a)
(b)
Figure 25: Bright Field (a) and Polarized Light (b) Micrographs Showing Loose
Agglomerate Structure of One Large Particle from Calcined Batch Coke
Sample 3824 Made with Coal Tar Distillate at 100 psig
438

61
(a)
(b)
Figure 26: Bright Field (a) and Polarized Light (b) Micrographs Showing
“Sintered” Area in Calcined Batch Coke Sample 3824 Made with Coal Tar
Distillate at 100 psig
The bulk structure in the remaining particles in this sample looked
normal. The overall structure ratings on this "normal" fraction were 42%
Needle, 36% Large Domain, and 22% Small Domain, indicating that these
portions of the sample are similar to those described above for the other
100% CTD coke sample.
Coke Run #4 (6289) 80% CTD/20% DO, 50 psig: The overall
structure results were 33% Needle, 42% Large Domain and 25% Small
439

62
Domain. There was some macro needle or flow orientation in the particles,
but most of the needle areas had only local flow orientation. Based on
both the numerical structure data and its overall visual appearance, this
sample appeared to be intermediate between the "good" 100% CTD
sample and the 100% DO sample. This structure rating is consistent with
its intermediate CTE value.
3.8.2. Microscopy Results on Calcined Continuous Pilot Coker Cokes
Five randomly selected -3/+6mesh particles of the lab calcined
coke samples from the PSU raw coke logs were mounted and polished for
examination. This is the GTI standard method for evaluating any
commercial or lab calcined coke by microscopy. In contrast, the raw Penn
State pilot coker samples were evaluated by examining only one large
particle from the top and one from the bottom of the raw coke log. Hence,
the results on the raw cokes, which were discussed in a previous section,
are biased toward materials near the bottom wall and the top surface of
coke log.
The first significant result is that there was no evidence for a
substantial amount of "sintering" occurring during the lab calcining
process with these continuous process cokes. Some of the Parma batch
pressure cokes did soften and flow to some extent and give a sintering
effect when they were lab calcined. The Penn State continuous cokes did
not suffer from this problem.
The second significant result is that these "bulk" samples contained
only a few areas that were clearly derived from the platelet-shaped
contamination particles that were so prevalent in the corresponding raw
coke samples from the top and bottom areas. Figure 27 shows low and
high magnifications views of one these areas in the calcined PSU Coker
Run #65 sample where it appears that much of the original silica-
containing platelet shaped particle may have reacted with the surrounding
coke during calcining and left a void region. There is some residual
inorganic material visible on the boundary on one side of this area in the
high magnification bright field view and the small domain character of
that area is evident in the corresponding polarized light micrograph.
440

63
(a) (b)
(c) (d)
Figure 27: Low Magnification Bright Field (a) and Polarized Light (b) Micrographs
and High Magnification Bright Field (c) and Polarized Light (d) Micrographs
of an Area Showing Some Residual Contamination from a Platelet-Shaped
Particle in One Large Particle in Calcined Continuous PSU Coker Run #65
In three of these samples, we did find a calcined coke particle with
a partial flat edge, indicating that it was coked at a wall interface. All of
these flat edge areas had very small domain structures and, in some cases,
contained some clusters of finely divided solids. It seems clear that coke
produced near the walls in this pilot coker was degraded by physical
and/or chemical processes.
The third significant result is that all of these pilot-coke derived
samples had much less needle or flow oriented areas than the
corresponding calcined batch samples. They appeared to have a highly
deformed structure in many areas from copious bubble percolation. Figure
28 shows one such area in the calcined coke from PSU Coker Run #63
with the Coal Tar Distillate at 50 psig.
441

64
(a) (b)
Figure 28: Bright Field (a) and Polarized Light (b) Micrographs of a Highly
Deformed Area in a Particle from Calcined Continuous PSU Coker Run #63
with Coal Tar Distillate
Based on our previous experience in carrying out coke structure
studies under various coking conditions, it appears that the feedstocks
were probably coked too quickly and did not develop the large domain
character and flow characteristics that we normally see when these high
quality feedstocks are coked commercially. Specifically, the coking
temperature was probably too high and/or the feed rate was too fast.
These microscopy results on the calcined cokes from continuous
coking runs indicate that there are probably two contributing causes for
their relatively high CTE values: (a) a substantial degradation in the local
coke quality near the walls from the contamination reactions with the
residue from the silicone release agent and (b) a general degradation of
potential coke quality from non-optimum coking conditions.
3.9. Elemental Analyses of Green and Calcined Cokes
All of the green and calcined batch cokes were milled to –200 mesh size
flours. Elemental CHN analyses were obtained for these samples using the CHN
analyzer and the data are reported in Table XXXIII. Sulfur contents were
measured separately and are also reported in the Table.
442
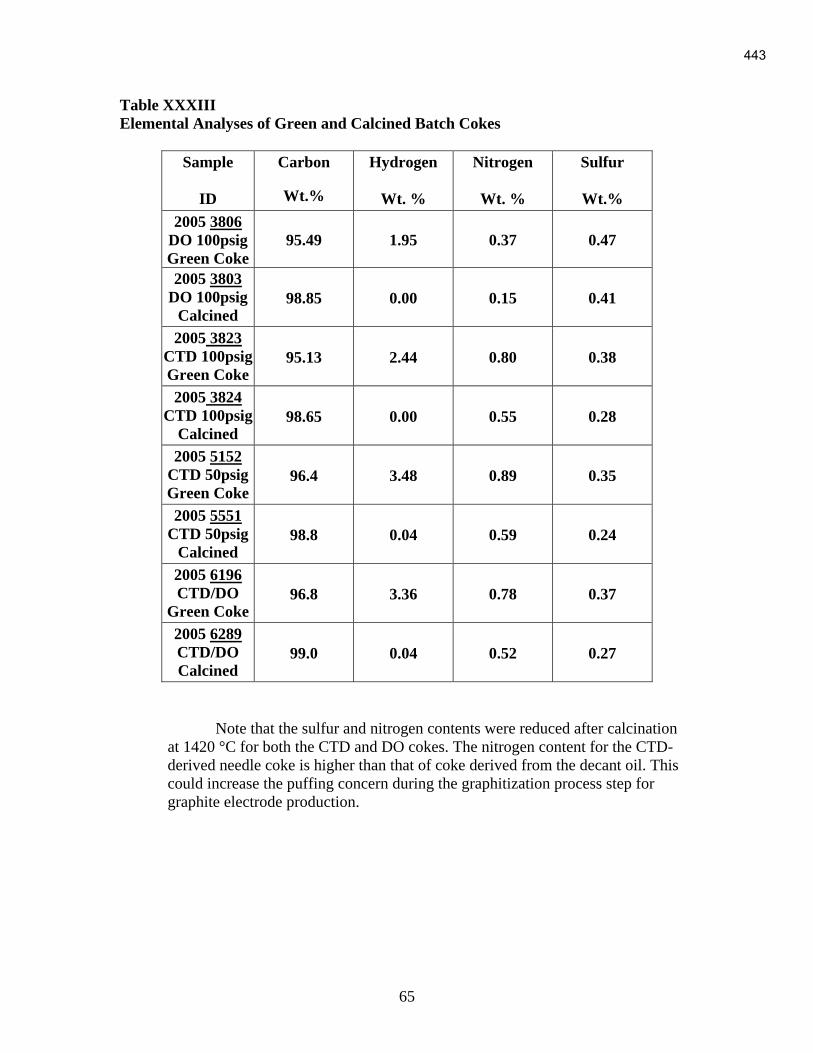
65
Table XXXIII
Elemental Analyses of Green and Calcined Batch Cokes
Sample
ID
Carbon
Wt.%
Hydrogen
Wt. %
Nitrogen
Wt. %
Sulfur
Wt.%
2005 3806
DO 100psig
Green Coke
95.49 1.95 0.37 0.47
2005 3803
DO 100psig
Calcined 98.85 0.00 0.15 0.41
2005 3823
CTD 100psig
Green Coke 95.13 2.44 0.80 0.38
2005 3824
CTD 100psig
Calcined 98.65 0.00 0.55 0.28
2005 5152
CTD 50psig
Green Coke 96.4 3.48 0.89 0.35
2005 5551
CTD 50psig
Calcined 98.8 0.04 0.59 0.24
2005 6196
CTD/DO
Green Coke 96.8 3.36 0.78 0.37
2005 6289
CTD/DO
Calcined 99.0 0.04 0.52 0.27
Note that the sulfur and nitrogen contents were reduced after calcination
at 1420 °C for both the CTD and DO cokes. The nitrogen content for the CTD-
derived needle coke is higher than that of coke derived from the decant oil. This
could increase the puffing concern during the graphitization process step for
graphite electrode production.
443

66
3.10. Puffing Results
3.10.1. Puffing Results of the Batch Coking Runs
Puffing is the irreversible expansion of carbon artifacts during the
graphitization process. There are several factors affecting the puffing
phenomena. One is the nitrogen and sulfur contents in the needle cokes.
As the heat treatment temperature is increased to the range of 1,450 °C
and 2200 °C, the nitrogen and sulfur-containing gases will evolve from the
coke particles in the carbon artifacts. If there are significant nitrogen and
sulfur contents in the calcined coke, the evolving gases can disrupt the
carbon and graphite structure. The other factors affecting the amount of
puffing are the crystallinity and pore structure of the coke.
The puffing results are presented in Table XXXIV as the relative
volume expansion in the 1100 to 2200 °C range. The data indicate that
coal tar distillate-derived needle coke, in general, exhibits more puffing
than the petroleum-based needle coke. One can attribute this to the higher
nitrogen content of the coal-based needle coke, as shown by the sulfur and
nitrogen elemental analysis results included in the Table XXXIV.
Table XXXIV
Summary of Puffing Results for Calcined Batch Cokes
Relative Volume
Expansion, %
Sulfur, % Nitrogen, %
100% CTD 100 psig (3824) 1.35 0.28 0.55
100% DO 100 psig (3803) 0.30 0.41 0.15
100% CTD 50 psig (5551) 0.55 0.24 0.59
80/20 CTD/DO Blend (M&B)
(6289) 0.75 0.27 0.52
The result for the 100% CTD coke prepared at 50 psig is
surprisingly low in puffing. It also has a very low CTE indicating high
crystallinity which typically gives higher puffing for the same
concentrations of sulfur and nitrogen.
Additional measurements were undertaken to see if the pore
structure of these samples might give an explanation for the unusually low
puffing behavior. Specifically, the envelope and helium densities of the
same calcined coke materials used for the puffing tests were measured and
the amount of open porosity was calculated for each sample. The results
are summarized in Table XXXV.
444
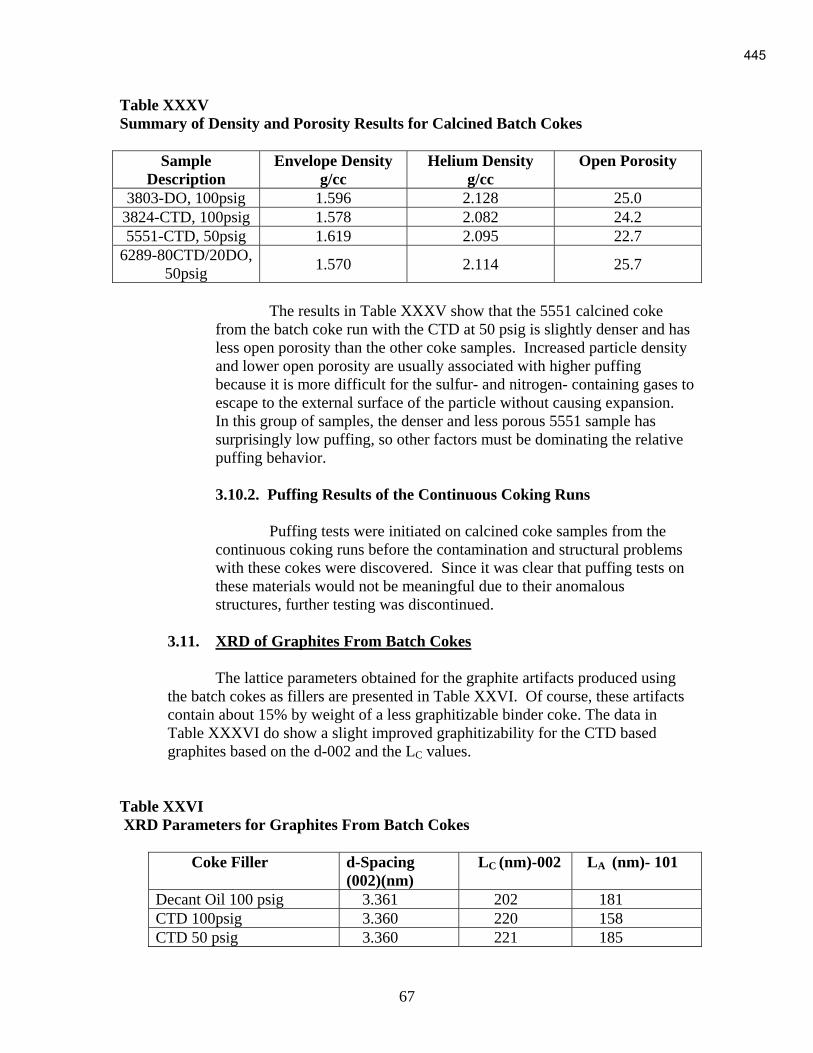
67
Table XXXV
Summary of Density and Porosity Results for Calcined Batch Cokes
Sample
Description
Envelope Density
g/cc
Helium Density
g/cc
Open Porosity
3803-DO, 100psig 1.596 2.128 25.0
3824-CTD, 100psig 1.578 2.082 24.2
5551-CTD, 50psig 1.619 2.095 22.7
6289-80CTD/20DO,
50psig 1.570 2.114 25.7
The results in Table XXXV show that the 5551 calcined coke
from the batch coke run with the CTD at 50 psig is slightly denser and has
less open porosity than the other coke samples. Increased particle density
and lower open porosity are usually associated with higher puffing
because it is more difficult for the sulfur- and nitrogen- containing gases to
escape to the external surface of the particle without causing expansion.
In this group of samples, the denser and less porous 5551 sample has
surprisingly low puffing, so other factors must be dominating the relative
puffing behavior.
3.10.2. Puffing Results of the Continuous Coking Runs
Puffing tests were initiated on calcined coke samples from the
continuous coking runs before the contamination and structural problems
with these cokes were discovered. Since it was clear that puffing tests on
these materials would not be meaningful due to their anomalous
structures, further testing was discontinued.
3.11. XRD of Graphites From Batch Cokes
The lattice parameters obtained for the graphite artifacts produced using
the batch cokes as fillers are presented in Table XXVI. Of course, these artifacts
contain about 15% by weight of a less graphitizable binder coke. The data in
Table XXXVI do show a slight improved graphitizability for the CTD based
graphites based on the d-002 and the LC values.
Table XXVI
XRD Parameters for Graphites From Batch Cokes
Coke Filler d-Spacing
(002)(nm)
LC (nm)-002 LA (nm)- 101
Decant Oil 100 psig 3.361 202 181
CTD 100psig 3.360 220 158
CTD 50 psig 3.360 221 185
445
68
80%CTD/20%DO 50psig 3.360 204 242
4. CONCLUSIONS
1. Coal tar distillate has been shown to produce an excellent needle coke which
can yield graphite with a lower CTE than petroleum-derived decant oil.
2. The high boiling CTD investigated in this program gives a very high yield of
coke when coked at the relatively low pressure of 50 psig which is close to that used in
commercial delayed cokers.
3. Both the quality and yield of the CTD-derived coke is sensitive to coking
conditions. The CTD contains a narrow distribution of polynuclear aromatics. A long
residence time at moderate coking temperatures is required to convert the lower
molecular weight components to coke. The mild coking conditions employed in the
batch coking trials allowed the slow development and alignment of large domained
mesophase necessary for formation of low CTE coke.
Higher temperatures and shorter residence times, such as those used in the
continuous coking trial, led to volatilization of the lower molecular weight aromatics
and formation of finer-domained mesophase which gave a less oriented structure and
produced a higher CTE graphite.
It is therefore important with this CTD material to allow slow thermal
polymerization and to retain the lower molecular weight components, which can serve to
plasticize the mesophase prior to completion of the coking process.
4. The coking behavior of the CTD material is related to its molecular
composition which consists of polynuclear aromatic hydrocarbons and heterocyclics with
a relative low degree of side chain substitution. As shown by the 1H and
13C NMR
analyses, the petroleum-derived decant oil in contrast contains aromatics with a large
degree of alkyl substituents of varying chain length. These alkyl substituents lead to a
higher reactivity and possibly, a slightly lower graphitizability than shown by the
aromatic components of the CTD.
5. The CTD has a much higher nitrogen content and a somewhat lower sulfur
content than the petroleum-based decant oil. The nitrogen species contribute to a higher
puffing rate for the CTD-based coke during graphitization which at present is not
controllable by conventional inhibitors. This could have an adverse economic effect on
the use of CTD coke for graphite electrodes.
6. Effective use of the liquid by-products is important in the economics of
delayed coking. The chemical makeup of the by-products from coking of the CTD and
the DO reflect the composition of the original feedstocks, with the CTD liquids showing
few alkyl substituted aromatics as compared to the DO.
446

69
7. The liquid by-products from coking of the CTD are essentially all in the high
boiling fuel oil range (BP>330oC) with only ~2% in the lower boiling gasoline, diesel oil
and jet fuel range. The CTD coking byproducts are likely the most volatile (least
reactive) components of the original feedstock and would have economic value as a
carbon black precursor or as fuel.
447
70
5. REFERENCES
(1) King, B. 1H and 13C Interpretation tutorial;
http://www.wfu.edu/ylwong/chem/nmrc13/c13chemicalshift.html- 2003.
(2) Rodriguez, J.; W, T. J.; Irving, W. Evaluation of a delayed coking process
by 1H and
13C n.m.r. spectroscopy: 2. Detailed interpretation of liquid
n.m.r. spectra. Fuel 1994, 73, 1870-1875.
(3) http://www.process-nmrcom/liquidanalysis(2).html Analytical liquid-state
NMR applications; Process NMR Associates, LLC, 2003.
(4) G. Wagoner, G. Sprogis, and D. G. Proctor, “Capacitance Bridge
Measurement of Thermal Expansion”, Carbon 1986 Proceedings, p. 234-
236, Baden-Baden (1986).
(5) H.A.Adams “Delayed Coking – Practice and Theory” in Introduction to
Carbon Technologies, Edited by H.Marsh, E.Heintz and F. Rodrigues-
Reinoso, University of Alicante Press, (1997), p.491.
448
71
6. APPENDIX
“Needle Coke from Coal-derived Feedstock”
Oil analysis
December, 2005
Harold Schobert*, Maria M. Escallon*
* Pennsylvania State University
Contract Number: 2867-GTIL-DOE-1874
Prime Award Number: DE-FC26-03NT41874
449

72
Table of Contents
1. Procedure of Analysis 774
1.1. Gas Chromatography / Mass Spectrometry (GC/MS) ........................................ 774
1.2. Simulated Distillation Gas Chromatography ...................................................... 774
1.3. Nuclear Magnetic Resonance – NMR ................................................................ 774
2. Results and Discussion 778
2.1. Distillation........................................................................................................... 778
2.2. Boiling point cuts................................................................................................ 779
2.2.1. Gasoline .............................................................................................. 779
2.2.2. Jet Fuel .................................................................................................. 81
2.2.3. Diesel .................................................................................................... 82
2.2.4. Fuel Oil ................................................................................................. 83
3. Conclusions 86
4. References 87
List of Tables
Table 1-1: 1H NMR assignments for functional groups of interest in petroleum
carbonization chemistry 3,4
...................................................................................... 775
Table 1-2: 13
C NMR assignments for functional groups of interest in petroleum
carbonization chemistry 3,4
...................................................................................... 776
Table 2-1: Simulated distillation.................................................................................... 778
Table 2-2: Actual distillation ......................................................................................... 778
Table 2-3: Hydrocarbon-type compounds obtained by GC/MS – Gasoline.................. 779
Table 2-4: Compounds obtained by 1H NMR – Gasoline ............................................. 779
Table 2-5: 13
C NMR - Gasoline ....................................................................................... 80
Table 2-6: Hydrocarbon-type compounds obtained by GC/MS - Jet Fuel ...................... 81
Table 2-7: Hydrocarbon-type compounds obtained by 1H NMR – Jet Fuel.................... 81
Table 2-8: Hydrocarbon-type compounds obtained by 13
C NMR – Jet Fuel .................. 81
Table 2-9: GC/MS – Diesel ............................................................................................. 82
Table 2-10: Hydrocarbon-type compounds obtained by 1H NMR – Diesel .................... 83
Table 2-11: Hydrocarbon-type compounds obtained by 13
C NMR – Diesel................... 83
Table 2-12: GC/MS – Fuel oil ......................................................................................... 83
Table 2-13: 1H NMR – Fuel oil ........................................................................................ 85
Table 2-14: 13
C NMR – Fuel oil....................................................................................... 85
450
73
Abstract
100 g sample of each oil obtained from the coking of decant oil alone (DO), coal tar
distillate alone (CTD) and the blend (CTD/DO) was subjected to vacuum distillation.
Four boiling point cuts were obtained, gasoline, jet fuel, diesel and fuel oil. The boiling
point cuts obtained from vacuum distillation were compared with the ones obtained by
simulated distillation (SimDis).
The oil characterization was carried out at The Energy Institute, The Pennsylvania
State University. Each boiling point cut was characterized by using chromatography-
mass spectrometry (GC/MS) and nuclear magnetic resonance spectroscopy (1H and
13C
NMR).
The characterization procedure was the same procedure followed for the feedtocks
characterization (see the first submitted report).
451
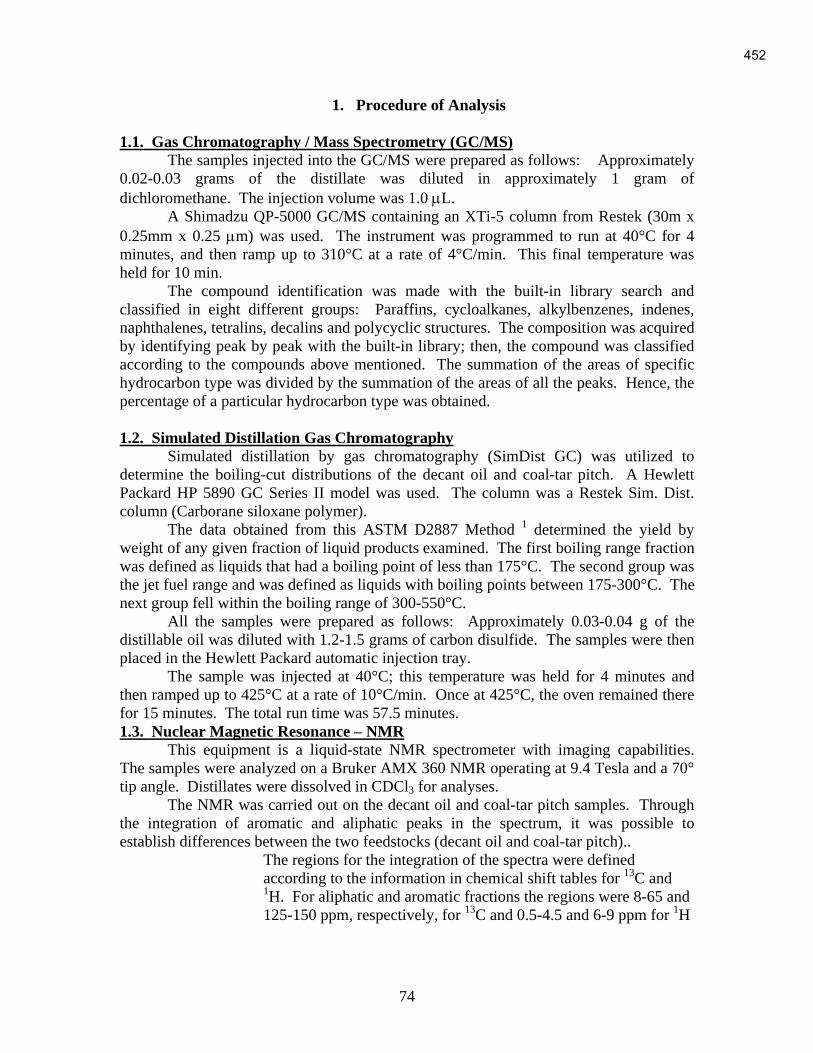
74
1. Procedure of Analysis
1.1. Gas Chromatography / Mass Spectrometry (GC/MS)
The samples injected into the GC/MS were prepared as follows: Approximately
0.02-0.03 grams of the distillate was diluted in approximately 1 gram of
dichloromethane. The injection volume was 1.0 μL.
A Shimadzu QP-5000 GC/MS containing an XTi-5 column from Restek (30m x
0.25mm x 0.25 μm) was used. The instrument was programmed to run at 40°C for 4
minutes, and then ramp up to 310°C at a rate of 4°C/min. This final temperature was
held for 10 min.
The compound identification was made with the built-in library search and
classified in eight different groups: Paraffins, cycloalkanes, alkylbenzenes, indenes,
naphthalenes, tetralins, decalins and polycyclic structures. The composition was acquired
by identifying peak by peak with the built-in library; then, the compound was classified
according to the compounds above mentioned. The summation of the areas of specific
hydrocarbon type was divided by the summation of the areas of all the peaks. Hence, the
percentage of a particular hydrocarbon type was obtained.
1.2. Simulated Distillation Gas Chromatography
Simulated distillation by gas chromatography (SimDist GC) was utilized to
determine the boiling-cut distributions of the decant oil and coal-tar pitch. A Hewlett
Packard HP 5890 GC Series II model was used. The column was a Restek Sim. Dist.
column (Carborane siloxane polymer).
The data obtained from this ASTM D2887 Method 1 determined the yield by
weight of any given fraction of liquid products examined. The first boiling range fraction
was defined as liquids that had a boiling point of less than 175°C. The second group was
the jet fuel range and was defined as liquids with boiling points between 175-300°C. The
next group fell within the boiling range of 300-550°C.
All the samples were prepared as follows: Approximately 0.03-0.04 g of the
distillable oil was diluted with 1.2-1.5 grams of carbon disulfide. The samples were then
placed in the Hewlett Packard automatic injection tray.
The sample was injected at 40°C; this temperature was held for 4 minutes and
then ramped up to 425°C at a rate of 10°C/min. Once at 425°C, the oven remained there
for 15 minutes. The total run time was 57.5 minutes.
1.3. Nuclear Magnetic Resonance – NMR
This equipment is a liquid-state NMR spectrometer with imaging capabilities.
The samples were analyzed on a Bruker AMX 360 NMR operating at 9.4 Tesla and a 70°
tip angle. Distillates were dissolved in CDCl3 for analyses.
The NMR was carried out on the decant oil and coal-tar pitch samples. Through
the integration of aromatic and aliphatic peaks in the spectrum, it was possible to
establish differences between the two feedstocks (decant oil and coal-tar pitch)..
The regions for the integration of the spectra were defined
according to the information in chemical shift tables for 13
C and 1H. For aliphatic and aromatic fractions the regions were 8-65 and
125-150 ppm, respectively, for 13
C and 0.5-4.5 and 6-9 ppm for 1H
452

75
2. A detailed interpretation was applied following the peaks
integration suggested by Rodriguez et al.3. This is shown in
Table I and
Table.
The description of functional groups peaks assignments for 1H NMR
4 is given as
follows:
Total Aliphatic: This is the atomic percent of hydrogen atoms present in paraffinic or
naphthenic components of the sample.
Total Aromatic: This is the atomic percent of hydrogen atoms present in mono-, di-,
and tri-ring aromatic groups.
Triaromatic: This is the atomic percent of hydrogen atoms on carbons adjacent to a
bridgehead site in a tri-ring aromatic.
Diaromatic: This is the atomic percent of hydrogen atoms on carbons adjacent to a
bridgehead site in a di-ring aromatic.
Monoaromatic: This is the atomic percent of hydrogen atoms in a single ring aromatic
group or on the periphery of a polynuclear aromatic group.
Alpha (α)-CH: This is the atomic percent of hydrogen present on methyl groups directly
attached to aromatic groups.
Beta (β): This is the atomic percent of hydrogen in CH or CH2 groups in paraffinic or
naphthenic groups, more than one carbon from an aromatic group.
Beta-CH2: This is the atomic percent of hydrogen present in naphthenic methylene
groups or methylene groups in beta position to an aromatic group.
Paraffinic-CH2: This is the atomic percent of hydrogen present in paraffinic methylene
groups.
Table 1-1: 1H NMR assignments for functional groups of interest in petroleum
carbonization chemistry 3,4
Band TMS
(ppm)
Assignment
0.5-1.0 CH3 γ and further, some naphthenic CH and CH2
1.0-1.7 CH2 β and further, some β CH3. Separation at 1.7
ppm is generally not base resolved
1.7-1.9 Most CH, CH2 β hydroaromatic. This shoulder is
one of the best available ways to estimate
hydroaromaticity
1.9-2.1 α to olefinic
2.1-2.4 CH3 α to aromatic carbons
2.4-3.5 CH, CH2 α to aromatic carbons
3.5-4.5 CH2 bridge (diphenylmethane)
4.5-6.0 Olefinic
6.0-7.2 Single ring aromatic (or monoaromatic)
7.2-8.3 Diaromatic and most of tri- and tetraromatic
8.3-8.9 Some tri- and tetraromatic rings
8.9-9.3 Some tetraromatic rings
453
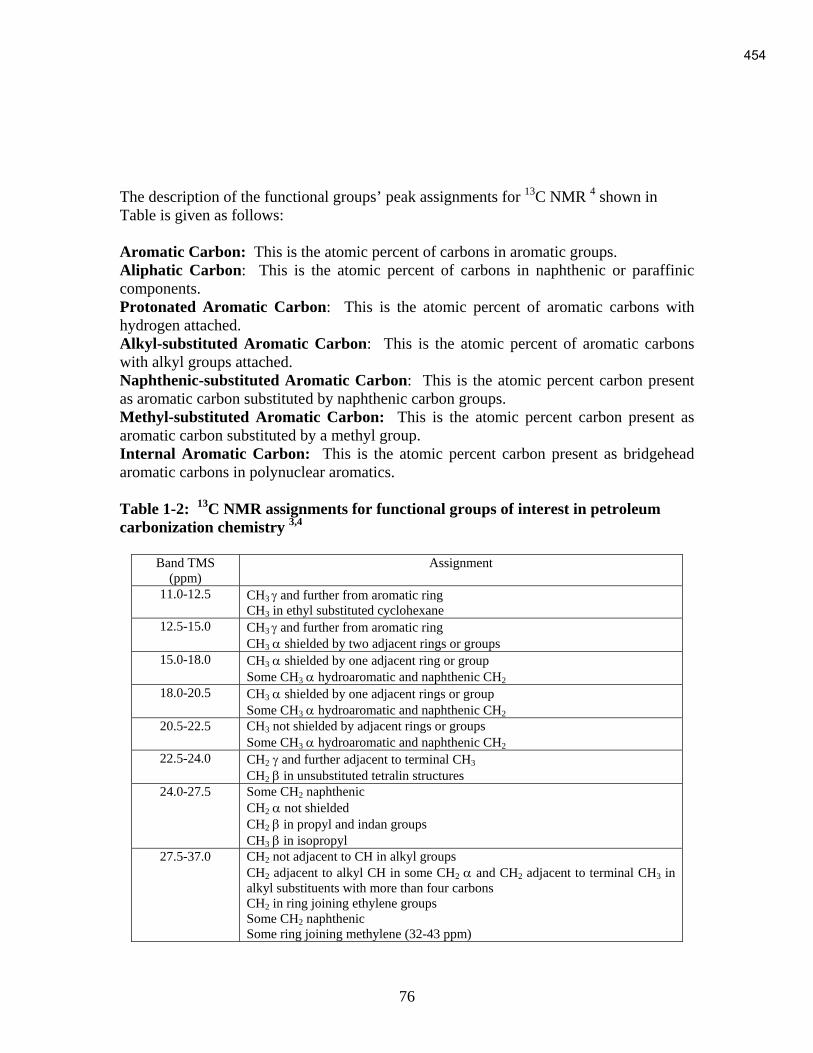
76
The description of the functional groups’ peak assignments for 13
C NMR 4 shown in
Table is given as follows:
Aromatic Carbon: This is the atomic percent of carbons in aromatic groups.
Aliphatic Carbon: This is the atomic percent of carbons in naphthenic or paraffinic
components.
Protonated Aromatic Carbon: This is the atomic percent of aromatic carbons with
hydrogen attached.
Alkyl-substituted Aromatic Carbon: This is the atomic percent of aromatic carbons
with alkyl groups attached.
Naphthenic-substituted Aromatic Carbon: This is the atomic percent carbon present
as aromatic carbon substituted by naphthenic carbon groups.
Methyl-substituted Aromatic Carbon: This is the atomic percent carbon present as
aromatic carbon substituted by a methyl group.
Internal Aromatic Carbon: This is the atomic percent carbon present as bridgehead
aromatic carbons in polynuclear aromatics.
Table 1-2: 13
C NMR assignments for functional groups of interest in petroleum
carbonization chemistry 3,4
Band TMS
(ppm)
Assignment
11.0-12.5 CH3 γ and further from aromatic ring
CH3 in ethyl substituted cyclohexane
12.5-15.0 CH3 γ and further from aromatic ring
CH3 α shielded by two adjacent rings or groups
15.0-18.0 CH3 α shielded by one adjacent ring or group
Some CH3 α hydroaromatic and naphthenic CH2
18.0-20.5 CH3 α shielded by one adjacent rings or group Some CH3 α hydroaromatic and naphthenic CH2
20.5-22.5 CH3 not shielded by adjacent rings or groups
Some CH3 α hydroaromatic and naphthenic CH2
22.5-24.0 CH2 γ and further adjacent to terminal CH3
CH2 β in unsubstituted tetralin structures
24.0-27.5 Some CH2 naphthenic
CH2 α not shielded
CH2 β in propyl and indan groups
CH3 β in isopropyl
27.5-37.0 CH2 not adjacent to CH in alkyl groups
CH2 adjacent to alkyl CH in some CH2 α and CH2 adjacent to terminal CH3 in
alkyl substituents with more than four carbons
CH2 in ring joining ethylene groups
Some CH2 naphthenic
Some ring joining methylene (32-43 ppm)
454

77
37.0-60.0 CH alkyl groups (except isoalkyl)
CH naphthenic
CH2 alkyl groups adjacent to CH
Some ring joining methylene (32-43 ppm)
108.0-118.0 Some olefinic (others spread through aromatic region)
118.0-129.5 Protonated aromatic
Some internal (quaternary) aromatic
129.5-133.0 Most internal aromatic. These carbons are present as bridgehead aromatic
carbons in polynuclear aromatics
133.0-135.0 Methyl substituted aromatic
135.0-138.0 Naphthenic substituted aromatic
138.0-160.0 Alkyl (other than methyl) substituted aromatic heteroatom (N, O, S) aromatic
455

78
2. Results and Discussion
2.1. Distillation
The distillation was carried out using the simulated distillation and actual
distillation (under vacuum). The boiling point cuts of the oils obtained after the
coking of the decant oil alone match when comparing Table 0-1 and
Table (simulated and actual distillation); however, the boiling cuts of the oils obtained
after the coking of the coal tar distillate (CTD) shows a big difference between the
simulated and actual distillation. The reason is because the CTD is richer in aromatic
compounds when compared to the decant oil; the simulated distillation standard
calibration contains n-alkanes which have lower boiling point when compared to their
aromatic counterparts. Therefore, simulated distillation is reporting the present of
compounds at lower boiling point cuts when actually those compounds do not belong to
that cut.
Table 0-1: Simulated distillation
Decant oil - DO Coal tar distillate - CTD
%
ibp-180 5.46 0.86
180-270 11.11 7.26
270-332 12.80 24.27
332-fpb 69.66 66.64 ibp=initial boiling point; fbp=final boiling point
Table 0-2: Actual distillation
DO CTD CTD/DO 4:1
%
ibp-180 Gasoline 5.8 2.0 1.0
180-270 Jet Fuel 10.7 -- 6.0
270-332 Diesel 14.6 -- ---
332-fpb Fuel Oil 68.9 98.0 93.0
456
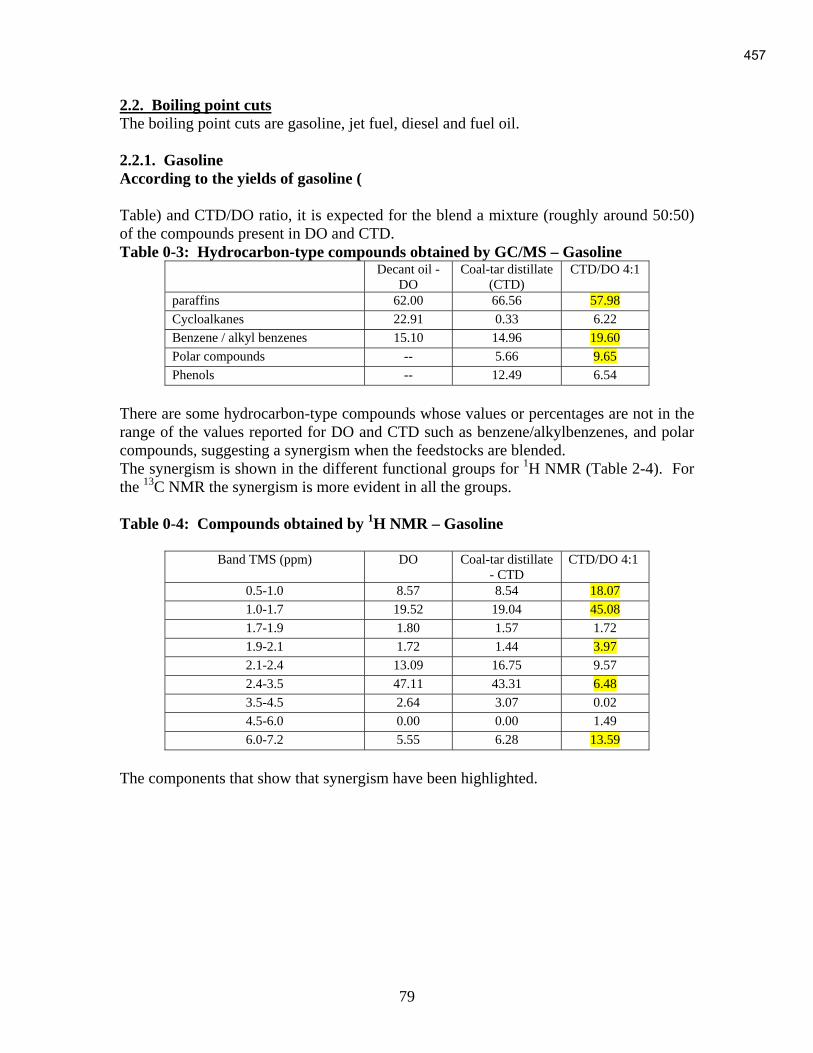
79
2.2. Boiling point cuts
The boiling point cuts are gasoline, jet fuel, diesel and fuel oil.
2.2.1. Gasoline
According to the yields of gasoline (
Table) and CTD/DO ratio, it is expected for the blend a mixture (roughly around 50:50)
of the compounds present in DO and CTD.
Table 0-3: Hydrocarbon-type compounds obtained by GC/MS – Gasoline
Decant oil -
DO
Coal-tar distillate
(CTD)
CTD/DO 4:1
paraffins 62.00 66.56 57.98
Cycloalkanes 22.91 0.33 6.22
Benzene / alkyl benzenes 15.10 14.96 19.60
Polar compounds -- 5.66 9.65
Phenols -- 12.49 6.54
There are some hydrocarbon-type compounds whose values or percentages are not in the
range of the values reported for DO and CTD such as benzene/alkylbenzenes, and polar
compounds, suggesting a synergism when the feedstocks are blended.
The synergism is shown in the different functional groups for 1H NMR (Table 2-4). For
the 13
C NMR the synergism is more evident in all the groups.
Table 0-4: Compounds obtained by 1H NMR – Gasoline
Band TMS (ppm) DO Coal-tar distillate
- CTD
CTD/DO 4:1
0.5-1.0 8.57 8.54 18.07
1.0-1.7 19.52 19.04 45.08
1.7-1.9 1.80 1.57 1.72
1.9-2.1 1.72 1.44 3.97
2.1-2.4 13.09 16.75 9.57
2.4-3.5 47.11 43.31 6.48
3.5-4.5 2.64 3.07 0.02
4.5-6.0 0.00 0.00 1.49
6.0-7.2 5.55 6.28 13.59
The components that show that synergism have been highlighted.
457

80
Table 0-5: 13
C NMR - Gasoline
Band TMS (ppm) DO Coal-tar distillate - CTD CTD/DO 80:20
11.0-12.5 0.62 0.61 0.43
12.5-15.0 4.74 4.81 5.08
15.0-18.0 1.66 1.66 1.81
18.0-20.5 5.17 5.26 2.93
20.5-22.5 4.00 4.07 2.70
22.5-24.0 4.88 4.95 5.32
24.0-27.5 4.63 4.69 2.97
27.5-37.0 27.88 28.23 25.34
37.0-60.0 11.78 11.40 5.51
108.0-118.0 0.09 0.15 3.41
118.0-129.5 20.68 21.25 29.92
129.5-133.0 4.05 4.00 4.32
133.0-135.0 3.25 3.18 4.33
135.0-138.0 2.20 2.11 1.32
138.0-160.0 4.37 3.64 4.61
Discussion:
The components present in the GC/MS were revised. There are some components that do
not correspond to the gasoline fraction; this suggested an overlapping with the jet fuel
fraction. These components were removed of the table and the percentages were
normalized.
The interpretation of the GC/MS and NMR is as follows:
By 1H and
13C NMR it is observed that olefins are increase in the gasoline fraction when
DO is blended with CTD (1.9-2.1 and 4.5-6 ppm 1H NMR and 108-118 ppm
13C NMR).
Olefins increase the octane number and might be upgrading the gasoline fraction;
however, olefins content have to meet specification and these are reported in %v/v. NMR
reports olefins in elemental percent (%H and %C). Additional test (ASTM) has to be
carried out to know the olefins composition in v/v %.
Aromatic content and single aromatic are higher for the blend, according to GC/MS, 1H
NMR (6.0-7.2 ppm) and 13
C NMR (118.0-129.5). The aromatics increase the octane
number; however, the percentage has to be within the specifications range. There are
special restrictions for benzene (it has to be below 3% v/v).
Phenols and polar compounds are present in the blend; this is shown in the GC/MS and 13
C NMR (138.0-160.0 ppm) and this is contribution from the CTD. These components
are undesirable for the gasoline for environmental purposes.
According to the analysis, the distillate resulting from after co-coke CTD and DO might
not improve the gasoline. Phenols and polar compounds are present as a contribution
from CTD. It is important to highlight that these data is not enough to know the possible
improve of the gasoline fraction by blending CTD/DO 4:1. Additional test have to be
carried out to get information about composition in v/v for specific components to see if
they meet the specifications.
458
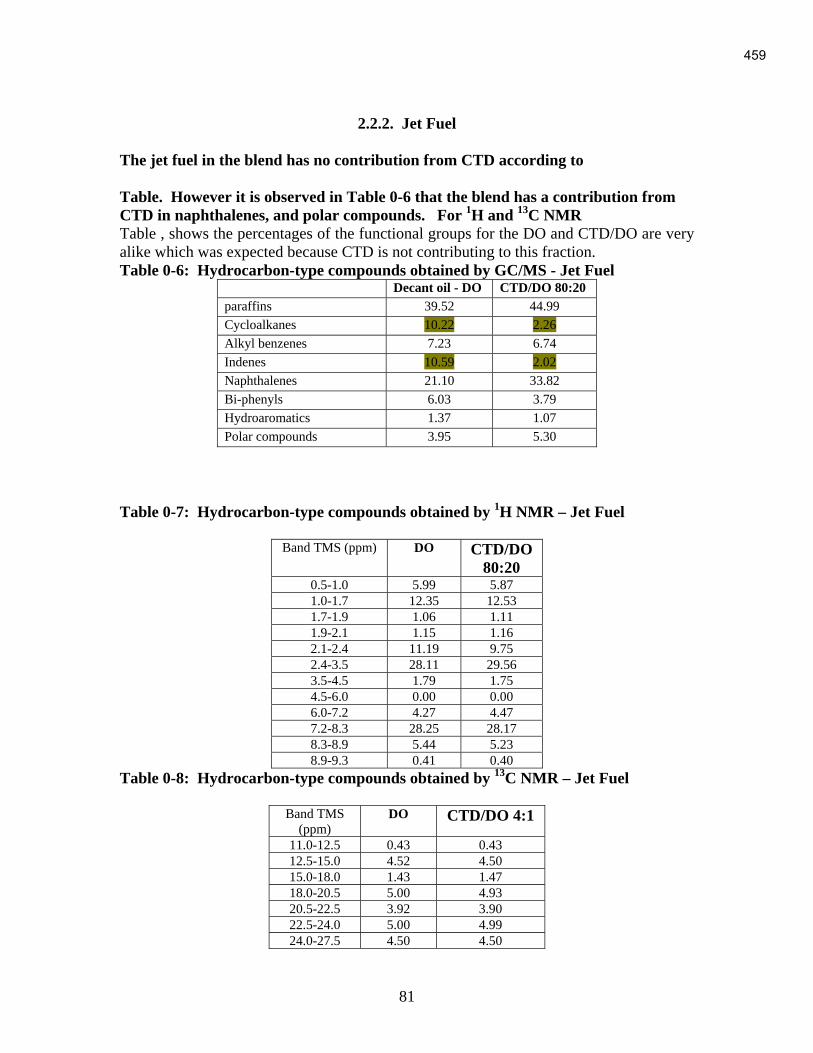
81
2.2.2. Jet Fuel
The jet fuel in the blend has no contribution from CTD according to
Table. However it is observed in Table 0-6 that the blend has a contribution from
CTD in naphthalenes, and polar compounds. For 1H and
13C NMR
Table , shows the percentages of the functional groups for the DO and CTD/DO are very
alike which was expected because CTD is not contributing to this fraction.
Table 0-6: Hydrocarbon-type compounds obtained by GC/MS - Jet Fuel Decant oil - DO CTD/DO 80:20
paraffins 39.52 44.99
Cycloalkanes 10.22 2.26
Alkyl benzenes 7.23 6.74
Indenes 10.59 2.02
Naphthalenes 21.10 33.82
Bi-phenyls 6.03 3.79
Hydroaromatics 1.37 1.07
Polar compounds 3.95 5.30
Table 0-7: Hydrocarbon-type compounds obtained by 1H NMR – Jet Fuel
Band TMS (ppm) DO CTD/DO
80:20
0.5-1.0 5.99 5.87
1.0-1.7 12.35 12.53
1.7-1.9 1.06 1.11
1.9-2.1 1.15 1.16
2.1-2.4 11.19 9.75
2.4-3.5 28.11 29.56
3.5-4.5 1.79 1.75
4.5-6.0 0.00 0.00
6.0-7.2 4.27 4.47
7.2-8.3 28.25 28.17
8.3-8.9 5.44 5.23
8.9-9.3 0.41 0.40
Table 0-8: Hydrocarbon-type compounds obtained by 13
C NMR – Jet Fuel
Band TMS
(ppm) DO CTD/DO 4:1
11.0-12.5 0.43 0.43
12.5-15.0 4.52 4.50
15.0-18.0 1.43 1.47
18.0-20.5 5.00 4.93
20.5-22.5 3.92 3.90
22.5-24.0 5.00 4.99
24.0-27.5 4.50 4.50
459

82
27.5-37.0 29.66 28.65
37.0-60.0 11.53 12.68
108.0-118.0 0.16 0.20
118.0-129.5 21.47 21.39
129.5-133.0 3.99 3.98
133.0-135.0 3.23 3.21
135.0-138.0 1.99 1.98
138.0-160.0 3.17 3.19
Discussion:
Some components reported in the GC/MS that belong to a heavier fraction were removed,
meaning that it was some overlapping in fractions when the vacuum distillation was
carried out.
The result of the synergism between DO and CTD are the presence of naphthalenes. This
is good for the Jet fuel fraction because further hydrotreatment of the jet fuel will give
hydroaromatics and/or cycloalkanes, components that improve the thermal stability of the
jet fuel. At the same time hydrotreatment might help in the reduction of polar
components.
2.2.3. Diesel
According to
Table, diesel is not obtained in CTD and CTD/DO
Table 0-9: GC/MS – Diesel
Decant oil -
DO
paraffins 10.84
Cycloalkanes 3.31
Alkyl benzenes 1.83
Indenes 1.67
Naphthalenes 4.51
Bi-phenyls 4.94
Anthracenes / Phenanthrenes 50.00
Hydroaromatics 7.65
Polar compounds 13.37
Acenaphtylene 1.88
Discussion:
CTD does not contribute to the diesel fraction alone and do not have a synergetic effect
on this fraction as it was for the jet fuel fraction; diesel fraction is not present in the
blend.
460
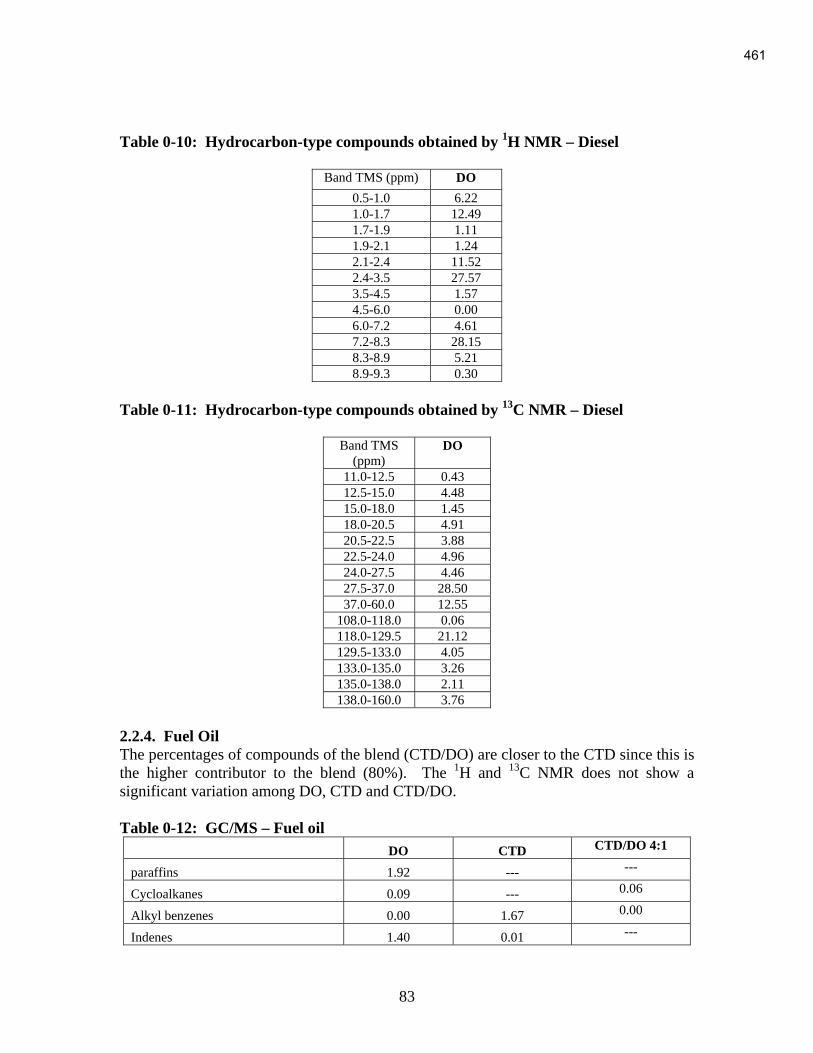
83
Table 0-10: Hydrocarbon-type compounds obtained by 1H NMR – Diesel
Band TMS (ppm) DO
0.5-1.0 6.22
1.0-1.7 12.49
1.7-1.9 1.11
1.9-2.1 1.24
2.1-2.4 11.52
2.4-3.5 27.57
3.5-4.5 1.57
4.5-6.0 0.00
6.0-7.2 4.61
7.2-8.3 28.15
8.3-8.9 5.21
8.9-9.3 0.30
Table 0-11: Hydrocarbon-type compounds obtained by 13
C NMR – Diesel
Band TMS
(ppm) DO
11.0-12.5 0.43
12.5-15.0 4.48
15.0-18.0 1.45
18.0-20.5 4.91
20.5-22.5 3.88
22.5-24.0 4.96
24.0-27.5 4.46
27.5-37.0 28.50
37.0-60.0 12.55
108.0-118.0 0.06
118.0-129.5 21.12
129.5-133.0 4.05
133.0-135.0 3.26
135.0-138.0 2.11
138.0-160.0 3.76
2.2.4. Fuel Oil
The percentages of compounds of the blend (CTD/DO) are closer to the CTD since this is
the higher contributor to the blend (80%). The 1H and
13C NMR does not show a
significant variation among DO, CTD and CTD/DO.
Table 0-12: GC/MS – Fuel oil
DO CTD CTD/DO 4:1
paraffins 1.92 --- ---
Cycloalkanes 0.09 --- 0.06
Alkyl benzenes 0.00 1.67 0.00
Indenes 1.40 0.01 ---
461

84
Naphthalenes, bi-naphthalenes 1.32 3.28 4.76
Bi, tri-phenyls 5.78 3.32 4.39
Anthracenes / Phenanthrenes (3-ring) 15.61 23.54 16.63
Pyrenes (4-fused ring) 39.60 13.67 16.65
Hydroaromatics 13.55 5.10 8.03
Polar compounds 3.67 1.60 1.41
Acenaphtylene 0.08 0.02 0.05
Fluorene 0.08 6.99 0.82
Fluoranthene 13.68 40.77 46.72
5-fused ring 2.38 0.02 0.39
6-fused ring 0.90 --- 0.09
Discussion:
The values for CTD/DO are in the range in between the DO alone and CTD such is
shown in GC/MS and 1H and
13C NMR. For this fraction synergism is not observed
except for Fluoranthene and naphthalenes/bi-naphthalenes.
462

85
Table 0-13: 1H NMR – Fuel oil
Band TMS
(ppm) Decant oil
- DO
Coal-tar
distillate -
CTD
CTD/DO
80:20
0.5-1.0 6.06 5.84 5.79
1.0-1.7 12.38 12.51 12.32
1.7-1.9 1.07 1.10 1.05
1.9-2.1 1.18 1.14 0.98
2.1-2.4 11.28 9.71 11.61
2.4-3.5 27.94 29.64 27.94
3.5-4.5 1.74 1.76 1.78
4.5-6.0 0.00 0.00 0.00
6.0-7.2 4.36 4.45 4.25
7.2-8.3 28.21 28.19 28.45
8.3-8.9 5.39 5.24 5.37
8.9-9.3 0.39 0.41 0.46
Table 0-14: 13
C NMR – Fuel oil
Band TMS (ppm) Decant oil - DO Coal-tar distillate - CTD CTD/DO 80:20
11.0-12.5 0.51 0.45 0.47
12.5-15.0 4.63 4.53 4.58
15.0-18.0 1.55 1.48 1.47
18.0-20.5 5.08 4.96 4.48
20.5-22.5 3.96 3.91 4.54
22.5-24.0 4.96 4.97 4.97
24.0-27.5 4.56 4.49 4.54
27.5-37.0 28.36 28.51 28.58
37.0-60.0 12.02 12.40 12.25
108.0-118.0 0.10 0.08 0.18
118.0-129.5 21.16 21.20 21.33
129.5-133.0 4.03 4.03 4.01
133.0-135.0 3.25 3.25 3.23
135.0-138.0 2.09 2.08 2.02
138.0-160.0 3.74 3.65 3.34
463

86
Conclusions
• The characterization of the Decant oil and Coal-Tar pitch was carried out by
using different techniques such as 1H and
13C NMR, GC/MS, SimDis.
• Oil coming from the CTD coking does not have cuts for jet fuel and diesel.
Therefore, the final product (jet fuel and diesel) is very low in yield and the oil
composition is more likely to the oil from DO.
• The presence of polyaromatics is observed in the jet fuel fraction. CTD has
contributed to the blend even though this is not observed in the yields when CTD
liquids from the coker are fractionated under vacuum; CTD alone does not have
distillates falling in the jet fuel range. This suggests that there is a synergism
effect when blending CTD and DO.
• 1H and
13C NMR show differences in the gasoline cut. Differences are not
observed for the jet fuel, diesel and fuel oil. In jet fuel and diesel the differences
are not observed because CTD alone does not have distillates falling in the jet fuel
range.
• The possible improvement of the gasoline fraction by blending DO and CTD is
not clear. There are present of compounds that increase the octane number but
there is also presence of polar compound coming from the CTD. Some
components for gasoline are strictly controlled for environmental purposes and
those are not determined by GC/MS alone or NMR Additional techniques
reported by the ASTM have to be carried out to get the information in volume
percent.
• The jet fuel fraction might be improved by blending DO and CTD. The presence
of naphthenic compounds, obtained after the hydrotreatment of the jet fuel
fraction giving hydroaromatics and cycloalkanes, which improve the thermal
stability of the jet fuel.
464
87
4. References
(1) ASTM/2887-84 In Manual on Hydrocarbon Analysis; A.W.Drews, Ed.; ASTM:
Philadelphia, 1988; 551-555.
(2) King, B. 1H and 13C Interpretation tutorial;
http://www.wfu.edu/ylwong/chem/nmrc13/c13chemicalshift.html, 2003.
(3) Rodriguez, J.; W, T. J.; Irving, W. Evaluation of a delayed coking process by 1H
and 13C n.m.r. spectroscopy: 2. Detailed interpretation of liquid n.m.r. spectra.
Fuel 1994, 73, 1870-1875.
(4) http://www.process-nmrcom/liquidanalysis(2).html Analytical liquid-state NMR
applications; Process NMR Associates, LLC, 2003.
(5) ASTM/D3279-83 In Manual on Hydrocarbon Analysis; A.W.Drews, Ed.; ASTM:
Philadelphia, 1988; 650-652.
465

Carbon Foam Production through Plasticization of Coal Tar Pitch with Supercritical CO2
Final Report for: The Consortium for Premium Carbon Products from Coal
Start Date: July 1st 2005 End Date: June 31st 2006
Authored by: Principal Investigator Joe Stoffa
August 2006
DOE Prime Award Number: DE-FC26-03NT41874 DOE Subaward Number: 3035-PCP-DOE-1874
Premium Carbon Products LLC 906 River Road Morgantown WV, 26501
466

2
Disclaimer This report was prepared as an account of work sponsored by an agency of the United States Government. Neither the United States Government nor any agency thereof, nor any of their employees, makes any warranty, express or implied, or assumes any legal liability or responsibility for the accuracy, completeness, or usefulness of any information, apparatus, product, or process disclosed, or represents that its use would not infringe privately owned rights. Reference not necessarily constitute or imply its endorsement, recommendation, or favoring by the United States Government or any agency thereof. The views and opinions of authors expressed herein do not necessarily state or reflect those of the United States Government or any agency thereof.
467

3
Abstract This report summarizes research on an alternative method of carbon foam production. The report relays the major research accomplishments, details the research completed, and provides the data necessary to justify the researchs conclusions. The highlight of research was the creation of carbon foams from pitch foams pitch foams that were produced from coal tar pitch and a blowing agent. This result proved that treating coal tar pitch as a thermoplastic enabled the production of low cost carbon foam precursors. This is significant because it implied new possibilities for carbon foam through the use of traditional thermoplastic processing techniques
The research goals were the creation of pitch foams and their transformation into carbon foams. An experimental plan was developed to test the suitability of several pitch foams as carbon foam precursors. An experimental apparatus was designed to create these pitch foams, while at the same time collecting data on system properties of interest. Once created, these pitch foams were examined via SEM microscopy and select physical properties were measured. These precursors were then transformed into carbon foams, and changes in their physical properties were recorded and analyzed. Examination of literature assisted in explaining observed data. The result of research was further development of a technology that should be able to create carbon foams form low cost precursors using established processing technology.
468

4
Contents Disclaimer ......................................................................................................................2 Abstract..........................................................................................................................3 Graphical Materials ......................................................................................................5
List of Figures .............................................................................................................5 List of Tables...............................................................................................................5 List of Equations..........................................................................................................5
Executive Summary.......................................................................................................6 Experimental .................................................................................................................8 Results and Discussions ...............................................................................................14 Conclusion....................................................................................................................31 References ....................................................................................................................32 Appendix A.1 Weight loss during air stabilization..................................................33 Appendix A.2 Weight loss during carbonization.....................................................34 Appendix B.1 Density data for pitch foam...............................................................35 Appendix B.2 Density data for air-stabilized foam .................................................36 Appendix B.3 Density data for carbonized foam.....................................................37 Appendix C Electrical resistance of carbonized foam samples...............................38 Appendix D Torque data at various motor RPM....................................................39
469

5
Graphical Materials List of Figures Figure 1 Circuit for converting transducer current to voltage signal ............................10 Figure 2 Diagram of experimental apparatus...............................................................10 Figure 3 Picture of experimental apparatus .................................................................11 Figure 4 Four point probe method to determine electrical resistance ...........................13 Figure 5 Pitch foam specific gravity............................................................................14 Figure 6 Weight loss during air-stabilization...............................................................15 Figure 7 Air stabilized foam specific gravity...............................................................16 Figure 8 Weight loss during carbonization ..................................................................17 Figure 9 SEM picture of pitch foam3...........................................................................18 Figure 10 SEM picture of air stabilized pitch foam3 ....................................................19 Figure 11 SEM picture of carbonized pitch foam3.......................................................20 Figure 12 Resistance of carbon foam samples .............................................................21 Figure 13 Wet and dry foam diagrams (top) vs. pitch foams (bottom) 3,4 .....................22 Figure 14 Relatively small pitch foam pore3................................................................23 Figure 15 Depressurization rate of batch foaming apparatus........................................24 Figure 16 Pitch foam piece near edge of pressure vessel3 ............................................25 Figure 17 Pitch foam piece near center of pressure vessel3 ..........................................26 Figure 18 Torque observed at various stirring rates, 4 wt. % Silica, 234°C..................27 Figure 19 Foaming envelope.......................................................................................29 List of Tables Table 1 Experimental matrix.........................................................................................8 List of Equations Equation 1 Williams-Landel-Ferry viscosity model for polymers................................28 Equation 2 T.S. Chow model predicting Tg .................................................................28 Equation 3 Critical radius of nucleating bubbles .........................................................29
470

6
Executive Summary The proposed research outlined two tasks. Firstly, to create various pitch foams from coal tar pitch, a blowing agent, and additives. Secondly, to transform these pitch foams to carbon foams through heat processing. These tasks have been completed, and more than envisioned in the original proposal has been accomplished. The ability to produce carbon foams from pitch foams proved that low cost pitch foam could serve as a precursor to carbon foam, which was not apparent at the onset of research. The production of the pitch foam itself was significant, because the production methodology treated coal tar pitch as a thermoplastic. This suggested that established thermoplastics processing technology could be used to create a wide variety of low cost carbon foam precursors. It is probable that an extruder could control the properties of pitch foam (density, cell size, and cell connectedness), and hence the resultant carbon foam. This implied that carbon foams can be tailor made to consumer needs. It is also probable that the extruded pitch foam could be formed into larger pieces and shapes by injection molding. These shapes and forms would then be air-stabilized and carbonized, resulting in shaped carbon foam. This would minimize the cost and waste associated with machining a large block of carbon foam into a smaller shape. The research measured the specific gravities of pitch foam, air stabilized foam, and carbon foam. The weight loss during air stabilization and carbonization was also recorded. Furthermore, the electrical resistivity of the carbon foam was measured. Data on the properties of the pitch foam precursor were also collected. The pitch foam precursor was a mixture of coal tar pitch, blowing agent, and additives. The viscosity of the pitch foam precursor as a function of shear rate was qualitatively measured. This information was useful for determining the shear behavior of the coal tar pitch and blowing agent solution. This viscosity information will be useful when the technology is scaled to larger equipment. Research also examined the properties of the foaming apparatus, namely the depressurization rate. The depressurization rate may control the pore size of the resultant pitch foam. Conclusions drawn from examination of this data will be useful during the next phase of research, when pitch foams are created using an extruder. A literature review improved the quality of laboratory work by identifying several process parameters and system properties of interest. Literature outlined some of the parameters that would be influential if the process were scaled; the pitch foam precursor viscosity and system depressurization rate. These parameters were measured if it was reasonable to do so while remaining within the scope of research as defined in the original proposal. Literature was also useful in describing results observed during research and in suggesting possible future process improvements.
Research progressed steadily, and more was accomplished than originally envisioned. The two tasks of the proposal, to create pitch foams and carbonize them, were accomplished. In addition to these tasks, some rheological properties of the coal tar pitch and carbon dioxide solution were qualitatively measured. Additionally, data was collected on the experimental apparatus during foaming. This information will be useful when the process is scaled, which is scheduled to occur in the next phase of research. The
471

7
literature review elucidated useful information that will improve the quality of and control over the process. In summary, all that was originally proposed and more has been accomplished. The result of the research was the further development of a technology that will yield new capabilities for carbon foam.
472

8
Experimental
Before laboratory work began, an experimental matrix was designed. The experimental matrix listed the twenty-seven samples (nine unique combinations) of coal tar pitch and additives that were created during research. These nine unique combinations arose from the combination of one coal tar pitch with three levels of ferrocene addition and three levels of silica addition. Each combination was performed three times, to ensure the data were repeatable. This resulted in a total of twenty seven experiments, which are summarized below in Table 1.
Table 1 Experimental matrix
473

9
A Koppers low volatility coal tar pitch, Mettler softening point 252°C (486°F),
was chosen for this research. This coal tar pitch was chosen because of its high softening point, which eased air stabilization. If the glass transition temperature of the pitch was too low, the pitch foam would have melted before being air stabilized. The other additives in the experimental matrix (see Table 1) were ferrocene and silica. Ferrocene is a hydrogenation/dehydrogenation catalyst. It was hypothesized that ferrocene would minimize pitch foam sagging during air stabilization; by raising the pitch foams softening point. It was also suspected that ferrocene would favor mesophase formation during carbonization, thus increasing the electrical conductivity of carbonized foams. Silica was added as a thixotropic agent, an additive that increases the at rest viscosity of a liquid1. It was hypothesized that silica would minimize pitch foam sagging during air stabilization, by raising the pitch foams at rest viscosity. Because these additives minimized pitch foam sagging by different mechanisms, it was suspected their effects would have been additive. After creation of the experimental matrix, the next step was to create the experimental apparatus.
The experimental apparatus included the vessel and periphery equipment necessary to create pitch foams. The experimental apparatus was designed to meet the following criteria:
Pressures up to 82 atm (1200 psi) Temperatures up to 250°C (482 °F) Stir pitch foam precursors at various shear rates Qualitatively measure viscosity Rapidly depressurize Remote Operation Record all important data Through careful selection of components, all of the above design criteria were
met. The heart of the experimental apparatus was a 300 ml stainless steel stirred pressure vessel. This pressure vessel was capable of handling pressure up to 136 atm (2000 psi) and temperatures up to 350°C (662°F). The pressure vessels temperature was controlled by a PID controller hooked to a heating mantle that cradled the pressure vessel. The pressure vessels stirrer was coupled to a variable RPM torque sensing stirrer motor, which measured torque values as high as 70 N-cm (620 in-lbs). Viscosity could be qualitatively measured by monitoring the torque sensing stirrer motor. The shear rate could be controlled by varying the RPM of the torque sensing stirrer motor. Vessel pressure was measured by a 0-136 atm (0-2000 psi) pressure gauge, as well as a 0-408 atm (0-6000 psi) pressure transducer. Power to the pressure transducer was supplied by a 24VDC power supply. The exit die of the pressure vessel, through which the blowing agent escaped when the system was depressurized, was a pipe plug with a 1.00 mm (0.04 inch) hole drilled through its center. The exit die was connected to the pressure vessel though an air actuated bellows valve. The air actuated bellows valve allowed remote control of apparatus depressurization.
474

10
All data was recorded by a 22 bit USB data acquisition module, which was capable of differential measurements. Differential measurement allowed for direct measurement and recording of thermocouples in the vessel. The USB data acquisition module also logged stirrer RPM and stirrer torque. The vessel pressure was measured by the USB data acquisition module in the following way. The pressure transducer output a 4-20mA current that was proportional to the pressure, while the data acquisition system could only read voltage. This problem was solved by constructing a simple circuit, shown in Figure 1, which allowed current to be calculated from the voltage difference across the resistor. The resistance across the resistor was sufficiently small to ensure the pressure transducer output was unaffected. The experimental apparatus is presented in diagram form as Figure 2. A picture of the experimental apparatus, Figure 3, follows the diagram.
Figure 1 Circuit for converting transducer current to voltage signal
Figure 2 Diagram of experimental apparatus
475
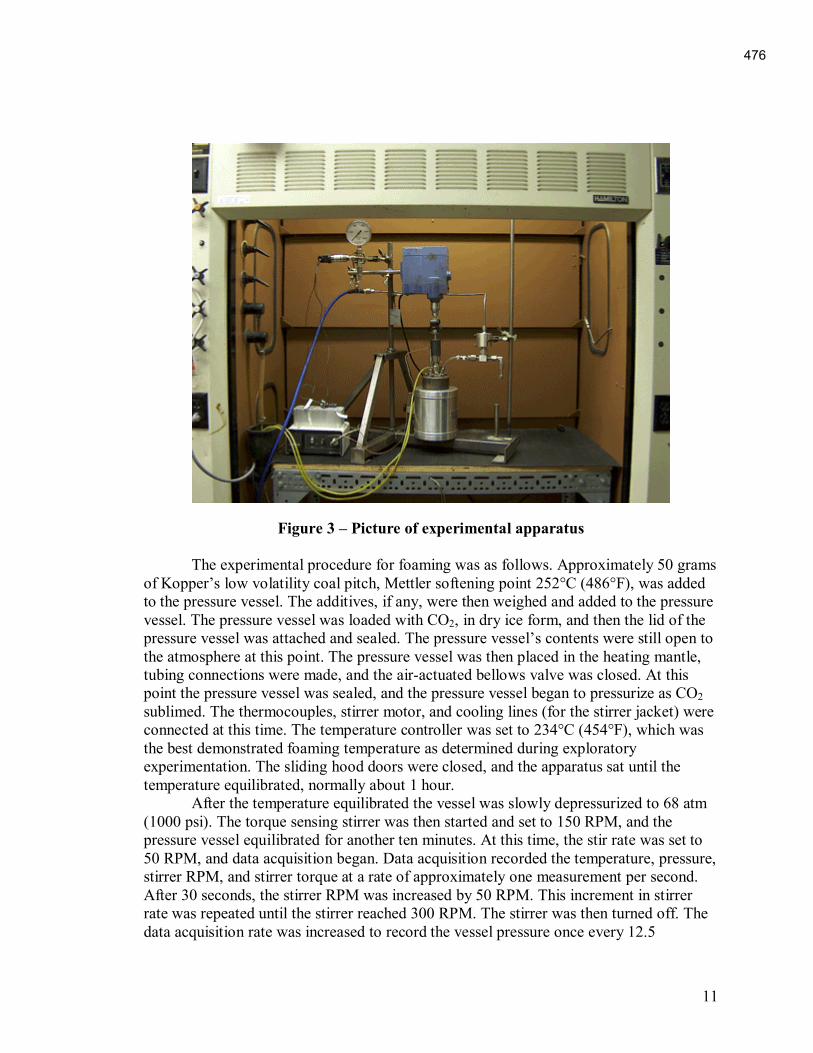
11
Figure 3 Picture of experimental apparatus
The experimental procedure for foaming was as follows. Approximately 50 grams of Koppers low volatility coal pitch, Mettler softening point 252°C (486°F), was added to the pressure vessel. The additives, if any, were then weighed and added to the pressure vessel. The pressure vessel was loaded with CO2, in dry ice form, and then the lid of the pressure vessel was attached and sealed. The pressure vessels contents were still open to the atmosphere at this point. The pressure vessel was then placed in the heating mantle, tubing connections were made, and the air-actuated bellows valve was closed. At this point the pressure vessel was sealed, and the pressure vessel began to pressurize as CO2 sublimed. The thermocouples, stirrer motor, and cooling lines (for the stirrer jacket) were connected at this time. The temperature controller was set to 234°C (454°F), which was the best demonstrated foaming temperature as determined during exploratory experimentation. The sliding hood doors were closed, and the apparatus sat until the temperature equilibrated, normally about 1 hour.
After the temperature equilibrated the vessel was slowly depressurized to 68 atm (1000 psi). The torque sensing stirrer was then started and set to 150 RPM, and the pressure vessel equilibrated for another ten minutes. At this time, the stir rate was set to 50 RPM, and data acquisition began. Data acquisition recorded the temperature, pressure, stirrer RPM, and stirrer torque at a rate of approximately one measurement per second. After 30 seconds, the stirrer RPM was increased by 50 RPM. This increment in stirrer rate was repeated until the stirrer reached 300 RPM. The stirrer was then turned off. The data acquisition rate was increased to record the vessel pressure once every 12.5
476

12
milliseconds. The air actuated bellows valve was opened, and the system rapidly depressurized. After vessel depressurization, data acquisition ceased. The pressure vessel was disconnected from the sitter and tubing, and water quenched to reduce foam coarsening. Quenching was necessary because the heat mass of the reactor was large compared to the heat mass of the pitch foam the pitch foam would have melted to liquid pitch if the vessel were not quenched. After the pressure vessel cooled, the lid was unbolted and the raw pitch foam was removed. A piece of raw pitch foam was cut into a cuboid. The cuboids dimensions were measured using digital calipers accurate to 0.01 mm. The weight was measured on a scale accurate to 0.1 mg. The density was calculated by dividing the weight of the cuboid by its volume. The foam was then stored until ready for air-stabilization. Immediately prior to air stabilization, the raw pitch foam was weighed in a watch glass. The pitch foam was then placed in an electric muffle furnace, and quickly heated to 100°C, and then heated to 400°C at a temperature ramp rate of 0.5°C per minute. The foam was held at 400°C for sixty minutes. The stabilized foam was again weighed, and the weight loss calculated. A piece of air-stabilized pitch foam was then cut into a small cuboid. The cuboids dimensions were measured, the weight was recorded, and the specific gravity was calculated. The foam samples were then stored until ready for carbonization.
Immediately prior to carbonization, the stabilized pitch foam samples were weighed. These stabilized foam samples were surrounded with steel wool, placed in a porcelain mug, and covered with a porcelain dish. The stabilized pitch foam was placed in a kiln under a nitrogen atmosphere, heated to a temperature of 400°C at a rate of 10°C per minute, then heated to 1000°C at rate of 1.0°C per minute. The foam was held at 1000°C for sixty minutes. After carbonization, the foam samples were weighed and the weight loss calculated. The carbonized cuboids dimensions were measured, the weight was recorded, and the specific gravity was calculated. The electrical resistances of all carbon foam samples were also measured using a Fluke 45 bench meter. Initially it was desired to use ASTM C 611-98, Standard Method for Electrical Resistance of Manufactured Carbon and Graphite Articles at Room Temperature2. However, the cuboids did not have the required aspect ratios, so a 4-point probe method was used, as illustrated in Figure 4.
477

13
Figure 4 Four point probe method to determine electrical resistance
478

14
Results and Discussions
Task I of the proposal was to create twenty-seven pitch foam samples from coal tar pitch, a blowing agent, and additives. The various pitch foams created during research are outlined in Table 1, the experimental matrix. After creation, these pitch foams were cut into small cuboids. The length, height, and width of the pitch foam cuboids were measured with a pair of digital calipers that were accurate to 0.01 mm. These pitch foam cuboids were weighed on a scale accurate to 0.1 mg. The specific gravity of the pitch foam was then calculated by dividing the cuboid weight by the cuboid volume. The specific gravities of the raw pitch foams appear below in Figure 5.
Figure 5 Pitch foam specific gravity Ferrocene affected the specific gravity of the pitch foam. It was hypothesized that ferrocene, a liquid at the foaming temperature and pressure, acted as an additional blowing agent. It was observed that some ferrocene lined the exit stream of the foaming vessel after depressurization, suggesting that some of it left the solution while the pitch precursor was forming. Silica did not appear to have a strong effect of pitch foam specific gravity. After the specific gravities of the pitch foam pieces were calculated and the pitch foams were examined via SEM (discussed later), the pitch foams were ready for air stabilization.
479
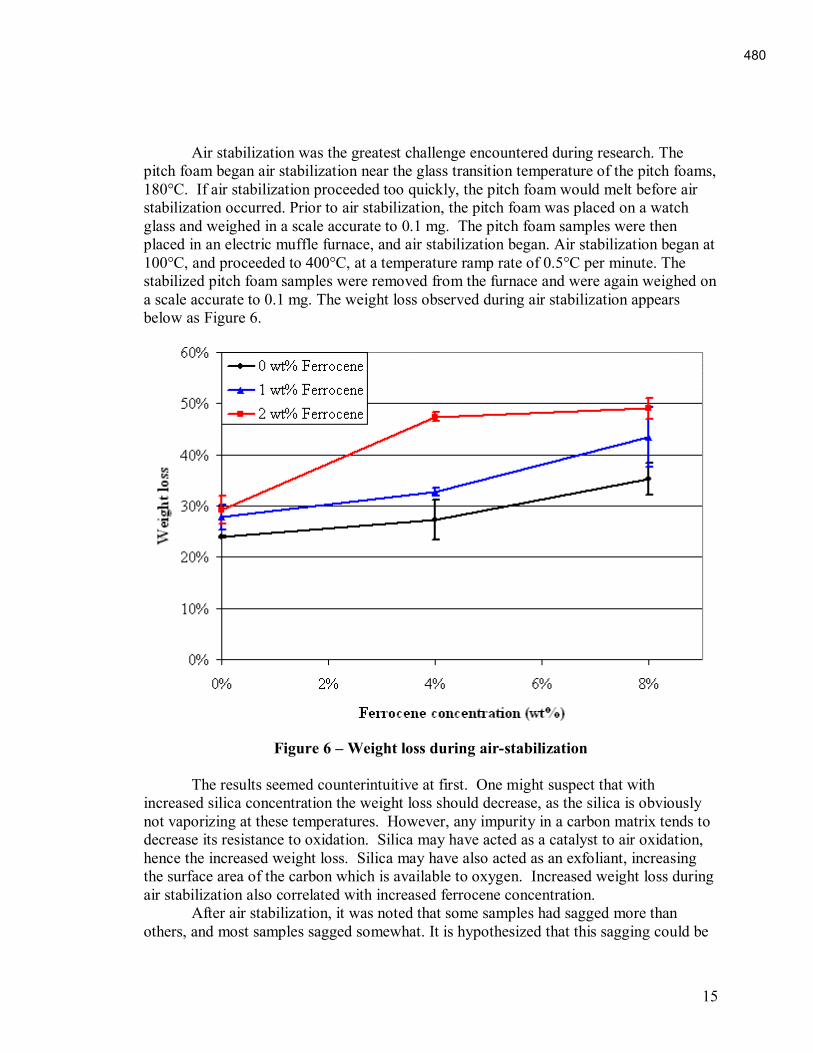
15
Air stabilization was the greatest challenge encountered during research. The pitch foam began air stabilization near the glass transition temperature of the pitch foams, 180°C. If air stabilization proceeded too quickly, the pitch foam would melt before air stabilization occurred. Prior to air stabilization, the pitch foam was placed on a watch glass and weighed in a scale accurate to 0.1 mg. The pitch foam samples were then placed in an electric muffle furnace, and air stabilization began. Air stabilization began at 100°C, and proceeded to 400°C, at a temperature ramp rate of 0.5°C per minute. The stabilized pitch foam samples were removed from the furnace and were again weighed on a scale accurate to 0.1 mg. The weight loss observed during air stabilization appears below as Figure 6.
Figure 6 Weight loss during air-stabilization
The results seemed counterintuitive at first. One might suspect that with increased silica concentration the weight loss should decrease, as the silica is obviously not vaporizing at these temperatures. However, any impurity in a carbon matrix tends to decrease its resistance to oxidation. Silica may have acted as a catalyst to air oxidation, hence the increased weight loss. Silica may have also acted as an exfoliant, increasing the surface area of the carbon which is available to oxygen. Increased weight loss during air stabilization also correlated with increased ferrocene concentration. After air stabilization, it was noted that some samples had sagged more than others, and most samples sagged somewhat. It is hypothesized that this sagging could be
480

16
completely eliminated by using a pitch with a higher softening point. Because the foam had sagged during air stabilization, the foam pieces were again trimmed into cuboids. The length, height, and width of the stabilized pitch foams were measured with a pair of digital calipers that were accurate to 0.01 mm. The cuboids were weighed on a scale accurate to 0.1 mg. The specific gravity was calculated by dividing the weight of the cuboid by the volume of the cuboid. The specific gravities of air stabilized pitch foams as a function of ferrocene and silica loading is presented below as Figure 7.
Figure 7 Air stabilized foam specific gravity Note that samples which contained no ferrocene or silica have approximately the same density as their raw pitch foam counterparts even though they lost approximately 25% of their mass during air stabilization. The density decrease provided by weight loss during air stabilization was offset by the density increase due to sagging, which also occurred during air stabilization. It was observed that samples containing silica and ferrocene held their shape much better during air stabilization. Thus, they had lower specific gravities because of the weight loss that occurred during air stabilization. It was concluded that using ferrocene and or silica during air stabilization is an effective tool to combat sagging. It was also observed that the effects appeared to be additive, adding silica and ferrocene was superior to adding either alone. There appeared to be an optimum silica concentration somewhere around 4 wt. %. If there is less silica, the pitch foam sags during air stabilization. If there is more silica, the stabilized pitch foam may
481

17
eventually approach the specific gravity of silica, which is 2.3. After air stabilization, the next processing step was to carbonize the air stabilized pitch foam samples Prior to carbonization, the stabilized pitch foam pieces were weighed on a scale accurate to 0.1mg. The air stabilized pitch foam was surrounded with steel wool, as an extra precaution to prevent oxidation. The air stabilized pitch foam was then placed in a porcelain mug, and covered with a porcelain dish. The porcelain cups were placed in a kiln, under a nitrogen atmosphere. The kiln was heated from room temperature to 400°C at a rate of 10°C per minute, and then heated to 1000°C at rate of 1.0°C per minute. The foam was held at 1000°C for sixty minutes. After carbonization, the foam samples were weighed on a balance accurate to 0.1 mg and the weight loss calculated. The weight loss observed during carbonization is presented below as Figure 8.
Figure 8 Weight loss during carbonization Little weight loss was observed during carbonization, likely due to an air stabilization temperature that was too high. Weight loss during carbonization seemed mild irrespective of ferrocene and or silica concentration. The completion of carbonization marked the end of Task II as outlined in the original proposal. Carbonization proved that carbon foams could be created from pitch foams.
482

18
SEM pictures of a pitch foam, an air stabilized foam, and carbonized foam are
presented below as Figure 9, Figure 10, and Figure 11, respectively3.
Figure 9 SEM picture of pitch foam3 Some pitch foams contained pores that were smaller or larger than those illustrated in Figure 93. Other pitch foams were less dense or more dense than the pitch foam illustrated in Figure 93. However, the pitch foam in Figure 9 was fairly representative of the average pitch foam created during research. The appearance of pitch foam could differ significantly from its air stabilized counterpart though. A SEM picture of an air stabilized pitch foam follows as Figure 103.
483

19
Figure 10 SEM picture of air stabilized pitch foam3 Some of the porosity present in the pitch foam was lost due to sagging that occurred during air stabilization. The SEM picture of the air stabilized pitch foam looks more dense and collapsed than the SEM picture of the pitch foam3. This trend was not observed for all air stabilized pitch foams, some held their shape much better than others. The following SEM picture represents a carbon foam that held its shape and structure relatively well during air stabilization and carbonization3.
484

20
Figure 11 SEM picture of carbonized pitch foam3 Stress cracks in the carbon foams bulk structure and pores are probably due to uneven expansion and contraction during carbonization. Despite these cracks, the foam appears to retain most of its structure.
As was earlier stated, more than originally envisioned was completed during research. An additional carbon foam property quantified during research was the electrical resistivity of carbon foam samples. Electrical resistivity was measured using a 4-point probe method, as discussed in the Experimental section and as illustrated in Figure 4. The electrical resistance of the carbon foam samples is presented below in Figure 12
485

21
Figure 12 Resistance of carbon foam samples The electrical resistance of carbon foam samples was around 200 kΩ-cm to 800
kΩ-cm. The electrical resistance followed approximately the same trend as specific gravity, although the resistance data was more variable. Another exciting research result was the demonstration of some control over foam morphology. The technology of producing carbon foam from coal tar pitch and blowing agents has demonstrated control over foam dryness and pore size. The relative dryness of foam refers to the void space within the foam. Dry foams contain a lot of void space, while wet foams contain somewhat less. From a practical standpoint, control over foam dryness implied control over foam density. The lower density limit of the technology has not yet been established. Foams with densities as low as 0.15 g/cc (10 lb/ft3) have been produced. Figure 13 compares dry and wet foam diagrams to SEM pictures of pitch foams created during research3,4.
486

22
Figure 13 Wet and dry foam diagrams (top) vs. pitch foams (bottom) 3,4 In addition to control over foam density, the technology has demonstrated control over foam pore size. Pore sizes have covered over an order of magnitude, from 30 microns to 300 microns. This can be seen by comparing a relatively large pore, those of Figure 13, to a relatively small pore, illustrated in Figure 143.
487

23
Figure 14 Relatively small pitch foam pore3
The pore size was controlled by the depressurization rate of the experimental vessel. The depressurization rate of the experimental vessel was controlled by the exit die which was attached to the air actuated bellows valve, as illustrated in Figure 2. The smaller the exit die, the lower the observed depressurization rate. The vessel pressure was measured by a pressure transducer. The pressure transducers output was recorded via USB data acquisition. The USB data acquisition module was capable of recording a data point every 12.5 ms. This was necessary to capture fast changing variables such as the pressure of the vessel during depressurization. A graph of the vessel pressure as a function of time follows as Figure 15.
488

24
Figure 15 Depressurization rate of batch foaming apparatus
There were three unique zones observed during depressurization; a rapid pressure drop, a slight pressure rise, and a more subdued pressure drop. The reason for the slight pressure rise was unknown. The slight pressure rise was also observed by the physical pressure gauge attached to the pressure vessel the slight pressure rise was real and not an artifact of the pressure transducer or USB data acquisition system. The slight pressure rise may have been due to the operation of the air actuated bellows valve or by CO2 as it underwent a transition from super critical to sub critical. The depressurization rate of the vessel was calculated as the slope of the line(s). The maximum depressurization rate was calculated as 15.1 MPa/s. The measured depressurization rate was consistent with depressurization rates measured by other researchers using batch foaming vessels and supercritical CO2
5. A depressurization rate of 15 MPa/s was far below the approximately 1 GPa/s depressurization rates provided by an extruder. It was hypothesized that pores much smaller than 30 microns could have been produced as depressurization rates increased.
Immediately following depressurization the foaming vessel was removed and water quenched, to reduce coarsening. Coarsening was when small bubbles were consumed to form large bubbles. Foam coarsening occurred because large bubbles are thermodynamically preferred over small bubbles. Coarsening was particularly hard to combat in the batch vessel, because it was a large heat mass and the pitch foam acted as an insulator. The pitch foam on the outer edge of the vessel cooled relatively quickly,
489

25
while the pitch foam towards the center of the vessel remained liquid like for approximately five minutes. The effects of coarsening were easily observed by comparing the morphology of two pitch foams from different parts of the foaming vessel. Figure 16 and Figure 17 are SEM photos of pitch foam from the same experimental run3. The pores of the pitch foam that had time to coarsen were approximately an order of magnitude larger than the pores of the pitch foam that cooled quickly. Even the pitch foam pieces which were cooled relatively quickly had approximately half a minute or longer to coarsen. It is thus believed that smaller pores will be observed when the pitch foam is cooled more quickly.
Figure 16 Pitch foam piece near edge of pressure vessel3
490

26
Figure 17 Pitch foam piece near center of pressure vessel3
Literature searches suggested some methods to minimize foam coarsening. Using a mixed gas, perhaps 95% CO2 and 5% N2 may have reduced foam coarsening. This is because even small additions of a relatively insoluble gas may have reduced coarsening, due to differences in how the gases would have permeated through cell barriers6.
Another accomplishment of this research was the qualitative measure of the viscosity of the pitch blowing agent solution (pitch foam precursor). Viscosity was important because it determined whether the solution would form pitch foam when depressurized. Viscosity also determined how the pitch foam held its shape while vitrifying. If the viscosity was too low, the pitch foam immediately collapsed after foaming. If the viscosity was too high, the pitch foam precursor was too rigid to foam. The viscosity was measured qualitatively by measuring the amount of torque required to stir the pitch foam precursor solution at various shear rates (RPM). A graph illustrating the torque required to stir the pitch foam precursor at various shear rates is presented below as Figure 18.
491
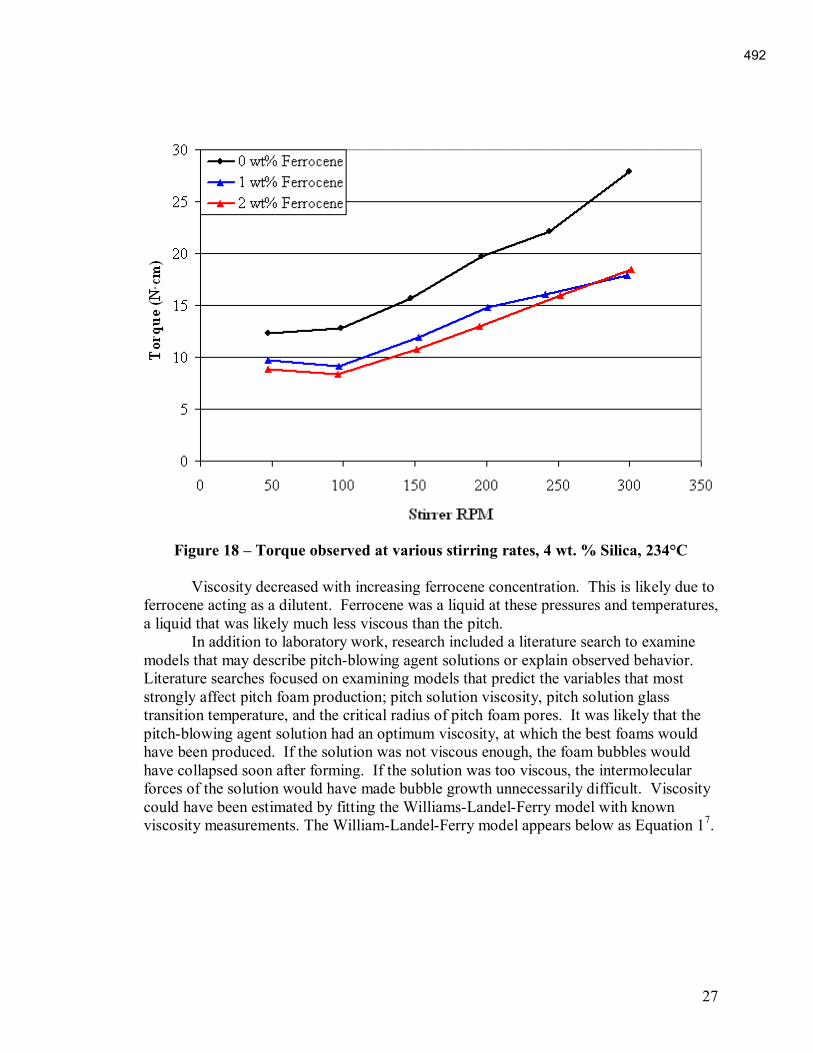
27
Figure 18 Torque observed at various stirring rates, 4 wt. % Silica, 234°C Viscosity decreased with increasing ferrocene concentration. This is likely due to ferrocene acting as a dilutent. Ferrocene was a liquid at these pressures and temperatures, a liquid that was likely much less viscous than the pitch.
In addition to laboratory work, research included a literature search to examine models that may describe pitch-blowing agent solutions or explain observed behavior. Literature searches focused on examining models that predict the variables that most strongly affect pitch foam production; pitch solution viscosity, pitch solution glass transition temperature, and the critical radius of pitch foam pores. It was likely that the pitch-blowing agent solution had an optimum viscosity, at which the best foams would have been produced. If the solution was not viscous enough, the foam bubbles would have collapsed soon after forming. If the solution was too viscous, the intermolecular forces of the solution would have made bubble growth unnecessarily difficult. Viscosity could have been estimated by fitting the Williams-Landel-Ferry model with known viscosity measurements. The William-Landel-Ferry model appears below as Equation 17.
492

28
Equation 1 Williams-Landel-Ferry viscosity model for polymers
−+
−=
r
r
TTCTTC
T2
10
)(exp)( µµ
Here µ is the viscosity, C1 and C2 are constants, and Tr is the reference temperature. C1 and C2 are calculated by fitting experimental data to Equation 1. Equation 1 alone would not be sufficient to model the pitch-blowing agent solution. The glass transition temperature of the pitch, Tg, changed as the blowing agent dissolved into the pitch. Therefore, even at a constant temperature, the viscosity of the pitch-blowing agent solution was constantly changing as the solution was depressurized and the pitch began to foam. The change in the glass transition temperature as a function of the blowing agent concentration may have been predicted by the T.S. Chow model, presented as Equation 28. Equation 2 T.S. Chow model predicting Tg
( ) ( )[ ]θθθθβ ln1ln1ln0
+−−=
g
gm
TT
Where
pp CMzR∆
=β
( )11
1
1 ωω
θ−
=zMM p
Tg0 is the glass transition temperature of the blowing agent free pitch Tgm is the glass transition temperature of the pitch-blowing agent solution z is the coordination number R is the universal gas constant Mp is the molecular weight of the polymer repeating unit ∆Cp is the molar heat capacity jump at the glass transition temperature ω1 is the weight fraction of the penetrant M1 is the molecular weight of the penetrant molecule It would be necessary to obtain the weight fraction of the blowing agent before the new glass transition temperature can be calculated, which was beyond the scope of research as outlined in the original proposal.
493

29
Further literature searches were conducted to explore alternative methods to control the pore size of the pitch foam. The depressurization rate had been the only controller of pore size. However, literature suggested that changing the surface tension of the pitch may have been an easier way to control the pore size of the pitch foam9. Bubbles forming in the pitch as the blowing agent leaves must reach a certain radius to continue growing, or, they will collapse. This radius is known as the critical radius the equation for the critical radius is presented as Equation 3. Equation 3 Critical radius of nucleating bubbles
PRc ∆
= σ2
Decreasing the surface tension of the pitch should have been possible through the use of surfactants such as sodium lauryl ether sulfate. Knowledge of the existence of a critical radius explained why pore sizes of foams produced earlier were not yet microcellular. Doubling the blowing agent pressure only halved the critical radius. It is likely that future work will examine modifying the surface tension of the pitch. The above equations and completed research suggested that there were processing limits outside of which foam would not have been formed. Outside of these limits, the pitch-blowing agent solution would have failed to foam for various reasons. These conditions outlined what has been coined a foaming envelope, presented as Figure 19.
Figure 19 Foaming envelope
494

30
If too little blowing agent was dissolved in the pitch, either by low system pressure or high system temperature, a dense cake would have been formed rather than foam. The final product would have been similar to Swiss cheese, it would have contained porosity, but not enough to have been classified as foam. If pitch Tg increased (which would have eased air stabilization), the solubility of CO2 in pitch would have decreased. Thus, operation with higher softening point pitches would have required higher CO2 operating pressures. However, as the system pressure is increased, the glass transition temperature of foam is decreased. Therefore, a pitch which may have been glassy at a set system temperature could have become liquid like as more blowing agent dissolved into the pitch. If other parameters remained equal, high pressures would have resulted in more CO2 being dissolved in the pitch, which would have lead to dryer (less dense) foam.
In summary, research progressed steadily and accomplished more than originally envisioned. The research accomplished the two tasks of the original proposal; to create various pitch foams and to transform them into carbon foams. The research also quantified other physical properties of carbon foam, such as specific gravity and electrical resistivity. Additionally, research demonstrated control over foam morphology. The density and the pore size of carbon foams should be independently controllable. The depressurization rate of the foaming vessel was measured, and found to agree with other researchers who have used batch foaming vessels and supercritical carbon dioxide as a blowing agent5. Information concerning the shear behavior of the pitch and blowing agent solution was also collected, which will be valuable when the process is scaled. Finally, literature examined during research suggested several models that may have explained observed results and suggested possible process improvements.
495

31
Conclusion Research progressed steadily and finished on schedule. The major research accomplishment was the creation of carbon foams from pitch foams. Pitch foams were created from low cost precursors coal tar pitch and a carbon dioxide blowing agent. This production method treated coal tar pitch as a thermoplastic, which suggested that existing thermoplastics processing technology could be used to create carbon foam precursors. This suggested the potential for an unprecedented level of control over the morphology and physical properties of carbon foam. Morphological properties such as wetness/dryness, cell size, and cell connectedness should be independently variable. Physical properties such as strength, density, electrical resistivity, and acoustic properties should also be independently variable. Carbon foam could be tailor made to consumer needs at an attractive price using well established thermoplastic processing technology.
Extruders and injection molders could create pitch foam of various shapes and sizes, pitch foams that would then be transformed into carbon foams through air-stabilization and carbonization. Extrusion and injection molding would minimize the waste and machining costs associated with machining a large block of carbon foam into a smaller shape. There are many potential applications for carbon foam made with this technology; capacitors and batteries, energy attenuating panels for automobile interiors, furnace insulation, RF shielding panels, acoustical insulators, and many more. In summary, the research moved the above described technology closer to commercialization. An experimental design that was included in the research created several combinations of pitch foams that served as carbon foam precursors. An experimental apparatus designed specifically for the research was used to collect important operating data that will be useful when the technology is scaled. The pitch foams produced in this apparatus were transformed into carbon foams by air-stabilization and carbonization, proving that carbon foams can be made from pitch foams. Furthermore, physical properties of the foams such as density and electrical resistivity, were quantified. This data illustrated the relationships between pitch foams and their resultant carbon foams.
496

32
References 1 Reiner, M., and Scott Blair, Rheology terminology, in Rheology, Vol. 4 pp. 461 2 ASTM C 611-98, p 18 3 West Virginia University SEM, for more info contact Elliot Kennel, (304) 692 5830 4 D. Weaire, S. Hutzler, in: The Physics of foams, Oxford University Press, New Ed edition, pp. 7-8, (2001) 5 X. Han, C. Zeng, L.J. Lee, K.W. Koelling, and D.L. Tomasko, Polymer Engineering and Science, June 2003, Vol. 43, No. 6, pg. 1264 6 D. Weaire, S. Hutzler, in: The Physics of foams, Oxford University Press, New Ed edition, pp 100-101, (2001) 7 S.T. Lee, Foam Extrusion, Technomic Publishing Company, p 47, (2000) 8 S.T. Lee, Foam Extrusion, Technomic Publishing Company, p 48, (2000) 9 S.T. Lee, Foam Extrusion, Technomic Publishing Company, p 86, (2000)
497

App
endi
x A
.1
Wei
ght l
oss d
urin
g ai
r st
abili
zatio
n
Pi
tch
foam
wei
ghts
Ai
r sta
biliz
ed fo
am w
eigh
ts
Leve
ls
W
eigh
t (gr
ams)
B
efor
e Af
ter
Silic
a Fe
rroc
ene
Rep
licat
e
Pitc
h Si
lica
Ferr
ocen
e To
tal
W
t. (g
) W
t. (g
) w
t. lo
ss
aver
age
0%
0%
1
0
0 0
39
.53
38.1
0 4%
24
%
0%
0%
2
50.1
1 0.
00
0.00
50
.11
47
.75
36.5
0 24
%
0.00
37
0%
0%
3
52.1
6 0.
00
0.00
52
.16
50
.88
38.5
2 24
%
0.21
%
0%
1%
1
49.4
0 0.
00
0.50
49
.90
48
.28
36.0
8 25
%
28%
0%
1%
2
50
.85
0.00
0.
51
51.3
6
49.7
0 37
.75
24%
0.
0499
0%
1%
3
50
.18
0.00
0.
52
50.7
0
48.3
8 31
.92
34%
2.
37%
0%
2%
1
50
.02
0.00
1.
00
51.0
2
49.3
4 37
.01
25%
29
%
0%
2%
2
50.2
1 0.
00
1.02
51
.23
49
.57
31.1
6 37
%
0.05
86
0%
2%
3
50.1
6 0.
00
1.00
51
.16
49
.10
36.6
2 25
%
2.78
%
4%
0%
1
50.5
2 1.
99
0.00
52
.51
49
.80
36.2
8 27
%
27%
4%
0%
2
49
.94
1.94
0.
00
51.8
8
50.0
1 32
.27
35%
0.
0819
4%
0%
3
52
.08
2.01
0.
00
54.0
9
51.2
5 41
.47
19%
3.
89%
4%
1%
1
48
.70
2.00
0.
50
51.2
0
49.9
9 38
.02
24%
33
%
4%
1%
2
49.6
0 2.
11
0.51
52
.22
50
.33
30.8
0 39
%
0.01
68
4%
1%
3
49.7
0 2.
04
0.50
52
.24
49
.58
32.0
1 35
%
0.80
%
4%
2%
1
49.4
5 4.
01
0.50
53
.96
52
.68
38.1
6 28
%
47%
4%
2%
2
49
.60
4.01
0.
50
54.1
1
52.1
7 23
.25
55%
0.
0183
4%
2%
3
49
.70
4.01
0.
51
54.2
2
51.9
3 21
.24
59%
0.
87%
8%
0%
1
51
.46
3.97
0.
00
55.4
3
53.5
6 34
.43
36%
35
%
8%
0%
2
50.9
3 4.
10
0.00
55
.03
53
.70
31.3
1 42
%
0.06
64
8%
0%
3
50.6
8 4.
05
0.00
54
.73
53
.50
38.3
0 28
%
3.15
%
8%
1%
1
40.0
7 3.
21
0.41
43
.69
41
.96
20.2
6 52
%
43%
8%
1%
2
40
.34
3.21
0.
41
43.9
6
42.0
5 20
.37
52%
0.
1236
8%
1%
3
40
.08
3.23
0.
41
43.7
2
41.9
2 30
.67
27%
5.
87%
8%
2%
1
49
.70
3.97
1.
01
54.6
8
50.7
5 32
.34
36%
49
%
8%
2%
2
50.2
2 3.
98
1.00
55
.20
52
.81
21.2
3 60
%
0.04
347
8%
2%
3
50.1
6 4.
60
1.01
55
.77
49
.31
24.1
1 51
%
2.06
%
498

34
App
endi
x A
.2
Wei
ght l
oss d
urin
g ca
rbon
izat
ion
Air s
tabi
lized
pitc
h fo
am w
eigh
ts
C
arbo
nize
d pi
tch
foam
wei
ghts
Le
vels
Bef
ore
Afte
r
Bef
ore
Afte
r
Si
lica
Ferr
ocen
e R
eplic
ate
W
t. (g
) W
t. (g
) w
t. lo
ss
aver
age
W
t. (g
) W
t. (g
) w
t. lo
ss
aver
age
0%
0%
1
39.5
3 38
.10
4%
24%
5.
0%
0%
0%
2
47.7
5 36
.50
24%
0.
0037
36.7
4 34
.60
5.8%
0%
0%
3
50.8
8 38
.52
24%
0.
21%
39.1
0 37
.48
4.1%
0%
1%
1
48.2
8 36
.08
25%
28
%
36
.34
34.3
1 5.
6%
5.0%
0%
1%
2
49
.70
37.7
5 24
%
0.04
99
38
.28
36.1
8 5.
5%
0%
1%
3
48
.38
31.9
2 34
%
2.37
%
32
.41
31.1
7 3.
8%
0%
2%
1
49
.34
37.0
1 25
%
29%
37.1
8 35
.83
3.6%
3.
8%
0%
2%
2
49.5
7 31
.16
37%
0.
0586
31.7
7 30
.60
3.7%
0%
2%
3
49.1
0 36
.62
25%
2.
78%
35.0
4 33
.59
4.1%
4%
0%
1
49.8
0 36
.28
27%
27
%
36
.13
34.9
0 3.
4%
4.4%
4%
0%
2
50
.01
32.2
7 35
%
0.08
19
31
.99
30.2
7 5.
4%
4%
0%
3
51
.25
41.4
7 19
%
3.89
%
41
.43
39.5
8 4.
5%
4%
1%
1
49
.99
38.0
2 24
%
33%
38.4
1 36
.73
4.4%
4.
7%
4%
1%
2
50.3
3 30
.80
39%
0.
0168
31.2
1 29
.63
5.1%
4%
1%
3
49.5
8 32
.01
35%
0.
80%
32.3
8 30
.88
4.6%
4%
2%
1
52.6
8 38
.16
28%
47
%
38
.45
37.1
2 3.
5%
4.9%
4%
2%
2
52
.17
23.2
5 55
%
0.01
83
23
.62
22.2
9 5.
6%
4%
2%
3
51
.93
21.2
4 59
%
0.87
%
21
.50
20.3
0 5.
6%
8%
0%
1
53
.56
34.4
3 36
%
35%
34.2
7 32
.56
5.0%
4.
3%
8%
0%
2
53.7
0 31
.31
42%
0.
0664
31.9
2 30
.55
4.3%
8%
0%
3
53.5
0 38
.30
28%
3.
15%
39.4
8 38
.02
3.7%
8%
1%
1
41.9
6 20
.26
52%
43
%
20
.78
19.5
9 5.
7%
5.3%
8%
1%
2
42
.05
20.3
7 52
%
0.12
36
20
.91
19.7
7 5.
5%
8%
1%
3
41
.92
30.6
7 27
%
5.87
%
31
.16
29.6
8 4.
7%
8%
2%
1
50
.75
32.3
4 36
%
49%
22.8
5 22
.06
3.5%
9.
6%
8%
2%
2
52.8
1 21
.23
60%
0.
0434
7
30.8
2 26
.58
14%
8%
2%
3
49.3
1 24
.11
51%
2.
06%
25.4
8 22
.49
12%
499

35
App
endi
x B
.1
Den
sity
dat
a fo
r pi
tch
foam
Raw
pitc
h fo
am
Si
lica
Ferr
ocen
e R
eplic
ate
Leng
th (m
m)
Wid
th (m
m)
Hei
ght (
mm
) M
ass
(g)
SG
Aver
age
STD
EVP
90%
CI
Low
Lo
w
1 14
.27
11.1
1 9.
20
0.65
95
0.45
2 0.
392
0.04
8 0.
023
Low
Lo
w
2 9.
72
8.38
7.
73
0.24
43
0.38
8
Low
Lo
w
3 21
.08
20.5
8 19
.22
2.79
49
0.33
5
Low
M
ed
1 14
.51
14.4
4 9.
69
0.95
07
0.46
8 0.
474
0.02
1 0.
010
Low
M
ed
2 14
.77
13.2
0 8.
13
0.79
77
0.50
3
Low
M
ed
3 11
.93
11.9
3 5.
85
0.37
61
0.45
2
Low
H
igh
1 14
.37
13.3
3 10
.38
1.01
57
0.51
1 0.
450
0.06
9 0.
033
Low
H
igh
2 13
.63
13.3
5 12
.37
1.09
40
0.48
6
Low
H
igh
3 11
.95
11.4
4 11
.28
0.54
51
0.35
3
Med
Lo
w
1 14
.96
12.1
6 12
.10
1.49
98
0.68
1 0.
554
0.09
5 0.
045
Med
Lo
w
2 15
.96
15.0
5 12
.15
1.32
58
0.45
4
Med
Lo
w
3 18
.66
13.4
5 12
.92
1.70
60
0.52
6
Med
M
ed
1 16
.62
16.0
1 10
.10
1.11
87
0.41
6 0.
455
0.05
1 0.
024
Med
M
ed
2 17
.11
16.1
0 9.
96
1.15
96
0.42
3
Med
M
ed
3 12
.99
12.8
5 9.
57
0.84
15
0.52
7
Med
H
igh
1 16
.26
15.8
7 11
.92
1.50
52
0.48
9 0.
424
0.05
0 0.
024
Med
H
igh
2 13
.34
11.8
8 8.
02
0.46
94
0.36
9
Med
H
igh
3 17
.53
9.13
8.
44
0.55
88
0.41
4
Hig
h Lo
w
1 15
.45
15.1
1 14
.54
1.56
70
0.46
2 0.
518
0.04
9 0.
023
Hig
h Lo
w
2 20
.00
14.3
8 13
.24
1.94
36
0.51
0
Hig
h Lo
w
3 17
.35
16.7
3 12
.68
2.14
01
0.58
1
Hig
h M
ed
1 15
.21
14.9
8 6.
70
0.68
47
0.44
9 0.
466
0.01
3 0.
006
Hig
h M
ed
2 18
.09
14.8
7 8.
19
1.03
47
0.47
0
Hig
h M
ed
3 21
.04
9.67
8.
20
0.80
14
0.48
0
Hig
h H
igh
1 15
.35
11.5
0 8.
96
0.72
99
0.46
1 0.
484
0.03
7 0.
017
Hig
h H
igh
2 14
.30
12.6
9 10
.79
1.04
90
0.53
6
Hig
h H
igh
3 13
.15
12.5
7 12
.34
0.92
76
0.45
5
500
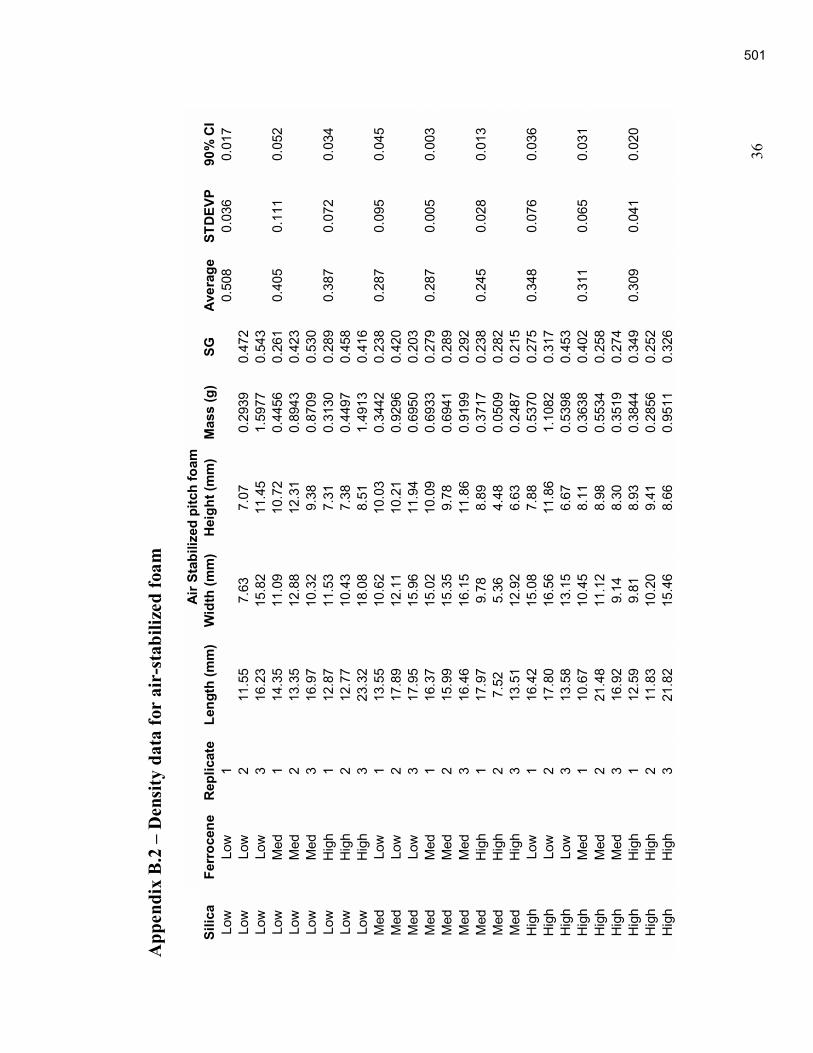
36
App
endi
x B
.2
Den
sity
dat
a fo
r ai
r-st
abili
zed
foam
Air S
tabi
lized
pitc
h fo
am
Si
lica
Ferr
ocen
e R
eplic
ate
Leng
th (m
m)
Wid
th (m
m)
Hei
ght (
mm
) M
ass
(g)
SG
Aver
age
STD
EVP
90%
CI
Low
Lo
w
1
0.50
8 0.
036
0.01
7 Lo
w
Low
2
11.5
5 7.
63
7.07
0.
2939
0.
472
Lo
w
Low
3
16.2
3 15
.82
11.4
5 1.
5977
0.
543
Lo
w
Med
1
14.3
5 11
.09
10.7
2 0.
4456
0.
261
0.40
5 0.
111
0.05
2 Lo
w
Med
2
13.3
5 12
.88
12.3
1 0.
8943
0.
423
Lo
w
Med
3
16.9
7 10
.32
9.38
0.
8709
0.
530
Lo
w
Hig
h 1
12.8
7 11
.53
7.31
0.
3130
0.
289
0.38
7 0.
072
0.03
4 Lo
w
Hig
h 2
12.7
7 10
.43
7.38
0.
4497
0.
458
Lo
w
Hig
h 3
23.3
2 18
.08
8.51
1.
4913
0.
416
M
ed
Low
1
13.5
5 10
.62
10.0
3 0.
3442
0.
238
0.28
7 0.
095
0.04
5 M
ed
Low
2
17.8
9 12
.11
10.2
1 0.
9296
0.
420
M
ed
Low
3
17.9
5 15
.96
11.9
4 0.
6950
0.
203
M
ed
Med
1
16.3
7 15
.02
10.0
9 0.
6933
0.
279
0.28
7 0.
005
0.00
3 M
ed
Med
2
15.9
9 15
.35
9.78
0.
6941
0.
289
M
ed
Med
3
16.4
6 16
.15
11.8
6 0.
9199
0.
292
M
ed
Hig
h 1
17.9
7 9.
78
8.89
0.
3717
0.
238
0.24
5 0.
028
0.01
3 M
ed
Hig
h 2
7.52
5.
36
4.48
0.
0509
0.
282
M
ed
Hig
h 3
13.5
1 12
.92
6.63
0.
2487
0.
215
H
igh
Low
1
16.4
2 15
.08
7.88
0.
5370
0.
275
0.34
8 0.
076
0.03
6 H
igh
Low
2
17.8
0 16
.56
11.8
6 1.
1082
0.
317
H
igh
Low
3
13.5
8 13
.15
6.67
0.
5398
0.
453
H
igh
Med
1
10.6
7 10
.45
8.11
0.
3638
0.
402
0.31
1 0.
065
0.03
1 H
igh
Med
2
21.4
8 11
.12
8.98
0.
5534
0.
258
H
igh
Med
3
16.9
2 9.
14
8.30
0.
3519
0.
274
H
igh
Hig
h 1
12.5
9 9.
81
8.93
0.
3844
0.
349
0.30
9 0.
041
0.02
0 H
igh
Hig
h 2
11.8
3 10
.20
9.41
0.
2856
0.
252
H
igh
Hig
h 3
21.8
2 15
.46
8.66
0.
9511
0.
326
501
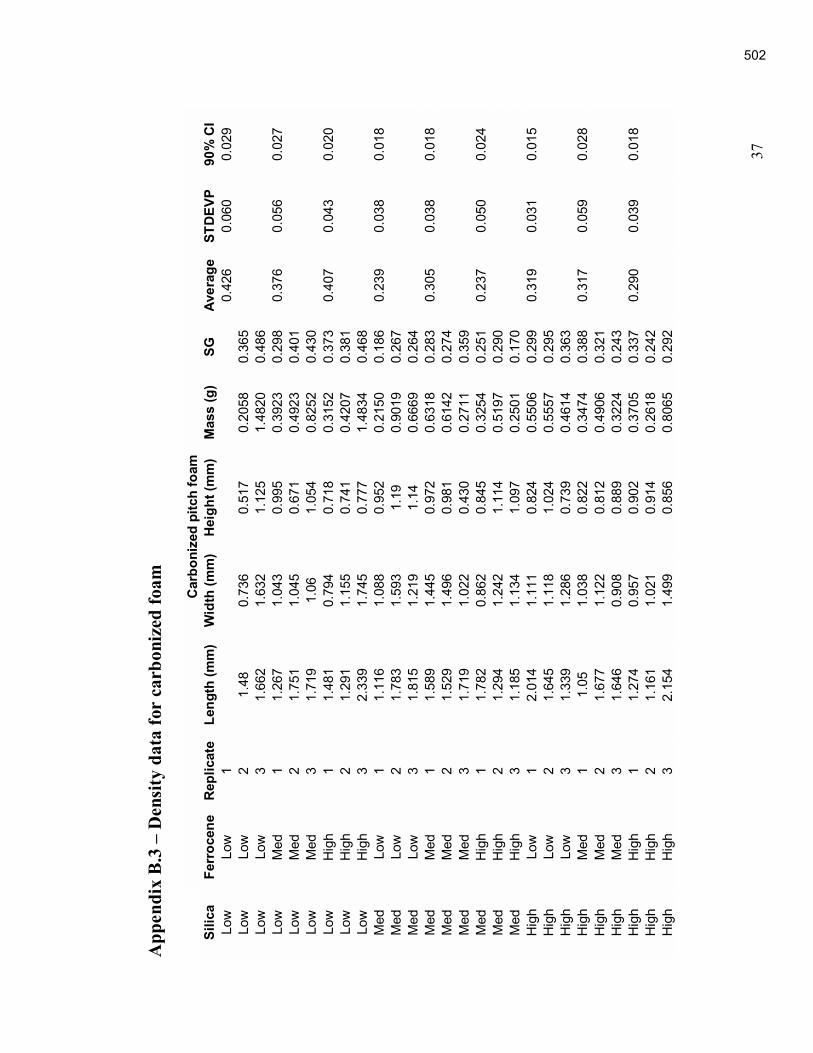
37
App
endi
x B
.3
Den
sity
dat
a fo
r ca
rbon
ized
foam
Car
boni
zed
pitc
h fo
am
Si
lica
Ferr
ocen
e R
eplic
ate
Leng
th (m
m)
Wid
th (m
m)
Hei
ght (
mm
) M
ass
(g)
SG
Aver
age
STD
EVP
90%
CI
Low
Lo
w
1
0.42
6 0.
060
0.02
9 Lo
w
Low
2
1.48
0.
736
0.51
7 0.
2058
0.
365
Lo
w
Low
3
1.66
2 1.
632
1.12
5 1.
4820
0.
486
Lo
w
Med
1
1.26
7 1.
043
0.99
5 0.
3923
0.
298
0.37
6 0.
056
0.02
7 Lo
w
Med
2
1.75
1 1.
045
0.67
1 0.
4923
0.
401
Lo
w
Med
3
1.71
9 1.
06
1.05
4 0.
8252
0.
430
Lo
w
Hig
h 1
1.48
1 0.
794
0.71
8 0.
3152
0.
373
0.40
7 0.
043
0.02
0 Lo
w
Hig
h 2
1.29
1 1.
155
0.74
1 0.
4207
0.
381
Lo
w
Hig
h 3
2.33
9 1.
745
0.77
7 1.
4834
0.
468
M
ed
Low
1
1.11
6 1.
088
0.95
2 0.
2150
0.
186
0.23
9 0.
038
0.01
8 M
ed
Low
2
1.78
3 1.
593
1.19
0.
9019
0.
267
M
ed
Low
3
1.81
5 1.
219
1.14
0.
6669
0.
264
M
ed
Med
1
1.58
9 1.
445
0.97
2 0.
6318
0.
283
0.30
5 0.
038
0.01
8 M
ed
Med
2
1.52
9 1.
496
0.98
1 0.
6142
0.
274
M
ed
Med
3
1.71
9 1.
022
0.43
0 0.
2711
0.
359
M
ed
Hig
h 1
1.78
2 0.
862
0.84
5 0.
3254
0.
251
0.23
7 0.
050
0.02
4 M
ed
Hig
h 2
1.29
4 1.
242
1.11
4 0.
5197
0.
290
M
ed
Hig
h 3
1.18
5 1.
134
1.09
7 0.
2501
0.
170
H
igh
Low
1
2.01
4 1.
111
0.82
4 0.
5506
0.
299
0.31
9 0.
031
0.01
5 H
igh
Low
2
1.64
5 1.
118
1.02
4 0.
5557
0.
295
H
igh
Low
3
1.33
9 1.
286
0.73
9 0.
4614
0.
363
H
igh
Med
1
1.05
1.
038
0.82
2 0.
3474
0.
388
0.31
7 0.
059
0.02
8 H
igh
Med
2
1.67
7 1.
122
0.81
2 0.
4906
0.
321
H
igh
Med
3
1.64
6 0.
908
0.88
9 0.
3224
0.
243
H
igh
Hig
h 1
1.27
4 0.
957
0.90
2 0.
3705
0.
337
0.29
0 0.
039
0.01
8 H
igh
Hig
h 2
1.16
1 1.
021
0.91
4 0.
2618
0.
242
H
igh
Hig
h 3
2.15
4 1.
499
0.85
6 0.
8065
0.
292
502
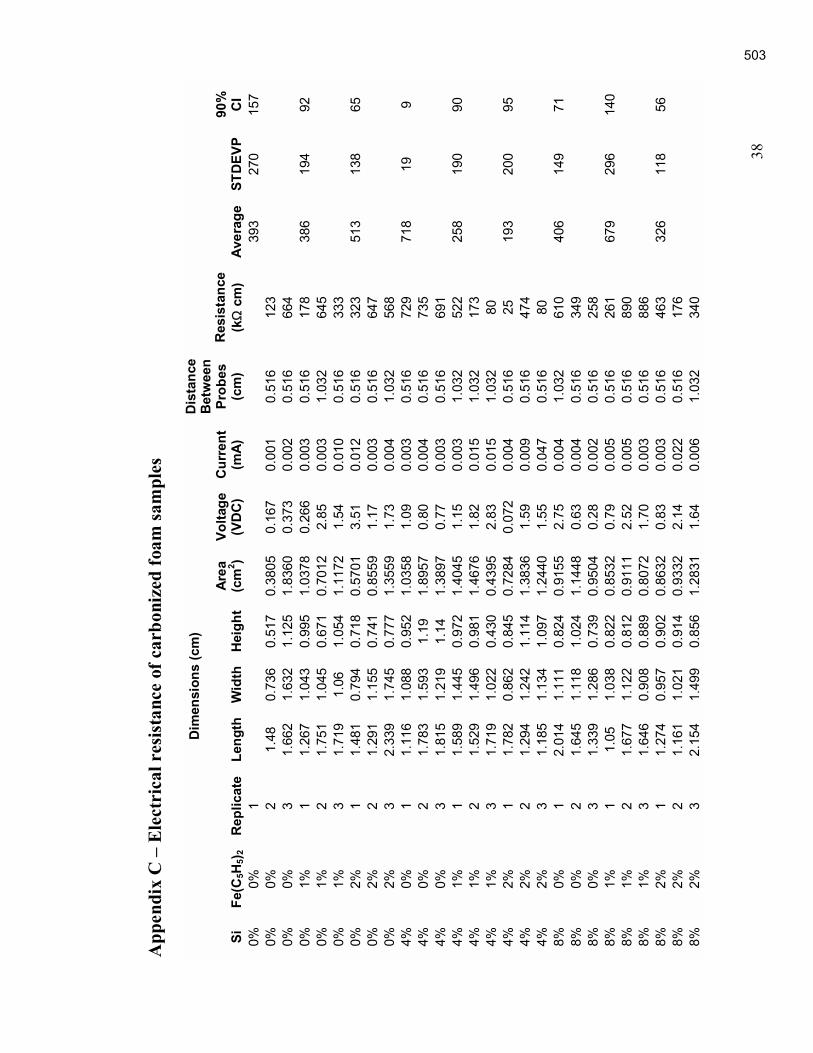
38
App
endi
x C
E
lect
rica
l res
ista
nce
of c
arbo
nize
d fo
am sa
mpl
es
Dim
ensi
ons
(cm
)
Si
Fe(C
5H5) 2
R
eplic
ate
Leng
thW
idth
Hei
ght
Area
(c
m2 )
Volta
ge
(VD
C)
Cur
rent
(m
A)
Dis
tanc
e B
etw
een
Prob
es
(cm
) R
esis
tanc
e (k
Ω c
m)
Aver
age
STD
EVP
90%
C
I 0%
0%
1
393
270
157
0%
0%
2 1.
48
0.73
6 0.
517
0.38
050.
167
0.00
1 0.
516
123
0%
0%
3
1.66
2 1.
632
1.12
5 1.
8360
0.37
3 0.
002
0.51
6 66
4
0%
1%
1 1.
267
1.04
3 0.
995
1.03
780.
266
0.00
3 0.
516
178
386
194
92
0%
1%
2 1.
751
1.04
5 0.
671
0.70
122.
85
0.00
3 1.
032
645
0%
1%
3
1.71
9 1.
06
1.05
4 1.
1172
1.54
0.
010
0.51
6 33
3
0%
2%
1 1.
481
0.79
4 0.
718
0.57
013.
51
0.01
2 0.
516
323
513
138
65
0%
2%
2 1.
291
1.15
5 0.
741
0.85
591.
17
0.00
3 0.
516
647
0%
2%
3
2.33
9 1.
745
0.77
7 1.
3559
1.73
0.
004
1.03
2 56
8
4%
0%
1 1.
116
1.08
8 0.
952
1.03
581.
09
0.00
3 0.
516
729
718
19
9 4%
0%
2
1.78
3 1.
593
1.19
1.
8957
0.80
0.
004
0.51
6 73
5
4%
0%
3 1.
815
1.21
9 1.
14
1.38
970.
77
0.00
3 0.
516
691
4%
1%
1
1.58
9 1.
445
0.97
2 1.
4045
1.15
0.
003
1.03
2 52
2 25
8 19
0 90
4%
1%
2
1.52
9 1.
496
0.98
1 1.
4676
1.82
0.
015
1.03
2 17
3
4%
1%
3 1.
719
1.02
2 0.
430
0.43
952.
83
0.01
5 1.
032
80
4%
2%
1
1.78
2 0.
862
0.84
5 0.
7284
0.07
2 0.
004
0.51
6 25
19
3 20
0 95
4%
2%
2
1.29
4 1.
242
1.11
4 1.
3836
1.59
0.
009
0.51
6 47
4
4%
2%
3 1.
185
1.13
4 1.
097
1.24
401.
55
0.04
7 0.
516
80
8%
0%
1
2.01
4 1.
111
0.82
4 0.
9155
2.75
0.
004
1.03
2 61
0 40
6 14
9 71
8%
0%
2
1.64
5 1.
118
1.02
4 1.
1448
0.63
0.
004
0.51
6 34
9
8%
0%
3 1.
339
1.28
6 0.
739
0.95
040.
28
0.00
2 0.
516
258
8%
1%
1
1.05
1.
038
0.82
2 0.
8532
0.79
0.
005
0.51
6 26
1 67
9 29
6 14
0 8%
1%
2
1.67
7 1.
122
0.81
2 0.
9111
2.52
0.
005
0.51
6 89
0
8%
1%
3 1.
646
0.90
8 0.
889
0.80
721.
70
0.00
3 0.
516
886
8%
2%
1
1.27
4 0.
957
0.90
2 0.
8632
0.83
0.
003
0.51
6 46
3 32
6 11
8 56
8%
2%
2
1.16
1 1.
021
0.91
4 0.
9332
2.14
0.
022
0.51
6 17
6
8%
2%
3 2.
154
1.49
9 0.
856
1.28
311.
64
0.00
6 1.
032
340
503
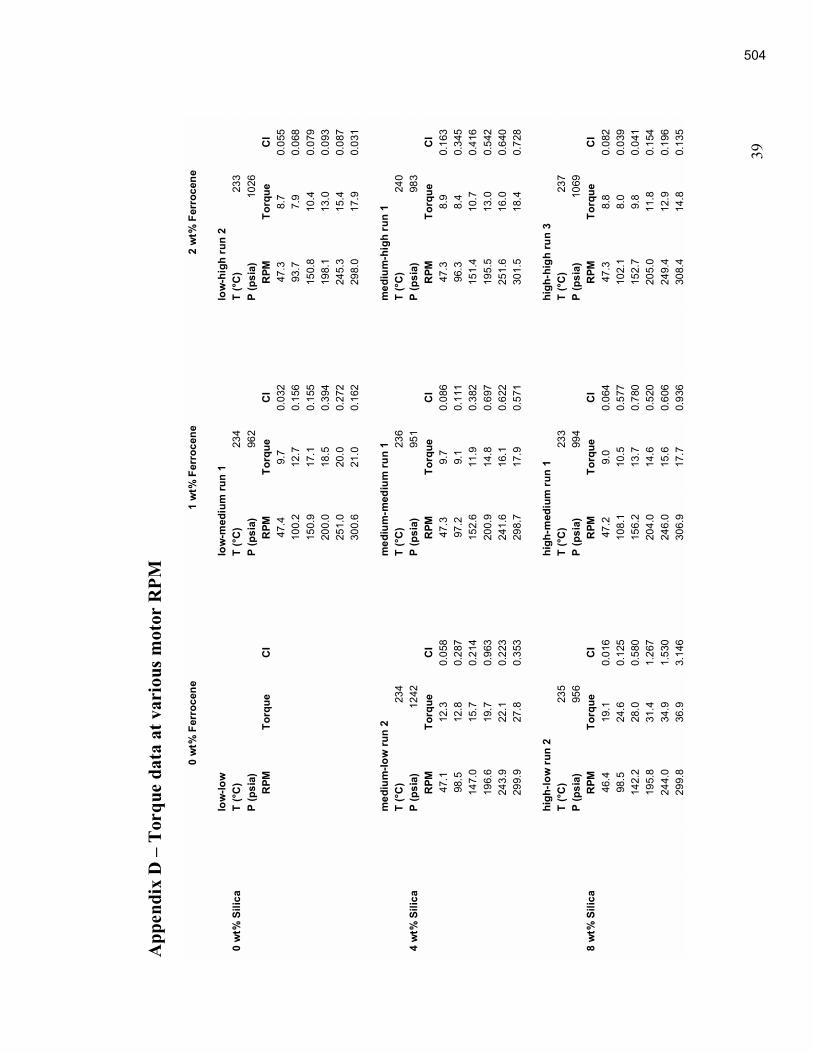
39
App
endi
x D
T
orqu
e da
ta a
t var
ious
mot
or R
PM
0 w
t% F
erro
cene
1 w
t% F
erro
cene
2 w
t% F
erro
cene
low
-low
low
-med
ium
run
1
lo
w-h
igh
run
2
0 w
t% S
ilica
T (°
C)
T
(°C
) 23
4
T
(°C
) 23
3
P (p
sia)
P (p
sia)
96
2
P
(psi
a)
1026
RPM
To
rque
C
I
RPM
To
rque
C
I
RPM
To
rque
C
I
47
.4
9.7
0.03
2
47.3
8.
7 0.
055
100.
2 12
.7
0.15
6
93.7
7.
9 0.
068
150.
9 17
.1
0.15
5
150.
8 10
.4
0.07
9
20
0.0
18.5
0.
394
19
8.1
13.0
0.
093
251.
0 20
.0
0.27
2
245.
3 15
.4
0.08
7
30
0.6
21.0
0.
162
29
8.0
17.9
0.
031
m
ediu
m-lo
w ru
n 2
med
ium
-med
ium
run
1
med
ium
-hig
h ru
n 1
T
(°C
) 23
4
T
(°C
) 23
6
T
(°C
) 24
0
4 w
t% S
ilica
P (p
sia)
12
42
P (p
sia)
95
1
P
(psi
a)
983
R
PM
Torq
ue
CI
R
PM
Torq
ue
CI
R
PM
Torq
ue
CI
47.1
12
.3
0.05
8
47.3
9.
7 0.
086
47
.3
8.9
0.16
3
98
.5
12.8
0.
287
97
.2
9.1
0.11
1
96.3
8.
4 0.
345
147.
0 15
.7
0.21
4
152.
6 11
.9
0.38
2
151.
4 10
.7
0.41
6
19
6.6
19.7
0.
963
20
0.9
14.8
0.
697
19
5.5
13.0
0.
542
243.
9 22
.1
0.22
3
241.
6 16
.1
0.62
2
251.
6 16
.0
0.64
0
29
9.9
27.8
0.
353
29
8.7
17.9
0.
571
30
1.5
18.4
0.
728
hi
gh-lo
w r
un 2
hi
gh-m
ediu
m r
un 1
hi
gh-h
igh
run
3
T (°
C)
235
T (°
C)
233
T (°
C)
237
P
(psi
a)
956
P (p
sia)
99
4
P
(psi
a)
1069
8 w
t% S
ilica
RPM
To
rque
C
I
RPM
To
rque
C
I
RPM
To
rque
C
I
46
.4
19.1
0.
016
47
.2
9.0
0.06
4
47.3
8.
8 0.
082
98.5
24
.6
0.12
5
108.
1 10
.5
0.57
7
102.
1 8.
0 0.
039
142.
2 28
.0
0.58
0
156.
2 13
.7
0.78
0
152.
7 9.
8 0.
041
195.
8 31
.4
1.26
7
204.
0 14
.6
0.52
0
205.
0 11
.8
0.15
4
24
4.0
34.9
1.
530
24
6.0
15.6
0.
606
24
9.4
12.9
0.
196
299.
8 36
.9
3.14
6
306.
9 17
.7
0.93
6
308.
4 14
.8
0.13
5
504