An increase in topsoil SOC stock of China's croplands between 1985 and 2006 revealed by soil...
6
An increase in topsoil SOC stock of China’s croplands between 1985 and 2006 revealed by soil monitoring Genxing Pan a,1, *, Xinwang Xu a,b,1 , Pete Smith c , Weinan Pan a , Rattan Lal d a Institute for Resource, Ecosystem and Environment of Agriculture, Nanjing Agricultural University, 1 Weigang, Nanjing 210095, Jiangsu, China b Department of Geography and Environment Sciences, Chizhou College, Anhui 247000, China c Institute of Biological and Environmental Sciences, School of Biological Sciences, University of Aberdeen, Cruickshank Building, St Machar Drive, Aberdeen AB24 3UU, UK d Carbon Management and Sequestration Center, Ohio State University, 422B Kottman Hall, 2021 Coffey Rd, Columbus, OH 43210, United States 1. Introduction Change in soil organic carbon (SOC) storage at global and regional scales is of critical importance for understanding the processes and mechanisms of terrestrial ecosystem C balance. This, in turn, is important for increasing the certainty with projections of future atmospheric CO 2 concentration, and the future trend of global climate change (Houghton, 2007). Recently, SOC dynamics at regional scale, and the possible impacts of climate change, have been paid much attention (Sleutel et al., 2003; Bellamy et al., 2005; Saby et al., 2008). At the same time, increasing emphasis has been put on soil C sequestration as an effective method to mitigate the increase of atmospheric CO 2 levels (McCarl et al., 2007), and is recognized as a potential major contributor to mitigation in agriculture (Smith et al., 2007a,b, 2008). For the last 5 years, much attention has been paid to the capacity and duration of C sequestration by croplands in the study of climate change (Smith, 2004; Bruce et al., 2007). Many studies have demonstrated C sequestration potential, the number of years over which seques- tration is effective, and the major controls on soil C sequestration by meta-analysis of data from various sources, under varying management and bio-climatic conditions (Smith et al., 1997, 1998, 2000; West and Post, 2002; Ogle et al., 2005; West and Six, 2007). China had a total area of croplands of 138.7 Mha including 32.3 Mha for RPs and 106.4 Mha for DCs in 1982 (SSSC, 1996). By 2006, China had an arable land area of 142.6 Mha (FAOSTAT, 2006), which is about 7% to the global total. SOC dynamics in these croplands has been widely studied (Lal, 2002; Pan et al., 2003; Pan and Zhao, 2005; Huang and Sun, 2006; Tang et al., 2006; Liao et al., 2009; Wang et al., 2000; Xu et al., 2004; Yu et al., 2003, 2006). Great efforts have been given to understanding the accumulation of SOC in the croplands of China by qualitative or semi-quantitative analysis of survey and inventory data in comparison to the baseline Agriculture, Ecosystems and Environment 136 (2010) 133–138 ARTICLE INFO Article history: Received 26 August 2009 Received in revised form 9 December 2009 Accepted 9 December 2009 Available online 8 January 2010 Keywords: C stock Climate change mitigation Croplands Soil organic carbon Topsoil ABSTRACT Soil C sequestration in cropland could play an important role in mitigating the rapidly increasing CO 2 emissions in China. Many efforts had been dedicated to estimating the potential for C sequestration in croplands. Potential increases in SOC in China’s croplands had been recently evaluated using inventory- up-scaling simulation and crop-soil C process-based modeling. In this study, data of SOC change at monitoring sites from croplands across mainland China were collected from publications available from 1985 to 2006 to perform a statistical analysis. The data set comprises 1081 observations (404 from rice paddies, RPs and 677 from dry croplands, DCs). Frequency analysis indicates that over 70% of observations show an increase in SOC, which is higher among RPs than DCs. To quantify SOC dynamics, a Relative Annual Change Index in g kg 1 year 1 (RAC, g kg 1 year 1 ) is defined and calculated using the initial and final SOC values for the duration of monitored observations. RAC values ranged from 0.806 to 0.963 g kg 1 year 1 for DCs and from 0.597 to 0.959 g kg 1 year 1 for RPs, respectively. From this data, the average is estimated to be 0.056 0.200 g kg 1 year 1 for DCs, and 0.110 0.244 g kg 1 year 1 for RPs, with an overall estimate for China’s croplands, with RPs and DCs combined, of 0.076 0.219 g kg 1 year 1 .A mean increase in topsoil C (0–20 cm) stock of China’s croplands was estimated to be 25.5 Tg C year 1 (8 Tg C year 1 in RPs and 17.5 Tg C year 1 in DCs) between 1985 and 2006, with a total topsoil C stock increase of 0.64 Pg C over the whole period. The annual stock increase may offset 20%, on average, of the total CO 2 emissions of China for 1994. This study suggests an important role of China’s croplands, especially rice paddies, for C sequestration to mitigate climate change. ß 2009 Elsevier B.V. All rights reserved. Abbreviations: RP, rice paddy; DC, dry cropland; GHGs, greenhouse gases; RAC, relative annual change. * Corresponding author. Tel.: +86 25 8439 6027; fax: +86 25 8439 6027. E-mail address: [email protected] (G. Pan). 1 These authors contributed equally. Contents lists available at ScienceDirect Agriculture, Ecosystems and Environment journal homepage: www.elsevier.com/locate/agee 0167-8809/$ – see front matter ß 2009 Elsevier B.V. All rights reserved. doi:10.1016/j.agee.2009.12.011
-
Upload
independent -
Category
Documents
-
view
0 -
download
0
Transcript of An increase in topsoil SOC stock of China's croplands between 1985 and 2006 revealed by soil...

An increase in topsoil SOC stock of China’s croplands between 1985 and 2006revealed by soil monitoring
Genxing Pan a,1,*, Xinwang Xu a,b,1, Pete Smith c, Weinan Pan a, Rattan Lal d
a Institute for Resource, Ecosystem and Environment of Agriculture, Nanjing Agricultural University, 1 Weigang, Nanjing 210095, Jiangsu, Chinab Department of Geography and Environment Sciences, Chizhou College, Anhui 247000, Chinac Institute of Biological and Environmental Sciences, School of Biological Sciences, University of Aberdeen, Cruickshank Building, St Machar Drive, Aberdeen AB24 3UU, UKd Carbon Management and Sequestration Center, Ohio State University, 422B Kottman Hall, 2021 Coffey Rd, Columbus, OH 43210, United States
Agriculture, Ecosystems and Environment 136 (2010) 133–138
A R T I C L E I N F O
Article history:
Received 26 August 2009
Received in revised form 9 December 2009
Accepted 9 December 2009
Available online 8 January 2010
Keywords:
C stock
Climate change mitigation
Croplands
Soil organic carbon
Topsoil
A B S T R A C T
Soil C sequestration in cropland could play an important role in mitigating the rapidly increasing CO2
emissions in China. Many efforts had been dedicated to estimating the potential for C sequestration in
croplands. Potential increases in SOC in China’s croplands had been recently evaluated using inventory-
up-scaling simulation and crop-soil C process-based modeling. In this study, data of SOC change at
monitoring sites from croplands across mainland China were collected from publications available from
1985 to 2006 to perform a statistical analysis. The data set comprises 1081 observations (404 from rice
paddies, RPs and 677 from dry croplands, DCs). Frequency analysis indicates that over 70% of
observations show an increase in SOC, which is higher among RPs than DCs. To quantify SOC dynamics, a
Relative Annual Change Index in g kg�1 year�1 (RAC, g kg�1 year�1) is defined and calculated using the
initial and final SOC values for the duration of monitored observations. RAC values ranged from�0.806 to
0.963 g kg�1 year�1 for DCs and from�0.597 to 0.959 g kg�1 year�1 for RPs, respectively. From this data,
the average is estimated to be 0.056 � 0.200 g kg�1 year�1 for DCs, and 0.110 � 0.244 g kg�1 year�1 for RPs,
with an overall estimate for China’s croplands, with RPs and DCs combined, of 0.076 � 0.219 g kg�1 year�1. A
mean increase in topsoil C (0–20 cm) stock of China’s croplands was estimated to be 25.5 Tg C year�1
(8 Tg C year�1 in RPs and 17.5 Tg C year�1 in DCs) between 1985 and 2006, with a total topsoil C stock
increase of 0.64 Pg C over the whole period. The annual stock increase may offset �20%, on average, of the
total CO2 emissions of China for 1994. This study suggests an important role of China’s croplands, especially
rice paddies, for C sequestration to mitigate climate change.
� 2009 Elsevier B.V. All rights reserved.
Contents lists available at ScienceDirect
Agriculture, Ecosystems and Environment
journal homepage: www.e lsev ier .com/ locate /agee
1. Introduction
Change in soil organic carbon (SOC) storage at global andregional scales is of critical importance for understanding theprocesses and mechanisms of terrestrial ecosystem C balance. This,in turn, is important for increasing the certainty with projections offuture atmospheric CO2 concentration, and the future trend ofglobal climate change (Houghton, 2007). Recently, SOC dynamicsat regional scale, and the possible impacts of climate change, havebeen paid much attention (Sleutel et al., 2003; Bellamy et al., 2005;Saby et al., 2008). At the same time, increasing emphasis has beenput on soil C sequestration as an effective method to mitigate theincrease of atmospheric CO2 levels (McCarl et al., 2007), and is
Abbreviations: RP, rice paddy; DC, dry cropland; GHGs, greenhouse gases; RAC,
relative annual change.
* Corresponding author. Tel.: +86 25 8439 6027; fax: +86 25 8439 6027.
E-mail address: [email protected] (G. Pan).1 These authors contributed equally.
0167-8809/$ – see front matter � 2009 Elsevier B.V. All rights reserved.
doi:10.1016/j.agee.2009.12.011
recognized as a potential major contributor to mitigation inagriculture (Smith et al., 2007a,b, 2008). For the last 5 years, muchattention has been paid to the capacity and duration of Csequestration by croplands in the study of climate change (Smith,2004; Bruce et al., 2007). Many studies have demonstrated Csequestration potential, the number of years over which seques-tration is effective, and the major controls on soil C sequestrationby meta-analysis of data from various sources, under varyingmanagement and bio-climatic conditions (Smith et al., 1997, 1998,2000; West and Post, 2002; Ogle et al., 2005; West and Six, 2007).
China had a total area of croplands of 138.7 Mha including32.3 Mha for RPs and 106.4 Mha for DCs in 1982 (SSSC, 1996). By2006, China had an arable land area of 142.6 Mha (FAOSTAT, 2006),which is about 7% to the global total. SOC dynamics in thesecroplands has been widely studied (Lal, 2002; Pan et al., 2003; Panand Zhao, 2005; Huang and Sun, 2006; Tang et al., 2006; Liao et al.,2009; Wang et al., 2000; Xu et al., 2004; Yu et al., 2003, 2006). Greatefforts have been given to understanding the accumulation of SOCin the croplands of China by qualitative or semi-quantitativeanalysis of survey and inventory data in comparison to the baseline
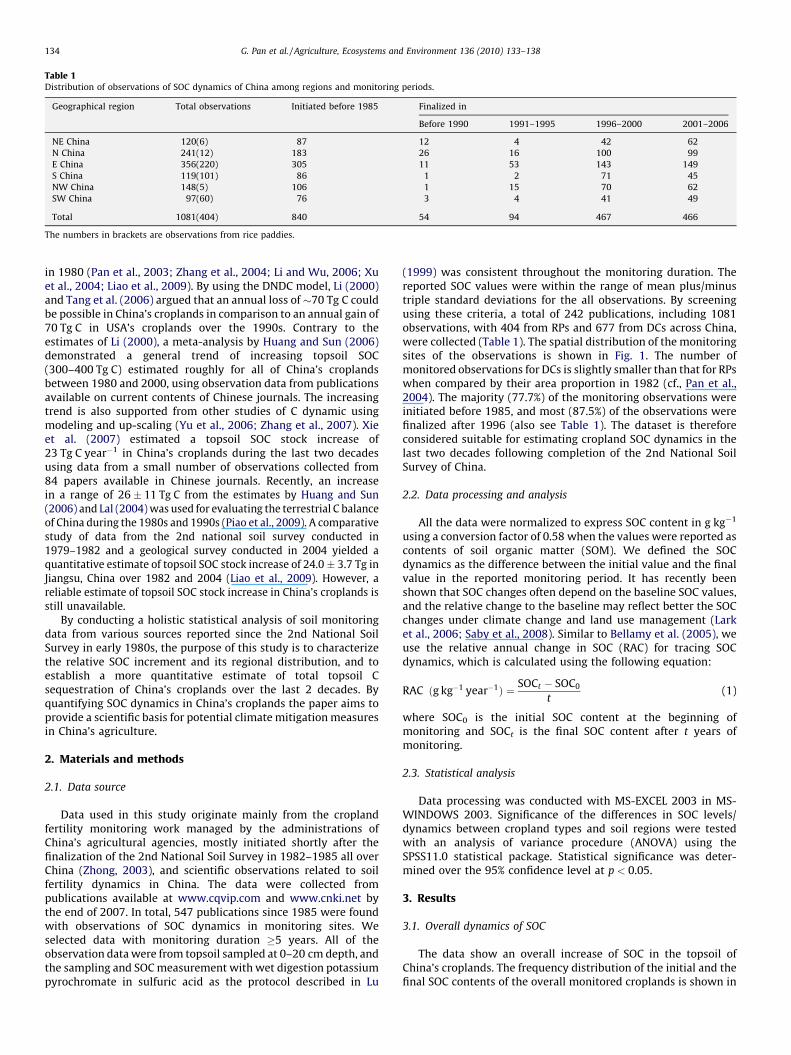
Table 1Distribution of observations of SOC dynamics of China among regions and monitoring periods.
Geographical region Total observations Initiated before 1985 Finalized in
Before 1990 1991–1995 1996–2000 2001–2006
NE China 120(6) 87 12 4 42 62
N China 241(12) 183 26 16 100 99
E China 356(220) 305 11 53 143 149
S China 119(101) 86 1 2 71 45
NW China 148(5) 106 1 15 70 62
SW China 97(60) 76 3 4 41 49
Total 1081(404) 840 54 94 467 466
The numbers in brackets are observations from rice paddies.
G. Pan et al. / Agriculture, Ecosystems and Environment 136 (2010) 133–138134
in 1980 (Pan et al., 2003; Zhang et al., 2004; Li and Wu, 2006; Xuet al., 2004; Liao et al., 2009). By using the DNDC model, Li (2000)and Tang et al. (2006) argued that an annual loss of�70 Tg C couldbe possible in China’s croplands in comparison to an annual gain of70 Tg C in USA’s croplands over the 1990s. Contrary to theestimates of Li (2000), a meta-analysis by Huang and Sun (2006)demonstrated a general trend of increasing topsoil SOC(300–400 Tg C) estimated roughly for all of China’s croplandsbetween 1980 and 2000, using observation data from publicationsavailable on current contents of Chinese journals. The increasingtrend is also supported from other studies of C dynamic usingmodeling and up-scaling (Yu et al., 2006; Zhang et al., 2007). Xieet al. (2007) estimated a topsoil SOC stock increase of23 Tg C year�1 in China’s croplands during the last two decadesusing data from a small number of observations collected from84 papers available in Chinese journals. Recently, an increasein a range of 26 � 11 Tg C from the estimates by Huang and Sun(2006) and Lal (2004) was used for evaluating the terrestrial C balanceof China during the 1980s and 1990s (Piao et al., 2009). A comparativestudy of data from the 2nd national soil survey conducted in1979–1982 and a geological survey conducted in 2004 yielded aquantitative estimate of topsoil SOC stock increase of 24.0 � 3.7 Tg inJiangsu, China over 1982 and 2004 (Liao et al., 2009). However, areliable estimate of topsoil SOC stock increase in China’s croplands isstill unavailable.
By conducting a holistic statistical analysis of soil monitoringdata from various sources reported since the 2nd National SoilSurvey in early 1980s, the purpose of this study is to characterizethe relative SOC increment and its regional distribution, and toestablish a more quantitative estimate of total topsoil Csequestration of China’s croplands over the last 2 decades. Byquantifying SOC dynamics in China’s croplands the paper aims toprovide a scientific basis for potential climate mitigation measuresin China’s agriculture.
2. Materials and methods
2.1. Data source
Data used in this study originate mainly from the croplandfertility monitoring work managed by the administrations ofChina’s agricultural agencies, mostly initiated shortly after thefinalization of the 2nd National Soil Survey in 1982–1985 all overChina (Zhong, 2003), and scientific observations related to soilfertility dynamics in China. The data were collected frompublications available at www.cqvip.com and www.cnki.net bythe end of 2007. In total, 547 publications since 1985 were foundwith observations of SOC dynamics in monitoring sites. Weselected data with monitoring duration �5 years. All of theobservation data were from topsoil sampled at 0–20 cm depth, andthe sampling and SOC measurement with wet digestion potassiumpyrochromate in sulfuric acid as the protocol described in Lu
(1999) was consistent throughout the monitoring duration. Thereported SOC values were within the range of mean plus/minustriple standard deviations for the all observations. By screeningusing these criteria, a total of 242 publications, including 1081observations, with 404 from RPs and 677 from DCs across China,were collected (Table 1). The spatial distribution of the monitoringsites of the observations is shown in Fig. 1. The number ofmonitored observations for DCs is slightly smaller than that for RPswhen compared by their area proportion in 1982 (cf., Pan et al.,2004). The majority (77.7%) of the monitoring observations wereinitiated before 1985, and most (87.5%) of the observations werefinalized after 1996 (also see Table 1). The dataset is thereforeconsidered suitable for estimating cropland SOC dynamics in thelast two decades following completion of the 2nd National SoilSurvey of China.
2.2. Data processing and analysis
All the data were normalized to express SOC content in g kg�1
using a conversion factor of 0.58 when the values were reported ascontents of soil organic matter (SOM). We defined the SOCdynamics as the difference between the initial value and the finalvalue in the reported monitoring period. It has recently beenshown that SOC changes often depend on the baseline SOC values,and the relative change to the baseline may reflect better the SOCchanges under climate change and land use management (Larket al., 2006; Saby et al., 2008). Similar to Bellamy et al. (2005), weuse the relative annual change in SOC (RAC) for tracing SOCdynamics, which is calculated using the following equation:
RAC ðg kg�1 year�1Þ ¼ SOCt � SOC0
t(1)
where SOC0 is the initial SOC content at the beginning ofmonitoring and SOCt is the final SOC content after t years ofmonitoring.
2.3. Statistical analysis
Data processing was conducted with MS-EXCEL 2003 in MS-WINDOWS 2003. Significance of the differences in SOC levels/dynamics between cropland types and soil regions were testedwith an analysis of variance procedure (ANOVA) using theSPSS11.0 statistical package. Statistical significance was deter-mined over the 95% confidence level at p < 0.05.
3. Results
3.1. Overall dynamics of SOC
The data show an overall increase of SOC in the topsoil ofChina’s croplands. The frequency distribution of the initial and thefinal SOC contents of the overall monitored croplands is shown in
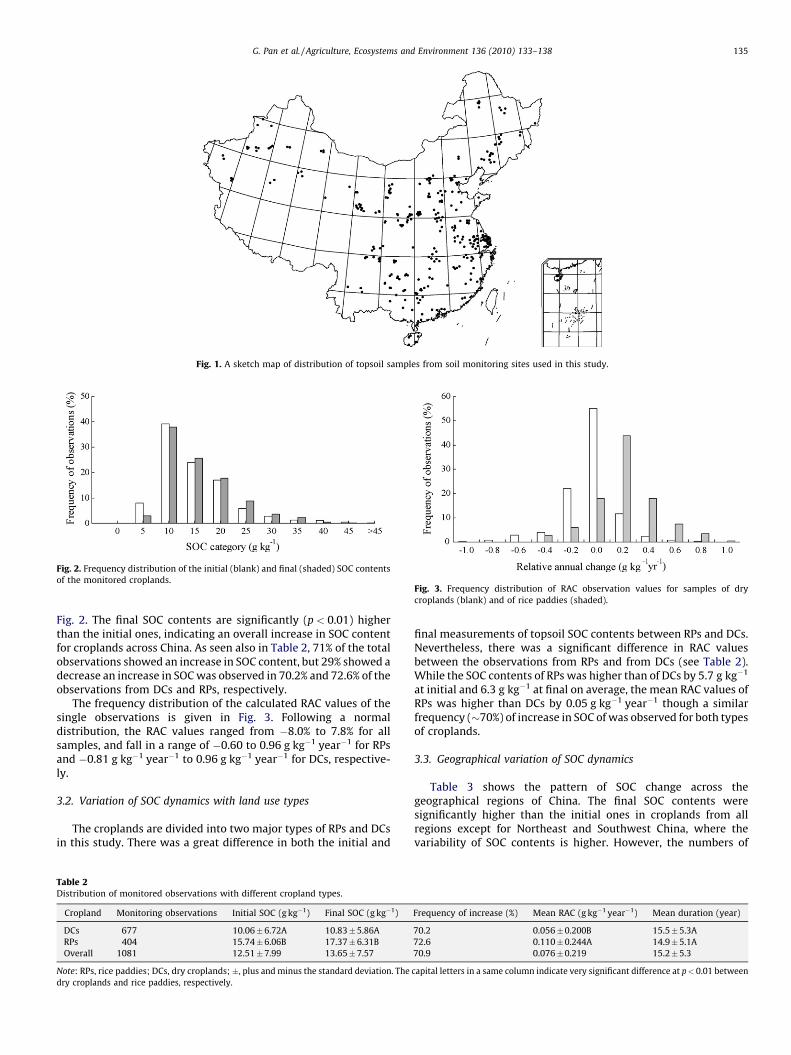
Fig. 1. A sketch map of distribution of topsoil samples from soil monitoring sites used in this study.
Fig. 2. Frequency distribution of the initial (blank) and final (shaded) SOC contents
of the monitored croplands.Fig. 3. Frequency distribution of RAC observation values for samples of dry
croplands (blank) and of rice paddies (shaded).
G. Pan et al. / Agriculture, Ecosystems and Environment 136 (2010) 133–138 135
Fig. 2. The final SOC contents are significantly (p < 0.01) higherthan the initial ones, indicating an overall increase in SOC contentfor croplands across China. As seen also in Table 2, 71% of the totalobservations showed an increase in SOC content, but 29% showed adecrease an increase in SOC was observed in 70.2% and 72.6% of theobservations from DCs and RPs, respectively.
The frequency distribution of the calculated RAC values of thesingle observations is given in Fig. 3. Following a normaldistribution, the RAC values ranged from �8.0% to 7.8% for allsamples, and fall in a range of �0.60 to 0.96 g kg�1 year�1 for RPsand �0.81 g kg�1 year�1 to 0.96 g kg�1 year�1 for DCs, respective-ly.
3.2. Variation of SOC dynamics with land use types
The croplands are divided into two major types of RPs and DCsin this study. There was a great difference in both the initial and
Table 2Distribution of monitored observations with different cropland types.
Cropland Monitoring observations Initial SOC (g kg�1) Final SOC (g kg�1)
DCs 677 10.06�6.72A 10.83�5.86A
RPs 404 15.74�6.06B 17.37�6.31B
Overall 1081 12.51�7.99 13.65�7.57
Note: RPs, rice paddies; DCs, dry croplands; �, plus and minus the standard deviation. The
dry croplands and rice paddies, respectively.
final measurements of topsoil SOC contents between RPs and DCs.Nevertheless, there was a significant difference in RAC valuesbetween the observations from RPs and from DCs (see Table 2).While the SOC contents of RPs was higher than of DCs by 5.7 g kg�1
at initial and 6.3 g kg�1 at final on average, the mean RAC values ofRPs was higher than DCs by 0.05 g kg�1 year�1 though a similarfrequency (�70%) of increase in SOC of was observed for both typesof croplands.
3.3. Geographical variation of SOC dynamics
Table 3 shows the pattern of SOC change across thegeographical regions of China. The final SOC contents weresignificantly higher than the initial ones in croplands from allregions except for Northeast and Southwest China, where thevariability of SOC contents is higher. However, the numbers of
Frequency of increase (%) Mean RAC (g kg�1 year�1) Mean duration (year)
70.2 0.056�0.200B 15.5�5.3A
72.6 0.110�0.244A 14.9�5.1A
70.9 0.076�0.219 15.2�5.3
capital letters in a same column indicate very significant difference at p< 0.01 between
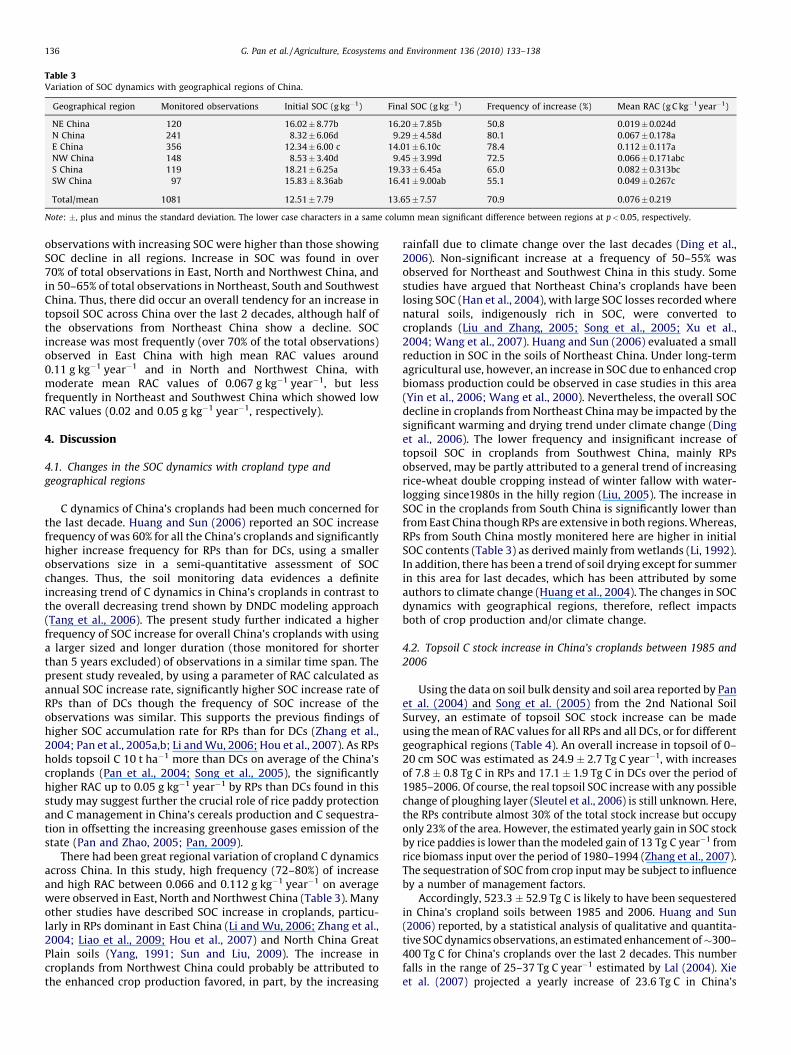
Table 3Variation of SOC dynamics with geographical regions of China.
Geographical region Monitored observations Initial SOC (g kg�1) Final SOC (g kg�1) Frequency of increase (%) Mean RAC (g C kg�1 year�1)
NE China 120 16.02�8.77b 16.20�7.85b 50.8 0.019�0.024d
N China 241 8.32�6.06d 9.29�4.58d 80.1 0.067�0.178a
E China 356 12.34�6.00 c 14.01�6.10c 78.4 0.112�0.117a
NW China 148 8.53�3.40d 9.45�3.99d 72.5 0.066�0.171abc
S China 119 18.21�6.25a 19.33�6.45a 65.0 0.082�0.313bc
SW China 97 15.83�8.36ab 16.41�9.00ab 55.1 0.049�0.267c
Total/mean 1081 12.51�7.79 13.65�7.57 70.9 0.076�0.219
Note: �, plus and minus the standard deviation. The lower case characters in a same column mean significant difference between regions at p<0.05, respectively.
G. Pan et al. / Agriculture, Ecosystems and Environment 136 (2010) 133–138136
observations with increasing SOC were higher than those showingSOC decline in all regions. Increase in SOC was found in over70% of total observations in East, North and Northwest China, andin 50–65% of total observations in Northeast, South and SouthwestChina. Thus, there did occur an overall tendency for an increase intopsoil SOC across China over the last 2 decades, although half ofthe observations from Northeast China show a decline. SOCincrease was most frequently (over 70% of the total observations)observed in East China with high mean RAC values around0.11 g kg�1 year�1 and in North and Northwest China, withmoderate mean RAC values of 0.067 g kg�1 year�1, but lessfrequently in Northeast and Southwest China which showed lowRAC values (0.02 and 0.05 g kg�1 year�1, respectively).
4. Discussion
4.1. Changes in the SOC dynamics with cropland type and
geographical regions
C dynamics of China’s croplands had been much concerned forthe last decade. Huang and Sun (2006) reported an SOC increasefrequency of was 60% for all the China’s croplands and significantlyhigher increase frequency for RPs than for DCs, using a smallerobservations size in a semi-quantitative assessment of SOCchanges. Thus, the soil monitoring data evidences a definiteincreasing trend of C dynamics in China’s croplands in contrast tothe overall decreasing trend shown by DNDC modeling approach(Tang et al., 2006). The present study further indicated a higherfrequency of SOC increase for overall China’s croplands with usinga larger sized and longer duration (those monitored for shorterthan 5 years excluded) of observations in a similar time span. Thepresent study revealed, by using a parameter of RAC calculated asannual SOC increase rate, significantly higher SOC increase rate ofRPs than of DCs though the frequency of SOC increase of theobservations was similar. This supports the previous findings ofhigher SOC accumulation rate for RPs than for DCs (Zhang et al.,2004; Pan et al., 2005a,b; Li and Wu, 2006; Hou et al., 2007). As RPsholds topsoil C 10 t ha�1 more than DCs on average of the China’scroplands (Pan et al., 2004; Song et al., 2005), the significantlyhigher RAC up to 0.05 g kg�1 year�1 by RPs than DCs found in thisstudy may suggest further the crucial role of rice paddy protectionand C management in China’s cereals production and C sequestra-tion in offsetting the increasing greenhouse gases emission of thestate (Pan and Zhao, 2005; Pan, 2009).
There had been great regional variation of cropland C dynamicsacross China. In this study, high frequency (72–80%) of increaseand high RAC between 0.066 and 0.112 g kg�1 year�1 on averagewere observed in East, North and Northwest China (Table 3). Manyother studies have described SOC increase in croplands, particu-larly in RPs dominant in East China (Li and Wu, 2006; Zhang et al.,2004; Liao et al., 2009; Hou et al., 2007) and North China GreatPlain soils (Yang, 1991; Sun and Liu, 2009). The increase incroplands from Northwest China could probably be attributed tothe enhanced crop production favored, in part, by the increasing
rainfall due to climate change over the last decades (Ding et al.,2006). Non-significant increase at a frequency of 50–55% wasobserved for Northeast and Southwest China in this study. Somestudies have argued that Northeast China’s croplands have beenlosing SOC (Han et al., 2004), with large SOC losses recorded wherenatural soils, indigenously rich in SOC, were converted tocroplands (Liu and Zhang, 2005; Song et al., 2005; Xu et al.,2004; Wang et al., 2007). Huang and Sun (2006) evaluated a smallreduction in SOC in the soils of Northeast China. Under long-termagricultural use, however, an increase in SOC due to enhanced cropbiomass production could be observed in case studies in this area(Yin et al., 2006; Wang et al., 2000). Nevertheless, the overall SOCdecline in croplands from Northeast China may be impacted by thesignificant warming and drying trend under climate change (Dinget al., 2006). The lower frequency and insignificant increase oftopsoil SOC in croplands from Southwest China, mainly RPsobserved, may be partly attributed to a general trend of increasingrice-wheat double cropping instead of winter fallow with water-logging since1980s in the hilly region (Liu, 2005). The increase inSOC in the croplands from South China is significantly lower thanfrom East China though RPs are extensive in both regions. Whereas,RPs from South China mostly monitered here are higher in initialSOC contents (Table 3) as derived mainly from wetlands (Li, 1992).In addition, there has been a trend of soil drying except for summerin this area for last decades, which has been attributed by someauthors to climate change (Huang et al., 2004). The changes in SOCdynamics with geographical regions, therefore, reflect impactsboth of crop production and/or climate change.
4.2. Topsoil C stock increase in China’s croplands between 1985 and
2006
Using the data on soil bulk density and soil area reported by Panet al. (2004) and Song et al. (2005) from the 2nd National SoilSurvey, an estimate of topsoil SOC stock increase can be madeusing the mean of RAC values for all RPs and all DCs, or for differentgeographical regions (Table 4). An overall increase in topsoil of 0–20 cm SOC was estimated as 24.9 � 2.7 Tg C year�1, with increasesof 7.8 � 0.8 Tg C in RPs and 17.1 � 1.9 Tg C in DCs over the period of1985–2006. Of course, the real topsoil SOC increase with any possiblechange of ploughing layer (Sleutel et al., 2006) is still unknown. Here,the RPs contribute almost 30% of the total stock increase but occupyonly 23% of the area. However, the estimated yearly gain in SOC stockby rice paddies is lower than the modeled gain of 13 Tg C year�1 fromrice biomass input over the period of 1980–1994 (Zhang et al., 2007).The sequestration of SOC from crop input may be subject to influenceby a number of management factors.
Accordingly, 523.3 � 52.9 Tg C is likely to have been sequesteredin China’s cropland soils between 1985 and 2006. Huang and Sun(2006) reported, by a statistical analysis of qualitative and quantita-tive SOC dynamics observations, an estimated enhancement of�300–400 Tg C for China’s croplands over the last 2 decades. This numberfalls in the range of 25–37 Tg C year�1 estimated by Lal (2004). Xieet al. (2007) projected a yearly increase of 23.6 Tg C in China’s
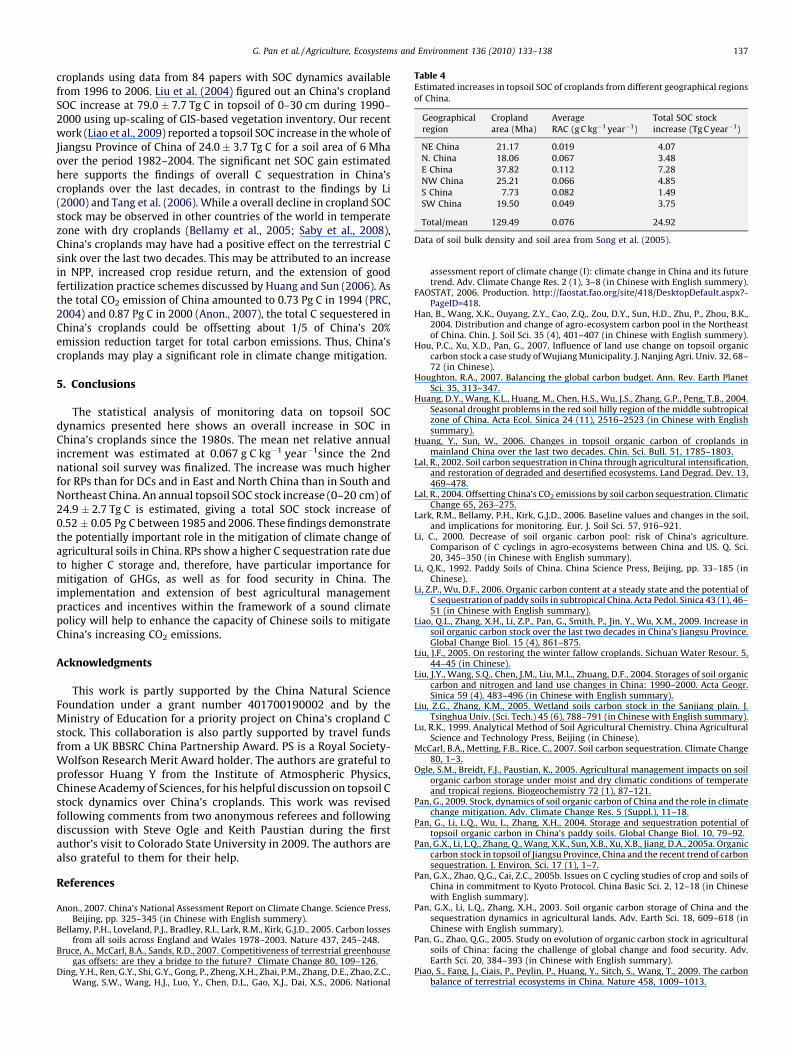
Table 4Estimated increases in topsoil SOC of croplands from different geographical regions
of China.
Geographical
region
Cropland
area (Mha)
Average
RAC (g C kg�1 year�1)
Total SOC stock
increase (Tg C year�1)
NE China 21.17 0.019 4.07
N. China 18.06 0.067 3.48
E China 37.82 0.112 7.28
NW China 25.21 0.066 4.85
S China 7.73 0.082 1.49
SW China 19.50 0.049 3.75
Total/mean 129.49 0.076 24.92
Data of soil bulk density and soil area from Song et al. (2005).
G. Pan et al. / Agriculture, Ecosystems and Environment 136 (2010) 133–138 137
croplands using data from 84 papers with SOC dynamics availablefrom 1996 to 2006. Liu et al. (2004) figured out an China’s croplandSOC increase at 79.0 � 7.7 Tg C in topsoil of 0–30 cm during 1990–2000 using up-scaling of GIS-based vegetation inventory. Our recentwork (Liao et al., 2009) reported a topsoil SOC increase in the whole ofJiangsu Province of China of 24.0 � 3.7 Tg C for a soil area of 6 Mhaover the period 1982–2004. The significant net SOC gain estimatedhere supports the findings of overall C sequestration in China’scroplands over the last decades, in contrast to the findings by Li(2000) and Tang et al. (2006). While a overall decline in cropland SOCstock may be observed in other countries of the world in temperatezone with dry croplands (Bellamy et al., 2005; Saby et al., 2008),China’s croplands may have had a positive effect on the terrestrial Csink over the last two decades. This may be attributed to an increasein NPP, increased crop residue return, and the extension of goodfertilization practice schemes discussed by Huang and Sun (2006). Asthe total CO2 emission of China amounted to 0.73 Pg C in 1994 (PRC,2004) and 0.87 Pg C in 2000 (Anon., 2007), the total C sequestered inChina’s croplands could be offsetting about 1/5 of China’s 20%emission reduction target for total carbon emissions. Thus, China’scroplands may play a significant role in climate change mitigation.
5. Conclusions
The statistical analysis of monitoring data on topsoil SOCdynamics presented here shows an overall increase in SOC inChina’s croplands since the 1980s. The mean net relative annualincrement was estimated at 0.067 g C kg�1 year�1since the 2ndnational soil survey was finalized. The increase was much higherfor RPs than for DCs and in East and North China than in South andNortheast China. An annual topsoil SOC stock increase (0–20 cm) of24.9 � 2.7 Tg C is estimated, giving a total SOC stock increase of0.52 � 0.05 Pg C between 1985 and 2006. These findings demonstratethe potentially important role in the mitigation of climate change ofagricultural soils in China. RPs show a higher C sequestration rate dueto higher C storage and, therefore, have particular importance formitigation of GHGs, as well as for food security in China. Theimplementation and extension of best agricultural managementpractices and incentives within the framework of a sound climatepolicy will help to enhance the capacity of Chinese soils to mitigateChina’s increasing CO2 emissions.
Acknowledgments
This work is partly supported by the China Natural ScienceFoundation under a grant number 401700190002 and by theMinistry of Education for a priority project on China’s cropland Cstock. This collaboration is also partly supported by travel fundsfrom a UK BBSRC China Partnership Award. PS is a Royal Society-Wolfson Research Merit Award holder. The authors are grateful toprofessor Huang Y from the Institute of Atmospheric Physics,Chinese Academy of Sciences, for his helpful discussion on topsoil Cstock dynamics over China’s croplands. This work was revisedfollowing comments from two anonymous referees and followingdiscussion with Steve Ogle and Keith Paustian during the firstauthor’s visit to Colorado State University in 2009. The authors arealso grateful to them for their help.
References
Anon., 2007. China’s National Assessment Report on Climate Change. Science Press,Beijing, pp. 325–345 (in Chinese with English summery).
Bellamy, P.H., Loveland, P.J., Bradley, R.I., Lark, R.M., Kirk, G.J.D., 2005. Carbon lossesfrom all soils across England and Wales 1978–2003. Nature 437, 245–248.
Bruce, A., McCarl, B.A., Sands, R.D., 2007. Competitiveness of terrestrial greenhousegas offsets: are they a bridge to the future? Climate Change 80, 109–126.
Ding, Y.H., Ren, G.Y., Shi, G.Y., Gong, P., Zheng, X.H., Zhai, P.M., Zhang, D.E., Zhao, Z.C.,Wang, S.W., Wang, H.J., Luo, Y., Chen, D.L., Gao, X.J., Dai, X.S., 2006. National
assessment report of climate change (I): climate change in China and its futuretrend. Adv. Climate Change Res. 2 (1), 3–8 (in Chinese with English summery).
FAOSTAT, 2006. Production. http://faostat.fao.org/site/418/DesktopDefault.aspx?-PageID=418.
Han, B., Wang, X.K., Ouyang, Z.Y., Cao, Z.Q., Zou, D.Y., Sun, H.D., Zhu, P., Zhou, B.K.,2004. Distribution and change of agro-ecosystem carbon pool in the Northeastof China. Chin. J. Soil Sci. 35 (4), 401–407 (in Chinese with English summery).
Hou, P.C., Xu, X.D., Pan, G., 2007. Influence of land use change on topsoil organiccarbon stock a case study of Wujiang Municipality. J. Nanjing Agri. Univ. 32, 68–72 (in Chinese).
Houghton, R.A., 2007. Balancing the global carbon budget. Ann. Rev. Earth PlanetSci. 35, 313–347.
Huang, D.Y., Wang, K.L., Huang, M., Chen, H.S., Wu, J.S., Zhang, G.P., Peng, T.B., 2004.Seasonal drought problems in the red soil hilly region of the middle subtropicalzone of China. Acta Ecol. Sinica 24 (11), 2516–2523 (in Chinese with Englishsummary).
Huang, Y., Sun, W., 2006. Changes in topsoil organic carbon of croplands inmainland China over the last two decades. Chin. Sci. Bull. 51, 1785–1803.
Lal, R., 2002. Soil carbon sequestration in China through agricultural intensification,and restoration of degraded and desertified ecosystems. Land Degrad. Dev. 13,469–478.
Lal, R., 2004. Offsetting China’s CO2 emissions by soil carbon sequestration. ClimaticChange 65, 263–275.
Lark, R.M., Bellamy, P.H., Kirk, G.J.D., 2006. Baseline values and changes in the soil,and implications for monitoring. Eur. J. Soil Sci. 57, 916–921.
Li, C., 2000. Decrease of soil organic carbon pool: risk of China’s agriculture.Comparison of C cyclings in agro-ecosystems between China and US. Q. Sci.20, 345–350 (in Chinese with English summary).
Li, Q.K., 1992. Paddy Soils of China. China Science Press, Beijing, pp. 33–185 (inChinese).
Li, Z.P., Wu, D.F., 2006. Organic carbon content at a steady state and the potential ofC sequestration of paddy soils in subtropical China. Acta Pedol. Sinica 43 (1), 46–51 (in Chinese with English summary).
Liao, Q.L., Zhang, X.H., Li, Z.P., Pan, G., Smith, P., Jin, Y., Wu, X.M., 2009. Increase insoil organic carbon stock over the last two decades in China’s Jiangsu Province.Global Change Biol. 15 (4), 861–875.
Liu, J.F., 2005. On restoring the winter fallow croplands. Sichuan Water Resour. 5,44–45 (in Chinese).
Liu, J.Y., Wang, S.Q., Chen, J.M., Liu, M.L., Zhuang, D.F., 2004. Storages of soil organiccarbon and nitrogen and land use changes in China: 1990–2000. Acta Geogr.Sinica 59 (4), 483–496 (in Chinese with English summary).
Liu, Z.G., Zhang, K.M., 2005. Wetland soils carbon stock in the Sanjiang plain. J.Tsinghua Univ. (Sci. Tech.) 45 (6), 788–791 (in Chinese with English summary).
Lu, R.K., 1999. Analytical Method of Soil Agricultural Chemistry. China AgriculturalScience and Technology Press, Beijing (in Chinese).
McCarl, B.A., Metting, F.B., Rice, C., 2007. Soil carbon sequestration. Climate Change80, 1–3.
Ogle, S.M., Breidt, F.J., Paustian, K., 2005. Agricultural management impacts on soilorganic carbon storage under moist and dry climatic conditions of temperateand tropical regions. Biogeochemistry 72 (1), 87–121.
Pan, G., 2009. Stock, dynamics of soil organic carbon of China and the role in climatechange mitigation. Adv. Climate Change Res. 5 (Suppl.), 11–18.
Pan, G., Li, L.Q., Wu, L., Zhang, X.H., 2004. Storage and sequestration potential oftopsoil organic carbon in China’s paddy soils. Global Change Biol. 10, 79–92.
Pan, G.X., Li, L.Q., Zhang, Q., Wang, X.K., Sun, X.B., Xu, X.B., Jiang, D.A., 2005a. Organiccarbon stock in topsoil of Jiangsu Province, China and the recent trend of carbonsequestration. J. Environ. Sci. 17 (1), 1–7.
Pan, G.X., Zhao, Q.G., Cai, Z.C., 2005b. Issues on C cycling studies of crop and soils ofChina in commitment to Kyoto Protocol. China Basic Sci. 2, 12–18 (in Chinesewith English summary).
Pan, G.X., Li, L.Q., Zhang, X.H., 2003. Soil organic carbon storage of China and thesequestration dynamics in agricultural lands. Adv. Earth Sci. 18, 609–618 (inChinese with English summary).
Pan, G., Zhao, Q.G., 2005. Study on evolution of organic carbon stock in agriculturalsoils of China: facing the challenge of global change and food security. Adv.Earth Sci. 20, 384–393 (in Chinese with English summary).
Piao, S., Fang, J., Ciais, P., Peylin, P., Huang, Y., Sitch, S., Wang, T., 2009. The carbonbalance of terrestrial ecosystems in China. Nature 458, 1009–1013.

G. Pan et al. / Agriculture, Ecosystems and Environment 136 (2010) 133–138138
Saby, N.P.A., Arrouays, D., Antoni, V., Lemercier, B., Follain, S., Walter, C., Schvartz, C.,2008. Changes in soil organic carbon in a mountainous French region, 1990–2004. Soil Use Manage. 24 (3), 254–262.
Sleutel, S., De Neve, S., Hofman, G., Boeckx, P., Beheydt, D., van Cleemput, O.,Mestdagh, I., Lootens, P., Carlier, L., van Camp, N., Verbeeck, H., van De Walle,I., Samson, R., Lust, N., Lemeur, R., 2003. Carbon stock changes and carbonsequestration potential of Flemish cropland soils. Global Change Biol. 9, 1193–1203.
Sleutel, S., De Neve, S., Singier, B., Hofman, G., 2006. Organic C levels of intensivelymanaged cropland soils—long term regional trends and characterisation oforganic matter fractions. Soil Use Manage. 22, 188–196.
Smith, P., 2004. Carbon sequestration in croplands: the potential in Europe and theglobal context. Eur. J. Agron. 20, 229–236.
Smith, P., Martino, D., Cai, Z., Gwary, D., Janzen, H.H., Kumar, P., McCarl, B., Ogle, S.,O’Mara, F., Rice, C., Scholes, R.J., Sirotenko, O., Howden, M., McAllister, T., Pan, G.,Romanenkov, V., Schneider, U., Towprayoon, S., Wattenbach, M., Smith, J.U.,2007a. Agriculture. In: Metz, B., Davidson, O.R., Bosch, P.R., Dave, R., Meyer, L.A.(Eds.), Contribution of Working Group III to the Fourth Assessment Report ofthe Intergovernmental Panel on Climate Change. Mitigation of Climate Change2007. Cambridge University Press, Cambridge/New York (Chapter 8).
Smith, P., Chapman, S.J., Scott, W.A., Black, H.I.J., Wattenbach, M., Milne, R., Camp-bell, C.D., Lilly, A., Ostle, N., Levy, P.E., Lumsdon, D.G., Millard, M., Towers, W.,Zaehle, S., Smith, J., 2007b. Climate change cannot be entirely responsible forsoil carbon loss observed in England and Wales, 1978–2003. Global Change Biol.13, 2605–2609.
Smith, P., Martino, D., Cai, Z., Gwary, D., Janzen, H.H., Kumar, P., McCarl, B., Ogle, S.,O’Mara, F., Rice, C., Scholes, R.J., Sirotenko, O., Howden, M., McAllister, T., Pan, G.,Romanenkov, V., Schneider, U., Towprayoon, S., Wattenbach, M., Smith, J.U., 2008.Greenhouse gas mitigation in agriculture. Philos. Trans. R. Soc. B 363, 789–813.
Smith, P., Powlson, D.S., Glendining, M.J., Smith, J., 1997. Potential for carbonsequestration in European soils: preliminary estimates for five scenarios usingresults from long-term experiments. Global Change Biol. 3, 67–79.
Smith, P., Powlson, D.S., Glendining, M.J., Smith, J., 1998. Preliminary estimates ofthe potential for carbon mitigation in European soils through no-till farming.Global Change Biol. 4, 679–685.
Smith, P., Powlson, D.S., Smith, J., Falloon, P., Coleman, K., 2000. Meeting Europe’sclimate change commitments: quantitative estimates of the potential forcarbon mitigation by agriculture. Global Change Biol. 6, 525–539.
Song, G.H., Li, L.Q., Pan, G., 2005. Topsoil organic carbon storage of China and its lossby cultivation. Biogeochemistry 74, 47–62.
State Soil Survey Service of China (SSSC), 1996. Dataset of National Soil Survey ofChina. China Agriculture Press, Beijing, p. 3 (in Chinese).
Sun, Y.L., Liu, Q., 2009. Soil fertilities and its relationship to maize productivity in theNorth China Plain. Soils 41 (2), 274–277 (in Chinese).
Tang, H.J., Qiu, J.H., Ranst, E.V., 2006. Estimations of soil organic carbon storagein cropland of China based on DNDC model. Geoderma 134 (1/2), 200–206.
The Peoples’ Republic of China (PRC), 2004. Initial National Communication onClimate Change. China Planning Press, Beijing, pp. 13–22 (in Chinese withEnglish summery).
Wang, J.K., Shuang, Y., Zhang, X.D., 2007. Spatial and temporal variability of soilquality in typical black soil area in Northeast China in 20 years. Chin. J. Eco-Agri.15 (1), 9–24 (in Chinese with English summary).
Wang, R.F., Wang, D.M., Cui, Y., 2000. The report of soil fertility monitoring indifferent areas of China (1988–1997). Soil Fertil. 6, 8–13 (in Chinese).
West, T.O., Post, W.M., 2002. Soil organic carbon sequestration by and crop rotation:a global data analysis. Soil Sci. Soc. Am. J. 66 (1), 930–946.
West, T.O., Six, J., 2007. Considering the influence of sequestration duration andcarbon saturation on estimates of soil carbon capacity. Climate Change 80,25–41.
Xie, Z.B., Zhu, J.G., Liu, G., Cadisch, G., Hasegawa, T., Chen, C.M., Sun, H.F., Tang, H.Y.,Zeng, Q., 2007. Soil organic carbon stocks in China and changes from 1980s to2000s. Global Change Biol. 13, 1989–2007.
Xu, Y., Zhang, F.R., Wang, J.K., 2004. Temporal changes of soil organic matter in UsticCambisols and Udic Isohumosols of China in recent twenty years. Chin. J. SoilSci. 35 (2), 102–105 (in Chinese with English summary).
Yang, S.C., 1991. Optimum Fertilizer Application on Major Crops and Soil QualityImprovement Techniques in Huang-Huai-Hai Plain. China Agricultural Sciencesand Technology Press, Beijing, p. 28 (in Chinese).
Yin, H.B., Han, X.R., Xie, F., 2006. Effect of long term fertilization on soil organiccarbon of Burozem. Chin. J. Soil Sci. 37 (6), 1102–1105 (in Chinese with Englishsummary).
Yu, H., Huang, J.K., Scott, R., 2003. Soil fertility changes of cultivated land in easternChina. Geogr. Res. 22 (3), 380–388 (in Chinese with English summary).
Yu, Y.Y., Guo, Z.T., Wu, H.B., 2006. Changes in organic carbon of cultivated soils inChina from 1980 to 2000. Mar. Geol. Q. Geol. 26 (6), 123–130 (in Chinese withEnglish summary).
Zhang, Q., Li, L.Q., Pan, G., Huang, H.G., 2004. Dynamics of topsoil organic carbon ofpaddy soils at Yixing over the last 20 years and the driving factors. Q. Sci. 24 (2),114–120 (in Chinese with English summary).
Zhang, W., Yu, Y.Q., Sun, W.J., 2007. Simulation of soil organic carbon dynamics inChinese rice paddies from 1980 to 2000. Pedosphere 17 (1), 1–10.
Zhong, Y.H., 2003. Collection of Soil Fertility Monitoring Results of China’s Crop-lands. China Agricultural Press, Beijing, pp. 3–28 (in Chinese).