An In-depth study of Mobile Browser Performance - GDAC
11
An In-depth study of Mobile Browser Performance Javad Nejati [email protected] Aruna Balasubramanian [email protected] ABSTRACT Mobile page load times are an order of magnitude slower com- pared to non-mobile pages. It is not clear what causes the poor per- formance: the slower network, the slower computational speeds, or other reasons. Further, most Web optimizations are designed for non-mobile browsers and do not translate well to the mobile browser. Towards understanding mobile Web page load times, in this paper we: (1) perform an in-depth pairwise comparison of loading a page on a mobile versus a non-mobile browser, and (2) characterize the bottlenecks in the mobile browser vis-a-vis non- mobile browsers. To this end, we build a testbed that allows us to directly compare the low-level page load activities and bottlenecks when loading a page on a mobile versus a non-mobile browser. We find that computation activities are the main bottleneck when load- ing a page on mobile browsers. This is in contrast to non-mobile browsers where network activities are the main bottleneck. We also find that the composition of the critical path during page load is different when loading pages on the mobile versus the non-mobile browser. A key takeaway of our work is that we need to fundamen- tally rethink optimizations for mobile browsers. 1. INTRODUCTION Recent reports estimate the number of smartphone subscriptions worldwide to be over the 2.6 billion mark [4]. Already, the num- ber of users for whom the mobile phone is their only ÒcomputerÓ has exceeded the number of PC-only users [10]. As a result, mo- bile pages are becoming the primary portal for content, and mo- bile browsers are one of the most popular applications on smart- phones [18]. Unfortunately, the page load performance on mobile devices does not match up to its importance: mobile page load times are an order of magnitude slower compared to loading pages on a desktop browser, often taking 10s of seconds to load just the landing page [17]. It is not easy to improve mobile Web performance: most of the Web optimizations [12, 25, 24] are designed for desktop browsers 1 . For example, HTTP/2 [12, 9] was designed to improve page load 1 We use the term non-mobile browsers and desktop browsers inter- changeably Copyright is held by the International World Wide Web Conference Com- mittee (IW3C2). IW3C2 reserves the right to provide a hyperlink to the author’s site if the Material is used in electronic media. WWW 2016, April 11–15, 2016, Montréal, Québec, Canada. ACM 978-1-4503-4143-1/16/04. http://dx.doi.org/10.1145/2872427.2883014. performance for primarily non-mobile browsers, and their effect on mobile pages have not been significant [20]. The problem is that mobile and desktop browsers have different bottlenecks and resource constraints. As a result, Web optimizations designed for desktop page loads cannot be directly ported to mobile page loads. Some recent research works [16, 30, 17] have specifically opti- mized mobile pages. FlyWheel [16], Google’s data compression proxy, significantly reduces data usage on mobile devices, but its effect on page load time is mixed. Others target specific aspects of the page load process such as the network latency [30] or user QoE [17] instead of the page load time. The problem is that the mobile pages are varied; an optimiza- tion that works well for one page may not work well for another. In addition, mobile page load bottlenecks are not well understood. Mobile devices are scaled down versions of desktops: they have limited CPU, poorer network capacities, and lower memory. It is unclear what the bottleneck is, and how this bottleneck compares to loading pages on non-mobile browsers. It is critical to understand the bottlenecks in mobile browsers to design appropriate optimiza- tions. Towards understanding mobile page load times, in this paper we: (1) perform an in-depth pairwise comparison of loading a page on a mobile versus a non-mobile browser, and (2) characterize the bot- tlenecks in a mobile browser vis-a-vis a non-mobile browsers. This in-turn can inform us on how and when to port desktop optimiza- tions to mobile. Unfortunately, it is not straightforward to isolate the effect of the browser and the mobile device on the page load performance. Even if we load the same page on the desktop and the mobile device, the difference in their performance could be due to several factors. Web page performance is influenced by the underlying network, changes to the Web page, the latencies at the Web server, the device, and the browser. It is challenging to determine what part of the page load performance is affected by the mobile device and the mobile browser, and what part is affected by other factors. Further, extracting the browser dependencies is challenging. The browser is a complex piece of software consisting of a series of in- terdependent network and computation activities [31]. Because of the interdependence, some of the activities can be performed only after a previous activity finishes, leading to bottlenecks, and creat- ing a critical path [6]. Identifying the bottlenecks require knowl- edge of the internal browser structure and browser policies. To address the bottleneck problem, we leverage WProf [31]. WProf is an in-browser profiler designed for desktop browsers that in- fers the dependency policies of browsers. WProf instruments the browser to log fine-grained timing information. It combines the timing information and the dependency policies to build the de- pendency graph and to identify the bottlenecks. We port WProf 1305
-
Upload
khangminh22 -
Category
Documents
-
view
0 -
download
0
Transcript of An In-depth study of Mobile Browser Performance - GDAC

An In-depth study of Mobile Browser Performance
Javad [email protected]
Aruna [email protected]
ABSTRACTMobile page load times are an order of magnitude slower com-pared to non-mobile pages. It is not clear what causes the poor per-formance: the slower network, the slower computational speeds,or other reasons. Further, most Web optimizations are designedfor non-mobile browsers and do not translate well to the mobilebrowser. Towards understanding mobile Web page load times, inthis paper we: (1) perform an in-depth pairwise comparison ofloading a page on a mobile versus a non-mobile browser, and (2)characterize the bottlenecks in the mobile browser vis-a-vis non-mobile browsers. To this end, we build a testbed that allows us todirectly compare the low-level page load activities and bottleneckswhen loading a page on a mobile versus a non-mobile browser. Wefind that computation activities are the main bottleneck when load-ing a page on mobile browsers. This is in contrast to non-mobilebrowsers where network activities are the main bottleneck. We alsofind that the composition of the critical path during page load isdifferent when loading pages on the mobile versus the non-mobilebrowser. A key takeaway of our work is that we need to fundamen-tally rethink optimizations for mobile browsers.
1. INTRODUCTIONRecent reports estimate the number of smartphone subscriptions
worldwide to be over the 2.6 billion mark [4]. Already, the num-ber of users for whom the mobile phone is their only ÒcomputerÓhas exceeded the number of PC-only users [10]. As a result, mo-bile pages are becoming the primary portal for content, and mo-bile browsers are one of the most popular applications on smart-phones [18]. Unfortunately, the page load performance on mobiledevices does not match up to its importance: mobile page loadtimes are an order of magnitude slower compared to loading pageson a desktop browser, often taking 10s of seconds to load just thelanding page [17].
It is not easy to improve mobile Web performance: most of theWeb optimizations [12, 25, 24] are designed for desktop browsers1.For example, HTTP/2 [12, 9] was designed to improve page load1We use the term non-mobile browsers and desktop browsers inter-changeably
Copyright is held by the International World Wide Web Conference Com-mittee (IW3C2). IW3C2 reserves the right to provide a hyperlink to theauthor’s site if the Material is used in electronic media.WWW 2016, April 11–15, 2016, Montréal, Québec, Canada.ACM 978-1-4503-4143-1/16/04.http://dx.doi.org/10.1145/2872427.2883014.
performance for primarily non-mobile browsers, and their effecton mobile pages have not been significant [20]. The problem isthat mobile and desktop browsers have different bottlenecks andresource constraints. As a result, Web optimizations designed fordesktop page loads cannot be directly ported to mobile page loads.
Some recent research works [16, 30, 17] have specifically opti-mized mobile pages. FlyWheel [16], Google’s data compressionproxy, significantly reduces data usage on mobile devices, but itseffect on page load time is mixed. Others target specific aspectsof the page load process such as the network latency [30] or userQoE [17] instead of the page load time.
The problem is that the mobile pages are varied; an optimiza-tion that works well for one page may not work well for another.In addition, mobile page load bottlenecks are not well understood.Mobile devices are scaled down versions of desktops: they havelimited CPU, poorer network capacities, and lower memory. It isunclear what the bottleneck is, and how this bottleneck compares toloading pages on non-mobile browsers. It is critical to understandthe bottlenecks in mobile browsers to design appropriate optimiza-tions.
Towards understanding mobile page load times, in this paper we:(1) perform an in-depth pairwise comparison of loading a page ona mobile versus a non-mobile browser, and (2) characterize the bot-tlenecks in a mobile browser vis-a-vis a non-mobile browsers. Thisin-turn can inform us on how and when to port desktop optimiza-tions to mobile.
Unfortunately, it is not straightforward to isolate the effect of thebrowser and the mobile device on the page load performance. Evenif we load the same page on the desktop and the mobile device, thedifference in their performance could be due to several factors. Webpage performance is influenced by the underlying network, changesto the Web page, the latencies at the Web server, the device, andthe browser. It is challenging to determine what part of the pageload performance is affected by the mobile device and the mobilebrowser, and what part is affected by other factors.
Further, extracting the browser dependencies is challenging. Thebrowser is a complex piece of software consisting of a series of in-terdependent network and computation activities [31]. Because ofthe interdependence, some of the activities can be performed onlyafter a previous activity finishes, leading to bottlenecks, and creat-ing a critical path [6]. Identifying the bottlenecks require knowl-edge of the internal browser structure and browser policies.
To address the bottleneck problem, we leverage WProf [31]. WProfis an in-browser profiler designed for desktop browsers that in-fers the dependency policies of browsers. WProf instruments thebrowser to log fine-grained timing information. It combines thetiming information and the dependency policies to build the de-pendency graph and to identify the bottlenecks. We port WProf
1305
to mobile by instrumenting a mobile browser. We call this instru-mented mobile browser WProf-M. Similar to WProf, WProf-M ex-tracts the dependency graph and identifies the bottlenecks, but doesso for mobile page loads.
To better isolate the effect of the browser and the mobile deviceon the page load performance, we build an experimental testbedto perform controlled experiments. The testbed uses several virtu-alized Web servers that serve local pages under a controlled net-work environment. The controlled environment reduces the vari-ances caused by external factors and helps us isolate the effect ofthe mobile browser/device. We use a WProf instrumented desktopbrowser, and a WProf-M instrumented mobile browser to log lowlevel page load activities. By combining the testbed and the lowlevel activity logging, we are able to compare the desktop and themobile page load performance at a fine-grained level.
We experiment with 200 Web pages, choosing pages from a mixof popular and not-so-popular pages from Alexa [1]. Our key find-ing is that it is computation activities, not network activities, thatare the main bottleneck in mobile browsers. On a mobile browser,computation activities such as HTTP parsing constitutes for over60% of the page load bottleneck in the median case. In contrast,computation activities constitutes less than 40% of the page loadbottleneck on a desktop browser under the same network condition.When network conditions worsen, network activities become evenmore of a bottleneck when loading pages on the desktop browser.In contrast, on the mobile browser, even when the network condi-tions get worse, computation activities continue to be the primarybottleneck. We verify that, even when loading pages in-the-wild,without our controlled testbed, computation is the primary bottle-neck on the mobile browser.
When loading mobile versions of a page (e.g., loading m.cnn.com instead of cnn.com), we find that computation activities arestill the bottleneck during page load time. This is not surprisingbecause mobile versions of the page reduces object size, but it doesnot simplify the computation required to load the page. As a re-sult, computation activities become even more of a bottleneck whenloading mobile versions of the page.
Next we compare the activities on the critical path (i.e., the bot-tleneck path), when loading pages on the mobile versus the desk-top browser. We find that, even when loading the same page underthe same conditions, the specific activities on the critical path varybetween the mobile and the desktop browser. Our observation indi-cates that optimizing a specific URL corresponding to a Javascriptor image may not provide improvements on both desktop and mo-bile browsers, since the specific URL may not be on both criticalpaths. However, we find that the type of activities on the criticalpath, for example, in terms of the percentage of Javascript evalua-tion versus CSS evaluation activities, remain largely similar for thedesktop and the mobile browser.
Finally, we find that for small pages that are less than 250KB insize, the performance difference between the desktop and the mo-bile browser is insignificant. The performance difference is moresignificant in larger pages, but the difference is because the timetaken to complete the computation activities on the mobile browseris much longer when compared to the desktop browser.
Our findings have several implications for browser vendors andmobile page developers. It shows that one of the keys to improvingmobile page load performance is to address the computation bottle-neck. While several existing optimizations such as FlyWheel [16],Parcel [30], and HTTP/2 [12], attempt to reduce the network la-tency, there has only been limited effort in improving the compu-tation latency. Our observations show that optimizations may nothelp mobile and desktop browsers equally because of the differ-
ences in the critical path, even when loading the same page. Fi-nally, our findings show that when loading smaller pages, the per-formance on the mobile browser is similar to the performance onthe desktop browser. Therefore, we should focus on optimizinglarger pages.
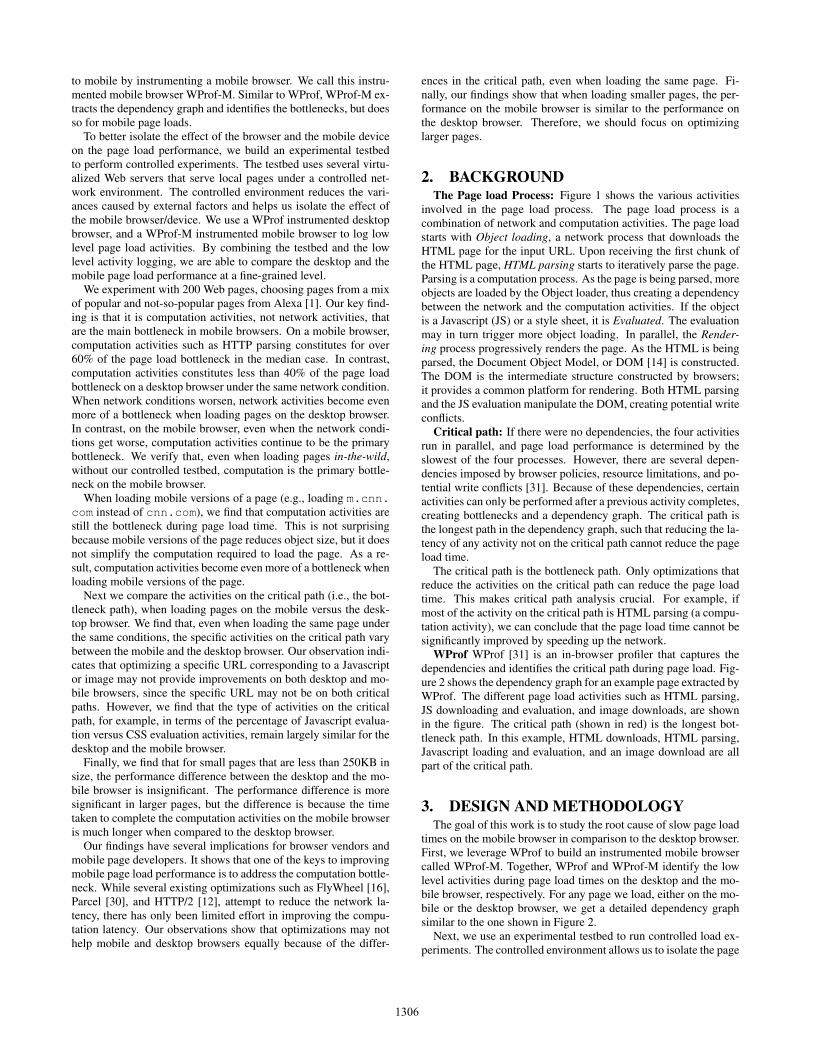
2. BACKGROUNDThe Page load Process: Figure 1 shows the various activities
involved in the page load process. The page load process is acombination of network and computation activities. The page loadstarts with Object loading, a network process that downloads theHTML page for the input URL. Upon receiving the first chunk ofthe HTML page, HTML parsing starts to iteratively parse the page.Parsing is a computation process. As the page is being parsed, moreobjects are loaded by the Object loader, thus creating a dependencybetween the network and the computation activities. If the objectis a Javascript (JS) or a style sheet, it is Evaluated. The evaluationmay in turn trigger more object loading. In parallel, the Render-ing process progressively renders the page. As the HTML is beingparsed, the Document Object Model, or DOM [14] is constructed.The DOM is the intermediate structure constructed by browsers;it provides a common platform for rendering. Both HTML parsingand the JS evaluation manipulate the DOM, creating potential writeconflicts.
Critical path: If there were no dependencies, the four activitiesrun in parallel, and page load performance is determined by theslowest of the four processes. However, there are several depen-dencies imposed by browser policies, resource limitations, and po-tential write conflicts [31]. Because of these dependencies, certainactivities can only be performed after a previous activity completes,creating bottlenecks and a dependency graph. The critical path isthe longest path in the dependency graph, such that reducing the la-tency of any activity not on the critical path cannot reduce the pageload time.
The critical path is the bottleneck path. Only optimizations thatreduce the activities on the critical path can reduce the page loadtime. This makes critical path analysis crucial. For example, ifmost of the activity on the critical path is HTML parsing (a compu-tation activity), we can conclude that the page load time cannot besignificantly improved by speeding up the network.
WProf WProf [31] is an in-browser profiler that captures thedependencies and identifies the critical path during page load. Fig-ure 2 shows the dependency graph for an example page extracted byWProf. The different page load activities such as HTML parsing,JS downloading and evaluation, and image downloads, are shownin the figure. The critical path (shown in red) is the longest bot-tleneck path. In this example, HTML downloads, HTML parsing,Javascript loading and evaluation, and an image download are allpart of the critical path.
3. DESIGN AND METHODOLOGYThe goal of this work is to study the root cause of slow page load
times on the mobile browser in comparison to the desktop browser.First, we leverage WProf to build an instrumented mobile browsercalled WProf-M. Together, WProf and WProf-M identify the lowlevel activities during page load times on the desktop and the mo-bile browser, respectively. For any page we load, either on the mo-bile or the desktop browser, we get a detailed dependency graphsimilar to the one shown in Figure 2.
Next, we use an experimental testbed to run controlled load ex-periments. The controlled environment allows us to isolate the page
1306

UI �
Object
Loading �
Cache, cookie, localStorage�
Network �
DOM �
HTML Parsing�
Evaluation�
Rendering�
Figure 1: The page load process involving four activ-ities (shown in gray). Figure from [31]
Figure 2: The dependency graph when loading an example page. The figure showsall the activities during the page load process. The line in red shows the critical path.The Page Load Time (PLT) for this page load is 375ms.
load performance differences caused by the mobile device better,by reducing the variances caused by external factors.
3.1 WProf-MTo perform critical path analysis on mobile devices, we built a
version of WProf [31] on Android Chromium Version 31.0.1626.0.As a first step, we infer the set of dependency policies. Depen-dencies occur because of the underlying browser policy. To un-cover these dependencies, we use the same technique as describedin WProf [31]: we load a set of test Web pages and observe thebrowser behavior when loading the Web pages. For example, toinfer the browser dependency policies in loading Web objects, wecreate test pages with two objects. We then artificially create de-lays in loading the first object. If the subsequent object is alsodelayed, we infer that the two objects are dependent. The full setof test pages we use to infer the dependency policies can be foundat wprof.cs.washington.edu/tests/.
From our analysis we find that the set of dependency policieswe observed in Android Chromium Version 31.0.1626.0 are thesame as the dependency policies observed in Chromium Version31.0.1626.0 that we instrument for WProf. Therefore, we portthe WProf instrumentation to the Android Chromium version di-rectly. The instrumentation logs the timing information for variousbrowser activities, and then uses the dependency policies to con-struct the dependency graph and the critical path. Minor modifica-tions were made to accommodate for changes between the desktopand the mobile browser versions.
We call the instrumented Android Chromium application WProf-M. Most of the instrumentation was done on Webkit, the opensource browser engine used by Chromium. In total, the differencein lines of code between Android Chromium and WProf-M is 4191lines, as indicated by the patch file.
The WProf-M browser application has been released and can bedownloaded from wprofx.cs.stonybrook.edu.
3.2 Testbed DesignThe key to our analysis is to load pages on the desktop and the
mobile browser under the same conditions, to perform pairwisecomparisons. However, this is non-trivial: page load performanceexhibits high variance [32]. This means, the difference in page loadtimes may not only because of loading the page on the desktop ver-sus the mobile device. It could be because of several other reasonsincluding network variations, changes to the Web page, or delay atthe Web server.
We design an experimental testbed that minimizes external vari-ances when loading pages over the desktop and the mobile browser.We perform the experiments in a controlled environment by:
• serving pages from our local server. We download the entirepage locally on the server and convert all the external linksto local links. This minimizes variances caused by changesto the page.
• loading the same page on the mobile and the desktop browser,rather than loading the mobile version of the page (or mpages)to perform more direct comparisons.
• emulating different network conditions using a traffic con-troller to ensure that both the mobile and the desktop browserload pages under the same network conditions.
To ensure that the results we get from our controlled setting ap-plies more broadly, we perform additional experiments where thethree restrictions are removed; i.e., we load pages directly from theWeb server, we load mpages, and we use real networks. Our ad-ditional experiments show that the conclusions we derive from ourcontrolled experiments also apply more generally (§5.5).
Figure 3 shows our experimental testbed. At the client side, weload Web pages on a phone using the WProf-M browser, and onthe desktop we load pages using the WProf browser. All Web pageloads go through the experiment manager. The manager stores thelogs generated by WProf and WProf-M. The manager also con-figures the traffic controller and the Web server according to theexperiment. We use reverse USB tethering to connect the mobiledevice to the experiment manager [33] rather than connect usingWiFi because we observed large variances in WiFi latencies.
On the server side, we leverage virtual machines to run mul-tiple web servers on the same platform. To isolate the differentnetwork stacks for the difference virtual servers, we use Linux net-work namespace [11], similar to [26]. To emulate different networkconditions, we use Linux Traffic Control (TC). Before each exper-iment, we use the ping and iperf tools to test that the emulatednetwork has the expected bandwidth and delay values.
3.3 MethodologyWe load the same set of Web pages on the desktop and the mo-
bile browser and collect logs of the low level browser activitiesas shown in Figure 2. We use the logs to identify the bottlenecksand the critical path during the page load process. By comparingthe two log files, we are able to study the differences in page loadbottlenecks when loading a page on the mobile versus the desktopbrowser.
1307

VirtualWebServer
VirtualWebServer
LocalWebPages
Internet
ReverseUSBTethering
TrafficController
Ethernet
WProf-MChromium
WProfChromium
Experimentmanager
Figure 3: Testbed architecture. All results presented in this paper(except the “in-the-wild” experiments) are run on this testbed.
We divide the activities on the critical path into computation andnetwork activities as follows:
• Computation activities: HTML Parsing, Javascript/CSS eval-uation, and rendering.
• Network activities: Downloading objects.
For example, in Figure 2, the critical path is a mix of computationand network activities: JS evaluation and HTML parsing are com-putation activities, and downloading the HTML, Javascript, and theimages are network activities. Note that several activities occur offof the critical path. Unless stated, we do not consider the activitiesthat are not on the critical path in our analysis because they are notbottlenecks.
4. EXPERIMENTAL SET UPServer and Client: All Linux instances are virtual machines run-ning inside a VMware ESXi 6.0 Bare-Metal Hypervisor. On aver-age, 4 cores at 2.6GHz and 2GB of RAM has been assigned to eachvirtual machine.
We use two Samsung Galaxy S4 phones each with 2GB of RAMand powered by a 1.9 GHz Quad-core Krait 300 CPU running An-droid KitKat. We also experiment with a Samsung Galaxy S6phone with 3GB of RAM and Octa-core 1.5/2.1 GHz Cortex-A53,Cortex-A57 CPUs running Android Lollipop. By default, we presentexperiments conducted on Samsung Galaxy S4 phones on the con-trolled testbed.Network: We run the emulated network experiments on 6 differentnetwork profiles under the following bandwidths: 1Mbps, 5Mbpsand 20Mbps. We experiment with two round trip delays with means50ms and 150ms. The delays are varied according to a normaldistribution. We inject up to 2% packet loss rate based on real worldstudies [19] and the losses are chosen from a random distribution.
lab_WiFi lab_3G lab_4GAverage b20-d50 b1-d50 b5-d50Poor b20-d150 b1-d150 b5-d150
Table 1: Network profiles used in the experiments. “b” stands forbandwidth in each direction and “d” stands for mean round tripdelay. For example, an Average lab_WiFi is denoted by b20-d50and stands for a network whose bandwidth is 20Mbps and whosemean round trip delay is 50ms.
Table 1 shows the different network profiles used in our experi-ments. The network profiles are named after typical WiFi, 3G, and4G conditions for ease of exposition. We map the profiles to theclosest network condition based on lab experiments.Webpages: We experiment with 200 Web pages. We randomlychose 40% of the Web pages from the top 200 Websites in Alexa [1],
30% from the pages from the bottom of Alexa’s 1 million Websites,and the remaining 30% from news Websites on Alexa. We choosea mix of Web pages for the following reason: typically the populartop 200 Web pages on Alexa are smaller (for example, google.com)and are highly optimized. The performance of such Web pages maynot be typical. Instead, we include unpopular pages in our mix be-cause they are likely to not be optimized. We also choose newsWebsites because they tend to be complex pages.
In the common case, we load the original page on both the desk-top and the mobile browser. We perform addition experimentswhere we load the mobile version of the page, that we call mpage.For example, m.cnn.com is an mpage, where the original pageis www.cnn.com. By default, mobile browsers always redirectto the mpage. We modify the user agent field to force the mobilebrowser to load the original page. We do this to directly comparethe performance differences between the mobile and the desktopbrowser.Metrics: We measure page load performance using the Page LoadTime (PLT) metric. The Page Load Time metric is commonly de-fined as the time between when the page is requested and when theDOMLoad event is fired [31]. The DOMLoad event is fired whenall objects are fetched, processed, and added to the DOM. Therehas been several alternate metrics to define page load performancesuch as the above-the-fold metric [15]. However, these alternatemetrics are not easy to compute and are not yet widely used.Limitations of the testbed: While our testbed allows us to performcontrolled experiments, there are several limitations. First, the PLTmetric does not take into account scrolling speeds, refresh rates,and other user-perceived Quality of Experience metrics. These areoutside the scope of this work. Second, the page load performanceis not only affected by the network bandwidth and delay, but also bynetwork variance. By controlling the network, we lose the networkvariances seen in real environments. However, there is a trade-offbetween doing controlled experiments and doing experiments thatare close to the real world. In this work, we lean towards controlledexperiments so that we can perform meaningful comparisons be-tween the desktop and the mobile browser.
Finally, our findings are specific to the version of the Chromiumbrowsers we choose. We believe that the findings from this workwill apply broadly and can help influence future browser versions.
5. COMPUTATION IS THE BOTTLENECKIn this section, we present the page load times and bottlenecks in
loading pages on the desktop and the mobile browser. We load boththe original version of the page and mpages under all the networkprofiles for all Web pages, as discussed in §4.
Our key findings are as follows:
• On the mobile browser, on almost all the network profilesstarting from Average lab_WiFi to Poor lab_3G, the timespent on computation activities on the critical path is sig-nificantly higher than on network activities. On the desktopbrowser, the phenomenon is reversed; irrespective of the net-work profile, almost always network activities are more of abottleneck.
• Computation is the key bottleneck even on newer SamsungGalaxy S6 phones with arguably better computational capac-ity.
• Our results are not specific to our controlled experimentaltestbed. When pages are loaded in-the-wild, i.e., from theoriginal Web server on real WiFi links, computation is stillthe bottleneck during page load on the mobile browser.
1308

5.1 Page load timesFigure 4 shows the page load times to load pages on the desk-
top browser and the mobile browser. In the median case, page loadtimes are two times slower on the mobile browser compared to thedesktop browser, even when both browsers see similar restrictionsin bandwidth and delays. The difference holds even in the top 20%of the cases, not shown in the figure because of the long tail. Notethat the same pages are being loaded under the same network con-ditions; the changes in page load performance are largely becauseof the mobile versus the desktop device/browser.
0 1000 2000 3000 4000 5000
Page load time (ms)
0.0
0.2
0.4
0.6
0.8
1.0
CD
F
desktopmobile
Figure 4: Page load times when loading original pages on themobile browser and the desktop browser. Results for Averagelab_WiFi.
0.0 0.2 0.4 0.6 0.8 1.0
Fraction of network and computation time on critical path
0.0
0.2
0.4
0.6
0.8
1.0
CD
F
ComputationNetworking
(a) Mobile, Average lab_WiFi
0.0 0.2 0.4 0.6 0.8 1.0
Fraction of network and computation time on critical path
0.0
0.2
0.4
0.6
0.8
1.0
CD
F
ComputationNetworking
(b) Mobile, Average lab_4G
0.0 0.2 0.4 0.6 0.8 1.0
Fraction of network and computation time on critical path
0.0
0.2
0.4
0.6
0.8
1.0
CD
F
ComputationNetworking
(c) Desktop, Average lab_WiFi
0.0 0.2 0.4 0.6 0.8 1.0
Fraction of network and computation time on critical path
0.0
0.2
0.4
0.6
0.8
1.0
CD
F
ComputationNetworking
(d) Desktop, Average lab_4G
Figure 5: Fraction of network and computation time on criticalpath when loading pages on the Average lab_WiFi and the Averagelab_4G networks. Under average connectivity, computation activi-ties is more of a bottleneck for the mobile browser, while networkactivities is the primary bottleneck for the desktop browser.
5.2 Bottleneck in mobile versus desktop browsersFigure 4 showed significant difference in page load performance
between the mobile and the desktop browser even when pages areloaded under similar conditions. To understand this further, westudy the bottleneck.
Figure 5 shows the fraction of computation and network activi-ties on the critical path when loading pages on the mobile and the
0.0 0.2 0.4 0.6 0.8 1.0
Fraction of network and computation time on critical path
0.0
0.2
0.4
0.6
0.8
1.0
CD
F
ComputationNetworking
(a) Mobile browser, Poor lab_WiFi
0.0 0.2 0.4 0.6 0.8 1.0
Fraction of network and computation time on critical path
0.0
0.2
0.4
0.6
0.8
1.0
CD
F
ComputationNetworking
(b) Mobile browser, Poor lab_4G
0.0 0.2 0.4 0.6 0.8 1.0
Fraction of network and computation time on critical path
0.0
0.2
0.4
0.6
0.8
1.0
CD
F
ComputationNetworking
(c) Desktop browser, Poor lab_WiFi
0.0 0.2 0.4 0.6 0.8 1.0
Fraction of network and computation time on critical path
0.0
0.2
0.4
0.6
0.8
1.0
CD
F
ComputationNetworking
(d) Desktop browser, Poor lab_4G
Figure 6: Fraction of network and computation time on critical pathwhen loading pages on the Poor lab_WiFi and the Poor lab_4G net-works. Even under poor network connectivity, computation activ-ities is the primary bottleneck for the mobile browser. Under poorconnectivity, network activities becomes even more of a bottleneckfor the desktop browser.
desktop browsers. The results are for average network conditions,under Average lab_WiFi and Average lab_4G networks. The defi-nition of computation and network activities can be found in §3.3and the network profiles are specified in §4.
Figure 5a and 5b show the fraction of computation and networkactivities when loading the page on the mobile browser for the twonetwork profiles. In both cases, in the median case, computationactivities occupy more than 60% of the critical path. Network ac-tivities occupy less than 40% of the critical path.
Figures 5c and 5d show that, in contrast, on the desktop browser,network activities occupy 60% of the critical path. The results forthe Average lab_3G network is quantitatively similar (not shownhere).
0.0 0.2 0.4 0.6 0.8 1.0
Fraction of network and computation time on critical path
0.0
0.2
0.4
0.6
0.8
1.0
CD
F
ComputationNetworking
Figure 7: Fraction of network and computation time on critical pathwhen loading mpages on the Average lab_WiFi network.
Next, we look at poor network environments. Figure 6 shows thefraction of computation and network activities on the critical path,when the mean round trip delay is 150ms. On the mobile browser,Figure 6a shows that computation activities continue to be the mainbottleneck for page load, accounting for 55% of the critical path in
1309

0 2000 4000 6000 8000 10000 12000
Page load time (ms)
0.0
0.2
0.4
0.6
0.8
1.0
CD
FS6S4
(a) PLTs when loading Web pages on Samsung Galaxy S4 andS6 phones. The pages were loaded on the Average lab_4G net-work.
0.0 0.2 0.4 0.6 0.8 1.0
Fraction of network and computation time on critical path
0.0
0.2
0.4
0.6
0.8
1.0
CD
F
ComputationNetworking
(b) Fraction of network and computation time on critical pathwhen loading pages in Samsung Galaxy S6 phones on the Av-erage lab_4G network.
Figure 8: Results from experiments on Samsung Galaxy S6
the median case. It is only in the Poor lab_4G environment thatthe network activities become more of a bottleneck compared tocomputation activities. As the network conditions worsen, networkactivities start becoming the primary bottleneck during page load.
On the other hand, on the desktop browsers the poor networkcondition only makes the bottleneck due to network activities morepronounced (Figures 6c and 6d).
5.3 Bottleneck when loading mpagesFigure 7 shows the bottlenecks when loading mpages on the
mobile browser. Continuing the trend, we find that when loadingmpages, computation activities are the primary bottleneck. In themedian case, 65% of the critical path constitutes computation ac-tivities, and only 35% of the critical path constitutes network activ-ities.
Mobile pages such as m.cnn.com are smaller versions of theoriginal cnn.com page, with smaller object sizes. Therefore, thenetwork activities for loading an mpage should not take as longcompared to loading the original page. Our analysis of the numberof bytes downloaded when loading an mpage versus loading theoriginal page confirms this hypothesis (§6.3). However, mpagesdo not significantly reduce the computation activities required toload the page. Therefore, it is not surprising that the computationactivities continue to be the bottleneck when loading mpages.
5.4 Experiments on Samsung Galaxy S6We repeated the controlled page load experiments on Samsung
Galaxy S6. The goal of this experiment is to observe if the bottle-
0 1 2 3 4 5 6 7
PLT of mobile/PLT of non-mobile
0.0
0.2
0.4
0.6
0.8
1.0
CD
F Desktop loads pages faster than mobile
Figure 9: The ratio of page load times on the mobilebrowser versus the desktop browser, when loading pagesin-the-wild.
0.0 0.2 0.4 0.6 0.8 1.0
Fraction of network and computation time on critical path
0.0
0.2
0.4
0.6
0.8
1.0
CD
F
ComputationNetworking
Figure 10: Fraction of network and computation timeon critical path when loading pages on mobile browserin-the-wild.
neck due to computation activities in mobile browsers are a func-tion of a weaker processor. The S6 phone has four ARM Cortex-A57 cores clocked at 2.1GHz, and four Cortex-A53 cores clockedat 1.5GHz, compared to the quad-core, 1.7GHz Samsung S4 phones.First we look at the page load time differences: Figure 8a showsthat the page load times on S6 is not significantly different com-pared to the page load times on S4.
As before, we next look at the bottlenecks in S6. Figure 8b showsthat computation activities is still the primary bottleneck, constitut-ing 62% of the critical path in the median case. There are twopossible reasons for this result. Either, the browsers are not able touse the additional CPU capacity effectively, or the increase in CPUis not enough to change the bottleneck. We will explore this furtheras part of future work.
5.5 Experiments in-the-wildFinally, we load web pages on the desktop and the mobile browser
outside of our experimental testbed. The web pages are fetchedfrom the Web server. The desktop browser uses the campus Eth-ernet connection (bandwidth 250Mbps), while the mobile browseruses the campus WiFi connection (bandwidth 30Mbps). The goalof this experiment is to study if the observations we make in thecontrolled setting also hold true in general.
We first perform a pairwise comparison of loading pages on thedesktop versus the mobile browser. Figure 9 shows the ratio ofthe time to load the page on the mobile browser versus the desk-top browser. The line x = 1 shows the points when the page loadtimes of the mobile and the desktop browsers are equal; all pointsto the right show cases when the desktop browser is faster. Figure 9
1310

0.1 0.2 0.3 0.4 0.5 0.6 0.7 0.8 0.9 1.0
Similarity metric
0.0
0.2
0.4
0.6
0.8
1.0C
DF
Figure 11: Similarity metric: the fraction oftime the same <URL, activity> pair occur onthe critical path when loading the page on themobile browser and the desktop browser. Eachactivity is associated with a unique URL. Re-sults from all network profiles.
Download HTML parsing JS eval CSS eval0.0
0.1
0.2
0.3
0.4
0.5
Perc
enta
gein
criti
calp
ath
desktopmobilempage
Figure 12: Looser similarity metric: the frac-tion of time an activity occurs on the criticalpath when loading the page on the mobile andthe desktop browser. The URL associated withthe activity may be different. Results from allnetwork profiles.
0 2 4 6 8 10
Ratio of the mobile vs desktop latency for activities on the critical path
0.0
0.2
0.4
0.6
0.8
1.0
CD
F
Computation
Figure 13: Ratio of the time taken to completecomputation activities on the mobile browserversus the desktop browser. The activityshould be on the critical path of at least oneof the two browser loads. Pages loaded on theAverage lab_WiFi network.
shows that in all cases, the desktop browser is faster than the mobilebrowser to load the same page. In the median case, loading a pageon the mobile browser is three times as slow compared to the desk-top browser. Note that these experiments are not performed in acontrolled setting. So the difference in performance between load-ing the pages on the desktop browser versus the mobile browsermay be due to several factors.
Figure 10 shows the fraction of computation versus network ac-tivities on the critical path when loading pages on the mobile browserin-the-wild. We find that computation activities are even more ofa bottleneck; in the median case, close to 70% of the critical pathis composed of computation activities. On the desktop browser, asbefore, we find that network activities continues to be the primarybottleneck (not shown here). Our in-the-wild experiments showthat our observations about the mobile and the desktop browserbottlenecks holds true more generally, and is not specific to ourtestbed.
6. CRITICAL PATH ANALYSISIn the previous section, we looked at the differences in critical
path between the mobile and the desktop browser at a macro-level.Next, we study the critical paths at a more micro-level. Our keyfindings are as following:
• Even when loading the same page on the same network pro-file, the critical path on the mobile browser and on the desk-top browser are different in terms of the exact objects down-loaded, the Javascript executed, etc. However, in terms ofthe fraction of page load activities on the critical path, thetwo critical paths are similar.
• For each computation activity on the critical path, it takes 4times as long to perform the activity on the mobile browsercompared to the desktop browser.
• On the mobile browser, of all the computation activities, HTMLparsing is the most dominant on the critical path; renderingactivities are the least dominant.
6.1 Comparing critical paths on the desktopand the mobile browser
The critical path consists of a series of activities such as HTMLloading, HTML parsing, downloading images, JavaScript, and CSS,
and evaluating the CSS and Javascript (see Figure 2). Going onelevel deeper, each of the activities are associated with a uniqueURL. For example, two activities that are both downloading animage are downloading different images associated with differentURLs.
Our goal is to study the similarity between the critical path whenloading a page on the desktop versus the mobile browser. We de-fine the similarity metric as follows: the fraction of time the same<URL, activity> pair occurs on the critical path when loading thepage on the desktop browser and the mobile browser.
Figure 11 shows the similarity metric across all network profiles.Even when the same page is being loaded under the same networkprofile, the critical path is identical only for 20% of pages. For an-other 20% of the pages, only 50% of the critical path is similar. Thisresult has implications for optimization. It shows that optimizing aspecific activity, such as making the content of a specific Javascriptobject smaller, may not have the same effect on the mobile browseras they would on the desktop browser.
Next, we relax the definition of similarity and look at the per-centage of time the same activity occurs on both the critical paths,but not necessarily associated with the same URLs. For example, ifthe desktop critical path contains the image download activity for,say downloading image1, but the mobile critical path contains an-other image download activity, for a different image, image2, weconsider them to be similar. Note that, in Figure 11, these twoactivities will be considered dissimilar because they are not down-loading the same image.
Figure 12 shows the percentage of each activity on the criticalpath across all pages and network profiles. For every page, the ac-tivities on the critical path in terms of Javascript evaluation, HTMLparsing etc are similar on the desktop and the mobile browser. Oneof the implications of this result is that optimizations that targeta class of activities, such as reducing the time to download allJavascript objects, are likely to provide benefits across mobile anddesktop browsers.
6.2 Comparing the latency for each activityon the critical path
Figure 12 showed that in terms of the number of the activitieson the critical path, the desktop and the mobile browser are similar,even though the URL of the activities may be different (Figure 11).However, we know that the length of the critical path (i.e., the PLT)is much smaller for the desktop browser compared to the mobile
1311

0 1000 2000 3000 4000 5000
Total number of bytes downloaded (KB)
0.0
0.2
0.4
0.6
0.8
1.0C
DF
mobilempage
Figure 14: Total bytes downloaded when load-ing the original versus mpage on the mobilebrowser. Results from all network profiles.
0 200 400 600 800 1000
Number of bytes on critical path (KB)
0.0
0.2
0.4
0.6
0.8
1.0
CD
F
desktopmobilempage
Figure 15: Bytes downloaded on the criticalpath when loading the original page on thedesktop and the mobile, and loading mpages.Results from all network profiles.
0 100 200 300 400 500
Time (ms)
0.0
0.2
0.4
0.6
0.8
1.0
CD
F
CSSJavascriptHTML parsingRendering
Figure 16: The breakdown of the computationactivities on the critical path. Results fromexperiments on the S6 phone on the Averagelab_WiFi network.
browser (Figure 4). To understand this, we measure the time takento complete an activity on the mobile versus the desktop browser.
We consider all activities that are on the critical path of at leastone of the two browsers. We then compare the time taken foreach of these activities to complete on the mobile and the desk-top browser. Since we load the exact same page, each activity hasto be performed both by the desktop and the mobile browser.
Figure 13 shows the time take for each computation activity tobe performed on the mobile versus the desktop browser. Each ac-tivity takes over 4 times longer to perform on the mobile browsercompared to the desktop browser. This is one of the reasons forthe mobile browser performance to be much worse compared tothe desktop browser performance even under similar network con-ditions.
Surprisingly, the time taken for network activities is also smalleron the desktop browser compared to the mobile browser (not shownin figure). In 40% of the cases, the difference is insignificant, butfor the remaining 60%, the difference is higher, even though thepages are loaded under the same network conditions. This can pos-sibly be because of a less optimized network stack on the mobilebrowser compared to the desktop browser. We will investigate thisfurther as part of future work.
6.3 The breakdown of network and computa-tion activities on the critical path
Figure 14 shows the total bytes downloaded when loading theoriginal page and loading the mpage on the mobile browser. Eventhough mpages are designed to be smaller, for 60% of the pages,the total objects downloaded remains the same. But for 30% of thepages, the difference in size is over 60%. The results suggests thatmpages significantly reduces the size of a small number of pages,but for a large fraction of pages, there is not much difference be-tween the mpage and the original page.
Figure 15 shows the bytes downloaded on the critical path whenloading the original page on the desktop and the mobile browser,and when loading mpage. Here we find that mpages do reducethe number of objects loaded in the critical path for over 40% ofthe pages. In a separate experiment (not shown here), we find thatloading mpages does not reduce the computation time on the criti-cal path.
With respect to computation, Figure 16 shows the breakdownof the various computation activities on the critical path. HTMLparsing is the dominant activity on the critical path, far outweighingthe time spent on Javascript and CSS evaluation. Rendering only
occupies a small part of the critical path, as also shown by otherresearchers [33].
7. EFFECT OF PAGE TYPE AND NETWORKIn this section, we present our results on the effect of page type
and network on the page load time. Our key findings are as follows:
• For page sizes of less than 250 KB, there is no significant dif-ference in performance between the mobile and the desktopbrowser. For larger pages, there is significant performancedifference.
• Under poor bandwidth conditions, changes in round trip de-lays does not affect page load times. Similarly, when theround trip times are high, bandwidth does not have signifi-cant effect on page load times.
• The desktop browser is able to use good network conditionsbetter than the mobile browser.
7.1 Effect of page typeIn this section, we look into desktop and mobile page load times
based on the page size. In our experiments, 25% of analyzed Webpages had size less than 250KB. We define these Web pages assmall pages and the rest as large pages.
Figure 17 shows that there is no significant difference in pageload time when loading small pages on the mobile versus the desk-top browser. But for large Web pages, the page load times on themobile browser is almost twice as high compared to the desktopbrowser in the median case. The results were similar for other net-work settings.
Figure 18 shows the time spent on network activities on the crit-ical path to load the small versus large pages. For both small andlarge pages, the time spent on network activities on the critical pathis not very different on the mobile and the desktop browser.
Figure 19 shows the time spent on computation activities on thecritical path to load small versus large pages. In this case, as before,for small pages, the computation time on the critical path is notsignificantly different when comparing page loads on the desktopand the mobile browser. But for the larger pages, we find that thecomputation time when loading the page on the mobile browser isalmost two times that of loading the page on the desktop browserin the median case.
In effect, the difference in page load performance when load-ing pages on the mobile versus the desktop browser is more pro-nounced for larger pages. This difference is because of the addi-
1312

0 2000 4000 6000 8000 10000
Page load time (ms)
0.0
0.2
0.4
0.6
0.8
1.0C
DF
Desktop large pagesDesktop small pagesMobile large pagesMobile small pages
Figure 17: Page load time for small and largeWeb pages in mobile and desktop browsers onthe Average lab_WiFi network.
0 2000 4000 6000 8000 10000
Networking time (ms)
0.0
0.2
0.4
0.6
0.8
1.0
CD
F
Desktop large pagesDesktop small pagesMobile large pagesMobile small pages
Figure 18: Time spent on network activities onthe critical path to load small and large Webpages on the Average lab_WiFi network.
0 2000 4000 6000 8000 10000
Computation time (ms)
0.0
0.2
0.4
0.6
0.8
1.0
CD
F
Desktop large pagesDesktop small pagesMobile large pagesMobile small pages
Figure 19: Time spent on computation activi-ties on the critical path to load small and largeWeb pages on the Average lab_WiFi network.
0 2000 4000 6000 8000 10000
Page load time (ms)
0.0
0.2
0.4
0.6
0.8
1.0
CD
F
Average Lab 3GPoor lab 3GAverage lab WifiPoor lab Wifi
Figure 20: Page load time under Averagelab_3G, Poor lab_3G, Average lab_WiFi, andPoor lab_WiFi networks when loading pageson the mobile browser.
0 2000 4000 6000 8000 10000
Page load time (ms)
0.0
0.2
0.4
0.6
0.8
1.0C
DF
Good Lab 4GPoor lab 4GGood lab WifiPoor lab Wifi
Figure 21: Page load time under Goodlab_4G, Poor lab_4G, Good lab_WiFi, andPoor lab_WiFi network profiles when loadingpages on the mobile browser.
0 1 2 3 4 5
Ratio
0.0
0.2
0.4
0.6
0.8
1.0
CD
F
Desktop loads faster
Mobile/Desktop PLT, Good lab 4GMobile/Desktop PLT, Poor lab 4GMobile/Desktop PLT, Good lab WifiMobile/Desktop PLT, Poor lab Wifi
Figure 22: The ratio of the page load timewhen loading pages on the mobile and thedesktop browser under Good lab_4G, Poorlab_4G, Good lab_WiFi, Poor lab_WiFi net-work.
tional time taken by the mobile browser to complete computationactivities on the critical path.
7.2 Effect of networkFigure 20 shows the page load times under various network con-
ditions on the mobile browser, starting from Average lab_WiFi toPoor lab_3G. When the bandwidth is poor, as in the case of lab_3G(with 1Mbps bandwidth), round trip times does not affect the pageload time; for instance, the page load time under Poor lab_3G (RTT= 150ms) and Average lab_3G (RTT = 50ms) is similar.
Figure 21 shows that, similarly, when the network experienceshigh RTTs, the bandwidth does not affect page load time. Underhigh RTT of 150ms, both lab_WiFi (bandwidth = 20 Mbps) andlab_4G (bandwidth = 5 Mbps) perform similarly. In these graphs,we define Good lab_Wifi and Good lab_4G to be the same as Aver-age lab_WiFi and Average lab_4G networks, respectively, in termsof bandwidth, but with mean round trip delays of 5ms.
Finally, Figure 22 shows that ratio of the page load time on themobile browser and the desktop browser for different network pro-files. Points to the right of x = 1 line shows the area wherethe desktop browser is faster. The difference between the desktopbrowser and the mobile browser is highest for the Good lab_WiFinetwork, which is the network with the best bandwidth and roundtrip times across our network settings. In this setting, the page loadtime on the mobile browser is 3.5 times higher than the desktopbrowser in the median case. As the network conditions worsen, asin the case of Poor lab_4G, the difference in performance betweenthe mobile and the desktop browser decreases. One possible hy-
pothesis is that the desktop browser is able to utilize good networkconditions much better than the mobile browser.
8. RELATED WORKIn this section, we will discuss related literature on mobile browsers.
We will also discuss literature on desktop browsers when applica-ble, since mobile browsers have not yet seen the kind of extensiveresearch as compared to desktop browsers.
Improving mobile browsers: Erman et al. [20] show that unlikedesktop browsers, optimizations such as SPDY/HTTP2 does notimprove performance of Web pages on mobile browsers. Theyshow that this is because of the negative interactions between thecellular state machine and the transport protocol. Similarly, Qianet al. [27] show that caching does not provide page load improve-ments for mobile browsers.
Many of the research on explicitly improving mobile browserperformance has seen mixed results. Flywheel [16] is Google’scompression proxy that compresses web content to significantlyreduce the use of expensive cellular data. The authors note thatwhile FlyWheel succeeds in reducing data usage, its effect on pageload performance is more mixed; it helps performance of certainpages and hurts performance of others. FlexiWeb [29] is built overGoogle’s compression proxy to ensure that the proxy does not hurtpage load times. But FlexiWeb is not designed to explicitly improvepage load performance. Wang et.al [34] show that speculative load-ing is one of the only client-only approaches that can improve mo-
1313

bile browser performance. However, speculative loading requiresknowledge of what objects are likely to be requested by the user.
Other research works have looked at metrics orthogonal to thepage load time metric. Parcel [30] uses a proxy approach to dividethe page load process between the mobile device and the proxy. Be-cause Parcel is a network approach, the evaluations are largely withrespect to reduction in network latencies. Klotski [17] focusses onincreasing the number of objects rendered in the first 5 seconds toimprove user Quality of Experience.
While there has been several recent efforts on improving mobilebrowser performance, they have not been uniformly successful. Inour work, we are studying the fundamental bottlenecks in mobilebrowsers as a first step towards designing effective mobile Web op-timizations. Importantly, our goal is to compare the page load per-formance between the desktop and the mobile browser, to under-stand why and how mobile browsers differ from desktop browsers.
Measurement Studies: The browser study presented by Wanget.al [33] in 2011 is the closest to our measurement set up. Similarto our set up, their work also uses an instrumented Webkit and ex-tracts dependency relations in the browser load process. Our find-ings are largely consistent with the What-If analysis presented inthe paper [33] for a small set of 10 Web pages. Notably, they findthat rendering does not significantly contribute to browser delays,and a more powerful operating system can improve browser perfor-mance.
Different from our findings, their work finds that higher band-width does not effect performance because Web page sizes aresmall. However, Web pages have become more complex now com-pared to 2011 [36]; as a result, we find that for current Web pages,higher bandwidth does improve page load times. Our work expandson this study by performing a more extensive dependency analy-sis for a larger number of pages. Importantly, we enable pairwisecomparisons between mobile and desktop browsers to understandthe critical differences between the two.
Qian et al. [28] provide one of the first detailed measurementstudy of mobile browsers, but focus on cellular data and energy us-age rather than page load times. Zaki et. al [38] measure the mobilebrowser performance in Ghana, focussing only on the network de-lays. They find that the network delays in Ghana are largely causedby DNS, HTTP redirections, and SSL handshake.
Industry tools: All major browsers, including Chrome, Firefox,and Internet explorer, provide developer tools to study browser per-formance [5, 21, 3]. Many of these tools are designed for desktopbrowsers, but they are starting to be developed for mobile. Whilethe developer tools provide network timings, they ignore the tim-ings for the computational activities, and cannot be used to con-struct the critical path [31]. New tracing tools such as chrome://tracing [13] provide more fine-grained information about chromeinternals, but again, do not have enough information to extract thecritical path.
Google Octane [7] benchmarks the performance of the Javascriptengine of a browser by running a suite of tests. Browsermark [2]is a browser benchmarking tool which helps a user to decide whichbrowser offers the best Web experience. We, on the other hand,are focused on characterizing the bottlenecks during mobile pageloads. We believe that once the bottlenecks are identified, each ofthe above mentioned benchmarking tools can play a role in improv-ing page load performance.
Measurement platforms such as WebPageTest [35] and HTTPArchives [22] allow researchers to perform Web page measure-ments from several vantage points. They provide measurement data
from a large number of networks and devices. However, we stilllack tools to directly compare the performance of desktop and mo-bile browsers, or to analyze the critical path.
Finally, Google’s PageSpeed Insight [8] and Yahoo’s YSlow [37]are industry tools that take a Webpage URL as input and suggestoptimizations. The tools apply static rules to the page. For ex-ample, if an object is not compressed, the tool may suggest thatthe object be compressed, even if loading the object is not the bot-tleneck. Analyzing page load bottlenecks can greatly improve theoptimization suggestions of these tools.
Testbeds: In terms of experimental testbed, Mahimahi [26] is theclosest to our work. Mahimahi uses an HTTP-based record and re-play tool for repeatable page load experiments on desktop browsers.Our goals on repeatability are similar. But we focus on studying thecritical path, and therefore record the page load time at the objectlevel rather than at the HTTP level.
WebProphet [23] was one of the first works to discuss depen-dencies for desktop browsers. WebProphet uncovered dependen-cies in desktop browsers, assuming the computational activities tobe a black box. Our previous work WProf [31], improved overWebProphet by uncovering both network and computation depen-dencies. In this work, we port WProf to a mobile browser.
9. IMPLICATIONS/CONCLUSIONSIn this work, we perform an in-depth study of bottlenecks in
mobile browsers vis-a-vis desktop browsers. To identify the lowlevel page load activities and extract the bottlenecks when loadinga mobile page, we leverage our past work to build WProf-M, an in-browser profiler for Android Chromium. We build an experimentaltestbed that allows us to directly compare the low-level page loadactivities and bottlenecks when loading a page on a mobile versusa desktop browser. We use the testbed to better isolate the differ-ences in page load performance caused by the mobile device andthe mobile browser.
Our results have several implications for mobile browser opti-mization. First we find that computation activities are the main bot-tleneck is mobile browsers. This is in contrast to desktop browserswhere network activities are the main bottleneck. This has im-plications for mobile browser optimizations which have focussedmore on reducing the networking latency during page load, andnot enough on reducing the computational bottlenecks. Second,we find that the activities on the critical path can be different whenloading pages on the mobile browser compared to the desktop browser.Therefore, optimizing a specific object on the critical path may notprovide similar benefits on the desktop and the mobile browser.Finally, smaller pages do not see significant difference in perfor-mance when loading on the mobile versus the desktop browser.Therefore, we should focus on optimizing larger pages.
AcknowledgementsFirst, a special thanks to University of Washington undergraduatestudent Tyler Jacoby who helped a great deal in porting WProf tothe Android version. Thank you to Xiao Sophia Wang for providinghelpful feedback and comments during the porting process. Thiswork was supported by the National Science Foundation, throughthe grant CNS-1551909. Sincere thanks to Stony Brook Mastersstudents Naveen Nuthalapati (for help with experiments) and PavanMuguluri (for help with debugging the WProf visualization). Wegratefully acknowledge the anonymous reviewers.
1314

10. REFERENCES[1] Alexa. http://www.alexa.com/.[2] Browsermark. http://web.basemark.com/.[3] Chrome developer tools.
https://developer.chrome.com/devtools/.[4] Ericsson mobility report june 2015:
http://www.ericsson.com/res/docs/2015/ericsson-mobility-report-june-2015.pdf.
[5] Firefox Developer Tools. https://developer.mozilla.org/en-US/docs/Tools.
[6] Google developers: Analyzing critical rendering pathperformance. https://developers.google.com/web/fundamentals/performance/critical-rendering-path/?hl=en.
[7] Google Octane.https://developers.google.com/octane.
[8] Google Pagespeed Insights. https://developers.google.com/speed/pagespeed/insights.
[9] HTTP/2. https://http2.github.io/.[10] Mobile-only users surpass desktop-only users.
http://marketingland.com/mobile-only-users-surpassed-pc-only.
[11] Network Namespace.http://blog.scottlowe.org/2013/09/04/introducing-linux-network-namespaces.
[12] SPDY. https://www.chromium.org/spdy/spdy-whitepaper.
[13] The Trace Event Profiling Tool .https://www.chromium.org/developers/how-tos/trace-event-profiling-tool.
[14] W3C: Document Object Model.http://www.w3.org/DOM/.
[15] Above the fold time.http://www.webperformancetoday.com/.
[16] V. Agababov, M. Buettner, V. Chudnovsky, M. Cogan,B. Greenstein, S. McDaniel, M. Piatek, C. Scott, M. Welsh,and B. Yin. Flywheel: Google’s data compression proxy forthe mobile web. In Proceedings of the 12th USENIXConference on Networked Systems Design andImplementation, NSDI’15, Berkeley, CA, USA, 2015.USENIX Association.
[17] M. Butkiewicz, D. Wang, Z. Wu, H. V. Madhyastha, andV. Sekar. Klotski: Reprioritizing web content to improve userexperience on mobile devices. In 12th USENIX Symposiumon Networked Systems Design and Implementation (NSDI15), Oakland, CA, 2015. USENIX Association.
[18] X. Chen, A. Jindal, N. Ding, Y. C. Hu, M. Gupta, andR. Vannithamby. Smartphone background activities in thewild: Origin, energy drain, and optimization. In Proceedingsof the 21st Annual International Conference on MobileComputing and Networking, MobiCom ’15, pages 40–52,New York, NY, USA, 2015. ACM.
[19] N. Dukkipati, M. Mathis, Y. Cheng, and M. Ghobadi.Proportional rate reduction for tcp. In Proceedings of the11th ACM SIGCOMM Conference on Internet Measurement2011, Berlin, Germany - November 2-4, 2011, 2011.
[20] J. Erman, V. Gopalakrishnan, R. Jana, and K. K.Ramakrishnan. Towards a spdy’ier mobile web? InProceedings of the Ninth ACM Conference on EmergingNetworking Experiments and Technologies, CoNEXT ’13,pages 303–314, New York, NY, USA, 2013. ACM.
[21] Firebug. http://getfirebug.com/.[22] HTTP Archive. http://httparchive.org/.[23] Z. Li, M. Zhang, Z. Zhu, Y. Chen, A. Greenberg, and Y.-M.
Wang. WebProphet: automating performance prediction forweb services. In Proc. of USENIX NSDI, 2010.
[24] L. A. Meyerovich and R. Bodik. Fast and parallel webpagelayout. In Proc. of the international conference on WorldWide Web (WWW), 2010.
[25] J. Mickens. Silo: Exploiting JavaScript and DOM Storagefor Faster Page Loads. In Proc. of USENIX conference onWeb Application Development (WebApps), 2010.
[26] R. Netravali, A. Sivaraman, S. Das, A. Goyal, K. Winstein,J. Mickens, and H. Balakrishnan. Mahimahi: AccurateRecord-and-Replay for HTTP. In USENIX Annual TechnicalConference 2015, Santa Clara, CA, July 2015.
[27] F. Qian, K. S. Quah, J. Huang, J. Erman, A. Gerber, Z. Mao,S. Sen, and O. Spatscheck. Web caching on smartphones:Ideal vs. reality. In MobiSys ’12, pages 127–140, New York,NY, USA, 2012.
[28] F. Qian, S. Sen, and O. Spatscheck. Characterizing resourceusage for mobile web browsing. MobiSys ’14, pages218–231, New York, NY, USA, 2014. ACM.
[29] S. Singh, H. V. Madhyastha, S. V. Krishnamurthy, andR. Govindan. Flexiweb: Network-aware compaction foraccelerating mobile web transfers. In Proceedings of the 21stAnnual International Conference on Mobile Computing andNetworking, MobiCom ’15, pages 604–616, New York, NY,USA, 2015. ACM.
[30] A. Sivakumar, S. Puzhavakath Narayanan,V. Gopalakrishnan, S. Lee, S. Rao, and S. Sen. Parcel: Proxyassisted browsing in cellular networks for energy and latencyreduction. In Proceedings of the 10th ACM International onConference on Emerging Networking Experiments andTechnologies, CoNEXT ’14, New York, NY, USA, 2014.ACM.
[31] X. S. Wang, A. Balasubramanian, A. Krishnamurthy, andD. Wetherall. Demystify page load performance with wprof.In Proc. of the USENIX conference on Networked SystemsDesign and Implementation (NSDI), 2013.
[32] X. S. Wang, A. Balasubramanian, A. Krishnamurthy, andD. Wetherall. How speedy is spdy? In Proceedings of the11th USENIX Conference on Networked Systems Design andImplementation, NSDI’14, pages 387–399, Berkeley, CA,USA, 2014. USENIX Association.
[33] Z. Wang, F. X. Lin, L. Zhong, and M. Chishtie. Why are webbrowsers slow on smartphones? In Proceedings of the 12thWorkshop on Mobile Computing Systems and Applications,pages 91–96. ACM, 2011.
[34] Z. Wang, F. X. Lin, L. Zhong, and M. Chishtie. How far canclient-only solutions go for mobile browser speed? InProceedings of the 21st International Conference on WorldWide Web, WWW ’12, pages 31–40, New York, NY, USA,2012. ACM.
[35] WebPagetest. http://www.webpagetest.org/.[36] WebsiteOptimization. Web growth, 2014.[37] YSlow. http://yslow.org/.[38] Y. Zaki, J. Chen, T. Pötsch, T. Ahmad, and L. Subramanian.
Dissecting web latency in ghana. In Proceedings of theInternet Measurement Conference (IMC). Vancouver,Canada, November 2014., 2014.
1315