AN EXAMINATION OF THE HEALTH BELIEF MODEL ... - CORE
323
AN EXAMINATION OF THE HEALTH BELIEF MODEL WHEN APPLIED TO DIABETES MELLITUS Thesis submitted for the degree of Doctor of Philosophy to the Department of Psychology University of Sheffield by KATHRYN S LEWIS BA (Hons) JANUARY 1994
-
Upload
khangminh22 -
Category
Documents
-
view
1 -
download
0
Transcript of AN EXAMINATION OF THE HEALTH BELIEF MODEL ... - CORE

AN EXAMINATION OF THE HEALTH BELIEF MODEL WHEN
APPLIED TO DIABETES MELLITUS
Thesis submitted for the degreeof Doctor of Philosophy
to the Department of PsychologyUniversity of Sheffield
by
KATHRYN S LEWIS
BA (Hons)
JANUARY 1994

ACKNOWLEDGEMENTS
During the stages of planning, data collection, data analyses, and the
writing-up of this research, many people gave their help and guidance. In
particular, I would like to give special thanks to Dr Clare Bradley for her
inspiration, encouragement, and supervision throughout the course of this
project. I would also like to thank Dr Paul Jackson and Dr Adrian Simpson
for their helpful advice concerning statistical analyses. I am also extremely
grateful to Dr John Ward and Dr Adrian Jennings for their help and
co-operation in obtaining the physiological and clinical data necessary for
the research. Thanks are also due to other members of the Royal
Hallamshire Hospital staff for their time and patience during the education
intervention study, particularly, diabetes nurse specialist, Mary MacKinnon,
and dietitian, Susan Murdoch. I am also particularly indebted to the many
people who consented to take part in the studies and patiently completed the
numerous questionnaires. Finally, I would like to thank my husband,
Mark, and my daughter, Jane, for their support and encouragement.

SUMMARY
Previous research studies which have used Health Belief Model (I-IBM)
dimensions in order to understand health outcomes have many problems
which prevent clear and reliable conclusions about their results. Studies
about diabetes-related health beliefs have proved to be no exception to this
rule. The research presented here is an attempt to address some of these
problems which include the lack of satisfactory scales to measure
diabetes-related health beliefs, the use of heterogeneous samples of patients
with different disease and regimen types, and the lack of prospective studies
in which health beliefs are used to predict outcomes in the future. Another
major problem which applies to all HBM research is that the relationships
between the various dimensions of the model have not been determined. As
such, the HBM is not a model at all but a catalogue of variables. The
present research aimed to specify the relationships between the components
of the HBM and attempted to integrate self-efficacy and locus of control
beliefs in order to extend the model and improve the amount of outcome
variance explained.
Scales to measure diabetes-specific health beliefs were developed from the
responses of 187 tablet-treated outpatients with Type II diabetes. Health
beliefs were examined, on the one hand, in relation to other psychological
and behavioural variables, and on the other, for their sensitivity to change
after educational and treatment interventions. Both cross-sectional and
longitudinal study designs were employed. The relationships between the
HBM components themselves were explored in a linear and non-linear
fashion.

44 - 65
44
46
65
66-87
66
67
78
79
82
AN EXAMINATION OF THE HEALTH BELIEF MODEL WHENAPPLIED TO DIABETES MELLITUS
CHAPTER
TITLE AND CONTENTS
PAGE
ONE
THE HEALTH BELIEF MODEL
1 - 43
Introduction 1
Cognitive models of health behaviour 2
Description of the Health Belief Model
3
Research utilizing the Health Belief Model
6
Explanations of health-related behaviournot included in the Health Belief Model
11
Health beliefs related to diabetes mellitus
16
Conclusions
42
TWO BASELINE STUDY DESIGN ANDMETHODOLOGY
Overall research strategy
Methods
Statistical analyses
THREE PSYCHOMETRIC DEVELOPMENT OF TUE
HEALTH BELIEF SCALES
Statistical analyses
Structure of the Health Belief measures
Reliability
Validity
Discussion
132 - 180
134
141
170
FOUR EXPLORATION OF RELATIONSHIPSBETWEEN HBM COMPONENTS USINGBASEUNE DATA
88 - 131
Variables selected for analyses
94
Results
97
Discussion
123
FIVE TIlE EFFECFS OF AN EDUCATIONALINTERVENTION ON HEALTH BEUEFS,OTHER PSYCHOLOGICAL VARIABLES,AND GLYCOSYLATED HAEMOGLOBIN
Methods
Results
Discussion
six EFFECTS OF AN INSUUN INTERVENTIONSTUDY ON HEALTH BELIEFS
Methods
Results
Discussion
181 - 219
183
192
212
SEVEN
OVERVIEW AND CONCLUSIONS
220 - 239
Development and validation of the HBMmeasures
221
Relationships found between the HBM
225components
The effects of the intervention studies onhealth beliefs and related outcomes
229
Critique
231
Implications of the studies for future I-IBMresearch
233
Suggestions for future research
235
Final conclusions
239
REFERENCES 239 - 259

APPENDICES
Appendix 1
Appendix 2
Appendix 3
Appendix 4
Appendix 5
Appendix 6
Appendix 7
Appendix 8
Appendix 9
Letter inviting outpatients to join thebaseline study
Booklet of questionnaires
Introduction to booklet of questionnairesand General Information questionnaire(post education)
Knowledge of Diabetes questionnaire
Written information supplied to patientsregarding diabetes and its complications(insulin study)
Introduction to booklet of questionnairesand General Information questionnaire(insulin study: post decision)
Introduction to booklet of questionnairesand General Information questionnaire(insulin study: pre-treatment)
Introduction to booklet of questionnairesand General Information questionnaire(insulin study: post-treatment)
Expectations and Experience of Treatmentquestionnaires (insulin study)
260 - 317
261 - 262
263 - 283
284 - 286
287 - 295
296 - 302
303 - 306
307 - 309
310 - 312
313 - 317

CHAPTER ONE
THE HEALTH BELIEF MODEL
Introduction
There has been a gradual shift of emphasis in medical science this century
from fighting infectious disease to dealing with chronic conditions and
dangers associated with lifestyle behaviours (Michael, 1982). Modifiable
antecedents of disease and death are to be found in the environment and in
patterns of behaviour. Changing patterns of morbidity and mortality and the
political drive to reduce the cost of medical care have therefore provided
impetus for encouraging widespread preventive health behaviours amongst
both chronically ill and healthy individuals (Clymer, Baum & Krantz, 1984).
Accordingly, there has been a movement towards emphasizing individual
responsibility for one's health.
The idea of prevention rather than cure is an excellent one but in practice
many people do not follow recommendations for health maintenence or
enhancement (Antonovsky & Kats, 1970). In the case of presenting illness,
the realization that patients do not always follow doctors' orders spawned a
multitude of early studies about patient non-compliance (Sackett & Snow,
1979). Much of this work was based on the biomedical model of disease and
therefore ignored the psychological processes underlying decisions to follow
treatment recommendations. In practice, this model sees the patient as a
passive recipient and performer of regimens and fosters the idea of physician
authority. Research on compliance was therefore characterized by a fruitless
search for dispositional characteristics of patients which might be corrected
(Leventhal & Cameron, 1987). In reality, the decision not to follow health
care advice is the result of many motivations. These may involve

2
dissatisfaction with clinical advice, competing social realities (e.g. financial
constraints, familial opposition, demands of work, leisure activities, peer
group pressures to conform), or even a conscious preference of illness to
health (Trostle 1988). Furthermore, in chronic conditions such as diabetes
mellitus a patient may come to believe that even ifs/he follows the treatment
regimen precisely this will not guarantee absence of health problems.
Conversely, it is also possible that a person may learn that risky health
behaviour does not lead to any harm. Compliance research has therefore
evolved into a focus on the beliefs and attributions which influence the health
behaviour of individuals. Moreover, implicit in this approach is the
acknowledgement that choosing not to follow treatment recommendations or
advice may be the result of rational decision-making and not a form of deviant
personality or other characteristic as implied by the biomedical model
(Christensen, 1978). The notion of compliance is therefore an outmoded one.
Cognitive models of health behaviour
During the past 25 years there has been a gradual development of several
models to explain behaviour related and unrelated to health. These models are
derived from social psychological learning theories developed from "Stimulus
Response" (SR) theory and "Cognitive Theory" (Rosenstock, Strecher &
Becker, 1988). The SR theorists argued that reinforcements are sufficient to
explain learning and behaviour. Cognitive theorists, however, emphasized
the role of expectations held by the individual. In this view, behaviour is
influenced by the subjective value of an outcome and the expectation that a
particular action will achieve that outcome. Individuals are therefore
motivated to maximize gains and minimize losses. Tolman (1932) and Lewin
(1935) were prominent in developing this formulation which has come to be
known as "value-expectancy" theory.

3
Examples of prominent value-expectancy theories used to explain health
behaviour are the Health Belief Model (Hochbaum, 1958; Rosenstock, 1966)
which is the focus of this thesis, the theory of reasoned action (Fishbein &
Ajzen, 1975), and social learning theory (Rotter, 1954).
Description of the Health Belief Model
The Health Belief Model (I-IBM) is the only model which has been
developed specifically to explain health behaviour and has generated the most
research in this area (Wallston & Wallston, 1984). It was developed by four
social psychologists: Hochbaum, Kegeles, Leventhal, and Rosenstock
(Hochbaum, 1958; Rosenstock1 1966) and is relevant to behaviours that are
under an individual's control. The model was originally conceived in order
to predict preventive health behaviours but with later adaptations (Becker,
1974; Becker & Maiman, 1975) has also been used to predict the behaviour of
people with acute and chronic illnesses. The value-expectancy approach in
the context of health-related matters was translated as: (a) the desire to avoid
illness, or if ill, to get well; and (b) the belief that a health behaviour will
prevent or ameliorate illness. The likelihood of someone taking a health
action is seen to be determined by the individual's perceptions about his/her
susceptibility to an illness and the perceived severity of its consequences.
Taken together these are said to constitute the perceived threat or risk of the
illness which provides the energy or force to act. The behavioural outcome,
on the other hand, is influenced by an evaluation of the required action in
terms of its efficacy in reducing the threat (perceived benefits) weighed
against the perceived costs of or barriers to undertaking the behaviour.
The model assumes that health is a highly valued concern. Furthermore, it
proposes that behaviour is triggered by 'cues to action' which make the
individual aware of the health threat. Such stimuli might be the individual's

4
internal symptoms or prompts from external sources such as health care
providers, family members or the media. Antonovsky and Kats (1970) have
argued, however, that including the concept of cues in the theoretical model is
unnecessary because individuals effectively create their own cues. In other
words, the manifestation of symptoms, the sudden awareness of information
or reminders about health threats will affect beliefs about susceptibility and
severity. Thus it is not the cue which directly prompts one to take health
action but the belief. Similarly, diverse demographic (age, sex, race, etc.),
sociopsychological (social class, peer and reference group, personality, etc.)
and structural factors (knowledge about the disorder, prior experience, etc.)
are likely to play a part in shaping health behaviour but these influence
behaviour only indirecfly by modifying the other components of the model.
The key components of the model are thus: perceived susceptibility,
perceived severity, perceived benefits and perceived barriers. The remaining
"health value", "cues to action" and "modifying factors" act as explanatory
antecedents to the key components (although "health value" has been
conspicuous by its absence from most descriptions of the traditional HBM).
It is surprising that these explanatory aspects of the model have not been
logically extended to embrace the influence of the various political policies of
governments and other institutions such as state financing and educational
philosophy. Janz and Becker (1984) have argued that the HBM is a
psychosocial model and as such "is limited to accounting for as much of the
variance in individuals' health-related behaviour as can be explained by their
attitudes and beliefs". However, there is a danger that research which focuses
on the individual's responsibility for health outcomes will divert attention
away from macro perspectives of how public health can be improved.
Indeed, because the I-IBM has been very influential and has stimulated a large
volume of research it has been singled out for criticism because it fails to
provide a societal view of health behaviour (Research Unit in Health &

Perceived
Susceptibility
to Disease "X"
Perceived
Severity
of Disease "X"
5
Behavioural Change, 1989). A summary of the HBM is provided in
Figure 1.
Figure 1: The Health Belief Model (based on Becker, Drachman and Kirscht, 1974)
INDIVIDUALPERCEPTIONS
MODIFYINGFACTORS
DemographicVariables
(age, sex, race, etc.)
Sociopsychologicalvariables(social class, peer andreference grouppressure, etc.)
Structural variables
(knowledge about thedisease, priorexperience, etc.)
Perceived Threat of
Disease "X"
LIKELiHOOD OFACTION
Perceived benefits
of preventive action
minus
Perceived barriers
to prevenlive action
Likelihood of TakingRecommendedPreventive HealthAction
Cues to Action
Mass media campaignsAdvice from othersAppointment remindersFamily illness
6
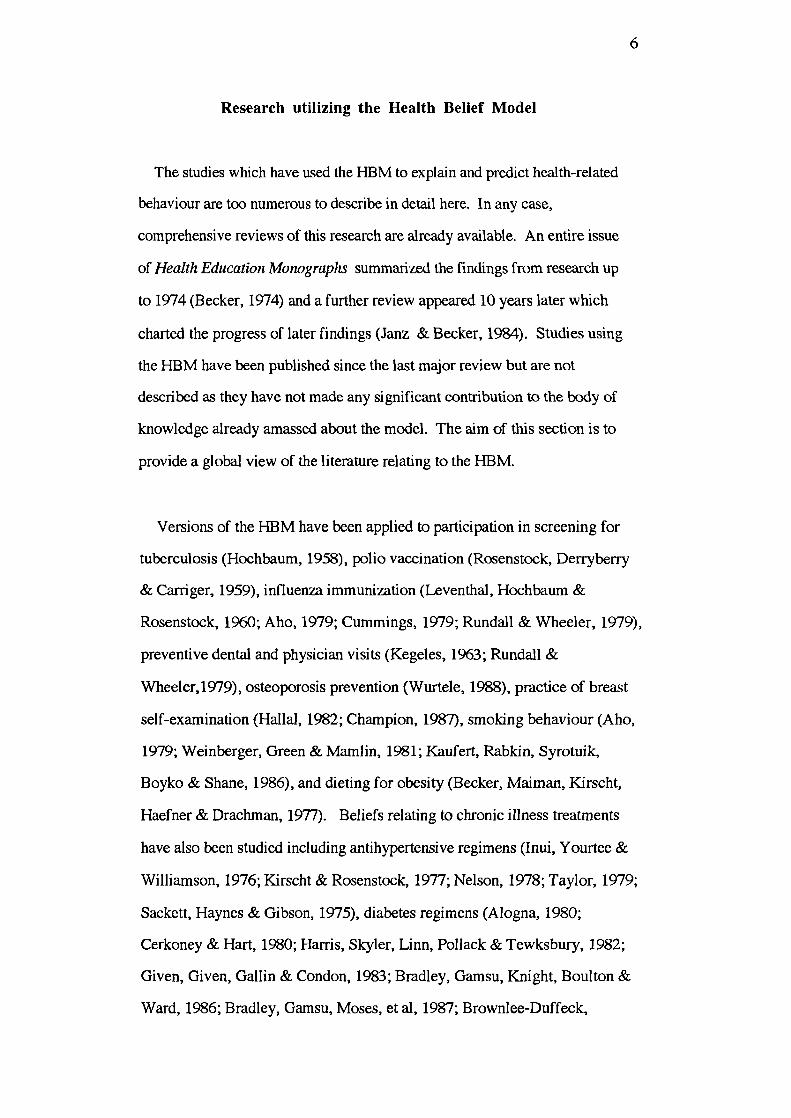
Research utilizing the Health Belief Model
The studies which have used the HBM to explain and predict health-related
behaviour are too numerous to describe in detail here. In any case,
comprehensive reviews of this research are already available. An entire issue
of Health Education Monographs summarized the findings from research up
to 1974 (Becker, 1974) and a further review appeared 10 years later which
charted the progress of later findings (Janz & Becker, 1984). Studies using
the I-IBM have been published since the last major review but are not
described as they have not made any significant contribution to the body of
knowledge already amassed about the model. The aim of this section is to
provide a global view of the literature relating to the I-IBM.
Versions of the I-IBM have been applied to participation in screening for
tuberculosis (Hochbaum, 1958), polio vaccination (Rosenstock, Derryberry
& Carriger, 1959), influenza immunization (Leventhal, Hochbaum &
Rosenstock, 1960; Aho, 1979; Cummings, 1979; Rundall & Wheeler, 1979),
preventive dental and physician visits (Kegeles, 1963; Rundall &
Wheeler, 1979), osteoporosis prevention (Wurtele, 1988), practice of breast
self-examination (Hallal, 1982; Champion, 1987), smoking behaviour (Aho,
1979; Weinberger, Green & Mamlin, 1981; Kaufert, Rabkin, Syrotuik,
Boyko & Shane, 1986), and dieting for obesity (Becker, Maiman, Kirscht,
Haefner & Drachman, 1977). Beliefs relating to chronic illness treatments
have also been studied including antihypertensive regimens (Inui, Yourtee &
Williamson, 1976; Kirscht & Rosenstock, 1977; Nelson, 1978; Taylor, 1979;
Sackett, Haynes & Gibson, 1975), diabetes regimens (Alogna, 1980;
Cerkoney & Hart, 1980; Harris, Skyler, Linn, Pollack & Tewksbury, 1982;
Given, Given, Gallin & Condon, 1983; Bradley, Gamsu, Knight, Boulton &
Ward, 1986; Bradley, Gamsu, Moses, et al, 1987; Brownlee-Duffeck,

7
Peterson, Simonds, et al, 1987; Lewis, Jennings, Ward & Bradley, 1990),
end-stage renal disease regimens (Hartman & Becker, 1978; Cummings,
1982) and psychiatric medication for outpatients (Kelly, Mamon & Scott,
1987).
From the review by Janz and Becker (1984) and a general survey of the
subsequent literature it is apparent that all of the studies published to date have
limitations related to sampling, design, or measurement. Some research was
carried out on small or atypical samples of subjects whilst other studies
reported large sample attrition through non-response or drop-out. Another
major problem was that a large proportion of the research was retrospective in
design. In this case, beliefs were correlated with measures of preventive
health behaviour or treatment adherence collected previously or at the same
point in time. In retrospective studies it is difficult to determine whether
beliefs determine behaviour or whether people rationalize their beliefs to be
consistent with their behaviour (McKinlay, 1972). There have also been few
attempts to modify beliefs to determine the causal nature of correlations
between HBM components and behavioural outcomes (Marteau, 1989). A
further major criticism of many of the studies is that Health Belief dimensions
were operationalized in questionable ways. Many of the studies, for example,
did not evaluate all of the dimensions of the model. Furthermore, the
measures in some studies (e.g. Berkanovic, Telesky & Reeder, 1981; Harris,
Skyler, Linn, Pollack & Tewksbury, 1982) either overlap with one another
creating problems of multicollinearity or lack face validity and are therefore
misleadingly labelled. There has also been a problem with inconsistent levels
of measurement of the model dimensions. For example, in one study (Tirrell
& Hart, 1980) susceptibility to illness in general was evaluated whilst barriers
were operationalized on a specific level (i.e. barriers to exercise). Probably
the most serious and widespread problem related to the measurement of HBM
dimensions, however, is the paucity of scales with reported reliability and

8
validity. Many of the measures were put together on the basis of face validity
only, thus raising doubts about the concepts actually measured. In one study
(Rundall & Wheeler, 1979) only one question was used to measure each
dimension of the model. Another major criticism is that idiosyncratic
interpretation of the model has resulted in various styles and types of
measurement instrument. Lack of measurement consistency makes
comparisons across studies problematic although some variation in
measurement is inevitable if researchers are to accommodate the specific
characteristics of the illness or health behaviour studied. Nevertheless, it is
desirable that ultimately, research within a particular field of study should be
comparable.
In order to test the HBM many studies have related its dimensions to
measures of treatment adherence provided by the subjects themselves,
observations of behaviour, or from physiological indices such as blood
glucose levels. However, these measures are often unreliable or invalid. The
problem with self-reports of health behaviour is that they may be influenced
by a subject's reluctance to report non-adherence to treatment
recommendations. Objective measures of health behaviour may be reliable if
they involve a single observable action such as attending a health screening
programme but this type of measure becomes more difficult, when long-term
behaviours are of interest as in a treatment regimen for chronic illness.
Studies facing this type of problem have often employed questionable
measures of "compliance" such as missing even a single dose of medication
within a relatively long time period (Nelson, Stason & Neutra, 1978). The
indirect measures of treatment adherence are also problematic in that measures
of, for example, metabolic control are also influenced by factors such as
incidence of intercurrent illness, and the adequacy of the treatment
recommendations for the particular person or illness. Given the shortcomings

9
of sampling, design and measurement related to the HBM already described
above, these additional problems of measuring behavioural outcome serve
only to compound the difficulty in assessing the utility and validity of the
model. Moreover, even if it is possible to obtain a reliable measure of health
behaviour, researchers testing the HBM still have to contend with the fact that
some behaviours (e.g. dieting and exercise) are performed for reasons other
than to improve or maintain health. Furthermore, for some preventive health
actions (e.g. dental hygiene) there may be a substantial habitual component
involved. As Cleary (1987) has pointed out, "when trying to explain
health-relevant behaviour, one confronts the awesome task of explaining
human behaviour in genera!",
Despite all the problems with studies involving the I-IBM just described,
Janz and Becker (1984) concluded that the research provides substantial
evidence for the importance of I-IBM dimensions in explaining and predicting
individuals' health-related behaviour. This conclusion was based on a survey
of the number of positive and statistically significant findings for each
individual HBM dimension. A "significance ratio" was created by dividing
each of these totals by the number of studies which reported a statistical
outcome for the particular dimension in question. For the studies conducted
between 1974 and 1984 the most consistent predictor of health-related
behaviour was the "barriers" dimension whilst "severity" produced the least
consistent results. When sick role studies were analysed separately,
however, the "severity" dimension proved to be the next most consistent
predictor of outcomes after "barriers" whilst "susceptibility" was the least
consistent. Janz and Becker comment that "susceptibility" was probably the
least efficient dimension in this type of research because it is difficult to
operationalize where a diagnosis of illness has already been made. Overall,
the significance ratios produced from the prospective studies were higher than
those from retrospective studies for all of the individual dimensions. For

10
studies prior to 1974 the ordering of the significance-ratios indicated that
"susceptibility" was the most consistent predictor of outcomes. However,
most of these studies examined preventive health behaviour and the majority
did not include the"barriers" dimension.
Three of the studies yielded significant results in a direction opposite to that
which the original HBM might have predicted. Janz and Becker argued,
however, that in two cases the design of the study was retrospective whilst
the third outcome was likely to be a logical result of feeling less susceptible
because the patients had followed treatment recommendations. Since the
review by Janz and Becker more studies have yielded results contrary to the
model's predictions (e.g. Brownlee-Duffeck, Peterson, Simonds, Goldstein,
Kilo & Hoette, 1987; Lewis, Jennings, Ward & Bradley, 1990) suggesting
the possibility that the relationships between health beliefs and outcomes are
not static but dynamic. Not only may health beliefs affect outcomes but these
outcomes, in turn, may affect health beliefs. As originally proposed, the
HBM makes no explicit provisions for such dynamic relationships. The value
of correlational studies in teasing out such relationships is therefore
questionable and warrants further research.
Although the review by Janz and Becker is thorough in its coverage of
studies published up to that date, surprisingly, it fails to acknowledge a major
flaw in HBM research. This flaw concerns the lack of studies which aim to
determine how the dimensions of the model combine to predict behaviour.
Stone (1979) has noted that the HBM makes relative rather than quantitative
predictions and Wallston and Waliston (1984) have argued that the original
theory implicitly suggests a multiplicative model. However, researchers have
either failed to consider more than one variable at a time or the individual
variables have been additively combined with no thought as to their

11
relationship. Indeed, Waliston and Waliston have pointed out that the I-IBM
is more a catalogue of variables than a model at present. In the final
paragraph of their 1984 review, Janz and Becker comment that "Given the
numerous survey-research findings on the HBM now available, it is unlikely
that additional work of this type will yield important new information." They
then go on to recommend that future research should be concerned with the
evaluation of the effects of interventions on the individual HBM dimensions.
The number of studies which have continued to evaluate I-IBM dimensions
individually since this review suggest that this view has been accepted
uncritically. The main aim of this thesis is to discover, therefore, whether the
various elements of the I-IBM may be interactively combined to predict
health-related outcomes more efficiently.
Explanations of health-related behaviour not included in the
Health Belief Model
The proportion of variance in health outcomes explained by HBM
components is not usually high (Rosenstock, 1985). One reason why the
model's components account for such small amounts of variance has just been
described. However, a further explanation is that key elements are missing
from the HBM. These elements have been included in value-expectancy
theories of behaviour which were not conceived specifically to predict
health-related outcomes. Nonetheless, they have been successful in
explaining substantial amounts of variance in health behaviour.

12
1. Social learning theory
Rotter's (1954) and Bandura's (1977) social learning theories have
emphasized the role of subjective expectations regarding self-efficacy, and
value of outcome in the prediction of behaviour, although most research
attention has been directed towards the expectancy component of the equation.
Rotter focused on generalized expectancy a version of which he
operationalized in a measure of locus of control. Locus of control is the
generalized expectancy that one's own behaviour or forces external to oneself
control reinforcements or behaviour outcomes. The measure began as a
unidimensional (internal-external) scale (Rotter, 1966) but research by others,
notably Levenson (1973) expanded the measure to include three orthogonal
dimensions. These represent beliefs in internality, powerful others, and
chance locus of control. It is predicted that a person is most likely to engage
in a particular behaviour if sfhe has a belief in internal locus of control and
low belief in chance locus of control. The Wallstons (1982) have also
speculated that particular combinations of locus of control beliefs are more
beneficial in health self-care. In particular, they suggested that the most
beneficial pattern is a combination of high scores for internality and powerful
others and a low score for chance. People with this pattern of beliefs were
labelled "Believers in Control" and were expected to make the best use of the
resources provided by health professionals giving care and advice as well as
their own personal resources. It has been suggested by Strickland (1978)
that generalized expectancies will predict behaviour in novel or ambiguous
settings but with experience in a given situation, situation-specific
expectancies become more important. Indeed, research experience has shown
that the more general measures of locus of control were not particularly
sensitive when related to specific behaviours. There are now several

13
situation-specific locus of control scales available including a health locus of
control scale (MHLC) (Wallston, Wallston, & DeVellis, 1978), and at a
greater level of specificity, dental behaviour (Beck, 1980), weight (Saltzer,
1982), fetal health (Labs & Wurtele, 1986), and smoking (Georgiou &
Bradley, 1992). Bradley, Brewin, Gamsu and Moses (1984) and Bradley,
Lewis, Jennings and Ward (1990) have also developed diabetes-specific
perceived control scales based on Peterson's (1982) Attributional Style
Questionnaire which allows the examination of attributions for positive and
negative outcomes separately. In general, situation-specific scales have been
more successful than the scales measuring generalized expectancies. Indeed
they have accounted for very respectable proportions of the variance in
behavioural outcomes (e.g. Beck 1980; Saltzer, 1982; Labs & Wurtele, 1986;
Bradley & colleagues, 1986; 1987; 1990).
Bandura (1977) has pointed out that locus of control is not the same as
self-efficacy since locus of control relates more to outcome expectations and
disregards whether or not one feels capable of performing that behaviour. In
this respect, locus of control belongs to the same HBM dimension of
"perceived benefits" which is also an outcome expectation. It is argued by
Bandura that a person could perceive outcomes as personally determined but
may still lack the necessaiy skills to carry out recommended behaviours.
The utility of self-efficacy expectations in predicting outcomes has been well
documented (Maddux & Stanley, 1986; Bandura, 1986). Changes in
self-efficacy expectancy and changes in behaviour are highly correlated and
self-efficacy has been shown to be an excellent predictor of behaviour. In
practice, however, most measures of self-efficacy are confounded to some
extent with elements of outcome expectancy and vice-versa (Maddux, Norton
& Stoltenberg, 1986). The diabetes-specific measures of perceived control
by Bradley and colleagues (1984, 1990) effectively evaluate a combination of
perceived self-efficacy in achieving a state of health and expectations

14
regarding locus of control over behavioural outcomes. Respondents are
required to rate the extent to which they themselves, medical staff, treatments,
other people, and chance, control and determine various hypothetical
outcomes related to diabetes. Because the outcomes are hypothetical, the
respondent is not restricted to accounting for real-life scenarios.
Rosenstock, Strecher and Becker (1988) have posited a revised
explanatory model of health behaviour which incorporates the previously
absent concept of self-efficacy into the HBM. They argue that self-efficacy is
particularly relevant to coping with a chronic illness which often requires the
modification of lifelong habits such as eating, drinking, exercising and
smoking. A belief in one's ability to alter such lifestyles is necessary before
an intervention can become a success. One aim of the present research is to
examine the effects of incorporating an overlapped measure of control and
efficacy expectation into the HBM and to test the overall model as a predictor
of health outcomes. Rosenstock and colleagues do not specify how a
measure of self-efficacy should be incorporated into the HBM so it is
assumed that they see it as a simple addition to the catalogue of variables to be
tested. In the present research, however, an attempt will be made to
investigate any interactive or multiplicative relationships with other
components of the HBM in an overall aim to specify the relationships between
the components of the model. In particular, it is predicted that self-efficacy
beliefs and expectancies about control will interact with perceived benefits of,
and barriers to, adopting health-care practices.
2. The theory of reasoned action:
The theory of reasoned action was developed as a general model of
behaviour but has been used successfully to explain and predict a variety of

15
health behaviours (Grube, Morgan & McGree, 1986). Like the HBM, this
theory is applicable only to behaviours that are under voluntary control and
thus deals with rational thought processes based on available information.
The attitudes included in the theory of reasoned action are similar to the beliefs
in the HBM; as Kirscht (1983) has pointed out, dimensions of the HBM can
be mapped onto the theory of reasoned action. The theory asserts that
behaviour is a function of an individual's intention to perform the behaviour.
Behavioural intention, in turn, is hypothesized to be a function of two basic
factors: the individual's attitude towards performing the behaviour and
subjective normr. Attitudes are the product of beliefs about the outcome of
performing specific behaviours. Subjective norms, on the other hand, reflect
one's perception of the degree to which individuals or groups think
performing the behaviour is importanL The main difference between the
HBM and the theory of reasoned action is that the latter emphasizes the
importance of normative beliefs. Furthermore, the relations among the
constructs of the theory are specified, unlike the I-IBM. Wallston and
Wallston (1984) have suggested that components of the HBM should be
combined with the additional elements from the theory of reasoned action [and
a similar, though extended model by Triandis (1980)]. Janz and Becker have
argued, however, that the normative component of the theory of reasoned
action could be considered as a logical refinement of the "benefits" and
"barriers" dimension of the HBM. A socially-approved behaviour would be
seen as a benefit, while a socially disapproved action might be viewed as a
barrier. Whether the operationalization of normative beliefs within the
"benefits" and "barriers" dimensions of the HBM would be adequate remains
to be seen. Probably the greatest obstacle to the efficient measurement of
normative beliefs within the HBM, however, is the correspondence of
measurement required by the Fishbein model. Unlike the more generalized
components of the I-IBM, the attitudes and normative beliefs of the theory of

16
reasoned action are measured at a very specific level. For this reason, no
attempt will be made to incorporate the concept of normative beliefs in the
exploration of the HBM reported in this thesis.
Health Beliefs related to diabetes mellitus
In order to carry out the task of assessing the relationships between the
various dimensions of the HBM, measures of diabetes-specific health beliefs
have been developed from the responses of individuals with tablet-treated,
Type II diabetes. (The psychometric development of these measures is
described in Chapter 2). The following sections of this chapter are therefore
about the nature, management, and outcomes of diabetes mellitus. This is
followed by a review of studies which have utilized versions of the I-IBM in
order to understand and predict diabetes-related health outcomes.
The nature and management of diabetes
In general, diabetes can be classified into two main types. Type I diabetes
has previously been labelled as "juvenile-onset" or "insulin-dependent"
diabetes and Type II used to be called "maturity-onset" and "non-insulin
dependent" diabetes. The new labels of Type I and Type II (based on certain
immunological cntera and genetic markers) were adopted because the earlier
classifications overlap and cause confusion; all juvenile-onset patients are
dependent on insulin but individuals with maturity onset diabetes form a
heterogeneous group treated by diet alone, diet and tablets, or diet and insulin.
In a report by the World Health Organization (1985) estimates of the
prevalence of diabetes ranged from 2% to 5% of the UK population and 5%

17
to 10% in the USA. Of the total number with diabetes, approximatley 75%
will have the Type II disorder (Jarrett, 1986). There is evidence to suggest
that Type I diabetes is an autoimmune disease whereby the insulin-producing
cells of the pancreas are gradually destroyed in individuals exposed to as yet
unidentified environmental triggers. Genetic factors are thought to play an
indirect role in both types of diabetes through the inheritance of characteristics
which make an individual more susceptible. However, there is a stronger
genetic link in Type II diabetes with the concordance rate for identical twins
approaching 100%. Very little is known about the aetiology and pathogenesis
of Type II diabetes but there are certain well-known predisposing risk factors.
A sedentary lifestyle and the consumption of energy-dense foods have been
particularly important in contributing to the rise in prevalence of this type of
diabetes in all populations (Taylor and Zimmet, 1983). Indeed, most people
with Type II diabetes are overweight.
Diabetes is characterized by abnormal metabolism of carbohydrates,
proteins, fats, and electrolytes resulting from a deficiency of insulin function.
This deficiency may be due to the beta cells of the pancreas producing
insufficient insulin or the insulin produced may not be utilized effectively.
Under normal circumstances, glucose will enter the liver, muscle, or fat cells
for storage or energy when sufficient insulin is bound to the cell wall. When
insulin is deficient, however, glucose builds up in excessive quantities in the
blood (hyperglycaemia) and spills over into the urine causing dehydration and
the classic symptoms of thirst and excessive urination. Defective glucose
metabolism also results in incomplete fat combustion which leads to an
accumulation of toxic ketone bodies in the blood. If diabetes is not treated by
administration of exogenous insulin, sufficient amounts of these ketone
bodies will cause acidosis and eventually coma which may be fatal. There is
another type of coma which is associated with insulin-treated diabetes which
is due to very low blood glucose levels (hypoglycaemia). Hypoglycaemia
occurs when insulin is not balanced with sufficient carbohydrate intake, or

18
unusual amounts of exercise are not compensated for by reduced insulin
dosage or an increase in carbohydrate consumption. Most people with
diabetes, however, with the help of oral agents and/or diet, do not need
exogenous insulin to manage their disorder because they still have the benefit
of some glucose homeostasis due to endogenous insulin. In this case,
therefore, there is only a small risk of ketoacidosis and hyperglycaemic coma.
Treatment for diabetes depends on the amount of endogenous insulin
produced by the pancreas and the efficiency of its uptake. In overweight
people with Type II diabetes, diet alone may be sufficient to manage the
disorder. This diet will involve a reduction of carbohydrate consumption to
the point where endogenous insulin can cope. High fibre foods are
recommended because their sugar is absorbed more slowly into the
bloodstream. Fat content is kept to a minimum in order to limit the number of
calories consumed and reduce the risk of atherosclerosis. The caloric content
is generally quite low to provoke weight loss which in turn will increase
insulin sensitivity and reduce the risk of macrovascular disease. These
patients are also encouraged to increase their physical activity although this is
not always possible if there is limited mobility. Type II patients with
endogenous insulin secretion but insufficient carbohydrate utilization may
require, in addition to diet, hypoglycaemic agents in tablet form. These
agents may stimulate insulin secretion in the pancreas (sulphonylureas) or
increase glucose uptake by the peripheral tissues (biguanides) (Lebovitz,
1985). For individuals with highly deficient or absent insulin secretion
regular doses of exogenous insulin are required in order to manage their
diabetes. This insulin has to be delivered subcutaneously by injection or via
an insulin infusion pump. In this case, the patient's diet is designed so that
caloric intake is balanced with the action of injected insulin, otherwise the
types of food recommended are similar to those for diet and tablet treated
individuals. The main problems of using exogenous insulin are that injections

19
have to be administered 30 minutes before each meal and then that person
must eat otherwise hypoglycaemia will occur. Snacks also have to be eaten in
order to avoid hypoglycaemia even though the patient may not be hungry.
People with diabetes which requires insulin which is administered by injection
therefore have to learn to regiment their lives in accordance with insulin
injections and mealtimes and have to learn to adapt to unforeseen
circumstances such as a delayed meal or unplanned exertion.
It is not only desirable for patients to keep themselves symptom-free but
also to maintain blood glucose levels as close as possible to the
normoglycaemic range of approximately 3.5 to 8.0 mmolIl. The rationale for
such strict control is to avoid or delay the long-term microvascular
complications associated with chronic hyperglycaemia (Pirart, 1978;
Tchobroutsky, 1978). The tissue damage which results from chronic
hyperglycaemia can be found in the nerves (neuropathy), small blood vessels,
the kidneys (nephropathy), and the retina and may lead to outcomes such as
amputations, blindness, renal failure, and sexual dysfunction. People with
diabetes have to be extra vigilant regarding care of the feet as the common
occurence of numbness in the lower extremities can render them more
vulnerable to undetected wounds which, together with impaired circulation
can result in amputations due to gangrene. In addition to the microascu1ar
complications, diabetes also affects the large blood vessels, mainly through
abnormal fat metabolism and hypertension. Hypertension and
hyperlipidaemia are more common among diabetic than among non-diabetic
individuals and may therefore increase the risk of coronary heart disease and
cerebral vascular accidents (strokes). In Type II diabetes, 60 to 70 percent of
deaths are caused by myocardial infarction and strokes (Burden, 1982) which
represents a two- to three-fold increase in mortality rate when compared to the
non-diabetic population. Adherence to dietary recommendations therefore
plays an important part in the treatment of diabetes, particularly for those who

20
are overweight. Unfortunately, diabetes is not always diagnosed at onset in
older people with Type II diabetes as it is possible to be asymptomatic. These
patients may therefore present with complications prior to diagnosis and thus
the aim of treatment is to arrest further degeneration of the tissues involved.
In general, however, it is unusual for people to be free of complications after
20 years of diabetes.
Ideally, in order to monitor blood glucose levels, individuals with diabetes
need to test their urine or blood. Urine testing usually involves dipping a
glucose-sensitive strip into the urine and observing the strip for colour
change. An alternative test involves the addition of a tablet to some diluted
urine and observation of the colour change. Urine testing, however, is not as
informative as blood testing because the appearance of glucose in the urine is
delayed. Moreover, urine glucose levels may not be an accurate reflection of
blood glucose levels because the threshold at which glucose spills over into
the urine varies between individuals, particularly those who are older
(Butterfield, Keen & Whichelow, 1967). For people who test their blood at
home, a blood sample is obtained by finger pricking. The sample is then
placed on a glucose-sensitive reagent strip which is then read by eye or by a
reflectance meter developed for this purpose. Blood glucose testing has now
largely replaced urine glucose testing for people with Type I diabetes.
However, most people with Type II diabetes use urine tests and some,
particularly the elderly, are not encouraged to monitor glucose levels at all.
Although attitudes are now changing (Alberti & Gnes, 1988), Type II
diabetes used to be seen as a mild form of diabetes because it does not have
the immediate life-threatening consequences associated with the Type I
disorder so patients have not always received optimal care. However, the
long-term consequences of Type II diabetes are just as devastating as those
for Type I diabetes and represent a major cause of premature death (Fuller,
1985)

21
It can be seen from the foregoing description of diabetes and its
management that the typical regimen is "complex, of life-long duration, and
requires many behaviour changes on the part of the patient" (Cerkoney &
Hart, 1980). Furthermore, effective control of the disorder depends in large
measure upon the participation of the patient in disease management.
Research studies have shown, however, that 80% of insulin-requiring
patients administered their insulin in an unacceptable manner, 65% to 73% did
not follow their diets, and only 30% to 57% regularly tested their urine
(Watkins, Williams, Martin, Hogan & Anderson, 1967; Korhonen,
Huttunen, Aro et al., 1983). Non-adherence to treatment recommendations
may be due to some extent to lack of knowledge. However, research in this
area has shown that even if individuals have a very good level of knowledge
about the management of their disorder, they may choose not to follow
treatment recommendations. Correlations between knowledge scores and
level of diabetes control are rarely significant and sometimes even negative
(Shillitoe, 1988) As discussed earlier, it seems that non-adherence to
treatment recommendations is the result of a decision-making process based
on beliefs about such factors as costs, benefits, risks, controllability, and
self-efficacy. Thus, patients will differ in the extent to which they believe that
a treatment regimen is worthwhile. An increase in research knowledge about
these perceptions is therefore desirable in order to design interventions which
attempt to change inaccurate or destructive but modifiable beliefs. The next
section is a critical review of studies which have employed dimensions of the
HBM in order to understand health outcomes in adults with diabetes. A
review of the research relating to locus of control and self-efficacy in relation
to diabetes is provided in a further Section.
The Health Belief Model and diabetes
In a study examining adherence to diet recommendations in 50 obese

22
subjects with non-insulin-dependent diabetes, Alogna (1980) focused on a
single HBM dimension: perceived severity. She also administered a measure
of locus of control, the results of which will be discussed in the following
section. The majority of the subjects were women and 46 of the total were
black, thus the sample was atypical. Alogna classified the participants as
"compliant" or "non-compliant" on the basis of prior weight loss and blood
glucose control resulting from a weight control treatment programme.
Perceived severity of diabetes was assessed using a "perception of severity of
disease index" derived from the Standardized Compliance Questionnaire
developed by Sackett and Haynes (Sackett, Becker, MacPherson, Luterbach
& Haynes, 1974). The results indicated that the "compliant" group viewed
their disorder as significantly more serious than did the "non-compliant
group. Furthermore, perceived severity did not vary with the incidence of
diabetes-related complications in each group. However, because of the
retrospective nature of the study, it is not possible to determine whether high
levels of perceived severity facilitated weight-reducing behaviour or whether it
was a consequence of success in the weight reduction programme. Also,
because the study measured only one dimension of the HBM it provides an
incomplete picture of how beliefs are related to health outcome in this
particular sample.
The Standardized Compliance Questionnaire was also used as a basis to
measure dimensions of the 1-IBM in a study by Cerkoney and Hart (1980). In
this case, 15 statements from the questionnaire were adapted in order to
measure the various dimensions of the HBM including cues to action.
One-week test-retest reliability was evaluated but no attempt was made to
establish internal reliability. Face validity of the items selected is also
impossible to assess because these are not fully described. Thirty
insulin-treated patients responded to the questionnaire, 73% of whom were
women. Eighty percent of the sample were aged over 50 years and almost

23
half of the subjects had been taking insulin for less than a year. Once again,
therefore, the sample studied was atypical. Adherence to treatment was
assessed using patient self-reports and direct observation in five areas of
management: diet, insulin administration, hypoglycaemia management, urine
testing, and foot care. Only self-report was used to measure adherence to
diet. On the basis of a study by Gordis, Markowitz and Lilienfeld (1969)
which reported that rates of adherence measured by self-report are double
those measured by any other method, Cerkoney and Hart allotted double point
values to the items measured by direct observation. Given that diet was
measured by self-report alone and the "doubling-up" method was based on a
single report, this seems to have been a somewhat arbitrary method of
obtaining a measure of adherence to treatment The individual HBM scores
were correlated with each of the adherence measures and the total adherence
score. The total adherence score was also correlated with a total HBM score
which seems to have been calculated on the basis that the various dimensions
of the model combine additively. The results of these correlations are
summarized in Table 1.1. The strongest correlation was between the total
HBM score and the total compliance score. However, as can be seen, this
correlation was attenuated by the fact that none of the 1-IBM measures were
significantly associated with urine testing or diet scores. Moreover, there
was a non-significant trend for greater diet adherence to be negatively
associated with perceived severity and greater adherence regarding
hypoglycaemia and foot care was negatively associated with perceived
benefits. It is also surprising that perceived benefits and perceived barriers
did not correlate significantly with any of the adherence measures. With the
benefit of knowledge from more recent research concerning the HBM (which
has shown these dimensions to be relatively strong predictors of adherence to
treatment), the reliability and validity of these measures is highly suspect.
The measures of adherence also included items which measured knowledge

24
Table 1.1: Correlation matrix reproduced from the study byCerkoney & Hart (1980)
Health belief motivators
Total Perceived Perceived Cues Perceived PerceivedCompliance HBM suscep- benefits barriers severity
tibility
Totalcompliancescore 0.50** 0.23 0.01 0.40* 0.12 0.42*
033 0.54 0.10 0.17
-0.01 033 -0.03 0.25
Footcare 030
Urine testing 034
** p<0.01 * p<0.05
Insulin and itsadministration 0.40*
Diet 0.20
Hypoglycaezniaor insulin
0.08retions
0.48 -0.27 -0.19 0.21 0.09
0.21 -0.11 0.14 0.01 Ø•47**
0.18 0.20 0.21 0.23 0.07
0.20
-0.20
about the various aspects of the regimen which makes the interpretation of the
results problematic.
In the absence of psychometrically developed scales designed to measure
HBM dimensions in individuals with diabetes, Given, Given, Gallin and
Condon (1983) published the first attempt to develop such measures. The
questionnaire items were derived from three sources: (a) previous
instruments measuring HBM concepts; (b) diabetes education materials
which included descriptions of aspects of the therapeutic regimen and
patients' beliefs and reactions related to diabetes; and (c) in-depth interviews
with a convenience sample of 25 diabetic patients using open-ended

25
questions. From these sources 76 statements measuring 12 groups of beliefs
were constructed. The statement groups measured dimensions of the HBM
dimensions but did not distinguish perceived vulnerability. In addition, one
group of statements measured beliefs about the degree of perceived personal
responsibility for treatment, another two statement groups effectively
measured a combination of social support and cues to action (Social Support
for Diet and Social Support for Taking Medications), and a further two
groups evaluated the impact of work on diet and on taking medications. The
groups relating to impact of work could have been conceptualized as
perceived barriers but because several items of this nature were constructed
and these groups of statements were applicable only to those who were
employed, it is not surprising that a separate scale was produced by the factor
analysis. Psychometric evaluation was carried out on the responses of 156
Type I and Type II diabetic patients. Factor analyses and inter-scale
correlations produced six final scales. These were labelled: (1) Control of
effects of diabetes (representing a combination of items from the original
Personal Responsibility and Severity statement groups); (2) Barriers to diet;
(3) Social support for diet ; (4) Barriers to taking medications; (5) Impact of
job on therapy (representing items from the original Impact of Job on
Taking Medications and Impact of Job on Diet statement groups); and
(6) Co,n,nit,nen! to benefits of therapy (consisting of items from the original
Benefits of Diet and Benefits of Taking Medications statement groups). Three
of the original 12 hypothesized groups of beliefs did not survive psychometric
evaluation. The final scales produced by Given and colleagues do not
distinctly represent the dimensions of the I-IBM as there is a measurement
overlap between perceived severity and perceived personal responsibility for
treatment. Moreover, although Becker and Janz (1985) have suggested that
some of the items measure perceived susceptibility, these are included in
scales measuring concepts such as perceived seventy. Perhaps because of
this lack of distinction between the scales, there have been no published

26
reports of studies utilizing them to measure the health beliefs of individuals
with diabetes. Indeed, it would not be possible to determine the relationships
between the variables if researchers are to test the HBM as originally
conceived. Furthermore, Davis, Hess, Harrison and Hiss (1987) have noted
that the psychological responses of patients to their disorder will differ
according to disease type and treatment mode, indicating that scale
development from the responses of a mixed sample may have produced
unrepresentative dimensions of beliefs.
Harris, Skyler, Linn, Pollack and Tewksbury (1982) reported the use of a
diabetes-specific measure based on the HBM, although a report regarding the
reliability and validity of a modified version of the scale was not published
until much later (Harris, Linn, Skyler & Sandifer, 1987). In the 1982 study,
Harris and colleagues described the use of a 71-item health beliefs
questionnaire adapted from an instrument used to evaluate the beliefs of
patients requiring haemodialysis (Hartman and Becker, 1978). The sample
studied consisted of 50 men with Type II diabetes (including some who were
insulin-treated). Categories of measurement included motivations, perceived
threats, perceived benefits, and perceived barriers. Behavioural and
physiological indices of adherence were used in this study. Behavioural
measures consisted of a nurse's scored assessment of the patients' reported
adherence to medication use, diet, urine testing, exercise and foot care.
Physiological measures included glycosylated haemoglobin (effectively an
average measure of blood glucose control over the previous 6-8 weeks),
fasting plasma glucose, fasting triglycerides, and urine glucose; all rated on a
scale of 1 (good control) to 4 (poor control). When reporting the results of
correlations between the health belief measures and indices of adherence to
treatment, it is apparent that only six of the original 71 items are used to
demonstrate relationships with the behavioural adherence measures, and five

27
items are used to demonstrate relationships with physiological indices. In the
former case, no associations are reported for items representing the perceived
severity dimension and in the latter case, no relationships are reported for
items concerning perceived barriers. Results from correlations with the
remaining health belief items or possible representative scales are not
mentioned at all. Attempts to correlate such a large number of single items
with the outcome variables also raises the doubt that the significant results
reported may have occured by chance. Table 1.2 and Table 1.3 summarize
the results of the reported correlations between health belief items and indices
of treatment adherence. It can be seen that while there are significant
correlations between individual items and the outcome measures, it is not
Table 1.2: Correlations between health belief items andand behavioural measures of adherence.(reproduced from Harris and colleagues, 1982)
Health belief Medication Dietary Exercise CompositeItems use compliance scale
(weightedaverage)
Benefits of Treatment
Believe physician can O.41**help with eye disease
Believe physician canhelp with nerve disease 033*
Cues to action
More extreme sweatingto seek medical help O.45** 0.3 1*
Frequency of low bloodsugar symptoms .032*
Perceived susceptibility
Feel susceptible to havinga shorter life 034*
Psychological barriers
Feel or imagine painfulinjections .033*
* p<O.05 ** p<O.Ol

28
Table 1.3: Correlations between health beliefs andphysiological indices of adherence. (reproducedfrom Harris and colleagues, 1982)
Health belief glycosylated fasting urine compositeitems haemoglobin plasma glucose score
glucose
Benefits of treatment
Believe physician canhelp with reducedlife expectancyBelieve physician canhelp with kidneydisease
Perceived susceptibility
Feel susceptible0.36* 0.30*amputation
Feel susceptible to031*disease of nerves
Perceived severity
Disease of nerves wouldinterfere with daily life .031*
* p<0.05
.035*
.0.34*
obvious why there should be a relationship between one outcome variable and
not another. An example is the item "Believe physician can help with eye
damage"; this item is significantly related to greater exercise adherence but
not to medication use or adherence to diet. Moreover, believing that a
physician can help with eye damage does not seem to correspond with
decisions about whether or not to exercise regularly. The face validity of
some of the items is also questionable. Harris and colleagues deliberate at
length about the reasons for various results, some of which are contrary to
expectations. However, this is largely a waste of effort given that individual
items were evaluated. This study was commended by Janz and Becker
(1984) as "Perhaps the most comprehensive exploration of the role of HBM
variables in diabetes-regimen compliance ..." Given the problems described
above, however, it is questionable whether this study makes any valuable
contribution to health belief research.

29
A further study reported by Harris, Linn and Pollack (1984) described the
use of the Diabetes Health Belief Scale (DHBS) but this was not fully
described and no data were presented concerning the instrument's reliability
and validity. Elements of the DHBS included general health motivation,
treatment beneficial", perceived seventy, perceived susceptibility,
psychological barriers, cues to action, and "structural elements" relating to the
patient's understanding and family support for the treatment regimen. In this
study, the DHBS is correlated with Rotter's (1966) Locus of Control scale,
the Health Locus of Control Scale (Wallston, Waliston, Kaplan & Maides,
1976), Hopkins Symptom Checklist (HSCL) (Derogatis, Lipman, Rickels,
Uhienhuth & Covi, 1974), Rosenberg's (1965) Self-Esteem Scale, and the
evaluative factor of the Semantic Differential scale (Osgood, Suci &
Tannenbaum, 1957) which was used to assess attitudes towards diabetes,
doctor and medical care. The rationale for this study was "to understand more
precisely the origins of such beliefs and the conditions under which they are
acquired". However, because of the correlational nature of this study the
direction of cause and effect is impossible to determine. Once again the
sample studied consisted of men only with Type 11 diabetes treated with diet
only or additionally with tablets or insulin. Results of the correlations are
summarized in Table 1.4. Harris and colleagues found several significant
associations with the obsessive-compulsive factor from the HSCL which
indicated that more obsessive-compulsive individuals perceived greater
benefits of treatment, felt that there were more barriers to treatment, and
perceived greater severity and vulnerability to complications. However,
Harris and colleagues did not consider that responses to the
obsessive-compulsive scale are not necessarily an indication of these
characteristics but a reflection of the vigilance and regulation of lifestyle which
is often required to adhere to a treatment regimen for diabetes. Similarly, the
items in many scales to measure affect such as the Hopkins Symptom
Checklist, include somatic symptoms which are confounded with diabetic

30Table 1.4: Correlations of health belief and psychological
variables. (based on Harris and colleagues, 1984)
General Treatment Severity Suscep- Psychol. Cues Struc-health beneficial tibility baniers to turalmotivn action elements
Health locus ofcontrol 0.2l* 0.26* 0.26*
0.22*
HopkinsSymptomChecklist:
Depression
Somatization
Internalsensitivity
Obsessive-compulsive
Anxiety
Self-esteem
SemanticDifferentials
Diabetes
Doctor
Medical care
0.25*
0.45**
0.23*
0.28 0.27* Ø39** 0.36**
035** 0.26*
0.27* 0.25*
0.24* 035* 0.26*
032**
033**
0.26*
* p<O.O5 ** pc:0.01
Health Locus of Control scored so higher number indicates a more internal orientation.HSCL scored so higher number means more of a factor.Self-esteem and Semantic Differential scored so higher number is less positive.
symptomatology (Bradley & Lewis, 1990). For this reason, the correlations
between these variables and health beliefs may be misleading. Indeed, it can
be argued that the HSCL is not a valid instrument when used with a diabetic
population. Given the atypical sample studied, the mixed nature of the
treatment regimens involved, and the unsubstantiated reliability and validity of
the DHBS, further research is necessary to determine the reproducibility of
the findings.

31
Harris, Linn, Skyler and Sandifer (1987) eventually published a paper
reporting the psychometric development of a 38-item DI-IBS which is a
modified version of the 40-item DHBS used in the earlier study (Hams and
colleagues, 1984) with a different scoring system. The nature of the previous
scoring system was never described. The scale was developed from the
responses of 280 men with Type I (23%) and Type II diabetes (77%). Over
half (68%) of the Type II patients were treated with insulin. Again, therefore,
the sampie is atypical and responses are related to more than one disease type
and treatment regimen. The final items produced from the factor analysis
accounted for a total of 44.4% of the variance and consisted of seven factors
with the same labels described earlier (see Table 1.5). Validity of the scale
was assessed from the responses of a sub-set of 120 subjects by relating the
DHBS to both behavioural and physiological indices in separate stepwise
multiple regression analyses. A total of 18% of the variance in treatment
adherence, as measured by behavioural indices, was explained by the seven
sub-scales. In this analysis, the majority of the variance was explained by
psychological barriers (6%), structural elements (5%) and perceived
susceptibility (3%). The second analysis showed that a total of 23% of the
variance in physiological control was accounted for, with the majority of this
variance explained by perceived seventy (6%), "treatment beneficial" (6%)
and perceived susceptibility (5%). [Contrary to predictions, better metabolic
control was associated with lower perceived susceptibility.] Thus the
behavioural and physiological indices of adherence had different patterns of
health belief predictors; probably due to the behavioural measure of
adherence being obtained from less reliable self-reports. This is one of the
first diabetes-related studies which has used health belief variables to predict
physiological control, so it is interesting to note that a comparatively greater
percentage of the variance in this measure was explained. Although Harris
and colleagues set out to test the model as a whole, the use of multiple
regression to analyse the data assumes that the various components of the

32
I-IBM combine additively and are related in a linear fashion to outcome
variables. Furthermore, although it is argued that cues to action and
structural variables influence health outcomes through an individual's beliefs
Harris and colleagues have included these in the analyses as direct predictors
of health outcomes. This approach is typical of the lack of consideration given
by research groups to the relationships between HBM dimensions when
analyzing the data. In addition to the limitations of the at,rpica1 and
heterogeneous sample used to develop the DHBS, another criticism concerns
the face validity of some of the individual items. For example, the question
"How much do you feel your doctor can help if you develop/have kidney
disease?" is classed as a "treatment beneficial" item; however, it seems to be
measuring patient perceptions about the doctor's control over complications
rather than perceived benefits of following a treatment regimen. Interpretation
of the findings in this study are therefore hampered by misleading scale
labels.
An earlier response to the lack of adequately developed scales to measure
HBM dimensions in a diabetic population was published by Bradley, Brewin,
Gamsu and Moses (1984). Measures of perceived control specific to diabetes
were also designed and developed. These scales were deveLoped from the
responses of 286 Type I patients (146 men and 140 women) aged between 16
and 59. The health belief scales measured perceived benefits of, and barriers
to treatment, and perceived severity of, and vulnerability to (a) complications
of diabetes and (b) disorders not specifically related to diabetes. The
usefulness of the scales in understanding individual differences in treatment
choice and perceived efficacy of treatment were examined in a feasibility study
of CSII (Bradley and colleagues, 1987). Patients choosing conventional
insulin therapy (Cl'), an intensified conventional therapy (ICT) and
continuous subcutaneous insulin infusion (CSII) pumps were compared on all
of the measures. The Perceived Severity and Perceived Vulnerability scores

33
were not significantly different for any of the comparisons. However, it was
found that patients choosing CSH for future treatment believed their current
treatment was less "cost-effective" (benefits less barriers) than patients
choosing CT. Although the HBM would predict that feelings of vulnerability
to severe complications would intensify preventive health care behaviour, and
higher Vulnerability and Severity scores would be associated with choosing
one of the intensified treatments these reLationships were not found. They
did find, however, that patients who chose CSII treatment and felt more
vulnerable to hyperglycaemic coma were significantly more likely to develop
diabetic ketoacidosis when using this form of therapy (Bradley and
colleagues, 1986). Nevertheless, Bradley and colleagues (1987) expressed
dissatisfaction with the Seventy and Vulnerability measures because of
problems in interpretation. A low vulnerability score, for example, may
indicate that a person may be ignorant of, underestimating, or denying the
risks of complications, but it may also be that, while aware of the general
risks, personally they may feel less vulnerable because of their efforts to
reduce the risk by improving their diabetes control. The Severity and
Vulnerability measures were also criticised because they did not take into
account that some respondents already had one or more of the complications.
The study in Chapter 2 describes the development of scales to measure health
beliefs in tablet-treated Type II patients. These scales were adapted from the
measures designed by Bradley and colleagues but the design of the new
perceived severity and vulnerability questionnaires was radically altered in
response to the problems just described. Although this research team
combined the perceived benefits and barriers scales to produce a measure of
perceived "cost-effectiveness" of treatment, it is disappointing that they did
not attempt to combine the perceived vulnerability and severity scales in this
study. This is likely to have reduced the chances of revealing meaningful
relationships between these measures and other variables.

34
Sjoberg, Carlson, Rosenqvist and Ostman (1988) used the scales designed
by Bradley and colleagues (1984) to study Type I patients with and without
endogenous insulin secretion. They reasoned that because patients with
some endogenous insulin secretion should find it easier to control their blood
glucose levels, they would perceive fewer treatment barriers, greater treatment
benefits, and feel that complications are less severe and less likely to occur to
them, when compared to non-excretors. The results indicated that there were
no significant differences between the two groups in perceived benefits and
barriers. However, in comparisons of scores for individual complications, it
was found that insulin-secretors perceived themselves to be significantly less
vulnerable to kidney problems than non-secretors. No attempt was made to
compare overall vulnerability and severity beliefs. Correlations between
measures of glycosylated haemoglobin (HbA 1 ) and the health belief
measures indicated that for insulin-secretors, better metabolic control was
significantly related to greater perceived vulnerability to complications. For
non-secretors, however, better metabolic control was associated with greater
perceived barriers to treatment Although this latter result is contrary to I-IBM
predictions, Sjoberg and colleagues reasoned that these patients perceived
more barriers in their efforts to obtain lower blood glucose levels because they
had to impose greater restrictions on their lifestyle. This study indicates,
therefore, how the health belief patterns of different groups of patients may
vary as a result of their physiological status.
Brownlee-Duffeck, Peterson, Simonds, and colleagues (1987) reported the
use of yet another diabetes-specific health beliefs instrument in order to
predict behavioural and physiological indices of treatment adherence. The
behavioural and physiological outcome data were, however, collected
retrospectively. The subjects were insulin-dependent patients drawn from
two centres producing predominantly younger and predominently older

35
samples respectively. Data obtained from these sample groups were therefore
analyzed separately as well as in combination. Multiple regression analyses
indicated that the amount of variance in glycosylated haemoglobin accounted
for by the HBM measures was 20% for the younger sample, 19% for the
older sample, and 16% for the samples combined. For indices of behavioural
adherence (self-reports), the health belief measures accounted for much larger
percentages of the variance (52% in the younger sample, 41% in the older
sample, and 40% in the combined sample), indicating that the health beliefs
were probably a reflection of the respondents' perceived adequacy of their
adherence behaviours. These findings also suggest that health beliefs vary
according to age, indicating the need to study more specific populations of
subjects in health beliefs research. As in the study by Harris and colleagues
(1987), the pattern of health beliefs predicting behavioural outcomes differed
from the pattern of health beliefs predicting physiological outcomes although
they were more similar for the older sample than the younger sample.
Support for the specific I-IBM predictions was mixed with, on the one hand,
greater perceived severity, fewer perceived barriers and greater perceived
benefits being associated with better metabolic control and reports of greater
adherence, while on the other hand, greater perceived susceptibility to
complications was associated with poorer metabolic control. The subscales of
the Diabetes Health Belief Questionnaire (DI-IBQ) were conceptually rather
than empirically derived. Internal reliability coefficients reported were
moderate to high with the exception of "cues to action" (Cronbach's alpha =
0.10). The items in the measure were not described in this paper but
assessment of face validity was possible on inspection of the questionnaire
obtained from the authors. Face validity of the items appeared to be good but
the method of measuring perceived vulnerability to complications of diabetes
was unusual. In this case, perceived susceptibility was assessed by asking
patients to estimate their chances of having a particular problem in percentage

36
terms. Percentage estimates were assessed on a five-point scale from 1-19%
chance to 80-99% chance. In addition, respondents were asked to rate (i)
how much of their estimate was based on how well they adhered to treatment
recommendations, and (ii) how much of their estimate was based on the
disease regardless of how much they adhered to their treatment, on a scale
from 1 (none of my estimate) to 5 (almost all of my estimate). Asking
patients to rate their susceptibility in percentage terms may have produced
inaccurate responses from individuals who had difficulty conceptualizing the
risks in this manner. Moreover, some patients may have experienced
difficulty in differentiating between the different bases for their estimate due to
lack of knowledge about the disease and the actual risks involved.
Brownlee-Duffeck and colleagues did not report how the responses from the
vulnerability scales were combined nor did they comment on the information
gained from measuring perceived vulnerability in this manner. An indication
of this research group's dissatisfaction with the DHBQ is that they have
designed a revised questionnaire (not yet published) which does not ask for
information about the bases for risk appraisal and has a new scoring system.
With a view to producing a needs assessment instrument specifically for
people with diabetes, Davis, Hess, Harrison and Hiss (1987) designed the
Diabetes Educational Profile (DEP). The theoretical basis for the DEP is
largely that of the I-IBM but the instrument also measures variables external to
the model. Sub-scales of the DEP were labelled Control Problems, Social
Problems, Barriers to Adherence, Benefits of Adherence, Regimen
Complexity, and Risk of Complications. The Social Problems sub-scale
consisted of items which could also be classed as perceived barriers to
treatment. The instrument was developed initially from the responses of 201
patients whose disease and regimen types were not described (Hess, Davis &
Van Harrison, 1986). Later validation of the scales (Davis and colleagues,
1987) was conducted on the responses of 56 Type I patients, 191 Type II

37
patients treated with diet or additionally with tablets, and 181 Type II patients
treated with diet and insulin. The DEP scores were correlated with measures
of glycosylated haemoglobin and percentage ideal weight collected
retrospectively for each patient group separately. Focussing on the HBM
variables, the results indicated that for Type I patients, more Social Problems
(largely perceived barriers to treatment) were significantly associated with
poorer blood glucose control (HbA 1). For non-insulin treated Type II
patients, however, more Social Problems and greater perceived Barriers to
Adherence were significantly associated with percentage ideal body weight
These results therefore indicate once again the eminence of perceived barriers
in predicting (or reflecting) health outcomes. The particular health outcomes
associated with perceived barners in this study are largely a reflection of their
importance for individuals with different types of treatment regimen.
An interesting study which focused on perceived barriers to treatment was
reported by Glasgow, McCaul & Schafer (1986). A 15-item questionnaire
was constructed from a pool of items contributed by six Type I patients and
two nurse educators. No attempt was made, however, to assess
psychometrically the structure or internal reliability of the responses of the 65
Type I patients studied. Adherence measures collected were based on the one
hand on retrospective self-reports, and on the other hand on prospective
patient self-reported records of insulin injections, blood glucose testing and
frequency of exercise; plus 24-hour dietary recall. Correlations between the
Barriers scores and adherence measures were computed concurrently at both
the initial and 6-month follow-up stages, and also prospectively using initial
scores to predict adherence at the 6-month follow-up. Although more
perceived barriers were associated with poorer adherence to treatment both
concurrently and prospectively, this association was much stronger for the
concurrent correlations at the 6-month assessment. The prospective

38
correlations were not greatly different from the concurrent correlations at the
initial assessment. Although Glasgow and colleagues do not attempt to
explain these findings it seems likely that the stronger concurrent correlations
at 6 months may be due to subject& perceptions about bathers to treatment
changing as a result of taking part in the study. These people had just
completed a &month period of self-monitoring in all aspects of the treatment
regimen so will have been greatly sensitized to how they felt in relation to
their degree of success in managing their diabetes. This study therefore
highlights the need for more prospective data collection in research concerning
diabetes in order to explore the dynamics of health beliefs in relation to
outcomes.
Locus of Control, Perceived Control, Self-efficacy and diabetes
Most of the studies which have measured locus of control (LOC)
expectations in a diabetic sample have employed Rotter's general
internal-external scale, the Health Locus of Control (HLC) Scale (Waliston,
Waliston, Kaplan & Maides, 1976) or the Multidimensional Health Locus of
Control (M}-ILC) Scale (Wallston, Waliston & DeVellis, 1978). However,
the results of these studies provide a confusing picture of LOC beliefs in
relation to diabetes. It has been argued by Bradley and colleagues (1990) that
the inconsistent or non-significant results produced by these studies may be
attributable to the non-specific nature of the LOC scales employed. The use
of scales designed specifically for diabetes has undoubtedly produced
consistent results which are also in accordance with predictions of the
underlying theory.
One of the first studies to examine locus of control expectations in diabetic
patients was carried out by Lowery and DuCette (1976). They used Rotter's

39
scale to measure LOC orientation in 90 black diabetic patients. The results
from the LOC measure were assessed in relation to scores from a Diabetes
and Health Information Test on the one hand, and the number of episodes of
physiological problems (hyper/hypoglycaemia and infections), weight gain,
and missed appointments on the other. In accordance with predictions,
Lowery and DuCette found that internal subjects were more active seekers of
information and were more knowledgeable than external subjects. However,
this superiority diminished with duration of diabetes to a point where no
significant differences between internals and externals were apparent. They
also found that although internals initially had fewer problems than externals,
contrary to predictions, this position was reversed in a group who had
experienced diabetes for longer. Another study which produced results
contrary to the predictions of LOC theory was that carried out by Edelstein
and Linn (1987). Once again, Rotter's internal-external scale was employed.
Subjects consisted of 120 men with insulin-requiring diabetes and an average
age of 51 years. LOC was assessed in relation to fasting blood glucose
levels, HbA 1, triglyceride and cholesterol levels which were combined in a
single measure of diabetes control. Multiple regression analyses indicated that
externally-oriented men had significantly better control than internally-oriented
men, however the amount of variance predicted amounted to only 12%
despite the inclusion of two covariates.
As mentioned earlier, Alogna (1980) used the HLC scale to assess whether
her "compliant" and "non-compliant" subjects differed in their control
expectations. She found that although there was no significant difference
between the groups in locus of control, there was a trend towards internality
in the "compliant" group. Schienk and Hart (1984) used the MHLC scale to
predict adherence to treatment along with measures of social support and
40
health value in Type I patients. Although no measure of physiological control
was obtained, they found that greater scores on the internality and powerful
others scales predicted the performance of self-management behaviours. In
another study by Peyrot and McMurr'j (1985) use of the MHLC revealed that
greater internality was significantly associated with better blood glucose
control (represented by glycosylated haemoglobin). Use of the more
health-specific LOC scales have therefore provided results more in line with
the predictions of the underlying theory but research in other health areas
using these scales has also produced inconsistent and confusing results
(Waliston, Wallston, Smith & Dobbin, 1987).
The need for more specific LOC scales was acknowledged by Bradley and
colleagues who designed and developed the diabetes specific perceived
control scales referred to earlier (Bradley, Brewin, Gamsu & Moses, 1984;
Bradley, Lewis, Jennings & Ward, 1990). The scales published in 1984
were developed for use with insulin-requiring patients, while the scales
published in 1990 were for tablet-treated patients. Both sets of scales have
produced comparable results which are in accordance with predictions of the
underlying theory when related to outcome variables. In particular, the scales
for insulin-users were successful in predicting treatment choice and efficacy in
a feasibility study of continuous subcutaneous insulin infusion (CSII) pumps
(Bradley, Gamsu, Moses, Knight, Boulton, Drury & Ward, 1987) and the
incidence of ketoacidosis in CSII pump users (Bradley, Gamsu, Knight,
Boulton & Ward, 1986) while the scales for tablet-treated individuals were
successful in predicting HbA 1, percent ideal body weight, psychological
well-being, and treatment satisfaction. The Wallstons' speculated LOC
typology (see p.12) was also successfully tested and confirmed using the
scales for tablet-treated patients.

41
Ferraro, Price, Desmond and Roberts (1987) have also designed and
developed a LOC scale specific to diabetes but it is not clear whether
responses to the instrument were obtained from Type I or Type II patients.
Furthermore, discriminant validity was not assessed in this study and no
subsequent validity data has been published so the utility of the scales has not
yet been established. However, the individual items of the instrument (which
is modelled on the M1-ILC) seem to have good face validity. The instrument
seems to have been designed for use with both Type I and Type 11 patients as
none of the items refer to specific treatments. It remains to be seen whether
this more general instrument is as efficient as the scales developed for specific
diabetic populations.
One of the explanations for the success of the scales developed by Bradley
and colleagues may be that these instruments also elicit beliefs about
self-efficacy expectations when positive outcomes are considered (see p.14).
The value of self-efficacy measurement in predicting outcomes related to
diabetes has only recently been recognised and this is reflected in the small
number of studies which have been published. One of the first studies to
include a diabetes-specific measure of self-efficacy was carried out by
Grossman, Brink & Hauser (1987). Their Self-efficacy for Diabetes Scale
was devised for use with adolescents and consisted of items which assessed
subjects' confidence in their abilities to perform various regimen behaviours.
It was successful in predicting metabolic control but the correlation was not
particularly strong and reliability and validity data on the scale were not
reported. In the same year another study was published by McCaul, Glasgow
and Schafer (1987) which reported the use of a 24-item diabetes self-efficacy
measure. Once again, the instrument assessed respondents' confidence in
their ability to perform diabetes regimen behaviours. No indication was given
that the measure had been psychometrically developed but the authors found
that it was the most consistent, and one of the most powerful predictors of
t1NWERSfl :EIBRAR'(

42
adherence to treatment in both adults and adolescents treated with insulin.
Apart from the perceived control scales by Bradley and colleagues, therefore,
there have been no psychometrically developed diabetes-specific measures of
self-efficacy published to date.
Conclusions
The research studies which have used I-IBM dimensions in order to
understand health outcomes have many problems which prevent clear and
reliable conclusions about their results. Studies about diabetes-related health
beliefs have proved to be no exception to this rule. Although interesting
insights have been gained about the nature of particular beliefs and their
relationships with health outcomes, much needs to be done to improve this
research to obtain a clearer picture of the efficacy of the HBM.
Major obstacles to reliable research findings have been:
1. The lack of satisfactory scales to measure diabetes-related health beliefs.
Although attempts have been made to produce different research instruments,
all of them have deficiencies of some kind which affect interpretation of their
results.
2. Heterogeneous samples of patients with different disease and regimen
types have often been studied together. It is now recognized that the nature of
the different types of diabetes will differentially affect patterns of health
beliefs and different patient samples should therefore be studied separately.

43
3. With few exceptions, most of the studies attempting to predict adherence to
treatment regimens from health belief measures have collected the outcome
data retrospectively. In order to determine the direction of the relationship
between health beliefs and health outcomes, prospective studies are required.
Studies of interventions would also help to determine the direction of these
relationships.
4. A problem which applies to all HBM research is that the relationships
between the various dimensions have not been detennined. The original
formulation suggested a multiplicative relationship between certain
components but this hypothesis remains to be tested.
5. The various dimensions of the 1-IBM have been successful in accounting
for only a moderate amount of variance in health behaviours. Although this
may be due to the various problems described earlier, certain key elements
may be missing from the model. The relationship between the I-IBM and
concepts such as locus of control and self-efficacy need to be explored further
in order to establish whether these may usefully extend the model.
The aim of the research described in the following chapters is to address
the above problems. Scales to measure diabetes-specific health beliefs in a
specific population of individuals with diabetes have been developed. These
scales are used to explore the relationships between the I-IBM dimensions in
retrospective and prospective studies. An attempt is also made to understand
the effects of various interventions on these beliefs. Finally, a measure of
perceived control of diabetes, which incorporates elements of locus of control
and self-efficacy, is studied in relation to the I-IBM.

44
CHAPTER TWO
BASELINE STUDY DESIGN AND METHODOLOGY
Psychological, clinical, physiological, and demographic data were collected
at baseline, in a study of people with tablet-treated Type 11 diabetes, for the
purposes of developing diabetes-specific health belief and perceived control
scales and assessing beliefs and attitudes before educational and treatment
interventions. Patients from this sample were approached for inclusion in
subsequent intervention studies which involved the use of several of the
baseline clinical and demographic measures and the previously developed
psychological scales. Because the studies have subjects and variables drawn
from the same baseline, therefore, the whole of this chapter is devoted to a
description of the design and methodology in order to avoid repetition in later
chapters. Figure 2.1 provides an overview of the research studies reported in
the present thesis.
Overall Research Strategy
In collaboration with Clare Bradley, health psychologist, John Ward,
consultant physician, and Adrian Jennings, research fellow, research studies
were planned with two main aims:
1. The diabetologists aimed to study the efficacy of a limited period of
insulin treatment in patients whose diabetes could not be optimally controlled
by diet and oral hypoglycaemic agents but for whom insulin would not have
normally been indicated. Details of the rationale and main hypotheses for this

(Chapter 3)
CrossectionalStudy ofBaseline
Beliefs &Attitudes
Study 1(Chapter 4)
EducationIntervention
Study
Study 2(Chapter 5)
InsulinIntervention
Study
Study 3(Chapter 6)
45
Baseline datacollection
Psyciwlogical questionnaires
Demographic, clinical andphysiological data
Psychometricdevelopment of
health beliefmeasures
A questionnaire booklet was athninictered in the baseline and intervention studiesand included measures of Health Beliefs, Perceived Control of Diabetes, Well-being,and Treatment Satisfaction. A general information questionnaire was also includedand additional demographic, clinical and metabolic data were provided by thephysicians.
Figure 2.1: An Overview of the Research Studies

46
study are presented in Chapter 6. In order to select subjects, an initial
screening of the overall population of tablet-treated patients attending the
hospital was necessary. Health status and degree of diabetes control were to
be assessed and suitable patients could then be approached for the insulin
intervention study. Patients whose diabetes was satisfactorily controlled or
potentially controllable with diet and tablets were to be offered the opportunity
to attend one of a series of diabetes education days.
2. The clinical research presented the opportunity for psychological
studies of the beliefs and attitudes of a specific population of diabetic patients
before and after the planned interventions. At the time of initial screening,
psychological data could be collected for the purposes of developing
diabetes-specific scales and to assess beliefs and attitudes in a crossectional
manner. Longitudinal research was also possible with the subsequent
collection of similar data at the various stages of the intervention studies.
Methods
Subjects
During an 18 month period, patients aged between 40 and 65 years with
tablet-treated Type II diabetes and attending routine appointments in two
clinics at the Royal Hallamshire Hospital, Sheffield, were approached for
inclusion in the baseline screening study. Invitation to join the study was by
letter (see Appendix 1) which was distributed to 239 patients (141 men and 98
women). Those who were blind or partially-sighted were not included. Two
hundred and nineteen (92%) patients (130 men and 89 women) agreed to take
47
part and attended an individual screening consultation with one of the
physicians (AJ). There were no significant differences between participants
and those who refused to take part for any of the available measures,
including sex, age, duration of diabetes, and glycosylated haemoglobin
levels. At the end of the consultation, the diabetologist gave each participant a
booklet of questionnaires (see Appendix 2) to complete at home. Patients
were asked to return the completed booklet, in confidence, direct to the
present author. Anyone who did not respond within 1 month of their
appointment received a reminder and invitation to contact the author if they
had any difficulty in completing the questionnaires. (A total of 41 reminders
were sent out.) One hundred and eighty-seven (85%) patients (110 men, 77
women) returned completed booklets of questionnaires. This final sample
provided data for the baseline study. There were no significant differences
between responders and non-responders to the questionnaires in sex, age,
duration of diabetes, glycosylated haemoglobin levels, or percent ideal body
weight.
Procedure
All patients who agreed to take part in the study attended the hospital for an
individual consultation with one of the physicians (AJ). At this consultation,
the physiological health status of participants was assessed in relation to their
diabetes and its control through physical examination, laboratory
investigations, and interview. Some of these data were used in subsequent
statistical analyses with psychological measures, and included

48
Percent ideal body weight:
This is the ratio of actual weight to ideal body weight for height as
given in the Metropolitan Life Insurance Tables (1959). The mean
percentage of ideal body weight for the general population between
the ages of 25 and 65 is 112% for men and 116% for women
(Multi-centre Study, 1988). In the Sheffield study, obesity was
defined as greater than 120% ideal body weight (Jennings, Spencer,
Dean, Wilson, Bottazzo & Ward, 1989)
Glycosylated haemoglobin (HbA1):
This gives an indication of the amount of glucose circulating in the
bloodstream in the 6-8 weeks prior to assay. The most usual
fraction of haemoglobin to be measured is A 1 leading to the
abbreviation by which the test is generally recognised: HbA1
(Shillitoe, 1988). The normal range of the Royal Hallamshire
Hospital assay was 29.0 to 39.0 mmol HMF. Poor glycaemic
control was defined by the physicians who collaborated in the
Sheffield study to be greater than 55 mmol HMF.
Presence of diabetic complications:
All patients attending the consultation were screened for the
recognized complications of diabetes. These were heart disease,
history of stroke, kidney disease (nephropathy), hypertension,
peripheral neuropathy, impotence, eye disease (cataract, retinopathy,
maculopathY) present and past foot ulcers and amputations.

49
The booklet of psychological questionnaires contained the following:
1 . General Information Questionnaire:
Information was requested about age, sex, weight, height, age at leaving
full-time education, average daily intake of carbohydrate, duration of diabetes,
type of glucose testing (i.e. blood or urine tests), if and how the treatment
regimen was adjusted by the patient on the basis of blood or urine testing, the
patient's general impression of how well the respondent's diabetes had been
controlled over the past few weeks [rated on a seven-point scale from 1 (very
well controlled) to 7 (very poorly controlled)], duration of present treatment,
and dose frequency of oral hypoglycaemic agents.
2 .Psychological Well-being:
Investigations of psychological well-being of people with general medical
disorders have typically used assessment instruments developed for use with
psychiatric or general populations (Fnis & Nanjundappa, 1986; Derogatis,
1986; Wilkinson, Borsey, Leslie, Newton, Lind & Ballinger, 1988). The
problem with using such instruments is that somatic symptoms of depression
and anxiety are usually included in these measures and are often similar to the
somatic symptoms of illnesses such as diabetes and cancer (Plumb &
Holland, 1977; Lustman, Amado H & Wetzel RD. 1983; Lustman & Harper,
1987). The commonly used Beck Depression Inventory, for example,
includes items concerning tiredness, loss of appetite, loss of libido, and
weight loss. However these symptoms are also typical of hyperglycaemia,
hypoglycaemia, chronic complications of diabetes, and the advanced stages of

50
acute illnesses such as cancer. Psychological well-being measures designed
for patients with a physical disorder therefore need to be particularly sensitive
to the more cognitive symptoms and to minimize as far as possible the
inclusion of somatic symptoms. The choice of items in the psychological
well-being measure included in the present research was therefore guided by
these considerations.
The original version of the well-being measure was put together for a
WHO multi-centre European study of continuous subcutaneous insulin
infusion (CSII) pumps and was constructed in order to measure depression,
anxiety, and positive well-being. The depression and anxiety scales were
taken from a measure already developed by Warr and colleagues on another
population (Warr, Banks & UlIah, 1985) while the positive well-being items
were newly put together by Clare Bradley (now at University of London). In
the present study, respondents rated a four-point scale from 3 (all the time) to
0 (not at all) to indicate how often they felt each statement applied to them in
the past few weeks. Psychometric analyses were necessary in order to ensure
that the final instrument met criteria for reliability and validity for the
population studied and to select final positive well-being items from the initial
pool of sixteen. Internal reliability of the scales was found to be satisfactory
(Cronbach Alpha = 0.70 for Depression scale; 0.80 for Anxiety scale; 0.88
for Positive Well-being scale) and construct validity was demonstrated by
predicted correlations with metabolic outcome variables and the other
psychological measures. A full description of the psychometric development
of the Well-being scales is reported elsewhere (Bradley & Lewis, 1990).
The developed scales (Figure 2.2) provided the data reported in the present
thesis.

51
Figure 2.2: The Well-being Scales
Depression
I feel that I am useful and needed
I have crying spells or feel like it
I find I can think quite clearly
My life is pretty full
I feel downhearted and blue
I enjoy the things I do
Anxiety
I feel nervous and anxious
I feel afraid for no reason at all
I get upset easily or feel panicky
I feel like I'm falling apart and going to pieces
I feel calm and can sit still easily
I fall asleep easily and get a good night's rest
Positive Well-being
I have been happy, satisfied or pleased with my personal life
I have felt well adjusted to my life situation
I have lived the kind of life I wanted to
I have felt eager to tackle my daily tasks or make new decisions
I have felt I could easily handle or cope with any serious problem or majorchange in my life
My daily life has been full of things that were interesting to me
Respondents rated afour-point scale from 3 (all the lime) to 0 (not at all) toindicate how often they felt each statement applied to them in the past fewweeks. (See Appendix 2)

52
3. Treatment Satisfaction
The treatment satisfaction questionnaire was an adapted and extended
version of a satisfaction measure designed for insulin-requiring patients
(Lewis, Bradley, Knight, Boulton & Ward, 1988). Psychometric analyses
of the responses to this questionnaire were necessary in order to select items
for inclusion in the final scale and to assess reliability and validity. The final
measure consisted of six items which provided a scale with satisfactory
internal reliability (Cronbach Alpha = 0.79) and construct validity was
indicated by predicted relationships with both psychological and metabolic
outcome variables. In addition to the final scale, two items concerning hypo-
and hyperglycaemia did not load in principal components analyses with the
six scale items or with each other. However, because the incidence of hypo-
and hyperglycaemia is likely to be important in the assessment of treatment
satisfaction in certain contexts, they were included in the overall Treatment
Satisfaction measure as separately scored items. A detailed description of the
design and development of the measure is given by Bradley & Lewis, 1990.
Responses relating to the final Treatment Satisfaction measure (Figure 2.3)
provided the data reported in the present thesis.
Psychological well-being and treatment satisfaction were measured in order
to obtain a baseline assessment before interventions, and were particularly
relevant to the evaluation of treatment efficacy in the insulin intervention study
which is reported elsewhere (Jennings, Lewis, Murdoch, Talbot, Bradley &
Ward, 1991). In the present research, the well-being and treatment
satisfaction measures were used in the assessment of construct validity of the
health belief scales (see Chapter 3).

53
Figure 2.3:
The Treatment Satisfaction Scale and Individual Items
Items from the scale:
How satisfied are you with your current treatment?
How well controlled do you feel your diabetes has been recently?
How convenient have you been finding your treatment to be recently?
How flexible have you been finding your treatment to be recently?
How satisfied are you with your understanding of your diabetes?
How satisfied would you be to continue with your present form oftreatment?
Individual items:
How often have you felt that your blood sugars have been unacceptablyhigh recently?
How often have you felt that your blood sugars have been unacceptablylow recently?
Respondents rated degree of Treatment Satisfaction on a seven-point scale.(See Appendix 2)
4. Perceived Control of Diabetes
The perceived control scales were adapted from a measure previously
developed for use with insulin-requiring patients (Bradley, Brewin, Gamsu &
Moses, 1984). Perceived control is a construct derived from attribution
theoiy which is concerned with the way people attribute or explain their own
and other's behaviour. In the context of health self-care, people's
motivation to carry out a particular preventive health behaviour is likely to be
influenced by past experience of a similar nature and their attributions for

54
previous successful and unsuccessful outcomes. As discussed in Chapter 1,
attributions about locus of control and self-efficacy have been shown to be
important in understanding people's motivation to manage their diabetes. The
Perceived Control of Diabetes measure used in the present research not only
incorporates the notion of locus of control by eliciting respondents'
attributions for outcome responsibility, but also assesses perceived
self-efficacy because the instrument has been designed so that it measures
responses to specific hypothesized outcomes.
The design of the perceived control of diabetes questionnaire was
influenced by work on locus of control measurement (Rotter, 1966; Wallston,
Waliston & DeVellis, 1978) and attributional style measurement (Peterson,
Semel, Von Baeyer, Abramson, Metalsky & Seligman, 1982). The
instrument measures Perceived Control for both positive and negative
outcomes associated with diabetes management, since individuals may
perceive more control over positive outcomes than negative outcomes, or
vice-versa (Brewin & Shapiro, 1984; Gamsu & Bradley, 1987; Gillespie &
Bradley, 1988). Furthermore, attribution about responsibility for positive
outcomes also provides information about perceived self-efficacy (i.e.
whether the respondent feels they can actually make the outcome happen in
the first place). The instrument consists of descriptions of hypothetical events
relevant to, or experienced by, people with tablet-treated diabetes (Figure
2.4) For each scenario, respondents were asked to imagine that they had
recently experienced the outcome described and write down its most likely
cause. This was then rated by the respondent on seven separate 7-point scales
designed to measure attributions of causality labelled Internality, Treatment,
Externality, Chance, Personal Control, Medical Control, and Foreseeability.
Figure 2.5 illustrates an example of a page in the questionnaire which
describes one of the hypothetical events and shows the format of the

55
Figure 2.4 Descriptions of hypothetical events
Positive outcomes
'Imagine that you have been able to keep your weight at an acceptable level
for a period of several weeks and you have felt fit and well.'
'Imagine that you have successfully avoided the complications of diabetes
such as problems with your feet.'
'Imagine that you have reduced your weight lo a satisfactory level after a
period when you gained too much weight'
Negative outcomes
'Imagine that you have recently become unacceptably overweight'
'Imagine that for several days you have found high levels of sugar when
you tested your urine.'
N.B. The original questionnaire included an extra negative outcome ('Imagine that you arevery thirsty and have passed unusually large amounts of urine recently'). This item eliciteda significant number of responses unrelated to diabetes so it was removed from the finalmeasure. (See Bradley, Lewis, Jennings & Ward (1990) for details.)

56
Figure 2.5: Illustrative item from the Perceived Control Scales
Imagine that for several days you have found high levels of sugarwhen you tested your urine.
Write down the single most likely cause of the high sugar levels inthe space below.
Now rate this cause on the following scales:
1. To what extent was the cause due to something about you?
Totally due to me 6 5 4 3 2 1 0 Not at all due to me
2. To what extent was the cause due to the treatment recommendedby your doctor?
Totallydueto ataSduetotreatment 6 5 4 3 2 1 0 treatmentrecommended recommended
3. To what extent was the cause something to do with other peopleor circumstances?
Totally due to other Not at all due to
people or 6 5 4 3 2 1 0 other people orcircumstances circumstances
4. To what extent was the cause due to chance?
Totally due to Not at all due
chance 6 5 4 3 2 1 0 to chance
5. To what extent was the cause controllable by you?
Totally Totallycontrollable by me 6 5 4 3 2 1 0 uncontrollable by me
6. To what extent was the cause controllable by your doctor?
Totally controllable Totally uncontrollable
by my doctor 6 5 4 3 2 1 0 by my doctor
7. To what extent do you think you could have foreseen the causeof the high sugar levels?
Totally foreseeable Totally unforeseeablebyrne 6 5 4 3 2 1 0 byrne
57
attribution scales used for each item.
Psychometric analyses of the responses to the questionnaire produced three
composite scales: Personal Control (consisting of the Internality, Personal
Control, and Foreseeability scales), Medical Control (consisting of the
Treatment and Medical Control scales), and Situational Control (consisting of
the Externality and Chance scales). Internal reliability was found to be
satisfactory for all three of these scales (Cronbach's Alpha = 0.70 to 0.91)
and construct validity was indicated by predicted relationships with the
metabolic outcomes and the other psychological measures. A full description
of the development of the Perceived Control of Diabetes scales is given in
Bradley, Lewis, Jennings & Ward (1990).
As mentioned in Chapter 1, Wallston and Wallston (1982) have offered a
speculative typology (based on the MHLC scales) in an attempt to clarify the
relationships between Locus of Control and health behaviour by looking at
patterns of beliefs and their effects on outcomes. The various types identified
by Wallston and Waliston are described in Table 2.1. It can be seen from this
table that the MHLC instrument provides scores on three scales: Internality,
Powerful Others, and Chance. The developed Perceived Control of Diabetes
scales therefore minor the M1-ILC scales quite well so it is feasible to apply
the Wallstons' typology to them. Indeed, when this typology was tested
during the psychometric evaluation of the Perceived Control of Diabetes
scales, the pattern of scores provided support for the initial hypotheses
(Bradley, Lewis, Jennings & Ward, 1990).

'Pure' Internals High
Low Low
'Pure' PowerfulOthers Externals Low
High Low
58
Table 2.1: Summary of Waliston and Wallston's typologyand predicted consequences for diabetes management(reproduced from Bradley, Lewis, Jennings & Ward, 1990)
Scale scores PredictedLabel consequences forInternality Powerful Chance diabetes managementOthers
Believers in High High LowControl
'Pure' ChanceExternals Low Low High
Double Externals Low High High
Type VI High Low High
Good use of personalresources and healthservice
Good use of personalresources but may notrecognize when theseare inadequate
Poor use of personalresources andunrealisticexpectations of healthservice resources
Fatalistic: poor use ofall resources
Poor use of personalresources, unrealisticexpectations of healthservice resources, andelement of fatalism
The Wallstonssuggested that this typewould be non-existentor rare
Yea-sayers High High High Response bias? Noclear predictions
Nay-sayers Low Low Low Response bias? Noclear predictions
59
5. Diabetes-specific Health Beliefs
In accordance with the I-IBM, the scales were constructed to measure
perceived benefits of, and barriers to treatment, and perceived severity of, and
vulnerability to complications of diabetes. The design of the scales was an
attempt to represent unambiguously the dimensions of the HBM in relation to
a specific type of diabetes based on the experience of developing and
interpreting findings from similar measures for insulin-users (Bradley,
Brewin, Gamsu & Moses, 1984).
The benefits of, and barriers to, treatment questionnaire initially consisted
of 24 statements with which respondents agreed or disagreed on a seven-point
scale from 0 (strongly disagree) to 6 (strongly agree). The original
questionnaire is included in Appendix 2 and an example of the questionnaire
format is provided in Figure 2.6. Because the HBM makes the prior
assumption that health is important to the individual, two of the items were
constructed in order to measure health value:
Good diabetes control has to take second place to some other
more important things in my life
The benefits of good weight control and a healthy diet are much
more important to me than the regular enjoyment of sugary and
fatty foods.
The benefits and barriers statements were constructed or adapted from items
used with insulin-requiring patients to make them relevant to respondents'
views about themselves and tablet-treated diabetes.

60
Figure 2.6: Format of the Perceived Benefits and BarriersQuestionnaire
HEALTH BELIEFS SCALE
In this section would you please circle one of the numbers on each of the scales toindicate how strongly you agree or disagree with each of the following statements.
On these scales 0 would indicate that you strongly disagree1 moderately disagree2= mildly disagree3= neither agree nor disagree4= mildlyagree5= moderately agree6= strongly agree
strongly stronglydisagree agree
1. Regular, controlled exercisehelps in the management of mydiabetes
2. By careful planning of diet andexercise, I can control mydiabetes at least as well as mostother people with diabetes
3. Controlling my diabetes wellimposes restrictions on mywhole lifestyle
4. Sticking to my diet makeseating out difficult
5. High blood sugars can beprevented if I plan ahead
6. 1 fmd it difficult to rememberto take all my tablets at thetimes recommended by the doctor
7. It is important for me to visit thediabetic clinic regularly even inthe absence of symptoms
8. The better my diabetes iscontrolled, the healthier I feel
9. It is just not possible to controlmy diabetes properly and live ina way that is acceptable to me
10. Testing wine is an unpleasanttask to have to undertake
11. A well-balanced, healthy diet canbe just as enjoyable as a dietwhich is rich in fat or sugar
0123456
0123456
0123456
0123456
0123456
0123456
0123456
0123456
0123456
0123456
0123456
/continued over

61
Perceived seventy was measured by asking respondents to rate on a
five-point scale from 0 (not serious at all) to 4 (extremely serious) the severity
of various disorders if they were to develop them. Based on the experience of
the perceived seventy questionnaire designed for insulin-users, the items were
made more specific than previously in order to avoid patients construing
certain disorders in different ways Cancer, for eample, covers a multitude of
different types and stages with differing prognoses whereas leukaemia is
more specific in type and prognosis. Eight of the disorders were
complications of diabetes (high blood pressure, blindness, kidney disease,
aching legs, numbness in the feet, heart disease, failing eyesight, gangrene)
and eight were not specifically related to diabetes (stomach ulcer, ear
infection, leukaemia, gum disease, bronchitis, deafness, asthma, loss of
hearing). In addition, two further items were included ('Your diabetes now'
and 'Your diabetes in 10 years' time') which focused respondents' attention
on the disorder of diabetes as a whole. The questionnaire was constructed so
that if patients were unable to rate the seriousness of a problem because they
did not know what the problem was, they could indicate this by ticking a box
next to the disorder concerned. An example of the questionnaire format is
given in Figure 2.7.
The list of disorders included in the perceived vulnerability questionnaire
was the same as that used for the measurement of perceived severity.
However, it was not sensible to include the two specific diabetes items in this
questionnaire so they were substituted with a single item: 'Complications
arising from diabetes'. Patients were asked to rate 'how likely you feel it is
that you will develop the following problems' on a five-point scale from 0
(extremely unlikely) to 4 (extremely likely). If respondents thought they
already had any of the problems listed, however, they could indicate this next
to the disorder concerned. The measure of perceived vulnerability designed
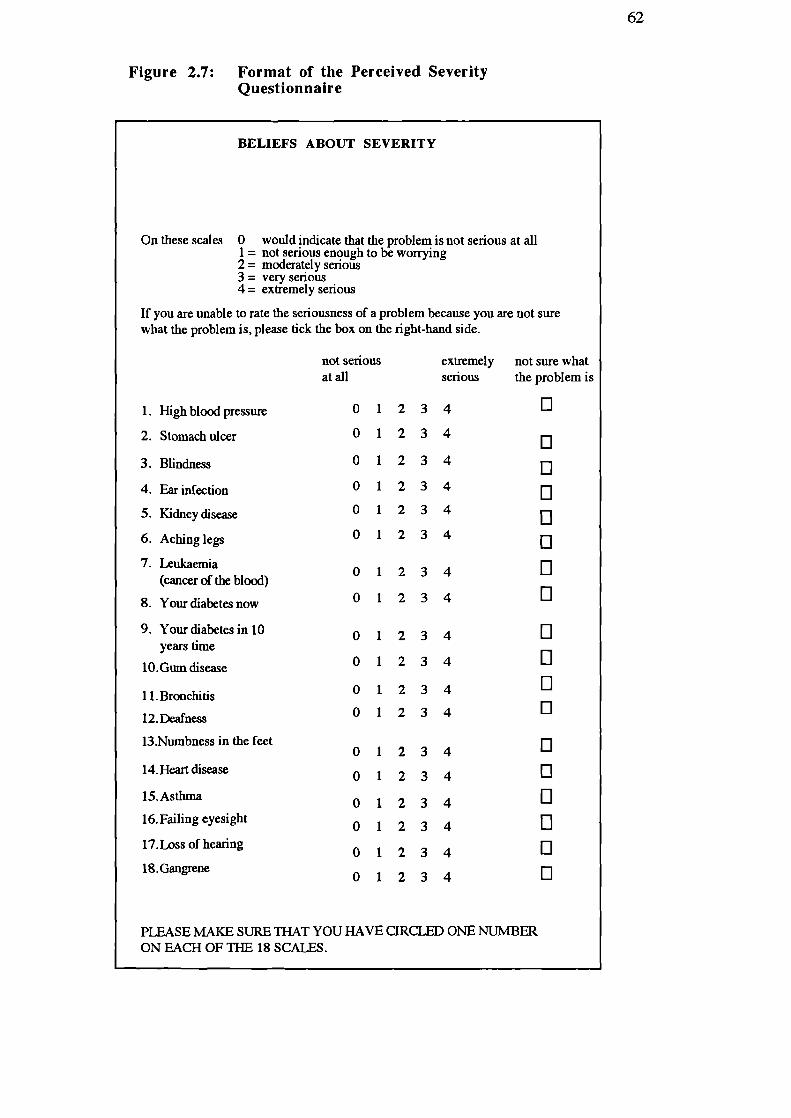
62
Figure 2.7: Format of the Perceived SeverityQuestionnaire
BELIEFS ABOUT SEVERITY
On these scales 0 would indicate that the problem is not serious at all1 = not serious enough to be worrying2 = moderately serious3 = very serious4= extremely serious
If you are unable to rate the seriousness of a problem because you are not surewhat the problem is, please tick the box on the right-hand side.
1. High blood pressure
2. Stomach ulcer
3. Blindness
4. Ear infection
5. Kidney disease
6. Aching legs
7. Lcukaemia(cancer of the blood)
8. Your diabetes now
9. Your diabetes in 10years time
10.Gum disease
11.Bronchitis
12.Deafness
13.Numbness in the feet
14. Heart disease
15.Asthma
16. Failing eyesight
17.Loss of hearing
18. Gangrene
not serious extremely not sure whatat all serious the problem is
fl 1 0
012340
01234 El01234
012340
01234 0
01234
El
01234
0
01234
01234
El
01234 0
01234 0
01234 0
01234 El
01234
U
01234
0
01234
U
01234
0
PLEASE MAKE SURE THAT YOU HAVE CIRCLED ONE NUMBERON BAd-I OF THE 18 SCALES.

63
for insulin-users did not elicit this type of information which may explain why
it was, on occasion, unsuccessful in predicting outcomes (Bradley, Gamsu,
Moses, Knight, Boulton, Drury & Ward, 1987). Another problem with the
previous measure, which the present measure took steps to deal with, was
that while patients may be aware of the general risks of complications, these
perceptions of vulnerability are mediated by what patients see as personal
risk-reducing strategies. Such strategies might be the patient's efforts to
improve blood glucose or weight control, or they may feel that because they
have regular checks at the hospital this renders them less vulnerable. It is also
possible that factors such as family history may make an individuaL feel more
vulnerable to a particular disorder but s/he may be unaware that it is a
complication of diabetes and so behaviour related to diabetes management
may be unaffected. Factors such as this are likely to cause 'noise' in the data
which will cloud any association between perceived risks of diabetes and
behaviour relating to diabetes management and between perceived risks and
clinical outcomes. The present measure was therefore designed so that
respondents were also asked to rate the vulnerability of an 'average person
with your kind of diabetes who is the same age, sex, follows the same kind of
treatment, and has 'average control over his/her diabetes'. It was reasoned
that ratings of an 'average person' would provide an estimate of vulnerability
which is less influenced by mediating influences and 'noise' from other
factors. The format of the questionnaire is illustrated in Figure 2.8.
The measures of perceived severity and vulnerability designed for
insulin-requiring patients employed six-point scales. The present measures of
perceived severity and vulnerability were redesigned to include five-point
scales because of the similarity of two of the points on the previous scale and
to create a mid-point. A full description of the development of all the health
belief scales will be reported in Chapter 3.

01234 0
01234
01234 001234
01234 0
01234
01234 0
01234
/continued over
64
BELIEFS ABOUT VULNERABILITY
In this section we are asking you to make two ratings for each of the problemslisted.
First: Indicate how likely you feel it is that you will develop the followingproblems.
Second: Consider an average person with your kind of diabetes who is
- your age- your sex- follows the same kind of treatment as yourself- has average control over his or her diabetes
On these scales 0 would indicate that you feel that you are extremelyunlikely to develop the problem
1 = neither likely nor unlikely2 = quite unlikely3 = quite likely4= extremely likely
If you already have or think you may have any of these problems, please tick the boxon the right-hand side.
extremely extremely
I already haveunlikely likely
this problem
1. High blood pressure
Yourself
Average person withyourkind of diabetes
2. Stomach ulcer
Yourself
Average person withyour kind of diabetes
3. Blindness
Yourself
Average person withyour kind of diabetes
4. Ear infection
Yourself
Average person withyour kind of diabetes

65
Statistical Analyses
A significance test for skewness was used to assess score distributions
which compared the standard error for skewness with zero using the z
distribution (Tabachnick & Fidell, 1989). The distributions of scores for the
Well-being, Treatment Satisfaction, Perceived Control, and Perceived
Benefits of Treatment scales were skewed, indicating the need for
non-parametric statistical tests or data transformation when analysing these
measures. Score distributions relating to Perceived Vulnerability satisfied the
assumptions of parametric statistical tests. Details of the tests used in
analyses of the various psychological measures will be given in the following
chapters where appropriate.

66
CHAPTER THREE
PSYCHOMETRIC DEVELOPMENT OF THE
HEALTH BELIEF SCALES
In order to explore the possible combinations of HBM variables in the
baseline and intervention studies, it was necessary to develop first a HBM
instrument that was reliable in terms of internal consistency and had evidence
of validity. This chapter will describe the psychometric procedures used to
select and test the diabetes-specific health belief scales for internal reliability
and construct validity. Chapter 2 has already presented a description and
rationale for the design of the scales together with details of the sample of
patients who provided responses to the questionnaires.
Statistical Analyses
The structure of the perceived benefits of, and barriers to treatment measure
was explored using a principal components factor analysis with vanmax
rotation (Harman, 1967). Reliability of all the scales was assessed using
Cronbach's alpha coefficient of internal consistency (Cronbach, 1951). As
mentioned in Chapter 2, the distributions of scores for the perceived benefits
of treatment and perceived severity scales were skewed, indicating the need
for non-parametric statistical tests in subsequent analyses of these measures.
Between-scale comparisons were therefore explored using the Wilcoxon
matched pairs signed ranks test and their relationships to other variables were
examined using Spearman rank correlations. The distributions of the
perceived vulnerability scores satisfied the assumptions of parametric tests, so

67
between-scale comparisons were explored using Student's t -tests (paired
scores), and relationships to other variables were examined using Pearson's
correlation coefficient.
Structure of the Health Belief Measures
Perceived Benefits of, and Barriers to Treat inent
Scores for all 24 of the benefits and baniers statements were submitted for
factor analyses in order to determine the structure of patient responses to the
questionnaire. It was predicted that three factors would emerge relating to
perceived benefits, perceived barners, and health value. However, an initial
analysis produced six factors which could not be labelled in this way.
Although the benefits and barriers items loaded together in sensible patterns
relating to diet, complications, etc., the two items constructed to measure
health value did not load together. Forced three-factor and two factor
solutions were sought, therefore, in order to determine whether health value
would emerge as a separate factor in the three-factor solution and if not,
whether the items would load with the predicted benefits and barriers factors
in the two-factor solution. The results of these analyses indicated that one of
the health value items (The benefits of good weight control and a healthy diet
are much more important to me than the regular enjoyment of sugary and fatty
foods') was responded to as a perceived benefits item in both the three- and
two-factor solutions. However, the remaining health value item ('Good
diabetes control has to take second place to some other more important things
in my life') did not load with any of the benefits or barriers items in either of
the forced solutions. On the basis of these findings, the former health value
68
item was not used in the final scales because it was not intended to measure
perceived benefits. However, although future research should aim to produce
a measure consisting of more than one item, it was considered possible that
the remaining health value item may be usefully employed as a single measure
when exploring the relationships between the I-IBM variables.
The forced two-factor solution provided distinct factors characterized by
items with loadings >0.4 relating to perceived benefits and barriers,
respectively. Eleven of the items loaded on the perceived barriers factor and
nine loaded on the perceived benefits factor. Each of the items in the scales
was examined for item-total correlations and items were dropped if they:
(a) inflated the reliability coefficient because of their
similarity to other items,
(b) had the lowest item-total correlations,
(c) reduced internal reliability, or
(d) qualitatively, restricted the measure to a subgroup
of patients such as those testing for urinary glucose rather
than blood glucose.
An equal number of items in each scale was sought and thus the final
perceived benefits and barriers scales comprised five items each. A
confirmatory, unforced factor analysis was carried out on the responses to the
final items which produced two factors comprising the benefits and barriers
items separately (Table 3.1) and accounted for a total of 52% of the variance
(30% and 22%, respectively). Data relating to the five perceived benefits and

69
five perceived barriers items were summed to form scales labelled Perceived
Benefits 0/Treatment and Perceived Barriers to Treatment. Following the
example of Bradley and colleagues (1987) a measure of Treatment
'Cost-effectiveness' was also calculated by subtracting the Perceived Barriers
score from the Perceived Benefits score for each individual.
Perceived Severity and Vulnerability
Scores relating to the eight complications items and eight disorders
unrelated to diabetes (Table 3.2) were summed separately to form the
following measures:
(a) Perceived Severity of Complications
(b) Perceived Severity of General Disorders
(c) Perceived Vulnerability to Complications
(d) Perceived Vulnerability to General Disorders
(e) Perceived Vulnerability of the Average Person to Complications
(1) Perceived Vulnerability of the Average Person to General Disorders
The scores relating to perceived severity of the patient's diabetes now and in
10 years' time were summed to form a measure labelled Perceived Severity
of Diabetes. The single perceived vulnerability item Complications arising
from diabetes was treated separately in analyses.

0.09
0.54
-0.09
0.52
-0.07
0.81
70
Table 3.1: Factor loadings for Perceived Benefits of, andBarriers to Treatment items(N = 178)
Factor loadings
Factor 1 Factor 2
Perceived Benefits
By careful planning of diet and exercise,I can control my diabetes at least as wellas most other people with diabetes.
High blood sugars can be prevented if Iplan ahead.
Good control of my diabetes reduces thepossibility of developing complications.
It is important to take all my tablets at thetimes recommended by the doctor if I amto achieve good control of my diabetes.
I find that keeping to a diet is helpful incontrolling my diabetes.
-0.04 0.80
-0.05 0.60
Perceived Barriers
Sticking to my diet makes eating outdifficult.
It is just not possible to control mydiabetes properly and live in a way that isacceptable to me.
Sticking to my diet causes inconvenienceto other people.
Controlling my diabetes well interfereswith my social life.
The diet I am supposed to follow israther dull and uninteresting.
0.73 0.07
0.72 -0.08
0.79 0.07
0.84 -0.05
0.65 -0.29
The magnitude of the factor loading indicates degree of relationship to eachfactor

71
Respondents who ticked the box "not sure what the problem is" on the
Beliefs about Severity questionnaire were coded as missing for the particular
disorder(s) concerned. The only diabetes-related item which produced a
significant number of these responses (32) was "Your diabetes in 10 years".
A likely explanation is that these patients were not aware that diabetes is a
progressive disease. In view of the number of missing cases for this item,
responses to "Your diabetes now" and "Your diabetes in 10 years" were
treated separately in some exploratory analyses of HBM variables (in addition
to the composite measure of Perceived Severity of Diabetes).
Frequency counts of the "I already have this problem" responses from the
Beliefs about Vulnerability questionnaire revealed that a substantial proportion
of patients (50%) believed they already had one or more of the complications.
The frequency counts for each individual disorder are shown in Table 3.2.
As the method of listwise deletion of cases was to be employed when
analysing total perceived vulnerability scores, this would have created a large
amount of missing data. In order to utilize data from the maximum number of
respondents, therefore, the mean of the available perceived vulnerability
scores for the individual complications was calculated for each respondent.
This measure of meaned scores was labelled: Mean Perceived Vulnerability to
Complications.
The design of the perceived severity and vulnerability questionnaires
predetermined the content of each scale so it was not necessary to conduct
factor analyses for the purpose of scale construction. However, factor
analyses were carried out in order to examine the pattern of responses to these
questionnaires. The results indicated that perceived severity ratings depended
upon whether the items related to:

72
Table 3.2: Frequencies of "I already have thisdisorder" from the Beliefs about Vulnerabilityquestionnaire.
Disorders unrelated to diabetes
Stomach ulcer 10
Ear infection 10Leukaemia
0
Gum disase
4
Bronchitis
8
Deafness
13
Asthma
2
Loss of hearing
15
Complication5
High blood pressure
47
Blindness
4
Kidney disease
1
Aching legs
59
Numbness in the feet
37
Heart disease
25
Failing eyesight
28
Gangrene
2
Single item:
"Complications arising from diabetes"
10
73
(a) Life-threatening/end-stage disorders
(b) Not immediately life-threatening/early stage disorders
(c) Eyesight
(d) Diabetes as a whole ("your diabetes now/in 10 years")
A total of 68% of the variance was accounted for by these four factors.
Factor analysis of the perceived vulnerability data indicated that ratings were
influenced by whether the disorders were perceived to be
(a) Life-threatening
(b) Not immediately life threatening and related to diabetes
(complications)
(c) Not immediately life threatening and unrelated to diabetes
The three factors accounted for a total of 67% of the variance. The perceived
vulnerability data relating to the "average person" was also factor-analysed
and produced three factors relating to:
(a) Disorders unrelated to diabetes
(b) Life-threatening complications of diabetes
(c) Not immediately life-threatening complications of diabetes
These three factors accounted for a total of 63% of the variance. The differing
factor patterns relating to the personal and "average person" ratings provide
evidence for the separate utility of these measures. Tables 3.3 and 3.4 show
the means, standard deviations and other statistics relating to the perceived
severity and vulnerability scores for the individual items in the questionnaires.
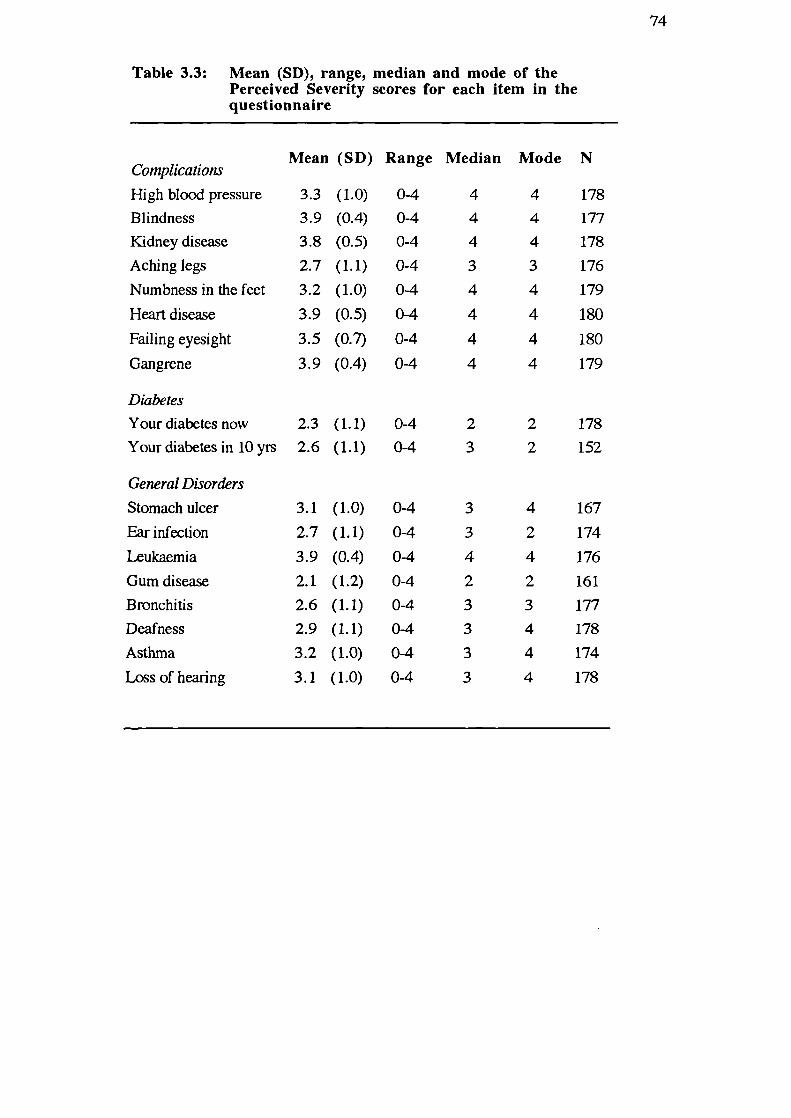
0-4
3
4
167
0-4
3
2
174
0-4
4
4
176
0-4
2
2
161
0-4
3
3
177
0-4
3
4
178
0-4
3
4
174
0-4
3
4
178
74
Tab'e 3.3: Mean (SD), range, median and mode of thePerceived Severity scores for each item in thequestionnaire
Complications
High blood pressureBlindnessKidney diseaseAching legs
Numbness in the feet
Heart disease
Failing eyesight
Gangrene
Mean (SD) Range Median Mode N
3.3 (1.0)
0-4
4
4
1783.9 (0.4)
0-4
4
4
1773.8 (0.5)
0-4
4
4
1782.7 (1.1)
0-4
3
3
1763.2 (1.0)
0-4
4
4
179
3.9 (0.5)
0-4
4
4
180
3.5 (0.7)
0-4
4
4
180
3.9 (0.4)
0-4
4
4
179
Diabetes
Your diabetes now 2.3 (1.1)
0-4
2
2
178Your diabetes in 10 yrs 2.6 (1.1)
0-4
3
2
152
General Disorders
Stomach ulcer
Ear infection
Leukaemia
Gum diseaseBronchitisDeafness
Asthma
Loss of hearing
3.1 (1.0)
2.7 (1.1)
3.9 (0.4)2.1 (1.2)
2.6 (1.1)2.9 (1.1)3.2 (1.0)
3.1 (1.0)

0-4
2
2
136
0-4
2
2
178
0-4
2
0
178
0-4
2
3
123
0-4
2
2
145
0-4
2
2
158
0-4
3
3
154
0-4
2
0
177
0-4
2
2
169
0-4
1
0
171
0-4
1
2
171
0-4
1
0
181
0-4
1
0
1750-4
1
0
173
0-4
1
0
1660-4
1
0
177
0-4
2
0
165
0-4
2
2
170
0-4
2
2
176
0-4
2
2
176
0-4
2
2
171
0-4
2
2
171
0-4
2
2
174
0-4
3
3
173
0-4
2
2
175
0-4
2
2
171
0-4
2
2
174
0-4
2
2
175
0-4
1
0
1750-4
1
2
174
0-4
2
2
174
0-4
2
2
171
0-4
1
0
1750-4
2
2
173
75
Table 3.4: Mean (SD), range, median and mode PerceivedVulnerability scores for each item in thequestionnaire
Mean (SD) Range Median Mode N
Personal VulnerabilityComplicationsHighbloodpressure 1.9 (1.2)Blindness 1.9 (1.3)Kidney disease 1.5 (1.3)Aching legs 2.2 (1.2)Numbness in the feet 2.1 (1.2)Heart disease 1.6 (1.3)Failing eyesight 2.3 (1.2)Gangrene 1.6 (0.1)
Single item:
Complications arisingfrom diabetes 2.2 (1.2)
General Disorders
Stomach ulcer 1.3 (1.2)Ear infection 1.4 (1.2)Leukaemia 1.0 (1.2)Gum disease 1.1 (1.1)Bronchitis 1.5 (1.3)Deafness 1.3 (1.2)Asthma 1.0 (1.1)Loss of hearing 1.4 (1.2)
"Average Person" VulnerabilityComplications
High blood pressure 2.2 (1.2)Blindness 2.0 (1.2)Kidney disease 1.7 (1.2)Aching legs 2.4 (1.1)Numbnessinthefeet 2.3 (1.1)Heart disease 1.8 (1.2)Failingeyesight 2.4 (1.1)Gangrene 1.7 (1.3)
SinRle item:
Complications arisingfrom diabetes 2.3 (1.2)
General Disorders
Stomach ulcer 1.5 (1.2)Earinfection 1.5 (1.1)Leukaemia 1.1 (1.2)Gum disease 1.3 (1.1)Bronchitis 1.5 (1.2)Deafness 1.4 (1.1)Asthma 1.1 (1.2)Loss of hearing 1.5 (1.2)

76
Distribution of Baseline Health Belief Scores
Perceived Benefits of, and Barriers to Treat inent
The range of scores possible for each of the scales is 0 to 30, higher scores
indicating greater Perceived Benefits or Barriers. Scale mean, standard
deviation, and minimum and maximum scores obtained are shown in Table
3.5. The distribution of the Perceived Benefits of Treatment scores was
highly negatively skewed, indicating that most respondents scored towards
the top end of the range on this scale, perceiving more benefits of treatment.
Scores for the Perceived Barriers scale and measure of treatment
'Cost-effectiveness' were more normally distributed, however. A Wilcoxon
test indicated that respondents gave higher ratings to Perceived Benefits of
Treatment than to Perceived Barriers to Treatment (z = -10.9; p.<0.001).
Perceived Severity of, and Vulnerability to Complications
The range of scores possible for each of the eight-item Perceived Severity
and Vulnerability scores is 0 to 32. Scores possible for the two-item
Perceived Severity of Diabetes measure range from 0 to 8. Mean, standard
deviation, minimum and maximum scores for the scales are shown in Table
3.5. Respondents felt that Complications were significantly more severe than
General Disorders (z = -9.5; p<0.001) and perceived themselves to be
significantly more vulnerable to Complications than General Disorders (z =
-6.5; p<O.001). Compared with the 'average person', however, patients saw
themselves as less vulnerable to both Complications (z = -4.0; p<zO.001) and
General Disorders (z = -2.9; p<0.01).

—
là
E
IL
.rii
'-.
V
.-
0&
V
.--
•c,
E-.- 0V+.a
.- 0Vl_Iu
rdJ
z
(,)
000 n00'ON ' N NN00
I I I I I I I I I I I
— 00' 'm ' o —
dd 00 00 00
NO N00 O\N001 °:° °?° ICO CC CO 00
cIC709CCC 000 a o
COmm
O\C 0000 000 0 00 0
moo
civ)Nm
000NN— —
Co00
oo
tdV
U
-' 'ooa c
C N-\ó - —4-'-- -
Q\m
C c *n —00 'O\O N— — — ,- — . —4 —4
E
'••• °c'
• 3 • V V. - I- V 0.. 0..'- - I 0..
• •
.
I

78
When inspecting the Perceived Vulnerability data, it was noted that
frequency counts for 'I already have this problem' were much lower for the
single complications item ('Complications arising from diabetes') than for
most of the individual complications. For example, 10 respondents indicated
that they already had 'complications arising from diabetes' whereas 47 said
they had high blood pressure, 59 had aching legs, 37 had numbness in the
feet, and 25 had heart disease. This suggests that respondents in this sample
were not aware of all the complications, or perceived 'complications arising
from diabetes' as something other than the disorders listed in the
questionnaire. It was predicted, therefore that the single complications item
would be more strongly related to metabolic outcome variables than a
composite score from the individual complications data.
Reliability
The internal reliability of each of the health belief scales was calculated and
produced a satisfactory alpha coefficient in each case. The reliability
coefficients and item-total correlations for each scale are presented in Table
3.5. Once again, because listwise deletion methods would have reduced the
number of cases to be analysed, calculation of the reliability of the Perceived
Vulnerability to Complications scale was carried out including available data
from missing cases. This increased the number of cases analysed to a
satisfactoiy level for internal reliability analysis (Kline, 1986). An alpha
coefficient is not reported for Perceived Severity of Diabetes as it comprises
only two items. All item-total correlations exceeded the minimum required
coefficient of 0.20 (Kline, 1986).

79
Validity
Content Validity
In order to establish content validity, an initial pool of items was
constructed for each measure which were relevant to, and typical of the
experience of having diabetes treated with oral hypoglycaemic agents. The
final items included in the questionnaire were chosen after detailed
consideration and discussions with a health psychologist specialising in
diabetes research (Dr. Clare Bradley) and a physician specialising in diabetes
(Dr. Adrian Jennings) about breadth of inclusion and the suitability and
representativeness of the items for the population studied.
Construct Validity
In order to assess construct validity the scales were correlated with other
variables collected in the baseline study. Construct validity was established if
associations between appropriate variables and scales were significant and
consistent. A correlation matrix is presented in Table 3.6. The following
significant results were obtained:
Glycosylated haemoglobin (HbA1)
The higher the patients' HbA 1 levels, the more vulnerable they perceived
themselves (r = 0.16; p<0.05) and the 'average person' (r =0.15; p<O.05) to
Complications.

0'4-V
U)
4-
rI
U)
4-V
V
0V
0
E L
. 0'-44-
0
1.400
0
-0.;
0
U)U)V0.
V VV 4— -
•, V 0V •V
.o •: 0U) 44-
.0
*** * * *
* *** * ** *
* *** * ** *
N .— fl • N N N .-4 (fl
cl) CNC' cnN NCOC C
I I I I I I I I I I I
* *** ** *
** * ** *
** * ** *
ra."o tr)00cn cn N'O c?NNNcn N
d S d
* * * ** * ** **
* *** * ** *
' cn C \O C Cfl C\ N- C -4 N N N - (n 4 —.
5 ddC d CC C
* * *** * ** *'-4
* * 40 *40* * ** *
* * * *** * ** *NCS 0\00 fl NN N
Cc.'1 cncnN c' cnN Ndd d
* * * *
* * * *40* * * *
*40*
s31
* ** *— N 00 0" 00 0' N cn N O —
N — N C .— N N N cn N -1 cndd d
4 I
*
** 40
*40* *000 N LflCfl —
—- N .-i _ C C C C
d
* *
* ** * ** *
.-i N
— C — N --4 Ndd d
I I
-(I)
E'-S
-E —°4-0.)
110.)11)0)
I .-4-
' 0)
- 0) 0 0'"> 011,
c0)
. h0
cSIfl -
_ 000'oo O'O Nr-r-s.-4 - - - - - - _I - _4 4 -
I
II
0
0
.) -...
c:
CV h-
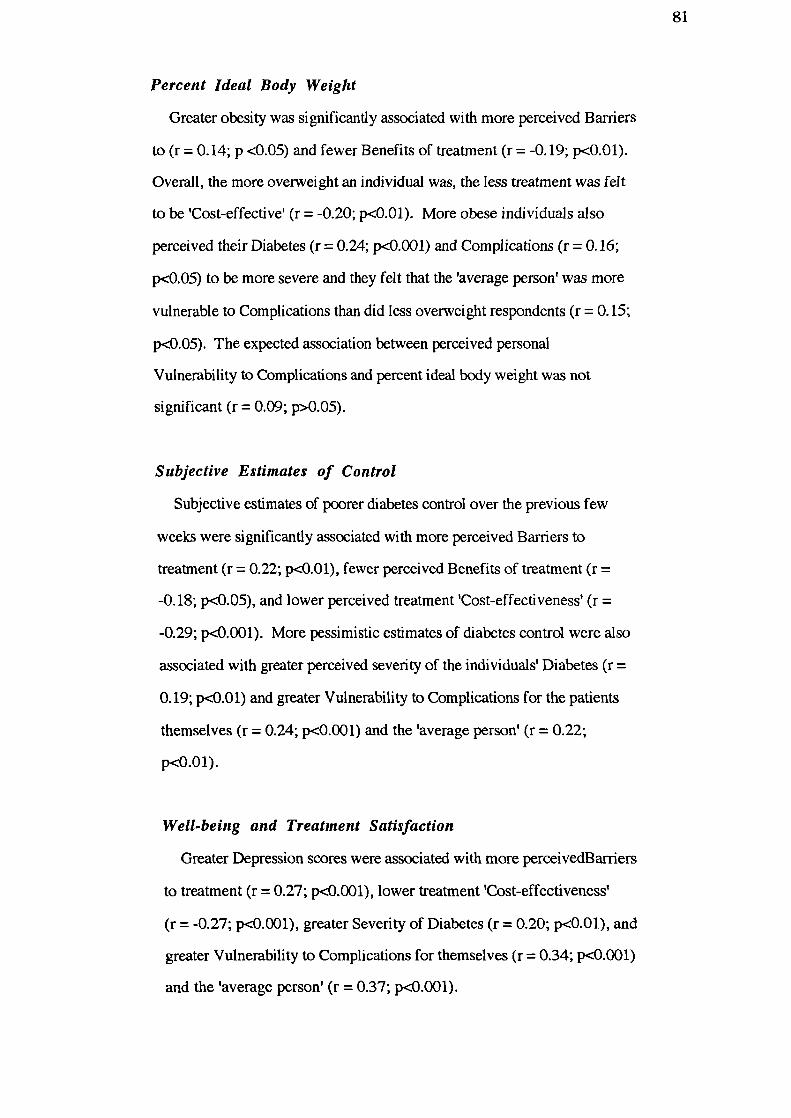
81
Percent Ideal Body Weight
Greater obesity was significantly associated with more perceived Barriers
to (r = 0.14; p <0.05) and fewer Benefits of treatment (r = -0.19; p.cz0.01).
Overall, the more overweight an individual was, the less treatment was felt
to be 'Cost-effectiv& (r = -0.20; p<0.01). More obese individuals also
perceived their Diabetes (r = 0.24; p<zO.001) and Complications (r = 0.16;
p.<0.05) to be more severe and they felt that the 'average person' was more
vulnerable to Complications than did less overweight respondents (r = 0.15;
p<O.OS) . The expected association between perceived personal
Vulnerability to Complications and percent ideal body weight was not
significant (r = 0.09; p>0.O5).
Subjective Estimates of Control
Subjective estimates of poorer diabetes control over the previous few
weeks were significantly associated with more perceived Barriers to
treatment (r = 0.22; p<zO.01), fewer perceived Benefits of treatment (r
-0.18; p<O.O5), and lower perceived treatment 'Cost-effectiveness' (r =
-0.29; p<O.001). More pessimistic estimates of diabetes control were also
associated with greater perceived seventy of the individuals' Diabetes (r =
0.19; p.cz0.01) and greater Vulnerability to Complications for the patients
themselves (r = 0.24; p<0.001) and the 'average person' (r = 0.22;
p.(O.O 1).
Well-being and Treatment Satisfaction
Greater Depression scores were associated with more perceivedBarriers
to treatment (r = 0.27; p<0.001), lower treatment 'Cost-effectiveness
(r = -0.27; p<0.001), greater Severity of Diabetes (r = 0.20; p<O.O1), and
greater Vulnerability to Complications for themselves (r = 0.34; p<O.001)
and the 'average person' (r = 0.37; p<0.001).

82
Higher Anxiety scores were associated with more perceived Barriers to
treatment (r = 0.34; p<0.001), fewer perceived Benefits of treatment
(r = -0.14; p<O.O5), lower perceived treatment 'Cost-effectiveness'
(r = -0.33; p<O.001), greater perceived Severity of Diabetes (r = 0.14;
p<0.05) and greater perceived Vulnerability to Complications for the
patients themselves (r = 0.26; p<0.001) and the 'average person' (r = 0.33;
p<O.001).
Greater Positive Well-being was related to fewer perceived Barriers (r =
-0.34; p<0.001), more Benefits (r = 0.19; p<0.01), greater treatment
'Cost-effectiveness' (r = 0.36; p<0.001), and less Vulnerability to
Complications for themselves (r = -0.29; p<0.001) and the 'average person'
(r = -0.32; p<O.00l).
Greater Treatment Satisfaction was associated with fewer perceived
Barriers (r = -0.27; p<O.001), more perceived Benefits (r = 0.31;
p<0.001), greater perceived 'Cost-effectiveness' of treatment (r = 0.35;
p.<0.001), lower perceived Severity of Diabetes (r = -0.22; p<0.01), and
less perceived Vulnerability for the patients themselves (r = -0.29; p<0.001)
and the 'average person' (r = -0.31; p<zO.001).
Discussion
The Health Belief scales reported in this chapter have been shown to have
satisfactory alpha coefficients of reliability. Cronbach's alpha ranged from
0.67 to 0.89 and item-total correlation coefficients were within the required
range for each scale.
Patterns of correlations with other variables also provide preliminary

83
evidence for the construct validity of the scales. Respondents in the present
study tended to perceive more Barriers to treatment and fewer Benefits of
treatment if they were more overweight and/or if they estimated control of
their diabetes to be poorer. Perceptions of more Barriers to treatment and
fewer Benefits of treatment were also assocated with greater Depression and
Anxiety scores and lower Positive well-being and Treatment Satisfaction.
Greater Perceived Vulnerability to Complications was similarly associated
with being overweight, subjective estimates of poorer diabetes control,
higher Depression and Anxiety scores, and lower Positive well-being and
Treatment Satisfaction. In addition, those who reported greater
Vulnerability to Complications for themselves and/or for the "average
person TM were also more likely to have higher I-IbA 1 levels. Perceived
Severity of Complications was associated with being overweight but not
with higher HbA 1 levels.
Because of the retrospective design of the present study, it is not possible
to conclude whether patients' beliefs are the cause, or the consequence of
the metabolic and psychological outcomes measured here. However, these
associations reflect realistic subjective estimates of diabetes control.
Awareness of the consequences of poor control may have been raised with
these patients when they were informed about their need to take oral
hypoglycaemic agents in the first place. Furthermore, many of the patients
attending the clinic are there because of doctors' concerns about
complications they have or because of problems in attaining adequate
diabetes control. The direction of association between diabetes health
beliefs and these outcomes is likely to be different if patients have unrealistic
perceptions about their diabetes control and its consequences. This
highlights the need, therefore, to assess beliefs about diabetes in the context
of the treatment involved and policies about information given to patients. It

84
is interesting to note here that associations between the health belief
variables and estimated diabetes control were much stronger than
correlations with either percentage of ideal body weight or HbA 1. The
difference in strength of associations is likely to be explained by the kind of
information given to these patients about their diabetes control. If beliefs
are to have maximum constructive impact on health care behaviour,
therefore, it is important that patients should have accurate feedback about
their control and information about scope for improvement (as well as
appropriate advice about methods for improving diabetes control).
Although associations between the perceived Benefits and Barriers scales
and clinical outcomes were as expected, the direction of associations
between the perceived severity and vulnerabliuity scales and these outcome
variables was contrary to that which the original Health Belief model might
have predicted. However, other researchers who have correlated diabetes
control with measures of perceived susceptibility to complications have
reported a similar direction of relationship between these variables (Harris,
Linn & Skyler, 1987; Brownlee-Duffeck, Peterson, Simonds, Goldstein,
Kilo & Hoette, 1987). As already mentioned in Chapter 1, a likely
explanation for these findings is that relationships between health beliefs
and outcomes are dynamic. Not only may health beliefs affect outcomes but
these outcomes, in turn, may affect health beliefs. It is likely, therefore,
that if individuals believe their diabetes is so poorly controlled it makes them
feel vulnerable to complications, they are more likely to take steps to
improve their control or reduce their weight. In order to achieve this goal
the patient may comply with the recommendations of the diabetes health care
team. This process probably explains why some researchers have reported
behavioural measures of compliance to be associated with greater perceived
vulnerability (Bloom Cerkoney & Hart, 1980; Harris, Linn & Skyler, 1987)

85
whilst better metabolic control has been associated with lower perceived
vulnerability (Hams, Linn & Skyler, 1987; Brownlee-Duffeck, Peterson,
Simonds, Goldstein, Kilo & Hoette, 1987).
Patients beliefs about severity and vulnerability are likely to be influenced
by their knowledge of diabetes and its complications which is determined
largely by the type of education received. At the start of the study only a
small proportion of respondents had attended an education session,
although all patients were offered education subsequently. It can be seen
from Table 3 that the single perceived vulnerability item "Complications
arising from diabetes" is more strongly associated with HbA1 levels and
subjective estimates of diabetes control than the composite Perceived
Vulnerability to Complications scale. It is evident, however, that scores for
the single item are artificially reduced by lack of knowledge about which
health problems are complications of diabetes; frequency counts of "I
already have this problem" for "Complications arising from diabetes" fell far
short of frequencies relating to the individual complications. The single
item therefore measures perceived vulnerability to what are understood to be
complications of diabetes. This distinction should be borne in mind
particularly when inspecting relationships between health beliefs and
behaviour. If, for example, a patient is unaware that heart disease is a
complication of diabetes, then he or she may make less effort to reduce fat
intake, consume fewer calories or take more exercise than if the risks were
known. Perceived vulnerability to "Complications arising from diabetes"
may be high, therefore, but perceived vulnerability to heart disease may be
relatively low. This distinction between the scores for the scale and scores
for the single item allows researchers to identify discrepancies in beliefs
about vulnerability to complications which may benefit from intervention. It
is interesting to note here that many of the items in scales designed by other

86
research groups to measure perceived vulnerability to complications of
diabetes (Hams, Linn & Skyler, 1987; Brownlee-Duffeck, Peterson,
Simonds, Goldstein, Kilo & Hoette, 1987) effectively inform the
respondent that a particular complication is related to diabetes. It is possible
therefore that if the respondent was previously unaware of this relationship,
ratings of susceptibility to the particular disorder may be affected by
perceptions about current metabolic control rather than metabolic control
being affected by feelings about susceptibility.
The improvements to the format of the Perceived Severity and
Vulnerability questionnaires since the design of the scales for
insulin-dependent patients (Bradley, Brewin, Gamsu & Moses, 1984) allow
the researcher to gain more information about the perceptions of
respondents. Patients now report which complications they already have
and these reports can be compared with information from their medical
records. Discrepancies between actual and perceived occurrence of
complications are likely to be reflected in the patients' health beliefs.
Perceived Vulnerability to Complications may also be examined in relation
to both the patient personally, and his or her estimate for the "average
person". It is interesting to note that patients in this study perceived the
"average person" to be significantly more vulnerable than themselves to
both Complications and General Disorders. Weinstein (1982, 1984, 1987)
found a similar optimistic bias when assessing the perceived susceptibility
of individuals to a variety of environmental and health hazards. Inspection
of the correlation matrix in Table 3.6 also indicates that whilst perceived
vulnerability scores for both the patients themselves and the "average
person" are similarly correlated with most of the metabolic and
psychological variables in this study, percentage of ideal body weight is
associated with perceived vulnerability of the "average person" to

87
Complications but not with personal perceived vulnerability. The reason
for measuring perceived vulnerability of the "average person" to
Complications was to remove the mediating effects of what patients see as
personal risk reducing strategies and "noise" from factors such as a family
histoiy of disorders which patients do not realise are complications of
diabetes. The optimistic bias mentioned earlier and the greater sensitivity of
the "average person" ratings in the correlation with percentage of ideal body
weight provide good grounds for the inclusion of the measure. Indeed, the
next chapter describes an attempt to integrate this measure into a model
which specifies the relationship between the HBM variables.
In conclusion, the scales reported here are internally reliable and
relationships with other psychological and metabolic variables demonstrate
their sensitivity and construct validity. The scales are likely to be
particularly useful in research which aims to assess the efficacy of
interventions such as education in modifying Health Belief model
dimensions to achieve desired health behaviours. They may also be useful
as an instrument of audit if indicators about the suitability of possible
interventions are sought. Chapters 5 and 6 describe the use of the
developed scales in such studies. It should be noted that the scales were
designed and developed for people with tablet-treated Type II diabetes, not
for diabetic individuals treated with diet alone. Modification of certain items
and psychometric development would be required if the scales were to be
used with diet-alone-treated patients.

88
CHAPTER FOUR
EXPLORATION OF RELATIONSHIPS BETWEEN
HBM COMPONENTS USING BASELINE DATA
After establishing the reliability and validity of the diabetes-specific I-IBM
scales, the next aim was to investigate the relationships between components
of the HBM using the same baseline data. As discussed in Chapter 1., there
has been no published account of such an investigation despite discussion of
the possible relationships in earlier publications (e.g. Becker, Drachman &
Kirscht, 1972; Leventhal, Safer & Panagis, 1983; Wallston & Waliston,
1984). Indeed, with the exception of one study (Haefner & Kirscht, 1970) it
appears that the research using the 1-IBM to date has assumed implicitly that
the HEM components combine additively and that they are linearly related to
health outcomes. However, value-expectancy theories imply that the
theoretical components of perceived severity and vulnerability combine in a
multiplicative fashion (Feather, 1982).
It may be that researchers using the HBM have tested for a multiplicative
relationship between perceived severity and vulnerability and found no
evidence for a multiplicative combinatorial rule. However, no-one has
published the results of such a study. Another possibility is that they have
noted other researchers' lack of success in demonstrating the advantage of
multiplicative terms when testing other theories involving similar or alternative
components to the HBM. There has been some notable research involving
hypothesized multiplicative relationships between variables by Rogers and
colleagues (Rogers, 1985; Rogers, 1983; Maddux & Rogers, 1983; Rogers
& Mewborn, 1976) in the context of fear appeals and attitude change using
Rogers' own theoretical approach termed protection motivation theory.
Protection motivation theory incorporates the main components of the I-IBM

89
when applied to fear communications and in the latest formulation states that
the three most important variables in a fear appeal are (a) the noxiousness of a
depicted event, (b) the probability that the event will occur provided no
adaptive activity is performed, and (c) the effectiveness of a coping response
that might avert the noxious event. The fear appeal is said to initiate two
appraisal processes: threat appraisal and coping appraisal which produce both
adaptive and maladaptive responses. The probability of maladaptive
responses are increased by intrinsic and extrinsic rewards and decreased by
beliefs about severity of, and vulnerability to the noxious event. On the other
hand, the probability of adaptive responses are increased by perceptions about
self-efficacy and response efficacy (perceived benefits), and decreased by the
perceived costs (barriers). The original formulation of protection motivation
theory specifically postulated that attitude change is a multiplicative function
of the mediating beliefs and attitudes produced by the fear appeal
(Rogers & Mewborn, 1976). When put to the test, however, the research
failed to produce evidence for a two-way interaction between severity and
vulnerability (and the predicted three-way interaction between perceived
severity, vulnerability and efficacy) and Rogers has therefore concluded that
these variables are independent Although Rogers and colleagues may be
justified in reaching this conclusion, the design of the studies used to test
interactions between the variables may have affected the results. For
example, in three separate experiments by Rogers and Mewborn (1976)
subjects were allocated to one of two groups who were shown a film about a
noxious outcome. (Each experiment was performed on a different health
topic: smoking, road safety and venereal diseases.) One group was randomly
allocated to see a film portraying the outcome (e.g. lung cancer) as being
highly noxious, and the other group saw a film portraying the same outcome
as being low in noxiousness. Within these conditions each subject was
randomly assigned to either a high or low probability of occurrence condition

90
and either a high or low efficacy of response condition. The probability of
occurrence and efficacy of response conditions were determined by written
communications. After seeing the film and reading the communications,
in order to check the effect of the experimental manipulations, each subject
rated the noxiousness and probability of exposure to the outcome and the
efficacy of the coping responses. They were also asked to rate their intentions
to adopt the coping responses recommended. Although the experimental
manipulations produced equivalent ratings for perceived vulnerability and
response efficacy, it is significant that the films did not have a significant
effect on the measure of appraised severity (noxiousness). Rogers and
Mewborn argued that the films did not affect perceived seventy in the
expected way because emotional arousal is likely to drop rapidly after
exposure to a fear appeal. However, it could also be argued that the subjects
in the low noxiousness condition perceived the portrayed outcome to be
highly noxious, probably as a result of prior knowledge or experience. It is
also conceivable that those in the high noxiousness condition may have
perceived the outcome to be low in noxiousness, especially if they were
allocated to the low probability of occurrence condition. In summary, the
experimenters did not appreciate that the effects of the experimental
manipulations were probably confounded with the enduring perceptions of the
subjects. Given that Rogers and Mewborn used the experimental
classification variables to test predictions about behavioural outcome and not
the manipulation check ratings of the subjects themselves, it was not
surprising that an interaction between perceived seventy and vulnerability was
not found. Sutton (1982) also points out that protection motivation theory
suffers from a number of other logical-theoretical problems. In particular, he
draws attention to the low probability of occurrence/high efficacy of response
condition where subjects are given inconsistent information about the effects
of a particular health threat. They may be told, for example, that on the one

91
hand, if they continue to smoke, the likelihood of getting Jung cancer is low
whilst on the other, that giving up smoking would greatly reduce their
chances of getting lung cancer.
It is worthy of note here that the design of studies by Rogers and
colleagues was probably influenced by the perceived need to use analyses of
variance (ANOVA) to test predictions about interactions between the
theoretical constructs of protection motivation theory. This is evident in the
study reported above where data relating to the experimental manipulations
themselves were used in the ANOVA rather than the subjec& own
perceptions of seventy, vulnerability and efficacy which were not so neatly
categorized. As argued earlier, however, the experimental manipulations may
be contaminated if subjects bring their own experience and knowledge to the
laboratory. Ironically, this flaw in the study design is likely to have
produced misleading categories of data for the ANOVA which influenced the
design of the study in the first place. It seems, therefore, that while the data
from this type of experimental manipulation research is ideally suited to
ANOVA, if the perceptions of the subjects themselves are to be analysed, this
requires statistical techniques which can handLe continuous rather than
categorical data. An alternative strategy is to ask respondents to rate their
beliefs and attitudes according to simple categories; however, several
categories might be needed in order to produce a reasonably sensitive measure
of the construct The use of ANOVA to test for interactions becomes more
unwieldly as the number of variables and categories within them increases. It
is not surprising, therefore, that most of the research concerning health care
behaviour has been of a correlational nature.
Unfortunately, as Evans (1991) has pointed out:

92
"Those undertaking studies using a correlational perspective seem
to have come late to the problem of dealing with interactions."
Evans showed that there is considerable confusion about the correct method
of testing theoretical models which contain multiplicative terms. In particular,
he pointed out that many researchers have inappropriately used simple
correlational analysis for assessing the relationship between a simple variable
and a multiplicative composite. The misuse of correlational analyses occurred
because researchers failed to notice, on the one hand, that correlation
coefficients are dependent on the scales used to measure the components of
the composite variable, and on the other, that the variance explained by the
individual components needs to be partialled out when accounting for the
unique variance explained by the composite variable. In the first instance,
changes in the scale such as the interval level or zero point can have marked
effects on the size of the correlation coefficient. Schmidt (1973)
demonstrated this by altering the means and standard deviations of
components of a composite variable to produce markedly different correlation
coefficients. This occurs because the standard deviation of the composite is a
function of the means and standard deviations of its components. However,
if the correlations between the components of a multiplicative composite and
the dependent variable are partialled out, not only does this provide an index
of the unique contribution of the interaction effect but it also takes care of the
scaling issue just raised. Despite warnings by Schmidt (1973; Schmidt &
Wilson, 1975) many researchers continue to report the use of inappropriate
methods to analyze multiplicative models. This is particularly notable in the
extensive research literature concerning Fishbein and Ajzen's (1975) theory of
reasoned action in which the attitude and norm measures are multiplicative
composites. Evans commented that the reason for the recent decline of
interest in value-expectancy theory may have been the failure to show an
advantage to the multiplicative models but this failure could be due to the use

93
of inappropriate correlational analyses. The apparent reluctance to test for
possible multiplicative relationships within the HBM may, conversely, be due
to an awareness of the problems involved, but uncertainty as to how they
could be solved. Evans (1991) recommended the use of hierarchical multiple
regression as the most appropriate method for the analysis of variables
constructed by multiplying two or more variables together. When using this
method, the multiplicative composite is entered into an equation that already
contains the components of the composite. The overall squared multiple
correlation (R2) for the two stages represents the amount of variance
explained by the model being tested, while the increase in R2 from the first
stage (when the separate components are entered) to the second stage (when
the composites are entered) indicates the value of the multiplicative model over
and above the additive model. This is a conservative technique for testing
multiplicative models because a certain amount of the overall variance which
might be more efficiently explained by a multiplicative composite will be
removed at the first stage of the hierarchical analysis by its individual
components. However, until better methods are developed, hierarchical
multiple regression is the only technique available which can take care of the
scaling issue in correlational analyses and provide an index of the unique
variance accounted for by the multiplicative composite. All possible
interactions between the components of the HBM are examined using this
technique in the present study.
The use of regression analyses relies on the assumption that the
independent variables are related in a linear fashion to the dependent variable.
However, it is possible that some or all of the I-IBM variables may be related
to outcomes in a non-linear fashion. Janz and Becker (1984) reported, for
example, that perceived seventy was not correlated with indices of preventive
health behaviours in a large number of studies. This may be because

94
perceived severity must reach a certain level to be of concern, but above that
level the decision to act is a function of other variables in the model such as
perceived vulnerability. Weinstein (1988) suggested a more complex version
of this decision rule in order to explain the lack of evidence for multiplicative
models of behaviour generally. He postulated that people may not respond to
a threat if either vulnerability or severity is below a minimum level. Once
both variables exceed the cutoffs, however, seventy and vulnerability become
independent and function according to an additive rather than a multiplicative
rule. In order to test such decision rules, it is clear that variables need to be
combined in a non-linear fashion. The notion of cutoffs provides the rationale
for categorizing variables and crosstabulating them with others using
appropriate techniques such as ANOVA or its non-parametric equivalent One
can then predict that if the multiplicative rule is valid, more favourable health
outcomes are associated with a particular combination (or combinations) of
belief magnitude. The study described in this chapter employs this method of
data combination and analysis in order to test the non-linearity hypothesis.
The Walistons' hypothesized locus of control typology (see Chapter 1) has
been tested in a similar manner (Bradley, Lewis, Jennings & Ward, 1990).
Details of the subjects and methods of this study have already been
provided in Chapter 2. The description of this study therefore begins with the
variables selected followed by the analyses undertaken and their results.
Variables selected for analyses
Perceived Severity and Vulnerability
Given that the newly-developed diabetes-specific questionnaires provided
composite and individual item measures of perceived severity and

95
vulnerability, an initial task was to select a representative and sensitive
measure for each of these constructs for the present study. It has been
reported in Chapter 3 that the frequency analyses relating to 'I already have
this problem' (Perceived Vulnerability questionnaire) indicated that a large
number of the respondents were not aware of all the complications, or
perceived the complications of diabetes to be something other than the
disorders listed individually. Furthermore, the correlations involving the
composite measures of perceived vulnerability and severity indicated that little
more than 2 per cent of the variance in percent ideal body weight or HbA1was
explained whereas the single-item measures of perceived vulnerability and
seventy accounted for nearly 6 percent of the variance in these outcomes. It
seems that the single-item measures of perceived vulnerability and severity are
more relevant to health outcomes in diabetes because the composite measures
depended upon respondents' knowledge about the complications of this
disorder. Because of the greater sensitivity of the single item measures of
perceived severity and vulnerability, therefore, these were selected for
inclusion in the analyses for this study. A further advantage of selecting the
single-item measures was that they were both normally distributed; the
composite measure of perceived Severity was positively skewed and would
have required transformation. The single-item measure of perceived
vulnerability was obtained from respondents' response to the item:
"Complications arising from diabetes". Perceived severity was assessed from
the summed responses to two items regarding the seriousness of the
respondents' own diabetes: "Your diabetes now" and "Your diabetes in 10
years' time". (See Chapter 2 for details of the rating scales.)
With a view to incorporating perceptions of vulnerability for the 'average
person' in the HBM, the single-item measure was selected for consistency
with the personal vulnerability measure. Ratings for personal vulnerability
were also subtracted from ratings for the 'average' person for each subject to

96
produce a measure of Optimistic Bias. Results of the analyses described in
Chapter 3 indicated that there was a significant tendency for the respondents
to rate themselves as less vulnerable to complications than the 'average'
person. A similar optimistic bias has been found in studies concerning
susceptibility to a variety of hazards (Weinstein, 1987). If this optimism is
unrealistic, it is likely to constitute a barner to preventive action and therefore
an attempt to measure this attitude may provide additional explanation of the
variance in health outcomes.
'Cost-effectiveness' of treatment
Because responses to the perceived Benefits scale were skewed (positive)
and regression analyses assume that the individual variables are normally
distributed, the Benefits and Bathers measures were combined by subtracting
the Barriers score from the Benefits score for each individual. This provided
a measure of perceived 'Cost-effectiveness' of treatment which satisfied the
assumptions of normality.
Personal Control/Self-efficacy
As discussed in Chapter 2, the Perceived Control of Diabetes sub-scale
labelled Personal Control, is not only a measure of personal control but is also
a measure of self-efficacy. This is because the respondent's attributions about
personal responsibility for positive outcomes are combined synergistically
with beliefs about the ability to make outcomes happen in the first place. As
described in Chapter 1, recent studies relating to diabetes have indicated the
value of measuring self-efficacy and locus of control in order to explain the
variance in health outcomes. Rosenstock and colleagues (1988) have also

97
suggested that the concept of self-efficacy should be incorporated into the
HBM. The Personal Control measure was therefore selected for this study
with a view to incorporating the combined self-efficacy and personal control
constructs into the HBM and to specify their relationship to the original
components of the model.
Because the distribution of the Personal Control measure was moderately
and negatively skewed, the data were reflected and a square root
transformation was applied (Tabachnick & Fidell, 1989). The transformed
variable was included in all analyses where the statistical technique iequired a
normal distribution.
Results
Intercorrelation of the HBM components
In order to check for multicollinearity between the original and
newly-introduced HBM components and their relationship to the baseline
outcome measures, all the variables were intercorrelated. Table 4.1 shows the
correlation matrix obtained. Multicollinearity is indicated by correlations of
.90 and above (Tabachnick & Fidel!, 1989).
It can be seen from the correlation matrix that the measures of personal
Vulnerability and 'average person' Vulnerability are multicollinear and they
would therefore render one another redundant in a regression equation.
Subsequent analyses therefore examined the separate utility of these measures
in explaining outcome variance in concert with the other HBM components.

—.-
o.-
0
. 1
.0
.
. .
cJ
.2
OLLL
— 0
U,
L0z
.-
o —C.?
q—4
C— C
***No
— C C
* ** ** *
Co 0d C
0\
00
N
q
***o—
* ** *
C '1C
* * *N
— q •- — q '-• —-4
- 0 C C C C
I I I I
zo — en '0
N fl '0 N '0 CO
— - — — — —
C/) _
CO
C
1h • . .
L
E -
q 0 —4
—4
***
—4
in m—4 o
d o C
* ** ** *NC
9 C C
*N CC — —
d d
CC9***— —4
—C C
***NCC C
** ** *—4
d** ** *o
c\1 Cl
N en00 00-
II UI)O
CI)
—
0
0
00
—
v
4-
o
*L)
-
o
'U
V
* -
*
99
These results (described later) determined the selection of the most efficient
measure of perceived Vulnerability to Complications.
The measure of optimistic bias did not correlate significantly with any of
the outcome measures and the direction of the correlations indicated that any
bias was associated with a realistic appraisal of diabetes control. Inspection
of a frequency analysis indicated that an overwhelming majority (89%) of the
respondents had rated their own Vulnerability to Complications to be the same
as that for the 'average person'. Of the respondents who deviated from this
trend, 5 per cent felt that they were more vulnerable, while 6 per cent felt they
were less vulnerable. Given the small percentage of respondents who had
rated themselves differently to the 'average person' and the realistic nature of
these responses, Optimistic Bias was not included in subsequent analyses as it
was unlikely to add significantly to the overall explanation of variance in
health outcomes. It was noted previously (see Chapter 3) that average
person' Vulnerability scores were significantly greater than scores for
personal Vulnerability. However, this difference was in relation to perceived
vulnerability to the individual complications.
Test of the multiplicative model: Hierarchical multiple
regression analyses.
Multiplicative combinations of several of the HBM components were tested
using hierarchical multiple regression analyses on the assumption that the
independent and dependent variables were related in a linear fashion. The
interactions predicted were as follows:

100
(a) SEVERITY x VULNERABILITY: Perceived Severity of Diabetes and
perceived Vulnerability to Complications will tend to increase in
relation to one another.
(b) TREATMENT 'COST-EFFECFIVENESS' x SEVERITY x 'JUUERABILffY:
Perceived Treatment 'Cost-effectiveness' will tend to increase in
relation to decreases in Perceived Severity and Vulnerability.
(c) PERSONAL W?'ITROLJSELF-EFHCACY x TREATMEI'IT 'COST-EFFECrIVENESS'
SEVERITY x VULNERABILITY: Decreases in perceived Severity and
Vulnerability and increases in perceived Treatment
'Cost-effectiveness" will occur in relation to increases in perceived
Personal Control/Self-efficacy.
The choice of interaction effects in the multiplicative regression models was
based on predictions made by the present author based on the observation of
relationships between the individual measures and outcome variables. It is
appreciated, however, that other interactive models could have been tested but
in the absence of prior predictions these were not attempted. The model was
tested by entering the interactions and their individual components in order to
predict baseline HbA 1, percent ideal body weight, and subjective estimates of
diabetes control. The individual variables were entered on the first step of the
analyses and the interactions were entered in a hierarchical fashion on the
second and subsequent steps. The interactions were calculated by converting
the component variables to z scores and obtaining their product. The reason
for initial standardization of the variables before multiplication was to avoid
high correlations between the multiplicative composite and its components.
The results of correlations between the component and composite variables
and their relationship to health outcomes are provided in Table 4.2.

0
0\
00
N
—
c •
.
U.
L
— L
.
q
00
***
('1 NC -
C C
00C C— C
*** *
0 '1)
**
* *00 - 00
Q —. 0 C C
-4 0 0 0 C d
* ** ** *
C'1 fl C
0 0 - C C
- 4 4 d
* *
* * *
* * *C
NC— d o d 0
* ** * ** * *00 N 00 a
ci q - - C C -'—
*1* ** * * * I
—.O 00 'fl '- C O\— — —4 —
-4 4 44 4 4 4
00 ci m N 00 O\ 'O N mZ N 'ri O 'fl m — 00 00 00
— — -4 — -4 -4 — — ,-I
.-.
e4e O
E—0 )0
rd c 2a — I)
- i c:5ç, c)$
0 - -I .•I 0 flI-I
& & Cl CI4
- C Cfl ' 'fl .O 0 d
. 00
>
iiV0
0•-
.o0
qC2V-
—4cm o
* I*
v-& 0

102
1. Prediction of outcomes from the original HBM components
and their interactions:
The first aim was to establish how much of the variance in the outcome
measures could be explained by the original components of the HBM,
individually and interactively. On the first step, perceived Severity of
Diabetes, perceived Vulnerability to Complications and perceived Treatment
'Cost-effectiveness' were entered. This stage of the analyses corresponded to
the usual formulation of the HBM in which all components are assumed to be
related in an additive fashion. On the second step, the first multiplicative
composite of Severity x Vulnerability was entered. Finally, on the third step
the multiplicative composite of Severity x Vulnerability x Treatment
'Cost-effectiveness' was entered.
Two sets of analyses were conducted initially in order to determine the
most efficient measure of perceived Vulnerability to Complications. In the
first set of analyses, scores relating to perceived personal vulnerability were
entered into the regression equation both independently and multiplicatively.
The results of these analyses are summarised in Table 4.3. The scores
relating to perceived vulnerability of the 'average person' replaced the
personal vulnerability scores in the second set of analyses. The
corresponding results are summarised in Table 4.4. These results indicated
that the measure of personal vulnerability was slightly more efficient than the
measure relating to the 'average person' in accounting for the variance in
outcomes. All subsequent regression analyses therefore included the measure
of personal vulnerability only.
Table 4.3 also indicates that, overall, the diabetes-specific I-IBM measures
were very poor predictors of baseline HbA 1 and percent ideal body weight,
whilst only moderate amounts of the variance in subjective estimates of

103
Table 4.3: Prediction of health outcomes from original JIBM componentsand their interactions. (includes measure of personal vulnerability )
Baseline HbAJ (n = 138)
B
B
sr2a
Treatment 'Cost-effectiveness' -0.029 -0.02 .00
Severity of Diabetes 0.260
0.04 .00
Vulnerability to Complications 1.914
0.18 .02
Severity x Vulnerability 0.688
0.07 .00
Severity x Vulnerability xTreatment 'Cost-effectiveness' -0.249
0.03
00
R2 = .05; AdjustedR2 = .01 (F = 130; Ij= 5,L32p>O.O.5)
Percent ideal body weight (n = 139)
Treatment 'Cost-effectiveness' -0312 -0.12 .01
Severity of Diabetes 2.245
0.19 .03 *
Vulnerability to Complications 0.884
0.04 .00
Severity x Vulnerability 2.002
0.10 .01
Severity x Vulnerability xTreatment 'Cost-effectiveness' - 1.903 -0.12 .01
R2 = .11 Adjusted R2 = .07 (F = 3.13 df= S,133;p<O.Ol)
Subjective estimates of diabetes control (n = 135)
Treatment 'Cost-effectiveness' -0.044 -0.25
Severity of Diabetes 0.005 0.01 .00
Vulnerability to Complications 0.403 0.29
Severity x Vulnerability -0.077 -0.06 .00
Severity x Vulnerability xTreatment 'Cost-effectiveness' 0.099 0.10 .01
R2 .16 AdjustedR2 = .12 (F= 4.82;df= 5,129 p<0.00l)
** p<O.Ol * p<O.O5a Sr2 = squared semipartial correlation using Type III sums of squares to indicate the uniquevariance accounted for by the variable

104
Table 4.4:
Prediction of health outcomes from original HEM components and theirinteractions. (Includes measure of 'average person' vulnerability )
Baseline HbAJ (n = 138)
B fi
sr2 a
Treatment 'Cost-effectiveness' -0.123 -0.09 .01
Severity of Diabetes 0.142 0.02 .00
Vulnerability to Complications 1.578 0.15 .01
Severity x Vulnerability 0.086 0.01 .00
Severity x Vulnerability xTreatment 'Cost-effectiveness' 0.124 -0.02 .00
R2 = .04; AdjusiedR2 = .00 (F = 1.01; df= 5,132;p>O.05)
Percent ideal body weight (n = 138)
Treatment 'Cost-effectiveness' -0383 -0.15 .02
Severity of Diabetes 2.399 0.21
03 *
Vulnerability to Complications 0.364 0.02 .00
Severity x Vulnerability 1.539 0.08 .00
Seventy x Vulnerability xTreatment cost-effectiveness' -1.043 -0.07 .00
R2 = .07 Adjusted R2 = .03 (F = 1.77 df= .5,l.32;p<0.O.5)
Subjective estimates of diabetes control (n = 137)
Treatment 'Cost-effectiveness' -0.05 1 -030
Seventy of Diabetes -0.007 0.01 .00
Vulnerability to Complications 0.344 0.24 Q4*
Severity x Vulnerability -0.135 -0.10 .00
Severity x Vulnerability xTreatment 'Cost-effectiveness' 0.122 0.12
01
R2 = .16; Adjusted R2 = .12 (F = 4.86; df= 5,131 p<O.00J)
*** p<O.001 * p<O.Ol * p<O.O5a sr2 = squared semipartial correlation using Type III sums of squares to indicate the uniquevariance accounted for by the variable

105
diabetes control were explained. A total of 5% (1% adjusted) of the variance
in baseline HbA 1, 11% (7% adjusted) of the variance in percent ideal body
weight, and 16% (12% adjusted) of the variance in subjective estimates of
control were accounted for by the I-IBM variables. None of the variables
contributed significantly to the overall prediction of HbA 1 values, although
perceived Vulnerability to Complications accounted for 2% of unique variance
in this outcome. Perceived Seventy of Diabetes contributed significantly
(p<O.O5) to the overall prediction of percent ideal body weight values, and
accounted for 3% of unique variance. Perceived Vulnerability to
Complications and perceived Treatment 'Cost-effectiveness' both contributed
significantly (p<.01) to the explanation of variance in subjective estimates of
diabetes control and accounted for 6% and 5% of unique variance
respectively. None of the interactions produced a significant increase in the
R2, indicating that the components of the HBM may operate independently.
The multiplicative hypothesis was not completely rejected at this stage,
however, as it was hypothesized that if perceived Personal
Control/Self-efficacy is added to the regression equation, it may not only
explain variance in its own right, 1out on t%e one hand, may also act as a
suppressor variable, and on the other, may have a multiplicative relationship
with the original HBM components. A suppressor variable "suppresses"
variance that is irrelevant to prediction of the dependent variable and may be
useful in increasing the multiple R2 by virtue of its correlations with other
independent variables (Tabachnick & Fidell, 1989).
2. Introduction of Perceived Control/Self-efficacy into the
regression equation.
In order to investigate the role of Personal Control/Self-efficacy as a
predictor of outcomes in concert with the original HBM variables, this

ft
Sr2 a
-0.03 .00
0.10 .01
0.14 .01
0.11 .01
0.11 .01
-0.03 .00
0.09 .00
106
Table 4.5:Personal Control/Self-efficacy added to the regression equation.
Baseline HbAI (n = 120)B
Treatment 'Cost-effectiveness' -0.045
Severity of Diabetes 0.053
Vulnerability to Complications 1.430
Personal Control/Self-efficacy 0.823
Seventy x Vulnerability 1.105
Severity x Vulnerability xTreatment 'Cost-effectiveness' -0.247
Severity x Vulnerability xTreatment 'Cost-effectiveness' xPersonal Control/Self-efficacy 0.597
= .08; AdjusiedR2 = .02 (F= 1.38; df= 7',112p>O.O5)
Percent ideal body weight (ii = 121)
Treatment 'Cost-effectiveness' -0.297 -0.11 .01
Severity of Diabetes 1.193
0.10 .01
Vulnerability to Complications 0.856
0.04 .00
Personal Control/Self-efficacy 2.659
0.18 .03 *
Severity x Vulnerability -0.641 -0.03 .00
Severity x Vulnerability xTreatment 'Cost-effectiveness' -2.461 -0.17 .01
Severity x Vulnerability xTreatment 'Cost-effectiveness' xPersonal Control/Sell-efficacy -2.135
0.18 .02
R2 = .13; AdjustedR2 = .08 (F = 2.44 df= 7,113 p<O.OS)
Subjective estimates of diabetes control (n = 117)
Treatment 'Cost-effectiveness' -0.035 -0.20
03*
Severity of Diabetes 0.041 0.05 .00
Vulnerability to Complications 0.447 0.33 Ø7**
Personal ControlISeif-efficacy 0.241 0.24
Severity x Vulnerability 0.086 0.06 .00
Severity x Vulnerability xTreatment 'Cost-effectiveness' 0.205 0.20 .02
Severity x Vulnerability xTreatment 'Cost-effectiveness' xPersonal Control/Self-efficacy 0.136 0.17 .02
R2 = .25; AdjustedR2 = .20 (F 5.18; df= 7,l09;p<O.00l)
** p<O.Ol * p<0.05a Sr2 = squared semipartial correlation using Type III sums of squares to indicate the uniquevariance accounted for by the variable

107
variable was introduced to the regression equation on the first step in order to
ascertain its independent value as a predictor. Personal Control/Self-efficacy
was then assessed in an interaction with the original I-IBM variables on the
last step. The results of these analyses are summarized in Table 4.5. It can
be seen that, once again, only a small amount of the variance in I-IbA 1 and
percent ideal body weight could be explained by all the variables. Adding
perceived Personal Control/Self-efficacy to the equation increased the R 2 only
marginally. Indeed, this variable had claimed some of the variance
previously explained by the health belief variables. A total of 8% (2%
adjusted) of the variance in HbA 1 and 13% (8% adjusted) of the variance in
percent ideal body weight was accounted for by the variables. None of the
variables contributed significantly to the prediction of HbA 1 values but
perceived Control/Self-efficacy significantly explained 3% of unique variance
in percent ideal body weight (p<O.05). The prediction of subjective estimates
of diabetes control improved when perceived Personal Control/Self-efficacy
was added to the equation with a total of 25% (20% adjusted) of the variance
in this outcome being explained. Once again, perceived Treatment
'Cost-effectiveness' and perceived Vulnerability to Complications accounted
for significant amounts of unique variance [3% (p<0.0S) and 7% (p.<0.01)
respectively] and perceived Personal Control/Self-efficacy added a further 5%
(p<O.Ol) to the prediction. For all three outcome variables, none of the
multiplicative composites added significantly to the variance explained when
entered on separate steps into the regression equation.
3. Inclusion of Health Value in the regression equation.
As mentioned in Chapter 3, one of two items constructed to measure
health value in the benefits of, and barriers to treatment questionnaire loaded
108
separately when factor analyzed. Health value is posited by the HBM to be a
necessary prerequisite if beliefs are to have an effect on health behaviour. This
item ('Good diabetes control has to take second place to some other more
important things in my life') was therefore added to the regression equation
on the first step in order to see if predictions in outcomes could be improved.
The HBM variables and perceived Personal Control/Self-efficacy were added
on the second step, and the multiplicative composites were entered on the
third and subsequent steps. The results of these analyses indicated that the
measure of health value did not contribute a significant amount of unique
variance in the prediction of HbA 1 (sr2 = .00; p>O.O5), percent ideal body
weight (sr2 = .02; p>0.O5), or subjective estimates of diabetes control
(sr2 = .00; p>O.O5). Furthermore, this measure did not appear to act as a
suppressor variable because the amount of variance explained overall for the
three outcomes did not change significantly [HbA 1: 8% (1% adjusted);
percent ideal body weight: 16% (10% adjusted); subjective estimates of
diabetes control: 26% (20% adjusted)].
Categorizing and combining the HBM variables. (The non-linear
hypothesis).
Given that none of the predicted interactions contributed significantly to
predictions, it is possible that the variables do not combine to predict
outcomes in a linear fashion. The non-linear hypothesis was therefore tested
by combining categories of each variable in a similar manner to the Walistons'
locus of control typology (Waliston & Waliston, 1982). Data relating to each
variable were split at the median to produce high and low categories and these
categories were combined to form groups of subjects. The group types were
explored in relation to baseline HbA 1, percent ideal body weight, and

35
89.3
60.0 (12.8) 61.0
21
57.5
50.9 (11.3) 48.0
29
82.0
57.7 (11.6) 57.0
57
60.4
51.2 (12.3) 50.0
36
82.4
134.5 (30.8)
122.5
21
71.1
122.9 (21.8)
122.0
29
76.6
126.4 (21.2)
122.0
57
63.4
119.3 (21.8)
116.0
32
84.7
3.5 (1.7)
3.0
21
55.5
2.2 (1.1)
2.0
28
86.8
3.6 (1.7)
3.5
57
57.6
2.4 (1.5)
2.0
109
Table 4.5: Prediction of outcomes from interactions between categories ofperceived Severity and Vulnerability
N Mean Rank Mean (SD) Median
Baseline HbAJ
High Severity/High Vulnerability
High Severity/Low Vulnerability
Low Severity/High Vulneiability
Low Severity/Low Vulnerability
Chi-square= 15.1; p<O.Ol
Percent ideal body weight
High Severity/High Vulnerability
High Severity/Low Vulnerability
Low Severity/High Vulnerability
Low Severity/Low Vulnerability
Chi-square 5.1; p>0.05
Subjective estimates of
diabetes control
High Severity/High Vulnerability
High Severity/Low Vulnerability
Low Severity/High Vulnerability
Low Severity/Low Vulnerability
Chi-square 17.5; p<0.001

110
subjective estimates of diabetes control using Kruskal-WaIIis H tests.
Initially, the perceived Severity and Vulnerability data were categorized and
combined in order to assess a two-way interaction between these variables.
(1) Two-way interaction: Perceived Severity of Diabetes and
Vulnerability to Complications
The 1-IBM predicts that patients with high perceived Severity and
Vulnerability scores would have the best diabetes control and those with low
perceived Severity and low Vulnerability scores would have the worst
diabetes control. The Kruskal-Wallis tests (Table 4.5) indicated that if
diabetes control was poor as determined by objective criteria (baseline HbA1
and percent ideal body weight) or perceived (subjective estimates of diabetes
control), perceived vulnerability was always greater but scores for perceived
Severity could be either high or low (see vertical patterns for each outcome
variable in Table 4.6). Conversely, if diabetes control was actually or
perceived to be good, perceived vulnerability was always lower but, once
again, perceived Severity could be either high or low. Although, contrary
to the predictions of the HBM, these relationships are in accordance with the
results of correlations reported earlier in this chapter. The general pattern of
results was statistically significant for baseline I-ThA 1 (chi-square = 15.1;
p<O.Ol ) and subjective estimates of control (chi-square = 17.5; p<O.001) but
did not reach significance for percent ideal body weight (chi-square =5.1).
Table 4.5 indicates that a combination of high perceived Severity and low
perceived Vulnerability was associated with the lowest levels of baseline
1-thA 1 and the most optimistic subjective estimates of diabetes control while a
combination of high perceived Severity and high perceived Vulnerability was
associated with the highest levels of baseline HbA 1. The most pessimistic

111
subjective estimates of diabetes control were related to a belief pattern of low
perceived Severity and high perceived Vulnerability. For percent ideal body
weight, a combination of low perceived Severity and low perceived
Vulnerability was associated with the best weight control while a combination
of high perceived Severity and high perceived Vulnerability was associated
with the greatest obesity.
Table 4.6: Patterns of perceived Severity and Vulnerability in relationto behavioural outcomes.
BaselineHbA1
Severity Vulner-ability
Best High I Low Icontrol I ILow (Lows
Poorest Low I High Icontrol I I
High High
Percent Subj ectiveideal body estimates ofweight diabetes control
Severity Vulner- Severity Vulner-
ability abtilty
Low Low High Low
High
Low Low Low
Low High High High
High High Low High
In conclusion, although the combinations of perceived Severity and
Vulnerability were statistically significant in relation to baseline HbA 1 and
subjective estimates of diabetes control, inspection of the belief patterns
across all three outcomes indicated that levels of perceived Vulnerability were
critical in determining diabetes control (or vice-versa), whilst levels of
perceived Severity seemed to vary randomly. In order to understand the
three-way interactions described below, it is important to note at this point,
that perceived Severity and Vulnerability appear to function independently in
relation to health outcomes.

112
(3) Three-way interaction: Perceived Severity, Vulnerability
and Treat inent 'Cost-effectiveness'
Because the combination of high and low categories of perceived
Severity and Vulnerability did not provide evidence for a consistent two-way
interaction in relation to the health outcomes, the next step was to examine the
results of three-way interactions between perceived Severity, Vulnerability
and treatment 'Cost-effectiveness'. Once again, the data relating to these
variables were split at the median but this time they were combined to form 8
groups of subjects as the increase in the number of variables increased the
number of possible combinations. The results of the Kruskal-Wallis tests
used on these data are presented in Table 4.7 and summarized in Table 4.8. It
was predicted that those patients with the best diabetes control would have
high or low perceived Severity scores, low Perceived Vulnerability scores,
and high treatment 'Cost-effectiveness' scores (in the table: Low/Low/High or
High/Low/High patterns). Conversely, it was predicted that those with very
poor diabetes control would have high or low perceived Severity scores, high
perceived Vulnerability scores and low treatment 'Cost-effectiveness' scores
(in the table: Low/High/Low or High/High/Low patterns).
When related to baseline HbA 1 and percent ideal body weight, the
pattern of ranks was not totally in line with predictions. Although the pattern
of beliefs predicted to be related to the poorest diabetes control was as
expected, the best diabetes control was assocated with a pattern of high
perceived Severity scores, low perceived vulnerability scores, and low
treatment 'Cost-effectiveness' scores (in the table: High/Low/Low).
Furthermore, the pattern of beliefs ranked second in relation to good control
comprised of low perceived Severity, low perceived Vulnerability, and low
treatment 'Cost-effectiveness' (in the table: Low/Low/Low). Thus, contrary
to predictions, low perceived treatment 'Cost-effectiveness' scores were

High
High
High
7
66.4
High
High
Low
26
91.2
High
Low
High
13
63.1
Low
High
High
16
73.3
Low
Low
High
30
61.3
Low
High
Low
12
86.9
111gb
Low
Low
8
45.1
Low Low
Low
26
58.5
High
High
7
62.6
High
Low
27
87.2
Low
High
13
76.0
High
High
16
65.9
Low
High
30
61.3
High
Low
12
85.2
Low
Low
8
54.9
Low
Low
26
61.3
High
High
Low
High
Low
High
Low
Low
High
Low
High
High
High
Low
Low
Low
6
25
13
16
30
11
8
26
64.4
86.8
53.8
78.3
45.7
93.3
55.6
70.4
2.0
3.0
2.0
3.0
2.0
2.0
2.0
2.5
3.0 (2.5)
3.6 (1.5)
2.1 (1.1)
3.2 (1.6)
1.9 (1.1)
4.1 (2.0)
2.2 (1.3)
3.0 (1.8)
High
High
High
bLow
Low
Low,
High
Low
113
Table 4.7: Prediction of outcomes from interactions between categories ofperceived Severity, Vulnerability, and Treatment 'Cost-effectiveness
Score Categories
Severity Vulner- 'Cost-
ability effectiveness'
High
High
High
Low
SLow
High4
Low
N Mean Rank Mean (SD) Median
54.8 (14.1)
52.5
62.1 (12.5)
62.0
53.5 (12.8)
51.0
52.2 (9.6)
51.0
4&5 (12.4)
49.0
50.6 (13.9)
52.0
47.0 ( 7.3)
46.0
57.7 (12.3)
60.0
Chi-square = 16.7; p<O.05
122.8 (23.3)
121.0
149.1 (31.8)
145.0
120.6 (22.6)
115.0
119.2 (19.5)
125.0
110.9 (19.0)
108.0
127.7 (22.5)
115.0
127.6 (18.8)
129.0
120.6 (25.0)
114.0
Chi-square = 11.1; p>O.O5
Chi-square = 23.9; p<0.001

114
associated with good diabetes control. The patterns of scores predicted to be
related to the best diabetes control were ranked next in line. These results
were statistically significant for baseline HbA 1 (chi-square = 16.7; p.czO.05)
but did not reach significance for percent ideal body weight (chi-square =
11.1).
The combinations of beliefs in relation to subjective estimates of
diabetes control were totally in line with predictions. A belief pattern of low
perceived Severity, low perceived Vulnerability, and high perceived treatment
'Cost-effectiveness' was associated with the most optimistic estimates of
control (in the table: Low/Low/I-ligh), followed by a pattern of high perceived
Severity, low perceived Vulnerability, and high perceived treatment
'Cost-effectiveness' (in the table: HighILowII-Jigh). At the other extreme, a
pattern of low perceived Severity, high perceived Vulnerability, and low
perceived treatment 'Cost-effectiveness' was associated with the most
pessimistic estimates of control (in the table: LowlHighlLow), followed by a
pattern of high perceived Severity, low perceived Vulnerability, and low
perceived treatment 'Cost-effectiveness' (in the table: High/High/Low). The
Kruskal-Wallis test indicated that the overall pattern of results was highly
significant (chi-square = 23.9; p<O.001).
In summary, the patterns of perceived Severity, Vulnerability, and
treatment 'Cost-effectiveness' were statistically significant in relation to
baseline HbA1 and subjective estimates of control but not for percent ideal
body weight. In the latter case, however, the pattern of weight control
rankings was comparable to those for glycaemic control and subjective
estimates of control. Inspection of Table 4.8 indicates that perceived
Vulnerability and treatment 'Cost-effectiveness' varied in relation to one
another but, once again, perceived Severity appeared to function

Baseline
HbA1
Sev- Vulner- 'Cost-erity ability effectiveness
High Low Low
Low Low Low
Low Low High
Iligh Low high
Best
Control
High High High
Poorest Jv Hi g h High
Control Low High Low
high High Low
115
Table 4.8: Patterns of perceived Severity, Vulnerability and treatment'Cost-effectiveness' in relation to behavioural outcomes.
Percent
ideal body
weight
Sev- Vulner- 'Cost-erity ability effectiveness
High Low Low
Low Low Low
Low Low High
High High Fligh
Low High High
Hi g h Jv IJigh
Low }1gh Low
High High Low
Subjective
estimates of
diabetes control
Sev- Vulner- 'Cost-
erity ability effectiveness
Low Low High
High Low High
High Low Low
High High High
Low Low Low
Low Hi g h high
1lih High Low
1ow High Low
Patterns of beliefs predicted to b e
I ii Patterns of beliefs predicted to b eassociated with the best diabetes associated with the poorest diabe tescontrol
control
independently and inconsistently across the three outcomes. A pattern of low
perceived Vulnerability and low perceived treatment 'Cost-effectiveness' was
associated with the two highest rankings of control for all three outcomes
whereas a pattern of high perceived Vulnerability and low perceived
Treatment 'Cost-effectiveness' was associated with the two lowest rankings
of control for all three outcomes. It can also be seen from Table 4.8 that in
relation to baseline HbA 1 and percent ideal body weight, the combination of
these beliefs produced a boomerang pattern of relationships for perceived
treatment 'Cost-effectiveness'. This pattern of associations provides
evidence, therefore, for a two-way interaction between perceived
Vulnerability and treatment 'Cost-effectiveness'.

116
(4) Categories of Personal Control/Self-efficacy coin bined
with the HBM variables
If categories of Personal Control/Self-efficacy were combined with
those for perceived Vulnerability, Severity, and treatment
'Costeffectiveness' the number of possible combinations would become
unwieldly and more difficult to interpret and the likelihood of very small
numbers in each category or even empty cells would increase. It was
therefore decided that perceived Severity and Vulnerability would be
combined multiplicatively and then split at the median into categories of high
and low values; this new variable was labelled 'perceived Threat'. Personal
Control/Self-efficacy scores were split at the median after first selecting out
subjects who had also scored highly on the Situational Control scale. This
method provided a 'purer' measure of the construct but reduced the number of
subjects. The categories of perceived Threat and perceived Personal
Control/Self-efficacy were then combined with those for perceived treatment
'Cost-effectiveness' to produce 8 combinations of beliefs. The results of the
Kruskal-Wallis tests on these data are presented in Table 4.9 and summarized
in Table 4.10. It was predicted that patients with the best diabetes control
would have a belief pattern of high perceived treatment 'Cost-effectiveness,
low perceived Threat, and high perceived Personal Control/Self-efficacy (in
the table: High/Low/High), whilst those with the poorest diabetes control
would have a belief pattern of low perceived treatment 'Cost-effectiveness,
high perceived Threat, and low perceived Personal Control/Self-efficacy (in
the table: Low/High/Low).
When related to all three outcomes, the patterns of beliefs were not
exactly as predicted. Patients with the lowest levels of HbA 1 had a belief

High
High
Low
Low
High
High
Low
Low
High
Low
High
Low
High
Low
High
Low
10
20
13
12
9
5
21
9
34.1
44.2
43-9
46.5
49.1
32.8
70.3
57-3
115.0
115.5
113.0
123.0
1190
100.0
1500
1290
112.6 (122)
1224 (20.2)
1234 (27.0)
121.3 (225)
125.3 (22.7)
111.6 (337)
144.9 (254)
1298 (19.9)
High
High
High
High
ILow
Low
Low
Low
2.5
1.0
3.5
2M
30
2M
30
40
10
20
12
12
9
5
19
9
505
239
62.5
47.5
608
29.1
61.3
551
High
Low
High
Low
High
Low
High
Low
High
High
Low
Low
High
High
Low
Low
2.8 (1.4)
1.4 (05)
3.8 (21)
2.6 (1.2)
3.4 (1.6)
L6 (05)
3.5 (1.6)
3.6 (25)
High'II
High
High
High
Low
Low
Low
Low
117
Table 4.9: Prediction of outcomes from interactions between categories ofperceived Treatment 'Cost-effectiveness', Threat, andPersonal Control/Self-efficacy
Score Categories N Mean Rank Mean (SD) Median
Cost- mreat Personal Control!effectiveness Self-efficacy
High
High
High
10
39.2
491 ( 73)
48.0
High
Low
High
20
35.8
4.8.4 (13.0)
45.0
High
High
Low
12
58.4
57.3 (1L8)
58.3
High
Low
Low
12
53.4
54.7 ( 9.0)
5L5
Low
High
High
9
65.1
60.7 (11.9)
6L0
Low
Low
High
5
16.5
41.2 ( 4.3)
4L0
Low
High
Low
21
59.8
583 (137)
570
Low
Low
Low
9
53.1
54.0 (1L4)
57.0
Chi-square = 19.7; p<0.01
Chi-square = 17.5; p<OOS
Chi-square = 274; p<0001

118
pattern of low perceived treatment 'Cost-effectiveness', low perceived Threat,
and high perceived Personal Control/Self-efficacy (in the table:
Low/Low/High). However, this group consisted of only five subjects. The
next best HbA 1 ranks were associated with the predicted belief pattern of high
perceived treatment 'Cost-effectiveness', low perceived Threat, and high
perceived Personal Control/Self-efficacy (in the table: High/Low/High). At
the other extreme, the poorest glycaemic control was associated with a belief
pattern of low perceived Cost-effectiveness, high perceived Threat and,
contrary to prediction, high perceived Personal Control/Self-efficacy (in the
table: Low/High/High). This combination of beliefs was followed, however,
by the predicted pattern of low perceived treatment 'Cost-effectiveness', high
perceived Threat, and low perceived Personal Control/Self-efficacy (in the
table: Low/High/Low). The Kruskal-Wallis test indicated that the overall
pattern of results was statistica1l sigi1icant (c1ni-square = 19.?; p<O.Ol)
The pattern of beliefs associated with the lowest values of percent ideal
body weight was the same as that associated with the lowest levels of HbA1
(in the table: Low/Low/High). Once again, only 5 subjects reported this
belief pattern. This was followed, however, by a belief pattern of high
perceived treatment 'Cost-effectiveness', high perceived Threat, and high
perceived Personal Control (in the table: High/High/High). This latter
combination of beliefs is in line with HBM predictions but was not predicted
in this study. At the other extreme, the greatest obesity was associated with
the predicted pattern of low perceived treatment 'Cost-effectiveness', high
perceived Threat, and low perceived Personal Control/Self-efficacy (in the
table: Low/High/Low). The overall pattern of results was statistically
significant (chi-square = 17.5; p<zO.05).

119
Table 4.10: Patterns of perceived treatment 'Cost-effectiveness', Threat, andPersonal Control/Self-efficacy In relation to behavioural outcomes.
Baseline HbA1
Percent ideal body Subjective estimates ofweight diabetes control
Cost- I Pets. Ctri/ 'Cost- I IIIdE Pets. CtrlI 'Cost- °''°° Pers. CtrlIeffective Self-efficacy effective Self-efficacy effective Self-efficacyness' ness ness'
Low Low High Low Low High High Low High
Best High Low High High High High Low Low High
ControlFligh high High High High Low High Low Low
Low Low Low High Low High High High High
High Low Low
High Low Low
Low Low Low
Poorest
lIih
!hh
low
Low High High
I Iih I Iih
ControlLow
Iligh
Low
Low Low Low
Low
High Low
Low
lligh
High
I ligh
High Low
Patterns of beliefs predicted to b e Patterns of beliefs predicted to b e
associated with the best diabetes - ;. associated with the poorest diabet es
control - - control
The most optimistic subjective estimates of diabetes control were
associated, as predicted, with a belief pattern of high perceived treatment
'Cost-effectiveness', low perceived Threat, and high perceived Personal
Control/Self-efficacy (in the table High/Low/I-ligh). Contrary to prediction,
the most pessimistic estimates of diabetes control were related to high
perceived treatment 'Cost-effectiveness' scores, high perceived Threat scores,
and low perceived Personal Control/Self-efficacy scores (in the table:
High/High/Low). This combination of beliefs was followed in rank by the
pattern predicted to be associated with estimates of the poorest diabetes
control (in the table: Low/High/Low). The Kruskal-Wallis test indicated that
the overall pattern of results was highly significant (chi-square = 27.4;
p<O.001).

120
In summary, the patterns of beliefs were statistically significant in
relation to all three outcome variables. Although the combinations of
variables were not always associated with outcomes as predicted, the overall
results were roughly in accordance with expectations. Furthermore,
inspection of Table 4.10 indicates that, in general, all three belief variables
varied in relation to one another, although the patterns associated with good
weight control and obesity were different to those for percent ideal body
weight and subjective estimates of diabetes control.
(5) Categories of Personal Control/Self-efficacy and HBM
variables related to Well-being and Treatment Satisfaction.
In general, the patterns of perceived treatment 'Cost-effectiveness,
perceived Threat, and perceived Personal Control/Self-efficacy were
associated with health outcomes as predicted but there were some notable
exceptions. For example, the lowest levels of baseline HbA 1 were associated
with the predicted categories of low perceived Threat and high perceived
Personal Control/Self-efficacy, but contrary to HBM predictions, were also
related to low perceived treatment 'Cost-effectiveness'. It was considered
possible that the unpredicted combinations of beliefs may have been a result
of the respondents' psychological Well-Being and Treatment Satisfaction at
the time of completing the questionnaires and thus all the patterns of HBM
and Personal Control/Self-efficacy beliefs were examined in relation to these
psychological outcomes. The results of these analyses are summarized in
Table 4.11.
The results indicate that those with the best diabetes control (indicated
by I-thA1 and percent ideal body weight) and the associated belief pattern of

121
low perceived treatment 'Cost-effectiveness', low perceived Threat, and high
perceived Personal Control/Self-efficacy (in the table: Low/Low/High), were
also the most depressed, and were among the most anxious and least
satisfied. The group of patients with the belief pattern predicted to be
associated with the best diabetes control (in the table: High/Low/High) had the
next best HbA 1 levels and the most optimistic subjective estimates of diabetes
control. These patients also reported the greatest Positive Well-being,
General Well-being, and Treatment Satisfaction. It seems likely, therefore,
that the low perceived treatment 'Cost-effectiveness' scores associated with
the best blood glucose and weight control were a result of feeling more
depressed and anxious, and less satisfied with treatment. The most
pessimistic subjective estimates of diabetes control were associated with high
perceived treatment 'Cost-effectiveness', high perceived Threat, and low
perceived Personal Control/Self-efficacy (in the table: I-ugh/High/Low).
However, the group of patients with this belief pattern were among the least
obese and had high Treatment Satisfaction scores. It is likely, therefore, that
high perceived treatment 'Cost-effectiveness' was related to these patients
having relatively good weight control and, as a result, being very satsuted
with their treatment.
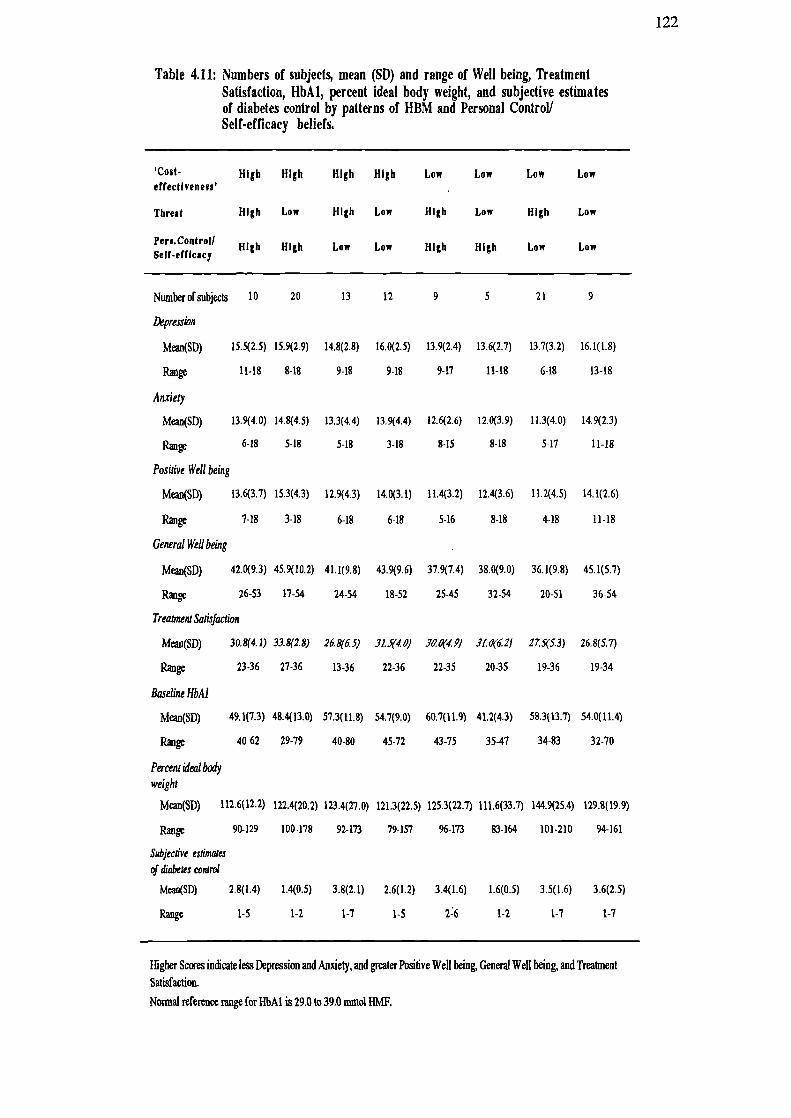
122
Table 4.11: Numbers of subjects, mean (SD) and range of Well being, TreatmentSatisfaction, HbA1, percent ideal body weight, and subjective estimatesof diabetes control by patterns of HBM and Personal Control!Self-efficacy beliefs.
Cost- High High High High Low Low Low Lowetfectivene8s'
Threat High Low High Low High Low High Low
High High Low Low High High Low Low
Numberolsubjects 10 20 13 12 9 5 21 9
Depression
Mean(SD) 15.5(2.5) 15.9(2.9) 14.8(2.8) 16.0(2.5) 13.9(2.4) 13.6(2.7) 13.7(3.2) 16.1(1.8)
Range 11-18 8-18 9-18 9-18 9-17 11-18 6-18 13-18
Anxiety
Mean(SD) 13.9(4.0) 14.8(4.5) 13.3(4.4) 13.9(4.4) 12.6(2.6) 12.0(3.9) 11.3(4.0) 14.9(2.3)
6-18 5-18 5-18 3-18 8-15 8-18 5-17 11-18
Positive Well being
Meaii(SD) 13.6(3.7) 15.3(4.3) 12.9(4.3) 14.0(3.1) 11.4(3.2) 12.4(3.6) 11.2(4.5) 14.1(2.6)
Range 1-18 3-18 6-18 6-18 5-16 8-18 4-18 11-18
General Well being
Mean(SD) 42.0(9.3) 45.9(10.2) 41.1(9.8) 43.9(9.6) 37.9(7.4) 38.0(9.0) 36.1(9.8) 45.1(5.1)
Range 26-53 17-54 24-54 18-52 25-45 32-54 20-51 36-54
Treatment Satisfaction
Mean(SD) 30.8(4.1) 33.8(2.8) 26.8(6.5) 31.5(4.0) 30.0(4.2/ JI.(1(6Z1 27S(5.3) 26.8(5.7)
Range 23-36 27-36 13-36 22-36 22-35 20-35 19-36 19-34
Baseline HbAJ
Mcan(SD) 49.1(7.3) 48.4(13.0) 57.3(11.8) 54.7(9.0) 60.7(11.9) 41.2(4.3) 58.3(13.7) 54.0(11.4)
Range 40 62 29-79 40-80 45-72 43-75 35-47 34-83 32-70
Percent idealbody
weight
Mean(SD) 112.6(12.2) 122.4(20.2) 123.4(27.0) 121.3(22.5) 125.3(22.7) 111.6(33.7) 144.9(25.4) 129.8(19.9)
Range 90-129 100-178 92-173 79-157 96-173 83-164 101-210 94-161
Sisbjective estimates
of diabetes control
Mean(SD) 2.8(1.4) 1.4(0.5) 3.8(2.1) 2.6(1.2) 3.4(1.6) 1.6(0.5) 3.5(1.6) 3.6(2.5)
Range 1-5 1-2 1-7 1-5 2:6 1-2 1-7 1-7
Higher Scores indicate less Depression and Anxiety, and greater Positive Well being, General Well being, and Treatment
Satisfaction.
Normal reference range for HbAI is 29.0 to 39.0 mmol HMF.

123
Discussion
In the present study, ratings of an 'average person's' Vulnerability to
Complications were not significantly different to those for personal
Vulnerability. Furthermore, when ratings did differ, both pessimistic and
optimistic biases were associated with a realistic appraisal of the respondents'
own diabetes control. It was also found subsequently that scores relating to
personal Vulnerability were slightly superior to those for the 'average person'
when these variables were entered into two separate regression equations.
Personal Vulnerability was therefore selected for inclusion in all subsequent
analyses and 'average person' Vulnerability was dropped completely.
In Chapter 3, it was noted that, for the individual complications, Vulnerability
scores relating to the 'average person' were significantly greater than those for
personal Vulnerability. The contrast between these findings and those in the
present study is probably explained, on the one hand, by lack of knowledge
regarding which disorders are complications, and on the other, by a restricted
or idiosyncratic interpretation of the single item, "Complications arising from
diabetes". If this is the case, then it seems that optimistic biases will only
prevail if the disorder in question is perceived to be irre'evant to cunent health
status. Thus, the general tendency to assume that "it won't happen to me"
(Weinstein, 1987), will diminish when a risk becomes more salient. In the
present study, it was anticipated that Optimistic Bias could be usefully
incorporated in the HBM in the course of specifying the relationships between
its components. However, because no significant Optimistic Bias was found,
it was excluded from subsequent analyses. As previously noted (Chapter 3),
the optimistic bias found in relation to Vulnerability to the individual
complications, provides useful information for the targeting of educational
interventions.
124
The main aim of this study was to establish whether the individual
components of the HBM combine in a purely additive fashion, or whether
multiplicative composites of the various components would add significantly
to the overall amount of outcome variance explained. On the assumption that
the components of the 1-IBM are linearly related to health outcomes, the initial
sets of analyses were carried out using hierarchical multiple regression. The
amount of variance explained by the individual components of the original
HBM was only small to moderate [4% to 16% (0% to 12% adjusted] and, in
all cases, none of the multiplicative composites added significantly to the
overall explanation. As found previously in individual correlations, the HBM
variables were more strongly related to subjective estimates of diabetes control
than to actual control (HbA 1 and percent ideal body weight). None of the
variables contributed significant amounts of unique variance in the prediction
of baseline HbA 1 and perceived Severity of Diabetes was the only variable
which significantly predicted percent ideal body weight Subjective estimates
of diabetes control were predicted by perceived treatment 'Cost-effectiveness'
and perceived Vulnerability to Complications. These results indicated that the
1-IBM components combine in an additive rather than a multiplicative manner.
Furthermore, certain beliefs were not salient in the prediction of outcomes;
for example, perceived Severity of Diabetes and treatment
'Cost-effectiveness' made extremely weak contributions to the prediction of
baseline HbA 1, and perceived Vulnerability to Complications barely
contributed to the prediction of percent ideal body weight
When perceived Personal Control/Self-efficacy was added to the
regression equation, both individually and as part of a multiplicative
composite, the amount of overall variance explained increased significantly
[8% to 25% (2% to 20% adjusted)]. Furthermore, although this variable did
not contribute a significant amount of unique variance in the prediction of

125
HbA 1, it did account for significant amounts of unique variance in the
prediction of percent ideal body weight and subjective estimates of diabetes
control. (In relation to percent ideal body weight, perceived Personal
Control/Self-efficacy claimed some of the variance explained by perceived
Severity and thus became the most important predictor of this outcome.)
When considered as part of a multiplicative composite, however, it did not
significantly increase the overall amount of variance explained in any of the
outcome variables. Furthermore, inclusion of this variable did not
significantly improve the efficiency of the previous multiplicative composites
in the prediction of outcomes. These results indicate, therefore, that perceived
Personal Control/Self-efficacy adds significant explanatory power to the
I-IBM but is related in an additive rather than a multiplicative fashion. Once
again, the amounts of variance explained overall by these variables was only
small to moderate. Moreover, subsequent inclusion of the single-item health
value measure in the regression equation did not improve these predictions. It
is possible, however, that the single item was a poor or unrepresentative
measure of health value.
As none of the multiplicative composites contributed significantly to
predictions of baseline I-ThA1, percent ideal body weight, and subjective
estimates of diabetes control, it was considered possible that these variables
do not combine to predict outcomes in a linear fashion. Indeed, non-linear
combinations of the belief variables revealed patterns which were not
predicted to be associated with particular outcomes. When all possible
combinations of perceived Severity and perceived Vulnerability were
combined after being categorized into high and low scores, a consistent
pattern of associations between perceived Vulnerability and diabetes control
became apparent. On the one hand, low perceived Vulnerability scores were
associated with the best diabetes control (as indicated by baseline I-ThA1,

126
percent ideal body weight, and subjective estimates of diabetes control), and
on the other, high perceived Vulnerability scores were associated with the
poorest diabetes control. However, levels of perceived Severity seemed to
vary randomly in relation to all three outcome variables. This result is
consistent with findings from several other I-IBM studies which have shown
that perceived Severity was not a useful prechctor of preventive health
behaviour (Janz & Becker, 1984). Furthermore, the random variation of
perceived Severity in relation to outcomes suggests that a minimum level of
this belief had been exceeded to be of concern, and thus preventive health
behaviour was largely a function of perceived Vulnerability only. An
alternative explanation for these findings is that perceived Severity of Diabetes
may be a particularly dynamic belief. Thus, if a person has reached a point
where their diabetes control is perceived to be unsatisfactory, perceived
Severity may increase and preventive health behaviour is likely to be initiated.
When control is perceived to have returned to a satisfactory level, however,
perceived Severity of Diabetes is likely to reduce to its original low level. The
magnitude of perceived Severity will therefore dpend on whether glycaemic
and/or weight control is deteriorating or improving. If this latter explanation
is correct, an intervention which has been designed to increase perceived
Severity should produce non-random patterns of this belief in relation to
health outcomes. Although the pattern of beliefs was consistent across all
three outcome variables, the combinations of high and low perceived Severity
and Vulnerability were not significantly associated with percent ideal body
weight. However, as shown by the previous regression analyses, this was
probably due to beliefs about Vulnerability to Complications being less salient
to behaviour concerning weight control.
When combinations of perceived Severity; Vulnerability, and treatment
'Cost-effectiveness' were examined, the same apparently random pattern of

127
perceived Severity scores was noted in relation to the outcome variables.
However, perceived Vulnerability and treatment 'Cost-effectiveness' appeared
to vary in relation to one another indicating that these variables interacted in a
non-linear fashion. It is particularly interesting to note that combinations of
these variables produced an unexpected boomerang pattern of relationships
between perceived treatment 'Cost-effectiveness' on the one hand, and HbA1
and weight control on the other. Low perceived treatment 'Cost-effectiveness'
was associated with both extremes of control whilst high perceived treatment
'Cost-effectiveness' was associated with intermediate levels of control.
However, the associated beliefs about Vulnerability varied as predicted with
lower scores for this variable being related to better control whilst higher
scores were associated with poorer control. The most optimistic and
pessimistic subjective estimates of diabetes control were associated with the
predicted patterns of Vulnerability and treatment 'Cost-effectiveness' beliefs
as predicted. Again, the patterns of beliefs were more strongly associated
with subjective estimates of control than actual measures of HbA 1 and percent
ideal body weight. Indeed, percent ideal body weight was not associated
significantly with these belief patterns, indicating once again that this was
probably due to weight control being only weakly associated with beliefs
about Vulnerability to Complications.
The final combinations of perceived treatment 'Cost-effectiveness',
perceived Threat (Severity x Vulnerability), and perceived Personal
Control/Self-efficacy were significantly associated with all three outcome
variables. However, some of the outcomes were associated with patterns of
beliefs which were not predicted. In particular, low perceived treatment
'Cost-effectiveness' was associated with the lowest HbA 1 levels and the best
weight control when combined with low perceived Threat and high perceived
Personal Control/Self-efficacy. When examined in relation to Well-being and

128
Treatment Satisfaction scores, however, the respondents with this belief
pattern were also the most depressed, and were among the most anxious and
least satisfied. Furthermore, the group of patients with the belief pattern
predicted to be associated with the best diabetes control (high perceived
treatment 'Cost-effectiveness'/low perceived Threat/high perceived Personal
Control/Self-efficacy) had the next best I-IbA 1 levels and the most optimistic
subjective estimates of diabetes control. They also reported the greatest
Positive Well-being, General Well-being and Treatment Satisfaction. In view
of these findings, it seems likely that the unexpected patterns of beliefs
associated with the best blood glucose and weight control were a result of
feeling more depressed, anxious and less satisfied with treatment. A pattern
of high perceived treatment tCost-effectiveness' in combination with high
perceived Threat, and low perceived Personal Control/Self-efficacy was
associated with the most pessimistic estimates of control. However, the
group of patients with this belief pattern were among the least obese and were
very satisfied with their treatment. The high treatment 'Cost-effectiveness'
scores were likely, therefore, to be the result of having relatively good weight
control and, consequently, being very satisfied with the treatment. Thus,
when Well-being and Treatment Satisfaction were taken into account, the
patterns of beliefs predicted to be associated with the best and poorest control
were generally as expected. A slight variation was apparent for percent ideal
body weight, however, in that a pattern of high rather than low perceived
Threat in association with high perceived treatment 'Cost-effectiveness' and
high perceived Personal Control/Self-efficacy predicted better weight control.
This pattern of beliefs was not predicted in this study but is in accordance
with the predictions of the HBM.
One of the shortcomings of this set of analyses was that single item
measures of perceived severity and vulnerability were used. These measures
were selected because of their greater sensitivity in correlations with the

129
outcome measures but single items are limited in the breadth of their
measurement and thus vanability in responses is reduced when compared
with multi-item measures. Accordingly, spurious agreement between subjects
may be obtained and idiosyncratic responding is more likely because the
elements of the construct measured are not made explicit. Furthermore, the
measure of perceived Severity of Diabetes was not the same as the composite
measure of perceived Severity of Complications. The multiplicative
combination of perceived Severity of Diabetes x perceived Vulnerability to
Complications may have been compromised, therefore, because of the
different levels of measurement. Nevertheless, given that the composite
measures were affected by knowledge, it appeared that the single item
measures were more representative.
A problem with using the measure of perceived Treatment
"Cost-effectiveness" was that this eliminated the possibility of examining the
impact of absolute level of perceived Barriers to, and Benefits of treatment
However, since the responses to the perceived Benefits scale were skewed
and regression analysis assumes that variables are normally distributed, the
difference score was employed because it satisfied assumptions of normality.
In summary, the results of the regression analyses indicated that the
components of the HBM (including perceived Personal Control/Self-efficacy)
are related in an additive fashion because none of the multiplicative
composites provided a significant contribution to the variance explained.
However, the KruskalE-Wallis ANOVAs indicated a significant three-way
interaction between perceived treatment 'Cost-effectiveness', perceived
Threat, and perceived Personal Control/Self-efficacy for all three outcome
variables. The results of categorizing and combining the health beliefs in a
non-linear fashion provided a clearer picture as to why the composite
variables did not add significantly to the variance explained in regression

130
analyses. In particular, it was noted that Well-being and Treatment
Satisfaction seemed to influence perceived 'Cost-effectiveness' of treatment
and, as a result produced combinations of beliefs which were not predicted to
be associated with the best and poorest diabetes control. When these factors
were taken into account, however, the predicted interactions between
perceived treatment 'Cost-effectiveness', perceived Threat, and perceived
Personal Control/Self-efficacy were largely as expected in relation to the three
outcome variables. Moreover, when the patterns of beliefs were ordered in
relation to the outcome variables, it was clear that the relationships were not
linear. The expected interaction between perceived Seventy and Vulnerability
was not demonstrated in either the regression analyses or the Kruskal-Wallis
one-way ANOVAs indicating that either a critical cut-off point for perceived
Severity had been exceeded or that this belief is particularly dynamic and
therefore difficult to assess in cross-sectional analyses. The results of the
analyses including perceived Threat should be interpreted, therefore, with
some caution. It should be remembered that these variables were combined
multiplicatively when testing the non-linear hypothesis because the number of
combinations in the analyses would have become unwieldly and difficult to
interpret. Furthermore, the numbers in each category would have been small,
increasing the likelihood of empty cells.
It is appreciated that the outcome variables used in this study were
collected at the same time as the psychological variables and thus conclusions
about cause and effect are problematic. Furthermore, the respondents' beliefs
about their diabetes and its managment were affected by knowledge about this
disorder and the quality of feedback about blood glucose control. Most of the
patients in this study had not been to an organized education session at all and
many were receiving inadequate feedback about the effects of their blood
glucose control. In view of these factors, it is not surprising that, compared
with subjective estimates of diabetes control, only small amounts of variance

131
in blood glucose control and percent ideal body weight were explained. The
next study attempted to tackle these problems in that it examines the effects of
an education session on the health beliefs and psychological well-being of a
sub-set of the patients from the present study. The effects of the beliefs on
health behaviour were then assessed using measures of HbA 1 recorded
approximately six months later. This study provided the opportunity,
therefore, to re-examine the relationships between the HBM components in
the light of better patient knowledge, and with the benefit of outcome data
which had been collected prospectively.

132
CHAPTER FIVE
THE EFFECTS OF AN EDUCATIONAL INTERVENTION
ON HEALTH BELIEFS, OTHER PSYCHOLOGICAL
VARIABLES, AND GLYCOSYLATED HAMOGLOBIN.
In Chapter 4 it was noted that health beliefs and psychological well-being were
affected by patients' knowledge about the complications of diabetes and the quality
of feedback they had received regarding their diabetes control. As a consequence,
the psychological variables explained more of the variance in subjective estimates of
diabetes control than the labomtory and clinical measures. The results were also
difficult to interpret because the health outcome measures were collected at the same
time as the psychological measures so it was impossible to determine whether beliefs
caused the outcomes or whether they were merely a reflection of current health
status. It is likely that a combination of these explanations was true which may
explain why the hypothesized interactions between the health beliefs did not emerge
as significant predictors of health outcome.
Given that patients have a large part to play in the control of their diabetes,
education about the disorder and its management-is very important. Furthermore,
because the treatment regimen is pervasive and often intrusive, it is helpful if patients
are given a rationale for taking exercise, following the recommended diet, and taking
oral hypoglycaemic agents as prescribed. In the traditional diabetes clinic, virtually
no time is allowed for education and instruction, although many hospitals now offer
separate education sessions of varying kinds and quality. Since Type II diabetes
has been, until recently, considered to be a mild form of the disease, perhaps
because it does not have the immediate life-threatening consequences of the Type I
disorder (Bloom, 1982; Burden, 1982), the needs of this patient group have often

133
been neglected (Moor & Gadsby, 1984; Alberti & Gries, 1988). Indeed, Type II
patients are generally found to have poorer knowledge about their disorder than
Type I patients (Shillitoe, 1987). Prior to the research reported in this thesis, Clare
Bradley and her colleagues found that when education was offered to some diet-only
and tablet-treated patients in Sheffield, many of them were unclear about the
treatment goals to be aimed for, and there was considerable ignorance about methods
of attaining these goals. The major block to appropriate health care, however,
appeared to be due to lack of understanding as to the reasons why their physicians
had recommended these goals in the first place. Many patients appeared to be
disturbingly ill-informed about the relationship between glycaemic control and
microvascular complications, on the one hand, and diet and macrovascular
complications on the other, yet this is the major source of motivation behind
physicians' attempts to improve the glycaemic and weight control of their patients.
Without such motivation it is easy to see why it is often the case that patients do not
achieve the treatment goals set. Very few of the patients from the baseline study had
previously received any formal education about diabetes and its management, thus,
in recognition of their needs, they were invited to attend one of a series of specially
designed education sessions at the hospital. The present study examines the effects
of this education on the beliefs, knowledge, psychological well-being, and treatment
satisfaction of those who attended. These variables were then examined in relation
to HbA 1 approximately six months later. A particular aim was to re-examine the
relationships between the I-IBM variables (including the newly-introduced measure
of perceived Personal Control/Self-efficacy) when used to predict a prospective
measure of blood glucose control.

134
Methods
Measures
Diabetes-specific Health Beliefs, Perceived Control, Well-being, and
Treatinent Satisfaction.
The psychological measures used in the present study were the same as those
administered at baseline (See Chapter 2). As before, the questionnaires were given
to the participants in the form of a booklet but a different front sheet was attached
giving information about the nature of the research at this stage. The general
information questionnaire included questions about current weight, how well
respondents felt their diabetes had been controlled over the past few weeks, whether
they had attended an education session before, and whether they had ever read any
books about diabetes before. Copies of the front sheet and General Information
questionnaire are included in Appendix 3.
Knowledge about Diabetes and its Management
The knowledge questionnaire used in the present study was adapted from the
Charing Cross questionnaire (CCQ2) developed for tablet and/or diet treated patients
(Meadows and colleagues, 1988), the diabetes knowledge (DKN) scales developed
by Dunn and colleagues (1984), an unpublished questionnaire constructed by Clare
Bradley for non-insulin-requiring patients which had been used to evaluate previous
education sessions in Sheffield, and new items constructed by the present author.
The process of choosing and generating suitable questions for the patient group
studied was carried out in consultation with another psychologist and a dietitian. A

135
pilot version of the questionnaire was filled in by a group of 6 doctors (1 consultant
and 5 Registrars), 4 dietitians, and 2 diabetes nurse specialists in order to eliminate
questions for which there was no consensus of opinion about the correct answers
and to seek comments about the suitability and clarity of the suggested questions.
The final questionnaire (Appendix 4) was designed according to a multiple-choice
format (including "I do not know" options) with questions concerning diet (8
questions), complications (10 questions), and diabetes and its management generally
(8 questions). Because of the multiple-choice format, responses were assessed
using the Middlesex scoring procedure (Buckley-Sharp & Harris, 1971). This
method takes into account guessed responses by calculating the difference between
the total percentage of corredily identified options and the total percentage of
incorrectly identified distractors (the adjusted percentage score or APSCORE). "I do
not know" responses were ignored in this calculation. In order to assess the
difficulty of the individual items in the questionnaire, facility indices were calculated
for all the options (percentage of patients responding correctly to each option).
Eighty-seven per cent of the options had facility indices within the acceptable range
of thirty to ninety per cent. The relationship of the items to overall knowledge
scores was assessed using discrimination coefficients (phi-coefficients) computed
for options and distractors using upper and lower criteria groups. (These groups
were defined according to whether 'scoiEs were above or below the median.)
Coefficients ranged from 0.01 to 0.57 for options and from 0 to 0.27 for distractors.
Eighty per cent of the options exceeded the minimum standard coefficient of 0.2.
Questions with options having facility indices greater than 0.90(90%) andlor
discrimination coefficients less than 0.2 should be rejected or revised (Windsor,
Roseman, Gartseff & Kirk, 1974). Furthermore, in relation to the group with
APSCORES below the median, the questions with very attractive distractors
(discrimination coefficients >0.2) should also be rejected. The questions which
survived the psychometric selection procedure just described are presented in
Figure 5.1 Responses to these items were used to assess knowledge in the present

a)
C)
=
a)
S0C)a).0
Ca
E
a)
C,,
=C"CI-C)C.
C)
.0Ca
Ca
CC:
P0CM0000OC)
a)
a'.I-Ca
0CM
a)
Ca
C
=
C)
=
C,.
a)
I-
a..)
C)
.0
0
C.)
E
C)
I-
I-
0
E
0
0.0
C,)
0
0.0
0
0
•0a)
00
In
a)I-0
I--a
O-- C)C:
a-0C.4
-a -- C
C- C C) C
a)
Cd
a-
CMa)a-
I-
a)•0
CC,.Ca
a).0
•0
0
CM
a'.
a). )_0::
0ado
•0
.0
C
Ca
Ea)CaC)
C0.
.0
C
a))
E0
C-
E
"a
C)::
=0
.0CM
C.::
a)
t.
0- M
•00
.0
0
C)
. :0
L.a)
-Ca)
C)a)
I-C
a)
C
a)
a)a-C
S
a)a-Ca
II
C)
C
--"C
v ca .2
- EC C '-
a)'- C._.
.5 . a) C.)
C-Ca)
•0>' ?s -5C 0 C) .0
0 .0 -2 .C) C) '.> > C.. Co o 0
C) C) - > -
a).0
Ca
I0000
a)
C.-
0.0
I-Ca) -- Ca
L .5
.0 0
I-
C,'c C)
C) CM -
ci
C)C)
C-. ?'
IC) -a>.
4)
>s>, ''
C
2C)
0.C)
S.0
- C)C) .0C.) -
5 .2CM C
(IC -::
a-C. "C
C)C. C
CM
"C •5C,)
5.2'-Q .0C.) .0
U) 0C)O"CC)C- ca..9 S 0
cco-
C)
.2 :a
o C)
2 E -...-: o
>.. Caa
C .0 0
.2C
U C C- C) 0
a--a)CaI-
CM
C
0
a-.
a).0
a-C
.0U
.0
C,)
C)
C)
C)
Ca
•0 a'.C)
Ca-
0-
-a)C,.0
C..00.
.0t_% > I-
0a).0
a)0I-0a).0
0
C)
C)a)
a)
'%• C,
'-a)
C)CC0C)C)C)
rfl t
CM
C) C)-E C) Cc: C)
•__t .-' C,) -
. . .
C) C) ..0 .0 .0
C)C
CM
.5 C)
. .0
s4
C.) •C
- •0 C)- C)
. '
o •- C.)
_C • CM
.0 C) .0o.0
_
'o C.OC C)
"C Q
C
-9
I-C)
I !
In
5
ca C)
-a
. ca -
000 - -
I-. I. In
0 Ia2 0
_0 .
0ado-
2 0
CM
Ca
.5 - CC)- >
S - -
C)
• E
- C)
0.0
C) -• - .0 0
C
.2
C,) C)Ca
- C) (I,
C ._ -oC)
- C2'
C"C
- -'C C.)C)
.0
C '-CIa S o
C,) "C
I- > - C.)Ca -
C OO I-.- -0-C 0 0 0
IC cia C
- C.. - -
C-.a)a-.0
a-
Ca
.0
a)a-Ca
C
C-
4).0
C-
.0C)
.0

137
study. Reliability analysis was performed on the final measure using the
Kudor-Richardson KR2O formula which was modified to incorporate the Middlesex
scoring procedure (Buckley-Sharp &Harris, 1972) The reliability coefficient of
0.68 indicated that the internal consistency of the responses was satisfactory for the
purposes of the present study. Validity data will be presented in the results section of
this chapter.
Format of the Education Sessions
The education sessions were designed to meet the specific needs of tablet-treated
patients. Each session lasted from 9.30 am to about 3.30 pm and included a midday
meal where foods recommended in the diet regimen were provided and informal
discussions took place between patients, partners and educators. The style of the
education sessions was a mixture of formal lectures, patient-led discussion, and
practical demonstrations. Each session began with a slide presentation and talk by
the doctor who had seen all the patients for a screening appointment at baseline.
This talk was about the nature of diabetes, its complications and the medical
treatments available, and was followed by a question and answer session. One of
the reasons for this talk was to ensure that patients and their partners understood the
rationale behind the recommended treatment regimen. The remainder of the
education session was spent talking to patients and their partners about the value of
the different aspects of treatment for avoiding or arresting complications and
improving the quality of life generally. Following the initial talk there was a
discussion led by a diabetes nurse specialist about oral hypoglycaemic agents, the
symptoms of hypo- and hyperglycaemia, when they occur, and what to do about
them. This was followed by a demonstration of, and discussion about the different
urine tests, how and why they should be used, and how to interpret their results.
Prior to the break for lunch, a talk and slide presentation was given by a senior

138
dietitian about the foods recommended together with information and tips about food
purchase and preparation. Once again, time was allowed for discussion after the
talk. Recommended foods were also displayed in the room where the education
session took place so that those attending could inspect sample food packages. After
lunch, a second diabetes nurse specialist gave a talk about footcare which was
followed by another discussion period. The patients were then asked if they had any
questions or worries about their diabetes which had not been resolved by the
education session. When these queries and worries had been addressed, the
education session was brought to a close.
Subjects and Procedure
Some of the participants from the baseline study were selected according to
certain criteria and approached to take part in an insulin treatment study. These
patients were classified as 'borderline poorly-controlled' because their blood glucose
levels were chronically high, not very well controlled by diet and oral
hypoglycaemic agents, and close to a threshold where insulin would be routinely
prescribed. A description of this study and the rationale for the insulin intervention
will be described in Chapter 6. The patients who did not meet the selection criteria
for the insulin study were invited to attend an education session when they went to
their screening appointment with the doctor. All were encouraged to bring a spouse,
partner or friend if they desired. Altogether, 81(47%) of the 173 patients who were
invited attended one of the 13 sessions. The demographic and clinical characteristics
of those attending and not attending for education are presented in Table 5.1 which
shows that there was a significant difference in duration of diabetes. Those who
attended an education session had experienced their diabetes for significantly fewer
years (p<O.Ol) when compared to non-attenders. Differences in baseline
psychological characteristics between attenders and non-attenders were also
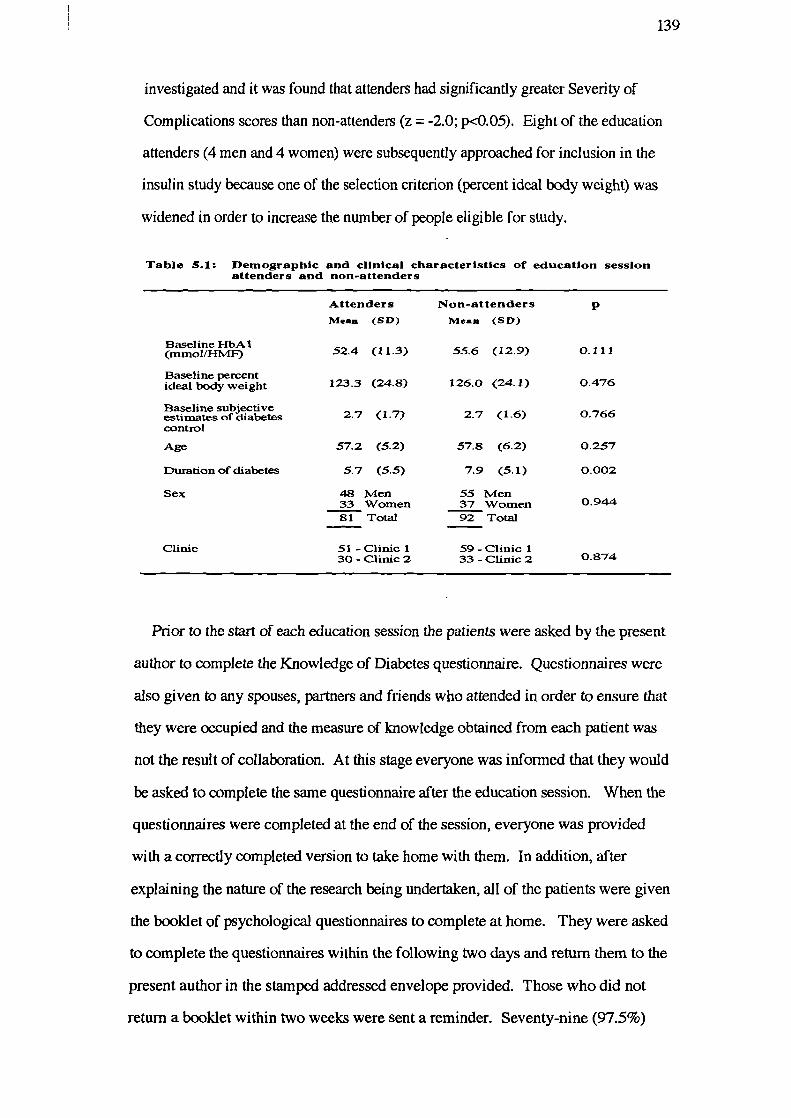
139
investigated and it was found that attenders had significantly greater Severity of
Complications scores than non-attenders (z = -2.0; p<O.05). Eight of the education
attenders (4 men and 4 women) were subsequently approached for inclusion in the
insulin study because one of the selection criterion (percent ideal body weight) was
widened in order to increase the number of people eligible for study.
Table 5.1: DemographIc and clinical characteristics of education sessionattenders and non-attenders
Attenders Non-attenders pMean (SD) Mean (SD)
Baseline HbA 1(mxnolfHMF)Baseline percentideal body weightBaseline subjectiveestimates of diabetescontrolAge
Duration of diabetes
Sex
52.4 (11.3)
123.3 (24.8)
2.7 (1.7)
57.2 (5.2)
5.7 (5.5)
48 Men33 Women81 Total
55.6 (12.9) 0.111
126.0 (24.1) 0.476
2.7 (1.6) 0.766
57.8 (6.2) 0.257
7.9 (5.1) 0.002
55 Men37 Women 0.94492 Total
Clinic 51-Clinic 1 59-Clinic 130- Clinic 2 33- Clinic 2 0.874
Prior to the start of each education session the patients were asked by the present
author to complete the Knowledge of Diabetes questionnaire. Questionnaires were
also given to any spouses, partners and friends who attended in order to ensure that
they were occupied and the measure of knowledge obtained from each patient was
riot the result of collaboration. At this stage everyone was informed that they would
be asked to complete the same questionnaire after the education session. When the
questionnaires were completed at the end of the session, everyone was provided
with a correctly completed version to take home with them. In addition, after
explaining the nature of the research being undertaken, all of the patients were given
the booklet of psychological questionnaires to complete at home. They were asked
to complete the questionnaires within the following two days and return them to the
present author in the stamped addressed envelope provided. Those who did not
return a booklet within two weeks were sent a reminder. Seventy-nine (97.5%)
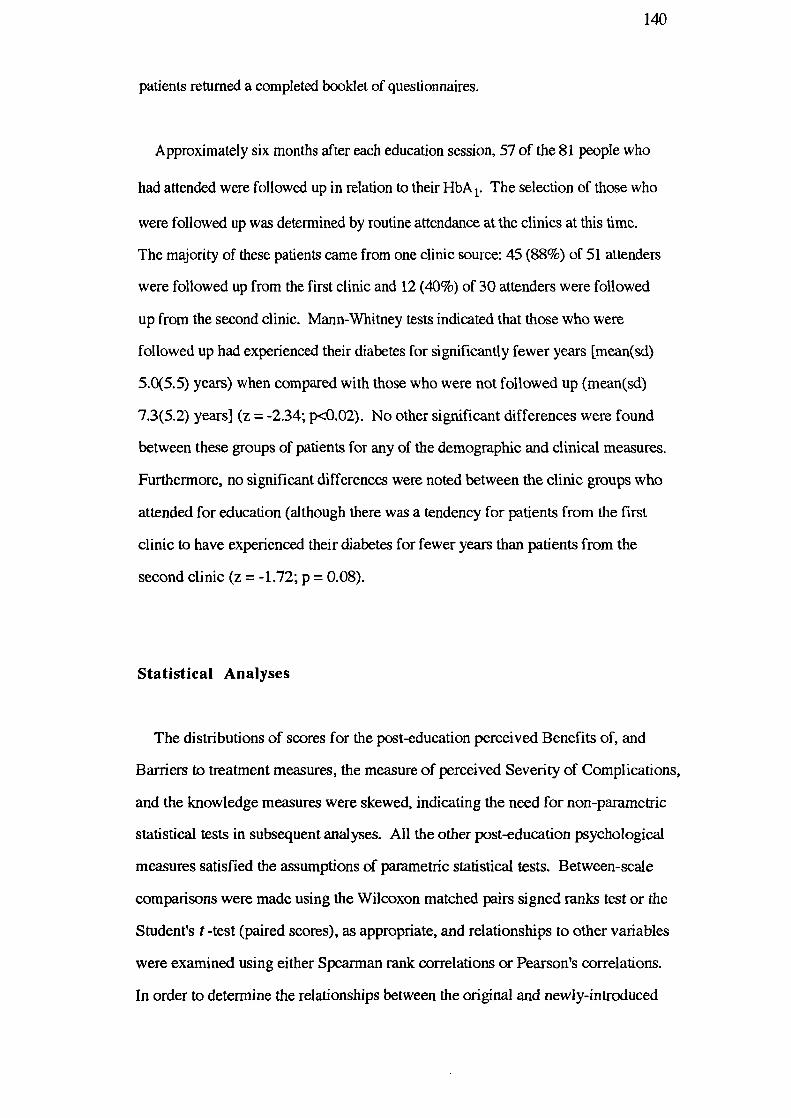
140
patients returned a completed booklet of questionnaires.
Approximately six months after each education session, 57 of the 81 people who
had attended were followed up in relation to their HbA 1. The selection of those who
were followed up was determined by routine attendance at the clinics at this time.
The majority of these patients came from one clime source: 45(88%) of 51 attenders
were followed up from the first clinic and 12 (40%) of 30 attenders were followed
up from the second clinic. Mann-Whitney tests indicated that those who were
followed up had experienced their diabetes for significantly fewer years [mean(sd)
5.0(5.5) years) when compared with those who were not followed up (mean(sd)
7.3(5.2) years] (z = -2.34; p<0.02). No other significant differences were found
between these groups of patients for any of the demographic and clinical measures.
Furthermore, no significant differences were noted between the clinic groups who
attended for education (although there was a tendency for patients from the first
clinic to have experienced their diabetes for fewer years than patients from the
second clinic (z = -1.72; p = 0.08).
Statistical Analyses
The distributions of scores for the post-education perceived Benefits of, and
Barriers to treatment measures, the measure of perceived Severity of Complications,
and the knowledge measures were skewed, indicating the need for non-parametric
statistical tests in subsequent analyses. All the other post-education psychological
measures satisfied the assumptions of pammetric statistical tests. Between-scale
compansons were made using the Wilcoxon matched pairs signed ranks test or the
Student's t -test (paired scores), as appropriate, and relationships to other variables
were examined using either Spearman rank correlations or Pearson's correlations.
In order to determine the relationships between the original and newly-introduced

141
HBM components and their combined effectiveness in the prediction of
prospectively measured HbA 1, hierarchical multiple regression analyses and
Kruskal-Wallis tests were employed.
Results
Comparison of Baseline and Follow-up HbA1
HbA 1 at baseline and approximately six months later were compared in order to
assess the impact of education on blood glucose control. The results indicated that
after education, HbA 1 was not significantly different to that at baseline (z = -0.82;
p<O.41). However, because some of the education attenders already had fairly good
blood glucose control, another analysis was conducted after selecting only those
with a baseline HbA 1 greater than 55 mmolIHMF (n = 18). The results of this
analysis indicated that for these patients, there was a significant improvement in
HbA J approximately six months later (z = -2.1; p<0.05). The baseline and
post-education HbA 1 statistics are presented in Table 5.2.

570.4151.0
51.0
80.0
77.0
29.0
36.0
180.0362.0
59.0
56.0
37.0
80.0
77.0
142
Table 5.2: Mean (SD), median, mimimum and maximum baseline
and follow-up HbAI(mmol HMF)
Mean(SD) Median Minimum Maximum (2-ta'I1ed) N
All patients who
attended for education
Baseline HbA 1
Follow-up ilbAl
Education attenderswith baseline HbA1>55 mmol HMF
Baseline ilbA 1
Follow-up HbA 1
52.4 (11.3)
52.6 (10.6)
64.5 ( 7.3)
59.7 (11.9)
Normal reference range for HbAI is 29.0 to 39.0 mmoi HMF.
Comparison of Pre- and Post-Education Health Beliefs, Perceived
Control, Psychological Well-being and Treatment Satisfaction
When the scores for the pre- and post-education psychological measures were
compared, it was noted that after education, patients perceived significantly more
Benefits of treatment (z = -2.52; p<O.05), fewer Barners to treatment
(z = -2.85; p<O.Ol), and overall, perceived their treatment to be significantly more
'Cost-effective' (t = -3.88; p .czO.001). These patients also perceived significantly
greater Personal Control/Self-efficacy (z = -2.48; p<0.O5) and Treatment
Satisfaction (z = -2.94; p<zO.01) after education. No other significant differences
were found between the pre-and post-education measures. The means and standard
deviations for all the measures are presented in Table 5.3.

0.930
0.810
0.202
0.384
0.262
0.687
0.384
0.702
0.783
1.000
0.013
0.947
0.411
0.052
0.178
0.219
0.062
143Table 5.3: Pre- and Post-education Health Beliefs, Personal Control/
Self-efficacy, psychological Well being,and TreatmentSatisfaction scores for patients who attended for education
Baseline Post Education p
N Mean (SD) Mean (SD) (2-tailed)
Perceived
Benefits 77 27.4 (3.2) 28.5 (2.1) 0.012
Barners 77 13.1 (8.3) 10.8 (6.4) 0.004
'Cost-effectiveness' 76 14.3 (9.5) 17.7 (7.0) 0.000
68
58
59
21
77
59
67
62
64
72
67
69
69
74
74
72
72
Perceived Severity
Complications
General Disorders
Diabetes (2 items)
Perceived Vulnerability
Complications
Complications (averaged)
General Disorders
'Complications arising from diabetes'(single item)
Perceived Vulnerability of the 'AveragePerson'
Complications
General Disorders
'Complications arising from diabetes'(single item)
Perceived
Personal Control/Self-efficacy
Medical Control
Situational Control
Psychological Well being
Depression
Anxiety
Positive Well being
General Well being
28.8 (3.1)
24.7 (4.6)
4.8 (1.9)
13.9 (6.1)
2.0 (0.9)
9.8 (63)
23 (1.1)
17.0 (5.9)
10.9 (6.7)
23 (1.1)
70.1 (14.5)
25.5 (12.1)
12.2 (11.1)
4.2 (2.7)
6.0 (3.9)
12.8 (3.9)
40.6 (9.1)
29.1 (2.8)
24.5 (5.0)
5.1 (1.9)
16.8 (4.8)
2.1 (0.8)
10.4 (6.0)
2.4 (1.1)
17.3 (5.1)
11.1 (6.0)
23 (1.0)
74.5 (11.6)
26.0 (13.6)
13.6 (10.2)
4.6 3.0)
63 (4.2)
12,5 (3.9)
39.6 (10.0)
Satisfaction with Treatment 76 29.1 (5.1) 30.8 (4.9) 0.003
Higher scores indicate more perceived Benefits and Barriers, and greater perceived treatment 'Cost-effectiveness',Severity, Vulnerability, Personal, Medical and Situational Control, Depression, Anxiety, Positive Well being,General Well being, and Treatment Satisfaction.

144
Pre- and Post-Education Knowledge Scores
When compared to pre-education scores, significant improvements in diabetes
knowledge scores (Table 5.4) for each of the sections and overall were noted after
education (General: z = -6.2, p<0.O01; Diet: z = -7.1, p<O.0O1; Complications: z =
-6.3, p<O.00l; Total Knowledge: z = -6.2; p<O.001). Given that some of the
patients who attended an education session already had a good knowledge of
diabetes with relatively little scope for improvement, a measure of knowledge
improvement was calculated which took into account pre-education scores. This
measure was computed by expressing the difference scores as a percentage of the
pre-education score. Scores for this variable (labelled percent Knowledge
Improvement) ranged from 0% to 231.6% with a mean (SD) of 39.4 % (43.5) and
a median of 25.4%. It was predicted that greater percent Knowledge Improvement
would be associated with favourable changes in the psychological variables and
better blood glucose control at follow-up. The pre- and post-education APSCORES,
the difference scores, and the percent Knowledge Improvement scores were
correlated with all the other psychological variables and the baseline and follow-up
demographic, clinical and biochemical variables. The results of these analyses are
presented in Table 5.5 and Table 5.6.
Table 5.4: Pie- and Post-Education Diabetes Knowledge Scores (Adjustedpercentage scores)
Pre-Education Post-Education
N Mean (SD) Mm Max Mean (SD) Mm Max
General 68 38.7 (23.6) -16.8 933 56.8 (20.8) -2,7 93.3
Diet 71 61.6 (21.1) 7.0 100.0 75.7 (18.2) 37.9 100.0
Complications 69 52.2 (19.1) -2.7 89.3 63.6 (19.8) 18.7 96.0
p(2-tailed)
0.000
0.000
0.000
Total Knowledge 68 60.6 (21.5) -63 100.0 72.8 (19.4) 5.0 100.0 0.000

145Table 5.5: Spearman Correlations (N) between Knowledge Scores and the
demographic, clinical, and biochemical variables
PercentPre-Education Post-Education APSCORE KnowledgeAPSCORE APSCOR E Difference Improvement
Baseline HbA1
Baseline percent idealbody weight
Baseline subjective estimatesof diabetes control
Follow-up ilbAl(approx 6 months after education)
Post-education subjectiveestimates of diabetes control
Age
Sex (1=Men, 2=Women)
Duration of diabetes
0.16 (70)
-0.05 (70)
-0.02 (70)
0.07 (50)
0,02 (67)
0.10 (70)
-0.05 (70)
-0.02 (70)
0.07 (76) 0.21* (68) 0.30** (67)
0.13 (76) 0.13 (68) 0.07 (67)
0.14 (76) 0.06 (68) -0.03 (67)
-0.01 (53) -0.15 (48) 0.27* (47)
0.18 (73) 0.15 (65) 0.08 (64)
-0.10 (76) -0.11 (68) -0.02 (67)
-0.01 (76) -0.10 (68) 0.05 (67)
0.05 (76) -0.03 (68) -0.08 (67)
** p<O.Ol * p<O.05
Higher scores indicate subjective estimates of poorer control
The results of conelations between the demographic, clinical, and biochemical
variables, and knowledge scores indicated that greater percent Knowledge
improvement was associated with lower levels of HbA 1 approximately six months
later (r = -0.27; p<O.05). However, there was an even stronger association between
percent Knowledge Improvement and baseline HbA 1 (r -0.30; p<0.01) suggesting
that education attenders with better blood glucose control were able to take greater
advantage of the education sessions than those with relatively poor blood glucose
control. Lower baseline HbA 1 was also associated with greater difference
APSCORES (r = -0.21; p<0.05).
The correlations between the knowledge scores and post-education health beliefs,
Perceived Control, Well-being, and Treatment Satisfaction measures indicated that

146
Table 5.6: Correlations (Spearman) between Kiiwledge Scores andPost-Education Health Beliefs, Perceived Control, Well Beingand Treatment Satisfaction.(Lower N determines N for correlation coefficient for each pair of variables)
PercentPre-Education Post-Education APSCORE KnowledgeAPSCORE APSCORE Difference Improvement
Perceived N 70 76 68 67
Bariiers 77 -0.11 0.01 0.21* 0.18
Benefits 77 0.15 -0.04 -0.13 0.22*
'Cost-effectiveness 76 0.15 0.00 O.22* O.24*
Perceived Severity
Complications 68 0.20 -0.01 0.02 0.06
GeneralDisonleis 58 0.21* -0.05 -0.14 -0.11
Diabetes (2 items) 59 0.08 -0.05 -0.10 -0.06
Perceived Vulnerability
Complications 21 -0.19 -0.08 -0.20 -0.11
Complications (averaged) 77 0.05 0.09 -0.04 -0.03
GeneralDisorders 59 -0.12 -0.10 -0.01 0.01
'Complications arising fromdiabetes' (single item) 67 0.03 -0.02 -0.15 -0.05
Perceived Vulnerability of the'Average Person'
Complications 62 0.14 0.21* 0.01 0.06
General Disonleis 64 -0.03 -0.01 0.02 0.06
'Complications arising fromdiabetes' (single item) 72 -0.03 -0.02 -0.06 0.04
Perceived
Personal ControllSeif-eflicacy 67 030** 0.13 -0.19 -0.15
Medical Control 69 0.32** 0.32** 0.07 0.08
Situational Control 69 0.25* ..033** 0.05 0.03
Peychological Well being
Depression 74 -0.08 0.22 0.19 0.13
Anxiety 74 -0.13 0.07 0.17 0.13
Positive Well being 72 0.03 0.26* 0.24* -0.18
General Wellbeing 72 0.10 -0.18 0.24* -0.17
Satisfaction with Treatment 76 0.04 0.19* _0.21* -0.17
Higher scores indicate more perceived Benefits and Barners, and greater perceived Treatment 'Cost-effectiveness',Severity, Vulnerability, Personal, Medical and Situational Control, Depression, Anxiety, Positive Well-being,General Well-being, and Treatment Satisfaction.
** p<O.Ol * p<0.05

147
greater pre-education APSCORES were associated with greater perceived Severity of
General Disorders (r = 0.21; p<0.05), greater perceived Personal
Control/Self-efficacy (r = 0.30; p<0.01), lower perceived Medical Control (r
-0.32; p<0.01), and lower perceived Situational Control (r = -0.25; p<0.05).
Greater post-education APSCORES were associated with lower perceived Medical
Control (r = -0.32; p<O.Ol), lower perceived Situational Control (r = -0.33;
p<O.01), greater Depression scores (r = 0.22; p<0.O5), lower Positive Well-being (
r = -0.26; p<0.05), and lower Treatment Satisfaction (r = -0.19; p<O.O5). The
correlations with the difference APSCORES indicated that greater increases were
associated with more perceived Barriers (r = 0.21; p<0.05), lower perceived
treatment 'Cost-effectiveness' (r = -0.22; p<O.O5), lower Positive Well-being (r =
-0.24; p<0.05), lower General Well-being (r = -0.24; p<O.O5), and lower Treatment
Satisfaction (r = -0.21; p<0.05). Greater percent Knowledge Improvement was
associated with fewer perceived Benefits ( r = -0.22; p<O.05) and lower perceived
treatment 'Cost-effectiveness' (r = -0.24; p<0.O5). Contrary to predictions, the
overall pattern of correlations between the psychological measures and knowledge
scores indicated that those who increased their knowledge about diabetes the most
were more negative about themselves and their diabetes management after education.
However, inspection of the results of correlations between knowledge scores and
baseline health beliefs, Perceived Control, Well- being, and Treatment Satisfaction
revealed a fairly similar, albeit weaker, pattern of associations (Table 5.7) indicating
that these patients' were predisposed to negative perceptions about themselves and
their diabetes management.

148
Table 5.7: Correlations (Spearman) between Knowledge Scores andPie-Education Health Beliefs, Perceived Control, Well Beingand Treatment Satisfaction.(Lower N determines N for correlation coefficient for each pair of variables)
PercentPre-Education Post-Education APSCORE KnowledgeAPSCORE APSCORE Difference Improvement
Perceived N 70 76 68 67
Barriers 77 -0.03 -0.02 0.00 0.02
Benefits 77 0.19 0.07 M.24* 0.28*
'Cost-effectiveness' 77 0.10 0.01 -0.11 0.09
Perceived Severity
Complications 68 0.12 -0.01 0.02 0.00
General Disorders 58 0.23 0.05 0.07 0.04
Diabetes (2 items) 59 0.12 0.01 -0.15 -0.13
Perceived Vulnerability
Complications 21 M.07 -0.12 0.02 -0.19
Complications(averaged) 77 0.08 0.00 -0.05 -0.12
General Disorders 59 -0.07 -0.03 -0.12 0.02
'Complications arising fromdiabetes'(singleitem) 67 0.12 0.08 -0.09 -0.18
Perceived Vulnerability of the'Average Person'
Complications 62 0.09 -0.02 -0.11 -0.12
General Disorders 64 -0.02 -0.09 -0.12 0.06
'Complications arising fromdiabetes' (single item) 72 0.09 -0.02 -0.11 0.02
Perceived
Personal ControllSelf-eflicacy 67 0.04 -0.01 -0.13 -0.11
Medical Control 69 -0.23 -0.07 0.13 0.12
Situational Control 69 0.10 -0.00 -0.13 -0.21
Psychological Well being
Depression 74 -0.06 0.03 0.13 0.11
Anxiety 74 -0.04 0.18 0.20 0.18
Positive Well being 72 0.05 0.23* 0.23* -0.18
General Well being 72 0.08 -0.16 -0.22 -0.18
Satisfaction with Treatment 76 -0.04 -0.09 -0.01 -0.09
Higher scores indicate more perceived Benefits and Barriers, and greater perceived Treatment 'Cost-eflèctiveness',Severity, Vulnerability, Personal, Medical and Situational Control, Depression, Anxiety, Positive Well-being,General Well-being, and Treatment Satisfaction.
** p<0.0l*

149
Relationships between the Post-education Psychological Measures and
the Demographic, Clinical, Biochemical, and Psychological Variables.
The post-education psychological variables were correlated with the demographic,
clinical, biochemical, and psychological outcome variables (Table 5.8)
in order to assess further the construct validity of the scales in the light of the
educational intervention.
HbA1 approximately six months after education:
Lower HbA 1 levels were significantly associated with more perceived Benefits of
treatment following education (r = -0.30; p<O.Ol) and greater perceived Personal
Control/Self-efficacy (r = -0.38; p<0.01). The correlation between perceived
Vulnerability to Complications (single item) and follow-up HbA 1 did not reach
significance (r = 0.22; p=0.07) but the direction of the relationship was the same as
that found with the baseline data.
Po.rI-ediecatica sthjective es(imates of diabetes control:
More optimistic subjective estimates of control were significantly associated with
lower perceived Vulnerability to Complications (r = 0.19; p<zO.O5), and greater
perceived Personal Control/Self-efficacy (r = -0.30; p<O.01).
Baseline percent ideal body weight :
Better weight control was significantly associated with fewer perceived Barriers to
treatment (r = 0.22; p<O.OS), greater perceived treatment 'Cost-effectiveness' (r =
-0.22; p<O.OS), greater perceived Severity of Diabetes (r = 0.23; p<zO.O5) and
greater perceived Personal Control/Self-efficacy (r = -0.29; p<O.Ol).
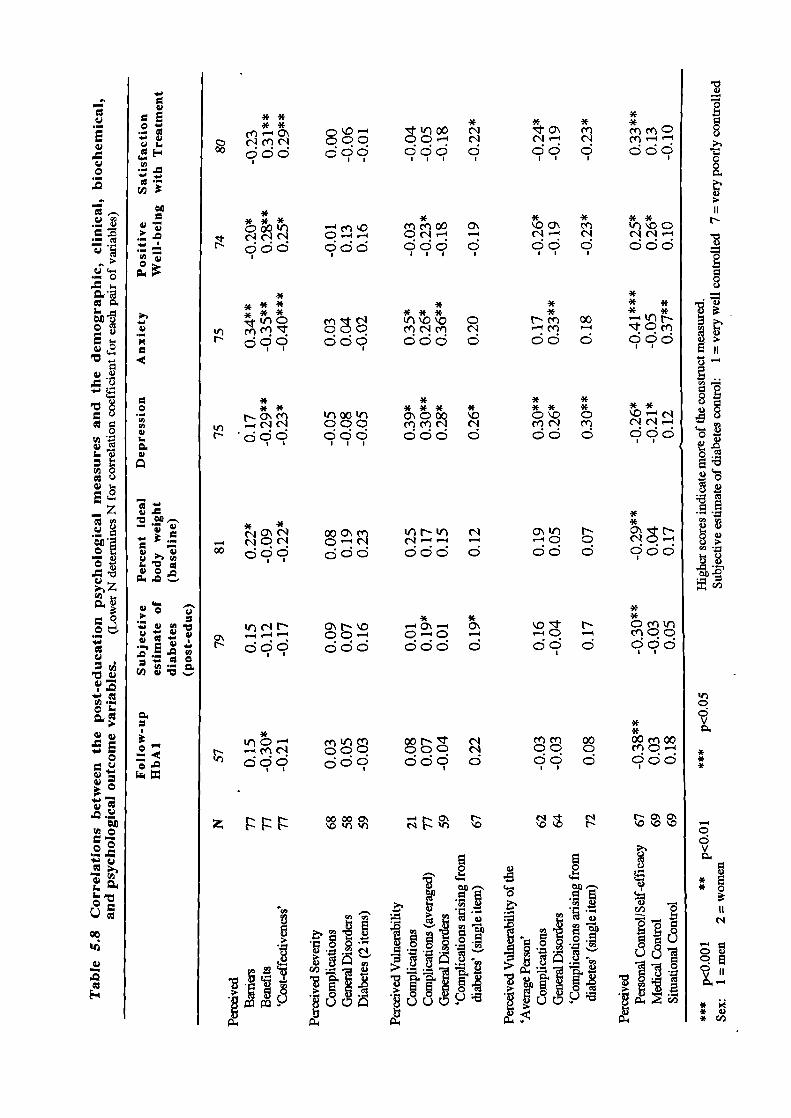
.
D4
Q.
0
V
.
0
— -
-—
.0
lI_ _•
Cd
Cd
.- 0.'I) '0
0.
Cd
E
Cd0.0
0
—z
0- V
Cd
1
Cd
0.
0
V
Cd
-
Ire
V.0
* *fO mc- c'1
do dI I I
*
*
mmCdd9
* * **
OO\ Cfl
dod doe
I I I
** * ** * *Nm 00-m d
* *** * **O\O omc' cndc d oc
**
N Q'N-0 0dd d dd
**N— — no0d çc
mm 00qc. c
**00 moo
8
t
N
8
Ua
L
U"5
II
U
0dV0.
***
HEa
* 0
C"
0
.II
*.* V* (/D
**
I *f'foo
I c, C1Crj ccl 001 00 qdd d
* *oo0 CflCflOO C\¶1• ç'lç'IC"I O-i.-i OC' -N odd ddd d
I I I I
**
C'r mmr 0 0 mc-Icn C'1r d cdq ddd d
* *
** *** *
N o m 00 ' 000 \O
..-ic' qqq mm ciN •ci;9
* * ooOm VNV ('I- C.-c' (.-4.—I -00 cod o
* *c'i N O\ N 'O — O\ — O\C' 0C- Q-C. -.N dfc dde coo o
N' dc9 d09 Co 0
z 0000C' -'NC N C'1 ('1N 'fl 'fl • 'fl 'D "0 N "00"0
E
b0' '-_ .fl
__
(/D 0
i JI* jII1I: Jj:!IIf

151
Well-being and Treatment Satisfaction:
Lower Depression scores were significantly associated with more perceived Benefits
of treatment ( r = -0.29; p<O.Ol), greater perceived treatment 'Cost-effectiveness' (r
= -0.23; p43.0S), lower perceived personal Vulnerability to Complications [r =
0.30, p.<0.O1; r = 0.26; p<O.O5 (single item)], lower perceived personal
Vulnerability to General Disorders (r = 0.28; p<zO.05), lower perceived Vulnerability
of the 'average person' to Complications (r = 0.30, p<O.Ol) and General Disorders
(r = 0.27, p<O.O5), and greater perceived medical control (r = - 0.21; p<zO.05).
Lower Anxiety scores were significantly associated with fewer perceived Baniers to
treatment (r = 0.32; p<O.Ol), more perceived Benefits of treatment (r = -0.35;
p<0.01), greater perceived treatment 'Cost-effectiveness' (r = -0.40; p<O.001),
lower perceived personal Vulnerability to Complications [r = 0.26, p<0.05; r =
0.20, p43.05 (single item)], lower perceived Vulnerability to General Disorders (r =
0.36; p<0.01), lower perceived Vulnerability of the 'average person' to General
Disorders (r = 0.33; p<0.01), greater perceived Personal Control/Self-efficacy (r =
-0.41; p<O.001), and lower perceived Situational Control (r = 0.37; p<zO.01).
Greater Positive Well-being scores were significantly associated with fewer
perceived Barriers to treatment (r = -0.20; p<zO.05), more perceived Benefits of
Treatment (r = 0.28; p43.01), greater perceived treatment 'Cost-effectiveness' (r =
0.25; p<zO.05), lower perceived personal Vulnerability to Complications (r = -0.23;
p43.05), lower perceived Vulnerability of the 'average person' to Complications [r
= -0.26, p43.05; r = -0.23, p43.05 (single item)], greater perceived Personal
Control/Self-efficacy (r = 0.25; p<zO.O5), and again, contrary to expectations, greater
perceived Medical Control (r = 0.26; p43.05).
Greater Treatment Satisfaction was significantly related to fewer perceived Barriers
(r = -0.23; p43.05), more perceived Benefits (r = 0.31; p<O.Ol), greater perceived

152
treatment 'Cost-effectiveness' (r = 0.29; p<0.01), lower perceived personal
Vulnerability to Complications (r = -0.22; p<0.05), lower perceived Vulnerability of
the 'average person' to Complications [r = -0.24, p<0.05; r = -0.23, p<0.05 (single
item)], and greater perceived Personal Control/Self-efficacy
(r = 0.33; p<O.Ol).
Patients whose blood glucose control improved compared with those
whose blood glucose control deteriorated.
In order to assess the impact of the education on beliefs, attitudes, and knowledge
in relation to changes in blood glucose control at follow-up, the patients were
divided according to whether HbA 1 approximately six months later was better
(N=20) or worse (N=25) than at baseline. (Twelve of the subjects for whom
follow-up I-thA 1 data were obtained did not show improvement or deterioration in
glycaemic control.) These groups were then assessed for differences in
post-education beliefs, attitudes, knowledge and demographic and clinical
characteristics. The results indicated that those who improved their blood glucose
control later felt significantly less Vulnerable to Complications (single item) after
education (z = -1.9; p<O.OS), but estimated their diabetes control after education to
be worse (z = -1.9; p<O.OS) when compared to those whose blood glucose control
did not improve or deteriorated. There was also a significant tendency for women
rather than men to improve their blood glucose control after education (z = -2.2;
p<0.05). No other significant differences were found between the groups. In view
of the sex difference reported above, further similar analyses were conducted in
order to assess whether there were differences in beliefs, attitudes, or demographic
and clinical characteristics for men and women separately. These analyses revealed
that the women who improved their blood glucose control after education perceived
their treatment to be significantly more 'Cost-effective' (post education) than their

153
counterparts (z = -3.2; p<0.01). On the other hand, the men who improved their
blood glucose control estimated their diabetes control after education to be
significantly worse than their counterparts (z = -2.0; p<0.05). No other within-sex
differences were noted.
Reassessment of the multiplicative HBM model: Post-education
beliefs
The procedure used with the baseline data (Chapter 4) was repeated. The
individual variables were entered on the first step of the regression analyses and the
interactions were entered in a hierarchical fashion on the second and subsequent
steps. As before, the interactions were calculated from the z scores of the
component variables. The HBM variables included in the regression analyses were
the same as those used for the baseline analyses because, once again, these variables
proved to be the most sensitive in correlations with the health outcome measure (see
Table 5.8). No attempt was made to include a measure of Optimistic Bias as the
respondents' ratings for the single item Vulnerability to Complications measures
(personal Vulnerability versus the 'average person's' Vulnerability) were not
significantly different. However, they did rate themselves to be signficantly less
vulnerable than the 'average person' to the individual complications (z = -2.16;
p<zO.OS). The results of correlations between the component and composite variables
and their relationship to the follow-up measure of HbA 1 are provided in Table 5.9.
The pattern of correlations indicated that none of the variables were multicollinear.
Interestingly, the direction of correlations between the variables indicated that on the
one hand, perceived treatment 'Cost-effectiveness' was associated with greater
perceived Threat (Severity x Vulnerability), but on the other hand, it was associated
with lower perceived Severity and Vulnerability. (Similar correlations at baseline
indicated that greater perceived treatment 'Cost-effectiveness' was associated with

154
Table 5.9: Intercorrelations between the individual and compositepost-education HBM variables and their relationship to HbA1approximately six months later. (N = 44)
1 2 3 4 5 6 7 8
1. Treatment 'Cost-effectiveness' 1.0
2. Vulnerability to Complications -0.21 1.0
3. SeverityofDiabetes -0.16 0.14 1.0
d . Petsonal Control)SeIf -efficacy 0.34 0.07 0.08 1.0
5. Severity x Vulnerability 0.20 -0.09 0.10 0.23 1.0
6. Severity x Vulnerability xTreatment Cost-effectiveness' 0.05 -0.10 -0.20 0.02 -0.05 1.0
7. Severity x Vulnerability xTreatment 'Cost-effectiveness' xPersonal Contml)Self-efficacy 0.39 0.23 -0.09 0.19 0.29 0.53 1.0
8. Follow-up HbA1 -0.28 0.23 0.10 -0.33 0.11 -0.11 0.08 1.0
Higher scores indicate greater perceived treatment Cost-effectiveness', Severity, Vulnerability, and Personal Control!Self-efficacy.
lower scores for all three of these variables.) Given that the number of subjects who
attended for education and provided data for the present study was small, the
regression analyses reported in the present chapter should be interpreted with
caution.
I .Prediction of follow-up HbA1 from the original and
newly-introduced HBM components and their interactions:
On the first step, perceived Severity of Diabetes, perceived Vulnerability to
Complications, perceived treatment 'Cost-effectiveness', and perceived Personal
Control/Self-efficacy were entered. The first multiplicative composite of Severity x
Vulnerability was entered on the second step, the multiplicative composite of
Severity x Vulnerability x treatment 'Cost-effectiveness' was entered on the third

155
step, and the multiplicative composite of Severity x Vulnerability x treatment
'Cost-effectiveness' x Personal Control/Self-efficacy was entered on the final step.
The results of this regression analysis are summarised in Table 5.10. It can be seen
that when all the individidual and composite variables were entered, a total of 35%
(22% adjusted) of the variance in follow-up HbA 1 was explained. Perceived
Petsoal Control/Self -efficacy and the multiplicative composite of Severity x
Vulnerability x treatment 'Cost-effectiveness' x Personal Control/Self-efficacy
accounted for significant amounts of unique variance [11% (p.<0.OS) and 10%
(pcz0.05) respectively]. On the final step of the analysis, the R2 increased by 0.10
(p<O.O5) indicating that an interaction between perceived Severity of Diabetes,
perceived Vulnerability to Complications, perceived treatment 'Cost-effectiveness',
and perceived Personal Control/Self-efficacy significantly improved the prediction of
follow-up HbA1.
2 .Inclusion of post-education General Well-being in the regression
equation.
As indicated earlier (Table 5.8), post-education Well-being was significantly
associated with perceptions about Vulnerability, perceived treatment
'Cost-effectiveness' and perceived Control yet the association between General Well
-being and follow-up HbA1 was relatively weak and not statistically significant (r =
0.07). In view of the pattern of these associations which suggested that General
Well-being might act as a suppressor variable, a second regression analysis was
conducted in which General Well-being entered the equation on the first step, the
individual HBM variables were entered on the second step, and the multiplicative
composites were entered on the third and subsequent steps. The results of this
analysis are summarized in Table 5.11. It can be seen that when the variance

B B
-0.513 -0.28
0.075 0.01
2.778 0.28
-0.367 -0.36
1.510 0.13
sr2 a
0.06
0.00
0.07
0.11*
0.01
-3.844 -0.29
0.05
156
Table 5.10:
Prediction of follow-up HbA 1 from the original and newly-introducedHBM components and their interactions (N=44). -- -
Treatment 'Cost-effectiveness'
Severity of Diabetes
Vulnerability to Complications
Personal Control/Self-efficacy
Severity x Vulnerability
Severity x Vulnerability xTreatment 'Cost-effectiveness'
Severity x Vulnerability xTreatment 'Cost-effectiveness' xPersonal Control/Self-efficacy 5.895 0.45 0.10*
Statistics for each step in the Regression Analysis:
Step R R 2 Adj R2R2 F
Personal Control/Self-efficacy
Vulnerability to Complications
Severity of Diabetes
Treatment 'Cost-effectiveness'
Severity x Vulnerability
Severity x Vulnerability xTreatment 'Cost-effectiveness'
Seventy x Vulnerability xTreatment 'Cost-effectiveness' xPersonal Control/Sell-efficacy
1 0.44 0.19 0.11 0.19 2.30
2 0.49 0.24 0.14 0.05 2.42
3 0.49 0.24 0.12 0.00 2.00
4 0.59 035 0.22 0.10* 2.72*
a sr2 = squared semipartial correlation using Type ifi sums of squares to indicate the uniquevariance accounted for by the variable.
* p<0.05

157
Table 5.11:
General Well-being added to the regression equation. (N = 44)
B B sr2a
General Well-being 0.391 0.35 0.06
Treatment 'Cost-effectiveness' -0.481 -0.26 0.05
Severity of Diabetes 0.747 0.12 0.01
Vulnerability to Complications 4.584 0.45 0. 16
Personal Control/Self-efficacy -0.602 -0.55 0.16
Severity x Vulnerability 6.295 0.47 0.12*
Severity x Vulnerability xTreatment 'Cost-effectiveness' -3.482 -0.20 0.03
Severity x Vulnerability xTreatment 'Cost-effectivertess' xPersonal Control/Self-efficacy -0.049 -0.00 0.00
Statistics for each step in the Regression Analysis:
General Well-being
Personal Control/Self-efficacy
Vulnerability to Complications
Severity of Diabetes
Treatment 'Cost-effectiveness'
Seventy x Vulnerability
Severity x Vulnerability xTreatment 'Cost-effectiveness'
Severity x Vulnerability xTreatment 'Cost-effectiveness' xPersonal Control/Self-efficacy
Step R R 2 Adj R2 1 R F
1 0.10 0.01 -0.02 0.01 0.43
2 0.49 0.24 0.12 0.23 2.04
3 0.66 0.43 033 0.19** 4Ø7**
4 0.69 0.47 035 0.03 3•94**
5 0.69 0.47 033 0.00 3.33**
a Sr2 squared semipartial correlation using Type ifi sums of squares to indicate the uniquevariance accounted for by the variable.
* p<0.05 ** p<O.Ol

158
associated with General Well-being was partialled out on the first step, the prediction
of follow-up HbA 1 from the HBM variables substantially improved. When all the
variables had been entered into the equation a total of 47% (33% adjusted) of the
variance in HbA 1 was explained. Perceived Vulnerability to Complications,
perceived Personal Control/Self-efficacy, and the multiplicative composite of
Severity x Vulnerability all contributed unique amounts of explained variance [16%
(p<0.01); 16% (p<O.Ol); and 12% (pczO.02) respectively]. When the multiplicative
composite of Severity x Vulnerability was entered on the third step, the R 2 increased
by 0.19 (p<0.01) indicating that there is a significant multiplicative relationship
between perceived Severity of Diabetes and perceived Vulnerability to
Complications. None of the other multiplicative composites significantly increased
the overall amount of variance explained.
3. Inclusion of Health Value in the regression equation.
Although the single-item measure of health value did not contribute to the
prediction of baseline HbA 1, this may have been due to the fact that the outcome
measure was not recorded prospectively. Given that the measure of HbA 1 in the
present study was collected approximately six months after the psychological
measures, a further regression analysis was conducted in which post-education
Health Value was entered on the first step together with General Well-being. As
before, the individual I-IBM variables were entered on the second step, and the
multiplicative composites were entered on the third and subsequent steps. The
results of this analysis indicated that, once again, the post-education measure of
Health Value did not contribute a significant amount of unique variance in the
prediction of follow-up HbA 1 (sr2 = .00; p>0.O5). Furthermore, this measure did
not appear to act as a suppressor variable because the amount of variance explained

159
by the individual and composite FIBM variables did not increase; on the final step
48% (31%) of the variance in follow-up HbA1 was explained. The multiplicative
composite of Severity x Vulnerability remained a significant contributor to the
overall explanation (i\R2 = 0.20; Sr2 = 0.13, p<O.O5). As in the previous analysis,
perceived Vulnerability to Complications and perceived Personal
Control/Self-efficacy also contributed significant amounts of unique variance (sr2=
0.17, p<O.Ol; sr2 = 0.16, p<0.01 respectively).
4. Introduction of 'Percent Knowledge Improvement' into the
regression equation.
As mentioned earlier (Table 5.5), Percent Knowledge Improvement was
significantly associated with follow-up HbA 1. A further regression analysis was
conducted, therefore, in which the variance associated with Percent Knowledge
Improvement was partialled out prior to entering the individual and I-IBM variables.
General Well-being was entered on the first step, Percent Knowledge Improvement
was entered on the second step, the individual HBM variables were introduced on
the third step, and the multiplicative composites were introduced on the fourth and
subsequent steps. The results of this analysis are summarized in Table 5.12. A total
of 57% (41% adjusted) of the variance in follow-up HbA 1 was explained when all
of the variables had been entered. Percent Knowledge Improvement, perceived
Vulnerability to Complications, perceived Personal Control/Self-efficacy, and the
multiplicative composite of Seventy x Vulnerability all contributed significant
amounts of unique variance [9% (p<0.O5); 16% (p<O.Ol); 18% (p<O.0l); and 8%
(p<O.O5) respectivelyl. As before, the multiplicative composite of Severity x
Vulnerability significantly increased the R2, although the increase was slightly less
than previously when Percent Knowledge Improvement was not included in the

B B
0.442 0.39
-0.019 -0.33
-0.436 -0.22
1.386 0.21
4.780 0.45
-0.645 -0.58
5.122 0.38
s,2 a
0.07
0.09*
0.03
0.04
0.16**
0.18**
0.08*
160
Table 5.12:
Inclusion of Percent Knowledge Improvement in the regressionequation. (N = 44)
General Well-being
Percent Knowledge Improvement
Treatment 'Cost-effectiveness'
Severity of Diabetes
Vulnerability to Complications
Personal Control/Self-efficacy
Seventy x Vulnerability
Severity x Vulnerability xTreatment 'Cost-effectiveness'
Severity x Vulnerbility xTreatment 'Cost-effectiveness' xPersonal Control/Self-efficacy
-3.861 -0.23 0.04
-0.082 -0.00 0.00
Statistics for each step in the Regression Analysis:
Step R R 2 Adj R2
F
General Well-being 1 0.13 0.02 -0.01
0.02
0.53
Percent Knowledge Improvement 2 0.29 0.08 0.03
0.07
1.45
Personal Control/Self-efficacy
Vulnerability to Complications
Severity of Diabetes
Treatment 'Cost-effectiveness'
Severity x Vulnerability
Severity x Vulnerability xTreatment 'Cost-effectiveness'
Severity x Vulnerability xTreatment 'Cost-effectiveness' xPersonal Control/Sell-efficacy
3 0.63 0.40 0.26 0.3 1* 2.96*
4 0.72 0.52 0.39 0.12* 4Ø5**
5 0.75 0.57 0.43 0.05 4.13**
6 0.75 0.57 0.41 0.00 3•53**
a Sr2 = squared semipartial correlation using Type III sums of squares to indicate the uniquevariance accounted for by the variable.
* pczO.05 ** p<O.Ol

161
equation. When compared to the previous analysis, the proportions of variance
explained by the HBM variables and General Well-being did not change very much
so it appears that the increase in total variance explained for this analysis was due to
the inclusion of Percent Knowledge Improvement in the regression equation.
5. Exclusion of respondents who took part in the insulin study.
As discussed earlier (see Methods section), eight of the participants in the present
study were approached for inclusion in the insulin study (Chapter 6) after they had
taken part in the education intervention study. Given that these patients were
subsequently classed as 'borderline poorly-controlled' because their tablet and diet
treatment was inadequate, it could be argued that they were members of a different
diabetic population. Indeed, when the insulin study participants were compared
with the remainder of the education attenders, they had significantly greater HbA1
both at baseline (z = -2.1; p<zO.05) and follow-up (z = -2.2; p<O.05), they tended to
perceived themselves as more Vulnerable to Complications (z = -1.9; p<zO.06), they
were significantly less Satisfied with Treatment (z = -2.2; p<zO.O5), and their
subjective estimates of diabetes control tended to be more pessimistic (z = -1.9;
p<O.O6). A further regression analysis was conducted, therefore, which excluded
the data from these patients. As before, General Well-being was entered on the first
step, Percent Knowledge Improvement was entered on the second step, the
individual HBM variables were entered on the third step, and the multiplicative
composites were entered on the fourth and subsequent steps. The results from this
analysis are summarized in Table 5.13. It can be seen that much of the variance in
follow-up HbA 1 previously accounted for by perceived Vulnerability to
Complications and the multiplicative composite of Severity x Vulnerability
disappeared when the data from the insulin study participants were excluded. An
increased amount of unique variance was accounted for by Percent Knowledge

162
Table 5.13:Exclusion of the eight insulin study participants (N=36)
B B sr2a
General Well-being
Percent Knowledge Improvement
Treatment 'Cost-effectiveness'
Severity of Diabetes
Vulnerability to Complications
Personal Control/Self-efficacy
Seventy x Vulnerability
Severity x Vulnerability xTreatment 'Cost-effectiveness'
Severity x Vulnerbility xTreatment 'Cost-effectiveness' xPersonal Control/Self-efficacy
0.356
0.29
0.04
-0.018 -0.39 0.13*
-0.353 -0.20
0.02
1.026
0.17
0.02
2.722
0.28
0.05
-0.565 -0.56 0.18*
2.257
0.18
0.01
-5.379 -0.32 0.03
5.097 0.28 0.02
Statistics for each step in the Regression Analysis:
Step R R 2 Adj R2 A R2 F
General Well-being 1 0.15 0.02 -0.02 0.02 0.58
PercentKnowledgelmpmvement 2 037 0.13 0.06 0.11 1.93
Personal Control/Self-efficacy
Vulnerability to Complications
Severity of Diabetes
Treatment 'Cost-effectiveness'
3 0.63 039 0.22 0.26 2.25
Severity x Vulnerability 4 0.67 0.45 0.26 0.06 233
Severity x Vulnerability xTreatment 'Cost-effectiveness' S 0.68 0.46 0.23 0.01 2.03
Severity x Vulnerability xTrealment 'Cost-effectiveness' xPersonal Control/Self-efficacy 6 0.69 0.48 0.21 0.01 1.82
a Sr2 = squared semipartial correlation using Type III sums of squares to indicate the uniquevariance accounted for by the variable.
* p<0.05
NB When Percent Knowledge Improvement was omitted from the analysis, Severity xVulnerability became a significant predictor of outcome and increased R 2 significantly onentry to the equation.

163
Improvement (sr2 = 0.13; p<O.O5), and as before, perceived Personal
Control/Self-efficacy (sr2 = 0.18; p<0.05) accounted for a further significant amount
of unique variance. A total of 48% (21% adjusted) of the variance in follow-up
HbA 1 was explained when all the variables had been entered into the regression
equation. Perceived Vulnerability and the multiplicative composite of Severity x
Vulnerability no longer contributed significant amounts of variance to the overall
explanation. In a separate analysis, Percent Knowledge Improvement was not
included in the regression equation which resulted in a total of 34% (12% adjusted)
of explained variance in follow-up HbA1. Furthermore, R2 was increased
significantly when the multiplicative composite of Severity x Vulnerability was
entered into the equation (p<0.05). Only perceived Personal Control/Self-efficacy
contributed a significant amount of unique variance when all the variables had been
entered (sr2 = 0.14; p<zO.OS). However, prior to entering the multiplicative
composite of Severity x Vulnerability x treatment 'Cost-effectiveness' x Personal
Control/Self-efficacy, the composite of Severity x Vulnerability also contributed a
unique amount of variance to the explanation (sr 2 = 0.14; p<0.05). The unique
variance contributed by Perceived Vulnerability to Complications did not quite reach
significance ( sr2 = 0.11; p<0.06).
Education attenders' baseline beliefs used to predict baseline health
outcome measures.
It was noted earlier (see Subjects and Procedure) that those attending for education
had experienced their diabetes for significantly fewer years than non-attenders. It
could be argued, therefore, that the relatively large amount of variance in follow-up
MbA 1 explained by the I-IBM variables was due to a differential pattern of beliefs
associated with duration of diabetes. The baseline beliefs of the education attenders

164
alone were therefore re-assessed in regression analyses in order to ascertain whether
predictions of baseline HbA 1 , percent ideal body weight, and subjective estimates of
control were improved. The results of these analyses indicated that when only the
data from education attenders were assessed outcome predictions were generally
improved relative to the whole sample [Baseline HbA 1: R2 = 0.16 (-0.006
adjusted); Percent ideal body weight: R2 = 0.28 (0.14 adjusted); Subjective
estimates of diabetes control: R2 = 0.31(0.18 adjusted). However, the amounts of
variance explained in baseline outcomes were still substantially less than the amount
of variance explained in follow-up HbA 1. Furthermore, none of the multiplicative
composites added significantly to the explained variance when entered into the
regression equation.
Further regression analyses were carried out in which General Well-being was
entered on the first step, and Pre-education APSCORES (Knowledge scores)were
entered on the second step. Given that knowledge about complications was poor at
baseline and certain unpredicted patterns of baseline beliefs were associated with
Well-being, it was hypothesized that these variables might act as suppressor
variables and improve the prediction of the baseline health outcomes from health
beliefs. As before, the individual HBM variables were entered on the third step, and
the multiplicative composites were entered on the fourth and subsequent steps. The
results of these analyses indicated some improvement in the prediction of percent
ideal body weight, but little or no improvement in the prediction of baseline HbA1
and subjective estimates of diabetes control [Baseline HbA 1: R2 = 0.18 (-0.06
adjusted); Percent ideal body weight: R2 = 036(0.17 adjusted); Subjective
estimates of diabetes control: R2 = 0.38 (0.19 adjusted)]. Once again, the amounts
of variance explained in baseline outcomes were still substantially less than the
amount of variance explained in follow-up HbA 1. Furthermore, the multiplicative
composites did not add significantly to the overall amounts of variance explained

165
when introduced to the regression equations.
Prediction of improvements in follow-up HbA 1 from the HBM
variables.
In order to investigate which HBM variables were associated with improvements
in blood glucose control after education, General Well-being, all the individual HBM
variables and the multiplicative composite of Severity x Vulnerability were entered
into a hierarchical multiple regression analysis. Because some of the patients already
had relatively good control and were unlikely to improve I-IbA 1 only those patients
with an HbA 1 greater than 45 mmol HMF were included in the analysis. The
multiplicative composites of Severity x Vulnerability x Treatment
'Cost-effectiveness', and Severity x Vulnerability x Treatment 'Cost-effectiveness'
x Personal Control/Self-efficacy were not included because there were only 28 cases
(20 women, 8 men) analysed. Tabachnick and Fidell (1989) state that a bare
minimum of 5 times more cases than independent variables should be used. Given
that the present analysis included 6 independent variables (including the
multiplicative composite of Severity x Vulnerability) the number of cases analysed
was 2 less than the bare minimum recommended. The results should therefore be
interpreted with extreme caution. Improvements in blood glucose control were
calculated by subtracting baseline HbA 1 from follow-up HbA 1. Higher scores were
therefore equivalent to greater improvements at follow-up. General Well-being was
entered on the first step, the individual HBM variables were entered on the second
step, and the multiplicative composite of Severity x Vulnerability was entered on the
final step. It was predicted that improvements in HbA 1 would be associated with
greater perceived treatment 'Cost-effectiveness', greater perceived Severity of

166
Diabetes, greater perceived Vulnerability to Complications, and greater perceived
Personal Control/Self-efficacy. The results of this analysis are summarized in Table
5.14 which shows that a total of 42% (26% adjusted) of the variance in HbA1
Table 5.14:
Prediction of HbA 1 improvement from the HBM variables (N = 28)
General Well-being
Treatment 'Cost-effectiveness'
Severity of Diabetes
Vulnerability to Complications
Personal Control/Self-efficacy
Severity x Vulnerability
B B
-0.340 -0.34
0.309 0.17
-0.091 -0.02
-4.477 -0.49
0.502 0.46
-5.932 -0.51
a
0.06
0.02
0.00
0.22**
0.08
0.21*
Statistics for each step in the Regression Analysis:
Step R R 2 Adj R2 AR2 F
General Well-being 1 0.05 0.00 -0.04
0.00 0.06
Personal Control/Sell-efficacy
Vulnerability to Complications
Severity of Diabetes
Treatment 'Cost-effectiveness'
Severity x Vulnerability
2 0.46 0.22 0.04 0.21 1.22
3 0.65 0.43 0.26 0.21* 2.61*
a Sr2 = squared semipartial correlation using Type ifi sums of squares to indicate the uniquevariance accounted for by the variable.
* p<0.05 ** p<O.Ol

167
improvement was explained when all the variables had been entered. Only perceived
Vulnerability to Complications and the multiplicative composite of Severity x
Vulnerability contributed significant amounts of unique variance to the overall
explanation [sr2 = 0.22 (p<0.01); sr2 = 0.21 (p.cz0.02) respectively]. When the
multiplicative composite of Severity x Vulnerability was entered on the final step, the
R2 increased significantly (A R2 = 0.21; p<O.02). Contrary to predictions the
unstandardized regression coefficients (B) indicated that greater improvements in
blood glucose control were associated with lower perceived Vulnerability to
Complications and lower perceived Threat (Severity x Vulnerability).
Categorizing and combining the HBM variables. (The non-linear
hypothesis re-examined.)
Although fairly large amounts of variance in follow-up HbA 1were explained by the
individual and composite post-education HBM vanables, non-linear combinations of
the variables were assessed for comparison with the baseline results. As in the
previous study, data relating to each HBM variable were split at the median to
produce high and low categories which were then combined to form belief patterns.
(1) Two-way interaction: Perceived Severity of Diabetes and
Vulnerability to Complications.
The Kruskal-Wallis test indicated that follow-up HbA 1 was not significantly
different for any of the four belief patterns (chi-square = 7.6; p=O.O6). Moreover,
when the data from the insulin study participants were excluded, the results were
also non-significant (chi-square = 5.6; p = 0.13).

168
(2) Three-way interaction: Perceived Severity, Vulnerability and
Treatment 'Cost-effectiveness'.
The Kruskal-Wallis test indicated that there was no significant difference in
follow-up HbA 1 for any of the eight belief patterns (chi-square = 12.3; p 0.09).
Furthermore, when the data for the insulin study participants were excluded, a
non-significant result was also obtained (chi-square = 9.9; p = 0.19).
(3) Three- way interaction: Perceived treatinent 'Cost-effectiveness',
Threat (Severity x Vulnerability), and Personal Control
ISeIf-efficacy.
This analysis indicated that follow-up HbA 1 did not differ significantly for any of
the eight belief patterns (chi-square 11.2; p = 0.08). Furthermore, when the
insulin study participants were excluded, the result did not quite reach significance
(chi-square = 12.4; p = 0.052). None of the subjects had a belief pattern of low
perceived treatment 'Cost-effectiveness', low perceived Threat, and high perceived
Personal Control/Self-efficacy. (At baseline, this group had the best mean HbA1.)
It was predicted that when the patterns of beliefs were ranked in relation to mean
follow-up HbA 1 (Table 5.15), the belief pattern associated with the best blood
glucose control approximately six months after education would be high perceived
treatment 'Cost-effectiveness', high or low perceived Threat (depending upon
whether blood glucose control was improving or deteriorating), and high perceived
Personal Control/Self-efficacy (in the table: I-ugh/Low/I-ugh or I-lighlHighlHigh).
On the other hand, the belief pattern predicted to be associated with the poorest
blood glucose control was low perceived treatment 'Cost-effectiveness', low or high

169
Table 5.15: Patterns of perceived treatment 'Cost-effectiveness', Threat,and Personal Control/Self-efficacy in relation to follow-up HbA1
Including insulin study
participants
N 'Cost- Thrnat Personal Mean 1N
effective
Control! follow-up
ness'
Self-efficacy HbA I
Excluding insulin study
participants
'Cost- Threat Personal Mean
effective Control! follow-up
ness Self-efficacy HbA 1
44.5
46.5
51.3
53.7
57.3
60.2
63.0
44.5
45.2
51.5
52.6
57.3
60.3
63.0
2 Low High High
10 High Low High
3 Low High Low
7 High High High
6 High Low Low
5 high High Low
2 Low Low Low
2 Low High High
9 High Low Fligh
2 Low High Low
5 High High High
6 High Low Low
4 High High Low
2 Low '' Low Low
Patterns of beliefs predicted to b e Patterns of beliefs predicted to b eassociated with the best diabetes associated with the poorest diabet escontrol after education - control after education
perceived Threat, and low perceived Personal Control/Self-efficacy (in the table:
Low/Low/Low or Low/High/Low). It can be seen from Table 5.15 that the
predictions were largely correct in that those with a belief pattern of high perceived
treatment 'Cost-effectiveness', low perceived Threat, and high perceived Personal
Control/Self-efficacy were among the best controlled patients approximately six
months after education while those with a belief pattern of low perceived treatment
'Cost-effectiveness', low perceived Threat, and low perceived Personal
Control/Self-efficacy had the poorest blood glucose control six months later.
Contrary to predictions, those with a belief pattern of low perceived treatment
'Cost-effectiveness', high perceived Threat, and low perceived Personal
Control/Self-efficacy (in the table: Low/High/Low) had better blood glucose control
than many of the other patients. However, there were only 3 subjects (2 when the
insulin study participants were excluded) with this belief pattern and thus the mean
follow-up HbA 1 for this group may be unrepresentative.
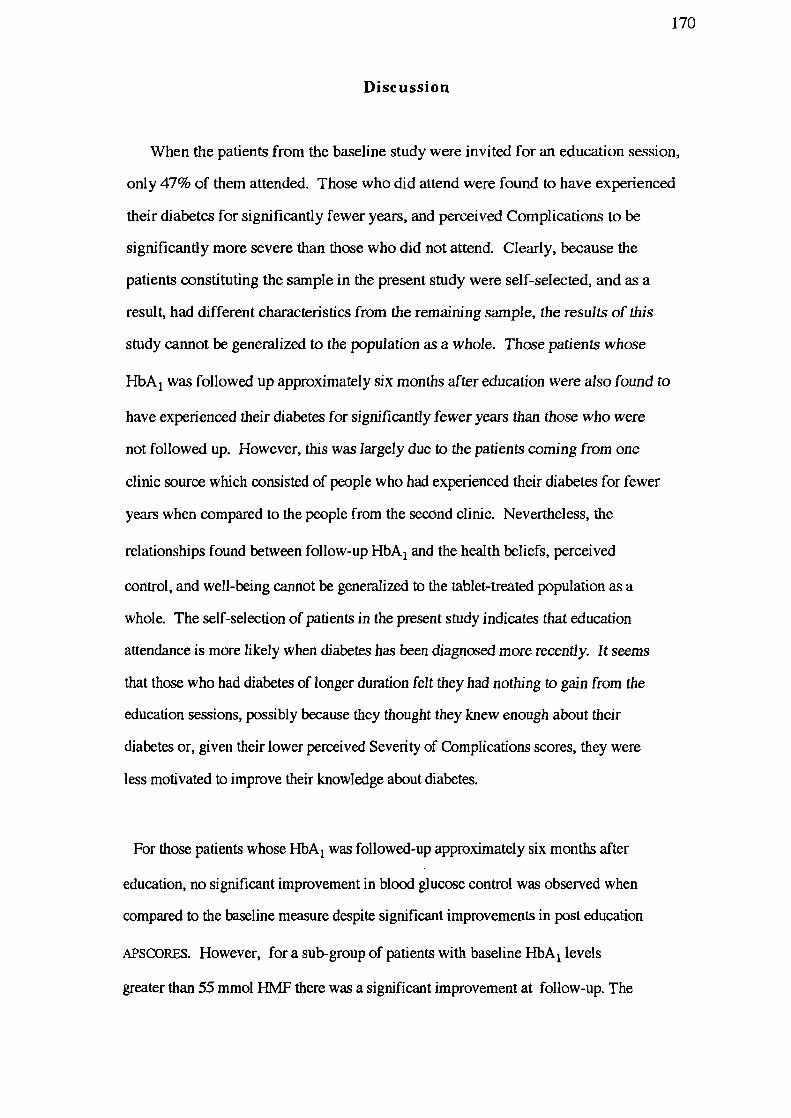
170
Discussion
When the patients from the baseline study were invited for an education session,
only 47% of them attended. Those who did attend were found to have experienced
their diabetes for significantly fewer years, and perceived Complications to be
significantly more severe than those who did not attend. Clearly, because the
patients constituting the sample in the present study were self-selected, and as a
result, had different characteristics from the remaining sample, the results of this
study cannot be generalized to the population as a whole. Those patients whose
I-IbA 1 was followed up approximately six months after education were also found to
have experienced their diabetes for significantly fewer years than those who were
not followed up. However, this was largely due to the patients coming from one
clinic source which consisted of people who had experienced their diabetes for fewer
years when compared to the people from the secOnd clinic. Nevertheless, the
relationships found between follow-up HbA 1 and the health beliefs, perceived
control, and well-being cannot be generalized to the tablet-treated population as a
whole. The self-selection of patients in the present study indicates that education
attendance is more likely when diabetes has been diagnosed more recently. It seems
that those who had diabetes of longer duration felt they had nothing to gain from the
education sessions, possibly because they thought they knew enough about their
diabetes or, given their lower perceived Severity of Complications scores, they were
less motivated to improve their knowledge about diabetes.
For those patients whose HbA 1 was followed-up approximately six months after
education, no significant improvement in blood glucose control was observed when
compared to the baseline measure despite significant improvements in post education
APSCORES. However, for a sub-group of patients with baseline l-thA 1 levels
greater than 55 mmol I-IMF there was a significant improvement at follow-up. The

171
education sessions therefore seem to have had the greatest impact on those whose
diabetes control needed to be improved the most. Several studies which have
assessed the impact of education on blood glucose control (eg Bloomgarden and
colleagues) have found that metabolic status did not improve significantly after
education even though knowledge has improved. Several researchers (eg Germer
and colleagues) have also attempted to correlate knowledge scores with diabetes
control and found no association. Indeed in the present study, no association was
found between pre- and post-education knowledge scores (APSCORES) and the
baseline and follow-up outcome measures. However, as Meadows, Lockington and
Wise (1987) have pointed out, it is naive to expect a linear relationship between
knowledge and diabetes control. Indeed, although a minimum level of diabetes
knowledge is probably required for maintaining good blood glucose and weight
control, above this threshold social and psychological factors are likely to play a
prominent important part in determining metabolic control. Thus, even if patients
have a very good knowledge about diabetes they may choose not to use it if they
lack the motivation, support, or means to bring their diabetes under control. In the
present study, a significant association was found between Percent Knowledge
Improvement and baseline as well as follow-up HbA 1 levels, indicating that those
patients whose diabetes was relatively well controlled in the first place were able to
take greater advantage of the education sessions than their counterparts. The reason
for this finding is probably due to the well-controlled patients having a superior
knowledge framework on which they could readily add new knowledge. This
points to the need for several education sessions when knowledge is particularly
poor, rather than just the single session offered, to allow time for a knowledge
framework to be built up and new information to be assimilated.
After education, the respondents perceived significantly more Benefits, fewer
Barriers, and overall, perceived their treatment to be more 'Cost-effectiv&. They
also perceived significantly greater Personal Control/Self-efficacy and greater

172
Treatment Satisfaction. The post-education measures of perceived Severity.
Vulnerability, Medical Control and Situational Control were not significantly
different when compared to baseline. There was, however, a tendency for
Well-being to deteriorate although this did not quite reach significance.
Furthermore, the correlations between the psychological measures and the
knowledge scores indicated that greater impact of the education (Percent Knowledge
Improvement and/or APSCORE difference), was associated with more perceived
Barriers, fewer perceived Benefits, lower perceived treatment 'Cost-effectiveness',
lower Positive Well-being, lower General Well-being, and lower Treatment
Satisfaction. Greater post-education APSCORES were also associated with greater
Depression, lower Positive Well-being, and lower Treatneut Satisfaction scores.
Although these negative effects of education were not predicted, these findings
indicate that prior lack of knowledge may have been associated with an unrealistic
view of diabetes and thus large increases in knowledge would have been very
disconcerting. In accordance with predictions greater post education APSCORES
were associated with lower perceived Medical Control and lower perceived
Situational Control. Although greater perceived Personal Control/Self-efficacy was
associated with greater pre-education APSCORES, the association with
post-education APSCORES was not significant. This finding indicates that higher
post-education knowledge scores may have had a deleterious effect on perceived
Personal Control/Self-efficacy for some of the patients in the study or that, in certain
cases, the education sessions had the effect of increasing perceived Personal
Control/Self-efficacy without concomitant increases in knowledge.
The pattern of correlations between the I-IBM and perceived control variables and
the demographic, clinical, and psychological outcomes in the present study provided
further evidence for the validity of these measures, although in many cases the
strength of the associations was much weaker. Similar to baseline, lower HbA1
levels were significantly associated with more perceived Benefits and greater

173
perceived Personal Control/Self-efficacy. More optimistic subjective estimates of
diabetes control were associated with lower perceived Vulnerability to
Complications, whilst better weight control was related to fewer perceived Barriers,
greater perceived Severity of Diabetes, and greater perceived treatment
'Cost-effectiveness'. The pattern of correlations between the Well-being and
Treatment Satisfaction measures and the HBM and perceived control measures was
also similar to that found at baseline. In general, greater Well-being and Treatment
Satisfaction were associated with fewer perceived Barriers, more perceived Benefits,
and greater perceived treatment 'Cost-effectiveness'. Greater Well-being and
Treatment Satisfaction were also associated with lower perceived Vulnerability to
Complications, greater perceived Personal Control/Self-efficacy, lower perceived
Situational Control, and greater perceived Medical Control.
In order to assess whether particular characteristics were associated with improved
glycaemic control, the patients whose blood glucose control improved were
compared with those whose blood glucose deteriorated. It was found that those
who improved their control felt less Vulnerable to Complications but were more
pessimistic when estimating their diabetes control. Furthermore, women rather than
men tended improve their blood glucose control alter education. The women who
improved their blood glucose control tended to perceive their treatment as more
'Cost-effective' compared to their counterparts, whereas the men who improved
their blood glucose control were more pessimistic than their counterparts when
estimating their diabetes control. These findings also provide further support for the
HBM. The sex difference noted when comparing those whose glycaemic control
improved with those whose control deteriorated may be due to women generally
valuing their health more highly than men because of the socialization process.
Verbrugge & Wingard (1987) suggested that males may be actively encouraged to be
tough and expected to minimize symptoms of illness, whereas females are socialized
to attend to their health in preparation for their caretaker role in the family. Indeed,

174
Kristiansen (1990) found sex differences in values (Rokeach Terminal Value
Survey) consistent with sex role norms and in particular, noted that women valued
their health to a greater extent than did men. An alternative explanation, is that men
with tablet-treated Type II diabetes are more protie to progressive 13-cell dysfunction
requiring eventual insulin treatment than women with tablet-treated Type 11 diabetes
(Kobayashi and colleagues; 1989). If this explanation is correct, then women would
have found it easier to improve their glycaemic control.
A major aim of the present study was to re-examine the relationships between the
original and newly-introduced HBM variables, when used to predict a prospective
measure of blood glucose control, and with the benefit of increased patient
knowledge about diabetes. However, the number of cases analysed in the
regression analyses was very small and therefore the amount of variance in health
outcome explained may have been inflated, despite adjustments to R2. The results
of the analyses must therefore be interpreted with some caution. The first regression
analysis indicated that a moderate amount of total variance [35% (22% adjusted)] in
follow-up HbA 1 was explained by the individual and composite HBM variables.
Interestingly, the multiplicative composite of Severity x Vulnerability x treatment
'Cost-effectiveness' x Personal Control/Self-efficacy contributed a significant
amount of unique variance to the explanation and, when entered into the regression
equation, significantly increased the R2. In this analysis, Perceived Personal
Control/Self-efficacy was the only individual variable to contribute a significant
amount of unique variance to the overall explanation. Inspection of the correlations
between Well-being and the HBM variables indicated fairly strong associations
between these variables yet the association between Well-being and follow-up HbA1
was relatively weak. This pattern of associations and the generally decreased
Well-being found after education suggested that introduction of General Well-being
on the first step of the analysis would suppress irrelevant variance and improve the
prediction of health outcome from the HBM variables. As a result, the

175
multiplicative composite of Severity x Vulnerability contributed a significant amount
of unique variance to the overall explanation and significantly increased the R2.
Furthermore, the overall amount of variance explained increased substantially to
47% (33% adjusted). In addition to Severity x Vulnerability, perceived
Vulnerability to Complications and perceived Personal Control/Self-efficacy also
contributed significant amounts of unique variance. The single-item Health Value
measure was introduced in another regression analysis, but prediction of follow-up
HbA 1 did not improve at all, probably because health value was an important
determinant of education attendance. When Percent Knowledge Improvement was
introduced in a further analysis, the overall amount of variance explained increased
to 57% (41%). However, there were no further improvements in the prediction of
follow-up HbA 1 from the I-IBM variables. These results therefore suggested that
when General Well-being was partialled out, a large proportion of the variance in
follow-up HbA 1 was explained by the individual and composite HBM variables.
Moreover, because the composite variable of Seventy x Vulnerability significantly
increased the amount of variance explained, a multiplicative relationship between
perceived Severity of Diabetes and perceived Vulnerability to Complications was
indicated. Although a much smaller amount of outcome variance was explained
when the eight participants in the insulin study were excluded from the analyses and
Percent Knowledge Improvement was excluded from the equation, the interaction
between perceived Severity and Vulnerability remained a significant contributor to
the prediction of health outcome. (Percent Knowledge Improvement shared some of
the same variance as perceived Vulnerability and the multiplicative composite of
Severity x Vulnerability.) In the light of the results just described the relationships
between the components of the I-IBM when predicting health outcome should be
specified as
HO Sr + Vr + (S x V)1 + (Ben - Barr) + PCSE
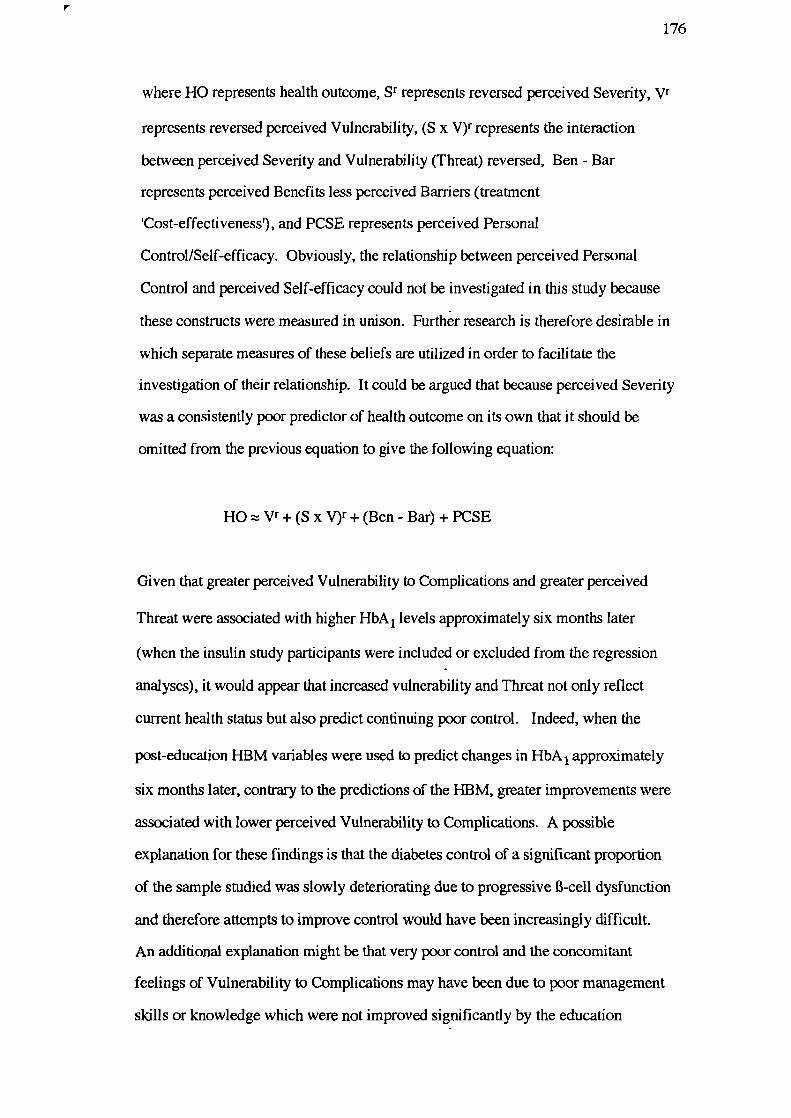
176
where HO represents health outcome, sr represents reversed perceived Seventy, yr
represents reversed perceived Vulnerability, (S x V)' represents the interaction
between perceived Severity and Vulnerability (Threat) reversed, Ben - Bar
represents perceived Benefits less perceived Barriers (treatment
'Cost-effectiveness'), and PCSE represents perceived Personal
Control/Self-efficacy. Obviously, the relationship between perceived Personal
Control and perceived Self-efficacy could not be investigated in this study because
these constructs were measured in unison. Further research is therefore desirable in
which separate measures of these beliefs are utilized in order to facilitate the
investigation of their relationship. It could be argued that because perceived Severity
was a consistently poor predictor of health outcome on its own that it should be
omitted from the previous equation to give the following equation:
HO VT + (S x V)' + (Ben - Bar) ^ PCSE
Given that greater perceived Vulnerability to Complications and greater perceived
Threat were associated with higher HbA 1 levels approximately six months later
(when the insulin study participants were included or excluded from the regression
analyses), it would appear that increased vulnerability and Threat not only reflect
current health status but also predict continuing poor control. Indeed, when the
post-education HBM variables were used to predict changes in HbA 1 approximately
six months later, contrary to the predictions of the I-IBM, greater improvements were
associated with lower perceived Vulnerability to Complications. A possible
explanation for these findings is that the diabetes control of a significant proportion
of the sample studied was slowly deteriorating due to progressive B-cell dysfunction
and therefore attempts to improve control would have been increasingly difficult.
An additional explanation might be that very poor control and the concomitant
feelings of Vulnerability to Complications may have been due to poor management
skills or knowledge which were not improved significantly by the education

I77
sessions and therefore frustrated any attempt to improve diabetes control. Either of
these explanations would tie in with the finding that lower perceived Personal
Control/Self-efficacy was associated with poorer control six months later.
Furthermore, lower post-education APSCORES were associated with greater
Situational Control. As mentioned earlier in relation to knowledge improvement, the
patients whose glycaemic control was already relatively good seem to have
benefitted more from the education sessions than their less well controlled
counterparts. An extension to this reasoning would be that those who were already
managing their diabetes fairly competently felt more able to improve their control if
so motivated and were therefore predisposed to feeling less vulnerable to
complications. If this reasoning is correct, it might be argued that perceived Severity
and Vulnerability are not preventive health motivators in themselves, but a reflection
of the degree of perceived treatment 'Cost-effectiveness', Personal
Control/Self-efficacy and the ability (knowledge, skills, or resources) to manage the
disorder generally. Indeed, in the analysis where the eight insulin study participants
were excluded, perceived Vulnerability and perceived Threat became insignificant
contributors to the prediction of health outcome when Percent Knowledge
Improvement was added to the equation.
It is interesting to note from the intercorrelations between the I-IBM variables that
greater perceived treatment 'Cost-effectiveness' was associated on the one hand,
with greater perceived Threat (Severity x Vulnerability) whilst on the other, it was
associated with lower perceived Vulnerability and lower perceived Severity. Indeed,
although the multiplicative composite of Seventy x Vulnerability x treatment
'Cost-effectiveness' did not explain a significant amount of unique variance in
follow-up HbA 1 in any of the regression analyses, in accordance with HBM
predictions, greater scores for this variable were associated with predictions of lower
follow-up HbA 1. This would suggest that for some people at least, increased
Vulnerability and Severity acted as motivators to improve control provided that
178
treatment was also perceived to be 'Cost-effectiv&. Clearly, the relationships
between the HBM variables and health outcome are fairly complex because health
beliefs appear to be context dependent, i.e. vary according to physiological status,
knowledge, skills, resources, feedback, and so on. Interrelationships found
between the HBM variables and their association with health outcome, therefore
need to be discussed in the context of the characteristics and source of the sample
studied. Furthermore, a larger sample would allow more definitive interpretations.
Because the amounts of variance in outcomes explained by the baseline data were
very low, particularly for HbA 1, it could be argued that the more successful
prediction of follow-up HbA 1 from the post-education beliefs was due to the
characteristics of the sample who attended for education or the small number of
cases used in the analyses of the post-education data. The baseline data of the
education attenders were re-analysed, therefore, in order to see if the prediction of
baseline 1-ThA 1 was comparable. The results indicated that relative to the whole of
the sample, predictions generally improved. However, in relation to HbA 1, when
the R2 was adjusted for the size of the sample, none of the variance in this outcome
was explained. A similar result was found even after the variance relating to General
Well-being was partialled out. Moreover, the amounts of variance explained in
baseline outcomes were still substantially less than the amount of variance explained
in follow-up HbA 1. These findings suggest, therefore, that the improved prediction
in follow-up HbA 1 was due to improved knowledge of the respondents and the
prospective nature of the health outcome measure.
When the I-IBM data were categorized and combined, none of the belief patterns
were significanly different from one another when related to follow-up HbA1,
indicating that the post-education beliefs combined to predict health outcome in a
linear rather than a non-linear fashion. Furthermore, when the patterns were ranked

179
according to follow-up HbA 1 , some of the belief combinations were associated with
levels of control which were not predicted. Moreover, the rankings were different
from those found when analysing the baseline data. In some cases the number of
subjects with a particular belief pattern was small. Indeed, in one of the analyses,
none of the respondents had the belief pattern of low perceived treatment
'Cost-effectiveness', low perceived Threat, and high perceived Personal
Control/Self-efficacy. A larger sample, therefore, may have produced different
results. However, given the superior prediction of follow-up HbA 1 from the same
sample in the regression analyses, this seems unlikely. It is interesting to contrast
these findings with the baseline results, which indicated significant differences in
health outcome when associated with non-linear combinations of beliefs.
In summary, the results from this study have shown that the education sessions
had a significant effect on knowledge, beliefs, Well-being, Treatment Satisfaction,
and, for those whose HbA 1 was relatively poor at baseline, glycaemic control. In
the latter case, sex differences were noted. The prospective nature of the health
outcome measure, and the greater knowledge of many of the patients in this study
appear to have improved the ability of the I-IBM variables to predict HbA 1 when
combined in a linear fashion. The relationships between the HBM variables were
found to be additive with the exception of perceived Severity and Vulnerability
which contributed a significant amount of unique variance to the overall prediction
when combined multiplicatively. Contrary to expectations, greater perceived
Vulnerability and greater perceived Threat were associated with poorer control six
months later which indicates that these variables probably do not act as predictors of
preventive health behaviour but merely reflect other beliefs and continuing health
status. It was also interesting to note that the relationships between the I-IBM
variables seemed to vary according to the characteristics of the sample included in
the analyses. It appears that the interrelationships between the HBM variables and

180
their association with health outcome are mediated by many contextual factors, thus
making it difficult to specify the relationships between the components of the model.
Although, the present study investigated belief changes after education, it was not
possible to assess the dynamics of health beliefs in the longer term. The next study
reports the effects on beliefs of the various stages of an insulin intervention. In
addition to the baseline data, beliefs were measured after the participants were first
informed of their poor glycaemic control and its implications, after a period of
optimizing control on current treatment, and several months later when they had
become used to using one of two different insulin delivery methods. The main aim
was to investigate the reactivity of health beliefs to new information and treatments
and to examine the nature and extent of any change in relation to health outcome.
181
CHAPTER SIX
EFFECTS OF AN INSULIN INTERVENTION STUDY
ON HEALTH BELIEFS
Janz and Becker (1984) pointed out in their review of HBM studies that
there has been a paucity of research which attempts to evaluate the effects of
interventions on health beliefs. Instead, most studies have focussed on the
relationship of beliefs to health outcomes. Although several years have
passed since this major review, the position is still the same. Indeed,
publications concerning the HBM have generally diminished in recent years.
Janz and Becker were referring specifically to the need for research which
assesses the impact of interventions designed to alter beliefs in order to
achieve desired health behaviours. It could be argued, however, that studies
of this type are premature from a theoretical standpoint because past research
has not been able to establish fully which I-IBM dimensions would benefit
from change and what the levels of these beliefs should be in order to warrant
intervention. Not only would inappropriate interventions be less effective in
terms of time and money, they could also produce changes in beliefs which
may lead to negative health outcomes. It has been noted in Chapter 5 that the
relationship between health outcomes and two of the I-IBM dimensions
(perceived Severity and Vulnerability) appears to be particularly dynamic
making it unclear when an intervention might be appropriate. Indeed it is not
certain whether these beliefs are the cause or simply a reflection of health
status. Clearly, more research is needed concerning the dynamics of health
beliefs in order to understand better how, why and if they can be changed.
This could be achieved through longitudinal studies which assess the impact
of different interventions on HBM dimensions rather than designing
interventions which aim to change beliefs in a particular direction. It is

182
predicted that studies of this kind would produce a better understanding of the
origins and context of health beliefs.
This chapter describes the impact of the various stages of an insulin
intervention study on health beliefs. The aim of this research was to gain an
insight into the reactivity of health beliefs to information, education, feedback
about control, and the introduction of two types of insulin delivery. The
subjects of this study had Type II diabetes which was progressively
inadequately controlled with oral hypoglycaemic agents and diet. Insulin
treatment would have been routinely prescribed at a particular threshold of
hyperglycaemia but these patients were approached before they reached this
threshold in order to ascertain whether they would volunteer to take part in the
insulin study, whether they could improve their diabetes control prior to
insulin therapy after an educational imput and improved feedback about
control, and to assess the efficacy of insulin injections and CSII pump
therapy. Health beliefs, Well-being and Treatment Satisfaction were assessed
prior to, and after each intervention of the study. The rationale for the clinical
part of the research was to assess the effects of insulin therapy on the
physiological status of patients with poorly-controlled Type II diabetes. It
was hypothesized that glycaemic control would be improved and this would
be associated with improvement in lipid status and in some aspects of the
abnormalities of coagulation and platelet function. In particular, the efficacy
of two methods of insulin delivery: conventional injection therapy (CIT) and
continuous subcutaneous insulin infusion (CSII) pump therapy were
compared. CIT is the regimen routinely prescribed when oral hypoglycaemic
agents are not successful whereas CSII has rarely been used for this type of
patient. Moreover, prior to the present study, CSII had not been evaluated
when used by Type II patients on an outpatient basis. On the basis of
experience with insulin-dependent patients (Lewis, Bradley, Knight, Boulton

183
& Ward, 1988), it was predicted that CSII would be the more acceptable form
of insulin treatment. The most worrying and severe complication of CSII use
by insulin-dependent patients is the rapid development of diabetic ketoacidosis
but the very nature of Type H diabetes means that this dangerous complication
cannot arise. The results of the clinical part of the study are reported
elsewhere (Jennings, Lewis, Murdoch, Talbot, Bradley & Ward, 1991).
This chapter focusses on the impact of the interventions on health beliefs and
the accompanying psychological outcomes.
Methods
Subjects and Procedure
The subjects of the present study were selected from an initial pool of
patients attending for a full clinical assessment described in Chapter 2. Those
who were approached to take part in the insulin study were Caucasian, aged
40 to 65 years, treated with maximum doses of sulphonylureas, had HbA1
concentrations above 55 mmol HMF/mol Hb, were free from severe diabetic
complications, and had been satisfactorily treated with sulphonylureas for at
least 1 year. Initially only patients with an ideal body weight < 130% were
included but in order to recruit a sufficient number of people for the study this
criterion was modified to < 160%. Furthermore,.because more people were
required for the insulin study after the baseline sample had been exhausted, 6
of the subjects were drawn directly from the outpatient clinics. Due to time
limitations at this late stage of the study, these patients were not asked to
complete a baseline questionnaire before being approached. Figure 6.1
illustrates the design of the insulin study.

Criterianot met Criteria
metMet revised
Education selection criteriaSession
CSII pumptherapy
Conventionalinjectiontherapy(CIT)
184
ScreeningAppointment
Baseline psychologicalmeasures
Selection
DiabetesCriteria
Clinics
Approachedfor Insulin
Study
Post decision] psychological measures
Optimizationof currenttreatment(Run-in)
Post run-in psychological measures
Post treatment psychological measures
Figure 6.1: Design of the study
Intervention 1: Feedback about patients' poor diabetes control
and the increased risk of complications.
Thirty two consecutive patients who fulfilled the selection criteria were
informed by the doctor who carried out the clinical assesment about the
unsatisfactory control of their diabetes on current treatment and their increased

185
risk of developing complications should hyperglycaemia continue. These
patients were then told about the likelihood of needing insulin treatment in the
near future. After giving this information, the patients were informed about
the insulin study and were asked to consider whether they would take part.
They were given written information about the complications of diabetes and
details of the insulin study to take home with them for consideration and for
educational purposes (see Appendix 5). The patients were also asked to
complete a booklet of psychological questionnaires at home, similar to the one
distributed at baseline. Included in the booklet was a questionnaire (see
Appendix 6) which asked respondents to estimate how well their diabetes had
been controlled over the past few weeks, to give their decision regarding
whether or not they had decided to take part in the insulin study, and to rate
their apprehensiveness about the thought of insulin injections, insulin pump
treatment, and blood test finger pricking, on three respective 7-point scales.
They were asked to return the completed booklet of questionnaires within the
next 2 or 3 days. Those who did not return a booklet within 2 weeks were
sent a reminder. Prior to being informed about the unsatisfactory control of
their diabetes, and during the time of the consultation with the doctor, all the
patients were asked to complete the diabetes knowledge questionnaire
described in Chapter 5. A correctly completed copy of this questionnaire was
provided for them to peruse at home. Twenty-five (78%) of those
approached agreed to participate in the insulin study. Of those who declined
to take part, 3 subsequently achieved improved glycaemic control (HbA 1 <55
mmol HMF/ mol Hb), 2 failed to attend the clinic as necessary, 1 died
following a myocardial infarction, and 1 received insulin therapy according to
the usual clinic regime. The patients who decided not to take part in the
insulin study gave significantly more optimistic estimates of their diabetes
control when compared with those who agreed to participate (z = -0.50;
p<O.Ol ). No other significant psychological, demographic, or clinical

186
differences were noted between these groups.
Intervention 2: Dietary advice, intensified dietary therapy, and
home blood glucose monitoring for a period of 3 mont/is.
The 25 patients who agreed to take part were entered into a preliminary
run-in phase of the study. This entailed a period of 3 months in which
treatment with diet and tablets was optimised. They attended the hospital
every 2 weeks for the first month and thereafter on a monthly basis. At each
visit progress was reviewed by a dietitian and the doctor who carried out the
initial clinical assessment. At the beginning, each patient was taught the
technique of home blood glucose monitoring (I-IMBG) which meant that
feedback about the control of their diabetes was improved. They were also
advised to increase the fibre and carbohydrate content of their diet and to
reduce fat intake. Obese individuals were advised to reduce their total energy
intake. At the end of the 3 months, 5 of the participants achieved good
glycaemic control (defined as HbA 1 <50 mmol 1-IMF/ mol Hb), and therefore
continued with sulphonylurea therapy. The 20 patients who were unable to
achieve HbA 1 <50 mmol HMFI mol Hb were entered into the insulin
treatment phase of the study. Prior to commencing insulin treatment, the
patients were asked to complete another copy of the diabetes knowledge
questionnaire in order to assess whether knowledge had improved after the
run-in phase. They were also asked to complete another copy of the booklet
of psychological questionnaires at home. Included in the booklet was a
questionnaire in which they were asked to indicate on 7-point scales how well
they thought their diabetes had been controlled during the previous few
weeks, to what extent they felt that HBGM had helped them to manage their
diabetes, and to what extent they felt that their diabetes control had improved

187
as a result of HBGM (See Appendix 7). A further questionnaire was
included in which they were asked to rate on 7-point scales their expectations
about the treatment to which they had been allocated. The questions from the
Expectations of Treatment questionnaire are presented in Figure 6.2. A full
copy of this questionnaire is provided in Appendix 9. As before, the
participants were asked to return the completed booklets within the next 2 or 3
days. Those who did not respond within a week were sent a reminder.
However, no attempt was made to obtain a completed booklet once the insulin
treatment phase of the study began. Sixteen of the 20 participants who went
on to use insulin returned completed questionnaires. Psychological measures
were not obtained from those who continued with tablet and diet treatment.
Figure 6.2: Questions from the Expectations of Treatment questionnaire.
1. I will feel able to control my own diabetes with little need for other people's help.
2. I will feel handicapped.
3. It will be easy to regulate my blood sugar.
4. I believe that I may develop infections with the treatment
5. I believe that the treatment will reduce the risk of my developing wmplications ofdiabetes (such as deteriorating eyesight).
6. It will be obvious to other people that I have diabetes.
7. 1 will have freedom to choose when I want to eat
8. I expect my blood sugar levels to become similar to those of non-diabetic people.
9. I will need to adapt my lifestyle.
10. Insulin reactions (hypos) will be frequent.
11.! believe there might be technical problems with the treatment
12. I will feel dependent on professional help for managing my diabetes.
13. It will be difficult to deal with the treatment
14. People around me will accept my using this form of treatment
15.1 think the study will produce valuable scientific information.
16. I will be able to forget that I have diabetes for most of the time.
17. I believe that I might put on too much weight
18. It will be inconvenient to do the number of blood tests required.
19. 1 will be able to be flexible with what 1 eat and still maintain control of my diabetes.
20.1 will be able to take part fully in social activities.
21. I believe that a short period of using insulin will lead to good blood sugar controlin the long term.

188
Table 6.1: Demographic and clinical characteristics of the insulinstudy participants.
All patients CSII CIT(n=20) (n=1O) (n=1O)
Mean (SD) Mean (SD) Mean (SD)
Age 56.5 (6.4) 56.7 (7.4) 56.3 (5.6)
Dumtion of diabetes 6.4 (4.5) 6.9 (5.8) 5.9 (3.1)
Percent ideal bodyweight (pre-treatment) 125.3 (23.9) 125.6 (24.4) 124.9 (24.8)
Sex 8 Men 4 Men 4 Men12 Women 6 Women 6 Women
Intervention 3 Insulin treatment using injections or CSII
pumps
The demographic and clinical characteristics of the insulin study
participants are presented in Table 6.1. It is interesting to note that this final
sample consisted of more women than men, whereas the baseline and
education study samples consisted of more men than women. This may
indicate that the insulin study sample is not representative, especially given
that there is some evidence (Kobayashi and colleagues, 1989) that maleness is
a risk factor for progressive B-cell dysfunction. The patients who provided
baseline data from this sample were compared with the remainder of the
baseline sample in order to ascertain whether there were any differences in the
psychological measures at this stage. Mann-Whitney tests indicated that there
were no significant differences between the samples with the exception of
perceived Severity of Diabetes which was significantly greater in the insulin
study patients (z = -2.6; p.<O.O1) The insulin study sample were therefore
characterized by higher perceived Severity of Diabetes scores prior to any of
the interventions.

189
The patients were randomised to either CSII or CIT (twice daily injections)
for 4 months. The randomisation was stratified so that equal proportions of
patients above and below 120% ideal body weight were included in each
group. The progress of the participants was reviewed by the doctor weekly
for 2 weeks, then fortnightly for 6 weeks, then monthly. They were also
reviewed at least once a month by the dietitian. CSII or CIT was commenced
on an outpatient basis. Initially patients attended the diabetes ward on three
consecutive mornings to receive instruction and advice about insulin therapy.
The dietitian advised patients about carbohydrate exchanges and
recommended a diet designed to minimise weight gain because insulin therapy
is known to increase weight in patients with Type II diabetes (Peacock &
Tattersall, 1984; Scott and colleagues, 1988). Those who were randomised
to CSII also received instruction about insulin injections in case these became
necessary, in the event of the pump malfunctioning. Injection technique was
taught by a diabetes nurse specialist At the end of the insulin treatment phase
of the study, the patients were asked to complete the knowledge questionnaire
in the hospital. They were also given a further copy of the booklet of
psychological questionnaires to complete at home. Included in the booklet
there was an additional questionnaire which asked respondents to rate the
experience of their treatment (Fig 6.3). This was similar to the Expectations
of Treatment questionnaire for the purpose of comparison. The patients were
also asked to rate how well they felt their diabetes had been controlled over
the previous few weeks. As before, they were asked to return the completed
booklet within the next 2 or 3 days. Reminders were sent if responses were
not received within about a week. Eighteen of the participants returned a
completed booklet at the end of the study.

190
Figure 6.3: Questions from the Experience of Treatment questionnaire.
1. I have felt able to control my own diabetes with little need for other people's help.
2. I have felt handicapped.
3. It has been easy to regulate my blood sugar.
4. I have developed infections with the treatment.
5. I believe that the treatment has reduced the risk of my developing complicationsof diabetes (such as deteriorating eyesight).
6. It has been obvious to other people that I have diabetes.
7. I have had freedom to choose when I want to eat
8. My blood sugar levels have become similar to those of non-diabetic people.
9. I needed to adapt my lifestyle.
10.There have been frequent insulin inactions (hypos).
11.! have experienced technical problems with the treatment.
12.! have felt dependent on professional help for managing my diabetes.
13. It has been difficult to deal with the treatment.
14. People around me have accepted my using this form Of treatment
15.1 think the study is producing valuable scientific infonnation.
16.1 have been able to forget that I have diabetes for most of the time.
17.! have put on too much weight.
18. It has been inconvenient to do the number of blood tests required.
19.1 have been flexible with what I eat and still maintain control of my diabetes.
20.1 have been able to take part fully in social activities.
Statistical Analyses
The distributions of scores for the psychological variables at all stages of
the study met the assumptions of parametric statistical tests. Exceptions were
Treatment Satisfaction after insulin treatment, perceived Severity of General
Disorders at baseline, and perceived Severity of Complications after deciding
whether or not to take part in the study, which were all negatively skewed.
Between stage comparisons were made using the Wilcoxon matched pairs
signed ranks test, the Student's t -test (paired scores), analyses of variance,
or Friedman's chi-square test, as appropriate.

191
Predictions
The following predictions were made in relation to the impact of the study
interventions on health beliefs, perceived control, Well-being, and Treatment
Satisfaction:
1. After being given feedback and information about the poor state of their
diabetes control and the increased risk of complications, the patients would
report reduced Personal Control/Self-efficacy, fewer perceived Benefits of
Treatment, more perceived Barriers to treatment, lower perceived treatment
'Cost-effectiveness', greater perceived Severity of Diabetes and its
Complications, and greater perceived Vulnerability to Complications. It
was also predicted that psychological Well-being and Treatment
Satisfaction would deteriorate.
2. After the opportunity to optimize their current treatment using improved
feedback about control from HBGM, it was predicted that the patients who
managed to improve their blood glucose control would report small but
favourable changes in health beliefs, perceived control, psychological Well
being, and Treatment Satisfaction when compared to the previous phase of
the study. Conversely, those who were unable to improve their control
would report negative or non-significant changes in these psychological
variables.
3. The insulin treatment phase of the study was predicted to have the greatest
effect on health beliefs and the other psychological variables because of
its marked impact on blood glucose control overall, It was predicted that
the improvements would produce very favourable changes in health
beliefs, perceived control, psychological Well-being and Treatment

192
Satisfaction. Higher levels of HbA 1 and percent ideal body weight after
insulin treatment were predicted to be associated with greater perceived
Severity of Diabetes and greater perceived Vulnerability to Complications.
Results
Clinical and physiological outcomes
Details of all the clinical and physiological outcomes of the present study
are reported elsewhere (Jennings, Lewis, Murdoch, Talbot, Bradley & Ward,
1991). Only outcomes which may have affected the psychological parameters
measured are summarized here. All 20 patients completed the insulin
treatment phase of the study, none of them requested a change in treatment,
and none of the CSII-treated patients experienced difficulty in operating the
pump device.
There were no significant differences between the treatment groups in
HbA 1 or ideal body weight prior to insulin treatment. After 4 months of
insulin treatment, however, HbA 1 significantly improved for both groups of
patients (CSII: z = -2.74, p<0.O1; CIT: z = -2.67; p<0.01). Eight of the 10
patients treated with CS!! were able to achieve HbA 1 below 50 mmol
HMF/mol Hb whereas only 3 of 10 patients treated with CIT were able to do
so (z = -2.1; p<O.05). Body weight increased significantly in both groups
after treatment with insulin (CSII: z = -2.2; p<O.O5; CIT: z = - 2.1; p<0.05)
but there were no significant between-group differences. Statistical
information relatingto HbA1 and percent ideal body weight at each stage of the
study are presented in Table 6.2.

0
II
C.)
0)
Cl)
0)
I?CO
C-
0
(C
CO
lie00V0.
*
0?CO
.0
0.0
0
I.-0
'O0(CCO
0
0
V
0.**
-
.0
0E
0EE
C')
N
.0
I...20?
0
4?'C0
.2(C
I. 0) CO —
C- Q
'C
0)
hi
V
'-I0 0)
V
1', 0
Cl)
V
I.)
L)0)
'C'o
lieCl) Cl) ri 0
zz0V
**
00 lie 0- - eN N li
00
0— —, -
0N
' I- ' lie
000N )000000
0•0•0•0N lie - •.l lie lie
**
0 - ' lie
Ci NN 00
- N lfl
' 'I.
© 000N 0000N 00 N '0
© 000N tfl - -lie tie lie ••
0?
• .E E.- I
Cl) l) Cl) Cl)
zzzz
*
00 lie iie
N N - e.- - - _C
1 00 Nitsd
N N N N, ' '-,
0 00 '0
N N N N- — - -
0 0 0 0
N '0 '0 '0- — - —
00C'e N C'3 lie000000 O
*
0 lie 0 Il)NIie0
— - — N- - - -
—0
N N N N
0 '0 O 00
'0IieNN N N N- - - -
0000000 N'0 lie lie N- — - -
0000000 N 00
C% ' 0
0?0Cl) .
(C
0? , ,CO Cl) Cl) Cl)
0 0 0

194
One patient in each group experienced frequent mild hypoglycaemia during
insulin treatment (>2 attacks per month) and a total of 3 patients, 2 of whom
were treated with CIT. experienced infrequent mild hypoglycaemia (<3
attacks during the 4 month insulin treatment period). None of the patients
developed infections at the needle site or uncontrolled hyperglycaemia. Eye
assessments indicated retinal deterioration in one of the CSII-treated patients
and 4 of the CIT-treated patients after insulin treatment.
Subjective estimates of control at each stage of the study
A two factor mixed measures ANOVA indicated that there were no
significant differences in subjective estimates of diabetes control between the
treatment groups (F=O. 11; df 1,9; p=O.7). However, subjective estimates of
diabetes control did vary significantly during the study (F=6.72; df 3,27;
p<O.Ol ) . A multiple comparison test (Tukey HSD method) indicated that
subjective estimates of control became significantly more optimistic after
insulin treatment when compared with the post run-in measure (p<O.O5).
However, correlations be1ween the objective and subjective indices of
diabetes control were non-significant at all stages of the study.
Impact of the insulin study interventions on health beliefs and
psychological outcomes
Statistics relating to the psychological measures at baseline and after each
intervention are presented in Tables 6.3 and 6.4.

195
Table 6.3: Mean (SD) health belief and perceived control scoresat each stage of the study
All patients CSH-treated CIT-treatedpatients patients
Mean (SD) N Mean (SD) N Mean (SD) N
Perceived Benefits
Baseline 26.8 (2.8) 14 26.7 (2.9) 8 26.8 (2.9) 6
Post decision 25.5 (3.8) 20 25.0 (2.9) 10 26.0 (4.7) 10
Post run-in phase 26.4 (3.5) 17 25.6 (4.0) 9 27.4 (2.7) 7
Post insulin treatment 27.6 (2.5) 18 27.0 (3.0) 9 28.2 (1.9) 9
Perceived Barriers
Baseline
Post decision
Post run-in phase
Post insulin treatment
Perceived Treatment'Cost-c ffec ti yen ess'
Baseline
Post decision
Post run-in phase
Post insulin treatment
Perceived Severity ofComplications
Baseline
Post decision
Post run-in phase
Post insulin treatment
Perceived Severity ofDiabetes
Baseline
Post decision
Post run-in phase
Post insulin treatment
14.6 (7.4) 14 13.0 (7.4) 8 16.8 (7.4) 6
15.0 (6.5) 20 13.7 (6.1) 10 17.4 (7.6) 10
11.4 (6.sr 16 11.8 (6.5) 9 11.6 (7.3) 7
10.2 (6.7) 18 8.0 (5.0) * 9 11.6 (7.9) 9
12.1 (82) 14 13.8 (7.7) 8 10.0 (8.9) 6
10.8 (4.4) 20 11.7 (42) 10 9.7 (4.8) 10
14.9 (6.7r 16 14.2 (7.0) 9 15.9 (6.7)* 7
19.1 (7.Sr 18 19.0 (6.8)* 9 16.7 (9.1) 9
28.7 (3.0) 15 28.4 (2.9) 8 29.0 (3.4) 7
29.1 (3.0) 20 29.1 (2.2) 10 29.0 (3.7) 10
29.1 (3.0) 16 28.3 (3.6) 9 30.0 (1.6) 7
28.3 (3.1) 17 28.8 (3.1) 8 27.9 (3.2) 9
6.6 (1.4) 14 6.7 (1.4) 8 6.4 (1.7) 6
5.9 (1.6) 18 5.3 (1.7)* 9 6.8 (1.1) 9
5.8 (2.0) 16 6.0 (2.2) 9 5.4 (1.8) 7
4.9 (4.6) 18 5.0 (2.1)s* 9 4.9 (1.1) 9
** pz0.01versus prior study phase /continued
* p<0.05
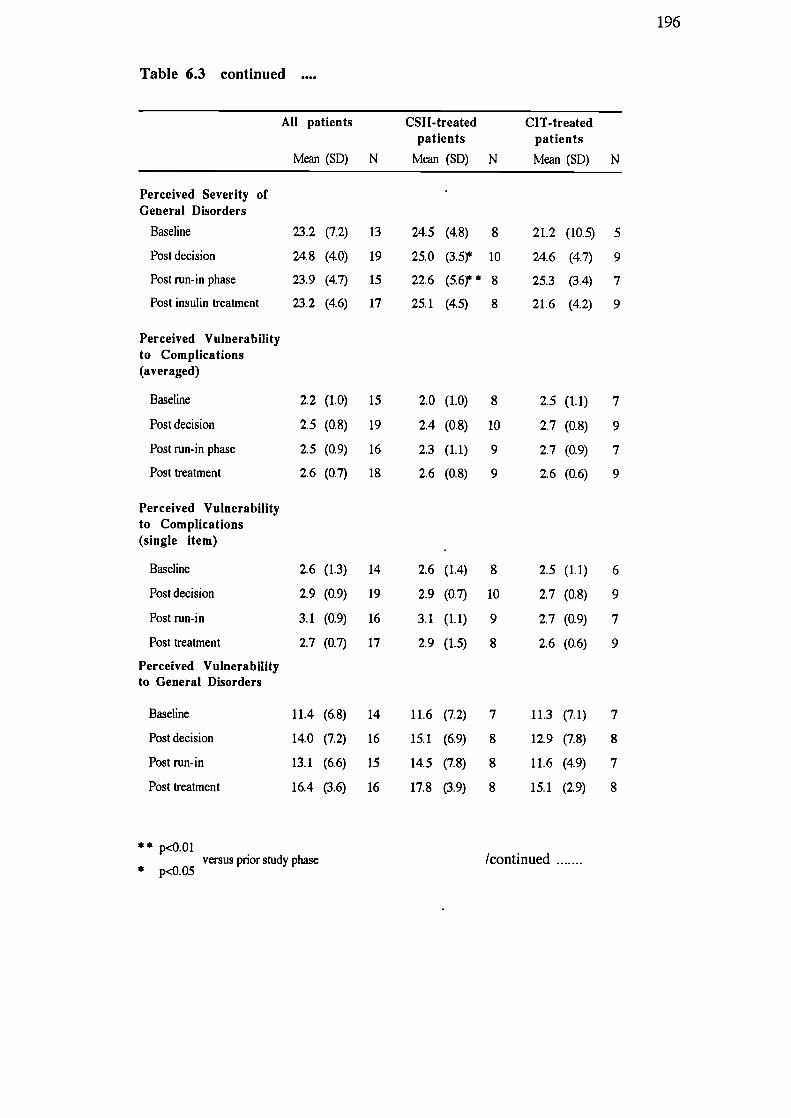
196
Table 6.3 continued
All patients CSII-treated CIT-treatedpatients patients
Mean (SD) N Mean (SD) N Mean (SD) N
Perceived Severity ofGeneral Disorders
Baseline 23.2 (7.2) 13 24.5 (4.8) 8 21.2 (10.5) 5
Post decision 24.8 (4.0) 19 25.0 (3.5) 10 24.6 (4.7) 9
Post run-in phase 23.9 (4.7) 15 22.6 (5.6) * 8 25.3 (3.4) 7
Post insulin treatment 23.2 (4.6) 17 25.1 (4.5) 8 21.6 (4.2) 9
Perceived Vulnerabilityto Complications(averaged)
Baseline
Post decision
Post run-in phase
Post treatment
Perceived Vulnerabilityto Complications(single item)
Baseline
Post decision
Post run-in
Post treatment
Perceived Vulnerabilityto General Disorders
Baseline
Post decision
Post run-in
Post treatment
2.2 (1.0) 15
2.5 (0.8) 19
2.5 (0.9) 16
2.6 (0.7) 18
2.6 (1.3) 14
2.9 (0.9) 19
3.1 (0.9) 16
2.7 (0.7) 17
11.4 (6.8) 14
14.0 (7.2) 16
13.1 (6.6) 15
16.4 (3.6) 16
2.0 (1.0) 8
2.4 (0.8) 10
2.3 (1.1) 9
2.6 (0.8) 9
2.6 (1.4) 8
2.9 (0.7) 10
3.1 (1.1) 9
2.9 (1.5) 8
11.6 (7.2) 7
15.1 (6.9) 8
14.5 (7.8) 8
17.8 (3.9) 8
2.5 (1.1)
2.7 (0.8)
2.7 (0.9)
2.6 (0.6)
2.5 (1.1)
2.7 (0.8)
2.7 (0.9)
2.6 (0.6)
11.3 (7.1)
12.9 (7.8)
11.6 (4.9)
15.1 (2.9)
7
9
7
9
6
9
7
9
7
8
7
8
** p<o.01versus pnor study phase /continued
* p<o.05

8
10
8
9
8
10
7
9
6
9
7
9
6
8
7
9
197
Table 6.3 continued
All patients - CSI I-treated CIT-treatedpatients patients
Mean (SD) N Mean (SD) N Mean (SD) N
Perceived Vulnerabilityof 'Average Person' toComplications
Baseline 19.1 (8.4) 13 17.0 (9.2) 7 21.5 (7.4) 6
Post decision 21.4 (5.5) 17 20.8 (3.8) 9 22.0 (7.2) 8
Post run-in phase 21.0 (4.7) 13 19.1 (4.6) 7 23.2 (4.1) 6
Post insulin treatment 21.4 (5.2) 18 20.2 (6.0) 9 22.6 (4.2) 9
14
18
14
18
14
19
15
18
Perceived Vulnerabilityof 'Average Person' toComplications (singleitem)
Baseline
Post decision
Post run-in phase
Post treatment
Perceived Vulnerabilityof 'Average Person' toGeneral Disorders
Baseline
Post decision
Post run-in
Post treatment
2.6 (1.3)
2.8 (0.8)
2.9 (0.9)
2.7 (0.7)
13.0 (7.2)
15.3 (7.0)
15.7 (4.2)
16.9 (44)
2.8 (1.5)
2.5 (0.5)
2.8 (1.0)
2.7 (0.7)
13.8 (8.0)
16.2 (6.2)
16.1 3.7)
17.1 (44)
2.5 (1.2)
3.1 (0.9)
3.1 (0.7)
2.7 (0.7)
12.0 (6.6)
14.1 (8.2)
15.3 (4.9)
16.8 (4.6)
/continued .......

198
Table 6.3 continued
All patients CSI I-treated CIT-treatedpatients patients
Mean (SD) N Mean (SD) N Mean (SD) N
Perceived PersonalControl/Self-efficacy
Baseline 67.8 (14.3) 13 62.0 (15.5) 7 74.5 (10.0) 6
Post decision 64.5 (16.3) 20 61.7 (17.0) 10 67.4 (16.0) 10
Post run-in phase 69.5 (15.7) 16 65.1 (19.1) 9 75.1 (8.2) 7
Post insulin treatment 71.7 (8.4) 18 71.0 (7.9) 9 72.4 (9.3) 9
Perceived MedicalControl
Baseline
Post decision
Post run-in phase
Post treatment
Perceived SituationalControl
Baseline
Post decision
Post run-in
Post treatment
30.8 (13.7) 13
30.5 (11.8) 20
29.5 (11.7) 16
32.3 (10.1) 18
18.4 (13.6) 13
18.5 (11.1) 20
15.4 (12.1) 16
16.2 (13.6) 18
34.9 (9.6) 7
28.1 (10.4) 10
29.4 (11.0) 9
34.6 (7.3) 9
25.5 (13.9) 7
20.1 (11.5) 10
16.0 (12.1) 9
17.7 (12.7) 9
26.0 (16.9)
6
32.9 (13.2) 10
29.6 (13.5)
7
30.0 (12.4)
9
11.3 (9.7)
6
16.9 (11.1)
10
14.6 (13.1)
7
14.7 (15.0)
9

199
Table 6.4: Mean (SD) Well being and Treatment Satisfaction scoresat each stage of the study
All patients CSII-treated CIT-treatedpatients patients
Mean (SD) N Mean (SD) N Mean (SD) N
Depression
Baseline 4.5 (2.4) 14 4.3 (2.8) 8 4.8 (1.9) 6
Post decision 5.6 (2.7) 20 6.2 (3.2) 10 5.0 (2.1) 10
Post run-in phase 3.8 (2.6) 16 4.2 (2.8) 9 3.3 (2.4) 7
Post insulin treatment 4.9 (2.8) 18 5.0 (2.9) 9 4.9 (2.8) 9
Anxiety
Baseline
Post decision
Post run-in phase
Post insulin treatment
Positive Well being
Baseline
Post decision
Post run-in phase
Post insulin treatment
General Well being
Baseline
Post decision
Post run-in phase
Post insulin treatment
6.3 (3.8) 15
6.7 (3.8) 20
6.3 (43) 15
5.5 (3.7) 18
12.5 (3.5) 15
12.3 (3.6) 20
13.4 (3.1) 15
12.5 (3.3) 18
39.4 (7.7) 14
38.0 (&2) 20
40.3 (8.4) 15
40.1 (8.3) 18
6.8 (3.8)
6.3 (4.1)
7.2 (4.8)
6.1 (2.9)
12.9 (3.4)
12.1 (4.0)
13.4 (3.5)
12.3 (4.6)
39.9 (7.5)
37.6 (9.9)
39.0 (10.1)
39.2 (8.3)
8
5.7 (4.1)
7
10
7.1 (3.5)
10
9
5.1 (3.4)
6
9
4.9 (4.4)
9
8
12.1 (3.8)
7
10
12.5 (3.3)
10
9
13.3 (2.6)
6
9
12.7 (3.7)
9
8 38.7 (8.7) 6
10 38.4 (6.7) 10
9 42.2 (5.2) 6
9 40.9 (8.7) 9
Treatment Satisfaction
Baseline 26.3 (5.9) 15 29.0 (3.9) 8 23.3 (6.6) 7
Post decision 22.8 (7.6) 20 23.9 (7.9) 10 21.6 (7.6) 10
Post run-in phase 25.6 (5.9) 16 24.6 (6.2) 9 27.0 (5.7) 7
Post insulin treatment 30.2 (5.1 * 17 29.0 (6.3) 9 31.6 (3.1 8
** p<O.O1versus prior phase of study
* p<0.05
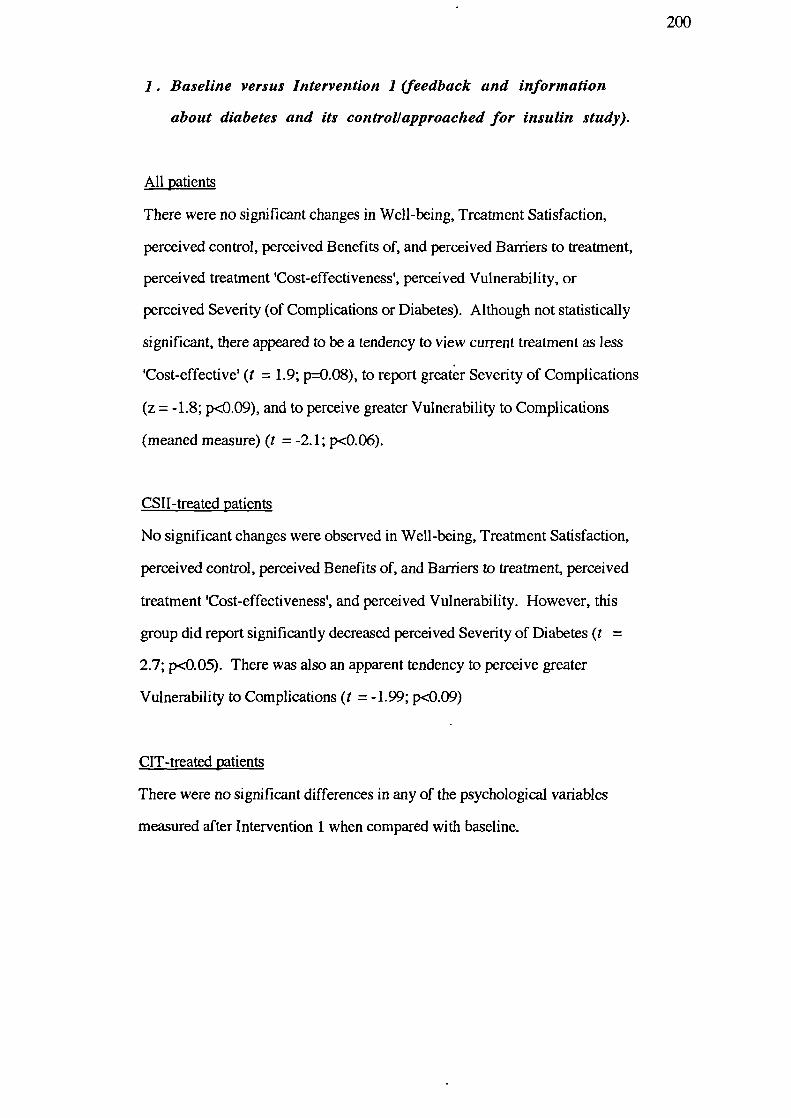
200
1. Baseline versus Intervention 1 (feedback and infor,nation
about diabetes and its control/approached for insulin study).
All patients
There were no significant changes in Well-being, Treatment Satisfaction,
perceived control, perceived Benefits of, and perceived Barriers to treatment,
perceived treatment 'Cost-effectiveness', perceived Vulnerability, or
perceived Severity (of Complications or Diabetes). Although not statistically
significant, there appeared to be a tendency to view current treatment as less
'Cost-effective' (t = 1.9; p=0.O8), to report greater Severity of Complications
(z = -1.8; p<0.09), and to perceive greater Vulnerability to Complications
(meaned measure) (t -2.1; p<0.06).
CSII-treated patients
No significant changes were observed in Well-being, Treatment Satisfaction,
perceived control, perceived Benefits of, and Barriers to treatment, perceived
treatment 'Cost-effectiveness', and perceived Vulnerability. However, this
group did report significantly decreased perceived Severity of Diabetes (t =
2.7; p<zO.O.5). There was also an apparent tendency to perceive greater
Vulnerability to Complications (t = -1.99; p<zO.09)
CIT-treated patients
There were no significant differences in any of the psychological variables
measured after Intervention 1 when compared with baseline.
201
2. Intervention 1 vs Intervention 2 (HBGM and optimization of
diet).
All patients
There were no significant changes in Well-being, Treatment Satisfaction,
perceived control, perceived Severity or perceived Vulnerability after the
run-in phase of the study. Patients did report significantly fewer Bamers to
treatment (t = 2.2; p'zO.05), and overall, perceived their current treatment to
be significantly more 'Cost-effectiv& (t = -2.6; p<O.05). As stated earlier,
one of the predictions made was that favourable changes in health beliefs and
the other psychological variables would be reported by those who managed to
improve their glycaemic control, whereas negative or non-significant changes
would be reported by those who were unable to improve their glycaemic
control. The 9 patients who improved their blood glucose control after this
phase of the study (and provided psychological data) reported their treatment
to be significantly more 'Cost-effective' (z = -2.3; p<0.05). However, no
other significant changes in the psychological variables were reported by this
sub-group. As predicted, no significant changes were observed in health
beliefs, perceived control, Well-being, or Treatment Satisfaction by the 7
patients whose blood glucose control did not improve during the run-in phase
CSH patients
No significant changes were observed in Well-being, Treatment Satisfaction,
perceived control, perceived Benefits of, and Barriers to treatment, perceived
treatment 'Cost-effectiveness', or perceived Vulnerability. These patients did
report greater perceived Severity of General Disorders (t = 2.8; p<O.O5).
CIT-treated patients
There were no significant changes in Well-being, perceived control, perceived

202
Severity or perceived Vulnerability. These patients did report significantly
greater Treatment Satisfaction (t = -2.5; p<zO.05), and perceived their
treatment to be significantly more 'Cost-effective' (t = -3.0; p<O.O5).
3. Intervention 2 vs intervention 3 (insulin treatinent
All patients
No significant changes in Well-being, perceived control, perceived Severity
or perceived Vulnerability were noted after the insulin treatment phase of the
study. Patients did report significantly greater Treatment Satisfaction (z =
-2.4; p<O.O2), fewer Barriers to treatment (1 = 2.2; p<0.05) and overall
viewed the treatment as significantly more 'Cost-effective' (t = -2.6;
p<zO.02). Although not statistically significant, there was an apparent
tendency for the patients to report reduced perceived Severity of Diabetes (t =
1.9; p<0.08).
CSII-treated patients
There were no significant changes in Well-being, Treatm em Satisfaction,
perceived control, or perceived Vulnerability after pump therapy. This group
did report significantly fewer perceived Barriers to treatment (1 = 3.9;
p<O.Ol), significantly greater perceived treatment 'Cost-effectiveness' (t
-3.0; p<0.05) significantly decreased perceived Severity of General Disorders
(t -3.5; p<zO.02) and significantly decreased perceived Severity of Diabetes
(t = 4.6; p<0.01).
CIT-treated patients
No significant changes were observed in Well-being, Treatment Satisfaction,
perceived Benefits of, or Barriers to treatment, perceived treatment

203
'Cost-effectiveness', or perceived Vulnerability after injection therapy.
However, this group did report significantly greater Treatment Satisfaction (z
= -2.2; p<O.0S. There was also an apparent tendency for perceived Severity
of Complications (1 = 2.12; p<zO.O8) and perceived Vulnerability to General
Disorders (t = -2.1; p.<O.09) to decrease.
4. Baseline vs Intervention 3
All patients
In order to assess the overall impact of all the interventions on the
psychological variables, the baseline measures were compared with the
post-treatment measures. These comparisons indicated that there were no
significant changes in Well-being, perceived control, or perceived
Vulnerability by the end of the study. There were, however, significant
increases in Treatment Satisfaction scores (z = -3.3; p<0.05), and perceived
treatment 'Cost-effectiveness' scores (1 = -3.4; p<0.01). In addition,
significant decreases were noted in perceived Barriers to treatment scores (t
3.4; p<zO.01), and perceived Severity of Diabetes scores (1 = 3.5; p<0.01).
CSII-treated patients
There were no significant changes in Well-being, Treatment Satisfaction,
perceived control, perceived Benefits of, or Barriers to treatment, perceived
treatment 'Cost-effectiveness', or perceived Vulnerability. This group did
report significantly decreased perceived Severity of Diabetes (t = 2.6;
p43.05) at the end of the study when compared to baseline.
204
CIT-treated patients
No significant changes in Well-being, perceived control, perceived Severity
or perceived Vulnerability were observed. However, these patients did report
significantly greater Treatment Satisfaction (1 = -4.3; p<0.01), fewer
perceived Barriers to treatment (1 = 3.0; p<0.05), and overall, perceived their
treatment to be significantly more 'Cost-effective' (t = -3.6; p<0.05) when
compared with baseline.
Comparisons between the treatment groups.
When scores from all the psychological measures were compared no
significant treatment group differences were observed at any stage of the
study. There was, however, a tendency for patients treated with CSII to
report greater Treatment Satisfaction at baseline (t = 2.0; p = 0.07) and to
perceived greater Situational Control at baseline (t = 2.05; p = 0.07).
Impact of the interventions on those who responded to
questionnaires at all stages of the study
Given that some patients did not return completed booklets of
questionnaires and some did not progress to insulin treatment, repeated
measures ANOVAs and Friedman's tests were computed as appropriate in
order to assess the impact of the interventions on those who provided
psychological data at all stages of the study (N=10: 5 treated with CSII, 5
treated with CIT). The results indicated that Well-being, perceived control,
and perceived Vulnerability did not vary significantly. However, there were
significant changes in Treatment Satisfaction (chi-square 8.4; p<zO.05),
205
perceived Barriers to treatment (F = 5.7; df 3,27; p<O.Ol), perceived
treatment 'Cost-effectiveness' (F = 8.5; df 3,27; p<0.001), and perceived
Severity of Diabetes (F = 6.6; df 3,27; p<0.01) during the study. Multiple
comparison tests indicated that
Treatment Satisfaction increased significantly between the decision to take part
(Intervention 1) and insulin treatment (Intervention 3) (p-<0.05);
perceived Barriers to treatment decreased significantly between baseline and
insulin treatment (Intervention 3) (p<zO.05) and between the decision to take
part (Intervention 1) and insulin treatment (Intervention 3) (p<O.Ol);
perceived treatment 'Cost-effectiveness' increased signficantly between
baseline and insulin treatment (Intervention 3) (p<0.01), between the decision
to take part (Intervention 1) and the run-in phase (Intervention 2) (p<0.05),
and between the decision to take part (Intervention 1) and insulin treatment
(Intervention 3) (p<O.Ol);
perceived Severity of Diabetes decreased significantly between baseline and
insulin treatment (Intervention 3) (p<zO.01)
Knowledge of Diabetes scores
When knowledge scores (Table 6.5) were compared, the results of a two
factor mixed measures ANOVA indicated that there were no significant
differences between the knowledge scores of the treatment groups (F=0.0O;
df 1,16; p=O.9), knowledge did not improve significantly at any stage of the
study (F = 1.08; df 2,32; p=O.4), and there was no interaction between
treatment group and knowledge scores (F=0.24; df 2,32; p=0.8).

206
Table 6.5: Mean (SD), median, and range of Diabetes Knowledgescores* at each stage of the study
Mean (SD)
Median Range N
Approached for study 67.6 (19.1)
66.3 12.5 - 100.0 19
Post run-in 70.9 (16.9)
76.3 27.5 - 95.0 19
Post insulin treatment 70.8 (22.4)
83.1 23.8-100.0 18
* APSCORE (adjusted percentage score)
Expectations and Experience of Treatment compared
Scores relating to the individual items from the Expectations of Treatment
and Experience of Treatment questionnaires were compared for the
CSII-treated and CIT-treated patients separately. These analyses indicated
that for both treatment groups, hypos were significantly less frequent than
expected (CSII: z = -2.2, p<0.05; CIT: z = -2.0; p<0.05), and the treatment
was significantly less difficult to deal with than expected (CSII: z = -2.1,
p<0.05; CIT: z = -2.2; p.czO.OS). In addition, the CSII-treated patients
reported that they were able to forget their diabetes significantly more than
expected (z = -2.1; p.czo.05). No other significant differences were noted in
relation to either treatment group.
Apprehension regarding insulin injections, pump therapy, and
finger pricking for HBGM
There were no significant differences between the treatment groups in the
degree of their apprehension about the use of insulin injections, CSII pump
therapy, or finger pricking in order to blood test at home. There was,
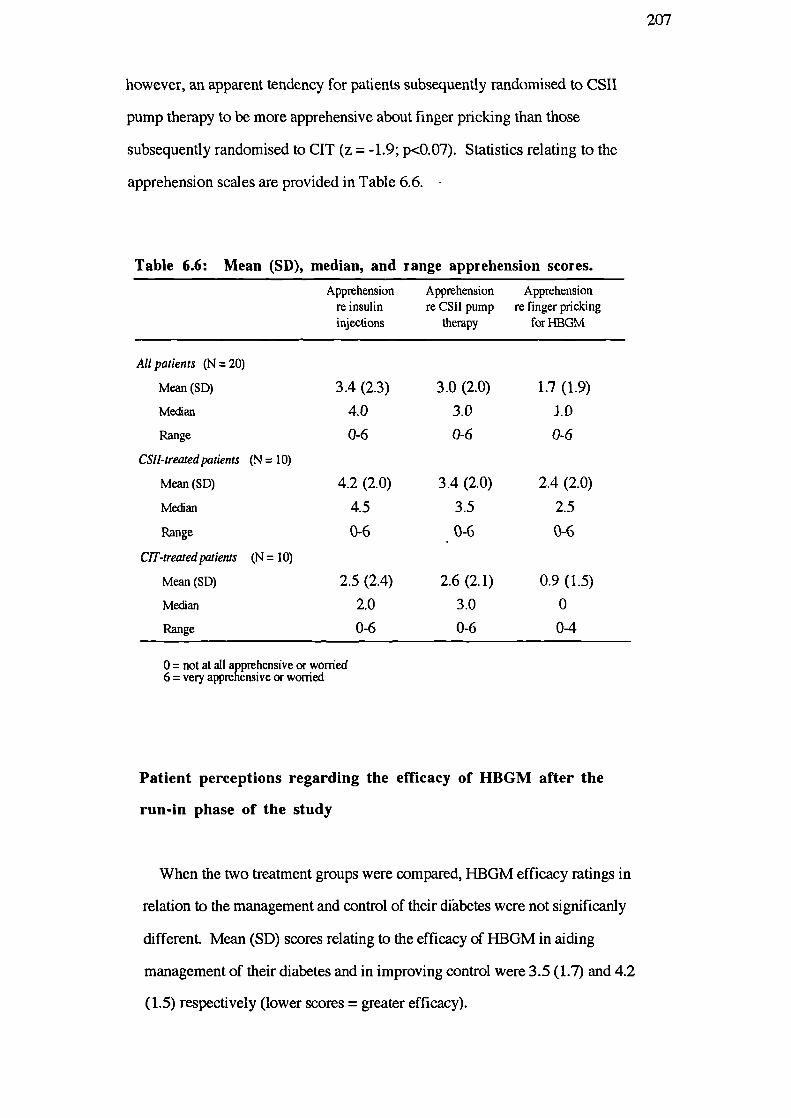
207
however, an apparent tendency for patients subsequently randomised to CSII
pump therapy to be more apprehensive about finger pricking than those
subsequently randomised to CIT (z = -1.9; p<O.O7). Statistics relating to the
apprehension scales are provided in Table 6.6.
Table 6.6: Mean (SD), median, and range apprehension scores.
Apprehension Apprehension Apprehensionre insulin re CSII pump re finger prickinginjections therapy for 1-IBGM
All patients (N = 20)
Mean (SD)
Median
Range
CS!I-treazed patients (N 10)
Mean (SD)
Median
Range
CIT-treated patients (N = 10)
3.4 (2.3)
4.0
0-6
4.2 (2.0)
4.5
0-6
3.0 (2.0)
3.0
0-6
3.4 (2.0)
3.5
0-6
1.7 (1.9)
ID
0-6
2.4 (2.0)
2.5
0-6
Mean(SD) 2.5 (2.4) 2.6 (2.1) 0.9 (1.5)
Median 2.0 3.0 0
Range 0-6 0-6 0-4
0 = not at all apprehensive or worried6= very apprehensive or worried
Patient perceptions regarding the efficacy of HBGM after the
run-in phase of the study
When the two treatment groups were compared, HBGM efficacy ratings in
relation to the management and control of their diabetes were not significanly
different. Mean (SD) scores relating to the efficacy of HBGM in aiding
management of their diabetes and in improving control were 3.5(1.7) and 4.2
(1.5) respectively (lower scores = greater efficacy).
208
Prediction of improvements in control after Intervention 2 (post
run-in phase) from the HBM variables measured after
Intervention 1 (feedback about control).
It was predicted that the impact of the first intervention on health beliefs
and the opportunity to optimize current treatment during the run-in phase of
the study, would generally increase the patients' motivation to improve their
diabetes control as far as possible. In order to assess whether health beliefs
would predict improvements in weight and blood glucose control, the
post-decision I-IBM variables were correlated with changes in percent ideal
body weight and HbA 1 after the run-in phase of the study. However, none of
the correlations were significant. Similar correlations were computed using
the post decision HBM variables and the absolute measures of weight and
blood glucose control collected after the run-in phase. Once again, however,
no significant associations were observed.
It was not possible to use pre-treatment health beliefs to predict health
outcomes after the insulin intervention because of the potency of the
intervention itself on control. Indeed, no significant associations were
observed between these variables.
Relationship of diabetes control to health beliefs at each stage of
the study
HbA 1 and percent ideal body weight measured at the various stages of the
study were correlated with concurrent health beliefs (Tables 6.7 to 6.10) in
order to assess the impact of the interventions from a cross-sectional
perspective.

209
At baseline, greater obesity was associated with fewer perceived Benefits
of treatment (r = -0.54; p<0.05) and greater perceived Severity of
Complications (r = 0.52, p.czo.05). More pessimistic subjective estimates of
diabetes control were significantly associated with greater perceived
Vulnerability to Complications [r = 0.59; p<O.O5 (meaned measure); r = 0.55;
p0.05 (single item)]. There were no significant correlations between HbA1
and the HBM variables at baseline.
Table 6.7: Relationship between the baseline HBM variablesand diabetes control (baseline)
Ideal body weight HbA1 Subjective Nestimate
of control
Perceived
Benefits -0.54 * 0.14 -0.13 14
Baniers 0.09 0.30 0.12 14
Treatment 'Cost-effectiveness' -0.27 -0.23 -0.15 14
Seventy of Diabetes 0.24 0.06 -0.23 14
Seventy of Complications 0.52 * 0.15 -0.21 15
Vulnerability to Complications 0.09 -0.00 0.59 * 15(averaged)
Vulnerability to Complications 0.10 0.38 0.55 * 14(single item)
Personal Control/Self-efficacy -0.04 0.21 0.07 13
* p<O.O5
Lower health outcome scores = better control
After being approached to take part in the insulin study, more pessimistic
estimates of diabetes control were significantly associated with fewer
perceived Benefits of treatment (r = -0.45; p<0.05). No significant
correlations were observed between percent ideal body weight or HbA 1 and
the health belief variables.

210
Table 6.8: Relationship between the post decision HBM variablesand diabetes control (post decision)
Ideal body weight HbA1 Subjective Nestimate
of control
Perceived
Benefits -0.32 0.15 -0.45 * 20
Baniers -0.18 0.21 -0.31 20
Treatment 'Cost-effectiveness' -0.00 -0.16 0.08 20
Severity of Diabetes 0.10 0.27 0.18 18
Severity of Complications 0.35 -0.12 -0.01 20
Vulnerability to Complications -0.07 -0.16 -0.33 19(averaged)
Vulnerability to Complications -0.17 -0.28 0.05 19(single item)
Personal Control/Self-efficacy -0.10 -0.06 -0.23 20
* p<O.O5
Lower health outcome scores = better control
After the run-in phase of the study, greater obesity was associated with
greater perceived Severity of Diabetes (r = 0.55; p<O.O5). No other
significant associations were observed between the outcome variables and
health beliefs (Table 6.9).
After 4 months of insulin treatment, greater obesity was significantly
associated with greater perceived Severity of Diabetes (r = 0.52; p<zO.05),
greater perceived Seventy of Complications (r = 0.59; p<zO.O5), and greater
perceived Vulnerability to Complications (meaned measure) (r = 0.48;
p<O.OS). Higher HbA 1 levels after the insulin treatment were significantly
associated with greater Vulnerability to Complications (single item) (r = 0.55;
p<0.05). It is interesting to note that no significant associations were found
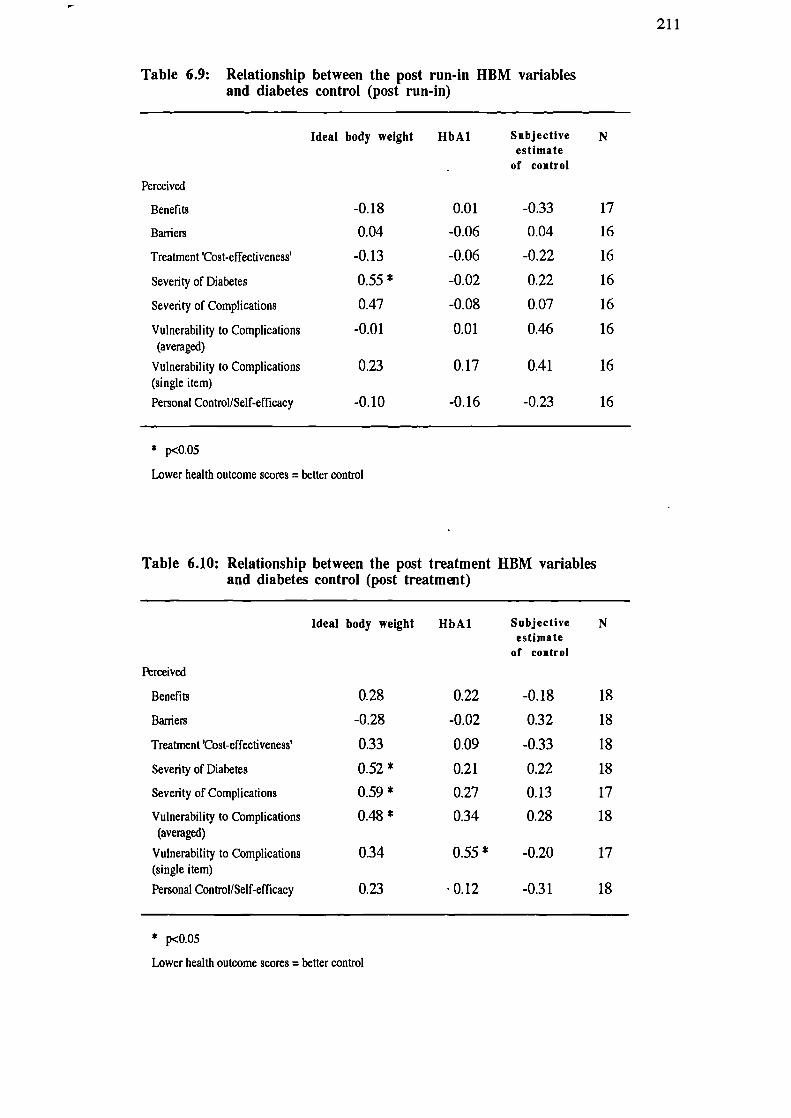
-0.18
0.01
-0.33
17
0.04
-0.06
0.04
16
-0.13
-0.06
-0.22
16
0.55 * -0.02
0.22
16
0.47
-0.08
0.07
16
-0.01
0.01
0.46
16
0.23 0.17 0.41 16
-0.10
-0.16
-0.23 16
211
Table 6.9: Relationship between the post run-in HBM variablesand diabetes control (post run-in)
Ideal body weight HbA1 Subjective Nestimate
- of control
Perceived
Benefits
Baniers
Treatment 'Cost-effectiveness'
Severity of Diabetes
Severity of Complications
Vulnerability to Complications(averaged)
Vulnerability to Complications(single item)
Personal Control/Self-efficacy
* p<o.o5
Lower health outcome scores = better control
Table 6.10: Relationship between the post treatment HBM variablesand diabetes control (post treatmit)
Ideal body weight HbA1 Subjective Nestimate
of control
Perceived
Benefits 0.28 0.22 -0.18 18
Barriers -0.28 -0.02 0.32 18
Treatment 'Cost-effectiveness' 0.33 0.09 -0.33 18
Severity of Diabetes 0.52 * 0.21 0.22 18
Severity of Complications 0.59 * 0.27 0.13 17
Vulnerability to Complications 0.48 * 0.34 0.28 18(averaged)
Vulnerability to Complications 0.34 0.55 * -0.20 17(single item)
Personal Control/Self-efficacy 0.23 0.12 -0.31 18
* p<OOS
Lower health outcome scores = better control

212
between subjective estimates of control and health beliefs after the insulin
treatment. Moreover, although not significant, the direction of the
correlations between subjective estimates of control and the health beliefs
were, in some cases, opposite to that found between the objective measures of
control and the health beliefs. In particular, it was noted that on the one hand,
greater perceived Vulnerability to Complications (single item) was associated
with higher levels of HbA 1 whilst on the other, greater perceived
Vulnerability tended to be associated with more optimistic subjective estimates
of diabetes control. A similar pattern of contrary associations was found for
perceived Benefits and Barriers to treatment, perceived treatment
'Cost-effectiveness', and perceived Personal Control/Self-efficacy (see Table
6.10).
Discussion
The clinical and physiological results indicated that, after the doctor
provided patients with feedback about their diabetes control (Intervention 1)
and after being given the opportunity to optimize current treatment
(Intervention 2), percent ideal body weight and HbA 1 did not change
significantly. However, as predicted, MbA 1 reduced significantly and
percent ideal body weight increased significantly after the insulin treatments
(Intervention 3). The incidence of hypoglycaemia in each treatment group
was generally equivalent after the insulin intervention. However, eye
assessments indicated that slight retinal deterioration occurred in more of the
CIT-treated patients. Given that 8 of the 10 patients treated with CSII were

213
able to achieve HbA 1 below 50 mmol HMF/mol Hb whereas only 3 of the 10
CIT-treated patients were able to do so, from a medical viewpoint, CSII was
regarded as the most successful method of insulin delivery in the present
study. From the patients' point of view, subjective estimates of diabetes
control did not change significantly until after the insulin interventions. There
were no significant differences between the treatment groups in ratings of
control at any stage and both groups estimated their post-treatment diabetes
control to be significantly improved when compared with pre-treatment
estimates.
The impact of Intervention 1 on the health beliefs, perceived control,
Well-being, and Treatment Satisfaction of the patients was not significant
although there was a tendency to perceive treatment to be less
'Cost-effective', and to perceive greater Severity of, and Vulnerability to
Complications. The impact of this intervention on the psychological variables
was much less than expected because it may have been mediated by
reassurances from the doctor or the patients' own expectations regarding
insulin therapy. Indeed, it is interesting to note that the patients who were
subsequently randomised to the CSII treatment group reported significantly
decreased perceived Severity of Diabetes after the intervention.
After the run-in phase of the study, which involved improved feedback
from blood glucose monitoring, intensive dietary advice and therapy, and
more frequent visits to the hospital, the patients reported significantly fewer
Barriers to treatment, and, overall perceived their treatment to be more
'Cost-effective'. In addition, the patients who were subsequently randomised
to CIT therapy, reported significantly increased Treatment Satisfaction. It
was predicted that those who managed to improve their blood glucose control
during this phase of the study would report increased treatment

214
'Cost-effectiveness' (more perceived Benefits and/or fewer perceived
Barriers), reduced perceived Severity of Diabetes, reduced perceived
Vulnerability to Complications, and improved psychological Well-being and
Treatment Satisfaction. What actually happened was that these patients
perceived their treatment to be significantly more 'Cost-effective' after the
run-in phase, but there were no other positive changes in any of the
psychological variables. As predicted, no significant changes were observed
in any of the psychological variables for those who did not manage to
improve their diabetes control. The most likely explanation for the lack of
impact on perceived Severity, Vulnerability, and Personal
Control/Self-efficacy in particular, was that the doctor had told the patients
that improvements in their glycaemic control were not sufficient to postpone
the insulin intervention. As mentioned earlier, psychological data were not
collected from those who improved their control sufficiently to continue with
the tablet treatment after the run-in phase. It is likely that positive changes in
more of the psychological variables would have been reported by these
patients.
The insulin interventions were predicted to have the greatest effect on the
psychological variables because of the marked impact of both types of insulin
delivery on the glycaemic control of the majority of the patients in the study.
Overall, the patients reported significantly greater Treatment Satisfaction,
fewer perceived Barriers to treatment, and greater treatment
'Cost-effectiveness'. In addition, the CSII-treated patients reported
significantly reduced perceived Severity of Diabetes and General Disorders,
while the CIT-treated patients reported significantly less Situational Control.
It is interesting to note that despite the greater success of CSII therapy in
reducing blood glucose levels, Treatment Satisfaction increased significantly
in the CIT-treated patients only. Although Treatment Satisfaction increased in

215
five of the eight CSII-treated patients who responded to the psychological
questionnaires, because two patients reported no significant change and one
patient was markedly less satisfied with CSII than with tablet treatment,
overall Treatment Satisfaction did not improve significantly for this group.
Given that a significant proportion of the patients reported reduced perceived
Severity of Diabetes, it is surprising that equivalent reductions in perceived
Vulnerability were not observed. Moreover, there were no improvements in
perceived Personal Control/Self-efficacy overall or within either of the
treatment groups after the insulin treatment. It is possible, however, that
beliefs about Personal Control/Self-efficacy did not change because the
intervention itself was largely responsible for improving glycaemic control.
Although psychological Well-being did not improve significantly after insulin
therapy, no significant changes were observed after the earlier interventions
either, which from a positive point of view, indicates that Well-being was not
damaged by the study.
It might be argued that significant changes in some of the psychological
variables were not evident because each intervention produced only small
incremental changes. The impact of the whole study was therefore assessed
by comparing the psychological measures at baseline with those measured
after the insulin intervention. It was found that by the end of the study,
perceived Barriers and perceived Severity of Diabetes had reduced
significantly, and perceived treatment 'Cost-effectiveness' and Treatment
Satisfaction had increased significantly. There were no changes, however, in
the I-IBM measures of perceived Vulnerability or perceived Personal
Control/Self-efficacy. Furthermore, no significant changes were observed in
psychological Well-being, perceived Medical Control or perceived Situational
Control.

216
When the psychological data from the patients who responded to
questionnaires at all stages of the study were assessed in repeated measures
ANOVAs and Friedman's tests, the pattern of results was similar to that
reported above. Significant changes were observed in Perceived Barriers to
treatment, perceived treatment 'Cost-effectiveness', perceived Severity of
Diabetes, and Treatment Satisfaction. As found previously, however,
perceived Vulnerability, perceived control, and psychological Well-being did
not vary significantly at any stage of the study.
Given that CSII therapy was more successful than CIT therapy in reducing
blood glucose levels, the psychological measures.relating to each group were
compared. The results of these analyses indicated that there were no
significant differences between the treatment groups for any of the
psychological measures (including Treatment Satisfaction) at any stage of the
study. Perhaps this is not surprising given that there were also no significant
differences between the groups in subjective estimates of diabetes control,
ratings of apprehension regarding insulin injections and CSII pumps, and
efficacy of HBGM ratings. Furthermore expectations about the insulin
treatments were generally in accordance with subsequent experience for both
of the treatment groups. In addition, not only were Diabetes Knowledge
scores comparable for each group, longitudinally the scores overall did not
improve significantly at any stage of the study.
From a cross-sectional perspective, it was notable that the correlations
between some of the baseline health beliefs and concurrent health outcomes
were much weaker than was found for the whole of the baseline sample (see
Chapter 3). In particular, no significant associations were found between the
health outcomes and perceived Barriers to treatment, perceived treatment
'Cost-effectiveness', perceived Severity of Diabetes, and perceived Personal

217
Control/Self-efficacy. These results may be explained by the small number of
subjects who provided psychological data at this stage of the study: only 14 of
the 20 insulin study participants were asked to complete psychological
questionnaires. However, as noted earlier, the sex ratio of the insulin study
participants was reversed when compared to the overall baseline and
education study samples, so it is also possible that these patients were not
representative of Type II patients with progressive B-cell dysfunction.
Another possible, and more likely explanation may be that patients of this type
who are not particularly overweight, do not receive adequate feedback about
their diabetes control until an intervention becomes necessary and thus their
health beliefs are only weakly related to health outcomes. It is interesting to
note that after the first and second interventions, any correspondence between
health beliefs and the objective and subjective indices of diabetes control
virtually disappeared whereas one might have expected a greater correlation
because of improved feedback. However, since on the one hand, the patients
were told that their diabetes control was unsatisfactory, irrespective of actual
levels of glycaemic control, and on the other, that their tablet treatment was
not satisfactory, the patients' health beliefs and subjective estimates of
diabetes control were probably distorted. After four months of using CSII or
CIT. it was predicted that the patients would be able to assess accurately the
efficacy of the insulin treatments in improving their diabetes control because
of continuous feedback from HBGM during the insulin treatment phase and
feedback from the doctor at the end of the study. As a result, the
correspondence between health beliefs and the health outcomes at this stage
was expected to increase significantly. In practice, however, although
several of the predicted correlations re-emerged at this point, most of the
significant associations observed were between the health beliefs and ideal
body weight rather than HbA 1. Moreover, none of the health beliefs were
significantly associated with subjective estimates of diabetes control. This
218
pattern of results indicates that the patients beliefs about Severity and
Vulnerability were affected by feedback about their weight control rather
than their blood glucose levels. Furthermore, the direction of some of the
correlation coefficients relating to subjective estimates of control were
sometimes opposite to those for ideal body weight and HbA 1 indicating that
some of the patients with relatively poor blood glucose and weight control
were more optimistic when giving their subjective estimates of control or
vice-versa. Indeed, when the objective and subjective post treatment
measures of diabetes control were correlated, the results were non-significant.
It seems that several of the patients were unable to use the continuous
feedback from HBGM in order to self assess their diabetes control, possibly
because the feedback from the doctor at the beginning of the study had
undermined their confidence to make such judgements. (It is also worth
noting that knowledge scores for some of the patients were very poor.)
Alternatively, these patients may have been unable to translate their blood
glucose readings into meaningful information such as good, adequate, or poor
control. The results also suggest that the doctor may have given some of the
patients the impression that their diabetes was better controlled than it was,
possibly because patients with poorer control were more likely to seek
reassurance. The unclear relationships found in the cross-sectional data may
explain why perceived Vulnerability and perceived Personal
Control/Self-efficacy did not change as predicted during the study.
When the results of the present study are assessed overall, the impression
given is that only beliefs about Barriers to treatment, treatment
'Cost-effectiveness', Severity of Diabetes, and Treatment Satisfaction were
reactive to the different kinds of intervention used here. The clinical and
educational implications may be that attempts to change perceived

219
Vulnerability and perceived Personal Control/Self-efficacy using similar
interventions will be unsuccessful. However, given that significant
improvements in perceived Personal Control were reported in the educational
intervention study (Chapter 5), it is possible that the interventions in this
study did not make a sufficient impact or were of the wrong kind in order to
change these beliefs. It is also likely that these beliefs were mediated by other
variables such as expectations about the insulin treatment, personal coping
strategies, reassurance by the medical staff, and subjective self-assessments
of control. Given the number of variables and interventions examined and the
complicated picture which emerged, the greatest limitation of this study was
that the number of subjects was too small. As such, it was not possible to
generalize the results to the population as a whole. A series of single case
studies might have been a more fruitful approach for this sample size, or,
given a much larger sample, sub-group effects could have been examined. As
far as the present author is aware, there have been no published studies
concerning diabetes which have assessed the effects of any type of
intervention on all of the I-IBM variables. Further research involving a variety
of interventions and greater numbers of patients are needed, therefore, in
order to confirm the present findings and to assess the effect of any health
belief mediators. When a greater pool of information about the dynamics of
health beliefs, their origins, and relationships with mediating variables has
been collected, researchers will be in a better position to tailor future
interventions accordingly and target beliefs appropriately.

220
CHAPTER SEVEN
OVERVIEW AND CONCLUSIONS
Rationale for the research
The studies described in the preceding chapters have attempted to address
some of the major problems of previous I-IBM research which were discussed
in Chapter 1. Shortcomings of this research include the paucity of health
belief scales with reported reliability and validity, the use of data drawn from
heterogeneous samples of subjects, and outcome measures which were
measured retrospectively making it impossible to determine the direction of
associations with HBM components. The health beliefs research reported in
the present thesis involved the development and validation of health belief
scales designed specifically for people with tablet-treated diabetes. The scales
were also validated using prospectively measured outcome data. A particular
problem with past health beliefs research, has been that previous researchers
either failed to consider more than one variable at a time or made the implicit
assumption that the dimensions of the HBM combine additively. The original
formulation of the HBM suggested a multiplicative relationship between
certain components. However, there have been no attempts to specify the
precise way in which the variables combine to predict behaviour or health
outcomes. One of the main aims of the present thesis, therefore, was to
attempt to specify the relationships between the components of the HBM
(Chapters 4 & 5). Furthermore, since the various dimensions of the I-IBM
have previously been successful in accounting for only a moderate amount of
variance in health behaviours, it was considered possible that certain key
elements may be missing from the model. The research described in Chapter
4 and Chapter 5 therefore additionally explored the possibility of extending

221
the model to include the concepts of locus of control and self-efficacy.
Finally, since previous research has failed to acknowledge that the
associations between health beliefs and outcomes are likely to involve a
dynamic process; outcomes will affect health beliefs as well as health beliefs
affecting outcomes; a considerable amount of longitudinal research is
warranted in order to understand and specify the nature of the process
involved. The longitudinal study described in Chapter 6 is an attempt to
explore the dynamics of health beliefs before and after the various
interventions of an insulin treatment study.
Development and validation of the HBM measures
An attempt was made to represent unambiguously all the dimensions of the
I-IBM in relation to tablet-treated diabetes. The design of the measures was
based on previous experience of developing and interpreting findings from
scales developed for insulin-requiring patients and ultimately consisted of five
separate scales to measure perceived Benefits of treatment, perceived Barriers
to Treatment, perceived Severity of Complications, perceived Vulnerability to
Complications, and perceived Vulnerability of the "average person" to
Complications. For the purpose of comparison, scales to measure perceived
Severity of General Disorders, perceived Vulnerability to General Disorders,
and perceived Vulnerability of the "average person" to General Disorders
were also constructed. Furthermore, a two item measure of perceived
Severity of Diabetes and a single item measure of "Complications arising from
Diabetes" were employed in the studies.
The objective outcome variables used in order to assess the efficiency of the
HBM measures were HbA1 and percent ideal body weight The HBM
predicts behaviour, however, and while the outcome measures employed

222
were intended to be the result of relevant behaviour, they are vulnerable to
other factors such as incidence of intercurrent illness and the adequacy of the
treatment recommendations for the individual concerned. (Indeed, given
these mediating influences, it could be argued that the I-IBM measures used
were extremely effective in explaining the outcome variance.) On the other
hand, it was not possible to obtain reliable behavioural measures from the
samples studied because the treatment regimen involves daily lifestyle
behaviours. This is in contrast to other types of health behaviours which
might involve a single observable action such as attending a health screening
programme. It may have been possible to obtain self-report measures of diet
and exercise as indices of behaviour but self-report measures are often
influenced by a subject's reluctance to report non-adherence to treatment
recommendations. On balance, therefore, it was considered that HbA 1 and
percent ideal body weight were more appropriate outcome measures in
diabetes management
The health belief scales were shown to have satisfactory internal reliability,
and patterns of correlations with other variables in the baseline and education
studies provided evidence for the construct validity of all the measures. Since
the participants were able to indicate on the perceived Vulnerability
questionnaire whether or not they already had a particular health problem, it
was noticed that responses to the single item measure of perceived
Vulnerability were different from the composite measure, probably as a result
of inadequate knowledge regarding which disorders are complications of
diabetes. As predicted, therefore, the two item measure of perceived Severity
of Diabetes, and the single item measure of perceived Vulnerability to
Complications were more strongly associated than the composite measures
with health outcomes. It was also noted that the baseline health belief
measures were more strongly associated with subjective estimates of diabetes

223
control than with percent ideal body weight or HbA 1, indicating that prior to
the interventions, these patients had received inadequate or misleading
feedback about their diabetes management.
Contrary to the predictions of the original HBM, greater perceived
Vulnerability and Severity were found to be associated with poorer diabetes
control. Although the health outcomes were measured retrospectively, the
findings were in accordance with other published studies in this field (Harris,
Linn & Skyler, 1987; Brownlee-Duffeck, Peterson, Simonds, Goldstein,
Kilo & Hoette, 1987) and seemed to indicate that not only may health beliefs
affect outcomes but these outcomes, in turn, may affect health beliefs. The
education intervention study should have helped to clarify these associations
because the outcome variable was measured prospectively. However,
unexpectedly, greater perceived Vulnerability and Severity were significantly
associated with poorer blood glucose control six months later indicating that
Vulnerability and Severity not only reflected current health status but also
seemed to predict continuing poor control. Given that lower perceived
Personal Control/Self-efficacy was associated with poor control six months
later, the results suggest that very poor control and the concomitant feelings of
high perceived Vulnerability to Complications and low perceived Personal
Control/Self-efficacy may have been due to poor management skills or
knowledge which were not improved significantly by the education sessions
and therefore frustrated any attempt to improve diabetes control. It was
interesting to note, however, that greater perceived treatment
"Cost-effectiveness" was associated on the one hand, with greater perceived
Threat (Severity x Vulnerability) whilst on the other, it was associated with
lower perceived Vulnerability and lower perceived Severity. Moreover,
subsequent regression analyses indicated that greater scores for the composite
of Severity x Vulnerability x treatment "Cost-effectiveness" were associated
with lower follow-up HbA1. This suggests that for some people at least,

224
increased Vulnerability and Severity acted as motivators to improve control
provided that treatment was also perceived to be "Cost-effective". The results
suggest that the interrelationships between the HBM variables and their
association with health outcomes are complex and mediated by many
contextual factors such as physiological status, knowledge, skills, resources,
and feedback. Consideration of the characteristics and source of any sample
studied would therefore appear to be crucial when assessing the explanatory
power of the HBM.
The perceived Vulnerability questionnaire was designed so that respondents
were not only asked to rate their own susceptibility to complications and other
disorders but they were also asked to rate the susceptibility of an "average
person". In accordance with the findings reported by Weinstein (1982, 1984,
1987) the patients rated themselves to be less vulnerable to the individual
complications and other disorders when compared to the "average person".
However, when the single-item measures of personal and "average person"
Vulnerability to Complications were compared, the optimistic bias
disappeared. When patients responded to the individual items from the
composite measures of perceived Vulnerability, the ratings depended upon
their knowledge about which disorders are complications of diabetes. It
seems that the general tendency to assume that "it won't happen to me" was
present when disorders were thought to be unrelated to diabetes. With the
single item measures, however, patients were in no doubt about what they
were being asked to rate and thus the optimistic bias diminished because the
risk seemed more salient. The measures of "average person" Vulnerability
were therefore discarded when exploring the relationships between the
components of the HBM. However, it would still be worthwhile comparing
perceived Vulnerability of the "average person" with beliefs about personal
Vulnerability if knowledge about the individual complications is poor. This
would provide useful information for the targeting of educational

225
interventions.
Relationships found between the HBM components
Exploration of the relationships between the HBM components was first
carried out using the baseline data (Chapter 4). The aim was to establish
whether the individual dimensions of the HBM combine in a purely additive
fashion, or whether multiplicative relationships between the various
components would explain significant additional amounts of variance in health
outcomes. An additional aim was to assess whether the measure of perceived
Personal Control/Self-efficacy (developed from the responses of the same
sample) could be integrated within the I-IBM and if so, specify its relationship
to the other components. In order to investigate the relationships between the
HBM variables and the outcome variables, multiple regression analyses were
employed. It is possible, however, to use other types of analyses in causal
inference such as path analysis or structural equation modelling. However, at
the time of the studies, the resources enabling use of these techniques were
not available to the present author. As recommended by Evans (1991),
hierarchical multiple regression was used to test for the hypothesized
multiplicative relationships between the variables because simple correlational
analyses would have been inappropriate (Schmidt, 1973). The amount of
variance explained in all three outcome variables (baseline percent ideal body
weight, HbA 1, and the patients' subjective estimates of diabetes control) was,
however, only small to moderate, and in all cases none of the multiplicative
composites added significantly to the overall explanation. When perceived
Personal Control/Self-efficacy was included in the regression equation both as
an individual variable and as part of a multiplicative composite, the amount of
variance explained increased significantly, particularly in relation to percent
ideal body weight and subjective estimates of diabetes control, which
226
indicated that this construct could be usefully integrated into the HBM.
However, once again, none of the multiplicative composites contributed
significantly to the overall explanation. These results seemed to indicate,
therefore, that the original and newly-introduced components of the HBM
combine in an additive rather than a multiplicative manner.
Since regression analyses assume that the independent variables in the
equation are linearly related to the dependent variable, it was considered
possible that non-linear combinations of the health beliefs might provide a
better explanation of health outcomes. The baseline health belief variables
were therefore dichotomized and combined in various ways and then related
to the outcome variables in non-parametric ANOVAs. Kruskal-Wallis H tests
were used in order to explore the non-linear hypothesis because the outcome
variables were continuous. It has been pointed out to the present author,
however, that if the outcome variables were categorized as well as the process
variables, loglinear modelling could have been employed. The results
indicated that when the onginal and newly-introduced health belief variables
were all combined, they were very significantly related to all three outcomes.
In relation to HbA 1 and percent ideal body weight, however, the best diabetes
control was found to be associated with a pattern of beliefs predicted to be
associated with poorer control [low perceived treatment
low perceived Threat (Severity x Vulnerability)Ihigh perceived Personal
Control/Self-efficacy]. However, the respondents with this belief pattern
were also the most depressed, and were among the most anxious and least
satisfied. Non-linear combinations of the health beliefs were therefore
particularly successful in predicting health outcomes and when viewed in
relation to Well-being and Treatment Satisfaction, helped to explain why
linear combinations of the baseline health beliefs were successful in
explaining, at best, only moderate amounts of outcome variance.

227
Although combining the variables in a non-linear fashion was successful in
the prediction of health outcomes, surprisingly, the predicted interaction
between perceived Severity and Vulnerability was not observed. However, it
was possible that these results were due to the retrospective nature of the
baseline outcome variables, and because the respondents' beliefs about their
diabetes and its management were mediated by lack of knowledge and
inadequate feedback. The relationships between the I-IBM components were
therefore reassessed using data from the educational intervention study
(Chapter 5) which involved a measure of outcome collected approximateley
six months later. Unfortunately, the number of cases analysed was relatively
small and therefore the amount of variance in health outcome explained may
have been inflated. Nevertheless, the results of the regression analyses
indicated that when all the education attenders were considered, and General
Well-being was partialled out on the first step, a substantial amount of
variance in HbA 1 six months later was explained by all the health belief
variables, including perceived Personal Control/Self-efficacy. Moreover, a
significantly unique contribution to the overall explanation was provided by
an interaction between perceived Severity of Diabetes and perceived
Vulnerability to Complications (single item). As found at baseline, however,
perceived Severity contributed insignificant amounts of unique variance to the
overall explanation when considered individually. These results suggested,
therefore, that the relationships between the components of the HBM when
predicting health outcome should be specified as
HO yr + (S x V)T + (Ben - Barr) + PCSE
where HO represents health outcome, yr represents reversed perceived
Vulnerability, (S x V)' represents the interaction between perceived Severity
and Vulnerability (Threat) reversed, (Ben - Barr) represents perceived

228
Benefits less perceived Barriers (treatment "Cost-effectiveness"), and PCSE
represents perceived Personal Control/Self-efficacy. Unfortunately, the
relationship between perceived Personal Control/Self-efficacy could not be
investigated because these constructs were measured in unison. Future
research involving the separate measurement of these beliefs is therefore
desirable in order to clarify their relationship. As suggested earlier, when
discussing the direction of the association between health outcome and
perceived Severity and Vulnerability, the relationships between the I-IBM
components might need to be redefined depending on the characteristics of the
sample studied. Indeed, the education study data were collected from
patients who were self-selected and not representative of the population as a
whole. Moreover, because greater perceived Vulnerability and perceived
Threat were associated with poorer control six months later, these variables
probably did not act as true predictors of health outcome in this study but
merely reflected other beliefs and continuing health status. In general, the
findings indicate that the improved prediction of HbA 1 was due to the
improved knowledge of the patients and the prospective nature of the health
outcome measure in this study. An additional explanation may be that the
educational intervention was instrumental in health beliefs becoming more
salient to health outcomes. It is possible that beliefs may remain dormant and
become increasingly less influential in the determination of behaviour until a
change demands that beliefs should be reappraised in order to decide how to
respond. Indeed, in the context of the HBM, the educational intervention
could be viewed as a "cue to action".
The assessment of health beliefs in relation to baseline and post education
health outcomes has highlighted that Well-being is a powerful mediator which
affects the explanatory power of the HBM. Dunn (1986) found that the
people who left an education programme feeling more emotional about
diabetes showed a bigger improvement in glycosylated haemoglobin than

229
those who went away feeling less emotional distress and argued that it is
necessary to reappraise the assumption that feeling better is a satisfactory
criterion for educational success. Indeed, this would be consistent with the
predictions of the original I-IBM. The results from the baseline study suggest,
however, that some people with very good diabetes control also reported poor
psychological Well-being. Clearly, the achievement of excellent blood
glucose levels is far from satisfactory if this results in the patient feeling
miserable. The implication of this finding is that studies assessing the
efficacy of treatment interventions need to consider psychological as well as
the usual physiological, clinical, and behavioural outcomes. Future research
in diabetes might benefit, therefore, from using a multivariate measure of
health outcome so that, for example, the best outcome would be low
HbA 1lhigh psychological Well-being/high treatment satisfaction and the
worst outcome would be high HbA 1/low psychological Well-being/low
treatment satisfaction.
The effects of the intervention studies on health beliefs and
related outcomes
The education sessions resulted in significantly increased knowledge and
Treatment Satisfaction, and for those whose HbA 1 was relatively poor at
baseline, improved glycaemic control. Furthermore, there was a tendency
for Well-being to deteriorate but this did not quite reach significance. After
education the participants also perceived significantly more Benefits, fewer
Barriers, greater treatment "Cost-effectiveness", and increased Personal
Control/Self-efficacy. However, beliefs about Severity and Vulnerability
were not significantly different from those at baseline. Interestingly, greater
improvements in knowledge were associated with more perceived Barriers,

230
fewer perceived Benefits, lower perceived treatment "Cost-effectiveness",
lower psychological Well-being and lower Treatment Satisfaction. Although
these negative effects of education were not predicted, it is likely that prior
lack of knowledge was associated with an unrealistic view of diabetes and
thus large increases in knowledge would have been very disconcerting in the
short term.
In the insulin study, the effects of a series of interventions on health beliefs
and related outcomes were assessed over a longer period. In addition to the
baseline data, beliefs were measured after the participants were first informed
of their poor glycaemic control and its implications, after a period of
optimizing control on culTent treatment with the aid of home blood glucose
monitoring, and several months later when they had become used to using
CIT or CSII pump therapy. The idea behind this research was to gain a better
understanding of the dynamics and reactivity of components of the HBM.
The first intervention did not produce significant changes in health beliefs but
the second intervention resulted in reduced perceived Barriers and greater
treatment "Cost-effectiveness". Although it was predicted that the insulin
intervention would have the greatest impact on the psychological variables, it
was surprising that more changes in beliefs were not observed after the first
two interventions. Post hoc assessment of these results suggested, however,
that the beliefs and attitudes of the study participants were probably mediated
by reassurances and feedback from the doctor. After the insulin intervention,
the patients overall reported significantly fewer perceived Barriers, greater
treatment "Cost-effectiveness", and greater Treatment Satisfaction. In
addition, the CSII-treated patients reported significantly reduced perceived
Severity of Diabetes. However, no changes in perceived Vulnerability or
perceived Personal Control/Self-efficacy were observed. It is likely that
beliefs about Personal Control/Self-efficacy did not alter because the
intervention itself was largely responsible for improving glycaemic control. It

231
was surprising, however, that despite reductions in perceived Severity of
Diabetes, there were no equivalent changes in perceived Vulnerability to
Complications. Given that, in the education study, greater perceived
Vulnerability was associated with poorer glycaemic control six months later it
may be that this belief is not as dynamic as first thought. However, it is also
possible that, beliefs about Vulnerability were mediated throughout the study
by reassurances and feedback from the doctor. Indeed, cross-sectional
analyses of the post-treatment data indicated that some of the patients were
under the impression that their diabetes was better controlled than it was. A
considerable amount of further research involving a variety of interventions
and greater numbers of patients are needed in order to clarify the sources and
nature of changes in the HBM components. When a greater pool of
information about the dynamics of health beliefs and their mediators have
been assessed, however, it is likely that researchers will be better placed to
tailor future interventions accordingly and target beliefs appropriately.
Critique
The studies described earlier have provided interesting information about the
nature of the relationships among HBM components and the value of
including efficacy and control beliefs in the model. However, some
limitations of the research should be acknowledged.
In Study 1 (Chapter 4), health outcomes were collected at the same time as
the psychological variables and thus conclusions about cause and effect are
problematic. Moreover, most of the sample studied had relatively poor
knowledge about diabetes and its management and received limited or
inaccurate feedback about their control which confounded the belief-behaviour
232
link. It is not surprising, therefore, that relatively small amounts of the
variance in health outcomes were explained. Study 2 (Chapter 5) aimed to
tackle these problems by examining the effects of an education session on the
health beliefs and psychological well-being of the participants, and collecting
a measure of health outcome six months later. However, the sample studied
was self-selected and proved to have some characteristics which differed
significantly from those of the baseline sample. The results from the study
cannot be generalized, therefore, to the population as a whole. A further
problem with Study 2 was that the number of subjects was quite small and, in
some cases, barely sufficient for the number of variables included in the
regression analyses. The results from these analyses should be interpreted,
therefore, with some caution.
Study 3 (Chapter 6) examined a large number of variables before and after
several interventions over a relatively short period of time. Given the small
number of subjects in the study and the complex picture which emerged, it
was not possible to make broad generalizations about the results. A series of
single-case studies might have been more appropriate with such a small
sample, enabling inspection of individual variations in beliefs in conjunction
with outcomes. A larger sample would have enabled the inspection of
sub-group variations.
Certain belief measures selected for analysis in the studies (perceived
Severity of Diabetes and perceived Vulnerability to Complications) were
composed of one or two items only and, as such, may be unrepresentative
measures of these belief constructs. These measures were selected, however,
because the composite measures were affected by knowledge and would have
provided a less reliable indicator of these beliefs. It is also acknowledged that
use of the treatment "Cost-effectiveness" variable (Benefits minus Barriers)
prevented the possibility of examining the impact of absolute levels of

233
perceived Benefits and Bamers in the additive and interactive models. Since
responses to the perceived Benefits measure were skewed, however, the
treatment "Cost-effectiveness" measure was employed in regression analyses
because it normalised the distribution.
Multiple regression analyses and Kruskall-Wallis H tests were used to
examine the relationships between the HBM components and the outcome
variables. However, it is recognised that other types of analyses could have
been employed such as path analysis, structural equation modelling, and
loglinear modelling. Consideration of these statistical techniques is
recommended for future HBM research.
Implications of the studies for future HBM research
In accordance with the revised explanatory model of Rosenstock, Strecher
and Becker (1988) which includes self-efficacy in the HBM, the present
research examined the effects of incorporating an overlapped measure of
control and efficacy expectation into the model. This measure of perceived
Personal Control/Self-efficacy was successful in predicting small amounts of
variance in outcome in the baseline study and significant amounts of variance
in outcome after education. It would seem, therefore, that control and
efficacy expectations are important in the prediction of health behaviour and
that these should be incorporated into the HBM.
A major aim of the research was to assess whether additional proportions of
variance could be explained by multiplicative or categorical combinations of
the I-IBM variables. Previous HBM research has focused on the predictive
power of the individual components of the model and virtually ignored the
possibility of looking at interactions between its components. Results from

234
the present studies indicated that the relationships between health beliefs and
outcome variables are complicated because there are several mediating factors.
Indeed, researchers need to consider the characteristics and source of any
sample when assessing the explanatory power of the HBM. In Study 1
(Chapter 4) it appeared that the relationships with outcome variables were best
predicted by non-linear combinations of variables but only when viewed in
relation to Well-being and Treatment Satisfaction. On the other hand, when
outcome was measured prospectively after an education intervention (Chapter
5), individual and multiplicative combinations of variables were successful in
accounting for significant proportions of the variance in outcome but, once
again, only after General Well-being had been partialled ouL It appears,
therefore, that health beliefs are mediated by the well-being of the patient and
thus future HBM research should take account of this variable.
Overall, it seems that health outcomes were best predicted from HBM
variables in a linear model but only after an intervention which significantly
improved knowledge about diabetes management (removing another
mediating factor) and which also provided a cue to action. Indeed, when
variance from mediating factors was removed, the multiplicative combination
of perceived Severity of Diabetes x perceived Vulnerability to Complications
accounted for an extra 12% of the variance in I-IbA 1 six months later. One of
the unexpected findings of the research studies, however, was that greater
perceived Vulnerability and Threat (Severity x Vulnerability) not only reflect
current health status but also predict continuing poor control. As such these
variables do not appear to be predictors of outcome but merely reflect other
beliefs (e.g. perceived control/self-efficacy) and abilities (knowledge, skills,
or resources). This raises doubts, therefore, about the necessity of including
these variables in the HBM in the first place but more research is needed in
order to clarify the efficacy of these components in the model. It should also
be remembered that only a limited number of possible interaction effects were

235
tested in the analyses. Other combinations of variables in the HBM (including
perceived Severity or Vulnerability) could have been examined given suitable
predictions.
In conclusion, the present research has indicated that beliefs about efficacy
and control are important in the prediction of health behaviour and as such
should be included in the I-IBM. In addition, it appears that interactive
components of the model can explain extra variance not accounted for in the
purely additive model after controlling for mediating variables such as
well-being and knowledge. However, the efficacy of the severity and
vulnerability components as predictors of health outcomes needs to be
examined in further research. Moreover, other multiplicative relationships not
assessed in the present research could be explored.
Suggestions for future research
Measurement of health value
Since health value is posited by the HBM to be a necessary prerequisite if
beliefs are to have an effect on behaviour, adequate measurement of this
construct appears to be particularly important when predicting health outcome
from the HBM components. In the baseline and education intervention
studies, health value was measured using a single item which proved to have
poor explanatory value. It is possible, however, that the item was an
unrepresentative measure of health value and thus further research involving
the development of a multi-item instrument is required.

236
Health professionals as a source of variance in health outcomes
The present research has suggested that health professionals can be potent
mediators of patientsv health beliefs through the quality of feedback and
advice they provide. In order to tease out such mediating influences, it is
desirable that future studies should also measure the beliefs and behaviours of
relevant health care staff. Indeed, Marteau and Johnson (1990) have argued
that there is a case for using the I-IBM on a different level to explain and
predict the behaviour of health professionals. They have also suggested that
more of the variance in health outcomes of patients might be explained by the
behaviour of health professionals than the behaviour of the patients
themselves.
The dynamic perspective
The I-IBM and other theories of health behaviour treat beliefs as continuous
dimensions. The underlying assumption is that progress from ignorance to
action in relation to a particular belief is determined by the individual's
position along a continuum. However, a number of researchers have
suggested that a single prediction rule is inadequate to explain reactions to
health threats. The alternative suggestion is that beliefs should be described in
terms of a series of stages (Janis & Mann, 1977; Weinstein, 1988;
DiClemente, Prochaska, Fairhurst, Velicer, Velasquez & Rossi, 1990).
Weinstein's (1988) model of the Precaution Adoption Process suggests that
there are distinct stages in the development of each type of belief. First of all,
individuals must learn that a hazard exists. Failure to adopt a particular health
protective behaviour may reflect ignorance of the threat. Indeed, in the
present research, a large number of the patients were not aware that heart

237
disease is a complication of diabetes so it is likely that they did not appreciate
fully why a low fat diet is particularly recommended for this population.
After this first stage, Weinstein suggests that individuals must be convinced
that the risk is significant to the population as a whole. Patients with Type II
diabetes, for example, need to know that 60 to 70 per cent of deaths in this
population are caused by myocardial infarction and strokes, which represents
a two- to three-fold increase in mortality rate when compared to the
non-diabetic population. Once the size of the risk has been established,
however, some people may be over optimistic regarding their own risk ("it
won't happen to me"). Individuals therefore need to move on to a further
stage of belief development where they acknowledge their own personal risk
before they are likely to consider taking action. Weinstein suggests that
development stages in other beliefs such as perceived severity and beliefs
about precaution effectiveness can also be differentiated in a similar manner.
He points out, however, that although beliefs about vulnerability, severity,
benefits and barriers may develop simultaneously, it is unlikely that interest in
precautions would precede the perception that a hazard is a significant
personal threat. A further stage in the precaution adoption process involves
the degree of priority attached to the intended action in the context of an
individual's general lifestyle. As illustration, Weinstein uses a messy desk
analogy where proposals for new initiatives arrive every day but there are also
routine responsibilities to be earned out. A good idea may get approved but
constraints on time and resources may make it impossible to carry out
immediately. Over time, the good idea may become buried and forgotten, or
may be passed over in favour of a low priority task that can be accomplished
quickly. Weinstein suggests therefore that action depends on the complexity
of the precaution, on events which make the information about action more
salient, and on reminders.
The stage perspective of preventive health behaviour seems to dismiss the

238
idea that individuals perform a cost-benefit analysis of precautions
recommended or that the force behind the decision to act is an algebraic
function of vulnerability and severity. However, it could be argued that when
(or ii) people reach the final stage of belief development that such
mathematical formulations are still valid. Indeed, a significant finding of the
research presented in the present thesis is that beliefs vary according to
different contexts such as knowledge, feedback, physiological status, and
resources. Outcome prediction in the education intervention study was
probably improved, not only because the intervention itself was a cue to
action (recall the messy desk analogy) but also because most participants had
been able to develop their health beliefs further through the education process.
The strength of Weinstein's precaution adoption theory is that it is a dynamic
perspective and as such may account for large amounts of variance in health
outcome previously unexplained. The implication for the HBM is that a more
complex formulation of its basic components needs to be tested. This would
involve the development of scales which measure the stage of belief
development as well as the strength of the particular belief. Furthermore,
because a stage theory suggests that variables important in producing
movement towards action at one point in the precaution adoption process may
not be relevant at another, intervention studies would need to be tailored
accordingly. Finally, since the inclusion of a combined measure of
self-efficacy and personal control in the model increased the amount of
variance explained in the baseline and education intervention studies, it is
likely that these constructs could also be integrated in any new formulation of
the HBM.

239
Final Conclusions
The research presented in this thesis has shown that the relationships
between the HBM variables are complex because beliefs are mediated by
many factors such as inadequate feedback and kiiowledge. As a result, it is
feasible to specify the relationships between the HBM components for a
specific group of people, but not for the population in general. Indeed, the
improved outcome prediction after the education intervention was probably
the result of reducing the effects of particular mediating factors. Since the
patients studied had experienced their diabetes for varying periods of time,
had different educational experiences, and differed in health status, their
individual beliefs were likely to differ in a qualitative as well as a quantitative
manner. Given these conclusions, it would appear that current formulations
of the HBM do not adequately account for the dynamics of beliefs in real life.
Adoption of the stage perspective of preventive health behaviour would
therefore seem to be the best way forward in this field of research. The
results of the insulin intervention study also suggest that measurement of
medical staff's beliefs would provide further explanations of patients' health
behaviour. It is even possible that the two frameworks of beliefs could be
integrated.

240
REFERENCES
Aho WR (1979) Participation of senior citizens in the swine flu inoculation
program: An analysis of health belief model variables in preventive health
behaviour. Journal of Gerontology, 34: 201-208.
Aho WR (1979) Smoking, dieting, and exercise: Age differences in attitudes
and behaviour relevant to selected health belief model variables. Rhode
Island Medical Journal, 62: 85-92.
Alberti 1(0MM and Gries FA (1988) Management of non-insulin-dependent
diabetes mellitus in Europe. A consensus view. Diabetic Medicine, 5:
275-281.
Alogna M (1980) Perception of severity of disease and health locus of control
in compliant and noncompliant diabetic patients. Diabetes Care, 3:
533-534.
Antonovsky A and Kats R (1970) The model dental patient. An empirical
study of preventive health behaviour. Social Science and Medicine, 4:
367-380.
Bandura A (1977) Social learning theory. New Jersey, Prentice Hall.
Bandura A (1986) Social foundations of thought and action: A social
cognitive theory. New York, Prentice Hall.
Beck K1-I (1980) Development and validation of a dental locus of control
scale. Journal of Preventive Dentistry, 6,327-332.
Becker MI-I (Ed) (1974) The health belief model and personal health
behaviour. Health Education Monographs, 2: 324-473.
241
Becker MH, Drachman RH and Kirscht JP (1972) Motivations as predictors
of health behaviour. Health Service Report, 87:852-862.
Becker MH, Drachman RH and Kirscht JP (1974) A new approach to
explaining sick role behaviour in low-income populations. American
Journal 0/Public Health, 64: 205-216.
Becker MH and Janz NK (1985) The health belief model applied to
understanding diabetes regimen compliance. The Diabetes Educator,
Spring.
Becker MT-I and Maiman LA (1975) Sociobehavioural determinants of
compliance with health and medical care recommendations. Medical
Care, 13: 10-24.
Becker MH, Maiman LA, Kirscht J, Haefner D and Drachman R (1977) The
health belief model and dietaiy compliance: A field experiment Journal
0/Health and Social Behaviour, 18: 348-366.
Becker MH and Rosenstock IM (1977) Social-psychological research on
determinants of preventive health behaviour. In RL Kane (Ed) The
Behavioural Sciences and Preventive Medicine: Opportunities and
dilemmas. Washington DC, US Printing Office, DI-IEW Publication No.
NIH 76-878.
Berkanovic E, Telesky C and Reeder S (1981) Structural and social
psychological factors as predictors of medical behaviour. Medical Care,
14: 422-431.
Bloom A (1982) Diabetes explained. 4th edition. MTP Press Ltd,
Lancaster.

242
Bloomgarden 11', Karmally W, Metzger MJ, Brothers M, Nechemias C,
Bookman J, Faierman D, Ginsberg-Fellner F, Rayfield E and Brown WV
(1987) Randomized controlled trial of diabetic patient education:
Improved knowledge without improved metabolic status. Diabetes Care,
10: 263-272.
Bradley C, Brewin C, Gamsu DS and Moses JL (1984) Development of
scales to measure perceived control of diabetes mellitus and
diabetes-related health beliefs. Diabetic Medicine, 1: 213-218.
Bradley C, Gamsu DS, Knight G, Boulton AJM and Ward JD (1986)
Predicting risk of diabetic ketoacidosis in patients using continuous
subcutaneous insulin infusion. British Medical Journal, 293: 242-243.
Bradley C, Gamsu DS, Moses JL, Knight G, Boulton AJM, Drury J and
Ward JD (1987) The use of diabetes-specific perceived control and health
belief measures to predict treatment choice and efficacy in a feasibility
study of continuous subcutaneous insulin infusion pumps. Psychology
and Health, 1: 133-146.
Bradley C and Lewis KS (1990) Measures of psychological well-being and
treatment satisfaction developed from the responses of tablet-treated
patients. Diabetic Medicine, 7: 445-451.
Bradley C, Lewis KS, Jennings AM and Ward JD (1990) Scales to measure
perceived control developed specifically for people with tablet-treated
diabetes. Diabetic Medicine, 7: 685-694.
Brewin CR and Shapiro DA (1984) Beyond locus of control: Attributions of
responsibility for positive and negative outcomes. British Journal of
Psychology, 75:43 -49.
243
Brownlee-Duffeck M, Peterson L, Simonds JF, Goldstein D, Kilo C and
Hoette S (1987) The role of health beliefs in the regimen adherence and
metabolic control of adolescents and adults with diabetes mellitus.
Journal of Consulting and Clinical Psychology, 55: 139-144.
Buckley-Sharp MD and Harris FTC (1971) The scoring of multiple-choice
questionnaires. British Journal of Medical Education, 5: 279-288.
Buckley-Sharp MD and Harris FTC (1972) Methods for analysis of multiple
choice examinations and questions. British Journal of Medical Education,
6: 53-60.
Burden AC (1982) Maturity-onset diabetes. Diabetes. Seminar series.
London, Update Publications Ltd.
Butterfield WJH, Keen H and Whichelow Mi (1967) Renal glucose
variations with age. British Medical Journal, 4: 505-507.
Cerkoney KAB and Hart LX (1980) The relationship between the health
belief model and compliance of persons with diabetes mellitus. Diabetes
Care, 3: 594-598.
Champion VL (1987) The relationship of breast self-examination to health
belief model variables. Research in Nursing and Health, 10: 375-382.
Christensen DB (1978) Drug-taking compliance: A review and synthesis.
Health Services Research, 13: 171-187.
Cleary PD (1987) Why people take health precautions. In ND Weinstein
(Ed) Taking Care: Understanding and encouraging self-protective
behaviour. Cambridge University Press.
244
Clymer R, Baum A and Krantz DS (1984) Preferences for self-care and
involvement in health care. In A Baum, SE Taylor and J Singer (Eds)
Handbook of Psychology and Health, Vol. 1V Social Psychological
Aspects of Health. New Jersey, Eribaum.
Cronbach U (1951) Coefficient alpha and the internal structure of tests.
Psychometrika, 16: 297-334.
Cummings KM, Becker MH, Kirscht JP and Levin NW (1982) Psychosocial
factors affecting adherence to medical regimens in a group of
hemodialysis patients. Medical Care, 20: 567-580.
Cummings KM, Jette AM, Brock BM and Haefner D (1979) Psychosocial
determinants of immunization behaviour in a swine influenza campaign.
Medical Care, 17: 639-649.
Davis WK, Hess GE, Van Harrison R and Hiss RU (1987) Psychosocial
adjustment to and control of diabetes mellitus: Differences by disease
type and treatment. Health Psychology, 6: 1-14.
Derogatis LR (1986) Psychology in cancer medicine: A perspective and
overview. Journal of Consultind and Clinical Psychology, 54: 632-638.
Derogatis LR, Lipman RS, Rickels K, Uhlenhuth EH and Covi L (1974) The
Hopkins Symptom Checklist (HSCL): A self-report symptom inventory.
Behavioural Science, 19, 1.
Dunn SM (1986) Reactions to educational techniques: Coping strategies for
diabetes and learning. Diabetic Medicine, 3:419-429.

245
Dunn RS, Bryson JM, Hoskins PL, Alford HN, Handelsman DJ, and Turtle
TR (1984) Development of the diabetes knowledge (DKN) scales: Forms
DKNA, DKNB and DKNC. Diabetes Care, 7: 36-41.
Edelstein J and Linn MW (1987) Locus of control and the control of
diabetes. Diabetes Educator, 13: 51-54.
Evans MG (1991) The problem of analyzing multiplicative composites.
Interactions revisited. American Psychologist, 46: 6-15.
Feather NT (1982) Erpectalions and actions: expectancy-value models in
psychology. Hillsdale, NJ: Eribaum.
Ferraro LA, Price JR and Desmond SM (1987) Development of a diabetes
locus of control scale. Psychological Reports, 61: 763-770.
Fishbein M and Ajzen I (1975) Beliefs, attitudes, intention, and behaviour:
An introduction to theory and research. Massachusettes:
Addison-Wesley.
Fnis R & Nanjundappa G (1986) Diabetes, depression and employment
status. Social Science and Medicine, 23: 471-475.
Fuller JP (1985) Causes of death in diabetes mellitus. Hormone and
Metabolic Research, Supplement Series, 15: 3-9.
Gamsu DS and Bradley C (1987) Clinical staff's attributions about diabetes:
Scale development and staff vs patient comparisons. Current
Psychological Research and Reviews, 6: 69-78.

246
Georgiou A and Bradley C (1992) The development of a smoking-specific
locus of control scale. Psychology and Health, 6: 227-246.
Gillespie C and Bradley C (1988) Causal attributions of doctor and patients
in a diabetic clinic. British Journal 0/Clinical Psychology, 27: 67-76.
Given CW, Given CW, Gallin RS and Condon JW (1983) Development of
scales to measure beliefs of diabetic patients. - Research in Nursing and
Health, 6: 127-141.
Glasgow RE, McCaul KD and Schafer LC (1986) Barriers to regimen
adherence among persons wioth IDDM. Journal 0/Behavioural
Medicine, 9: 65-77.
Gordis L, Markowitz M and Lilienfeld AM (1969) The inaccuracy in using
interviews to estimate patient reliability in taking medications at home.
Medical Care, 7: 49-54.
Grossman HY, Brink S and Hauser ST (1987) Self-efficacy in adolescent
girls and boys with insulin-dependent diabetes mellitus. Diabetes Care,
10: 324-329.
Grube JW, Morgan M and McGree ST (1986) Attitudes and normative
beliefs as predictors of smoking intentions and behaviours: A test of 3
models. British Journal 0/Social and Clinical Psychology, 25: 81-93.
Haefner DP and Kirscht JP (1970) Motivational and behavioural effects of
modifying health beliefs. Public health Reports, 85: 478-484.

247
Hallal JC (1982) The relationship of health beliefs, health locus of control,
and self concept to the practice of breast self-examination in adult women.
Nursing Research, 31:137-142.
Harman HH (1967) Modern Factor Analysis. Chicago: University of
Chicago Press.
Harris R, Linn MW and Pollack L (1984) Relationship between health beliefs
and psychological variables in diabetic patients. British Journal of
Medical Psychology, 57: 253-259.
Harris R, Linn MW, Skyler JS and Sandifer R (1987) Development of the
diabetes health belief scale. The Diabetes Educator, 13:292-297.
Harris R, Skyler JS, Linn MW, Pollack L and Tewksbury D (1982)
Relationship between the health belief model and compliance as a basis
for intervention in diabetes mellitus. Pediatric and Adolescent
Endocrinology, 10: 123-132.
Hartman PE and Becker MR (1978) Non-compliance with prescribed
regimen among chronic hemodialysis patientS: A method of prediction
and educational diagnosis. Dialysis and Transplantation, 7: 978-985.
Hess GE, Davis WK and Harrison R (1986) A diabetes psychosocial profile.
Diabetes Educator, 12: 135-140.
Hochbaum G (1958) Public participation in medical screening programs: A
sociopsychological study. Public Health Service Publication No. 572,
Washington, DC., Superintendent of Public Documents.
248
Inui TS, Yourtee EL and Williamson JW (1976) Improved outcomes in
hypertension after physician tutorials. Annals of Internal Medicine, 84:
646-651.
Janis IL and Mann L (1977) Decision making: A piychological analysis of
conflict, choice and comni1jnent. New York: Free Press.
Janz NK and Becker MH (1984) The health belief model: A decade later.
Health Education Quarterly, 11: 1-47.
Jarrett RJ (1986) Diabetes mellitus. London, Croom Helm.
Jennings AM, Spencer KM. Dean BM, Wilson RM, Bottazzo GF and
Ward JD (1989) Islet cell antibodies and insulin autoantibodies in patients
treated with oral hypoglycaemic agents. Diabetic Medicine, 6: 434-439.
Jennings AM, Lewis KS, Murdoch S, Talbot JF, Bradley C and Ward JD
(1991) A randomised trial comparing CSII and conventional
insulin therapy in Type 2 diabetic patients poorly controlled with
suiphonylureas. Diabetes Care, 14: 738-744.
Kaufert JM, Rabkin SW, Syrotuik J, Boyko E and Shane F (1986) Health
beliefs as predictors of success of alternate modalities of smoking
cessation: Results of a controlled trial. Journal of Behavioural Medicine,
9: 475-489.
Kegeles SS (1963) Some motives for seeking preventive dental care.
Journal of the American Dental Association, 67: 90-98
Kelly GR, Mamon JA and Scott JE (1987) Utility of the Health Belief Model
in examining medication compliance among psychiatric outpatients.
Social Science and Medicine, 25: 1205-1211.

249
Kirscht JP and Rosenstock IM (1977) Patient adherence to antihypertensive
medical regimens. Journal of Community Health, 3: 115-124.
Kirscht JP (1983) Preventive health behaviour: A review of research and
issues. Health Psychology, 2: 277-30 1.
Kline P (1986) A Handbook of Test Construction: Introduction to
psychometric design. London: Methuen.
Kobayashi T, Nakanishi K, Sugimoto T, Itoh T, Murase T, Kosaka K, Tsuji
K (1989) Maleness as risk factor for slowly progressive IDDM.
Diabetes Care, 12: 7-10.
Korhonen T, Huttunen .1K, Aro A, Hentinen M, Ihalainen 0, Majander H,
Siitonen 0, Uusitupa M and Pyorala K (1983) A controlled trial on the
effects of patient education in the treatment of insulin-dependent diabetes.
Diabetes Care, 6: 256-61.
Kristiansen CM (1990) The role of values in the relation between gender and
health. Social Behaviour, 5: 127-133.
Labs SM and Wurtele SK (1986) Fetal health locus of control scale:
Development and validation. Journal of Consulting aM Clinical
Psychology, 54: 814-819.
Lebovitz HE (1985) Oral hypoglycaemic agents. In KGMM Alberti and LP
Krall (Eds) The diabetes annual. 1:93-110. Amsterdam, Elsevier
Science.
Levenson H (1973) Multidimensional locus of control in psychiatric patients.
Journal of Consulting and Clinical Psychology, 41: 397-404.
250
Leventhal H, Hochbaum G and Rosenstock IM (1960) Epidemic impact on
the general population in two cities. In The impact of Asian influenza on
community life: A study in five cities. Washington DC, Government
Printing Office.
Leventhal H, Safer M and Panagis FD (1983) The impact of communications
on the self-regulation of health beliefs, decisions and behaviour. Health
Education Quarterly, 10:3-29.
Leventhal H and Cameron L (1987) Behavioural theories and the problem of
compliance. Patient Education and Counseling, 10: 117-138.
Lewin K (1935) A dynamic theory 0/personality. New York, McGraw 1-1111.
Lewis KS, Jennings AM, Ward JD and Bradley C (1990) Health belief
scales developed specifically for people with tablet-treated type 2 diabetes.
Diabetic Medicine, 7: 148-155.
Lewis KS, Bradley C, Knight G, Boulton AJM and Ward JD (1988) A
measure of treatment satisfaction designed specifically for people with
insulin-dependent diabetes. Diabetic Medicine, 5: 235-242.
Lowery BJ and DuCette JP (1976) Disease-related learning and disease
control in diabetes as a function of locus of control. Nursing Research,
25: 358-362.
Lustman PJ, Amado H and Wetzel RD (1983) Depression in diabetics: a
critical appraisal. Comprehensive Psychiatry, 24: 65-74.

251
Lustman PJ and Harper GW (1987) Nonpsychiatnc physicians' identification
and treatment of depression in patients with diabetes. Comprehensive
Psychiatry, 28: 22-27
Maddux JE and Rogers RW (1983) Protection motivation and self-efficacy:
A revised theory of fear appeals and attitude change. Journal of
Experimental Social Psychology, 19: 469-479.
Maddux JE and Stanley MA (Eds) (1986) Self-efficacy theory in
contemporary psychology. (Special issue) Journal 0/Social and Clinical
Psychology, 4.
Maddux JE, Norton LW and Stoltenberg CD (1986) Self-efficacy
expectancy, outcome expectancy, and outcome value: Relative effects on
behavioural intentions. Journal 0/Personality and Social Psychology,
51: 783-789.
Marteau TM (1989) Health beliefs and attributions. In AK Broome (Ed)
Health Psychology: Processes and applications. pp 1-23. London,
Chapman and Hall.
Marteau TM and Johnston M (1990) Health professionals: a source of
variance in health outcomes. Psychology and Health, 5: 47-58.
Meadows KA, Fromson B, Gillespie C, Brewer A, Carter C, Lockington T,
Clark G and Wise PH (1987) Development, validation and application of
computer-linked questionnaires in diabetes education. Diabetic Medicine,
5: 61-67.
Meadows KA, Lockington TJ and Wise PH (1987) Assessment of
knowledge of diabetes by questionnaire. Diabetic Medicine, 4: 343.

252
Metropolitan Health Insurance Company (1959) New weight standards for
men and women. Statutory Bulletin of the Metropolitan Life Insurance
Company, 40: 1-4.
McCaul KD, Glasgow RE and Schafer LC (1987) Diabetes regimen
behaviours: Predicting adherence. Medical Care, 25: 869-881.
McKinlay JB (1972) Some approaches and problems in the study of the use
of services: An overview. Journal of health and Social Behaviour, 13:
115-52.
Michael JM (1982) The second revolution in health: Health promotion and its
environmental base. American Psychologist, 37, 936-941.
Moor MJ and Gadsby R (1984) Non-insulin dependent diabetes mellitus in
general practice. The Practitioner, 228: 672-679.
Multi-centre Study (1988) UK prospective diabetes study. IV.
Characteristics of newly presenting Type 2 diabetic patients: male
preponderance and obesity at different ages. Diabetic Medicine, 5:
154-159.
Nelson EC, Stason WB and Neutra RR (1978) Impact of patient perceptions
on compliance with treatment for hypertension. Medical Care, 16:
893-906.
Osgood CE, Suci GJ and Tannenbaum PH (1957) The measurement of
meaning. University of Illinois Press.
253
Peacock I and Tattersall RB (1984) The difficult choice of treatment for
poorly controlled maturity onset diabetes: tablets or insulin? British
Medicaifournal: 288: 1956-1959.
Peterson C, Semel A, Von Baeyer C, Abramson LY, Metaisky GI and
Seligman MEP (1982) The attributional style questionnaire. Cognitive
Therapy Research, 6: 287-300.
Peyrot M and McMurry JF (1985) Psychosocial factors in diabetes control;
adjustment of insulin treated adults. Psychosomatic Medicine, 47:
542-547.
Pirart J (1978) Diabetes mellitus amd its degenerative complications: A
prospective study of 4,400 patients observed between 1947 and 1973.
Diabetes Care, 1: 168-188.
Plumb MM and Holland J (1977) Comparative studies of psychological
function in patients with advanced cancer. 1. Self-reported depressive
symptoms. Psychoso,natic Medicine, 39: 264-276.
Research Unit in Health and Behavioural Change (1989) Changing the public
health. London, John Wiley.
Rogers RW (1983) Cognitive and physiological processes in fear appeals and
attitude change: a revised theory of protection motivation. In J Cacioppo
& R Petty (Eds) Social Psychophysiology. New York: Guilford Press.
Rogers RW (1985) Attitude change and informations integration in fear
appeals. Psychological Reports, 56: 179-182.

254
Rogers RW and Mewborn CR (1976) Fear appeals and attitude change:
Effects of a threat's noxiousness, probability of occurrence, and the
efficacy of coping responses. Journal of Personality and Social
Psychology, 34: 54-61.
Rosenburg M (1965) Society and the adolescent self-image. New Jersey,
Princeton University Press.
Rosenstock IM, Denybeny M, and Carriger BK (1959) Why people fail to
seek poliomyelitis vaccination. Public Health Reports, 74: 98-103
Rosenstock IM (1966) Why people use health services. Milbank Memorial
Fund Quarterly, 44: 94-124.
Rosenstock IM (1985) Understanding and enhancing patient compliance with
diabetic regimens. Diabetes Care, 8: 610-616.
Rosenstock IM, Strecher VJ and Becker MH (1988) Social learning theoiy
and the Health Belief Model. Health Education Quarterly, 15: 175-183.
Rotter JB (1954) Social learning and clinical psychology. New Jersey,
Prentice-Hall.
Rotter JB (1966) Generalized expectancies for internal versus external control
reinforcement. Psychological Monographs, 80.
Rundall TG and Wheeler JRC (1979) The effect of income on use of
preventive care: An evaluation of alternative explanations. Journal of
Health and Social Behaviour, 20: 397-406.

255
Rundall TG and Wheeler JRC (1979) Factors associated with utilization of
the swine flu vaccination program among senior citizens. Medical Care,
17:191-200.
Sackett DL, Becker MH, MacPherson AS, Luterbach E and Haynes RB
(1974) The standardised compliance questionnaire. Ontario, McMaster
University.
Sackett DL, Haynes RB, Gibson ES, Hackett BC, Taylor DW, Roberts RS
and Johnson AL (1975) Randomised clinical trial of strategies for
improving medication compliance. Lancet, 31: 1205-1207.
Sackett DL and Snow JC (1979) The magnitude of compliance and
non-compliance. In RB Haynes, DL Sackett and DW Taylor
(Eds) Compliance in Health Care, Baltimore, Johns Hopkins University
Press.
Saltzer EB (1978) Locus of control and the intenlion to lose weight. Hea;lth
Education Monographs, 6: 118-128.
Schlenk EA and Hart LK (1984) Relationship between health locus of
control, health value, and social support and compliance of persons with
diabetes mellitus. Diabetes Care, 7: 566-574.
Schmidt FL (1973) Implications of a measurement problem for
expectancytheoiy research. Organizational Behaviour and Human
Performance, 10: 243-251.
Schmidt FL and Wilson TC (1975) Expectancy value models of attitude
measurement A measurement problem. Journal of Marketing Research,
12: 366-368.

256
Scott AR, Attenborough Y, Peacock I, Fletcher E, Jeffcoate WJ, Tattersall
RB (1988) Comparison of high fibre diets, basal insulin supplements,
and flexible insulin treatment for non-insulin-dependent (type II) diabetics
poorly controlled with suiphonylureas. British Medical Journal, 297:
707-710.
Shillitoe RW (1987) Diabetes education: ideas into action. Practical Diabetes,
4:133-135.
Shillitoe RW (1988) Psychology and diabetes: Psychosocial factors in
management and control. London, Chapman and Hall.
Sjoberg S. Carison A, Rosenqvist and Ostman J (1988) Health attitudes,
self-monitoring of blood glucose, metabolic control and residual insulin
secretion in type I diabetic patients. Diabetic Medicine, 5: 449-453.
Stone GC (1979) Psychology and the health system. In GC Stone, F Cohen
and NE Adler (Eds) Health Psychology. San Francisco: .Jossey-Bass.
Strickland BR (1978) Internal-external expectancies on health-related
behaviours. Journal of Consulting and Clinical Psychology, 46:
1192-1211.
Sutton ST (1982) Fear arousing communications: a critical examination of
theory and research. In J R Eiser (Ed) Social Psychology and
Behavioural Medicine. Chichester Wiley.
Tabachnick BG and Fidell LS (1989) Using multi variate statistics. (2nd
edition) New York, Harper & Row.

257
Taylor IDW (1979) A test of the health belief model in hypertension. In RB
Haynes, DW Taylor and DL Sackett (Eds), Compliance in Health Care,
Baltimore, Johns Hopkins University Press.
Taylor Rand Zimmet P (1983) Migrant studies in diabetes epidemiology. In
.11 Mann, K Pyorala and A Teuscher (Eds) Diabetes in epidemiological
perspective. Edinburgh, Churchill Livingstone.
Tchobroutsky G (1978) Relation of diabetic control to developement of
microvascular complications. Diabetologia, 15: 143-152.
Tirrell BE and Hart LK (1980) The relationship of health beliefs and
knowledge to exercise compliance in patients after coronary bypass.
Heart and Lung, 9: 487-493.
Tolman EC (1932) Purposive behaviour in animals and men, New York,
Appleton-Century Crofts.
Triandis HC (1980) Values, attitudes and interpersonal behaviour. In MM
Page (Ed) 1979 Nebraska Symposium on Motivation. University of
Nebraska Press.
Trostle JA (1988) Medical compliance as an ideology. Social Science and
Medicine, 27: 1299-1308.
Verbrugge LM and Wingard DL (1987) Sex differentials in health and
mortality. Women and Health, 12: 103-145.
Wallston BS, Wallston KA, Kaplan G and Maides S (1976) Development
and validation of the health related locus of control (I-ILC) scale. Journal
of Consulting and Clinical Psychology, 44: 580-585.

258
Wallston KA, Wallston BS and DeVellis R (1978) Development of the
multidimensional health locus of control (M1-ILC) scales. Health
Education Monographs, 6: 160-170.
Waliston KA and Waliston BS (1982) Who is responsible for your health?
The construct of health locus of control. In G Sanders and J Suls (Eds)
Social Psychology of Health and Illness. New Jersey, Eribaum.
Wallston KA and Wallston BS (1984) Social psychological models of health
behaviour: An examination and integration. In A Baum, SE Taylor and
JE Singer (Eds) Handbook of Health Psychology, Vol. IT' Social
Psychological Aspects of Health. New Jersey, Eribaum.
Wallston KA, Wallston BS, Smith S and Dobbin CJ (1987) Perceived
control and health. Current Psychological Research and Reviews, 6:
5-25.
WalT PB, Banks MH and Ullah P (1985) The experience of unemployment
among black and white urban teenagers. British Journal of Psychology,
76: 75-87.
Watkins JD, Williams F, Martin DA, Hogan MD and Anderson E (1967) A
study of diabetic patients at home. American Journal of Public Health,
56: 452-459.
Weinberger M, Greene JY, Mamlin JJ and Jenn MJ (1981) Health beliefs
and smoking behaviour. American Journal of Public Health, 71:
1253-1255
Weinstein ND (1982) Unrealistic optimism about susceptibility to health
problems. Journal of Consulting and Clinical Psychology, 55: 139-144.

259
Weinstein ND (1984) Why it won't happen to me: perceptions of nsk factors
and susceptibility. Health Psychology, 3: 431-457.
Weinstein ND (1987) Unrealistic optimism abou j susceptibility to health
problems: conclusions from a community-wide sample. Journal of
Behavioural Medicine, 10: 481-500.
Weinstein ND (1987) Taking care: Understanding and encouraging
self-protective behaviour. New Yorlc Cambridge University Press.
Weinstein ND (1988) The precaution adoption process. Health Psychology,
7: 355-386.
Wilkinson 0, Borsey DQ, Leslie P, Newton RW, Lind C and Ballinger CB
(1988) Psychiatric morbidity and social problems in patients with insulin
dependent diabetes mellitus. British Journal of Psyc/ziaty, 153: 38-43.
Windsor RA, Roseman J, Gartseff 0 and Kirk KA (1981) Qualitative issues
in developing educational diagnostic instruments and assessment
procedures for diabetic patients. Diabetes Care, 4: 468-475.
World Health Organisation Study Group (1985) Diabetes mellitus. Technical
Report Series, No. 727. Geneva, World Health Organisation.
Wurtele SK (1988) Increasing women's calcium intake: The role of health
beliefs, intentions and health value. Journal of Applied Social
Psychology, 18: 627-639.

Appendix 4
Appendix 5
Appendix 8
Appendix 9
260
APPENDICES
Appendix 1
Letter inviting outpatients to Join the baseline study
Appendix 2
Booklet of questionnaires:
(a) Introduction to booldet (Baseline study)(b) General Infomation questionnaire(c) Well-being questionnaire(d) Treatment Satisfaction questionnaire(e) Perceived Control of tablet-treated Diabetes questionnaire(f) Health beliefs about tablet-treated Diabetes questionnaire(g) Beliefs about Seventy questionnaire(h) Beliefs about Vulnerability questionnaire
Appendix 3
Appendix 6
Appendix 7
Introduction to booklet of questionnaires and General Informationquestionnaire (Post Education)
Knowledge of Diabetes questionnaire
Written information supplied to patients regarding diabetes and itscomplications (Insulin Study)
Introduction to booklet of questionnaires and General Informationquestionnaire (Insulin Study: Post Decision)
Introduction to booklet of questionnaires and General Informationquestionnaire (Insulin Study: Pre-Treatment)
Introduction to booklet of questionnaires and General Informationquestionnaire (Insulin Study: Post-Treatment)
Expectations and Experience of Treatment questionnaires(Insulin Study)

261
APPENDIX 1
Letter inviting outpatients to Join the baseline study

262
We would like to review the type of health care that we recommend to patients withdiabetes who are treated with diet and tablets. Our impression is that there is room forconsiderable improvement to the treatment that is offered to people like yourself but in thefirst instance we need to obtain more information about diabetes and the way it affects ourpatients. This will be done partly by questionnaire and partly by consultation with a doctor(Dr. Adrian Jennings) who is taking a special interest in patients with your kind of diabetes.
In order to obtain accurate and representative information for the purposes of introducingimprovements in the near future, we are asking as many patients as possible to attend for anappointment within the next few months. The appointment would take approximately onehour and will not be held at the time of the diabetes clinic to ensure that no-one is keptwaiting.
Please complete all of the section below even if you cannot help us:
NAME
MALEJFEMALE*
HOSPITAL NO. (From appointment card)
ADDRESS
TEL. NO............................
DATEOF BIRTH .........................COUNTRY OF BIRTH ...........................
IS ENGLISH YOUR HRST LANGUAGE' ? ....................
HOWLONG HAVE YOU HAD DIABETES'? .................................................
AGE AT LEAVING FULL-TIME EDUCATION .......................
1. I am able to attend for a consultation with Dr. Jennings YESINO*
2. If any day is difficult for you to come please enter here:
3. Do you require transport? (please answer yes if transport is absolutely necessary)
YESINO*
4. Please tick box if you have filled in this form for someone who is blind/partially
sighted. _____
* delete as applicable
Please hand in to the doctor in the clinic
Dr Adrian JenningsMrs Kathryn LewisDr Clare BradleyDrJD Ward

263
APPENDIX 2
BOOKLET OF QUESTIONNAIRES
A Introduction to booklet
B General Information Questionnaire
C Well-being Questionnaire
D Satisfation with Treatment Questionnaire
E Perceived Control of tablet-treated Diabetes Scales
F Health Beliefs about tablet-treated Diabetes Questionnaire(perceived Benefits of, and Barriers to treatment)
G Beliefs about Severity Questionnaire
H Beliefs about Vulnerability Questionnaire

264
TYPE H DIABETES STUDY BOOKLET
We are interested in gaining a better understanding of the difficulties which arise forpeople with your kind of diabetes.
On the following pages of this booklet you will find a general information sheet and aseries of questionnaires dealing with beliefs and opinions about diabetes.
We would like you to complete the booklet today if possible (or within the next 2 or 3days) and post it in the stamped addressed envelope provided.
In this research, we will be asking about 150 people to complete these questionnaires.All answers will be treated in strict confidence.
If you have any problems in completing the questionnaires, please do not hesitate to getin touch with us.
Mrs K S LewisDr C BradleyDepartment of PsychologyUniversity of SheffieldSheffield SlO 2TN
Telephone: 768555 ext 6550

265
GENERAL INFORMATION
Name..................................................
AgeSex ................
WeightHeight .............
Age at leaving full-time education ................
How many grams of carbohydrate, on average, do you take each day 7 .........gms
How long have you had diabetes 9 ..........years ...........months
Do you test your urine for sugar? yes .......no .......
If "yes", how often do you test your urine? (please tick)
Occasionally...........
Everyday .............
Do you test your blood for sugar? yes .......no .........
If "yes", how often do you test your blood 9 .........times per week
Do you regularly adjust your treatment regime on the basis of bloodorurine test results? yes ........no ...........
If "yes", what adjustments do you make if your blood or urine sugartests show too much sugar? (please tick appropriate items)
tabletdose .........food intake ..........exercise ..........
other(please describe) ............................................Please indicate your general impression of your diabetes control during the pastfew weeks by circling a number on the scale below
Very well 1 2 3 4 5 6 7 Very poorlycontrolled controlled
For how long have you been following your present type of treatment (diet and tablets)?
...years months
How many tablets do you take at any one time7 .............
How many times a day do you take the tablets ...............
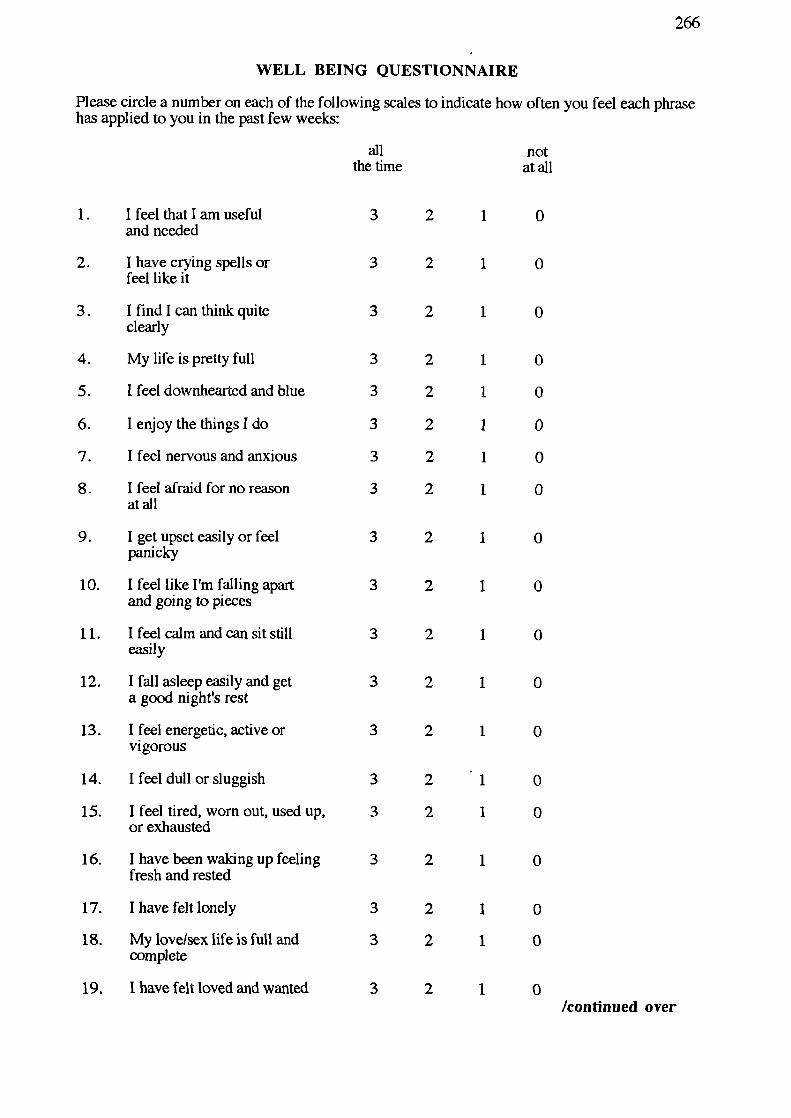
3
3
3
3
3
3
3
3
3
3
3
3
3
3
3
3
3
3
0
0
0
0
0
0
0
0
0
0
0
0
0
0
0
0
0
0/continued over
3 2 1 0
2
2
2
2
2
2
2
2
2
1
1
1
1
1
I
1
1
1
2 1
2 1
2 1
2
1
2
1
2
1
2
1
2
1
2
1
266
WELL BEING QUESTIONNAIRE
Please circle a number on each of the following scales to indicate how often you feel each phrasehas applied to you in the past few weeks:
all notthe time at all
1. I feel that I am usefuland needed
2. I have crying spells orfeel like it
3. Ifindlcanthinkquiteclearly
4. My life is pretty full
5. 1 feel downhearted and blue
6. I enjoy the things I do
7. I feel nervous and anxious
8. 1 feel afraid for no reasonat all
9. 1 get upset easily or feelpanicky
10. I feel like I'm falling apartand going to pieces
11. Ifeelcalmandcansitstilleasily
12. I fall asleep easily and geta good night's rest
13. I feel energetic, active orvigorous
14. I feel dull or sluggish
15. I feel tired, worn out, used up,or exhausted
16. I have been waking up feelingfresh and rested
17. I have felt lonely
18. My love/sex life is full andcomplete
19. 1 have felt loved and wanted

267
all notthe time at all
20. I have been happy, satisfied, or 3 2 1 0pleased with my personal life
21. I have felt cheerful, lighthearted 3 2 1 0
22. I have felt well adjusted to my 3 2 1 0life situation
23. Ihaveenjoyedlife 3 2 1 0
24. I have lived the kind of life 3 2 1 0I wanted to
25. I have felt eager to tackle my 3 2 1 0daily tasks or make new decisions
26. I have felt proud or good about 3 2 1 0some things I did
27. I have felt I could easily handle 3 2 1 0or cope with any serious problemor major change in my life
28. My daily life has been full of 3 2 1 0things that were interesting to me
PLEASE MAKE SURE THAT YOU HAVE CONSIDERED EACH OF THE 28 STATEMENTSAND HAVE CIRCLED A NUMBER ON EACH OF THE 28 SCALES.

268
SATISFACTION WITH TREATMENT
The following questions are concerned with the form of treatment you are using now and yourexperience over the past few weeks. Please answer each question by circ1ing a number on each ofthe scales.
How satisfied are you with your current treatment?
verysatisfied 6 5 4 3 2
1
0 very dissatisfied
How well controlled do you feel your diabetes has been recently?
veiywell 6 5 4 3 2
o very poorlycontrolled
controlled
How often have you felt that your blood sugars have been unacceptably high recently?
most of the time 6 5 4 3 2 1 0 none of the time
How often have you felt that your blood sugars have been unacceptably low recently?
most of the time 6 5 4 3 2 1 0 none of the time
How convenient have you been finding your treatment to be recently?
very convenient 6 5 4 3 2 1 0 very inconvenient
How flexible have you been finding your treatment to be recently?
veryflexible 6 5 4 3 2 1
0 very inflexible
How satisfied are you with your understanding of your diabetes?
verysatisfied 6 5 4 3 2 1
0 very dissatisfied
/continued over

1
0 very undemanding
1
0 very dissatisfied
269
How demanding is your present method of treatment?(in terms of time, effort, thought, etc.)
very demanding 6 5 4 3 2
How satisfied have you been with life in general?
verysatisfied 6 5 4 3 2
How satisfied would you be to continue with your present form of treatment?
very satisfied 6 5 4 3 2 1 0 very dissatisfied
How worthwhile do you consider your present treatment to be?
very worthwhile 6 5 4 3 2
0 not at all worthwhile
PLEASE MAKE SURE THAT YOU HAVE CIRCLED ONE NUMBER ON EACHOF THE SCALES.

270
The following questions are about the causes of situations which you mayhave expenenced recently.
While events may have causes, we want you to pick only one (the majorcause) of the situation as you see it.
Please write this cause in the space provided after each event.
Next, we want you to answer some questions about the cause by circling themost appropriate number on a sliding scale from 0 to 6.

271
Imagine that your eyesight has become noticeably blurred for more than a few hours.
Wiite down the most likely cause of your blurred eyesight in the space below.
Now rate this cause on the following scales:
1. To what extent was the cause due to something about you?
Totally due to me 6 5 4 3 2 1 0 Not all due to me
2. To what extent was the cause due to the treatment recommended by your doctor?
Totally due 6 5 4 3 2 1 0 Not at all dueto treatment to treatmentrecommended recommended
3. To what extent was the cause something to do with other people or circumstances?
Totally due 6 5 4 3 2 1 0 Not at all dueto other people to other peopleor circumstances or circumstances
4. To what extent was the cause due to chance?
Totallydue 6 5 4 3 2
1to chance
5. To what extent was the cause controllable by you?
Totally 6 5 4 3 2 1controllableby me
O Not at all dueto chance
o Totallyuncontrollableby me
6. To what extent was the cause controllable by your doctor?
Totally 6 5 4 3 2 1 0 Totallycontrollable uncontrollableby my doctor by my doctor
7. To what extent do you think you could have foreseen the cause of the blurred eyesight?
Totally 6 5 4 3 2 1 0 Totallyforeseeable by me unforeseeable
by me

272
Imagine that you have been able to keep your weight at an acceptable level for a period of severalweeks and you have felt fit and well.
Write down, in the space below, the single most likely cause of this period of good weightcontrol and sense of general well-being.
Now rate this cause on the following scales:
1. To what extent was the cause due to something about you?
Totally due to me 6 5 4 3 2 1 0 Not at all due to me
2. To what extent was the cause due to the treatment recommended by your doctor?
Totally due 6 5 4 3 2 1 0 Not at all dueto treatment to treatmentrecommended recommended
3. To what extent was the cause something to do with other people or circumstances?
Totally due 6 5 4 3 2 1 0 Not at all dueto other people to other peopleor circumstances or circumstances
4. To what extent was the cause due to chance?
Totallydue 6 5 4 3 2to chance
5. To what extent was the cause controllable by you?
Totally 6 5 4 3 2controllable by me
1
O Not at all dueto chance
o Totallyuncontrollable by me
6. To what extent was the cause controllable by your doctor?
Totally 6 5 4 3 2 1 0 Totallycontrollable uncontrollableby my doctor by my doctor
7. To what extent do you think you could have foreseen the cause of the period ofgood weight control?
Totally 6 5 4 3 2 1 0 Totallyforeseeable unforeseeablebyrne byrne

273
Imagine that for several days you have found high levels of sugar when you tested your urine.
Write down the single most likely cause of the high sugar levels in the space below.
Now rate this cause on the following scales:
1. To what extent was the cause due to something about you?
Totally due to me 6 5 4 3 2 1 0 Not at all due to me
2. To what extent was the cause due to the treatment recommended by your doctor?
Totally due 6 5 4 3 2 1 0 Not at all dueto treatment to treatmentrecommended recommended
3. To what extent was the cause something to do with other people or circumstances?
Totally due 6 5 4 3 2 1 0 Not at all dueto other people . to other peopleor circumstances or circumstances
4. To what extent was the cause due to chance?
Totallydue 6 5 4 3 2
1 0 Notatalldueto chance to chance
5. To what extent was the cause controllable by you?
Totally 6 5 4 3 2 1 0 Totallycontrollable by me uncontrollable by me
6. To what extent was the cause controllable by your doctor?
Totally 6 5 4 3 2 1 0 Totallycontrollable uncontrollableby my doctor by my doctor
7. To what extent do you think you could have foreseen the cause of the high sugar levels?
Totally 6 5 4 3 2 1 0 Totallyforeseeable unforesceablebyrne byme

274
Imagine that you have reduced your weight to a satisfactory level after a period when you gainedtoo much weight.
Write down the single most likely cause of this weight reduction in the space below.
Now rate this cause on the following scales:
1. To what extent was the cause due to something about you?
Totally due to me 6 5 4 3 2 - 1 0 Not at all due to me
2. To what extent was the cause due to the treatment recommended by your doctor?
Totally due 6 5 4 3 2 1 0 Not at all dueto treatment to treatmentrecommended recommended
3. To what extent was the cause something to do with other people or circumstances?
Totally due 6 5 4 3 2 1 0 Not at all dueto other people to other peopleor circumstances or circumstances
4. To what extent was the cause due to chance?
Totallydue 6 5 4 3 2
1 0 Notatalldueto chance to chance
5. To what extent was the cause controllable by you?
Totally 6 5 4 3 2 1 0 Totallycontrollable by me uncontrollable by me
6. To what extent was the cause controllable by your doctor?
Totally 6 5 4 3 2 1 0 Totallycontrollable uncontrollableby my doctor by my doctor
7. To what extent do you think you could have foreseen the cause of the weight reduction?
Totally 6 5 4 3 2 1 0 Totallyforeseeable unforesceablebyrne byrne

275
Imagine that you have successfully avoided the complications of diabetes such as problems withyour feet.
Write down, in the space below, the single most likely cause of the successful avoidance ofdiabetic complications such as problems with your feet.
Now rate this cause on the following scales:
1. To what extent was the cause due to something about you?
Totally due to me 6 5 4 3 2 1 0 Not at all due to me
2. To what extent was the cause due to the treatment recommended by your doctor?
Totallydue 6 5 4 3 2 1 0 Notatall dueto treatment to treatmentrecommended recommended
3. To what extent was the cause something to do with other people or circumstances?
Totally due 6 5 4 3 2 1 0 Not at all dueto other people to other peopleor circumstances or circumstances
4. To what extent was the cause due to chance?
Totallydue 6 5 4 3 2
1 0 Notatalldueto chance to chance
5. To what extent was the cause controllable by you?
Totally 6 5 4 3 2 1 0 Totallycontrollable by me . uncontrollable by me
6. To what extent was the cause controllable by your doctor?
Totally 6 5 4 3 2 1 0 Totallycontrollable uncontrollableby my doctor . by my doctor
7. To what extent do you think you could have foreseen the cause of successfully avoidingcomplications?
Totally 6 5 4 3 2 1 0 Totallyforeseeable unforeseeablebyrne byrne

276
Imagine that you have recently become unacceptably overweight.
Write down, in the space below, the single most likely cause of becoming overweight.
Now rate this cause on the following scales:
1. To what extent was the cause due to something about you?
Totally due to me 6 5 4 3 2 1 0 Not at all due to me
2. To what extent was the cause due to the treatment recommended by your doctor?
Totally due 6 5 4 3 2 1 0 Not at all dueto treatment to treatmentrecommended recommended
3. To what extent was the cause something to do with other people or circumstances?
Totally due 6 5 4 3 2 1 0 Not at all dueto other people to other peopleor circumstances or circumstances
4. To what extent was the cause due to chance?
Totallydue 6 5 4 3 2
1 0 Notatalldueto chance
to chance
5. To what extent was the cause controllable by you?
Totally 6 5 4 3 2 1 0 Totallycontrollable by me uncontrollable by me
6. To what extent was the cause controllable by your doctor?
Totally 6 5 4 3 2 1 0 Totallycontrollable uncontrollableby my doctor by my doctor
7. To what extent do you think you could have foreseen the cause of becoming overweight?
Totally 6 5 4 3 2 1 0 Totallyforeseeable unforeseeablebyrne byrne

277
Imagine that you are very thirsty and have passed unusually large amounts of urinerecently.
Write down, in the space below, the single most likely cause of being very thirsty andpassing a lot of urine.
Now rate this cause on the following scales:
1. To what extent was the cause due to something about you?
Totally due to me 6 5 4 3 2 1 0 Not at all due to me
2. To what extent was the cause due to the treatment recommended by your doctor?
Totally due 6 5 4 3 2 1 0 Not at all dueto treatment to treatmentrecommended recommended
3. To what extent was the cause something to do with other people or circumstances?
Totally due 6 5 4 3 2 1 0 Not at all dueto other people to other peopleor circumstances or circumstances
4. To what extent was the cause due to chance?
Totallydue 6 5 4 3 2to chance
5. To what extent was the cause controllable by you?
Totally 6 5 4 3 2controllable by me
1 0 Notatalldueto chance
o Totallyuncontrollable by me
6. To what extent was the cause controllable by your doctor?
Totally 6 5 4 3 2 1 0 Totallycontrollable uncontrollableby my doctor by my doctor
7. To what extent do you think you could have foreseen the cause of being thirsty and/orpassing a lot of urine?
Totally 6 5 4 3 2 1 0 Totallyforeseeable unforeseeablebyrne byrne

278
HEALTH BELIEFS SCALE
In this section would you please circle one of the numbers on each of the scales toindicate how strongly you agree or disagree with each of the following statements.
On these scales 0 would indicate that you strongly disagree1 = moderately disagree2 = mildly disagree3 = neither agree nor disagree4 = mildly agree5 = moderately agree6 = strongly agree
strongly stronglydisagree agree
1. Regular, controlled exercisehelps in the management of mydiabetes 0 1 2 3 4 5 6
2. By careful planning of diet andexercise, I can control mydiabetes at least as well asmost other people with diabetes 0 1 2 3 4 5 6
3. Controlling my diabetes wellimposes restrictions on mywhole lifestyle 0 1 2 3 4 5 6
4. Sticking to my diet makeseating out difficult 0 1 2 . 3 4 5 6
5. High blood sugars can beprevented if I plan ahead 0 1 2 3 4 5 6
6. I find it difficult to rememberto take all my tablets at thetimes recommended by the doctor 0 1 2 3 4 5 6
7. It is important for me to visit thediabetic clinic regularly even inthe absence of symptoms 0 1 2 3 4 5 6
8. The better my diabetes iscontrolled, the healthier I feel 0 1 2 3 4 5 6
9. It is just not possible to controlmy diabetes properly and livein a way that is acceptable to me 0 1 2 3 4 5 6
10. Testing urine is an unpleasanttask to have to undertake 0 1 2 3 4 5 6
11. A well-balanced, healthy diet canbe just as enjoyable as a dietwhich is rich in fat or sugar 0 1 2 3 4 5 6
/continued over
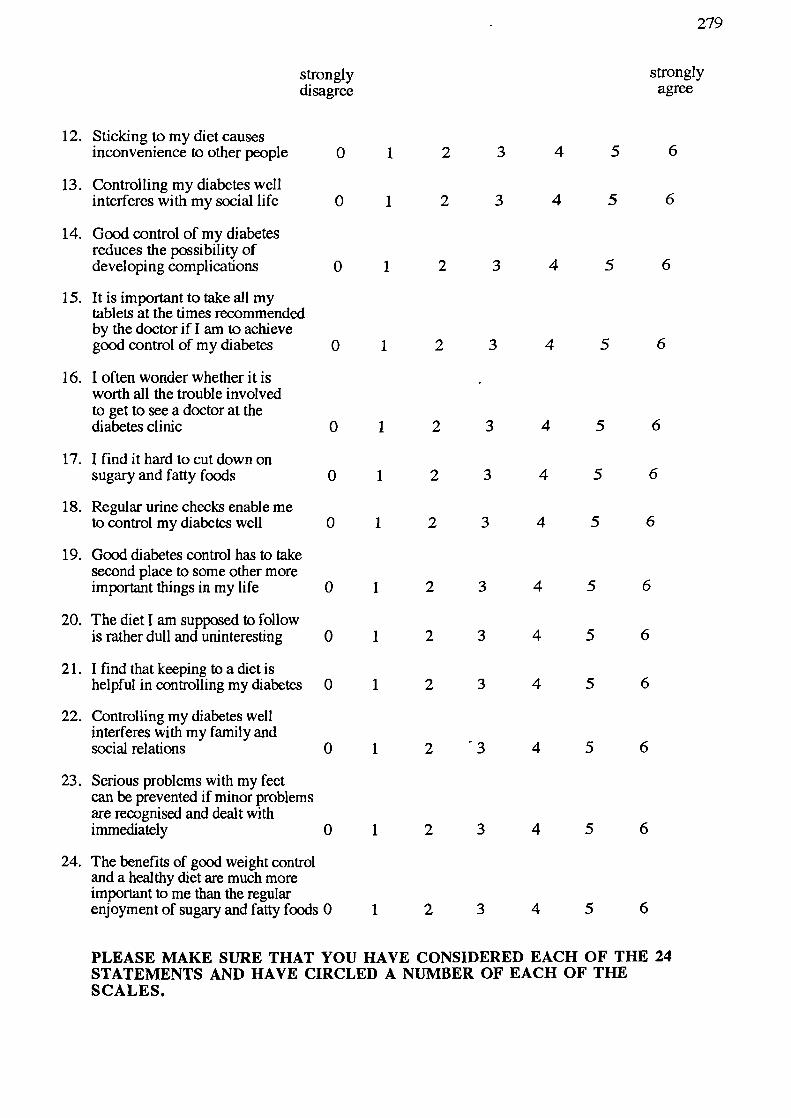
279
strongly stronglydisagree agree
12. Sticking to my diet causesinconvenience to other people 0 1 2 3 4 5 6
13. Controlling my diabetes wellinterferes with my social life 0 1 2 3 4 5 6
14. Good control of my diabetesreduces the possibility ofdeveloping complications 0 1 2 3 4 5 6
15. It is important to take all mytablets at the times recommendedby the doctor if! am to achievegood control of my diabetes 0 1 2 3 4 5 6
16. I often wonder whether it is -worth all the trouble involvedto get to see a doctor at thediabetes clinic 0 1 2 3 4 5 6
17. I find it hard to cut down onsugary and fatty foods 0 1 2 3 4 5 6
18. Regular urine checks enable meto control my diabetes well 0 1 2 3 4 5 6
19. Good diabetes control has to takesecond place to some other moreimportant things in my life 0 1 2 3 4 5 6
20. The diet I am supposed to followis rather dull and uninteresting 0 1 2 3 4 5 6
21. I find that keeping to a diet ishelpful in controlling my diabetes 0 1 2 3 4 5 6
22. Controlling my diabetes wellinterferes with my family andsocial relations 0 1 2 3 4 5 6
23. Serious problems with my feetcan be prevented if minor problemsare recognised and dealt withimmediately 0 1 2 3 4 5 6
24. The benefits of good weight controland a healthy diet are much moreimportant to me than the regularenjoyment of sugary and fatty foods 0 1 2 3 4 5 6
PLEASE MAKE SURE THAT YOU HAVE CONSIDERED EACH OF THE 24STATEMENTS AND HAVE CIRCLED A NUMBER OF EACH OF THESCALES.

280
BELIEFS ABOUT SEVERITY
In this section would you please circle a number on each of the scales toindicate how serious you think the following problems would be if you wereto develop them.
On these scales 0 would indicate that the probleth is not serious at all1 = not serious enough to be worrying2 = moderately serious3 = very serious4 = extremely serious
If you are unable to rate the seriousness of a problem because you are not surewhat the problem is, please tick the box on the right-hand side.
not serious extremely not sure what
at all serious the problem is
1. High blood pressure 0 1 2 3 4
2. Stomach ulcer 0 1 2 3 4 U
3. Blindness 0 1 2 3 4 U
4. Earinfection 0 1 2 3 4 [IIJ
5. Kidney disease 0 1 2 3 4 U
6. Aching legs 0 1 2 - 3 4 07. Leukaemia 0 1 2 3 4 0
(cancer of the blood)
8. Yourdiabetes now 0 1 2 3 4 [19. Your diabetes in 10 0 1 2 3 4 U
years time
10. Gum disease 0 1 2 3 4 fl11. Bronchitis 0 1 2 3 4 [112.Deafness 0 1 2 3 4 LI
13. Numbness in the feet 0 1 2 3 4 LI
14. Heart disease 0 1 2 3 4 015.Asthma 0 1 2 3 4 U
16. Failing eyesight 0 1 2 . 3 4 LIII
17. Loss of hearing 0 1 2 3 4 0
18. Gangrene 0 1 2 3 4 LII
PLEASE MAKE SURE THAT YOU HAVE CIRCLED ONE NUMBER ON EACHOF THE 18 SCALES.
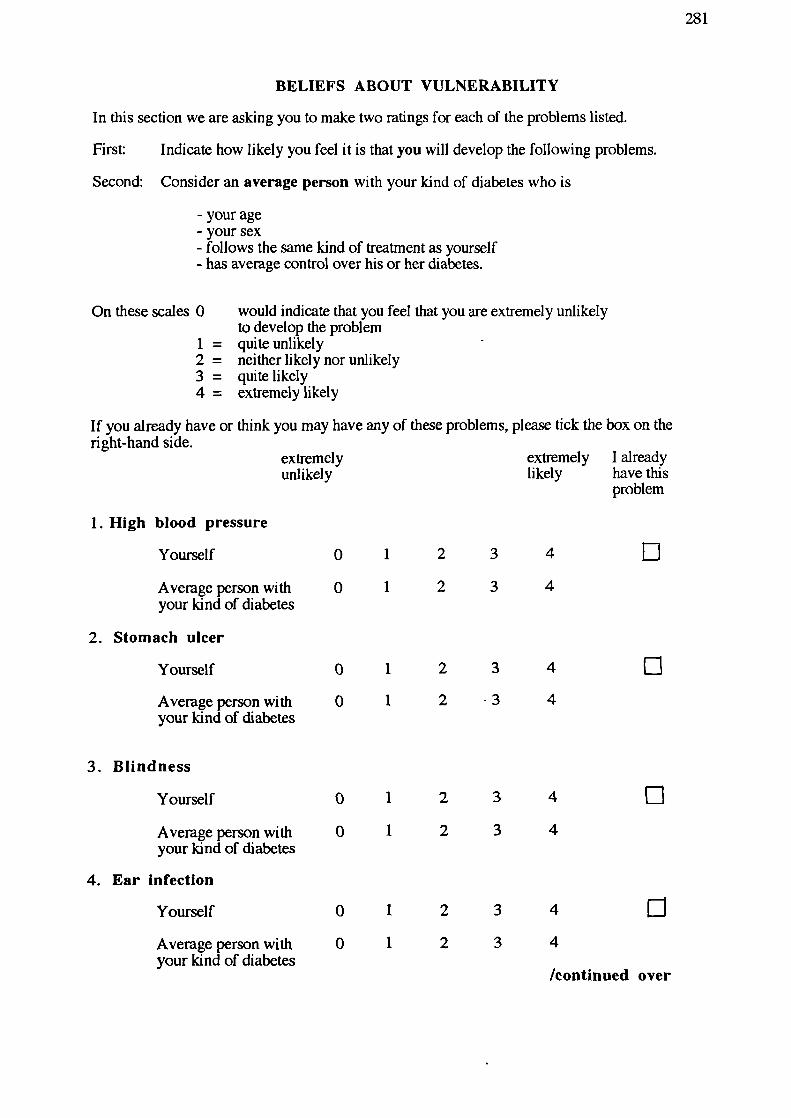
1
1
04
4
2
2
3
3
0
0
I
1
04
4
3
3
0
0
2
2
1
1
04
4
2
2
3
3
0
0
0
1
2
34
0
1
2
3 4
/continued over
281
BELIEFS ABOUT VULNERABILITY
In this section we are asking you to make two ratings for each of the problems listed.
First: Indicate how likely you feel it is that you will develop the following problems.
Second: Consider an average person with your kind of diabetes who is
- your age- your sex- follows the same kind of treatment as yourself- has average control over his or her diabetes.
On these scales 0 would indicate that you feel that you are extremely unlikelyto develop the problem
1 = quite unlikely2 = neitherlikelynorunlikely3 = quite likely4 = extremely likely
If you already have or think you may have any of these problems, please tick the box on theright-hand side.
extremely extremely I alreadyunlikely likely have this
problem
1. High blood pressure
Yourself
Average person withyour kind of diabetes
2. Stomach ulcer
Yourself
Average person withyour kind of diabetes
3. Blindness
Yourself
Average person withyour kind of diabetes
4. Ear Infection
Yourself
Average person withyour kind of diabetes

2 3
4
02 3
4
2 3
4
El2 3
4
2 3
4
02 3
4
2 3
4
02 3
4
2
34 02
3 4
/continued over
282
extremely extremely I alreadyunlikely likely have this
problem
5. Kidney disease
Yourself o 1
Average person with 0 1your kind of diabetes
6. Aching legs
Yourself 0 1
Average person with 0 1your kind of diabetes
7. Leukaemia(cancer of blood)
Yourself 0 1
Average person with 0 1your kind of diabetes
8. Complications arisingfrom diabetes
Yourself 0 1
Average person with 0 1your kind of diabetes
9. Gum disease
Yourself 0 1
Average person with 0 1your kind of diabetes
10. Bronchitis
Yourself 0 1
Average person with 0 1your kind of diabetes
2 3
4
02 3
4

ALremelyunlikely
283
extremely I alreadylikely have this
problem
11. Deafness
Yourself 0 1 2 3 4 [1Average person with 0 1 2 3 4your kind of diabetes
12. Numbness in the feet
Yourself 0 1 2 3 4 0Average person with 0 1 2 . 3 4your kind of diabetes
13. Heart disease
Yourself C) 1 2 3 4 0Average person with 0 1 2 3 4your kind of diabetes
14. Asthma
Yourself 0 1 2 3 4 0Average person with 0 1 2 3 4your kind of diabetes
15. Failing eyesight
Yourself 0 1 2 3 4 0Average person with 0 1 2 3 4your kind of diabetes
16. Loss of hearing
Yourself 0 1 2 3 4
Average person with 0 1 2 3 4your kind of diabetes
17. Gangrene
Yourself 0 1 2 3 4 0Average person with 0 1 2 3 4your kind of diabetes
PLEASE MAKE SURE THAT YOU HAVE CIRCLED A NUMBER ON EACHOF THE SCALES.

284
APPENDIX 3
Introduction to booklet of questionnairesand
General Information Questionnaire
(Post-Education)

285
TYPE II DIABETES STUDY BOOKLET
(POST EDUCATION)
When you recently came to the hospital for a consultation with Dr Jennings, you weregiven a booklet of questionnaires dealing with beliefs and opinions about diabetes.
The information that you gave to us in this booklet will be very useful in gaining a betterunderstanding of the difficulties which arise for people with your kind of diabetes.
Now that you have attended an education session, we are interested to know whetheryour beliefs and opinions about your diabetes have changed. For this reason, you willfind attached another copy of the booklet of questionnaires similar to the one given toyou before.
We would like you to complete the booklet today, if possible (or within the next 2 or 3days) and post it in the stamped addressed envelope provided.
Once again, all answers will be treated in strict confidence.
If you have any problems in completing the questionnaires, please do not hesitate to getin touch with us.
Mrs KS LewisDr C BradleyDepartment of PsychologyUniversity of SheffieldSheffield SlO 2TN
Telephone: 768555 ext 6550

286
GENERAL INFORMATION
Name
Age
Sex................
Weight
Height...............
Please indicate your general impression of your diabetes control during the past fewweeks by circling a number on the scale below
Very well 1 2 3 4 5 6 7 Very poorlycontrolled controlled
Have you ever been to an education session before?
(Please tick) Yes No ..........
Have you ever read any books about diabetes?
(Please tick) Yes No ..........

287
APPENDIX 4
Know'edge Questionnaire

288
DIABETES KNOWLEDGE QUESTIONNAIRE
Name....................................................................................................
PLEASE READ THE FOLLOWING INSTRUCTIONS BEFOREANSWERING THE QUESTIONS IN THIS BOOKLET.
1. On the following pages you will find some questions and statements on diabetes.
2. Each question or statement is followed by a number of choices.
3. You should choose from these choices one or more which you think correctlyanswers the question or completes the statement. Please put a tick by your choice(s).
For example:
Q. Which of the following foods are vegetables?
Banana
Carrot
Cabbage
Turnip
I do not know
4. If you cannot answer a question or complete a statement please put a tick next to"I do not know".
5. Please attempt to answer all the questions.
Thank you.

289
Please make sure that you consider all the choices for a particularstatementor question.
GENERAL
1. Glucose is detected in the urine when:
A person who hasn't got diabetes eats too many sweet things
The kidney threshold is passed and glucose spills over into the urine
The dose of tablets is too large
Blood sugar levels are very low
I do not know
2. High blood sugar levels can be caused by:
Missing a meal
Being less active than usual
Getting an infection
Emotional stress
I do not know
3. Common symptoms of low blood sugars are...
Feeling hungry and sweating
Blurred vision
Slurred speech
Passing a lot of urine
I do not know
4. Some common symptoms of very high blood sugar levels are:
Ei Feeling faint
El Blurring of vision
El Passing more urine
Feeling thirsty
[ I do not know

290
5. If you experience symptoms of hypoglycaemia (low blood sugar) youshould:
Take extra tablets for your diabetes
Continue what you are doing
Take two sugar cubes or a sweetened drink
Drive yourself to hospital
I do not know
6. If a urine test shows 2% (++++) sugar this suggests that you have
Eli A slightly high blood sugar level
El A low blood sugar level
A high blood sugar level
El A normal blood sugar level
El I do not know
7. Which of the following is true:
It does not matter if your diabetes is not fully controlled, as longas you do not have a coma
Poor control of diabetes may result in complications later
Blood or urine testing is only necessary when symptoms occur
It is best to have some sugar in the urine
I do not know
8. A person who has diabetes should try to:
El Avoid high blood sugar levels
El Keep blood sugar levels high
Avoid becoming overweight
El Avoid taking exercise of any kind
El I do not know
ElElElElEl

291
DIET
1. Foods containing refined sugar:
Always cause blood sugar levels to go too low
Raise blood sugar levels quicker than starchy foods
Will have no effect on blood sugar levels
Are slower than starchy foods in raising blood sugar levels
I do not know
2. Which of the following are high in fat?
Cottage cheese
Skimmed milk
Pastry
Cheddar cheese
I do not know
3. Which of the following are high in fibre?
Li Jacket potato
fl Cornflour
Baked beans
Cream crackers
Peas
I do not know
4. Which of the following so-called "DIABETIC" food items are approvedby the hospital clinic?
El Diabetic jam
El Diabetic jellies
El Sorbitol-sweetened, sugar-free canned fruit
"Low Calorie" soft drinks
El I do not know

292
5. Which of the following should be avoided or restricted if you areoverweight?
Cream
Tomatoes
fl Margarine/butter
Alcohol
I do not know
6. Which 3 of the following contain added sugar?
Rice pudding
Chocolate mousse
Marmalade
Pasta
I do not know
7. On a diabetic person's diet, which of the following can be eatenfreely?
Cauliflower
Lettuce
Digestive biscuits
Honey
I do not know
8. Rice is mainly:
Protein
Carbohydrate
Fat
Mineral and vitamin
I do not know

293
COMPLICATIONS
1. Which of the following does help in the care of your feet?
Changing your socks/tights frequently
Wearing the same shoes every day
Checking your feet regularly for sores
Rinsing socks/tights carefully after washing to remove soap
I do not know
2. After washing your feet you should:
Remove any dry skin from the feet
Remove any hard skin from the feet
Blot dry between the toes with a soft towel
Avoid rubbing the feet with a towel
I do not know
3. When a person with diabetes smokes the effect it has is
To increase the risk of damage to blood vessels
To increase the risk of poor blood circulation in the legs
To increase the risk of heart disease
To cause problems with weight control
I do not know
4. Keeping diabetes well controlled over the years can lower the risk ofdamage to:
Nerves in the feet
The kidneys
The lungs
The eyes
I do not know
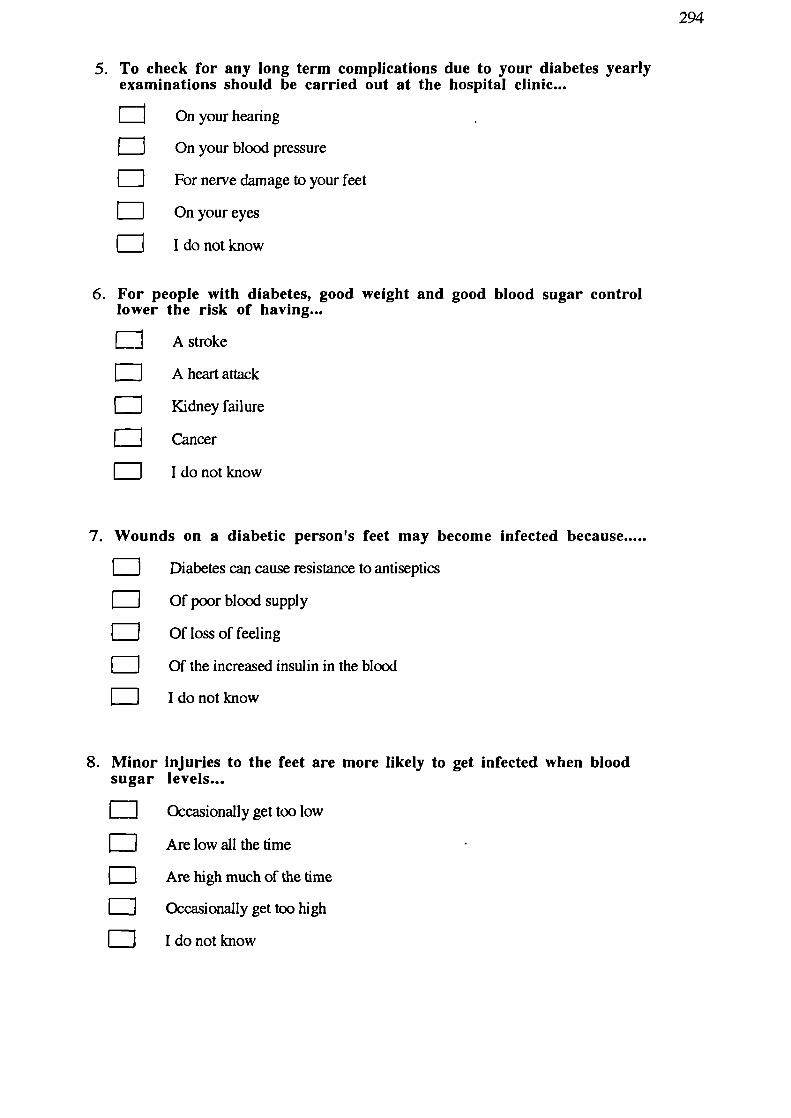
294
5. To check for any long term complications due to your diabetes yearlyexaminations should be carried out at the hospital clinic...
On your hearing
On your blood pressure
For nerve damage to your feet
On your eyes
I do not know
6. For people with diabetes, good weight and good blood sugar controllower the risk of having...
A stroke
A heart attack
Kidney failure
Cancer
I do not know
7. Wounds on a diabetic person's feet may become infected because.....
Diabetes can cause resistance to antiseptics
Of poor blood supply
Of loss of feeling
Of the increased insulin in the blood
I do not know
8. Minor injuries to the feet are more likely to get infected when bloodsugar levels...
EJ Occasionally get too low
Are low all the time
Are high much of the time
Occasionally get too high
I do not know

295
9. Control of diabetes is affected by...
The kind of food eaten
E
The amount of food eaten during the day
The amount of water drunk during the day
The amount of exercise done
I do not know
10. Your urine or blood tests have started to show increased sugar, you...
Should rest for 4-5 hours
Should check your diet is correct
Should check for any infections
May need to eat less atmeal times
I do not know
296
APPENDIX 5
Written information supplied to patietits regarding diabetes and itscomplications
(Insulin Study)

297
INFORMATION FOR PEOPLE WITH DIABETES WHO ARE TREATEDWTH DIET AND TABLETS
In diabetes the level of sugar in the blood becomes higher than normal and it spills into
the urine. People who develop diabetes in middle life often do not feel unwell with their
diabetes and frequently it is only found by chance. They are recommended to follow a
diet and many take tablets to help control their diabetes.
Why control diabetes?
Diabetes that starts in middle life may seem "mild", but like the diabetes that occurs in
younger people there are long-term effects. These effects, commonly called "the
complications of diabetes", occur much less frequently in people whose diabetes is "well
controlled".
How do we measure control?
Often there are no obvious symptoms of poor control and we therefore rely largely on
"tests" to measure diabetes control. Urine tests are used by many people and they
should, ideally, show no sugar. A few patients with tablet-treated diabetes measure
blood sugar by pricking their fingers. This can be more accurate than urine testing.
Control is also assessed by the blood sugar test done in the diabetic clinic and from time
to time by a blood test to measure "glycosylated haemoglobin". Glycosylated
haemoglobin is a measure of a person's diabetes control over a two month period.
What are the complications of diabetes?
Diabetes can damage a number of parts of the body and these will be outlined in turn.
(a) Blood vessels. Hardening of the arteries is more pronounced in diabetes and
tends to come on at an earlier age. This results in an increased risk of heart
attacks and poor circulation to the legs.
(b) Eyes. Changes occur at the back of the eye that, left untreated, can lead to loss
of vision. Fortunately, if these changes are detected early, the risk of losing
vision is greatly reduced by laser treatment
(c) Nerves. Diabetes affects nerves, particularly those that carry sensation from the
feet. Some people with damage to these nerves may notice "pins and needles",

298
pain or numbness in their feet most of the time. Others have severely damaged
nerves but do not have any symptoms.
(d) Feet. These deserve special mention. They may be affected by a number of the
complications of diabetes and need to be carefully looked after. As a result of
nerve damage, people may not notice their shoes rubbing or may not feel
anything when a pin has pierced the sole of their shoe. The blood supply may
be poor and healing may be slow. It is therefore important to inspect your feet
daily, keep them clean and dry, and keep the toe nails trimmed.
(e) Kidneys. The kidneys can be damaged by poorly controlled diabetes leading to
kidney failure in a small proportion.
How can complications be prevented or arrested?
The risk of complications can be greatly reduced by good control of your diabetes.
Good control can be achieved in most people who develop diabetes in middle life by
following a diet and taking tablets. It is very important that people with diabetes are not
overweight as extra weight has the effect of making their diabetes worse. The diet
recommended by the dietician not only helps with weight loss but also reduces the risk
of certain complications. Smoking increases the risk of hardening of the arteries and we
therefore strongly recommend that you do not smoke.
How can diabetes be treated if diet and tablet treatment does not achieve
good control?
The tablets prescribed for diabetes generally work by stimulating the body's own
insulin. However, despite treatment with diet and tablets, some people cannot make
enough insulin. In this case insulin injections are usually necessary in order to improve
control and reduce the risk of complications. Usually, once started, insulin is continued
indefinitely.

299
Are there any new alternatives?
There are no new alternatives to insulin, but recently a short course of insulin has been
found to improve control, not only during the period of treatment with insulin, but also
after stopping the insulin and restarting tablets.
Here in Sheffield, we are assessing the effect of afour month period of insulin
treatment on people with poorly controlled tablet-treated diabetes. We hope this will
help determine who is likely to do better on insulin. It is also possible that, as a result of
the insulin therapy, some people will be better controlled on tablets after using insulin.
Insulin treatment
Insulin is normally made by the pancreas gland and it helps the body to use sugar.
However, in diabetes, the pancreas does not make enough insulin. As a result of this,
some of the sugar collects in the blood instead of being used by the body. Insulin
treatment helps the body to make use of this sugar. Unfortunately, insulin cannot be
taken by mouth and must be injected under the skin (not into a vein).
Insulin injections
Injections are usually done twice a day, before breakfast and before the evening meal.
Disposable plastic syringes are normally used nowadays and they have a very fine
needle. After a short period of time most people barely notice the injections. Insulin can
be injected into the upper ann, the upper leg, or under the skin of the abdomen. People
starting insulin receive a lot of help and instruction from the doctors and nurses based at
the hospital and most learn to give their own insulin within a few days.
The insulin pump
In this hospital, we have considerable experience with another method of giving insulin,
namely the insulin infusion pump. This is a small device that slowly injects insulin
throughout the day through a small needle placed under the skin. The pump is about the
size of a pack of playing cards and is usually carried in a pocket or attached to a belt.
Before each meal the patient sets the pump to give a small "boost" of insulin. As with

300
injection treatment people starting treatment with the insulin pump receive a lot of help
and instruction from the hospital staff.
Is any change in the diet necessary?
Yes, people treated with insulin have to spread the foods that have any form of
carbohydrate in them (eg potatoes, bread, rice) regularly throughout the day to
counterbalance the insulin as, if this is not done, the blood sugar may become lower
than normal (hypoglycaemic, "hypo") or higher than usual. People treated with insulin
prevent hypoglycaemia (hypo) by eating regular meals and taking some sugar if they are
going to be late for a meal.
Blood testing
People who use insulin usually check their blood glucose by pricking their finger using
an automatic device called an "autolet". This also has a fine needle and people rapidly
get used to this form of testing. The drop of blood formed by pricking the finger is
dropped onto a test stick which changes colour according to the level of sugar in the
blood. Controlling diabetes is made easier by knowing the level of sugar in the blood.
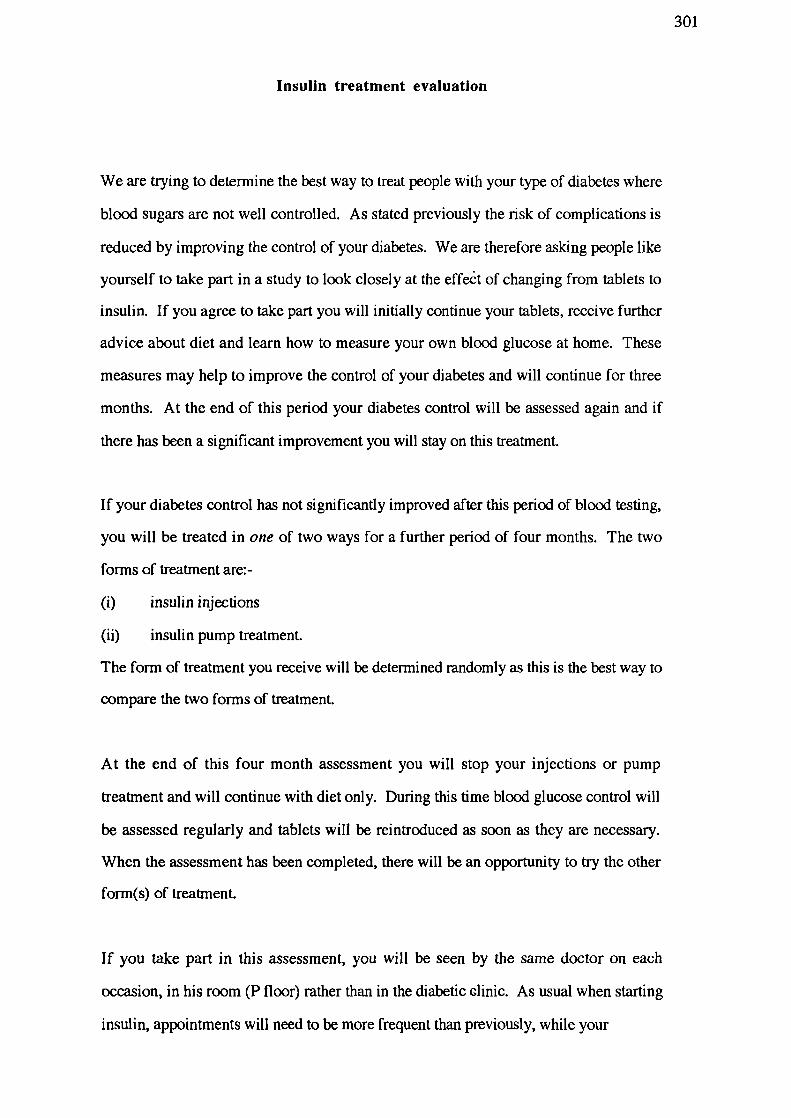
301
Insulin treatment evaluation
We are trying to determine the best way to treat people with your type of diabetes where
blood sugars are not well controlled. As stated previously the risk of complications is
reduced by improving the control of your diabetes. We are therefore asking people like
yourself to take part in a study to look closely at the effet of changing from tablets to
insulin. If you agree to take part you will initially continue your tablets, receive further
advice about diet and learn how to measure your own blood glucose at home. These
measures may help to improve the control of your diabetes and will continue for three
months. At the end of this period your diabetes control will be assessed again and if
there has been a significant improvement you will stay on this treatment.
If your diabetes control has not significantly improved after this period of blood testing,
you will be treated in one of two ways for a further period of four months. The two
forms of treatment are:-
(1) insulin injections
(ii) insulin pump treatment.
The form of treatment you receive will be determined randomly as this is the best way to
compare the two forms of treatment.
At the end of this four month assessment you will stop your injections or pump
treatment and will continue with diet only. During this time blood glucose control will
be assessed regularly and tablets wilt be reintroduced as soon as they are necessary.
When the assessment has been completed, there will be an opportunity to try the other
form(s) of treatment.
i you take part in this assessment, you will be seen by the same doctor on each
occasion, in his room (P floor) rather than in the diabetic clinic. As usual when starting
insulin, appointments will need to be more frequent than previously, while your

302
treatment is adjusted. There will, however, be very little waiting and your appointments
will be more flexible. During the assessment our nursing staff will also help you adjust
to your new form of treatment and advise you about various aspects of insulin treatment.
As mentioned previously, some people may find that a period of insulin treatment will
have improved their diabetes control compared with their previous control when using
tablets and diet. We do not know how long this will last. Some people may find that
the blood testing alone helps them control their diabetes. Other people will find that in
order to maintain good diabetes control, they need to continue insulin treatment
indefinitely.

303
APPENDIX 6
Introduction to booklet of questionnaires
and
General Information Questionnaire
(Insulin Study - Post Decision)

304
TYPE II DIABETES STUDY BOOKLET
(POST DECISION)
When you recently came to the hospital for a consultation with Dr Jennings, you weregiven a booklet of questionnaires dealing with beliefs and opinions about diabetes.
The information that you gave to us in this booklet will be very useful in gaining a betterunderstanding of the difficulties which arise for people with your kind of diabetes.
Now that you have more information about your diabetes control and have made adecision as to whether or not to take part in the insulin study, we are interested to knowwhether your views about your diabetes have changed. For this reason, you willfind attached another copy of the booklet of questionnaires similar to the one given toyou before.
We would like you to complete the booklet today, if possible (or within the next 2 or 3days) and post it in the stamped addressed envelope provided.
Once again, all answers will be treated in strict confidence.
If you have any problems in completing the questionnaires, please do not hesitate to getin touch with us.
Mrs K S LewisDr C BradleyDepartment of PsychologyUniversity of SheffieldSheffield SlO 2TN
Telephone: 768555 ext. 6550

305
GENERAL INFORMATION
Name
Age Sex
Weight Height
Please indicate your general impression of your diabetes control during the past fewweeks by circling a number on the scale below
Very well 1 2 3 4 5 6 7 Very poorlycontrolled controlled
What have you decided to do? (please tick where applicable)
Take part in the insulin study
Continue with present treatment
Other (please state)
Please describe in the space below your reasons for the above decision:
/continued over......

306
Please answer the questions below to indicate how you feel about the treatments youhave been offered (whether or not you have decided to take part in theinsulin study):
1. Does the thought of injecting yourself with insulin make you feel apprehensive orworried? Please circle a number on the scale below:
Very apprehensive Not at allor worried 6 5 4 3 2 1 0 apprehensive
or worried
2. Does the thought of using an insulin pump make you feel apprehensive or worried?Please circle a number on the scale below:
Very apprehensive Not at allor worried 6 5 4 3 2 1 0 apprehensive
or worried
3. Does the thought of pricking your finger to sample your blood sugar make you feelapprehensive or worried? Please circle a number on the scale below.
Very apprehensive Not at allor worried 6 5 4 3 2 1 0 apprehensive
or worried
307
APPENDIX 7
Introduction to booklet of questionnaires
and
General Information Questionnaire
(Insulin Study - Pre-Treatment)
308
TYPE II DIABETES STUDY BOOKLET
(PRE-TREATMENT)
Over the past 3 months, you have been monitoring your blood sugar levels at home andhave been finding out more about your diabetes control. You have also been givenadvice and instruction about the management of your diabetes by Dr Jennings and thedietician, Susan Murdoch. We are interested to learn whether these experiences havechanged your views about your diabetes and its management
We would therefore like you to complete another copy of the booklet of questionnairessimilar to the ones given to you before. Please do this today, if possible (or within thenext 2 or 3 days) and post it in the envelope provided.
Once again, all answers will be treated as confidential.
Please do not hesitate to contact us if you have any problems in completing thequestionnaires.
Mrs K S LewisDr C BradleyDepartment of PsychologyUniversity of SheffieldSheffield S 10 2TN
Telephone: 768555 ext. 6550

309
GENERAL INFORMATION
Name
Weight........................
Please indicate your general impression of your diabetes control during the past fewweeks by circling a number on the scale below
Very well 1 2 3 4 5 6 7 Very poorlycontrolled controlled
To what extent do you feel that monitoring your blood sugar levels over the past fewweeks has helped you to manage your diabetes.
Please circle a number on the scale below:
Has greatly 1
2 3
4 5 6 7 Hasnothelpedhelped me to me to managemanage my my diabetesdiabetes
To what extent do you feel that your diabetes control has improved as a result of bloodglucose monitoring?
Has greatly 1 2 3 4 5 6 7 Has notimproved as a improved as aresult of blood result of bloodglucose glucosemonitoring monitoring

310
APPENDIX 8
Introduction to booklet of questionnaires
and
General Information Questionnaire
(Insulin Study - Post-Treatment)

311
TYPE II DIABETES STUDY BOOKLET
(POST-TREATMENT)
Now that you have been using insulin for 4 months, we are interested to know whetheryour views about your diabetes and its management have changed. We also want toknow what your experience of using this form of treatment has been like.
We would therefore like you to complete another booldet of questionnaires similar tothose given to you before.
Please complete the booklet today, if possible (or within the next 2 or 3 days) and post itin the stamped addressed envelope provided.
Once again, your answers will be treated as confidential.
Please feel free to add comments or information to the questionnaires where you feel thismight help.
If you have any problems in completing the questionnaires, please do not hesitate to getin touch with us.
Mrs K S LewisDr C BradleyDepartment of PsychologyUniversity of SheflieldSheffield SlO 2TN
Telephone: 768555 ext. 6550

312
GENERAL INFORMATION
Name
Weight
Please indicate your general impression of your diabetes control during the past fewweeks by circling a number on the scale below
Very well 1 2 3 4 5 6 7 Very poorlycontrolled controlled

313
APPENDIX 9
A Expectations of Treatment Questionnaire
B Experience of Treatment Questionnaire

stronglyagree
3 4 5 6
3 4 5 6
3 4 5 6
3 4 5 6
3 4 5
6
3 4 5
6
3 4 5
6
3 4 5 6
3 4 5 6
3 4 5 6
3 4 5 6
1
2
1
2
1
2
1 2
1 2
1 2
1 2
1 2
1 2
1 2
1 2
314
EXPECTATIONS OF THE TREATMENT
Please consider your expectations about the form of diabetes treatment which you areabout to use. Circle one of the numbers on each of the scales to indicate how strongly youagree or disagree with each of the following statements.
On these scales 0= strongly disagree1 = moderately disagree2= mildly disagree3 = neither agree nor disagree4= mildly agree5= moderately agree6 = strongly agree
stronglydisagree
1. I will feel able to control myown diabetes with little needfor other people's help 0
2. I will feel handicapped 0
3. It will be easy to regulatemy blood sugar 0
4. I believe that I may developinfections with the treatment 0
5. I believe that the treatment willreduce the risk of my developingcomplications of diabetes (suchas deteriorating eyesight) 0
6. It will be obvious to otherpeople that I have diabetes 0
7. I will have freedom to choosewhenlwanttoeat 0
8. I expect my blood sugar levelsto become similar to those ofnon-diabetic people 0
9. I will need to adapt my life-style 0
10. Insulin reactions (hypos) willbe frequent 0
11. I believe there might be technicalproblems with the treatment 0

3 4
3 4
3 4
3 4
5 6
5 6
5 6
5 6
1
2
1
2
1
2
1
2
1
2
1
2
1 2
1 2
1 2
1 2
3
4
5
6
3
4
5
6
3
4
5
6
3
4
5
6
3
4
5
6
3
4
5
6
315
strongly stronglydisagree agree
12. I will feel dependent onprofessional help for managingmy diabetes 0
13. It will be difficult to deal withthe treatment 0
14. People around me will acceptmy using this form of treatment 0
15. I think the study will producevaluable scientific information 0
16. I will be able to forget that I havediabetes for most of the time 0
17. 1 believe that I might put on toomuch weight 0
18. It will be inconvenient to do thenumber of blood glucose testsrequired 0
19. I will be able to be flexiblewith what I eat and still maintaincontrol of my diabetes 0
20. I will be able to take part fullyin social activities 0
21. Ibelievethatashortperiodof 0using insulin will lead to goodblood sugar control in the longterm.
PLEASE MAKE SURE THAT YOU HAVE CONSIDERED EACH OF THE21 STATEMENTS AND HAVE CIRCLED A NUMBER ON EACH OF THE21 SCALES.

stronglyagree
3
4 5 6
3
4 5 6
3
4 5 6
3
4 5 6
3
4 5 6
3
4 5 6
3
4
5 6
3 4
5
6
3 4
5
6
3 4
5
6
3 4
5
6
316
TREATMENT EXPERIENCE
Please think back over the past few weeks and consider your experience about the formof diabetes treatment which you have been using recently.Circle one of the numbers on each of the scales to indicate how strongly you agree ordisagree with each of the following statements.
On these scales 0= strongly disagree1 = moderately disagree2= mildly disagree3 = neither agree nor disagree4= mildly agree5= moderately agree6 = strongly agree
stronglydisagree
1. I have felt able to control myown diabetes with little needfor other people's help 0 1 2
2. I have felt handicapped 0 1 2
3. Ithasbeeneasytoregulatemybloodsugar 0 1 2
4. I have developed infectionswith the treatment 0 1 2
5. I believe that the treatment hasreduced the risk of my developingcomplications of diabetes (suchas deteriorating eyesight) 0 1 2
6. It has been obvious to otherpeople that I have diabetes 0 1 2
7. I have had freedom to choosewhenlwanttoeat 0 1 2
8. My blood sugar levels havebecome similar to those ofnon-diabetic people 0 1 2
9. I needed to adapt my life-style 0 1 2
10. There have been frequentinsulin reactions (hypos) 0 1 2
11. I have experienced technicalproblems with the treatment 0 1 2

1
2
3
1
2
3
1
2
3
1
2
3
1
2
3
1
2
3
1 2 3
1 2 3
1 2 3
4
5
4
5
4
5
4
5
4
5
4
5
6
6
6
6
6
6
4 5
4 5
4 5
6
6
6
317
strongly stronglydisagree agree
12. I have felt dependent onprofessional help for managingmy diabetes 0
13. It has been difficult to deal withthe treatment 0
14. People around me have acceptedmy using this form of treatment 0
15. I think the study is producingvaluable scientific information 0
16. I have been able to forget that Ihave diabetes for most of the time 0
17. I have put on too much weight0
18. It has been inconvenient to do thenumber of blood glucose testsrequired 0
19. I have been flexible with whatI eat and still maintained controlof my diabetes 0
20. I have been able to take part fullyin social activities 0
PLEASE MAKE SURE THAT YOU HAVE CONSIDERED EACH OF THE20 STATEMENTS AND HAVE CIRCLED A NUMBER ON EACH OF THE20 SCALES.