An Examination of Ohio’s Physical Education Academic Content Standard 4, Benchmark A for Grades...
59
Wright State University CORE Scholar Master of Public Health Program Student Publications Master of Public Health Program 2011 An Examination of Ohio’s Physical Education Academic Content Standard 4, Benchmark A for Grades 9-12 Gabriel Jones Wright State University - Main Campus Follow this and additional works at: hp://corescholar.libraries.wright.edu/mph Part of the Community Health and Preventive Medicine Commons is Master's Culminating Experience is brought to you for free and open access by the Master of Public Health Program at CORE Scholar. It has been accepted for inclusion in Master of Public Health Program Student Publications by an authorized administrator of CORE Scholar. For more information, please contact [email protected]. Repository Citation Jones, G. (2011). An Examination of Ohio’s Physical Education Academic Content Standard 4, Benchmark A for Grades 9-12. Wright State University, Dayton, Ohio.
-
Upload
independent -
Category
Documents
-
view
2 -
download
0
Transcript of An Examination of Ohio’s Physical Education Academic Content Standard 4, Benchmark A for Grades...
Wright State UniversityCORE ScholarMaster of Public Health Program StudentPublications Master of Public Health Program
2011
An Examination of Ohio’s Physical EducationAcademic Content Standard 4, Benchmark A forGrades 9-12Gabriel JonesWright State University - Main Campus
Follow this and additional works at: http://corescholar.libraries.wright.edu/mph
Part of the Community Health and Preventive Medicine Commons
This Master's Culminating Experience is brought to you for free and open access by the Master of Public Health Program at CORE Scholar. It has beenaccepted for inclusion in Master of Public Health Program Student Publications by an authorized administrator of CORE Scholar. For moreinformation, please contact [email protected].
Repository CitationJones, G. (2011). An Examination of Ohio’s Physical Education Academic Content Standard 4, Benchmark A for Grades 9-12. Wright StateUniversity, Dayton, Ohio.
1
Running Head: EXAMINATION OF OHIO’S PE ACADEMIC CONTENT
An Examination of Ohio’s Physical Education Academic Content Standard 4,
Benchmark A for Grades 9-12
Gabriel Jones
Wright State University
EXAMINATION OF OHIO’S PE ACADEMIC CONTENT 2
Acknowledgements
I would like to acknowledge and thank Dr. Sabrina Neeley, Dr. Marietta Orlowski and Dr. Kevin
Lorson for their guidance and support throughout my Culminating Experience.
EXAMINATION OF OHIO’S PE ACADEMIC CONTENT 3
Table of Contents
Abstract ............................................................................................................................................5
Introduction ......................................................................................................................................6
Research Purpose .............................................................................................................................7
Literature Review.............................................................................................................................7
Physical Activity ..................................................................................................................7
Adolescent Physical Activity and Physical Activity Barriers..............................................8
Physical Activity and School-Based Physical Education ..................................................11
Concerns with Physical Education .....................................................................................12
Benefits of Physical Education ..........................................................................................13
Ohio High School Physical Education Requirements .......................................................14
Ohio High School Physical Education Participation .........................................................15
Ohio High School Physical Education Standards ..............................................................17
A Brief History of the PE Standards in Ohio .....................................................................19
Ohio Physical Education Standard 4, Benchmark A .........................................................21
Methods..........................................................................................................................................25
Results ............................................................................................................................................29
Teachers’ Perceptions of Standard 4, Benchmark A Assessments ....................................29
Student Health-Enhancing Fitness Levels .........................................................................35
Key Informant Interview....................................................................................................37
Discussion ......................................................................................................................................39
Teachers’ Perceptions of Standard 4, Benchmark A Assessments ....................................39
Student Health-Enhancing Fitness Levels .........................................................................41
EXAMINATION OF OHIO’S PE ACADEMIC CONTENT 4
Limitations .........................................................................................................................43
Public Health Implications and Recommendations ...........................................................44
Conclusions ....................................................................................................................................45
References ......................................................................................................................................47
Appendices .....................................................................................................................................52
EXAMINATION OF OHIO’S PE ACADEMIC CONTENT 5
Abstract
Objective: The purpose of this study was to describe select physical education teachers’
perceptions of the effectiveness and accuracy of the assessments for Ohio's Physical Education
Academic Content Standard 4 Benchmark A in determining the fitness and physical activity
levels of high school students. A secondary purpose was to describe the fitness levels of high
school physical education students, based on assessment data.
Methods: Participants were forty-one physical education teachers and ninety high school
students from southwest Ohio. Data were collected from the teachers through an online
questionnaire and from students with FITNESSGRAM testing. FITNESSGRAM data from one
local school district and questionnaire data were analyzed with descriptive statistics. A key
informant interview was also completed with a member of the Ohio Department of Education
Physical Education Standards and Assessments committee and Physical Education faculty
member at Wright State University.
Results: A majority of the teachers found the assessments aligned with Ohio’s Physical
Education Standard 4 Benchmark A to be effective and accurate at measuring physical fitness
and activity levels of students and they were helpful to both the teachers and students in guiding
the process of assessment. Results also indicated students were not achieving the optimal levels
of physical fitness based on assessment data (30% of boys and 49% of girls had limited fitness
levels and 61% of boys and 33% of girls had proficient fitness levels).
Conclusions: Results from this pilot study indicate that physical educators have positive
perceptions of the assessments aligned with Ohio’s PE Standard 4 Benchmark A and find them
helpful in assessing a students’ health-benefiting physical activity levels and physical fitness.
Also, high school students generally have poor health-benefitting fitness levels.
EXAMINATION OF OHIO’S PE ACADEMIC CONTENT 6
An Examination of Ohio’s Physical Education Academic Content Standard 4,
Benchmark A for Grades 9-12
Physical education (PE) courses are taken during primary and secondary education in
public and private schools and encourage psychomotor learning in a play or movement
exploration setting (Anderson, 1989). In 1976, nearly 40 percent of students in public schools
took part in daily PE activities (USDHHS, 2000). The number of students enrolled in PE has
continued to decline over the years. As of now (December 2011), only five states require PE in
every grade kindergarten through 12th
(NASPE, 2010). Though enrollment and participation
declines in PE seem dramatic, there have been slight improvements that have been made in the
last few years, with more states that now requiring PE for grades K-8. The 17% increase in the
number of states requiring PE maybe me attributed to the growing obesity epidemic among our
nation’s youth and the realization that PE may play a vital role in slowing it down (NASPE,
2010). Ohio requires that students take PE as a required part of curriculum for grades K-8 and
that students in grades 9-12 complete a minimum of 120 hours of course instruction in order to
graduate (Henry, 2011). The frequency of classes per week and time spent in PE class varies by
school district (Henry, 2011).
Physical activity is important in maintaining physical fitness and is associated with many
health-related benefits (Stampfer, Hu, Manson, Rimm, & Willett, 2000). According to the US
Department of Health and Human Services, adolescents need around 60 minutes of physical
activity a day to receive benefits associated with physical activity (Fitness.gov, 2001). A great
way for students to get this physical activity is through PE class. Quality physical education has
been linked to cognitive, affective, and quality of life benefits in addition to the physical benefits
for students at elementary, middle, and high school levels (NASPE, 2010).
EXAMINATION OF OHIO’S PE ACADEMIC CONTENT 7
In December 2007, the Ohio State Board of Education adopted the National Association
of Sport and Physical Education (NASPE) standards. These standards provide clear, rigorous
expectations for all students in kindergarten through 12th
grade (Henry, 2011). Two of the six
standards address physical activity and physical fitness. Standard 3 addresses physical activity
and Standard 4 addresses physical fitness (NASPE, 2010). In addition to these standards, the
Ohio State Board of Education adopted benchmarks and indicators for each of the standards in
June 2009. A critical component of the benchmarks and indicators are assessments such as
physical fitness tests.
Research Purpose
The purpose of this study is to: (a) describe select high school PE teachers’ perceptions of
the effectiveness and accuracy of the assessments for Ohio's Physical Education Academic
Content Standard 4 Benchmark A in determining the fitness and physical activity levels of high
school students and (b) to describe the fitness levels of select high school PE students.
Literature Review
Physical Activity
Physical activity is important for building and maintaining physical fitness and is
associated with health-related benefits. One important benefit received from being physically
active is an improvement in the cardiovascular system. Stampfer, Hu, Manson, Rimm, and
Willett (2000), who followed 84,129 women participating in a Nurses' Health Study, found that
adherence to lifestyle guidelines involving diet, exercise, and abstinence from smoking was
associated with a very low risk of coronary heart disease and those women who were physically
active had the lowest number of chronic diseases (Stampfer et al., 2000). Chronic diseases
including heart disease, cancer, chronic respiratory diseases, stroke, and diabetes typically
EXAMINATION OF OHIO’S PE ACADEMIC CONTENT 8
progress slowly. They are long in duration, sometimes lasting the remainder of the person’s life.
They are the leading cause of death in Ohio as well as throughout the world (Centers for Disease
Control and Prevention, 2009).
Physical activity also has short-term benefits. Wilmore and Knuttgen (2003) found that
being physically active built and maintained healthy bone density, muscle strength, and joint
mobility, improved immune function, and promoted the psychological well being of his
participants in a study at Texas A&M University (Wilmore & Knuttgen, 2003). Studies
conducted by Cohen and Williamson found that physical activity helps maintain a healthy body
weight. They found that participants in their study who were performing physical activity
increased their resting metabolism and burned calories. Physical activity also reduced levels of
cortisol in the participants, a hormone that builds fat in the abdominal region and causes both
physical and mental health problems (Cohen & Williamson, 1991). By reducing the amount of
cortisol produced by the body, there was less fat built in the abdominal area, thus making it
easier to maintain a healthy body weight.
Adolescent Physical Activity and Physical Activity Barriers
Both long-and short-term benefits received from physical activity are especially
important for the younger population, whose bodies are still growing and whose systems are still
developing. Physically inactive adolescents are more likely to be overweight (Going, Lohman,
& Cussler, 2011). In a study aimed to describe the age-specific fatness-risk factor relationship in
U.S. youth, Going, Lohman, and Cussler (2011) collected data from 12,279 adolescents from the
National Health and Nutritional Examination Surveys (NHANES) and discovered that there is a
strong relationship between chronic disease risk factors and percent fat as well as physical
inactivity (Going et al., 2011). When there were higher the levels of physical inactivity and
EXAMINATION OF OHIO’S PE ACADEMIC CONTENT 9
percent fat among the adolescents, there was a higher prevalence of adverse cardiovascular
disease risk factors (Going et al., 2011).
In addition to the physical and psychological benefits of physical activity already
mentioned, physical activity has also been documented as a protective factor for risky or unsafe
behaviors among adolescents. Pate, Heath, Dowda, and Trost (1996) found that physical activity
was associated with lower cigarette smoking, marijuana use, higher fruit and vegetable
consumption, less television watching, increased likeliness to wear a seatbelt, and higher
perception of academic performance (Pate, Heath, Dowda, & Trost, 1996). Physical activity also
improves many social aspects of health such as self-perception. In a study among urban,
adolescent girls conducted by Colchico, Zybert, and Basch (2000), higher participation in
physical activity programs was associated with an increase in scholastic competence, social
acceptance, athletic competence, physical appearance, and global self-worth (Colchico, Zybert,
& Basch, 2000).
Because behaviors developed as adolescents tend to be carried into adulthood, where the
frequency of physical activity and sport participation already tends to decrease with age, it is
important that adolescents make a regular habit of engaging in safe behaviors such as physical
activity (Telama & Yang, 2000). However, low rates of physical activity among adolescents
have been an increasing trend in the United States for a number of years. As of December 2010,
only 15.3% of high school students in the United States met the aerobic objective set by the
Centers for Disease Control and Prevention, 51.0% met the muscle-strengthening objective, and
12.2% met the objective for both aerobic and muscle-strengthening activities (Centers for
Disease Control and Prevention, 2010).
EXAMINATION OF OHIO’S PE ACADEMIC CONTENT 10
There are a number of environmental reasons why adolescents may not participate in
regular physical activity. Dagkas and Stathi (2007) explored the social and environmental
factors that may affect high school adolescents’ engagement in physical activity. They suggested
that adolescent involvement in physical activity is linked with social class and home
environment (Dagkas & Stathi, 2007). Adolescents tend to have a tendency to model the activity
patterns of parents and siblings. For example, when Anderssen and Wold (2002) performed a
study on 904 students in western Norway, the following were all positively related to the
students’ physical activity levels: perceived leisure-time physical activity of parents and best
friend, perceived direct support for physical activity from parents and friends, direct help from
parents in exercising vigorously, and perceived value of physical activity of parents and friends
(Anderssen & Wold, 2002).
Dagkas and Stathi (2007) also suggest that physical activity is linked with economic
status. Those adolescents from lower socioeconomic backgrounds were limited in access to
areas and opportunities for physical activity, compared to their higher socioeconomic
counterparts (Dagkas & Stathi, 2007). Lower socioeconomic status adolescents often live in
communities where they are unable to participate in physical activity due to crime and safety
issues. Lack of facilities and places to engage in physical activity such as recreation centers,
parks, and paths also inhibit those of lower socioeconomic status.
In addition to the external barriers to physical activity such as environmental and
interpersonal factors, there are a number of internal barriers that inhibit physical activity among
adolescents. Allison, Dwyer, and Goldenberg (2005) have found that some internal factors
include individual characteristics, lower priority for physical activity, and involvement in
technology-related activities (Allison, Dwyer, & Goldenberg, 2005). Technology-related
EXAMINATION OF OHIO’S PE ACADEMIC CONTENT 11
activities include television watching, video games, and other activities that often draw the
individual away from physical activity and the internal drive to be physically active is thus
decreased. These and other internal factors are often complex because they are associated with a
person’s traits and internal characteristics, which are unique to each individual.
Internal and external barriers to physical activity, which are causing surges in the
physical inactivity levels among the adolescents around the nation, are a major cause for
concern. People around the country have looked for ways to address this concern and have
looked to local, state, and federal policy makers and administrators to help overcome this issue.
One of the primary areas where addressing physical inactivity has been attempted is in schools.
Physical Activity and School-Based Physical Education
The school is a promising environment for health promotion activities because it reaches
such a great proportion of the adolescent population and because interventions in the school
environment are efficient and effective (Nahas & Corbin, 1992). One program in schools
observed by Sibley and Potteiger (2008) was the Making the Grade with Diet and Exercise
(MGDE) program. During this program, there was a re-structuring of the school day to provide
teacher-led physical activity for a short amount of time, access for students to a free breakfast
program that provided nutritious foods, and a reversal of the order of lunch and recess (Sibley &
Potteiger, 2008). In their study, these authors found numerous benefits associated with the
MGDE program. They found small but significant decreases in both BMI and percent body fat
among students at the school, across all time points (over 2 years). There was also a significant
increase in self-reported physical activity from the beginning to the end of the school year
(Sibley & Potteiger, 2008). This is one of many of the programs implemented in schools in
order to improve the physical fitness and physical activity levels of students.
EXAMINATION OF OHIO’S PE ACADEMIC CONTENT 12
Another more popular way to get youth more physically fit and active is through physical
education (PE) class. PE class can provide students the opportunity to regularly engage in
physical activity in a structured setting. PE focuses on human and motor development acquired
through knowledge and practice of physical activities (Nahas & Corbin, 1992). Both health
professionals and policy makers suggest that engagement in physical activity through PE class
may provide protection against stress, symptoms of depression, and drug use among adolescents
(Nahas & Corbin, 1992). However, there have been a number of issues brought up with PE.
Concerns with Physical Education
The struggle with balancing financial and time resources is a concern for schools offering
PE. For example, Trost and Van Der Mars (2010) found that No Child Left Behind (NCLB) has
linked federal funding to school’s adequate yearly progress in reading and mathematics. As a
result, programs such as PE, as well as music and art, are viewed as secondary to the academic
mission of most schools. Teachers may feel that losing three to five hours a week while their
students are in PE class would make improving math and reading scores even more difficult,
especially in schools that are already performing poorly (Trost & Van Der Mars, 2010).
Other issues such as prejudices centering on the athletic body have been brought up in
research. Penney’s (2002) studies on the intersection of gender, race, and social class in physical
education has found there is the possibility of embarrassment by both males and females when
their bodies do not conform to the social norm for an athletic body. This may be exacerbated in
PE class where the clothing is typically more revealing (Penney, 2002). Heterosexuality, and
physicality are also brought up with PE classes (Penney, 2002). In her research, Penney reveals
homophobic tendencies toward gay PE teachers, sexual harassment of these teachers due to their
sexuality and institutional homophobia and heterosexualism within schools (Penney, 2002).
EXAMINATION OF OHIO’S PE ACADEMIC CONTENT 13
Despite these drawbacks, authors such as Dagkas and Stathi (2007) suggest a better and
wider provision of structured physical activity in school PE classes in order to improve physical
activity levels and develop skills and behaviors that will be used later in life.
Benefits of Physical Education
PE provides large numbers of students the ability to engage in activities that will benefit
them during their time in school and in their future (Nahas & Corbin, 1992). Several studies
examined PE classes and their impact on physical activity and fitness among all age levels.
Sallis and colleagues (1997) performed a study on the effects of a 2-year PE program on physical
activity and fitness and found that a health-related PE curriculum could provide students with
substantially more physical activity during physical education classes.
A study conducted by Janssen and LeBlanc (2010) found that structured physical activity
through PE programs is one of the best ways to get youth physically active and receive health
benefits associated with physical activity. In their study that looked at thousands of PE students,
these authors found that the physical activity during PE class contributed to improvements in
high blood cholesterol, high blood pressure, metabolic syndrome, obesity, low bone density, and
depression among students with these health conditions (Janssen & LeBlanc, 2010). To achieve
substantive health benefits, the physical activity had to be of at least a moderate intensity.
Vigorous intensity activities may provide even greater benefit (Janssen & LeBlanc, 2010).
Unstructured physical activity, such as recess, does not usually require the student to engage in
moderate to vigorous activity whereas a PE class would require the student to engage in vigorous
physical activity. The dose-response relationships observed in observational studies indicated
that the more physical activity, the greater the health benefit (Janssen & LeBlanc, 2010).
EXAMINATION OF OHIO’S PE ACADEMIC CONTENT 14
The academic mission of schools may be better served by providing more opportunities
for physical activity. Physically active, fit youth are more likely to have better grades than their
inactive counterparts (Trost & Van Der Mars, 2010). Therefore, incorporating at least a little
time for physical activity, such as a class period, may actually help improve test scores upon
which schools focus so intently for funding. PE also has the potential to promote knowledge and
positive attitudes relating to a healthy and active lifestyle (Sallis & Mckenzie, 1991).
Adolescence is an important stage of life that often shapes who people become in adulthood and
later years. This would indeed make PE an important and worthwhile intervention if it
influences a healthy lifestyle.
However, many states still do not require PE in schools where the likelihood of physical
activity engagement is great for almost all students. The state of Ohio encourages, but does not
require, PE for all students in grade bands K-8 and has more strict requirements for students in
grade band 9-12.
Ohio High School Physical Education Requirements
For grades 9-12, students are required to complete one-half unit of PE for graduation and
both elective and traditional PE courses require a minimum of 120 hours of course instruction to
earn one-half unit of credit (Henry, 2011). Students typically complete this requirement in the
9th
grade. Students who are participants in interscholastic athletics, marching band or
cheerleading for at least two full seasons, or an approved Junior Reserve Officer Training Corps
(JROTC) program for two years, and also complete one-half unit in another curricular area, are
eligible to be exempt from PE class (Henry, 2011).
EXAMINATION OF OHIO’S PE ACADEMIC CONTENT 15
Ohio High School Physical Education Participation
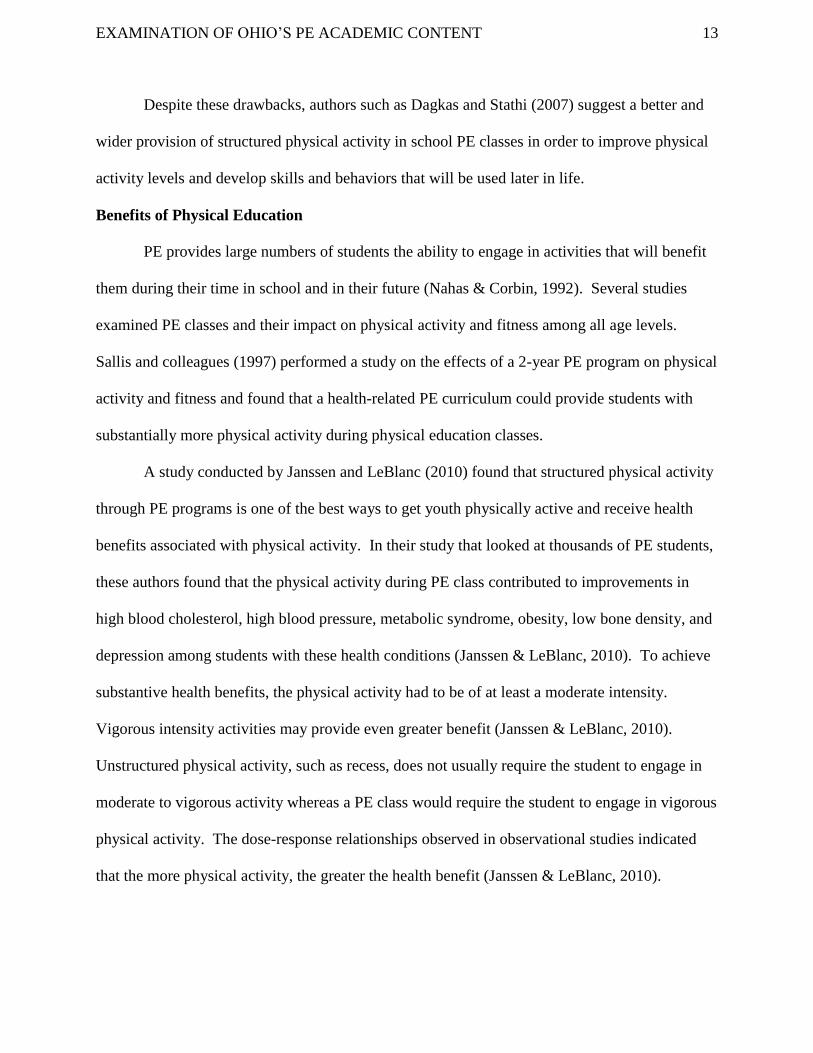
Generally, less than 30 percent of high school students attend PE classes daily (Figure 1)
(Centers for Disease Control and Prevention, 2007). Males had a higher percentage of attendees
than females. In terms of grade level, the number of participants was much greater in 9th
than
any other grade, with the number of enrollees decreasing from 9th
to 12th
grade.
Figure 1. Percentage of Ohio high school students who attend physical education classes daily
(2007).
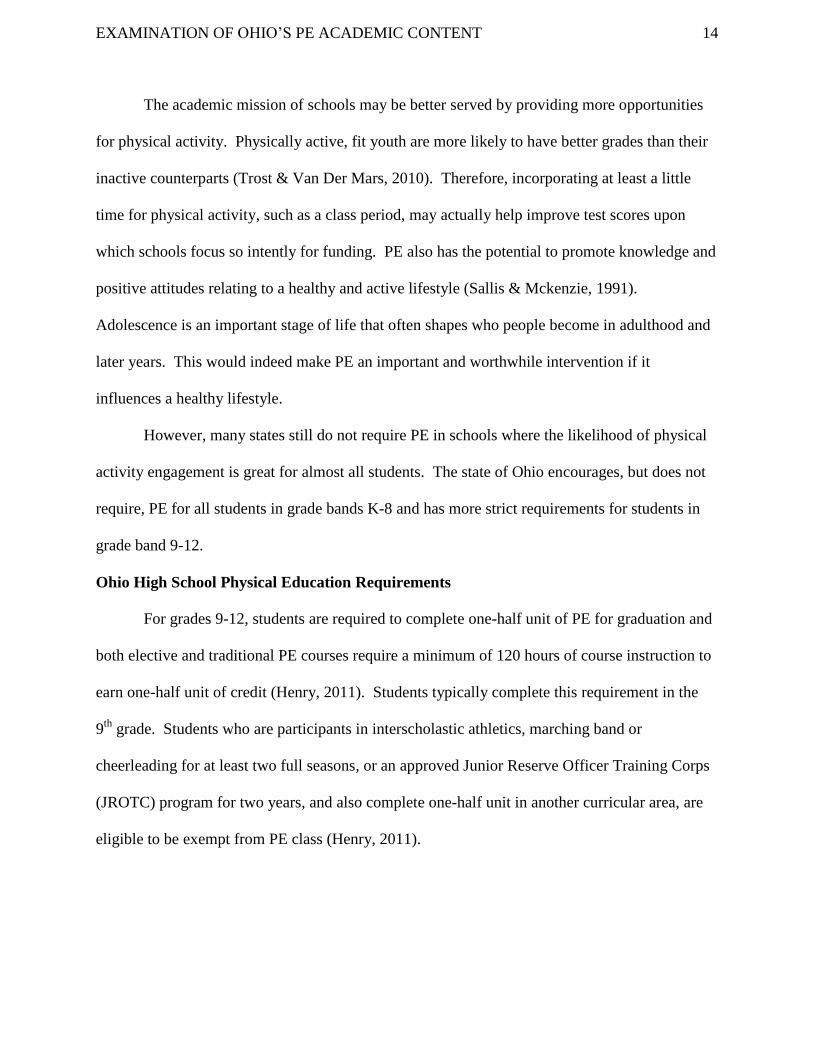
In 2007, less than half the Ohio high school students participated in at least 60 minutes of
physical activity for at least 5 days of the week (Figure 2) (Centers for Disease Control and
Prevention, 2007). This is considered the minimal amount of time to receive the benefits
associated with physical activity (Fitness.gov, 2001). Males were reported to be significantly (p
< 0.001) more physically active than females (Figure 2) (Centers for Disease Control and
Prevention, 2007).
0.00%
10.00%
20.00%
30.00%
40.00%
50.00%
60.00%
Total Male Female 9thGraders
10thGraders
11thGraders
12thGraders
White Black Hispanic
EXAMINATION OF OHIO’S PE ACADEMIC CONTENT 16
Figure 2. Percentage of Ohio high school students who were physically active for a total of at
least 60 minutes per day on five or more days in the past week (2007).
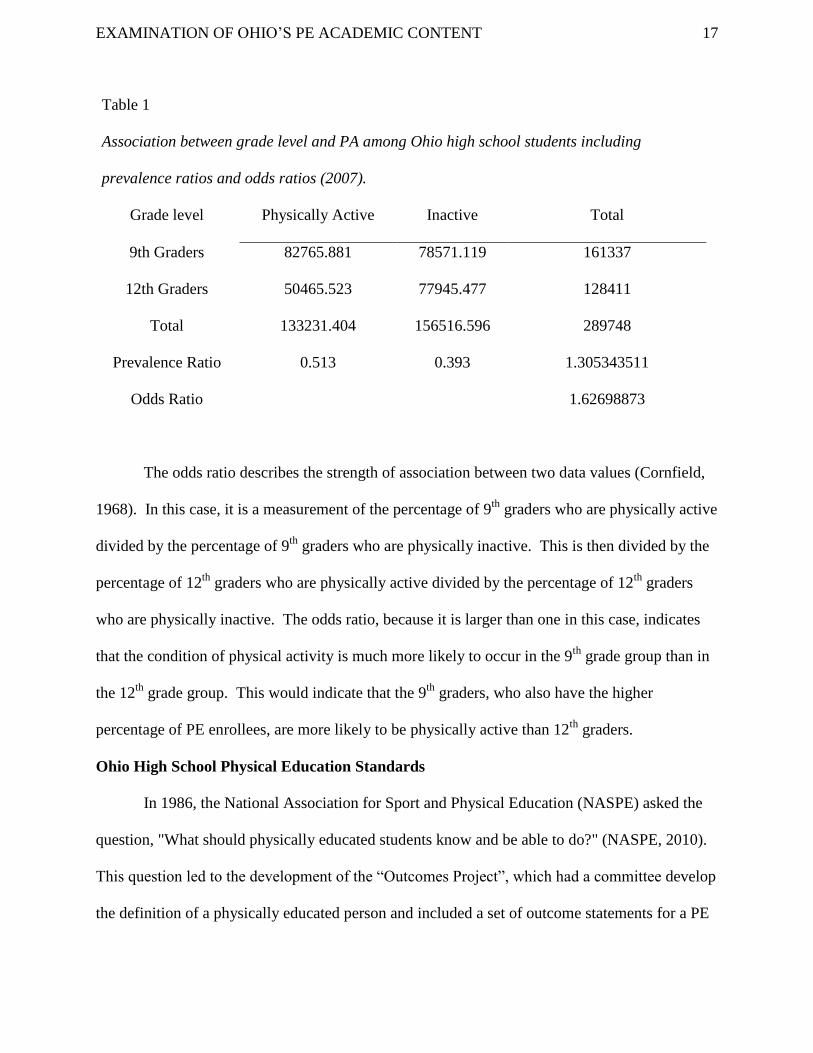
The total minutes of physical activity was 1.3 times higher for 9th
grade students than 12th
grade students and the odds of being physically active during PE class were 1.6 times greater for
9th
grade students (Table 1) (Centers for Disease Control and Prevention, 2007). The prevalence
ratio, or the proportion, is calculated by the total number of cases of a factor (physical activity)
divided by the number of individuals in the population (high school students). This prevalence
ratio shows that physical activity is more prevalent among the 9th
grade population.
0.00%
10.00%
20.00%
30.00%
40.00%
50.00%
60.00%
EXAMINATION OF OHIO’S PE ACADEMIC CONTENT 17
Table 1
Association between grade level and PA among Ohio high school students including
prevalence ratios and odds ratios (2007).
Grade level Physically Active Inactive Total
9th Graders 82765.881 78571.119 161337
12th Graders 50465.523 77945.477 128411
Total 133231.404 156516.596 289748
Prevalence Ratio 0.513 0.393 1.305343511
Odds Ratio 1.62698873
The odds ratio describes the strength of association between two data values (Cornfield,
1968). In this case, it is a measurement of the percentage of 9th
graders who are physically active
divided by the percentage of 9th
graders who are physically inactive. This is then divided by the
percentage of 12th
graders who are physically active divided by the percentage of 12th
graders
who are physically inactive. The odds ratio, because it is larger than one in this case, indicates
that the condition of physical activity is much more likely to occur in the 9th
grade group than in
the 12th
grade group. This would indicate that the 9th
graders, who also have the higher
percentage of PE enrollees, are more likely to be physically active than 12th
graders.
Ohio High School Physical Education Standards
In 1986, the National Association for Sport and Physical Education (NASPE) asked the
question, "What should physically educated students know and be able to do?" (NASPE, 2010).
This question led to the development of the “Outcomes Project”, which had a committee develop
the definition of a physically educated person and included a set of outcome statements for a PE
EXAMINATION OF OHIO’S PE ACADEMIC CONTENT 18
class. In 1992, the work of this committee resulted in the Outcomes of Quality Physical
Education Programs (NASPE, 2010). A task force was then formed to create standards with
assessment measures based on the outcomes document. In 1995, Moving into the Future:
National Standards for Physical Education was published (NASPE, 2010).
These standards are the structure around which to develop realistic and achievable
expectations for student performance at every grade level. They describe achievement, confirm
that knowledge and skills matter, and demonstrate that willing participation is not the same as
education (NASPE, 2010). They have been improved upon over the years in order to address a
number of measurement issues with the old standards and to provide a more appropriate way to
evaluate levels of health-related fitness in youth (Welk, De Saint-Maurice Maduro, Laurson, &
Brown, 2011). In order to do this, in the summer of 2002, NASPE appointed the K-12 National
Physical Education Standards Review Committee to review the standards and consider questions,
recommendations, and problems forwarded by teachers, teacher educators, and others (NASPE,
2010).
In December 2007, the Ohio State Board of Education adopted these NASPE national
physical education standards and the benchmarks and indicators were added in June 2009. These
standards were designed to provide Ohio PE teachers with content and performance standards
that provide both direction and accountability. The standards enable these teachers to deliver
instruction that addresses what students should know, understand, and be able to do in PE
(James, Griffin, & France, 2005). A complete list of the state standards for Ohio PE is as follows
(Henry, 2011):
Standard 1: Demonstrates competency in motor skills and movement patterns needed to
perform a variety of physical activities.
EXAMINATION OF OHIO’S PE ACADEMIC CONTENT 19
Standard 2: Demonstrates understanding of movement concepts, principles, strategies and
tactics as they apply to the learning and performance of physical activities.
Standard 3: Participates regularly in physical activity.
Standard 4: Achieves and maintains a health-enhancing level of physical fitness.
Standard 5: Exhibits responsible personal behavior and social behavior that respects self
and others in physical activity settings.
Standard 6: Values physical activity for health, enjoyment, challenge, self-expression
and/or social interaction.
A Brief History of the PE Standards in Ohio
Ohio was one of the most recent states to adopt the physical education standards (Henry,
2011). After the former governor of Ohio left office in 2007, the policy makers revised the Ohio
core for graduation requirements for high school students. One of the things that was placed in
the bill at the last minute was the substitution policy for physical education credit (students
involved in marching band, JROTC, interscholastic athletics substituting their participation in
those activities for PE credit). This decision upset members of the Ohio Department of
Education (ODE) who felt that PE was an important program and put attention on PE in Ohio
(Lorson, 2011).
This substitution policy started the advocacy for PE standards by administrators and
leadership in the ODE and around the state. Advocates pointed out the fact that Ohio did not
have PE standards whereas all of the other academic content areas in Ohio (besides health
education) had standards (Lorson, 2011). Other content areas such as math and science were
under the control of the ODE. However, because PE and health education were actually under
the control of the Ohio legislature, the ODE was unable to change the PE policy until the large
EXAMINATION OF OHIO’S PE ACADEMIC CONTENT 20
push by the ODE started changing the minds of those in the legislature later in 2007. Because of
this increased pressure, the legislature finally granted the ODE approval to implement standards
in PE (Henry, 2011).
A critical piece of the adopted legislation was the development of standardized
assessments for each standard. The first step taken in the development of assessments was to
convene an advisory committee. The charge of the committee was to address critical and unique
issues related to physical education, and develop consistency of language and a working
framework for writing team members to use during the construction process. The members of
the committee consisted of curriculum directors, university faculty, public educators and a
physician (Henry, 2011). For each standard, there were to be two benchmarks and a set of
indicators for each benchmark. No other state before had designed benchmarks and indicators
for each standard (Lorson, 2011). The benchmarks and indicators for assessments defined what
a student should be able to achieve in PE class based on grade level and grade band whereas the
NASPE standards just defined the overall goals and suggested outcomes for each standard. For
example, for Standard 1, Benchmark A there was an assessment to test whether the students at all
grade levels could combine locomotor and non-locomotor skills into movement patterns (Henry,
2011). For a 3rd
grade student, the indicator for this benchmark was a test to see whether the
student could balance on a variety of objects that are either static or dynamic (Henry, 2011).
The committee began writing the benchmarks and indicators in 2008 and they were
implemented in 2009. Standardized tests were then implemented after the passage of Senate Bill
210 (the Healthy Choices for Healthy Children Act) (Lorson, 2011). This bill required the ODE
to develop evaluation instruments to assess progress towards the PE benchmarks. This bill was
enacted in June of 2010. These assessments are not mandatory for PE teachers to give to
EXAMINATION OF OHIO’S PE ACADEMIC CONTENT 21
students in Ohio and they could be conducted at any time throughout the year. However,
summarized data is to be required of all schools for each of the benchmarks by June 30, 2013
(Henry, 2011). Therefore, all schools K-12 will be required to perform assessments starting in
the Fall of the 2012 academic year, regardless of whether or not a PE program is in place in that
school. This is another unique endeavor by the ODE (Lorson, 2011).
Ohio Physical Education Standard 4, Benchmark A
Standardized tests such as fitness tests are some of the new assessments that were
implemented in Ohio after Senate Bill 210 was introduced. These fitness tests are used in
Standard 4. Standard 4 is an accurate indicator of student’s health-benefiting physical fitness
levels. If a student is achieving Standard 4, then they are achieving or maintaining a health-
enhancing level of physical fitness (NASPE, 2010). Benchmark A for Standard 4 calls for the
student to meet or exceed criterion-referenced health-related physical fitness standards (Henry,
2011). For all grades, this encompasses performing fitness activities using appropriate principles
and practices as well as meeting criterion-referenced standards for the components of health-
related fitness (Henry, 2011). These health-related fitness components include cardiovascular
endurance, body composition, muscular strength, muscular endurance, and flexibility.
FITNESSGRAM is one of the recommended youth testing programs to assess students’
health-related fitness components. The Cooper Institute created the FITNESSGRAM in 1987.
The Cooper Institute was founded in 1970 as an independent research institute that wanted to
bridge the gap between fitness faddism and scientific legitimacy in order to establish the direct
relationship that exists between physical activity and good health (Meyer, 2011). The
FITNESSGRAM program provides teachers with a battery of validated field-based fitness and
activity assessments to facilitate effective physical education programming (Welk et al., 2011).
EXAMINATION OF OHIO’S PE ACADEMIC CONTENT 22
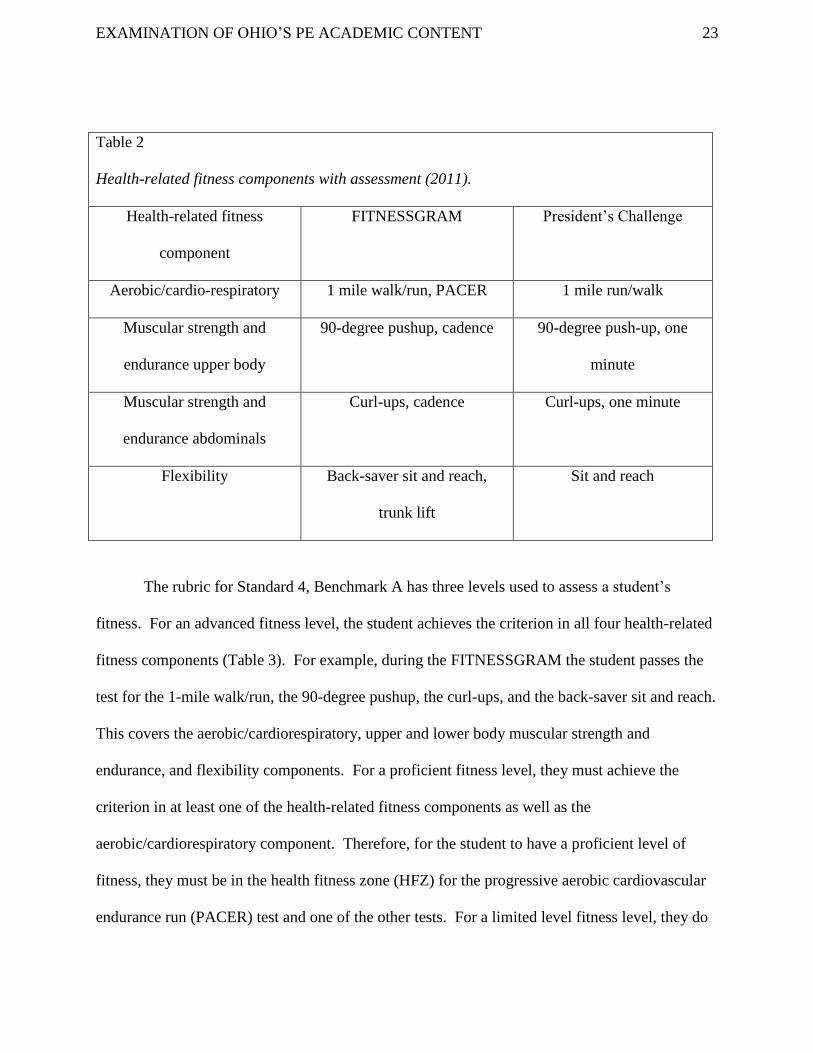
The test includes a 1-mile run/walk for the aerobic/cardio-respiratory health-related fitness
component, a 90-degree push-up to a specific cadence for muscular strength and endurance of
the upper body, curl-ups to a cadence for muscular strength and endurance of the abdominals,
and both a back-saver sit and reach and trunk lift for flexibility (Table 2) (NASPE, 2010).
Criterion-referenced standards have been established for this program based on measures thought
to produce a health benefit or reduce the risk of a health problem (Corbin & Pangranzi, 1992). In
1992, the concept of a fitness zone replaced the notion of a single cut-off score. Results have
been evaluated as either the needs improvement zone (NIZ), which was failing, or the health
fitness zone (HFZ), which was considered passing the test.
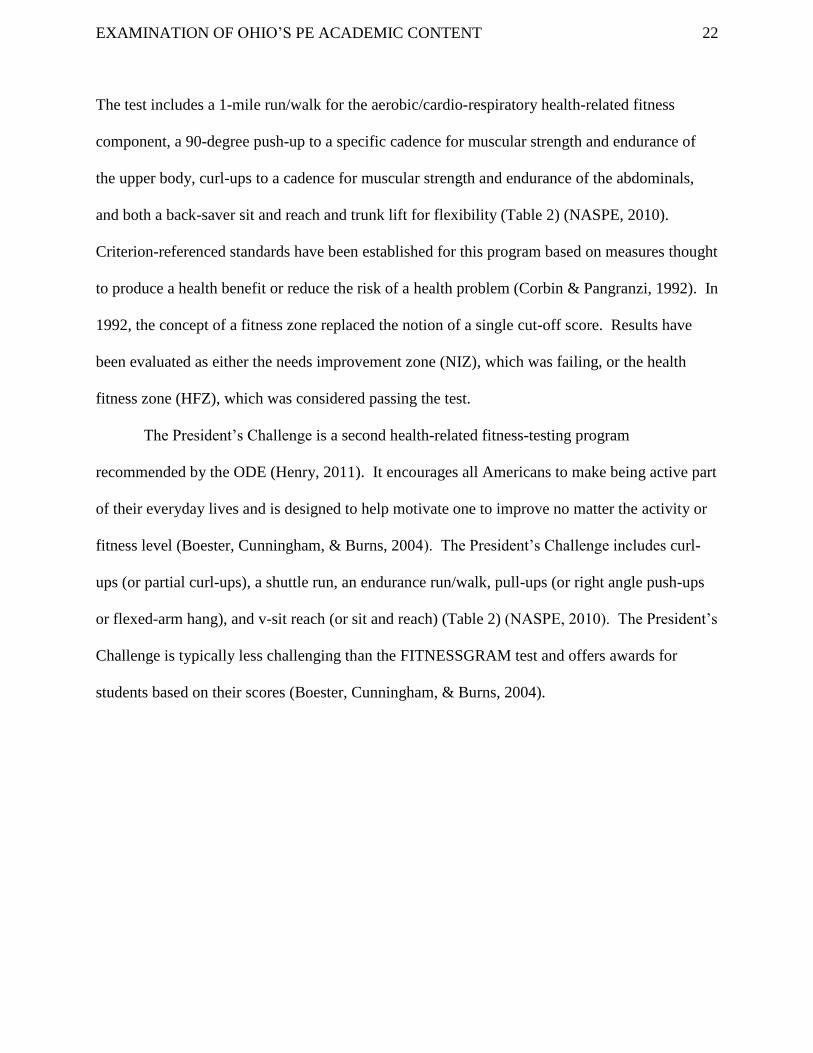
The President’s Challenge is a second health-related fitness-testing program
recommended by the ODE (Henry, 2011). It encourages all Americans to make being active part
of their everyday lives and is designed to help motivate one to improve no matter the activity or
fitness level (Boester, Cunningham, & Burns, 2004). The President’s Challenge includes curl-
ups (or partial curl-ups), a shuttle run, an endurance run/walk, pull-ups (or right angle push-ups
or flexed-arm hang), and v-sit reach (or sit and reach) (Table 2) (NASPE, 2010). The President’s
Challenge is typically less challenging than the FITNESSGRAM test and offers awards for
students based on their scores (Boester, Cunningham, & Burns, 2004).
EXAMINATION OF OHIO’S PE ACADEMIC CONTENT 23
Table 2
Health-related fitness components with assessment (2011).
Health-related fitness
component
FITNESSGRAM President’s Challenge
Aerobic/cardio-respiratory 1 mile walk/run, PACER 1 mile run/walk
Muscular strength and
endurance upper body
90-degree pushup, cadence 90-degree push-up, one
minute
Muscular strength and
endurance abdominals
Curl-ups, cadence Curl-ups, one minute
Flexibility Back-saver sit and reach,
trunk lift
Sit and reach
The rubric for Standard 4, Benchmark A has three levels used to assess a student’s
fitness. For an advanced fitness level, the student achieves the criterion in all four health-related
fitness components (Table 3). For example, during the FITNESSGRAM the student passes the
test for the 1-mile walk/run, the 90-degree pushup, the curl-ups, and the back-saver sit and reach.
This covers the aerobic/cardiorespiratory, upper and lower body muscular strength and
endurance, and flexibility components. For a proficient fitness level, they must achieve the
criterion in at least one of the health-related fitness components as well as the
aerobic/cardiorespiratory component. Therefore, for the student to have a proficient level of
fitness, they must be in the health fitness zone (HFZ) for the progressive aerobic cardiovascular
endurance run (PACER) test and one of the other tests. For a limited level fitness level, they do
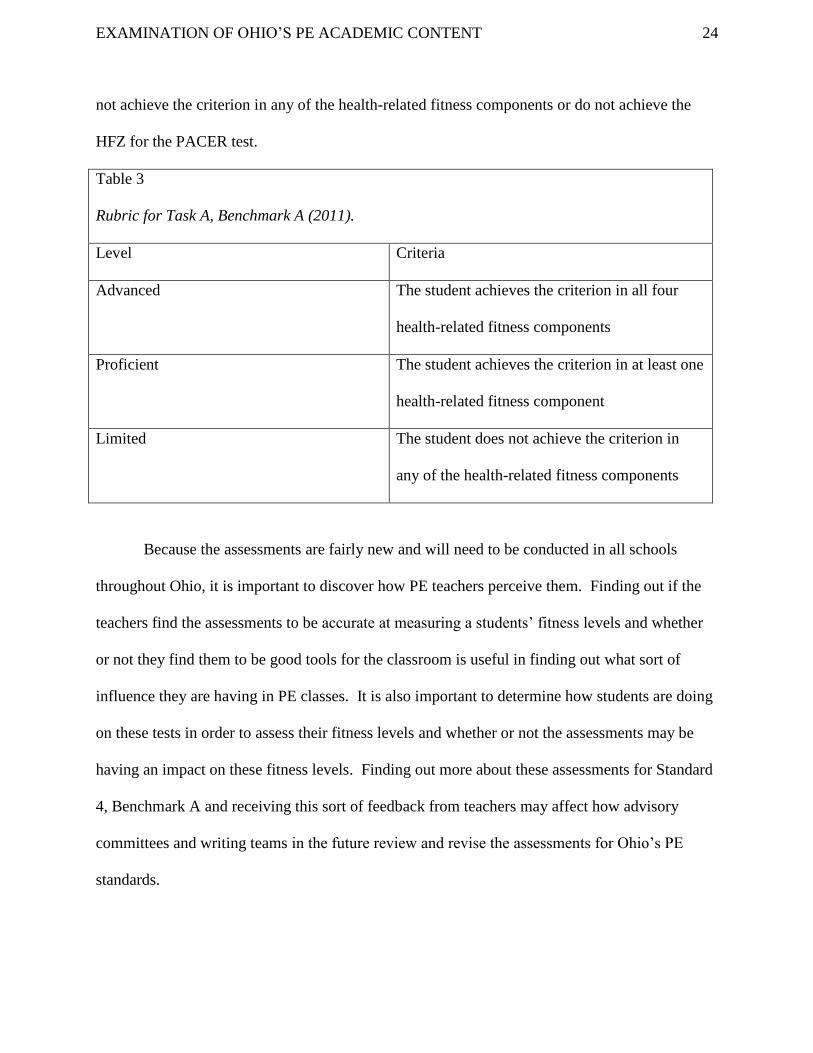
EXAMINATION OF OHIO’S PE ACADEMIC CONTENT 24
not achieve the criterion in any of the health-related fitness components or do not achieve the
HFZ for the PACER test.
Table 3
Rubric for Task A, Benchmark A (2011).
Level Criteria
Advanced The student achieves the criterion in all four
health-related fitness components
Proficient The student achieves the criterion in at least one
health-related fitness component
Limited The student does not achieve the criterion in
any of the health-related fitness components
Because the assessments are fairly new and will need to be conducted in all schools
throughout Ohio, it is important to discover how PE teachers perceive them. Finding out if the
teachers find the assessments to be accurate at measuring a students’ fitness levels and whether
or not they find them to be good tools for the classroom is useful in finding out what sort of
influence they are having in PE classes. It is also important to determine how students are doing
on these tests in order to assess their fitness levels and whether or not the assessments may be
having an impact on these fitness levels. Finding out more about these assessments for Standard
4, Benchmark A and receiving this sort of feedback from teachers may affect how advisory
committees and writing teams in the future review and revise the assessments for Ohio’s PE
standards.
EXAMINATION OF OHIO’S PE ACADEMIC CONTENT 25
Methods
Questionnaire
The purpose of this questionnaire was to discover select high school physical education
(PE) teachers’ perceptions of the assessments for Ohio's Academic Content Standard 4
Benchmark A.
Setting
This pilot study consisted of physical education teachers throughout southwest Ohio.
The university’s Institutional Review Board approved this study. The PE teachers grades K
through 12 were recruited from eight counties in Southwest Ohio. The forty-seven school
districts were located in urban, suburban, and rural counties. In order to gather a sample, emails
were collected from school district websites. Two hundred eighty-five PE teachers were
contacted. Of the 285 teachers that were emailed, 41 responded to the questionnaire for a
response rate of roughly 14%.
Measurement/Data Collection
An attitudinal questionnaire containing seven items was developed on SurveyMonkey
specifically for this study to assess teachers’ perceptions of assessments for Standard 4,
Benchmark A. Each item was scored on a 5-point Likert scale ranging from Strongly Agree to
Strongly Disagree. Teachers were contacted via email at the beginning of October 2011 and
asked to participate in the online questionnaire. They were assured that their participation in the
questionnaire was voluntary and that responses were confidential. Responses were analyzed at
the beginning of November 2011. The questionnaire had not been tested prior to this study.
EXAMINATION OF OHIO’S PE ACADEMIC CONTENT 26
Data Analysis
Questionnaire data was analyzed quantitatively using descriptive statistics with the
computer program Microsoft Excel. Frequencies and percentages were calculated for each
question based on the number of teachers that responded for each category within the question.
Crosstabulation was conducted with the computer program SPSS in order to assess the responses
to the items, based on what assessment they were using to measure Standard 4, Benchmark A.
Chi-square tests were conducted via SPSS as well to discover whether or not results were
statistically significant. Statistical significance was determined by using =0.05.
FITNESSGRAM
The purpose of examining FITNESSGRAM data was to discover the physical fitness
levels of select high school PE students.
Sample
FITNESSGRAM data was analyzed from one high school, representing 3 PE classes and
90 students. There were a total of 57 males and 33 females that were enrolled in these PE
classes. The data used was preexisting data offered by the PE teacher of these classes for the
purposes of this part of the study.
Data Collection
The FITNESSGRAM test items were administered to the participants during the 2010-
2011 school year. They were carried out in the following order: (a) Progressive Aerobic
Cardiovascular Endurance Run (PACER) test for aerobic ability; (b) push-up test for upper-body
muscular strength/endurance ability; (c) curl-up test for lower body muscular strength/endurance
ability; and (d) back-saver sit-and-reach test for flexibility. One PE teacher at this school
administered all FITNESSGRAM testing.
EXAMINATION OF OHIO’S PE ACADEMIC CONTENT 27
Data Analysis
The dependent variable for this part of the study was the achievement of age- and gender-
based scores for each of the FITNESSGRAM test based on whether the student was in the Needs
Improvement Zone (NIZ) or the Healthy Fitness Zone (HFZ). The other dependent variables in
this study were the performance measures of the FITNESSGRAM test. Specifically, these were
the students’: (a) scores for the PACER test, which calls for the student to run as long as possible
back and forth across a 20-meter space at a specified pace that gets faster each minute; (b) scores
for the push-up test, which calls for the student to perform as many pushups as possible at
approximately 20 90° push-ups per minute or 1 90° push-up every 3 seconds; (c) scores for the
curl-up test, which calls for the student to complete as many curl-ups as possible up to a
maximum of 75 at a specified pace of 1 curl-up every 3 seconds; and (d) scores for the back-
saver sit-and-reach test, which calls for the student to be able to reach the specified distance on
the right and left sides of the body.
FITNESSGRAM data was analyzed quantitatively with Microsoft Excel. If a student
was in the HFZ for all four portions of the FITNESSGRAM test, they were considered to have
an Advanced fitness level according to the rubric for Task A, Benchmark A. If a student was in
the HFZ for at least one other portion of the test in addition to the PACER test, then they were
considered to have a Proficient level of fitness. If a student did not pass any portion of the test or
did not pass the PACER test, then they were considered to have a Limited level of fitness.
Frequencies and percentages of the number of Limited, Proficient, and Advanced students were
calculated and separated by gender.
EXAMINATION OF OHIO’S PE ACADEMIC CONTENT 28
Key Informant Interview
The purpose of the key informant interview was to find out more about history of the
physical education standards and assessments in Ohio and what impact they are having in PE
classrooms around the state. It was also to discover what the future holds for these assessments
in terms of how they may be modified.
The interview was conducted with Dr. Kevin Lorson. He obtained his PhD in Physical
Education Teacher Education from the Ohio State University and is currently an assistant
professor in the department of Health, Physical Education, and Recreation at Wright State
University. He was a part of the Standards Alignment Project, which was designed to align
NASPE Standards for Beginning Teachers with the Ohio Standards for the Teaching Profession.
Appointed by the Ohio Department of Education, he was a member of the writing team that
completed major drafts of the academic content standards, including the benchmarks that served
as checkpoints at grade-bands and grade-level indicators of progress for kindergarten through
grade 12.
The informal interview was conducted at Wright State University during the Fall
academic quarter 2011 using a semi-structured interview guide developed for this research
project (30 minutes). The interview explored information regarding the PE standards and
assessments as well as his perceptions of their impact in the state of Ohio. The interview was
tape-recorded and consisted of flexible open-ended questions and was conversational. The
interview usually focused on assessment.
EXAMINATION OF OHIO’S PE ACADEMIC CONTENT 29
Results
Teachers’ Perceptions of Standard 4, Benchmark A Assessments
Of the 285 PE teachers who were contacted for this research project, a total of 41
completed all items on the questionnaire. This was a response rate of roughly 14%. Teachers
were from urban, suburban, and rural schools. They had been teaching for at least one year.
There were 19 male teachers and 22 female teachers.
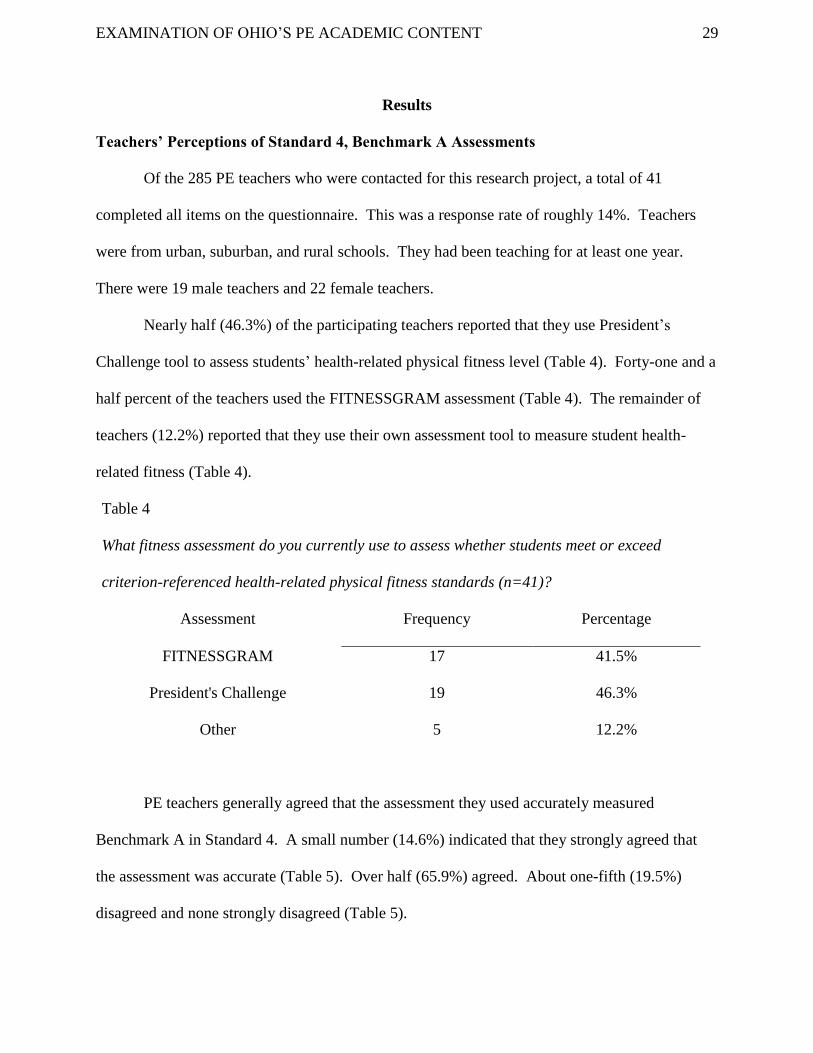
Nearly half (46.3%) of the participating teachers reported that they use President’s
Challenge tool to assess students’ health-related physical fitness level (Table 4). Forty-one and a
half percent of the teachers used the FITNESSGRAM assessment (Table 4). The remainder of
teachers (12.2%) reported that they use their own assessment tool to measure student health-
related fitness (Table 4).
Table 4
What fitness assessment do you currently use to assess whether students meet or exceed
criterion-referenced health-related physical fitness standards (n=41)?
Assessment Frequency Percentage
FITNESSGRAM 17 41.5%
President's Challenge 19 46.3%
Other 5 12.2%
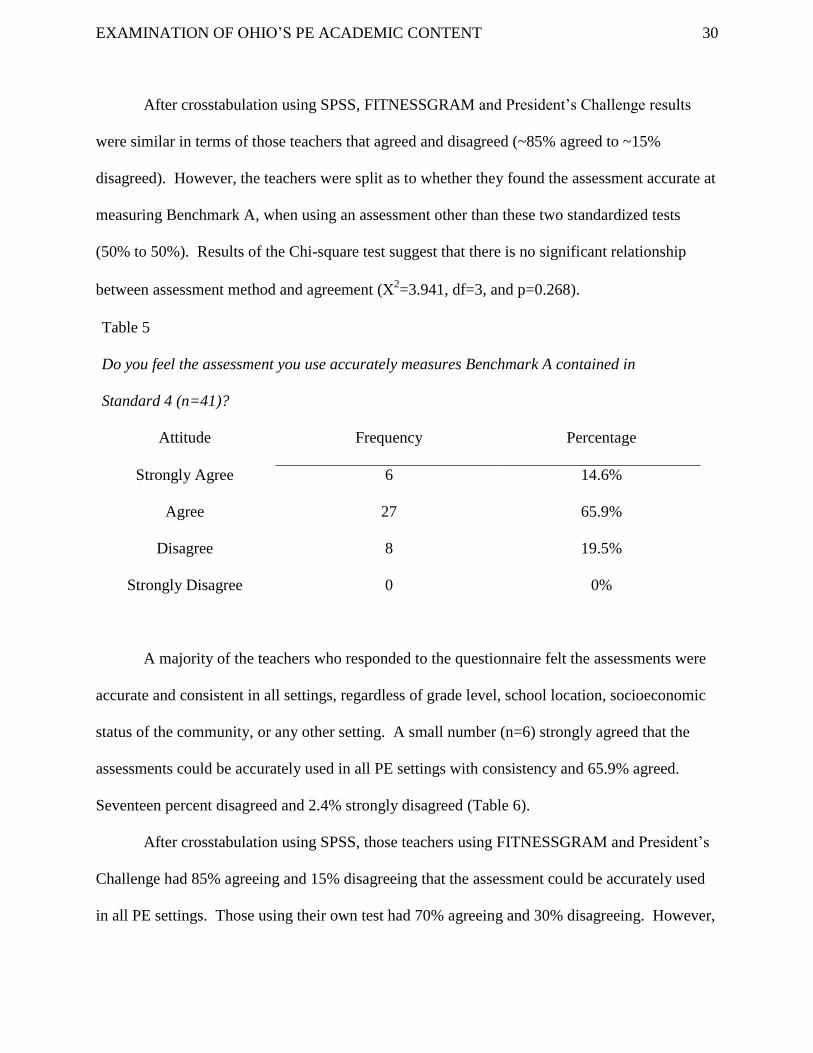
PE teachers generally agreed that the assessment they used accurately measured
Benchmark A in Standard 4. A small number (14.6%) indicated that they strongly agreed that
the assessment was accurate (Table 5). Over half (65.9%) agreed. About one-fifth (19.5%)
disagreed and none strongly disagreed (Table 5).
EXAMINATION OF OHIO’S PE ACADEMIC CONTENT 30
After crosstabulation using SPSS, FITNESSGRAM and President’s Challenge results
were similar in terms of those teachers that agreed and disagreed (~85% agreed to ~15%
disagreed). However, the teachers were split as to whether they found the assessment accurate at
measuring Benchmark A, when using an assessment other than these two standardized tests
(50% to 50%). Results of the Chi-square test suggest that there is no significant relationship
between assessment method and agreement (2=3.941, df=3, and p=0.268).
Table 5
Do you feel the assessment you use accurately measures Benchmark A contained in
Standard 4 (n=41)?
Attitude Frequency Percentage
Strongly Agree 6 14.6%
Agree 27 65.9%
Disagree 8 19.5%
Strongly Disagree 0 0%
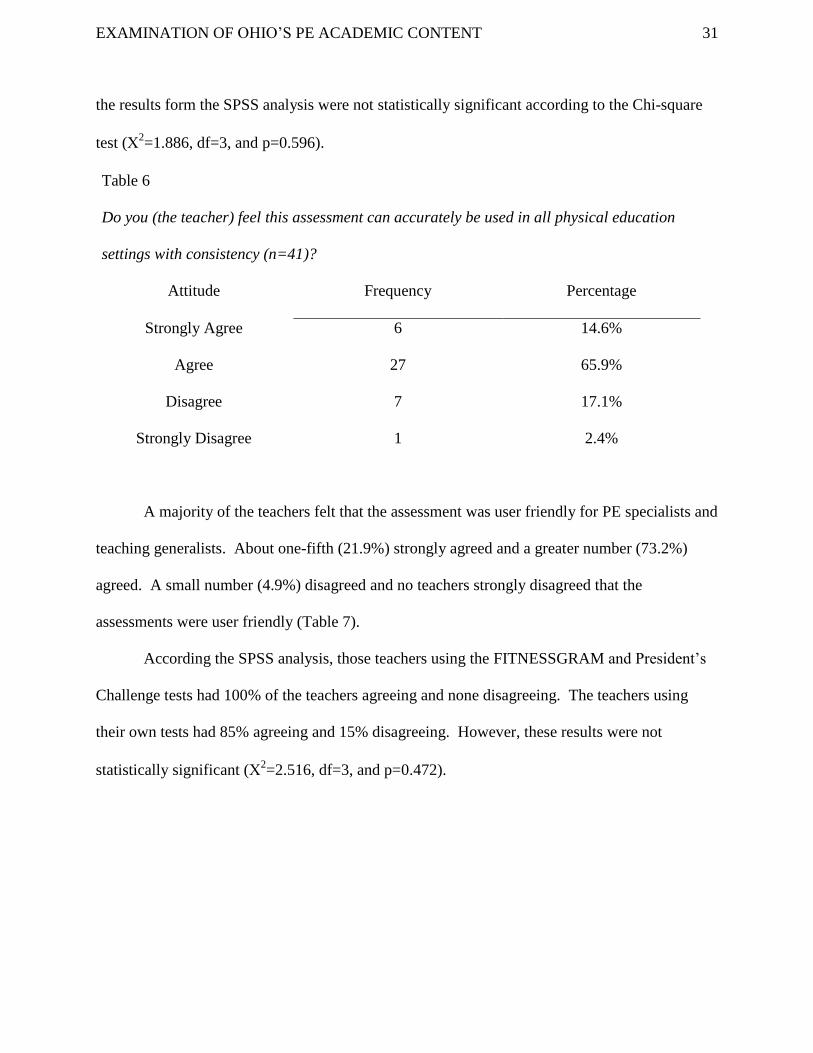
A majority of the teachers who responded to the questionnaire felt the assessments were
accurate and consistent in all settings, regardless of grade level, school location, socioeconomic
status of the community, or any other setting. A small number (n=6) strongly agreed that the
assessments could be accurately used in all PE settings with consistency and 65.9% agreed.
Seventeen percent disagreed and 2.4% strongly disagreed (Table 6).
After crosstabulation using SPSS, those teachers using FITNESSGRAM and President’s
Challenge had 85% agreeing and 15% disagreeing that the assessment could be accurately used
in all PE settings. Those using their own test had 70% agreeing and 30% disagreeing. However,
EXAMINATION OF OHIO’S PE ACADEMIC CONTENT 31
the results form the SPSS analysis were not statistically significant according to the Chi-square
test (2=1.886, df=3, and p=0.596).
Table 6
Do you (the teacher) feel this assessment can accurately be used in all physical education
settings with consistency (n=41)?
Attitude Frequency Percentage
Strongly Agree 6 14.6%
Agree 27 65.9%
Disagree 7 17.1%
Strongly Disagree 1 2.4%
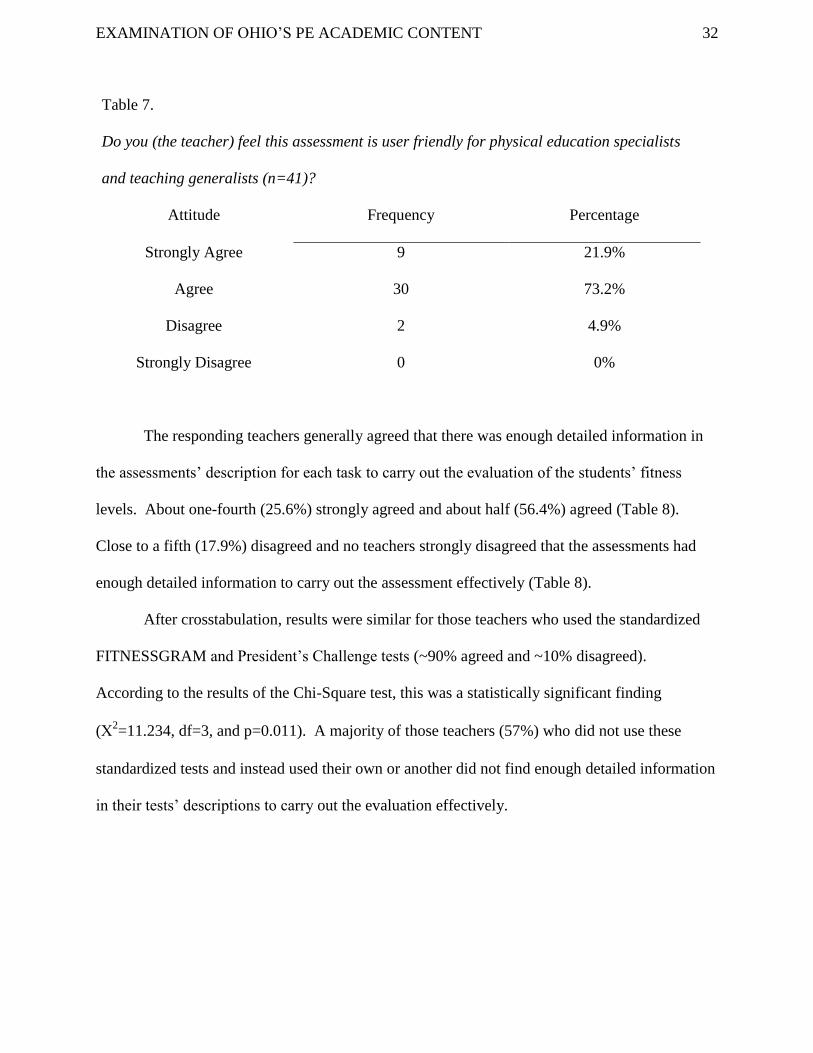
A majority of the teachers felt that the assessment was user friendly for PE specialists and
teaching generalists. About one-fifth (21.9%) strongly agreed and a greater number (73.2%)
agreed. A small number (4.9%) disagreed and no teachers strongly disagreed that the
assessments were user friendly (Table 7).
According the SPSS analysis, those teachers using the FITNESSGRAM and President’s
Challenge tests had 100% of the teachers agreeing and none disagreeing. The teachers using
their own tests had 85% agreeing and 15% disagreeing. However, these results were not
statistically significant (2=2.516, df=3, and p=0.472).
EXAMINATION OF OHIO’S PE ACADEMIC CONTENT 32
Table 7.
Do you (the teacher) feel this assessment is user friendly for physical education specialists
and teaching generalists (n=41)?
Attitude Frequency Percentage
Strongly Agree 9 21.9%
Agree 30 73.2%
Disagree 2 4.9%
Strongly Disagree 0 0%
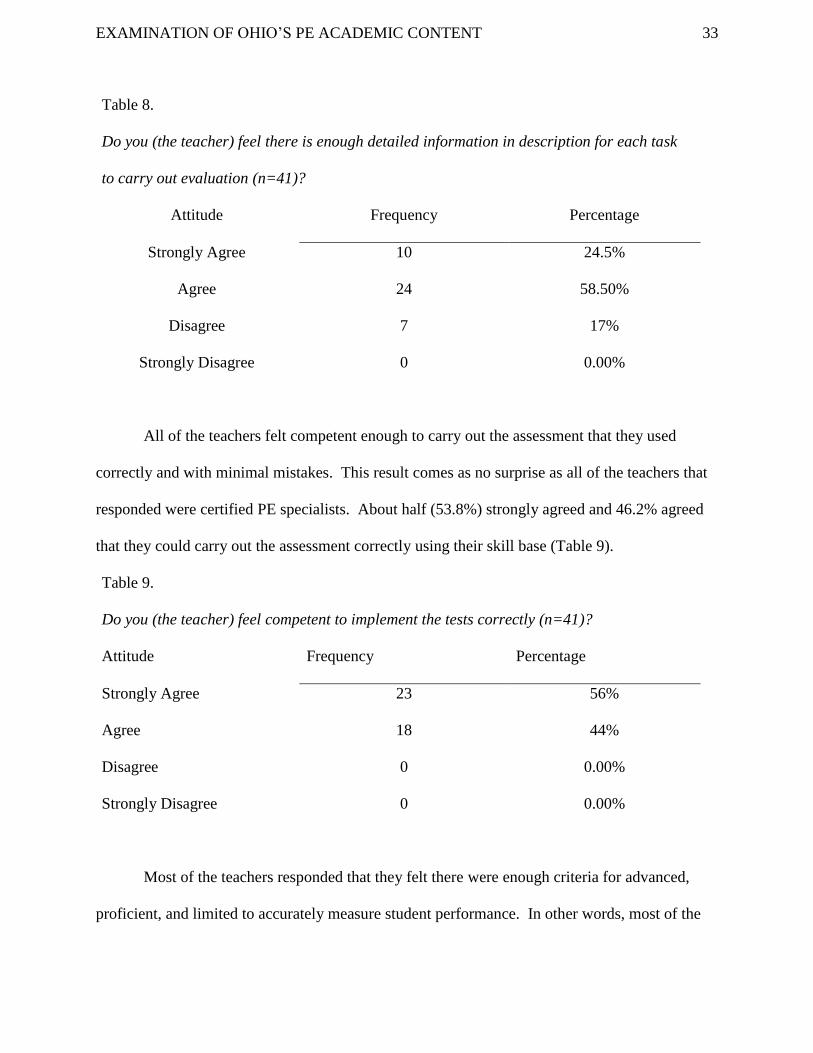
The responding teachers generally agreed that there was enough detailed information in
the assessments’ description for each task to carry out the evaluation of the students’ fitness
levels. About one-fourth (25.6%) strongly agreed and about half (56.4%) agreed (Table 8).
Close to a fifth (17.9%) disagreed and no teachers strongly disagreed that the assessments had
enough detailed information to carry out the assessment effectively (Table 8).
After crosstabulation, results were similar for those teachers who used the standardized
FITNESSGRAM and President’s Challenge tests (~90% agreed and ~10% disagreed).
According to the results of the Chi-Square test, this was a statistically significant finding
(2=11.234, df=3, and p=0.011). A majority of those teachers (57%) who did not use these
standardized tests and instead used their own or another did not find enough detailed information
in their tests’ descriptions to carry out the evaluation effectively.
EXAMINATION OF OHIO’S PE ACADEMIC CONTENT 33
Table 8.
Do you (the teacher) feel there is enough detailed information in description for each task
to carry out evaluation (n=41)?
Attitude Frequency Percentage
Strongly Agree 10 24.5%
Agree 24 58.50%
Disagree 7 17%
Strongly Disagree 0 0.00%
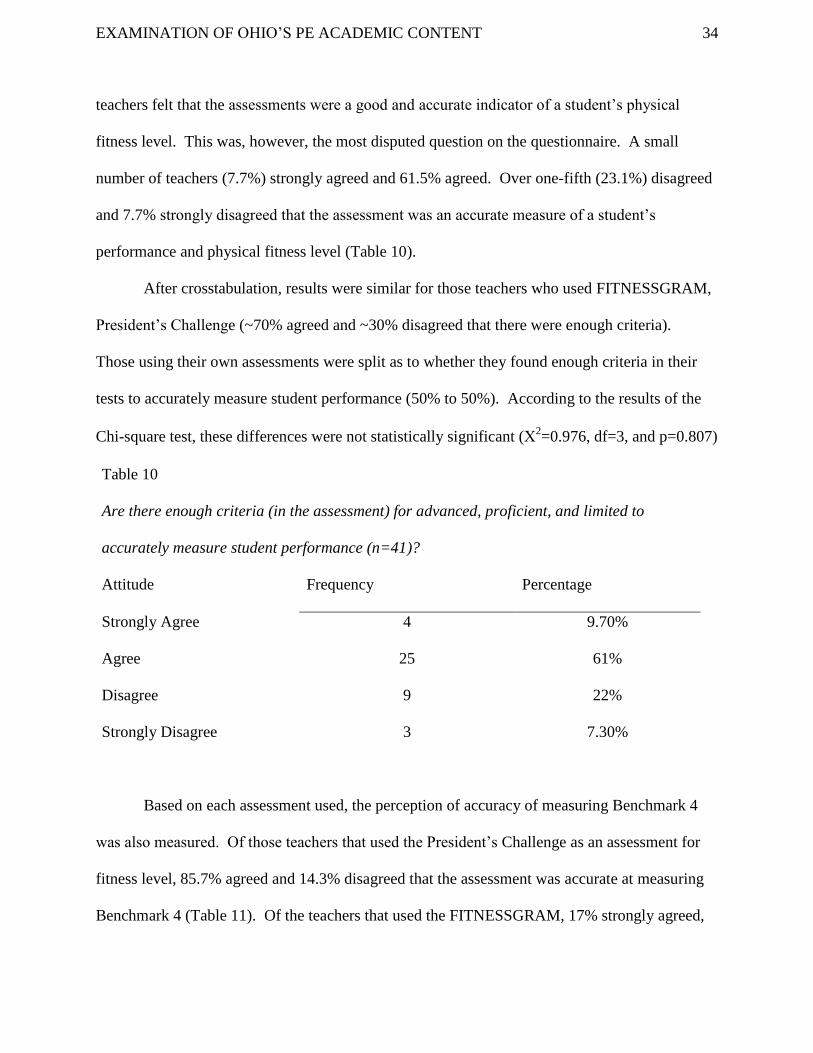
All of the teachers felt competent enough to carry out the assessment that they used
correctly and with minimal mistakes. This result comes as no surprise as all of the teachers that
responded were certified PE specialists. About half (53.8%) strongly agreed and 46.2% agreed
that they could carry out the assessment correctly using their skill base (Table 9).
Table 9.
Do you (the teacher) feel competent to implement the tests correctly (n=41)?
Attitude Frequency Percentage
Strongly Agree 23 56%
Agree 18 44%
Disagree 0 0.00%
Strongly Disagree 0 0.00%
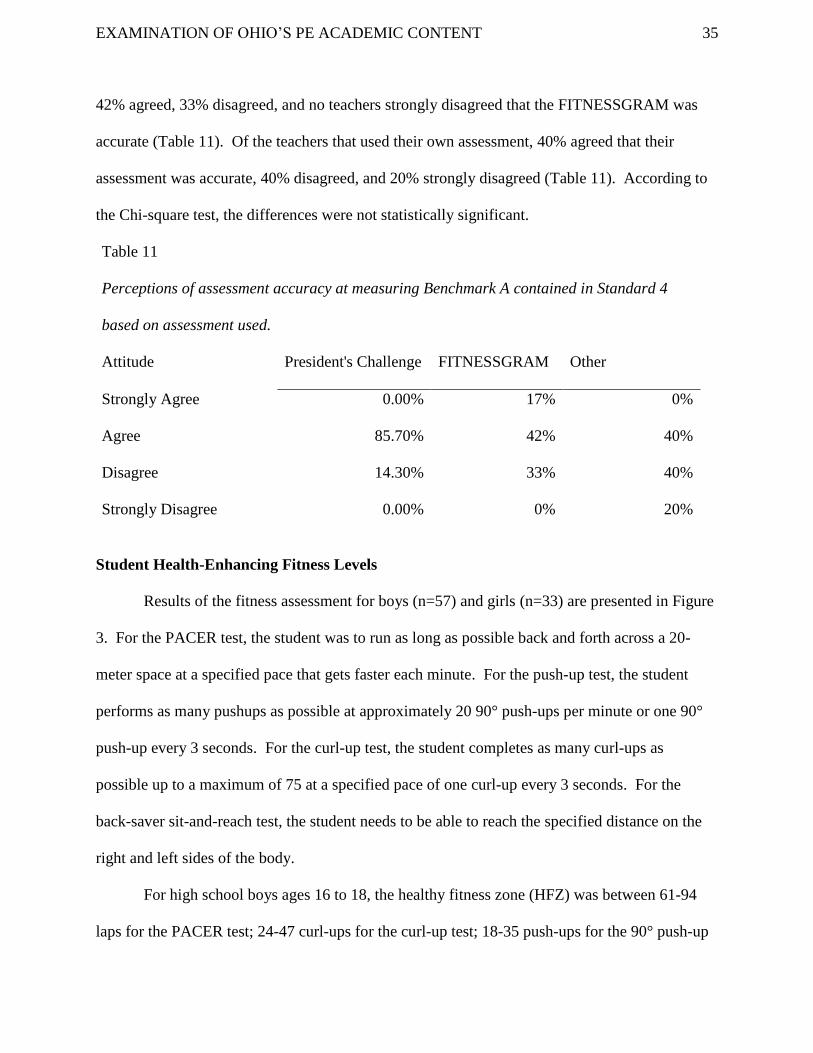
Most of the teachers responded that they felt there were enough criteria for advanced,
proficient, and limited to accurately measure student performance. In other words, most of the
EXAMINATION OF OHIO’S PE ACADEMIC CONTENT 34
teachers felt that the assessments were a good and accurate indicator of a student’s physical
fitness level. This was, however, the most disputed question on the questionnaire. A small
number of teachers (7.7%) strongly agreed and 61.5% agreed. Over one-fifth (23.1%) disagreed
and 7.7% strongly disagreed that the assessment was an accurate measure of a student’s
performance and physical fitness level (Table 10).
After crosstabulation, results were similar for those teachers who used FITNESSGRAM,
President’s Challenge (~70% agreed and ~30% disagreed that there were enough criteria).
Those using their own assessments were split as to whether they found enough criteria in their
tests to accurately measure student performance (50% to 50%). According to the results of the
Chi-square test, these differences were not statistically significant (2=0.976, df=3, and p=0.807)
Table 10
Are there enough criteria (in the assessment) for advanced, proficient, and limited to
accurately measure student performance (n=41)?
Attitude Frequency Percentage
Strongly Agree 4 9.70%
Agree 25 61%
Disagree 9 22%
Strongly Disagree 3 7.30%
Based on each assessment used, the perception of accuracy of measuring Benchmark 4
was also measured. Of those teachers that used the President’s Challenge as an assessment for
fitness level, 85.7% agreed and 14.3% disagreed that the assessment was accurate at measuring
Benchmark 4 (Table 11). Of the teachers that used the FITNESSGRAM, 17% strongly agreed,
EXAMINATION OF OHIO’S PE ACADEMIC CONTENT 35
42% agreed, 33% disagreed, and no teachers strongly disagreed that the FITNESSGRAM was
accurate (Table 11). Of the teachers that used their own assessment, 40% agreed that their
assessment was accurate, 40% disagreed, and 20% strongly disagreed (Table 11). According to
the Chi-square test, the differences were not statistically significant.
Table 11
Perceptions of assessment accuracy at measuring Benchmark A contained in Standard 4
based on assessment used.
Attitude President's Challenge FITNESSGRAM Other
Strongly Agree 0.00% 17% 0%
Agree 85.70% 42% 40%
Disagree 14.30% 33% 40%
Strongly Disagree 0.00% 0% 20%
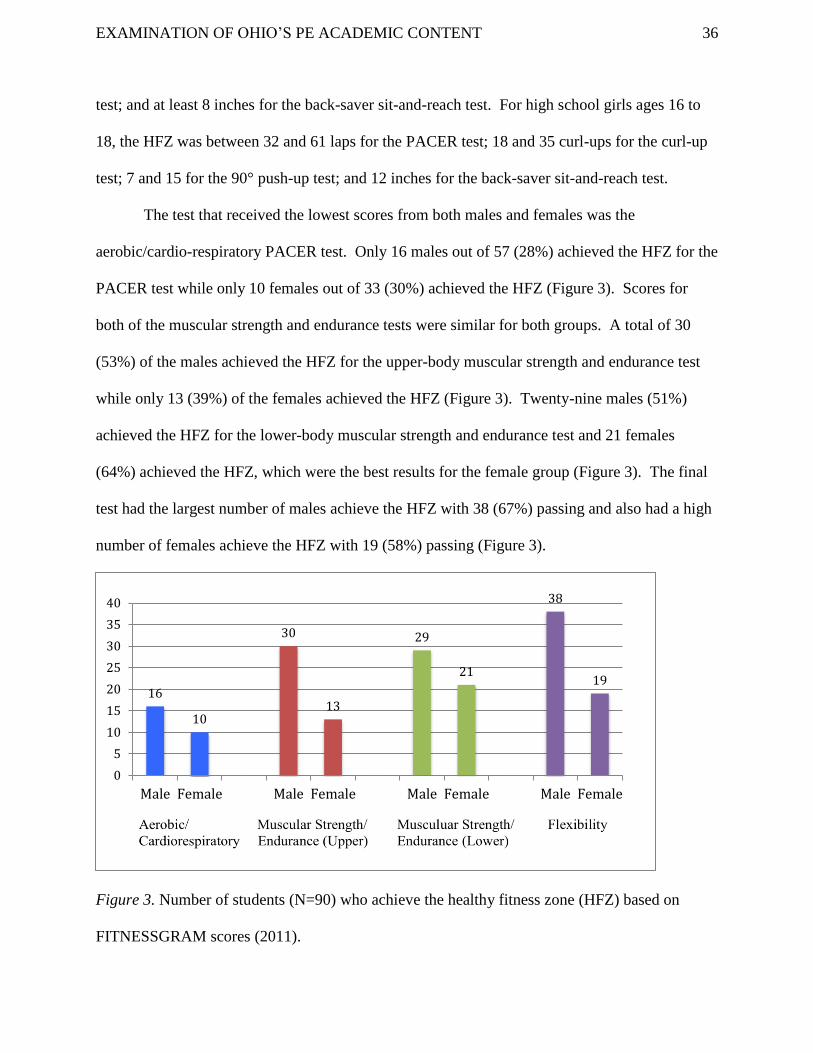
Student Health-Enhancing Fitness Levels
Results of the fitness assessment for boys (n=57) and girls (n=33) are presented in Figure
3. For the PACER test, the student was to run as long as possible back and forth across a 20-
meter space at a specified pace that gets faster each minute. For the push-up test, the student
performs as many pushups as possible at approximately 20 90° push-ups per minute or one 90°
push-up every 3 seconds. For the curl-up test, the student completes as many curl-ups as
possible up to a maximum of 75 at a specified pace of one curl-up every 3 seconds. For the
back-saver sit-and-reach test, the student needs to be able to reach the specified distance on the
right and left sides of the body.
For high school boys ages 16 to 18, the healthy fitness zone (HFZ) was between 61-94
laps for the PACER test; 24-47 curl-ups for the curl-up test; 18-35 push-ups for the 90° push-up
EXAMINATION OF OHIO’S PE ACADEMIC CONTENT 36
test; and at least 8 inches for the back-saver sit-and-reach test. For high school girls ages 16 to
18, the HFZ was between 32 and 61 laps for the PACER test; 18 and 35 curl-ups for the curl-up
test; 7 and 15 for the 90° push-up test; and 12 inches for the back-saver sit-and-reach test.
The test that received the lowest scores from both males and females was the
aerobic/cardio-respiratory PACER test. Only 16 males out of 57 (28%) achieved the HFZ for the
PACER test while only 10 females out of 33 (30%) achieved the HFZ (Figure 3). Scores for
both of the muscular strength and endurance tests were similar for both groups. A total of 30
(53%) of the males achieved the HFZ for the upper-body muscular strength and endurance test
while only 13 (39%) of the females achieved the HFZ (Figure 3). Twenty-nine males (51%)
achieved the HFZ for the lower-body muscular strength and endurance test and 21 females
(64%) achieved the HFZ, which were the best results for the female group (Figure 3). The final
test had the largest number of males achieve the HFZ with 38 (67%) passing and also had a high
number of females achieve the HFZ with 19 (58%) passing (Figure 3).
Figure 3. Number of students (N=90) who achieve the healthy fitness zone (HFZ) based on
FITNESSGRAM scores (2011).
16
10
30
13
29
21
38
19
0
5
10
15
20
25
30
35
40
Male Female Male Female Male Female Male Female
EXAMINATION OF OHIO’S PE ACADEMIC CONTENT 37
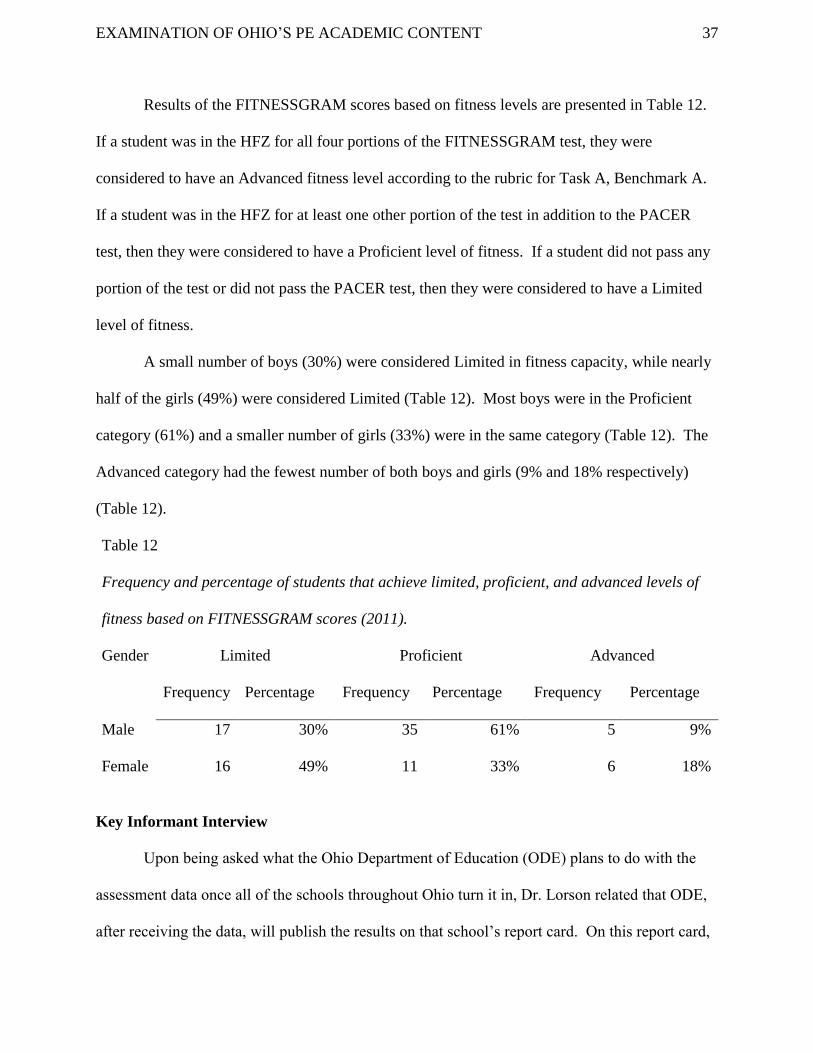
Results of the FITNESSGRAM scores based on fitness levels are presented in Table 12.
If a student was in the HFZ for all four portions of the FITNESSGRAM test, they were
considered to have an Advanced fitness level according to the rubric for Task A, Benchmark A.
If a student was in the HFZ for at least one other portion of the test in addition to the PACER
test, then they were considered to have a Proficient level of fitness. If a student did not pass any
portion of the test or did not pass the PACER test, then they were considered to have a Limited
level of fitness.
A small number of boys (30%) were considered Limited in fitness capacity, while nearly
half of the girls (49%) were considered Limited (Table 12). Most boys were in the Proficient
category (61%) and a smaller number of girls (33%) were in the same category (Table 12). The
Advanced category had the fewest number of both boys and girls (9% and 18% respectively)
(Table 12).
Table 12
Frequency and percentage of students that achieve limited, proficient, and advanced levels of
fitness based on FITNESSGRAM scores (2011).
Gender Limited Proficient Advanced
Frequency Percentage Frequency Percentage Frequency Percentage
Male 17 30% 35 61% 5 9%
Female 16 49% 11 33% 6 18%
Key Informant Interview
Upon being asked what the Ohio Department of Education (ODE) plans to do with the
assessment data once all of the schools throughout Ohio turn it in, Dr. Lorson related that ODE,
after receiving the data, will publish the results on that school’s report card. On this report card,
EXAMINATION OF OHIO’S PE ACADEMIC CONTENT 38
there are aspects such as how well the school is doing with physical education, the local wellness
policy of the school, BMI data, and whether or not they are participating in a physical activity
pilot program developed by the ODE. The summarized score will be available to teachers,
parents, and other community members. By making this information public, Dr. Lorson and the
ODE hope that it will make PE “accountable in schools and will be an agent for change.” He did
not believe the assessments would change much based on the scores but said that there may need
to be some future revisions made based on their impact in PE classes throughout the state.
Based on his prior experience, the informant believes that there will be poor results from
the students for Standard 4, Benchmark A. He said that this is mostly because of poor health and
physical activity trends of students in Ohio and because PE classes do not have enough time with
students. He also said that poor PE teacher enthusiasm is an issue related to student fitness
activity during PE class. He said that there would probably never be daily PE in schools due to
“lack of space in schools (one gym compared to numerous classrooms), lack of funding, lack of
teachers, and lack of PE teacher enthusiasm.”
Despite these drawbacks, the informant is quite optimistic in regard to the PE standards
and assessment in Ohio. He said that the assessment data could improve the appearance of the
impact PE has on a child. He related that assessments are “key to PE survival” and would have
been removed in schools if the assessments were not implemented. He said that the best thing
about the assessments is that they hold everyone accountable. He felt that the assessment could
motivate the teacher and student and he has already seen a number of improvements in PE
classes due to the assessments.
He believes that the assessments are having the greatest impact on PE teachers. He
related that before the assessments were in place, many PE teachers needed to change numerous
EXAMINATION OF OHIO’S PE ACADEMIC CONTENT 39
things in their classroom such as lesson plans. After the assessments, he has already seen these
changes come into play because the teachers are “becoming more involved”. Prior to the
assessments, he was performing only one to two professional development sessions for teachers.
He noted that they did not appear to be “interested in what PE had to offer”. After the
assessments were in place in 2009, however, his professional development sessions for PE
teachers have increased dramatically.
He stated that several schools in Ohio are now looking at growth in PE and some schools
are getting student data at the beginning of the year and at the end of the year to see what
differences are being made in the PE classes. The informant noted that the students in these
schools are “already showing improvements”. He said that there is still a long way to go in order
to get students to have higher levels of physical activity and physical fitness but believes that the
state of Ohio is “heading in a good direction.”
Discussion
Teachers’ Perceptions of the Standard 4, Benchmark A Assessments
From this pilot study, one year after the implementation of the state-required physical
education assessments for Standard 4, Benchmark A, there were two themes that emerged based
on teachers’ perceptions of assessments.
First, teachers who used nationally available fitness tests (either the FITNESSGRAM or
President’s Challenge) had positive feelings towards accuracy of the assessments. Of those
responding teachers who used the nationally available fitness tests (87.8% of the teachers),
79.5% either agreed or strongly agreed that the assessments accurately measured Benchmark A
in Standard 4. A majority of these teachers (69.2%) also thought that there were enough criteria
in the assessment for advanced, proficient, and limited to accurately measure performance.
EXAMINATION OF OHIO’S PE ACADEMIC CONTENT 40
Those who used their own assessment (12.2% of the teachers) were unsure if their test was
accurate at measuring whether students met or exceeded criterion-referenced physical fitness
standards (50% disagreed). They also had mixed feelings as to whether there were enough
criteria in their assessment to indicate whether their students had advanced, proficient, and
limited levels of physical fitness (50% disagreed).
Secondly, teachers using either the FITNESSGRAM or President’s Challenge indicated
that those assessments’ instructions were detailed and easy to follow. Those teachers felt
confident in carrying them out. The teachers indicated that they found the standardized test they
used to have enough detailed information in the protocol to carry out the evaluation effectively.
Teachers using their own protocol, however, had mixed perceptions towards whether their
protocol had enough detailed information to carry out the test accurately (57.1% disagreed).
Previous studies on these assessments used in Standard 4, Benchmark A have shown
similar results. The state of South Carolina also established a statewide program assessment
established to make positive change in physical education school programs. A study by Rink,
Jones, Kirby, Mitchell, and Doutis (2007) was conducted to determine teacher perceptions this
program. They found that the FITNESSGRAM and President’s Challenge assessment were
consistent in any PE setting and that many teachers support the viability of the standards,
assessment, and accountability reform effort to positively impact PE programs (Rink, Jones,
Kirby, Mitchell, & Doutis, 2007).
A study by Reed, Brittenham, Phillips, and Carlisle (2007) on the physical fitness levels
of three hundred and forty six children concluded that the teachers found these national test
batteries to be valid and reliable and are considered appropriate measures of physical activity
accountability in the PE classroom (Reed, Brittenham, Phillips, & Carlisle, 2007). Another study
EXAMINATION OF OHIO’S PE ACADEMIC CONTENT 41
performed by James, Griffin, and France (2005) in a suburban elementary school with an
enrollment of 440 students found that the teachers using the standardized assessments for state
standards perceived that their knowledge of the content they intended their students to learn was
enhanced as they began to recognize the connection between the instructional tasks and
assessment. They also found that the teaching-learning process was also enhanced because the
teacher began to align instruction by focusing on aligning assessment with the NASPE standards
(James, Griffin, & France, 2005).
This part of this pilot study was conducted to discover if teachers found the fitness tests
recommended by the Ohio Department of Education (President’s Challenge and
FITNESSGRAM) to be accurate and reliable. It was important to assess the teachers’
perceptions of the assessments because these assessments were implemented to address many
concerns with the physical activity and fitness levels of students in Ohio (Henry, 2011). The
second part of this study was conducted to assess these current health-enhancing fitness levels by
analyzing FITNESSGRAM scores of Ohio high school students.
Student Health-Enhancing Fitness Levels
There were several areas of concern based on the FITNESSGRAM scores in this study.
The area of the least concern was the flexibility assessment, as over half of the boys and girls
(67% and 58% respectively) were in the healthy fitness zone (HFZ). This is congruent with
other studies on the FITNESSGRAM as the flexibility test is one of the commonly least-failed
aspects of the FITNESSGRAM (Shriver et al., 2011).
One concern was the muscular strength and endurance of the lower body portion of the
test. Only half of the boys (51%) were in the HFZ for this portion of the test. However, a
greater number (64%) of girls were in the HFZ for this test. This is the area where the females
EXAMINATION OF OHIO’S PE ACADEMIC CONTENT 42
scored the highest. Some research on the FITNESSGRAM testing suggests that females
sometimes tend to have a greater lower-body strength than males, often scoring higher on lower
body tests (Stodden, Langendorfer, Roberton, & Kelbley, 2007). Some tests where they score
higher are on this curl-up test and on a test for kicking velocity.
Another concern from the scores was the muscular strength and endurance of the upper
body portion of the FITNESSGRAM. Only half of the boys (53%) were in the HFZ for this
portion of the test while less than half of the girls (39%) were in the HFZ. This is typically one
of the lowest-scoring areas for female adolescents (Mota et al., 2010). This is also an area of
particular concern since it has been found that low strength test performance was associated with
increased risk for obesity and metabolic risk in adolescent girls (Mota et al., 2010).
The greatest area of concern was the aerobic/cardio-respiratory portion of the
FITNESSGRAM test. Students tend to score lowest on this portion of the test. Eisenmann,
Laurson, and Welk (2011) conducted a study on aerobic fitness percentiles for U.S. adolescents
in 2011, gathering data from 2,997 subjects through the National Health and Nutrition
Examination Survey (NHANES). They discovered that, using FITNESSGRAM HFZ thresholds,
33% of adolescents have a limited fitness level and females tend to have lower fitness levels than
males (Eisenmann, Laurson, & Welk, 2011). Within this study, only 28% of males and 30% of
females were considered to be in the HFZ.
Nationally, age-related aerobic fitness declines have been attributed to this finding.
Studies show declines in the percentage of youth who achieved the HFZ standard for
cardiovascular fitness as they age (elementary school: 70%; middle school: 46%; high school:
34%) (Welk, Meredith, Ihmels, & Seeger, 2010). This is such a concern because this
EXAMINATION OF OHIO’S PE ACADEMIC CONTENT 43
cardiorespiratory component is often associated with the greatest health-related benefits
(Stampfer et al., 2000).
Despite the poor assessment data results, there are some positives to take away from this
part of the study. As noted in the key informant interview, the assessments are already having a
positive impact on student assessment results and are generating more enthusiasm in Ohio PE
students than ever before (Lorson, 2011). It would be interesting to do a follow-up of the same
students and see if the scores improve over time.
Limitations
There are numerous limitations to this pilot study. First, readers are reminded of the
small sample size (41 respondents) and low participation rate (14%). Thus, results should only
be generalized to these 41 teachers from southwest Ohio. Teachers from other parts of the state,
as well as nonrespondents, were not included in this study and thus generalizing the results to the
entire state is not encouraged. Current national response rates for questionnaires range from
21% to 60% (Dey, 1997). The 14% response rate in this study is thus well below the expected
rate. This could introduce a bias that could limit the external validity of the results since the
teachers that did not respond could have dissimilar points of view as well as different programs
and curriculum.
The sample size may have been improved had the questionnaire been sent to PE teachers
throughout all of Ohio rather than just the southwest portion. The response rate could have
improved had the questionnaire been sent by someone who the teachers recognized in the
physical education community.
The questionnaire had not been previously piloted/validated prior to this study. There
may have some measurement limitations in this respect. This could have been adjusted had a
EXAMINATION OF OHIO’S PE ACADEMIC CONTENT 44
previously piloted and validated questionnaire been used for this study.
For the FITNESSGRAM data, existing data was used. This study could have been more
accurate had the FITNESSGRAM tests been performed specifically for the purposes of this pilot
study. It was assumed that the teacher followed the protocol for the FITNESSGRAM test, but
there may have been inaccurate measurements by the PE teacher and this may have skewed the
results as well.
Public Health Implications and Recommendations
This is an exciting time for physical education and physical activity in Ohio schools.
Ohio PE assessments were implemented in 2009 and the Ohio Department of Education (ODE)
requires scores of these assessments for Standard 4, Benchmark A to be sent to them by Fall
2013. The ODE recommends that the teachers use national assessment protocols such the
FITNESSGRAM or President’s Challenge. These nationally recognized standardized
assessments are helpful to teachers because they provide a set of guidelines that point teachers in
the right direction when it comes to assessing a student’s fitness levels (Henry, 2011).
To enhance and expand PE and physical activity programs in Ohio, a comprehensive
approach at the state, district, school, and classroom levels is necessary. Ohio and its school
districts should attempt to keep improving upon standardized testing and its curriculum and try to
keep PE teachers committed to understanding the standards. The teachers themselves should
have a personal commitment to their growing knowledge about the standards. The teachers
should also be active participants in professional development activities that help them stay
current. They should attempt to always understand the standards because this understanding is
an influential determinant of the teachers’ attitude towards the standards (Weiyun, 2006).
EXAMINATION OF OHIO’S PE ACADEMIC CONTENT 45
Overall, the results of the FITNESSGRAM test indicate that the students are not
achieving optimal levels of health-enhancing fitness. This would suggest that there are some
areas where PE teachers need to focus their efforts. The teachers could use the FITNESSGRAM
scores to base their lesson plans. For example, having students spend more of their time on
cardiovascular-related lesson plans such as in active sport play or by running, cycling, or
swimming might help improve aerobic/cardiorespiratory levels. Oftentimes, instead of for fun,
teachers use cardiovascular-related activities such as running for disciplinary purposes (Lee,
Burgeson, Fulton, & Spain, 2007). If the efforts were focused in a more positive manner and
directed appropriately, students could receive great benefits from PE class. Some of these
benefits are already beginning to show in Ohio with the implementation of the PE standards and
assessments for Standard 4, Benchmark A (Lorson, 2011).
More research needs to be done in order to determine the best methods for increasing
physical activity levels and improving the fitness levels and tests scores of students. Future
research should be done on those schools in Ohio that are establishing student baselines for
fitness data and then seeing what differences are being made in PE class over the course of the
year. Other research should be conducted on students throughout Ohio and discover their own
perceptions of the assessments.
Conclusions
School-based physical education is a mechanism used to promote physical activity in a
classroom setting. Because physical activity levels have declined over the years, particularly
among adolescents, the state of Ohio has developed a set of standards and assessments for PE in
order to promote physical activity and health-benefitting physical fitness. It was also designed to
hold both teachers and students accountable for their health-benefitting physical fitness levels.
EXAMINATION OF OHIO’S PE ACADEMIC CONTENT 46
Assessment scores are to be sent to the Ohio Department of Education by Fall 2013. The Ohio
Department of Education encourages teachers to use the nationally recognized President’s
Challenge and FITNESSGRAM for their assessments. In this pilot study, it was discovered that
most teachers find these nationally recognized test batteries to be user friendly and accurate at
measuring health-benefiting physical fitness levels.
Also from this study, of the 90 students performing the FITNESSGRAM test, only 57
demonstrated proficient or advanced fitness levels while 33 demonstrated limited fitness levels.
The students received the best scores on the flexibility portion of the assessment and the worst
scores on the aerobic/cardio-respiratory portion. It is recommended that the teachers use these
scores to help plan their lesson plans. As noted in the key informant interview, despite the poor
results of the students, studies across the state are showing increased improvements in physical
activity and fitness levels due to the accountability that is created by the assessments for
Standard 4, Benchmark A for both teachers and students.
EXAMINATION OF OHIO’S PE ACADEMIC CONTENT 47
References
Allison, K. R., Dwyer J. J., & Goldenberg, E. (2005). Male adolescents' reasons for participating
in physical activity, barriers to participation, and suggestions for increasing participation.
Adolescence, 40(157), 155-170.
Anderson, D. (1989). The Discipline and the Profession. Foundations of Canadian Physical
Education, Recreation, and Sports Studies. Dubuque, IA: Wm. C. Brown Publishers.
Anderssen, N., & Wold, B (2002). Parental and peer influences on leisure-time physical activity
in young adolescents. Research Quarterly for Exercise and Sport, 63(4), 341-348.
Beatly, Carla. Personal Interview. 19 October 2011.
Boester, E., Cunningham, L., & Burns, T. (2004). The President's Challenge. Journal of
Nutrition Education & Behavior, 36(4), 221-222.
Centers for Disease Control and Prevention. (2010). Physical activity and public health -- a
recommendation from the centers for disease control and prevention and the American
College of Sports Medicine. Journal of the American Medical Association, (273), 402-
407.
Centers for Disease Control and Prevention. (2009). Youth Risk Behavior Survey. Available at:
www.cdc.gov/yrbss. Accessed on July 2011.
Cohen, S., & Williamson, G. M. (1991). Stress and infectious disease in humans. Psychological
Bulletin. 109: 5–24
Colchico, K., Zybert P., & Basch, C. (2000). Effects of after-school physical activity on fitness,
fatness, and cognitive self-perceptions: a pilot study among urban, minority adolescent
girls. American Journal of Public Health, 90(6), 977-978.
EXAMINATION OF OHIO’S PE ACADEMIC CONTENT 48
Corbin, C. B., & Pangranzi, R. P. (1992). Are American children and youth unfit? Research
Quarterly for Exercise and Sport, 63(2), 96–106.
Dagkas, S., & Stathi, A. (2007). Exploring social and environmental factors affecting
adolescents' participation in physical activity. European PE Review, 13(3), 369-384.
Dey, E. L. (1997). Working with low survey response rates: The efficacy of weighting
adjustments. Research in Higher Education, 38, 215-227.
Eisenmann, J. C., Laurson, K. R., & Welk, G. J. (2011). Aerobic Fitness Percentiles for U.S.
Adolescents. American Journal of Preventive Medicine, 41(4), S106-S110.
Going, S., Lohman, T., & Cussler, E. (2011). Percent body fat and chronic disease risk factors in
US children and youth. American Journal of Preventive Medicine, 41(4S2), S77-S86.
Henry, L. (2011, August 15). PE academic content standards. Retrieved from
http://www.ode.state.oh.us/GD/Templates/Pages/ODE/ODEDetail.aspx?Page=3&TopicR
elationID=1793&Content=109934
Fitness.gov. “The President’s Council on Physical Fitness.” Fitness.gov. 2001. Department of
Health and Human Services, Web. 5 May 2011.
http://www.fitness.gov/resources_factsheet.htm
James, A. R., Griffin, L. L., & France, T. (2005). Perceptions of Assessment in Elementary PE:
A Case Study. Physical Educator, 62(2), 85-95.
Janssen, I., & LeBlanc, A. G. (2010). Systematic review of the health benefits of physical
activity and fitness in school-aged children and youth. International Journal of
Behavioral Nutrition & Physical Activity, 7, 40-55. doi:10.1186/1479-5868-7-40
Lee, S. M., Burgeson, C. R., Fulton, J. E., & Spain, C. G. (2007). Physical education and
physical activity: results from the School Health Policies and Programs Study 2006.
EXAMINATION OF OHIO’S PE ACADEMIC CONTENT 49
Journal of School Health, 77, 435–463.
Lorson, Kevin. Personal Interview. December 7, 2011.
Meyer, M. (2011). About the Cooper Institute. Retrieved from
http://www.cooperinstitute.org/ceo
Mota, J., Vale, S., Martins, C., Gaya, A., Moreira, C., Santos, R., & Ribeiro, J. C. (2010).
Influence of muscle fitness test performance on metabolic risk factors among adolescent
girls. Diabetology & Metabolic Syndrome, 2(1), 1-7.
Nahas, M. V., & Corbin, C. B. (1992). Fitness and health: justification and suggestions to
implementation a physical education program. Rev Bras Cien Mov, 6(2), 47-58.
Pate, R. R., Heath, G. W., Dowda, M., & Trost, S. G. (1996). Associations between PA and other
health behaviors in a representative sample of us adolescents. American Journal of Public
Health, 86(11), 1581.
Penney, D. (2002). Gender and PE: contemporary issues and future directions. London,
England: Routledge.
Reed, J. A., Brittenham, S. W., Phillips, D., & Carlisle, C. S. (2007). A Preliminary Examination
of the Fitness Levels of Children Who Meet the President's Council PA
Recommendation. Physical Educator, 64(3), 159-167.
Rink, J., Jones, L., Kirby, K., Mitchell, M., & Doutis, P. (2007). Teacher Perceptions of a PE
Statewide Assessment Program. Research Quarterly for Exercise & Sport, 78(3), 204-
215.
Sallis, J. F., & Mckenzie, R.D. (1991). Physical education’s role in public health. Research
Quality for Exercise and Sport, 62, 124-137.
EXAMINATION OF OHIO’S PE ACADEMIC CONTENT 50
Sallis, J. F., McKenzie, T. L., Alcaraz, J. E., Kolody, B., Faucette, N., & Hovell, M. F. (1997).
The effects of a 2-year physical education program (SPARK) on physical activity and
fitness in elementary school students. Sports, Play and Active Recreation for Kids.
American Journal of Public Health, 87(8), 1328-1334.
Shriver, L. H., Harrist, A. W., Hubbs-Tait, L., Topham, G., Page, M., & Barrett, A. (2011).
Weight Status, Physical Activity, and Fitness Among Third-Grade Rural Children.
Journal of School Health, 81(9), 536-544.
Sibley, B. A., & Potteiger, J.A. (2008). Impact of school program on body composition and PA.
Proceedings of the the preliminary program for 2008 aahperd national convention and
exposition. Oxford, OH: Miami University.
Stampfer, M. J., Hu, F. B., Manson, J. E., Rimm, E. B., & Willett, W. C. (2000). "Primary
Prevention of Coronary Heart Disease in Women through Diet and Lifestyle". New
England Journal of Medicine, 343(1), 16.
Stodden, D. F., Langendorfer, S. J., Roberton, M., & Kelbley, L. (2007). Association between
motor skill competence and health-related physical fitness. Journal of Sport & Exercise
Psychology, 29, S45-S46.
Telama, R., & Yang, X. (2000). Decline of physical activity from youth to young adulthood in
Finland. Medicine and Science in Sports and Exercise, 32(9), 1617-1622.
Trost, S. G., Pate, R. R., Freedson, P. S., Sallis, J. F., & Taylor, W. C. (2000). Using objective
physical activity measures with youth: How many days of monitoring are needed?
Medicine and Science in Sports and Exercise, 32, 426-431.
Trost, S. G., & Van Der Mars, H. (2009). Why We Should Not Cut P.E. Educational Leadership,
67(4), 60-65.
EXAMINATION OF OHIO’S PE ACADEMIC CONTENT 51
U.S. Department of Health and Human Services. (2000). Physical Activity and Health: A Report
of the Surgeon General. Atlanta, GA: Centers for Disease Control and Prevention.
U.S. Department of Health and Human Services. (n.d.). Healthy people 2020:Physical Activity.
Retreived from
http://www.healthypeople.gov/2020/topicsobjectives2020/objectiveslist.aspx?topicid=33
Weiyun, C. (2006). Teachers’ knowledge about and views of the national standards for physical
education. Journal of Teaching in Physical Education, 25(1), 120-142.
Welk, G. J., De Saint-Maurice Maduro, P. F., Laurson, K. R., & Brown, D. D. (2011). Field
evaluation of the new FITNESSGRAM Criterion-Referenced Standards. American
Journal of Preventive Medicine, 41(4), S131-S142.
Welk, G. J., Meredith, M. D., Ihmels, M., & Seeger, C. (2010). Distribution of Health-Related
Physical Fitness in Texas Youth: A Demographic and Geographic Analysis. Research
Quarterly For Exercise and Sport, 81, S6-S15.
Wilmore, J., & Knuttgen, H. (2003). Aerobic Exercise and Endurance Improving Fitness for
Health Benefits. The Physician and Sportsmedicine, 31(5), 45.
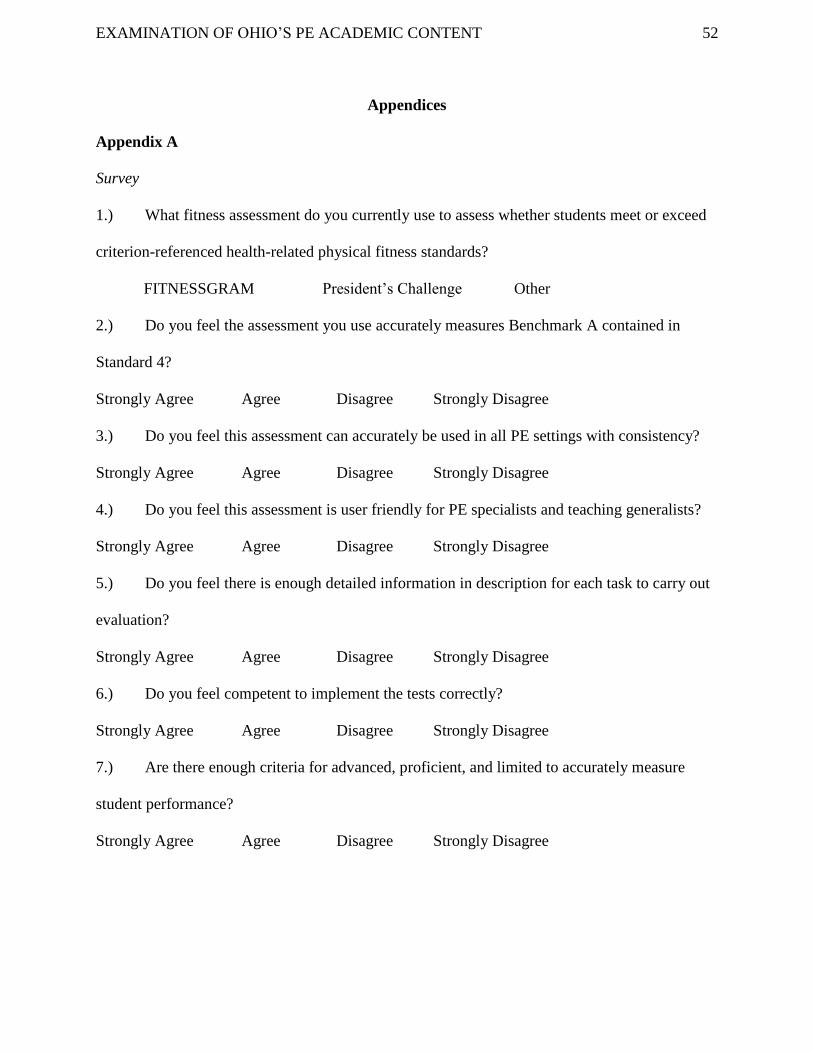
EXAMINATION OF OHIO’S PE ACADEMIC CONTENT 52
Appendices
Appendix A
Survey
1.) What fitness assessment do you currently use to assess whether students meet or exceed
criterion-referenced health-related physical fitness standards?
FITNESSGRAM President’s Challenge Other
2.) Do you feel the assessment you use accurately measures Benchmark A contained in
Standard 4?
Strongly Agree Agree Disagree Strongly Disagree
3.) Do you feel this assessment can accurately be used in all PE settings with consistency?
Strongly Agree Agree Disagree Strongly Disagree
4.) Do you feel this assessment is user friendly for PE specialists and teaching generalists?
Strongly Agree Agree Disagree Strongly Disagree
5.) Do you feel there is enough detailed information in description for each task to carry out
evaluation?
Strongly Agree Agree Disagree Strongly Disagree
6.) Do you feel competent to implement the tests correctly?
Strongly Agree Agree Disagree Strongly Disagree
7.) Are there enough criteria for advanced, proficient, and limited to accurately measure
student performance?
Strongly Agree Agree Disagree Strongly Disagree
EXAMINATION OF OHIO’S PE ACADEMIC CONTENT 53
Appendix B
IRB Letter
Hello,
You are invited to be a participant in a research project concerning PE standards in Ohio.
My name is Gabriel Jones and I am a Public Health graduate student at Wright State
University. I am conducting a survey to discover PE teachers’ perceptions of the effectiveness
and accuracy of the assessments for Ohio's Academic Content Standard 4 Benchmark A in PE in
determining the fitness levels of students. Your role as a subject in the research project will be to
provide me with your own evaluation of Standard 4 Benchmark A based on prompted questions
in the survey. The results from this survey will be used for my research paper on my Ohio’s PE
Academic Content Standard 4, Benchmark A as part of my Culminating Experience project for
Wright State University.
Your participation in the research project is voluntary. Confidentiality will be maintained for
you throughout the entire research project. You are free to terminate your participation at any
time and without prejudice.
Completion of the survey implies your consent to participate in this research project. It is
estimated that it will take you no more than ten minutes to complete the survey. There are no
known risks and you will receive no direct benefit as a result of completing the survey. The
group results may be obtained at Wright State University’s Center for Global Health Systems,
Management, and Policy in November 2011 and will also be presented in a Culminating
EXAMINATION OF OHIO’S PE ACADEMIC CONTENT 54
Experience presentation at a later date yet to be determined.
You may print a copy of this letter for your reference. If you have any questions or concerns
about the research you may contact the principal investigator (Gabe Jones via email at
[email protected] or phone at (937)258-5547) or faculty advisor (Sabrina Neeley via email
at [email protected] or phone at (937)258-5540). If you have general questions about
giving consent or your rights as a research participant in this research study, you can call the
Wright State University Institutional Review Board (via phone at (937)775-4462).
Gabriel Jones (Principal Investigator), Dr. Sabrina Neeley (Faculty Advisor)
Here is a link to the survey:
http://www.surveymonkey.com/s.aspx
Please do not forward this message.
Here is a link to opt out of the survey:
http://www.surveymonkey.com/optout.aspx
Ohio PE Assessments
Standard 4
Achieves and maintains a health-enhancing level of physical fitness
Benchmark A
Benchmark A: Meet or exceed criterion-referenced health-related physical fitness standards.
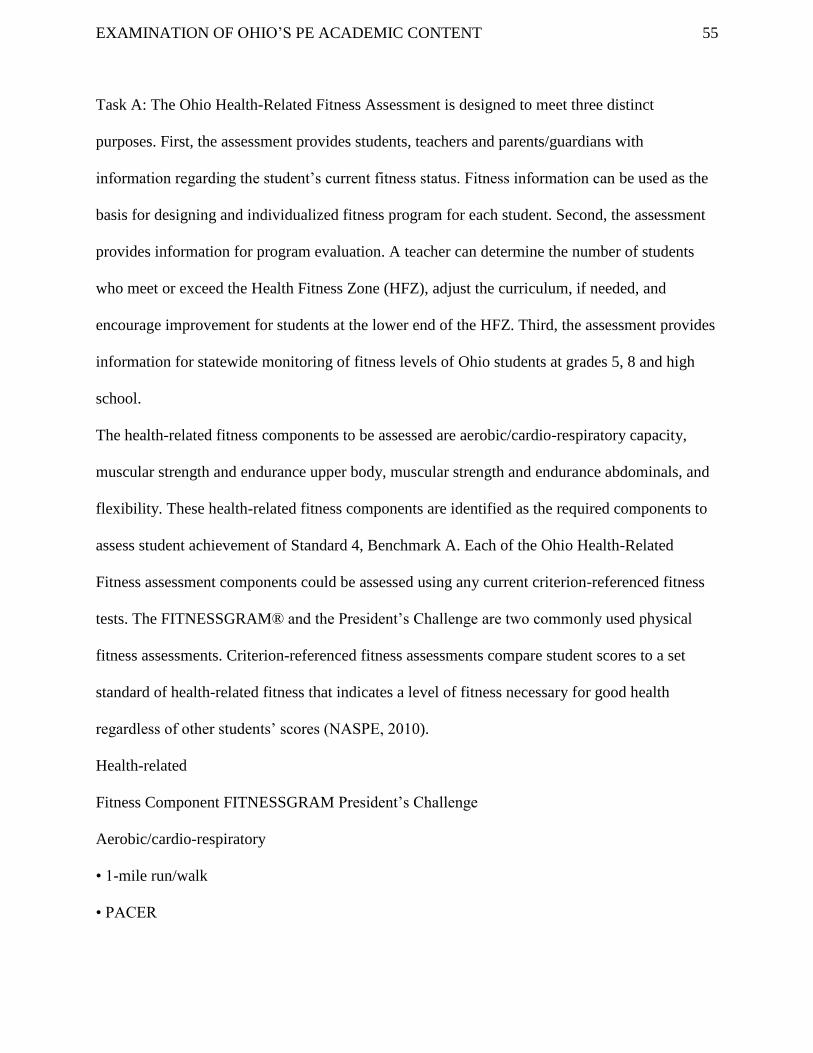
EXAMINATION OF OHIO’S PE ACADEMIC CONTENT 55
Task A: The Ohio Health-Related Fitness Assessment is designed to meet three distinct
purposes. First, the assessment provides students, teachers and parents/guardians with
information regarding the student’s current fitness status. Fitness information can be used as the
basis for designing and individualized fitness program for each student. Second, the assessment
provides information for program evaluation. A teacher can determine the number of students
who meet or exceed the Health Fitness Zone (HFZ), adjust the curriculum, if needed, and
encourage improvement for students at the lower end of the HFZ. Third, the assessment provides
information for statewide monitoring of fitness levels of Ohio students at grades 5, 8 and high
school.
The health-related fitness components to be assessed are aerobic/cardio-respiratory capacity,
muscular strength and endurance upper body, muscular strength and endurance abdominals, and
flexibility. These health-related fitness components are identified as the required components to
assess student achievement of Standard 4, Benchmark A. Each of the Ohio Health-Related
Fitness assessment components could be assessed using any current criterion-referenced fitness
tests. The FITNESSGRAM® and the President’s Challenge are two commonly used physical
fitness assessments. Criterion-referenced fitness assessments compare student scores to a set
standard of health-related fitness that indicates a level of fitness necessary for good health
regardless of other students’ scores (NASPE, 2010).
Health-related
Fitness Component FITNESSGRAM President’s Challenge
Aerobic/cardio-respiratory
• 1-mile run/walk
• PACER
EXAMINATION OF OHIO’S PE ACADEMIC CONTENT 56
• 1-mile run/walk
Muscular strength and endurance
upper body
• 90-degree push-up, cadence
• 90-degree push-up, one-minute
Muscular strength and endurance
abdominals
• Curl-ups, cadence
• Curl-ups, one-minute
Flexibility
• Back-saver sit and reach
• Trunk lift
• Sit and reach
Teachers should follow the specific protocols for each test item. Provide students with ample
EXAMINATION OF OHIO’S PE ACADEMIC CONTENT 57
practice time before measuring student performance for this assessment. Please refer to the
National Association for Sport and PE position statement Appropriate Uses of Fitness
Measurement for guidelines for effectively using the information obtained from this assessment
(http://www.aahperd.org/naspe/standards/PEPS.cfm).
Rubric for Task A, Benchmark A Level Criteria
Advanced The student achieves the criterion in all four health-related fitness components.
Proficient The student achieves the criterion in at least one of the fitness assessments.
Limited The student does not achieve the criterion in any of the health-related fitness
components.

EXAMINATION OF OHIO’S PE ACADEMIC CONTENT 58
Appendix C
List of Public Health Competencies Met
Specific Competencies
Domain #1: Analytic Assessment Skill
Defines a problems
Selects and defines variables relevant to defined public health problems
Identifies relevant and appropriate data and information sources
Applies ethical principles to the collection, maintenance, use, and dissemination of data and information
Partners with communities to attach meaning to collected quantitative and qualitative data
Makes relevant inferences from quantitative and qualitative data
Applies data collection processes, information technology applications, and computer systems storage/retrieval strategies
Domain #2: Policy Development/Program Planning Skills
Collects, summarizes, and interprets information relevant to an issue
Domain #3: Communication Skills
Communicates effectively both in writing and orally, or in other ways
Solicits input from individuals and organizations
Advocates for public health programs and resources
Attitudes
Listens to others in an unbiased manner, respects points of view of others, and promotes the expression of diverse opinions and perspectives
Domain #4: Cultural Competency Skills
Utilizes appropriate methods for interacting sensitively, effectively, and professionally with persons from diverse cultural, socioeconomic, educational, racial, ethnic and professional backgrounds, and persons of all ages and lifestyle preferences
Identifies the role of cultural, social, and behavioral factors in determining the delivery of public health services
Domain #5: Community Dimensions of Practice Skills
Establishes and maintains linkages with key stakeholders
Domain #6: Basic Public Health Sciences Skills
Defines, assesses, and understands the health status of populations, determinants of health and illness, factors contributing to health promotion and disease prevention, and factors influencing the use of health services
Identifies and applies basic research methods used in public health
Applies the basic public health sciences including behavioral and social sciences, biostatistics, epidemiology, environmental public health, and prevention of chronic and infectious diseases and injuries
Identifies and retrieves current relevant scientific evidence
Identifies the limitations of research and the importance of observations and interrelationships
Domain #7: Financial Planning and Management Skills - N/A
Domain #8: Leadership and Systems Thinking Skills - N/A