A polarized human endometrial cell line that binds and transports polymeric IgA
Upload
independentCategory
view
0download
0
An ex ante forecast on economically engineered bit ratesfor IPTV service via xDSL transportsof internodal access
Perambur S. Neelakanta & Angela S. Perez &
Daniel M. Baeza
Accepted: 14 February 2008 /Published online: 29 April 2008# Springer Science + Business Media, LLC 2008
Abstract Concerning broadband IPTV service (of 12/24 MHz bandwidth) on adigital subscriber line (xDSL), an algorithm (plus a numerical spreadsheet) thatcomputes the required, economically engineered bit rates (EEBRs) of associated(aggregated) traffic is developed. The EEBR is decided by user (residential/business)behavior at a wire center and is essential for economic design/implementation/expansion of xDSL infrastructure. Using an available set of (ex post) data on xDSLgrowth of services (collected over a period of semiannual terms) at a wire center, anex ante forecast on EEBR is elucidated. An EEBR-based economic utilization ofresources and connection admission control is indicated.
Keywords IPTV. xDSL economically engineered bit rates . Bit rate forecast
1 Introduction
The prospects of next-generation networking (NGN) in telecommunications (as overlayefforts on existing infrastructure of circuit-switched network architectures) encompassthree technological components vis-à-vis their evolution and turf layout considerations.The first one is the internodal access transport (otherwise, simply known as the “local-
Netnomics (2008) 9:21–46DOI 10.1007/s11066-008-9009-y
P. S. Neelakanta (*)Department of Electrical Engineering, Florida Atlantic University, Boca Raton, FL 33431, USAe-mail: [email protected]
A. S. PerezIBM Global Engineering Services, STG, Bldg. 062-J1173039 Cornwallis Road,Research Triangle Park, NC 27709, USAe-mail: [email protected]
D. M. BaezaAT & T Labs, 6451 North Federal Highway, RM # 619, Fort Lauderdale, FL 33308, USAe-mail: [email protected]
loop”). It refers to the gamut of infrastructural facility of transport methods plus theelectronics stretching from the network interface device (NID) at the customer premisesto the serving central office (CO). The second one refers to the switching technology thatcovers the CO-switch paraphernalia and the third is the internodal transport pertinent tothe whole plethora of interoffice facility (IOF).
The present study offers a method to design economically-engineered bit rates(EEBRs) for upcoming and next-generation local-loop technology that may supportIPTV streaming to customer premises via xDSL (digital subscriber line) accessmethods. The EEBR, in question, implies a prudent choice of bit rate requirementsof the network resources and the associated support systems consistent withcustomer usage pattern. That is, the EEBR in essence, should economically providethe unspecified bit rate (UBR) as well as the guaranteed bit rates (GBRs) negotiatedthrough service level agreements (SLAs) with the customers. In other words, theEEBR represents an optimized bit rate that conforms to practical aspects ofbandwidth-provisioning and capacity management with respect to the physical layerof xDSL transport. Proper adoption of EEBR would allow network resources toadequately support the (non-deterministic) total bandwidth on demand fromcustomer side (including IPTV streaming in the present context) without prejudicingthe SLA. At the same time, the resources are not redundantly installed, lest it wouldburden the capital and operational expenses (CAPEX and OPEX) involved.
In general, traditional xDSL networks support two classes of customers: (1)Residential customers with a simple asymmetric DSL (ADSL) connectivity forInternet access provisioned by an UBR-specific SLA; and, (2) business/enterprisecustomers who may need xDSL connectivity but with an access that provides rathera GBR class of service (with corresponding SLA).
In the upcoming as well as in the next-generation xDSL pursuits, thetelecommunication companies (telcos) would aggressively practice offering anotherdistinct class of service to residential customers who opt for IPTV (warranting largeBW/high bit-rate streaming via xDSL access). Multi-dwelling units (MDUs) andhospitality premises are examples where such connectivity for down-streamingcable-quality (or better) video access is needed [5]. In the competitive deregulatedenvironment, the telcos would tend to pursue such options so as to achieve return-on-investment (RoI) benefits from the tons of buried copper lines of plain oldtelephone service (POTS).
The ongoing efforts in telco business in implementing IPTV via xDSL is based onusing the so-called ADSL2/ADSL2+ services along with a strategy known as“copper-bonding” that will facilitate the required upper limit on the bit rate for(MPEG) quality picture transmissions [1].
To the best of authors’ knowledge, no efforts on explicit evaluation of EEBRpertinent to intermodal access seem to exist or published in open literature. AnUS patent[12] of 2002 describes a measurement system for post-estimation of the capacity of aDSL local loop (on the physical lines already trenched in situ). This, however,provides no a priori data on design requirements of bit rates needed for additionalservices as such. Described in [4] details on preparing the infrastructure of legacynetworks for broadband services (such as IPTV). It includes relevant particulars ondata gathering, compilation of network information archive, access network check andlocal loop qualifications, but does not offer any approach to estimate the bit rates to be
22 P.S. Neelakanta et al.
engineered. In a latest publication [5], the author queries that, in the existing copperinfrastructure of access loops, the “biggest unknown in the broadband servicesequation is how much bandwidth will be needed to support video into the nextdecade?” Today it is still a “wild card decision” in provisioning this queriedbandwidth/bit rate considerations due to the nonexistence of any tangible algorithm tocompute the bit rates to be engineered. This niche motivated the present study.
2 IPTV on xDSL infrastructure
For the implementation of broadband IPTV applications on DSL transports, theaforesaid ADSL2/ADSL2+ schemes need ratings of the type and extent of bit ratesas listed in Table 1.
While resorting to ADSL2/ADSL2+ services (up to 18 kft reach), the underlyinglarge bandwidth (BW) is realized by what is known as multi-pair bonding [1]. Thisstrategy refers to bonding together multiple copper-pairs enabling a loopaggregation. For example, four copper-pairs each serving at a xDSL rate of 2.3 Mbpscan be bonded (paralleled) to support a higher rate of 10 Mbps (at the cost of fourDSLs for a given reach-distance). Typically, 18 kft is considered (via line-qualification field tests) as the allowable maximum distance to support typicalADSL speed (or bandwidth). For IPTV transmissions (corresponding to MPEGquality pictures), such a simple ADSL bandwidth will, however, be insufficient(even for 18 kft access or less). Therefore, the aforesaid strategy of copper-bondingis adopted towards total bandwidth requirements (such as for IPTV). That is, byfacilitating architecture of bonded copper-pairs in the physical layer, IPTVtransmissions can be enabled and provisioned on local-loops.
With reference to services rendered as per ADSL2/ADSL2+, though a guaranteedbit rate is specified (as given in Table 1), the equipment in the turf that serves theentire DSL customer base will not, however, be loaded at all times to the extent ofthe sum total of GBR/UBR demands of the entire subscribers. The reason is that,
Table 1 Minimum-to-maximum ranges of bit rates on up- and down-links for different types of service ofinterest: xDSL classifications of ADSL2/ADSL2+ [2]
Minimum-to-maximum ranges of bit rates:(Rdmin − Rdmax)down-link/(Rumin − Rumax)up-link (kbps)
xDSL Service classification and bit rate type
(256–1,500)down/(128–256)up ADSL: ResidentialHigh-speed InternetBit rate type: UBR/UBR
(12,000)down/(1,000)up: ADSL2: Residential/MDUEntertainment/IPTV/high-speed-Internet:18 kft Loop-length
Bit rate type: GBR(24,000)down/(3,000)up ADSL2+: Residential/MDU
Entertainment/IPTV/high-speed Internet:18 kft Loop-length
Bit rate type: GBR
MDU multi-dwelling unit
Ex ante forecast on economically engineered bit rates for IPTV 23
statistically it can be expected that at any given time, not all customers (of a servicearea) will be availing the entire circuit (and the associated resources), nor that theywould avail simultaneously the maximum rate that the physical line of the loop cansupport (per subscriber). Normally, it is conceivable that there exists a fraction ofcustomer population (in the service area) not using the line at all; and, some may beusing the xDSL sparingly for lean-traffic applications such as e-mail; and, activeIPTV transmissions being streamed through internodal access loop could only be afraction of the total traffic supported over that period of time.
The present study uses this statistically anticipated, limited use of resources todesign economically, the bit rates engineered for the transport of aggregated traffic(including IPTV) of internodal loop access. Hence a forecast scheme is devised toascertain the EEBRs on ex ante basis using the available (ex post) details oninfrastructure growth versus services rendered in the customer base.
3 DSL infrastructure
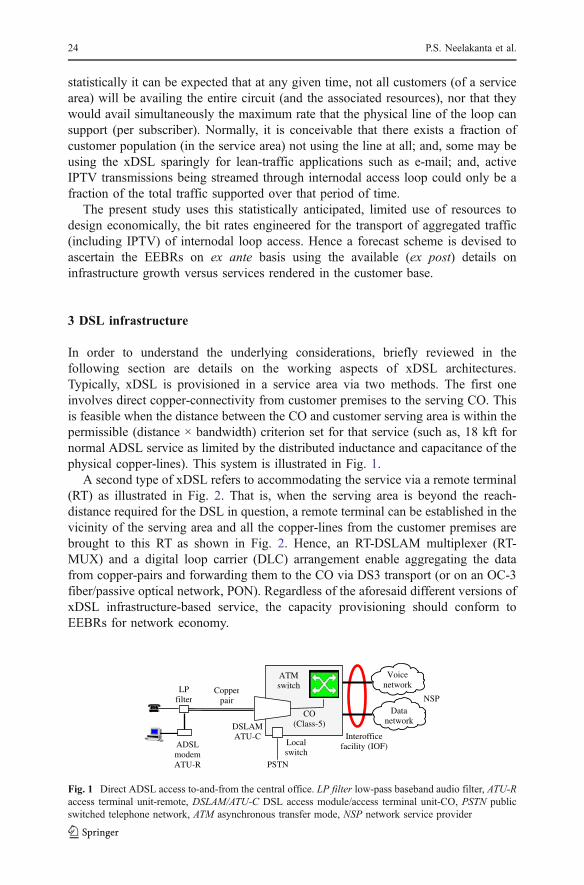
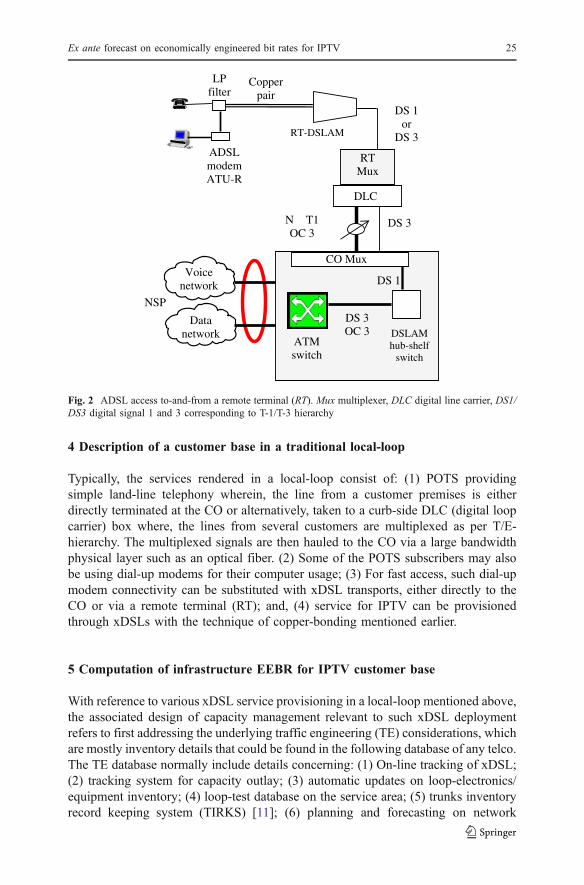
In order to understand the underlying considerations, briefly reviewed in thefollowing section are details on the working aspects of xDSL architectures.Typically, xDSL is provisioned in a service area via two methods. The first oneinvolves direct copper-connectivity from customer premises to the serving CO. Thisis feasible when the distance between the CO and customer serving area is within thepermissible (distance × bandwidth) criterion set for that service (such as, 18 kft fornormal ADSL service as limited by the distributed inductance and capacitance of thephysical copper-lines). This system is illustrated in Fig. 1.
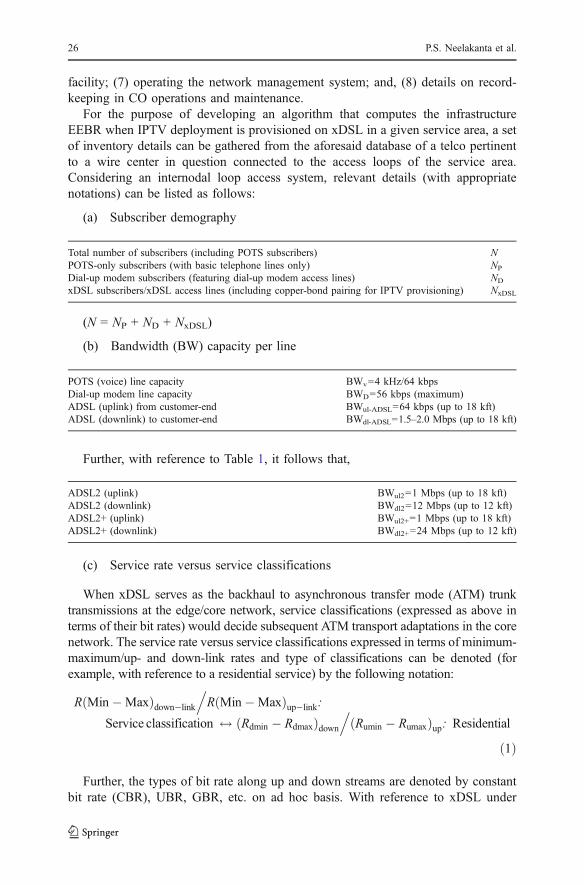
A second type of xDSL refers to accommodating the service via a remote terminal(RT) as illustrated in Fig. 2. That is, when the serving area is beyond the reach-distance required for the DSL in question, a remote terminal can be established in thevicinity of the serving area and all the copper-lines from the customer premises arebrought to this RT as shown in Fig. 2. Hence, an RT-DSLAM multiplexer (RT-MUX) and a digital loop carrier (DLC) arrangement enable aggregating the datafrom copper-pairs and forwarding them to the CO via DS3 transport (or on an OC-3fiber/passive optical network, PON). Regardless of the aforesaid different versions ofxDSL infrastructure-based service, the capacity provisioning should conform toEEBRs for network economy.
LP filter
ADSL modem ATU-R
Copperpair
DSLAMATU-C
PSTN
Voice network
Data network
NSP
Interoffice facility (IOF)
ATM switch
CO (Class-5)
Localswitch
Fig. 1 Direct ADSL access to-and-from the central office. LP filter low-pass baseband audio filter, ATU-Raccess terminal unit-remote, DSLAM/ATU-C DSL access module/access terminal unit-CO, PSTN publicswitched telephone network, ATM asynchronous transfer mode, NSP network service provider
24 P.S. Neelakanta et al.
4 Description of a customer base in a traditional local-loop
Typically, the services rendered in a local-loop consist of: (1) POTS providingsimple land-line telephony wherein, the line from a customer premises is eitherdirectly terminated at the CO or alternatively, taken to a curb-side DLC (digital loopcarrier) box where, the lines from several customers are multiplexed as per T/E-hierarchy. The multiplexed signals are then hauled to the CO via a large bandwidthphysical layer such as an optical fiber. (2) Some of the POTS subscribers may alsobe using dial-up modems for their computer usage; (3) For fast access, such dial-upmodem connectivity can be substituted with xDSL transports, either directly to theCO or via a remote terminal (RT); and, (4) service for IPTV can be provisionedthrough xDSLs with the technique of copper-bonding mentioned earlier.
5 Computation of infrastructure EEBR for IPTV customer base
With reference to various xDSL service provisioning in a local-loop mentioned above,the associated design of capacity management relevant to such xDSL deploymentrefers to first addressing the underlying traffic engineering (TE) considerations, whichare mostly inventory details that could be found in the following database of any telco.The TE database normally include details concerning: (1) On-line tracking of xDSL;(2) tracking system for capacity outlay; (3) automatic updates on loop-electronics/equipment inventory; (4) loop-test database on the service area; (5) trunks inventoryrecord keeping system (TIRKS) [11]; (6) planning and forecasting on network
Voice network
Data network
NSP
ATM switch
CO Mux
N × T1 OC 3
DS 3
DS 3OC 3 DSLAM
hub-shelfswitch
DS 1
DLC
RT Mux
DS 1 or
DS 3 RT-DSLAM
LP filter
ADSL modem ATU-R
Copperpair
Fig. 2 ADSL access to-and-from a remote terminal (RT). Mux multiplexer, DLC digital line carrier, DS1/DS3 digital signal 1 and 3 corresponding to T-1/T-3 hierarchy
Ex ante forecast on economically engineered bit rates for IPTV 25
facility; (7) operating the network management system; and, (8) details on record-keeping in CO operations and maintenance.
For the purpose of developing an algorithm that computes the infrastructureEEBR when IPTV deployment is provisioned on xDSL in a given service area, a setof inventory details can be gathered from the aforesaid database of a telco pertinentto a wire center in question connected to the access loops of the service area.Considering an internodal loop access system, relevant details (with appropriatenotations) can be listed as follows:
(a) Subscriber demography
Total number of subscribers (including POTS subscribers) NPOTS-only subscribers (with basic telephone lines only) NP
Dial-up modem subscribers (featuring dial-up modem access lines) ND
xDSL subscribers/xDSL access lines (including copper-bond pairing for IPTV provisioning) NxDSL
(N = NP + ND + NxDSL)
(b) Bandwidth (BW) capacity per line
POTS (voice) line capacity BWv=4 kHz/64 kbpsDial-up modem line capacity BWD=56 kbps (maximum)ADSL (uplink) from customer-end BWul-ADSL=64 kbps (up to 18 kft)ADSL (downlink) to customer-end BWdl-ADSL=1.5–2.0 Mbps (up to 18 kft)
Further, with reference to Table 1, it follows that,
ADSL2 (uplink) BWul2=1 Mbps (up to 18 kft)ADSL2 (downlink) BWdl2=12 Mbps (up to 12 kft)ADSL2+ (uplink) BWul2+=1 Mbps (up to 18 kft)ADSL2+ (downlink) BWdl2+=24 Mbps (up to 12 kft)
(c) Service rate versus service classifications
When xDSL serves as the backhaul to asynchronous transfer mode (ATM) trunktransmissions at the edge/core network, service classifications (expressed as above interms of their bit rates) would decide subsequent ATM transport adaptations in the corenetwork. The service rate versus service classifications expressed in terms of minimum-maximum/up- and down-link rates and type of classifications can be denoted (forexample, with reference to a residential service) by the following notation:
R Min�Maxð Þdown�link
.R Min�Maxð Þup�link:
Service classification $ Rdmin � Rdmaxð Þdown.
Rumin � Rumaxð Þup: Residential
ð1Þ
Further, the types of bit rate along up and down streams are denoted by constantbit rate (CBR), UBR, GBR, etc. on ad hoc basis. With reference to xDSL under
26 P.S. Neelakanta et al.
consideration, relevant details are as given in Table 1. In addition, in order todevelop algorithms toward EEBR computation under consideration, the followingexplicit details are required:
– Number and types of customers connected to a given DSLAM version– Maximum number of active customers supported on this DSLAM during peak-
hours [9]– Total bandwidth in demand specified by the statistics of the bit rate profile
prevailing on the customer side– DSLAM type (CO-based or RT-based) and physical line (DS-3/OC-3) feed
adapted at the DSLAM for directing the aggregated DSL traffic to the CO– xDSL physical port capacity to be provisioned/engineered
(d) Suppose, the total number of ADSL customers connected to the DSLAM ata CO is specified as, NADSL-CO, then more explicit parameters can be defined(specific to the types of subscribers and versions of services) as follows:
5.1 Residential customers not opting for IPTV, (identified by the subscript index, R1)
Number of residential customers connected to the DSLAMat the CO not opting for IPTV
NR-nonIPTV
Coefficient deciding the fraction of residential users(out of total subscribers) not opting for IPTV
fR1 < 1 ¼ NR�nonIPTVNADSL�CO
Number of residential non-IPTV users active during peak-hours (NR-nonIPTV)Active
Coefficient deciding the fraction of non-IPTV residential users(out of total users) active during peak hours
gR1 < 1ð Þ ¼ NR�nonIPTVð ÞActiveNADSL�CO
Further, suppose an ith active user (of any UBR category) is served by theDSLAM in a down-stream access mode at a variant speed, (Umin ≤ ui ≤ Umax). Then,
Coefficient deciding the fraction of statistically variant UBR utilizedby non-IPTV residential customers
(hR1<1) = (uR1)i/UMax
5.2 Residential customers opting for IPTV, (identified by the subscript index, R2)
Number of residential customers opting for IPTVconnected to the DSLAM at the CO
NR-IPTV
Coefficient deciding the fraction of residential users(out of total subscribers) opting for IPTV
fR2 < 1 ¼ NR�IPTVð ÞNADSL�CO
Number of active IPTV users during peak-hours (NR-IPTV)Active
Coefficient deciding the fraction of IPTV user(out of total users) active during peak hours
gR2 < 1 ¼ NR�IPTVð ÞActiveNADSL�CO
Coefficient deciding guaranteed and statistically-invariant,maximum-UBR utilized by IPTV residential customers
(hR1=1) = UMax/UMax
Ex ante forecast on economically engineered bit rates for IPTV 27
5.3 Business customers on UBR service agreement, (identified by the subscriptindex, BU)
Number of business customers on UBR connectedto the DSLAM at the CO (and not opting for IPTV)
NB-nonIPTV/UBR
Coefficient deciding the fraction of business users(out of total subscribers) on UBR (not opting for IPTV)
fBU < 1 ¼ NB�nonIPTV=UBR
NADSL�CO
Number of UBR business (non-IPTV) users active duringthe peak-hours
(NB-nonIPTV/UBR)Active
Coefficient deciding s fraction of UBR business (non-IPTV)users (out of total users) active during the peak-hours
gBU < 1 ¼ NB�nonIPTV=UBRð ÞActive
NADSL�CO
Coefficient deciding the fraction of statistically variant UBRused by non-IPTV/UBR business customers
(hBU<1) = (uBU)i/UMax
5.4 Business customers on GBR service agreement, (identified by the subscriptindex, BG)
Number of business customers on GBR connectedto DSLAM at the CO (and not opting for IPTV)
NB-nonIPTV/GBR = NBG
Coefficient deciding the fraction of non-IPTV businessusers (out of total subscribers) on GBR
fBG < 1 ¼ NBGNADSL�CO
Coefficient deciding the fraction of GBR (non-IPTV)business users (out of total users) active during the peak-hours
gBG < 1 ¼ NB�nonIPTV=GBRð ÞActive
NADSL�CO
Coefficient deciding statistically invariant,GBR used by non-IPTV/UBR business customers
(hBG=1) = UMax/UMax
(e) Capacity requirements
Case (1) Customer base: Residential DSL customers with high-speed Internet access and IPTV support
Number of active residential subscribers in this base:
NRð ÞCase 1¼ gR1 � fR1 þ gR2 � fR2ð Þ � NADSL�CO ð2Þ
UBR for ADSL-based residential customer 1.5 MbpsMaximum (bursty) bit rate on down-streamper customer (accessing IPTV; ADSL2 up to 12 kft)
12 Mbps
Total capacity in demand:
CRð ÞCase 1¼ fR1 � gR1 � hR1ð Þ � 1500þ fR2 � gR2ð Þ � hR2 ¼ 1ð Þ � 12000½ � � NADSL�COf gkbps ð3Þ
Case (2) Customer base: Mixed set of residential(non-IPTV and IPTV) subscribers plus businesscustomers of UBR and GBR support on DSL
UBR for ADSL-based IPTVresidential/business customer:
1.5 Mbps
Maximum (bursty) bit rate on down-streamper customer (accessing IPTV) (ADSL2 up to 12 kft)
12 Mbps
28 P.S. Neelakanta et al.
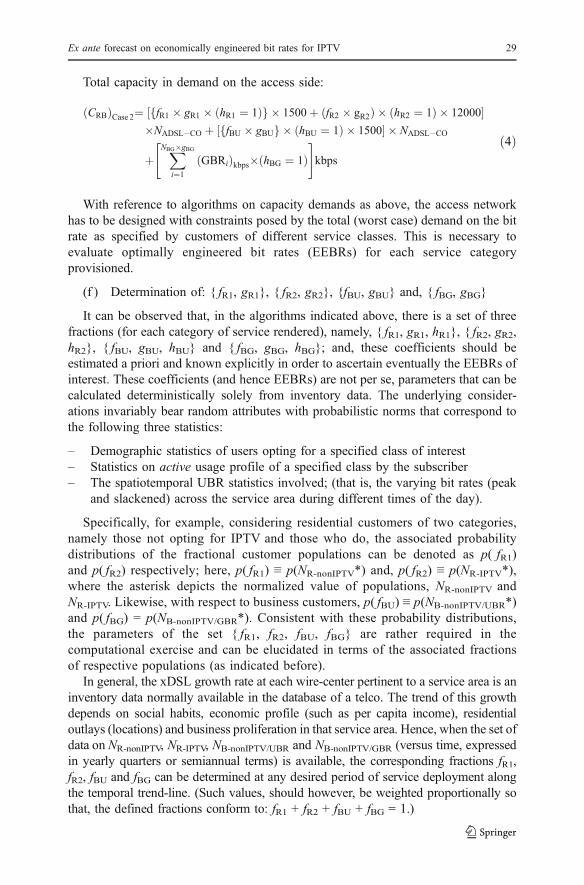
Total capacity in demand on the access side:
CRBð ÞCase 2¼ fR1 � gR1 � hR1 ¼ 1ð Þf g � 1500þ fR2 � gR2ð Þ � hR2 ¼ 1ð Þ � 12000½ ��NADSL�CO þ fBU � gBUf g � hBU ¼ 1ð Þ � 1500½ � � NADSL�CO
þXNBG�gBG
i¼1
GBRið Þkbps� hBG ¼ 1ð Þ" #
kbps
ð4Þ
With reference to algorithms on capacity demands as above, the access networkhas to be designed with constraints posed by the total (worst case) demand on the bitrate as specified by customers of different service classes. This is necessary toevaluate optimally engineered bit rates (EEBRs) for each service categoryprovisioned.
(f ) Determination of: { fR1, gR1}, { fR2, gR2}, {fBU, gBU} and, { fBG, gBG}
It can be observed that, in the algorithms indicated above, there is a set of threefractions (for each category of service rendered), namely, { fR1, gR1, hR1}, { fR2, gR2,hR2}, { fBU, gBU, hBU} and { fBG, gBG, hBG}; and, these coefficients should beestimated a priori and known explicitly in order to ascertain eventually the EEBRs ofinterest. These coefficients (and hence EEBRs) are not per se, parameters that can becalculated deterministically solely from inventory data. The underlying consider-ations invariably bear random attributes with probabilistic norms that correspond tothe following three statistics:
– Demographic statistics of users opting for a specified class of interest– Statistics on active usage profile of a specified class by the subscriber– The spatiotemporal UBR statistics involved; (that is, the varying bit rates (peak
and slackened) across the service area during different times of the day).
Specifically, for example, considering residential customers of two categories,namely those not opting for IPTV and those who do, the associated probabilitydistributions of the fractional customer populations can be denoted as p( fR1)and p( fR2) respectively; here, p( fR1) ≡ p(NR-nonIPTV*) and, p( fR2) ≡ p(NR-IPTV*),where the asterisk depicts the normalized value of populations, NR-nonIPTV andNR-IPTV. Likewise, with respect to business customers, p( fBU) ≡ p(NB-nonIPTV/UBR*)and p( fBG) = p(NB-nonIPTV/GBR*). Consistent with these probability distributions,the parameters of the set { fR1, fR2, fBU, fBG} are rather required in thecomputational exercise and can be elucidated in terms of the associated fractionsof respective populations (as indicated before).
In general, the xDSL growth rate at each wire-center pertinent to a service area is aninventory data normally available in the database of a telco. The trend of this growthdepends on social habits, economic profile (such as per capita income), residentialoutlays (locations) and business proliferation in that service area. Hence, when the set ofdata on NR-nonIPTV, NR-IPTV, NB-nonIPTV/UBR and NB-nonIPTV/GBR (versus time, expressedin yearly quarters or semiannual terms) is available, the corresponding fractions fR1,fR2, fBU and fBG can be determined at any desired period of service deployment alongthe temporal trend-line. (Such values, should however, be weighted proportionally sothat, the defined fractions conform to: fR1 + fR2 + fBU + fBG = 1.)
Ex ante forecast on economically engineered bit rates for IPTV 29

Next considering, the coefficient set, namely, {gR1, gR2, gBU, gBG}, it refers to thestatistics on active usage of lines for different service categories. Considering the so-called peak-hour traffics, it is logical to surmise that xDSL traffic would mimic moreor less the traditional local access (dial-up modem) traffic on circuit-switchednetworks. Such traffics on circuit-switches located at a CO are measurable (or “peg-counted”) in terms of the so-called centum call second (CCS) load experienced by theCO switch. But, this CCS load consists of a voice-traffic part (CCS)v and a data-trafficpart (CCS)d. Therefore, the total of CCS measured at the circuit switch, namely(CCS)T can be written in terms of Lichtenecker and Rother mixture formula [6]:
CCSð ÞT¼ CCSð Þv� �θ� CCSð Þd
� �1�θ ð5Þwhere θ is a fraction of voice-alone (telephone) lines out of the total network accesslines (NALs) terminated at the CO switch; and, therefore θ is a known inventoryparameter.
Using Eq. 5, (CCS)d can be filtered out assuming that (CCS)v≈3, (which istypical in telephony). Further, as indicated above, (CCS)T is a measurable (peg-counted) parameter at the CO during the peak-hours when active sessions of datatraffic prevail. Relevant to the notations adopted, these sessions for gR1 and gR2correspond to residential areas; and, for gBU and gBG such sessions refer to busyhours in business districts. Thus, for example,
CCSð ÞdCCSð ÞT
����Residential�area=UBR traffic
¼ gR1ð Þ8� gR2ð Þ1�8 ð6Þ
where 8 is the ratio of non-IPTV users to total xDSL users. The fraction gR1 cancorrespond to those measurements at wire centers where IPTV customers do notexist (or sparingly exist). Hence, gR2 can be evaluated explicitly. And,
gBU ¼ CCSð ÞdCCSð ÞT
����Business�district=UBR traffic
ð7aÞ
gBG ¼ CCSð ÞdCCSð ÞT
����Business�district=GBR traffic
ð7bÞ
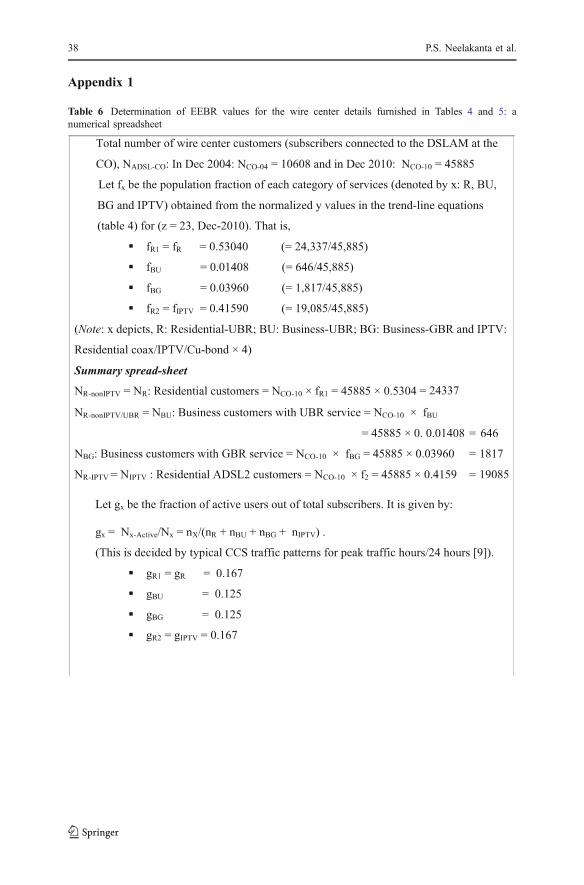
In the numerical example indicated in Appendix 1, the data furnished on the set {gx}is gathered from the wire center details described in [9].
(g) Determination of: {hR1, hR2, hBU, hBG}
The third set of parameters, namely, {hR1, hR2, hBU, hBG} of interest refers to thestatistics of application-specific (fluctuating) UBR and (constant) GBR values ofdata rates involved in the traffic. That is, under UBR conditions a line could besupporting sometimes bursty spurts of bits or may pass non-spurt bit rates onstatistical basis. In GBR services, however, a guaranteed (constant) rate is alwaysassured and supported on the line. Consistent with the two-state model of UBRfluctuation, the parameter set, {hR1, hR2, hBU}can be determined by a methodproposed in [8, 10] and described below. The parameter, hBG, however, is equal to 1due to the constancy of GBR provisioned.
30 P.S. Neelakanta et al.

As indicated earlier, an ith active user (of any UBR category) is served by theDSLAM in a down-stream access mode at a speed, Umin ≤ ui ≤ Umax. Thisstatistical variable ui across the entire ensemble of user base can be specified by thefollowing heuristics: Considering the downstream access, the function of aDSLAM can be regarded as a queueing-service that enables bits being receivedfrom the feeding side and buffered as well as (de)multiplexed to n active users.Hence, any ith active user (of UBR category) is served by the DSLAM in questionto have a (down-stream) access at a speed of Umin ≤ ui ≤ Umax of the user type/service category, x (denoting explicitly, the service category R1, R2, BU or BG).Further, since the bit rate ui being considered is a time-dependent statisticalvariable, Umin and Umax respectively define its minimum and maximum bounds fora given service category x.
And, as defined earlier, (ux)i = (hx × Umax)i with an average rate of (Ra–x)i = (μx)iand a standard deviation (σx)i. Also, this variable ui can be assumed to be uniformlydistributed, inasmuch as any value between Umin and Umax is equally likely to occurin any active session. Hence, the prescription of Laplace’s assumption namely, auniform probability distribution as regard to this variable in question is a validproposition.
(h) Determination of ui and EEBR evaluation
Next, the objective is to decide the value of ui that can be used in EEBR designs.Suppose pertinent to any ith customer of service category x, the following relation isdefined:
(x ¼ (o � nx= nR1 þ nR2 þ nBU þ nBGð Þ½ � ð8Þ
with x ⇒ (non-IPTV service: R1), (IPTV service: R2), BU or BG; and, nx depictsthe number of lines (users) being active, for example, nR1 = gR1 × NADSL-CO.Further, (o = (ρx × p) where, ρx is the user-side utilization (that is, the probabilitythat a user is in an active, spurt state); and, (p=1) denotes explicitly the criticalstate of the DSLAM being at its full service activity, (namely, the feed-sidecapacity is fully flooded). So, p<1, implies a prorated condition on the full serviceactivity. As described in [8, 10], the index (i=1, 2,…,n) refers to multiplexedconnections supporting traffics of average rate (μx)i in each ith connection (of anycategory x).
Now, an “equivalent bandwidth” can be defined such that, the probability that theinstantaneous aggregate bit rate exceeding a certain value (cx)i is less than (x; and,the entity (ux × cx) thereof, depicts an “equivalent capacity” per user of the servicecategory, x. Corresponding analysis in [8, 10], further stipulates elucidating aninverse Gaussian distribution αx specified by the following approximation in order todetermine cx:
αx � 2� ln 1= (xð Þf g � ln 2� πð Þ½ �1=2 ð9ÞWhen αx→0, it depicts the critical condition (that the feed-side been fully
flooded). It leads to ((x)critical = (o=0.39894. Hence explicitly, (x=0.39894 × [nx/(nR + nBU + nBG)]. Further, under this critical condition, p→1; therefore, ρx can beimplicitly specified by: 0.39894 × (user occupation fraction of time). Suppose this
Ex ante forecast on economically engineered bit rates for IPTV 31
user occupation fraction of time (depicting the fraction of average duration ofactive period) of a service category x is denoted by bx (so that, ρx=0.39894×bx).Then, following the details furnished in [9], this bx parameter of the active period/session time can be evaluated on the basis of ensemble data on CCS compiled at awire center. Described in [9] are details pertinent to such active time-slabsindicating worst-case active sessions of the traffic in terms of CCS-loadingencountered in voice and data transmissions. Relevant considerations yieldapproximately the numerical evaluation of the set {bx}(and used in the calculationsof Appendix 1).
Further, pursuing the analysis similar to that in [8, 10], the expression for cx is asfollows:
cx ¼yx � χxð Þ þ yx � χxð Þ2þ4� χx � ρx � yx
h i1=22� yx
ð10Þ
where, yx = αx × bx × (1−ρx) × Umax and χx is the feed-side capacity (such as DS-3,OC 3, 4 × DS1 or DS-1) at the DSLAM provisioned per ADSL. Hence, (ui)x due toall the (i=1, 2,…,n) active users is given by:
uð Þx� �
M¼ UM �
axð Þ �Pni¼1
cxð Þin
8>><>>:
9>>=>>; ð11Þ
where the subscript M denotes maximum, average or minimum values on ux,corresponding to UMax, UMean and UMin respectively. The expression of Eq. 11 canfurther be approximated over its entire ensemble set (of large cardinality) asfollows:
uð Þx� �
M
� ���Ensemble set i¼1;2;...;nf g� UM � αxð Þ � cx ð12Þ
Therefore, the set {hR1, hR2, hBU} with hx defined via (ux)i = (hx × Umax)i, can beduly evaluated; (and, as indicated earlier, hBG=1).
In essence, as stated before, the above algorithm of Eq. 12 is obtained on the basisof a two-state model (representing active/spurt and silent dichotomy of traffic statesas mentioned earlier). It also includes Gaussian approximation of superimposed(multiplexed) traffics described in [8, 10].
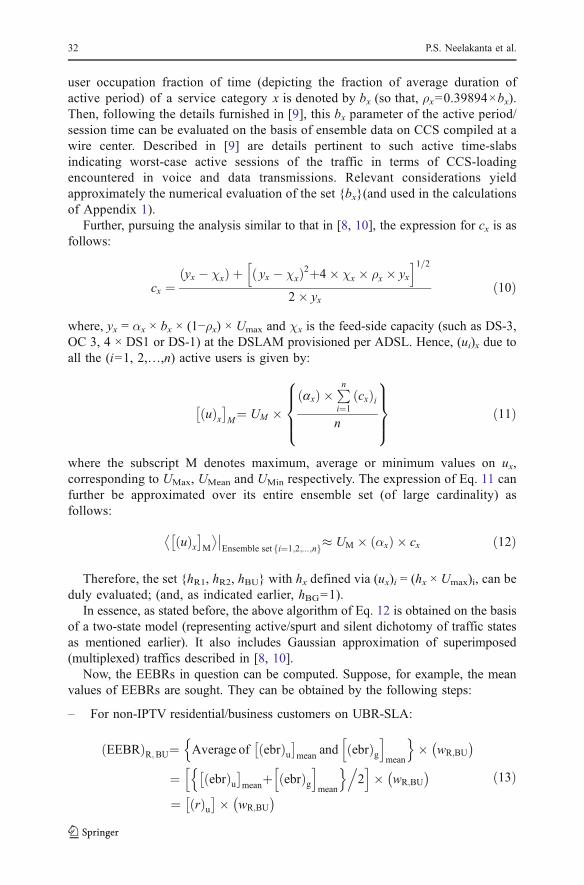
Now, the EEBRs in question can be computed. Suppose, for example, the meanvalues of EEBRs are sought. They can be obtained by the following steps:
– For non-IPTV residential/business customers on UBR-SLA:
EEBRð ÞR;BU¼ Average of ebrð Þu� �
mean and ebrð Þgh i
mean
n o� wR;BU
� �¼ ebrð Þu
� �meanþ ebrð Þg
h imean
n o.2
h i� wR;BU
� �¼ rð Þu� �� wR;BU
� � ð13Þ
32 P.S. Neelakanta et al.

– For business customers on UBR- and GBR-SLA:
EEBRð ÞBU¼ Average of rð Þu and ebrð Þgh i
mean
h in o� wBGð Þ
¼ rð Þu and ebrð Þgh i
mean
n o.2
h i� wBGð Þ
ð14Þ
– For residential customers on high-speed Internet (UBR)- plus IPTV(GBR)-SLA:
EEBRð ÞIPTV¼ Average of ebrð Þu and ebrð Þgh i
mean
h in o� wIPTVð Þ
¼ rð Þu� �� wIPTVð Þ
ð15Þ
where, (ebr)x denotes the statistical spread of bit rates being economicallyengineered. Explicitly, for the service categories of interest:
ebrð Þu� �
M¼ uð ÞR1
� �M� nR1½ � þ uð ÞBU
� �M� nBU½ � �
nR1 þ nBUð Þ ð16aÞ
ebrð Þgh i
M¼ uð ÞBG
� �M� nBG½ � þ uð ÞIPTV
� �M� nR2:IPTV½ � �
nBG þ nR2:IPTVð Þ ð16bÞ
Further, the entity wx in Eqs. 13, 14, 15 represents a prorating coefficient for theservice category x. It is decided by the ratio of maximum (worst case) rate Umax (ofthat service category) relative to the highest (bursty) rate Rmax of the system. That is,with Rmax depicting the maximum of all [Umax]x of all the services provisioned, itfollows that,
wx ¼ Uð Þx� �
max
.Rmax ¼ Uð Þx
� �max
.Max UMaxð Þx
h ið17Þ
6 EEBR calculation: numerical example
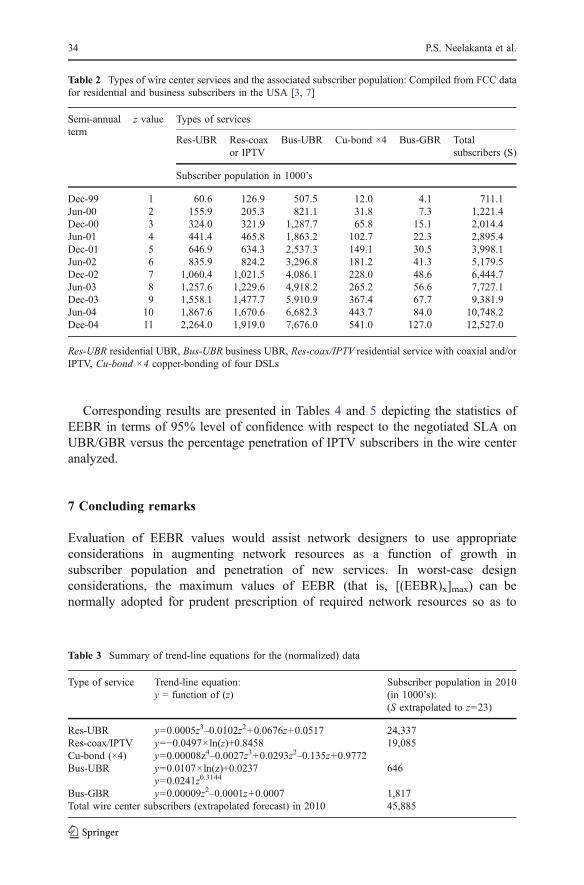
Data furnished in Table 2 corresponds to details on types of servicesprovisioned in a typical wire center and the associated population growth overa stretch of eleven semiannual terms commencing from December 1999 throughDecember 2004 [3, 7]. Corresponding trend-line equations on the growthperformance are presented in Table 3. (These trend-line expressions are obtainedon the basis of normalized values of the data set given in Table 2. Relevantnormalization is done as follows: Each data value in a row is normalized withrespect to the total subscriber value (S ) found in the last column for that row. Thisnormalized variable is denoted by y. For example, considering the residential UBRpopulation, ( y)Dec-99=60.6/711.1=0.08522 and so on. The semiannual termcounting from the first is denoted by z; for example, z=1 represents the Dec-99term and so on, so that an extended value of z=23 depicts the ex ante forecast termof Dec-2010).
Ex ante forecast on economically engineered bit rates for IPTV 33
Corresponding results are presented in Tables 4 and 5 depicting the statistics ofEEBR in terms of 95% level of confidence with respect to the negotiated SLA onUBR/GBR versus the percentage penetration of IPTV subscribers in the wire centeranalyzed.
7 Concluding remarks
Evaluation of EEBR values would assist network designers to use appropriateconsiderations in augmenting network resources as a function of growth insubscriber population and penetration of new services. In worst-case designconsiderations, the maximum values of EEBR (that is, [(EEBR)x]max) can benormally adopted for prudent prescription of required network resources so as to
Table 2 Types of wire center services and the associated subscriber population: Compiled from FCC datafor residential and business subscribers in the USA [3, 7]
Semi-annualterm
z value Types of services
Res-UBR Res-coaxor IPTV
Bus-UBR Cu-bond ×4 Bus-GBR Totalsubscribers (S)
Subscriber population in 1000’s
Dec-99 1 60.6 126.9 507.5 12.0 4.1 711.1Jun-00 2 155.9 205.3 821.1 31.8 7.3 1,221.4Dec-00 3 324.0 321.9 1,287.7 65.8 15.1 2,014.4Jun-01 4 441.4 465.8 1,863.2 102.7 22.3 2,895.4Dec-01 5 646.9 634.3 2,537.3 149.1 30.5 3,998.1Jun-02 6 835.9 824.2 3,296.8 181.2 41.3 5,179.5Dec-02 7 1,060.4 1,021.5 4,086.1 228.0 48.6 6,444.7Jun-03 8 1,257.6 1,229.6 4,918.2 265.2 56.6 7,727.1Dec-03 9 1,558.1 1,477.7 5,910.9 367.4 67.7 9,381.9Jun-04 10 1,867.6 1,670.6 6,682.3 443.7 84.0 10,748.2Dec-04 11 2,264.0 1,919.0 7,676.0 541.0 127.0 12,527.0
Res-UBR residential UBR, Bus-UBR business UBR, Res-coax/IPTV residential service with coaxial and/orIPTV, Cu-bond ×4 copper-bonding of four DSLs
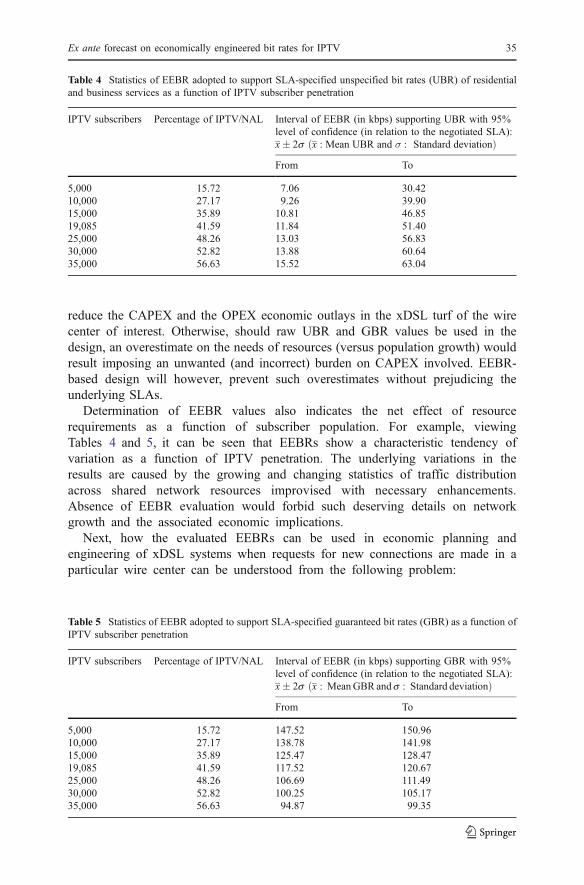
Table 3 Summary of trend-line equations for the (normalized) data
Type of service Trend-line equation:y = function of (z)
Subscriber population in 2010(in 1000’s):(S extrapolated to z=23)
Res-UBR y=0.0005z3–0.0102z2+0.0676z+0.0517 24,337Res-coax/IPTV y=−0.0497×ln(z)+0.8458 19,085Cu-bond (×4) y=0.00008z4–0.0027z3+0.0293z2–0.135z+0.9772Bus-UBR y=0.0107×ln(z)+0.0237 646
y=0.0241z0.3144
Bus-GBR y=0.00009z2–0.0001z+0.0007 1,817Total wire center subscribers (extrapolated forecast) in 2010 45,885
34 P.S. Neelakanta et al.
reduce the CAPEX and the OPEX economic outlays in the xDSL turf of the wirecenter of interest. Otherwise, should raw UBR and GBR values be used in thedesign, an overestimate on the needs of resources (versus population growth) wouldresult imposing an unwanted (and incorrect) burden on CAPEX involved. EEBR-based design will however, prevent such overestimates without prejudicing theunderlying SLAs.
Determination of EEBR values also indicates the net effect of resourcerequirements as a function of subscriber population. For example, viewingTables 4 and 5, it can be seen that EEBRs show a characteristic tendency ofvariation as a function of IPTV penetration. The underlying variations in theresults are caused by the growing and changing statistics of traffic distributionacross shared network resources improvised with necessary enhancements.Absence of EEBR evaluation would forbid such deserving details on networkgrowth and the associated economic implications.
Next, how the evaluated EEBRs can be used in economic planning andengineering of xDSL systems when requests for new connections are made in aparticular wire center can be understood from the following problem:
Table 4 Statistics of EEBR adopted to support SLA-specified unspecified bit rates (UBR) of residentialand business services as a function of IPTV subscriber penetration
IPTV subscribers Percentage of IPTV/NAL Interval of EEBR (in kbps) supporting UBR with 95%level of confidence (in relation to the negotiated SLA):x� 2s x : Mean UBR and σ : Standard deviationð ÞFrom To
5,000 15.72 7.06 30.4210,000 27.17 9.26 39.9015,000 35.89 10.81 46.8519,085 41.59 11.84 51.4025,000 48.26 13.03 56.8330,000 52.82 13.88 60.6435,000 56.63 15.52 63.04
Table 5 Statistics of EEBR adopted to support SLA-specified guaranteed bit rates (GBR) as a function ofIPTV subscriber penetration
IPTV subscribers Percentage of IPTV/NAL Interval of EEBR (in kbps) supporting GBR with 95%level of confidence (in relation to the negotiated SLA):x� 2s x : MeanGBRand s : Standard deviationð ÞFrom To
5,000 15.72 147.52 150.9610,000 27.17 138.78 141.9815,000 35.89 125.47 128.4719,085 41.59 117.52 120.6725,000 48.26 106.69 111.4930,000 52.82 100.25 105.1735,000 56.63 94.87 99.35
Ex ante forecast on economically engineered bit rates for IPTV 35
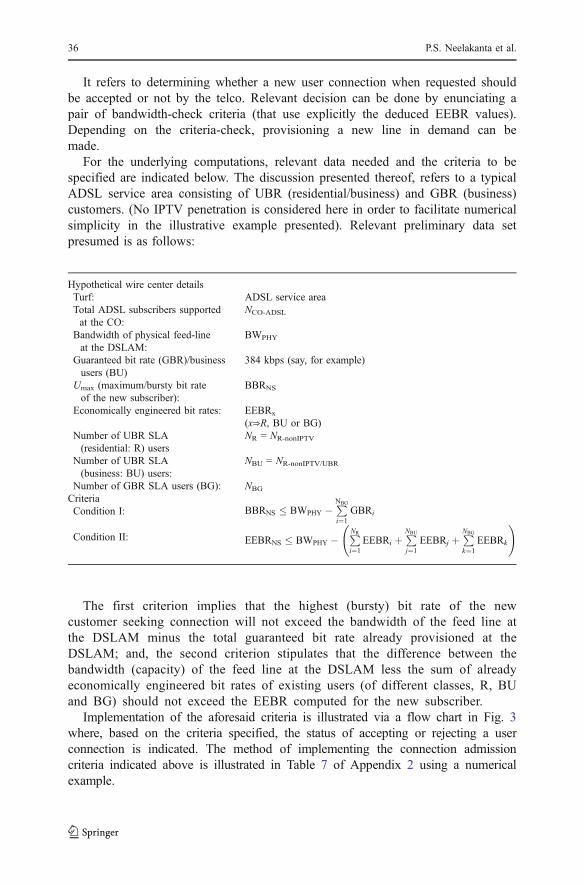
It refers to determining whether a new user connection when requested shouldbe accepted or not by the telco. Relevant decision can be done by enunciating apair of bandwidth-check criteria (that use explicitly the deduced EEBR values).Depending on the criteria-check, provisioning a new line in demand can bemade.
For the underlying computations, relevant data needed and the criteria to bespecified are indicated below. The discussion presented thereof, refers to a typicalADSL service area consisting of UBR (residential/business) and GBR (business)customers. (No IPTV penetration is considered here in order to facilitate numericalsimplicity in the illustrative example presented). Relevant preliminary data setpresumed is as follows:
Hypothetical wire center detailsTurf: ADSL service areaTotal ADSL subscribers supportedat the CO:
NCO-ADSL
Bandwidth of physical feed-lineat the DSLAM:
BWPHY
Guaranteed bit rate (GBR)/businessusers (BU)
384 kbps (say, for example)
Umax (maximum/bursty bit rateof the new subscriber):
BBRNS
Economically engineered bit rates: EEBRx
(x⇒R, BU or BG)Number of UBR SLA(residential: R) users
NR = NR-nonIPTV
Number of UBR SLA(business: BU) users:
NBU = NR-nonIPTV/UBR
Number of GBR SLA users (BG): NBG
CriteriaCondition I: BBRNS � BWPHY � PNBG
i¼1GBRi
Condition II: EEBRNS � BWPHY � PNR
i¼1EEBRi þ
PNBU
j¼1EEBRj þ
PNBG
k¼1EEBRk
!
The first criterion implies that the highest (bursty) bit rate of the newcustomer seeking connection will not exceed the bandwidth of the feed line atthe DSLAM minus the total guaranteed bit rate already provisioned at theDSLAM; and, the second criterion stipulates that the difference between thebandwidth (capacity) of the feed line at the DSLAM less the sum of alreadyeconomically engineered bit rates of existing users (of different classes, R, BUand BG) should not exceed the EEBR computed for the new subscriber.
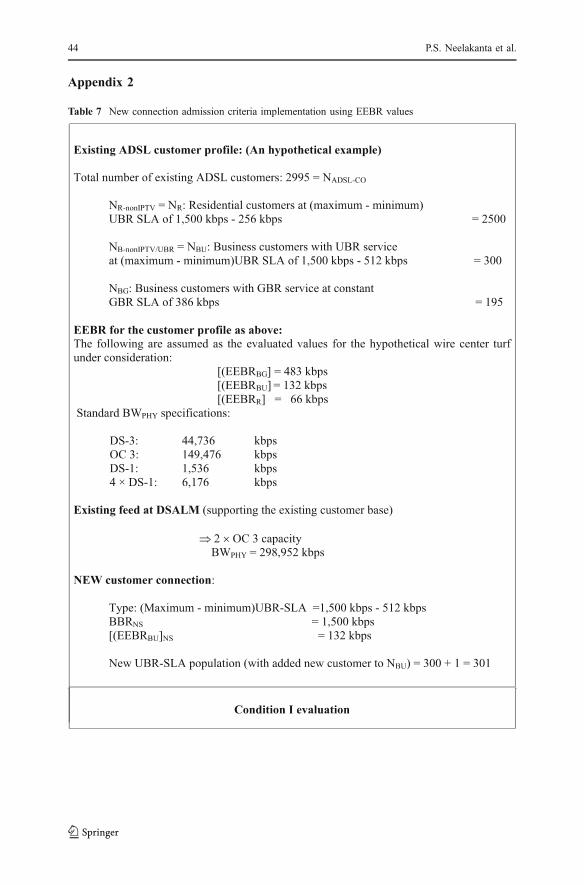
Implementation of the aforesaid criteria is illustrated via a flow chart in Fig. 3where, based on the criteria specified, the status of accepting or rejecting a userconnection is indicated. The method of implementing the connection admissioncriteria indicated above is illustrated in Table 7 of Appendix 2 using a numericalexample.
36 P.S. Neelakanta et al.
In summary, the present study considers practical aspects of xDSL turf details,the associated services provisioned and corresponding demography of userpopulation so as to ascertain the economics of network capacity (observed interms of bit rates deployed prudently to the customer base without violating theSLAs). Designing such economically engineered bit rates is based on userbehavior versus the statistical pattern of sharing the associated network resources.Such EEBRs are logically adequate to support statistically-fluctuating traffics andat the same time, economically viable in improvising network resources costeffectively; above all, the customers will remain transparent to the bit rates onply with their SLAs honored effectively.
An illustrative example is furnished (in Appendix 1) to demonstrate the EEBRcomputation when IPTV penetration exists in an xDSL service area. Relevantcalculations lead to an ex ante forecast on EEBRs accomplished using ex postdetails of the loop.
Another example is presented (in Appendix 2) to show how the estimated valuesof EEBR can be profitably utilized in new connection admissions being sought.Using a hypothetical set of details pertinent to an ADSL service area (with no IPTVprovisioned), a numerical example is elaborated to illustrate the connectionadmission procedure.
Input data
Is condition I satisfied?
Is condition II satisfied?
Can BWPHY
increased? Yes
Yes
No
No
No
Yes
Accept user connection request
Input the increased BWPHY
Reject user connection request
Fig. 3 Flow-chart on bandwidth provisioning check when a new user connection request is made
Ex ante forecast on economically engineered bit rates for IPTV 37
Appendix 1
Table 6 Determination of EEBR values for the wire center details furnished in Tables 4 and 5: anumerical spreadsheet
38 P.S. Neelakanta et al.
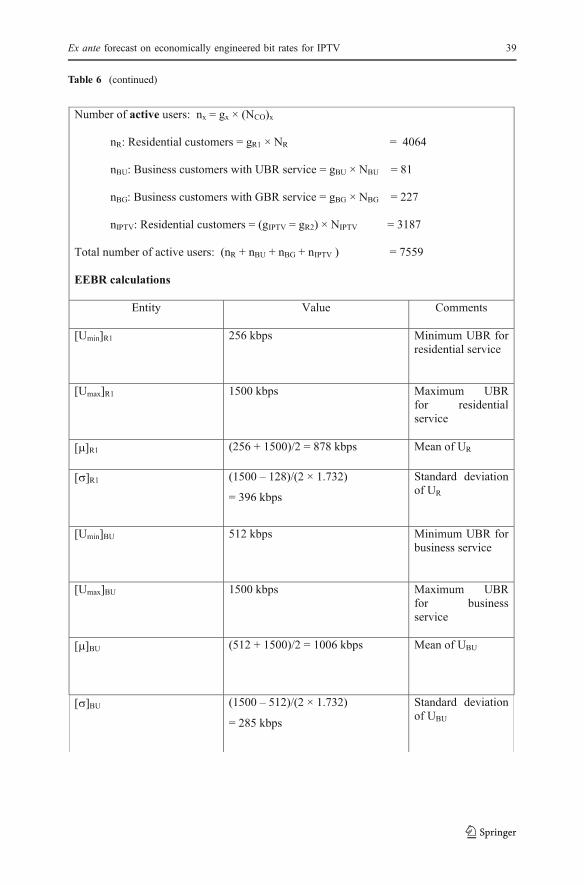
Table 6 (continued)
Ex ante forecast on economically engineered bit rates for IPTV 39
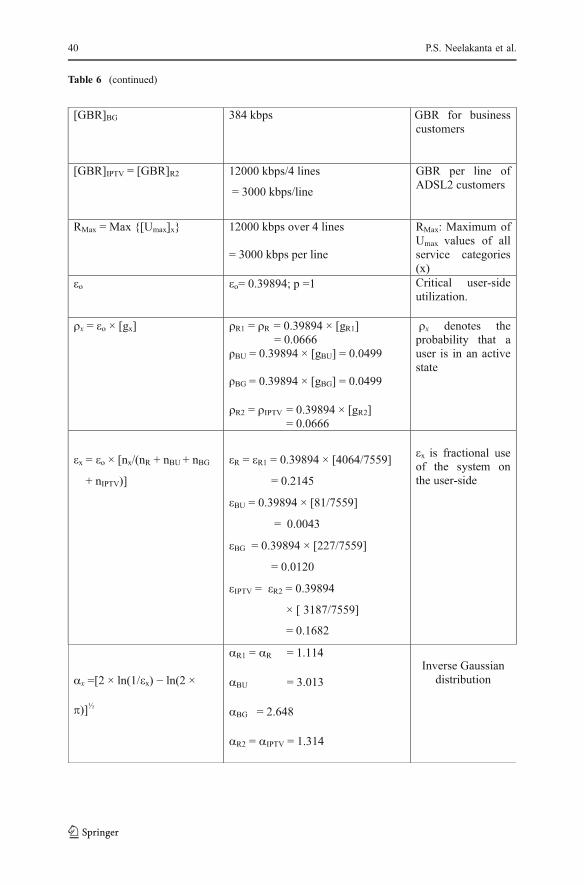
Table 6 (continued)
40 P.S. Neelakanta et al.
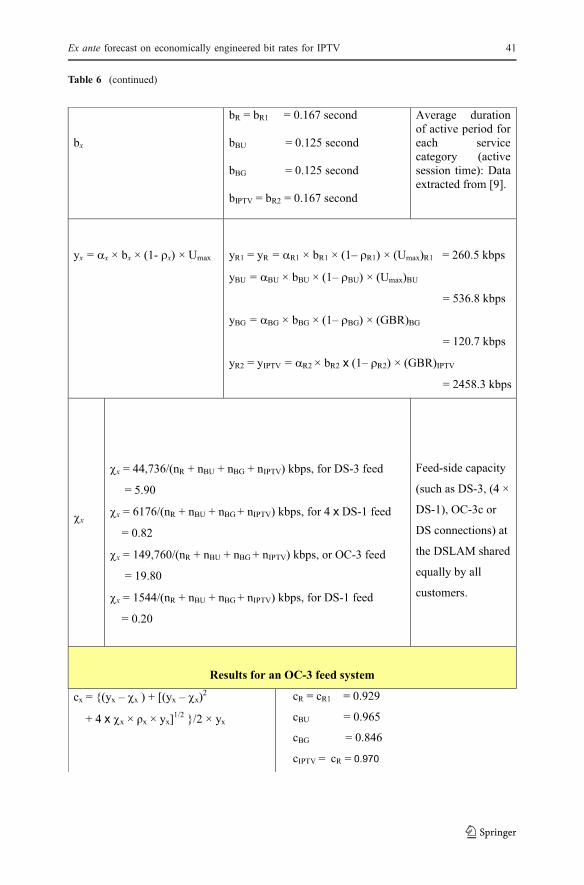
Table 6 (continued)
Ex ante forecast on economically engineered bit rates for IPTV 41
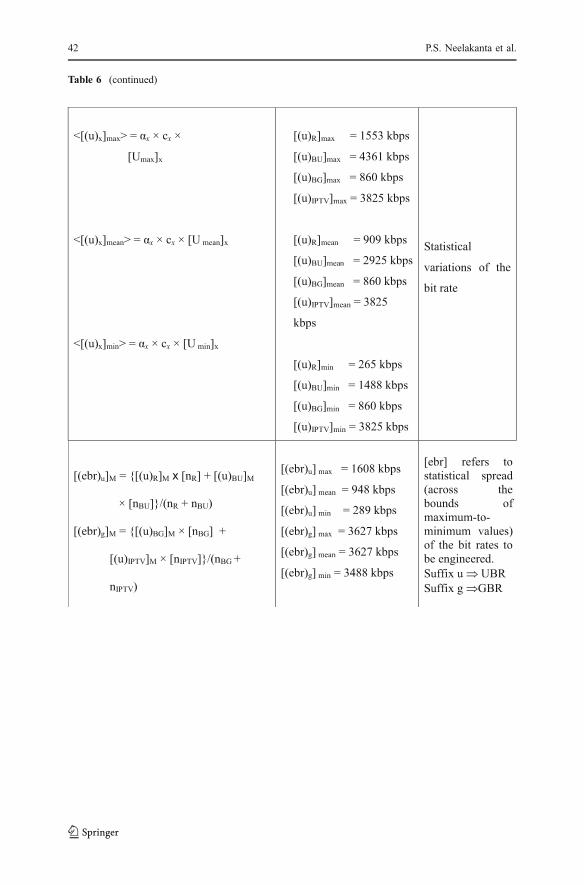
Table 6 (continued)
42 P.S. Neelakanta et al.

Table 6 (continued)
Ex ante forecast on economically engineered bit rates for IPTV 43
Appendix 2
Table 7 New connection admission criteria implementation using EEBR values
44 P.S. Neelakanta et al.
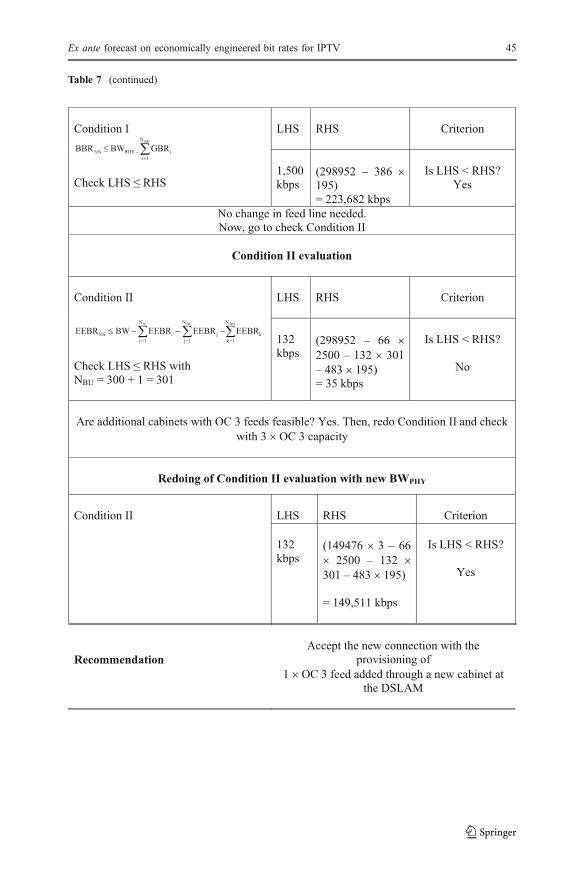
Table 7 (continued)
Ex ante forecast on economically engineered bit rates for IPTV 45
References
1. Bees, D. (2002). Flexible bandwidth services with DSL bonding, PMC-Sierra: Technology WhitePaper (PMC-021395), Issue 1, August.
2. Broadband suite solution series-IPTV. Retrieved January 21, 2008 from http://www.dslforum.org/learndsl/aboutiptv.shtml.
3. FCC data for residential and business ADSL subscribers in the United States. Retrieved August 2006from: http://www.fcc.gov/Bureaus/Common_Carrier/Reports/FCC-State_Link/IAD/trend605.pdf.
4. Haddadzadeh, M. (2006). Preparing the legacy networks for broadband services, Paper presented atAccessNets’06, Athens, Greece, September.
5. Kennedy, B. (2007). The economics of FTTN vs. FTTP. Broadband Properties, 27, 80–82.6. Lichtenecker, K., & Rother, K. (1938). Die Herleitung des logarithmischen Mischungsgesetzes aus
allgemeinen Prinzipien der stationaren Strömung. Physikalische Zeitschrift, 32, 255–260.7. Local Telephone Competition and Broadband Deployment. Retrieved January 21, 2008 from http://
www.fcc.gov/wcb/iatd/comp.html.8. Neelakanta, P. S. (2000). A textbook on ATM telecommunications: Principles and implementation.
Boca Raton, FL: CRC.9. Neelakanta, P. S., & Baeza, D. M. (2002). Arbitrated sharing of traffic in telecommunication
networks: Technoeconomical considerations. Netnomics, 4, 105–129.10. Onvural, R. O. (1995). Asynchronous transfer mode networks: Performance issues. Boston, MA:
Artech House.11. TelcordiaÒ TIRKSÒ CE. Retrieved January 21, 2008 from http://www.telcordia.com/products/tirks/
index.html.12. Tennyson, G. (2002). System and method for estimating the capacity of a local loop to carry data. US
Patent 6,466,647, 15 October 2002.
46 P.S. Neelakanta et al.
Copyright © 2022 FDOKUMEN