An evaluation of the seal capacity and CO2 retention properties of the Eau Claire Formation...
24
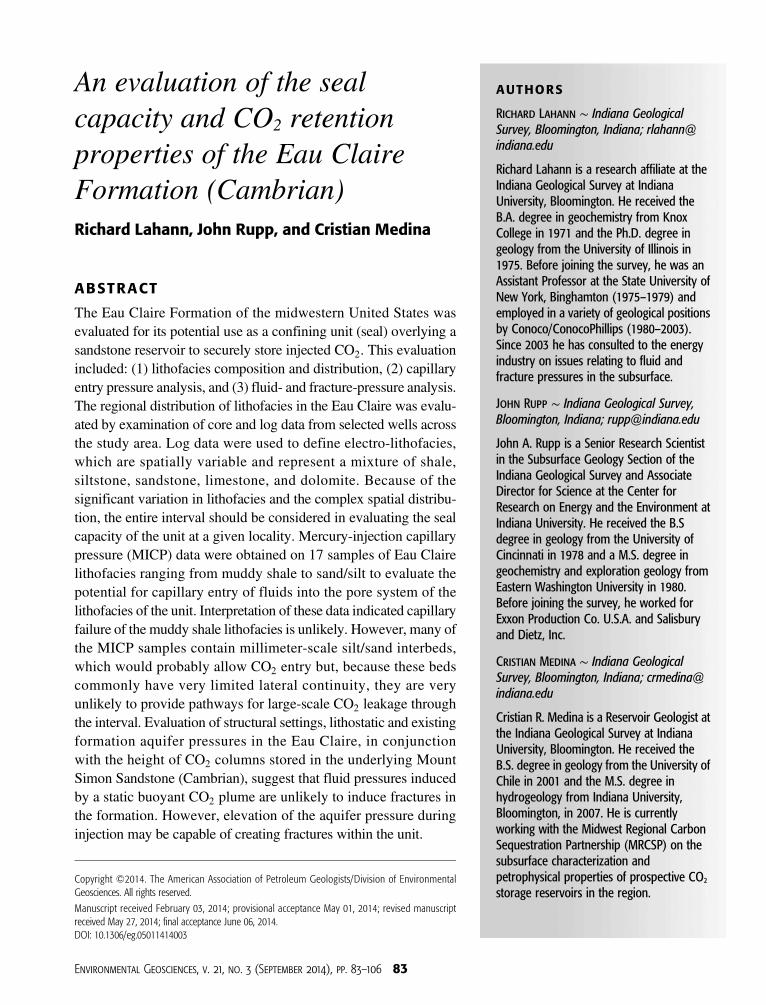
An evaluation of the seal capacity and CO 2 retention properties of the Eau Claire Formation (Cambrian) Richard Lahann, John Rupp, and Cristian Medina ABSTRACT The Eau Claire Formation of the midwestern United States was evaluated for its potential use as a confining unit (seal) overlying a sandstone reservoir to securely store injected CO 2 . This evaluation included: (1) lithofacies composition and distribution, (2) capillary entry pressure analysis, and (3) fluid- and fracture-pressure analysis. The regional distribution of lithofacies in the Eau Claire was evalu- ated by examination of core and log data from selected wells across the study area. Log data were used to define electro-lithofacies, which are spatially variable and represent a mixture of shale, siltstone, sandstone, limestone, and dolomite. Because of the significant variation in lithofacies and the complex spatial distribu- tion, the entire interval should be considered in evaluating the seal capacity of the unit at a given locality. Mercury-injection capillary pressure (MICP) data were obtained on 17 samples of Eau Claire lithofacies ranging from muddy shale to sand/silt to evaluate the potential for capillary entry of fluids into the pore system of the lithofacies of the unit. Interpretation of these data indicated capillary failure of the muddy shale lithofacies is unlikely. However, many of the MICP samples contain millimeter-scale silt/sand interbeds, which would probably allow CO 2 entry but, because these beds commonly have very limited lateral continuity, they are very unlikely to provide pathways for large-scale CO 2 leakage through the interval. Evaluation of structural settings, lithostatic and existing formation aquifer pressures in the Eau Claire, in conjunction with the height of CO 2 columns stored in the underlying Mount Simon Sandstone (Cambrian), suggest that fluid pressures induced by a static buoyant CO 2 plume are unlikely to induce fractures in the formation. However, elevation of the aquifer pressure during injection may be capable of creating fractures within the unit. Copyright ©2014. The American Association of Petroleum Geologists/Division of Environmental Geosciences. All rights reserved. Manuscript received February 03, 2014; provisional acceptance May 01, 2014; revised manuscript received May 27, 2014; final acceptance June 06, 2014. DOI: 10.1306/eg.05011414003 AUTHORS Richard Lahann ∼ Indiana Geological Survey, Bloomington, Indiana; rlahann@ indiana.edu Richard Lahann is a research affiliate at the Indiana Geological Survey at Indiana University, Bloomington. He received the B.A. degree in geochemistry from Knox College in 1971 and the Ph.D. degree in geology from the University of Illinois in 1975. Before joining the survey, he was an Assistant Professor at the State University of New York, Binghamton (1975–1979) and employed in a variety of geological positions by Conoco/ConocoPhillips (1980–2003). Since 2003 he has consulted to the energy industry on issues relating to fluid and fracture pressures in the subsurface. John Rupp ∼ Indiana Geological Survey, Bloomington, Indiana; [email protected] John A. Rupp is a Senior Research Scientist in the Subsurface Geology Section of the Indiana Geological Survey and Associate Director for Science at the Center for Research on Energy and the Environment at Indiana University. He received the B.S degree in geology from the University of Cincinnati in 1978 and a M.S. degree in geochemistry and exploration geology from Eastern Washington University in 1980. Before joining the survey, he worked for Exxon Production Co. U.S.A. and Salisbury and Dietz, Inc. Cristian Medina ∼ Indiana Geological Survey, Bloomington, Indiana; crmedina@ indiana.edu Cristian R. Medina is a Reservoir Geologist at the Indiana Geological Survey at Indiana University, Bloomington. He received the B.S. degree in geology from the University of Chile in 2001 and the M.S. degree in hydrogeology from Indiana University, Bloomington, in 2007. He is currently working with the Midwest Regional Carbon Sequestration Partnership (MRCSP) on the subsurface characterization and petrophysical properties of prospective CO 2 storage reservoirs in the region. Environmental Geosciences, v. 21, no. 3 (September 2014), pp. 83–106 83
-
Upload
independent -
Category
Documents
-
view
1 -
download
0
Transcript of An evaluation of the seal capacity and CO2 retention properties of the Eau Claire Formation...
An evaluation of the sealcapacity and CO2 retentionproperties of the Eau ClaireFormation (Cambrian)Richard Lahann, John Rupp, and Cristian Medina
ABSTRACT
The Eau Claire Formation of the midwestern United States wasevaluated for its potential use as a confining unit (seal) overlying asandstone reservoir to securely store injected CO2. This evaluationincluded: (1) lithofacies composition and distribution, (2) capillaryentry pressure analysis, and (3) fluid- and fracture-pressure analysis.The regional distribution of lithofacies in the Eau Claire was evalu-ated by examination of core and log data from selected wells acrossthe study area. Log data were used to define electro-lithofacies,which are spatially variable and represent a mixture of shale,siltstone, sandstone, limestone, and dolomite. Because of thesignificant variation in lithofacies and the complex spatial distribu-tion, the entire interval should be considered in evaluating the sealcapacity of the unit at a given locality. Mercury-injection capillarypressure (MICP) data were obtained on 17 samples of Eau Clairelithofacies ranging from muddy shale to sand/silt to evaluate thepotential for capillary entry of fluids into the pore system of thelithofacies of the unit. Interpretation of these data indicated capillaryfailure of the muddy shale lithofacies is unlikely. However, many ofthe MICP samples contain millimeter-scale silt/sand interbeds,which would probably allow CO2 entry but, because these bedscommonly have very limited lateral continuity, they are veryunlikely to provide pathways for large-scale CO2 leakage throughthe interval. Evaluation of structural settings, lithostatic and existingformation aquifer pressures in the Eau Claire, in conjunctionwith the height of CO2 columns stored in the underlying MountSimon Sandstone (Cambrian), suggest that fluid pressures inducedby a static buoyant CO2 plume are unlikely to induce fractures inthe formation. However, elevation of the aquifer pressure duringinjection may be capable of creating fractures within the unit.
Copyright ©2014. The American Association of Petroleum Geologists/Division of EnvironmentalGeosciences. All rights reserved.
Manuscript received February 03, 2014; provisional acceptance May 01, 2014; revised manuscriptreceived May 27, 2014; final acceptance June 06, 2014.DOI: 10.1306/eg.05011414003
AUTHORS
Richard Lahann ∼ Indiana GeologicalSurvey, Bloomington, Indiana; [email protected]
Richard Lahann is a research affiliate at theIndiana Geological Survey at IndianaUniversity, Bloomington. He received theB.A. degree in geochemistry from KnoxCollege in 1971 and the Ph.D. degree ingeology from the University of Illinois in1975. Before joining the survey, he was anAssistant Professor at the State University ofNew York, Binghamton (1975–1979) andemployed in a variety of geological positionsby Conoco/ConocoPhillips (1980–2003).Since 2003 he has consulted to the energyindustry on issues relating to fluid andfracture pressures in the subsurface.
John Rupp ∼ Indiana Geological Survey,Bloomington, Indiana; [email protected]
John A. Rupp is a Senior Research Scientistin the Subsurface Geology Section of theIndiana Geological Survey and AssociateDirector for Science at the Center forResearch on Energy and the Environment atIndiana University. He received the B.Sdegree in geology from the University ofCincinnati in 1978 and a M.S. degree ingeochemistry and exploration geology fromEastern Washington University in 1980.Before joining the survey, he worked forExxon Production Co. U.S.A. and Salisburyand Dietz, Inc.
Cristian Medina ∼ Indiana GeologicalSurvey, Bloomington, Indiana; [email protected]
Cristian R. Medina is a Reservoir Geologist atthe Indiana Geological Survey at IndianaUniversity, Bloomington. He received theB.S. degree in geology from the University ofChile in 2001 and the M.S. degree inhydrogeology from Indiana University,Bloomington, in 2007. He is currentlyworking with the Midwest Regional CarbonSequestration Partnership (MRCSP) on thesubsurface characterization andpetrophysical properties of prospective CO2
storage reservoirs in the region.
Environmental Geosciences, v. 21, no. 3 (September 2014), pp. 83–106 83
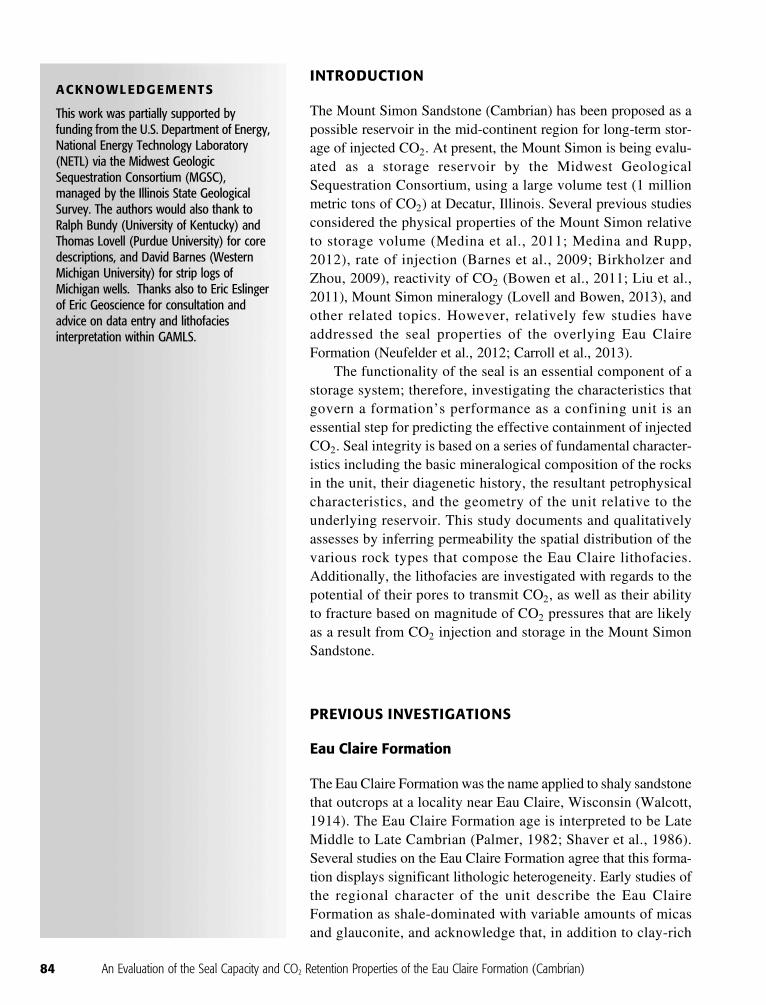
INTRODUCTION
The Mount Simon Sandstone (Cambrian) has been proposed as apossible reservoir in the mid-continent region for long-term stor-age of injected CO2. At present, the Mount Simon is being evalu-ated as a storage reservoir by the Midwest GeologicalSequestration Consortium, using a large volume test (1 millionmetric tons of CO2) at Decatur, Illinois. Several previous studiesconsidered the physical properties of the Mount Simon relativeto storage volume (Medina et al., 2011; Medina and Rupp,2012), rate of injection (Barnes et al., 2009; Birkholzer andZhou, 2009), reactivity of CO2 (Bowen et al., 2011; Liu et al.,2011), Mount Simon mineralogy (Lovell and Bowen, 2013), andother related topics. However, relatively few studies haveaddressed the seal properties of the overlying Eau ClaireFormation (Neufelder et al., 2012; Carroll et al., 2013).
The functionality of the seal is an essential component of astorage system; therefore, investigating the characteristics thatgovern a formation’s performance as a confining unit is anessential step for predicting the effective containment of injectedCO2. Seal integrity is based on a series of fundamental character-istics including the basic mineralogical composition of the rocksin the unit, their diagenetic history, the resultant petrophysicalcharacteristics, and the geometry of the unit relative to theunderlying reservoir. This study documents and qualitativelyassesses by inferring permeability the spatial distribution of thevarious rock types that compose the Eau Claire lithofacies.Additionally, the lithofacies are investigated with regards to thepotential of their pores to transmit CO2, as well as their abilityto fracture based on magnitude of CO2 pressures that are likelyas a result from CO2 injection and storage in the Mount SimonSandstone.
PREVIOUS INVESTIGATIONS
Eau Claire Formation
The Eau Claire Formation was the name applied to shaly sandstonethat outcrops at a locality near Eau Claire, Wisconsin (Walcott,1914). The Eau Claire Formation age is interpreted to be LateMiddle to Late Cambrian (Palmer, 1982; Shaver et al., 1986).Several studies on the Eau Claire Formation agree that this forma-tion displays significant lithologic heterogeneity. Early studies ofthe regional character of the unit describe the Eau ClaireFormation as shale-dominated with variable amounts of micasand glauconite, and acknowledge that, in addition to clay-rich
ACKNOWLEDGEMENTS
This work was partially supported byfunding from the U.S. Department of Energy,National Energy Technology Laboratory(NETL) via the Midwest GeologicSequestration Consortium (MGSC),managed by the Illinois State GeologicalSurvey. The authors would also thank toRalph Bundy (University of Kentucky) andThomas Lovell (Purdue University) for coredescriptions, and David Barnes (WesternMichigan University) for strip logs ofMichigan wells. Thanks also to Eric Eslingerof Eric Geoscience for consultation andadvice on data entry and lithofaciesinterpretation within GAMLS.
84 An Evaluation of the Seal Capacity and CO2 Retention Properties of the Eau Claire Formation (Cambrian)
strata, the Eau Claire Formation is also composed ofsiltstones, sandstones, dolomites, and limestones(Gutstadt, 1958; Becker et al., 1978). Aswasereelertet al. (2008) use core and outcrop samples to describethe Eau Claire Formation in Wisconsin as a regionalaquitard consisting of very fine- to medium-grained,moderately well-sorted, variable feldspathic, glauco-nitic, and dolomitic sandstone with variable amountsof siltstone and mudstone. They also use these litho-logic characteristics along with sedimentary structuresand bedding to define lithofacies as representative ofdepositional environments. In other studies, drillcores and wireline logs from Illinois, Indiana,Kentucky, and Ohio were used to identify a series oflithofacies that occur within the Eau ClaireFormation, including mudstone and siltstone, sand-stone, dolomite, limestone, and predominantly shale(Yawar, 2011; Bandy, 2012; Neufelder et al., 2012).
A general consensus exists that the Eau ClaireFormation could act as the primary seal to preventupward migration of CO2 following injection into theMount Simon Sandstone (Leetaru and McBride,2009; Medina et al., 2011; Medina and Rupp, 2012;Carroll et al., 2013). The regional distribution and thethickness of the Eau Claire, ranging from 100 to 1000feet (ft) (30 to 300 m) in thickness across most of theIllinois basin, make this formation an ideal candidatefor consideration as a sealing unit. In addition to pro-viding a physical barrier to upward migration, geo-chemical and geomechanical studies suggest thatmany shales could also act as reservoirs if geomechan-ical failure occurs (i.e., Couples, 2005; Busch et al.,2008, 2009;Wollenweber et al., 2009; Liu et al., 2011).
Shales as Cap Rocks
GeochemistryBatch and reactive transport modeling using mineral-ogical compositions of the Nordland Shale, the unitthat seals the Sleipner carbon sequestration site(North Sea), suggest that during the initial stages ofCO2 injection, reactions are dominated by calciteand feldspar dissolution. Following that, precipitationof calcium- and iron-bearing minerals occurs, all ofwhich leads to an overall decrease in porosity in thelower parts of the sealing unit (Gaus et al., 2005).Similar models also suggest that carbonate cement
in shales can dissolve and create migration pathwaysfor CO2, but the buffering capacity of carbonatescan also facilitate the long-term mineral trapping ofCO2 (Credoz et al., 2009). However, to better under-stand the storage and sealing capacity of cap rocksand define flow units in large-scale reaction transportmodels, measured values of permeability, porosity,and pore-throat size must be incorporated(McCreesh et al., 1991; Yang and Aplin, 1998;Aguilera, 2002; Cerepi et al., 2002). Numerical andexperimental investigations using samples of shalesexposed to reservoir pressure and temperature condi-tions, along with supercritical CO2 and brine suggestthat carbonate-rich shale and clay-rich shale couldsequester CO2 by precipitation of calcite (Gherardiet al., 2007; Alemu et al., 2011).
Seal IntegrityShales have also been studied in terms of theirmechanical trapping capabilities. An extensive list oftechnical papers from the scientific literature reinfor-ces the importance of evaluating geomechanicalproperties when estimating the sealing capacityof rocks (Grunau, 1987; Rutqvist and Tsang,2002; Hildenbrand et al., 2004; Couples, 2005;Chiquet et al., 2007; Rutqvist et al., 2007; Bolgerand Reifenstuhl, 2008; Angeli et al., 2009; Heathet al., 2011, 2012; Rutqvist, 2012). According toChiquet et al. (2007), leakage of CO2 through thecap rock may occur via capillary breakthrough ofthe CO2 phase and by fracturing of the cap rockresulting from the CO2 injection. Another mechanismis diffusive loss of dissolved gas through the caprock, but this process is very slow and could be ofsignificance only relative to very long-term storagesecurity (Song and Zhang, 2012).
Geological characterization studies of othergeological sequestration sites, including some inthe U.S. Department of Energy Regional CarbonSequestration Partnership projects, have focused onthe cap-rock systems at test injection because this isfundamental for understanding the sealing perfor-mance of cap rocks in CO2 storage systems. For exam-ple, at Cranfield Field in southwest Mississippi, 60 ft(20 m) of core from the heterogeneous middleTuscaloosa Formation (Cretaceous) mudstone wasanalyzed, including petrographic, mineralogical, and
LAHANN ET AL. 85
chemical analyses (scanning electron microscopy,X-ray diffraction, and X-ray fluorescence) to improvethe knowledge of seal performance at this site (Luet al., 2011). In a similar investigation to the work per-formed in the Cranfield study, Divko et al. (2010)investigated the effectiveness of a regional seal(Lakes Entrance Formation, Oligocene, Gippslandbasin, Australia). They used geometry of the seal (thegeographic extent, depth to base, and thickness ofseal), seal capacity (calculated vertical column heightsfrom mercury injection capillary entry pressure[MICP] analysis), and mineralogical composition tocharacterize a unit for geological sequestration.
METHODS
In this investigation, widely available subsurfaceinformation, specifically borehole wireline logs, wereused to characterize the effectiveness of the EauClaire stratigraphic interval as a potential seal overthe underlying Mount Simon reservoir. As logs ofthis type (gamma ray, density, sonic, and neutron)are the most common sources of subsurface informa-tion, the study was designed to calibrate logs usingadvanced lithologic analysis and selected special coreanalyses so that, ultimately, logs alone could be usedto infer sealing capacity of the unit.
Examination of both local and regional variationsin Eau Claire properties demonstrated the importanceof scale in understanding the sealing properties of theEau Claire. Core description, MICP analysis, and logcorrelation/interpretation all operate on differentscales ranging from <1 mm to tens of meters (a 104
range in scale). The information derived from thesedisparate data types were integrated to interpret theoverall effectiveness of the Eau Claire as a seal forCO2 stored in the underlying reservoir.
The assessment of the Eau Claire Formation’sability to prevent upward migration of CO2 from theunderlying Mount Simon Sandstone was divided intothree parts. (1) The lithofacies distribution within theEau Claire was defined both spatially and vertically.(2) The required CO2 fluid pressures necessary to ini-tiate CO2 entry into the Eau Claire were quantified.And (3) the relative likelihood was evaluated thatanticipated CO2 column heights will induce either
capillary entry of CO2 or tensile fracture failure ofthe Eau Claire.
Complementary techniques are available thatcould also be used to assess the sealing capacity of aseal, but were not used in this study. These include(1) petrography of lithofacies to characterize boththe primary and diagenetic petrological character ofa unit (e.g., Neufelder et al., 2012); (2) evaluation ofthe potential reactivity of lithofacies with CO2 in thepresence of native fluids that could result in changesto the petrophysical character of the unit, includingthe potential fixation of CO2 via mineral precipita-tion; and (3) investigation of operationally site-specific CO2-injection pressure dynamics relative toCO2-injection processes.
Lithofacies Analysis
Regional scale variations in the type and organizationof the various lithofacies that occur within the EauClaire were defined using log and core interpretation.The purpose of this effort was to qualitatively identifyand portray the spatial distribution of those facies thatare inferred to have lower permeability (higher CO2
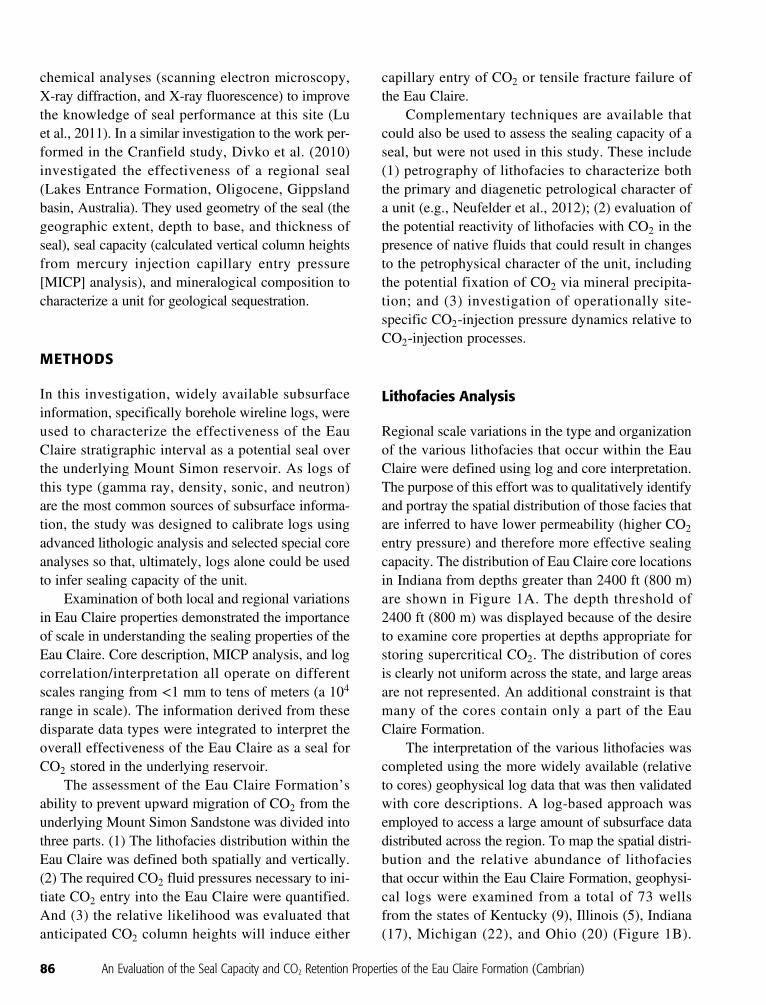
entry pressure) and therefore more effective sealingcapacity. The distribution of Eau Claire core locationsin Indiana from depths greater than 2400 ft (800 m)are shown in Figure 1A. The depth threshold of2400 ft (800 m) was displayed because of the desireto examine core properties at depths appropriate forstoring supercritical CO2. The distribution of coresis clearly not uniform across the state, and large areasare not represented. An additional constraint is thatmany of the cores contain only a part of the EauClaire Formation.
The interpretation of the various lithofacies wascompleted using the more widely available (relativeto cores) geophysical log data that was then validatedwith core descriptions. A log-based approach wasemployed to access a large amount of subsurface datadistributed across the region. To map the spatial distri-bution and the relative abundance of lithofaciesthat occur within the Eau Claire Formation, geophysi-cal logs were examined from a total of 73 wellsfrom the states of Kentucky (9), Illinois (5), Indiana(17), Michigan (22), and Ohio (20) (Figure 1B).
86 An Evaluation of the Seal Capacity and CO2 Retention Properties of the Eau Claire Formation (Cambrian)
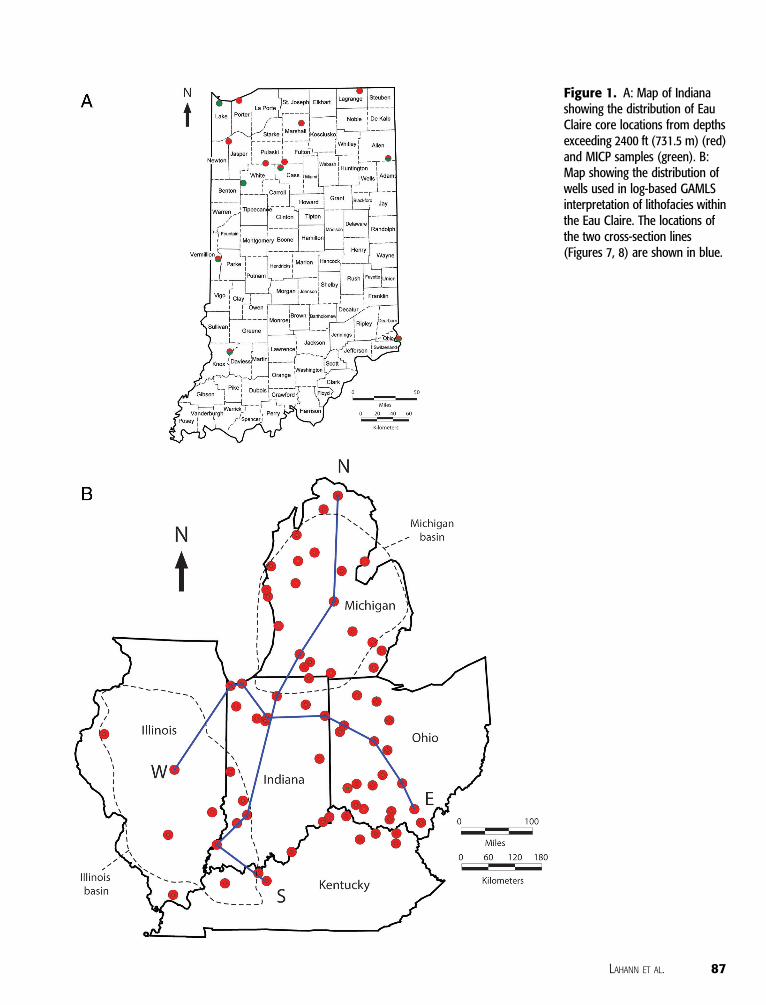
Figure 1. A: Map of Indianashowing the distribution of EauClaire core locations from depthsexceeding 2400 ft (731.5 m) (red)and MICP samples (green). B:Map showing the distribution ofwells used in log-based GAMLSinterpretation of lithofacies withinthe Eau Claire. The locations ofthe two cross-section lines(Figures 7, 8) are shown in blue.
LAHANN ET AL. 87
Wells having log suites used for this analysiswere chosen based on log quality, type, and arealdistribution. The log-based interpretation of lithofacieswas obtained by application of a software program(Geologic Analysis via Maximum Likelihood System[GAMLS], version 3.0.93c, Eric Geoscience, Inc.) thatuses multiple wireline logs from each well to provide aclassification and interpretation of the rock types usinga probabilistic clustering procedure (Eslinger andEverett, 2012).
Only one well from each county was selected forinclusion in the log-based lithofacies study in anattempt to create a regionally representative inter-pretation. Each selected well has a gamma-ray logand at least two porosity-type logs, specificallysonic, density, or neutron logs. Resistivity logs wereevaluated for potential inclusion in the analysis butwere not found to be useful in the interpretation oflithofacies. Many counties were not representedbecause adequate log sets were not available.
Initially, the GAMLS software was used to gen-erate 12 lithofacies for the Eau Claire. These initiallithofacies were subsequently combined into sevenmajor lithofacies: (1) sand/silt; (2) muddy silt/sand;(3) silty/sandy shale; (4) muddy shale; (5) dolomiticshale; (6) muddy dolomite; (7) limestone/dolomite(Figure 2). The combining of lithofacies was doneafter the software processing to limit the number of
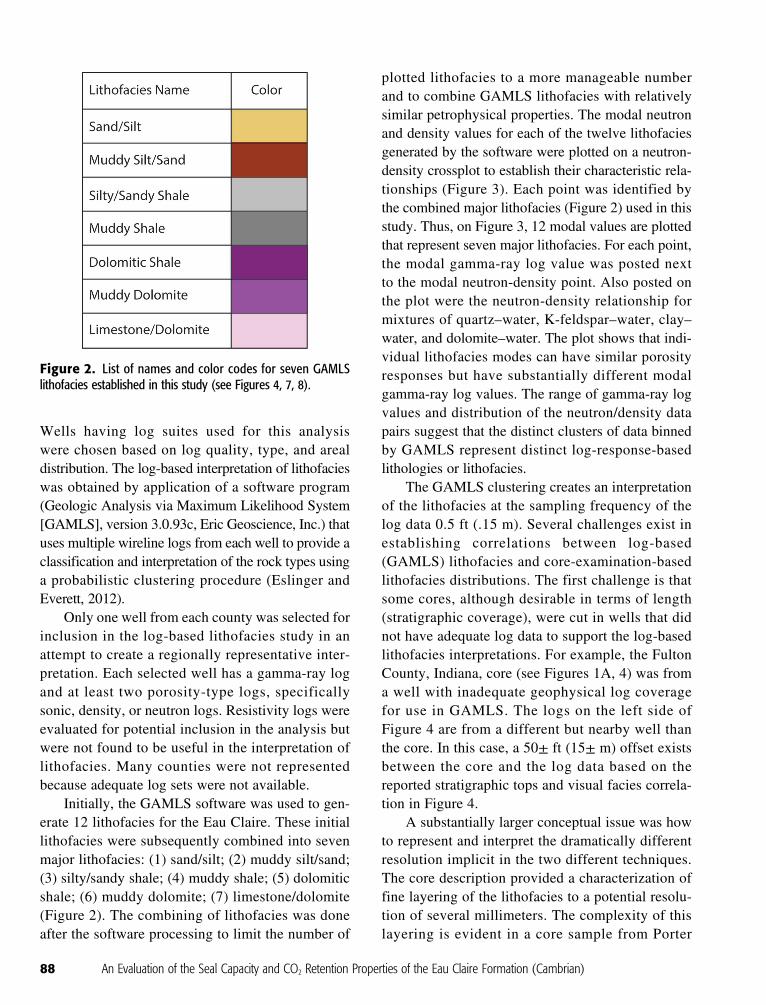
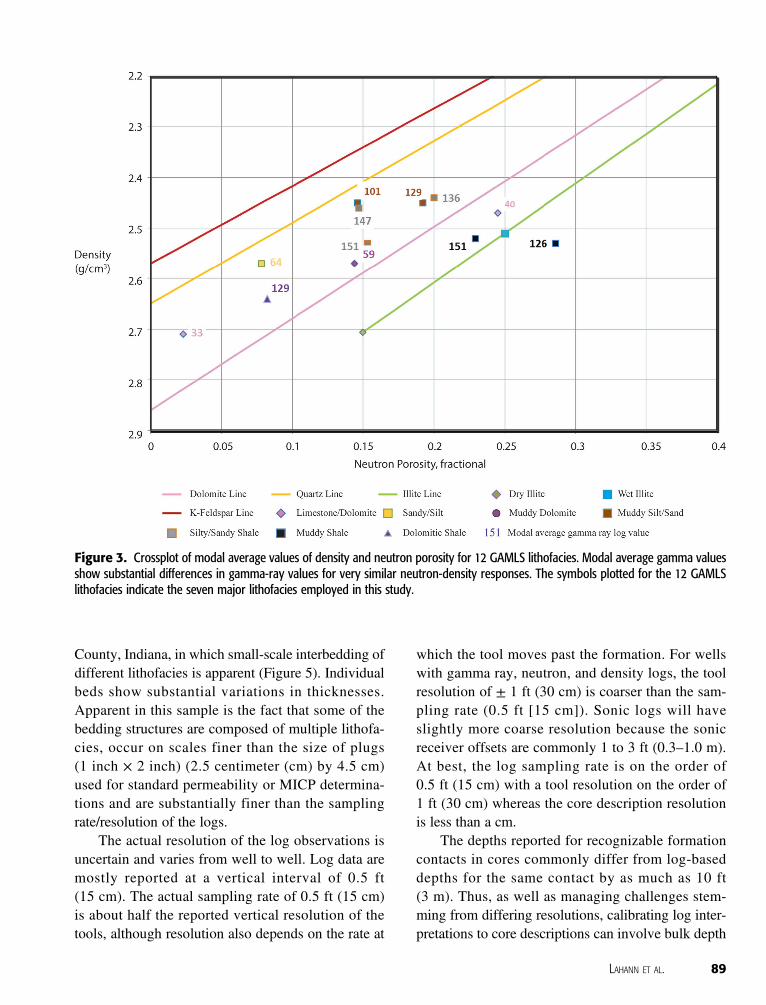
plotted lithofacies to a more manageable numberand to combine GAMLS lithofacies with relativelysimilar petrophysical properties. The modal neutronand density values for each of the twelve lithofaciesgenerated by the software were plotted on a neutron-density crossplot to establish their characteristic rela-tionships (Figure 3). Each point was identified bythe combined major lithofacies (Figure 2) used in thisstudy. Thus, on Figure 3, 12 modal values are plottedthat represent seven major lithofacies. For each point,the modal gamma-ray log value was posted nextto the modal neutron-density point. Also posted onthe plot were the neutron-density relationship formixtures of quartz–water, K-feldspar–water, clay–water, and dolomite–water. The plot shows that indi-vidual lithofacies modes can have similar porosityresponses but have substantially different modalgamma-ray log values. The range of gamma-ray logvalues and distribution of the neutron/density datapairs suggest that the distinct clusters of data binnedby GAMLS represent distinct log-response-basedlithologies or lithofacies.
The GAMLS clustering creates an interpretationof the lithofacies at the sampling frequency of thelog data 0.5 ft (.15 m). Several challenges exist inestablishing correlations between log-based(GAMLS) lithofacies and core-examination-basedlithofacies distributions. The first challenge is thatsome cores, although desirable in terms of length(stratigraphic coverage), were cut in wells that didnot have adequate log data to support the log-basedlithofacies interpretations. For example, the FultonCounty, Indiana, core (see Figures 1A, 4) was froma well with inadequate geophysical log coveragefor use in GAMLS. The logs on the left side ofFigure 4 are from a different but nearby well thanthe core. In this case, a 50± ft (15± m) offset existsbetween the core and the log data based on thereported stratigraphic tops and visual facies correla-tion in Figure 4.
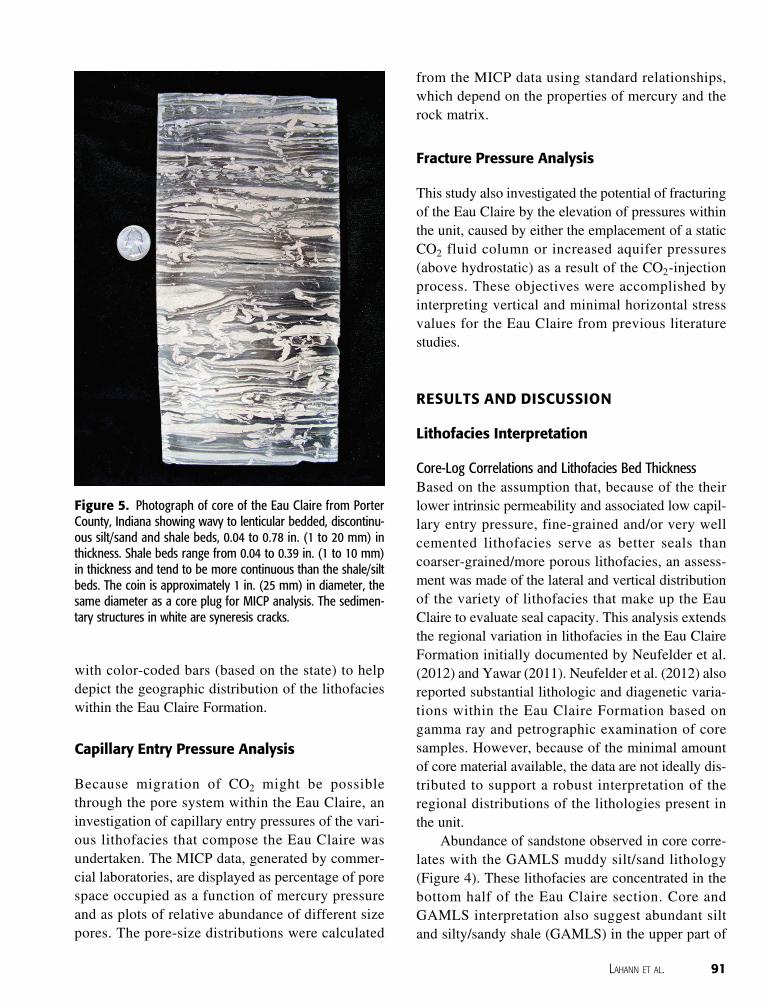
A substantially larger conceptual issue was howto represent and interpret the dramatically differentresolution implicit in the two different techniques.The core description provided a characterization offine layering of the lithofacies to a potential resolu-tion of several millimeters. The complexity of thislayering is evident in a core sample from Porter
Figure 2. List of names and color codes for seven GAMLSlithofacies established in this study (see Figures 4, 7, 8).
88 An Evaluation of the Seal Capacity and CO2 Retention Properties of the Eau Claire Formation (Cambrian)
County, Indiana, in which small-scale interbedding ofdifferent lithofacies is apparent (Figure 5). Individualbeds show substantial variations in thicknesses.Apparent in this sample is the fact that some of thebedding structures are composed of multiple lithofa-cies, occur on scales finer than the size of plugs(1 inch × 2 inch) (2.5 centimeter (cm) by 4.5 cm)used for standard permeability or MICP determina-tions and are substantially finer than the samplingrate/resolution of the logs.
The actual resolution of the log observations isuncertain and varies from well to well. Log data aremostly reported at a vertical interval of 0.5 ft(15 cm). The actual sampling rate of 0.5 ft (15 cm)is about half the reported vertical resolution of thetools, although resolution also depends on the rate at
which the tool moves past the formation. For wellswith gamma ray, neutron, and density logs, the toolresolution of ± 1 ft (30 cm) is coarser than the sam-pling rate (0.5 ft [15 cm]). Sonic logs will haveslightly more coarse resolution because the sonicreceiver offsets are commonly 1 to 3 ft (0.3–1.0 m).At best, the log sampling rate is on the order of0.5 ft (15 cm) with a tool resolution on the order of1 ft (30 cm) whereas the core description resolutionis less than a cm.
The depths reported for recognizable formationcontacts in cores commonly differ from log-baseddepths for the same contact by as much as 10 ft(3 m). Thus, as well as managing challenges stem-ming from differing resolutions, calibrating log inter-pretations to core descriptions can involve bulk depth
Figure 3. Crossplot of modal average values of density and neutron porosity for 12 GAMLS lithofacies. Modal average gamma valuesshow substantial differences in gamma-ray values for very similar neutron-density responses. The symbols plotted for the 12 GAMLSlithofacies indicate the seven major lithofacies employed in this study.
LAHANN ET AL. 89
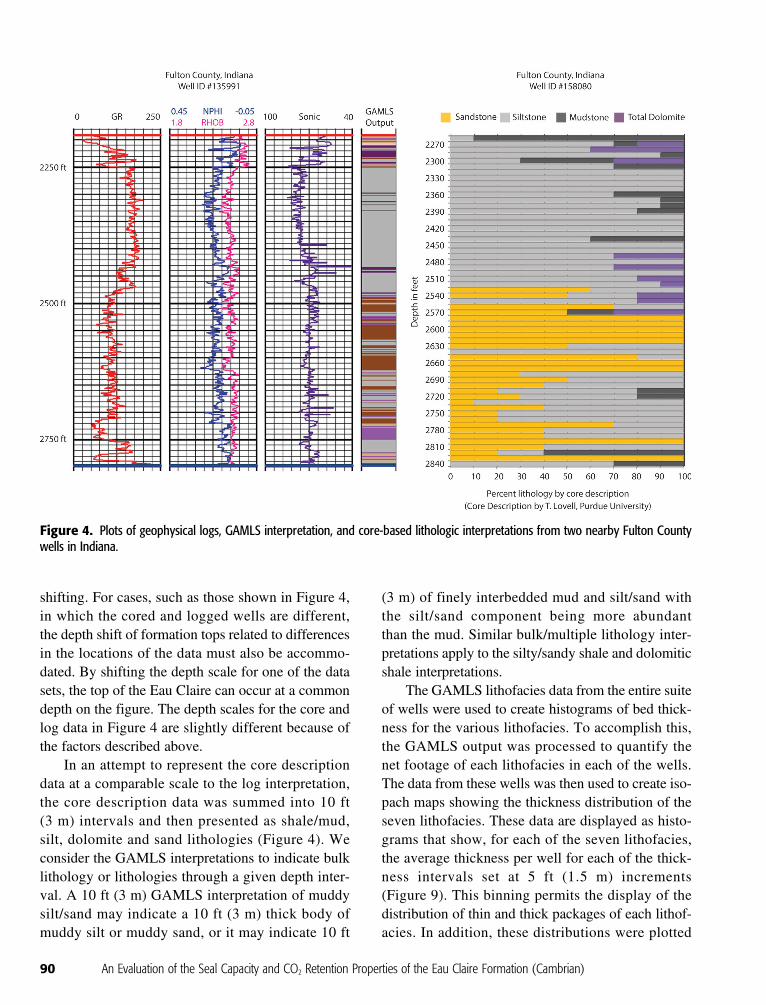
shifting. For cases, such as those shown in Figure 4,in which the cored and logged wells are different,the depth shift of formation tops related to differencesin the locations of the data must also be accommo-dated. By shifting the depth scale for one of the datasets, the top of the Eau Claire can occur at a commondepth on the figure. The depth scales for the core andlog data in Figure 4 are slightly different because ofthe factors described above.
In an attempt to represent the core descriptiondata at a comparable scale to the log interpretation,the core description data was summed into 10 ft(3 m) intervals and then presented as shale/mud,silt, dolomite and sand lithologies (Figure 4). Weconsider the GAMLS interpretations to indicate bulklithology or lithologies through a given depth inter-val. A 10 ft (3 m) GAMLS interpretation of muddysilt/sand may indicate a 10 ft (3 m) thick body ofmuddy silt or muddy sand, or it may indicate 10 ft
(3 m) of finely interbedded mud and silt/sand withthe silt/sand component being more abundantthan the mud. Similar bulk/multiple lithology inter-pretations apply to the silty/sandy shale and dolomiticshale interpretations.
The GAMLS lithofacies data from the entire suiteof wells were used to create histograms of bed thick-ness for the various lithofacies. To accomplish this,the GAMLS output was processed to quantify thenet footage of each lithofacies in each of the wells.The data from these wells was then used to create iso-pach maps showing the thickness distribution of theseven lithofacies. These data are displayed as histo-grams that show, for each of the seven lithofacies,the average thickness per well for each of the thick-ness intervals set at 5 ft (1.5 m) increments(Figure 9). This binning permits the display of thedistribution of thin and thick packages of each lithof-acies. In addition, these distributions were plotted
Figure 4. Plots of geophysical logs, GAMLS interpretation, and core-based lithologic interpretations from two nearby Fulton Countywells in Indiana.
90 An Evaluation of the Seal Capacity and CO2 Retention Properties of the Eau Claire Formation (Cambrian)
with color-coded bars (based on the state) to helpdepict the geographic distribution of the lithofacieswithin the Eau Claire Formation.
Capillary Entry Pressure Analysis
Because migration of CO2 might be possiblethrough the pore system within the Eau Claire, aninvestigation of capillary entry pressures of the vari-ous lithofacies that compose the Eau Claire wasundertaken. The MICP data, generated by commer-cial laboratories, are displayed as percentage of porespace occupied as a function of mercury pressureand as plots of relative abundance of different sizepores. The pore-size distributions were calculated
from the MICP data using standard relationships,which depend on the properties of mercury and therock matrix.
Fracture Pressure Analysis
This study also investigated the potential of fracturingof the Eau Claire by the elevation of pressures withinthe unit, caused by either the emplacement of a staticCO2 fluid column or increased aquifer pressures(above hydrostatic) as a result of the CO2-injectionprocess. These objectives were accomplished byinterpreting vertical and minimal horizontal stressvalues for the Eau Claire from previous literaturestudies.
RESULTS AND DISCUSSION
Lithofacies Interpretation
Core-Log Correlations and Lithofacies Bed ThicknessBased on the assumption that, because of the theirlower intrinsic permeability and associated low capil-lary entry pressure, fine-grained and/or very wellcemented lithofacies serve as better seals thancoarser-grained/more porous lithofacies, an assess-ment was made of the lateral and vertical distributionof the variety of lithofacies that make up the EauClaire to evaluate seal capacity. This analysis extendsthe regional variation in lithofacies in the Eau ClaireFormation initially documented by Neufelder et al.(2012) and Yawar (2011). Neufelder et al. (2012) alsoreported substantial lithologic and diagenetic varia-tions within the Eau Claire Formation based ongamma ray and petrographic examination of coresamples. However, because of the minimal amountof core material available, the data are not ideally dis-tributed to support a robust interpretation of theregional distributions of the lithologies present inthe unit.
Abundance of sandstone observed in core corre-lates with the GAMLS muddy silt/sand lithology(Figure 4). These lithofacies are concentrated in thebottom half of the Eau Claire section. Core andGAMLS interpretation also suggest abundant siltand silty/sandy shale (GAMLS) in the upper part of
Figure 5. Photograph of core of the Eau Claire from PorterCounty, Indiana showing wavy to lenticular bedded, discontinu-ous silt/sand and shale beds, 0.04 to 0.78 in. (1 to 20 mm) inthickness. Shale beds range from 0.04 to 0.39 in. (1 to 10 mm)in thickness and tend to be more continuous than the shale/siltbeds. The coin is approximately 1 in. (25 mm) in diameter, thesame diameter as a core plug for MICP analysis. The sedimen-tary structures in white are syneresis cracks.
LAHANN ET AL. 91
the interval. Dolomitic shale (GAMLS) and dolomite(core examination) are the dominant lithologies nearthe middle and top of the Eau Claire.
Additional core description data were correlatedto GAMLS interpretations and reasonably good cor-relations are observed between lithofacies interpretedby the two methods. Additional comparisons result-ing in reasonable correlations were generated fromwells from Macon County (IL); Jefferson andBoone Counties (KY); Warren and Scioto Counties(OH); and Charlevoix, Cheboygan, Arenac, andKalamazoo Counties (MI).
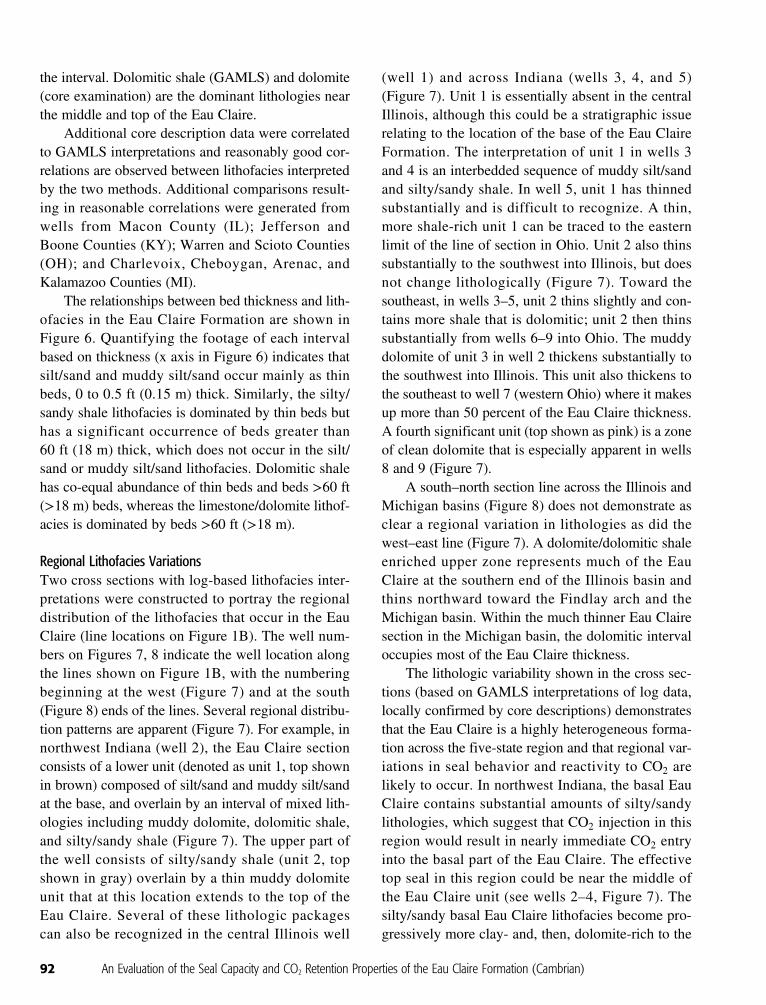
The relationships between bed thickness and lith-ofacies in the Eau Claire Formation are shown inFigure 6. Quantifying the footage of each intervalbased on thickness (x axis in Figure 6) indicates thatsilt/sand and muddy silt/sand occur mainly as thinbeds, 0 to 0.5 ft (0.15 m) thick. Similarly, the silty/sandy shale lithofacies is dominated by thin beds buthas a significant occurrence of beds greater than60 ft (18 m) thick, which does not occur in the silt/sand or muddy silt/sand lithofacies. Dolomitic shalehas co-equal abundance of thin beds and beds >60 ft(>18 m) beds, whereas the limestone/dolomite lithof-acies is dominated by beds >60 ft (>18 m).
Regional Lithofacies VariationsTwo cross sections with log-based lithofacies inter-pretations were constructed to portray the regionaldistribution of the lithofacies that occur in the EauClaire (line locations on Figure 1B). The well num-bers on Figures 7, 8 indicate the well location alongthe lines shown on Figure 1B, with the numberingbeginning at the west (Figure 7) and at the south(Figure 8) ends of the lines. Several regional distribu-tion patterns are apparent (Figure 7). For example, innorthwest Indiana (well 2), the Eau Claire sectionconsists of a lower unit (denoted as unit 1, top shownin brown) composed of silt/sand and muddy silt/sandat the base, and overlain by an interval of mixed lith-ologies including muddy dolomite, dolomitic shale,and silty/sandy shale (Figure 7). The upper part ofthe well consists of silty/sandy shale (unit 2, topshown in gray) overlain by a thin muddy dolomiteunit that at this location extends to the top of theEau Claire. Several of these lithologic packagescan also be recognized in the central Illinois well
(well 1) and across Indiana (wells 3, 4, and 5)(Figure 7). Unit 1 is essentially absent in the centralIllinois, although this could be a stratigraphic issuerelating to the location of the base of the Eau ClaireFormation. The interpretation of unit 1 in wells 3and 4 is an interbedded sequence of muddy silt/sandand silty/sandy shale. In well 5, unit 1 has thinnedsubstantially and is difficult to recognize. A thin,more shale-rich unit 1 can be traced to the easternlimit of the line of section in Ohio. Unit 2 also thinssubstantially to the southwest into Illinois, but doesnot change lithologically (Figure 7). Toward thesoutheast, in wells 3–5, unit 2 thins slightly and con-tains more shale that is dolomitic; unit 2 then thinssubstantially from wells 6–9 into Ohio. The muddydolomite of unit 3 in well 2 thickens substantially tothe southwest into Illinois. This unit also thickens tothe southeast to well 7 (western Ohio) where it makesup more than 50 percent of the Eau Claire thickness.A fourth significant unit (top shown as pink) is a zoneof clean dolomite that is especially apparent in wells8 and 9 (Figure 7).
A south–north section line across the Illinois andMichigan basins (Figure 8) does not demonstrate asclear a regional variation in lithologies as did thewest–east line (Figure 7). A dolomite/dolomitic shaleenriched upper zone represents much of the EauClaire at the southern end of the Illinois basin andthins northward toward the Findlay arch and theMichigan basin. Within the much thinner Eau Clairesection in the Michigan basin, the dolomitic intervaloccupies most of the Eau Claire thickness.
The lithologic variability shown in the cross sec-tions (based on GAMLS interpretations of log data,locally confirmed by core descriptions) demonstratesthat the Eau Claire is a highly heterogeneous forma-tion across the five-state region and that regional var-iations in seal behavior and reactivity to CO2 arelikely to occur. In northwest Indiana, the basal EauClaire contains substantial amounts of silty/sandylithologies, which suggest that CO2 injection in thisregion would result in nearly immediate CO2 entryinto the basal part of the Eau Claire. The effectivetop seal in this region could be near the middle ofthe Eau Claire unit (see wells 2–4, Figure 7). Thesilty/sandy basal Eau Claire lithofacies become pro-gressively more clay- and, then, dolomite-rich to the
92 An Evaluation of the Seal Capacity and CO2 Retention Properties of the Eau Claire Formation (Cambrian)
Figure 6. Histograms of cumulative thickness of beds within bed-thickness windows for the GAMLS lithofacies. Color bars indicate thespatial distribution (by state) of the lithofacies.
LAHANN ET AL. 93
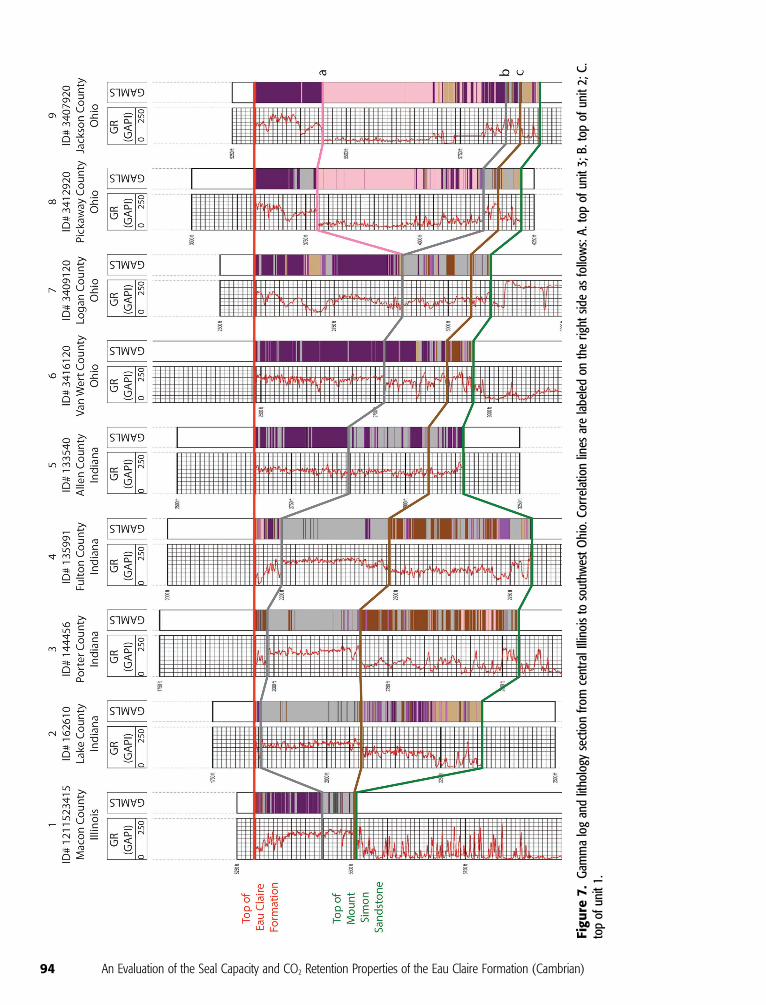
Figu
re7.
Gammalogandlithology
sectionfro
mcentralIllinoisto
southw
estO
hio.Correlationlines
arelabeledon
theright
sideas
follows:A.
topof
unit3;B.topof
unit2;C.
topofunit1.
94 An Evaluation of the Seal Capacity and CO2 Retention Properties of the Eau Claire Formation (Cambrian)
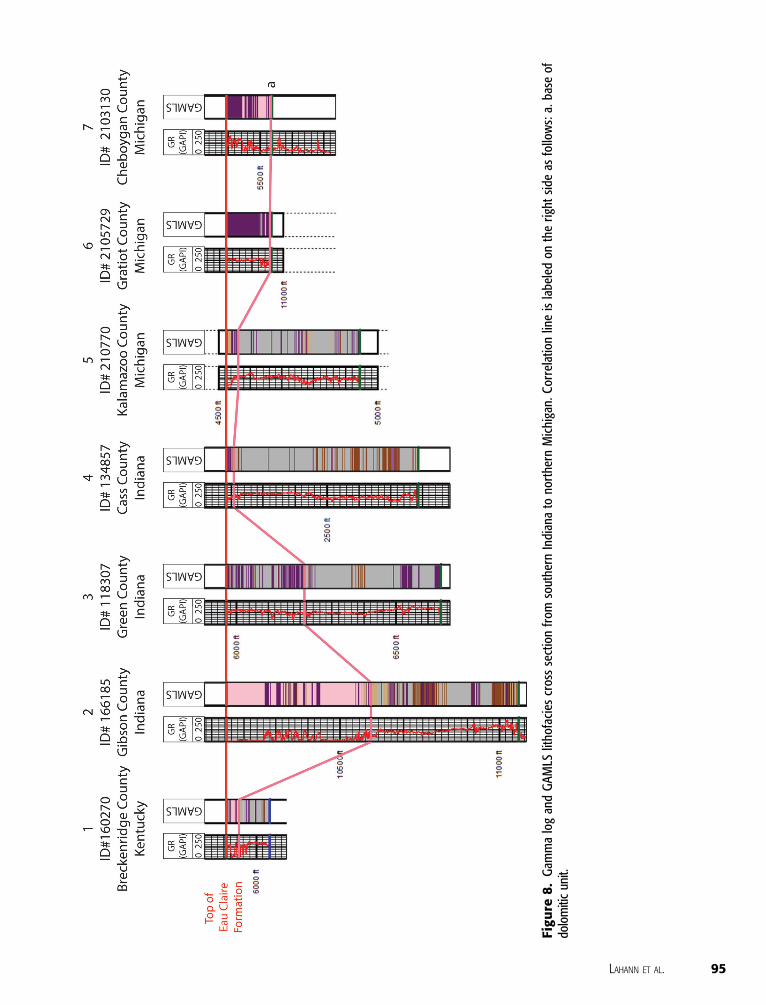
Figu
re8.
GammalogandGA
MLS
lithofacies
crosssectionfrom
southern
Indianato
northern
Michigan.Co
rrelationlineislabeledon
theright
sideas
follows:a.base
ofdolomiticunit.
LAHANN ET AL. 95
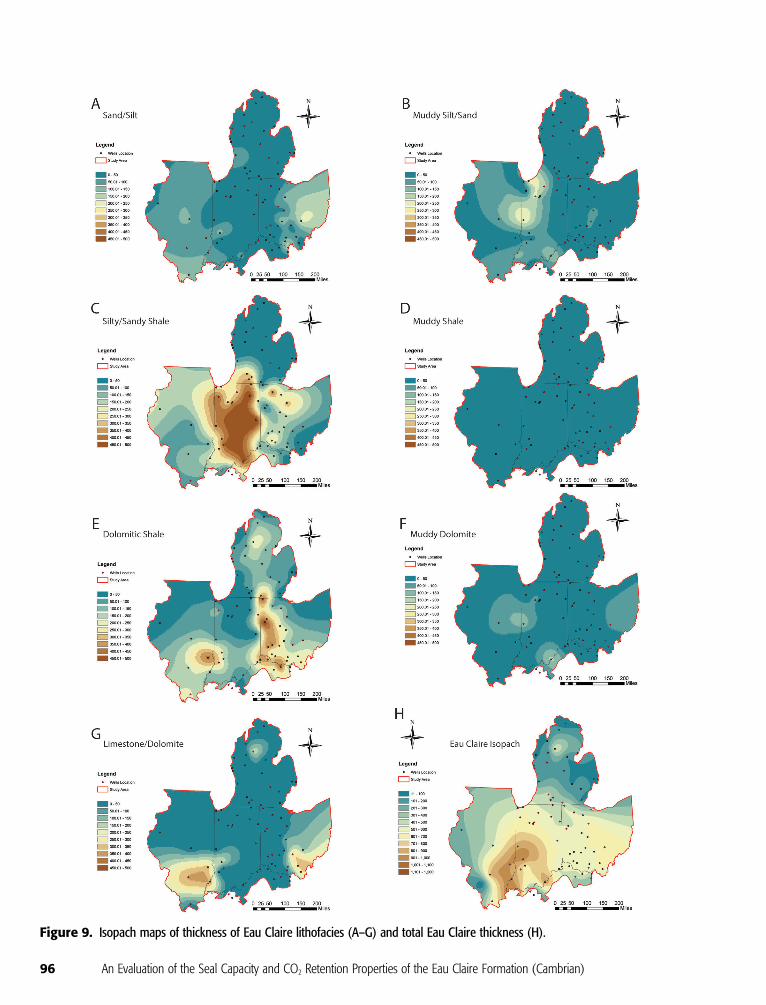
Figure 9. Isopach maps of thickness of Eau Claire lithofacies (A–G) and total Eau Claire thickness (H).
96 An Evaluation of the Seal Capacity and CO2 Retention Properties of the Eau Claire Formation (Cambrian)
west, south, and east from the northwest Indianaregion.
In contrast, central Illinois (well 1, Figure 7), cen-tral and southern Indiana (wells 5–7, Figure 7), andwestern Ohio and southern Michigan wells (wells3–5, Figure 8) have shaly sediments interpreted nearthe top of the Mount Simon Formation. These sedi-ments, depending on the amount of interbedded siltand sand, may be effective top seals for CO2.Isopach maps of the total thickness for the EauClaire interval and for each of the seven GAMLSlithologies were constructed (Figure 9). The totalthickness isopach map shows that the Eau Clairethickens substantially along the southern part of theIndiana–Illinois border (Figure 9H). The formationthins dramatically to the west and north acrossIllinois. The unit also thins from Indiana towardMichigan and does not thicken significantly in theMichigan basin. From Indiana to Ohio, the EauClaire thickness remains relatively constant.
Several of the GAMLS lithofacies display thick-ness patterns that deviate dramatically from the totalEau Claire isopach (Figure 9). The seven lithofaciesare plotted with the same thickness scales. The pre-dominance of brown colors indicates that silty/sandyshales (Figure 9C) are the most abundant lithofacies,followed by dolomitic shale (Figure 9E). The silty/sandy shales are most abundant in Indiana, but theirthickness does not correlate strongly with the overallthickness. The silty/sandy shale lithofacies thins tothe east and west toward Ohio and Illinois. The dolo-mitic shale lithofacies (Figure 9E) thickens along theIndiana–Ohio border as the thickness of the silty/sandy shale decreases. Muddy dolomite also appearsto thicken along the southern Indiana–Illinois border.The limestone/dolomite lithofacies thickens west-ward into Illinois away from the dolomitic shale andeastward in Ohio away from the dolomitic shalethickness trend. These patterns are consistent withthe overall patterns demonstrated in section lines(Figures 7, 8).
CO2 and Capillary Entry
The potential of CO2 entering the pore system of thebasal Eau Claire Formation and the overall function-ality of the unit serving as a top seal can be addressed
by determining CO2 entry pressures. The fracturepressure data suggests that for static CO2 columns,capillary sealing capacity on the order of 100 poundsper square inch (psi; 0.7 MPa) is required to preventCO2 migration out of the Mount Simon Sandstone.
MICP data may be used to assess the thresholdpressure at which mercury begins to enter the poresystem of a given lithofacies. MICP data can also beused to interpret the pore-size distribution in the sam-ple. Generally, rocks having larger (and commonlybetter connected) pores imbibe larger volumes ofnon-wetting fluid at lower pressures and, therefore,exhibit a strongly concave-upward shape to the capil-lary entry pressure curve, especially at high mercurysaturation (Figure 10A). Conversely, fine-grained,lower permeability rocks tend to imbibe non-wettingfluid at higher pressures and have MICP profiles thatare convex-upward at low mercury saturation values(Figure 10A). MICP data can be combined withinformation about CO2 fluid and interfacial propertiesto calculate CO2 entry pressures. The MICP profilesshow that smaller grain sizes (by implication,smaller pore throats) require higher pressure for ini-tial entry of mercury and for any saturation value(Figure 10A). Advanced levels of compaction/cementation can cause sandstone profiles to occurnear the same pressures as observed for shales(Figure 10A).
In an effort to better understand the sealingcapacity (minimum breakthrough pressure) of thevarious fine-grained lithofacies of the Eau Claire, 17samples from the Eau Claire Formation were col-lected for MICP analysis (Figure 10B). The volumeof mercury that entered the sample is expressed as apercentage of pore space versus the mercury pressurerequired to achieve that amount of entry. The samplesdisplay a wide range of entry pressures and a varietyof curve shapes (Figure 10B).
The entry pressure of CO2 equivalent to that ofmercury was evaluated by substituting appropriateCO2 fluid properties for mercury properties into theLaplace equation. Song and Zhang (2012) show arelationship of CO2-brine interfacial tension as afunction of density differential between brine andCO2. Brine density was determined by assuming arange of salinities, depths, and thermal gradientsappropriate for the Illinois basin. CO2 density was
LAHANN ET AL. 97
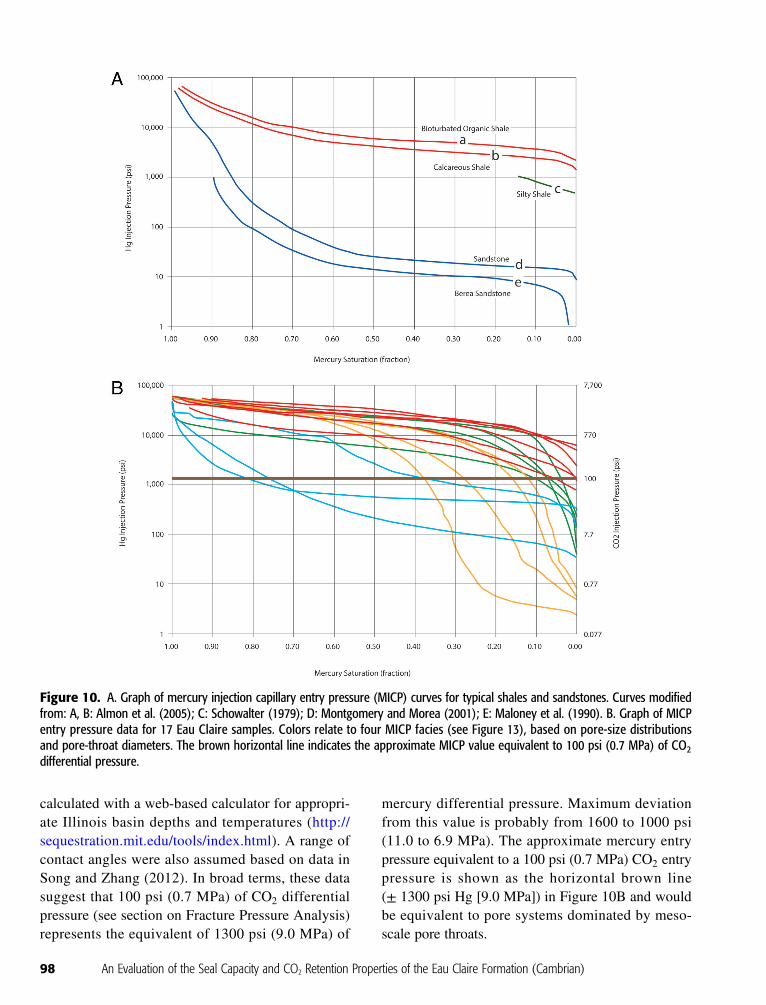
calculated with a web-based calculator for appropri-ate Illinois basin depths and temperatures (http://sequestration.mit.edu/tools/index.html). A range ofcontact angles were also assumed based on data inSong and Zhang (2012). In broad terms, these datasuggest that 100 psi (0.7 MPa) of CO2 differentialpressure (see section on Fracture Pressure Analysis)represents the equivalent of 1300 psi (9.0 MPa) of
mercury differential pressure. Maximum deviationfrom this value is probably from 1600 to 1000 psi(11.0 to 6.9 MPa). The approximate mercury entrypressure equivalent to a 100 psi (0.7 MPa) CO2 entrypressure is shown as the horizontal brown line(± 1300 psi Hg [9.0 MPa]) in Figure 10B and wouldbe equivalent to pore systems dominated by meso-scale pore throats.
Figure 10. A. Graph of mercury injection capillary entry pressure (MICP) curves for typical shales and sandstones. Curves modifiedfrom: A, B: Almon et al. (2005); C: Schowalter (1979); D: Montgomery and Morea (2001); E: Maloney et al. (1990). B. Graph of MICPentry pressure data for 17 Eau Claire samples. Colors relate to four MICP facies (see Figure 13), based on pore-size distributionsand pore-throat diameters. The brown horizontal line indicates the approximate MICP value equivalent to 100 psi (0.7 MPa) of CO2differential pressure.
98 An Evaluation of the Seal Capacity and CO2 Retention Properties of the Eau Claire Formation (Cambrian)
The distribution of data from the 17 MICPexperiments indicates a substantial range in initialentry pressures and in the shapes of the entry pressureprofiles (Figure 10B). This range of responses wascategorized into four MICP facies, which, in turn,can be related to the seven GAMLS lithofacies(Figure 2).
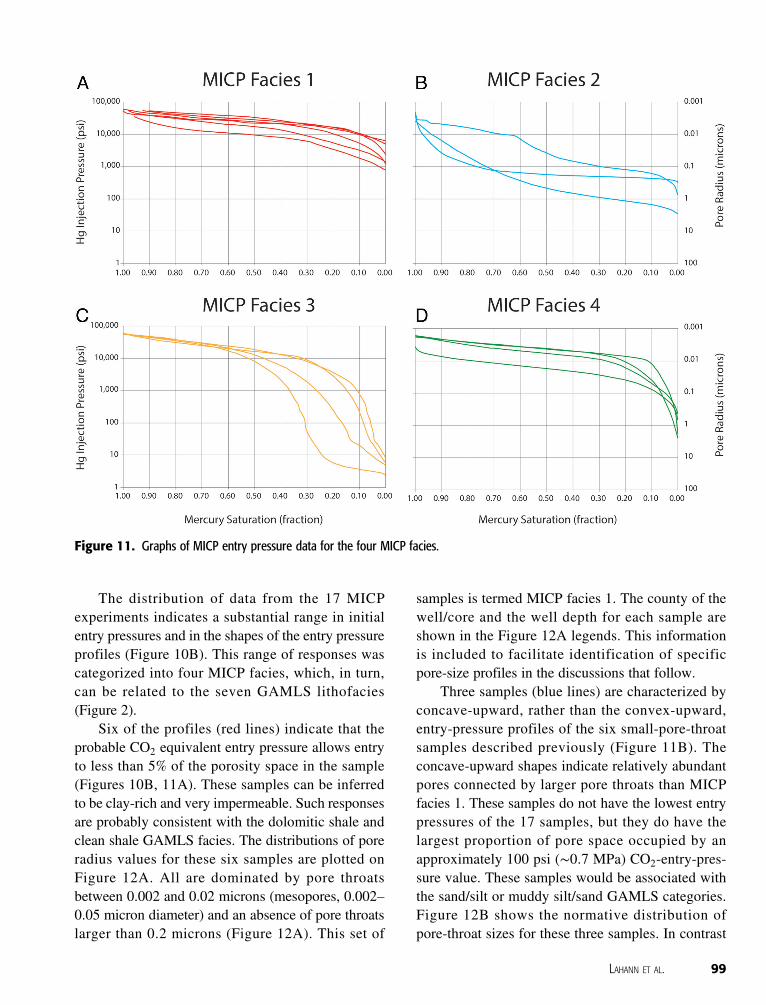
Six of the profiles (red lines) indicate that theprobable CO2 equivalent entry pressure allows entryto less than 5% of the porosity space in the sample(Figures 10B, 11A). These samples can be inferredto be clay-rich and very impermeable. Such responsesare probably consistent with the dolomitic shale andclean shale GAMLS facies. The distributions of poreradius values for these six samples are plotted onFigure 12A. All are dominated by pore throatsbetween 0.002 and 0.02 microns (mesopores, 0.002–0.05 micron diameter) and an absence of pore throatslarger than 0.2 microns (Figure 12A). This set of
samples is termed MICP facies 1. The county of thewell/core and the well depth for each sample areshown in the Figure 12A legends. This informationis included to facilitate identification of specificpore-size profiles in the discussions that follow.
Three samples (blue lines) are characterized byconcave-upward, rather than the convex-upward,entry-pressure profiles of the six small-pore-throatsamples described previously (Figure 11B). Theconcave-upward shapes indicate relatively abundantpores connected by larger pore throats than MICPfacies 1. These samples do not have the lowest entrypressures of the 17 samples, but they do have thelargest proportion of pore space occupied by anapproximately 100 psi (∼0.7 MPa) CO2-entry-pres-sure value. These samples would be associated withthe sand/silt or muddy silt/sand GAMLS categories.Figure 12B shows the normative distribution ofpore-throat sizes for these three samples. In contrast
Figure 11. Graphs of MICP entry pressure data for the four MICP facies.
LAHANN ET AL. 99
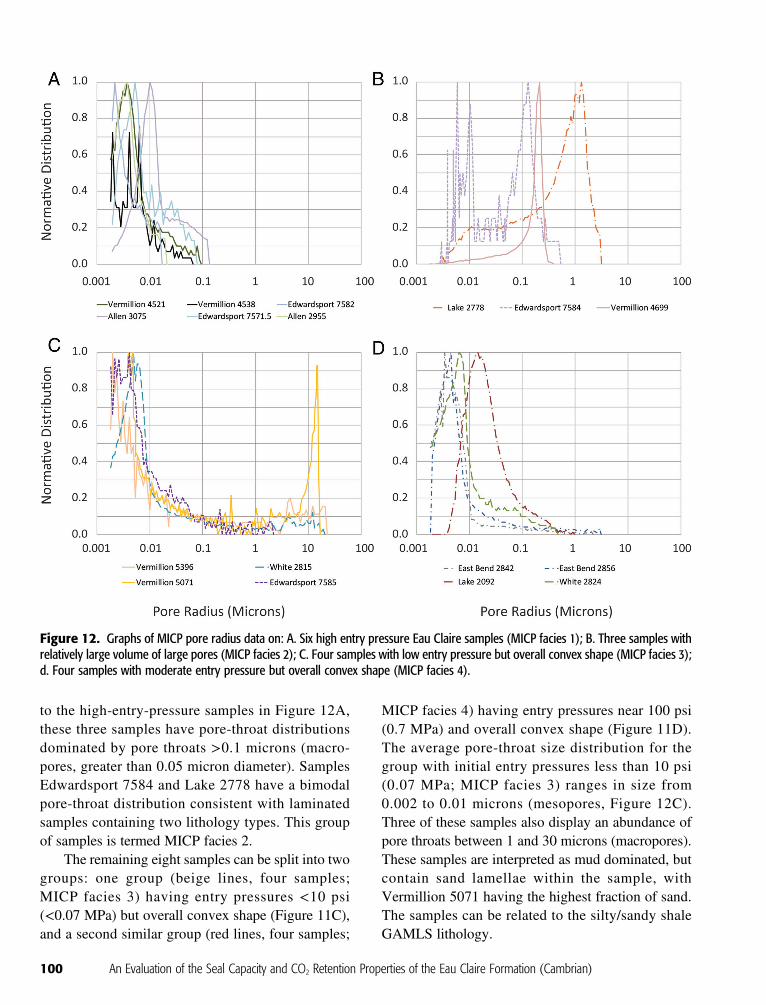
to the high-entry-pressure samples in Figure 12A,these three samples have pore-throat distributionsdominated by pore throats >0.1 microns (macro-pores, greater than 0.05 micron diameter). SamplesEdwardsport 7584 and Lake 2778 have a bimodalpore-throat distribution consistent with laminatedsamples containing two lithology types. This groupof samples is termed MICP facies 2.
The remaining eight samples can be split into twogroups: one group (beige lines, four samples;MICP facies 3) having entry pressures <10 psi(<0.07 MPa) but overall convex shape (Figure 11C),and a second similar group (red lines, four samples;
MICP facies 4) having entry pressures near 100 psi(0.7 MPa) and overall convex shape (Figure 11D).The average pore-throat size distribution for thegroup with initial entry pressures less than 10 psi(0.07 MPa; MICP facies 3) ranges in size from0.002 to 0.01 microns (mesopores, Figure 12C).Three of these samples also display an abundance ofpore throats between 1 and 30 microns (macropores).These samples are interpreted as mud dominated, butcontain sand lamellae within the sample, withVermillion 5071 having the highest fraction of sand.The samples can be related to the silty/sandy shaleGAMLS lithology.
Figure 12. Graphs of MICP pore radius data on: A. Six high entry pressure Eau Claire samples (MICP facies 1); B. Three samples withrelatively large volume of large pores (MICP facies 2); C. Four samples with low entry pressure but overall convex shape (MICP facies 3);d. Four samples with moderate entry pressure but overall convex shape (MICP facies 4).
100 An Evaluation of the Seal Capacity and CO2 Retention Properties of the Eau Claire Formation (Cambrian)
The final sample grouping of four profiles(Figure 12D) displays a similar distribution to MICPfacies 3 but with a higher entry pressure for thesubordinate coarser grained component. This set ofsamples has characteristics that also suggest a mud-dominated lithofacies with interspersed silt lamellae.Three of the four MICP facies 4 samples also haveabundant pore-throat sizes between 0.002 and 0.01microns (mesopores), similar to the mud-dominatedsamples in MICP facies 3. This group of samplescould also be associated with the silty/sandy shaleGAMLS lithology.
Relationship of MICP Facies to GAMLS LithofaciesThe previous discussion infers the ideal circumstancein which a given GAMLS lithofacies can be defini-tively associated with a particular MICP facies. The
identification of a specific GAMLS lithofacies foreach MICP sample is difficult because of the need,in some cases, to correlate from core locationsin one well to a GAMLS interpretation in the nearestwell with appropriate logs. The correlation isalso subject to the issues of scale of resolution.The fact that the bedding resolution is on theorder of centimeters for the MICP samples and ismeters for the GAMLS interpretations is an issue, aswell as the challenges associated with core-log depthshifts.
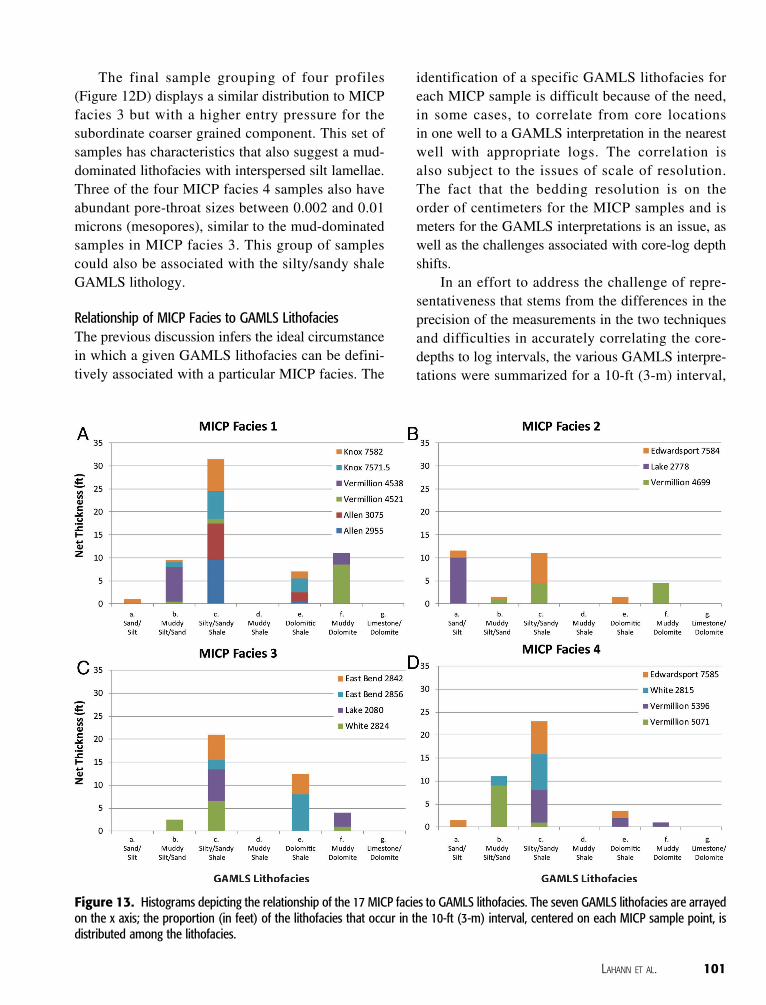
In an effort to address the challenge of repre-sentativeness that stems from the differences in theprecision of the measurements in the two techniquesand difficulties in accurately correlating the core-depths to log intervals, the various GAMLS interpre-tations were summarized for a 10-ft (3-m) interval,
Figure 13. Histograms depicting the relationship of the 17 MICP facies to GAMLS lithofacies. The seven GAMLS lithofacies are arrayedon the x axis; the proportion (in feet) of the lithofacies that occur in the 10-ft (3-m) interval, centered on each MICP sample point, isdistributed among the lithofacies.
LAHANN ET AL. 101
centered on the sample depth for each MICP sample.These summaries of GAMLS interpretations sur-rounding each MICP sample point were then plottedas histograms to show the proportional distributionof lithofacies relative to MICP facies (Figure 13).
For example, MICP facies 1 contained six sam-ples; hence those six samples can be associated with60 ft (18 m) of summarized GAMLS interpretations.In the case of this correlation, four of the six samplesthat were categorized as MICP facies 1 were mostcommonly interpreted by GAMLS to be in the silty/sandy shale lithofacies (Figure 13A). This result isnot altogether surprising because silty/sandy shale isthe most abundant GAMLS facies (Figure 9C).Therefore, proportionately, a preponderance of siltyshale lithofacies occurs in the intervals that surroundfive of the six MICP facies 1 samples. The remainingMICP facies 1 samples were most commonly associ-ated with muddy silt (Vermillion 4538) and muddydolomite (Vermillion 4521). Very few silt/sand orlimestone/dolomite GAMLS interpretations occurin the same interval as entry-pressure samples thatwere interpreted as MICP facies 1 (Figure 13A).This result suggests that the samples that are typifiedby high entry pressure are not limited to theGAMLS distribution of the silty/sandy shale facies,but such behavior can also occur in the muddy/dolo-mitic and muddy silt lithofacies as well and possiblyalso in other mud-dominated, low-permeabilityGAMLS lithofacies.
The GAMLS lithofacies associated with theMICP facies 2 (three samples), the injection facieshaving the most abundant population of large pores,is substantially different from those associated withMICP facies 1 (Figure 13B). For MICP facies 2, theGAMLS silt/sand and silty/sandy shale lithofaciesabundances are very similar. The GAMLS silt/sandlithofacies is substantially better associated withMICP facies 2, despite only half the number ofsamples as MICP facies 1. Similarly, the GAMLSsilt/sand lithofacies is similar in occurrence to thesilty/sand shale, despite having a much lower overallabundance (Figure 9A, C).
MICP facies 3 and 4, interpreted to representmud-dominated lithologies with limited amounts ofclean sand and silt, are associated with severalGAMLS lithofacies, but most commonly with the
silty/sandy shale lithofacies (Figure 13C, D). Thisresult is not surprising given the overall abundanceof the GAMLS silty/sandy lithofacies within the EauClaire. Substantial amounts of these two MICP faciesare also associated with the GAMLS muddy silt/sandand dolomitic shale lithofacies.
Fracture Initiation Pressure
To evaluate the possibility that an increase in pressureof the fluids in the pores could initiate and propagatefractures into the Eau Claire, an analysis wasconducted that used the known hydrostatic pressuregradient, proposed storage depths, and the pressure-dependent density of CO2.
The Illinois basin is currently in a stress configu-ration in which the maximum stress (SHmax) ishorizontal, oriented approximately east-northeast–west-southwest, with the minimum horizontal stress(Shmin) orthogonal to it, also occurring in the hori-zontal plane (Zoback and Zoback, 1989). The verti-cal stress (Sv) is the intermediate stress component.
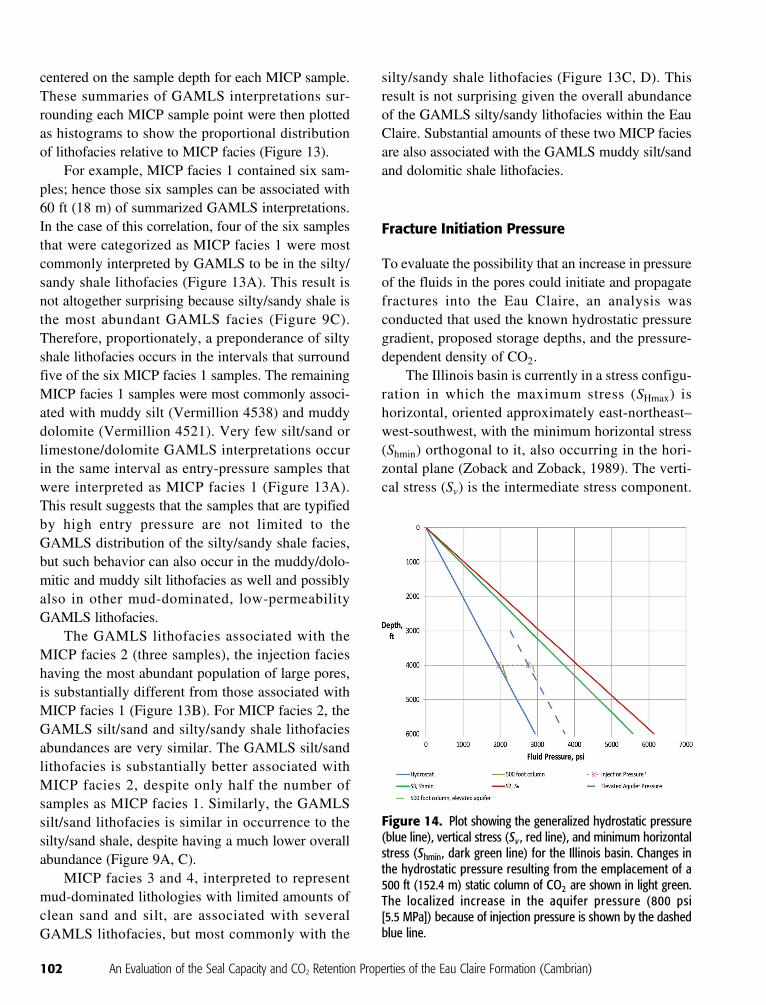
Figure 14. Plot showing the generalized hydrostatic pressure(blue line), vertical stress (Sv , red line), and minimum horizontalstress (Shmin, dark green line) for the Illinois basin. Changes inthe hydrostatic pressure resulting from the emplacement of a500 ft (152.4 m) static column of CO2 are shown in light green.The localized increase in the aquifer pressure (800 psi[5.5 MPa]) because of injection pressure is shown by the dashedblue line.
102 An Evaluation of the Seal Capacity and CO2 Retention Properties of the Eau Claire Formation (Cambrian)
Goodarzi et al. (2011) and Lucier et al. (2006)provide regional estimates of the magnitude of theminimum and maximum stresses (both horizontal).Structures located within the Illinois basin thatpotentially could be targeted for CO2 storage havestructural relief on the order of several hundred -feet, up to a maximum of 500 ft (160 m). Thatvalue implies that the tallest CO2 fluid columns, ifstructurally controlled, would be no greater than500 ft (160 m).
Figure 14 contains a depiction of the relationshipof pressure with depth for a representative hydrostaticpressure curve (the hydrostat; dark blue line), plottedalong with Sv (red line) and Shmin (dark green line)for the Illinois basin. Also plotted on this figure isthe expected pressure profile caused by the emplace-ment of a 500 ft (160 m) static column of CO2 withina structure, the base of which occurs at 4500 ft(1400 m, light green lines). The elevation in fluidpressure within the CO2 column, relative to thehydrostat profile, is very small and the CO2 columnpressure does not approach the fluid pressure thatwould be required to initiate fracture of the seal(>Shmin) (Figure 14).
In addition to the increase in fluid pressurecaused by the emplacement of the CO2 column, theprocess of injecting CO2 can also be expected toincrease the fluid pressure in the aquifer near theinjection well, at least temporarily, during the injec-tion process. Based on industry practices for injectionwells in the region, an 800 psi (5.5 MPa) increase inaquifer pressure because of injection was chosen(Kim, 2013). This increase in the aquifer pressure sig-nificantly moves the aquifer pressure closer to theShmin pressure (dashed blue line on Figure 14).
A comparison of the increases in fluid pressurescaused by the static column CO2 fluid with the local-ized elevation of the aquifer pressure, proximal to thewellbore, caused by injection, suggests that any sig-nificant elevation of the fluid pressure is more likelyto be created by the injection process rather than bythe CO2 storage process. Therefore, the potential fora significant localized elevation of the aquifer pres-sure associated with injection activities suggests thatboth the fluid pressure of the aquifer and the injectionpressure of the CO2 should be monitored during theoperation of the injection well.
The localized increase in the aquifer pressurebecause of the injection process is likely to be moreimportant if local fractures or fault zones are present.If present, the aquifer pressure required to reactivateexisting fractures or faults would most likely be lowerthan the pressure required to initiate new fractures(Shmin in Figure 14). Hence, any injection activitiesshould be sited to avoid interactions with knownexisting fractures or faults.
CONCLUSIONS
Based on the analyses completed in this investigationwe have concluded the following:
• Various types of geophysical log data, inte-grated with core descriptions, were processedby GAMLS, software that classifies and inter-prets rock types from wireline logs using aprobabilistic clustering procedure, to success-fully represent the Eau Claire formation as aseries of twelve distinct lithofacies. TheseGAMLS lithofacies were reduced to seven lith-ofacies that were interpreted in a suite of 73wells in the study area. Lithofacies 1 and 2(sand/silt and muddy silt/sand, respectively)were interpreted to have some permeability butthe abundances of these lithofacies are rela-tively small in wells from the study area. Thepresence of these lithofacies would allow foran upward flow into the seal of a part of theCO2, adding some additional storage volumeto the system.
• GAMLS interpretations indicate that the lithof-acies present in the basal part of the Eau Clairevaries dramatically across the five state regionof the study. In northwest Indiana, the basalEau Claire contains substantial amounts ofsand/silt and muddy silt/sand (lithofacies 1 and2, respectively) lithologies that could allow theentry of CO2 into the Eau Claire Formation.However, these lithologies are capped in thisarea by abundant facies dominated by thicksequences of silty/sandy shale (lithofacies 3),which are characterized by high MICP entrypressure (mesopores). The muddy silt/sand inthe basal Eau Claire becomes progressivelymore clay- and then, dolomite-rich to the west,south and east of this region, specifically in
LAHANN ET AL. 103
southeast Illinois, and west of Ohio, along theCincinnati arch.
• The integration of GAMLS lithofacies charac-terization and MICP analysis indicates thatintervals with silty/sandy shale lithofacies,which correlates with overall high MICP butrelatively low initial entry pressures (macro-pores), may allow limited CO2 entry. Intervalsthat contain mud-dominated lithofacies, withcorrespondingly overall high MICP entry pres-sures (mesopores), will prevent significantCO2 entry in the pore system of the seal. Thissuggests that in considering the thickness ofhigh MICP entry pressure facies, the sealingcapacity of the Eau Claire Formation displaysits highest potential in north central Michigan,all through Indiana, western Ohio, and south-east Illinois. However, more studies are neces-sary that include other variables such asinjection viability in areas of considerable depth(i.e., southeast Illinois and southwest Indiana)or, conversely, shallower areas along theCincinnati arch, which do not meet the mini-mum depth criteria for injection of supercriticalCO2.
• MICP analyses confirm that parts of the silty/sandy lithofacies of the Eau Claire will poten-tially allow significant amounts of CO2 to enterinto the pore system, assuming increases in porepressures associated with CO2 column heightsof approximately 500 ft (160 m). For the inter-mediate grain-size clastic rock samples exam-ined by MICP analysis, the maximum CO2saturation could be up to 75% of pore space.For clean sandstones, this value is expected tobe even higher. Therefore, in regions with abun-dant silty/sandy lithologies (e.g., northwesternIndiana), significant vertical penetration ofCO2 into the Eau Claire is possible. UltimateCO2 trapping in this region would rely on thepresence of significant amounts of mud-richlithofacies within the vertical sequence ofthe unit.
• MICP analyses confirm that silty/sandy shalelithofacies will allow minor CO2 entry, but theamount of CO2 entry into the unit will be limitedby the lateral continuity of this lithofacies. Inmany cases, this lithofacies occurs as thinlyinterbedded sequences that may not have the lat-eral continuity needed to form an effective seal.
• MICP analyses confirm that mud-dominatedlithofacies will not allow CO2 entry into thepore system of the unit, assuming the increasein pore pressures expected with the storage ofa 500 ft (152 m) column of CO2.
• Regional seal evaluation of the Eau ClaireFormation should include models that capturethe potential for limited CO2 entry and associ-ated trapping, albeit limited, within coarse-grained and permeable lithofacies in the EauClaire Formation.
• The vertical height of the CO2 liquid columnheld in a structural trap places limitations onthe magnitude of the additional static fluid pres-sures that will be created by CO2 storage.Within the Illinois basin, the pressures impartedby the static CO2 accumulations are unlikely toapproach fracture pressures for the Eau ClaireFormation unless those accumulations aredirectly associated with existing fracture or faultsystems (which would facilitate CO2 escape atsignificantly lower injection pressures).
• The pressure dynamics associated with theprocess of injection of CO2, compounded withincreases in fluid pressure imparted by a staticcolumn of CO2, creates a higher risk forapproaching fracture pressure of the seal. Thisfact should be taken into consideration duringsite selection and operation of a CO2 storagefield. Both the pressure near the wellborecaused by the injection process, and the moredistal pressure increases within the top of thereservoir should be monitored to effectivelymanage the pressure and preclude seal fractur-ing. Increased aquifer pressure because of injec-tion activities will probably be a transientphenomenon that dissipates after injection hasceased. Care should also be taken during siteselection to avoid active fracture/fault systemsbecause of their substantially lower entrypressures.
REFERENCES CITED
Aguilera, R., 2002, Incorporating capillary pressure, pore throataperture radii, height above free-water table, and Winlandr35 values on Pickett plots: AAPG Bulletin, v. 86, no. 4,p. 605–624.
Alemu, B. L., P. Aagaard, I. A. Munz, and E. Skurtveit, 2011,Caprock interaction with CO2: A laboratory study of
104 An Evaluation of the Seal Capacity and CO2 Retention Properties of the Eau Claire Formation (Cambrian)
reactivity of shale with supercritical CO2 and brine: AppliedGeochemistry, v. 26, no. 12, p. 1975–1989, doi: 10.1016/j.apgeochem.2011.06.028.
Almon, W. R., W. C. Dawson, F. G. Ethridge, E. Rietsch, S. J.Sutton, and B. Castelblanco-Torres, 2005, Sedimentologyand petrophysical character of Cretaceous marine shalesequences in foreland basins—Potential seismic responseissues, in P. Boult and J. Kaldi, eds., Evaluating fault andcap rock seals: AAPG Hedberg Series 2, p. 215–235.
Angeli, M., M. Soldal, E. Skurtveit, and E. Aker, 2009,Experimental percolation of supercritical CO2 through a cap-rock: Energy Procedia, v. 1, no. 1, p. 3351–3358, doi: 10.1016/j.egypro.2009.02.123.
Aswasereelert, W., J. A. Simo, and D. L. LePain, 2008,Deposition of the Cambrian Eau Claire Formation,Wisconsin: Hydrostratigraphic implications of fine-grainedcratonic sandstones: Wisconsin Geological and NaturalHistory Survey, Geoscience Wisconsin, v. 19, pt. 1, 22 p.
Bandy, R. E., III, 2012, Geology of the Eau Claire Formation andConasauga Group in part of Kentucky and analysis of theirsuitability as caprocks for deeper CO2 sequestration: Thesisand Dissertations, Earth and Environmental Sciences,Paper 8, 155 p. http://uknowledge.uky.edu/ees_etds/8.
Barnes, D. A., D. H. Bacon, and S. R. Kelley, 2009, Geologicalsequestration of carbon dioxide in the Cambrian MountSimon Sandstone: Regional storage capacity, site characteri-zation, and large-scale injection feasibility, Michigan Basin:Environmental Geosciences, v. 16, no. 3, p. 163–183, doi:10.1306/eg.05080909009.
Becker, L. E., A. J. Hreha, and T. A. Dawson, 1978, Pre-Knox(Cambrian) stratigraphy in Indiana: Indiana GeologicalSurvey Bulletin, v. 57, 72 p.
Birkholzer, J. T., and Q. Zhou, 2009, Basin-scale hydrogeologicimpacts of CO2 storage: Capacity and regulatory implica-tions: International Journal of Greenhouse Gas Control,v. 3, no. 6, p. 745–756.
Bolger, G. W., and R. R. Reifenstuhl, 2008, Mercury injectioncapillary pressure and reservoir seal capacity of 26 outcropsamples, Miocene to Triassic Age: Alaska Division ofGeological & Geophysical Surveys, Report of Investigation1D, p. 69–78.
Bowen, B. B., R. Ochoa, N. D. Wilkens, J. Brophy, T. R. Lovell,N. E. Fischietto, C. Medina, and J. Rupp, 2011, Depositionaland diagenetic variability within the Cambrian MountSimon Sandstone: Implications for carbon dioxide seques-tration: Environmental Geosciences, v. 18, no. 2, p. 69–89.
Busch, A., S. Alles, Y. Gensterblum, D. Prinz, D. N. Dewhurst,M. D. Raven, H. Stanjek, and B. M. Krooss, 2008, Carbondioxide storage potential of shales: International Journal ofGreenhouse Gas Control, v. 2, no. 3, p. 297–308, doi: 10.1016/j.ijggc.2008.03.003.
Busch, A., S. Alles, B. M. Krooss, H. Stanjek, and D. Dewhurst,2009, Effects of physical sorption and chemical reactions ofCO2 in shaly caprocks: Energy Procedia, v. 1, no. 1,p. 3229–3235, doi: 10.1016/j.egypro.2009.02.107.
Carroll, S. A., W. W. McNab, Z. Dai, and S. C. Torres, 2013,Reactivity of Mount Simon Sandstone and the Eau ClaireShale under CO2 storage conditions: EnvironmentalScience & Technology, v. 47, p. 252–261.
Cerepi, A., C. Durand, and E. Brosse, 2002, Pore microgeometryanalysis in low-resistivity sandstone reservoirs: Journalof Petroleum Science and Engineering, v. 35, no. 3–4,p. 205–232, doi: 10.1016/S0920-4105(02)00244-9.
Chiquet, P., D. Broseta, and S. Thibeau, 2007, Wettability altera-tion of caprock minerals by carbon dioxide: Geofluids, v. 7,no. 2, p. 112–122, doi: 10.1111/gfl.2007.7.issue-2.
Couples, G. D., 2005, Seals: The Role of Geomechanics, inP. Boult, ed., Evaluating fault and cap rock seals: AAPGHedberg Series 2, p. 87–108.
Credoz, A., O. Bildstein, M. Jullien, J. Raynal, J. C. Pétronin,M. Lillo, C. Pozo, and G. Geniaut, 2009, Experimental andmodeling study of geochemical reactivity between clayeycaprocks and CO2 in geological storage conditions: EnergyProcedia, v. 1, no. 1, p. 3445–3452, doi: 10.1016/j.egypro.2009.02.135.
Divko, L. G., J. Hamilton, and G. W. O’Brian, 2010, Evaluationof the regional top seal for the purpose of geologic seques-tration in the Gippsland Basin, southeastern Australia:American Association of Petroleum Geologists, Search andDiscovery Article #80099.
Eslinger, E., and R. Everett, 2012, Petrophysics in gas shales, inJ. A. Breyer, ed., Shale Reservoirs—Giant Resourcesfor the 21st Century: AAPG Memoir 97, chapter 14,p. 419–451.
Gaus, I., M. Azaroual, and I. Czernichowski-Lauriol, 2005,Reactive transport modelling of the impact of CO2 injectionon the clayey cap rock at Sleipner (North Sea): ChemicalGeology, v. 217, no. 3–4p. .
Gherardi, F., T. F. Xu, and K. Pruess, 2007, Numerical modelingof self-limiting and self-enhancing caprock alterationinduced by CO2 storage in a depleted gas reservoir:Chemical Geology, v. 244, no. 1–2, p. 103–129, doi: 10.1016/j.chemgeo.2007.06.009.
Goodarzi, S., A. Settari, M. Zoback, and D. Keith, 2011,A coupled geomechanical reservoir simulation analysis ofcarbon dioxide storage in a saline aquifer in the OhioRiver Valley: Environmental Geosciences, v. 18, no. 3,p. 189–207, doi: 10.1306/eg.04061111002.
Grunau, H. R., 1987, A worldwide look at the cap-rock problem:Journal of Petroleum Geology, v. 10, no. 3, p. 245–265, doi:10.1111/jpg.1987.10.issue-3.
Gutstadt, A. M., 1958, Cambrian and Ordovician stratigraphy andoil and gas possibilities in Indiana: Indiana GeologicalSurvey Bulletin, v. 14, 103 p.
Heath, J. E., T. A. Dewers, B. J. O. L. McPherson, R. Petrusak,T. C. Chidsey, Jr., A. J. Rinehart, and P. S. Mozley, 2011,Pore networks in continental and marine mudstones:Characteristics and controls on sealing behavior:Geosphere, v. 7, no. 2, p. 429–454.
Heath, J. E., T. A. Dewers, B. J. O. L. McPherson, M. B. Nemer,and P. G. Kotula, 2012, Pore-lining phases and capillarybreakthrough pressure of mudstone caprocks: Sealing effi-ciency of geologic CO2 storage sites: International Journalof Greenhouse Gas Control, v. 11, no. 2, p. 204–220.
Hildenbrand, A., S. Schlömer, B. M. Krooss, and R. Littke, 2004,Gas breakthrough experiments on pelitic rocks:Comparative study with N2, CO2 and CH4: Geofluids, v. 4,no. 1, p. 61–80.
LAHANN ET AL. 105
Kim, W.-Y., 2013, Induced seismicity associated with fluidinjection into a deep well in Youngstown, Ohio: Journalof Geophysical Research: Solid Earth, v. 118, no. 7,3506–3518.
Leetaru, H. E., and J. H. McBride, 2009, Reservoir uncertainty,Precambrian topography, and carbon sequestration in theMt. Simon Sandstone, Illinois Basin: EnvironmentalGeosciences, v. 16, no. 4, p. 235–243, doi: 10.1306/eg.04210909006.
Liu, F., P. Lu, C. Zhu, and Y. Xiao, 2011, Coupled reactive flowand transport modeling of CO2 sequestration in theMt. Simon sandstone formation, Midwest U.S.A:International Journal of Greenhouse Gas Control, v. 5,no. 2, p. 294–307, doi: 10.1016/j.ijggc.2010.08.008.
Lovell, T. R., and B. B. Bowen, 2013, Fluctuations in sedimen-tary provenance of the Upper Cambrian Mount SimonSandstone, Illinois Basin, United States: Journal ofGeology, v. 121, no. 2, p. 129–154, doi: 10.1086/669230.
Lu, J., K. Milliken, R. M. Reed, and S. Hovorka, 2011,Diagenesis and sealing capacity of the middle Tuscaloosamudstone at the Cranfield carbon dioxide injection site,Mississippi, U.S.A: Environmental Geosciences, v. 18,no. 1, p. 35–53, doi: 10.1306/eg.09091010015.
Lucier, A., M. Zoback, N. Gupta, and T. S. Ramakrishnan, 2006,Geomechanical aspects of CO2 sequestration in a deep salinereservoir in the Ohio River Valley region: EnvironmentalGeosciences, v. 13, no. 2, p. 85–103, doi: 10.1306/eg.11230505010.
Maloney, D. R., M. M. Honarpour, and A. D. Brinkmeyer, 1990,The effect of rock characteristics on relative permeability.DOE Topical Report No. NIPER 441, National Institutefor Petroleum and Energy Research, Bartlesville,Oklahoma, 39 p.
McCreesh, C. A., R. Ehrlich, and S. J. Crabtree, 1991,Petrography and reservoir physics II: Relating thin sectionporosity to capillary pressure, the association between poretypes and throat size: AAPG Bulletin, v. 75, no. 10,p. 1563–1578.
Medina, C. R., J. A. Rupp, and D. A. Barnes, 2011, Effectsof reduction in porosity and permeability with depth onstorage capacity and injectivity in deep saline aquifers:A case study from the Mount Simon Sandstone aquifer:International Journal of Greenhouse Gas Control, v. 5,no. 1, p. 146–156, doi: 10.1016/j.ijggc.2010.03.001.
Medina, C. R., and J. A. Rupp, 2012, Reservoir characterizationand lithostratigraphic division of the Mount SimonSandstone (Cambrian): Implications for estimations of geo-logic sequestration storage capacity: EnvironmentalGeosciences, v. 19, no. 1, p. 1–15, doi: 10.1306/eg.07011111005.
Montgomery, S. L., and M. F. Morea, 2001, Antelope Shale(Monterey Formation), Buena Vista Hills field: Advanced res-ervoir characterization to evaluate CO2 injection for enhancedoil recovery AAPG Bulletin, v. 85, no. 4, p. 561–585.
Neufelder, R. J., B. B. Bowen, R. W. Lahann, and J. A. Rupp,2012, Lithologic, mineralogical, and petrophysical charac-teristics of the Eau Claire Formation: Complexities of a car-bon storage system seal: Environmental Geosciences, v. 19,no. 3, p. 81–104, doi: 10.1306/eg.02081211014.
Palmer, A. R., 1982, Fossils of Dresbachian and Franconian(Cambrian) age from the subsurface of west-centralIndiana: Indiana Geological Survey Special Report 29,12 p.
Rutqvist, J., and C. F. Tsang, 2002, A study of caprock hydro-mechanical changes associated with CO2-injection into abrine formation: Environmental Geology, v. 42, no. 2–3,p. 296–305, doi: 10.1007/s00254-001-0499-2.
Rutqvist, J., J. Birkholzer, F. Cappa, and C. F. Tsang, 2007,Estimating maximum sustainable injection pressure duringgeological sequestration of CO2 using coupled fluid flowand geomechanical fault-slip analysis: Energy Conversionand Management, v. 48, no. 6, p. 1798–1807, doi: 10.1016/j.enconman.2007.01.021.
Rutqvist, J., 2012, The geomechanics of CO2 storage in deepsedimentary formations: Geotechnical and GeologicalEngineering, v. 30, no. 3, p. 525–551, doi: 10.1007/s10706-011-9491-0.
Schowalter, T. T., 1979, Mechanics of secondary hydrocarbonmigration and entrapment: AAPG Bulletin, v. 63, no. 5,p. 723–760.
Shaver, R. H., et al., 1986, Compendium of Paleozoic rock-unitstratigraphy in Indiana—a revision: Indiana GeologicalSurvey Bulletin, v. 59, 203 p.
Song, J., and D. Zhang, 2012, Comprehensive review of caprock-sealing mechanisms for geologic carbon sequestration:Environmental Science & Technology, v. 47, no. 1,p. 9–22, doi: 10.1021/es301610p.
Walcott, C. D., 1914, Dikelocephalus and other genera of theDikelocephalinae: Smithsonian Miscellaneous Collection,v. 57, no. 13, p. 345–412.
Wollenweber, J., S. A. Alles, A. Kronimus, A. Busch, H. Stanjek,and B. M. Krooss, 2009, Caprock and overburden processesin geological CO2 storage: An experimental study on sealingefficiency and mineral alterations: Energy Procedia, v. 1,no. 1, p. 3469–3476.
Yang, Y., and A. C. Aplin, 1998, Influence of lithology andcompaction on the pore size distribution and modelledpermeability of some mudstones from the Norwegianmargin: Marine and Petroleum Geology, v. 15, no. 2,p. 163–175, doi: 10.1016/S0264-8172(98)00008-7.
Yawar, Z., 2011, Stratigraphy, lithofacies distribution andsedimentological analysis of the Eau Claire Formation,Indiana: M.S. thesis, Indiana, Indiana University,Bloomington, 122 p.
Zoback, M. D., and M. L. Zoback, 1989, Tectonic stress field ofthe conterminous United States: Geological Society ofAmerica Memoirs, v. 172, p. 523–540, doi: 10.1130/MEM172.
106 An Evaluation of the Seal Capacity and CO2 Retention Properties of the Eau Claire Formation (Cambrian)