An Evaluation of the Health Applications (and Implications) of Digital Interactive Television: Case...
13
http://jis.sagepub.com/ Journal of Information Science http://jis.sagepub.com/content/29/3/181 The online version of this article can be found at: DOI: 10.1177/01655515030293005 2003 29: 181 Journal of Information Science David Nicholas, Paul Huntington, Peter Williams and Barrie Gunter of the Livinghealth Channel An Evaluation of the Health Applications (and Implications) of Digital Interactive Television: Case Study Published by: http://www.sagepublications.com On behalf of: Chartered Institute of Library and Information Professionals can be found at: Journal of Information Science Additional services and information for http://jis.sagepub.com/cgi/alerts Email Alerts: http://jis.sagepub.com/subscriptions Subscriptions: http://www.sagepub.com/journalsReprints.nav Reprints: http://www.sagepub.com/journalsPermissions.nav Permissions: http://jis.sagepub.com/content/29/3/181.refs.html Citations: What is This? - May 1, 2003 Version of Record >> by David Nicholas on July 19, 2014 jis.sagepub.com Downloaded from by David Nicholas on July 19, 2014 jis.sagepub.com Downloaded from
Transcript of An Evaluation of the Health Applications (and Implications) of Digital Interactive Television: Case...
http://jis.sagepub.com/Journal of Information Science
http://jis.sagepub.com/content/29/3/181The online version of this article can be found at:
DOI: 10.1177/01655515030293005
2003 29: 181Journal of Information ScienceDavid Nicholas, Paul Huntington, Peter Williams and Barrie Gunter
of the Livinghealth ChannelAn Evaluation of the Health Applications (and Implications) of Digital Interactive Television: Case Study
Published by:
http://www.sagepublications.com
On behalf of:
Chartered Institute of Library and Information Professionals
can be found at:Journal of Information ScienceAdditional services and information for
http://jis.sagepub.com/cgi/alertsEmail Alerts:
http://jis.sagepub.com/subscriptionsSubscriptions:
http://www.sagepub.com/journalsReprints.navReprints:
http://www.sagepub.com/journalsPermissions.navPermissions:
http://jis.sagepub.com/content/29/3/181.refs.htmlCitations:
What is This?
- May 1, 2003Version of Record >>
by David Nicholas on July 19, 2014jis.sagepub.comDownloaded from by David Nicholas on July 19, 2014jis.sagepub.comDownloaded from

An evaluation of the healthapplications (and implications) ofdigital interactive television: casestudy of the LivingHealth Channel
David Nicholas, Paul Huntington,Peter Williams and Barrie Gunter
Ciber, Department of Information Science, City University,London
Received 23 April 2002Revised 19 September 2002
Abstract.
A large-scale and pioneering evaluation of the use of digitalinteractive television for the provision of health informationand advice has been carried out. As part of a Department ofHealth (DoH) funded pilot, researchers at City Universityare evaluating the attempts of four media consortia todeliver health information and advice to the general public.Reported here are the initial results of one of the first pilotsto complete, Flextech’s LivingHealth Channel, distributed bythe cable company Telewest to 38,000 of its Birminghamsubscribers. Data on subscribers’ use or non-use, ease of use,service satisfaction and health outcomes were analysedusing a combination of log analysis and questionnairesurvey methods. Over 1100 people were questioned andlogs were monitored for a period of four months.
1. Introduction
During the 1980s there was a variety of informationtechnology ‘platforms’ in existence, most notablyCommercial online, CD-ROM, and OPACs, and there-fore considerable debate in the information professionas to which was the ‘best’ or most ‘appropriate’platform. This debate was largely conducted withregard to the use of information services for informa-tion professionals or other professional or academicend-users. The debate largely came to an end with thearrival of the PC/world wide web platform combina-tion. It has since been re-ignited as a result of theemergence of a whole range of new digital platforms –the touch screen information kiosk, the mobile deviceand, most recently, digital interactive television (DiTV)– most of which, unlike the platforms of the 1980s, aretargeted at the general public. If anything, the informa-tion fog we now find ourselves descending into is eventhicker. Little research has been undertaken on howthe newly information-enfranchised general publicrelates to these seemingly very different deliveryplatforms, nor has much thought been given to theirrelative appropriateness or adequacy. This papercarries the debate into the under-researched, buthugely strategic and political, consumer informationfield, by examining the use of the most recent andheralded recruit to the consumer information cause –DiTV.
DiTV, the vehicle for WebTV, is not only a brandnew platform about which very little is known, it isalso a platform in which much hope is invested.
Correspondence to: D. Nicholas, Department of InformationScience, City University, Northampton Square, London EC1V0HB, UK. E-mail: [email protected]
Journal of Information Science, 29 (3) 2003, pp. 181–192 # CILIP 181 by David Nicholas on July 19, 2014jis.sagepub.comDownloaded from

There is a sense, amongst politicians certainly, thatthis is the platform. It has wide consumer reach, usesa medium with long-standing public credentials andis thus envisaged as a principal conduit for a wholerange of e-government and e-local government ser-vices for the public. Confidence in this platform stemsfrom the fact that virtually everybody has a televisionset (and within a few years most viewers will possessa digital television). Most people, and most impor-tantly even those not yet signed up to the Internet ona PC platform, are familiar with TV sets. Hence itthrows an ICT lifeline to all those who have beenexcluded from the digital revolution to date – thepoor, socially excluded, elderly etc. The hopes thatpoliticians have for DiTV were plainly manifest in aproclamation in 2000 by the then Minister for Health,Gisela Stuart:
Digital TV promises faster, easier access to healthinformation for all and is likely to allow us to take afurther significant step towards the NHS becoming theauthoritative provider of advice on health at home and aproactive partner in helping people to change to healthierlifestyles.
The Government is pinning many hopes on the digitaldelivery of information. In addition to its fledglingNHS Direct online web site, it is introducing NHSDirect Digital, set to become the digital TV arm of thisinitiative. Kingston Interactive Services in Hull andVideo Networks in London have been engaged in pilotNHS Direct digital video-on-demand services.
However, it is not just politicians advocating thecase for DiTV. Television directors, content producers,participating GPs and other health professionals, andthe communities involved in these pilots, also sawthemselves as pioneers of a new communications age,where passive television viewing – although still amajor part of people’s everyday recreational habits –would not be the sole television option. In future, thetelevision set would become a multimedia informationdatabase and two-way communications conduit. Inshort, viewers (perhaps more aptly named ‘viewer-users’) would be able both to utilize their television toobtain video-based entertainment and to send/receiveinformation in a range of formats. The television setwould thus become an information retrieval and two-way communications platform as well as a tool for bothleisure and work
In order to determine the success or otherwise ofDiTV as an information platform for the general public,City University researchers have been evaluating anumber of pilot DiTV initiatives in the health field,
funded by the Department of Health.* Areas of studyinclude impact (in terms of usage figures), reasons forturning to the services, impact on the health services,and accessibility/usability issues. The study does notconcern itself with the evaluation of the actualinformation contained in health information services– that requires medical and other subject experts.Needless to say this is also an important area of study,and some of our work [1] discusses the literature onissues such as the lack of quality control of informationthat can be found on the Internet.
1.1. Aims and objectives
The broad aim of the study was to determine howhealth information and advisory services carried onDiTV were being used by the general public andwhether they were satisfied with them. This paperconcentrates on one of the four pilot services beingevaluated: the LivingHealth channel, the first pilotproject to run its course.{
Specifically, the following information was sought:. what kinds of people viewed it – personal char-
acteristics of users, e.g. age, gender, occupation;. use data – number of users and pages viewed, time
spent viewing and health topics viewed;. ease of use;. what the service was used for and perceptions of
usefulness and value;. reasons for non-use and characteristics of non-
users;. future use expectations;. relationship with use of other health information
and advisory sources/services.
2. Literature review
We believe this is the first piece of research that hasbeen conducted into the health applications of digitalinteractive television. Indeed, the research presentedhere constitutes the first academic analysis of the useof DiTV information services by the general public.Proprietary research has been conducted by the maininteractive television players (ITV Digital, Sky Digital,
*An evaluation of pilot projects exploring the healthapplications of digital interactive television. Department ofHealth, 2001–2002.{The others featuring in the pilots are: DKTV, Communicopiaand Channel Health.
Evaluation of health applications of digital interactive television
182 Journal of Information Science, 29 (3) 2003, pp. 181–192 # CILIP
by David Nicholas on July 19, 2014jis.sagepub.comDownloaded from
NTL and Telewest) on audience penetration and reach,while advertisers using the medium have trackedwhere the most significant impacts have occurred.For advertisers, of course, digital interactive televisionprovides a vehicle not just for product or servicepromotion, but a conduit through which consumerscan actually place orders.
The Yankee marketing group [2] identifies ‘keycustomer groups’ likely to take ITV services, including:. ‘Aggressive early adopters’ – this group is eager to
acquire a second interactive device in the home, butnot at the cost or space requirements of a new PC;and
. ‘Third wave adopters’ – the mass-market group of‘Internet users to come’. This refers to the potentialusers who may not be able to afford a PC, but havean interest in tapping the new basic interactiveservices available over ITV, such as e-mail, bank-ing, shopping and travel services.
Similarly, Interactive TV was said by marketingcompany GartnerG2 [4] to reach consumers that ‘thetraditional PC Internet can’t reach. Half of interactiveTV users don’t use the PC Internet – typically lesseducated, blue collar workers on average incomes’.Commercially confidential information acquired by thepresent authors (hence, it is not possible to cite)suggests that interactive television users most closelyfollowed the profiles of early adopters of othertechnologies, that is, they were male and in theirtwenties. However, there seems to be some disputeregarding the relationship between PC owners andinteractive television, with the commercially sensitivesource claiming that there was no relationship betweennon-ownership of PCs and interest in interactivetelevision. Research by the National Opinion Poll(NOP) organization supports the view that interactivetelevision consumers are young. An NOP survey [5]found that among the nearly 5 million 7–16-year-oldsnow using the Internet almost one in 10 (9%) does sothrough digital TV, and that over a fifth (22%) of 14–16-year-old boys accessing the Internet do so using digitalTV.
Research agencies such as Forrester have indicatedthat some high street names, such as Domino’s Pizza,Argos and Woolworth’s, together with some travelcompanies, have reported a degree of success with thisnew medium [7]. However, these cases have so far beenthe exception rather than the rule, and it is clear thatthere is still much to be learned about how to use DiTVeffectively, whatever the application. This last pointunderlines the importance at this early stage in itsevolution of conducting considered research into its
usability and effectiveness in different communica-tions contexts.
3. Background: Flextech LivingHealthchannel
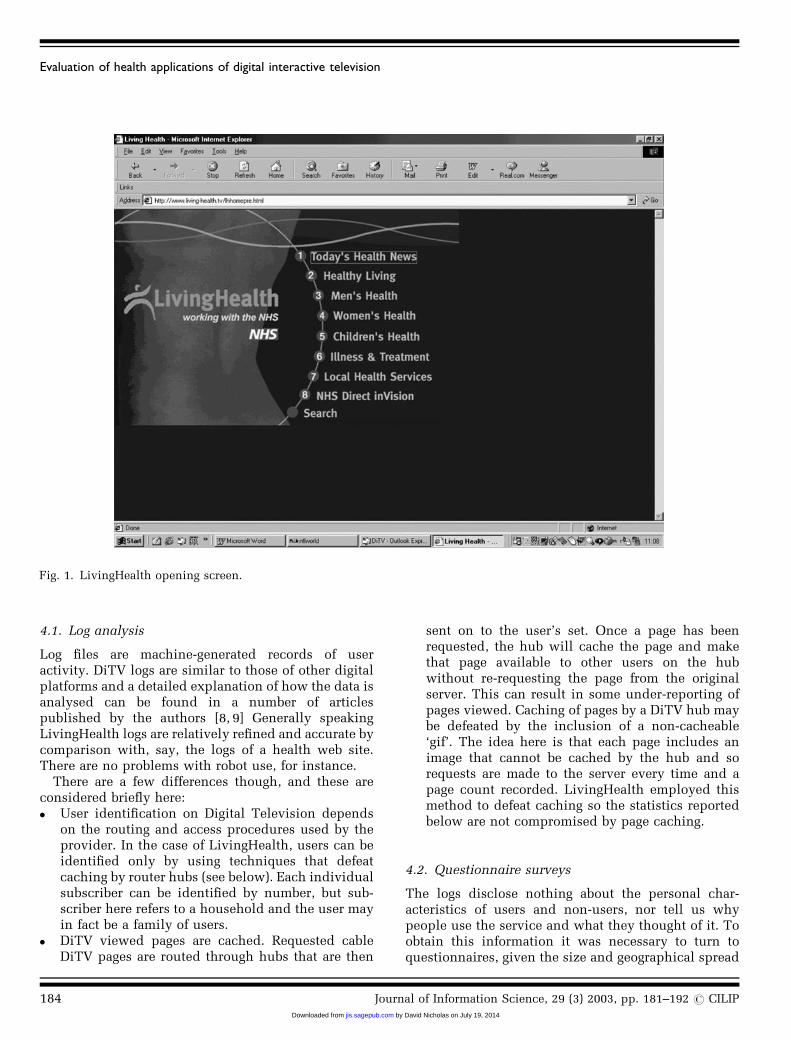
The service comprises both interactive and transac-tional services made available on a cable TV platform(see Fig. 1 for the channel’s opening screen). The pilotwas carried by Telewest in Birmingham to its ca.38,000 subscribing households – more than 45,000people. In addition, the service is being made availableon the intranets of Birmingham City Council andBirmingham Area Health Authority.
The interactive service component is a contentdatabase (mostly text) on a wide range of health topicslargely adapted from NHS Direct Online, althoughsupplemented by content from other suppliers (e.g.updated daily news bulletins, medicines and servicesdirectories, and public health alerts). There is alsoNHS careers information provided by the Departmentof Health Communications Directorate.
There are two transactional services: (1) NHS DirectIn-Vision and (2) an On-Line Surgery AppointmentBooking Service. In-Vision provides a one-way videolink between a nurse in a NHS Direct Call Centre andthe user at home; the video link is supplemented by atelephone link to provide oral communication betweenthe two parties. The On-Line Appointments BookingService allows users to book an appointment with theirgeneral practitioner (GP). Three GP surgeries inBirmingham are partners in this venture. The generalservice and GP booking element was launched on 28June 2001. The In-Vision element was rolled out acrossBirmingham cable hubs starting 30 July 2001, and wasavailable in all cable homes.
4. Methods
A two-pronged research approach was taken to ensurethat the topic could be examined in the round and indetail:. the transactional logs of the service were evaluated
for the period July to November 2001 to providedetailed, real-time records of user activity;
. two questionnaire surveys were conducted toprovide personal, satisfaction and causal data –one shortly before the channel’s launch and theother towards the end of the pilot in October 2001.
D. NICHOLAS ET AL.
Journal of Information Science, 29 (3) 2003, pp. 181–192 # CILIP 183 by David Nicholas on July 19, 2014jis.sagepub.comDownloaded from
4.1. Log analysis
Log files are machine-generated records of useractivity. DiTV logs are similar to those of other digitalplatforms and a detailed explanation of how the data isanalysed can be found in a number of articlespublished by the authors [8, 9] Generally speakingLivingHealth logs are relatively refined and accurate bycomparison with, say, the logs of a health web site.There are no problems with robot use, for instance.
There are a few differences though, and these areconsidered briefly here:. User identification on Digital Television depends
on the routing and access procedures used by theprovider. In the case of LivingHealth, users can beidentified only by using techniques that defeatcaching by router hubs (see below). Each individualsubscriber can be identified by number, but sub-scriber here refers to a household and the user mayin fact be a family of users.
. DiTV viewed pages are cached. Requested cableDiTV pages are routed through hubs that are then
sent on to the user’s set. Once a page has beenrequested, the hub will cache the page and makethat page available to other users on the hubwithout re-requesting the page from the originalserver. This can result in some under-reporting ofpages viewed. Caching of pages by a DiTV hub maybe defeated by the inclusion of a non-cacheable‘gif’. The idea here is that each page includes animage that cannot be cached by the hub and sorequests are made to the server every time and apage count recorded. LivingHealth employed thismethod to defeat caching so the statistics reportedbelow are not compromised by page caching.
4.2. Questionnaire surveys
The logs disclose nothing about the personal char-acteristics of users and non-users, nor tell us whypeople use the service and what they thought of it. Toobtain this information it was necessary to turn toquestionnaires, given the size and geographical spread
Fig. 1. LivingHealth opening screen.
Evaluation of health applications of digital interactive television
184 Journal of Information Science, 29 (3) 2003, pp. 181–192 # CILIP
by David Nicholas on July 19, 2014jis.sagepub.comDownloaded from
of the population. Two questionnaires were sent out –one near channel launch time and the second close tothe end of the pilot (nearly three months after launch).The first questionnaire was designed and delivered byLivingHealth and analysed by City researchers. Thesecond was constructed by the authors. Together, morethan 1100 people responded to one or other of thesurveys.. Questionnaire 1 – a questionnaire was sent by
Flextech to all Telewest subscribers in the Birming-ham area on the 2 and 3 July 2001. The ques-tionnaire was sent out as part of a promotionalpack. Subscribers were invited to use the channeland were asked to complete and return the ques-tionnaire. In all, 38,000 promotional packs weresent out and by 28 July 2001 450 questionnaires hadbeen returned. This represents a return rate of 1.5%.The low response rate is probably due to the factthat many people would not have had time to viewthe service as it had only been launched daysearlier. Clearly, any users represent the earlyadopters and are people interested in healthinformation. The questionnaire asked subscriberswhich parts of the broadcast they used, how oftenthey would use it, their current healthy livingpractices and how easy they found it to use as wellas their age and gender. The results were processedusing the SPSS software package.
. Questionnaire 2 – the team also constructed its ownquestionnaire to ascertain users’ attitudes andresponses towards the service. This was distributedby LivingHealth to the 38,000 Telewest Birming-ham subscriber households, and 723 (2% of thepopulation) were returned and analysed. Thesample is plainly a small one and the data shouldbe regarded as illustrative rather than representa-tive. Wherever possible these data have beentriangulated with other data sets. The questionnairewas designed to obtain responses on the use andnon-use of digital television for health information,specifically, with regard to LivingHealth. Further-more, it asked for personal information details aswell as asking people to rank the importance of avariety of other sources for health information.
Apart from the sample size the study was also limitedby the non-random make-up of the respondents. Thosewho chose to complete the survey were, of course, self-selecting. They may well have had a greater interest inthe topic than non-respondents, or more time or haveother attributes that biased their responses. This is,however, a common problem, and an attempt has beenmade to overcome this with use of other available data
where possible – in particular, the transaction logs ofservice use.
5. Results
5.1. Personal characteristics of subscribers and users
The population surveyed was Telewest subscriberswho lived in the Birmingham area. Of course not allsubscribers were users of the LivingHealth channel.For clarity, the terms users (meaning Living-Healthviewers) and respondents (Telewest subscribers:LivingHealth users and non-users) are used.
5.2. Gender and age
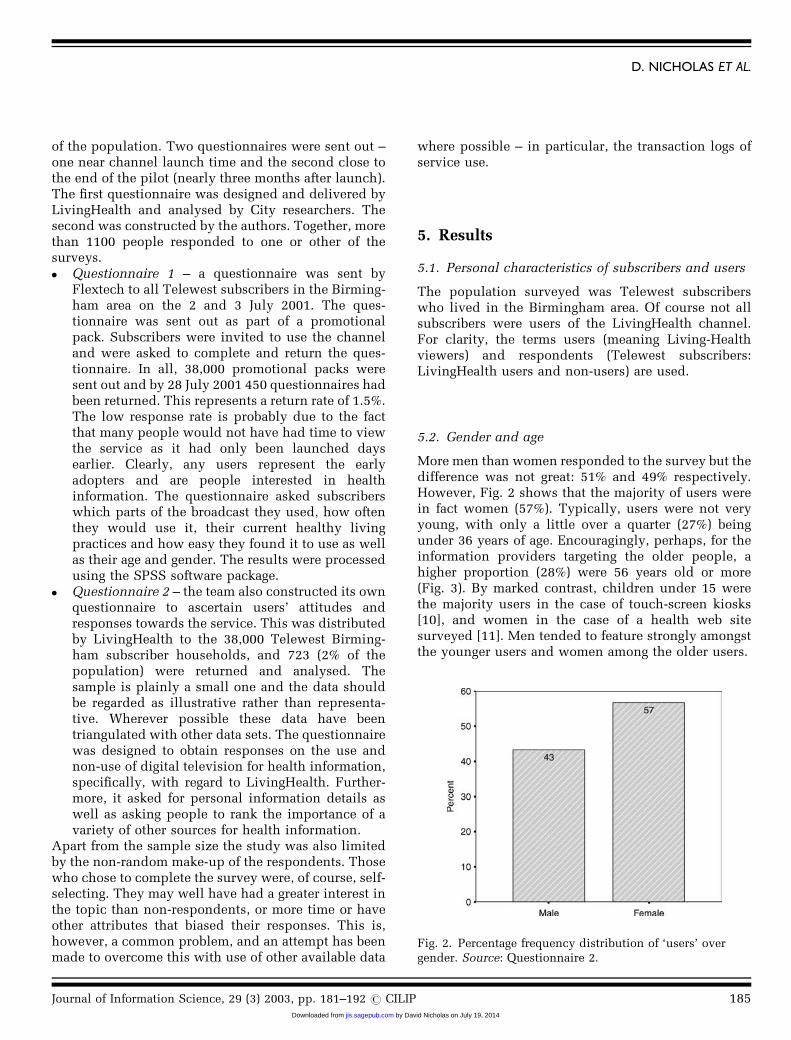
More men than women responded to the survey but thedifference was not great: 51% and 49% respectively.However, Fig. 2 shows that the majority of users werein fact women (57%). Typically, users were not veryyoung, with only a little over a quarter (27%) beingunder 36 years of age. Encouragingly, perhaps, for theinformation providers targeting the older people, ahigher proportion (28%) were 56 years old or more(Fig. 3). By marked contrast, children under 15 werethe majority users in the case of touch-screen kiosks[10], and women in the case of a health web sitesurveyed [11]. Men tended to feature strongly amongstthe younger users and women among the older users.
Fig. 2. Percentage frequency distribution of ‘users’ overgender. Source: Questionnaire 2.
D. NICHOLAS ET AL.
Journal of Information Science, 29 (3) 2003, pp. 181–192 # CILIP 185 by David Nicholas on July 19, 2014jis.sagepub.comDownloaded from
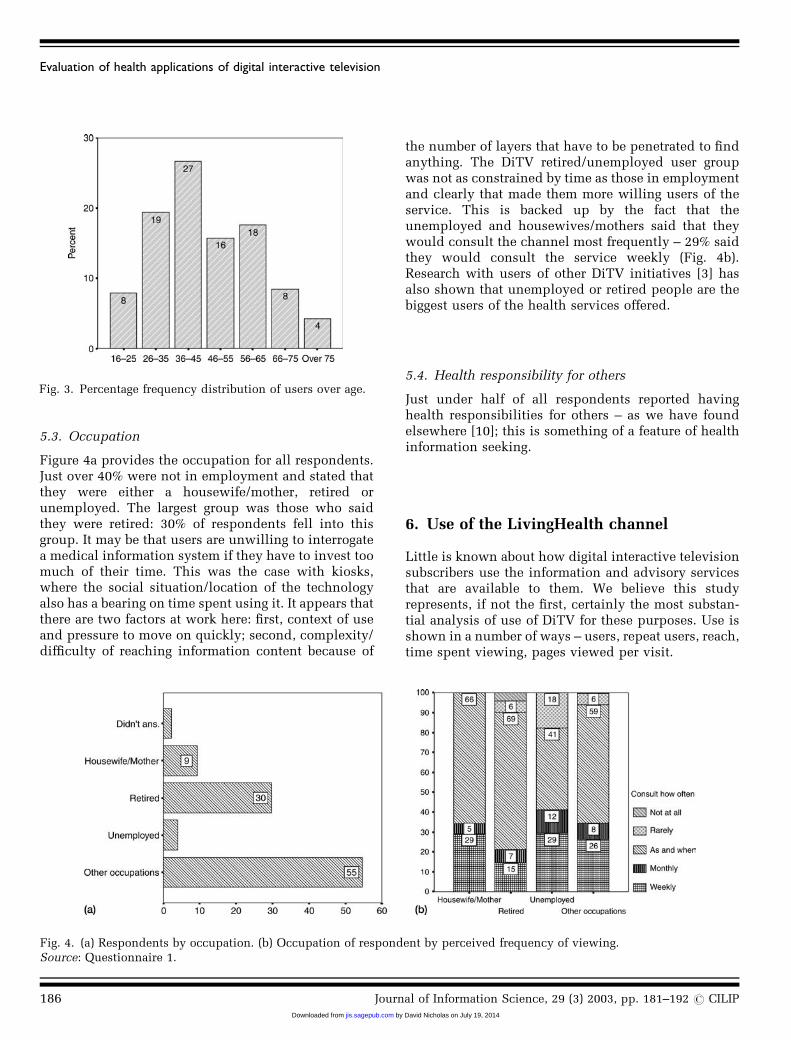
5.3. Occupation
Figure 4a provides the occupation for all respondents.Just over 40% were not in employment and stated thatthey were either a housewife/mother, retired orunemployed. The largest group was those who saidthey were retired: 30% of respondents fell into thisgroup. It may be that users are unwilling to interrogatea medical information system if they have to invest toomuch of their time. This was the case with kiosks,where the social situation/location of the technologyalso has a bearing on time spent using it. It appears thatthere are two factors at work here: first, context of useand pressure to move on quickly; second, complexity/difficulty of reaching information content because of
the number of layers that have to be penetrated to findanything. The DiTV retired/unemployed user groupwas not as constrained by time as those in employmentand clearly that made them more willing users of theservice. This is backed up by the fact that theunemployed and housewives/mothers said that theywould consult the channel most frequently – 29% saidthey would consult the service weekly (Fig. 4b).Research with users of other DiTV initiatives [3] hasalso shown that unemployed or retired people are thebiggest users of the health services offered.
5.4. Health responsibility for others
Just under half of all respondents reported havinghealth responsibilities for others – as we have foundelsewhere [10]; this is something of a feature of healthinformation seeking.
6. Use of the LivingHealth channel
Little is known about how digital interactive televisionsubscribers use the information and advisory servicesthat are available to them. We believe this studyrepresents, if not the first, certainly the most substan-tial analysis of use of DiTV for these purposes. Use isshown in a number of ways – users, repeat users, reach,time spent viewing, pages viewed per visit.
Fig. 3. Percentage frequency distribution of users over age.
Fig. 4. (a) Respondents by occupation. (b) Occupation of respondent by perceived frequency of viewing.Source: Questionnaire 1.
Evaluation of health applications of digital interactive television
186 Journal of Information Science, 29 (3) 2003, pp. 181–192 # CILIP
by David Nicholas on July 19, 2014jis.sagepub.comDownloaded from

6.1. Number of individuals using the service daily andpages viewed
The number of LivingHealth users varied quiteconsiderably over the survey period – 18 July to 28November 2002. Just after the launch of the channel itstood at just under 400 users a day. The number ofusers remained high for September (after a technicalproblem forced a 2 week service break) at approxi-mately 320 users a day. The number of users recordedfell after 24 September, and from the beginning ofOctober the number of daily users remained in theband 220–270.
6.2. Return viewers
Coming back to a site constitutes conscious anddirected use – as good an approximation of this asyou are likely to get from web logs. Just over 59% ofusers visited the channel only once during the surveyperiod – meaning that a relatively high proportion(41%) revisited the service. Figure 5 provides thenumber of times users returned by the first date thatthey used the system. It confirms expectations in thatthose users who visited the site early were more likelyto be regular users – plainly they showed an earlyinterest and were more willing to revisit. It can be seenthat users who first visited the channel in July/August,on average, visited the channel three times in total orvisited at the rate of about once a month. In looking atjust those users who visited twice, the average numberof days between the first and second visit wascalculated at 26 days, also suggesting a return visit
frequency of approximately once a month. However, itmight be expected that the period between repeat visitswill lengthen over time as initial and long-standingneeds are met. There might also emerge over the longerterm another pattern – frequent visits followed by aperiod of abstinence, caused by the researching of aparticular health problem. Generally, as the number ofvisits increased, so did the time spent on a session,although session time did decline for those users whovisited the site over 15 times in the period of study.
6.3. Reach
The above-mentioned figures do not tell the wholestory because, self-evidently, checking on one’s health,unlike consuming the news, for instance, is unlikely tobe a daily or even periodic event for most people.Reach – the percentage use made of a service by thosewho had access to it – provides another way at lookingat use.
During the period of analysis, LivingHealth wasavailable to approximately 38,000 households. Overthe period 13,718 subscriber households used thesystem and, based upon this figure, it is estimatedthat 36% of potential users accessed the service duringthe survey period. Note that reach is a function of theservice period over which the figure is calculated. Thelonger the period over which reach is calculated, thehigher one would expect the reach figure would be. Bycomparison, reach for DiTV services offering primarilyvideo-on-demand marterial was far lower � 20%.
6.4. Time spent viewing
Using Huber’s robust M-estimator, the average pageview time, as elicited from the transaction logs isnearly 13 seconds and session time is just over 4minutes. On average, page view time tends to vary fromabout 11 to 13 seconds. However, there are (as yet)unexplained surges and falls. Not surprisingly, com-parative data for services including videos showed a50–100% longer view time [3].
6.5. Pages viewed during a visit (service/sitepenetration)
Service penetration, as shown by the number ofscreens viewed in a visit, is an important factor inmeasuring use because, in many menu-based informa-tion systems, the user has to navigate through anumber of menu screens to arrive at what can betermed an information page. On average, 15 pages were
Fig. 5. Number of times users have visited by date of firstvisit.
D. NICHOLAS ET AL.
Journal of Information Science, 29 (3) 2003, pp. 181–192 # CILIP 187 by David Nicholas on July 19, 2014jis.sagepub.comDownloaded from

viewed in a visit to the channel. However this tellsonly part of the story. Clearly positive use implies thatthe information seeker navigates beyond the collectionof initial menu screens to the actual information pages.
Service penetration denotes how many pages theuser has viewed. Table 1 groups users by the number ofpages viewed. Approximately 22% of users viewed oneto three pages and these users were unlikely to havepenetrated past the menu screens and would not haveviewed an information page. These users were unlikelyto have found anything of interest and, in conse-quence, would then probably have bailed out quickly –a case of information-seeking without success one mayassume. Note this figure compares very favourablywith both users of the Internet and touch screen kiosks[8]. A large proportion (78%) of users of LivingHealth,however, navigated to an information page, and 37%
showed their interest by viewing more than 20 pageson a visit. These figures have not changed since thebeginning of the study and one can assume that thefigures will be typical for this service.
6.6. Topics viewed
Figure 6 shows the sections that were available for useand the amount of use they attracted. Illness andtreatment was plainly the most popular section bysome margin – 39% viewed these pages. This patternwas also found in other DiTV services evaluated by theresearchers. A section on ‘A to Z of medical condi-tions’, including diabetes, lower back pain and asthmaappearing in the top 10 pages, was the most popularviewed on The NHS Direct Digital service offered byKIT in Hull [3]. This may point to the direct andpractical needs to which health DiTV is being put or,perhaps, to the particular audience it attracts – theunemployed and elderly feature strongly. This bodeswell one would have thought for the interactive andtransactional health services hosted on the channel –
the appointments booking service and the video nurse,which are the feature of a separate investigation.
7. Ease of use
Ease of use information was obtained from bothquestionnaires. Figure 7 shows that a small majorityof people did not have difficulties with using theservice. Fifty-two per cent thought it very easy or easyto use the information. Of course that left a lot of
Table 1Number of pages viewed in a visit
Number of pages viewedin a visit
Percentage frequencyof users (%)
1–3 pages viewed 21.94–10 pages viewed 23.111–20 pages viewed 18.1Over 20 pages viewed 36.9
Fig. 6. Use of sections.
Fig. 7. Did you find it easy to get information (percentagefrequency distribution)? Source: Questionnaire 1.
Evaluation of health applications of digital interactive television
188 Journal of Information Science, 29 (3) 2003, pp. 181–192 # CILIP
by David Nicholas on July 19, 2014jis.sagepub.comDownloaded from

people saying that it was OK, hard or very hard to findinformation on the channel.
It was found that users who only trusted theinformation most of the time or who did not trust theinformation were, respectively, twice and five times aslikely to say that the service was either OK, hard orvery hard to use, compared with users who said thatthey trusted the information on the channel. Figure 8portrays the relationship between ease of use and theuser’s trust in the service. While 51% of those findingthe service either very easy or easy to use said that theytrusted the service, this figure fell to 27% for thosepeople finding the site OK, hard or very hard. Clearlythere is a relationship between trust of the source andease of use. However, the relationship here may wellbe that users will be less likely to trust the site if theyfind the system difficult to use. Future qualitativeresearch needs to identify why this relationship mighthold.
8. Usefulness, value and trust
In the second survey, users were asked about thegeneral usefulness of the service and how easy the sitewas to navigate, how they found the menus if the sitewas easy to read and understand and if the site was fullof medical jargon (Fig. 9).
Eighty-one per cent of respondents reported that thesite was useful all or most of the time. In comparing thequestions, respondents were more likely to say that the
site was easy to read all of the time – 55% ofrespondents said this. Furthermore, 45 and 39% ofrespondents reported that the site had easy menus andeasy navigation all of the time.
More men than women reported that the service wasuseful all of the time or some of the time, and thosewith an interest in health topics were also more likelyto say the service was useful.
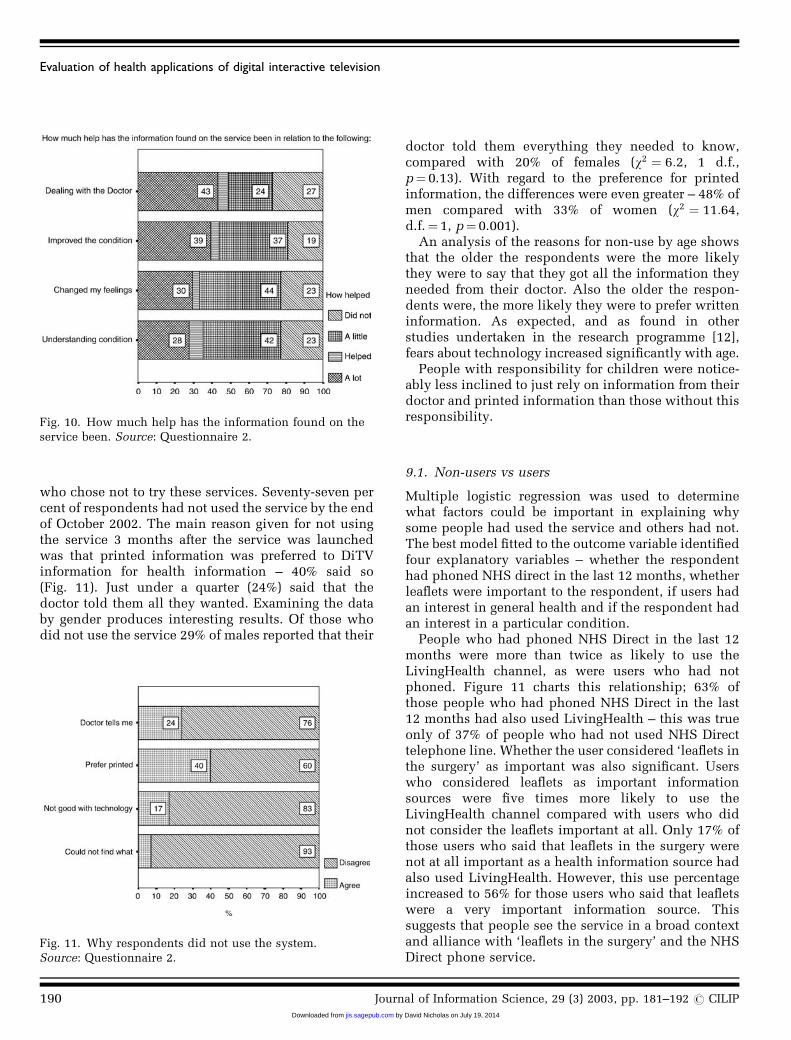
Users were asked how much help the informationthey found was in dealing with the doctor, improvingtheir condition, in changing their feelings to theircondition and in understanding their condition.Nearly half were very positive about the outcome,with 49% saying that the information found had eitherhelped or helped a lot in dealing with their doctor(Fig. 10). In this regard the videos offered by NHSDirect Digital also appear to have been very effective –a similar survey of users found that 62% of NHS Directusers said that the information found either helped alittle or helped a lot in improving their condition [3].
9. Non-use
Clearly, we are still going through a very early periodin the development of DiTV and it is thereforeimportant to get the views not just of early users ofinteractive television services, but also of thoseindividuals within the catchment area of these services
Fig. 8. Ease of use by trust of source – percentage component.Source: Questionnaire 2.
Fig. 9. General usefulness and ease of navigation of theLivingHealth service.
D. NICHOLAS ET AL.
Journal of Information Science, 29 (3) 2003, pp. 181–192 # CILIP 189 by David Nicholas on July 19, 2014jis.sagepub.comDownloaded from
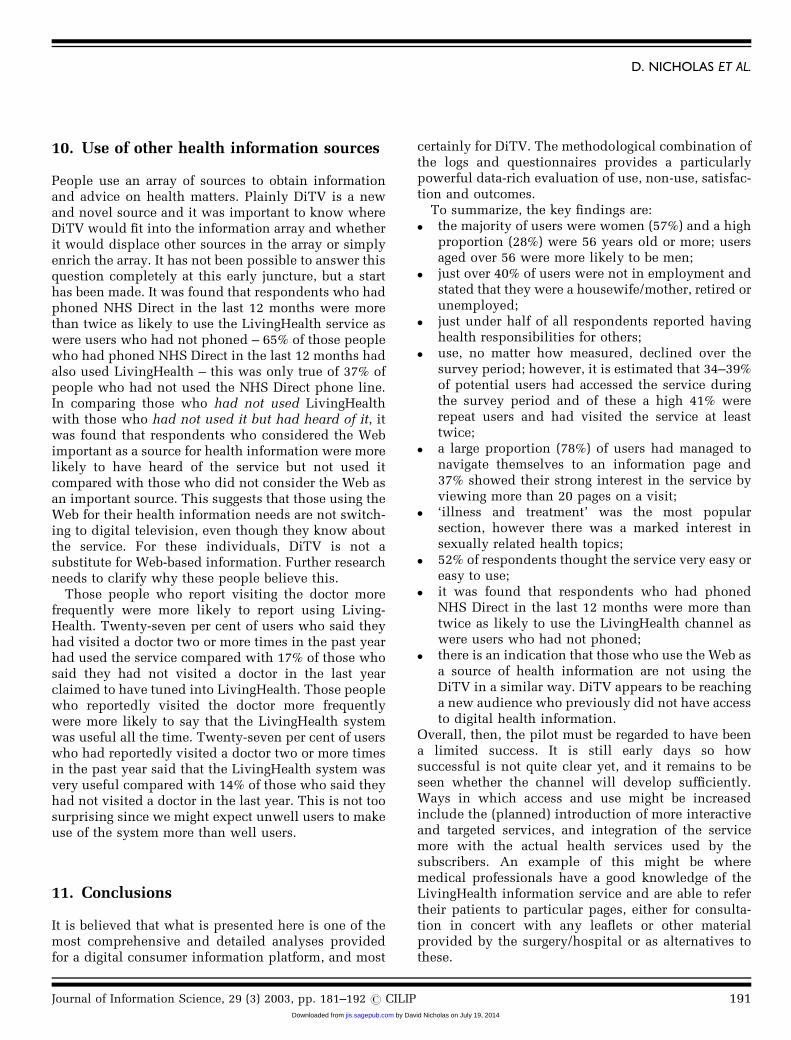
who chose not to try these services. Seventy-seven percent of respondents had not used the service by the endof October 2002. The main reason given for not usingthe service 3 months after the service was launchedwas that printed information was preferred to DiTVinformation for health information – 40% said so(Fig. 11). Just under a quarter (24%) said that thedoctor told them all they wanted. Examining the databy gender produces interesting results. Of those whodid not use the service 29% of males reported that their
doctor told them everything they needed to know,compared with 20% of females (w2 ¼ 6:2, 1 d.f.,p¼ 0.13). With regard to the preference for printedinformation, the differences were even greater – 48% ofmen compared with 33% of women (w2 ¼ 11:64,d.f.¼ 1, p¼ 0.001).
An analysis of the reasons for non-use by age showsthat the older the respondents were the more likelythey were to say that they got all the information theyneeded from their doctor. Also the older the respon-dents were, the more likely they were to prefer writteninformation. As expected, and as found in otherstudies undertaken in the research programme [12],fears about technology increased significantly with age.
People with responsibility for children were notice-ably less inclined to just rely on information from theirdoctor and printed information than those without thisresponsibility.
9.1. Non-users vs users
Multiple logistic regression was used to determinewhat factors could be important in explaining whysome people had used the service and others had not.The best model fitted to the outcome variable identifiedfour explanatory variables – whether the respondenthad phoned NHS direct in the last 12 months, whetherleaflets were important to the respondent, if users hadan interest in general health and if the respondent hadan interest in a particular condition.
People who had phoned NHS Direct in the last 12months were more than twice as likely to use theLivingHealth channel, as were users who had notphoned. Figure 11 charts this relationship; 63% ofthose people who had phoned NHS Direct in the last12 months had also used LivingHealth – this was trueonly of 37% of people who had not used NHS Directtelephone line. Whether the user considered ‘leaflets inthe surgery’ as important was also significant. Userswho considered leaflets as important informationsources were five times more likely to use theLivingHealth channel compared with users who didnot consider the leaflets important at all. Only 17% ofthose users who said that leaflets in the surgery werenot at all important as a health information source hadalso used LivingHealth. However, this use percentageincreased to 56% for those users who said that leafletswere a very important information source. Thissuggests that people see the service in a broad contextand alliance with ‘leaflets in the surgery’ and the NHSDirect phone service.
Fig. 11. Why respondents did not use the system.Source: Questionnaire 2.
Fig. 10. How much help has the information found on theservice been. Source: Questionnaire 2.
Evaluation of health applications of digital interactive television
190 Journal of Information Science, 29 (3) 2003, pp. 181–192 # CILIP
by David Nicholas on July 19, 2014jis.sagepub.comDownloaded from
10. Use of other health information sources
People use an array of sources to obtain informationand advice on health matters. Plainly DiTV is a newand novel source and it was important to know whereDiTV would fit into the information array and whetherit would displace other sources in the array or simplyenrich the array. It has not been possible to answer thisquestion completely at this early juncture, but a starthas been made. It was found that respondents who hadphoned NHS Direct in the last 12 months were morethan twice as likely to use the LivingHealth service aswere users who had not phoned – 65% of those peoplewho had phoned NHS Direct in the last 12 months hadalso used LivingHealth – this was only true of 37% ofpeople who had not used the NHS Direct phone line.In comparing those who had not used LivingHealthwith those who had not used it but had heard of it, itwas found that respondents who considered the Webimportant as a source for health information were morelikely to have heard of the service but not used itcompared with those who did not consider the Web asan important source. This suggests that those using theWeb for their health information needs are not switch-ing to digital television, even though they know aboutthe service. For these individuals, DiTV is not asubstitute for Web-based information. Further researchneeds to clarify why these people believe this.
Those people who report visiting the doctor morefrequently were more likely to report using Living-Health. Twenty-seven per cent of users who said theyhad visited a doctor two or more times in the past yearhad used the service compared with 17% of those whosaid they had not visited a doctor in the last yearclaimed to have tuned into LivingHealth. Those peoplewho reportedly visited the doctor more frequentlywere more likely to say that the LivingHealth systemwas useful all the time. Twenty-seven per cent of userswho had reportedly visited a doctor two or more timesin the past year said that the LivingHealth system wasvery useful compared with 14% of those who said theyhad not visited a doctor in the last year. This is not toosurprising since we might expect unwell users to makeuse of the system more than well users.
11. Conclusions
It is believed that what is presented here is one of themost comprehensive and detailed analyses providedfor a digital consumer information platform, and most
certainly for DiTV. The methodological combination ofthe logs and questionnaires provides a particularlypowerful data-rich evaluation of use, non-use, satisfac-tion and outcomes.
To summarize, the key findings are:. the majority of users were women (57%) and a high
proportion (28%) were 56 years old or more; usersaged over 56 were more likely to be men;
. just over 40% of users were not in employment andstated that they were a housewife/mother, retired orunemployed;
. just under half of all respondents reported havinghealth responsibilities for others;
. use, no matter how measured, declined over thesurvey period; however, it is estimated that 34–39%
of potential users had accessed the service duringthe survey period and of these a high 41% wererepeat users and had visited the service at leasttwice;
. a large proportion (78%) of users had managed tonavigate themselves to an information page and37% showed their strong interest in the service byviewing more than 20 pages on a visit;
. ‘illness and treatment’ was the most popularsection, however there was a marked interest insexually related health topics;
. 52% of respondents thought the service very easy oreasy to use;
. it was found that respondents who had phonedNHS Direct in the last 12 months were more thantwice as likely to use the LivingHealth channel aswere users who had not phoned;
. there is an indication that those who use the Web asa source of health information are not using theDiTV in a similar way. DiTV appears to be reachinga new audience who previously did not have accessto digital health information.
Overall, then, the pilot must be regarded to have beena limited success. It is still early days so howsuccessful is not quite clear yet, and it remains to beseen whether the channel will develop sufficiently.Ways in which access and use might be increasedinclude the (planned) introduction of more interactiveand targeted services, and integration of the servicemore with the actual health services used by thesubscribers. An example of this might be wheremedical professionals have a good knowledge of theLivingHealth information service and are able to refertheir patients to particular pages, either for consulta-tion in concert with any leaflets or other materialprovided by the surgery/hospital or as alternatives tothese.
D. NICHOLAS ET AL.
Journal of Information Science, 29 (3) 2003, pp. 181–192 # CILIP 191 by David Nicholas on July 19, 2014jis.sagepub.comDownloaded from

References
[1] P. Williams, D. Nicholas, P. Huntington and B. Gunter,Doc dot com: reviewing the literature in digital healthinformation, Aslib Proceedings 54(2) (2002) 127–141.
[2] Yankee Group, Yankee Group Reports Find GrowingConsumer Demand in Europe, Coupled With FastGrowth Of Digital TV, Will Create TV-Based ‘InternetFor The Masses’, News release 16 March 2001. Availableat: www.yankeegroup.com/webfolder/yg21a.nsf/press/17CCFD73A796194085256A110049AFE7?OpenDocu-ment
[3] D. Nicholas, P. Huntington, P. Williams and B. Gunter,First Steps Towards Providing the Nation with HealthCare Advice and Information via their Television Sets:An Evaluation of Pilot Projects Exploring the HealthApplications of Digital Interactive Television. Reportpresented to the Department of Health (August 2002).
[4] GartnerG2, GartnerG2 Says Retailers Fail to Capitaliseon Increasing Interactive TV Adoption – Consumers AreSimply Not Using It. Available at: www3.gartner.com/5_about/press_releases/2002_01/pr20020118b.jsp(2002).
[5] National Opinion Poll, Web Access through TV Becom-ing Reality for Boy Surfers 8 February 2001). Available
at: www.nop.co.uk/news/news_survey_web_access.shtml (access date 4 February 2002).
[6] T. Clawson, Boxing clever, EBusiness January (2002) 26–29.
[7] D. Nicholas, P. Huntington and P. Williams, Comparingweb and touch screen transaction log files, Journal ofMedical Internet Research 3(2) (2001) e18. Available at:www.jmir.org/2001/2/e18/
[8] D. Nicholas, P. Huntington and P. Williams, Establish-ing metrics for the evaluation of touch screen kiosks,Journal of Information Science 27(2) (2001) 61–72.
[9] D. Nicholas, P. Huntington and P. Williams, Healthkiosk use: a national comparative study, Aslib Proceed-ings 53(4) (2001) 130–140.
[10] D. Nicholas, P. Huntington, P. Williams and P. Black-burn, Digital health information and health outcomes,Journal of Information Science 27(4) (2001) 265–276.
[11] D. Nicholas, P. Huntington and P. Williams, The impactof location on the use of digital information systems:case study health information kiosks, Journal of Doc-umentation 58(3) 284–301.
[12] P. Williams, D. Nicholas and P. Huntington, Non-use ofhealth information kiosks examined in an informationneeds context, Health Information and Libraries Review(submitted).
Evaluation of health applications of digital interactive television
192 Journal of Information Science, 29 (3) 2003, pp. 181–192 # CILIP
by David Nicholas on July 19, 2014jis.sagepub.comDownloaded from