An evaluation of Project iRead: A program created to improve ...
123
W&M ScholarWorks W&M ScholarWorks Dissertations, Theses, and Masters Projects Theses, Dissertations, & Master Projects 2014 An evaluation of Project iRead: A program created to improve An evaluation of Project iRead: A program created to improve sight word recognition sight word recognition Theresa Meade Marshall College of William & Mary - School of Education Follow this and additional works at: https://scholarworks.wm.edu/etd Part of the Educational Administration and Supervision Commons, Educational Leadership Commons, and the Language and Literacy Education Commons Recommended Citation Recommended Citation Marshall, Theresa Meade, "An evaluation of Project iRead: A program created to improve sight word recognition" (2014). Dissertations, Theses, and Masters Projects. Paper 1539618427. https://dx.doi.org/doi:10.25774/w4-321c-rz61 This Dissertation is brought to you for free and open access by the Theses, Dissertations, & Master Projects at W&M ScholarWorks. It has been accepted for inclusion in Dissertations, Theses, and Masters Projects by an authorized administrator of W&M ScholarWorks. For more information, please contact [email protected].
-
Upload
khangminh22 -
Category
Documents
-
view
1 -
download
0
Transcript of An evaluation of Project iRead: A program created to improve ...

W&M ScholarWorks W&M ScholarWorks
Dissertations, Theses, and Masters Projects Theses, Dissertations, & Master Projects
2014
An evaluation of Project iRead: A program created to improve An evaluation of Project iRead: A program created to improve
sight word recognition sight word recognition
Theresa Meade Marshall College of William & Mary - School of Education
Follow this and additional works at: https://scholarworks.wm.edu/etd
Part of the Educational Administration and Supervision Commons, Educational Leadership Commons,
and the Language and Literacy Education Commons
Recommended Citation Recommended Citation Marshall, Theresa Meade, "An evaluation of Project iRead: A program created to improve sight word recognition" (2014). Dissertations, Theses, and Masters Projects. Paper 1539618427. https://dx.doi.org/doi:10.25774/w4-321c-rz61
This Dissertation is brought to you for free and open access by the Theses, Dissertations, & Master Projects at W&M ScholarWorks. It has been accepted for inclusion in Dissertations, Theses, and Masters Projects by an authorized administrator of W&M ScholarWorks. For more information, please contact [email protected].

AN EVALUATION OF PROJECT iREAD: A PROGRAM CREATED TO IMPROVE SIGHT WORD RECOGNITION
A Dissertation
Presented to
The Faculty o f the School o f Education
The College of William and Mary in Virginia
In Partial Fulfillment Of the Requirements for the Degree
Doctor o f Education
byTheresa Meade Marshall
May 2014

AN EVALUATION OF PROJECT iREAD: A PROGRAM CREATED TO IMPROVE SIGHT WORD RECOGNITION
by
Theresa Meade Marshall
Approved May 2014 by
— t — a . rMichael F. DiPaola, Ed. D. Chairperson o f Doctoral Committee
Steven R. Staples, Ed. D.
Leslie W. Grant, Ph. D.

Dedication
We see the word family so often and in so many contexts. There is a reason for
this. Families stand by us and with us and sustain us. I dedicate this work to my family.
You, beloved ones, are the reason I am.

Table o f Contents
Acknowledgements.................................................................................................................... v
List o f T ab les ............................................................................................................................. vi
List o f F igures...........................................................................................................................vii
A bstract.....................................................................................................................................viii
Half-Title P a g e ........................................................................................................................... ix
Chapter 1: Background............................................................................................................... 1
Project iRead: T heory....................................................................................................6
Project iRead’s Program D esign .................................................................................. 8
Project iRead Program C ontext.................................................................................. 10
Description o f Project iR ead ........................................................................................ 11
A ctivities...........................................................................................................11
Participants....................................................................................................... 13
Expected O utcom es......................................................................................... 15
Program Evaluation M odel.......................................................................................... 15
Research Q uestions...................................................................................................... 17
Limitations of this S tudy ............................................................................................. 18
Delim itations................................................................................................................. 19
Operational Definitions................................................................................................19
Organization of the S tudy ............................................................................................20
Chapter 2: Review o f the Literature....................................................................................... 21
Development o f Reading.............................................................................................21
Phonemic Awareness..................................................................................... 22

Phonics.......................................................................................................... 23
Fluency.......................................................................................................... 24
V ocabulary................................................................................................... 25
Comprehension............................................................................................26
Word Recognition.....................................................................................................27
Sight Word D evelopm ent........................................................................... 29
Importance of Sight Word Vocabulary.................................................... 30
Research on Improving Sight Word Recognition...................................32
Intervention for Struggling R eaders.......................................................................33
A Constellation o f Problem s......................................................................34
Sum m ary.................................................................................................................... 36
Chapter 3: M ethodology.......................................................................................................38
Purpose...................................................................................................................... 38
Identifying Stakeholders............................................................................ 40
D esign........................................................................................................... 41
Ethical Considerations............................................................................... 42
Participants and Setting .......................................................................................... 43
Procedures................................................................................................................ 43
Data Collection.......................................................................................... 44
Instrumentation.......................................................................................... 45
Administration........................................................................................... 45
Scoring.........................................................................................................46
Reliability.................................................................................................... 47

V alidity ...................................................................................................... 50
Coding D a ta ............................................................................................................53
Question 1 ................................................................................................... 53
Question 2 .................................................................................................. 54
Question 3 .................................................................................................. 54
Question 4 .................................................................................................. 55
Question 5 .................................................................................................. 55
Question 6 .................................................................................................. 56
Data A nalysis.........................................................................................................56
Chapter 4: R esults.............................................................................................................. 58
Question O n e ......................................................................................................... 59
Sample Characteristics............................................................................59
A nalysis.....................................................................................................60
Question T w o ........................................................................................................ 62
Sample Characteristics............................................................................62
A nalysis.....................................................................................................63
Question T h ree ......................................................................................................64
Sample Characteristics........................................................................... 64
A nalysis.................................................................................................... 65
Question F o u r........................................................................................................68
Sample Characteristics........................................................................... 69
A nalysis.................................................................................................... 70
Question F iv e ........................................................................................................ 71

Sample Characteristics............................................................................ 72
A nalysis......................................................................................................73
Question S ix ........................................................................................................... 75
Sample Characteristics............................................................................ 75
A nalysis......................................................................................................76
Sum m ary.................................................................................................................78
Chapter 5: Discussion and Implications.......................................................................... 79
Findings................................................................................................................... 81
District D a ta ............................................................................................... 81
Early and Late Adopting School D a ta ................................................... 85
Standards o f Program Evaluation........................................................................88
Implications for P ractice ...................................................................................... 89
Implications for R esearch....................................................................................92
Final Thoughts.......................................................................................................96
References............................................................................................................................99
iv

Acknowledgements
Completing one’s doctorate is an enormous undertaking. It does not begin alone,
progress alone, or end alone. I am a fortunate woman. Dr. Michael DiPaola sat beside
me in the halls of our school of education and asked me, point blank, what I was thinking.
When we are called to examine our motivation and our goal, we are forced to articulate
our plans, hopes, and dreams. Sir, I thank you. My journey was easy because o f you.
My committee members have been more than just evaluators. Dr. Steven Staples
and Dr. Leslie Grant challenged me to think about the larger picture o f student
achievement, fidelity o f school participation, and district decision-making. Their input
continues to help me find ways to improve my leadership.
Additionally, I am indebted to Marcie Walsh. She created Project iRead. Her
efforts are recognized by our school district. Marcie has been a tireless advocate for
students. I truly believe this program can positively impact student growth. I also
believe Marcie will find a path to ensure Project iRead meets its potential.

List of Tables
Fourth Grade SOL Pass Rates from Central County’s School Report C a rd ..................... 4
Participant Dem ographics.........................................................................................................14
Uses o f CIPP in evaluations..................................................................................................... 17
PALS data g roups..................................................................................................................... 44
Early and Late Adoption S ite s ................................................................................................ 45
Reliability Coefficients for Word Recognition in Isolation.............................................. 48
Inter-rater Reliability for Word Recognition in Isolation..................................................49
Correlation Coefficients for Inter-rater Reliability............................................................. 50
Collinearity Statistics for Project iRead Participation........................................................60
Regression Analysis o f Word Recognition in Iso lation .................................................... 61
Regression Analysis o f Word Recognition Omitting Insignificant Predictors..............61
Variables Excluded from Fluency A nalysis....................................................................... 64
Best Fit Fluency Linear Regression M odel........................................................................64
Comprehension Regression Analysis R esults....................................................................67
Regression Analysis of Comprehension Omitting Insignificant Predictors.................67
Collinearity Statistics for Early and Late Adopting Schools.......................................... 70
Variables Excluded from Word Recognition in Isolation at iRead Schools.................71
Stepwise Linear Regression Results for Word Recognition at iRead Schools.............71
Fluency Regression Analysis Isolated to iRead Schools.................................................74
Fluency Regression at iRead Schools Omitting Insignificant Predictors..................... 74
Comprehension Regression Analysis Isolated to iRead Schools...................................77
Comprehension Regression at iRead Schools Omitting Insignificant Predictors 77
Summarized District D a ta ................................................................................................... 84

List of Figures
Project iRead Logic M odel....................................................................................................... 7
Conceptual model o f reading fluency ................................................................................... 31
vii

AN EVALUATION OF PROJECT iREAD: A PROGRAM CREATED TO IMPROVE SIGHT WORD RECOGNITION
ABSTRACT
This program evaluation was undertaken to examine the relationship between
participation in Project iRead and student gains in word recognition, fluency, and
comprehension as measured by the Phonological Awareness Literacy Screening (PALS)
Test. Linear regressions compared the 2012-13 PALS results from 5,140 first and second
grade students at adopting and non-adopting schools. Similar regressions were performed
at early and late adopting schools. The outcomes for Project iRead indicated statistically
significant improvement in word recognition at the district level. However, the results
were not practically significant as less than 1% o f the variation was explained by the
model. In addition, Project iRead appeared to have negative relationships with word
recognition, fluency, and comprehension when comparisons were conducted at early and
late adopting schools. Practice changes and further research would improve our
understanding of both sight word instruction and Project iRead. Amendments to Project
iRead’s implementation manual and additions to its Virtual Flash Card repertoire may
increase practical outcomes. A qualitative study may explain present outcomes.
Research that includes disability status and word recognition as predictors may provide
more insight into Project iRead’s best uses. Finally, limiting the data set to students 2
standard deviations from the mean or to students who are at or below grade level
benchmarks may be more indicative o f this program’s relationship to gains in reading.
THERESA MEADE MARSHALL
EDUCATIONAL POLICY, PLANNING, AND LEADERSHIP
THE COLLEGE OF WILLIAM AND MARY IN VIRGINIA

AN EVALUATION OF PROJECT IREAD: A PROGRAM CREATED TO
IMPROVE SIGHT WORD RECOGNITION

Chapter One
Background of the Study
Today, America’s schools fight a battle for accreditation. They strive to meet the
annual measurable objectives (AMO) specified by the Elementary and Secondary
Education Act (ESEA) (2012). The latest iterations o f the ESEA, No Child Left Behind
(NCLB) Act and Race to the Top (RTTT) require annual growth and standardized testing
with ever-increasing achievement expectations for every demographic group and every
child (NCLB, 2002). The pressure to prepare all students for the standardized
assessments and produce necessary student gains is at the forefront o f many educational
conversations. The majority o f the impact and stress o f these federal mandates are both
exerted and felt at tested grade levels. While this varies from state to state, the tension—
and the standardized testing—typically starts in third grade as only California and Iowa
test primary students.
The need to meet these standards is felt by school superintendents, principals, and
teachers. These educators and leaders search for proven programs that allow them to
meet the challenge of educating students with diverse backgrounds and abilities. One of
those school districts, named Central County for this study, encourages its teachers to go
beyond the basic requirements o f state and federal standards in order to deliver a premier
education to all its students. The results should be seen in students’ career and college
readiness.
And yet, learning does not begin in high school or in third grade. Indeed, critical
foundations are laid in the primary grades. Although students in kindergarten, first, and
second grades do not typically take standardized tests, under NCLB (2002) their teachers
are still responsible for ensuring children read by the time they reach third grade. This
1
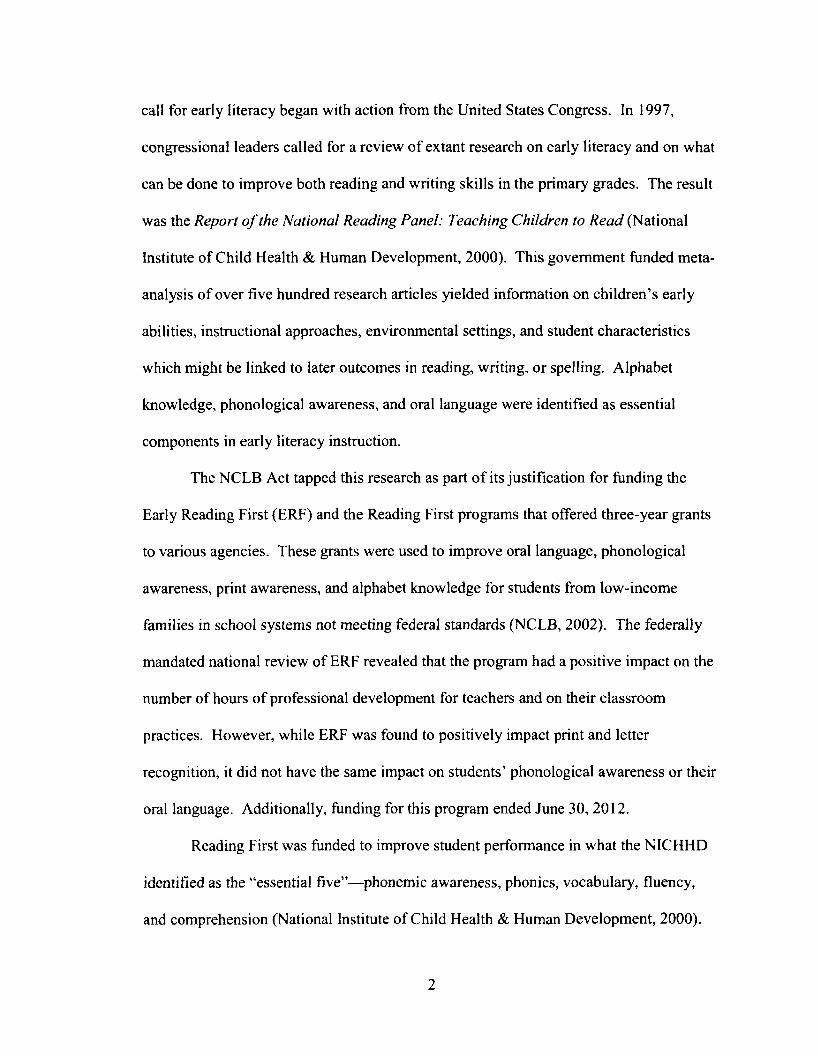
call for early literacy began with action from the United States Congress. In 1997,
congressional leaders called for a review o f extant research on early literacy and on what
can be done to improve both reading and writing skills in the primary grades. The result
was the Report o f the National Reading Panel: Teaching Children to Read (National
Institute of Child Health & Human Development, 2000). This government funded meta
analysis o f over five hundred research articles yielded information on children’s early
abilities, instructional approaches, environmental settings, and student characteristics
which might be linked to later outcomes in reading, writing, or spelling. Alphabet
knowledge, phonological awareness, and oral language were identified as essential
components in early literacy instruction.
The NCLB Act tapped this research as part o f its justification for funding the
Early Reading First (ERF) and the Reading First programs that offered three-year grants
to various agencies. These grants were used to improve oral language, phonological
awareness, print awareness, and alphabet knowledge for students from low-income
families in school systems not meeting federal standards (NCLB, 2002). The federally
mandated national review of ERF revealed that the program had a positive impact on the
number o f hours o f professional development for teachers and on their classroom
practices. However, while ERF was found to positively impact print and letter
recognition, it did not have the same impact on students’ phonological awareness or their
oral language. Additionally, funding for this program ended June 30, 2012.
Reading First was funded to improve student performance in what the NICHHD
identified as the “essential five”—phonemic awareness, phonics, vocabulary, fluency,
and comprehension (National Institute of Child Health & Human Development, 2000).
2

The methods o f improvement included providing professional development, progress
monitoring, materials, interventions, and reading coaches. In 2008, the federal
government called for a report on the efficacy of the program. The Reading First Impact
Study Final Report (RF1SFR) (Gamse, Jacob, Horst, Boulay, & Unlu, 2008) detailed
those results. The researchers found that Reading First had a positive and significant
impact on instructional time on task, professional development, and decoding. However,
the program had no discemable impact on student comprehension. Regardless o f utility,
funding for this program ended June 30, 2010.
The issue o f early literacy impacts the nation’s schools at multiple points and is
measured with a variety o f instruments. Data can be examined at the national, state,
district, school, classroom, or student level. Statistics indicate a continuing deficiency in
our students’ reading abilities. The National Center for Education Statistics (NCES)
conducts a biennial National Assessment o f Educational Progress (NAEP) (U. S.
Department o f Education, 2011). NCES rates student performance on this test as basic,
proficient or advanced. Students scoring in the basic range manifest only partial mastery
of the knowledge and skills necessary for grade level work while proficient students
exhibit solid academic performance and competency. In 2011, the NAEP indicated that
only 32% of all fourth grade students nationwide scored at a proficient level or higher.
The tests also revealed that 39% of Virginia’s fourth graders performed at the same level.
The tests are meant to be representative o f the state and the nation, not o f a particular
school district. However, the data in Table 1 indicates that Central County Public
School’s (the school district’s and its schools’ names have been changed to protect
anonymity) pass rates for the Virginia Fourth Grade Reading Standard of Learning Test
3

(SOL) are quite similar to the state’s overall results (Virginia Department o f Education,
2012). Thus one might extrapolate that the results of NAEP are similarly representative
of the county’s students. And while a high percentage of students are passing the SOL,
their success does not translate to the NAEP statistics.
Table 1
Fourth Grade SOL Pass Rates from Central County’s School Report Card
Student Subgroup Type 2009-2010 2010-2011 2011-2012
All Students Division 90 88 89
State 88 87 88
Female Division 92 90 92
State 90 89 90
Male Division 89 87 86
State 87 85 86
Black Division 87 85 86
State 80 77 79
Hispanic Division 84 83 84
State 85 81 83
White Division 95 94 94
State 92 92 92
Students with Disabilities Division 74 70 68
State 76 68 67
Economically Division 83 80 81
disadvantaged State 81 79 80
While NAEP measures achievement o f fourth grade students, it is the instruction
they receive in the primary grades that builds the basis of literacy. The National Early
Literacy Panel found several strong and consistent predictors o f successful development
of literacy skills (2009). These include understanding graphemes and their associated
4

phonemes, knowing how to manipulate syllables, and being able to write one’s name.
Central County is grappling with early literacy on several levels. The district has forty-
five elementary schools. However, only twenty-two o f those schools house federally
funded preschool classes. Even then, there are a total o f just thirty classes. In
comparison, the county provides one hundred ninety-three kindergarten classes. The
federally funded preschools have a maximum o f 18 students while kindergarten
classrooms typically consist of 20 students. This grants access to federally funded
preschool to less than 14% of the district’s students. Thirty-eight percent o f Central
County’s student body is eligible for free and reduced lunch (Virginia Department o f
Education, 2011). Studies have indicated that children from a low socioeconomic
background struggle to master spoken and written language skills (Pruitt, Oetting, &
Hegarty, 2010; Terry, Thomas-Tate, & Love, 2010; Whitehurst & Fischel, 2000).
Therefore, less than half o f the students who might benefit from preschool are able to
participate in the program due to shortages in funding from federal, state, and local
sources.
In addition to providing preschools Central County Public Schools, like other
districts across the nation, relies upon the research theories o f NICHHD (2000). Their
“essential five” components of reading—phonics, phonemic awareness, fluency,
comprehension, and vocabulary—are central in today’s research-based reading programs.
There is no doubt that phonemic awareness is a large part o f both reading and reading
comprehension (Ehri & McCormick, 1998; Snider, 1997). However, success is also
predicated on fluency (Rasinski, Samuels, Heibert, Petscher & Felle, 2011; Samuels,
2006). That fluency is impacted not only by students’ phonemic abilities, but also by
5

their facility with common sight words. Before students can leam to read words
automatically and effortlessly, as suggested by the NICHHD (2000) and as mandated by
NCLB (2002), students must leam and practice words in isolation (Camine, Silbert,
Kameenui, & Tarver, 2004). Gunning (2003) adds that students must become accurate
readers and they will “have automaticity if they recognize the words rapidly” (p. 196).
Additionally, Hiebert, Samuels, and Rasinski (2012) argue that “proficient silent reading
is the means whereby individuals access the ever-increasing stores o f knowledge within
texts that are required for the workplace and community” (p. 114). Such proficiency can
occur only when students have both the ability to decode words and the ability to
recognize words.
How can Central County provide high quality, research based programs which not
only meet the need to increase students’ sight word vocabulary, but do so in a systematic
and engaging way? This was the question facing the program’s creator in the summer of
2008 when she created Project iRead. This program originated as a method to enlarge the
sight word vocabularies o f students in a single classroom. It has since grown to serve
approximately 7,000 students.
Project iRead: Theory
Fitzpatrick, Sanders, and Worthen (2012) use program theory to explain the logic
of a program. One o f Central County School District’s answers to the problem of word
recognition is Project iRead. A logic model supporting Project iRead is illustrated in
Figure 1. While a logic model provides a structure for understanding the machinations of
Project iRead and facilitates the program evaluation, grounding this logic model in the
6

program’s underlying theory will help ascertain if and why the program will achieve its
intended goals.
• Teachers are introduced to the Project iRead model• Teachers receive ongoing professional development
• Teachers implement Project iRead with fidelity• Data on sight word and fluency are collected
• Students increase sight word vocabulary
• Students improve fluency rates
Figure 1. Project iRead Logic Model
If one knows the program’s extant and stated inputs, activities, outputs, and
outcomes, then it is possible to align these components with the program’s underlying
theory (Weiss, 1997). “Theories help people understand phenomena, guide how people
react to and make sense o f the natural world, and should help frame how people explain
and understand phenomena under study” (Amrein-Beardsley & Haladyna, 2012, p. 18).
Weiss adds that theory-based evaluation can “show the series of micro-steps that lead
from inputs to outcomes.. ..if some of the posited steps are not bome out by the data, then
the study can show where the expected sequence o f steps breaks down” (p. 43).
Project iRead’s developer and a major stakeholder stated that she has anecdotal
notes suggesting the program’s ability to improve sight word recognition and student
fluency rates (personal communication, January 17, 2013). Thus, Project iRead was
created on her theory that repeated exposure to sight words at each student’s individual
7
MInputs
V iActivities
MOutputs
VOutcomes

ability level would lead to improved reading outcomes for students in kindergarten, first
and second grades. Weiss (1997) maintains that researchers should avoid sole reliance on
stakeholders’ overly simplistic theoretical models and instead suggests combining
stakeholder input with extant research to build program theory.
Research analyzed in Report o f the National Reading Panel: Teaching Children
to Read (NICHHD, 2000) offers several theories about reading. These suggestions may
support Project iRead’s design and expected outcomes. The panel, through extensive
review of existing research, found that repeated oral reading led to improvements for both
good and poor readers. However, research also suggests that such repeated readings
should be accompanied by feedback and guidance. The National Reading Panel also
maintains that, while accuracy o f word recognition is not the goal o f reading, such
accuracy, efficiency, and automaticity is essential for fluency. And, as noted previously,
fluency is essential for reading comprehension (Rasinski et al., 2011; Samuels, 2006).
Hence, an existing theory regarding early literacy supports teaching sight words by
giving students multiple opportunities to read both to themselves and to others in order to
improve their accuracy and automaticity (Biemiller, 2006; Camine et al., 2004; Homan et
al., 1993). This notion of improved facility is the foundation of Project iRead, supports
the program creator’s anecdotal observations, and provides the theoretical groundwork
for this program.
Project iRead’s Program Design
Project iRead utilizes iPods to teach Dolch sight words. The program’s creator
used Microsoft PowerPoint to combine QuickTime movies and sound. The selection o f
movies includes all the sight words at a particular level—from pre-primer through third
8

grade. Additionally, students can access a smaller subset o f those sight words as the
program’s creator has crafted practice sets o f ten words to reduce frustration rates for
some students. Younger students can also practice letter recognition and letter sounds
while older students or those who need more challenging work can read passages in order
to improve their fluency.
Project iRead consists o f virtual flash cards (VFC) and virtual repeated readings
(VRR). This program evaluation, due to its limited scope, will focus only on the results
achieved using VFC which allow students to work on their own level with either letter
names and sounds or sight words. The Dolch (1936) sight word list is not the only list of
sight words, but it is one of the oldest and perhaps most popular English sight word lists.
Dolch built on the work o f contemporaries and published his research in 1936. Dolch’s
list consists o f 220 sight words common to the International Kindergarten Union, the
Gates List, and the Wheeler-Howell List. In 1970, Johns conducted research and found
the Dolch sight word list continues to be relevant to the subject matter students are
taught. Today, teachers continue to utilize this list.
Project iRead’s VFCs provide visual, oral, and aural practice o f sight words.
When using VFCs, students see the word, say the word, and hear the word. There is a
three second delay between the time the word appears and the time the recording o f the
word is heard. Students are expected to speak the words aloud during this pause and then
listen for the correct word as the recording plays. In this way, students either receive
immediate reinforcement for words read correctly or immediate correction for words read
incorrectly. The program’s creator has designed 10-word lists for students with difficulty
9

attending to an entire list o f 40 to 50 words. This allows teachers more freedom in
scheduling students for the program and in differentiating for individual student needs.
Project iRead Program Context
The program’s creator was a Central County exceptional education teacher
working in a collaborative fourth grade classroom in 2007. Her school, Left Bank (all
school names are pseudonyms), received Title I funding and her students functioned on
many different reading levels. Project iRead’s creator found traditional sight word
instruction cumbersome and ineffective with the high variation in reading levels. During
the summer o f 2008 Project iRead’s creator learned how to turn Keynote presentations
into Quicktime® movies. She used this skill to create flash card files that would allow the
audio portion of a Quicktime® movie to provide the immediate reinforcement or
correction she had been doing in person. This portion of the program aligns with the
theory o f sight word development and fluency noted in the National Reading Panel’s
research (NICHHD, 2000).
The project expanded after Project iRead’s creator attended a second summer
professional development institute offered by Central County which dealt with reading
fluency interventions. She realized that several research-based fluency practices could be
replicated using the recording functions on MacBooks and iPods. This led to the
development o f the second component o f iRead— the Virtual Repeated Readings. This
component uses variations on the fluency practices of repeated readings, modeled
reading, choral reading, and paired or supported reading (Adlof, Catts, & Little, 2006;
Armbruster, Lehr, Osborn, 2001; Hicks, 2009).
10
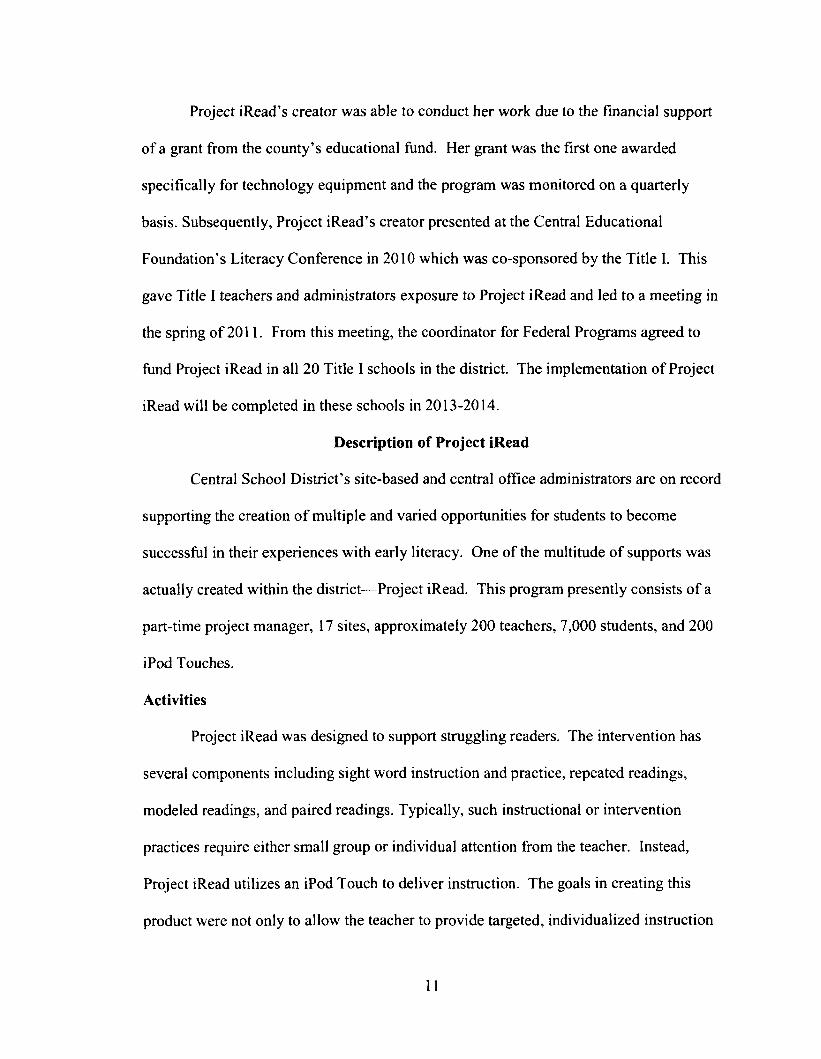
Project iRead’s creator was able to conduct her work due to the financial support
of a grant from the county’s educational fund. Her grant was the first one awarded
specifically for technology equipment and the program was monitored on a quarterly
basis. Subsequently, Project iRead’s creator presented at the Central Educational
Foundation’s Literacy Conference in 2010 which was co-sponsored by the Title I. This
gave Title I teachers and administrators exposure to Project iRead and led to a meeting in
the spring o f 2011. From this meeting, the coordinator for Federal Programs agreed to
fund Project iRead in all 20 Title I schools in the district. The implementation o f Project
iRead will be completed in these schools in 2013-2014.
Description of Project iRead
Central School District’s site-based and central office administrators are on record
supporting the creation o f multiple and varied opportunities for students to become
successful in their experiences with early literacy. One of the multitude o f supports was
actually created within the district— Project iRead. This program presently consists o f a
part-time project manager, 17 sites, approximately 200 teachers, 7,000 students, and 200
iPod Touches.
Activities
Project iRead was designed to support struggling readers. The intervention has
several components including sight word instruction and practice, repeated readings,
modeled readings, and paired readings. Typically, such instructional or intervention
practices require either small group or individual attention from the teacher. Instead,
Project iRead utilizes an iPod Touch to deliver instruction. The goals in creating this
product were not only to allow the teacher to provide targeted, individualized instruction

to students but also to provide that instruction in the most engaging manner possible, i.e.
the novelty effect o f using an iPod Touch.
Each iPod Touch is loaded with Virtual Flash Cards (VFC). These were created
using Apple’s Keynote and then rendered as QuickTime® movies. Ideally, students see a
word—visual stimulus, then say the word— oral stimulus, then hear the word— aural
stimulus. As stated previously, there is a three second pause between the appearance o f a
word on the iPod’s screen and the time the recording can be heard. This delay creates a
“game” aspect for Project iRead because students strive to say the words they encounter
before the other player— Project iRead’s creator— is able to say them. Thus, students
increase their sight vocabulary with immediate reinforcement or correction. All o f this
occurs without direct teacher or interventionist supervision.
Students may also utilize the Virtual Repeated Readings (VRR) loaded onto the
iPod Touches. In this option, students record themselves reading an unfamiliar passage.
Students then read the passage silently while listening to a teacher-generated recording
which models proper fluency. The next step in this process requires students to record
themselves reading aloud with the teacher-generated recording as a paired reading. The
final step is for students to record themselves reading the passage alone. Teachers may
listen to the initial student reading and the final student reading in order to gauge student
progress. Running records can be utilized to gather these data.
Data collection is another component o f the program. A baseline screening
allows educators to determine which sight word list is appropriate for students to use.
Words are available from letter recognition and pre-primer levels to third grade. Running
records allow teachers to determine students’ fluency rates before and after VRR.
12

The combination o f sight words and short passage readings give primary grade
teachers a host of options for differentiating instruction in the classroom. More
importantly, Project iRead provides students direct instruction at their level. The
question for this study is whether participation in Project iRead instruction is meeting its
goal o f increasing student reading performance as measured with the fluency and
comprehension components o f the Phonological Awareness Literacy Screening (PALS).
Participants
Seventeen of the Central School District’s 45 elementary schools presently use
Project iRead as an instructional tool with kindergarten, first grade, and second grade
students. Twenty-seven schools do not use Project iRead, and one o f the district’s schools
only serves students in grades 3-5. The populations and accreditation status in reading of
the participating schools are displayed in Table 2.
13

Table 2
Participant Demographics
Number o f Students Accreditation Status
School Total K-2 State Federal AMO
Anderson 468 214 Accredited Fully met
Barton 489 228 Accredited Fully met
Downtown 493 228 Accredited Not met in reading
Derbyshire 590 300 Accredited Fully met
Fairlawn 366 149 Accredited Fully met
Glades 538 170 Accredited Fully met
Harvest 607 282 Accredited Not met in reading
Highview 500 253 Accredited Fully met
Jones 490 239 Accredited Fully met
Lance 546 263 Accredited Fully met
Lakeview 472 223 Accredited Not met in reading
Left Bank 541 243 Accredited Fully met
Meadowbrook 619 327 Accredited Fully met
Rappahannock 465 205 Accredited Fully met
Restful 524 254 Accredited Not met in reading
Tidewater 669 341 Accredited Fully met
W ater’s Edge 515 252 Accredited Fully met
Fifteen o f the schools using Project iRead receive Title I funds. As part o f the
Elementary and Secondary Education Act, Title I funding provides additional money for
at risk students from impoverished communities (U. S. Department o f Education, 2003).
Those funds were utilized for Project iRead. Meadowbrook and Tidewater schools are
not Title I schools. Instead, they received funding from their PTAs in order to implement
Project iRead.
14

Expected Outcomes
The National Reading Panel (NICHHD, 2000) estimates that 20% o f students
experience difficulties with reading. Adams (1990) posits as many as one-third of
primary students grapple with the skills necessary to read. Project iRead’s
comprehensive manual affirms the purpose o f the project is to support struggling readers.
Therefore, the goals o f this program mirror the goals for many American schools.
This program evaluation will focus only on the VFC. Their purpose includes
increasing sight word recognition, improving fluency, freeing working memory, and
thereby boosting comprehension. An additional expectation is for students to retain those
skills over time. The use o f novel technology, differentiated instruction, and research-
based methods are expected to create successful student outcomes.
Program Evaluation Model
Program evaluations take many forms. One noted researcher identified 22
approaches (Stufflebeam, 2000a). Fitzpatrick, Sanders, and Worthen (2012) assert that
no single model meets every agency’s needs. Rather, each situation should be examined
to determine the best design to utilize. They distilled Stufflebeam’s 22 approaches into
five broad categories— expertise-oriented, consumer-oriented, program-oriented,
decision-oriented, and participant-oriented. Additionally, the Joint Committee on
Standards for Educational Evaluation (JCSEE) has identified areas o f utility, feasibility,
propriety, and accuracy researchers should consider as they conduct studies (Yarbrough,
Shulha, Hopson, & Caruthers, 2011). These JCSEE standards dictate that a program
evaluation must be responsive to stakeholder needs, conducted in a timely manner, serve
15
its intended purpose, be comprised of practical procedures, employ systematic
information collection, and yield reliable information.
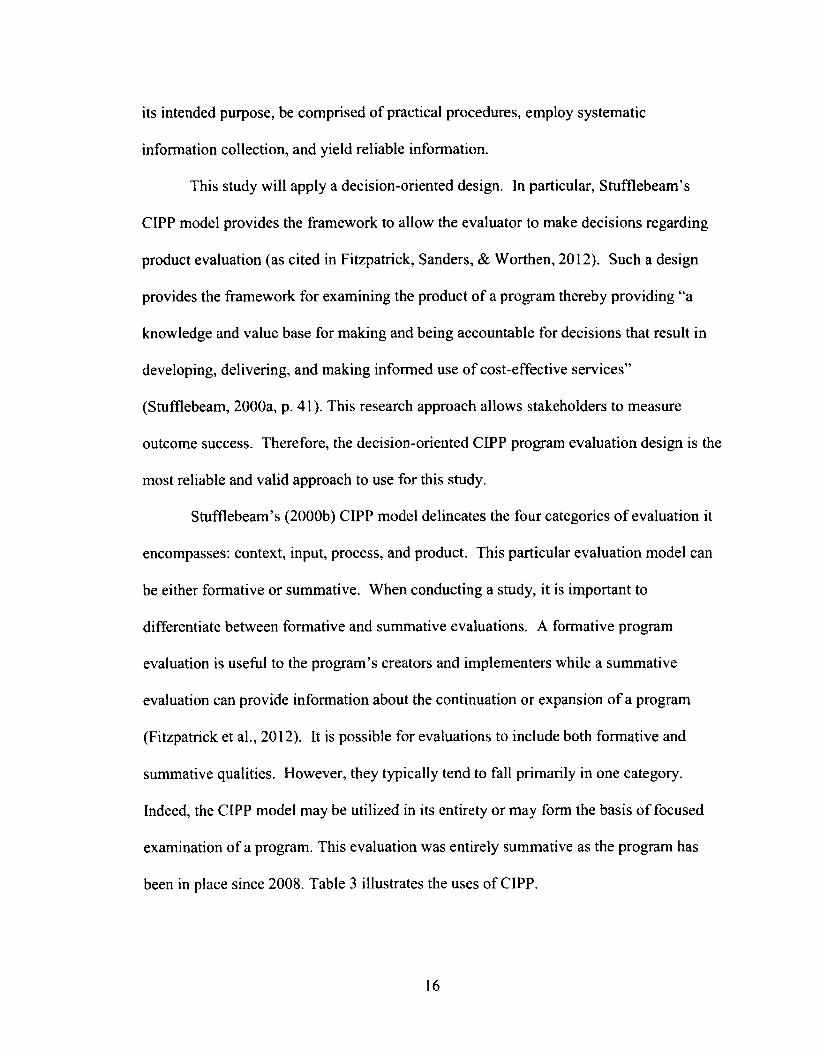
This study will apply a decision-oriented design. In particular, Stufflebeam’s
CIPP model provides the framework to allow the evaluator to make decisions regarding
product evaluation (as cited in Fitzpatrick, Sanders, & Worthen, 2012). Such a design
provides the framework for examining the product o f a program thereby providing “a
knowledge and value base for making and being accountable for decisions that result in
developing, delivering, and making informed use o f cost-effective services”
(Stufflebeam, 2000a, p. 41). This research approach allows stakeholders to measure
outcome success. Therefore, the decision-oriented CIPP program evaluation design is the
most reliable and valid approach to use for this study.
Stufflebeam’s (2000b) CIPP model delineates the four categories o f evaluation it
encompasses: context, input, process, and product. This particular evaluation model can
be either formative or summative. When conducting a study, it is important to
differentiate between formative and summative evaluations. A formative program
evaluation is useful to the program’s creators and implementers while a summative
evaluation can provide information about the continuation or expansion o f a program
(Fitzpatrick et al., 2012). It is possible for evaluations to include both formative and
summative qualities. However, they typically tend to fall primarily in one category.
Indeed, the CIPP model may be utilized in its entirety or may form the basis o f focused
examination of a program. This evaluation was entirely summative as the program has
been in place since 2008. Table 3 illustrates the uses o f CIPP.
16

Table 3
Uses o f CIPP in evaluations
Evaluation’sRole Context Input Process ProductSummative Compares
assessedstrengths,weaknesses,opportunitiesand threats togoals
Compares strategies, design, and budget to competitors or beneficiaries
Describes processes and compares designed to actual processes
Compares outcomes to needs and interprets the results in light o f context, input and process
Formative Provides guidance for identifying intervention needs and ranking goals
Assists in choosing a program
Guidance for implementing the operational plan bymonitoring and adjusting program activities
Determines whether the program should be continued, modified, or terminated
Research Questions
This study was undertaken to determine the effectiveness o f the Project iRead
program. In particular, Central County wished to understand the impact of this program
on early literacy. The following research questions will guide this study:
1. What is the relationship between participation in Project iRead and student word
recognition as identified by student growth on the PALS test?
2. What is the relationship between participation in Project iRead and student
fluency as identified by student growth on the PALS test?
3. What is the relationship between participation in Project iRead and student
comprehension as identified by student growth on the PALS test?
17

4. What is the relationship between participation in Project iRead and student word
recognition at early adopting schools as identified by student growth on the PALS
test?
5. What is the relationship between participation in Project iRead and student
fluency at early adopting schools as identified by student growth on the PALS
test?
6. What is the relationship between participation in Project iRead and student
comprehension at early adopting schools as identified by student growth on the
PALS test?
Limitations of this Study
This evaluation o f Central County’s Project iRead program was limited to the
district’s use. Although the data may provide further understanding o f the relationship
between word recognition and comprehension, the evaluation itself may not be
generalizable to other school districts due to the specificity o f context in Central County.
Additionally, this evaluation was limited by the resources available to complete it.
Money, personnel, and especially prevented a complete CIPP analysis o f all components
likely to be identified by concerned stakeholders. Instead, this program evaluation
focused on key questions that provide the best indication o f the connection between the
Project iRead and student achievement.
As the researcher, a county employee, and previous site coordinator for Project
iRead, I brought my own limitations to this study. It is possible that bias may have
played a part in the manner in which components were chosen for review, in the rigor o f
18

analysis, and in the specificity o f the final reporting. Thus, the very nature o f using an
internal program analyst limits the generalizability of this research.
Delimitations
This study was delimited in several ways. These include the choice o f problem,
population, research questions, and choice o f philosophical framework. Although there
are many ways in which this research is delimited, there remains the possibility for an
increased understanding o f the development o f reading and the practicality o f this
particular program in supporting reading. By using a constructivist framework, the
researcher worked with program stakeholders to build an understanding o f the program
outcomes.
Operational Definitions
Concept of Word - The awareness o f the match between the spoken word and the written
word in the reading o f text (Morris, 1993)
Fluency - the combination of accuracy, automaticity, and prosody which facilitates a
reader’s construction of meaning and supports comprehension (Kuhn, Schwanenflugel, &
Meisinger, 2010)
Phonemic awareness - The ability to focus on and manipulate phonemes in spoken words
(National Reading Panel, 2000)
Phonics - The relationship between written letters and sounds (Camine, Silbert,
Kame’enui & Tarver, 2004)
Program evaluation - the identification, clarification, and application o f defensible
criteria to determine the program’s worth or merit in relation to those criteria (Fitzpatrick,
Sanders, & Worthen, 2012)
19

Reading comprehension - The ability to process both the graphemes and phonemes o f a
word in a manner that renders meaning to the entirety o f the text (Ehri, 1998)
Sight words - Words that are recognized and known by rote memorization and the use of
visual cues such as word length, letter configurations, or logos as mnemonic aids (Ehri &
McCormick, 1998)
Stakeholder - Anyone involved in a program being evaluated or who might be affected
by or interested in the findings o f the evaluation (Gall, Gall & Borg, 2007)
Vocabulary - The productive and receptive words known to a person and used for
listening, speaking, reading or writing (Pearson, Hiebert, & Kamil, 2007)
Word recognition - Words that are recognized or used in print (Armbruster, Lehr &
Osborn, 2003)
Organization of the Study
Chapter One presented the introduction, problem, research questions, limitations,
delimitations, and a definition of terms. The following chapter contains a review of the
literature as it relates to present educational mandates, early childhood literacy, and sight
word vocabulary. Chapter Three outlines the methodology and procedures to use in
gathering the data for this study. The results and findings will be reported in Chapter
Four. The final chapter will contain a summary o f the study, its findings, conclusions
drawn, a discussion, and recommendations for further study.
20

Chapter Two
Review of the Literature
The purpose o f this literature review is to ground the Project iRead program
evaluation in the context o f extant, relevant research. The literature review begins with
the background o f word recognition and its impact on reading. The process o f
developing a sight word vocabulary and the importance of that vocabulary are also
explored. The review then turns to the research on struggling readers and current models
for providing intervention. The findings are summarized at the end o f this chapter. The
evaluation itself will gather information regarding the implementation and outcomes of
an early literacy program utilized for struggling students in primary grades. The
information garnered from this study will aid the program’s designer and other
stakeholders as they continue to refine Project iRead.
Development of Reading
From the time children first begin to vocalize words, they learn that particular
sounds are associated with specific objects, events, and psychological states (Klein,
1981). However, the ability to link written texts to oral language is a skill that must be
explicitly taught to our children (Foorman, Chen, Carlson, Moats, Francis & Fletcher,
2003). The National Early Literacy Panel (2008) and Snow, Bums, and Griffin (1998)
maintain that experiences with print are extremely valuable to preschool students.
However, although President Obama has called for universal preschool, federal mandates
for preschool do not currently exist. Thus, as the International Reading Association
(IRA) and the National Association for the Education o f Young Children (NAEYC) have
21

observed, our kindergarten students arrive at school with a vast and problematic
difference in their knowledge about concept o f word (IRA,1998; NAEYC, 1998).
This notion of direct instruction was further supported by a joint position
statement from the IRA and the NAEYC wherein they argue that no one naturally
becomes literate (1998). Instead, the leaders o f the IRA and NAEYC contend the
combination of play and the exposure to informal adult instruction form the basis for
literacy (Anbar, 1986; Scarborough & Brady, 2002). Reading aloud constitutes the most
important form of informal instruction parents and early childcare providers can give
young students (NICHHD, 2000). Reading with children allows them to develop the
alphabetic principle— the idea that “the letters that comprise our printed language stand
for the individual sounds that comprise our spoken language” (Byrne, 1998, p. 1).
Indeed, the ability to link oral language— phonemes— to written language— graphemes—
is fundamental for reading (Ehri, 2005).
The importance o f the five pillars o f reading must be recognized here. Research
shows that the development o f reading is complicated. No single factor determines a
child’s ability to read. Rather, the combination o f phonemic awareness, phonics, fluency,
vocabulary, and comprehension act in unison to produce readers (NICHHD, 2000).
However, Ehri (2005) argues one o f the ultimate goals of reading instruction is
automaticity with word recognition which “is essential for achieving text-reading skill”
(p. 170).
Phonemic Awareness
Phonemes are the sounds that comprise our language. Phonemic awareness is the
ability to understand and manipulate those sounds (NICHHD, 2000). Griffith and Olson
22
(1992) suggest there are levels o f phonemic awareness. The easiest tasks call for students
to rhyme words. Blending phonemes is an intermediate phonemic skill. The most
difficult phonemic awareness tasks involve the complete segmenting o f words and then
manipulating phonemes to create new words. Examples include asking a student to
pronounce the word nest without the s sound or saying hill without the h sound.
Adams’ (1990) seminal research on reading indicates that it is “not working
knowledge o f phonemes that is so important but conscious, analytic knowledge. It is
neither the ability to hear the difference between two phonemes nor the ability to
distinctly produce them that is significant. What is important is the awareness that they
exist as abstractable and manipulable components o f the language” (p. 65). The
NICHHD’s (2000) meta-analysis showed that phonemic awareness can be taught to
students thereby increasing the likelihood they will become successful readers.
Phonics
“Phonics instruction teaches the relationships between the letters o f written
language (graphemes) and the individual sounds of spoken language (phonemes)”
(Camine, Silbert, Kame’enui & Tarver, 2004, p. 38). While phonemic awareness is the
ability to segment spoken words into segments and then manipulate those segments
(NICHHD, 2000), phonics moves the student a step further towards reading by
associating specific sounds with particular letters. The purpose of phonics instruction is
to encourage students to leam and use the alphabetic principle— that connection between
phonemes and graphemes— to recognize familiar written words and decode new ones
(Harris & Hodges, 1995). This is a particularly important connection for those who
23

speak English as this language has a strong tie between the spoken language and its
written code (Moats, 2000; Venezky, 1999).
One might ask how important the connection is between the abstract symbols
representing words, spoken language, and the ability to read. The NICHHD’s (2000)
meta-analysis o f extant research indicates that planned phonics instruction creates
significant gains for all students in kindergarten through sixth grade, particularly those
children having a difficult time learning to read. Thus, research indicates that explicit
phonics instruction is both valuable and essential in classroom reading programs (Starrett,
2006).
Fluency
Fluency describes a person’s ability to read with speed, accuracy, and expression
(NICHHD, 2000). Speed refers to the number o f words per minute a student reads,
accuracy refers to reading those words accurately either by sight or by decoding and
prosody means reading in a conversational tone with proper expression and phrasing.
These three components o f fluency are all critical to success in reading, but one
component alone cannot guarantee that students make the leap to good reading
comprehension. The National Reading Panel states, “Although accuracy in word
recognition is, indeed, an important reading milestone, accuracy is not enough to ensure
fluency— and without fluency, comprehension might be impeded” NICHHD, 2000, p.
193). Hudson, Lane, and Pullen (2005) expound upon this argument by adding, “Each
aspect o f fluency has a clear connection to text comprehension. Without accurate word
reading, the reader will have no access to the author’s intended meaning, and inaccurate
word reading can lead to misinterpretations o f the text. Poor automaticity in word
24

reading or slow, laborious movement through the text taxes the reader’s capacity to
construct an ongoing interpretation o f the text. Poor prosody can lead to confusion
through inappropriate or meaningless groupings o f words” (p. 703).
Schreiber’s (2001) research indicates that fluency also describes the ability to
group words into meaningful units by determining where to place emphasis and where to
pause in order to make sense of the text. The Institute of Education Sciences’ evaluation
o f the Reading First Initiative showed that, although many students became adept at
decoding text, they did not make equal gains in comprehension ability (Gamse, Jacob,
Horst, Boulay, & Unlu, 2008). Additionally, the National Assessment o f Educational
Progress (NAEP) found that 44% of fourth graders are not fluent readers. The National
Reading Panel (NICHHD, 2000) contends that reading requires both the recognition o f
words and the construction of meaning for those words. If students are utilizing their
working memory to decode and are not fluent the consequence is a loss o f cognitive
resources to expend upon comprehension.
Vocabulary
Heibert and Kamil (2005) claim “vocabulary is not a developmental skill or one
that can ever be seen as fully mastered. The expansion and elaboration o f vocabularies is
something that extends across a lifetime” (p. 2). They add that vocabulary is a working
knowledge of the meaning of words. More specifically, readers must have an adequate
receptive vocabulary in order to continue to develop their reading ability. In fact,
Camine et al. (2004) assert that “with inadequate vocabulary knowledge, learners are
asked to develop novel combinations o f known concepts with insufficient tools” (p. 331).
The National Reading Panel’s (NICHHD, 2000) meta-analysis of extant research found
25

that vocabulary is strongly related to reading comprehension. The NRP adds that
vocabulary and comprehension are closely linked because o f the nature o f their
definitions. Vocabulary describes the understanding o f single words while
comprehension involves understanding larger units thus separating the two processes is
nearly impossible.
Comprehension
The National Institute for Literacy defines comprehension as “the reason for
reading” (Armbruster, Lehr, & Osbom, 2003, p. 41). Willis (2008) adds that most
reading researchers conceptualize reading comprehension as the depth o f understanding a
reader has for the text. It is also important to note that while students may sound fluent
when reading a text aloud, if those students are merely calling out words, then they are
not extending their capacity as readers (Chall, 1999; Diehl, Armitage, Nettles, &
Peterson, 2011).
The NRP (NICHHD, 2000) compiled the results of studies on the effects o f
metacognitive awareness, comprehension monitoring, cooperative learning, curriculum
plus strategies (the teaching of strategies such as prediction, clarification, and
summarizing), use o f graphic organizers, active listening, mental imagery, mnemonics,
multiple strategy instruction, reciprocal teaching, prior knowledge, question answering,
question generation, story structure instruction, summarization instruction, and
vocabulary instruction on comprehension. The panel also investigated the impact o f
teacher training on student comprehension. The panel did not find one particular method
of instruction superior to any other method.
26

Reading is a layered and complex act. Extracting meaning from text depends
upon the ability to utilize phonemic awareness, phonics, fluency and vocabulary
(NICHHD, 2000). The NRP did not come to this conclusion on its own. Rather, it
sought input from 125 stakeholders at regional hearings across the United States. The
resulting examination of research revealed the complexity and intertwined nature of
reading. Scharer, Pinnell, Lyons, and Fountas (2005) add that “reading is thinking cued
by written language. We cannot think for students; we cannot even directly show them
the complex operations they need to put in place” (p. 24). Instead, these researchers
insist that educators must ensure the acquisition o f basic skills while also striving to
provide opportunities for deep comprehension through positive classroom experiences.
Word Recognition
The foundation o f reading lays in understanding the printed word (Adams, 1990;
Donat, 2006). This groundwork is created by integrating phonemic awareness— the
spoken word— and phonics—the connection to the written word (Ehri, 2005).
Camboume (2002) adds “constructivist theory argues that the ends o f reading instruction
are very much determined by the means employed to teach it. In other words, the
experiences and contexts in which learning to read is embedded will be critical to each
learner’s understanding of, and ability to use, reading” (p. 27). Thus, Camboume argues
that learners must be motivated and engaged before this complex act o f learning to read
can occur.
To understand printed words, students must grasp the alphabetic principle
(NICHHD, 2001; Snow, Bums, & Griffin, 1998). The alphabetic principle for a language
such as English describes the knowledge that graphemes are systematically utilized to
27

represent phonemes. That concept underpins the development of reading because it
allows early readers to decode new words. In order for a student to master the alphabetic
principal, that student must also possess phonemic awareness as defined earlier in this
paper. Research indicates that phonemic awareness is a strong predictor o f reading
achievement in the primary grades (Juel, Griffith, & Gough, 1986; Snider, 1997). And
while most children easily and naturally learn to speak English, all children require direct
instruction in order to read English (Donat, 2006; Griffith & Olson, 1992).
Word recognition and learning to read are the beginning of a student’s path to
comprehension. However, students must move beyond the work of decoding before they
can become fluent readers who are not consumed with the process o f reading (Adlof,
Catts, & Little, 2006; LaBerge & Samuels as cited in Homan, Klesius, & Hite, 1993, p.
94). LaBerge and Samuels theorize that the brain’s limited working memory does not
allow a reader to process the meaning o f a word or chunk o f words while also decoding
those words. Thus, at some point in one’s life, decoding must give way to automaticity.
Torgesen and Hudson (2006) contend “the automaticity with which a reader can
recognize words is almost as important as word-reading accuracy. It is not enough to get
the word right if a great deal of cognitive effort is required to do so” (p. 134).
Research shows that word recognition is a complicated process which must be
mastered before students can move from learning to read to reading to learn (Stevens,
Slavin, & Famish, 1991). The application of each o f these components o f reading—
phonological awareness, the alphabetic principle, and phonemic awareness— combine to
create the automaticity associated with word recognition. “When these processes are
sufficiently automatized... this frees up working memory space for additional, or more
28

complex comprehension processes” (Hudson, Pullen, Lane, & Torgesen, 2009, p. 8).
Thus, students are expected progress to a point where a large sight word lexicon allows
them to concentrate on the real purpose o f reading— comprehension (Juel, Griffith, &
Gough, 1986; Scharer et al., 2005).
Sight Word Development
Ehri (1998) contends that “sight word learning” must be operationalized in order
to be discussed. This pivotal researcher defines sight word learning as a process rather
than an instructional strategy. By considering sight word development in this manner,
one can separate methods from outcomes thereby focusing on the development o f the
skill and not the use o f a particular tool or teaching method which enables the student to
develop that skill. Browder and Xin’s (1998) meta-analysis o f 48 studies on sight word
instruction further adds to Ehri’s research. They found that “a variety o f procedures have
been effective in teaching sight words” (p. 150). Additionally, Browder and Xin note
that providing a variety o f instructional choices increases the likelihood that students will
be motivated to learn.
This view of sight word learning may at first seem in conflict with Camboume’s
(2002) assertion that experiences and contexts are keys to student success. It is true that
Camboume’s research supports the constructivist approach to teaching reading.
However, this researcher does not promote specific programs. Camboume posits that
teachers serve as guides, helping students discover the pleasure of reading. This is
partially accomplished through explicitly teaching an awareness of the processes,
knowledge, and skills necessary for reading. Thus in his own way, Camboume makes
the argument for including skill development in the classroom.
29

Before students build a sight word vocabulary, they must understand grapheme to
phoneme correspondence and use this information to create connections among a word’s
written form, pronunciation, and meaning (Ehri, 2005; Invemizzi, Justice, Landrum &
Booker, 2004; Vellutino, 2003). To build the competencies associated with a strong sight
word lexicon, Ehri (1998) argues that students require special experiences that go beyond
daily encounters with oral language. Indeed, neurological research indicates that
Broddman’s Area in the left hemisphere is more active when reading sight words while
bilateral brain activation occurs in beginning readers who are more likely to use decoding
skills (Simos, Fletcher, Sarkari, Billignsley-Marshall, Denton, & Papanicolaou, 2007).
This indicates a physical difference in how we access words when we transition from
decoding to “knowing” a word.
Importance of Sight Word Vocabulary
To understand the importance o f sight words, one must first grasp how sight
words relate to comprehension. Humans do not read so they may understand the
relationships between graphemes and phonemes nor do we read so we may know words.
Rather, the end goal of reading is to understand and to share thoughts— to comprehend
(NICHHD, 2000). Hudson et al. (2009) have proposed a visual model explicating the
relationship between the components which lead to comprehension. By examining
Figure 2, it is possible to see how Hudson et al. conceptualize reading fluency. We start
with simple decoding. With instruction, students continue to build skills. A combination
o f sight word vocabulary, decoding fluency, utilization of context clues, and orthographic
knowledge then allows students to focus on comprehension. Thus, they progress from
learning to read to reading to learn.
30

Elements of Reading Comprehension
metacojcmtion know ledge viK ubiilancontext context
tnghf word vwahuUrv
orthographxknow ledge
decodingfluency
ImuJfipie cue ! efficiency ; I
Elements of Reading Fluency
phonemic awareness
tfuenev
phonogsantfluency
Elements of Decoding Fluency
Figure 2. Conceptual model of reading fluency. Reprinted from “The Complex Nature of
Reading Fluency: A Multidimensional View,” by R. F. Hudson, P. C. Pullen, H. B.
Lane, and J. K. Torgesen, 2009, Reading & Writing Quarterly, 25, p. 9. Copyright by
Taylor & Francis Group, LLC.
Cognitive research indicates “the record of a lifetime’s encounter with words is
stored in long-term memory in a structured, well-organized way” (Kintsch & Mangalath,
2011, p. 348). Words must be committed to long-term memory in order to free our
limited working memory. Hudson et al. (2009) make the assumption “that reading
processes share limited-capacity processing resources often termed working memory.”
(p. 8). They add that Perfetti’s (1985, quoted in Hudson et al.) verbal efficiency theory
suggests more efficient and automatic processes use fewer o f the working memory’s
resources thereby allowing other processes such as comprehension to occur. The
National Reading Panel also found a close relationship between fluency and reading
comprehension (NICHHD, 2000). Although the “black box” o f reading is undoubtedly

complex, a strong sight word lexicon is essential to reading success (Ehri, 2005; Hiebert
& Kamil; 2005).
Research on Improving Sight Word Recognition
Since students require a robust sight word lexicon in order to free working
memory, one might ask what methods teachers currently employ to reach that end. Ehri
(2005) contends that students learn to read sight words by forming connections. Ehri’s
research indicates those connections are created primarily due to students’ knowledge of
the alphabetic system. When children understand graphemes, phonemes, and spelling
patterns they are able to commit familiar words to memory. Students who learn the
grapheme ph represents the phoneme /f/ are able to retrieve and apply this knowledge in
larger and larger chunks until the unit memorized is the word itself (Bhattacharya & Ehri,
2004).
Sight word recognition is a progression of knowledge for many learners (Ehri,
1998). They learn the aforementioned letter-sound correspondences thereby making
connections that bond spellings and words into memory (Bhattacharya & Ehri, 2004;
Chall, 1996; Ehri, 2005). However, some students stumble in this process and need
additional instruction in sight word recognition. In these cases, alternative supports are
provided to teach sight words. The expectation is that students with a larger lexicon will
show improved fluency and comprehension (Erbey, McLaughlin, Derby, & Everson,
2011; Hong & Kemp, 2007; Oldrieve, 2012).
Browder and Xin’s (1998) meta-analysis o f 48 studies published in peer-reviewed
journals reveals several important facts. First, the researchers found that interventions
employed time delay, verbal praise, tangible reinforcement, peer tutoring, post-response
32

feedback and/or pre-response prompting. Secondly, “most studies on sight word
instruction have been conducted with individuals with moderate mental retardation” (p.
147). Additionally, Browder and Xin determined that post-response interventions in the
form of feedback (p < .001) combined with opportunities for students to revisit word lists
(p < .05) created the largest gains in sight word knowledge. However, these researchers
also note a limitation in sight word research. Students may develop a larger lexicon, but
they are not required to demonstrate functional use o f their new knowledge. Only 25 o f
the 48 studies Browder and Xin reviewed included data about functional use. Even then,
the authors used a liberal definition o f functional use. This definition included data
reflecting students’ improved ability to match pictures to words, identification o f words
in a grocery store, giving definitions, spelling target words, and completing word finds.
However, there was no mention of fluency or comprehension in any of the studies.
Intervention for Struggling Readers
Our nation struggles with reading. Over one-third o f our fourth graders and one-
fourth o f our eighth graders cannot read at a basic level (NCES, 2011). Left unaddressed,
these difficulties carry on to adulthood. Research continues to evolve on how best to
address the needs o f struggling readers. The biggest debate has been over basic skill
instruction in the form of phonics versus a whole language approach that concentrates on
meaning. Chall’s (1967) seminal work laid the foundation for modern phonics
instruction. Additional research confirmed the importance of direct instruction for early
literacy development (NICHHD, 2000; NELP, 2008; Snow, Bums, & Griffin, 1998).
A recent focus on response to intervention (RTI) models has led to a better
understanding of programs that meet the needs of underachieving students. These
33

students fail to demonstrate the growth of their typically developing peers when given
only the universal instruction provided in the general education classroom (McAlenney &
Coyne, 2011). Hecht and Close (2002) examined the benefits of direct, intensive
phonemic instruction. They found relationships between phonemic awareness instruction
and individual students’ prior letter knowledge, invented spelling, vocabulary knowledge,
and print concepts. However, 12 o f their 42 participants showed insignificant gains on a
phonemic blending task and 4 did not show significant gains on a blending task. These
results suggest that students may need individualized remediation programs that respond
to their specific needs.
A Constellation of Problems
Simos et al. (2007) confirm Hecht and Close’s (2002) findings. Their research
shows a constellation o f possible difficulties including deficits in phonological
processing, rapid naming, and the processing o f rapidly changing visual or auditory
stimuli. Bear, Negrete, and Cathey (2012) add that some students grapple with concept
of word, articulation, and within word patterns. Each o f these basic skill failures requires
targeted remediation.
Phonological processing refers to the ability to hear and manipulate the basic
sounds in spoken language (McArthur & Castles, 2011). Rapid naming skills describe a
student’s ability to automatically recognize and name upper and lower case letters (W olf
& Bowers, 2000). Processing rapidly changing visual and auditory stimuli builds from
rapid naming skills. This processing is necessary for the accurate encoding o f letter
positions and their associated sounds (Witton et al., 1998). Students who lack concept of
word confuse individual syllables with words (Morris, 1993). Those exhibiting
34

articulation errors fail to make the physical connection between how a word sounds and
the way it “feels” in the mouth (Templeton, 2011). Students trapped at a within word
pattern reading level experience difficulty surmounting the transitional phase o f reading
(Bear et al., 2012). This dizzying array o f miscues, misconceptions, and mistakes leaves
educators with an equally perplexing choice o f remedial solutions.
A plethora o f commercial programs claim proven success. Four Blocks®, Words
their Way®, Leveled Literacy Instruction®, IntelliTools Reading®, Making
Connections®, HELPS® (Helping Early Literacy with Practice Strategies), Reading
Reels®, and Success for All® are just a few o f the many packages available to school
districts. Respective websites cite research supporting the efficacy of their approach.
Yet districts, administrators, teachers, and interventionists continue to search for ways to
make each student a successful reader. How do these critical stakeholders decide which
programs to adopt? How does one determine which approach will truly create the
greatest gains in reading?
The National Reading Panel analyzed effective instructional reading approaches
in general and also made recommendations for struggling readers in particular (NICHHD,
2000). However, those suggestions were broad, including instruction in phonics, partner
reading, and repeated oral reading. The panel did not answer the questions o f which
programs to choose and how much gain could be expected. Socioeconomic status and
minority status exacerbate the issue of literacy (Arnold & Doctoroff, 2003; Crowe,
Connor, & Petscher, 2009; Hart & Risley, 1995). Students from lower socioeconomic
backgrounds often begin their school careers with weaker language and literacy skills
than their advantaged peers. Additionally, Rank and Hirschl (1999) found that 68% of
35

African American students experienced poverty compared to 26% of white students. If
schools choose remedial programs that lack interesting subjects, these disadvantaged,
minority students will fall further and further behind their classmates (Arnold &
Doctoroff, 2003; Stanovich, 1986).
The perfect storm o f institutional need, student underperformance, and lack o f
direction sets the stage for this research. A body o f knowledge exists. Researchers,
government agencies, and educators recognize that a significant percentage o f elementary
students struggle with reading (Arnold & Doctoroff, 2003; Hecht & Close, 2002; NCES,
2011). The National Reading Panel has identified “the big five” (NICHHD, 2000).
Schools have moved away from a discrepancy model and embraced response to
intervention (Vellutino, Scanlon, Small, & Fanuele, 2006). Yet amidst this storm, one
truth remains: schools search for solutions. In Central School District, one o f those
solutions is Project iRead. Its efficacy is addressed in subsequent chapters. However, its
foundations lay in the research conducted by authorities in the field o f reading
instruction.
Summary
This literature review indicates a body of evidence supporting the importance of
word recognition, reading fluency and comprehension. It has grounded that verification
in extant research on how students learn to read and the inter-relationships between
phonemic awareness, phonics, fluency, vocabulary, and comprehension. These five
components comprise the complicated act o f reading. In order for the end goal—
comprehension— to occur, the research shows that students need a broad personal
36
lexicon. If too much energy is spent determining what a word is, the student will not
have the capacity to grasp what the words mean.
Studies have examined how to improve sight word vocabulary. However, there is
a dearth o f information about how improved word recognition in isolation impacts a
student’s ability to read fluently and to comprehend a passage. Additionally, the majority
of studies were conducted with students who are intellectually disabled or have specific
learning disabilities. Research indicates that struggling readers need supplementary
instruction. Questions remain as to the best avenues for providing that instruction.
Evaluating Project iRead can add to the existing body o f knowledge because it is a sight
word program that is used with general education students and slow learners in addition
being used with students receiving exceptional education services.
37

Chapter Three
Methodology
The purpose o f this chapter is to describe the methodology utilized for this study.
The chapter begins with the purpose o f the study and its design. The next section
provides information about the participants. Information regarding data sources, data
collection, and applicability to the questions follows. The chapter concludes with a
discussion o f the data analysis procedures.
Purpose
This program evaluation examined the outcomes o f Project iRead, an iPod-based
sight word program, which was created and is used in a single Virginia school district.
The Central School District utilizes Project iRead in order to improve students’ sight
word vocabulary. One o f the district’s exceptional education teachers developed Project
iRead. The coordinator o f Federal Programs then made the program available at
additional schools in the district. It is presently funded by the school district’s
Department of Federal Programs. Expansion continues into additional schools with the
expectation that 22 o f the county’s 45 elementary schools will employ the program by the
2013-2014 fiscal year. The program’s creator wished to document the effect o f Project
iRead on student outcomes. Elucidating the reasons for a program evaluation o f Project
iRead ensures the design methodology does, indeed, match the desired outcome of the
analysis. This clarification meets the Joint Committee on Standards for Education
Evaluation’s (JCSEE’s) (2013) standards o f identifying the purpose o f the research,
serving the stakeholders’ needs, and negotiating agreements in order to account for
clients’ needs and expectations.
38

Throughout this program evaluation the researcher served as the primary agent for
the study. While other evaluations are executed using additional internal personnel or an
outside evaluation agency, such measures were not feasible in this case. This research
served as partial fulfillment o f the requirements for a doctoral degree and the schools
provided no funding. Thus, both time and money were constraints. Central School
District’s Department of Research and Planning provided PALS data. The researcher
completed all statistical analyses. The use o f the Department o f Research and Planning
provided a buffer between the researcher and the subjects thus lessening possible biases
in the results.
This research had two overarching goals. The first was to determine the
relationship between participation in Project iRead and student growth in reading, as
measured by PALS. The second goal was to ascertain whether a relationship existed
between long term participation in Project iRead and student growth, as measured by
PALS. This research utilized Stufflebeam’s CIPP model to reach its goals (2000). The
CIPP model encompasses context, inputs, process, and product. The CIPP’s model
flexibility renders it applicable to this study. That flexibility allows CIPP to be utilized in
its entirety or in part, and it may also be used formatively and/or summatively. The
evaluation o f Project iRead focused very narrowly on a summative product evaluation.
Thus, the CIPP model provided the frame for determining the relationship between
Project iRead’s stated goal of improving students’ reading performance and actual results
during the 2012-13 school year.
The following research questions guided this study:
39

1. What is the relationship between participation in Project iRead and student word
recognition as identified by student growth on the PALS test?
2. What is the relationship between participation in Project iRead and student
fluency as identified by student growth on the PALS test?
3. What is the relationship between participation in Project iRead and student
comprehension as identified by student growth on the PALS test?
4. What is the relationship between participation in Project iRead and student word
recognition at early adopting schools as identified by student growth on the PALS
test?
5. What is the relationship between participation in Project iRead and student
fluency at early adopting schools as identified by student growth on the PALS
test?
6. What is the relationship between participation in Project iRead and student
comprehension at early adopting schools as identified by student growth on the
PALS test?
Identifying Stakeholders
Gall, Gall, and Borg (2007) maintain the success o f a program evaluation relies
on identification and involvement o f key stakeholders. They suggest that leaving out
stakeholders can lead to sabotage or discredited results. The researchers also argue that
involvement does not have to be in-depth for all affected by the program or the
evaluation. This component of the program evaluation required determining those
members.
40

Those responsible for the supporting the Project iRead comprise one group. This
includes the program’s creator and administrator as well as the coordinator in charge o f
funding, the reading specialist and the directors o f elementary education. These
individuals have a keen interest in understanding Project iRead’s implementation and its
effects are on student achievement. Comprehending implementation came through a
discussion with Project iRead’s creator after analysis o f the results. However, a
summative examination o f student gains remained as the primary goal o f this program
evaluation.
The second identified group includes those who utilize Project iRead. The
educators actually in charge of classroom practices and their school administrators will
profit by learning about the results o f this study. In addition to Project iRead, Central
School District employs EarobicsO, Making Connections©, and Leveled Literacy
Intervention© (LLI). The results o f this program evaluation may help these stakeholders
to determine whether to include Project iRead in their intervention programming.
Design
This program evaluation utilized a quantitative research design. Fitzpatrick et al.
(2012) maintain that quantitative methods represent an appropriate approach in program
evaluation when the researcher seeks to determine whether an existing theory applies to
that program. In this case, one asks whether Project iRead improves students’ reading
ability as established by the National Reading Panel’s research (NICHHD, 2000). The
use o f quantifiable constructs has been a preferred method in research and aligns to the
CIPP model (Fitzpatrick et al., 2012).
41

The data consist o f students’ scores on the PALS test for the 2012-13 school year
which provides information about word recognition in isolation, fluency, and
comprehension. Classroom teachers collected data. Central School District’s
Department o f Research and Planning then aggregated at the district level. The
Department o f Research and Planning removed identifying student information before
providing the data to the researcher.
Ethical Considerations
This research was conducted in compliance with all policies and procedures
required by The College o f William and Mary and Central School District. Completing a
series o f tasks ensured ethical treatment requirements were met. First, the researcher
received permission to conduct research from the county. Central School District has
stringent guidelines on research and their central office only accepts requests four
times— September 1, December I, March I, and June lyearly. To ensure data
availability for the dissertation proposal it was vital to submit a request by June 1, 2013,
well in advance o f the August 2013 proposal defense date. Additionally, permission to
conduct research was sought from The College o f William and Mary’s Institutional
Review Board. The Education Internal Review Board of William and Mary reviewed
protocol EDIRC-20123-09-06-8925-mfdida and exempted it from formal review due to
the fact that the research would be “conducted in established or commonly accepted
educational settings, involving normal educational practices, such as research on regular
and special education instructional strategies” (Protection o f Human Subjects, 2009, p.
3). Upon receipt o f permission from both o f these agencies, the researcher worked
through Central School District’s Department of Research and Planning to obtain data.
42

That department provided access to Phonological Awareness Literacy Screening (PALS)
data for all first and second grade students in the district. Approval from the district
confirmed that no sub-group of students received preferential treatments due to the study
and that confidentiality was maintained. Upon securing the appropriate permissions to
conduct the study, this research began.
Participants and Setting
Virginia students attend one o f its 132 school districts. Enrollment in these
districts varies from 209 to 183,417 students. This research occurred in a single school
district comprised o f urban, suburban and rural communities. The Central School District
serves over 49,000 students. The district’s student population consists o f 44% white,
37% African American, 8% Asian, 7% Hispanic, and 4% two or more races (VADOE,
nd). Approximately 38% o f students quality for free or reduced lunch, thereby
identifying them as economically disadvantaged. Students with disabilities account for
15% of the district’s population (VADOE, 2009).
The Department of Research and Planning gathered quantitative data from
participating elementary schools in the district. In the 2012-13 school year, 17 of the
county’s 45 elementary schools used Project iRead as an intervention tool in
kindergarten, first grade, and second grade. One o f the schools served only grades three
through five and did not have a K-2 program. The analysis o f PALS data included the
remaining 44 schools.
Procedures
The county maintains historical data on students’ fall and spring scores for PALS.
The PALS test results indicate student performance levels on concept o f word, word
43

recognition in isolation, developmental spelling, oral reading, and comprehension
(Invemizzi & Meier, 2003). These data sets will allow the researcher to compare groups
to determine the relationship between participation in Project iRead and student growth in
these areas.
Data Collection
Central School District’s Department o f Research and Planning provided the
researcher with 2012-13 PALS data. These data sets were grouped based on use of
Project iRead as illustrated in Table 4. One hundred fifty-four students were removed
from the data set. These students spent partial years at 2 or more schools. Therefore, it
would have been impossible to determine their primary grouping. The number o f students
enrolled at schools participating in Project iRead is significantly smaller than those not
enrolled in non-participating schools. Therefore, the Statistical Package for the Social
Sciences (SPSS) was used to randomly select 2,570 o f the 4,445 cases from students at
non-participating schools in order to create a matched data set.
Table 4
PALS data groups
Number of Participants Schools Students
iRead Adoption Sites 17 2,570
Sites without iRead 27 4,445
A similar examination was conducted for early and late adopting Project iRead
schools. This information is displayed in Table 5. The students removed during the
initial sort o f the files remained out of the data set for these analyses as well. No
adjustments were made to the size of the data sets for early and late adopting schools due
to the small difference in the number o f participants.
44

Table 5
Early and Late Adoption Sites
Number of Participants Schools Students
Early Adopters 7 552
Late Adopters 10 675
Instrumentation
The Phonological Awareness Literacy Screening (PALS) test served as the data
source for this research. The PALS test was created at the University o f Virginia as a
statewide tool for identifying students at risk o f reading difficulties and delays (Invemizzi
et al., 2003). Presently, 99% of all Virginia schools use the PALS test (Virginia
Department o f Education, 2011). The dependent variables of word recognition in
isolation, fluency, and comprehension are all measured with this test.
Administration
Central School District administers the PALS test three times per year. Each
testing window lasts two weeks. The PALS test consists o f several sub-tests: word
recognition, spelling, oral reading in context, fluency, and comprehension. Although the
spelling test is given to the class as a whole group, the remainder of the PALS test is one-
on-one. Benchmark scores have been established for all portions o f the test. A series o f
pilot studies by the test’s creators established these benchmarks as critical levels of
knowledge for students who are working on grade level (Invemizzi et al., 2003). If
students in grades 1 and 2 are identified below those benchmarks, teachers administer
additional components to assess for alphabet recognition, letter sounds, and concept of
word. These elements pinpoint a student’s instructional level.
45

Three components o f the PALS test provide the data necessary for this program
evaluation. The word recognition in isolation task provides information about students’
sight word knowledge. Each grade level list includes 20 words. This portion, once
administered by hand, is now delivered electronically. Students see each word for a
controlled amount o f time and then must name the word. If a student correctly reads 15
or more words on a grade level list, the teacher proceeds to the next list. Likewise, when
starting on a grade level list, if the student reads fewer than 15 words correctly, the
teacher moves down a grade level to assess the student’s knowledge o f sight words. This
information determines which oral reading passage each student receives.
The oral reading in context passage serves for several purposes. Teachers time
students to assess both their accuracy and speed. These data help determine fluency.
Fluency scores range from 1 to 3 on each grade level with the highest rating defining a
student who reads fluently and expressively. This portion of the test ends with a
comprehension check. The teacher reads six questions and their answer choices aloud to
students. There is only one right answer to each question and students must answer each
question from memory without returning to the original passage (Invemizzi et al., 2003).
Scoring
Each teacher enters students’ scores into the PALS electronic database. Students
receive a “summed score” for the spelling and word recognition tasks. The summed
score comprises only their knowledge of grade level specific material, and the scores for
each task are added together. To clarify, a student who knows words on a sixth grade
level would receive no higher summed score than a student who only knows words on a
second grade level. The word recognition in isolation serves to assess instructional
46

reading level. The summed score identifies students who fall below the grade level
benchmark and in need o f intervention (Invemizzi et al., 2003).
Fluency is assessed on a three-point scale, and videos on the PALS website
illustrate the differences between fluency rates. Students receive 1 point for laborious,
word-by-word reading delivered in a monotone. A rating o f 2 points indicates reading
that lacks prosody and expression. Three points are given for reading that is adequately
paced and delivered in meaningful phrases. This reading is expressive and fluent. The
PALS database creates output with fluency scores entered in columns corresponding to
the grade level o f the oral reading passage. No changes to the score o f 1, 2, or 3 occur to
allow for difficulty o f the text.
Comprehension rates range from zero to six based on the number o f questions
answered correctly. Again, the PALS database reports this information in distinct
categories, but there no increasing values awarded for advanced grade levels. For
example, correctly answering 5 questions on a first grade reading passage is noted as a 5
in the first grade column. However, correctly answering 4 questions on a fifth grade
passage carries no weight. Coding indicates a 4 in the fifth grade reporting column.
Reliability
Gall, Gall, and Borg (2007) define reliability as “the consistency, stability, and
precision of test scores” (p. 151). Sanders and Sullins (2006) maintain that reliable tests
will consistently produce the same results. The PALS test was field tested with more
than 500,000 students. Modifications were made based on student and teacher feedback.
The developers then conducted a second, smaller field test. The reliability o f the PALS
test was assessed for internal consistency o f sub-tasks and accuracy o f scoring (inter-rater
47

reliability). However, it must be noted that reliability research on sub-task consistency
was conducted only on spelling and word recognition as these factors determine which
students receive state funded remediation. The researchers reported a mean alpha
coefficient o f .80 for all sub-tasks and inter-rater reliability coefficients as high as .98
(Invemizzi et al., 2003). The reliability for word recognition in isolation appears in
Table 6 and the inter-rater reliability is found in Table Seven.
Table 6
Reliability Coefficients fo r Word Recognition in Isolation
Word List
Cronbach’s alpha (n)
Spring 2000 Spring 2001 Fall 2001 Spring 2004
Preprimer — .96 (n = 486) .92 (n = 617) .83 (« — 315)
Primer .91 (n = 77) .94 (n = 25) .91 (« = 369 .86 (n = 699)
Grade 1 .93 (n = 224) .90 (n = 54) .88 (n = 409) .79 (« = 1,188)
Grade 2 .91 (n = 223) .87 (n = 93) .91 (n = 223) .86 (« = 1,674)
Grade 3 .87 (n = 222) .81 (n= 109) .86 (n = 295) .86 (« = 1,747)
Grade 4 — — — .88 (« = 1,379
Grade 5 — — — .83 (« = 513)
Grade 6 — — — ,8 7 (« = 190)
Note. Adapted from PALS: 1-3 Technical reference, by M. Invemizzi, J. Meier, C. Juel,
Viriginia State Department of Education, and University o f Virginia’s Curry School of
Education, 2003, Charlottesville, Virginia, University o f Virginia. Copyright 2003 by the
Rector and The Board of Visitors o f the University o f Virginia. Adapted with
permission.
48
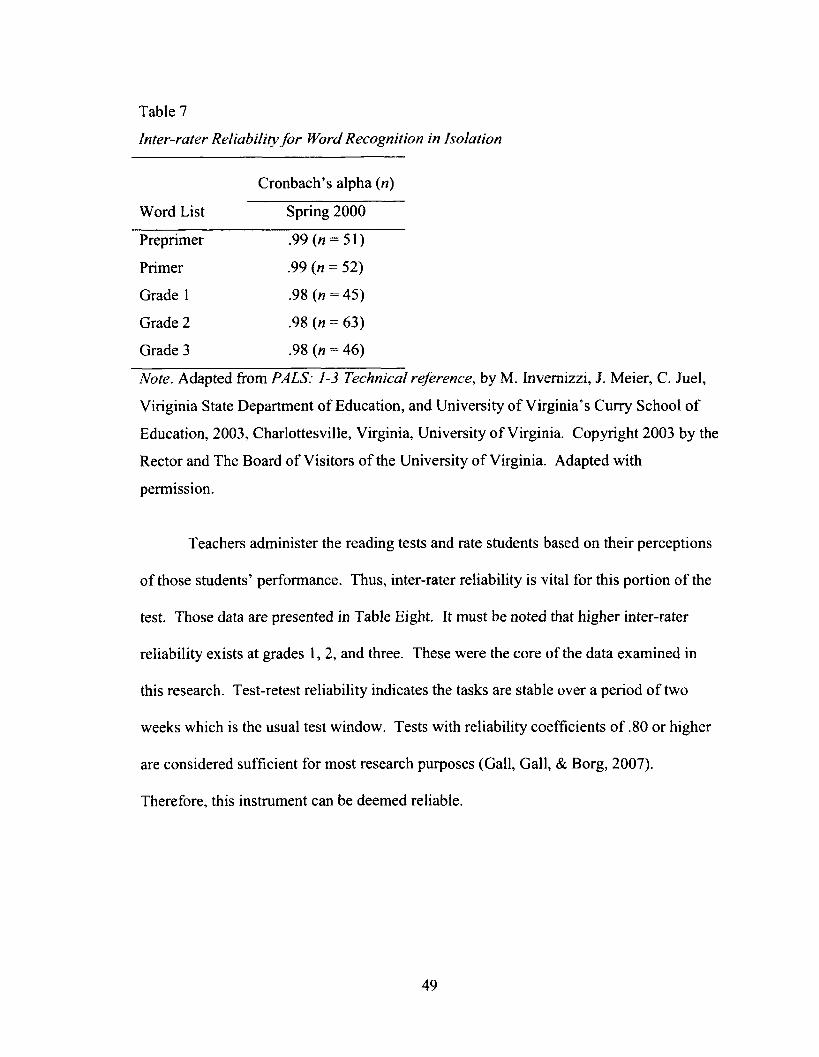
Table 7
Inter-rater Reliability fo r Word Recognition in Isolation
Word List
Cronbach’s alpha (n)
Spring 2000
Preprimer .99 (n = 51)
Primer .99 (n = 52)
Grade 1 .98 (n = 45)
Grade 2 .98 (n = 63)
Grade 3 .98 (n = 46)
Note. Adapted from PALS: 1-3 Technical reference, by M. Invemizzi, J. Meier, C. Juel,
Viriginia State Department of Education, and University o f Virginia’s Curry School o f
Education, 2003, Charlottesville, Virginia, University o f Virginia. Copyright 2003 by the
Rector and The Board of Visitors o f the University o f Virginia. Adapted with
permission.
Teachers administer the reading tests and rate students based on their perceptions
of those students’ performance. Thus, inter-rater reliability is vital for this portion o f the
test. Those data are presented in Table Eight. It must be noted that higher inter-rater
reliability exists at grades 1, 2, and three. These were the core of the data examined in
this research. Test-retest reliability indicates the tasks are stable over a period o f two
weeks which is the usual test window. Tests with reliability coefficients o f .80 or higher
are considered sufficient for most research purposes (Gall, Gall, & Borg, 2007).
Therefore, this instrument can be deemed reliable.
49

Table 8
Correlation Coefficients fo r Inter-rater Reliability
PALS Task Date Reading Level Correlation (n )
Oral Reading in Fall 2000
Context
Fall 2002
Primer .94 (« = 36)
Grade 1 .97 (n = 43)
Grade 2 .96 (n = 50)
Grade 3 .98 (n = 72)
Readiness .74 (n = 33)
Preprimer A .77 (n = 32)
Preprimer B .63 (n = 29)
Preprimer c .83 (n = 29)
Primer .97 (n= 18)
Grade 1 .97 (« = 21)
Grade 2 .85 (n = 38)
Grade 3 .81 (n = 78)
Note. Adapted from PALS: 1-3 Technical reference, by M. Invemizzi, J. Meier, C. Juel,
Viriginia State Department of Education, and University of Virginia’s Curry School of
Education, 2003, Charlottesville, Virginia, University o f Virginia. Copyright 2003 by the
Rector and The Board of Visitors o f the University o f Virginia. Adapted with
permission.
Validity
Validity is “the degree to which all of the evidence points to the intended
interpretation of test scores for the proposed purpose” (Creswell, 2012, p. 159). In other
words, does the assessment accurately reflect the content it was written to address?
Validity can be ascertained through content evidence, criterion evidence, and construct
evidence. The PALS developers have documented their adherence to each o f these
components of validity.
50

Content validity defines the way a test samples the learning outcomes (Sanders &
Sullins, 2006). This can be conceptualized as the degree to which test items and tasks
provide a relevant selection of the content (Gronlund, 1985). A content area expert may
evaluate the test to determine its content validity. The presence o f content validity
provides evidence for construct validity. The creators o f PALS utilized existing research
by the National Reading Panel to select the tasks deemed essential for reading
comprehension (Invemizzi et al., 2003). This includes blending phonemes, segmenting
sounds, matching sounds to letters, and transferring phonemic awareness to letters.
The PALS test demonstrates criterion validity. The degree to which one
assessment score— in this case, the PALS test— is related to another assessment score or
similar outcome represents the test’s criterion validity. There are two types o f criterion
validity: predictive— when an assessment predicts future performance and concurrent—
when an assessment’s results are compared to another assessment (Gall, Gall & Borg,
2007). During the 2000-01 school year, fall and spring PALS data were assessed. Spring
PALS results were compared to Stanford-9 Reading scores and Virginia Standards of
Learning (SOL) Reading Tests. These evaluations provided the data needed to assess
concurrent and predictive validity. A regression analysis yielded R2- .53 for first grade
on Stanford-9. The regression analysis for the SOL test resulted in R2 value o f .36. The
researchers argue these data indicate significant predictive criterion validity for the PALS
test (Invemizzi et al, 2003). The spring to fall comparison o f PALS results yielded an R2
of .76 suggesting that the fall scores could be predicted by using the previous year’s
spring data. The Qualitative Reading Inventory (QRI) and Developmental Reading
Inventory (DRA) were used to determine concurrent criterion validity. A bivariate
51

correlation between a student’s reading level as determined by PALs and by the QRI
yielded a significant correlation (r = .73, p < .01). A correlation between reading level as
identified by PALS and by the DRA was also significant (r = .82 ,p < .01).
Construct validity stands as the final component of test validity. Construct
validity refers to an assessment’s ability to accurately measure what it purports to
measure (Gronlund & Waugh, 2009). Content and criterion validity directly affect
construct validity. The assessment’s correlation to the intended learning outcomes
comprises an important component o f construct validity. In this case, the outcome
equates to a student’s reading level. The relationship o f graphemes and phonemes to
reading provided the basis upon which the PALS test was constructed. In order to test
their theory, the creators o f PALS conducted discriminant analyses and principal
component analyses on PALS data to determine whether PALS subtask scores could
accurately predict whether a student would be identified as falling below benchmark.
The most recently reported principal component analysis (PCA) was conducted in 2001
and “yielded a single factor with an eigenvalue o f 5 .20....The one-factor solution
suggested that PALS was measuring a unitary trait: reading, or the marriage between
sound and print” (Invemizzi et al., 2003, p. 38). That unitary factor accounted for 79% to
85% of the variance in the summed scores. Discriminant analyses allowed the program
designers to determine the extent to which a particular combination o f subtest scores
predicted whether a student would be identified as below benchmark. These analyses
have accurately classified 95% to 98% of students as below or not below benchmark.
The PALS test can be considered a valid testing instrument due to significant supporting
results for content, criterion, and construct validity.
52
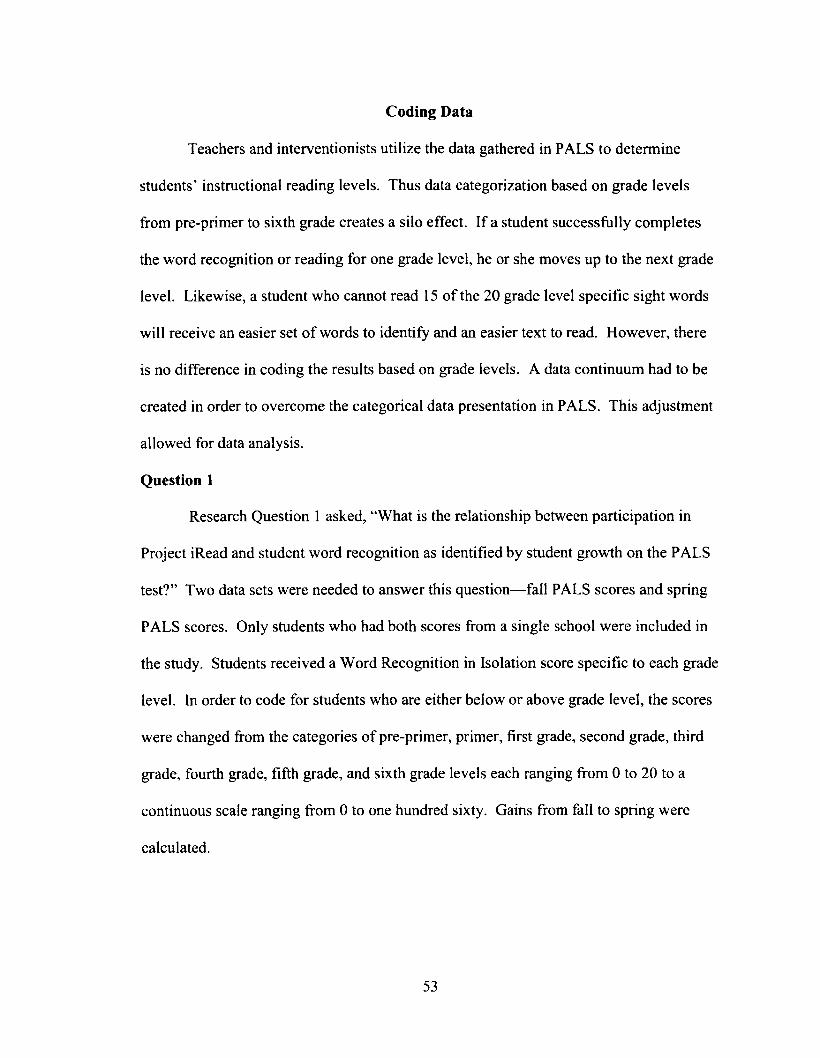
Coding Data
Teachers and interventionists utilize the data gathered in PALS to determine
students’ instructional reading levels. Thus data categorization based on grade levels
from pre-primer to sixth grade creates a silo effect. If a student successfully completes
the word recognition or reading for one grade level, he or she moves up to the next grade
level. Likewise, a student who cannot read 15 o f the 20 grade level specific sight words
will receive an easier set o f words to identify and an easier text to read. However, there
is no difference in coding the results based on grade levels. A data continuum had to be
created in order to overcome the categorical data presentation in PALS. This adjustment
allowed for data analysis.
Question 1
Research Question 1 asked, “What is the relationship between participation in
Project iRead and student word recognition as identified by student growth on the PALS
test?” Two data sets were needed to answer this question— fall PALS scores and spring
PALS scores. Only students who had both scores from a single school were included in
the study. Students received a Word Recognition in Isolation score specific to each grade
level. In order to code for students who are either below or above grade level, the scores
were changed from the categories o f pre-primer, primer, first grade, second grade, third
grade, fourth grade, fifth grade, and sixth grade levels each ranging from 0 to 20 to a
continuous scale ranging from 0 to one hundred sixty. Gains from fall to spring were
calculated.
53

Question 2
Research Question 2 asked, “What is the relationship between participation in
Project iRead and student fluency as identified by student growth on the PALS test?”
Data analysis was based on PALS fluency ratings. When students read a passage with
90% to 97% accuracy, they were considered on their instructional level. After teachers
determined the student’s instructional level, they gathered data on fluency and words per
minute at each student’s level. The reading levels range from primer to sixth grade.
Teachers reported fluency on a scale from 1 to 3 at each o f those categorical levels.
Recoding the results into a continuous data set from 0 to 21 allowed for determination of
fluency gains.
Question 3
Research Question 3 asked, “What is the relationship between participation in
Project iRead and student comprehension as identified by student growth on the PALS
test?” For each PALS reading passage, primer through sixth grade, there were 6
accompanying comprehension questions. As with Question 1, these were coded on a
single, continuous scale in order to accurately indicate the differences in achievement
from fall to spring when a student might progress from answering 6 questions on a first
grade text to answering 4 questions on a third grade text. The continuous, recoded data
ranged from 0 to forty-two.
Question 4
Research Question 4 asked, “What is the relationship between participation in
Project iRead and student word recognition at early adopting schools as identified by
student growth on the PALS test?” Rather than examining the entire school district, the
54
focus became only the early and late adopting Project iRead schools. This question and
the following two questions sought to concentrate the effects of Project iRead by
examining scores for second grade only. This question required the same data
information as Question One. The Word Recognition in Isolation scores were examined
only for students with data for fall and spring at a single school. Categorical results were
rescaled to produce continuous data to allow for interpretation about growth during the
year. The resulting scores ranged from 0 to one hundred sixty.
Question 5
Research Question 5 asked, “What is the relationship between participation in
Project iRead and student fluency at early adopting schools as identified by student
growth on the PALS test?” As with Question 2, the fluency rates for students were coded
to produce a continuous data set. Only second grade students were included in the
analysis. The resulting scores ran from 0 to twenty-one.
Question 6
Research Question 6 asked, “What is the relationship between participation in Project
iRead and student comprehension at early adopting schools as identified by student
growth on the PALS test?” This question mirrors Question 3 yet narrows the scope of
participants to second graders at early and late adopting schools. The data were coded to
convert categorical grade level information into continuous student data. The result was
a scale o f scores from 0 to forty-two.
Data Analysis
Statistical analyses were performed using the Statistical Package for the Social
Sciences (SPSS), version 22. For Questions 1, 2, and 3, the independent variable of
55

interest was participation in Project iRead. Questions 4, 5, and 6, the independent
variable o f interest was early or late adoption o f Project iRead. However, the
independent variables o f socioeconomic status, race, Hispanic heritage, and gender were
also examined as possible predictors of performance for word recognition in isolation,
fluency, and comprehension. Each research question had one variable o f interest and 4
additional independent variables. Linear regressions permit researchers to investigate the
relationship between a single continuous outcome variable and a set o f predictor variables
(Yan & Su, 2009). This program evaluation sought to determine the relationship between
Project iRead and student gains in reading. Yet the models also included 4 additional
predictor variables. Therefore, linear regressions were chosen as the statistical tool.
Descriptive statistics, including means, standard deviations, ranges, medians, and
frequencies were calculated for each dependent variable. All data were then tested for
the basic assumptions for linear regression: linearity, absence o f multicollinearity, and
constant variance o f the random errors— homoscedasticity (Freund, Wilson, & Sa, 2006).
Linearity assumes a straight line relationship between the predictor variables and the
dependent variables. The absence o f multicollinearity assumes predictor variables are not
closely related to each other. Homoscedasticity is the normal distribution o f errors about
the regression line. The results of those tests are presented in Chapter Four.
Due to issues with heteroscedasticity in the dependent variables, two less common
statistical tests were utilized. Both a nonparametric Levene’s test and, when necessary,
robust multiple regressions were utilized. Violations o f normalcy may lead to an increase
in Type I errors in the Levene’s test (Shoemaker, 2003). Therefore, a nonparametric
Levene’s test with rank scores permitted analysis of the variance in skewed data sets
56

(Nordstokke, Zumbo, Cairns, & Saklofske, 2011). This test involved three steps: “(i)
pooling the data and replacing the original scores by their ranks and then (ii) separating
the data back into their groups and (iii) applying the conventional mean-based Levene
test to the ranks” (Nordstokke et al., 2011, p. 3). The nonparametric Levene’s test was
utilized to determine whether there was equality o f variance in each of the data sets.
When the null hypothesis (equality o f variance) was violated, a more robust linear
regression was applied.
Transforming data is a common practice when issues o f non-normality occur. A
robust analysis is a similar method o f dealing with the problems associated with
heteroscedasticity. A heteroscedasticity-consistent standard error (HCSE) analysis was
used to compute the regression statistics. This approach was first suggested by White
(1980) and further expanded upon by Long and Ervin (2000). Hayes and Cai (2007)
added to the body o f knowledge by creating a macro for SPSS. This additional module
allows researchers to analyze heteroscedastistic data sets with a more robust linear
regression model.
All findings were evaluated at a confidence level o f p < .05. R2 calculations were
examined to determine how much variance in the dependent variable is accounted for by
the independent variables. The t test established the significance of each predictor
variable, and beta coefficients were utilized to confirm the effect size for individual
independent variables.
57

Chapter Four
Results
The purpose o f this program evaluation was to determine the relationship between
Project iRead and student outcomes in early literacy. PALS data were examined for
growth in word recognition in isolation, fluency, and comprehension. This chapter
presents the data analysis results for each of the six research questions.
Six research questions were employed to determine the outcomes o f Project
iRead. The first three questions examined data from students at participating schools as
compared to students at non-participating schools. Those same three questions were
applied to a targeted subset o f schools. In particular, the researcher sought to find
differences between early adopting and late adopting Project iRead schools. Early
adopting schools were defined as schools utilizing Project iRead for two to four years.
Late adopting schools were those with a year or less o f implementation. In addition, the
focus was narrowed to second grade students only to concentrate the possible effects o f
Project iRead. Students in second grade at early adopting schools could have either two
or three years o f iRead instruction thereby increasing the likelihood o f having a teacher
who used the program with fidelity and also increasing the time spent interacting with the
program as opposed to students at late adopting schools who had a maximum of only one
year’s interaction with Project iRead.
Growth from fall to spring in the 2012-13 school year was examined. In addition to
Project iRead participation, variables for gender, minority status, Hispanic heritage, and
socioeconomic status were entered into the model. This was necessary due to the
possibility these variables might have more impact on word recognition than the program
58

itself. Interpreting the results required comparison o f categorical groups coded as zero
and one. SPSS uses the latter category as its reference o f comparison. Socioeconomic
status, iRead participation, early iRead participation, Hispanic descent, minority status,
and males were coded as one for all research questions.
Question One
Research Question 1 asked, “What is the relationship between participation in
Project iRead and student word recognition as identified by student growth on the PALS
test?” This question was tested with a robust linear regression. An evenly matched
sample (N = 5,140) of first and second grade student scores were examined for growth in
word recognition from fall to spring during the 2012-13 school year. The 22 students
who had word recognition scores more than 3 standard deviations from the mean were
removed from the data set before analyses began. Growth for students participating in
Project iRead (N = 2,563, M = 38.15, SD = 18.35) was compared to those not
participating in Project iRead (N = 2,555, M = 36.75, SD = 20.56).
Sample Characteristics
A Shapiro-Wilk’s test (p < .05) and visual inspection o f the histograms, normal
Q-Q plots and box plots were conducted to determine the normality o f the word
recognition data. These tests all indicated a non-normal data set. Further examination
indicated significant skewness of .265 (SE = .048) for data o f Project iRead students and
significant skewness o f .332 (SE = .048) and kurtosis o f -.248 (SE = .097) for data o f
students not participating in the program.
Creating and interpreting a scatterplot for linearity o f the independent variables
(Project iRead, socioeconomic status, Hispanic descent, minority status and gender) and
59

the dependent variable (word recognition in isolation) was not applicable in this instance
because all predictor variables were categorical and had no associated linearity. A
nonparametric Levene’s test was used to determine the equality of variances in the
samples— also known as homoscedasticity (Nordstokke et al., 2011). This test indicated
a heteroscedastic data set Ip < .01). The VIF statistic was calculated for collinearity o f
predictor variables. The null hypothesis— lack of collinearity—was not violated and
results are reported in Table Nine.
Table 9
Collinearity Statistics fo r Project iRead Participation
Variable VIF
Socioeconomic Status 1.07
Hispanic descent 1.03
Gender 1.00
Minority Status 1.15
iRead Participation 1.04
Analysis
A robust multiple regression analysis was used to test whether participation in
Project iRead significantly predicted students’ word recognition in isolation. The
variables entered into the model included participation in Project iRead, socioeconomic
status, Hispanic descent, minority status, and gender. The results o f the regression
indicated less than one percent o f the total variability in word recognition in isolation is
explained by the model (R2 = .006). However, the model also indicated significant
explanatory power (F (5, 5111) = 6.27, p < .001). Significant contributors to the model
were socioeconomic status, B = 1.71, t(5,007) = 2.73, p = .006, minority status, B = 2.51,
60

*(5,007) = 4.12, p < .001, and participation in Project iRead, B = -1.38, *(5,007) = 1.38, p
= .02. A second regression analysis was completed that omitted the insignificant
independent variables. The results o f this analysis are presented in Table 10. It must be
noted that the robust linear regression analysis only calculates unstandardized
coefficients. It does not report standardized beta weights. The results o f the linear
regression are presented in Table 11.
Table 10
Regression Analysis o f Word Recognition in Isolation
B SE * P
Constant 33.68 1.07 31.59 .000
Socioeconomic Status 1.71 .62 2.73 .006
Hispanic Descent .52 1.03 .51 .611
Minority Status 2.51 .61 4.12 .000
Gender -.16 .54 -.29 .775
iRead Participation 1.38 .60 2.31 .021
Table 11
Regression Analysis o f Word Recognition Omitting Insignificant Predictors
B SE * P
Constant 34.69 .58 59.75 .000
Socioeconomic Status 1.79 .60 3.00 .003
Minority Status 2.59 .58 4.46 .000
iRead Participation 1.39 .60 2.31 .021
R2 = .006, F(3, 5113)= 10.26,/?< .001
61
Socioeconomic status (B = 1.79, p > .001), minority status (B = 2.59,p = .027),
and participation in Project iRead (B = 1.39, p = .0207) were all significant factors
associated with word recognition in isolation. Students who were identified at a lower
socioeconomic status made significantly greater gains than their peers. Minorities made
greater gains in word recognition than white students. And, most importantly to this
program evaluation, participation in Project iRead made a significant contribution to
student growth in word recognition.
Question Two
Research Question 2 asked, “What is the relationship between participation in
Project iRead and student fluency as identified by student growth on the PALS test?” An
evenly matched sample (N = 5,140) of first and second grade student scores were
examined for growth in fluency from fall to spring during the 2012-13 school year. The
29 students who had fluency scores more than 3 standard deviations from the mean were
removed from the data set before analyses began. Growth for students participating in
Project iRead (N = 2,555, M = 5.46, SD = 3.45) was compared to those not participating
in Project iRead (N = 2,556, M = 5.54, SD = 3.45).
Sample Characteristics
A Shapiro-Wilk’s test (p < .05) and visual inspection o f the histograms, normal
Q-Q plots and box plots were conducted to determine the normality o f the fluency data.
These tests all indicated a non-normal data set. Further examination indicated significant
skewness of .264 (SE = .048) and kurtosis of -.494 (SE = .097) for data o f Project iRead
62

students and significant skewness of .203 (SE = .048) and kurtosis o f -.370 (SE = .097)
for data o f students not participating in the program.
Creating and interpreting a scatterplot for linearity o f the most o f the independent
variables (Project iRead, socioeconomic status, Hispanic descent, minority status and
gender) and the dependent variable (word recognition in isolation) was not applicable in
this instance because these predictor variables were categorical and had no associated
linearity. However, a scatterplot was examined for word recognition in isolation. A
nonparametric Levene’s test was used to determine the equality of variances in the
samples—also known as homoscedasticity (Nordstokke et al., 2011). This test was
utilized due to the lack o f normality in the data. This test supported the null hypothesis
that the data had equality o f variance (F (1,5108) = .23, p = .63). The null hypothesis—
lack o f collinearity—was not violated and results were reported in Table 9.
Analysis
A stepwise multiple regression analysis was used to test whether participation in
Project iRead significantly predicted students’ growth in fluency rates. Socioeconomic
status, Hispanic descent, minority status, gender, and participation in Project iRead were
entered as independent variables for consideration. SPSS generated three models. The
most statistically significant model accounted for a small amount o f the variance in
scores (R2= .012). The model indicated significant explanatory power (F(3, 5106) =
20.55, p < .001). Significant contributors to the model were socioeconomic status, B = -
.503, t(5,106) = -4 .97 , p < .001, minority status, B = .32, /(5 ,106) = 3.13,/? = .002, and
gender, B = -.36, t(5,106) = -3.70, p < .001. Hispanic descent and participation in iRead
63

were excluded from all models due to the lack o f predictive association. Information on
these statistics is presented in Table 12. The results from the best model are presented in
Table 13.
Table 12
Variables Excludedfrom Fluency Analysis
Model Excluded Variable Beta in t P
1 iRead Participation .008 .55 .581
Minority Status .045 3.05 .002
Gender -.051 -3.64 .000
Hispanic Descent -.011 -.79 .431
2 iRead Participation .008 .53 .597
Minority Status .046 3.13 .002
Hispanic Descent -.011 -.74 .458
3 iRead Participation .015 1.01 .313
Hispanic Descent -.024 -1.63 .104
Table 13
Best Fit Fluency Linear Regression Model
B SE fi t P
Constant 5.80 .10 56.50 .000
Socioeconomic Status -.50 .10 -.70 -4.97 .000
Gender -.36 .01 -.05 -3.70 .000
Minority Status .32 .10 .05 3.13 .002
64
It is interesting to note that economically disadvantaged students made
significantly greater gains in word recognition, yet failed to make concomitant gains in
fluency. In fact, the largest predictor o f scores was the negative standardized coefficient
for low socioeconomic status. Females made more growth than males. Minority students
made greater gains than their white peers. It is possible that additional factors have
provided more opportunities for Central School District’s minority students as compared
to their white students. Indeed, the low R2 value of the regression analysis indicates there
are other, better predictors that were not included in the model.
Question Three
Research Question 3 asked, “What is the relationship between participation in Project
iRead and student comprehension as identified by student growth on the PALS test?” An
evenly matched sample (N = 5,140) o f first and second grade student scores were
examined for growth in comprehension from fall to spring during the 2012-13 school
year. One hundred ninety-four students had comprehension scores more than 3 standard
deviations from the mean. These outliers represented less than 5% of the data set and
were eliminated before any analyses began. Growth for students participating in Project
iRead (N = 2,477, M = 11.42, SD = 7.76) was compared to those not participating in
Project iRead (N = 2,469, M = 12.18, SD = 9.25).
Sample Characteristics
A Shapiro-Wilk’s test {p < .05) and visual inspection o f the histograms, normal
Q-Q plots and box plots were conducted to determine the normality o f the fluency data.
These tests all indicated a non-normal data set. Further examination indicated significant
65

skewness o f .298 (SE = .049) and kurtosis of .604 (SE = .098) for data o f Project iRead
students and significant skewness o f .482 (SE = .049) and kurtosis o f .426 (SE = .098)
for data o f students not participating in the program.
Creating and interpreting a scatterplot for linearity o f the independent variables
(Project iRead, socioeconomic status, Hispanic descent, minority status and gender) and
the dependent variable (word recognition in isolation) was not applicable in this instance
because all predictor variables were categorical and had no associated linearity. A
nonparametric Levene’s test was used to determine the equality of variances in the
samples— also known as homoscedasticity (Nordstokke et al., 2011). This test indicated
a heteroscedastic data set ip < .01). The null hypothesis— lack of collinearity— was not
violated and results were reported in Table 9.
Analysis
A robust multiple regression analysis was utilized to test whether participation in
Project iRead significantly predicted students’ comprehension scores. The variables
entered into the model included participation in Project iRead, socioeconomic status,
Hispanic descent, minority status, and gender. The results of the regression indicated less
than one percent o f the total variability in word recognition in isolation is explained by
the model (R2 = .005). However, the model also indicated significant explanatory power
(F (5, 4939) = 5.28, p < .001). Gender, Hispanic descent, minority status, and
participation in Project iRead, all failed to be significant predictors o f comprehension
performance. The only significant contributor to the model was socioeconomic status, B
= -.607, r(4,939) = -2.1 S ,p = .03. The results o f the regression analysis are reported in
66

Table 14. A second regression analysis was completed that omitted the insignificant
independent variables. The results are presented in Table 15. It must be noted that the
robust linear regression analysis utilized for this study only calculates unstandardized
coefficients. It does not report standardized beta weights.
Table 14
Comprehension Regression Analysis Results
B SE T P
Constant 12.32 .30 41.34 .000
Socioeconomic Status -.61 .28 -2.18 .030
Hispanic Descent -.68 .44 -1.54 .124
Minority Status .43 .27 1.57 .118
Gender -.33 .24 -1.37 .170
iRead Participation -.43 .27 -1.61 .107
Table 15
Regression Analysis o f Comprehension Omitting Insignificant Predictors
B SE T P
Constant 12.25 .17 71.01 .000
Socioeconomic Status -.97 .24 -4.03 .000
R2 = .0032, F (l, 4944) = 16.25,/? < .001
The first three research questions examined district-wide data. The relationship of
Project iRead to student learning outcomes in word recognition, fluency, and
comprehension were the relationships o f interest. Project iRead was significantly related
to gains in word recognition, but participation in the program was not significantly
67
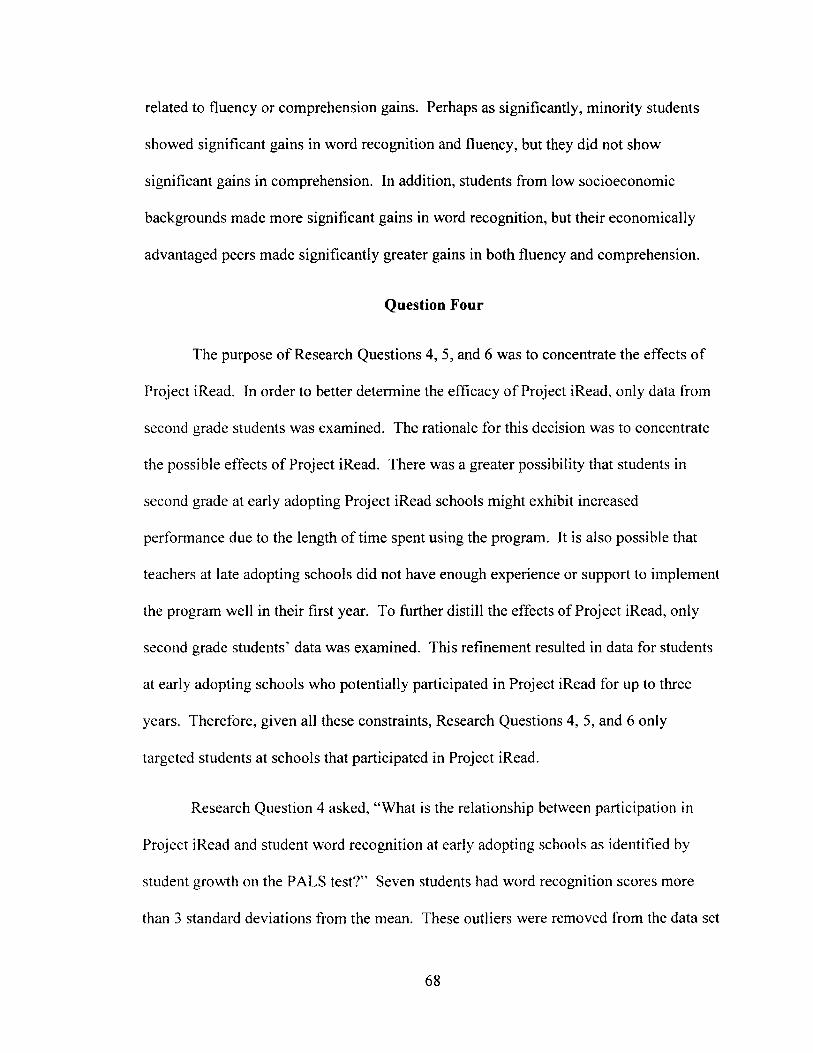
related to fluency or comprehension gains. Perhaps as significantly, minority students
showed significant gains in word recognition and fluency, but they did not show
significant gains in comprehension. In addition, students from low socioeconomic
backgrounds made more significant gains in word recognition, but their economically
advantaged peers made significantly greater gains in both fluency and comprehension.
Question Four
The purpose o f Research Questions 4, 5, and 6 was to concentrate the effects o f
Project iRead. In order to better determine the efficacy o f Project iRead, only data from
second grade students was examined. The rationale for this decision was to concentrate
the possible effects o f Project iRead. There was a greater possibility that students in
second grade at early adopting Project iRead schools might exhibit increased
performance due to the length o f time spent using the program. It is also possible that
teachers at late adopting schools did not have enough experience or support to implement
the program well in their first year. To further distill the effects of Project iRead, only
second grade students’ data was examined. This refinement resulted in data for students
at early adopting schools who potentially participated in Project iRead for up to three
years. Therefore, given all these constraints, Research Questions 4, 5, and 6 only
targeted students at schools that participated in Project iRead.
Research Question 4 asked, “What is the relationship between participation in
Project iRead and student word recognition at early adopting schools as identified by
student growth on the PALS test?” Seven students had word recognition scores more
than 3 standard deviations from the mean. These outliers were removed from the data set
68

before analyses began. Growth for students at early adopting Project iRead schools (N =
548, M = 28.50, SD = 14.85) was compared to growth for students at late adopting
Project iRead schools (N = 672, M - 30.90, SD = 14.68).
Sample Characteristics
A Shapiro-Wilk’s test (p < .05) and visual inspection o f the histograms, normal
Q-Q plots and box plots were conducted to determine the normality o f the word
recognition data. These tests all indicated a non-normal data set. Further examination
indicated no significant skewness (skew =.084, SE = .104) or kurtosis (kurtosis = -.437,
SE = .208) for data of students at early adopting Project iRead schools. There was no
significant skewness (skew = -.038, SE = .094) for data of students at late adopting
Project iRead schools. However, there was kurtosis of -.576 (SE = .188) at those
schools.
Creating and interpreting a scatterplot for linearity o f the independent variables
(Project iRead, socioeconomic status, Hispanic descent, minority status and gender) and
the dependent variable (word recognition in isolation) was not applicable in this instance
because all predictor variables were categorical and had no associated linearity. A
nonparametric Levene’s test was used to determine the equality of variances in the
samples— also known as homoscedasticity (Nordstokke et al., 2011). This test supported
the null hypothesis that the data had equality o f variance ( F ( l , 5108) = .001,/? = .98).
Collinearity was calculated for each predictor variable. The null hypothesis— lack of
collinearity— was not violated and results are reported in Table 16.
69
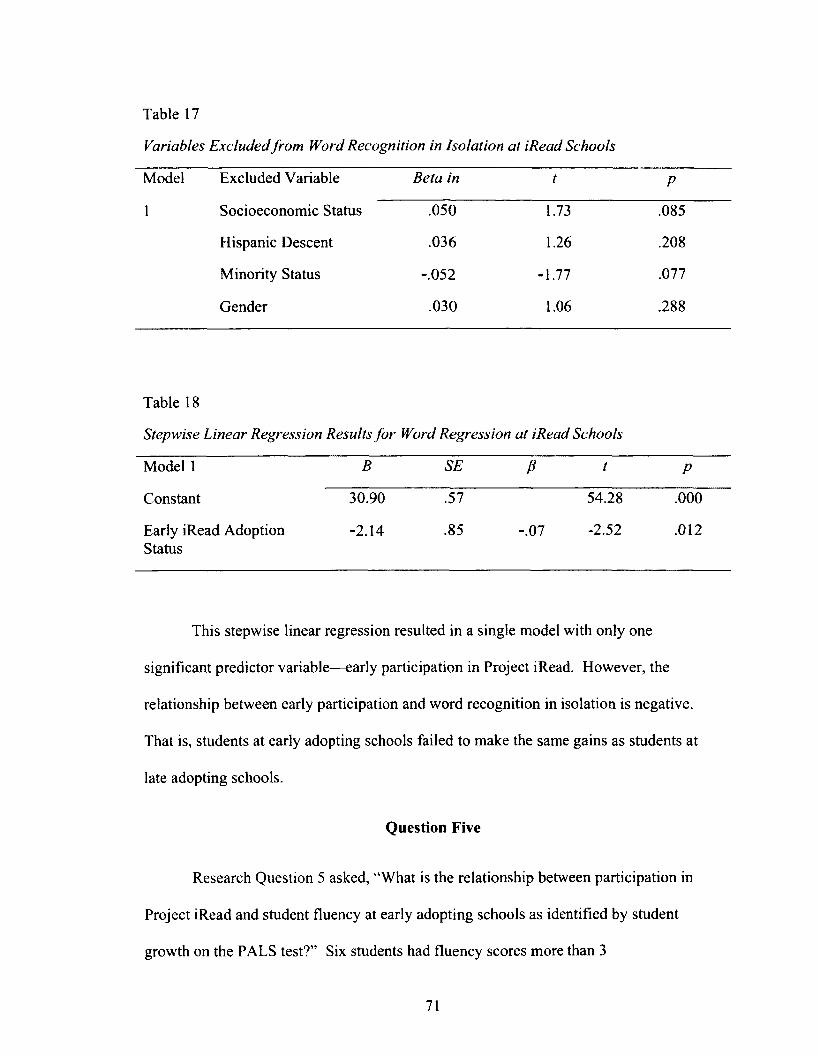
Table 17
Variables Excluded from Word Recognition in Isolation at iRead Schools
Model Excluded Variable Beta in t P
1 Socioeconomic Status .050 1.73 .085
Hispanic Descent .036 1.26 .208
Minority Status -.052 -1.77 .077
Gender .030 1.06 .288
Table 18
Stepwise Linear Regression Results fo r Word Regression at iRead Schools
Model 1 B SE A t P
Constant 30.90 .57 54.28 .000
Early iRead Adoption -2.14 .85 Status
-.07 -2.52 .012
This stepwise linear regression resulted in a single model with only one
significant predictor variable— early participation in Project iRead. However, the
relationship between early participation and word recognition in isolation is negative.
That is, students at early adopting schools failed to make the same gains as students at
late adopting schools.
Question Five
Research Question 5 asked, “What is the relationship between participation in
Project iRead and student fluency at early adopting schools as identified by student
growth on the PALS test?” Six students had fluency scores more than 3
71

standard deviations from the mean. These outliers were removed from the data set before
analyses began. Growth for students at early adopting Project iRead schools (N = 552, M
= 5.00, SD = 2.81) was compared to growth for students at late adopting Project iRead
schools (N = 669, M = 5.56, SD = 3.33).
Sample Characteristics
A Shapiro-Wilk’s test ip < .05) and visual inspection of the histograms, normal
Q-Q plots and box plots were conducted to determine the normality o f the word
recognition data. These tests all indicated a non-normal data set. Further examination
indicated significant skewness of .323 (SE = .104) for data o f students at early adopting
Project iRead schools, but the data were not kurtotis (kurtosis = -.033, SE = .208). There
was also significant skewness of .276 (SE = .094) and significant kurtosis o f -.400 (SE =
.189) for data o f students at late adopting Project iRead schools.
Creating and interpreting a scatterplot for linearity o f the independent variables
(Project iRead, socioeconomic status, Hispanic descent, minority status and gender) and
the dependent variable (word recognition in isolation) was not applicable in this instance
because all predictor variables were categorical and had no associated linearity. A
nonparametric Levene’s test was used to determine the equality of variances in the
samples—-also known as homoscedasticity (Nordstokke et al., 2011). This test indicated
a heteroscedastic data set ip < .01). Collinearity was calculated for each predictor
variable. The null hypothesis— lack of collinearity— was not violated and results were
reported in Table 16.
72

Analysis
A robust multiple regression analysis was utilized to test whether participation in
an early adopting Project iRead school significantly predicted students’ growth in fluency
rates. Socioeconomic status, Hispanic descent, minority status, gender, and early
participation in Project iRead were entered as independent variables for consideration.
The results o f the regression indicated less than one percent o f the total variability in
fluency is explained by the model (R = .0095). However, the model also indicated
significant explanatory power (F (5, 1215) = 2.45, p = .03). Socioeconomic status,
gender, Hispanic descent, and minority status all failed to be significant predictors o f
fluency performance. The only significant contributor to the model was early
participation in Project iRead, B - -.56, r( 1,221) = -3.22, p = .002. The results o f the
regression analysis are reported in Table 19. A second linear regression was created
using only the significant predictor for fluency gains. Those results are presented in
Table 20. It must be noted that the robust linear regression analysis utilized for this
study only calculates unstandardized coefficients. It does not report standardized beta
weights.
73

Table 19
Fluency Regression Analysis Isolated to iRead Schools
B SE T P
Constant 5.32 .23 23.59 .000
Socioeconomic Status .16 .22 .76 .448
Hispanic Descent -.04 .36 -.11 .913
Minority Status .16 .22 .77 .461
Gender .19 .18 1.04 .298
iRead Early Participation -.56 .19 -3.02 .003
Table 20
Fluency Regression at iRead Schools Omitting Insignificant Predictors
B SE T P
Constant 5.56 .13 43.18 .000
iRead Early Participation
rk/v*-rr» m 1 <■> i
-.56 .18 -3.17 .002
R2 = .0079, F(\, 1219) = 10.03, p = .002
The results of this linear regression analysis suggest that students who attend early
adopting Project iRead schools were statistically less successful in making gains in
fluency than their peers at late adopting schools. While the purpose o f Project iRead is to
improve sight word recognition, it was expected that fluency gains would be positively
impacted as well. In fact, the results o f analyses in questions four and five support the
opposite effect for both word recognition and fluency.
74

Question Six
Research Question 6 asked, “What is the relationship between
participation in Project iRead and student comprehension at early adopting schools as
identified by student growth on the PALS test?” Twenty-two students had
comprehension scores more than 3 standard deviations from the mean. These outliers
were removed from the data set before analyses began. Growth for students at early
adopting Project iRead schools (N= 551, M = 9.40, SD = 6.14) was compared to growth
for students at late adopting Project iRead schools (N = 659, M = 11.29, SD = 7.23).
Sample Characteristics
A Shapiro-Wilk’s test (p < .05) and visual inspection o f the histograms, normal
Q-Q plots and box plots were conducted to determine the normality o f the word
recognition data. These tests all indicated a non-normal data set. Further examination
indicated significant skewness of .523 (SE - .104) for data o f students at early adopting
Project iRead schools. The data were not kurtotic (kurtosis = .801, SE = .208). There was
no significant skewness (skewness = . 118, SE = .190) or kurtosis (kurtosis = -.344, SE =
.19) for data o f students at late adopting Project iRead schools.
Creating and interpreting a scatterplot for linearity of the independent variables
(Project iRead, socioeconomic status, Hispanic descent, minority status and gender) and
the dependent variable (word recognition in isolation) was not applicable in this instance
because all predictor variables were categorical and had no associated linearity. A
nonparametric Levene’s test was used to determine the equality of variances in the
samples— also known as homoscedasticity (Nordstokke et al., 2011). This test indicated
75

a heteroscedastic data set (p < .01). Collinearity was calculated for each predictor
variable. The null hypothesis— lack o f collinearity— was not violated and results were
reported in Table 16.
Analysis
A robust multiple regression analysis was utilized to test whether participation in
an early adopting Project iRead school significantly predicted students’ growth in
comprehension rates. Socioeconomic status, Hispanic descent, minority status, gender,
and early participation in Project iRead were entered as independent variables for
consideration. The results o f the regression indicated just over three percent o f the total
variability in comprehension is explained by the model (R2 = .0316). However, the
model also indicated significant explanatory power (F (5, 1204) = 8.64, p < .001). The
only significant contributors to the model were socioeconomic status, B = 1.57, /( l ,204) =
3.41, p < .001, and early participation in Project iRead, B = -1.56, /(1,204) = -3 .86 , p <
.001. The results o f the regression analysis are reported in Table 21. A second
regression analysis was run utilizing only significant predictors. The results o f this test
are presented in Table 22. It must be noted that the robust linear regression analysis
utilized for this study only calculates unstandardized coefficients. It does not report
standardized beta weights.
76

Table 21
Comprehension Regression Analysis Isolated to iRead Schools
B SE t P
Constant 10.44 .50 20.86 .000
Socioeconomic Status 1.31 .45 2.94 .003
Hispanic Descent .36 .67 .54 .589
Minority Status -.36 .48 -.75 .456
Gender -.18 .38 -.49 .627
iRead Participation -1.69 .40 -.75 .000
Table 22
Comprehension Regression at iRead Schools Omitting Insignificant Predictors
B SE t P
Constant 10.10 .42 24.22 .000
Socioeconomic Status 1.62 .41 3.95 .000
iRead Early Participation -1.59 .39 -4.03 .000
= .0315, F(2, 1207) = 21.42,/? < .001
This final research question sought to define the relationship between Project
iRead use at early adopting schools and gains in comprehension as measured by the
PALS test. Two variables proved to be significant— socioeconomic status and iRead
participation. Students with an economically deprived background made greater gains in
comprehension than their more advantaged peers. However, as with word recognition
and fluency, students at early adopting schools achieved significantly less growth than
their peers.
77

Summary
Several important findings resulted from the analysis o f Project iRead. At the
district level, Project iRead had a significantly positive relationship to only gains in word
recognition. Students identified with low socioeconomic status made statistically greater
gains in word recognition, but went on to make statistically less gains in both fluency and
comprehension. Minority students realized greater gains in word recognition and fluency
than white students, but minority status had no significant relationship to comprehension
gains. Females displayed better fluency than males, but no other differences were noted.
The same questions about word recognition, fluency, and comprehension were
assessed for students at early and late adopting Project iRead schools. In all cases Project
iRead exhibited a significant relationship to gains. However, in all cases those
relationships were negative. To be specific, students at late adopting schools
outperformed their peers at early adopting schools. Socioeconomic status is the only
other factor associated with gains. These students made statistically greater gains in
comprehension. This stands in contrast to the overall results for the school district
indicating that students from economically advantaged schools made greater growth in
comprehension.
78

Chapter Five
Discussion and Implications
Reading is an essential skill in today’s society. The United States has spent an
enormous amount o f money and effort to improve the reading ability o f its students.
Since 1969, the National Assessment o f Educational Progress (NAEP) has served as our
only national gauge of student achievement. Campbell, Hombo, and Mazzeo (2000)
reported on trends in NAEP achievement over three decades. Their analysis o f NAEP
scores indicated a consistent divide between white, African American, and Hispanic
students. Phillips and Chin (2004) noted that “the average black fourth-grader scores
about .80 standard deviations below the average white fourth-grader in reading ....
Latino-white gaps are slightly smaller....These gaps change little between fourth and
eighth grade or between eighth and twelfth grade” (p. 468). Results from the 2011
NAEP indicate that all students are failing to make expected improvements. In fact, the
national average for fourth grade students is only two points higher than in 2002. In
addition, the significant differences in achievement rates o f minorities, economically
disadvantaged, and males persist.
The National Reading Panel (NICHHD, 2000) has documented the complexity
associated with reading. The panel specifically identified the importance o f “the big
five” components: phonemic awareness, phonics, fluency, vocabulary, and
comprehension. The panel maintained these components must be explicitly taught to
students and no single component can be viewed as less important than the others.
Students who cannot hear and manipulate phonemes have been shown to struggle with
their written representations (Ehri & McCormick, 1998). Phonics instruction is equally
79

critical. Smith, Simmons, and Kameenui (1998) argue “phonological awareness is a
hallmark characteristic o f good readers while its absence is a consistent characteristic of
poor readers” (p. 61). Fluency allows students to move from the realm o f learning words
to comprehending the meaning o f text. Research indicates a high correlation (r = .74)
between curriculum based measures o f fluency and comprehension (Shinn, Good,
Knutson, & Tilly, 1992). Vocabulary is so intricately linked to comprehension that the
National Reading Panel reported no studies were available to indicate vocabulary causes
increased comprehension (NICHHD, 2000). The panel argued that vocabulary and
comprehension both define the meaning o f the text, merely at different levels. The final
element o f “the big five” is comprehension. Ultimately, this is the purpose for reading
(Durkin, 1993, Starred, 2006). These five factors work together as the basis o f reading.
The purpose o f this particular study was to evaluate Project iRead. The program’s
primary goal is to increase word recognition in isolation. How does this goal support the
National Reading Panel’s recommendations? How does it draw from extant research
about best practices? Lexical automaticity is essential for reading (Ehri, 2005; Hudson et
al., 2009; Pikulski & Chard, 2005). This automaticity relies on a vast sight word
vocabulary that, in turn, frees students’ attention for the task o f comprehension (Samuels
& Kamil, 1984). Simply put, decoding and context clues are cumbersome tools for
students. Far too much working memory is consumed to permit comprehension.
Students without a robust personal lexicon face a lifelong struggle with reading (Snow,
Bums, & Griffin, 1998). Vellutino (2003) posits “reader differences in the acquisition o f
fluent word recognition skills are the primary and most common source of variability in
reading comprehension in elementary school children” (p. 53). Project iRead allows
80

teachers to employ their knowledge of individual student needs in order to differentiate
for instruction, remediation, or enrichment. Research supports sight word instruction.
Project iRead’s foundation is strong.
Findings
Does Project iRead meet its potential? This summative program evaluation
examined student growth in word recognition in isolation, fluency, and comprehension
during the 2012-13 school year. The findings o f the quantitative analysis o f Project
iRead’s relationship to these outcomes are discussed below in two separate sections. The
first will focus on differences between students at schools that participated in Project
iRead as compared to those who did not. The second will concentrate on the differences
between students at early adopting Project iRead schools as compared to students at late
adopting schools.
District Data
Project iRead (B = 1.39,p = .02) was positively related to growth in word
recognition as were low socioeconomic status (B = 1.79,p = .003) and minority status (B
=2.59, p < .001). Increasing sight word recognition is the primary goal o f Project iRead,
thus these results indicate the program is reaching its desired outcome. In addition, the
relationships for socioeconomic and minority status must also be addressed. Typically,
these two sub-groups attain less growth than their peers. How might this significant
relationship between low socioeconomic status and minority status be explained? There
are two possibilities.
First, one must note that Hart and Risley (1995) conducted a two and a half year
longitudinal study of forty-two families from various socioeconomic statuses. They
81

found children from with socioeconomic backgrounds typically heard 2,153 words per
hour, children in working class families heard an average o f 1,251 words per hour and
children with low socioeconomic backgrounds heard an average o f 616 words per hour.
They extrapolated their research to suggest that, by age four, a child from an
economically deprived background could hear 32 million fewer words than his or her
economically advantaged peer. Perhaps this additional growth for economically
disadvantaged students (who are often disproportionately minorities) in Central School
District is indicative o f the amount o f ground they needed to make up to reach the
achievement level o f their peers.
Alternatively, one might argue the ceiling effect or regression to the mean
prevented higher achieving students from showing their true ability (Kiess & Green,
2010). PALS charts growth from pre-primer to sixth grade. Students who were already at
the top o f the PALS continuum simply had no room for growth. At this point, there is no
way of knowing demographic information about these high achieving students due to the
way data were coded.
Word recognition is not end to itself. Rather, it is a tool that allows students to
build their fluency and comprehension (Ehri, 2005). Because there is a positive
relationship between Project iRead and students’ word recognition, one would expect to
see a corresponding increase in fluency gains. However, this prediction did not hold true.
There was a relationship between gender and fluency with females making greater gains
than males (B = -.36, p < .001). And while minorities and economically disadvantaged
students made greater gains in word recognition than their peers, those gains did not
continue for the fluency o f students from low socioeconomic backgrounds (B - -.503,/?
82

< .001). Arnold and Doctoroff (2003) posit “research in challenging because o f major
differences across and within each ethnic group. SES appears to be the primary force
behind academic risk among minority children. Nevertheless, minority status likely adds
at least some additional risk o f educational underachievement” (p. 526). The additional
gains for minority students may actually be indicative of how far behind these students
were. It is also alarming to note that an examination o f the data set itself revealed 327 of
the 2,573 students, 12.7%, who started the school year with a fluency rate o f zero also
ended the school year with a fluency rate o f zero.
The question of increased comprehension is perhaps furthest from Project iRead’s
stated goal o f improving sight word recognition. And yet, comprehension is exactly the
goal o f reading instruction. Durkin (1993) argues that reading is an intentional process
wherein the reader constructs meaning about the text. If students are not able to
understand the text and put that understanding to use, then the fundamental purpose for
reading is lost. Thus, improving comprehension rates is suggested as the true desired
outcome for any reading intervention program. How has Project iRead fared in this
respect? A robust linear regression revealed only one predictor of gains in
performance— socioeconomic status (B = -.97, p < .001). This negative correlation
indicates that students from economically advantaged homes made greater gains than
their disadvantaged peers. Thus, when we come to the real purpose o f reading—
comprehension— the only statistically related difference in results is for students who did
not come from disadvantaged homes.
The summarized district results are presented in Table 23. Project iRead met its
stated goal of improving word recognition, but there were no related improvements in
83

fluency or comprehension. It is also important to recognize the relationship o f low
socioeconomic status and reading achievement. Crowe, Connor, and Petscher (2009)
have documented the impact o f poverty on poor academic outcomes. These researchers
also note the influence o f lessened family involvement, school resources, and language
resources as contributing factors in students’ failure to attain expected growth. The low
R2 value of all the models associated with this research indicate there were other
factors— perhaps these— that were not accounted for.
Table 23
Summarized District Data
Positive Negative No Significant
Relationship Relationship Relationship
Word Recognition Project iRead Hispanic Descent
in Isolation Participation
Socioeconomic
Status
Minority Status
Gender
Fluency Minority Status Socioeconomic
Status
Gender
Project iRead
Participation
Hispanic Descent
Comprehension Socioeconomic
Status
Project iRead
Participation
Minority Status
Hispanic Descent
Gender
84

Early and Late Adopting School Data
Second grade data from early and late adopting schools were analyzed in an
attempt to concentrate the effects o f Project iRead. The rationale for this was to maximize
the number of years students were engaged in the program. First grade students received
a maximum of two years o f iRead instruction at early adopting schools, but second grade
students had a maximum o f three years instruction. By contrast, students at late adopting
schools received a year or less o f Project iRead instruction. The same questions and
variables were employed as in the first three research questions.
There was only one variable significantly associated with word recognition in
isolation— early participation in Project iRead (B = -2 .14 ,p = .012). This is a negative
association. In other words, students at late adopting schools performed significantly
better than their early adopting peers. Ehri (2005) maintains that memorizing words with
a look— say approach lacks the power necessary to explain how skilled readers can
recognize thousands o f words instantaneously. Instead, Ehri argues that connections in
spelling and word families form a better description for how students learn sight words.
It would follow that teaching word families and graphophonemic relations may be a
better way to increase students’ sight word knowledge. It is possible the existing
interventions and supports at the late adopting schools were more advantageous for
increasing sight word recognition.
There was only one variable significantly associated with fluency— early
participation in Project iRead (B = -.56, p - .002). It must again be noted this is a
negative relationship between early participation and fluency. The early and late
adopting schools appeared to be very similar demographically. This seems to hold true in
85

the analysis o f the data as there are no statistically significant findings for minorities,
Hispanics, males, or socioeconomically disadvantaged students. Why, then, is
participation in a program that teaches sight word recognition related to reduced gains in
sight word recognition and fluency? Crowe et al. (2009) argue that a complication of
using “curriculum as a component o f reading reform lies in the possibility that the
effectiveness o f any one curriculum may depend on many factors, the most prominent of
which may be characteristics o f the students themselves” (p. 189). Therefore, some other
factors, unaccounted for in this program evaluation, may play a larger role in student
growth in both word recognition and fluency.
Theoretically, a goal of sight word recognition is to free working memory for the
more complex tasks o f fluency and comprehension (Hudson et al., 2009). When word
recognition becomes effortless, the reader’s attention can focus on understanding
(Laberge & Samuels, as cited in Hudson et al., 2009). The final research question in this
program evaluation sought to determine the relationship between comprehension and
Project iRead. In this case there were two significant variables. Students who were
economically disadvantaged made greater gains in comprehension skills than their
advantaged peers (B = 1.62, p < .001). Possible explanations for such an outcome were
examined in earlier paragraphs. However, Project iRead was negatively related to growth
in comprehension skills (B - ~ 1.59, p < .001). Hence, this research revealed a negative
relationship between Project iRead and all outcome variables when comparing early and
late adopting schools. There are two possible explanations for these results. Either
Project iRead is not meeting its stated goal of improving sight word recognition or there
86

are unaccounted, confounding variables involved. First, I will examine the latter
possibility.
Fifteen o f the schools in this portion o f the study were Title I schools. However,
two early adopting schools were not Title I and had significantly lower numbers o f
minority and disadvantaged students. In fact, o f the one hundred nine students at
Tidewater Elementary School included in the study, just five were coded at low
socioeconomic status and only two were African Americans. Research indicates that
minorities and economically disadvantaged students do not achieve reading gains at
national averages (Arnold & Doctoroff, 2003; Crowe et al., 2009; Snow, 2002). That
same research indicates that whites and economically advantaged students achieve
reading gains above the national averages. The PALS test only documents reading levels
up to and including sixth grade. Therefore, if there were more students at Tidewater who
experienced a ceiling effect, their scores may have biased the results o f this program
evaluation. An interview with the program’s creator also revealed that Left Bank, an
early adopting school, uses Project iRead exclusively in third grade. Their practices,
therefore, likely skewed the results for early adopting schools in general.
There remains, however, the possibility that Project iRead does not have a
significant relationship to student gains in reading. Certainly, the results o f the
comparison between early and late adopting schools seem to support the lack o f effect.
Stanovich (1986) famously identified Matthew effects in reading wherein he argues that
our attempts to remediate struggling students “combined with the large skill differences
in reading volume, could mean that a ‘rich-get-richer’ or cumulative advantage
phenomenon is almost inextricably embedded within the developmental course o f reading
87

progress” (p. 381). In other words, repeated practice with the same words results in a
slower vocabulary development that, in turn, impedes fluency and comprehension. The
results o f this evaluation may support Stanovich’s research.
To summarize the overall results of this study, Project iRead had a positive
relationship to word recognition growth for participants as compared to non-participants,
yet a negative relationship to word recognition, fluency, and comprehension for early
adopting schools as compared to late adopting schools. And, although there were
numerous statistically significant relationships between predictor and outcome variables,
none of the results had practical significance due to the small amount o f variability each
o f the models explained. The implications for these results will be discussed further in
the next section of this research.
Standards of Program Evaluation
Throughout this summative evaluation o f Project iRead, the researcher referred to
the JCSEE’s Program Evaluation Standards (Yarbrough et al., 2011). The utility
standard was met through the dissemination o f the evaluation’s findings. The researcher
contacted Project iRead’s creator often, relating the results and requesting additional
information to explicated those findings. The feasibility standards were met in several
ways. First, there were no costs incurred by Central School District. Disruption was
minimalized because existing PALS data were employed to appraise Project iRead’s
relationship on student outcomes. Use of the existing PALS data ensured negligible
impact on teachers’ and administrators’ workloads. JCSEE’s propriety standards were
met multiple ways as well. First, the research did not begin until a formal, written
agreement was reached with Central School District detailing its parameters and goals.
88

The rights o f human subjects were guaranteed through the College o f William and
Mary’s Institutional Review Board, which exempted it from formal review due to the fact
that the research is “conducted in established or commonly accepted educational settings,
involving normal educational practices” (Protection o f Human Subjects, 2009, p. 3). The
assessment itself was complete and fair, detailing both the strengths and weaknesses o f
Project iRead. Finally, all results were communicated to the program’s creator and to
stakeholders in Central Office. The accuracy standards were met through detailed
description o f Project iRead, the purpose and procedures for the program evaluation, and
the validity and reliability o f the PALS data.
Consideration was given to usefulness, context, resources, reliability, validity, and
moral and ethical concerns. Balancing each o f these components o f the Program
Evaluation Standards provided “the methodology used to increase and document
evaluation quality” (Yarbrough et al., 2011, pp. xxviii). Yarbrough, Shulha and
Caruthers (2004) contend that the growth in program evaluation requires attention to
standards and that the “users’ questions inform the choice o f methodology in order to
make an efficient, effective, and useful evaluation more likely” (p. 27). This program
evaluation has met those goals.
Implications for Practice
The results of this program evaluation were puzzling. Students participating in
Project iRead made greater gains in sight word recognition than their peers who did not
participate. However, when early and late adopting participators were compared,
students who spent more time in the program realized significantly less growth. There
89

are several implications for practice that may serve to enhance the possible benefits o f
Project iRead.
First, the iRead manual should be reviewed and updated to define
implementation. A successful program begins with successful implementation.
Fitzpatrick et al. (2012) maintain that implementation failure occurs when a program is
not delivered as planned causing the program to fail to meet its goals. Central School
District gives a great deal o f autonomy to its building administrators. At this point, the
Project iRead manual does not specify how often, how many minutes, or the duration of
the program. In addition, there are no parameters for determining when a student should
be evaluated and moved into a new, more challenging word set. A revision o f the manual
specifying these factors for Tier I, II, and III instruction would allow the program creator,
central office staff, and building administrators to determine whether the program is
being used with fidelity.
Second, research indicates that students benefit from programs featuring
systematic and explicit associations o f the phonemic patterns such as those found in word
families (Ehri, & McCormick, 1998; NICHHD, 2000; Wolter & Apel, 2010). Project
iRead would profit from additional word lists (in the form of VFCs) that utilize word
families to enable students’ recognition o f spelling patterns. These lists would be
assigned to students based on individual PALS scores defining reading levels. Again,
specificity in delineating the usage o f the program will add to the effectiveness o f this
program.
Next, emphasis should be placed on students with specific learning disabilities.
Previous research on sight word instruction has focused on exceptional education
90
students (Browder & Xin, 1998; Mesmer et al., 2010; Van Norman & Wood, 2008).
Some exceptional education students lack the basic decoding skills necessary for
phonemic reading. A variety o f underlying processing problems prevents these students
from being able to generalize the phonemic patterns in the English language. Therefore,
learning sight words has traditionally been a significant strategy used with this
population. At this point, Project iRead has not specifically been targeted for use with
exceptional education students or with autistic spectrum students. However, both of
these groups may benefit from targeted instruction.
Finally, a plan needs to be created for students who are identified below
benchmark in PALS. These students require the maximum support in order to ensure
success. In 1997, the Virginia General Assembly established the ground works for PALS
testing with the express purpose o f identifying and remediating students at risk for early
reading problems (Invemizzi et al., 2004). Students who are identified as “below
benchmark” in kindergarten, first and second grades are required to receive additional
instruction to help them reach on grade level performance by third grade. It is these
students who are not exceptional education, but who are struggling with the phoneme to
grapheme connections, who may also benefit from regular, defined participation in
Project iRead. The U. S. Department o f Education (Torgesen et al., 2006) concluded that
effective reading intervention models must be provided 30 minutes per day and include
fast paced, engaging instruction in a small group at the student’s ability level. While one
would not expect students to spend 30 minutes per day practicing sight words, this
activity could certainly serve as an introduction to each daily lesson.
91

In summary, there are a number o f ways Project iRead’s implementation model
could be improved. A focus on exceptional education students and students identified
below benchmark on PALS would better define Project iRead’s purpose in the district.
That definition could be set forth explicitly with implementation guidelines in the
program’s handbook. However, in order for implementation to truly be successful, it is
this evaluator’s belief that a collaborative effort between Project iRead’s creator,
directors o f elementary education, the reading specialist, and the coordinator for
Response to Intervention must occur. A unified effort to promote best practices as they
apply to Project iRead will best ensure that Central School District is getting best results
from the resources in which they have invested.
Implications for Research
The data in this program evaluation were problematic. The lack o f normalcy
accompanied by the absence o f equality o f variance gives one pause when interpreting
the results o f the evaluation. In addition, the weakness in the predictive power for all the
models suggested additional factors should be examined in future research. Some of
these avenues are explored in the following paragraphs.
A qualitative study involving a case study, multiple site interviews, open-ended
questionnaire items, or a combination o f data points would reveal the depth to which
Project iRead is actually being utilized at each site. This information could explain the
negative relationship between early adopting schools and gains in word recognition,
fluency, and comprehension. The contrast o f positive association with Project iRead
participation and word recognition gains at the district level might also be clarified in a
qualitative study. Questions to ask educators might include:
92

• How do you select students to use Project iRead?
• How do you decide how many minutes per session students will use Project
iRead?
• How do you determine how often students will use Project iRead?
• What does iRead add to your reading instruction?
• What do you think is important about iRead?
• Can you share a success story involving iRead?
• What obstacles do you have to overcome in order to use iRead?
• What would effective implementation o f iRead look like?
By conducting a qualitative analysis, additional formative data could add to the
summative information gathered in this program evaluation. Combining the formative
and summative data could better enlighten Central School District and thereby provide
for enhanced implementation of Project iRead.
A ceiling effect is a commonly recognized occurrence wherein results may be
skewed because subjects at the top o f the scale have nowhere to go. In the case o f the
PALS data, four hundred thirteen students were at the fifth or sixth grade word
recognition level in the fall, leaving them with little or no room for growth in the spring.
One hundred thirty-four students were at the fifth or sixth grade level for fluency in the
fall and eighty-one o f those students were at the absolute top rating with no possibility of
scoring higher. One hundred one students had perfect or almost perfect (one point off)
scores on the sixth grade comprehension questions in the fall. The only possibility for
many of these students was a regression to the mean. Future research might better reveal
the effects of Project iRead by removing these students from the data pool at both
93

participating and non-participating schools. Focusing on only grade level or below grade
level readers may better explicate the effects o f Project iRead on student gains in reading.
Rather than control for the ceiling effect, reducing the sample size might provide
a clearer picture o f the impact o f Project iRead on student growth. In a normally
distributed data set, approximately 95% of all scores lie within two standard deviations o f
its mean (Gall, Gall, & Borg, 2007). This study included scores within three standard
deviations. While such a wide range allowed the inclusion of more data, it may also have
skewed the results. Fifty-three o f the fifty-eight students who either lost ground on their
word recognition skills or made no gains were already recognizing words at or above
grade level in the fall. Ninety-four o f the five hundred ninety-nine students who either
lost ground or made no gains in their fluency rates had perfect or nearly perfect prosody
at the sixth grade level in the fall (scores o f 20 or 21). One hundred three o f eight
hundred students who either lost ground or made no gains in comprehension rates had
perfect or nearly perfect comprehension scores at the sixth grade level in the fall (scores
of 41 or 42). Reducing the data set to two standard deviations would eliminate these
students and control for the ceiling effect.
Research has shown the importance o f teaching students the connections between
graphemes and phonemes (Ehri, & McCormick, 1998; NICHHD, 2000; Wolter & Apel,
2010). If the Project iRead’s creator opts to expand the VFCs and include word families,
a study tracking their success would be needed. These data could reveal whether a new
model for Project iRead increases its efficacy. This recommendation for research would
be predicated on both changes to the types o f VFCs available and refinement o f the
94

program manual. The manual modifications should specify the duration o f each session
and other parameters as discussed in earlier in this paper.
A conversation with the Project iRead’s creator revealed a great deal o f variation
in implementation methods throughout the school district. Another study utilizing nested
data could reveal where Project iRead might have greater impact. A generalized linear
mixed model would allow data nesting. Future research could examine data at multiple
levels to determine whether particular schools or classes have an effect on student
outcomes. By nesting the data from school to classroom to student, the variability o f past
implementation practices could be silenced thereby allowing an improved understanding
o f the relationship between Project iRead and student growth in reading.
Although some have cast a broad net in sight word research (Caldwell, 2013;
MacQuarrie, 2012; Nelson, 2008), the majority o f published work examines the efficacy
of sight word instruction for exceptional education students (Bear, Negrete, & Cathey,
2012; Browder & Xin, 1998; Cullen, Keesey, Alber-Morgan, & Wheaton, 2013; Simos et
al., 2007,;Vellutino et al., 1996). Another examination o f 2012-13 data would provide
insight into the relationship between Project iRead, disability status, and student growth
in reading. Typically, PALS data includes information about student disabilities.
However, those data were eliminated from the files the district provided. The researcher
requested information regarding socioeconomic status and was unaware that receiving
this information would preclude also having information about participation in
exceptional education. Thus, another analysis o f the same data with this additional
predictor variable might reveal more information about the efficacy o f Project iRead.
95

None of the models in this program evaluation significantly explained the
outcome variables. In fact, R2 ranged from .005 to .034 indicating little predictive power.
The National Reading Panel has emphasized the inter-relatedness o f “the big five”—
phonemic awareness, phonics, fluency, vocabulary, and comprehension (NICHHD,
2000). Research indicates a significant achievement gap between socioeconomic classes
and minorities (Arnold & Doctoroff, 2003; Crowe et al., 2009; Snow, 2002). Although
the purpose o f this research was to determine the relationship between Project iRead and
student gains in reading, further exploration o f existing national issues are warranted.
Specifically, an analysis o f the relationship between word recognition in isolation and
fluency as predictive factors for comprehension should be examined. It would be
informative to identify any possible differences in these relationships based on
socioeconomic and/or minority status.
In summary, there are several avenues for research. A number o f variables could
be explored through either quantitative or qualitative analysis. Determining the fidelity
o f implementation, refining the sampling method, investigating new VFCs, and adding
additional predictive factors the regression model all have the potential not only to
elucidate the impact o f Project iRead, but also to add to the body of knowledge about the
complexities associated with reading achievement.
Final Thoughts
The stated purpose of this research was to explore the relationship o f Project
iRead to student outcomes in reading. However, several other notable issues arose both
during conversations with the program’s creator and in the analysis o f other independent
variables. The first concern was about the definition of the program. Teachers likely did
96

not make optimal use o f this valuable tool due to lack of clear, definitive guidance on
how often to utilize it or how often to move students up to more challenging word lists.
One o f the first lessons learned in a program evaluation class involves logic models. A
program needs defined inputs, activities, outputs, and outcomes. Central School District
prides itself on giving building level administrators autonomy in daily practices.
However, the nebulous nature o f Project iRead’s parameters may well prevent it from
being as effective as it can be. An issue strongly related to the definition o f Project iRead
is its implementation. Research indicates that first and second grades are the most
applicable years for students to build basic sight vocabulary knowledge. If schools such
as Left Bank completely exclude these students from participating, will Project iRead be
able to meet its potential even with changes in its manual?
The leading areas o f concern, however, went beyond the scope o f Project iRead.
These were the matters o f race and socioeconomic class. The district results from 5,140
students indicated achievement gaps between minorities and whites and between students
from low socioeconomic backgrounds and their more privileged peers. This is not new.
And yet, it is disconcerting to see more evidence of disparities in student achievement. It
is hoped this program evaluation will provide the information necessary to refine Project
iRead. It is also hoped that Matthew effects can be diminished in Central School District
in order to lessen these achievement gaps.
97

9898

References
Adams, M. J. (1990). Beginning to read: Thinking and learning about print. Boston, MA :
Massachusetts Institute o f Technology.
Adlof, S. M., Catts, J. W., & Little, T. D. (2006). Should the simple view of reading include a
fluency component? Reading and Writing, 19(9), 933-958. doi: 10.1007/sl 1145-006-
9024-z
Amrein-Beardsley, A. & Haladyna, T. (2012). Validating a theory-based survey to evaluate
teaching effectiveness in higher education. Journal on Excellence in college Teaching,
23(1), 17-42.
Anbar, A. (1986). Reading acquisition of preschool children without systematic instruction.
Early Childhood Research Quarterly, 1, 69-83.
Armbruster, B. B., Lehr, F. & Osbom, J. (2001). Put reading first: The research building blocks
fo r teaching children to read: Kindergarten through grade 3. Ann Arbor, MI: Center for
the Improvement o f Early Reading Achievement (CIERA).
Armbruster, B. B., Lehr, F. & Osbom, J. (2003). Put reading first: The research building blocks
o f reading instruction (2nd ed.). Washington, DC: Center for the Improvement o f Early
Reading Achievement.
Arnold, D. H., & Doctoroff, G. L. (2003). The early education of socioeconomically
disadvantaged children. Annual Review o f Psychology, 54(1), 517-545. Retrieved from
http://web.b.ebscohost.com.proxy.wm.edu/ehost/pdfViewer/pdfViewer?sid=33flcbbd-
f6ef-4e25-b31d-705d0e85c264%40sessionmgrl 15&vid=l&hid=l 14
Bear, D. R., Negrete, S., Cathey, S. (2012). Developmental literacy instruction with struggling
readers across three stages. New England Reading Association Journal, 48( 1), 1-9.
99
Creswell, J. W. (2012). Educational research: Planning, conducting, and evaluating quantitative
and qualitative research (4th ed.). Upper Saddle River, NJ: Pearson.
Crowe, E. C., Connor, C. M. & Petscher, Y. (2009). Examining the core: Relations among
reading curricula, poverty, and first through third grade reading achievement. Journal o f
School Psychology, 47(3), 187-214.
Cullen, J., Keesey, S., Alber-Morgan, S. R., Wheaton, J. (2013). The effects o f computer-assisted
instruction using Kurzweil 3000 on sight word acquisition for students with mild
disabilities. Education and Treatment o f Children, 36(2), 87-103. Retrieved from
http://web.a.ebscohost.com.proxy.wm.edu/ehost/pdfviewer/pdfViewer?sid=6339fl5d-
0d9f-4a87-ba6d-0d895e41 c67f%40sessionmgr4004&vid= 1 &hid=4101
Diehl, H. L., Armitage, C. J., Nettles, D. H., & Peterson, C. (2011). The three-phase reading
comprehension intervention (3-RCI): A support for intermediate-grade word callers.
Reading Horizons, 51(2), 149-170.
Dolch, W. W. (1936). A basic sight word vocabulary. The Elementary School Journal, 36(6),
456-460. Retrieved from
http://www.jstor.org.proxy.wm.edu/stable/pdfplus/995914.pdf?acceptTC=true
Donat, D. J. (2006). Reading their way: A balanced approach that increases achievement.
Reading & Writing Quarterly, 22(4), 305-323.
Durkin, D. (1993). Teaching them to read (6th ed.). Boston, MA: Allyn & Bacon.
Ehri, L. C. (1998). Grapheme-phoneme knowledge is essential for learning to read words in
English. In J. L. Netsala & L. C. Ehri (Eds.), Word Recognition in Beginning Literacy (3-
40). Mahwah, NJ: Erlbaum.
101

Ehri, L. C. (2005). Learning to read words: Theory, findings, and issues. Scientific Studies o f
Reading, 9(2), 167-188.
Ehri, L. & McCormick, S. (1998). Phases o f word learning: Implications for instruction with
delayed and disabled readers. Reading and Writing Quarterly, 14, 135-163.
Fitzpatrick, J. L. Sanders, J. R., Worthen, B. R. (2012). Program evaluation: Alternative
approaches and practical guidelines (4th ed.). Boston, MA: Pearson.
Foorman, B. R., Chen, D. Carlson, C. Moats, L., Francis, D. J., & Fletcher, J. M. (2003). The
necessity o f the alphabetic principle to phonemic awareness instmction. Reading and
Writing: An Interdisciplinary Journal, 16, 289-324.
Freund, R. J., Wilson, W. J., Sa, P. (2006). Regression analysis: Statistical modeling o f a
response variable. Boston, MA: Academic Press.
Gamse, B. C., Jacob, R. T., Horst, M., Boulay, B., & Unlu, F. (2008). Reading First impact study
fina l report. National Center for Education Evaluation and Regional Assistance, Institute
o f Education Sciences, Washington DC: U. S. Department o f Education. Retrieved from
http ://ies. ed. gov/ncee/pdf/20094038.pdf
Griffith, P. L. & Olson, M. W. (1992). Phonemic awareness helps beginning readers break the
code. The Reading Teacher, 45(1), 516-523.
Grondlund, N. E. (1985). Measurement and evaluation in teaching (5th ed.). New York, NY:
Macmillan.
Gronlund, N. E. & Waugh, C. K. (2009). Assessment o f student achievement (9th ed.). Boston,
MA: Allyn & Bacon.
Gunning, T. G. (2003). Creating literacy instruction fo r all children. Boston, MA: Allyn and
Bacon.
102

Harris, T., & Hodges, R. (Eds.). (1995). The literacy dictionary, Newark, DE: International
Reading Association.
Hart, B. & Risley, R. T. (1995). Meaningful differences in the everyday experience o f young
American children. Baltimore, MD: Paul H. Brookes.
Hayes, A. F., & Cai, L. (2007). Using heteroscedasticity-consistent standard error estimators in
OLS regression: An introduction and software implementation. Behavior Research
Methods, 39(4), 7009-722. Retrieved from
http://download.springer.com/static/pdf/14/art%253A10.3758%252FBF03192961.pdf?au
th66=l394043687_5e3166a3139fb4a07c6b6c35f8a04ab0&ext=.pdf
Hecht, S. A. & Close, L. (2002). Emergent literacy skills and training time uniquely predict
variability in responses to phonemic awareness training in disadvantaged kindergarteners.
Experimental Child Psychology, 82(2), 93-115. Retrieved from http://ac.els-
cdn.com/S002209650200001211 -s2.0-S0022096502000012-main.pdf?_tid=94bd7aac-
addf-1 Ie3-bc46-
00000aacb35e&acdnat=1395066333_e4e72a3643990b344c71288293764e2e
Hicks, C. P. (2009). A lesson on reading fluency learned from The Tortoise and the Hare. The
Reading Teacher, 63(4), 319-323. doi: 10.1598/RT.63.4.7
Hiebert, E. H. & Kamil, M. L. (eds.) (2005). Teaching and learning vocabulary: Bringing
research to practice. Mahwah, NJ: Erlbaum.
Hiebert, E. H., Samuels, S. J. & Rasinski, T. (2012). Comprehension-based silent reading rates:
What do we know? What do we need to know? Literacy Research & Instruction, 51(2),
110-124.
103
Homan, S. P., Klesius, J. P., & Hite, C. (1993). Effects o f repeated readings and nonrepetitive
strategies on students’ fluency and comprehension. Journal o f Educational Research,
87(2), 94-99.
Hudson, R. F., Lane, H. B. & Pullen, P. C. (2005). Reading fluency assessment and instruction:
What, why, and how? The Reading Teacher, 55(8), 702-714. doi:10.1598/RT.58.8.1
Hudson, R. F., Pullen, P. C., Lane, H. B., Torgesen, J. K. (2009). The complex nature o f reading
fluency: A multidimensional view. Reading & Writing Quarterly, 25(1), 4-32.
International Reading Association (IRA) & National Association for the Education o f Young
Children (NAEYC). (1998). Learning to read and write: Developmentally appropriate
practices for young children. The Reading Teacher, 52(2), 193-215.
Invemizzi, M. Justice, L., Landrum, T. J. & Booker, K. (2004). Early literacy screening in
kindergarten: Widespread implementation in Virginia. Journal o f Literacy Research,
36(4), 479-500. doi: 10.1207/sl5548430jlr3604_3
Invemizzi, M., Meier, J., Juel, C., Virginia State Department o f Education, & University of
Virginia’s Curry School o f Education. (2003). PALS: 1-3 Technical reference.
Charlottesville, VA: University o f Virginia. Retrieved from
https://pals.virginia.edu/pdfs/rd/tech/l-3%20Tech%20Ref%202013_A.pdf
Invemizzi, M. & Meier, J. (2003). Phonological awareness literacy screening 2002-2003:
Technical reference. Charlottesville, VA: The Rector and Board of Visitors o f the
University o f Virginia.
Johns, J. L. (1970). The Dolch basic word list—Then and now. Journal o f Reading Behavior,
3(4). doi: 10.1080/10862967009546963
104
Nordstokke, D.W., Zumbo, B. D. Caims, S. L., & Saklofske, D. H. (2011). The operating
characteristics o f the nonparametric Levene test for equal variances with assessment and
evaluation data. Practical Assessment, Research, & Evaluation, 16(5), 1-8. Retrieved
from http://pareonline.net/getvn.asp?v= 16&n=5
Pearson, P. D., Hiebert, E. H., & Kamil, M. L. (2007). Vocabulary assessment: What we know
and what we need to learn. Reading Research Quarterly, 42(2), 282-296. doi:
0.1598/RRQ.42.2.4
Phillips, N. & Chin, T. (2004). School inequality: What do we know? In K. M. Neckerman (ed.),
Social inequality (pp. 467-520). New York, NY: Russell Sage Foundation.
Pikulski, J. J. & Chard, D. J. (2005). Fluency: Bridge between decoding and reading
comprehension. Reading Teacher, 58(6), 510-519. doi: 10.1598/RT.58.6.2
Protection o f Human Subjects, 45 Code of Federal Regulations, §45. (2012). Retrieved from
http://www.hhs.gov/ohrp/policy/ohrpregulations.pdf
Pruitt, S., Oetting, J., & Hegarty, M. (2010). Passive participle marking by African American
English-speaking children reared in poverty. Journal o f Speech, Language, and Hearing
Research, 54(2), 598-607.
Rank, M. R., & Hirschl, T. A. (1999). The economic risk of childhood in America: Estimating
the probability of poverty across the formative years. Journal o f Marriage and Family,
6 l(4), 1058-1067. Retrieved from
http://www.jstor.org.proxy.wm.edu/stable/pdfplus/354024.pdf?acceptTC=true&acceptTC
=true&jpdConfirm=true
Rasinski, T. Samuels, S. J.; Hiebert, E., Petscher, Y., & Feller, K. (2011). The relationship
between a silent reading fluency instructional protocol on students’ reading
107

comprehension and achievement in an urban school setting. Reading Psychology,52(1), p.
75-97. doi: 10.1080/02702710903346873
Samuels, S. J. (1984). Models o f the reading process. In P. D. Pearson, (ed.) Handbook o f
reading research, volume I (pp. 185-224). Mahwah, NJ: Lawrence Erlbaum.
Samuels, S. J. (2006). Reading fluency: Its past, present, and future in T. Rasinski, C.
Blachowicz, & K. Lems (Eds.), Fluency Instruction: Research-Based Best Practices pp.
7-20). New York, NY: The Guildford Press.
Sander, J. R., Sullins, C. D. (2006). Evaluating school programs: An educator’s guide (3rd ed.).
Thousand Oaks, CA: Corwin Press.
Scarborough, H. S., & Brady, S. A. (2002). Toward a common terminology for talking about
speech and reading: A glossary of the ‘phon’ words and some related terms. Journal o f
Literacy Research, 34, 299-334.
Scharer, P. L., Pinnell, G. S., Lyons, C. & Fountas, I. (2005). Becoming an engaged reader.
Educational Leadership, 63(2), 24-29.
Schreiber, P. A. (2001). Understanding prosody’s role in reading acquisition. Theory into
Practice, 30(3), p. 158-164. Retrieved from
http://web.ebscohost.com.proxy.wm.edu/ehost/pdfviewer/pdfviewer?sid=4e4d9970-9a7a-
45b0-bb88-albf84618alc%40sessionmgrl 10&vid= 1 &hid==T 12
Shinn, M. R., Good, R. H., Knutson, N. Tilly, W. D. (1992). Curriculum-based measurement o f
oral reading fluency: A confirmatory analysis o f its relation to reading. School
Psychology Review, 21(3), 459-479. Retrieved from
http://web.b.ebscohost.com.proxy. wm.edu/ehost/detail?sid=170ae6cd-2212-4a97-8602-
108

80clb6l02el8% 40sessionm grl 1 l& vid=l& hid=l 14&bdata=JnNpdGU9ZWhvc3QtbG12
ZQ%3d%3d#db=trh&AN=9604164585
Shoemaker, L. W. (2003). Fixing the F Test for equal variances. The American Statistician,
57(2), 105-114. Retrieved from http://www.jstor.org/stable/30037243
Simos P. G., Fletcher, J. M., Sarkari, S., Billignsley-Marshall, R., Denton, C. A., &
Papanicolaou, A. C. (2007). Intensive instruction affects brain magnetic activity
associated with oral word reading in children with persistent reading disabilities. Journal
o f Learning Disabilities, 40{ 1), 37-48. Retrieved from
http://web.ebscohost.com.proxy.wm.edu/ehost/pdfviewer/pdfviewer?sid=002393 lc-
dl4a-4860-98e3-69a2013a2ca6%40sessionmgrl98&vid=T&hid=l 17
Smith, S. B., Simmons, D. C., & Kameenui, E. J. (1998). Phonological awareness: Research
bases. In D. C. Simmons & E. J. Kameenui (eds.), What reading research tells us about
children with diverse learning needs: Bases and basics (pp. 61-128).
Snider, V. E. (1997). The relationship between phonemic awareness and later reading
achievement. Journal o f Educational Research, 90(4), 203-211. Retrieved from
http://web.ebscohost.com.proxy.wm.edu/ehost/pdfviewer/pdfViewer?sid=3e4f27c6-460b-
428e-ae83-95314b4b75ab%40sessionmgrl 1 l& vid=l& hid=l 12
Snow, C. (2002) Reading fo r understanding: Toward an R & D program in reading
comprehension. Santa Monica, CA: Rand Corporation.
Snow, C. E., Bums, M. S. & Griffin, P. (Eds.). (1998). Preventing reading difficulties in young
children. Washington, DC: National Academy Press.
Stanovich, K. E. (1986). Matthew effects in reading: Some consequences o f individual
differences in the acquisition o f literacy. Reading Research Quarterly, 2 /(4), 360-407.
109

Retrieved from
http: //www.j stor. org. proxy. wm. edu/stable/pdfplus/747612. pdf?&acceptT C=true&jpdC on
firm=true
Starrett, E. V. (2006). Teaching phonics fo r balanced reading (2nd ed.). Thousand Oaks, CA:
Sage Publications.
Stevens, R. J., Slavin, R. E., & Famish, A. M. (1991). The effects o f cooperative learning and
direct instruction in reading comprehension strategies on main idea identification.
Journal o f Educational Psychology, 53(1), 8-16. Retrieved from
http://psycnet.apa.org.proxy.wm.edU/joumals/edu/83/l/8.pdf
Stufflebeam, D. L. (2000). The CIPP model for evaluation. In D. L. Stufflebeam, G. F. Madaus,
& T. Kellaghan (Eds.) Evaluation Models: Viewpoints on Educational and Human
Services Evaluation, 279-317.
Templeton, S. (2011). Teaching spelling in the English/language arts classroom. In D. Lapp & D.
Fisher (Eds.), The handbook o f research on teaching the English language arts (3rd ed.).
New York, NY: Routledge.
Terry, N. C., Connor, C. M., Thomas-Tate, H., & Love, M. (2010). Examining relationships
among dialect variation, literacy skills, and school context in first grade. Journal o f
Speech, Language, and Hearing Research, 53, 126-145. doi: 10.1044/1092-
4388(2009/08-0058)
Torgesen, J. K. & Hudson, R. F. (2006). Reading fluency: Critical factors for struggling readers.
In S. J. Samuels & J. Farstrup (Eds.) What research has to say about fluency instruction.
Newark, DE: International Reading Association.
110

Torgesen, J. K.., Myers, D., Schirm, A., Stuart, E., Vartivarian, S., Mansfield, W., Stancavage, F.,
Dumo, D., Javorsky, R., & Haan, C. (2006). National assessment o f Title I interim report
to Congress: Volume II: Closing the reading gap, first year findings from a randomized
trial o ffour reading interventions fo r striving readers. Washington, DC: U. S.
Department o f Education, Institute o f Education Sciences. Retrieved from
https://www2.ed.gov/rschstat/eval/disadv/title 1 interimreport/vol2.pdf
United States Department o f Education, Institute o f Education Sciences, National Center for
Education Statistics, National Assessment o f Educational Progress (NAEP), 2011
Reading Assessment.
United States Department o f Education, Office o f the Under Secretary, Policy and Program
Studies Service. (2003). A snapshot o f Title I schools, 2000-01 (Doc No. 2003-02).
Washington, D.C.: Author.
Van Norman, R. K., Wood, C. L. (2008). Effects o f prerecorded sight words on the accuracy of
tutor feedback. Remedial and special education, 29(2), 96-107.
Vellutino, F. R. (2003). Individual differences as sources o f variability in reading comprehension
in elementary school children. In S. P. Sweet & C. E. Snow (Eds.), Rethinking Reading
Comprehension, 51-81.
Vellutino, F. R., Scanlon, D. M., Sipay, E. R., Small, S. G., Pratt, A., Chen, R., Denckla, M. B.
(1996). Cognitive profiles o f difficult-to-remediate and readily remediated poor readers:
Intervention as a vehicle for distinguishing between cognitive and experiential deficits as
basic causes o f specific reading disability. Journal o f Educational Psychology, 55(4),
601-638. doi: 10.1037/0022-0663.88.4.601
111

Vellutino, F. R., Scanlon, D. M., Small, S., & Fanuele, D. P. (2006). Response to intervention as
a vehicle for distinguishing between children with and without reading disabilities:
Evidence for the role o f kindergarten and first-grade interventions. Journal o f Learning
Disabilities, 39(2), 157-169. Retrieved from
http://web.a.ebscohost.com.proxy.wm.edu/ehost/pdfviewer/pdfviewer?sid=7ef0b70e-
81 f9-443e-861 a-70c7123bc7a9%40sessionmgr4003&vid= 1 &hid=4212
Venezky, R. L. (1999). American way o f spelling: The structure and origins o f American English
orthography. New York, NY: Guilford.
Virginia Department of Education, (nd). Fall membership reports. Retrieved from
http://www.doe.virginia.gov/statistics_reports/enroIlment/fall_membership/
Virginia Department of Education, (nd). Henrico County school division report card. Retrieved
from https://plpe.doe.virginia.gov/reportcard/report.do?division=43&schoolName=All
Virginia Department of Education. (2009). Special education performance report: Henrico
County Public Schools. Retrieved from
http://www.doe.virginia.gov/special_ed/reports_plans_stats/special_ed_performance/divi
sion/2007-2008/henrico.pdf
Virginia Department o f Education (2011). Virginia state literacy plan. Retrieved from
http://www.doe.virginia.gov/instruction/english/literacy/literacy_plan.pdf
Weiss, C. H. (1997). Theory-based evaluation: Past, present, and future. New Directions fo r
Evaluation, 199(76), 41-55.
White, H. (1980). A heteroskedasticity-consistent covariance matrix estimator and a direct test
for heteroskedasticity. Econometrica, 48(4), 817-838. Retrieved from
112

http://www.jstor.org.proxy.wm.edu/stable/pdfplus/1912934.pdf?acceptTC=true&acceptT
C=true&jpdConfirm=true
Whitehurst, G. J., & Fischel, J. E. (2000). A developmental model o f reading and language
impairments arising in conditions o f economic poverty. In D. Bishop & L. Leonard
(Eds.), Speech and language impairment: From theory to practice, 53-71.
Willis, A. I. (2008). Reading comprehension research and testing in the U. S.: Undercurrents o f
race, class, and power in the struggle fo r meaning. New York, NY: Erlbaum.
Witton, C., Talcott, J. B., Hansen, P. C., Richardson, A. J., Griffiths, T. D., Rees, A., Stein, J. F.,
& Green, G. G. R. ( 1998). Sensitivity to dynamic auditory and visual stimuli predicts
nonword reading ability in both dyslexic and normal readers. Current Biology, 5(14),
791-797.
Wolf, M. & Bowers, P. G. (2000). Naming-speed processes and developmental reading
disabilities: An introduction to the special issue on the double-deficit hypothesis. Journal
o f Learning Disabilities, 55(4), 322-324.
Wolter, J. A., & Apel, K. (2010). Initial acquisition of mental graphemic representations in
children with language impairment. Journal o f Speech, Language & Hearing Research,
55(1), 179-194.
Yan, X. & Su, X. G. (2009). Linear regression analysis: Theory and computing. Hackensack,
NJ: World Scientific Publishing. Retrieved from
http://web.b.ebscohost.com.proxy.wm.edu/ehost/ebookviewer/ebook/bmxlYmtfXzMwN
TIxN19fQU417sid=22ecc8bf-7759-46b6-8ad4-
81 e6786c93e6@sessionmgr 198&vid=2&hid= 114&format-EB
113

Yarbrough, D. B., Shulha, L. M., & Caruthers, F. A. (2004). Background and history o f the Joint
Committee’s Program Evaluation Standards. New Directions fo r Evaluation, 104, 15-30.
Yarbrough, D. B., Shulha, L. M., Hopson, R. K.., & Caruthers, F. A. (2011). The program
evaluation standards: A guide fo r evaluators and evaluation users (3rd ed.). Thousand
Oaks, CA: Sage Publications.
114