An epi-evolutionary model for predicting the adaptation of ...
17
HAL Id: hal-03465168 https://hal.archives-ouvertes.fr/hal-03465168 Submitted on 11 Jan 2022 HAL is a multi-disciplinary open access archive for the deposit and dissemination of sci- entific research documents, whether they are pub- lished or not. The documents may come from teaching and research institutions in France or abroad, or from public or private research centers. L’archive ouverte pluridisciplinaire HAL, est destinée au dépôt et à la diffusion de documents scientifiques de niveau recherche, publiés ou non, émanant des établissements d’enseignement et de recherche français ou étrangers, des laboratoires publics ou privés. Distributed under a Creative Commons Attribution| 4.0 International License An epi-evolutionary model for predicting the adaptation of spore-producing pathogens to quantitative resistance in heterogeneous environments Frédéric Fabre, Jean-Baptiste Burie, Arnaud Ducrot, Sébastien Lion, Quentin Richard, Ramsès Djidjou-Demasse To cite this version: Frédéric Fabre, Jean-Baptiste Burie, Arnaud Ducrot, Sébastien Lion, Quentin Richard, et al.. An epi-evolutionary model for predicting the adaptation of spore-producing pathogens to quantitative resistance in heterogeneous environments. Evolutionary Applications, Blackwell, 2022, pp.95-110. 10.1111/eva.13328. hal-03465168
-
Upload
khangminh22 -
Category
Documents
-
view
0 -
download
0
Transcript of An epi-evolutionary model for predicting the adaptation of ...

HAL Id: hal-03465168https://hal.archives-ouvertes.fr/hal-03465168
Submitted on 11 Jan 2022
HAL is a multi-disciplinary open accessarchive for the deposit and dissemination of sci-entific research documents, whether they are pub-lished or not. The documents may come fromteaching and research institutions in France orabroad, or from public or private research centers.
L’archive ouverte pluridisciplinaire HAL, estdestinée au dépôt et à la diffusion de documentsscientifiques de niveau recherche, publiés ou non,émanant des établissements d’enseignement et derecherche français ou étrangers, des laboratoirespublics ou privés.
Distributed under a Creative Commons Attribution| 4.0 International License
An epi-evolutionary model for predicting the adaptationof spore-producing pathogens to quantitative resistance
in heterogeneous environmentsFrédéric Fabre, Jean-Baptiste Burie, Arnaud Ducrot, Sébastien Lion, Quentin
Richard, Ramsès Djidjou-Demasse
To cite this version:Frédéric Fabre, Jean-Baptiste Burie, Arnaud Ducrot, Sébastien Lion, Quentin Richard, et al.. Anepi-evolutionary model for predicting the adaptation of spore-producing pathogens to quantitativeresistance in heterogeneous environments. Evolutionary Applications, Blackwell, 2022, pp.95-110.�10.1111/eva.13328�. �hal-03465168�

Evolutionary Applications. 2021;00:1–16. | 1wileyonlinelibrary.com/journal/eva
Received: 8 April 2021 | Revised: 18 November 2021 | Accepted: 22 November 2021
DOI: 10.1111/eva.13328
O R I G I N A L A R T I C L E
An epi- evolutionary model for predicting the adaptation of spore- producing pathogens to quantitative resistance in heterogeneous environments
Frédéric Fabre1 | Jean- Baptiste Burie2 | Arnaud Ducrot3 | Sébastien Lion4 | Quentin Richard5 | Ramsès Djidjou- Demasse5
This is an open access article under the terms of the Creative Commons Attribution License, which permits use, distribution and reproduction in any medium, provided the original work is properly cited.© 2021 The Authors. Evolutionary Applications published by John Wiley & Sons Ltd.
1INRAE, Bordeaux Sciences Agro, ISVV, SAVE, Villenave d’Ornon, France2IMB, Univ. Bordeaux, Bordeaux INP, CNRS, Talence, France3LMAH, Univ. Normandie, UNIHAVRE, CNRS, ISCN, Le Havre, France4CEFE, CNRS, Univ. Montpellier, EPHE, IRD, Univ. Montpellier 3 Paul- Valéry, Montpellier, France5MIVEGEC, Univ. Montpellier, IRD, CNRS, Montpellier, France
CorrespondenceFrédéric Fabre, INRAE, UMR SAVE, 71 avenue Édouard Bourlaux CS 20032, 33882 Villenave d'Ornon Cedex, France.Email: [email protected]
Funding informationRDD received support from the Conseil Interprofessionnel du Vin de Bordeaux (CIVB) under the CIVB project “Recherche, experimentation, etudes et outils,” and from the EU in the framework of the Marie- Curie FP7 COFUND People Programme, through the award of an AgreenSkills/AgreenSkills+fellowship under grant agreement number FP7- 609398. QR received support from the cluster SysNum of Bordeaux University. SL was supported by JCJC grant ANR- 16- CE35- 0012 "STEEP," and FF, JBR, and AD received support from ANR- 18- CE32- 0004 "ArchiV."
AbstractWe have modeled the evolutionary epidemiology of spore- producing plant pathogens in heterogeneous environments sown with several cultivars carrying quantitative re-sistances. The model explicitly tracks the infection- age structure and genetic compo-sition of the pathogen population. Each strain is characterized by pathogenicity traits determining its infection efficiency and a time- varying sporulation curve taking into account lesion aging. We first derived a general expression of the basic reproduction number ℛ0 for fungal pathogens in heterogeneous environments. We show that the evolutionary attractors of the model coincide with local maxima of ℛ0 only if the infec-tion efficiency is the same on all host types. We then studied the contribution of three basic resistance characteristics (the pathogenicity trait targeted, resistance effective-ness, and adaptation cost), in interaction with the deployment strategy (proportion of fields sown with a resistant cultivar), to (i) pathogen diversification at equilibrium and (ii) the shaping of transient dynamics from evolutionary and epidemiological per-spectives. We show that quantitative resistance affecting only the sporulation curve will always lead to a monomorphic population, whereas dimorphism (i.e., pathogen diversification) can occur if resistance alters infection efficiency, notably with high adaptation costs and proportions of the resistant cultivar. Accordingly, the choice of the quantitative resistance genes operated by plant breeders is a driver of pathogen diversification. From an evolutionary perspective, the time to emergence of the evo-lutionary attractor best adapted to the resistant cultivar tends to be shorter when resistance affects infection efficiency than when it affects sporulation. Conversely, from an epidemiological perspective, epidemiological control is always greater when the resistance affects infection efficiency. This highlights the difficulty of defining deployment strategies for quantitative resistance simultaneously maximizing epide-miological and evolutionary outcomes.

2 | FABRE Et Al.
1 | INTRODUC TION
Resistance to parasites, that is, the capacity of a host to decrease its parasite development (Raberg et al., 2009), is a widespread defense mechanism in plants. Qualitative resistance usually confers disease immunity such that the parasite disease phenotype follows a dis-crete distribution (“causes disease” vs. “does not cause disease”) on a resistant plant (McDonald & Linde, 2002). Quantitative resistance leads to a decrease in disease severity (Poland et al., 2009; St. Clair, 2010) such that parasite pathogenicity follows a continuous distri-bution (Lannou, 2012; McDonald & Linde, 2002; St. Clair, 2010). Pathogenicity, also known as aggressiveness, can be estimated in laboratory experiments through the measurement of a number of pathogenicity traits (Lannou, 2012) expressed during the basic steps in the host– pathogen interaction. Quantitative resistance has at-tracted attention in plant breeding as a means of pathogen control in low- input cropping systems, particularly due to its supposed higher durability than qualitative resistance (Niks et al., 2015). However, plant pathogens also adapt to quantitative resistance (see Pilet- Nayel et al. (2017) for a review). The resulting gradual “erosion” of resistance effectiveness (McDonald & Linde, 2002) corresponds, from the pathogen side, to a gradual increase in pathogenicity.
Historically, theoretical studies investigating the effects on pathogen aggressiveness of deploying quantitative resistance in agrosystems have been based on adaptive dynamics (e.g., Gudelj, Fitt, et al. (2004), Gudelj, van den Bosch, et al. (2004), van den Bosch et al. (2006), van den Bosch et al. (2007), van den Berg et al. (2014)). Adaptive dynamics (Dieckmann, 2002; Geritz et al., 1997, 1998) ap-proaches assume that epidemiological and evolutionary processes unfold over different timescales. They essentially focus on long- term predictions for endemic diseases. Fewer studies (Bourget et al., 2008; Iacono et al., 2012; Rimbaud et al., 2018) have addressed the fundamental short- and long- term objectives of the sustainable man-agement of plant diseases (Rimbaud et al., 2018; Zhan et al., 2015): The short- term goal is the reduction in disease incidence, whereas the longer- term objective is to reduce pathogen adaptation to resis-tant cultivars. Evolutionary epidemiology analysis is well suited to this purpose (Day & Proulx, 2004). Essentially inspired by quantita-tive genetics, it accounts for the interplay between epidemiological and evolutionary dynamics over the same timescale. As such, it can be used to monitor the dynamics of epidemics and the evolution of any set of pathogen life- history traits of interest simultaneously. It can also take into account the heterogeneity of host populations resulting, for example, from differences in the genetic, physiologi-cal, or ecological states of individuals (Day & Gandon, 2007). This is typically the case with field mixtures, in which several cultivars are cultivated in the same field, and with landscape mosaics, in which cultivars are cultivated in different fields (Rimbaud et al., 2021).
In this article, we follow this approach and study the evolutionary epidemiology of spore- producing pathogens in heterogeneous agri-cultural environments. Plant fungal pathogens (sensu lato, i.e., includ-ing oomycetes) are typical spore- producing pathogens responsible for nearly one third of emerging plant diseases (Anderson et al., 2004). Spore production is usually a function of the time since infection, due to lesion aging (Kolnaar & Bosch, 2001; Sache et al., 1997; Segarra et al., 2001; van den Bosch et al., 1988). We first formulated a gen-eral model explicitly tracking the infection- age structure and genetic composition of the pathogen population. Mathematically, this model is an extension to heterogeneous plant populations of an integro- differential model introduced by Djidjou- Demasse et al. (2017). We then investigated how the deployment of quantitative resistances altering different pathogenicity traits affected pathogen population structure at equilibrium. This question was addressed by highlighting the links between the frameworks of evolutionary epidemiology and adaptive dynamics. We characterized the evolutionary attractors of the coupled epidemiological evolutionary dynamics while emphasiz-ing the differences between the cornerstone concepts of ℛ0 in epi-demiology (Diekmann et al., 1990; van den Driessche & Watmough, 2008) and invasion fitness in evolution (Dieckmann, 2002; Diekmann et al., 2005; Geritz et al., 1998; Metz et al., 1996; Nowak & Sigmund, 2004). Finally, we investigated the effect of deploying quantitative resistances on the transient behavior of the coupled epi- evolutionary dynamics, both at epidemiological (disease incidence) and at evolu-tionary (resistance durability) levels.
2 | AN EPI- E VOLUTIONARY MODEL FOR SPORE- PRODUCING PATHOGENS
Let us suppose that we cultivate two host types differing in terms of quantitative resistance level to a pathogen (e.g., a resistant and a susceptible cultivar). How can we model the joint epidemiologi-cal and evolutionary dynamics of the host– pathogen interaction? In this section, we first formulate a general model for the dynamics of spore- producing plant pathogens in structured populations, which we then apply to the study of specific scenarios.
2.1 | Host and pathogen populations
Let us consider a spore- producing plant pathogen infecting a het-erogeneous host population with Nc host classes. In our study, the host classes are assumed to represent different plant cultivars, but, more generally, host heterogeneity may correspond to differences in host developmental or physiological states or different habitats. At a given time t, hosts in class k can be either healthy (Hk (t)) or infected.
K E Y W O R D Sadaptive dynamics, basic reproduction number, integro- differential equations, quantitative resistance, resistance durability, spore- producing pathogens

| 3FABRE Et Al.
Note that, in keeping with the biology of fungal pathogens, we do not track individual plants, but instead focus on leaf area densities (leaf surface area per m2). The leaf surface is viewed as a set of indi-vidual patches corresponding to a restricted host surface area that can be colonized by a single pathogen individual (i.e., no co- infection is possible). Thus, only indirect competition between pathogen strains for a shared resource is considered. Spores produced by all the infectious tissues are assumed to mix uniformly in the air to form a well- mixed pool of spores that can land on any host class according to the law of mass action. Thus, the probability of contact between a spore and host k is proportional to the total healthy leaf surface area of this host.
The parasite population is structured by a continuous phenotype x and by the time since infection a, such that Ik (a, t, x) represents the density of infected tissue of host k at time t, which have been infected for a duration a with strain x. The density of the airborne pool of spores with phenotype x at time t is denoted by A (t, x). Both the phenotype and time since infection affect two pathogenicity traits in each host class summarizing the basic steps of the disease infection cycle: (i) infection efficiency �k (x), that is, the probability that a spore deposited on a receptive host surface produces a lesion; and (ii) the sporulation curve rk (a, x). In line with the biology of plant fungi (Van den Bosch, 1988; Kolnaar & Bosch, 2001; Sache, 1997; Segarra et al., 2001), we assumea gamma sporulation curve defined by four parameters: (i) the latent period �k (x), (ii) the total number of spores pk (x) produced by a lesion throughout its entire infectious period, and (iii– iv) the rate and shape parameters of the gamma dis-tribution (denoted �k (x). and nk (x) respectively). These hypotheses lead to the following sporulation function:
where Γ is the gamma function. With this formalism, the duration of the infectious period can be estimated (based on a Gaussian approxi-mation) as 4
√nk (x)∕�k (x).
2.2 | Epi- evolutionary dynamics
With these assumptions, we can derive the following integro- differential equations to describe the epidemiological and evolution-ary dynamics of the host and pathogen populations (see Figure 1C for a schematic representation of the model with 2 hosts):
Healthy hosts are produced at rate Λ and �k is the proportion of the host k at planting in the environment. Healthy hosts can become infected by airborne spores. Thtotal force of infection on a host k is ∫
ℝN
�k (y)A (t, y) dy, where ℝN is the phenotype space of dimension N. Airborne spores produced by infected hosts become nonviable at rate �. Healthy hosts die at rate � (regardless of their class), and in-fected hosts die at rate � + dk (a, x), where dk (a, x) is disease- induced mortality. Hosts infected with strain y produce airborne spores with phenotype x at rate m� (y − x) rk (a, y), where m� (y − x) is the proba-bility of mutation from phenotype y to phenotype x. Thus, mutations randomly displace strains in the phenotype space at each infection cycle (i.e., generation) according to a mutation kernel m�. A centered multivariate Gaussian distribution with standard deviation � is typ-ically used hereafter. However, other mutation kernels can be used provided that they satisfy some general criteria (Appendix S2).
In the simplest scenarios, the phenotype space can be one- dimensional (i.e., N = 1), but we can also consider a multidimensional phenotype space (i.e., N ≥ 2). We refer the reader to Table 1 for a list of the variables and parameters of the model, and to Appendix S3 for a discussion of how to recover several simpler models in the literature from model (2).
3 | BA SIC REPRODUC TION NUMBER AND INVA SION FITNESS
Model (2) allows us to track the coupled epidemiological and evo-lutionary dynamics of the host– pathogen interaction. We can use a numerical integration of this model to determine the transient dynamics toward potential evolutionary attractors. For further ana-lytical progress, we can consider two limiting cases of this process. First, in an initially uninfected population, whether or not a single pathogen strain spreads in the population can be determined by cal-culating the basic reproduction number of this strain. Second, the long- term evolutionary endpoints can be determined by calculating the invasion fitness of a rare mutant in a resident population at equi-librium according to the standard adaptive dynamics methodology.
3.1 | Basic reproduction number: Invasion in an uninfected population
The basic reproduction number, usually denoted ℛ0, is defined as the total number of infections arising from one newly infected in-dividual introduced into a healthy (disease- free) host population (Anderson, 1991; Diekmann et al., 1990). It is typically used to study the spread of a pathogen strain x in an uninfected host population. In an environment with Nc host classes in which all the pathogen propagules pass through a common pool in compartment A as in model (2), ℛ0 is the sum of pathogen reproduction numbers for each host class (Rueffler & Metz, 2013). A pathogen with phenotype x will spread if ℛ0 (x) > 1, with
(1)rk (a, x) =
⎧⎪⎨⎪⎩
pk (x) 𝜆nk (x)
k
�a−𝜏k (x)
�nk (x)−1 e−𝜆k (x)(a−𝜏k (x))Γ�nk (x)
� if a>𝜏k (x) ,
0 otherwise .
(2)
⎛⎜⎜⎜⎜⎜⎜⎜⎜⎜⎝
�
�tHk (t) =�kΛ−�Hk (t) −Hk (t) ∫
ℝN
�k (y)A (t, y) dy,
��
�t+
�
�a
�Ik (t, a, x) = −
��+dk (a, x)
�Ik (t, a, x) ,
Ik (t, 0, x) =�k (x)Hk (t)A (t, x) ,
�
�tA (t, x) = −�A (t, x) +
Nc�k=1
∫ℝN
∫∞
0
m� (y−x) rk (a, y) Ik (t, a, y) dady.

4 | FABRE Et Al.
F I G U R E 1 (a) Shapes of gamma sporulation function rk (a, x) with latent period �k = 10 and total spore production over the entire infectious period pk = 5.94 as a function of nk and �k. The infectious period is ≅ 24 days for both functions. (b) Phenotypic landscapes of a pathogenicity trait � on a susceptible (S) and on a resistant (R) cultivar. Trait values are described by unnormalized Gaussian functions. The optimal parasite phenotypes �S and �R have maximum tras �max and �max
(1 − Δmax
) on the S and R cultivars, respectively. The relative
effectiveness of resistance Reff =(�S
(�S
)− �R
(�S
))∕�max corresponds to the trait difference between the cultivars of phenotype �S. The
relative cost of adaptation Cadp =(�S
(�S
)− �S
(�R
))∕�max corresponds to the trait difference between the phenotypes �S and �R on the S
cultivar. Here, Reff = 0.8, Cadp = 0.9, and Δmax = 0.2. C Schematic representation of the model with 2 hosts (a susceptible (S) and a resistant (R) cultivar) and a one- dimensional mutation kernel (i.e., Nc = 2 and N = 1). All state variables and parameters are listed in Table 1
(a) (b)
(c)

| 5FABRE Et Al.
where the quantity ℛk0(x) = Ψk (x)H
0k is the basic reproduction num-
ber of a pathogen with phenotype x in host k. This expression depends on the disease- free equilibrium density of healthy hosts H0
k= �kΛ∕�
and Ψk (x), the reproductive value of a pathogen with phenotype x landing on host k (i.e., the fitness function, Appendix S4). It is given by
In this expression, multiplying the probability that a lesion is via-ble at time since infection a by rk (a, x) and integrating over all times since infection a gives the total number of spores effectively pro-duced by a lesion during its lifetime. This differs from (x), which is the number of spores potentially produced if the lesion remains viable during the whole infectious period. A closely related expression with a simpler model (single host type and no disease- induced mortality) was derived by Gilchrist et al. (2006).
Assuming that dk does not depend on the time since infection and a gamma sporulation function (1), we obtain
Furthermore, if rk is a constant (i.e., rk (a, x) = pk (x) and dk (a, x) = dk (x) for all a), we recover the classical expression of ℛ0 . for SIR models (Day, 2002) with
3.2 | Invasion fitness and long- term evolutionary attractors
Once a pathogen strain x has reached an endemic equilibrium, inva-sion by a new mutant strain can be studied with the adaptive dynam-ics methodology. A rare mutant strain with phenotype y will invade a resident pathogen population with phenotype x if its invasion fitness fx (y) > 0. Potential evolutionary endpoints can be identified as the solutions of fx (y) > 0. The sign of this two- dimensional function is classically visualized on a pairwise invasibility plot (PIP) (Dieckmann, 2002; Diekmann et al., 2005; Geritz et al., 1997, 1998; Metz et al., 1996; Nowak & Sigmund, 2004). In our model, the existence of a common pool of pathogen propagules allows us to write (Appendix S6) the invasion fitness fx (y) as
Environmental feedback of the resident strain x conditions the ability of a mutant strain y to invade the resident population. It de-pends on the conditions established by the resident strain, particu-larly as concerns the resources of host k already taken by x. When infection efficiencies do not differ between host classes (i.e., �k = � , for all host classes k), this feedback term is unique and comes out of the sum, and using equation (3), equation (6) can be rewritten as
It follows that model (2) admits an optimization principle based on ℛ0 (Gyllenberg, & Service, 2011; Lion & Metz, 2018; Mylius & Diekmann, 1995; Metz et al., 2008; Rueffler & Metz, 2013). Indeed, the sign of the invasion fitness fx (y) is given by the sign of the dif-ference between ℛ0 (y) and ℛ0 (x); and thus, the evolutionary at-tractors of model (2) coincide with the local maxima of ℛ0 provided that host plants affect only sets of pathogenicity traits underlying sporulation curves. Conversely, if infection efficiencies differ for at least two host classes, the optimization principle does not apply. Accordingly, if some plant hosts affect infection efficiency, the cal-culation of invasion fitness with equation (6) is required for the char-acterization of evolutionary attractors.
4 | C A SE STUDY: DEPLOYMENT OF QUANTITATIVE RESISTANCES
As an application of our general model, we now consider two habi-tats corresponding to a susceptible (S) and a resistant (R) cultivar differing by a single quantitative resistance trait. We assume that, after a long period of monoculture of the S cultivar, a fraction � of the S cultivar is replaced by the R cultivar at t = 0. We consider two scenarios, depending on how the resistance trait affects the life cycle of the pathogen. In the SP scenario, the resistance affects only total spore production, whereas in the IE scenario, the resistance affects only infection efficiency. The analysis of the scenarios makes use of analytical results from adaptive dynamics and simulation re-sults from evolutionary epidemiology while highlighting the links between these frameworks.
4.1 | Scenario simulations and model outputs
Phenotypic landscapes on the S and R cultivars. Model simulation first re-quires the specification of fitness functions describing the pathogenic-ity trait values of any strain x on each cultivar (Figure 1B). For a trait � (either total spore production in the SP scenario, or infection efficiency in the IE scenario), we used the unnormalized Gaussian function
(3)ℛ0(x) =
Nc∑k=1
ℛk0(x)
(4)�k (x) =
1
��k (x) ∫
∞
0
rk (a, x) exp( − �a − ∫a
0
dk (�, x)d�)
⏟⏞⏞⏞⏞⏞⏞⏞⏞⏞⏞⏞⏞⏞⏞⏞⏞⏞⏟⏞⏞⏞⏞⏞⏞⏞⏞⏞⏞⏞⏞⏞⏞⏞⏞⏞⏟prob.that a lesion is viable at age a
da,
(5)Ψk (x) =1
�× �k (x) × e−(�+dk (x))�k (x) × pk (x) ×
(�k
�k+�+dk (x)
)nk
.
Ψk (x) =�k (x) pk (x)
�(� + dk (x)
) .
(6)fx(y) =
Nc∑k=1
Λ�k
� + �k (x)Ax
⏟⏞⏞⏞⏞⏟⏞⏞⏞⏞⏟feed back of resident x
(�k (y) − (�k (x)
).
(7)fx(y) =�
� + �(x)Ax
(ℛ0(y) −ℛ0(x)
).
�s(x) = �max ×
(exp −
(x+�)2
2�2S
)and�R(x) = �max(1 − Δmax) × exp −
((x−�)2
2�2R
).
6 | FABRE Et Al.
Without loss of generality, and to simplify the presentation, the optimal phenotypes are opposite for the S and R cultivars. Therefore, the optimal parasite phenotypes �S = − � and �R = � are characterized by maximal trait values �max and �max
(1 − Δmax
) on
the S and R cultivars, respectively, where Δmax is the relative dif-ference in maximal traits between the two cultivars. The inverse of the variances 1∕�2
S and 1∕�2
R defines the selectivity of each habitat.
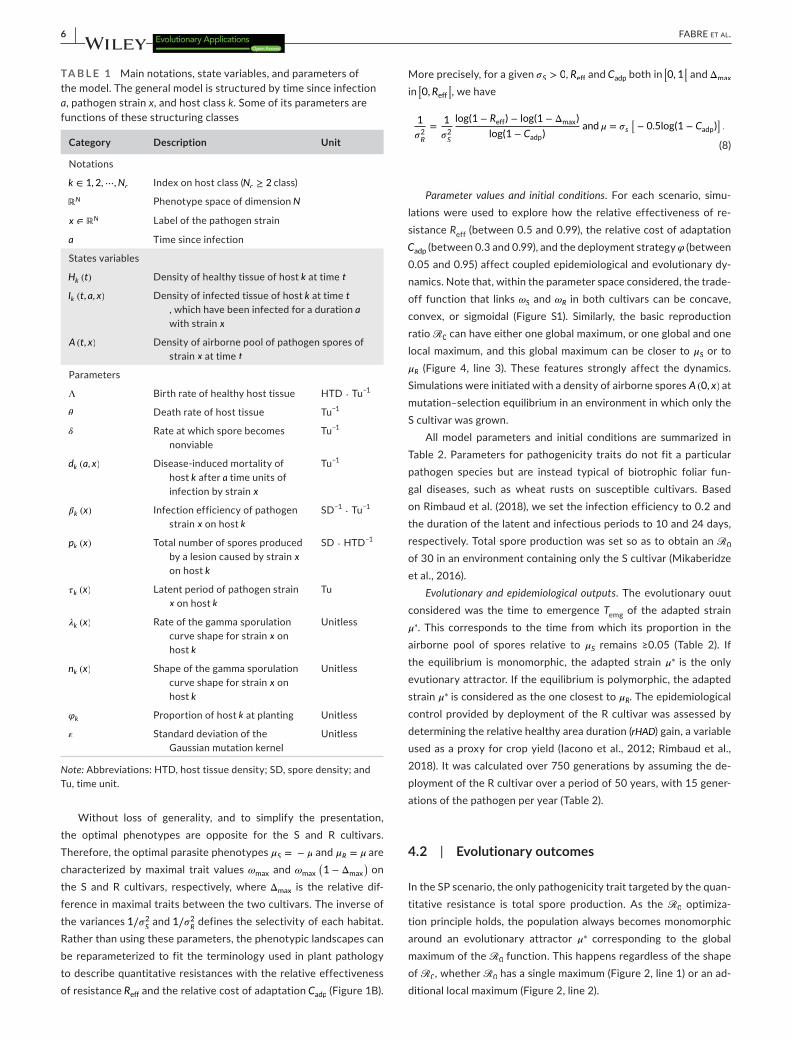
Rather than using these parameters, the phenotypic landscapes can be reparameterized to fit the terminology used in plant pathology to describe quantitative resistances with the relative effectiveness of resistance Reff and the relative cost of adaptation Cadp (Figure 1B).
More precisely, for a given 𝜎S > 0, Reff and Cadp both in [0, 1
[ and Δmax
in [0,Reff
[, we have
Parameter values and initial conditions. For each scenario, simu-lations were used to explore how the relative effectiveness of re-sistance Reff (between 0.5 and 0.99), the relative cost of adaptation Cadp (between 0.3 and 0.99), and the deployment strategy � (between 0.05 and 0.95) affect coupled epidemiological and evolutionary dy-namics. Note that, within the parameter space considered, the trade- off function that links �S and �R in both cultivars can be concave, convex, or sigmoidal (Figure S1). Similarly, the basic reproduction ratio ℛ0 can have either one global maximum, or one global and one local maximum, and this global maximum can be closer to �S or to �R (Figure 4, line 3). These features strongly affect the dynamics. Simulations were initiated with a density of airborne spores A (0, x) at mutation– selection equilibrium in an environment in which only the S cultivar was grown.
All model parameters and initial conditions are summarized in Table 2. Parameters for pathogenicity traits do not fit a particular pathogen species but are instead typical of biotrophic foliar fun-gal diseases, such as wheat rusts on susceptible cultivars. Based on Rimbaud et al. (2018), we set the infection efficiency to 0.2 and the duration of the latent and infectious periods to 10 and 24 days, respectively. Total spore production was set so as to obtain an ℛ0 of 30 in an environment containing only the S cultivar (Mikaberidze et al., 2016).
Evolutionary and epidemiological outputs. The evolutionary ouut considered was the time to emergence Temg of the adapted strain �∗. This corresponds to the time from which its proportion in the airborne pool of spores relative to �S remains ≥0.05 (Table 2). If the equilibrium is monomorphic, the adapted strain �∗ is the only evutionary attractor. If the equilibrium is polymorphic, the adapted strain �∗ is considered as the one closest to �R. The epidemiological control provided by deployment of the R cultivar was assessed by determining the relative healthy area duration (rHAD) gain, a variable used as a proxy for crop yield (Iacono et al., 2012; Rimbaud et al., 2018). It was calculated over 750 generations by assuming the de-ployment of the R cultivar over a period of 50 years, with 15 gener-ations of the pathogen per year (Table 2).
4.2 | Evolutionary outcomes
In the SP scenario, the only pathogenicity trait targeted by the quan-titative resistance is total spore production. As the ℛ0 optimiza-tion principle holds, the population always becomes monomorphic around an evolutionary attractor �∗ corresponding to the global maximum of the ℛ0 function. This happens regardless of the shape of ℛ0, whether ℛ0 has a single maximum (Figure 2, line 1) or an ad-ditional local maximum (Figure 2, line 2).
(8)
1
�2R
=1
�2S
log(1 − Reff) − log(1 − Δmax)
log(1 − Cadp)and� = �s
[− 0.5log(1 − Cadp)
].
TA B L E 1 Main notations, state variables, and parameters of the model. The general model is structured by time since infection a, pathogen strain x, and host class k. Some of its parameters are functions of these structuring classes
Category Description Unit
Notations
k ∈ 1, 2,⋯,Nc Index on host class (Nc ≥ 2 class)
ℝN Phenotype space of dimension N
x ∈ ℝN Label of the pathogen strain
a Time since infection
States variables
Hk (t) Density of healthy tissue of host k at time t
Ik (t, a, x) Density of infected tissue of host k at time t, which have been infected for a duration a with strain x
A (t, x) Density of airborne pool of pathogen spores of strain x at time t
Parameters
Λ Birth rate of healthy host tissue HTD ⋅ Tu−1
� Death rate of host tissue Tu−1
� Rate at which spore becomes nonviable
Tu−1
dk (a, x) Disease- induced mortality of host k after a time units of infection by strain x
Tu−1
�k (x) Infection efficiency of pathogen strain x on host k
SD−1 ⋅ Tu−1
pk (x) Total number of spores produced by a lesion caused by strain x on host k
SD ⋅ HTD−1
�k (x) Latent period of pathogen strain x on host k
Tu
�k (x) Rate of the gamma sporulation curve shape for strain x on host k
Unitless
nk (x) Shape of the gamma sporulation curve shape for strain x on host k
Unitless
�k Proportion of host k at planting Unitless
� Standard deviation of the Gaussian mutation kernel
Unitless
Note: Abbreviations: HTD, host tissue density; SD, spore density; and Tu, time unit.

| 7FABRE Et Al.
In the IE scenario, the only pathogenicity trait targeted by the quantitative resistance is infection efficiency. The optimization prin-ciple based on ℛ0 does not hold here, and evolutionary branching and diversification are possible and cannot be characterized by the shape of ℛ0. Typically, a polymorphic pathogen population can be selected at equilibrium, while ℛ0 has a single maximum (Figure S2).
In this scenario, we need to calculate the invasion fitness to charac-terize the evolutionary attractors (equation 6).
As in the SP scenario, the population can evolve to a monomor-phic equilibrium (Figure 2, line 3). This outcome occurs for a broad range of resistance genes and deployment strategies (Figure 3). However, a dimorphic population can also be selected (Figure 2,
TA B L E 2 Initial conditions and parameters used for simulations with the S and R cultivars. Two scenarios were considered: The R cultivar can alter either the infection efficiency of the pathogen (IE) or its total spore production (SP). The reference values given for each parameter are those used in all simulations, unless otherwise stated. Values in brackets indicate the range of variation [minimum, maximum] used for the numerical exploration
Name Description Values
Pathogenicity traits
�max Maximal infection efficiency on the S cultivar 0.2
�max Latent period associated with maximal sporulation 10
pmax Maximal total spore production on the S cultivar 5.94a
n Shape of the gamma sporulation curve 2
� Rate of the gamma sporulation curve 0.24
Pathogenicity landscape for the trait � affected by the resistance gene
Reff Relative effectiveness of the R cultivar [0.5, 0.99]
Cadp Relative cost of adaptation [0.3, 0.99]
�max Maximal trait value on the S cultivar �max (IE)b; pmax (SP)b
Δmax Relative difference of maximal traits between S and R cultivars 0
1∕�2S
Selectivity of the S cultivar 0. 06−2
�S (x) Trait value on the S cultivar �maxf�(− �, �S , x
)c�R (x) Trait value on the R cultivar �max
(1 − Δmax
)f�
(�, �R , x
)cOthers parameters
Λ Birth rate of healthy host tissue 0.35
� Death rate of host tissue 0.01
� Rate at which spore becomes nonviable 1
� Standard deviation of the Gaussian mutation kernel 0.005
d Disease- induced mortality 0
� Proportion of the R cultivar at planting [0.05, 0.95]
Tdpl Duration of R cultivar deployment 750
Initial conditions
HS (0) Density of healthy tissue on the S cultivar (1 − �) Λ∕�
HR (0) Density of healthy tissue on the R cultivar �Λ∕�
iS (0, a, x) Density of infected tissue on the S cultivar 0
iR (0, a, x) Density of infected tissue on the R cultivar 0
A (0, x) Density of the airborne pool of pathogen spores Mutation– selection equilibriumd
Evolutionary and epidemiological outputs
Temg Time to emergence of the adapted strain �∗ Time from which, for any t ≥ Temg,
A (t,�∗) ∕(A(t,�S
)+ A (t,�∗)
) ≥ 5\%
rHAD Relative healthy area duration gain ∫ Tdpl0
(HS + HR
)(t) |�dt∕ ∫ Tdpl0
(HS (t)
) |�=0dt
apmax is such that ℛ0
(�S
)= 30 for � = 0, leading to pmax = 30 × ��exp(��max )
(1+�∕�)n
(�maxΛ).
b�max = �max for the IE scenario and �max = pmax for the SP scenario.cThe notations fN(�, �, x) = exp[ − (x−�)2∕(2�2)] indicate the unnormalized density function of the Gaussian distribution. The optimal phenotype value � and the selectivity of the R cultivar 1∕�2
R are calculated from equation (8).
dThe density of the airborne pool of pathogen spores at mutation– selection equilibrium is determined by running the model over 3000 generations in an environment containing only the S cultivar.

8 | FABRE Et Al.
line 4). This dimorphism is easily observed in the airborne pool of spores (Figure S3), but not necessarily on the individual cul-tivar (Figure 2, line 4). Indeed, the fitness functions on cultivars can give sharply different relative proportions at equilibrium
(Appendix S5). A dimorphic population is selected once the cost of adaptation and resistance effectiveness reach ≥0.9 for most nonextreme proportions of the R cultivar at planting (Figure 3, central panel). Dimorphic populations are also selected in a larger
F I G U R E 2 Evolutionary epidemiological dynamics. Line 1. The resistance impacts only spore production. The fitness function is unimodal (left panel). At t = 0, the pathogen population is at its mutation– selection equilibrium on the S cultivar (light green distribution). The infection dynamics and phenotypic composition of the pathogen population on the S and R cultivars are displayed in the central and right panels, respectively. The black line in the right panel corresponds to the time to emergence Temg. Line 2. As in line 1, but with Reff = 0.99. The fitness function is bimodal, with both a global and a local maximum. Line 3. The resistance affects only infection efficiency. The pairwise invasibility plot (PIP) visualiz the sign of invasion fitness fx (y) (left panel). As a mutant strain y will invade the resident population x only if fx (y) > 0 , the PIP reveals a single evolutionary attractor �∗ (the vertical line through �∗. is completely contained within a region marked “– ”). Line 4. As in line 3 but with Reff = 0.99. The PIP reveals two evolutionary attractors (left panel). For all panels, all the other parameters are set to their reference values (Table 2). Note that the timescale axis varies between lines

| 9FABRE Et Al.
number of production situations for the R cultivar characterized by the highest cost of adaptation
(Cadp = 0.99
). In this case, the
deployment of a proportion of the R cultivar above a threshold that increases with decreasing resistance effectiveness generally leads to the selection of a dimorphic population (Figure 3, right panel).
The evolutionary epidemiology framework can also shed light on the duration of the transient dynamics. Whatever the basic re-sistance characteristics (pathogenicity trait targeted, resistance ef-fectiveness, and cost of adaptation), the relative proportion of the evolutionary attractor is already ≥5% in the pool of spores in the air at the initial time point for a wide range of deployment strate-gies, mostly when the R cultivar is not dominant in the environment (Figure 4, lines 1 and 2, level A0). This is the case mostly when the evolutionary attractor is closer to �S (optimal phenotype on the S cultivar) than to �R (optimal phenotype on the R cultivar). In such settings, unless it already exists from the beginning in the mutation– selection equilibrium, the evolutionary attractor can be rapidly at-tained by mutation (Figure 2, lines 1 and 3), whether ℛ0 has one or two maxima (Figure 4, line 3, level "1S- 2S").
The time to emergence can substantially increase when ℛ0 is unimodal but with a maximum approaching the optimal phenotype on the R cultivar (Figure 4, line 3, level "1R"). Indeed, more time is then required to reach the evolutionary attractor by mutation. This increase in time, which is small with a low cost of adaptation for both scenarios (Figure 4, Cadp = 0.3), is larger for higher costs (Figure 4, Cadp = 0.9 or 0.99).
The longest times to emergence are obtained in the SP scenario when ℛ0 is bimodal with a global maximum closer to the optimal phenotype on the R cultivar. This configuration is obtained for small ranges of intermediate proportions of the R cultivar at planting combined (i) with an adaptation cost and resistance effectiveness ≥0.9, or (ii) with the highest adaptation cost considered
(Cadp = 0.99
)
for all resistance effectiveness values tested (Figure 4, line 3, level "2R"). In this configuration, the pathogen population remains for a relatively long time around the initially dominant phenotype and
then shifts by mutation to the evolutionary attractor after crossing a fitness minimum. These dynamics occur simultaneously on the S and R cultivars (Figure 2, line 2). The shape of the response surfaces for time to emergence in the IE scenario is broadly similar to that of the SP scenario. However, in all the production situations explored, time to emergence in the IE scenario was always similar to or shorter than that in the SP scenario, notably when the maximum of ℛ0 was closer to �R. Emergence times were shorter by a mean of 41 generations when ℛ0 was unimodal and by a mean of 801 generations when ℛ0 was bimodal (Figure 4, line 3, levels "1R" and "2R"). Moreover, in the IE scenario, the evolutionary dynamics differed between cultivars (Figure 2, line 4).
4.3 | Epidemiological outcomes
Long- term epidemiological control is assessed by determining the relative increase in healthy area duration. In the SP scenario, it ranges from 1.25 to 3.21, with a mean of 1.61 over the whole pa-rameter space explored (Figure 5, line 1). Achieving a substantial relative yield gain ≥1.5 requires the deployment of an R cultivar with a cost of adaptation ≥0.9 in at least 50% of the fields, re-gardless of resistance effectiveness. The achievement of a higher relative yield gain ≥2 requires, in addition, a high resistance ef-fectiveness ≥0.9.
In the IE scenario, relative yield gains range from 1.27 to 5.02, with a mean of 1.9 (Figure 5, line 1). In all the production situa-tions explored, relative yield gains were higher for the IE scenario than for the SP scenario. The mean difference in relative yield gains between production situations was 0.28 (maximal difference 1.93). Substantial gains ≥2 are obtained for larger ranges of resistance effectiveness and proportions of the R cultivar at planting, pro-vided that the costs of adaptation are ≥0.9. Remarkably, for both scenarios, epidemiological control is not correlated with time to emergence in the production situations explored (compare Figures 4 and 5).
F I G U R E 3 Nature of the evolutionary equilibrium (monomorphic or dimorphic) when the resistance affects only infection efficiency. The nature of the equilibrium is characterized as a function of the proportion of the R cultivar at planting (x- axis) and of the relative effectiveness of the resistant cultivar (y- axis) for three costs of adaptation (columns). For all panels, all the other parameters are set to their reference values (Table 2)

10 | FABRE Et Al.
5 | DISCUSSION
This work follows a current trend toward the combined modeling of epidemiological and evolutionary dynamics in host– parasite
interactions. Our theoretical framework, driven by fungal infections in plants, can be used to tackle the question of the durability of plant quantitative resistances altering specific pathogen life- history traits. In our case study, we show that the evolutionary and epidemiological
F I G U R E 4 Time to emergence of the evolutionary attractor. The time to emergence Temg is the time at which the proportion of the evolutionary attractor (the closest to the optimal phenotype on the R cultivar) becomes ≥5% in the pool of spores in the air. Line 1. The resistance affects only total spore production (SP scenario). Temg is characterized as a function of the proportion of the R cultivar at planting (x- axis) and of the relative effectiveness of the resistant cultivar (y- axis) for three costs of adaptation (columns). Level A0 indicates situations in which the criteria for emergence are met right from the initial conditions. Line 2. An in line 1 when the resistancaffects only infection efficiency (IE scenario). Line 3. Shape of the ℛ0 function. Three shapes are classified: (i) "1S- 2S" when the evolutionary attractor �∗ is closer to �S than to �R (i.e., 𝜇∗ < 0), (ii) "1R" when �∗ is closer to �R and ℛ0 is unimodal, and (iii) "2R" when �∗ is closer to �R and ℛ0 is bimodal. Point A0 indicates situations in which the criteria for emergence are met right from the initial conditions. For all panels, all the other parameters are set to their reference values (Table 2)

| 11FABRE Et Al.
consequences of deploying resistant cultivars are not necessarily aligned, and depend on the pathogenicity trait targeted by the plant resistance genes. From an evolutionary perspective, the emergence time of the strategy best adapted to the R cultivar tends to be shorter when the resistance affects infection efficiency (IE scenario) than when it affects sporulation (SP scenario). In both cases, the emergence time is maximal for an intermediate proportion of R cultivars, as previ-ously reported by Papaïx et al. (2018). In contrast, from an epidemio-logical perspective, epidemiological control is always greater in the IE scenario than in the SP scenario, as already observed by Iacono et al. (2012); Rimbaud et al. (2018). These general rules are common to all theoretical studies over the last decade investigating the epidemio-logical and evolutionary effects of deploying quantitative resistances in agro- ecosystems, supporting the robustness of these conclusions.
5.1 | Bridging the gap between modeling approaches
All these previous studies account for the interplay between epide-miological and evolutionary dynamics, but they are based on differ-ent modeling frameworks, hypotheses, and parametrizations. One of
the strong points of our general modeling framework is that it allows us to bridge the gap between different modeling traditions. First, we can investigate both the short- and long- term epidemiological and evolutionary dynamics of the host– pathogen interaction (Day & Proulx, 2004). The short- term dynamics are investigated numeri-cally, but the long- term analysis is analytically tractable and can pre-dict the outcome of pathogen evolution. In contrast to most studies in evolutionary epidemiology, our results are neither restricted to rare mutations, as in the classical adaptive dynamics approach, nor restricted to a Gaussian mutation kernel (see also Mirrahimi (2017)). When the trait distribution is sufficiently narrow, we expect the population to concentrate around the attractors predicted by adap-tive dynamics. However, the full model is required to quantify the speed of evolution, and, notably, the time to the emergence of an adapted pathogen strain, which is often as important for practical purposes than the characterization of the potential long- term out-come. We also note that “fat- tailed” kernels allowing the inclusion of long- distance dispersal events in the phenotype space could also be considered (Appendix S2).
Second, our analysis makes it possible to consider multimodal fitness functions, which are reminiscent of fitness landscapes in population genetics, and to characterize evolutionary attractors at
F I G U R E 5 Epidemiological outcomes. Epidemiological control is estimated by calculating the gain in relative healthy area duration (rHAD), a proxy for crop yield. Line 1. The resistance affects only total spore production (SP scenario). Epidemiological control is characterized as a function of the proportion of the R cultivar at planting (x- axis) and of the relative effectiveness of the resistant cultivar (y- axis) for three costs of adaptation (columns). Line 2. As in line 1 when the resistance affects only infection efficiency (IE scenario). For all panels, all the other parameters are set to their reference values (Table 2)

12 | FABRE Et Al.
equilibrium through a detailed description of their shapes (number of modes, steepness, and any higher moments with even order). Our results show that these features strongly affect transient dynamics, which, in turn, shape evolutionary and epidemiological outcomes. In particular, multimodal fitness functions with close local maxima result in the longest time to the emergence of adapted pathogen strains in the SP scenario. Mathematically, they are characterized by a slow convergence to equilibrium (Burie et al., 2020). In practice, it is possible to take advantage of these properties by wisely choosing the proportion of each cultivar in the agricultural landscape. Indeed, the shape of the fitness function in this scenario is basically the sum of the fitness in each hosts weighted by their proportions in the en-vironment (equation 3).
Third, we propose a simple framework based on Gaussian distri-butions to describe the pathogen phenotypic landscape associated with quantitative resistance. Variation of the relative effectiveness of resistance and cost of adaptation allows us to describe a whole range of quantitative resistance effects, making it possible to con-sider the continuum between the two main models used for qualita-tive plant– parasite interactions: (i) the gene- for- gene model in which a parasite strain may have universal infectivity (Reff = 1 and Cadp = 0) and i) the matching- allele model in ich universal infectivity is impos-sible (Reff = 1 and Cadp = 1) (Thrall et al., 2016). By exploring the con-tinuum between these extremes (while noting that Reff and Cadp can only tend to 1 in our framework), we can investigate in more detail the impact of deploying quantitative resistances on epidemiological and evolutionary outcomes.
5.2 | Quantitative resistances as a major driver of pathogen evolution
The possibility that deploying R cultivars in agricultural landscapes will lead to the diversification of an initially monomorphic population and to the long- term coexistence of different pathogen strategies has been investigated with adaptive dynamics by Gudelj, van den Bosch, et al. (2004) and by Gandon (2004) in the general context of the evolution of virulence in multihost parasites. These studies highlighted the strong dependence of evolutionary outcomes on the shape of the trade- off curve for pathogen transmission on sympatric hosts. Concave trade- off curves lead to monomorphic evolutionary endpoints, whereas convex or sigmoidal trade- off curves can lead to evolutionary branching. These results can also explain the exist-ence of sibling fungal pathogens (Gudelj, Fitt, et al. (2004)). In this approach, the transmission rate aggregates infection, spore produc-tion, and dispersal into a single proxy trait affecting secondary in-fection from infected to healthy hosts. In contrast, our framework allows us to disentangle the specific effect of the pathogenicity traits that follow one another during infection. Consistent with Gudelj, van den Bosch, et al. (2004), we show that dimorphism is possible with a convex or sigmoidal trade- off for host infection effi-ciencies (IE scenario), whereas the population always remains mono-morphic when the trade- off curve is concave. However, our analysis
shows that predictions crucially depend on the step of the parasite life cycle affected by quantitative resistance in the R cultivar. The population always remains monomorphic when resistance affects only the sporulation curve (total spore production but also any other pathogenicity traits, such as the duration of the latency period) irre-spective of the underlying trade- off curve shape (SP scenario). This is because the SP scenario allows an optimization principle based on ℛ0 and potential evolutionary attractors are located at the peaks of ℛ0 (Lion & Metz, 2018).
The evolution of plant pathogens toward generalism or spe-cialism following the deployment of an R cultivar is also a major concern (Croll & McDonald, 2017; Papaïx et al., 2013, 2014). We propose a simple binary criterion for classifying the evolutionary attractors as generalist or specialist by comparing their ℛ0 on the R and S cultivars to a preset threshold (Figure S4). This highlights not only that high costs of adaptation are a major factor leading to the selection of specialists but also that emergence times and epidemi-ological control are weakly structured by this classification (Figure S4). It remains unclear whether it is better to favor deployment strategies leading to the selection of generalist or specialist patho-gen strains, and this issue merits further investigation. The answer depends partly on the preexisting level of pathogen diversification (Papaïx, 2011). However, addressing this question in the context of quantitative resistance will first require the development of new indices measuring the degree of generalism within a specialist/gen-eralist continuum.
5.3 | �0 in heterogeneous host environments sharing a common pool of propagules
Many practical epidemiological studies are based on the concept of the basic reproduction ratio ℛ0. For instance, van den Bosch et al. (2008) calculated ℛ0 for lesion- forming foliar pathogens in a set-ting with two cultivars but with no effect of the time since infec-tion on sporulation and disease- induced mortality. ℛ0 is typically calculated with the spectral radius of the next- generation operator (Diekmann et al., 1990), but we follow here a methodology based on the generation evolution operator (Inaba, 2012) to derive an expres-sion for the basic reproduction number ℛ0 in heterogeneous host populations with any number of cultivars. This expression captures the time scales inherent to the life cycle of plant fungal pathogens with, notably, sporulation varying over time. Capturing such pat-terns is a challenge in the modeling of plant diseases, as reported by Cunniffe et al. (2015). Moreover, with a common pool of well- mixed airborne pathogen propagules, the function ℛ0 (x) is an exact fit-ness proxy for competing strains with potentially different sporu-lation curves (including the latent period, total spore production, and shape parameters). This is important because the computation of ℛ0 (x) usually assumes that the invading pathogen enters an un-infected host population. However, more generally, a clear distinc-tion between pathogen invasion fitness ℛ (x, y) and epidemiological ℛ0 (x) is required for correct discussions of the adaptive evolution of

| 13FABRE Et Al.
pathogens (Lion & Metz, 2018). Even with a common pool of spores, the optimization principle of ℛ0 (x) does not hold when infection ef-ficiencies differ between host classes.
5.4 | Notes on model assumptions
The model assumes an infinitely large pathogen population. Demographic stochasticity is, thus, ignored despite its potential impact on evolutionary dynamics (e.g., lower probabilities of emer-gence and fixation of beneficial mutations, and reduction of standing genetic variation (Kimura, 1962)). In particular, genetic drift is more likely to affect the maintenance of a neutral polymorphism than that of a protected polymorphism when selection favors the coexist-ence of different genotypes protecting against invasions by mutant strategies (Geritz et al., 1998). The effect of genetic drift depends on the stability properties of the model considered. As our model has a unique globally stable eco- evolutionary equilibrium, genetic drift is likely to have a weaker impact than in models with several lo-cally stable equilibria. Moreover, the large effective population sizes (from 103 to 3.104) reported at field scale for several species of wind- dispersed, spore- producing plant pathogens (Ali et al., 2016; Walker et al., 2017; Zhan et al., 2001) suggest a weak effect of genetic drift.
The model assumes that the aggressiveness components are mutually independent. However, correlations between traits have sometimes been reported. For instance, Pariaud et al. (2013) ob-served a positive correlation between the duration of the latent period and the fecundity of a plant fungus. This relationship de-scribes a phenotypic trade- off because a short latent period and a high sporulation probability represent fitness advantages. It can be introduced into the SP scenario assuming that the latent period and the total spore production of a pathogen strain x are linked by mathematical functions, such as the quadratic relationship sug-gested by Pariaud et al. (2013). Alternatively, correlations between pathogen life- history traits can emerge from the covariance matrix of the (multidimensional) mutation kernel (Gandon, 2004). Another feature of the framework that we did not use is the possibility of tracking the evolution of the quantitative traits of the pathogen with Price's equation (Day & Gandon, 2007; Day & Proulx, 2004; Iacono et al., 2012). Indeed, differential equations for the mean phenotype and phenotypic variance of any trait of interest can be derived from model (2).
The model also assumes a unique pool of well- mixed propagules. Spore dispersal therefore disregards the location of healthy and in-fected hosts. This assumption, which ensures the one- dimensional environmental feedback loop of the model, is more likely when the extent of the field or landscape considered is not overly large with respect to the dispersal function of airborne propagules. Airborne fungal spores often disperse over substantial distances. Mean dis-persal distances range from 100 m to 1 km and, in most cases, long- distance dispersal events are frequent (Fabre et al., 2021). A spatially implicit framework embedded into integro- differential equations was recently used to describe the eco- evolutionary dynamics of a
phenotypically structured population subject to mutation, selec-tion, and migration between two habitats (Mirrahimi, 2017). With the same goal, Rimbaud et al. (2018) used a spatially explicit frame-work with several habitats embedded in an HEIR stochastic model. It would be interesting to draw on these examples and extend our approach to a spatially explicit environment. Indeed, when dispersal decreases with distance, large homogeneous habitats promote di-versification, whereas smaller habitats, favoring migration between different patches, hamper diversification (Débarre & Gandon, 2010; Haller et al., 2013; Papaïx et al., 2013, 2014).
5.5 | Applied significance
This study gave rise to three key applied findings. The first is the ℛ0 equation in an environment with several cultivars. This equa-tion is based on a gamma sporulation curve, as documented for several plant fungi (van den Bosch et al., 1988; van den Bosch et al., 1988; Kolnaar & Bosch, 2001; Sache et al., 1997; Segarra et al., 2001), and explicitly integrates the pathogenicity traits expressed during the basic steps of infection (infection efficiency, latent pe-riod, sporulation dynamics). As these traits can be measured in the laboratory, this expression of ℛ0 bridges the gap between plant- scale and epidemiological studies, and between experimental and theoretical approaches. It helps address the practical difficulty of estimating ℛ0 for real populations, as pointed out by Gilligan and van den Bosch (2008). For example, it can be used to compare the fitness of a collection of pathogen isolates (e.g., see Montarry et al. (2010) for an application to potato late blight) or to predict their field structure (e.g., see Durand et al. (2017) for an application to Lyme disease).
The second applied finding is that the choice of quantitative resistance genes operated by plant breeders drives pathogen diversification. This effect is mediated by the parasite life cycle targeted by the resistance. Quantitative resistances specifically affecting different stages of pathogen cycles have been identified in several pathosystems (e.g., Azzimonti et al. (2013), Chung et al. (2010), Jorge et al. (2005)). Moreover, understanding the condi-tions for maintaining pathogen polymorphism is a long- standing question in disease ecology and evolution, with implications for disease management (Vale, 2013). We show here that the patho-gen population always remains monomorphic when resistance affects only sporulation, irrespective of the underlying trade- off curve shape. In contrast, pathogen diversification is possible when resistance affects only infection efficiency. This finding highlights the need for a detailed knowledge of the effect of resistance genes on pathogen life cycle for a full understanding of the impact of the deployment of quantitative resistances on the strain struc-tures underlying the patterns of disease incidence. This finding is important, because quantitative resistances are increasingly being used by plant breeders to deal with the rapidity with which major resistance genes break down (Zhan et al., 2015). Interestingly, similar questions concerning the epidemiological and evolutionary
14 | FABRE Et Al.
consequences of vaccination strategies have been considered. Quantitative resistance traits targeting pathogen infection rate, latent period, and sporulation rate are analogous to partially effec-tive (imperfect) vaccines with anti- infection, antigrowth, and anti-transmission modes of action, respectively (Gandon et al., 2001). Similarly, the proportion of the R cultivar deployed is analogous to vaccination coverage in the population; in the vaccination con-text, the relative effectiveness of resistance is termed "vaccine efficacy" and the relative cost of adaptation is termed "cost of es-cape" (Gandon & Day, 2007).
Finally, using a different theoretical approach, we confirm the finding of Papaïx et al. (2018) that "there is no silver bullet deploy-ment strategy" simultaneously maximizing epidemiological and evolutionary outcomes (Rimbaud et al., 2021). Accordingly, as the different stakeholders involved in plant resistance management may pursue objectives that are not always compatible (e.g., growers, breeders), they should all be involved in defining the best manage-ment strategies.
ACKNOWLEDG EMENTSWe thank Ludek Berec, Eva Kisdi, Loup Rimbaud, and Julien Papaïx for comments and suggestions to improve the manuscript.
AUTHORS’ CONTRIBUTIONSRDD, AD, JBB, and FF planned and designed the research. RDD, AD, JBB, and FF developed analytic tools and conducted numerical ex-periments. SL and QR critically revised the manuscript and contrib-uted to its writing. All the authors gave final approval for publication and agreed to be held accountable for the work described.
DATA AVAIL ABILIT Y S TATEMENTThe MATLAB codes used to simulate the model and generate the main figures have been deposited in Dataverse at https://doi.org/10.15454/WAEIMA
ORCIDFrédéric Fabre https://orcid.org/0000-0001-8271-7678
R E FE R E N C E SAli, S., Soubeyrand, S., Gladieux, P., Giraud, T., Leconte, M., Gautier, A.,
Mboup, M., Chen, W., Vallavieille- Pope, C., & Enjalbert, J. (2016). Cloncase: Estimation of sex frequency and effective population size by clonemate resampling in partially clonal organisms. Molecular Ecology Resources, 16, 45– 861.
Anderson, P. K., Cunningham, A. A., Patel, N. G., Morales, F. J., Epstein, P. R., & Daszak, P. (2004). Emerging infectious diseases of plants: Pathogen pollution, climate change and agrotechnology driv-ers. Trends in Ecology and Evolution, 19, 535– 544. https://doi.org/10.1016/j.tree.2004.07.021
Anderson, R. M. (1991). Populations and infectious diseases: ecology or epidemiology? Journal of Animal Ecology, 60, 1– 50. https://doi.org/10.2307/5443
Azzimonti, G., Lannou, C., Sache, I., & Goyeau, H. (2013). Components of quantitative resistance to leaf rust in wheat cultivars: Diversity, variability and specificity. Plant Pathology, 62, 970– 981. https://doi.org/10.1111/ppa.12029
Bourget, R., Chaumont, L., Durel, C.- E., & Sapoukhina, N. (2008). Sustainable deployment of QTLs conferring quantitative resistance to crops: First lessons from a stochastic model. New Phytologist, 206(3), 1163– 1171. https://doi.org/10.1111/nph.13295
Burie, J. B., Djidjou- Demasse, R., & Ducrot, A. (2020). Slow convergence to equilibrium for an evolutionary epidemiology integro- differential system. Discrete and Continuous Dynamical Systems - Series B, American Institute of Mathematical Sciences, 25(6), 2223– 2243.
Burie, J. B., Ducrot, A., Griette, Q., & Richard, Q. (2019). Concentration estimates in a multi- host epidemiological model structured by phenotypic traits. Journal of Differential Equations, 269(12), 11492– 11539. https://doi.org/10.1016/j.jde.2020.08.029
Chung, C. L., Longfellow, J. M., Walsh, E. K., Kerdieh, Z., van Esbroeck, G., Balint- Kurti, P., & Nelson, R. J. (2010). Resistance loci affecting distinct stages of fungal pathogenesis: Use of introgression lines for QTL mapping and characterization in the maize - Setosphaeria turcica pathosystem. BMC Plant Biology, 10, 103. https://doi.org/10.1186/1471- 2229- 10- 103
Croll, D., & McDonald, B. A. (2017). The genetic basis of local adaptation for pathogenic fungi in agricultural ecosystems. Molecular Ecology, 26, 2027– 2040.
Cunniffe, N. J., Koskella, B., Metcalf, C. J. E., Parnell, S., Gottwald, T. R., & Gilligan, C. A. (2015). Thirteen challenges in modelling plant diseases. Epidemics, 10, 6– 10. https://doi.org/10.1016/j.epidem.2014.06.002
Day, T. (2002). Virulence evolution via host exploitation and toxin produc-tion in spore- producing pathogens. Ecology Letters, 5(4), 471– 476.
Day, T., & Gandon, S. (2007). Applying population- genetic models in the-oretical evolutionary epidemiology. Ecology Letters, 10, 876– 888. https://doi.org/10.1111/j.1461- 0248.2007.01091.x
Day, T., & Proulx, S. R. (2004). A general theory for the evolutionary dy-namics of virulence. American Naturalist, 163(4), e40– 63. https://doi.org/10.1086/382548
Débarre, F., & Gandon, S. (2010). Evolution of specialization in a spa-tially continuous environment. Journal of Evolutionary Biology, 23(5), 1090– 1099. https://doi.org/10.1111/j.1420- 9101.2010.01966.x
Dieckmann, U. (2002). Adaptive dynamics of pathogen- host interac-tions. In U. Dieckmann, J. A. J. Metz, M. W. Sabelis, & K. Sigmund (Eds.), Adaptive dynamics of infectious diseases: In pursuit of virulence management (pp. 39– 59). Cambridge University Press.
Diekmann, O., Heesterbeek, J. A. P., & Metz, J. A. (1990). On the defini-tion and the computation of the basic reproduction ratio R0 in mod-els for infectious diseases in heterogeneous populations. Journal of Mathematical Biology, 28(4), 365– 382. https://doi.org/10.1007/BF001 78324
Diekmann, O., Jabin, P. E., Mischler, S., & Perthame, B. (2005). The dy-namics of adaptation: An illuminating example and a Hamilton- Jacobi approach. Theoretical Population Biology, 67, 257– 271. https://doi.org/10.1016/j.tpb.2004.12.003
Djidjou- Demasse, R., Ducrot, A., & Fabre, F. (2017). Steady state concen-tration for a phenotypic structured problem modeling the evolu-tionary epidemiology of spore producing pathogens. Mathematical Models and Methods in Applied Sciences, 27, 385– 426. https://doi.org/10.1142/S0218 20251 7500051
Durand, J., Jacquet, M., Rais, O., Gern, L., & Voordouw, M. J. (2017). Fitness estimates from experimental infections predict the long- term strain structure of a vector- borne pathogen in the field. Scientific Reports, 7(1), 1851. https://doi.org/10.1038/s4159 8- 017- 01821 - 1
Fabre, F., Coville, J., & Cunniffe, N. J. (2021). Optimising Reactive Disease Management Using Spatially Explicit Models at the Landscape Scale. In P. Scott, R. Strange, L. Korsten, & M. L. Gullino (Eds.), Plant pathology in the 21st Century. Plant diseases and food security in the 21st century (pp. 47– 72). Springer International Publishing.
Gandon, S. (2004). Evolution of multihost parasites. Evolution, 58(3), 455– 469. https://doi.org/10.1111/j.0014- 3820.2004.tb016 69.x

| 15FABRE Et Al.
Gandon, S., & Day, T. (2007). The evolutionary epidemiology of vaccina-tion. Journal of the Royal Society Interface, 4(16), 803– 817. https://doi.org/10.1098/rsif.2006.0207
Gandon, S., Mackinnon, M. J., Nee, S., & Read, A. F. (2001). Imperfect vac-cines and the evolution of pathogen virulence. Nature, 414(6865), 751– 756.
Geritz, S. A. H., Kisdi, É., Meszéna, G., & Metz, J. A. J. (1998). Evolutionarily singular strategies and the adaptive growth and branching of the evolutionary tree. Evolutionary Ecology, 12, 35– 57. https://doi.org/10.1023/A:10065 54906681
Geritz, S. A., Metz, J. A., Kisdi, É., & Meszéna, G. (1997). Dynamics of adaptation and evolutionary branching. Physical Review Letters, 78(10), 2024– 2027. https://doi.org/10.1103/PhysR evLett.78.2024
Gilchrist, M. A., Sulsky, D. L., & Pringle, A. (2006). Identifying fitness and optimal life- history strategies for an asexual filamentous fungus. Evolution, 5, 970– 979. https://doi.org/10.1111/j.0014- 3820.2006.tb011 75.x
Gudelj, I., Fitt, B. D., & van den Bosch, F. (2004). Evolution of sibling fungal plant pathogens in relation to host specialization. Phytopathology, 94(7), 789– 795. https://doi.org/10.1094/PHYTO.2004.94.7.789
Gudelj, I., van den Bosch, F., & Gilligan, C. A. (2004). Transmission rates and adaptive evolution of pathogens in sympatric heterogeneous plant populations. Proceedings of the Royal Society B, 271(1553), 2187– 2194.
Gyllenberg, M., & Service, R. (2011). Necessary and sufficient conditions for the existence of an optimisation principle in evolution. Journal of Mathematical Biology, 62(3), 359– 369. https://doi.org/10.1007/s0028 5- 010- 0340- 1
Haller, B. C., Mazzuccco, R., & Dieckmann, U. (2013). Evolutionary branching in complex landscape. American Naturalist, 184(4), e127– 141.
Iacono, G. L., van den Bosch, F., & Paveley, N. (2012). The evolution of plant pathogens in response to host resistance: Factors affect-ing the gain from deployment of qualitative and quantitative re-sistance. Journal of Theoretical Biology, 304, 152– 163. https://doi.org/10.1016/j.jtbi.2012.03.033
Inaba, H. (2012). On a new perspective of the basic reproduction number in heterogeneous environments. Journal of Mathematical Biology, 65(2), 309– 348. https://doi.org/10.1007/s0028 5- 011- 0463- z
Jorge, V., Dowkiw, A., Faivre- Rampant, P., & Bastien, C. (2005). Genetic architecture of qualitative and quantitative Melampsora larici- populina leaf rust resistance in hybrid poplar: genetic mapping and QTL detection. New Phytologist, 167, 113– 127. https://doi.org/10.1111/j.1469- 8137.2005.01424.x
Kimura, M. (1962). On the probability of fixation of mutant genes in a population. Genetics, 47, 713– 719. https://doi.org/10.1093/genet ics/47.6.713
Klein, E. K., Lavigne, C., & Gouyon, P. H. (2006). Mixing of propa-gules from discrete sources at long distance: Comparing a dis-persal tail to an exponential. BMC Ecology, 6, 3. https://doi.org/10.1186/1472- 6785- 6- 3
Kolnaar, R. W., & van den Bosch, F. V. D. (2001). Effect of temperature on epidemiological parameters of Puccinia lagenophorae. Plant Pathology, 50, 363– 370.
Lannou, C. (2012). Variation and selection of quantitative traits in plant pathogens. Annual Review of Phytopathology, 50, 319– 338. https://doi.org/10.1146/annur ev- phyto - 08121 1- 173031
Lion, S., & Metz, J. A. J. (2018). Beyond R0 maximisation: On pathogen evolution and environmental dimensions. Trends in Ecology and Evolution, 33, 75– 90. https://doi.org/10.1016/j.tree.2018.02.004
McDonald, B. A., & Linde, C. (2002). Pathogen population genetics, evolutionary potential, and durable resistance. Annual Review of Phytopathology, 40, 349– 379.
Metz, J. A. J., Geritz, S. A. H., Meszéna, G., Jacobs, F. J. A., & van Heerwaarden, J. S. (1996). Adaptive dynamics, a geometrical study of the consequences of nearly faithful reproduction. In S. J. van
Strien & S. M. Verduyn Lunel (Eds.), Stochastic and spatial structures of dynamical systems (pp. 183– 231). North- Holland.
Metz, J. A. J., Mylius, S. D., & Diekmann, O. (2008). When does evolution optimise? Evolutionary Ecology Research, 10, 629– 654.
Mikaberidze, A., Mundt, C. C., & Bonhoeffer, S. (2016). Invasiveness of plant pathogens depends on the spatial scale of host dis-tribution. Ecological Applications, 26, 1238– 1248. https://doi.org/10.1890/15- 0807
Mirrahimi, S. (2017). A Hamilton- Jacobi approach to characterize the evo-lutionary equilibria in heterogeneous environments. Mathematical Models and Methods in Applied Sciences, 27(13), 2425– 2460.
Montarry, J., Hamelin, F. M., Glais, I., Corbière, R., & Andrivon, D. (2010). Fitness costs associated with unnecessary virulence factors and life history traits: Evolutionary insights from the potato late blight pathogen Phytophthora infestans. BMC Evolutionary Biology, 10, 1– 9. https://doi.org/10.1186/1471- 2148- 10- 283
Mylius, S. D., & Diekmann, O. (1995). On evolutionarily stable life histo-ries, optimization and the need to be specific about density depen-dence. Oikos, 74, 218– 224.
Niks, R. E., Qi, X., & Marcel, T. C. (2015). Quantitative resistance to biotrophic filamentous plant pathogens: Concepts, misconcep-tions, and mechanisms. Annual Review of Phytopathology, 53, 444– 470. https://doi.org/10.1146/annur ev- phyto - 08061 4- 115928
Nowak, M. A., & Sigmund, K. (2004). Evolutionary dynamics of biological games. Science, 303(5659), 793– 799.
Papaïx, J. (2011). Structure of agricultural landscapes and epidemic risk, a demo- genetic approach. PhD thesis in Agricultural sciences. AgroParisTech. 192 pages, pastel- 00737855.
Papaïx, J., Burdon, J. J., Lannou, C., & Thrall, P. H. (2014). Evolution of pathogen specialisation in a host metapopulation: Joint effects of host and pathogen dispersal. PLoS Computational Biology, 10, e1003633. https://doi.org/10.1371/journ al.pcbi.1003633
Papaïx, J., David, O., Lannou, C., & Monod, H. (2013). Dynamics of adap-tation in spatially heterogeneous metapopulations. PLoS One, 8(2), e54697.
Papaïx, J., Rimbaud, L., Burdon, J. J., Zhan, J., & Thrall, P. H. (2018). Differential impact of landscape- scale strategies for crop cultivar deployment on disease dynamics, resistance durability and long- term evolutionary control. Evolutionary Applications, 11, 705– 717. https://doi.org/10.1111/eva.12570
Pariaud, B., van den Berg, F., van den Bosch, F., Powers, S. J., Kaltz, O., & Lannou, C. (2013). Shared influence of pathogen and host ge-netics on a trade- off between latent period and spore production capacity in the wheat pathogen, Puccinia triticina. Evolutionary Applications, 6, 303– 312.
Pilet- Nayel, M. L., Moury, B., Caffier, V., Montarry, J., Kerlan, M. C., Fournet, S., Durel, C. E., & Delourme, R. (2017). Quantitative re-sistance to plant pathogens in pyramiding strategies for durable crop protection. Frontiers in Plant Science, 8, 21– 29. https://doi.org/10.3389/fpls.2017.01838
Poland, J. A., Balint- Kurti, P. J., Wisser, R. J., Pratt, R. C., & Nelson, R. J. (2009). Shades of gray: The world of quantitative disease resis-tance. Trends in Plant Science, 14, 21– 29. https://doi.org/10.1016/j.tplan ts.2008.10.006
Raberg, L., Graham, A. L., & Read, A. F. (2009). Decomposing health: Tolerance and resistance to parasites in animals. Philosophical Transactions of the Royal Society B: Biological Sciences, 364, 37– 49. https://doi.org/10.1098/rstb.2008.0184
Rimbaud, L., Fabre, F., Papaïx, J., Moury, B., Lannou, C., Barrett, L. G., & Thrall, P. H. (2021). Models of plant resistance deployment. Annual Review of Phytopathology, 59, 125– 152. https://doi.org/10.1146/annur ev- phyto - 02062 0- 122134
Rimbaud, L., Papaïx, J., Rey, J.- F., Barrett, L. G., & Thrall, P. H. (2018). Assessing the durability and efficiency of landscape- based strategies to deploy plant resistance to pathogens. PLOS Computational Biology, 14(4), e1006067. https://doi.org/10.1371/journ al.pcbi.1006067

16 | FABRE Et Al.
Rueffler, C., & Metz, J. A. (2013). Necessary and sufficient conditions for R0 to be a sum of contributions of fertility loops. Journal of Mathematical Biology, 66(4– 5), 1099– 1122.
Sache, I. (1997). Effect of density and age of lesions on sporulation ca-pacity and infection efficiency in wheat leaf rust (Puccinia recondita f.sp. tritici). Plant Pathology, 4, 581– 589.
Segarra, J., Jeger, M. J., & van den Bosch, F. (2001). Epidemic dynamics and patterns of plant diseases. Phytopathology, 91(10), 1001– 1010. https://doi.org/10.1094/PHYTO.2001.91.10.1001
St. Clair, D. A. (2010). Quantitative disease resistance and quantitative re-sistance loci in breeding. Annual Review of Phytopathology, 48, 247– 268. https://doi.org/10.1146/annur ev- phyto - 08050 8- 081904
Thrall, P. H., Barrett, L. G., Dodds, P. N., & Burdon, J. J. (2016). Epidemiological and evolutionary outcomes in gene- for- gene and matching allele models. Frontiers in Plant Science, 6, 1084. https://doi.org/10.3389/fpls.2015.01084
Vale, P. F. (2013). Killing them softly: Managing pathogen polymor-phism and virulence in spatially variable environments. Trends in Parasitology, 29(9), 417– 422.
van den Berg, F., Lannou, C., Gilligan, C. A., & van den Bosch, F. (2014). Quantitative resistance can lead to evolutionary changes in traits not targeted by the resistance QTLs. Evolutionary Applications, 7, 370– 380.
van den Bosch, F., Akudibilah, G., Seal, S. U. E., & Jeger, M. (2006). Host resistance and the evolutionary response of plant vi-ruses. Journal of Applied Ecology, 43(3), 506– 516. https://doi.org/10.1111/j.1365- 2664.2006.01159.x
van den Bosch, F., Frinking, H. D., Metz, J. A. J., & Zadoks, J. C. (1988). Focus expansion in plant disease. III: Two experimental exam-ples. Phytopathology, 78, 919– 925. https://doi.org/10.1094/Phyto - 78- 919
van den Bosch, F., Jeger, M. J., & Gilligan, C. A. (2007). Disease con-trol and its selection for damaging plant virus strains in vegeta-tively propagated staple food crops; a theoretical assessment. Proceedings of the Royal Society B, 274(1606), 11– 18. https://doi.org/10.1098/rspb.2006.3715
van den Bosch, F., McRoberts, N., van den Berg, F., & Madden, L. V. (2008). The basic reproduction number of plant pathogens: Matrix approaches to complex dynamics. Phytopathology, 98(2), 239– 249.
van den Driessche, P., & Watmough, J. (2008). Further notes on the basic reproduction number. F. Brauer, P. van den Driessche, & J. Wu (Eds.), In Mathematical epidemiology. Lecture Notes in Mathematics (Vol. 1945, pp. 159- 178). Springer.
van den Gilligan, C. A., & Bosch, F. (2008). Epidemiological mod-els for invasion and persistence of pathogens. Annual Review of Phytopathology, 46, 385– 418. https://doi.org/10.1146/annur ev.phyto.45.062806.094357
Walker, A. S., Ravigne, V., Rieux, A., Ali, S., Carpentier, F., & Fournier, E. (2017). Fungal adaptation to contemporary fungicide applications: the case of Botrytis cinerea populations from Champagne vineyards (France). Molecular Ecology, 26, 1919– 1935.
Zhan, J., Mundt, C. C., & McDonald, B. A. (2001). Using restriction frag-ment length polymorphisms to assess temporal variation and es-timate the number of ascospores that initiate epidemics in field populations of Mycosphaerella graminicola. Phytopathology, 91, 1011– 1017.
Zhan, J., Thrall, P. H., Papaïx, J., Xie, L., & Burdon, J. J. (2015). Playing on a pathogen's weakness: Using evolution to guide sustainable plant disease control strategies. Annual Review of Phytopathology, 53, 19– 43.
SUPPORTING INFORMATIONAdditional supporting information may be found in the online version of the article at the publisher’s website.
How to cite this article: Fabre, F., Burie, J.- B., Ducrot, A., Lion, S., Richard, Q., & Djidjou- Demasse, R. (2021). An epi- evolutionary model for predicting the adaptation of spore- producing pathogens to quantitative resistance in heterogeneous environments. Evolutionary Applications, 00, 1– 16. https://doi.org/10.1111/eva.13328