An Empirical Study of the Effects of Minimization on the Fault Detection Capabilities of Test Suites
10
An Empirical Study of the Effects of Minimization on the Fault Detection Capabilities of Test Suites Gregg Rothermel Department of Computer Science Oregon State University Corvallis, OR [email protected] Mary Jean Harrold Department of Computer and Information Science Ohio State University Columbus, OH [email protected] Jeffery Ostrin Department of Computer Science Oregon State University Corvallis, OR [email protected] Christie Hong Department of Computer and Information Science Ohio State University Columbus, OH [email protected] Abstract Test suite minimization techniques attempt to reduce the cost of saving and reusing tests during software mainte- nance, by eliminating redundant tests from test suites. A potential drawback of these techniques is that in minimizing a test suite, they might reduce the ability of that test suite to reveal faults in the software. A recent study showed that minimization can reduce test suite size without significantly reducing the fault detection capabilities of test suites. To further investigate this issue, we performed an experiment in which we compared the costs and benefits of minimizing test suites of various sizes for several programs. In con- trast to the previous study, our results reveal that the fault- detection capabilities of test suites can be severely compro- mised by minimization. 1 Introduction Because test development is expensive, software devel- opers often save the test suites they develop for their soft- ware, so that they can reuse those suites later as the software undergoes maintenance. As the software evolves, its test suites also evolve: new test cases are added to exercise new functionality or to maintain test adequacy. As a result, test suite size increases, and the costs of managing and using those test suites increases. Therefore, researchers have investigated the notion that when several test cases in a test suite execute the same pro- gram components, that test suite can be reduced to a smaller suite that guarantees equivalent coverage. This research has resulted in the creation of various test suite minimization algorithms (e.g., [2, 7, 8]). The motivation for test suite minimization is straightfor- ward: by reducing test suite size we reduce the costs of executing, validating, and managing those test suites over future releases of the software. A potential drawback of minimization, however, is that in minimizing a test suite we may significantly alter the fault-detecting capabilities of that test suite. This tradeoff between the time required to execute, validate, and manage test suites, and the fault de- tection effectiveness of test suites, is central to any decision to employ test suite minimization. A recent study [14] suggests that test suite minimization may produce dramatic savings in test suite size, at little cost to the fault-detection effectiveness of those test suites. To further explore this issue, we performed an experiment. Our experiment, however, revealed results quite different from those of the previous study. The following sections of this paper review the relevant literature, describe our experimen- tal design, analysis, and results, and compare our results with previous results. 2 Test Suite Minimization Summary and Lit- erature Review 2.1 Test suite minimization The test suite minimization problem may be stated as follows [7, p. 272]: Given: Test suite TS, a set of test case require- ments that must be satisfied to pro- vide the desired test coverage of the program, and subsets of TS, , one associated with each of the s such that any one of the test cases belonging to can be used to test . Problem: Find a representative set of test cases from TS that satisfies all of the s.
Transcript of An Empirical Study of the Effects of Minimization on the Fault Detection Capabilities of Test Suites

An Empirical Study of the Effects of Minimization on the Fault DetectionCapabilities of Test Suites
GreggRothermelDepartmentof
ComputerScience
OregonStateUniversity
Corvallis, OR
Mary JeanHarroldDepartmentof Computer
andInformationScience
OhioStateUniversity
Columbus,OH
Jeffery OstrinDepartmentof
ComputerScience
OregonStateUniversity
Corvallis, OR
ChristieHongDepartmentof Computer
andInformationScience
OhioStateUniversity
Columbus,OH
Abstract
Testsuiteminimizationtechniquesattemptto reducethecost of savingand reusingtestsduring software mainte-nance, by eliminating redundanttestsfrom test suites. Apotentialdrawbackof thesetechniquesis thatin minimizinga testsuite, they mightreducetheability of that testsuitetoreveal faults in the software. A recentstudyshowedthatminimizationcanreducetestsuitesizewithoutsignificantlyreducingthe fault detectioncapabilitiesof testsuites. Tofurther investigatethis issue, we performedan experimentin which wecomparedthecostsandbenefitsof minimizingtest suitesof varioussizesfor several programs. In con-trast to thepreviousstudy, our resultsrevealthat thefault-detectioncapabilitiesof testsuitescanbeseverelycompro-misedby minimization.
1 Introduction
Becausetestdevelopmentis expensive, softwaredevel-opersoften save the testsuitesthey develop for their soft-ware,sothatthey canreusethosesuiteslaterasthesoftwareundergoesmaintenance.As the software evolves, its testsuitesalsoevolve: new testcasesareaddedto exercisenewfunctionalityor to maintaintestadequacy. As a result,testsuitesize increases,and the costsof managingandusingthosetestsuitesincreases.
Therefore,researchershave investigatedthe notion thatwhenseveraltestcasesin a testsuiteexecutethesamepro-gramcomponents,thattestsuitecanbereducedto asmallersuitethatguaranteesequivalentcoverage.Thisresearchhasresultedin the creationof various test suite minimizationalgorithms(e.g.,[2, 7, 8]).
Themotivationfor testsuiteminimizationis straightfor-ward: by reducingtest suite size we reducethe costsof
executing,validating,andmanagingthosetestsuitesoverfuture releasesof the software. A potentialdrawback ofminimization, however, is that in minimizing a test suitewemaysignificantlyalterthefault-detectingcapabilitiesofthat testsuite. This tradeoff betweenthe time requiredtoexecute,validate,andmanagetestsuites,andthe fault de-tectioneffectivenessof testsuites,is centralto any decisionto employ testsuiteminimization.
A recentstudy[14] suggeststhattestsuiteminimizationmayproducedramaticsavingsin testsuitesize,at little costto the fault-detectioneffectivenessof thosetestsuites. Tofurtherexplorethisissue,weperformedanexperiment.Ourexperiment,however, revealedresultsquite differentfromthoseof thepreviousstudy. The following sectionsof thispaperreview therelevantliterature,describeourexperimen-tal design,analysis,and results,and compareour resultswith previousresults.
2 Test Suite Minimization Summary and Lit-erature Review
2.1 Test suite minimization
The test suite minimization problemmay be statedasfollows[7, p. 272]:
Given: TestsuiteTS, a setof testcaserequire-ments������������������ thatmustbesatisfiedto pro-vide the desiredtest coverageof the program,andsubsetsof TS,
��� ������ � , oneassociatedwith eachof the �� s suchthatany oneof the testcases��� belongingto
� canbeusedto test ��� .Problem: Find a representative setof test casesfrom TSthatsatisfiesall of the � � s.

The ��� s in the foregoing statementcan representvarioustestcaserequirements,suchassourcestatements,decisions,definition-useassociations,or specificationitems.
A representative setof testcasesthatsatisfiesall of the�� s mustcontainat leastonetestcasefrom each��� ; suchasetis calledahitting setof thegroupof sets���������������������� .To achieve a maximumreduction,it is necessaryto findthesmallestrepresentative setof testcases.However, thissubsetof the testsuite is the minimum cardinalityhittingset of the � � s, and the problem of finding such a set isNP-complete[4]. Thus,minimizationtechniquesresorttoheuristics.
Severaltestsuiteminimizationheuristicshavebeenpro-posed(e.g.,[2, 7, 8]); in thiswork weutilize themethodol-ogyof Harrold,Gupta,andSoffa [7].
2.2 Previous empirical work
A numberof empiricalstudiesof softwaretestinghavebeenperformed. Someof thesestudies,suchasthosere-portedin References[3, 9, 13], provide only indirect dataabouttheeffectsof testsuiteminimizationthroughconsid-erationof the effectsof testsuitesizeon costsandbene-fits of testing. Otherstudies,suchasthestudyreportedinReference[5], provide only indirectdataaboutthe effectsof testsuiteminimizationthrougha comparisonof regres-siontestselectiontechniquesthatpracticeor donotpracticeminimization.�
A recentstudyby Wong, Horgan,London,andMathur[14], however, directly examinesthe costs and benefitsof test suite minimization. We refer to this study as the“WHLM” study;wesummarizeits resultshere.
TheWHLM studyinvolvedtencommonC UNIX utilityprograms,includingnineprogramsrangingin sizefrom 90to 289linesof code,andoneprogramof 842linesof code.For eachof theseprograms,theresearchersrandomlygen-eratedan initial testcasepool containing1000testcases.However, if any two testcasesexecutedthesameexecutiontracein a program,theresearchersrandomlyexcludedoneof thosetestcasesfrom thepool: thenumberof testcasesin theresultanttestpoolsvariedbetween61and862.
The researchersnext generatedmultiple distinct testsuitesfor thetenprograms,by randomlyselectingtestcasesfrom the associatedtest casepools. The researchersdidnot attemptto achieve any particularcoverageof thecode;measurementstakenafterthetestsuitesweregeneratedin-dicatedthatthetestsuitesachievedblockcoveragerangingfrom 50% to 95%. Reference[14] reportstestsuitesizes�Whereasminimizationconsidersa programandtestsuite,regression
testselectionconsidersa program,testsuite,andmodifiedprogramver-sion, and selectstest casesthat are appropriatefor that versionwithoutremoving themfrom thetestsuite. Theproblemsof regressiontestselec-tion andtestsuiteminimizationarethusrelatedbut distinct. For furtherdiscussionof regressiontestselectionseeReference[12].
in termsof averagesovergroupsof testcasesthatachievedsimilarcoverage:89testsuitesbelongedto groupsin whichaveragetestsuitesizerangedfrom 12 to 27 testcases,and933 test suitesbelongedto groupsin which averagetestsuitesizerangedfrom 1 to 7 testcases.
Theresearchersenlistedgraduatestudentsto inject sim-ple mutation-like faults into eachof the subjectprograms.The researchersexcludedfaultsthat could not be detectedby any testcase. All told, 183 faulty versionsof the pro-gramswereretainedfor usein thestudy.
To assessthe difficulty of detectingthesefaults,the re-searchersmeasuredthepercentagesof testcases,in theas-sociatedtestpools,thatwereableto detectthefaults.Of the183faults,75 (41%)were“Quartile I” faultsdetectablebyfewer than25%of theassociatedtestcases,39 (21%)were“Quartile II” faultsdetectableby between25%and50%oftheassociatedtestcases,20(11%)were“QuartileIII” faultsdetectableby between50%and75%of theassociatedtestcases,and49(27%)were“QuartileIV” faultsdetectablebyat least75%of theassociatedtestcases.
The researchersminimized their test suitesusing AT-ACMIN [8], a heuristic-basedminization tool that found“exact solutionsfor minimizationsof all testsuitesexam-ined” [14, page42]. This minimizationwasdonewith re-spectto all-usesdataflow coverage(i.e., sizewasreducedwhile keepingall-usescoverageconstant).Theresearchersmeasuredthe reductionin testsuitesizeachieved throughminimization,andthereductionin fault-detectioneffective-nessof theminimizedtestsuites.
The researchersdrew the following overall conclusionsfrom thestudy:
� As the block coverageachieved by test suites in-creases,minimization producesgreatersavings withrespectto thosetestsuites,atratesrangingfrom 1.19%(for 50-55%blockcoveragesuites)to 44.23%(for 90-95%blockcoveragesuites).
� As the block coverageachieved by test suites in-creases,minimization producesgreaterlossesin thefault-detectioneffectivenessof thosesuites.However,lossesin faultdetectioneffectivenessweresmallcom-paredto savings in testsuitesize: thoselossesrangedfrom 0%(for 50-55%blockcoveragesuites)to 1.45%(for 90-95%blockcoveragesuites).
� Fault difficulty partially determinedwhether mini-mizationcausedlossesin fault-detectioneffectiveness:effectivenessreductionsfor Quartile-I and Quartile-II faultswere.39%and.66%, respectively, while ef-fectivenessreductionsfor Quartile-III andQuartile-IVfaultswere.098%and0%,respectively.
Theauthorscautionthattheir observationsarebasedonasinglestudyandmaynotapplyto programsandtestsuites

with differentcharacteristics,andthey emphasizetheneedfor furtherstudies.They thenconclude:
Data collected during experimentation haveshown thatwhenthesizeof a testsetis reducedwhile theall-usescoverageis keptconstant,thereis little or noreductionin its faultdetectioneffec-tiveness.Thisobservationleadsusto believethattest casesthat do not add coverageto a testsetarelikely to beineffective in detectingadditionalfaults[14, page50].
2.3 Open questions
The WHLM study leavesa numberof openquestions.Many of thesequestionsconcerntheextentto which there-sultsobservedin thatstudygeneralizeto othertestingsitu-ations.Amongtheopenquestionsarethefollowing, whichmotivatethepresentwork.
1. How doesminimizationfarein termsof costsandben-efitswhentestsuiteshave a wider rangeof sizesthanthetestsuitesutilized in theWHLM study?
2. How doesminimizationfarein termsof costsandben-efitswhentestsuitesarecoverage-adequate?
3. How doesminimization fare in terms of costsandbenefitswhentestsuitescontainadditionalcoverage-redundanttestcases,includingmultiple testcasesthatexecuteequivalentexecutiontraces?
Testsuitesin practiceoften containtestcasesdesignednot for code coverage,but rather, designedto exerciseproductfeatures,specificationitems,or exceptionalbehav-iors. Suchtest suitesmay containlarger numbersof testcases,andlargernumbersof coverage-redundantandtrace-redundanttest cases,than those utilized in the WHLMstudy. It is importantto understandthe cost-benefittrade-offs involvedin minimizingsuchtestsuites.
3 The Experiment
3.1 Hypotheses
H1: Test suite minimization can produce savings oncoverage-adequate,coverage-redundanttestsuites.
H2: As the sizeof suchtestsuitesincreases,the savingsassociatedwith minimizing thosetestsuitesincreases.
H3: Testsuiteminimizationcancompromisethe fault de-tectioneffectivenessof coverage-adequate,coverage-redundanttestsuites.
H4: As the size of suchtest suitesincreases,the reduc-tion in fault-detectioneffectivenessassociatedwithtestsuiteminimizationincreases.
3.2 Measures
To investigateour hypotheseswe needto measurethecostsandsavingsof testsuiteminimization.
3.2.1 Measuring savings.
Testsuiteminimizationlets testersspendlesstime execut-ing testcases,examiningtestresults,andmanagingthedataassociatedwith testing. Thesesavings in time aredepen-denton theextentto which minimizationreducestestsuitesize. Thus,to measurethesavingsthatcanresultfrom testsuite minimization, we measurethe percentagereductionin testsuitesizeresultingfrom minimization,asgiven by( !" #" !�$&%(') !* +-,�.�. ).
This approachmakes several assumptions:it assumesthat all testcaseshave uniform costs,it doesnot differen-tiatebetweencomponentsof costsuchasCPUtime or hu-mantime,andit doesnotdirectlymeasurethecompoundingof savingsthatresultsfrom usingtheminimizedtestsuitesover a successionof subsequentreleases.This approach,however, hasthe advantageof simplicity, andusing it wecandraw severalconclusionsthatareindependentof theseassumptions.
3.2.2 Measuring costs.
Thereare two coststo considerwith respectto test suiteminimization.
Thefirst costis thecostof executingaminimizationtoolto producetheminimizedtestsuite.However, a minimiza-tion tool canberunfollowing thereleaseof aproduct,auto-maticallyandduringoff-peakhours,andunderthisprocessthecostof runningthe tool maybenoncritical. Moreover,having minimizeda testsuite, the costof minimizationisamortizedover theusesof thatsuiteonsubsequentproductreleases,andthusassumesprogressively lesssignificanceinrelationto othercosts.
The secondcost to consideris more significant. Testsuiteminimizationmaydiscardsometestcasesthat, if ex-ecuted,would reveal defectsin the software. Discardingthesetestcasesreducesthe fault detectioneffectivenessofthe testsuite. The costof this reducedeffectivenessmaybecompoundedratherthanamortizedover usesof the testsuiteon subsequentproductreleases,andtheeffectsof themissedfaultsmaybecritical. Thus,in this experiment,wefocusonthecostsassociatedwith discardingfault-revealingtestcases.
Weconsideredtwo methodsfor calculatingreductionsinfaultdetectioneffectiveness.
On a per-test-case basis: Oneway to measurethecostof minimizationin termsof effectson faultdetection,givenfaulty program / and test suite 0 , is to identify the testcasesin 0 thatreveala fault in / but arenot in 0�132(4 . This

quantitycanbenormalizedby thenumberof fault-revealingtest casesin 5 . One problemwith this approachis thatmultiple test casesmay reveal a given fault. In this casesometestcasescouldbediscardedwithout reducingeffec-tiveness;thismeasurepenalizessuchadecision.
On a per-test-suite basis: Anotherapproachis to clas-sify theresultsof testsuiteminimization,relativeto agivenfaultin 6 , in oneof threeways:(1) notestcasein 5 is fault-revealing,and,thus,no testcasein 5�798;: is fault-revealing;(2) sometestcasein both 5 and 5<738;: is fault-revealing;or(3) sometestcasein 5 is fault-revealing,but no testcasein5<738;: is fault-revealing.Case1 denotessituationsin which5 is inadequate.Case2 indicatesauseof minimizationthatdoesnot reducefault detection,andCase3 capturessitua-tionsin whichminimizationcompromisesfaultdetection.
For this experimentwe baseour measurementsof coston thesecondapproach.For eachprogram,ourmeasureofreducedeffectivenessis thepercentageof faultsfor which5<738;: containsnofault-revealingtestcases,but 5 doescon-tainfault-revealingtestcases.Moreprecisely, if = >?= denotesthenumberof faultsrevealedby 5 over thefaulty versionsof program6 , and = > 798;: = denotesthenumberof faultsre-vealedby 5 738;: over thoseversions,thepercentagereduc-tion in fault-detectioneffectivenessof minimizationfor 6 ,5 , and 5 738(: is givenby ( @ AB@ C"@ A�D�EGF)@@ AH@
I-JK�K ).Notethatthismethodof measuringthecostof minimiza-
tion calculatescostrelative to a fixedsetof faults.This ap-proachalsoassumesthatmissedfaultshaveequalcosts,anassumptionthattypically doesnothold in practice.
3.3 Experimental instrumentation
3.3.1 Programs.
We usedsevenC programsassubjects(seeTable1). Eachprogramhasavarietyof versions,eachcontainingonefault.Eachprogramalsohasalargeuniverseof inputs.Thesepro-grams,versions,andinputswereassembledby researchersat SiemensCorporateResearchfor a study of the fault-detectioncapabilitiesof control-flow anddata-flow cover-agecriteria [9]. We describethe otherdatain the tableinthefollowing paragraphs.
3.3.2 Faulty versions, test cases, and test suites.
The researchersat Siemenssought to study the fault-detectingeffectivenessof coveragecriteria.Therefore,theycreatedfaultyversionsof thesevenbaseprogramsby man-ually seedingthoseprogramswith faults,usuallyby mod-ifying a singleline of codein theprogram.In a few casesthey modifiedbetweentwo and five lines of code. Theirgoalwasto introducefaultsthatwereasrealisticaspossi-ble,basedontheirexperiencewith realprograms.Tenpeo-ple performedthe fault seeding,working “mostly without
Lines No. of TestPoolProgram of Code Versions Size Descriptiontotinfo 346 23 1052 informationmeasureschedule1 299 9 2650 priority schedulerschedule2 297 10 2710 priority schedulertcas 138 41 1608 altitudeseparationprinttok1 402 7 4130 lexical analyzerprinttok2 483 10 4115 lexical analyzerreplace 516 32 5542 patternreplacement
Table 1. Experimentalsubjects.
knowledgeof eachother’swork” [9, p. 196].For eachbaseprogram,the researchersat Siemenscre-
ateda large testpool containingpossibletestcasesfor theprogram.To populatethesetestpools,they first createdaninitial setof black-boxtestcases“accordingto goodtest-ing practices,basedon the tester’s understandingof theprogram’s functionality and knowledgeof specialvaluesandboundarypointsthatareeasilyobservablein thecode”[9, p. 194], using the category partition methodand theSiemensTest SpecificationLanguagetool [1, 11]. Theythen augmentedthis set with manually-createdwhite-boxtest casesto ensurethat eachexecutablestatement,edge,and definition-usepair in the baseprogramor its controlflow graphwasexercisedby at least30 testcases.To ob-tain meaningfulresultswith theseededversionsof thepro-grams,the researchersretainedonly faultsthat were“nei-thertooeasynor toohardto detect”[9, p. 196],which theydefinedasbeingdetectableby at leastthreeandatmost350testcasesin thetestpoolassociatedwith eachprogram.
Figure1 showsthesensitivity to detectionof thefaultsintheSiemensversionsrelativeto thetestpools;theboxplotsLillustrate that the sensitivities of the faults vary withinand betweenversions,but overall fall between.05% and19.77%.Therefore,all of thesefaultswere,in theterminol-ogyof theWHLM study, “QuadrantI” faults,detectablebyfewer than25%of thetestpool inputs.
To investigateour hypotheseswe required coverage-adequatetest suitesthat exhibit redundancy in coverage,andwe requiredthesein a rangeof sizes.As anadequacycriteriawechoseedgecoverage: acoveragecriteriasimilarto decisioncoveragebut definedoncontrolflow graphs.M
NA boxplot is a standardstatisticaldevice for representingdatasets
[10]. In theseplots, eachdataset’s distribution is representedby a box.Thebox’s heightspansthecentral50%of thedataandits upperandlowerendsmarktheupperandlowerquartiles.Themiddleof thethreehorizontallineswithin the box representsthemedian.Thevertical linesattachedtothebox indicatethetailsof thedistribution.O
A testsuite P is edge-coverage adequatefor programQ iff, for eachedge R in eachcontrol flow graphfor someprocedurein Q , if R is dy-namicallyexercisable,thenthereexists at leastonetestcaseSUTVP thatexercisesR . A testcaseS exercisesanedgeR9WYX(Z\[^]_Z Na` in controlflowgraph b iff S causesexecutionof the statementassociatedwith Zc[ , fol-lowedimmediatelyby thestatementassociatedwith Z N .

20
18
16
14
12
10
8
6
4
2
printtok2 replace
perc
enta
ge o
f te
sts
that
rev
eal f
ault
s
subject program
totinfo schedule1 schedule2 tcas printtok1
Figure 1. Boxplotsthatshow, for eachof thesevenpro-grams,thedistribution,overtheversionsof thatprogram,ofthepercentagesof inputsin the testpoolsfor the programthatexposefaultsin thatversion.
We usedtheSiemenstestpoolsto obtainedge-coverageadequatetest suitesfor eachsubjectprogram. Our testsuitesconsistof a varying numberof test casesselectedrandomlyfrom the associatedtestpool, togetherwith anyadditionaltestcasesrequiredto achieve 100%coverageofcoverableedges.d We madenoattemptto avoid addingtestcasesthatachieveequivalentexecutiontracesto testsuites;thus,multiple testcasesin thetestsuitefor a programmaytraversethe samepathsthroughthat program. However,we did not add any particular test caseto any particulartestsuitemorethanonce. To ensurethat thesetestsuiteswould possessvaryingrangesof coverageredundancy, werandomlyvariedthenumberof randomlyselectedtestcasesoversizesrangingfrom 0 to .5 timesthenumberof linesofcodein the program. Altogether, we generated1000 testsuitesfor eachprogram.
Figure 2 provides a view of the rangeof sizesof testsuitescreatedby the processjust described.The boxplotsillustratethatfor eachsubjectprogram,our testsuitegener-ationprocedureyieldedauniverseof testsuitesof sizesthatare relatively evenly distributed acrossthe rangeof sizesutilized for thatprogram.
Analysisof thefault-detectioneffectivenessof thesetestsuitesshows that, except for eight of the test suitesforschedule2, every testsuiterevealedat leastonefault inthesetof faulty versionsof theassociatedprogram.Thus,althougheachfault individually is difficult to detectrelativeto theentiretestpool for theprogram,almostall (99.9%)ofthe testsuitesutilized in thestudypossessedat leastsomefault-detectioneffectivenessrelativeto thesetof faultypro-gramsutilized.
eTo randomly select test casesfrom the test pools, we usedthe C
pseudo-random-numbergenerator“rand”, seededinitially with theoutputof the C “time” systemcall, to obtainan integer which we treatedasanindex f into thetestpool (modulothesizeof thatpool).
subject program
size
of
test
sui
te
120
150
180
210
240
30
60
90
270
tcastotinfo schedule1 schedule2 printtok1 printtok2 replace
Figure 2. Boxplotsthatshow, for eachof thesevenpro-grams,the distribution of sizesamongstthe unminimizedtestsuitesfor thatprogram.
3.3.3 Test suite minimization tools.
To performthe experiments,we requireda testsuitemin-imization tool. We implementedthealgorithmof Harrold,GuptaandSoffa [7] within the Aristotle programanalysissystem[6].
3.4 Experimental design
3.4.1 Variables.
Theexperimentmanipulatedtwo independentvariables:
1. Thesubjectprogram(7 programs,eachwith a varietyof faultyversions).
2. Test suite size (between0 and .5 times lines-of-codetestcasesrandomlyselectedfrom the testpool,togetherwith additional test casesas necessarytoachieve100%coverageof coverableedges).
We measuredthreedependentvariables:
1. For eachprogramg andtestsuite h , wemeasuredthesizeof theminimizedversionof thatsuite, h�i3j(k .
2. On eachrun, with program g , faulty version gml , andtestsuiteh , whetheroneormoretestcasesin h revealsthefault in gml .
3. On eachrun, with program g , faulty version gml , andtestsuiteh�i3j;k , whetheroneor moretestcasesin h�i3j;krevealsthefault in gml .
3.4.2 Design.
This experimentusesa full-f actorialdesignwith 1000re-peatedmeasures.Thatis, for eachsubjectprogram,wecre-ated1000edge-coverage-adequatetestsuitesfrom the test
pools.For eachtestsuite,wethenappliedtheminimizationtechniqueandevaluatedthefault detectioneffectivenessoftheoriginalandminimizedtestsuites.
3.4.3 Threats to validity.
In this sectionwe discusssomeof the potentialthreatstothevalidity of ourstudies.
Threatsto internal validity are influencesthat can af-fectthedependentvariableswithouttheresearcher’sknowl-edge,andthat thusaffect any suppositionof a causalrela-tionship betweenthe phenomenaunderlyingthe indepen-dent and dependentvariables. In this study, our greatestconcernsfor internalvalidity involvethefactthatwedonotcontrol for thestructureof thesubjectprogramsor for thelocality of programchanges,andthat we utilize only onetypeof testsuite. To limit problemsrelatedto this, we runour testsuiteminimizationalgorithmoneachtestsuiteandeachsubjectprogram.
Threatsto externalvalidity areconditionsthat limit ourability to generalizeour results. The primary threatstoexternalvalidity for this studyconcernthe representative-nessof the artifactsutilized. First, the subjectprograms,thoughnontrivial, aresmall, and larger programsmay besubjectto differentcost-benefittradeoffs. Also, thereis ex-actlyoneseededfault in everysubjectprogram;in practice,programshave much more complex error patterns. Fur-thermore,the faults were all deliberatelychosen(by theSiemensresearchers)to be faultsthatwereneithertoo dif-ficult nor too easyto detect.Finally, the testsuiteswe uti-lized representonly onetypeof testsuitethatcouldappearin practice,if a mix of non-coverage-basedandcoverage-basedtestingwerebeingutilized. Thesethreatscanonly beaddressedby additionalstudies,utilizing a greaterrangeofartifacts.
Threatsto constructvalidity arisewhenmeasurementin-strumentsdo not adequatelycapturethe conceptsthey aresupposedto measure.For example,in this experimentourmeasuresof cost and effectivenessare very coarse: theytreatall faultsasequallysevere,andall testcasesasequallyexpensive.
4 Data and Analysis
Our analysisstrategy hasthreesteps.First, we summa-rize thedataon testsuitesizereductionandfault-detectioneffectivenessreduction.Thenwe compareour resultswiththeresultsof theWHLM study, anddiscussfactorsthatmayberesponsiblefor differencesbetweentheresults.Finally,in Section5, wesummarizeourresultsandmakeadditionalobservations.
subject program
printtok1 printtok2 replace
size
of
test
sui
te
120
150
180
210
240
30
60
90
270
totinfo schedule1 schedule2 tcas
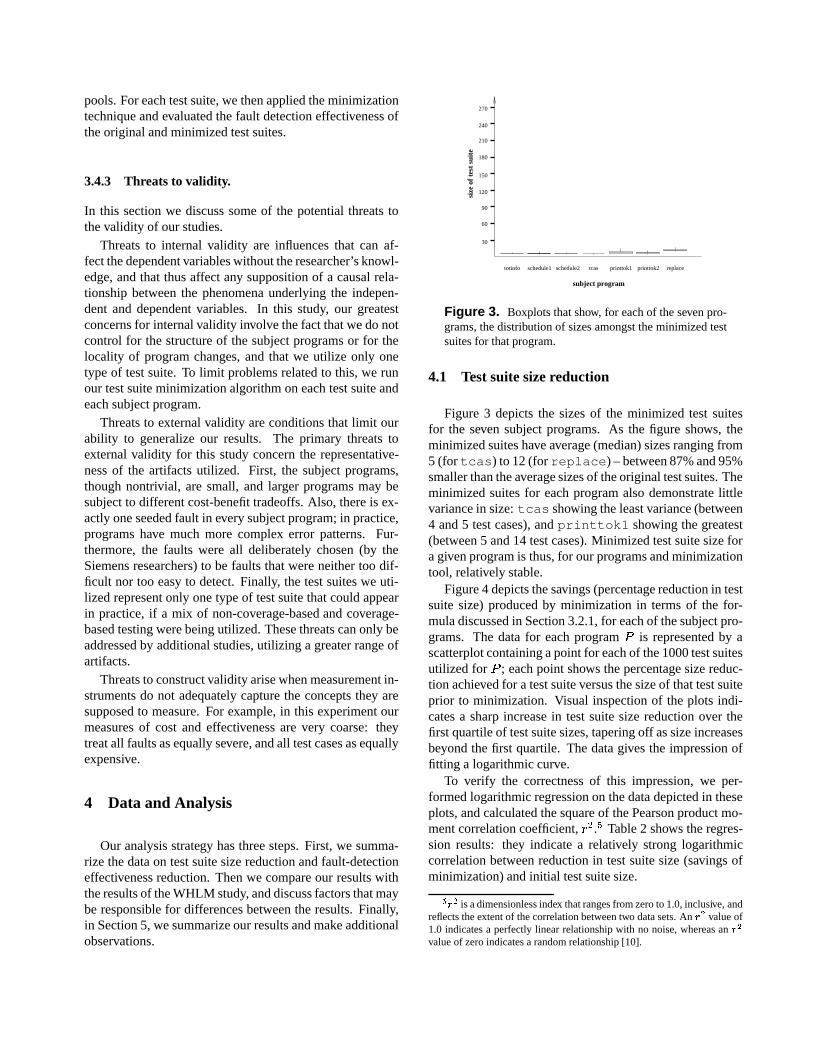
Figure 3. Boxplotsthatshow, for eachof thesevenpro-grams,thedistributionof sizesamongsttheminimizedtestsuitesfor thatprogram.
4.1 Test suite size reduction
Figure 3 depictsthe sizesof the minimized test suitesfor the seven subjectprograms. As the figure shows, theminimizedsuiteshaveaverage(median)sizesrangingfrom5 (for tcas) to12(for replace) – between87%and95%smallerthantheaveragesizesof theoriginaltestsuites.Theminimizedsuitesfor eachprogramalsodemonstratelittlevariancein size:tcas showing theleastvariance(between4 and5 testcases),andprinttok1 showing thegreatest(between5 and14 testcases).Minimized testsuitesizeforagivenprogramis thus,for ourprogramsandminimizationtool, relatively stable.
Figure4 depictsthesavings(percentagereductionin testsuite size) producedby minimization in termsof the for-muladiscussedin Section3.2.1,for eachof thesubjectpro-grams. The datafor eachprogram n is representedby ascatterplotcontainingapointfor eachof the1000testsuitesutilized for n ; eachpoint shows thepercentagesizereduc-tion achievedfor a testsuiteversusthesizeof thattestsuiteprior to minimization. Visual inspectionof the plots indi-catesa sharpincreasein testsuitesizereductionover thefirst quartileof testsuitesizes,taperingoff assizeincreasesbeyondthefirst quartile. Thedatagivesthe impressionoffitting a logarithmiccurve.
To verify the correctnessof this impression,we per-formedlogarithmicregressionon thedatadepictedin theseplots,andcalculatedthesquareof thePearsonproductmo-mentcorrelationcoefficient, o�p . q Table2 shows theregres-sion results: they indicatea relatively stronglogarithmiccorrelationbetweenreductionin testsuitesize(savingsofminimization)andinitial testsuitesize.ras�t
is adimensionlessindex thatrangesfrom zeroto 1.0,inclusive,andreflectstheextentof thecorrelationbetweentwo datasets.An
s tvalueof
1.0 indicatesa perfectlylinear relationshipwith no noise,whereasans t
valueof zeroindicatesa randomrelationship[10].

0
20
40
60
80
100
0 50 100 150 200 250
printtok2
0
20
40
60
80
100
0 50 100 150 200 250
replace
0
20
40
60
80
100
0 50 100 150 200
printtok1
0
20
40
60
80
100
0 10 20 30 40 50 60 70
tcas
0
20
40
60
80
100
0 20 40 60 80 100 120 140 160
schedule2
0
20
40
60
80
100
0 20 40 60 80 100 120 140 160
schedule1
0
20
40
60
80
100
0 20 40 60 80 100 120 140 160 180
totinfo
Figure 4. Percentagereductionin testsuitesizeasa resultof minimization,versussizesof initial testsuites.Horizontalaxesdenotethesizeof theinitial testsuites,andverticalaxesdenotethepercentagereductionin testsuitesize.
program regressionequation u�vtotinfo wyx{z}|�~ �������&��������|��~ |�z 0.75schedule1 wyx{z^��~ |�����&������������~ �� 0.80schedule2 wyx{z^��~ �����&�����������~�z^� 0.80tcas wyx�����~ |�z}���&�����&��|�~ ��� 0.88printtok1 wyx{z^��~ �����&��������|�z�~ ��� 0.80printtok2 wyx{z^��~�z�z}���&��������|���~ ��� 0.78replace wyx{z}��~ �|���&����������~ ��� 0.85
Table 2. Correlationbetweentestsuitesizereductionandsizeof initial testsuite.
Our experimentalresultssupportour hypothesis(H1)that test suite minimization can producesavings in testsuite size on coverage-adequate,coverage-redundanttestsuites. The resultsalso supportour hypothesis(H2) thatas test suite size increases,the savings producedby testsuiteminimizationincrease.Analysisof thedatasuggeststhattheincreasein savingsis logarithmicin theincreaseintestsuitesize. The savings increaseat a rapid rateacross(approximately)the first quartile of test suite sizes— arangethat correspondsin our study to test suite sizesofup to one-eighththenumberof statementsin theprogram.Significantly, theseresultsare relatively consistentacrossthesevensubjectprograms,despitethedifferencesin size,structure,andfunctionalityamongthoseprograms.
4.2 Fault detection effectiveness reduction
Figure5 depictsthecost(reductionin faultdetectionef-fectiveness)incurredby minimization,in termsof the for-
muladiscussedin Section3.2.2,for eachof thesevensub-ject programs.Thedatafor eachprogram� is representedby a scatterplotcontaininga point for eachof the1000testsuitesutilized for � ; eachpoint shows the percentagere-ductionin fault detectioneffectivenessobserved for a testsuiteversusthesizeof thattestsuiteprior to minimization.
The scatterplotsshow that the fault detectioneffective-nessof test suitescanbe severely compromisedby mini-mization. For example,on replace, the largestof thesubjectprograms,minimizationreducesfault-detectionef-fectivenessby over50%for morethanhalf of thetestsuitesconsidered.Also, althoughin a small percentageof casesminimizationdoesnot reducefault-detectioneffectiveness(e.g.,onprinttok1), therearemany casesin whichmin-imization reducesthe fault-detectioneffectivenessof testsuitesby 100%(e.g.,onschedule2).
Visual inspectionof theplotssuggeststhat reductioninfault detectioneffectivenessslightly increasesastestsuitesizeincreases.Testsuitesin thesmallestsizerangesdopro-duceeffectivenesslossesof lessthan50%morefrequentlythanthey producelossesin excessof 50%,a situationnottrue of the larger testsuites. Even the smallesttestcases,however, exhibit effectivenessreductionsin mostcases:forexample,on replace, test suitescontainingfewer than50 testcasesexhibit an averageeffectivenessreductionofnearly40%,andfew suchsuitesdonot loseeffectiveness.
Theseresultssupportour hypothesis(H3) that testsuiteminimizationcancompromisethefault-detectioneffective-nessof coverage-adequate,coverage-redundanttestsuites.However, the results only weakly support our hypothe-sis (H4) that as test suite size increases,the reductionin

0
20
40
60
80
100
0 10 20 30 40 50 60 70
tcas
0
20
40
60
80
100
0 50 100 150 200
printtok1
0
20
40
60
80
100
0 50 100 150 200 250
printtok2
0
20
40
60
80
100
0 50 100 150 200 250
replace
0
20
40
60
80
100
0 20 40 60 80 100 120 140 160
schedule2
0
20
40
60
80
100
0 20 40 60 80 100 120 140 160
schedule1
0
20
40
60
80
100
0 20 40 60 80 100 120 140 160 180
totinfo
Figure 5. Percentagereductionin fault-detectioneffectivenessasaresultof minimization,versussizesof initial testsuites.Hori-zontalaxesdenotethesizeof theinitial testsuites,andverticalaxesdenotethepercentagereductionin fault-detectioneffectiveness.
thefault-detectioneffectivenessof thosetestsuiteswill in-crease.
In contrastto thescatterplotsshowing sizereductionef-fectiveness,the scatterplotsshowing reductionin fault de-tection effectivenessdo not give a strong impressionofcloselyfitting any curveor line: thedatais muchmorescat-teredthanthedatafor testsuitesizereduction.Ourattemptsto fit linear, logarithmic,andquadraticregressioncurvestothe datavalidatethis impression: the datain Table 3 re-vealslittle linear, logarithmic,or quadraticcorrelationbe-tweenreductionin fault detectioneffectivenessandinitialtestsuitesize.
One additional featureof the scatterplotsof Figure 5bearsmentioning: on several of the graphs, there aremarkedly visible “horizontal lines” of points. In thegraphfor printtok1, for example,thereareparticularlystronghorizontallines at 0%, 20%,25%,33%,40%,50%,60%,and67%. Suchlines indicatea tendency for minimizationto excludeparticularpercentagesof faultsfor theprogramsonwhich they occur.
This tendency is partially explainedby our useof a dis-cretenumberof faultsin eachsubjectprogram.Givenatestsuite that exposesk faults, minimizationcan excludetestcasesthat detectbetween0 andk of thesefaults,yieldingdiscretepercentagesof reductionsin fault-detectioneffec-tiveness.For printtok1, for example,thereare sevenfaults,of which theunminimizedtestsuitesmayrevealbe-tweenzeroandseven.Whenminimizationis appliedto thetest suitesfor printtok1, only 19 distinct percentagesof fault detectioneffectivenessreductioncanoccur:100%,
86%,83%,80%,75%,71%,67%,60%,57%,50%,43%,40%,33%,29%,25%,20%,17%,14%,and0%. Eachofthesepercentagesexcept29% and100%is evident in thescatterplotfor printtok1. With all pointsoccurringonthese16percentages,theappearanceof linesin thegraphisunsurprising.
It follows thatasthenumberof faultsutilized for a pro-gramincreases,thepresenceof horizontallinesshouldde-crease;this is easilyverifiedby inspectingthegraphs,con-sideringin turn printtok1 with 7 faults,schedule1with 9, schedule2 with 10, printtok2 with 10,totinfo with 23,replace with 32,andtcas with 41.
This explanation,however, is only partial: if it werecomplete, we would expect points to lie more equallyamongthevariousreductionpercentages(with allowancesfor thefactthattheremaybemultiplewaysto achievepar-ticularreductionpercentages).Thefactthattheoccurrencesof reductionpercentagesare not thus distributed reflects,we believe,variancein fault locationsacrosstheprograms,coupledwith variancein test coveragepatternsof faultystatements.
4.3 Comparison to previous empirical results
Both the WHLM study and our study supportour hy-pothesesH1 andH2, that testsuiteminimizationcanpro-ducesavings (in test suite size reduction),and that thesesavingsincreasewith testsuitesize.Both studiesalsosup-port, to somedegree, hypothesisH4, that reductionsinfault-detectioneffectivenessincreaseas test suite size (or

program regressionline 1 ��� regressionline 2 ��� regressionline 3 ���totinfo �-������ � a¡£¢¥¤¦�� §�§ 0.11 �£�©¨�� §�¨�ª&«&¬�¡�<¢®¤�� ¯�� 0.16 �£�±°B��� ���¤�¡ � ¢¥��� ²�³�¡£¢´ ^¦�� ��µ 0.16schedule1 �-������ �³�¡£¢¶µ�¨�� ¦�¤ 0.12 �£�± ^��� ��µ�ª&«&¬�¡�<¢·¦�� ¤³ 0.15 �£�±°B��� ���¤�¡ � ¢¥��� ²�¯�¡£¢¥¤¦�� ¨�� 0.15schedule2 �-����� ¤¨�¡£¢¶µ²�� ¨�§ 0.16 �£�± �¯�� ¯��ª&«&¬�¡�<¢¸ �¯��G ^¤ 0.20 �£�±°B��� ��²�¡ � ¢¥��� ¨�¦�¡£¢´ �¯�� ��¯ 0.21tcas �-����� §�¨�¡£¢¶µ²�� ¨�¦ 0.38 �£��¤�¤��� ^¨�ª&«&¬�¡��°� ^§�� ¤�µ 0.47 �£�±°B��� ��¤�¡ � ¢�¤��� ^¨�¡£¢´ ^µ�� ²� 0.46printtok1 �-������ ^§�¡£¢¥¤�¤�� ²�¨ 0.18 �£�± }²�� §�¨�ª&«&¬�¡�<¢�¤§�� µ�² 0.20 �£�±°B��� ��� }¡ � ¢¥��� ²�²¡£¢´ ^��� ¦² 0.20printtok2 �-����� ��¯�¡£¢´ �¤�� ²�² 0.11 �£�©§�� ¦� ^ª&«&¬�¡�<¢¸ � �G }µ 0.14 �£�±°B��� ��� }¡ � ¢¶���� ^¦�¡m¢·§�� ¨�² 0.13replace �-������ � a¡£¢¹²�¤�� §�¯ 0.20 �£�± ^µ�� ��¯ª&«&¬�¡�<¢�²�� ¨�¤ 0.26 �£�±°B��� ��� }¡ � ¢¥��� ²� a¡£¢¥¤§�� ¯¦ 0.28
Table 3. Correlationbetweenreductionin faultdetectioneffectivenessandsizeof initial testsuite.
in thecaseof theWHLM study, aspercentageof blockcov-erageachievedby testsuites)increases.
The two studiesdiffer substantially, however, with re-spectto hypothesisH3. The authorsof the WHLM studyconcludethat, for the programsand test casesthey stud-ied: (1) testsuitesthat do not addcoveragearenot likelyto detectadditionalfaults,and(2) effectivenessreductionisinsignificanteven for testsuitesthat have high block cov-erage.Thisconclusioncontrastsmarkedlywith our results,andwewould like to know thecausesof thisdifference.
A preciseanswerto thisquestionis outsideof thescopeof this work, asit requiresa controlledcomparative study.We suggestseveralpotentialcauses.
The subjectprogramsutilized by the two studiesdif-fered,andall but oneof our programswerelarger thanallbut oneof theWHLM programs.However, all subjectpro-gramscontainedfewer than1000linesof code.
The WHLM study used ATAC for minimization,whereasour studyutilized the algorithmof Reference[7].Reference[14] reportsthat the ATAC approachachievedminimal testselectionon thecasesstudied;wehavenotyetdeterminedwhetherour algorithmwasequallysuccessful.However, if our algorithmis lesssuccessfulthanthealgo-rithm usedin the WHLM study, we would expect this tocauseusto understatepossiblereductionsin faultdetectioneffectiveness.
Althoughbothstudiesutilized seededfaultsthatmaybeaccuratelydescribedas“mutation-like”, all of thefaultsuti-lized in ourstudywereQuartileI faults,whereasonly 41%of thefaultsusedin theWHLM studywereQuartileI faults.Easilydetectedfaultsarelesslikely to go unrecognizedinminimizedtestsuitesthanfaults that aremoredifficult todetect;thus,we would expectour resultsoverall to showgreaterreductionsin fault-detectioneffectivenessthantheWHLM study. However, the authorsof the WHLM studydid separatelyreportresultsfor QuartileI faults,andin theirstudy, minimizedtestsuitesmissedfew of thesefaults.
A morelikely causeof differencesstemsfrom the factthatin theWHLM study, testsuiteswereminimizedfor all-usescoverage,whereasour studyminimizedfor all-edgescoverage. All-usescoveragerequiresmore testcasesand
greatercodecoverageoverall thanall-edgescoverage.Theauthorsof the WHLM study suggestthat, had they mini-mized with respectto block coverage,“both the size andeffectivenessreductionsof the minimized test setswouldhave beensubstantiallygreaterthanfor minimizationwithrespectto all-usescoverage”[14, page43].
In our opinion, the factorlikely to be mostresponsiblefor differencesin resultsin the two studiesinvolves thetypesof test suitesutilized. The WHLM study usedtestsuitesthat werenot coverage-adequate,andthat wererel-atively small comparedto our testsuites. Overall, 933 ofthe 1022testsuitesutilized in the WHLM studybelongedto groupsof testcaseswhoseaveragesizesdid not exceed7 testcases.Smalltestsuitesizereducesopportunitiesbothfor minimization,andfor reductionin fault-detectioneffec-tiveness.Furtherdifferencesin testsuitesstemfromthefactthat the testpoolsusedin theWHLM studyassourcesfortestsuitesdidnotcontaintrace-redundanttestcases,anddidnot necessarilycontainany minimumnumberof testcasesper covereditem. Thesedifferencesmay contribute to re-ducedredundancy in test coveragewithin test suites,andreducethe likelihoodthatminimizationwill excludefault-revealingtestcases.
Furtherunderstandingof thefactorsthatcausedthedif-ferencesin the resultsof the two studieswould be useful;we leave this for futurework.
5 Summary and Conclusions
As we discussedearlier, this experiment,like any other,hasseveral limits to its validity. In particular, theselimitsincludeseveralthreatstoexternalvalidity thatlimit ourabil-ity to generalizeour results;thesethreatscanbeaddressedonly by additionalexperimentationwith a wider varietyofprograms,faults,andtestsuites.Keepingthis in mind, wedraw thefollowing conclusions.
Our resultsstronglysupportour first threehypotheses:given testsuitesthat arecoverage-adequateandcoverage-redundant,test suite minimizationcan provide significantsavingsin testsuitesize.Thesesavingscanincreaseasthesizeof the original testsuitesincreases,andthesesavings

are relatively highly correlated(logarithmically)with testsuitesize. However, minimizationcan significantlycom-promisethefault-detectionabilitiesof suchtestsuites,evenwhenthetestsuitesarenotparticularlylarge.
Our resultsonly marginally supportour fourth hypothe-sis:degreeof reductionin faultdetectioneffectivenessdoesnotmarkedly increaseastestsuitesizeincreases.More im-portantly, we did not observe a closecorrelationbetweenfault detectioneffectivenessand test suite size. Conceiv-ably, thepresenceof discretenumbersof faultsin ourexper-imentalsubjectsmayhave influencedthis result: givenaneffectively infinite (or at leastsignificantlylarger) numberof faultsour resultsmight have differed. Nevertheless,theresultssupportan hypothesisthat somefactorsother thantestsuitesizeplay a significantrole in lossof fault detec-tion effectiveness.
A comparisonof our resultswith thoseof the WHLMstudyrevealssimilarities in all but one importantrespect:the two studiesdiffer substantiallyin termsof thecostsinfault-detectioneffectivenessthat they attribute to testsuiteminimization. We have suggestedseveralpossiblereasonsfor this difference,andwe arepursuingfurther studiestoinvestigatetheissuein greaterdepth.In particular, we willsoonrepeatour studyusingminimizationfor all-usescov-erage.
Finally, of particularsignificanceto testingpractitionersis thefactthatour resultsdemonstrateno clearcost-benefittradeoffs associatedwith theuseof testsuiteminimization.In our study, as testsuitesize increased,the savings pro-videdby minimizationincreased,but regardlessof thelevelof savings provided, potentiallossesin fault-detectionef-fectivenessvariedwidely. This is unfortunate,becauseastesters,we prefersituationsin which the risks inherentinour testingprocessesrelatemeasurablyto theeffort we putinto thoseprocesses;in suchcaseswe can balancethoserisksagainstthecostsof ourefforts. Thus,wewouldpreferthat the risks inherentin reducingtestsuitesizebe relatedto to the potentialfor savings resultingfrom reducingtestsuitesize.Theresultsof thisstudysuggestthatsucha rela-tionshipmaynothold.
Given this fact, and the suggestionthat some factorother thantestsuitesize influencesthe reductionin fault-detectioneffectivenessthatattendsminimization,apossibleconclusionis thatwe maynot want to minimizetestsuitesstrictly in termsof codecoverage. Alternative minimiza-tion strategies,whosecost-benefittradeoffs aremoreclear,couldbebeneficial.
6 Acknowledgements
This work was supportedin part by grantsfrom Mi-crosoft,Inc. to OhioStateUniversityandOregonStateUni-versity, by NationalScienceFoundationFacultyEarly Ca-
reer DevelopmentAward CCR-9703108to Oregon StateUniversity, by National ScienceFoundationAward CCR-9707792to OhioStateUniversityandOregonStateUniver-sity, andby NationalScienceFoundationNationalYoungInvestigatorAwardCCR-9696157to OhioStateUniversity.SiemensCorporateResearchsuppliedthesubjectprograms.JimJonesandKarenRothermelassistedwith thestatisticalanalysis.
References
[1] M. Balcer, W. Hasling,andT. Ostrand.Automaticgenera-tion of testscriptsfromformaltestspecifications.In Proc.ofthe3rd Symp.on Softw. Testing, Analysis,andVerification,pages210–218,Dec.1989.
[2] T. ChenandM. Lau.Dividingstrategiesfor theoptimizationof a testsuite. InformationProcessingLetters, 60(3):135–141,Mar. 1996.
[3] P. FranklandS.Weiss.An experimentalcomparisonof theeffectivenessof branchtestinganddataflow testing. IEEETrans.onSoftw. Eng., 19(8):774–787,Aug. 1993.
[4] M. Garey and D. Johnson. Computers and Intractability.W.H. Freeman,New York, 1979.
[5] T. Graves,M. Harrold,J.-M.Kim, A. Porter, andG. Rother-mel. An empiricalstudyof regressiontestselectiontech-niques.In The20thInt’l. Conf. onSoftw. Eng., Apr. 1998.
[6] M. HarroldandG. Rothermel.Aristotle: A systemfor re-searchonanddevelopmentof programanalysisbasedtools.TechnicalReportOSU-CISRC-3/97-TR17,The Ohio StateUniversity, Mar 1997.
[7] M. J. Harrold,R. Gupta,andM. L. Soffa. A methodologyfor controllingthesizeof a testsuite.ACM Trans.onSoftw.Eng. andMethodology, 2(3):270–285,July 1993.
[8] J.HorganandS.London.ATAC: A dataflow coveragetest-ing tool for C. In Proc.of theSymp.onAssessmentof Qual-ity Softw. Dev. Tools, pages2–10,May 1992.
[9] M. Hutchins,H. Foster, T. Goradia,and T. Ostrand. Ex-perimentsontheeffectivenessof dataflow- andcontrolflow-basedtestadequacy criteria. In Proc.of the16thInt’l. Conf.onSoftw. Eng., pages191–200,May 1994.
[10] R.Johnson.ElementaryStatistics. Duxbury Press,Belmont,CA, sixthedition,1992.
[11] T. OstrandandM. Balcer. The category-partitionmethodfor specifyingandgeneratingfunctionaltests.Comm.of theACM, 31(6),June1988.
[12] G. RothermelandM. Harrold.Analyzingregressiontestse-lectiontechniques.IEEE Trans.on Softw. Eng., 22(8):529–551,Aug. 1996.
[13] W. E.Wong,J.R.Horgan,S.London,andA. P. Mathur. Ef-fectof testsetsizeandblockcoverageonthefaultdetectioneffectiveness.In Proc.of theFifth Intl. Symp.on Softw. Rel.Engr., pages230–238,Nov. 1994.
[14] W. E.Wong,J.R.Horgan,S.London,andA. P. Mathur. Ef-fectof testsetminimizationonfaultdetectioneffectiveness.In 17thInt’l. Conf. on Softw. Eng., pages41–50,Apr. 1995.