An embodied carbon and embodied energy appraisal of a section of Irish motorway constructed in...
18
An embodied carbon and embodied energy appraisal of a section of Irish motorway constructed in peatlands Alan R. Duggan a , Bryan A. McCabe a,b,⇑ , Jamie Goggins a,b , Eoghan Clifford a,b a College of Engineering and Informatics, National University of Ireland, Galway, Ireland b Ryan Institute, National University of Ireland, Galway, Ireland highlights A novel life cycle assessment methodology for road construction is presented. This determines the environmental impact in areas of highly organic soils. This was applied to an Irish case study where excavate-and-replace was used for peat. In the case study, the biggest embodied carbon (EC) component was excavated peat. Alternative ground improvement scenarios of soil-mixing and piling were examined. article info Article history: Received 7 June 2013 Received in revised form 17 November 2014 Accepted 7 December 2014 Keywords: Road construction Embodied carbon Embodied energy Peat excavate-and-replace Dry soil-mixing Piling Restoration techniques Binder abstract In addition to the customary drivers of cost and timely project delivery, embodied energy (EE) and embodied carbon (EC) have come to prominence in recent years as major design considerations in all aspects of large-scale road construction projects. An assessment of road construction necessitating the excavation or alteration of peat should consider the impact on carbon stored within the peat and the greenhouse gases potentially released. A methodology for calculating the environmental impact of con- structing roads on peat is presented in this paper. Furthermore, the paper describes the application of this methodology (focusing on EE and EC calculations) to a case study; a section of the M6 motorway in Ire- land for which excavate-and-replace was the ground improvement method (Scenario ER). A range of peat-related factors impacting on EE and EC estimates were examined, including materials, transport and machinery, as well as more unfamiliar factors such as peat drainage, drainage systems, restoration, slope stability and clearance of vegetation/forest. Comparisons of total EC are investigated under various management practices and restoration techniques for peatlands, assessing their strength in terms of hydrology and carbon storage potential. The total EC and EE for road construction to the sub-base level (and implications thereof) of the 2.14 km section of the M6 discussed in this paper was 17,220 tCO 2 eq (8047 tCO 2 eq/km) and 54,541 GJ (25,487 GJ/km), respectively, with carbon loss from excavated peat accounting for 62% of the total EC. Two other ground improvement method scenarios for constructing this section of road were also considered: Scenario S, soil-mixing and Scenario ER + P, an appropriate combination of excavate-and-replace and piling. Scenario S gave rise to a total EC of 25,306 tCO 2 eq (11,825 tCO 2 eq/km) and a total EE of 164,364 GJ (76,806 GJ/km) while Scenario ER + P gave rise to a total EC of 17,048 tCO 2 eq (7966 tCO 2 eq/km) and a total EE of 92,706 GJ (43,320 GJ/km). In this study, Scenario ER was the preferred technique as it had EC comparable to Scenario ER + P and the lowest EE. On the other hand, Scenario S was the least favourable due to the high EC and EE of the binder. However, this paper shows that the EC and EE can be decreased dramatically by changing the binder proportions. Further- more, the EC of Scenarios ER and ER + P can also be significantly reduced if alternative restoration tech- niques are employed for excavated peat. Ó 2014 Elsevier Ltd. All rights reserved. 1. Introduction and context of research In the decade 2000–2010, the length of motorway and dual car- riageway in the Republic of Ireland approximately quadrupled to a http://dx.doi.org/10.1016/j.conbuildmat.2014.12.015 0950-0618/Ó 2014 Elsevier Ltd. All rights reserved. ⇑ Corresponding author at: College of Engineering and Informatics, National University of Ireland, Galway, Ireland. Tel.: +353 91 492021. E-mail address: [email protected] (B.A. McCabe). Construction and Building Materials 79 (2015) 402–419 Contents lists available at ScienceDirect Construction and Building Materials journal homepage: www.elsevier.com/locate/conbuildmat
Transcript of An embodied carbon and embodied energy appraisal of a section of Irish motorway constructed in...

Construction and Building Materials 79 (2015) 402–419
Contents lists available at ScienceDirect
Construction and Building Materials
journal homepage: www.elsevier .com/locate /conbui ldmat
An embodied carbon and embodied energy appraisal of a sectionof Irish motorway constructed in peatlands
http://dx.doi.org/10.1016/j.conbuildmat.2014.12.0150950-0618/� 2014 Elsevier Ltd. All rights reserved.
⇑ Corresponding author at: College of Engineering and Informatics, NationalUniversity of Ireland, Galway, Ireland. Tel.: +353 91 492021.
E-mail address: [email protected] (B.A. McCabe).
Alan R. Duggan a, Bryan A. McCabe a,b,⇑, Jamie Goggins a,b, Eoghan Clifford a,b
a College of Engineering and Informatics, National University of Ireland, Galway, Irelandb Ryan Institute, National University of Ireland, Galway, Ireland
h i g h l i g h t s
� A novel life cycle assessment methodology for road construction is presented.� This determines the environmental impact in areas of highly organic soils.� This was applied to an Irish case study where excavate-and-replace was used for peat.� In the case study, the biggest embodied carbon (EC) component was excavated peat.� Alternative ground improvement scenarios of soil-mixing and piling were examined.
a r t i c l e i n f o
Article history:Received 7 June 2013Received in revised form 17 November 2014Accepted 7 December 2014
Keywords:Road constructionEmbodied carbonEmbodied energyPeat excavate-and-replaceDry soil-mixingPilingRestoration techniquesBinder
a b s t r a c t
In addition to the customary drivers of cost and timely project delivery, embodied energy (EE) andembodied carbon (EC) have come to prominence in recent years as major design considerations in allaspects of large-scale road construction projects. An assessment of road construction necessitating theexcavation or alteration of peat should consider the impact on carbon stored within the peat and thegreenhouse gases potentially released. A methodology for calculating the environmental impact of con-structing roads on peat is presented in this paper. Furthermore, the paper describes the application of thismethodology (focusing on EE and EC calculations) to a case study; a section of the M6 motorway in Ire-land for which excavate-and-replace was the ground improvement method (Scenario ER). A range ofpeat-related factors impacting on EE and EC estimates were examined, including materials, transportand machinery, as well as more unfamiliar factors such as peat drainage, drainage systems, restoration,slope stability and clearance of vegetation/forest. Comparisons of total EC are investigated under variousmanagement practices and restoration techniques for peatlands, assessing their strength in terms ofhydrology and carbon storage potential. The total EC and EE for road construction to the sub-base level(and implications thereof) of the 2.14 km section of the M6 discussed in this paper was 17,220 tCO2eq(8047 tCO2eq/km) and 54,541 GJ (25,487 GJ/km), respectively, with carbon loss from excavated peataccounting for 62% of the total EC. Two other ground improvement method scenarios for constructingthis section of road were also considered: Scenario S, soil-mixing and Scenario ER + P, an appropriatecombination of excavate-and-replace and piling. Scenario S gave rise to a total EC of 25,306 tCO2eq(11,825 tCO2eq/km) and a total EE of 164,364 GJ (76,806 GJ/km) while Scenario ER + P gave rise to a totalEC of 17,048 tCO2eq (7966 tCO2eq/km) and a total EE of 92,706 GJ (43,320 GJ/km). In this study, ScenarioER was the preferred technique as it had EC comparable to Scenario ER + P and the lowest EE. On the otherhand, Scenario S was the least favourable due to the high EC and EE of the binder. However, this papershows that the EC and EE can be decreased dramatically by changing the binder proportions. Further-more, the EC of Scenarios ER and ER + P can also be significantly reduced if alternative restoration tech-niques are employed for excavated peat.
� 2014 Elsevier Ltd. All rights reserved.
1. Introduction and context of research
In the decade 2000–2010, the length of motorway and dual car-riageway in the Republic of Ireland approximately quadrupled to a

A.R. Duggan et al. / Construction and Building Materials 79 (2015) 402–419 403
total of 1200 km [1]. Given that peatlands account for 13.8% of Ire-land’s land area [2], it was inevitable that peat would be encoun-tered in large expanses on some of these projects. Forgeotechnical engineers, peat represents a challenge because of itshigh moisture content, low shear strength and high compressibility(especially its propensity for long-term creep settlements). Someform of ground improvement is normally required when it isencountered on road projects. The favoured option for road con-struction in Ireland to date has been to excavate the peat, particu-larly where the depth is no greater than 3–4 m [3] and replace itwith competent fill material. However, in some road projects inIreland, depths greater than 4 m were excavated, with local exca-vations reaching depths of up to 13 m [3]. Piling, on the other hand,because of its high cost, has generally been used only where settle-ment control was paramount. Some projects have also considereddry soil-mixing, whereby a dry binder (typically some combinationof cement and ground granulated blast furnace slag) is injectedinto the peat to create a stabilised platform, but in most cases itwas not deemed commercially viable because of the large amountsof binder required [4]. Surcharging, another option, is not currentlypermitted for peat soils by the National Roads Authority in Ireland.The use of any of these methods for supporting roads necessitatesthe generation of a substantial amount of construction materials,leading to the depletion of natural resources, the emission ofgreenhouse gases and damage to the local environment due to con-struction operations.
Ireland has an obligation to reduce its annual non EmissionsTrading Scheme (non-ETS) greenhouse gases emitted to at least20% below 2005 levels by 2020 or face significant fines under thelegally-binding EU’s ’20-20-20’ initiative [5]. In 2005, the Irish con-struction sector was domestically responsible for the emission of8.11 MtCO2eq [6], amounting to 11.7% of the country’s emissionsof 69.3 MtCO2eq [5], where CO2 equivalents (CO2eq) include notonly CO2 but also other greenhouse gases, such as methane(CH4), nitrous oxide (N2O) and perfluorocarbons (PFCs), takingaccount of their global warming potential as set out in the Kyotoprotocol. Global warming potential is based on the relativeamounts of heat trapped in the atmosphere by greenhouse gas;for example, CO2 and CH4 have global warming potentials of 1and 25, respectively [7]. It is anticipated that Ireland will violateits non-ETS annual greenhouse gas emissions commitments from2016 onwards, exceeding its EU 2020 target by between 4.1(11%) and 7.8 MtCO2eq (21%) [5]. To combat these soaring emis-sions and comply with regulations, it is vital to be in a positionto produce accurate calculations of construction-related energyconsumption and emissions, including the geotechnical elementsof projects. This will enable engineers to appraise various optionswith a view to minimising environmental impacts.
Recently, the geotechnical profession has taken steps to quan-tify energy consumption and emissions for construction projects.Egan and Slocombe [8] investigated the embodied carbon (EC) ofseveral piling options on a range of construction projects, whileChau et al. [9] examined the embodied energy (EE) associated withthe construction of sections of a UK rail tunnel. Both Milachowskiet al. [10] and Chappat and Bilal [11] estimated the environmentalimpact of constructing roads. However, despite the increasingdemands for sustainable engineering practices, there is a dearthof life cycle assessment (LCA) studies, methodologies and figuresfor geotechnical projects. This probably accounts for the absenceof guidelines on how to determine the potential construction-related emissions (at planning and design stages) associated withroad construction in areas of organic soil such as peat.
In this paper, a LCA methodology is outlined which allows aquantitative comparison of the potential environmental impactsof various ground improvement options for road construction onpeat, including excavate-and-replace (ER), dry soil-mixing (S) and
piling (P). The methodology was applied to a study section of arecent Irish motorway project for which the excavation andreplacement of peaty soil was the chosen solution (Scenario ER).Results for total EE and EC for this case study are calculated. Alter-native ground improvement scenarios that could have been con-sidered on the same site were also examined, i.e. soil mixing(Scenario S) and a combination of excavate-and-replace and piling(Scenario ER + P). Only aspects of the road construction to the sub-base level and related implications were included in the calcula-tions. Pavement layers were common to all ground improvementscenarios considered and were therefore excluded in the interestsof clarity.
2. EC/EE considerations in peatlands
2.1. Construction in peatlands
Peat is a soft organic soil formed in high water table environ-ments where the supply of organic material to the surface sur-passes the rate of decomposition due to anaerobic conditions[12]. Consequently, peat accumulates over time, slowly taking incarbon from the atmosphere in the process. In Ireland’s three mainbog types (raised bogs, blanket bogs, and fens), undisturbed peat-lands have been sequestering carbon for thousands of years, exert-ing a net cooling effect on the world’s atmosphere. Many of thesepeatlands are now disturbed and are net sources of CO2.
Using existing EE and EC methods, it might be expected that theexcavate-and-replace option would be less energy/carbon inten-sive than soil-mixing and piling, as replacement of peat with fillsuch as quarried material is relatively cheap and environmentallyfriendly. The EE associated with producing the binder in soil-mix-ing and the cement for the concrete in piles is energy intensivebecause of the additional manufacturing stage and, in general, highEE activities engender high EC. However, the excavation processand the extent of drainage due to construction have a negativeimpact as a drained peatland releases its stored carbon as CO2
and other greenhouse gases and thereafter loses its ability tosequester carbon [13].
The higher the organic content of a soil, the higher the potentialfor loss of carbon as CO2. In the absence of organic content values,the Scottish Natural Heritage [14] proposed that the carbon con-tent of peat may be estimated at between 49% and 62% of its dryweight. Using this method, the carbon content of peat having atypical dry density of 0.1 g/cm3 would lie between 0.18 and0.23 tCO2eq/m3. However, it is preferable to quantify the organiccontent of the peat by the loss-on-ignition method [15]. Schum-acher [16] suggests finding carbon content by dividing the organiccontent values by a factor, which has been derived by experimentand ranges between 1.724 (representing 58% carbon) and 2.5 (rep-resenting 40% carbon). In general, the range of organic contentsfound in peat soils is greater than the range of carbon contentsfound in the organic matter, thereby justifying the latter approach[16].
2.2. Life cycle assessment (LCA)
Environmental LCA tools involve quantifying and evaluating theenvironmental burden associated with a product or process byconsidering energy and material uses and releases into the envi-ronment. LCA tools can be utilised to implement opportunities todecrease the environmental cost of road construction. A LCAincludes four phases: (i) goal and scope definition, (ii) life cycleinventory (LCI), (iii) life cycle impact assessment, and (iv) interpre-tation [17]. Having defined the LCA goal, the following are identifiedin Phase 1: functional unit (e.g. tCO2eq/m3, tCO2eq/t, tCO2eq/km),

404 A.R. Duggan et al. / Construction and Building Materials 79 (2015) 402–419
system boundary (factors involved), data requirements, and limita-tions. Phase 2 involves the collection of information on EE/ECintensities from existing databases and other published materialto create a database for materials and processes that lie withinthe system boundary. Phase 3 focuses on performing the assess-ment, while in Phase 4 the results are interpreted in order to makerecommendations and arrive at conclusions.
In an environmental LCA, it is usual to examine global warming(e.g. EC and EE), although other category indicators such as (butnot limited to) impacts from water and land use, acidification,eutrophication and ecotoxicity can be used [18–20]. Where possi-ble, EC is taken as the greenhouse emissions released and is mea-sured in CO2 equivalents (CO2eq), found by multiplying the mass ofthe greenhouse gases by their associated 100-year global warmingpotential [7]. EE is associated with the energy consumed over aproduct’s life cycle [21].
2.3. Use of emission and peat-related factors in LCA studies
In order to understand and quantify the dynamics of gas emis-sions from peatlands, the Intergovernmental Panel on ClimateChange (IPCC) has published basic Tier 1 default emission factorsfor peatlands in different climates [22]. With the help of these emis-sion factors and other basic assumptions, both Hall [23] and Nayaket al. [24] were able to estimate the carbon cost of building a wind-farm on peat and investigate the effect of forest removal and drain-age. Notwithstanding this progress to date, only a limited number ofpeat-related factors have been incorporated into EE/EC studies usingsimple calculations. This paper employs several methodologies toestimate the EC and EE associated with road construction onpeatlands and uses Tier 2 country-specific emission factors in addi-tion to established Tier 1 emission factors [22]. The estimation of ECfor a particular method of road construction depends on a widerange of factors and construction activities such as constructionoperations, peat drainage, peat stability, restoration of peatlands,vegetation/forest, and the effect of climate change [25].
2.4. Forest and peatland carbon sinks
In order to help offset the degradation of land and the environ-mental cost of a construction project, it is possible to include forestand peatland carbon sinks in the EE/EC assessment. To this end,afforestation and peatland restoration can be carried out in con-junction with a road construction project, thereby accumulatingcarbon credits which have a market value. Under the Land Use,Land Use Change and Forestry (LULUCF) category and the KyotoProtocol, forest and peatland carbon sinks will, more than likely,be included in Ireland’s emissions in 2020. Forest sinks could playa vital role in reducing Ireland’s emissions and are predicted toremove 4.6 MtCO2eq by 2020 [5]. However, as recognised byLULUCF negotiators, drained peatlands and the restoration of wet-lands and previously drained peatlands can act as both carbonsinks and significant contributors of greenhouse gas emissions[26] and have the potential to offset annual emissions if accountedfor in the post-Kyoto Protocol commitment period from 2013.Greenhouse gas emissions and removals related to LULUCF arenot currently included in the EU 2020 target but, nevertheless,must be recorded [5].
3. Case study: M6, Pollboy section
3.1. Introduction
The M6 Galway to East Ballinasloe motorway scheme in theWest of Ireland was the final stage of an overall route,
approximately 190 km long, connecting Dublin to Galway. Thescheme comprised 56 km of motorway, a 7 km link road to Lough-rea and 32 km of side and link roads [27]. The mainline is a four-lane dual carriageway with a pavement width of 22 m, and vergesof 2 m in accordance with National Roads Authority guidelines inIreland [28]. Peat underlay approximately 4% of the route. Thestudy section considered in this paper is 2.14 km long, in an areaof predominantly peaty soil at Pollboy, south of Ballinasloe(approximately 53�1805900N, 8�1305500W to 53�1804900N,8�1200100W; Chainage (Ch.) 52,210–54,350, see Fig. 1). Peat exca-vate-and-replace (henceforth referred to as Scenario ER) was cho-sen as the ground improvement technique.
3.2. Geology
The road section lies in the River Suck catchment, with the RiverSuck about 2 km to the east. The mean annual rainfall is approxi-mately 1150 mm; the mean annual evaporation loss is 460 mm;and the average annual temperature is 9.8 �C [27]. The site has aslope of around 0.5� from north to south and is located in wet landincluding a mixture of drained reclaimed and unreclaimed fieldswith an underlying layer of peat and peaty clay, hereafter referredto collectively as peat. This site also borders the Pollboy cutoverbog (Ch. 52,930–53,530). The peatlands had previously beendrained, leaving the water table level below the peat layer(Fig. 2). Between the start of the section and the River Suck, a sig-nificant thickness of alluvial material overlain by peat deposits pre-vails. In general, good ground conditions exist north of the roadalignment and poorer conditions to the south. Peat in the areawas found to have moisture contents ranging between 500% and1000%, organic contents from 25% to 80%, oedometer coefficientsof volume compressibility (mv) values of approximately 2–4 m2/MN, and oedometer coefficient of consolidation (cv) values of0.9–1.5 m2/year.
3.3. Road construction and ancillary details
An estimated 115,000 m3 of peat was excavated for the motor-way mainline and replaced with 170,000 m3 of engineered fillmaterial from nearby quarries (the extra 55,000 m3 was employedto establish a higher foundation level for the sub-base). The exca-vated volumes necessitated three peat disposal areas along withdrainage works comprising of ponds and infiltration ditches. Theseadditional excavations, as well as a stream diversion, accounted foran additional 20,173 m3 of excavated peat. Two wet fields and anopen area of moor grass-covered bog south of the alignment werechosen to site the embankments, which have side slopes of 1:4 anda maximum height of 2 m. A plan identifying these elements of thescheme is shown in Fig. 2. A birch/willow woodland was subse-quently planted on the peat disposal areas to blend in with the sur-rounding landscape.
The road embankment has a maximum height of 4.2 m andincorporates a geogrid for extra strength (Fig. 3(a)). Deep depos-its of soft silt/clay underlay the peat layer in three zones, whichwere located at the following chainages: Ch. 52,400–52,700, Ch.53,000–53,350, and Ch. 53,770–54,430 (Fig. 2). Since the softsilt/clay has cv values ranging from 2 to 5 m2/year, prefabricatedvertical drains (band drains) were required to accelerate drainageunder embankment loading. A drainage blanket of 1.5 m inheight was employed to lay the band drains in these three partsof the section (Fig. 3(b)).
The drainage system consists of retention ponds, infiltrationditches and two types of stream diversion. The retention pondsare 0.5 m deep, with a 1:4 side slope and are lined with a perme-able geotextile and a 150 mm depth of rockfill. The infiltrationditches around the peat disposal areas have a base width of 1 m,

Fig. 1. Location of the M6 motorway and the Pollboy contract, adapted from RPS [27].
Fig. 2. Plan and cross section of contract.
A.R. Duggan et al. / Construction and Building Materials 79 (2015) 402–419 405
are 1 m in depth and have a 1:1 side slope. As the road alignmentcrossed a stream, two types of stream diversion had to be built,requiring the excavation of peat to a depth of 2 m in the first typeand to 2.5 m in the second. Both types have side slopes of 1:2, withthe second case requiring the laying of an impermeable geomem-brane and a 150 mm depth of rockfill lining.
4. Carbon and energy calculation
4.1. Goal and scope definition
The goal of the study is to present a methodology thatgeotechnical engineers can deploy on projects to determine the

Fig. 3. Typical cross sections of (a) rock embankment (top), (b) rock embankment with vertical drains (bottom) (courtesy of RPS group).
406 A.R. Duggan et al. / Construction and Building Materials 79 (2015) 402–419
environmental impact of road construction in areas of highlyorganic soils, where EE and EC are used as indicators. Thus, theconstruction of a control segment of the aforementioned M6scheme is utilised as a case study to highlight the key consider-ations in performing environmental LCA for this application. Whileexcavate-and-replace was adopted in the contract, the study hasbeen extended by also considering potential EE/EC associated withalternatives, such as soil-mixing and piling, and other ancillaryactivities are also considered in Section 5. For the purposes of thisstudy, the entire 2.14 km section was examined, but a functional1 km unit was also considered. The calculations have been per-formed using LCA methodology conforming to ISO 14040 [17].
The function of the scheme is to support pavement layers andvehicular traffic, while meeting the engineering specifications setout by the National Roads Authority in Ireland [28]. The functionalunit is defined in this study as a kilometre of motorway operationalfor 120 years. According to the Highways Agency [29], the designlifetime of geotechnical structures such as embankments shouldrange from 60 to 120 years. Based on the upper limit of this stan-dard, the boundary of the LCA study starts at the extraction of rawmaterials and ends when the design lifetime of the road foundationexpires after 120 years.
This study adopts the process analysis approach utilising arange of published EE and EC intensities, much of which come fromthe Inventory of Carbon and Energy Version 2.0 (ICE V2.0) [21,30].The system boundaries employed in the study for an excavationand replacement approach (Scenario ER) for road construction onhighly organic soil are given in Fig. 4, where the dotted line repre-sents the system boundary and the solid black arrows indicatetransport. Recurring EC and EE in the form of maintenance (e.g.resurfacing roads, line painting, new signage, etc.) were not takeninto account as the pavement layers were excluded. Materials,
transport and machinery all have cradle-to-site boundary condi-tions, while direct and indirect emissions on-site, on the otherhand, are taken into account for the full life cycle. Direct emissionsoriginate from the excavated peat, while indirect emissions comefrom land construction activities such as emissions from ponds,drainage systems, peat disposal areas and roads, some of whichmay go into direct emissions and some into the restorationcategory.
Following the establishment of the goals and study boundaries,a methodical examination of the construction stages shown inFig. 4 was undertaken. Once the key processes were identified, datawere obtained to quantify each individual process. The box on theleft of Fig. 4 contains the EE and EC intensities for raw materialsused in producing the materials needed for the embankment,stream diversion and ponds. Direct and indirect emissions areillustrated leaving these main unit processes.
4.2. Life cycle inventory
This section presents the collection of data for each processincluded in the product system, as defined in Section 4.1 and sum-marised in Fig. 4. Where possible, data were validated by compar-ing them with other sources.
4.2.1. Materials, transport and machineryTable 1 contains the life cycle inventory (LCI) of the relevant
properties of the materials needed for the study. Resulting fromuncertainties after product manufacture, it has become commonpractice to calculate EC and EE intensities for materials right upto when the product leaves the factory [21]. The aforementionedlife cycle profile was adopted in this LCA, using intensities fromV2.0 of the inventory [21].

Fig. 4. Process flowchart of Scenario ER.
Table 1Materials required for Scenario ER.
Materials Density(kg/m3)
EC intensity(kgCO2eq/kg)
EE intensity(MJ/kg)
Distance travelled onland one-way (km)
Transportvehicle
% Weightladen
Distance travelledby sea (km)
One or twoway transport
Volume(m3)
Scenario ERAggregate 2240 0.0052 0.083 15 Rigid 100, 0* 0 Two 170,000Rockfill 2240 0.0052 0.083 15 Rigid 100, 0* 0 Two 405
(kg/m2) (m2)Geogrid (PP) 0.4 3.43 99.2 204 Articulated 62 226 One 80,000Geotextile (PE) 0.3 2.54 83.1 204 Articulated 62 226 One 1969Geocomposite (LLDPE) 0.939 2.08 78.1 204 Articulated 62 226 One 728Vertical drain 1 3.43 99.2 486 Articulated 62 626 One 10,111
* The trucks were 100% loaded from quarry to site and returned to the quarry empty.
A.R. Duggan et al. / Construction and Building Materials 79 (2015) 402–419 407
The materials employed in Scenario ER (i.e. as constructed)include aggregate, vertical drains, and a geogrid. The 8 m long,100 mm by 4 mm polypropylene band drains (permeable plasticcores wrapped in filter membranes), installed in a triangular pat-tern with a centre-to-centre spacing of 1.75 m were imported fromthe Netherlands via the UK on average weight laden transport(Table 1). A polypropylene geogrid was used for the embankment,
a polyester geotextile employed for the permeable separating pondliner, and a linear low-density polyethylene (LLDPE) impermeablegeomembrane for the stream diversion. These geosynthetics wereassumed to have been imported from England by road and sea overdistances given in Table 1. A bulk density of 1000 kg/m3 wasadopted for the peat, which was assumed to be transported anaverage distance of 1.07 km on a rigid truck (>17 tonnes), a

Table 2Fuel consumption rates for heavy goods vehicles and cargo ships [30].
Transport % Weight laden Payload (t) Fuel consumption (kgCO2eq/t km) Fuel consumption (l/t km)
Rigid truck (>17 t) 100 9.41 0.146 0.046Articulated truck (>33 t) 62 11.78 0.103 0.032Articulated truck (>33 t) 100 19 0.075 0.024Concrete mixer (>17 t) 100 14.4 (6 m3) 0.096 0.030Average cargo ship 60 0.016 0.005
Fuel consumption (kgCO2eq/km) Fuel consumption (l/km)
Rigid truck (>17 t) 0 0 0.959 0.303Articulated truck (>33 t) 0 0 0.860 0.272
Table 3Fuel consumption rates and rates of work for Scenario ER.
Machinery Fuelconsumption (l/h)
Rate(m3, drains/h)
Amount(m3) (drains)
21 tonne excavator 16 100 135,173Band drain rig 45 87.5 16,852
408 A.R. Duggan et al. / Construction and Building Materials 79 (2015) 402–419
distance equal to half the contract length. The trucks were fullyloaded to the peat disposal area and empty on the way back.Table 2 gives fuel consumption rates for the use of diesel (UK aver-age biofuel blend), which has an EE intensity of 38.3 MJ/l [30].Transport distances were kept to a minimum, thereby minimisingthe environmental cost of transport. All transport by sea wasassumed to involve average weight laden cargo ships.
Since the top pavement layers are not being considered part ofthe study, machinery such as pavers and compactors were notincluded. The EC and EE of machinery are difficult to estimatedue to the large variety required in building a motorway. For thepurpose of this scenario, only the EC and EE of excavators and banddrain rigs were examined (Table 3). Transport of machinery to sitewas not calculated as these values would be similar regardless ofthe ground improvement method considered.
4.2.2. DrainageThe lateral extent of drainage (E) due to road construction
(demarcated in Fig. 3) was calculated by using Eq. (1), which wasbased on 16 previous studies [32–44] relating E to hydraulic
Fig. 5. Plot of extent of drainage a
conductivity (K) (Fig. 5). The equation represents an update bythe authors of this paper upon a linear fit proposed by Nayaket al. [24] to eight of these studies:
E ¼ 1:527log2ðKÞ þ 2:84 logðKÞ ð1Þ
In Eq. (1), the unit of E and K are m and mm/d, respectively.Using Eq. (1) and an average hydraulic conductivity of 200 mm/d(calculated from site investigation data), the extent of drainagewas estimated to be 14.6 m from ditches, ponds and any otherexcavations. However, the extent of drainage has limited relevancefor already-drained bogland, and the area will continue to be a netsource of greenhouse gases regardless of construction. This drain-age equation will, nonetheless, be used in Section 6.6 to calculatethe environmental impact if the drained bogland had been undis-turbed. CO2 and CH4 are accounted for in EC calculations but notN2O emissions, which are deemed negligible from oligotrophicpeatlands [31].
4.2.3. Drainage systemsDepending on the peatland type, peat depth, slope and type of
ditch/pond, ditches and ponds may stay functional for decades ormay deteriorate and fill with vegetation within 10 years of instal-lation [45]. High CH4 fluxes from drainage ditches and ponds in atemperate climate have been reported by Hendriks et al. [46], inparticular nutrient-rich ponds and ditches. Clogged ditches con-sisting of algae and other vegetation that are not regularly main-tained will tend to produce higher CH4 emissions [45],
gainst hydraulic conductivity.

Fig. 6. Clogged stream diversion shown at front and peat disposal area in background at Pollboy 3 years after construction.
Table 4Emissions from drainage ditches in a temperate climate.
Study Peatland (nutrient status) Total(tCO2eqha�1 year�1)
Schrier-Uijl et al. [49] Mesotropic/eurotrophic status 27.3Schrier-Uijl et al. [47] Eutrophic fen (intensive) 25.4Schrier-Uijl et al. [47] Eutrophic fen (less intensive) 12.3Hendriks et al. [46] Restored agricultural peat meadow 12.7
Average 19.4 (�20)
A.R. Duggan et al. / Construction and Building Materials 79 (2015) 402–419 409
exemplified by the ditches at Pollboy (Fig. 6). Emissions can also behigh from turbulent water due to the thinner boundary layerbetween the water and air interface [45]. For this study, it isassumed that only the base of infiltration ditches is covered withwater all year round, which will compensate for periods whenhigher levels are recorded in winter or when lower or no water lev-els are recorded in summer. In contrast, the ponds are assumed tohave a 0.25 m head of water all year round. CH4 emissions dependprimarily on air temperature, water level, speed of the movingwater and vegetation [45,47].
Studies of gas emissions from ditches and ponds in temperate,boreal and Mediterranean climates reported in the literature wereexamined. The highest emissions, 61.5 tCO2eq ha�1 year�1, werefrom a site in a Mediterranean climate because of higher tempera-tures and a higher decomposition rate [48]. Table 4 summarisesprevious studies, some of which include fens, which tend to havehigher emissions than ombrotrophic peatlands. As the Pollboy sec-tion contained plants that are considered a fen species (due to theunderlying marl soil), the studies were deemed adequate for use.Emission rates in a temperate climate ranged from 12.7 to27.3 tCO2eq ha�1 year�1 (Table 4), thus an average emission rateof 20 tCO2eq ha�1 year�1 was assumed for the ditches and pondsat Pollboy for the 120-year life cycle.
4.2.4. Direct emissionsThe loss of carbon as CO2 from excavated peat is considered a
direct emission and should be included in EC calculations [24].Excavated peat, which has been under anaerobic conditions, startsreleasing CO2 and other gases when exposed to the atmosphereand aerobic conditions [13]. In this LCA, the percentage of carbonlost from the peat as CO2 (Clost) was assumed to be 100% becausethe embankments and their sides are exposed to aerobic condi-tions, and it is highly probable that the excavated peat will remainabove the water table for the lifetime of the road. The volume ofthis peat will reduce as a result of primary and secondary consol-idation and peat oxidation [13]. Using the average dry density
(qd) of 0.121 g/cm3 and organic content (OC) of 41%, it was foundthat the peat had an organic matter density of 0.05 t/m3, whichwhen divided by a factor (F) of 2.11 gave an embodied carbon con-tent of 0.024 tC/m3 (0.086 tCO2eq/m3). The aforementioned factorrefers to the mean of the range of division factors quoted bySchumacher [16], and is explained further in Section 2.1. The totalCO2 released ECpeat (tCO2eq) from the volume of excavated peat(Vpeat) for the 120 years was estimated at 11,670 tCO2eq, (Eq. (2)):
ECpeat ¼ qd � Vpeat � ð1=FÞ � ðOC=100Þ � ðClost=100Þ � ð44=12Þð2Þ
Table 5 demonstrates why it is plausible that 100% of the peat’scarbon may be released over the road’s 120-year life cycle. Accord-ing to this analysis, peat will have released all its carbon as CO2 in61–67 years at an emission rate of 20 tCO2eq ha�1 year�1 [26], or,as calculated similarly, in 123–134 years at an emission rate of10 tCO2eq ha�1 year�1, which is typical of a drained peatland [50].
Had the removed peat from the road and associated drainagesystems not been disturbed, it would have produced emissions.This has to be factored into net direct emissions because the focusis the environmental impact of the road, not the natural emissionsthat would have occurred in the absence of construction. There-fore, after subtracting the CO2 from these excavated peat areas,
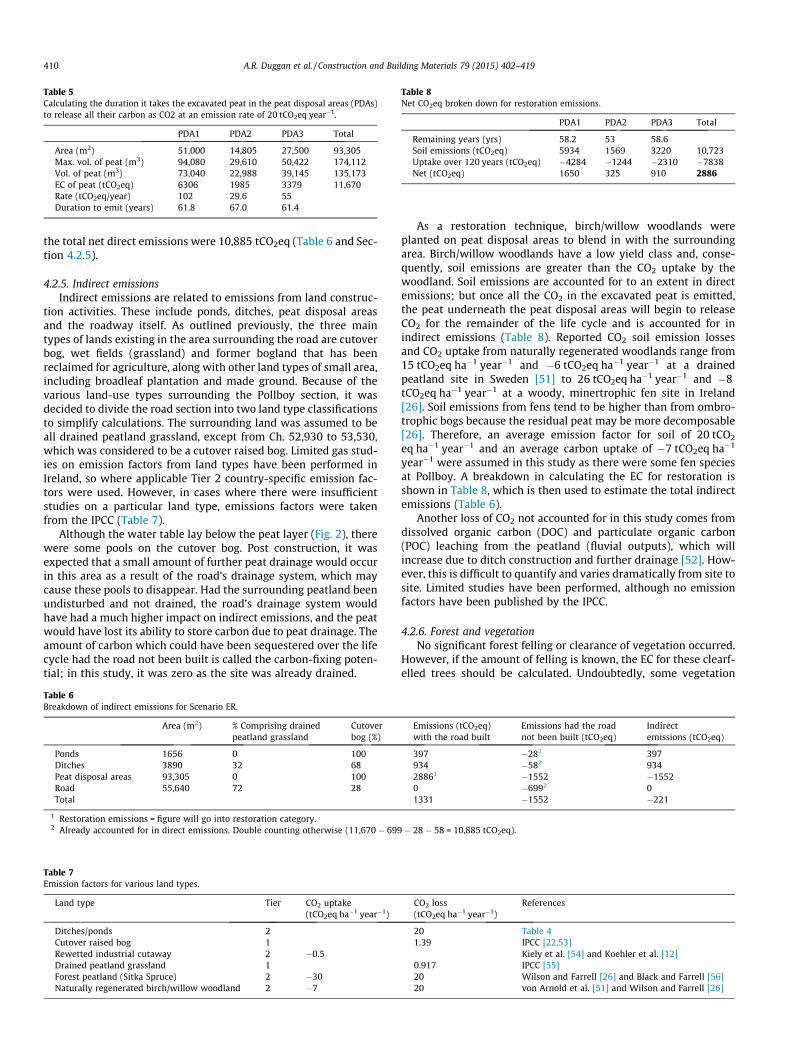
Table 5Calculating the duration it takes the excavated peat in the peat disposal areas (PDAs)to release all their carbon as CO2 at an emission rate of 20 tCO2eq year�1.
PDA1 PDA2 PDA3 Total
Area (m2) 51,000 14,805 27,500 93,305Max. vol. of peat (m3) 94,080 29,610 50,422 174,112Vol. of peat (m3) 73,040 22,988 39,145 135,173EC of peat (tCO2eq) 6306 1985 3379 11,670Rate (tCO2eq/year) 102 29.6 55Duration to emit (years) 61.8 67.0 61.4
Table 8Net CO2eq broken down for restoration emissions.
PDA1 PDA2 PDA3 Total
Remaining years (yrs) 58.2 53 58.6Soil emissions (tCO2eq) 5934 1569 3220 10,723Uptake over 120 years (tCO2eq) �4284 �1244 �2310 �7838Net (tCO2eq) 1650 325 910 2886
410 A.R. Duggan et al. / Construction and Building Materials 79 (2015) 402–419
the total net direct emissions were 10,885 tCO2eq (Table 6 and Sec-tion 4.2.5).
4.2.5. Indirect emissionsIndirect emissions are related to emissions from land construc-
tion activities. These include ponds, ditches, peat disposal areasand the roadway itself. As outlined previously, the three maintypes of lands existing in the area surrounding the road are cutoverbog, wet fields (grassland) and former bogland that has beenreclaimed for agriculture, along with other land types of small area,including broadleaf plantation and made ground. Because of thevarious land-use types surrounding the Pollboy section, it wasdecided to divide the road section into two land type classificationsto simplify calculations. The surrounding land was assumed to beall drained peatland grassland, except from Ch. 52,930 to 53,530,which was considered to be a cutover raised bog. Limited gas stud-ies on emission factors from land types have been performed inIreland, so where applicable Tier 2 country-specific emission fac-tors were used. However, in cases where there were insufficientstudies on a particular land type, emissions factors were takenfrom the IPCC (Table 7).
Although the water table lay below the peat layer (Fig. 2), therewere some pools on the cutover bog. Post construction, it wasexpected that a small amount of further peat drainage would occurin this area as a result of the road’s drainage system, which maycause these pools to disappear. Had the surrounding peatland beenundisturbed and not drained, the road’s drainage system wouldhave had a much higher impact on indirect emissions, and the peatwould have lost its ability to store carbon due to peat drainage. Theamount of carbon which could have been sequestered over the lifecycle had the road not been built is called the carbon-fixing poten-tial; in this study, it was zero as the site was already drained.
Table 6Breakdown of indirect emissions for Scenario ER.
Area (m2) % Comprising drainedpeatland grassland
Cutoverbog (%)
Ponds 1656 0 100Ditches 3890 32 68Peat disposal areas 93,305 0 100Road 55,640 72 28Total
1 Restoration emissions = figure will go into restoration category.2 Already accounted for in direct emissions. Double counting otherwise (11,670 � 699
Table 7Emission factors for various land types.
Land type Tier CO2 uptake(tCO2eq ha�1 year�1)
Ditches/ponds 2Cutover raised bog 1Rewetted industrial cutaway 2 �0.5Drained peatland grassland 1Forest peatland (Sitka Spruce) 2 �30Naturally regenerated birch/willow woodland 2 �7
As a restoration technique, birch/willow woodlands wereplanted on peat disposal areas to blend in with the surroundingarea. Birch/willow woodlands have a low yield class and, conse-quently, soil emissions are greater than the CO2 uptake by thewoodland. Soil emissions are accounted for to an extent in directemissions; but once all the CO2 in the excavated peat is emitted,the peat underneath the peat disposal areas will begin to releaseCO2 for the remainder of the life cycle and is accounted for inindirect emissions (Table 8). Reported CO2 soil emission lossesand CO2 uptake from naturally regenerated woodlands range from15 tCO2eq ha�1 year�1 and �6 tCO2eq ha�1 year�1 at a drainedpeatland site in Sweden [51] to 26 tCO2eq ha�1 year�1 and �8tCO2eq ha�1 year�1 at a woody, minertrophic fen site in Ireland[26]. Soil emissions from fens tend to be higher than from ombro-trophic bogs because the residual peat may be more decomposable[26]. Therefore, an average emission factor for soil of 20 tCO2
eq ha�1 year�1 and an average carbon uptake of �7 tCO2eq ha�1
year�1 were assumed in this study as there were some fen speciesat Pollboy. A breakdown in calculating the EC for restoration isshown in Table 8, which is then used to estimate the total indirectemissions (Table 6).
Another loss of CO2 not accounted for in this study comes fromdissolved organic carbon (DOC) and particulate organic carbon(POC) leaching from the peatland (fluvial outputs), which willincrease due to ditch construction and further drainage [52]. How-ever, this is difficult to quantify and varies dramatically from site tosite. Limited studies have been performed, although no emissionfactors have been published by the IPCC.
4.2.6. Forest and vegetationNo significant forest felling or clearance of vegetation occurred.
However, if the amount of felling is known, the EC for these clearf-elled trees should be calculated. Undoubtedly, some vegetation
Emissions (tCO2eq)with the road built
Emissions had the roadnot been built (tCO2eq)
Indirectemissions (tCO2eq)
397 �282 397934 �582 93428861 �1552 �15520 �6992 01331 �1552 �221
� 28 � 58 = 10,885 tCO2eq).
CO2 loss(tCO2eq ha�1 year�1)
References
20 Table 41.39 IPCC [22,53]
Kiely et al. [54] and Koehler et al. [12]0.917 IPCC [55]20 Wilson and Farrell [26] and Black and Farrell [56]20 von Arnold et al. [51] and Wilson and Farrell [26]

Table 9Breakdown of total EC and EE for Scenario ER.
Factor EC(tCO2eq)
Percentage(%)
EE (GJ) Percentage(%)
Scenario ERMaterials 2132 12.1 35,962 65.9Transport 1458 8.25 17,612 32.3Machinery 80 0.45 968 1.77Carbon fixing potential 0 0Direct emissions 10,885 61.6Indirect emissions �221 1.25Vegetation/forest 0 0DOC and POC leaching 0 0Slope stability 0 0Restoration 2886 16.3Total 17,220 100 54,541 100Total (per km) 8047 25,487
A.R. Duggan et al. / Construction and Building Materials 79 (2015) 402–419 411
clearance took place, which also has an EC factor but was notincluded [25].
4.2.7. Slope stabilityA slope stability risk assessment was deemed unnecessary in
this study. The site had an average annual rainfall for the west ofIreland, a slope angle of less than 0.5� and is in an area not knownfor peat failures. Therefore, a factor of safety on indirect CO2 emis-sions is not needed, which would have, if employed, accounted forpeat debris from peat failures drying and releasing CO2 [57].
Peat failures along the sides of the peat excavation prior tobackfill and in peat disposal areas are assumed to be included inthe total CO2 emissions in the excavated peat EC figure. The extentof side collapse can, in general, be limited by experienced contrac-tors who maintain the backfill close to the face.
5. Environmental impact assessment in the LCA
5.1. Case study
As a result of the excavate-and-replace (Scenario ER) groundimprovement method used at Pollboy, the section’s EC and EE
-2000
0
2000
4000
6000
8000
10000
12000
Materials Transport Machine
Embo
died
Car
bon
(tCO
2eq)
Fig. 7. Breakdown of tota
totalled 8047 tCO2eq/km and 25,487 GJ/km, respectively (Table 9).62% of the total EC came from CO2 released from the excavatedpeat (Fig. 7), highlighting the significance of how excavated peatis managed. The restoration measure undertaken also showed abig loss at 16%, which could have been reduced substantially hadalternative measures been taken. Materials at 66% accounted forthe bulk of energy consumed, followed by transport at 32% andmachinery at 1.8%. The order of EE contributions calculated arein agreement with other studies such as Chau et al. [9], based ona rail tunnel construction, where EE of materials for one construc-tion scenario was also the highest contributor at 82%, followed bytransport and machinery at 10% and 8%, respectively.
5.2. Introduction to alternative scenarios
Two alternative ground improvement scenarios were examinedto evaluate the potential environmental impact of using theseapproaches in this case study. Scenario S used peat stabilisationto support a road embankment (Fig. 8(a)), while Scenario ER + Pinvolved a combination of peat excavate-and-replace and some pil-ing (Fig. 8(b)). In Scenario ER + P, piling is only incorporated in thezone Ch. 52,300–52,600, where the depth of peat is greater than3 m along a significant stretch of road, and peat excavate-and-replace was used for the remainder of the section. In this sense,it is a hybrid scenario and should not be considered as exclusivelyrepresentative of piling. Neither scenario required as many peatdisposal areas, retention ponds or ditches as was required duringconstruction in Scenario ER, as reduced quantities of peat wereremoved during operations. Scenario S required one peat disposalarea (PDA 2), and Scenario ER + P required two peat disposal areas(PDA 1 and PDA 2).
5.3. Scenario S: peat stabilisation
In Scenario S, the peat on the mainline was considered to be sta-bilised with a total binder content of 250 kg/m3, consisting of 75%cement and 25% ground granulated blast-furnace slag (GGBS), pro-portions commonly adopted in practice. A polyester geotextile ofsufficient tensile strength was placed on the stabilised platform,
ry Direct Emissions
Indirect emissions
Restora�on
l EC for Scenario ER.

Fig. 8. (a) Typical cross sections of a stabilised embankment, (b) typical cross sections of a piled embankment.
Table 10Properties, quantities and distances for materials needed for Scenario S.
Materials Density(kg/m3)
EC intensity(kgCO2eq/kg)
EE intensity(MJ/kg)
Distance travelledon land (km)
TransportVehicle
% Weightladen
Distancetravelledby sea (km)
One or twoway transport
Volume dealtwith (m3)
Binder (75:25) 250 0.7357 4.61 92.5 – CEM 1 167-GGBS Rigida 100, 0 0 Two 115,000Aggregate 2240 0.0052 0.083 15 Rigida 100, 0 0 Two 41,090Surcharge 2240 0.0052 0.083 15 Rigida 100, 0 0 Two 13,910Rockfill 2240 0.0052 0.083 15 Rigida 100, 0 0 Two 176
(kg/m2) (m2)Geotextile (PE) 0.3 2.54 83.1 204 Articulated 62 226 One 80,447Geocomposite (LLDPE) 0.939 2.08 78.1 204 Articulated 62 226 One 728
a The trucks were 100% loaded from quarry to site, and returned to the quarry empty.
Table 11Fuel consumption rates and rates of work for Scenario S.
Machinery (Scenario S) Fuelconsumption (l/h)
Rate(m3/h)
Volumeof peat (m3)
Stabilising machinery 40 41.67 115,00021 tonne excavator 16 100 15,206
412 A.R. Duggan et al. / Construction and Building Materials 79 (2015) 402–419
with the embankment placed on the geotextile. It is assumed thatpeat stabilisation was carried out in two sections. A surcharge0.5 m in height was incorporated over the stabilised area (as isstandard practice to maximise strength gain); once it had gainedadequate strength, it was placed on the second section. The sur-charge was retained as part of the embankment.
The moisture content of the peat prior to mixing was between500% and 1000% but after mixing could be lower than 200%. Eventhough the water content of the peat reduces significantly due tohydration, the stabilised peat seems to retain its carbon aftersoil-mixing. Preliminary unpublished research at NUI Galway indi-cates that the binder, whether cement or a combination of cementand by-products, takes in CO2 both from the atmosphere and whatlittle CO2 that is released from the peat due to carbonation. Carbon-ation has been widely examined in concrete where CO2 reacts withcalcium hydroxide (Ca(OH)2) in the cement to form calcium car-bonate (CaCO3) [58]. When stabilised peat is surcharged, air voidsare reduced but oxygen will continue to enter the voids to oxidise
the peat. If a small amount of stabilised peat releases CO2 andwater still remains in the stabilised peat, then carbonation willoccur. In this study, it was assumed that any CO2 released frompeat was absorbed by the cement in the life cycle; consequently,net emissions from stabilised peat were assumed to be zero.
Table 10 details the materials required along with their relevanttransport distances. Fuel consumption rates for the machinery areshown in Table 11, which also includes stabilising machinery fordry soil-mixing.
Scenario S had a total EC and EE of 25,306 tCO2eq (11,825tCO2eq/km) and 164,364 GJ (76,806 GJ/km). Fig. 9 and Table 12details the EC and EE for Scenario S. As small amounts of peat wereexcavated, materials in Scenario S accounted for 86% of the total EC.
5.4. Scenario ER + P: combination of peat excavate-and-replace andpiling
For Scenario ER + P, a piled embankment was envisaged over a300 m section as mentioned. This consisted of driven precast C32/40 concrete piles, 8 m long with a cross section of 0.4 m2 piles and80 kg/m3 of reinforcement. The reinforcement was imported fromthe UK, and had an EU-27 market 3-year average recycled contentof 59% [21]. Cast-in-situ 0.5 m3 pile caps were considered, installedat a centre-to-centre spacing of 1.5 m, also containing 80 kg/m3 ofsteel reinforcement imported from the UK. Above the pile caps, thereis a 0.9 m thick piling platform to support machinery and a 2 m thick

0
5000
10000
15000
20000
25000
Materials Transport Machinery Direct Emissions
Indirect emissions
Restora�on
Embo
died
Car
bon
(tCO
2eq)
Fig. 9. Breakdown of total EC for Scenario S.
Table 12Breakdown of total EC and EE Scenario S.
Factor EC (tCO2eq) (%) EE (GJ) (%)
Scenario SMaterials 21,857 86.4 144,855 88.1Transport 1257 4.97 15,192 9.24Machinery 357 1.41 4317 2.63Carbon fix. Pot. 0 0Direct emissions 581 2.30Indirect emissions 256 1.01Veg/forest 0 0DOC + POC 0 0Peat stability 0 0Restoration 997 3.94Total 25,306 100 164,364 100Total per km 11,825 76,806
A.R. Duggan et al. / Construction and Building Materials 79 (2015) 402–419 413
load transfer platform. A polypropylene geotextile was laid in thepiling platform and a polyester geotextile in the load transfer plat-form. It is well established [59,60] that piling has an impact on theintervening soil; ideally, any effect on indirect emissions would becaptured in an analysis. However, the impact is unknown at thisstage and was not included in this study.
Table 13Properties, quantities and distances for materials needed for Scenario ER + P.
Materials Density(kg/m3)
EC intensity(kgCO2eq/kg)
EE intensity(MJ/kg)
Distancetravelledon land (km
Aggregate 2240 0.0052 0.083 15Rockfill 2240 0.0052 0.083 15Piles (RC 32/40) 2480 0.2226 2.162 129c
60c
Load transfer platform 2240 0.0052 0.083 15Piling platform 2240 0.0052 0.083 15Pile caps (concrete) 2400 0.132 0.88 53(32/40 MPa) (Steel) 80 1.4 17.4 165
(kg/m2)Geogrid (PP) 0.4 3.43 99.2 204Geotextile (PP) 0.4 3.43 99.2 204Geotextile (PE) 0.3 2.54 83.1 204Geocomposite (LLDPE) 0.939 2.08 78.1 204Vertical drain 1 3.43 99.2 486
a The trucks were 100% loaded from quarry to site and returned to the quarry emptyb Both transport of piles and pile caps include two-way transport except for the returc Precast piles were transported 129 km from the piling production plant to site while t
to the piling plant.
Table 13 details the materials required along with their relevanttransport distances. Fuel consumption rates for the machinery(including a piling rig) used are shown in Table 14. The concretemixer truck was assumed to transport the concrete for the pilecaps at a speed of 50 kph and a distance of 53 km. This is the max-imum distance it can travel as the total time between the begin-ning of mixing the concrete and its final pouring should notexceed 90 min [61].
Scenario ER + P amounted to a total EC and EE of 17,048 tCO2eq(7966 tCO2eq/km) and 92,706 GJ (43,320 GJ/km)—detailed furtherin Table 15 and Fig. 10. The biggest contributors of EC in this casewere materials at 34% due to the high EC intensity of the piles anddirect emissions at 32% as a result of the relatively high volume ofpeat excavated.
6. Interpretation and discussion of the results
6.1. Overview
It is important to distinguish between EC and EE in the contextof road construction. For the LCA factors for materials, transportand machinery, a high EE figure gives rise to a high EC figure due
)
Transportvehicle
% Weightladen
Distancetravelledby sea (km)
One or twowaytransport
Volumedealtwith (m3)
Rigida 100, 0 0 Two 120,000Rigida 100, 0 0 Two 277Articulateda 100,0 0 Two 6784Articulateda,b 100,0 226 Two/oneRigida 100, 0 0 Two 24,000Rigida 100, 0 0 Two 10,800Mixera 100,0 0 Two/One 663Articulateda,b 100,0 226
(m2)Articulated 62 226 One 68,000Articulated 62 226 One 12,000Articulated 62 226 One 12,000Articulated 62 226 One 728Articulated 62 626 One 8572
.n boat journey for the imported steel.he steel needed to produce the piles was transported 60 km from the steel producer

Table 14Fuel consumption rates and rates of work for Scenario ER + P.
Machinery(Scenario ER + P)
Fuelconsumption (l/h)
Rate(m/h)
Total length (m)
Piling rig 23 40 42,400
(m3/h) Volume of peat (m3)21 tonne excavator 16 100 72,918
(drains/h) Number (drains)Band drain rig 45 87.5 14,287
Table 15Breakdown of total EC and EE for Scenario ER + P.
Factor EC (tCO2eq) (%) EE (GJ) (%)
Scenario ER + PMaterials 5986 34.4 71,933 77.6Transport 1595 9.18 19,275 20.8Machinery 124 0.71 1498 1.62Carbon fix. Pot. 0 0Direct emissions 5537 31.9Indirect emissions �165 0.95Veg/forest 0 0DOC + POC 0 0Peat stability 0 0Restoration 3970 22.8Total 17,048 100 92,706 100Total per km 7966 43,320
414 A.R. Duggan et al. / Construction and Building Materials 79 (2015) 402–419
to the typical use of fossil fuels as primary energy sources for theseprocesses. This would be the case had the road not been built inpeatlands. However, in the Pollboy case study, the road is built inpeatlands; consequently, peat-related factors increase EC substan-tially, while having no effect on EE. Additional contributions to ECwill include emissions from land construction activities, such asexcavated peat, drainage systems, ponds and peat disposal areas.The higher the EC, the greater the on-site environmental impact,thus the greater the effect on global warming. In summary, EC ismore important than EE when considering which ground improve-ment technique to use in construction on peat.
However, EC and EE results are both determined in this LCA, asthe EE value may be used as a distinguishing factor when EC resultsare similar for two ground improvement methods. Furthermore, ifEE results are also similar, on-site impact could then be examinedin terms of land area required as well as direct, indirect and
-1000
0
1000
2000
3000
4000
5000
6000
7000
Materials Transport Machiner
Embo
died
Car
bon
(tCO
2eq)
Fig. 10. Breakdown of total
restoration emissions. Cost is obviously also a major factor indesign, but is not examined in this study. When EC values are sim-ilar, caution is advised in ranking the methods as the accuracy ofcarbon emissions is more difficult to estimate and subject to morevariability than EE results, due to the variability in peat and theuncertainties of emission factors. Consequently, it will be for theconsulting engineer to determine the accuracy of the EC figuresas any total EC figure calculated will depend on how comprehen-sive the LCA study is (see Section 6.7).
6.2. Comparison of ground improvement techniques
Comparisons of total EC and EE for the three scenarios investi-gated in this study are illustrated in Fig. 11. Scenario ER andER + P had similar EC values (i.e. 17,220 tCO2eq and 17,048 tCO2eq,respectively), whereas Scenario S had an EC value of 25,306tCO2eq. However, Scenario ER had the lowest EE (54,541 GJ) com-pared to Scenario ER + P (92,706 GJ) and Scenario S (164,364 GJ).Scenario ER was, therefore, the preferred technique. The mainadvantages and disadvantages of each scenario are summarisedin Table 17.
The EC and EE of construction materials were the predominantcontributors to the overall EC and EE of Scenario S (i.e. 86.4% (i.e.21,857 tCO2eq) and 88.1% (i.e. 144,855 GJ), respectively) (Fig. 11).This was mainly due to the use of a blend of 75% CEM 1 and 25%GGBS as a stabiliser. The effect of an alternative binder combina-tion is discussed in Section 6.3. On the other hand, no cementitiousmaterial was used in Scenario ER, hence the contribution of mate-rials to total EC and EE for Scenario ER was lower at 12.1% (i.e.2132 tCO2eq)and 65.9% (i.e. 35,962 GJ), respectively. The construc-tion of a piled embankment section in Scenario ER + P was anenergy intensive procedure due to the relatively high EC and EEcost of reinforced concrete piles and pile caps. The contributionof materials to overall EC and EE for Scenario ER + P was therefore34.4% (i.e. 5986 tCO2eq) and 77.6% (i.e. 71,933 GJ), respectively.
Shipment of steel reinforcement from the UK to the site in Ire-land for the pile caps and piles, as well as the requisite aggregatefrom local quarries caused Scenario ER + P to have the highest EC(i.e. 1595 tCO2eq) and EE (i.e. 19,275 GJ) for transport. Scenario Srequired a lower volume of materials (binder) than the other sce-narios; and as the binder was sourced in Ireland, it had the lowestEC (i.e. 1257 tCO2eq) and EE (i.e. 15,192 GJ) for transport. Theglobal warming potential of operating machinery, however, washighest in Scenario S (i.e. 357 tCO2eq), primarily due to the stabil-ising machinery (i.e. 350 tCO2eq). In Scenario ER + P, the piling
y Direct Emissions
Indirect emissions
Restora�on
EC for Scenario ER + P.

Fig. 11. (a) Comparison of total EC of the three scenarios investigated in this study, and (b) comparison of total EE of the three scenarios.
Table 16Land area required for some features required for the three ground improvementscenarios where the restoration scenario is a naturally regenerated woodland.
Scenario name PDAs (m2) Drainage ditches (m2) Ponds (m2)
Scenario ER 93,305 3890 1656Scenario S 14,805 1730 362Scenario ER + P 65,805 2945 927
A.R. Duggan et al. / Construction and Building Materials 79 (2015) 402–419 415
machinery had a relatively high EC value (i.e. 77 tCO2eq) comparedto the excavator (i.e. 37 tCO2eq), which was used extensively inScenario ER.
While the optimal method will always depend on the site andconstruction scenario, the least preferred technique for this studywas Scenario S as it had the highest EC and EE due to the highEE and EC intensities of the binder. It also had the lowest on-siteand environmental impact on local surroundings of the three sce-narios, as the majority of the peat remained in situ. Scenario ER hadthe highest on-site and negative environmental impact on localsurroundings due to high levels of peat excavation, which isreflected in the high direct and restoration emissions. These emis-sions accounted for 61.6% (10,885 tCO2eq) and 16.3% (2886 tCO2-
eq) of the total EC, respectively, as more land was required forpeat disposal areas, drainage ditches and ponds than either ofthe other scenarios (Fig. 11(a)) (Table 16). In Scenario ER + P andScenario S, direct emissions accounted for only 31.9% (5537 tCO2-
eq) and 2.3% (581 tCO2eq), respectively, as less land was needed.Restoration emissions for Scenario ER + P and Scenario S were22.8% (3970 tCO2eq) and 3.9% (997 tCO2eq) of the total EC, respec-tively. The management of peat during and after construction isdiscussed in Sections 6.4 and 6.6.
6.3. Materials – binder
Materials can represent a high environmental cost in a roadconstruction project. In Scenario S, they amounted to 86% of total
Table 17Main advantages and disadvantages of each scenario.
Scenario Advantages
ER � Materials were of low EC and EE intensity� Emissions from transport were low as quarries nearby� Low machinery emissions
S � Low on-site impact due to peat remaining in situ.� Alternative binder combinations have the potential to have low EC an
intensitiesER + P � Where sections were piled, peat remained in situ—less environm
impact� Some materials such as aggregate were locally sourced and are of lo
and EE intensity
EC, with the binder accounting for 97% of this figure. Timoneyet al. [62] showed that 1:3 cement to GGBS mixes can produce highstabilised peat strengths; therefore, it may have been possible touse less energy-intensive binders giving sufficiently high strengths.Ordinary Portland cement (OPC) has an EE intensity of three timesgreater than that of GGBS and an EC intensity of approximately 11times greater than GGBS [21]. Scenarios of 1:1 and 1:3 cement toGGBS ratios were examined for the Pollboy section. Results showthat EC costs can be reduced considerably to a level where the totalEC in Scenario S is lower than the other scenarios (Fig. 12(a)). How-ever, EE costs are still higher than the other two ground improve-ment scenarios (Fig. 12(b)), though in recent years cement has adecreasing clinker content, which would further reduce EC andEE costs.
6.4. Management of excavated peat
Around 600,000 m3 of peat was excavated along the 56 kmroute, 115,000 m3 of which was from the Pollboy section. ScenarioER and Scenario ER + P had significantly higher levels of excavatedpeat and greater on-site impacts than Scenario S. For example, thelargest EC component of Scenario ER was direct emissions at 62%(10,885 tCO2eq) while restoration emissions accounted for 16%(2886 tCO2eq). By using other restoration techniques, it is possibleto reduce these percentages significantly. Rather than growing abirch/willow woodland on the peat disposal areas, which was amajor contributor of CO2, afforestation with Sitka spruce or peat-land restoration could be undertaken.
By growing Sitka spruce, substantial amounts of CO2 can besequestered in the 120-year life cycle. Sitka spruce is a tree speciesthat has a yield class ranging from 10 m3 ha�1 year�1 to 24 m3
ha�1 year�1 and is a source of income when it is thinned and har-vested [56]. For this study, a carbon uptake emission factor of�30 tCO2eq ha�1 year�1 was used (Fig. 13). The figure is based onan average of studies undertaken on Sitka spruce forests on organic
Disadvantages
� High on-site impact� Depending on organic content, carbon emissions from excavated peat
may be high
d EE� Binder had a high EC and EE intensity due to high levels of cement
used� Stabilising machinery environmentally intensive
ental
w EC
� High EC and EE intensity for piles due to concrete and imported steel� Piling machinery environmentally intensive

Fig. 12. (a) Bar chart showing how different binders compare with total EC, (b) bar chart showing how different binders compare with total EE.
416 A.R. Duggan et al. / Construction and Building Materials 79 (2015) 402–419
soils in Ireland (e.g. �29 tCO2eq ha�1 year�1, Wilson and Farrell[26] to �32 tCO2eq ha�1 year�1, Black and Farrell [56]). Lossesdue to soil emissions were assumed to be at the same rate as soilemissions from birch/willow woodlands; that is, 20 tCO2eq ha�1
year�1 (Table 7). Losses due to harvesting and thinning were notaccounted for.
In Ireland’s current climate there is a high probability that peat-land restoration will serve as a small sink. Uptake by undisturbedpeatlands in Ireland has been reported from between �0.47tCO2eq ha�1 year�1 by Kiely et al. [54] and �1.1 tCO2eq ha�1 year�1
by Koehler et al. [12]. For the current study, a lower boundlong-term emission factor of �0.5 tCO2eq ha�1 year�1 was usedto account for climate change, which will have a negative impacton carbon uptake. In this restoration technique it was assumedthat 50% of the carbon in the excavated peat was released as CO2
due to the agitation (breakup) of peat during transport and, moreimportantly, to the length of time it takes to restore a peatland,estimated at 20 years by the IPCC [55].
Depending on groundwater vulnerability, another option todeal with removed peat is to dump and bury it in decommissioned
quarries and borrow pits. Two cases and two assumptions for eachscenario were examined for this site where excavated peat wasplaced at depth and under the water table, therefore retainingmuch of its carbon. In the first instance, it was assumed that ifthe peat is kept below the water table for 120 years, 90% of the car-bon would remain intact. In the second case, only 50% of the car-bon in the peat would remain because the disposed peat is overand under the water table at different periods. In both cases, indi-rect emissions were assumed to be zero because it was assumedthat emissions would be zero had the peat not been disposed ofin these areas. Also factored into the aforementioned cases wasthe fact that due to the lack of peat disposal areas, ponds werenot constructed and fewer drainage ditches were required.
The options described above to cater for the excavated peatwere examined in terms of EC (Fig. 13). Results show that affores-tation with Sitka spruce seems to be the most promising andrewarding in terms of EC, with total EC ranging from �8532 tCO2eqin Scenario ER to 21,220 tCO2eq in Scenario S. Burying the peat per-manently under the water table and peatland restoration were alsoquite positive for Scenario ER, with EC totalling 4359 tCO2eq and

Fig. 13. Total EC showing various restoration scenarios normalised to Scenario ER (birch/willow woodland) over the 120-year life cycle.
A.R. Duggan et al. / Construction and Building Materials 79 (2015) 402–419 417
7939 tCO2eq, respectively. Fig. 13 shows that EC is heavily influ-enced by the extent of excavation of peat. When examining resto-ration options, it is important to use the emission factors presentedas guidelines only. Further work is required to define country-spe-cific emission factors more accurately.
6.5. Carbon credits
Under the Kyoto Protocol, carbon credits generated from peat-land restoration and afforestation can be traded as a commodityand have a mandatory and voluntary market value, with the high-est potential sale value being achievable on the voluntary markets.Carbon credits were sold at prices ranging from €6.22/tCO2eq to€6.40/tCO2eq at the start of 2013 [63], a decrease from a high in2008 of €25/tCO2eq [64]. A study was carried out on Irish peatlandrestoration by Wilson et al. [65] where a carbon credit price of €20was assumed. At this value, if a peatland had been restored at thePollboy section as part of the construction process and the peat-land had a sink of 0.5 tCO2eq ha�1 year�1 for the 120-year lifecycle, €1200 per hectare could have been earned.
6.6. Construction on undisturbed peatland
Had the peatland at Pollboy been undisturbed and not drained,Scenarios ER would have had a higher environmental impact dueto construction, resulting in an increasing total EC. The peatlanddirectly affected by excavation would have continued sequesteringCO2 over the 120 years had the road and drainage system not beenbuilt. The peatland would also have changed from a sink to asource of CO2 due to the extent of drainage. The drainage systemalong the road and around peat disposal areas is vast, making itproblematic to estimate the area affected by drainage. In essence,had there been a drain either side of the road in the peat exca-vate-and-replace scenario, an area of 6.25 ha would have beendamaged, releasing 1040 tCO2eq over the road’s lifetime at anemission rate of 1.39 tCO2eq ha�1 year�1. Furthermore, had thepeatland not been disturbed, the carbon-fixing potential wouldhave been 375 tCO2eq. Together, the added EC cost of indirectemissions and the carbon-fixing potential represent an additional8% of the overall EC total of Scenario ER in this LCA.
6.7. The cost of performing a study
An important consideration for a company wishing to performthis specific type of environmental LCA would be the time and skillrequired and the accessibility of data. The more information a com-pany has on a project, the more comprehensive an LCA calculationit can undertake. Once the site investigation documents are com-pleted and the geotechnical issues are brought forward in thedesign stage, the data needed for this calculation will be readilyavailable in these documents and will help in deciding whichground improvement scenario to use.
The basic components needed for the materials, transport, andmachinery factors should be the most straightforward to obtain.Finding EC and EE intensities for fuel and materials, such as aggre-gate and cement can be obtained from databases, such as theInventory of Carbon and Energy Version 2.0 (ICE V2.0) [21] andGuidelines to Defra/DECC’s GHG Conversion Factors for CompanyReporting [30]. For the peat-related factors, the following informa-tion is needed: the volume of peat excavated, the size and numberof peat disposal areas required, the size of drainage systems (pondsand drainage ditches), the proposed restoration techniques and thepeatland type (drained or undisturbed). Using the emission factors,extent of drainage equation and the methodology presented in thispaper, an EC value for direct, indirect and restoration emissions foreach scenario can be obtained. Although a user friendly tool/calcu-lator to quantify the main peat-related factors for construction ofroads on peatlands would be useful, this paper outlines ways oftackling each factor, which can be subsequently assimilated in aspreadsheet.
6.8. Other notes
Additional carbon costs not considered in this LCA include:maintenance, fencing, road markings and signs, asphalt concreteand pavement layers, subgrade preparation (compaction) andwork on link and side roads and structures such as the overpassbridge at Ch. 52,900. Another factor not examined was the numberof workers that would be needed for each ground improvementtechnique. Soil-mixing would probably have required fewer per-sonnel than peat excavate-and-replace or piling methods but

418 A.R. Duggan et al. / Construction and Building Materials 79 (2015) 402–419
would have a minimal influence on the method chosen from an EE/EC point of view. With reference specifically to peat-related factors,direct emissions would have been 23,408 tCO2eq, 2.2 times higherhad the peat, for example, an average organic content of 85%,showing it to be a high-sensitivity variable. Ideally, climate changeshould also be accounted for; unfortunately, it was beyond thescope of this study. As temperatures rise, CO2 emissions from peat-lands will increase; Scenario ER + P and Scenario ER will be mostaffected as both deal with more excavated peat and have a greateron-site impact than Scenario S.
7. Conclusions
By examining all construction and peat-related factors, the LCAmethodology presented in this paper has clear potential to reducethe EE and EC of a road construction project on peat. Three groundimprovement technique scenarios were assessed in terms of EEand EC, allowing the major contributions to be highlighted. Resto-ration techniques and other methods of reducing these factorswere then examined. From the calculations presented, the mainconclusions are:
� The method that was undertaken for the Pollboy contractamounted to an EC of 8047 tCO2eq/km and EE of 25,487 GJ/km. This is over 6 times greater in EC and 1.6 times greater inEE than the cost of building an asphalt pavement for a 26 mwide two-lane motorway whose EC and EE were 1300 tCO2eq/km and 15,600 GJ, respectively [11]. For context, it is also over5 times greater than the cost of building an asphalt pavementfor a 28 m wide two-lane motorway (1574 tCO2eq/km) [10]and 119 times greater than building a 3 m wide greenway(67.6 tCO2eq/km) [66].� The biggest EC component in peat excavate-and-replace was
direct emissions from excavated peat, signalling the importanceof how excavated peat should be managed.� Scenario ER was the favoured technique for this project as it had
similar EC to Scenario ER + P and the lowest EE. Scenario ER + P,ranked second, with an EE of 1.7 times greater than Scenario ER,due to the energy intensive procedure of building a piledembankment. Scenario S, on the other hand, had both the high-est EC and EE and was, therefore, the least desirable solution.The EE total of materials in Scenario S was twice as high in Sce-nario ER + P and 4 times greater than Scenario ER due to the EEintensity of cement.� Employing a variety of restoration techniques can substantially
reduce restoration, direct and indirect emissions and provide anincome from the sale of carbon credits.� Indirect emissions can fluctuate according to the type of peat-
land the road is built on whether, for example, it is an undis-turbed peatland, drained peatland, drained grassland peatland,or forest peatland.� Soil-mixing in Scenario S had the lowest onsite and environ-
mental impact on the local surroundings in direct and indirectemissions, but the binder used in stabilising the peat repre-sented 86% of the EC total. As a result, the total EC was 1.47and 1.48 times larger than in Scenario ER and Scenario ER + P,respectively, and the total EE was 3.01 and 1.77 times higherthan Scenario ER and Scenario ER + P, respectively. However,the use of an alternative 1:3 cement to GGBS binder split, ifappropriate from a strength viewpoint, reduces total EC by48% and total EE by 33%.
When the potential greenhouse gases released from peat arefactored in, building on peat and organic soils increases the EC costsubstantially compared to building a road on mineral soils. Each
ground improvement technique employed has advantages and dis-advantages. By carrying out various scenarios of EC calculations ona peatland site where one of the three techniques is used or wherecombinations of techniques are applied, optimum EC and EE solu-tions can be achieved in construction on peat. It is only by analys-ing these outcomes that the most appropriate solution can beproduced, as the preferred technique will change according tothe project and site location.
Acknowledgements
The authors thank the College of Engineering and Informatics atNational University of Ireland, Galway for their financial support.They would also like to thank the RPS Group Consulting Engineers,Galway, in particular Mr. Cian McGuinness for the data on the con-struction of the Pollboy study section. Finally, the authors wish toacknowledge the contributions of Allu, LCM (Keller Grundläggning)and Balfour Beatty Ground Engineering (BBGE) who providedinformation on soil stabilisation and piling machinery.
References
[1] National Roads Authority (NRA). NRA annual report 2010. Dublin, Ireland:NRA; 2010.
[2] Ward S, Connolly J, Walsh J, Dahlman L, Holden NM. Climate change –modelling carbon fluxes from Irish peatlands: towards the development of anational carbon fluxes inventory for Irish peatlands. Johnstown Castle,Wexford, Ireland: Environmental Protection Agency; 2007.
[3] Buggy F, Farrell ER. Geotechnical challenges in road construction in Ireland:2000–2010. In: Buggy F, Farrell ER, Quigley P, Robinson M, editors. Proceedingsof a conference on geotechnics on Irish roads, 2000–2010 – a decade ofachievement. Portlaoise, Ireland: Engineers Ireland; 2012. p. 1–15.
[4] Hebib S, Farrell ER. Some experiences on the stabilisation of Irish peats. CanGeotech J 2003;40(1):107–20.
[5] EPA (Environmental Protection Agency). Ireland’s greenhouse gas emissionsprojections 2011–2020. Johnstown Castle, Co. Wexford, Ireland: EPA; 2012.
[6] Acquaye A, Duffy A. Input–output analysis of Irish construction sectorgreenhouse gas emissions. Build Environ 2010;45(3):784–91.
[7] IPCC (Intergovernmental Panel on Climate Change). Climate change 2007:synthesis report. In: Pachauri RK, Reisinger A, editors. Contribution of workinggroups I, II and III to the fourth assessment report of the intergovernmentalpanel on climate change. Geneva, Switzerland: IPCC; 2007.
[8] Egan D, Slocombe B. Demonstrating environmental benefits of groundimprovement. Proc Inst Civil Eng Ground Improv 2010;163(1):63–9.
[9] Chau C, Soga K, O’Riordan N, Nicholson D. Embodied energy evaluation forsections of the UK channel tunnel rail link. Proc Inst Civil Eng Geotech Eng2012;165(2):65–81.
[10] Milachowski C, Stengel T, Gehlen C. Life cycle assessment for road constructionand use. Brussels, Belgium: European Concrete Paving Association; 2011.
[11] Chappat M, Bilal J. Sustainable development, the environmental road of thefuture: life cycle analysis. France: Colas Group; 2003.
[12] Koehler A, Sottocornola M, Kiely G. How strong is the current carbonsequestration of an Atlantic blanket bog? Global Change Biol 2011;17(1):309–19.
[13] Lindsay R. Peatbogs and carbon, a critical synthesis. London, UK:Environmental Research Group, University of East London; 2010.
[14] SNH (Scottish Natural Heritage). Windfarms and carbon savings. Technicalguidance note. Inverness, UK: SNH; 2000. p. 6.
[15] ASTM. ASTM standard D2974: standard test methods for moisture, ash andorganic matter of peat and other organic soils. West Conshohocken, PA: ASTMInternational; 2007.
[16] Schumacher BA. Methods for the determination of total organic carbon (TOC)in soils and sediment. US: Ecological Risk Assessment Support Center, Office ofResearch and Development, US Environmental Protection Agency; 2002.
[17] BSI (British Standards). BS ISO 14040:2006. Environmental management — lifecycle assessment — principles and framework. Brussels, Belgium: BSI; 2006.
[18] BSI (British Standards). BS ISO 14025:2006. Environmental labels anddeclarations — type III environmental declarations — principles andprocedures. Brussels, Belgium: BSI; 2006.
[19] BSI (British Standards). BS ISO 14044:2006. Environmental management — lifecycle assessment — requirements and guidelines. Brussels, Belgium: BSI; 2006.
[20] Jolliet O, Frischknecht R, Bare J, Boulay AM, Bulle C, Fantke P, et al. Globalguidance on environmental life cycle impact assessment indicators: findings ofthe scoping phase. Int J Life Cycle Assess 2014;19(4):962–7.
[21] Hammond G, Jones C. Inventory of carbon & energy Version 2.0 (ICEV2.0). Bath, UK: Department of Mechanical Engineering, University of Bath;2011.

A.R. Duggan et al. / Construction and Building Materials 79 (2015) 402–419 419
[22] IPCC (Intergovernmental Panel on Climate Change). In: Eggleston S, Buendia L,Miwa K, Ngara T, Tanabe K, editors. 2006 guidelines for national greenhousegas inventories, vol. 4. Japan: IGES; 2006 [chapter 7].
[23] Hall M. A guide to calculating the carbon dioxide debt and payback time forwind farms. London, UK: Renewable Energy Foundation; 2006.
[24] Nayak R, Miller D, Nolan A, Smith P, Smith J. Calculating carbon savings fromwind farms on Scottish peat lands—a new approach. London, UK: School ofBiological Science, University of Aberdeen, and Macaulay Land Use ResearchInstitute; 2008.
[25] Duggan AR, McCabe BA, Goggins J, Clifford E. Factors affecting embodiedcarbon and embodied energy associated with ground improvementtechniques for construction on peat. In: Proceedings of a conference onbridge & concrete research in Ireland. Ireland: Dublin Institute of Technology;2012. p. 147–52.
[26] Wilson D, Farrell EP. Carbal: carbon gas balances in industrial cutawaypeatlands in Ireland. Final report. Dublin: Forest Ecosystem Research Group,University College Dublin; 2007.
[27] RPS (RPS Group). Environmental impact statement (EIS) N6 Galway to EastBallinasloe. Galway, Ireland, vol. 1; 2004.
[28] National Roads Authority) (NRA). NRA manual of contract documents forroadworks, vol. 4. Dublin, Ireland: NRA; 2013.
[29] Highways Agency (HA). Design manual for road and bridges (DMRB), volume4, geotechnics and drainage, section 1 earthworks, geotechnical considerationsand techniques for widening highway earthworks HA 43/91. UK: TheHighways Agency; 1991.
[30] Defra and DECC (Department for Environment, Food and Rural Affairs andDepartment of Energy and Climate Change). Guidelines to Defra/DECC’s GHGconversion factors for company reporting. London, UK: Defra; 2012.
[31] Martikainen P, Nykanen H, Crill P, Sivola J. Effect of a lowered water table onnitrous oxide fluxes from northern peatlands. Nature 1993;366(6450):51–3.
[32] Stewart AJA, Lance AN. Moor draining: a review of impacts on land use. JEnviron Manage 1983;17(1):81–99.
[33] Hudson JA, Roberts G. The effect of a tile drain on the soil moisture content ofpeat. J Agric Eng Res 1982;27(6):495–500.
[34] Coulson JC, Butterfield JEL, Henderson E. The effect of open drainage ditches onthe plant and invertebrate communities of moorland and on thedecomposition of peat. J Appl Ecol 1990;27(2):549–61.
[35] Silins U, Rothwell RL. Forest peatland drainage and subsidence affect soil waterretention and transport properties in an Alberta peatland. Soil Sci Soc Am J1998;62(4):1048–56.
[36] Burke W. Drainage investigations on bogland: the effects of drain spacing onground water levels. Irish J Agric Res 1961;1(1):31–4.
[37] Stewart AJA, Lance AN. Effects of moor-draining on the hydrology andvegetation of Northern Pennine blanket bog. J Appl Ecol 1991;28(3):1105–17.
[38] Allott TEH, Evans MG, Lindsay JB, et al. Water table in peak district blanketpeatlands. Moors for the future partnership. Moors for the future Report No.17. Derbyshire, UK: The Moorland Centre; 2009.
[39] Heathwaite AL. Solute transfer from drained fen peat. Water Air Soil Pollut1990;55(3–4):379–95.
[40] Boelter DH. Water table drawdown around an open ditch in organic soils. JHydrol 1972;15(4):329–40.
[41] Holden J, Burt TP. Hydraulic conductivity in upland blanket peat:measurement and variability. Hydrol Processes 2003;17(6):1227–37.
[42] Prevost M, Belleau P, Plamondon AP. Substrate conditions in a treed peatland:responses to drainage. Ecoscience 1997;4(4):543–54.
[43] Gilman K. Hydrology and wetland conservation. London, UK: Wiley; 1994.[44] Hillman GR. Some hydrological effects of peatland drainage in Alberta’s boreal
forest. Can J For Res 1992;22(11):1588–96.[45] Minkkinen K, Laine J. Vegetation heterogeneity and ditches create spatial
variability in methane fluxes from peatlands drained for forestry. Plant Soil2006;285(1–2):289–304.
[46] Hendriks DMD, Van Huissteden J, Dolman AJ, van der Molen MK. The fullgreenhouse gas balance of an abandoned peat meadow. Biogeosciences2007;4(3):411–24.
[47] Schrier-Uijl AP, Veenendaal EM, Leffelaar PA, Van Huissteden JC, Berendse F.Spatial and temporal variation of methane emissions in drained eutrophic peatagro-ecosystems: drainage ditches as emission hotspots. Biogeosci Discuss2008;5(2):1237–61.
[48] Teh YA, Silver WL, Sonnentag O, et al. Large greenhouse gas emissions from atemperate peatland pasture. Ecosystems 2011;14(2):311–25.
[49] Schrier-Uijl AP, Veraart AJ, Leffelaar PA, Berendse F, Veenendaal EM. Release ofCO2 and CH4 from lakes and drainage ditches in temperate wetlands.Biogeochemistry 2011;102(1–3):265–79.
[50] Sundh I, Nilsson M, Mikkelä C, Granberg G, Svensson BH. Fluxes of methane andcarbon dioxide on peat-mining area in Sweden. Ambio 2000;29(8):499–503.
[51] Von Arnold K, Nilsson M, Hanell B, Weslien P, Klemedtsson L. Fluxes of CO2,CH4 and N2O from drained organic soils in deciduous forests. Soil Biol Biochem2005;37(6):1059–71.
[52] Worrall F, Reed M, Warburton J, Burt T. Carbon budget for a British upland peatcatchment. Sci Total Environ 2003;312(1–3):133–46.
[53] IPCC (Intergovernmental Panel on Climate Change). Revised 1996 IPCCguidelines for national greenhouse gas inventories. Bracknell, UK: IPCC; 1997.
[54] Kiely G, Leahy P, Sottocornola M, et al. Celticflux: measurement and modellingof greenhouse gas fluxes from grasslands and a peatland in Ireland. Co.Wexford, Ireland: Environmental Protection Agency (EPA); 2009.
[55] IPCC (Intergovernmental Panel on Climate Change). In: Penman J, Gytarsky M,Hiraishi T, et al., editors. Good practice guidance for land use, land-use changeand forestry. Japan: IGES; 2003.
[56] Black KG, Farrell EP. Carbon sequestration and Irish forest ecosystems. Dublin,Ireland: COFORD; 2006.
[57] Dykes A, Warburton J. Mass movements in peat: a formal classificationscheme. Geomorphology 2007;86(1–2):73–93.
[58] Papadakis VG, Vayenas CG, Fardis MN. Experimental investigation andmathematical modelling of the concrete carbonation problem. Chem Eng Sci1991;46(5–6):1333–8.
[59] Adams JI, Hanna TH. Ground improvements due to pile driving. In:Proceedings of a conference on the behaviour of piles. London, UK:Institution of Civil Engineers; 1970. p. 127–33.
[60] Cooke R, Price G. Strains and displacements around friction piles. In:Proceeding of the 8th international conference on soil mechanics andfoundation engineering, vol. 2.1. Moscow; 1973, pp. 53–60.
[61] Goggins J, Keane T, Kelly A. The assessment of embodied energy in typicalreinforced concrete building structures in Ireland. Energy Build 2010;42(5):735–44.
[62] Timoney MJ, Quigley P, McCabe BA. Some laboratory soil mixing trials of Irishpeat ISSMGE-TC 211. In: Denies N, Huybrechts N, editors. InternationalSymposium on Ground Improvement (IS-GI), vol. 2. Belgium: IS-GI Brussels;2012. p. 511–20.
[63] Vitelli A. EU carbon permits pare early losses, tracking German 2014power. Bloomberg; 2013. see <http://www.bloomberg.com/news/2013-01-03/european-union-carbon-dioxide-permits-decline-to-one-month-low.html> [accessed 06/01/2013].
[64] Sethuraman D, Obiko Pearson N. Carbon credits becoming ‘Junk’ before 2013ban closes door: energy markets. Bloomberg; 2011. see <http://www.bloomberg.com/news/2011-12-06/carbon-credits-becoming-junk-before-2013-ban-closes-door-energy-markets.html> [accessed 06/01/2013].
[65] Wilson D, Renou-Wilson R, Farrell C, Bullock C, Müller C. Carbon restore – thepotential of restored Irish peatlands for carbon uptake and storage. Co.Wexford, Ireland: EPA; 2012.
[66] Manton R, Duggan AR, Goggins J, Clifford E. Carbon costs and saving ofgreenways: creating a balance sheet for the sustainable design andconstruction of cycling routes. J Environ Sustainable Dev 2014;13(1):3–19.