An Efficient Low-Cost Energy Smart Meter and Power Quality ...
13
Article OpenZmeter: An Efficient Low-Cost Energy Smart Meter and Power Quality Analyzer Eduardo Viciana, Alfredo Alcayde , Francisco G. Montoya * , Raul Baños , Francisco M. Arrabal-Campos, Antonio Zapata-Sierra and Francisco Manzano-Agugliaro Department of Engineering, University of Almeria, 04120 Almeria, Spain; [email protected] (E.V.); [email protected] (A.A.); [email protected] (R.B.); [email protected] (F.M.A.-C.); [email protected] (A.Z.-S.); [email protected] (F.M.-A.) * Correspondence: [email protected]; Tel.: +34-950-214501 Received: 12 October 2018; Accepted: 2 November 2018; Published: 4 November 2018 Abstract: Power quality and energy consumption measurements support providers and energy users with solutions for acquiring and reporting information about the energy supply for residential, commercial, and industrial sectors. In particular, since the average number of electronic devices in homes increases year by year and their sensitivity is very high, it is not only important to monitor the total energy consumption, but also the quality of the power supplied. However, in practice, end-users do not have information about the energy consumption in real-time nor about the quality of the power they receive, because electric energy meters are too expensive and complex to be handled. In order to overcome these inconveniences, an innovative, open source, low-cost, precise, and reliable power and electric energy meter is presented that can be easily installed and managed by any inexperienced user at their own home in urban or rural areas. The system was validated in a real house over a period of two weeks, showing interesting results and findings which validate our proposal. Keywords: electric energy meter; power quality analyzer; smart meter; low-cost; open source; energy consumption; monitoring; sustainable energy 1. Introduction Electric energy meters are devices that are often installed in buildings and businesses in order to measure the amount of consumed electric energy [1] (i.e. these meters are installed for billing purposes [2]). However, the increasing awareness about energy consumption is not the only concern today [3]. The quality of the supplied energy is also an important feature, so it is necessary to introduce new technologies that provide end-users with up-to-date, online, real-time information about the quantity and quality of the power supply they receive from the utility [4]. There are several commercial and research devices [5,6] that can be used to either measure the electric energy consumption or the power quality (PQ; power quality analyzers). Further, there are devices that integrate both functions, such that they include application software to download, analyze, and report energy consumption and power quality data. For example, some power quality analyzers are used by engineers, electricians, maintenance, and facilities technicians to record power quality, carry out diagnostic work on electrical systems or devices, identify energy waste in facilities (in kilowatt hours, kWh), and detect and prevent power issues before they happen. Unfortunately, they are expensive and difficult to use for unskilled users, being utilized to carry out advanced energy saving audits. We firmly believe that the introduction of new technologies based on the open source paradigm can help users to better understand how to interact with electrical devices. In this sense, the information traditionally provided by utilities has made it difficult to consider efficient energy saving scenarios. Sustainability 2018, 10, 4038; doi:10.3390/su10114038 www.mdpi.com/journal/sustainability
-
Upload
khangminh22 -
Category
Documents
-
view
2 -
download
0
Transcript of An Efficient Low-Cost Energy Smart Meter and Power Quality ...
Article
OpenZmeter: An Efficient Low-Cost Energy SmartMeter and Power Quality Analyzer
Eduardo Viciana, Alfredo Alcayde , Francisco G. Montoya * , Raul Baños ,Francisco M. Arrabal-Campos, Antonio Zapata-Sierra and Francisco Manzano-Agugliaro
Department of Engineering, University of Almeria, 04120 Almeria, Spain; [email protected] (E.V.);[email protected] (A.A.); [email protected] (R.B.); [email protected] (F.M.A.-C.); [email protected] (A.Z.-S.);[email protected] (F.M.-A.)* Correspondence: [email protected]; Tel.: +34-950-214501
Received: 12 October 2018; Accepted: 2 November 2018; Published: 4 November 2018�����������������
Abstract: Power quality and energy consumption measurements support providers and energyusers with solutions for acquiring and reporting information about the energy supply for residential,commercial, and industrial sectors. In particular, since the average number of electronic devices inhomes increases year by year and their sensitivity is very high, it is not only important to monitor thetotal energy consumption, but also the quality of the power supplied. However, in practice, end-usersdo not have information about the energy consumption in real-time nor about the quality of the powerthey receive, because electric energy meters are too expensive and complex to be handled. In order toovercome these inconveniences, an innovative, open source, low-cost, precise, and reliable powerand electric energy meter is presented that can be easily installed and managed by any inexperienceduser at their own home in urban or rural areas. The system was validated in a real house over aperiod of two weeks, showing interesting results and findings which validate our proposal.
Keywords: electric energy meter; power quality analyzer; smart meter; low-cost; open source;energy consumption; monitoring; sustainable energy
1. Introduction
Electric energy meters are devices that are often installed in buildings and businesses in orderto measure the amount of consumed electric energy [1] (i.e. these meters are installed for billingpurposes [2]). However, the increasing awareness about energy consumption is not the only concerntoday [3]. The quality of the supplied energy is also an important feature, so it is necessary to introducenew technologies that provide end-users with up-to-date, online, real-time information about thequantity and quality of the power supply they receive from the utility [4].
There are several commercial and research devices [5,6] that can be used to either measure theelectric energy consumption or the power quality (PQ; power quality analyzers). Further, there aredevices that integrate both functions, such that they include application software to download, analyze,and report energy consumption and power quality data. For example, some power quality analyzersare used by engineers, electricians, maintenance, and facilities technicians to record power quality,carry out diagnostic work on electrical systems or devices, identify energy waste in facilities (inkilowatt hours, kWh), and detect and prevent power issues before they happen. Unfortunately,they are expensive and difficult to use for unskilled users, being utilized to carry out advanced energysaving audits. We firmly believe that the introduction of new technologies based on the open sourceparadigm can help users to better understand how to interact with electrical devices. In this sense,the information traditionally provided by utilities has made it difficult to consider efficient energysaving scenarios.
Sustainability 2018, 10, 4038; doi:10.3390/su10114038 www.mdpi.com/journal/sustainability
Sustainability 2018, 10, 4038 2 of 13
In this paper, openZmeter (oZm), an efficient low-cost single-phase smart electric energy meterand power quality analyzer is presented. oZm is the result of six years of research under the supervisionof the research group TIC221 of the University of Almeria. Thanks to a multidisciplinary group ofcomputer and electrical engineers, it has been possible to design and build an advanced device thatcombines and improves many features of much more expensive commercial devices under the aegis ofopen source software. This is a low-cost device because it can be assembled for less than 50 USD. It canalso be easily installed in buildings to retrieve and process a large amount of information regardingthe power supply and energy consumption. The consumption pattern and power quality events arevisualized through a user-friendly supervisory control and data acquisition (SCADA) system thanksto the implementation of a simple and intuitive interface that people without technical knowledge caneasily understand.
It provides advanced usage statistics that other devices cannot provide in an affordableand structured way. It can help to find energy consumption patterns thanks to its multiplevisualizations. The power required and the energy consumed can be analyzed together in such away that the user can determine, for example, whether they are demanding less power than that whichis actually contracted.
The rest of the paper is organized as follows: Section 2 presents a brief overview of electricenergy metering. Section 3 presents the designed single-phase smart electric energy meter and powerquality analyzer, including the technical specifications and the installation procedure in buildings.Section 4 presents an analysis of its usage in a real environment, while the main conclusions aresummarized in Section 5.
2. An Overview of Electric Energy Metering
Since energy consumption is becoming more prevalent in residential, commercial, and industrialinstallations, the research in this topic has become significant in recent years. In particular, the risingenergy prices are promoting higher levels of energy efficiency, which requires an accurate quantificationand management of energy consumption. The energy management requirements at both servicesupplier and consumer sides promoted the evolution of smart grids [7], with the aim of reducing thegeneration and operation costs in power systems and the hydrocarbon emissions [8]. The smart grid isthe evolution of the electrical grid thanks to using new technologies that increase the efficiency of thesystem and minimize outages. A smart grid is an electrical grid which includes a variety of operationaland energy measures including smart meters and efficient energy resources, including renewableenergy. These devices allow the electricity supplied to consumers to be controlled via two-way digitalcommunication. Smart cities, smart buildings, and smart homes also play a key role in the new era ofsmart connected devices.

Sustainability 2018, 10, 4038 3 of 13
Smart metering favors the efficient use of energy resources by providing high-resolution data [9],such that this equipment is essential to study electrical installations and energy consumption inindustrial [10], commercial [11], and residential [12] environments. In particular, real-time activityrecognition for energy efficiency in buildings is a critical issue to design better buildings and automationsystems [13]. In addition to the use of electric energy meters to retrieve information about theenergy consumption, power quality monitoring is another important issue to be addressed [14].Power quality analyzers allow the measurement of a wide variety of power quality parameters andevents, including harmonic distortion and short-term disturbances such as transients, voltage sag,and swell or power-line flicker.
Many papers have analyzed the use of electric energy meters [15] and power quality analyzers [10]in different environments. Although there are many commercial electric energy meters and powerquality analyzers, they are often expensive and difficult to use for the average consumer, beingmainly used by engineers and technicians to perform maintenance activities or energy audits [16].Only a few authors have proposed the use of low-cost devices to perform these tasks. For example,authors in [17] presented a portable battery-powered energy-logger circuit to monitor the energyharvested by different piezoelectric converters. Other researchers have designed devices that includethe functionalities of a power quality analyzer, an event logger, a synchronized phasor measurementunit, and an inter-area oscillation identifier [18]. Recently, a metering system that measures the reactiveenergy component through the Hilbert transform in low-cost measuring devices was presented [19].A low-cost power quality analyzer based on frequency analysis was described in [20] for monitoringthe power supply waveform and to detect some power quality events. The OpenEnergyMonitor isanother open source home energy monitoring system for analyzing real-time power use and dailyenergy consumption [21]. The key role of open source systems is also revealed in [22], where smartmeters and an energy management system are integrated in the smart grid context. The increasingtrend that open source resources constitute nowadays is evidenced not only for energy measurement,but for a number of scopes as shown in [23–26].
Being an open source system, you can add interesting features such as non-intrusive loadmonitoring (NILM), new statistics, etc., which cannot be done in closed and commercial systems.Although there are some other devices on the market, they generally have much lower functionalities.The energy monitors present on the market perform very basic functions and estimate energy withgreat error. oZm meets several international standards (e.g., IEC 62052 regarding energy metering) andguarantees a very small error in measurement. It is also very versatile and can display informationfrom different sources and scopes. As shown in Table 1, oZm outperforms some very well knowsmart devices on the market, being the only one to simultaneously measure power, energy, frequency,voltage, current, harmonics, phase, power factor, THD, phasors, and many more. It is also the onlyopen source system with an application programming interface (API) that allows real-time prices to beobtained from national utilities (e.g., REE in Spain) or wide set options for network communicationbased on Linux reliability.

Sustainability 2018, 10, 4038 4 of 13
Table 1. Feature comparison between commercial and open source meters.
oZm (openZmeter) Flukso OpenEnergyMonitor OpenPowerQuality Geo Minim Current Cost Efergy Alertme Wibeee Sense Energy Monitor CURB PQUBE3 Smapee Neurio
Active Energy Yes Yes Yes No Yes Yes Yes Yes Yes Yes Yes Yes Yes YesReactive Energy Yes No No No No No No No No No No Yes No No
Active Power Yes Yes Yes No Yes No Yes Yes Yes Yes Yes Yes Yes YesReactive Power Yes No No No No No No No No No No Yes No NoApparent Power Yes No Yes No No No No No No No No Yes No No
Frequency Yes No No Yes No No No No No No No Yes No NoRMS Voltage Yes No Yes Yes No No No No Yes No No Yes Yes YesRMS Current Yes No Yes No No No No No Yes Yes No Yes Yes YesPower Factor Yes No No No No No No No No No No Yes No No
Angle Yes No No No No No No No No No No Yes No NoVoltage Events Yes No No Yes No No No No No No No Yes No No
4 Quadrant Yes No No No No No No No No Yes Yes Yes No YesEN50160 Yes No No No No No No No No No No Yes No No
IEC61000-4-30 Yes No No Yes No No No No No No No Yes No NoHigh Samp. Rate Yes No Yes Yes No No No No No Yes Yes Yes No No
Aggr. Interv. Yes No No No No No No No No No No No No NoHTML5 Interface Yes Yes Yes Yes No No No Yes Yes Yes Yes No Yes Yes
Alert System Yes No No Yes No No No No Yes Yes Yes No Yes YesITCI/CBEMA Yes No No Yes No No No No No No No No No NoZero Crossing Yes No Yes Yes No No No No No No No Yes No No
FFT Yes No No Yes No No No No No Yes No Yes No NoHarmonics Yes No No Yes No No No No No No No Yes No No
THD Yes No No Yes No No No No No No No Yes No No4G Yes Yes No No No No No No No No No No No No
Wi-Fi Yes Yes Yes No Yes No No No Yes Yes Yes No Yes YesEthernet Yes Yes Yes Yes No No No Yes No No No Yes No No
API Yes Yes Yes No No No No No No No No No No NoRealtime Pricing Yes No No No Yes No No Yes No No No No No No
Phasor Yes No No No No No No No No No No No No NoTelegram Yes No No No No No No No No No No No No No
Open Source Yes Yes Yes Yes No No No No No No No No No No

Sustainability 2018, 10, 4038 5 of 13
3. The openZmeter (oZm)
In this section, the physical layout is described and technical specifications of the open-sourceand open-hardware smart electric energy meter and power quality analyzer are presented, under thename of “openZmeter” (oZm, read as “open zeta meter”).
3.1. Physical Layout
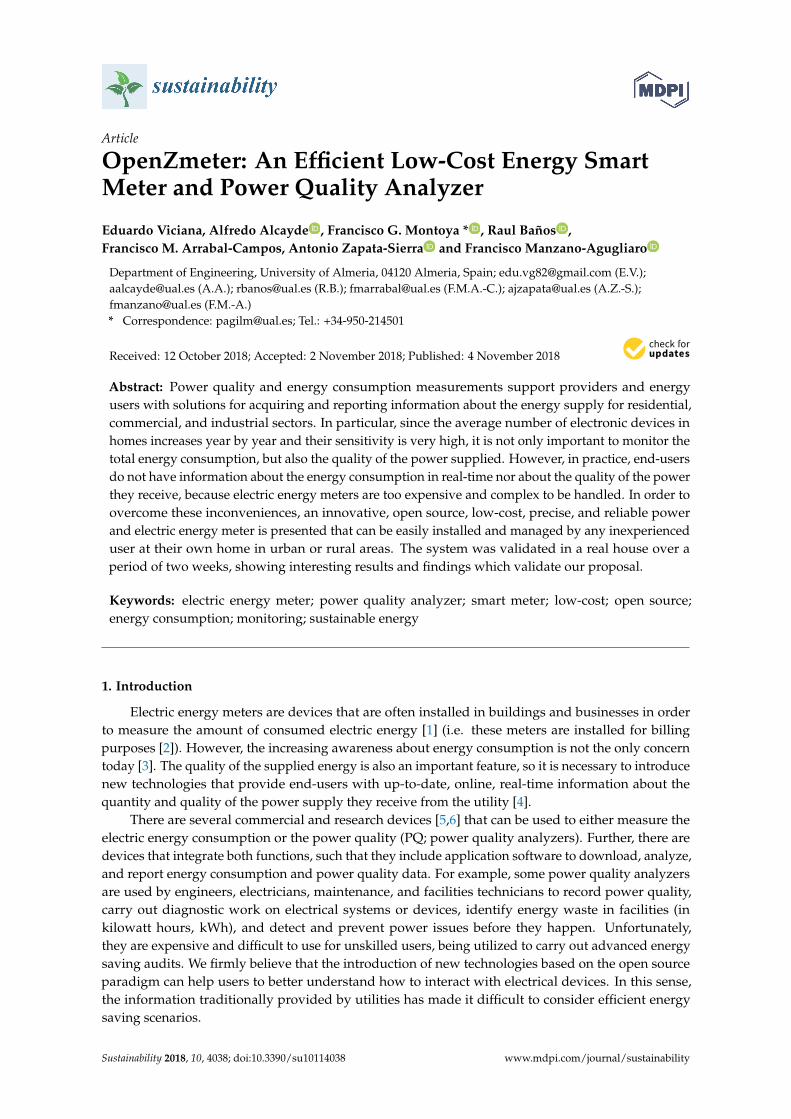
Figure 1 shows the general scheme of the single-phase oZm and a picture of the real device.oZm has an analog front end (AFE) that is responsible for capturing the voltage and current waveforms.The voltage is acquired using a simple resistive divider (0.1% and 100 ppm/ºC tolerances) that cutdown the 120/230 voltage to a much smaller input value suited for the onboard analog-to-digitalconverter (ADC). The current is measured by an integrated Hall-effect (Infineon TLI4970) sensor up to50 A of peak value and 1% precision (factory calibrated). Current clamp sensors or Rogowsky coilscan also be used to measure hundreds or thousands of amperes in bigger buildings. Both Hall effectand current clamp/Rogowsky current channels are synchronized with the voltage resistor usingsoftware-corrected algorithms (maximum deviation is less than 0.5 µs) to avoid significant phase errors.The oZm device is powered directly by the grid using an isolated AC/DC source, which provides all thenecessary energy for the circuitry. A lithium-ion battery is also used to power the board and keep thesystem running for hours in under-voltage or interruption conditions. When main power is restored,the system switches automatically (without restarting) and the battery is then recharged. The oZm hasgalvanic isolation for the voltage and current inputs and the ARM board through optocouplers.
(a) (b)
Figure 1. (a) Schematic diagram of the oZm; (b) Physical layout of the oZm.
Commonly used approaches for PQ monitoring and smart metering are widely based on the useof microprocessors, data acquisition cards, hybrids, and FPGA hardware. Each approach has its ownadvantages and drawbacks. In this case, the PQ monitoring and smart metering device is designed bycoupling a Linux ARM board and an AFE managed by an STM32 microcontroller. The ARM Linuxcontroller is easy to manage, and it is also low cost. The ARM Linux gives much more flexible softwarecompared to any other device. We use the NanoPi Neo Air ARM board, which is a powerful systemequipped with an H3 Allwinner Cortex-A7 quad-core at 1.2 GHz and 512 MB of DDR3 RAM.
Due to space limitations, it is difficult to conveniently detail all the components used as wellas their structure and price (though it is worth mentioning that the ARM board is about 20 USD).The interested reader can go to https://gitlab.com/zredalmeria/openZmeter/wikis/home (accessed

Sustainability 2018, 10, 4038 6 of 13
on 8 May 2012), where there is a detailed list of components and the functionality of each element ofthe AFE and ARM.
3.2. Technical Specifications
The accuracy of the measurement results depends on the correctness of the measurementalgorithms implemented in the meter and the quality of its calibration [27], along with the qualityand accuracy of the external probes used. The oZm fulfills these requirements by implementinga voltage divider for the voltage stage and a Hall-effect sensor with less than 1% error (calibratedfrom factory). The algorithm was implemented from scratch, combining our code with open sourcelibraries. The system runs a Debian Linux operating system where some well-known open sourcelibraries are used, such libmicrohttpd, postgresql, etc. (we refer the reader to our wiki mentionedabove). All the data are stored locally thanks to the onboard EMC memory with up to 16 GB capacity.An SD card can also be added to extend the storage. This implies that oZm is completely autonomousand there is no need to use any external cloud. In any case, an API is provided to send data to thecloud. Remote monitoring can also be accomplished in two ways, that is, using a telegram bot speciallydesigned to access the data in a simple and easy way or using a simple web browser (in this casethe local router should be configured properly or a VPN should be used) to connect to the local webserver which runs on top of the libmicrohttpd library. oZm implements a security feature to accessboth the web interface (user and password by default), https protocol, and encrypted data for APIcommunication. The main characteristics of oZm are:
• Free and open system: open source software and hardware;• Electrical measurements: effective voltage and current values, active, reactive, apparent and
distortion power, power factor, harmonics (up to order 50), active and reactive energy, frequency,voltage events (gaps, over-voltages, interruptions) in real-time and stored in database;
• Measurement in four quadrants to measure consumption and generation of energy. Valid forrenewable energy systems (e.g., photovoltaic, wind, etc.);
• Testing according to the international standards IEC 61000-4-30 and EN 50160. Voltage measurementwith precision of 0.1% for raw values. Frequency measurement with precision of 10 mHz (in therange 42.5–57.5 Hz). Current measurement up to 50 A (integrated Hall-effect sensor). Current clampor Rogowsky coil as an option;
• Sampling frequency of 15,625 Hz (64 µs between samples). Frequency measurement is performedusing a digital input filter to minimize noise and interharmonic components. According toIEC61000-4-30, 10 s of signal are taken and the zero crossing method is applied;
• Aggregation in the voltage channel of 10 cycles, 3 s, 10 min according to standard and one houras extra aggregation for energy;
• Cutting-edge web based on HTML5, CSS3, and JavaScript for data analysis and SCADA;• Alert system and event management (ITIC/CBEMA, frequency, over/under-voltage,
interruptions, etc.);• FFT integration, zero crossing, and RVC from scratch (Rapid Voltage Changes according to
IEC61000-4-30 with 5% threshold);• Time synchronization based on NTP time service. Time error less than 20 ms using Chronyd daemon.• User-friendly and powerful interface;• Modular, with the possibility of adding new capture modules;• Connectivity: USB ports (Wi-Fi dongle, 3G/LTE/4G, etc.), Ethernet port, and Wi-Fi. SPI, I2C,
UART and PWM are also available;• Connection to the grid operator’s information system (eSios) to get daily energy prices and
calculate the cost of energy in real-time;• Integration with Telegram applications for the generation of periodic reports and alerts in real time.
Remote access to relevant information;• Specific API for third-party integration based on JSON.

Sustainability 2018, 10, 4038 7 of 13
Despite the long list of features implemented in oZm, it is also necessary to note that there aresome limitations that must be taken into account, and that are often present in some open sourceprojects, such as the lack of technical support in hardware certification or the adoption of measures fora centralized mass deployment.
3.3. Building Configuration and Setup
The configuration of oZm can be easily achieved using Ethernet or Wi-Fi. The setup is typicallycarried out into the low-voltage circuit breaker panel of the building. Its placement and wiring issimilar to any traditional or modern electric energy meter, so that nominal voltage is applied to aninternal resistive divider that provides a low-voltage output linear to the input voltage for the ADC.The board tracks were precisely calculated for the current flowing through them. The width wascalculated to avoid heating caused by Joule effect losses. Figure 2 shows the oZm setup. It is easilyinstalled in any home circuit breaker panel. Moreover, the single-phase oZm can also be used in largebuildings, by placing several devices in different locations to optimally and robustly monitor theelectrical parameters [28].
Figure 2. Installation of oZm in the electric panel of a building.
4. Usage Analysis in a Real Environment
4.1. Description of the Environment
The data acquired from an oZm installation in a home were analyzed. Specifically, it was afamily home with two adults and three children. The house has 150 square meters in 5 rooms and

Sustainability 2018, 10, 4038 8 of 13
a list of home appliances including an oven, a dishwasher, a washing machine, television, electricwater heater, in addition to other electronic devices, plus 10 energy-saving light bulbs and 20 pointsof light (plugs) where other electronic devices such as laptops, tablets, or irons are sporadicallyconnected. In order to show the most interesting information obtained by oZm, measurements weretaken during two weeks (January–February 2018) every 200 ms (10 cycles of 50 Hz) as described in thefollowing subsection.
4.2. Data Analysis
The data collected allows information to be obtained about both the energy consumption andthe power quality. This information is first retrieved and analyzed using statistical tools [29], and theresults are then displayed in a powerful graphical interface that was specifically designed for oZm.
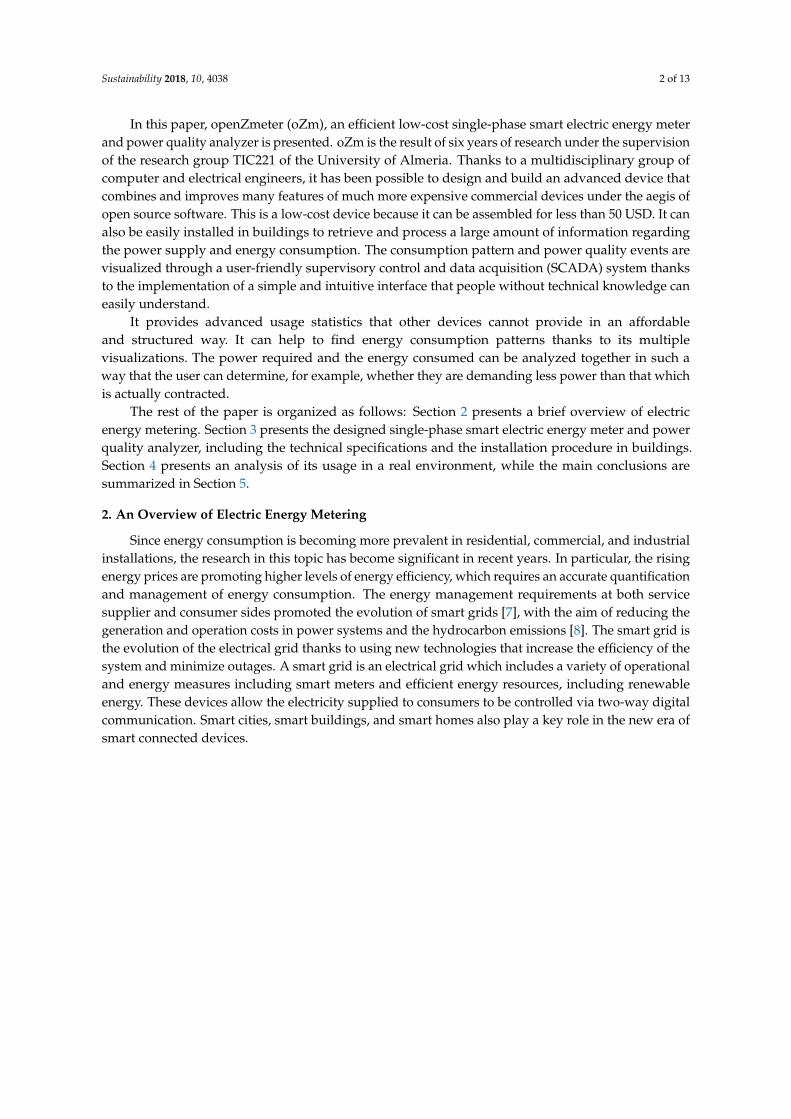
Figure 3 shows the main view or dashboard of oZm. It includes the basic magnitudes, includingthe active energy consumption (kWh) in different periods that can be displayed with different timespan aggregation. All the plots shown share a common template based on HTML5, CSS3, JavaScript,and JQuery, thus providing information about the RMS voltage, RMS current, frequency, and activepower for a 3 s aggregation interval. The top subplot in Figure 3 shows the active energy consumptionfor a fixed time span, but these data can be aggregated based on nominal values: 3 s, 1 min, 10 min,and 1 h. The data are stored in an SQL-like database (PostgreSQL) and can be retrieved for a day, week,month, or year. These measures can be analyzed with more detail. For example, Figure 4 shows theaverage, maximum, and minimum magnitudes of voltage in a time-period using different aggregationscales, and the voltage waveform (oZm can serve as an oscilloscope for waveform diagnosis).
Figure 3. Dashboard of oZm. From top to bottom and left to right, active energy, RMS voltage,RMS current, active power, and frequency are shown.
Sustainability 2018, 10, 4038 9 of 13
Figure 4. Detailed information about the voltage.
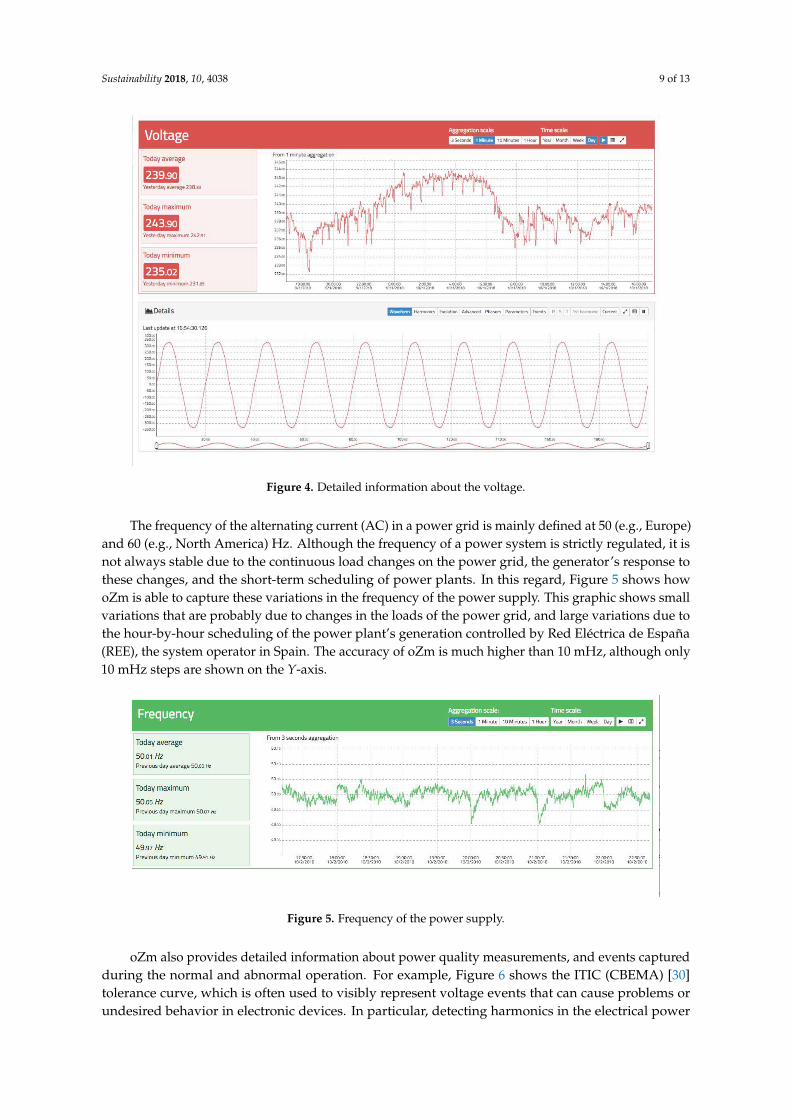
The frequency of the alternating current (AC) in a power grid is mainly defined at 50 (e.g., Europe)and 60 (e.g., North America) Hz. Although the frequency of a power system is strictly regulated, it isnot always stable due to the continuous load changes on the power grid, the generator’s response tothese changes, and the short-term scheduling of power plants. In this regard, Figure 5 shows howoZm is able to capture these variations in the frequency of the power supply. This graphic shows smallvariations that are probably due to changes in the loads of the power grid, and large variations due tothe hour-by-hour scheduling of the power plant’s generation controlled by Red Eléctrica de España(REE), the system operator in Spain. The accuracy of oZm is much higher than 10 mHz, although only10 mHz steps are shown on the Y-axis.
Figure 5. Frequency of the power supply.
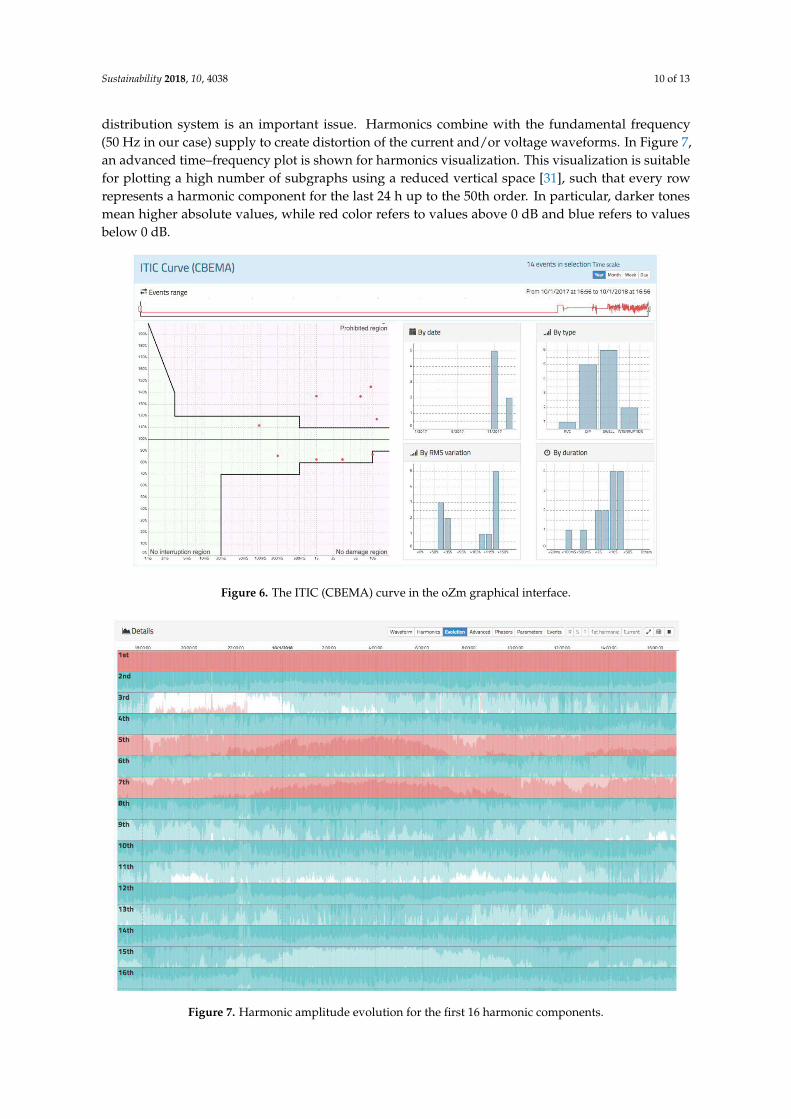
oZm also provides detailed information about power quality measurements, and events capturedduring the normal and abnormal operation. For example, Figure 6 shows the ITIC (CBEMA) [30]tolerance curve, which is often used to visibly represent voltage events that can cause problems orundesired behavior in electronic devices. In particular, detecting harmonics in the electrical power
Sustainability 2018, 10, 4038 10 of 13
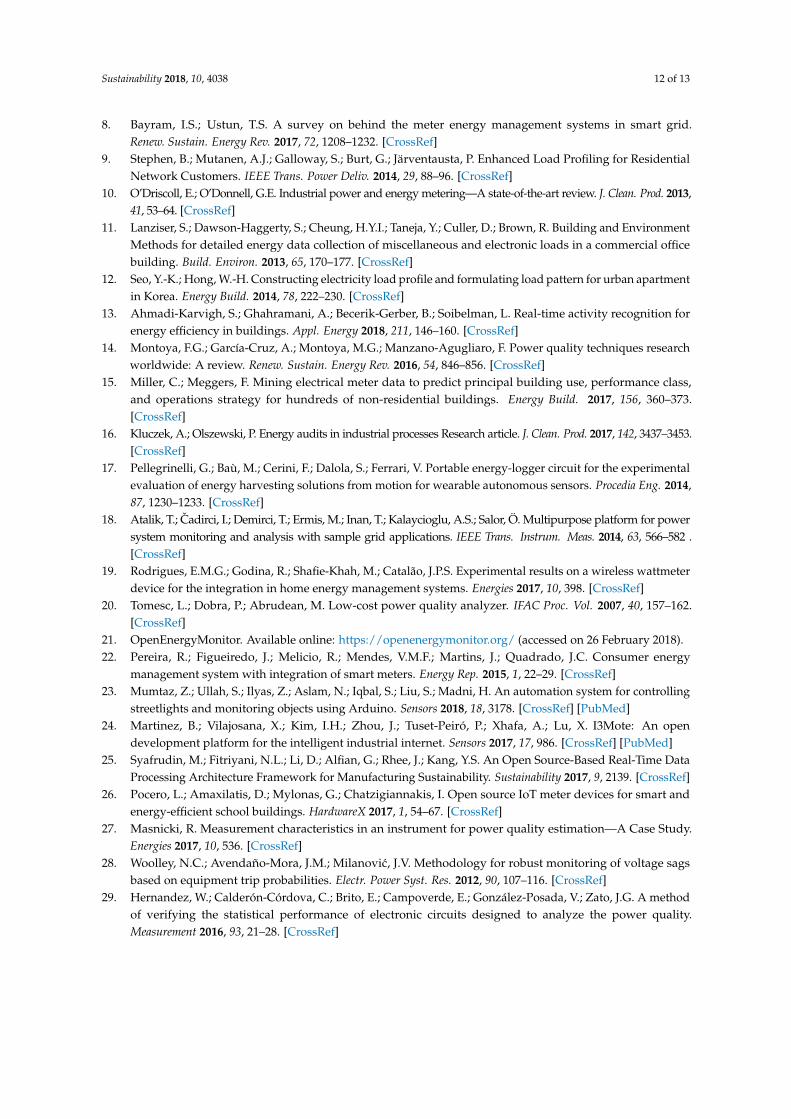
distribution system is an important issue. Harmonics combine with the fundamental frequency(50 Hz in our case) supply to create distortion of the current and/or voltage waveforms. In Figure 7,an advanced time–frequency plot is shown for harmonics visualization. This visualization is suitablefor plotting a high number of subgraphs using a reduced vertical space [31], such that every rowrepresents a harmonic component for the last 24 h up to the 50th order. In particular, darker tonesmean higher absolute values, while red color refers to values above 0 dB and blue refers to valuesbelow 0 dB.
Figure 6. The ITIC (CBEMA) curve in the oZm graphical interface.
Figure 7. Harmonic amplitude evolution for the first 16 harmonic components.

Sustainability 2018, 10, 4038 11 of 13
5. Conclusions
Electric energy meters and power quality analyzers are often used by power engineers andtechnicians to discover the health state of power systems. However, these professional devicesare often expensive and difficult to handle for non-expert users. To overcome these drawbacks,this paper presents openZmeter (oZm), an open source, low-cost, and efficient single-phase energysmart meter and power quality analyzer that can be easily installed and used by inexperienced usersat their homes in urban or rural areas. This device is able to retrieve a large amount of informationrelated to energy consumption and power quality, satisfying national and international power qualitystandards. This work demonstrates that the use of open source systems can help sustainability and,more specifically, sustainable energy use by providing valuable information to users so that they canmake energy-saving decisions supported by reliable and open data obtained in real environments.The use of open devices that provide relevant information in real time within the framework ofintelligent networks is therefore shown to be worthwhile. In order to show the novel features of thisdevice, it was installed in the circuit breaker panel of a house for several weeks. Results obtainedwere satisfactory, since it was possible to verify how oZm retrieves an important amount of datathat is processed and visualized using an advanced graphical interface. The graphs included in thispaper (energy consumption, voltage and current waveforms, frequency, and power quality events)can be easily interpreted by expert and non-expert users. As a future work, it is planned to extendthe analysis to large buildings by deploying a network of sensors in different locations. Furthermore,the three-phase version of oZm is in an advanced stage of development and should be available in thenext months.
Author Contributions: Conceptualization, F.M.A.-C.; Data curation, E.V.; Formal analysis, F.G.M., F.M.A.-C.,and F.M.-A; Funding acquisition, A.Z.-S.; Investigation, F.M.A.-C.; Methodology, F.G.M.; Project administration,F.G.M. and R.B.; Software, E.V. and A.A.; Supervision, F.M.-A.; Validation, A.A., R.B., and F.M.-A;Writing—original draft, R.B.; Writing—review & editing, A.Z.-S.
Funding: This research was funded by the Regional Government of Andalusia (ceiA3 project) at the Universityof Almeria.
Acknowledgments: This research has been supported by the Spanish Ministry of Economy and Competitiveness(project TIN2015-67020-P leaded by the University of Granada), and by the Regional Government of Andalusia(ceiA3 project) at the University of Almeria.
Conflicts of Interest: All authors declare no conflict of interest.
References
1. Pritoni, M.; Salmon, K.; Sanguinetti, A.; Morejohn, J.; Modera, M. Occupant thermal feedback for improvedefficiency in university buildings. Energy Build. 2017, 144, 241–250. [CrossRef]
2. Torrent-Fontbona, F.; Lopez, B. Power re-allocation for reducing contracted electric power costs. Energy Build.2015, 89, 112–122. [CrossRef]
3. Perez-Lombard, L.; Ortiz, J.; Pout, C. A review on buildings energy consumption information. Energy Build.2008, 40, 394–398. [CrossRef]
4. Aiad, M.; Lee, P.H. Unsupervised approach for load disaggregation with devices interactions. Energy Build.2016, 116, 96–103. [CrossRef]
5. Morales-Velazquez, L.; de Jesus Romero-Troncoso, R.; Herrera-Ruiz, G.; Morinigo-Sotelo, D.; Osornio-Rios, R.A.Smart sensor network for power quality monitoring in electrical installations. Measurement 2017, 103, 133–142.[CrossRef]
6. Muñoz, D.R.; Pérez, D.M.; Moreno, J.S.; Berga, S.C.; Montero, E.C. Design and experimental verification of a smartsensor to measure the energy and power consumption in a one-phase AC line. Measurement 2009, 42, 412–419.[CrossRef]
7. Kabalci, Y. A survey on smart metering and smart grid communication. Renew. Sustain. Energy Rev. 2016, 57, 302–318.[CrossRef]
Sustainability 2018, 10, 4038 12 of 13
8. Bayram, I.S.; Ustun, T.S. A survey on behind the meter energy management systems in smart grid.Renew. Sustain. Energy Rev. 2017, 72, 1208–1232. [CrossRef]
9. Stephen, B.; Mutanen, A.J.; Galloway, S.; Burt, G.; Järventausta, P. Enhanced Load Profiling for ResidentialNetwork Customers. IEEE Trans. Power Deliv. 2014, 29, 88–96. [CrossRef]
10. O’Driscoll, E.; O’Donnell, G.E. Industrial power and energy metering—A state-of-the-art review. J. Clean. Prod. 2013,41, 53–64. [CrossRef]
11. Lanziser, S.; Dawson-Haggerty, S.; Cheung, H.Y.I.; Taneja, Y.; Culler, D.; Brown, R. Building and EnvironmentMethods for detailed energy data collection of miscellaneous and electronic loads in a commercial officebuilding. Build. Environ. 2013, 65, 170–177. [CrossRef]
12. Seo, Y.-K.; Hong, W.-H. Constructing electricity load profile and formulating load pattern for urban apartmentin Korea. Energy Build. 2014, 78, 222–230. [CrossRef]
13. Ahmadi-Karvigh, S.; Ghahramani, A.; Becerik-Gerber, B.; Soibelman, L. Real-time activity recognition forenergy efficiency in buildings. Appl. Energy 2018, 211, 146–160. [CrossRef]
14. Montoya, F.G.; García-Cruz, A.; Montoya, M.G.; Manzano-Agugliaro, F. Power quality techniques researchworldwide: A review. Renew. Sustain. Energy Rev. 2016, 54, 846–856. [CrossRef]
15. Miller, C.; Meggers, F. Mining electrical meter data to predict principal building use, performance class,and operations strategy for hundreds of non-residential buildings. Energy Build. 2017, 156, 360–373.[CrossRef]
16. Kluczek, A.; Olszewski, P. Energy audits in industrial processes Research article. J. Clean. Prod. 2017, 142, 3437–3453.[CrossRef]
17. Pellegrinelli, G.; Baù, M.; Cerini, F.; Dalola, S.; Ferrari, V. Portable energy-logger circuit for the experimentalevaluation of energy harvesting solutions from motion for wearable autonomous sensors. Procedia Eng. 2014,87, 1230–1233. [CrossRef]
18. Atalik, T.; Cadirci, I.; Demirci, T.; Ermis, M.; Inan, T.; Kalaycioglu, A.S.; Salor, Ö. Multipurpose platform for powersystem monitoring and analysis with sample grid applications. IEEE Trans. Instrum. Meas. 2014, 63, 566–582 .[CrossRef]
19. Rodrigues, E.M.G.; Godina, R.; Shafie-Khah, M.; Catalão, J.P.S. Experimental results on a wireless wattmeterdevice for the integration in home energy management systems. Energies 2017, 10, 398. [CrossRef]
20. Tomesc, L.; Dobra, P.; Abrudean, M. Low-cost power quality analyzer. IFAC Proc. Vol. 2007, 40, 157–162.[CrossRef]
21. OpenEnergyMonitor. Available online: https://openenergymonitor.org/ (accessed on 26 February 2018).22. Pereira, R.; Figueiredo, J.; Melicio, R.; Mendes, V.M.F.; Martins, J.; Quadrado, J.C. Consumer energy
management system with integration of smart meters. Energy Rep. 2015, 1, 22–29. [CrossRef]23. Mumtaz, Z.; Ullah, S.; Ilyas, Z.; Aslam, N.; Iqbal, S.; Liu, S.; Madni, H. An automation system for controlling
streetlights and monitoring objects using Arduino. Sensors 2018, 18, 3178. [CrossRef] [PubMed]24. Martinez, B.; Vilajosana, X.; Kim, I.H.; Zhou, J.; Tuset-Peiró, P.; Xhafa, A.; Lu, X. I3Mote: An open
development platform for the intelligent industrial internet. Sensors 2017, 17, 986. [CrossRef] [PubMed]25. Syafrudin, M.; Fitriyani, N.L.; Li, D.; Alfian, G.; Rhee, J.; Kang, Y.S. An Open Source-Based Real-Time Data
Processing Architecture Framework for Manufacturing Sustainability. Sustainability 2017, 9, 2139. [CrossRef]26. Pocero, L.; Amaxilatis, D.; Mylonas, G.; Chatzigiannakis, I. Open source IoT meter devices for smart and
energy-efficient school buildings. HardwareX 2017, 1, 54–67. [CrossRef]27. Masnicki, R. Measurement characteristics in an instrument for power quality estimation—A Case Study.
Energies 2017, 10, 536. [CrossRef]28. Woolley, N.C.; Avendaño-Mora, J.M.; Milanovic, J.V. Methodology for robust monitoring of voltage sags
based on equipment trip probabilities. Electr. Power Syst. Res. 2012, 90, 107–116. [CrossRef]29. Hernandez, W.; Calderón-Córdova, C.; Brito, E.; Campoverde, E.; González-Posada, V.; Zato, J.G. A method
of verifying the statistical performance of electronic circuits designed to analyze the power quality.Measurement 2016, 93, 21–28. [CrossRef]

Sustainability 2018, 10, 4038 13 of 13
30. Masoum, M.A.S.; Fuchs, E.F. Power Quality in Power Systems and Electrical Machines. In Impact of PoorPower Quality on Reliability, Relaying and Security, 2nd ed.; Masoum, M.A.S., Fuchs, E.F., Eds.; AcademicPress/Elsevier: Amsterdam, The Netherlands, 2015; pp. 681–778.
31. Few, S. Time on the Horizon. Visual Business Intelligence Newsletter, June/July 2008. Available online:http://www.perceptualedge.com/articles/visual_business_intelligence/time_on_the_horizon.pdf(accessed on 26 February 2018).
© 2018 by the authors. Licensee MDPI, Basel, Switzerland. This article is an open accessarticle distributed under the terms and conditions of the Creative Commons Attribution(CC BY) license (http://creativecommons.org/licenses/by/4.0/).