An efficient agent-based algorithm for overlapping community detection using nodes’ closeness
17
Physica A 392 (2013) 5231–5247 Contents lists available at ScienceDirect Physica A journal homepage: www.elsevier.com/locate/physa An efficient agent-based algorithm for overlapping community detection using nodes’ closeness Reza Badie a,∗,1 , Abolfazl Aleahmad a,1 , Masoud Asadpour b,c,1 , Maseud Rahgozar a,1 a Database Research Group, School of Electrical and Computer Engineering, University of Tehran, North Karegar Ave., Tehran, Iran b Social Networks Lab., University of Tehran, North Karegar Ave., Tehran, Iran c School of Computer Science, Institute for Research in Fundamental Sciences (IPM), Iran highlights • Considering nodes’ closeness improves the methods that are based on label propagation. • L2I quantify how much internal a link is with respect to a specific community. • NMI improvement by the proposed algorithm in synthetic networks. • F -score improvement in the overlapping nodes identification problem. article info Article history: Received 14 March 2013 Received in revised form 18 May 2013 Available online 2 July 2013 Keywords: Overlapping community detection Label propagation Social networks Social network analysis abstract Communities are groups of nodes forming tightly connected units in networks. Some nodes can be shared between different communities of a network. The presence of overlapping nodes and their associated membership diversity is a common characteristic of social networks. Analyzing these overlapping structures can reveal valuable information about the intrinsic features of realistic complex networks, especially social networks. In this paper, we propose a novel algorithm that is able to detect overlapping and non- overlapping community structures in complex networks. This algorithm uses a number of agents for investigation of the input network. These agents consider different nodes’ closeness in their investigations. Various experiments are carried out on both synthetic and real-world networks that prove that the proposed algorithm outperforms most state- of-the-art algorithms of this field both in terms of the accuracy and execution time. © 2013 Elsevier B.V. All rights reserved. 1. Introduction Community or modular structure is one of the most significant properties of graphs representing real systems and com- plex networks [1]. Communities are groups of nodes such that members of the same group have a large number of edges between themselves compared with the number of edges with members belonging to other groups [2]. The existence of modular structure in real-world complex networks originates from their intrinsic features, especially the fact that they are not random graphs [3]. In such networks, the distribution of link density is inhomogeneous both locally and globally, i.e. ∗ Corresponding author. Tel.: +98 2177646236. E-mail addresses: [email protected], [email protected] (R. Badie). 1 Tel.: +98 21 82089718. 0378-4371/$ – see front matter © 2013 Elsevier B.V. All rights reserved. http://dx.doi.org/10.1016/j.physa.2013.06.056
Transcript of An efficient agent-based algorithm for overlapping community detection using nodes’ closeness

Physica A 392 (2013) 5231–5247
Contents lists available at ScienceDirect
Physica A
journal homepage: www.elsevier.com/locate/physa
An efficient agent-based algorithm for overlappingcommunity detection using nodes’ closeness
Reza Badie a,∗,1, Abolfazl Aleahmad a,1, Masoud Asadpour b,c,1,Maseud Rahgozar a,1a Database Research Group, School of Electrical and Computer Engineering, University of Tehran, North Karegar Ave., Tehran, Iranb Social Networks Lab., University of Tehran, North Karegar Ave., Tehran, Iranc School of Computer Science, Institute for Research in Fundamental Sciences (IPM), Iran
h i g h l i g h t s
• Considering nodes’ closeness improves the methods that are based on label propagation.• L2I quantify how much internal a link is with respect to a specific community.• NMI improvement by the proposed algorithm in synthetic networks.• F-score improvement in the overlapping nodes identification problem.
a r t i c l e i n f o
Article history:Received 14 March 2013Received in revised form 18 May 2013Available online 2 July 2013
Keywords:Overlapping community detectionLabel propagationSocial networksSocial network analysis
a b s t r a c t
Communities are groups of nodes forming tightly connected units in networks. Somenodescan be shared between different communities of a network. The presence of overlappingnodes and their associated membership diversity is a common characteristic of socialnetworks. Analyzing these overlapping structures can reveal valuable information aboutthe intrinsic features of realistic complex networks, especially social networks.
In this paper, we propose a novel algorithm that is able to detect overlapping and non-overlapping community structures in complex networks. This algorithm uses a numberof agents for investigation of the input network. These agents consider different nodes’closeness in their investigations. Various experiments are carried out on both syntheticand real-world networks that prove that the proposed algorithm outperforms most state-of-the-art algorithms of this field both in terms of the accuracy and execution time.
© 2013 Elsevier B.V. All rights reserved.
1. Introduction
Community or modular structure is one of the most significant properties of graphs representing real systems and com-plex networks [1]. Communities are groups of nodes such that members of the same group have a large number of edgesbetween themselves compared with the number of edges with members belonging to other groups [2]. The existence ofmodular structure in real-world complex networks originates from their intrinsic features, especially the fact that they arenot random graphs [3]. In such networks, the distribution of link density is inhomogeneous both locally and globally, i.e.
∗ Corresponding author. Tel.: +98 2177646236.E-mail addresses: [email protected], [email protected] (R. Badie).
1 Tel.: +98 21 82089718.
0378-4371/$ – see front matter© 2013 Elsevier B.V. All rights reserved.http://dx.doi.org/10.1016/j.physa.2013.06.056

5232 R. Badie et al. / Physica A 392 (2013) 5231–5247
more links reside within some particular parts of the network [1]. Community structure identification has many applica-tions, especially in fields like sociology, biology and computer science. Some complex networks that are usually representedby graphs are social groups like family, colleagues, friendship networks and online communities on the Internet. Such graphscan also be found in biology, for example in protein–protein interaction (PPI) networks [4], metabolic networks [5], WorldWideWeb, i.e. web pages and hyperlinks among them [6], collaboration networks [2] and bipartite ormultipartite networkslike co-authorship networks.
To further clarify the importance of the community identification task, we will mention some typical applications ofthis interesting challenge. In protein–protein interaction networks that are subject of intense investigation in biology andbioinformatics, communities correspond to functional groups, i.e. proteins with similar functionality tend to be observedwith each other in similar chemical reactions. So, such proteins are often observed in the same cluster near each other. Topredict the functionality of newly discovered proteins (the proteins that no prior knowledge is available for their attributesand functionalities) detection of community structure in PPI networks can be used to predict the functionality of newlydiscovered proteins, the proteins that no prior knowledge is available for their attributes and functionalities. For exampleRef. [7] used this technique for yeast.
Community detection is also a popular topic in computer science. In parallel computing, it is vital to know the best way toallocate tasks to processors in order to minimize communication cost. This can be accomplished by partitioning computerclusters into groups of approximately the same number of processors. Partitioning must be carried out in a way that therequired number of actual connections between processors of different clusters is kept at the minimum possible level [8].
In this paper, we analyze social networks as our case study. In these networks, likemany other complex networks, we canachieve valuable information about the prominent features of the network by analyzing community structures. Usually insocial networks, multiplememberships of nodes or individuals in different groups or communities exist. As a result, in socialnetworks, the overlapping community structure must be considered in which each node of the social network can belong toone or more community. This issue is also observed in other kinds of complex networks such as biological networks, wherea nodemight havemultiple functions. In Ref. [9], the authors show that the overlap is actually a prominent property ofmanyreal social networks. As a consequence, in these networks, the intersection of clusters can be non-empty, a condition that isassumed and exploited in some previously proposed algorithms.
Nodes that belong to more than one community are called overlapping nodes. Such nodes naturally have the importantduty of intermediation between different parts of the graph [1].
Most of the previously proposed algorithms for finding the community structure aim to find the disjoint communitystructure. But in social networks, as shown in Ref. [9], wemust consider the detection of overlapping communities. The goalof this paper is to present an efficient algorithm to calculate accurate covers for various kinds of social networks. A coverof a graph is the set of clusters such that each node is assigned to at least one cluster [10]. Moreover, considering overlap-ping nodes causes tremendous increase in the number of possible covers with respect to standard partitions. Thus, findingoverlapping communities of ten needs much more computation than is required for identifying traditional partitions, andan efficient algorithm for this harder challenge should be devised.
This problem is not yet perfectly solved, despite the considerable efforts of different researchers in the past few years [1].
2. Related work
In this section, the existing algorithms for overlapping community detection are briefly introduced. These algorithms canbe categorized into five different classes [11] which will be discussed respectively:
• Clique percolation• Line graph and link partitioning• Local expansion and optimization• Fuzzy detection• Agent-based and dynamical algorithms.
Our proposed algorithm, described in Section 3, works based on label propagation [12] and belongs to the agent-basedand dynamical algorithms’ class.
As Palla et al. stated, a community is formed from a set of several complete or fully connected subgraphs or cliques thathavemany common nodes [13]. Thus, they devised an algorithm called the Clique PercolationMethod (CPM) for overlappingcommunity identification through discovery of k-clique communities that are union of all k-cliques, complete subgraphs ofsize k, that are reachable from each other through a sequence of adjacent k-cliques (where adjacency means sharing k − 1nodes) [13]. CFinder is a good implementation for CPM [14]. Farkas et al. introduced an extension of CPM, called CPMw,that considers link weights in a better way by taking into account the concept of Subgraph Intensity [15] while searching.CPMw uses the same searching procedure of the original version of CPM but includes only one newly discovered k-cliqueinto a module, if it has higher intensity than a predetermined fixed threshold value [16]. Lee et al. proposed a new com-munity identification algorithm called Greedy Clique Expansion (GCE). The algorithm identifies distinct cliques as initialcommunities and expands these initial communities by greedy optimization of a local fitness function [17].

R. Badie et al. / Physica A 392 (2013) 5231–5247 5233
Ahn et al. used link partitioning instead of node partitioning to calculate the overlapping community structure of anetwork [18]. Evans and Lambiotte introduced the idea of partitioning the links of a weighted graph for the discovery ofoverlapping communities [19].
Another category of algorithms works based on maximizing a local objective function. Baumes et al. acquired someprimary disconnected and disjoint cores by removing some nodes that have a considerable number of connections withother nodes by use of a procedure called RaRe or Rank Removal. Removed nodes will be added to a set called R. In thesecond step called IS or Iterative Scan, the vertices in Rwill be examined for addition to these cores by taking into account alocal density function, i.e. vertices in set R are added or removed from the cores until no further improvement in the definedlocal density function can be obtained. If in the second step a vertex is added to more than one core then we can have anoverlap between the identified communities [20]. Lancichinetti et al. proposed LFM that also expands a community from arandom initial seed vertex until a fitness function is locally maximal. Their aim is to determine a subgraph starting from aspecific node such that inclusion or elimination of a new node from that subgraph would lower down an associated fitnessfunction. Lancichinetti called such a subgraph the natural community of a node [10]. Lancichinetti et al. also introducedOSLOM (Order Statistics Local Optimization Method). That is based on the optimization of a fitness function. This fitnessfunction is defined in a way to be able to compute the statistical significance of a cluster. OSLOM can be used as a stand-alone independent algorithm for overlapping community identification or can be used to improve the partitions or coversthat are results of execution of other algorithms [21].
Fuzzy clustering has also been extended to overlapping community detection. Zhang et al. used the spectral methodto acquire a presentation of the graph in k − 1 dimensional Euclidean space. Nodes are then clustered by the fuzzy c-mean algorithm [22]. Sun et al. used fuzzy clustering for detection of both overlapping and non-overlapping communityidentification [23].
COPRA proposed by Gregory is an extension of the label propagation algorithm introduced by Raghavan et al. [12] foroverlapping community detection. Each node updates its coefficients by averaging the coefficients of all its neighbors. COPRAproduces a number of small size communities in some networks [24]. Xie et al. introduced a new algorithm based on a labelpropagation approach called SLPA. In this algorithm adjacent nodes exchange labels based on some predetermined rules.These rules are considerably similar to human’s social interactions when someone listens to others speaking to him [25,26]. Wu et al. proposed the balanced multi-label propagation algorithm (BMLPA) for overlapping community detection.They extended COPRA by proposing a new update strategy, which allows vertices to belong to any number of communitieswithout a global limit on the number of community memberships, which COPRA requires. They also proposed a methodfor identifying primary rough cores, which can be used to initialize labels for multi-label propagation algorithms [27].Gregory also introduced another algorithm named CONGA for discovering overlapping communities, by extending Girvanand Newman’s algorithm based on betweenness centrality measure. In order to be able to find the overlapping structure ofmodules, CONGA allows nodes of a graph to be split into multiple copies. Both splitting betweenness and the conventionaledge betweenness are used [28].
Shen et al. proposed EAGLE (agglomerativE hierarchicAl clusterinG based onmaximaL cliquE), that uses an agglomerativeapproach for creating a dendrogram. First it identifies all maximal cliques that are considered as initial communities. Then,pairs of communitieswithmaximumsimilarity aremerged iteratively. Expensive calculations can be considered as theweakpoint of this algorithm [29].
Nepusz et al. defined the overlapping community identification as a nonlinear constraint optimization problem [30].Psorakis et al. proposed a probabilistic approach based on Bayesian nonnegative matrix factorization (NMF) for overlappingcommunity structure determination [31].
Chen et al. proposed a new algorithm for overlapping community identification by leveraging some concepts from gametheory [32]. We named this algorithm Game like [11]. Mcdaid and Hurley proposed a new algorithm called MOSES (Model-based Overlapping Seed ExpanSion), based on a statistical model of community structure, which is capable of detectinghighly overlapping community structures [33].
Rosvall and Bergstrom proposed an algorithm called Infomap [34]. It uses a randomwalker to investigate the input graphand detects communities in a way that is very similar to a data compression problem solved in information theory. Esquiveland Rosvall extended Infomap by adding the ability of detecting overlapping community structures. This version is calledFuzzy-Infomap [35]. This algorithm uses the communities identified by the original version of Infomap [34] as its input andtries to determine which nodes can be considered as overlapping nodes. Infomap uses a similar approach to Refs. [36,37]but instead of modularity maximization, the average number of bits that are required for description of movements in eachstep of an infinite random walker is minimized. The Infomap algorithm is actually an optimization procedure that derivedits objective function from information theory.
3. Our approach
In this section we propose a new algorithm for community identification that is named swarm of agents’ teamworkfor overlapping community identification (SATOCI). This algorithm is able to detect both overlapping and non-overlappingcommunity structures. The following table explains the different steps of the SATOCI algorithm.

5234 R. Badie et al. / Physica A 392 (2013) 5231–5247
SATOCI (T , α)
Step 1: Load the Input Network GStep 2: Initialization
(2.1) Compute L2I for all links of G(2.2) Assign initial labels to nodes of G(2.3) Let H be set of the selected hubs by HubsSelectionandAgentAssignment()(2.4) Assign agents to nodes in H
Step 3: Agents Investigation (will be repeated up to T times)(3.1) Agents explore the input network simultaneously
Step 4: Post Processing(4.1) Determine community cores based on the disseminated labels(4.2) Identify overlapping nodes through thresholding(4.3) Add overlapping nodes to appropriate cores(4.4) Delete communities that are completely nested inside a bigger community
Algorithm 1. SATOCI global architecture
First by use of a reweighting process we discriminate close friends and those that have a small acquaintance with eachother. Then a group of judging agents examined different random pair of nodes during their individual investigations. Theagents take into account the impact of closeness between different pairs of nodes they visit. Then the agents estimate theinfluence each of the actors can get during their interactions with their neighbors. These estimates are stored in the asso-ciated memory of each actor as the agents’ judgments. So through the teamwork of these agents and aggregation of theirlocal views, a global view can be obtained about the intrinsic community structure of the given complex network.
3.1. Steps of our algorithm
The following subsections discuss the steps of SATOCI in more detail. For each step an appropriate high level descriptionis provided to clarify its explanation. We assume that the input network is G(V , E) where V is the set of vertices of thisnetwork and E is the set of links in it. The cardinality of set V or |V | (that is the number of nodes of G) will be denoted by nand the cardinality of set E or |E| (that is the number of links of G) will be denoted bym.
3.1.1. Link weight computationThe first step of SATOCI is computation of weight for network links. We use internality index as link weights that is a
measure to quantify how much internal a link is with respect to a specific community. Reasons behind the introduction ofinternality index are discussed in Section 3.1.1.1. But as a brief justification, note that a community is a coherent part of anetwork that includes a group of nodes with strong relations between them. Now, one may ask what relationship can beconsidered to be strong? Link internality index (L2I) is our answer to this question. In other words, L2I tries to quantify thequality or strength of links between different nodes.
Let l(A, B) be a link between nodes A and B and call them the end-points of this link. Also let Γ (A) be the set of neighborsof node A. Then we have [38]
Jaccard(l(A, B)) =|Γ (A) ∩ Γ (B)||Γ (A) ∪ Γ (B)|
. (1)
Notice that only the intersection between the immediate neighbors of nodes A and B is considered, i.e. the nodes that are ingeodesic distance one from these two nodes.
Formula (3) is the definition of L2I. In this formula, if Jaccard(A, B) is greater than β , then we set L2I(l(A, B)) = 1, other-wise, we set L2I = Jaccard(l(A, B)). The reason behind introducing this condition is that if β percent of neighbors of A andB are common, then it is highly probable that both A and B belong to the same community. Please note that L2I is computedonly for the node-pairs that are connected in the input network, and not for any node-pairs that may have nonnegativeneighborhood overlap. Through experiments, we observed that the interval [0.2, 0.5] is an appropriate interval for valuesof β . Intuitively it is obvious that values near 50% for β can lead to precise results. But our algorithm executions suggest thatlow values like 0.2 for β are indeed adequate and lead to remarkably accurate results in community detection.We think thisis true because the final answer of the algorithm is the result of lots of individual judgments of agents about the communitystructure of the network. But note that, in order to achieve the best results in any given network, it is maybe necessary toexamine different values for β to find the best value for it for the given network. Also, this threshold helps us to reduce thecomputation time needed for calculation of Jaccard(l(A, B)):
L2I(l(A, B)) =
1; Jaccard(A, B) > βJaccard(A, B); otherwise. (2)
R. Badie et al. / Physica A 392 (2013) 5231–5247 5235
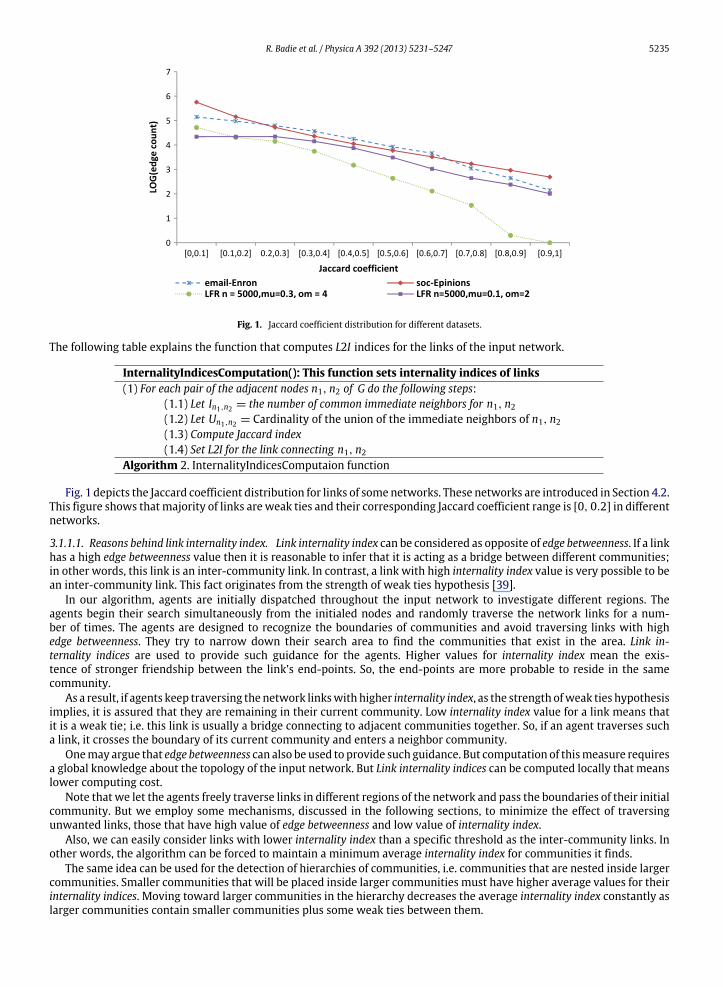
Fig. 1. Jaccard coefficient distribution for different datasets.
The following table explains the function that computes L2I indices for the links of the input network.
InternalityIndicesComputation(): This function sets internality indices of links(1) For each pair of the adjacent nodes n1, n2 of G do the following steps:
(1.1) Let In1,n2 = the number of common immediate neighbors for n1, n2
(1.2) Let Un1,n2 = Cardinality of the union of the immediate neighbors of n1, n2
(1.3) Compute Jaccard index(1.4) Set L2I for the link connecting n1, n2
Algorithm 2. InternalityIndicesComputaion function
Fig. 1 depicts the Jaccard coefficient distribution for links of some networks. These networks are introduced in Section 4.2.This figure shows thatmajority of links areweak ties and their corresponding Jaccard coefficient range is [0, 0.2] in differentnetworks.
3.1.1.1. Reasons behind link internality index. Link internality index can be considered as opposite of edge betweenness. If a linkhas a high edge betweenness value then it is reasonable to infer that it is acting as a bridge between different communities;in other words, this link is an inter-community link. In contrast, a link with high internality index value is very possible to bean inter-community link. This fact originates from the strength of weak ties hypothesis [39].
In our algorithm, agents are initially dispatched throughout the input network to investigate different regions. Theagents begin their search simultaneously from the initialed nodes and randomly traverse the network links for a num-ber of times. The agents are designed to recognize the boundaries of communities and avoid traversing links with highedge betweenness. They try to narrow down their search area to find the communities that exist in the area. Link in-ternality indices are used to provide such guidance for the agents. Higher values for internality index mean the exis-tence of stronger friendship between the link’s end-points. So, the end-points are more probable to reside in the samecommunity.
As a result, if agents keep traversing the network linkswith higher internality index, as the strength ofweak ties hypothesisimplies, it is assured that they are remaining in their current community. Low internality index value for a link means thatit is a weak tie; i.e. this link is usually a bridge connecting to adjacent communities together. So, if an agent traverses sucha link, it crosses the boundary of its current community and enters a neighbor community.
Onemay argue that edge betweenness can also be used to provide such guidance. But computation of thismeasure requiresa global knowledge about the topology of the input network. But Link internality indices can be computed locally that meanslower computing cost.
Note that we let the agents freely traverse links in different regions of the network and pass the boundaries of their initialcommunity. But we employ some mechanisms, discussed in the following sections, to minimize the effect of traversingunwanted links, those that have high value of edge betweenness and low value of internality index.
Also, we can easily consider links with lower internality index than a specific threshold as the inter-community links. Inother words, the algorithm can be forced to maintain a minimum average internality index for communities it finds.
The same idea can be used for the detection of hierarchies of communities, i.e. communities that are nested inside largercommunities. Smaller communities that will be placed inside larger communities must have higher average values for theirinternality indices. Moving toward larger communities in the hierarchy decreases the average internality index constantly aslarger communities contain smaller communities plus some weak ties between them.

5236 R. Badie et al. / Physica A 392 (2013) 5231–5247
3.1.2. Initialization of labelsIn order to be able to detect communities of a network, their boundaries and their overlaps, we use some agents to
accomplish this task through their local investigations. We also need a mechanism for storing the judgments of each agentabout the structure of the communities in the region of the network which that specific agent has investigated. For thispurpose, we adopted the label propagation scheme. We assign a label and a local memory to each node. Each label containsthe corresponding node’s unique number. Also, the memory of each node is initialized with its corresponding label. Thismemory will store judgments of the agents that have encountered with this node during their local investigations. Thereceiving frequency for the node’s own label is set to one in this initial state and is zero for all the other labels. For thedefinition of the receiving frequency please refer to Section 3.1.4. Initially, each node is in its own community. After sometime, this memory will keep track of the labels each node has received.
Also notice that by saving the judgments of each agent in the memory of the encountered nodes, we are consideringan opportunity to other agents that will visit the same nodes, in some point later in time, to reinvestigate the structure ofcommunities in the surroundings of the same nodes. As a result, later agents can verify the judgments of the previous agentsand correct them if necessary. These new agents havemore accurate knowledge about the structure of communities, via theinformation stored throughout the network in the local memories of the nodes. This information is the reason that leads tomore precise judgments by new agents.
In addition, as stated before a prerequisite for a subgraph to be considered as a community is to have aminimum amountof coherentness. One of the properties of coherent networks is their high overall connectivity. It means that there must belots of different paths among nodes of a coherent group. So the same situation must be true for communities. Thus weassumed that if we use random walkers they intrinsically tend to remain in the limits of the community that they wereinitially deployed to. So by dividing our agents into some sub-groups and dispatching them uniformly in the whole networkwe can accurately determine the limits of the communities of the input network. Also if an agent crosses the boundary ofits initial community, although its probability is low, it must have traversed a weak tie. By the mechanism that our agentsuse in making their decisions, the effect of such a traversal is lowered down appropriately.
3.1.3. Selecting hubsAfter initialization of labels, we select some hubs that are nodes of the network with highest total degree. A number of
agents are assigned to each hub that is equal to the hub’s degree.The number of selected hubs should be determined in a way that can ensure enough number of investigating agents for
any network. Let H be the set of nodes selected as hubs; then the proportion of total number of links in a network and totalnumber of investigating agents is defined as
p =
i ∈H
degree(i)
total_number_of _links. (3)
Our algorithm constantly increases the number of hubs until the desired value for p is achieved. The following table explainsthe details of hubs’ selection and assignment of agents to them.
HubsSelectionandAgentAssignment():This function Selects hubs and assign labels to them(1) Let be equal to (cutoff = 0.9) and let maxDegree be the greatest degree of nodes of G(2) Let the initial number of agents be zero and H = {}
(3) Let currentRatio be the number of agents divided by m(4) Repeat the following steps while currentRatio is smaller than p
(4.1) For each node n of G do the following steps(4.1.1) If (n ∈ is not in the H) and (degree of n > cutoff × maxDegree)
(4.1.1.1) Add n to H set(4.1.1.2) Let currentRatio =
|H|
n(4.2) Let cutoff = cutoff − 0.1
(5) For each h in H do the following steps for a number of times that is equal to its degree(5.1) Define a new agent A(5.1) Set the current location of A be equal to h(5.1) Assign A to h
(6) Output H as selected hubs setAlgorithm 3. HubsSelectionandAgentAssignment function
We considered different values for p in our experimentations and observed a tradeoff; by increasing the number of agents,the accuracy is improved and at the same time, the execution time of our algorithm is increased. After some experiments,the best value for p is trained. Fig. 2 shows the results of the experiments for a network generated by the LFR benchmark [40]with parameters n = 5000, µ = 0.1 and Om = 2. We decided to set p = 0.1 that is an appropriate balance of accuracy andexecution time.

R. Badie et al. / Physica A 392 (2013) 5231–5247 5237
Fig. 2. NMI and execution time for different values of p for a network generated by the LFR benchmark with n = 5000, µ = 0.1 and Om = 2.
It is important to select hubs uniformly from all regions of the network. By assigning agents to the nodes with high de-gree, an initial bias toward these nodes is shaped. The agents belonging to a particular hub propagate its correspondinglabel between nodes in its vicinity. This is a useful feature of the algorithm; communities are local structures and it is highlyprobable that the neighbor nodes of a hub belong to the community of that hub.
All agents of different hubs investigate their corresponding region simultaneously. Consequently, when an agent comesout of its region, a partial consensus exists among the nodes of that region. This partial consensus about community structureis due to the effect of activities of previous agents. So the current agent may not be the first one to make decision aboutcommunity structure for a new region.
3.1.4. Interaction simulation stageAfter positioning agents on a network hub, local investigation of agents begins. Each agent selects a label from the
memory of its hub, randomly selects one of the links of its hub and traverses the selected link to reach a new node. Then itassigns the label to the new node. Selection of a label from node’s memory is carried out based on a simple probabilistic rule.For every label in thememory of eachnode,wehave a corresponding selection probability. The selection probability of a labelis equal to the receiving frequency of that label by the corresponding node divided by the sumof the receiving frequencies of allthe labels this node has received. Let f (l) denote the receiving frequency of label l; then the selection probability of a label is
s(l) =f (l)
k∈RLvf (k)
. (4)
In the above formula RLv is the set of all the labels node v has received. Agents decide passing a label to the next node basedon the selection probability of labels.
Every time an agent reaches a new node, the label that it has picked from thememory of the previous node is assigned tothis new node by that agent. The previous node is the node that is visited by this agent in its former step of its explorations.Then this agent increases the value of the selected label receiving frequency of the current node by the internality index of thelink connecting the current and the previous node. Agents do not use the best label of each node here, because doing so willprevent the algorithm to be able to detect multiple memberships of nodes. Because if agents constantly select the best labelof each node, then there would be no opportunity for weaker interactions and relationships to have any impression on the

5238 R. Badie et al. / Physica A 392 (2013) 5231–5247
overall process of detection of overlapping community structure, because their corresponding labels will never exchangebetween such actors.
One may have different levels of closeness and sincerity with his friends. What his friends say, do or think about havedifferent degrees of influence on him. What his closer friends think or tell him can often have more impact on what he willthink about a particular event or subject of discussion. Link internality index is our estimate from the sincerity and closenessof different individuals in the network. Each individual transfer of a specific label between two adjacent nodes is completelysimilar to a social interaction that happens between two friends. So, in order to be able to simulate the effect of closeness ofdifferent individuals, that is the amount of influence they get from each other, link internality indices are used to increase thereceiving frequency of the label that transferred between two adjacent nodes. Also amechanism is employed that guaranteesthat each node is visited uniformly by the agents that will encounter this node. In other words, the search procedure forcesall the agents to visit all the regions of the network uniformly and prevents any random bias in the amount of search in anyregion of the network.
This step is iterated for T times. T is one of the algorithmparameters. It controls the number of iterations of the interactionsimulation stage of the algorithm. In our experiments we set T = 300. Other values for T are also examined. For example forT = 200 we observed considerable accuracy in our results, that is still competitive with the results of the best algorithmsof this field. By increasing the value of T we did not see more improvement. It shows that after 300 times of iteration, ouralgorithm reaches its final stable state. More iterations do not affect the consensus formed among the nodes of the network.This is one of the advantages of our algorithm compared with SLPA [25,26]. SLPA provides its best results for T = 100. Incontrast to our algorithm it does not reach a final stable state. By increasing the value of T , its accuracy is decreased. Thisis a weak point for SLPA that never converges to a final stable situation. The following table shows the function used fornetwork structure examination and simulation of interaction among different actors.
NetworkStructureExploration(): This function manage agents exploration in the input networkFor T times do the following steps for each agent A
(1) Let CurrentNode(A) be the current location of A(2) Let NextNode(A) be one of the neighbors of CurrentNode(A) that is selected uniformly(3) Let LinkToTraverse be the link between CurrentNode(A) and NextNode(A)variable(4) Let Label be a label probabilistically picked from CurrentNode(A)’s memory(5) Insert Label into NextNode(A)’s memory if it does not already exist(6) Add L2I of LinkToTraverse to Receiving Frequency of Label in NextNode(A)’smemory(7) Let CurrentNode(A) be NextNode(A)
Algorithm 4. NetworkStructureExploration function
3.1.5. Post processingIn this step, each node’s memory is examined and the best label of each node is identified. The best label is the one
that its corresponding node has received it more than any other label. Then this node is considered as a member of thecommunity that is represented by its best label. By reaching to this section of the algorithm, themain part of each communityis identified. We call the main part of a community as community core. Algorithm 5 shows a section of our algorithm thatidentifies community cores and removes the cores that are completely contained by a bigger core.
After the discovery of the core part of the communities using this approach, a thresholding step for the determination ofoverlaps among community cores and identification of overlapping nodeswill take place. The thresholding that is performedin the final step of our algorithm actually converts the fuzzy or soft assignments of nodes to communities to a crispassignment, in which each node is a member of a specific community or it is not a member of that specific community.
CommunityCoresIdentification(): This function finds community cores of the input network(1) Do the following steps for each node N of the input network G
(1.1) Identify Label(labels) with maximum Receiving Frequency in memory of N(1.2) Add N to the community core(cores) that is(are) characterized by the label(labels) of step 1.1
(2) Remove community cores that are completely nested inside a bigger oneAlgorithm 5. CommunityCoresIdentification function
Overlapping nodes are those that are located in the boundaries of different communities. So for each node, we calculatethe proportion of its neighbors belonging to different communities. Then we use a thresholding procedure; the nodes thathave considerable proportion of their friends in different communities are the nodes that are identified by the thresholdingstage to be overlapping nodes.

R. Badie et al. / Physica A 392 (2013) 5231–5247 5239
Table 1Parameter values used for generation of synthetic networks.
Networksize (n)
Averagedegree (k)
Exponent of nodes’degree distribution
Exponent of communitysize distribution
Mixingparameter (µ)
# Overlappingnodes (On)
# Memberships ofoverlapping nodes (Om)
Communitysize range
5000 10 2 1 {0.1, 0.3} n/10 {2, 3, 4, 5} [20, 100]
Table 2Different parameter value configurations.
Config. no. µ Om
1 0.1 22 0.1 33 0.1 44 0.1 55 0.3 26 0.3 37 0.3 48 0.3 5
FinalCommunitiesIdentification(): This function finds final communities from community coresDo the following steps for each node N of G
(1) Let C be the set of communities in vicinity of N(2) For each community c in C do the following steps
(2.1) Let Pc,N be the portion of neighbors of N that belong to c(2.2) Add N to c if Pc,N > α Threshold
Algorithm 6. FinalCommunitiesIdentification function
Algorithm 6 shows the thresholding phase in more detail, during which overlapping nodes are identified by our algo-rithm.
4. Experiments and results
In order to analyze and understand the performance of SATOCI in the identification of overlapping community structure,different experiments on both synthetic and real-world networks are executed. For creation of synthetic networks, we usethe widely accepted LFR benchmark [40]. Also, parameter values used for the creation of synthetic networks are stated inthe following subsections.
4.1. Synthetic networks’ characteristics
Table 1 shows the parameter values used for generation of synthetic networks in our experiments.We also set themaximumdegree in our synthetic networks to 50. By increasingOm harder identification tasks are created
to evaluate our algorithm. We intended to observe how robust our algorithm is in such tasks. Higher values for Om are notconsidered since a common feature observed by various algorithms in real-world networks is that only a relatively smallportion of the nodes of a network are overlapping nodes (often less than 30% of the total nodes of a network), each of whichbelongs to only 2 or 3 communities [11]. In our experiments, our algorithm is comparedwith 4 otherwell-known algorithmsthat are SLPA [25,26], OSLOM [21], Game [32] and COPRA [24]. These algorithms are reported to be the best in the detectionof overlapping communities [11]. We use the default parameter setting for OSLOM and Game. For other algorithms thathave tunable parameters, we tried to set the parameters in a way to achieve the best possible results for them. For SLPA theparameter r ranges between 0.05 and 0.5 with 0.05 steps. For COPRA, the parameter v is taken from the range [1, 9].
4.2. Experiments’ method description
For the experiments on the synthetic benchmark, for each configuration of parameter values, we generate 10 differentnetworks. We have 8 different configurations for parameter values that are listed in Table 2.
As described before n is the number of nodes, µ is the mixing parameter and Om is the number of memberships ofoverlapping nodes in the generated networks. Other parameters of the LFR benchmark have the same values described inSection 4.1. Our algorithm parameter is the strictness intensity that is used in the thresholding phase. We represent it withα and it ranges in the interval [0, 1]. Closer values of α to one will increase the strictness of algorithm in accepting a nodeas overlapping node.
For experiments on synthetic networks we let α to ranges over interval [0.10, 0.25] because by performing numerousexperimentations we find out that this interval contains all the possible appropriate values of α. We use each of the 10

5240 R. Badie et al. / Physica A 392 (2013) 5231–5247
Table 3The properties of different social networks used.
Name Nodes count Links count Reference
CA-GrQc(CA) 5 242 28980 [42]Dolphins(Dp) 62 159 [43]Football(Fb) 115 613 [2]Les Miserables(Ls) 77 254 [44]p2p-Gnutella31(p2p) 62586 147892 [42,45]PGP 10680 24340 [46]Karate(Kr) 34 78 [47]Soc-epinions 75879 508837 [48]Enron-email 36 692 367662 [49]
synthetic networks corresponding to a parameter value configuration as input for our algorithm. In the execution of ouralgorithm for each of these synthetic networks, we need to set α, the strictness intensity, appropriately. The initial value ofα is 0.10. Then we execute our algorithm for this value of α for 5 times; then α is increased by 0.01. Then we repeat it for thenext value of α until we perform the algorithm for 5 times for all the possible values of α. This exact routine will be followedfor all the 8 parameter value configurations until we have examined all of the configurations. Then for every syntheticnetwork we identify the optimal value of the strictness intensity. The optimal value of the strictness intensity for a networkis the value of α that if used by the algorithm yields the best NMI [10] value. At the end, we compute another measure calledF-score that is defined in the following formula [11] and the results of experiments are represented in the following sections:
F =2 · precision · recallprecision + recall
. (5)
In our experiments on real-world social networks, someof themostwell-knownavailable datasets are used. As no groundtruth is available for most of the real-world datasets the NMI measure cannot be used. So, for evaluating the performanceof our algorithm on these types of social networks Nicosia modularity [41] is used. The real-world social networks used aredescribed in Table 3.
4.3. Overlapping communities in synthetic networks
In order to compare our algorithm with other similar algorithms, we use an extended form of NMI introduced by Lanci-chinetti [24]. That is a value between 0 and 1. It can be used for comparing two different covers with each other. So whenwehave the ground truth for a given network, which is the case for synthetic networks, this measure can be used for compar-ing the accuracy of different algorithms. The best values for NMI of the algorithms are depicted in Figs. 3 and 4. Higher NMIvalues for SATOCI clearly show that it outperforms other algorithms. Note that other algorithms used in our experimentsare among the best performers in this field. This best performance is achieved for different values of mixing parameter, bothfor µ = 0.1 and µ = 0.3. This fact implies that our algorithm is capable of handling different topological structures. TheLFR benchmark creates communities in the generated synthetic networks by changing some attributes like node degreesequences, their in-degree, out-degree andmixing parameters. All of these parameters are defining communities by adjust-ing the topological properties of the network. In addition, since in the synthetic networks created by the LFR benchmark,links represent pairwise relationships between nodes (not flows), topological algorithms can perform better in detection ofcommunities. Our algorithm is topological like SLPA and this is the reason why these two algorithms achieved better NMIthan the Fuzzy-Infomap algorithm.
4.4. Overlapping nodes’ detection in synthetic networks
In addition to detection of overlapping communities, it is also important for an algorithm to be able to make correctidentifications of overlapping nodes. We use the same F-score introduced in Ref. [26] for evaluating our algorithm accuracyin the identification of overlapping nodes. The identification of overlapping nodes is like a binary classification problem.We use F-score as a measure of accuracy, which is defined as the harmonic mean of precision (i.e., the number of overlap-ping nodes detected correctly divided by the total number of all detected overlapping nodes) and recall (i.e., the number ofoverlapping nodes discovered correctly divided by the expected value of overlapping nodes, that is 500 for all the syntheticnetworks we generated by using the LFR benchmark for our experimental purposes).
The precision of different algorithms is depicted in Fig. 5.Also, the recall achieved by different algorithms is depicted in Fig. 6.Fig. 7 shows F-score as a function of the number of memberships. As you can see SATOCI also achieves the largest F-score
for the synthetic networks generated by the LFR benchmark.As shown in Figs. 5–7, the Fuzzy-Infomap algorithm is the best binary classifier for categorizing nodes as overlapping or
non-overlapping. After that our algorithm and SLPA have the best performance in this case. The high performance of Fuzzy-Infomap in binary classification of nodes originates from taking into account the amount of flow a node exchanges with

R. Badie et al. / Physica A 392 (2013) 5231–5247 5241
Fig. 3. NMI as a function of Om for LFR networks with n = 5000 and µ = 0.1.
Fig. 4. NMI as a function of Om for LFR networks with n = 5000 and µ = 0.3.
Fig. 5. Precision as a function of Om for LFR networks with n = 5000 and µ = 0.3.
its neighboring communities. Although, Fuzzy-Infomap is very precise in this classification, its weakness is that it can onlybe run on small networks due to its large memory needs. Although, we were able to run Infomap for all of the real-worlddatasets introduced in Table 3, we could not run the Fuzzy-Infomap for PGP [46] and p2p-Gnutella31(p2p) [42,45] networks

5242 R. Badie et al. / Physica A 392 (2013) 5231–5247
Fig. 6. Recall as a function of Om for LFR networks with n = 5000 and µ = 0.3.
Fig. 7. F-score as a function of Om for LFR networks with n = 5000 and µ = 0.3.
on a laptop with 4 GB of main memory due to its high memory consumption. So, for these two networks we just report theresults of the Infomap algorithm.
As another test for the accuracy of our algorithm we compare the identified and actual distribution of community sizes(CS). Figs. 8–10 show the histogram of CS for different values of Om. We have 10 different LFR generated graphs for each ofthe first three parameter value configurations introduced earlier for the case whereµ = 0.3, which is a harder scenario. Foreach of these ten networks, corresponding to one of the parameter value configurations, we executed our algorithm for anumber of times. Then community sizes and community count statistics of the best results for each of the ten networks areaggregated and averaged. The actual statistics of the community sizes and counts for each of the ten generated networksare known. So, these actual statistics are also aggregated and averaged together. The final results are shown in the followingfigures. In synthetic networks, we expect the size distribution to follow the power lawwith exponent τ2 = 1withminimumsize 20 and maximum size 100. As shown in Figs. 8–10, the results of SATOCI are in very good agreement with the actualdistribution.
As one can see in the above figures, our algorithm is very accurate in the detection of community sizes. Even our algorithmdetects the count of communitieswith a specific size precisely. The only shortcoming iswhenOm = 4 and community size isbigger than 80. In this case, our algorithm reports lower counts for such communities. This is also true for SLPA. Please notethat SLPA is among the best performers in this field [11]. In Figs. 8–10 it can be observed that SLPA always reports highernumbers for small size communities incorrectly (range [11, 20]) compared with our algorithm. In addition, SLPA does notperform well in identifying communities with sizes bigger than 90.
4.5. Overlapping communities in real-world social networks
In order to evaluate the performance and precision of overlapping community detection in real-world networks, a specialversion of modularity proposed by Nicosia [41] is used. We call this version, the Nicosia modularity and denote it with Qov.It is an extension of Newman’s Modularity [50] for directed networks with overlapping communities. The value of Nicosiamodularity depends on the number of communities to which each node belongs and the strength of its membership to eachcommunity. Like [27] we assume that each node belongs equally to all of the communities of which it is a member. In the

R. Badie et al. / Physica A 392 (2013) 5231–5247 5243
Fig. 8. Community size histogram for LFR networks with n = 5000,Om = 2 and µ = 0.3.
Fig. 9. Community size histogram for LFR networks with n = 5000,Om = 3 and µ = 0.3.
Fig. 10. Community size histogram for LFR networks with n = 5000,Om = 4 and µ = 0.3.
definition of Nicosia modularity, a function f exists. We define this function as suggested in Ref. [27]:
f (x) = 60x − 30. (6)
Like other modularity measures Qov varies between 0 and 1. Despite its intrinsic problems, it is widely accepted for the eval-uation of the accuracy of different algorithms. So we will use this measure for the evaluation of the precision of covers thatSATOCI found in real-world social networks. But note that we shall not draw strong conclusions about the accuracy of the

5244 R. Badie et al. / Physica A 392 (2013) 5231–5247
Fig. 11. Nicosia modularity values achieved for different datasets.
community detection that is performed when using this measure for evaluation, because of the existence of essential flawsin the definition of this measure [27,11,1,51].
In this experiment, SATOCI uses α in between 0.1 and 0.6. α is the strictness intensity parameter. The higher the valueof the strictness, the lower the number of overlapping nodes identified by SATOCI will be. Other algorithms use the sameparameters as discussed before. For SLPA and COPRA, we repeat the algorithms 100 times and record the average of Qov. Asshown in Fig. 11, the results of SATOCI are very close to that of SLPA. For some networks like CA, PGP and P2P the results ofSLPA are slightly higher than that of SATOCI. Also, notice that the performance of the Fuzzy-Infomap algorithm is slightlylower than our proposed algorithm. This is because themodularity measure gives more importance to the topological prop-erties of the network, e.g. link weights, in-degree, out-degree and cohesiveness of specific parts in the input network. Ouralgorithm is a topological algorithm that can perform better in community detection when the links of the input networkrepresent pairwise relationships between actors. On the other hand, algorithms such as Infomap (or Fuzzy-Infomap) canperform better if the links represent induced flows between actors. For more clarification, we may refer to the US collegefootball teams’ network example at the end of this section.
Note that acquiring a cover with maximum value of modularity for a given network does not necessarily mean that isthe best cover for that network. The optimal cover from a topological point of view, which usually does not correspond tothe maximum modularity due to the resolution limit [14], indeed may actually have a high modularity value. As a result,the optimal cover is essentially indistinguishable from a huge number of high-modularity covers, which are in generalstructurally dissimilar. Large structural discrepancy among the high-modularity covers implicitly declares that we cannotrely on any of them, at least in principle,whenno additional information is available for a specific systemand its structure [1].So, because of the imperfections in the definition of modularity and as the optimal structure is indistinguishable using itsassociated modularity value, we avoid using modularity directly in our algorithm.
As a final examplewe showour algorithm result for the network of American college football teams introduced in Ref. [2].This is a real-world social network with known community structures. For this network we found the following communi-ties:
1- {Florida State, North Carolina, Virginia, Duke, Georgia Tech, Wake Forest, North Carolina State, Maryland, Clemson};2- {Boston College, Virginia Tech, Miami Florida, Pittsburgh,West Virginia, Syracuse, Rutgers, Temple, Notre Dame, Navy};3- {EasternMichigan, Northern Illinois, Central Michigan,WesternMichigan, Ball State, Akron, Kent, Connecticut, Bowling
Green State, Marshall, Ohio, Toledo, Buffalo, Miami Ohio};4- {San Jose State, Nevada, Texas Christian, Southern Methodist, Texas El Paso, Hawaii, Rice, Fresno State, Tulsa};5- {Iowa, Illinois,Michigan State,Michigan,Minnesota, Northwestern, Ohio State, Purdue, Indiana, Penn State,Wisconsin};6- {Nevada Las Vegas, San Diego State, Air Force, Brigham Young, Colorado State, Wyoming, New Mexico, Utah};7- {Alabama Birmingham, East Carolina, Army, Tulane, Cincinnati, Southern Mississippi, Louisville, Houston, Memphis};8- {Baylor, Oklahoma State, Texas A&M, Texas Tech, Texas, Iowa State,Missouri, Nebraska, Kansas State, Kansas, Oklahoma,
Colorado};9- {Oregon, Oregon State, Washington, Southern California, Arizona, Arizona State, Washington State, Stanford, California,
UCLA};10- {Louisiana State, Tennessee, Middle Tennessee State, Georgia, Florida, Arkansas, Auburn, Kentucky, Mississippi,
Louisiana Tech, Alabama, Vanderbilt, Louisiana Monroe, Mississippi State, South Carolina};11- {New Mexico State, Utah State, Arkansas State, Boise State}.

R. Badie et al. / Physica A 392 (2013) 5231–5247 5245
Fig. 12. Community structures of the American college football teams’ network [2].
Our algorithm detects North Texas, Louisiana Lafayette, Idaho and Central Florida as overlapping nodes.By comparing our results to the known community structure for this network [2] one can see that our algorithm detected
the correct communities for this network accurately. The performance of our algorithm for the above network proves itsprecision in the detection of community structures in complex networks. On the other hand, Infomap is a flow-based al-gorithm and cannot produce acceptable results for networks such as the US college football teams’ network in which thelinks represent pairwise relations between nodes. In this example, Infomap detects 8 communities instead of the actual 11communities.
5. Conclusion and discussion
In this paper an efficient algorithm, named SATOCI, for overlapping community detection was introduced. Also, througha number of different experiments, we proved that the performance of our algorithm in synthetic networks is significantlybetter than other similar state-of-the-art algorithms. The main reason is that in our algorithm, agents consider closeness ofdifferent nodes in their decisions. Of course, in terms of precision, the performance of SATOCI is competitive compared withthe best algorithms of this field.
We also cross-checked the performance of our algorithm in real-world networks in which their actual communitystructure is already known. The results specify that SATOCI is also able to find community structures in real-world networksprecisely. One of the experimented real-world networks is the American college football teams introduced in Ref. [2] thatexplains the better performance of SATOCI (see Fig. 12).
We also showed that in the binary classification problem of deciding whether a specific node is overlapping or not, ourproposedmethod performs verywell in terms of F-score that is also another sign of the outstanding accuracy of ourmethod.In addition, we showed that our method is able to identify the size of communities and the count of communities with aspecific size precisely. Moreover, our algorithm has a desirable behavior for its convergence, i.e. the more the simulationstage iterates, the more accurate the final results will be; this is not true for algorithms like SLPA.
SATOCI does not use the attributes of random walkers’ process such as walker persistency times or nodes ergodic visitfrequencies of Infomap. It uses agents for dissemination of labels in the input network. Label dissemination is used as a wayto simulate interactions between individuals in real world. Also, the individuals’ closeness is considered by weighting linkswith L2I. There is another difference between Infomap and our algorithm. Infomap is a flow-based algorithm, so propertieslike the direction of links and persistency time are the primary aspects of a network that Infomap takes into consideration.But, SATOCI is a topological algorithm. It inspects the structures of a given network by considering the topological propertiesamong the links of the network. In other words, our method belongs to the category of methods that try to optimize the

5246 R. Badie et al. / Physica A 392 (2013) 5231–5247
modularity measures. Although, our method does not try to directly optimize any specific criteria, it identifies sections ofthe input network with high overall cohesiveness.
In general, the results of our algorithm may be completely different from those produced by the Infomap algorithm forvarious networks. For example, in analyzing networks inwhich links represent pairwise relationships rather than flows, thenourmethod can provide better results compared to Infomap. For such systems, topological methods such asmodularity [52]or our proposed algorithm are preferable. But for analyzing network data where the links represent patterns of movementamong nodes, flow-based approaches are likely to identify the most important structural features.
The Infomap algorithm can discover precise and fine-grained communities for networks in which the direction of linksare in away that long-range flows of information appear. But it is possible for this family of algorithms to lose their versatilitywhen long-range flows do not exist on a network. For example, consider a network in which all nodes are source or sink.But, our algorithm is also able to detect meaningful features in such networks.
SATOCI can be extended by addition of other measures that express the cohesiveness of a subgraph to Jaccard index thatis currently used in the definition of L2I. The current version of our algorithm is designed for un-weighted networks. But,extension of the current algorithm forweighted networkswould be straight forward. A simple interpolationmay be used forthe application of initial weights of links of the input network in L2I. Different ways of this interpolation can be investigatedas a future work.
References
[1] S. Fortunato, Community detection in graphs, Physics Reports 486 (2010) 75–174.[2] M. Girvan, M.E.J. Newman, Community structure in social and biological networks, Proceedings of the National Academy of Sciences 99 (2002)
7821–7826.[3] P. Erdös, A. Rényi, Statistical physics of social dynamics, Publicationes Mathematicae Debrecen 6 (1959) 290.[4] A. Zhang, Protein Interaction Networks: Computational Analysis, Cambridge University Press, 2009.[5] R. Guimera, L.A.N. Amaral, Functional cartography of complex metabolic networks, Nature 433 (2005) 895–900.[6] R. Albert, H. Jeong, A. Barabasi, The diameter of the world wide web, Nature 401 (1999) 130.[7] V. Spirin, L.A. Mirny, Protein complexes and functional modules in molecular networks, Proceedings of the National Academy of Sciences 100 (2003)
12123–12128.[8] A. Pothen, Graph partitioning algorithmswith applications to scientific computing, in: ICASE LaRC Interdisciplinary Series in Science and Engineering,
vol. 4, 1997, pp. 323–368.[9] S. Kelley, M. Goldberg, M. Magdon-Ismail, K. Mertsalov, A. Wallace, Handbook of Optimization in Complex Networks, Springer, 2011.
[10] A. Lancichinetti, S. Fortunato, J. Kertész, Detecting the overlapping and hierarchical community structure in complex networks, New Journal of Physics11 (2009) 033015.
[11] J. Xie, S. Kelley, B.K. Szymanski, Overlapping community detection in networks: the state of the art and comparative study, 2011. ArXiv PreprintarXiv:1110.5813.
[12] U.N. Raghavan, R. Albert, S. Kumara, Near linear time algorithm to detect community structures in large-scale networks, Physical Review E 76 (2007)036106.
[13] G. Palla, I. Derényi, I. Farkas, T. Vicsek, Uncovering the overlapping community structure of complex networks in nature and society, Nature 435 (2005)814–818.
[14] B. Adamcsek, G. Palla, I.J. Farkas, I. Derényi, T. Vicsek, CFinder: locating cliques and overlapping modules in biological networks, Bioinformatics 22(2006) 1021–1023.
[15] J.P. Onnela, J. Saramäki, J. Kertész, K. Kaski, Intensity and coherence of motifs in weighted complex networks, Physical Review E 71 (2005) 065103.[16] I. Farkas, D. Ábel, G. Palla, T. Vicsek, Weighted network modules, New Journal of Physics 9 (2007) 180.[17] C. Lee, F. Reid, A. McDaid, N. Hurley, Detecting highly overlapping community structure by greedy clique expansion, 2010. ArXiv Preprint
arXiv:1002.1827.[18] Y.Y. Ahn, J.P. Bagrow, S. Lehmann, Link communities reveal multiscale complexity in networks, Nature 466 (2010) 761–764.[19] T. Evans, R. Lambiotte, Line graphs of weighted networks for overlapping communities, The European Physical Journal B. Condensed Matter and
Complex Systems 77 (2010) 265–272.[20] J. Baumes, M. Goldberg, M. Krishnamoorthy, M. Magdon-Ismail, N. Preston, Finding communities by clustering a graph into overlapping subgraphs,
2005, pp. 97–104.[21] A. Lancichinetti, F. Radicchi, J.J. Ramasco, S. Fortunato, Finding statistically significant communities in networks, PLoS One 6 (2011) e18961.[22] S. Zhang, R.S. Wang, X.S. Zhang, Identification of overlapping community structure in complex networks using fuzzy c-means clustering, Physica A.
Statistical Mechanics and its Applications 374 (2007) 483–490.[23] P.G. Sun, L. Gao, S. Shan Han, Identification of overlapping and non-overlapping community structure by fuzzy clustering in complex networks,
Information Sciences 181 (2011) 1060–1071.[24] S. Gregory, Finding overlapping communities in networks by label propagation, New Journal of Physics 12 (2010) 103018.[25] J. Xie, B. Szymanski, Towards linear time overlapping community detection in social networks, in: Advances in Knowledge Discovery and DataMining,
2012, pp. 25–36.[26] J. Xie, B.K. Szymanski, X. Liu, SLPA: Uncovering Overlapping Communities in Social Networks Via a Speaker–Listener Interaction Dynamic Process,
IEEE, 2011, pp. 344–349.[27] Z.H. Wu, Y.F. Lin, S. Gregory, H.Y. Wan, S.F. Tian, Balanced multi-label propagation for overlapping community detection in social networks, Journal
of Computer Science and Technology 27 (2012) 468–479.[28] S. Gregory, An algorithm to find overlapping community structure in networks, in: Knowledge Discovery in Databases: PKDD 2007, 2007, pp. 91–102.[29] H. Shen, X. Cheng, K. Cai, M.B. Hu, Detect overlapping and hierarchical community structure in networks, Physica A. Statistical Mechanics and its
Applications 388 (2009) 1706–1712.[30] T. Nepusz, A. Petróczi, L. Négyessy, F. Bazsó, Fuzzy communities and the concept of bridgeness in complex networks, Physical Review E 77 (2008)
016107.[31] I. Psorakis, S. Roberts, M. Ebden, B. Sheldon, Overlapping community detection using Bayesian non-negative matrix factorization, Physical Review E
83 (2011) 066114.[32] W. Chen, Z. Liu, X. Sun, Y. Wang, A game-theoretic framework to identify overlapping communities in social networks, Data Mining and Knowledge
Discovery 21 (2010) 224–240.[33] A. McDaid, N. Hurley, Detecting Highly Overlapping Communities with Model-Based Overlapping Seed Expansion, IEEE, 2010, pp. 112–119.[34] M. Rosvall, C.T. Bergstrom,Maps of randomwalks on complex networks reveal community structure, Proceedings of the National Academy of Sciences
105 (2008) 1118–1123.[35] A.V. Esquivel, M. Rosvall, Compression of flow can reveal overlapping-module organization in networks, Physical Review X 1 (2011) 021025.

R. Badie et al. / Physica A 392 (2013) 5231–5247 5247
[36] A. Clauset, M.E. Newman, C. Moore, Finding community structure in very large networks, Physical Review E 70 (2004) 066111.[37] K. Wakita, T. Tsurumi, Finding community structure in mega-scale social networks, 2007. ArXiv Preprint http://arxiv.org/abs/cs/0702048.[38] P. Jaccard, Étude comparative de la distribution floraledansune portion des Alpeset des Jura, Bulletin de la Société Vaudoise des Sciences Naturelles
37 (1901) 547–579.[39] M.S. Granovetter, The strength of weak ties, American Journal of Sociology (1973) 1360–1380.[40] A. Lancichinetti, S. Fortunato, Benchmarks for testing community detection algorithms on directed and weighted graphs with overlapping
communities, Physical Review E 80 (2009) 016118.[41] V. Nicosia, G. Mangioni, V. Carchiolo, M. Malgeri, Extending the definition of modularity to directed graphs with overlapping communities, Journal of
Statistical Mechanics: Theory and Experiment 2009 (2009) P03024.[42] J. Leskovec, J. Kleinberg, C. Faloutsos, Graph evolution: densification and shrinking diameters, ACM Transactions on Knowledge Discovery from Data
(TKDD) 1 (2007) 2.[43] D. Lusseau, K. Schneider, O.J. Boisseau, P. Haase, E. Slooten, S.M. Dawson, The bottlenose dolphin community of doubtful sound features a large
proportion of long-lasting associations, Behavioral Ecology and Sociobiology 54 (2003) 396–405.[44] D.E. Knuth, The Stanford GraphBase: A Platform for Combinatorial Computing, ACM Press, 1993.[45] M. Ripeanu, I. Foster, Mapping the gnutella network: macroscopic properties of large-scale peer-to-peer systems, in: Peer-to-Peer Systems, 2002,
pp. 85–93.[46] M. Boguñá, R. Pastor-Satorras, A. Díaz-Guilera, A. Arenas, Models of social networks based on social distance attachment, Physical Review E 70 (2004)
056122.[47] W.W. Zachary, An information flow model for conflict and fission in small groups, Journal of Anthropological Research (1977) 452–473.[48] M. Richardson, R. Agrawal, P. Domingos, Trust management for the semantic web, in: The Semantic Web-ISWC 2003, 2003, pp. 351–368.[49] B. Klimt, Y. Yang, Introducing the Enron corpus, in: First Conference on Email and Anti-Spam, CEAS, 2004.[50] M.E.J. Newman, Fast algorithm for detecting community structure in networks, Physical Review E 69 (2004) 066133.[51] R. Guimera,M. Sales-Pardo, L.A.N. Amaral,Modularity from fluctuations in randomgraphs and complex networks, Physical ReviewE70 (2004) 025101.[52] M.E. Newman, M. Girvan, Finding and evaluating community structure in networks, Physical Review E 69 (2004) 026113.