Cities as Highly Functional Socio-Ecological Systems: Solving the Environmental Crisis with a Tree?
Upload
independentCategory
view
0download
0
Instructional Science 25: 151–166, 1997. 151c 1997 Kluwer Academic Publishers. Printed in the Netherlands.
An ecological approach to the on-line assessment ofproblem-solving paths: Principles and applications
ROBERT E. SHAW1�, JUDITH A. EFFKEN2, BRETT R. FAJEN1,STEVEN R. GARRETT1 and ANTHONY MORRIS11University of Connecticut, Department of Psychology, Bousfield Building, Box U-20, Storrs,CT 06269 USA (�Author for correspondence)2University of Arizona, Tucson, AZ 85721, USA
Abstract. In this paper, we propose a theoretical framework for designing on-line situatedassessment tools for multimedia instructional systems. Based on an ecological psychologyapproach to situated learning, a graph theoretic methodology is applied to monitor students’performance (solution paths) throughout the learning activity. Deviation of the student’s pathfrom the target (expert) path generates indicators which can function as alerts to the student andto the instructor. The information collected in the dribble files and presented visually enablesthe instructor to identify problems quickly and intervene appropriately. The feasibility of themethodology is explored in case studies describing three instructional systems that teach (1)critical thinking and problem-solving skills, (2) principles of hemodynamic monitoring andtreatment, and (3) orthodontic treatment, respectively.
Key words: assessment, problem solving, interface design, ecological psychology, hypermedia
Millions of dollars have been invested to design and implement interac-tive multi-media technology that can develop students’ critical thinking andproblem-solving skills. As a result, today’s multi-media instructional systemsare capable of creating highly realistic, situated problem-solving experiencesfor students. However, designing assessment components for these instruc-tional systems remains a challenge.
Multi-media instructional systems commonly use the record-keepingabilities of the computer to tally and store students’ scores, often as pre- andpost-test assessments of what the student learned. Underlying these assess-ments is a linear, additive, static model of knowledge and understanding thatconstrains evaluation to a snap-shot in time and ignores the crucial interac-tive and dynamic components of learning. Restated, this type of assessmentconsiders only the product, rather than the process of learning. Clearly, theproducts of learning (problem solutions, calculations) are valuable assessmentdata. But the processes of learning are equally important. In computer-basedenvironments, students’ interactive learning processes can be captured toprovide important feedback for the learner, the instructor or even the instruc-
152
tional designer. The design challenge is finding a way to integrate productwith process information in a way that is minimally disruptive to the student’sinteractive learning process and maximally informative to the instructor. Ifproperly designed, computer-based records of the student’s interaction withthe instructional interface can provide the instructor with new insights intostudents’ learning processes that were previously impossible to assess on-lineand difficult to assess post hoc.
This paper offers a theoretical framework for designing situated assessmentsystems to provide instructors with real-time, on-line evaluation of students’performance. After describing the underlying graph theoretic methodologyand relevant principles of ecological interface design, the feasibility of theapproach is demonstrated in three instructional environments.
The ecological approach to situated assessment
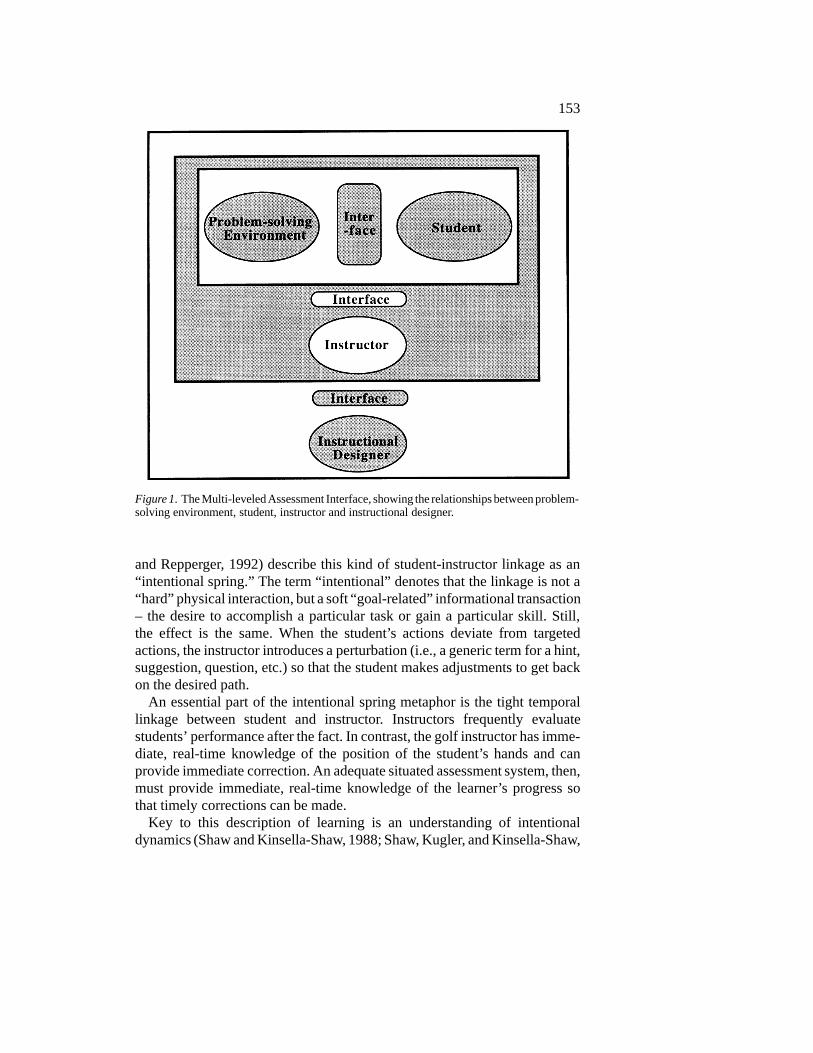
The goal of anchored instruction (CTGV, 1990, 1992) is to situate instruc-tion in a realistic environment. The goal of anchored assessment is to situateassessment in the same realistic environment. Minimally, two componentsmust be assessed: the student and the learning context (Young, 1993; Youngand McNeese, 1995). We assume that the student is coupled to the problem-solving instructional environment through the interface (see Figure 1). At thislevel, evaluation is provided to the student as feedback about performance,questions about selected strategies, or instructions about the learning task orthe interface itself. At a higher level, the student-problem-solving interfaceis coupled to the instructor. At this level, the assessment system providesthe instructor with real-time information about the student’s problem-solvingprogress, identifies potential problem areas and perhaps suggests interven-tions. This enables the instructor to provide the necessary scaffolding forproblem-solvers and to remove that scaffolding as students progress. Becausethe instructor’s expertise must be divided among many students that may ormay not be in the same physical setting (e.g., in asynchronous access to learn-ing resources), it is advisable to build some of that expertise into the interface,as an on-line screening tool or teaching assistant, for example.
The perturbation reduction technique
Imagine students learning to play golf. To teach the students the correctgrip, instructors may place their hands over the students’, thereby hard-coupling their hands. When students’ hands deviate from the desired grip,instructors can apply the physical force of their own hands to get students tomake the correct adjustment. Shaw and his colleagues (Shaw, Kadar, Sim,
153
Figure 1. The Multi-leveled Assessment Interface, showing the relationships between problem-solving environment, student, instructor and instructional designer.
and Repperger, 1992) describe this kind of student-instructor linkage as an“intentional spring.” The term “intentional” denotes that the linkage is not a“hard” physical interaction, but a soft “goal-related” informational transaction– the desire to accomplish a particular task or gain a particular skill. Still,the effect is the same. When the student’s actions deviate from targetedactions, the instructor introduces a perturbation (i.e., a generic term for a hint,suggestion, question, etc.) so that the student makes adjustments to get backon the desired path.
An essential part of the intentional spring metaphor is the tight temporallinkage between student and instructor. Instructors frequently evaluatestudents’ performance after the fact. In contrast, the golf instructor has imme-diate, real-time knowledge of the position of the student’s hands and canprovide immediate correction. An adequate situated assessment system, then,must provide immediate, real-time knowledge of the learner’s progress sothat timely corrections can be made.
Key to this description of learning is an understanding of intentionaldynamics (Shaw and Kinsella-Shaw, 1988; Shaw, Kugler, and Kinsella-Shaw,
154
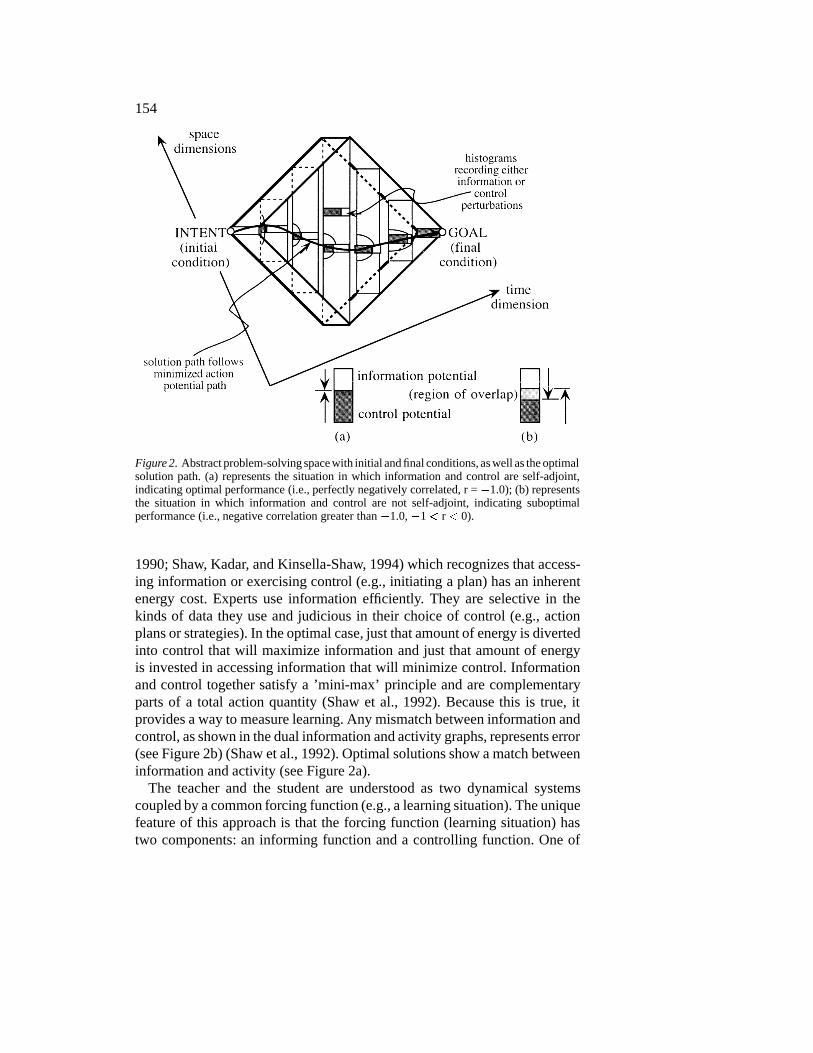
Figure 2. Abstract problem-solving space with initial and final conditions, as well as the optimalsolution path. (a) represents the situation in which information and control are self-adjoint,indicating optimal performance (i.e., perfectly negatively correlated, r = �1.0); (b) representsthe situation in which information and control are not self-adjoint, indicating suboptimalperformance (i.e., negative correlation greater than �1.0, �1< r < 0).
1990; Shaw, Kadar, and Kinsella-Shaw, 1994) which recognizes that access-ing information or exercising control (e.g., initiating a plan) has an inherentenergy cost. Experts use information efficiently. They are selective in thekinds of data they use and judicious in their choice of control (e.g., actionplans or strategies). In the optimal case, just that amount of energy is divertedinto control that will maximize information and just that amount of energyis invested in accessing information that will minimize control. Informationand control together satisfy a ’mini-max’ principle and are complementaryparts of a total action quantity (Shaw et al., 1992). Because this is true, itprovides a way to measure learning. Any mismatch between information andcontrol, as shown in the dual information and activity graphs, represents error(see Figure 2b) (Shaw et al., 1992). Optimal solutions show a match betweeninformation and activity (see Figure 2a).
The teacher and the student are understood as two dynamical systemscoupled by a common forcing function (e.g., a learning situation). The uniquefeature of this approach is that the forcing function (learning situation) hastwo components: an informing function and a controlling function. One of
155
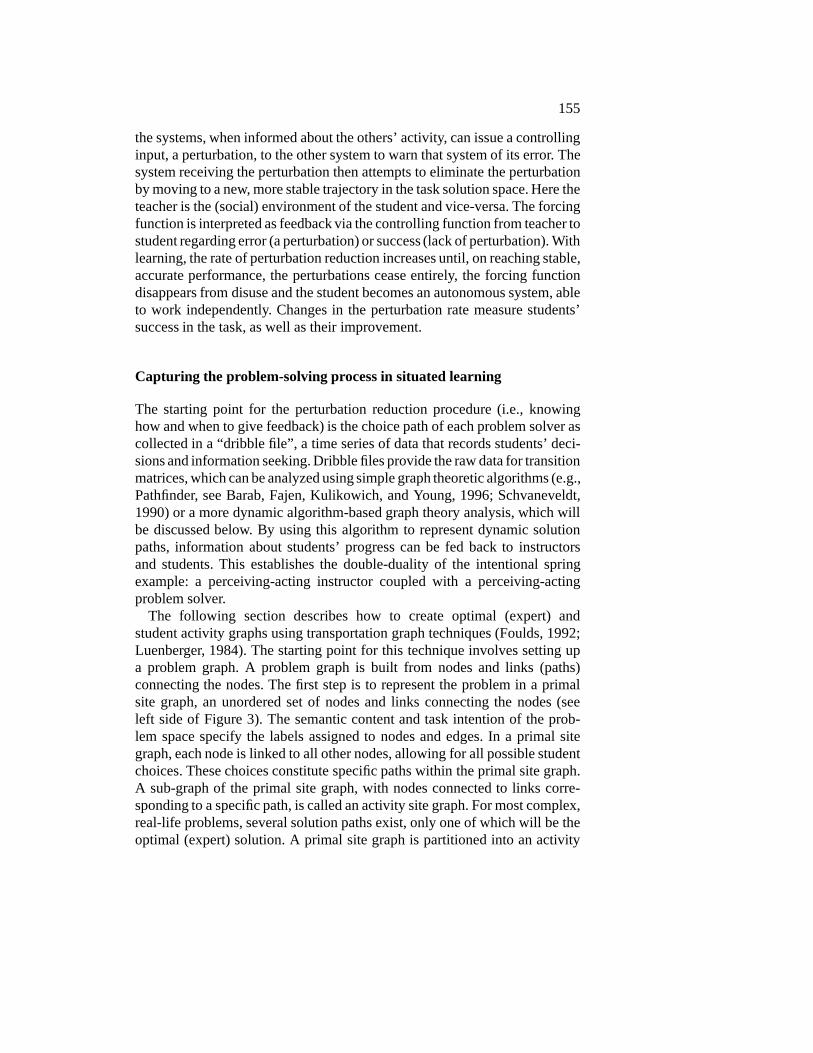
the systems, when informed about the others’ activity, can issue a controllinginput, a perturbation, to the other system to warn that system of its error. Thesystem receiving the perturbation then attempts to eliminate the perturbationby moving to a new, more stable trajectory in the task solution space. Here theteacher is the (social) environment of the student and vice-versa. The forcingfunction is interpreted as feedback via the controlling function from teacher tostudent regarding error (a perturbation) or success (lack of perturbation). Withlearning, the rate of perturbation reduction increases until, on reaching stable,accurate performance, the perturbations cease entirely, the forcing functiondisappears from disuse and the student becomes an autonomous system, ableto work independently. Changes in the perturbation rate measure students’success in the task, as well as their improvement.
Capturing the problem-solving process in situated learning
The starting point for the perturbation reduction procedure (i.e., knowinghow and when to give feedback) is the choice path of each problem solver ascollected in a “dribble file”, a time series of data that records students’ deci-sions and information seeking. Dribble files provide the raw data for transitionmatrices, which can be analyzed using simple graph theoretic algorithms (e.g.,Pathfinder, see Barab, Fajen, Kulikowich, and Young, 1996; Schvaneveldt,1990) or a more dynamic algorithm-based graph theory analysis, which willbe discussed below. By using this algorithm to represent dynamic solutionpaths, information about students’ progress can be fed back to instructorsand students. This establishes the double-duality of the intentional springexample: a perceiving-acting instructor coupled with a perceiving-actingproblem solver.
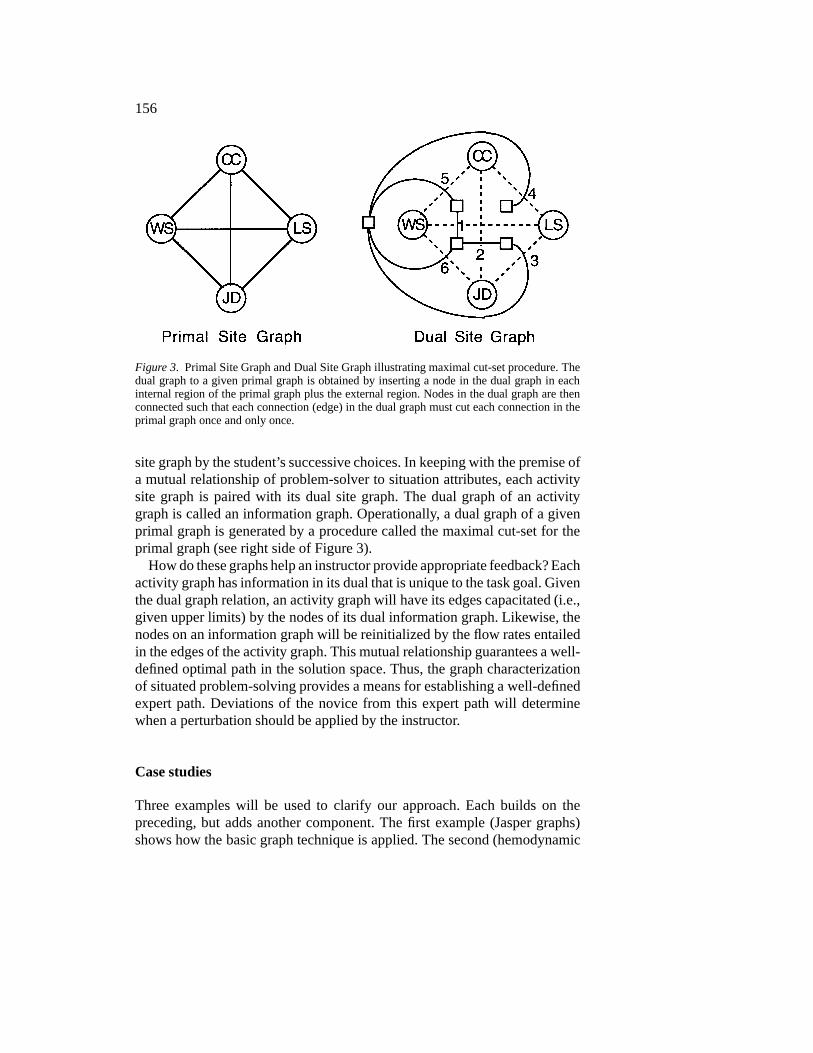
The following section describes how to create optimal (expert) andstudent activity graphs using transportation graph techniques (Foulds, 1992;Luenberger, 1984). The starting point for this technique involves setting upa problem graph. A problem graph is built from nodes and links (paths)connecting the nodes. The first step is to represent the problem in a primalsite graph, an unordered set of nodes and links connecting the nodes (seeleft side of Figure 3). The semantic content and task intention of the prob-lem space specify the labels assigned to nodes and edges. In a primal sitegraph, each node is linked to all other nodes, allowing for all possible studentchoices. These choices constitute specific paths within the primal site graph.A sub-graph of the primal site graph, with nodes connected to links corre-sponding to a specific path, is called an activity site graph. For most complex,real-life problems, several solution paths exist, only one of which will be theoptimal (expert) solution. A primal site graph is partitioned into an activity
156
Figure 3. Primal Site Graph and Dual Site Graph illustrating maximal cut-set procedure. Thedual graph to a given primal graph is obtained by inserting a node in the dual graph in eachinternal region of the primal graph plus the external region. Nodes in the dual graph are thenconnected such that each connection (edge) in the dual graph must cut each connection in theprimal graph once and only once.
site graph by the student’s successive choices. In keeping with the premise ofa mutual relationship of problem-solver to situation attributes, each activitysite graph is paired with its dual site graph. The dual graph of an activitygraph is called an information graph. Operationally, a dual graph of a givenprimal graph is generated by a procedure called the maximal cut-set for theprimal graph (see right side of Figure 3).
How do these graphs help an instructor provide appropriate feedback? Eachactivity graph has information in its dual that is unique to the task goal. Giventhe dual graph relation, an activity graph will have its edges capacitated (i.e.,given upper limits) by the nodes of its dual information graph. Likewise, thenodes on an information graph will be reinitialized by the flow rates entailedin the edges of the activity graph. This mutual relationship guarantees a well-defined optimal path in the solution space. Thus, the graph characterizationof situated problem-solving provides a means for establishing a well-definedexpert path. Deviations of the novice from this expert path will determinewhen a perturbation should be applied by the instructor.
Case studies
Three examples will be used to clarify our approach. Each builds on thepreceding, but adds another component. The first example (Jasper graphs)shows how the basic graph technique is applied. The second (hemodynamic

157
monitoring) extends the basic graph technique to merge data from both infor-mation and action graphs into a dynamic, perceptually-based display for theinstructor. The third (orthodontic treatment planning) extends the approachto include intrinsic measures of success by taking into account individualpatient characteristics.
1. Jasper graphs of questions and actions
In one successful multi-media instructional environment, the Jasper Series(see CTGV, 1990, 1992, 1993; Young, 1993 for a detailed description),students view short videodisc-based stories in which a multi-step, real-worldproblem is embedded. For example, in “Journey to Cedar Creek,” the maincharacter, Jasper Woodbury, travels down a river to buy a boat. The storyfollows Jasper to the point where he buys the boat and must decide whetherhe has enough daylight, gas and money to get the boat home.
To solve the problem, students must collect and integrate from all the factsembedded in the story just that information relevant to the solution. Studentssolve the problem using a HyperCard-designed interface called the “JasperPlanning Assistant” (JPA). The JPA provides instructional scaffolding byallowing and sometimes prompting students to generate sub-goals, recordfacts, make calculations, review parts of the story, etc. As students collectfacts by observing and reviewing the video, they record sub-problems andfacts on separate lists which may be accessed and appended repeatedly.
All student interaction with the JPA is recorded in a dribble file. Trainedinstructors use these dribble files (along with student interviews and retro-spective protocol analysis) to recreate the student’s solution. The perturba-tion reduction approach can enhance interpretation of the dribble files (hence,assessment of complex problem-solving skills), as shown in the following: Inthe Jasper video, Journey to Cedar Creek, students perform activities, gatherinformation and make choices at four sites: Jasper’s home dock (JD), Larry’sgas station (LS), Willie’s gas station (WS), and Cedar Creek marina (CC).Each site is a node in the Primal Site graph (see Figure 3). To solve Jasper’sproblem, students must consider whether Jasper needs to stop at Willie’s gasstation (WS) or Larry’s gas station (LS) to refuel. Several possible pathsexist, but only one is optimal: Refuel at Willie’s (WS) then continue home(JD). Other paths result either in failure to get home or in less optimalsolutions. The critical information (i.e., that Willie’s is the only gas stationin the range of Jasper’s boat given its tank capacity and rate of fuel consump-tion) is contained in a graph that is dual to the graph containing the optimalpath.
The Jasper graphs show a “top-level” view of the possible and actualchoices made by the student, but not the underlying activities and information
158
the student used to arrive at those decisions. In the following examples, wewill show how dribble files can capture both aspects, thus providing morecomplete assessment data.
2. Teaching principles of hemodynamic monitoring and treatment
The objective of the hemodynamic monitoring instructional interface (Effken,1993; Effken, Kim and Shaw, in press) is to help nursing students learn theunderlying principles of hemodynamics so that they will understand betterhow to diagnose and treat clinical problems. Students choose from six drugsto treat simulated hemodynamic problems (variations in arterial, venous, andatrial pressure and cardiac output or flow) and give discrete doses of the drugsby pressing a mouse key. Each drug and dose given are recorded in an activitydribble file, along with the current patient pressure and flow values, recordedin the information dribble file.
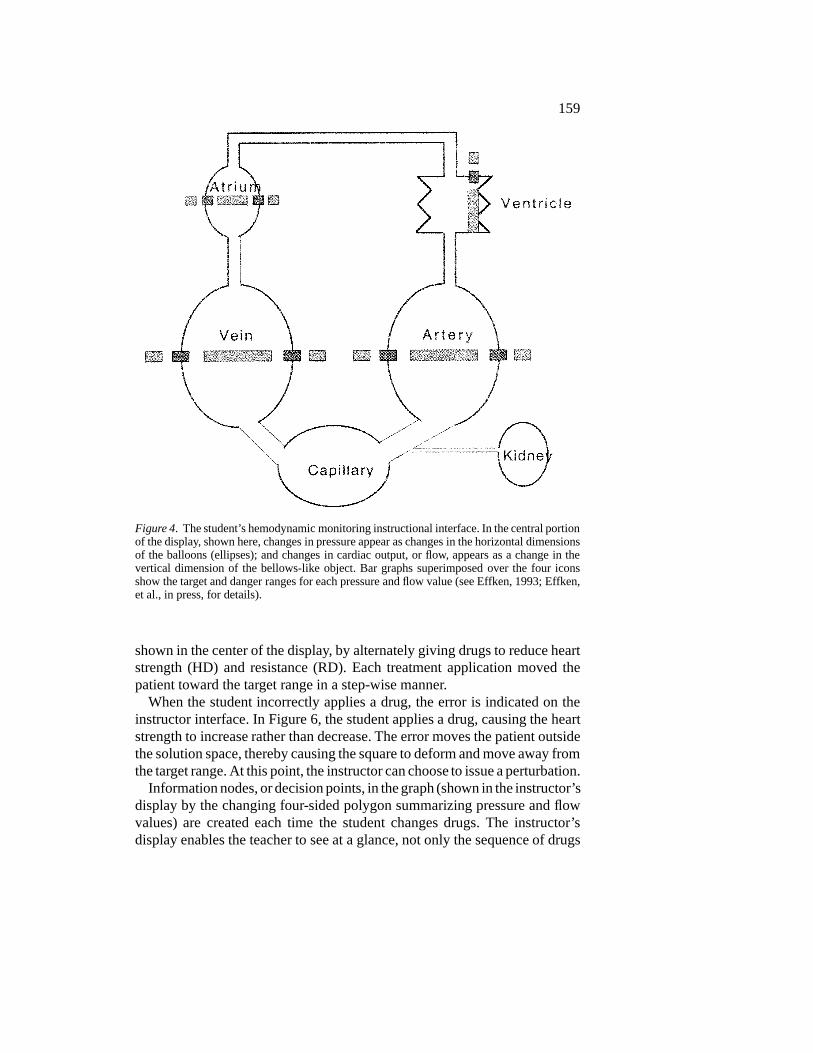
The instructor creates hemodynamic problems by changing the drugcontrol, or etiological, parameters in the underlying Guyton (1980) model(a 19-equation simulation). The drugs the student uses act directly on theseetiological components. The student interface shows the changes in pressureand flow as connected balloons to make the structural relationship of thehemodynamic system visible (see Figure 4). However, the display does notshow the underlying etiological factors, and the relationships between thedrug factors and the observed pressures and flow that the student must learnare both complex and nonlinear. So the problem is not trivial.
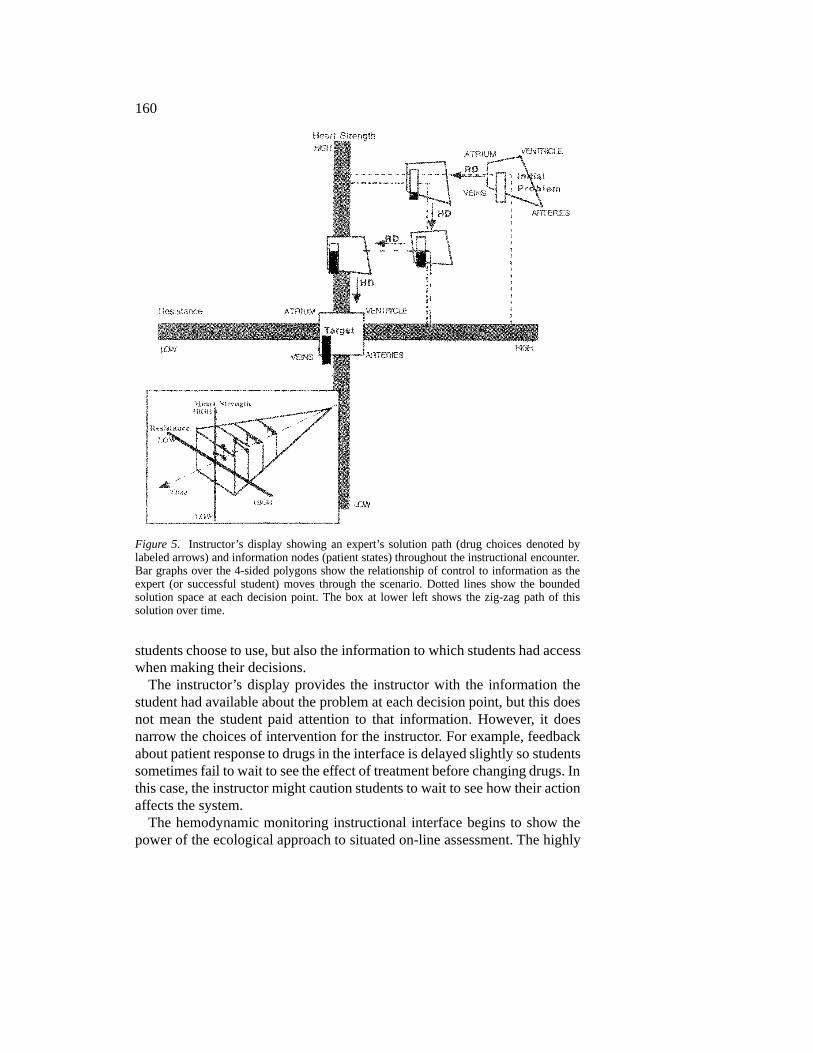
The student’s task is to use the drugs to correct simulated hemodynamicproblems. The optimal solution is to nullify the disease state induced by high,on-board doses of the “drugs,” or etiological factors, by administering an equalamount of the reciprocal drugs. To help the instructor monitor the student’sprogress, we utilize a different interface design (see Figure 5). Cardiac output,and arterial, venous and atrial pressures are shown as the vertices of a 4-sided polygon that can move about through a 2-dimensional space definedby the underlying etiological factors of heart strength (the vertical axis) andresistance (horizontal axis). When all values are in normal range, the 4-sidedpolygon approximates the square positioned over the crossing point of thebars indicating heart strength and resistance. In the example shown here,the instructor created a hemodynamic problem (high cardiac output, higharterial pressure, low venous and atrial pressures represented by the 4-sided“deformed” polygon in the top right quadrant of the display) by assigninghigh values to heart strength and resistance. As a student selected drugs,the solution path emerged. In this case, the student successfully moved thepatient from his initial “disease” state, indicated by the deformed 4-sidedpolygon, to the target “healthy” state, indicated by the square labeled “target”
159
Figure 4. The student’s hemodynamic monitoring instructional interface. In the central portionof the display, shown here, changes in pressure appear as changes in the horizontal dimensionsof the balloons (ellipses); and changes in cardiac output, or flow, appears as a change in thevertical dimension of the bellows-like object. Bar graphs superimposed over the four iconsshow the target and danger ranges for each pressure and flow value (see Effken, 1993; Effken,et al., in press, for details).
shown in the center of the display, by alternately giving drugs to reduce heartstrength (HD) and resistance (RD). Each treatment application moved thepatient toward the target range in a step-wise manner.
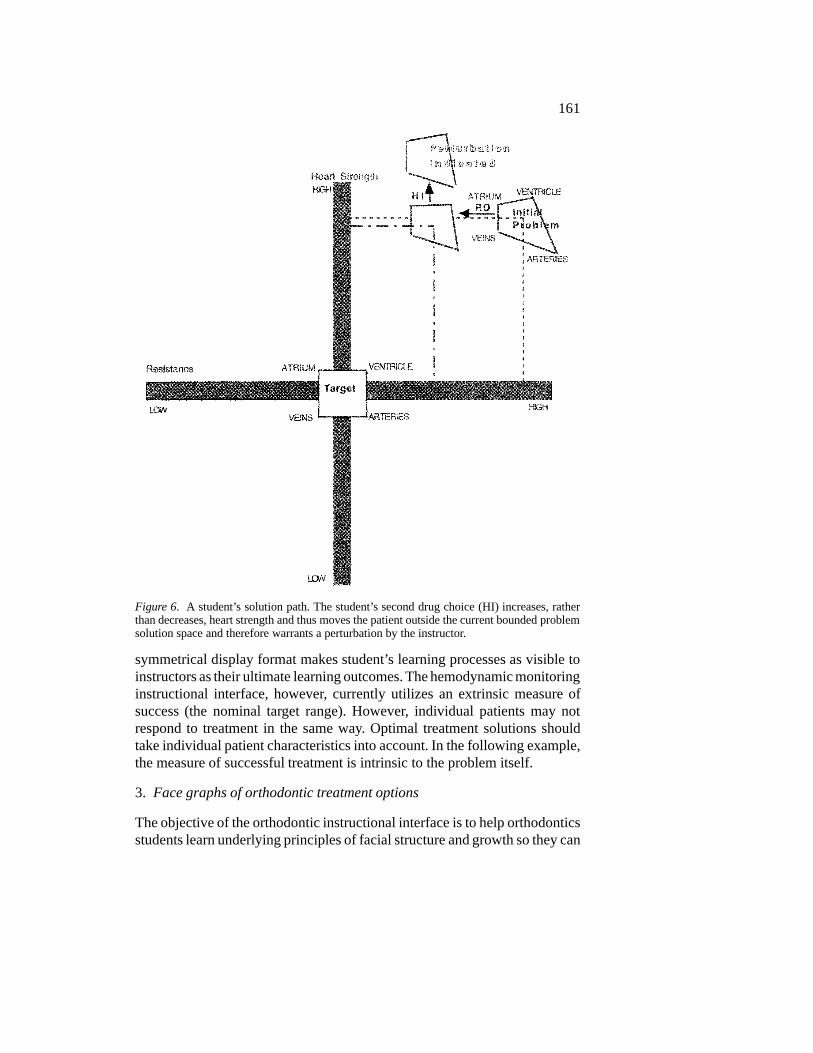
When the student incorrectly applies a drug, the error is indicated on theinstructor interface. In Figure 6, the student applies a drug, causing the heartstrength to increase rather than decrease. The error moves the patient outsidethe solution space, thereby causing the square to deform and move away fromthe target range. At this point, the instructor can choose to issue a perturbation.
Information nodes, or decision points, in the graph (shown in the instructor’sdisplay by the changing four-sided polygon summarizing pressure and flowvalues) are created each time the student changes drugs. The instructor’sdisplay enables the teacher to see at a glance, not only the sequence of drugs
160
Figure 5. Instructor’s display showing an expert’s solution path (drug choices denoted bylabeled arrows) and information nodes (patient states) throughout the instructional encounter.Bar graphs over the 4-sided polygons show the relationship of control to information as theexpert (or successful student) moves through the scenario. Dotted lines show the boundedsolution space at each decision point. The box at lower left shows the zig-zag path of thissolution over time.
students choose to use, but also the information to which students had accesswhen making their decisions.
The instructor’s display provides the instructor with the information thestudent had available about the problem at each decision point, but this doesnot mean the student paid attention to that information. However, it doesnarrow the choices of intervention for the instructor. For example, feedbackabout patient response to drugs in the interface is delayed slightly so studentssometimes fail to wait to see the effect of treatment before changing drugs. Inthis case, the instructor might caution students to wait to see how their actionaffects the system.
The hemodynamic monitoring instructional interface begins to show thepower of the ecological approach to situated on-line assessment. The highly
161
Figure 6. A student’s solution path. The student’s second drug choice (HI) increases, ratherthan decreases, heart strength and thus moves the patient outside the current bounded problemsolution space and therefore warrants a perturbation by the instructor.
symmetrical display format makes student’s learning processes as visible toinstructors as their ultimate learning outcomes. The hemodynamic monitoringinstructional interface, however, currently utilizes an extrinsic measure ofsuccess (the nominal target range). However, individual patients may notrespond to treatment in the same way. Optimal treatment solutions shouldtake individual patient characteristics into account. In the following example,the measure of successful treatment is intrinsic to the problem itself.
3. Face graphs of orthodontic treatment options
The objective of the orthodontic instructional interface is to help orthodonticsstudents learn underlying principles of facial structure and growth so they can

162
better identify the nature of deformities and apply proper corrective forcesto return the patients to optimal growth paths. Learners access profiles ofpatients at various ages (e.g., age 3–21), then apply various transformationsto these profiles and compare the effect of the treatment forces applied (themodified growth path) with the archetypal, or ideal, growth path for thatindividual. Determining which forces to apply requires that the student be ableto detect deformities. Human perceivers are excellent at judging age, gender,and attractiveness of facial profiles as a function of distance from archetype(Carello, Grosofsky, Shaw, Pittenger, and Mark, 1989), where archetype isdefined as the facial structure of an individual at an older age that wouldbe produced as a function of optimal growth applied to that individual at ayounger age (Jenkins, 1983).
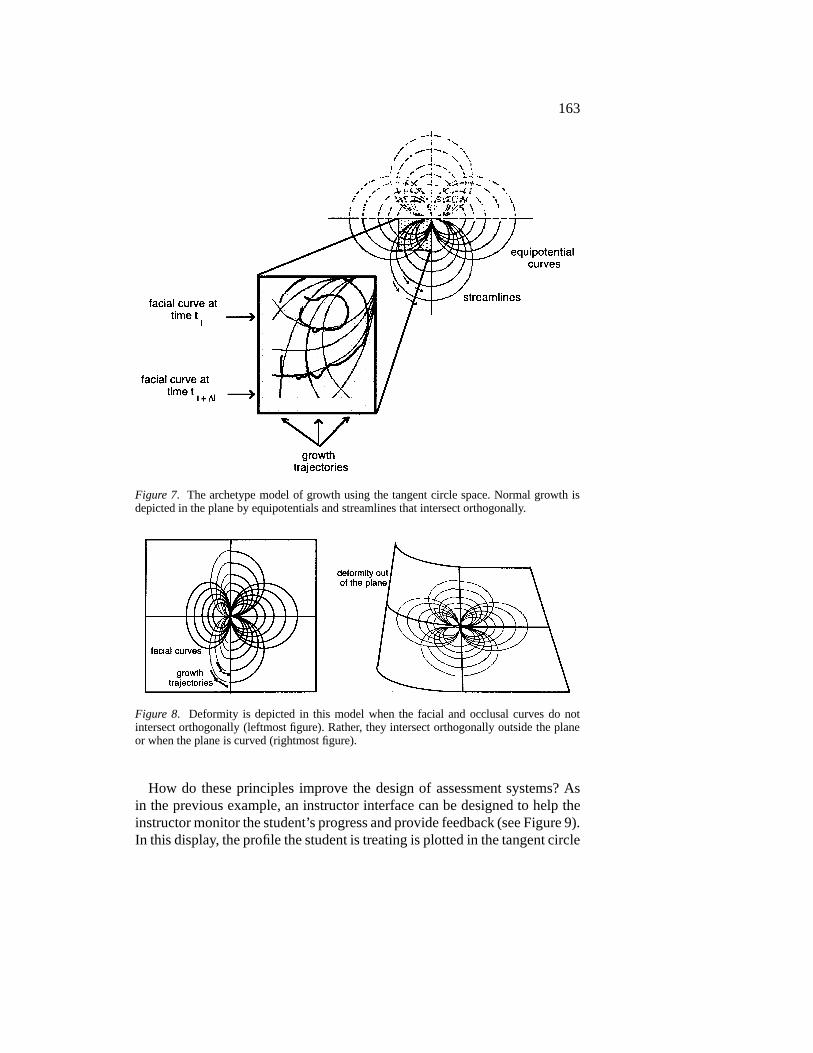
Jenkins, Shaw and colleagues identified a class of transformations thatcharacterize growth of the human face and head (Shaw, Mark, Jenkins, andMingolla, 1982; Shaw, McIntyre, and Mace, 1974; Todd, Mark, Shaw, andPittenger, 1980). Their archetype model captures the stresses that producenormal, growth-related changes common to all individuals, as well as thosestresses that produce abnormal growth peculiar to single individuals. In thismodel (see Figure 7), faces move along the streamlines of the tangent circlespace as they grow such that certain properties and relations remain invariantwhile others change.
The archetypal path underlies the morphological diversity that can occurin a particular individual; deformity is a departure from the archetypal path.The model is unique because it incorporates deformity intrinsically. Duringnormal growth, the facial curve and occlusal curve (the curve from the jawhinge over the medial bite plane) intersect at a right angle. In the tangent circlespace, this means that the equipotential curves and the streamlines intersectorthogonally. When there is deformity, the facial and occlusal curves do notintersect orthogonally. In the tangent circle space, this means the growthpath follows lines that do not intersect orthogonally (see Figure 8a) in theplane. Rather, they intersect orthogonally outside the plane (see Figure 8b).Thus, normal faces follow a geodesic path in a flat tangent circle space, butdeformed faces follow a geodesic path in a curved tangent circle space.
To the extent that these lines do not intersect orthogonally, the face is not onits archetypal path and is functionally suboptimal. The way the lines deviateidentifies deformity potentials and specifies the counterforces needed to getthe face back onto its optimal growth path. In this sense, the model provides atransformational distance measure for how different an observed face is fromits archetype. Note that this model of growth and treatment compares pathsof growth (sequences of facial configurations over time), not just static facialconfigurations.
163
Figure 7. The archetype model of growth using the tangent circle space. Normal growth isdepicted in the plane by equipotentials and streamlines that intersect orthogonally.
Figure 8. Deformity is depicted in this model when the facial and occlusal curves do notintersect orthogonally (leftmost figure). Rather, they intersect orthogonally outside the planeor when the plane is curved (rightmost figure).
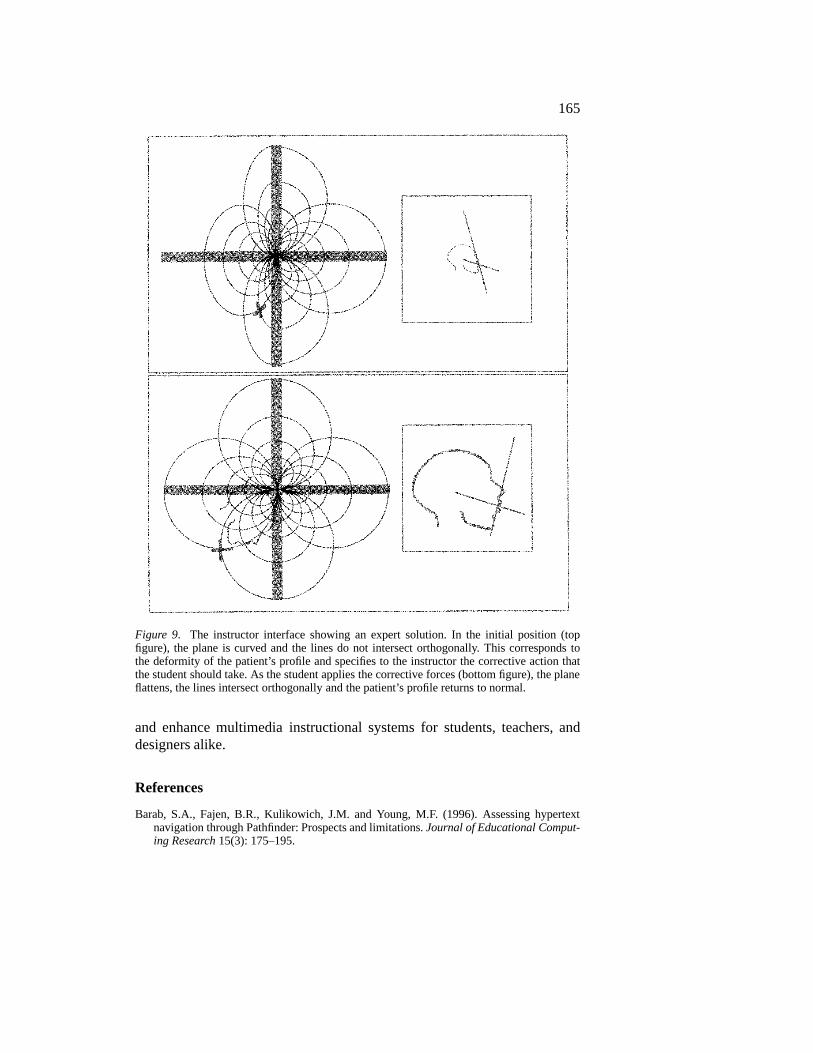
How do these principles improve the design of assessment systems? Asin the previous example, an instructor interface can be designed to help theinstructor monitor the student’s progress and provide feedback (see Figure 9).In this display, the profile the student is treating is plotted in the tangent circle
164
space described above. The display is dynamic; faces grow through the spaceover time. Younger faces are smaller and appear closer to the origin; olderfaces are larger and appear further from the origin. Moreover, to the extent agiven face is deformed, the curves in the tangent circle space intersect non-orthogonally (i.e., the plane in which the tangent circle space lies is curved).In the example depicted in Figure 9, the deformed profile appears in a tangentcircle space whose lines do not intersect orthogonally (see top figure). Whenthe proper counterforces are applied (see bottom figure), the normal profileappears in a tangent circle space whose lines do intersect orthogonally.
Students see an individual face, but the instructor interface showing theface plotted in an abstract space informs the instructor of the sequence offorces students choose to apply and also of the information to which studentshad access when making their decisions, thereby enabling them to provideappropriate timely feedback.
Conclusion
The ideas described in this paper suggest that several components must beconsidered for the successful design of situated assessment. Students’ deci-sions that are recorded by the dribble file are in some sense limited by thequality of the interface. If the interface forces students to do too much work“in their heads”, then very little can be recorded in the dribble file and henceinstructor feedback is minimized. On the other hand, a student interfacecannot force students to externalize all actions, or it risks being intrusiveto the student, possibly hindering learning. The case studies describe aboveillustrate how a deep understanding of the underlying principles particular toa domain can facilitate the design of instructor interfaces that can help realizethe on-line informational linkage between teacher and student. Thus, it seemsnecessary to consider how the student interface, the teacher interface, and theinformation recorded in the dribble files relate for the successful design ofsituated assessment.
We have described a theoretical framework for incorporating situatedassessment capabilities into multimedia instructional environments and haveshown the feasibility of the theoretical approach in three instructional envi-ronments. The ecological framework defines the users of assessment asinstructor, student, and designer, thereby moving it far beyond current on-lineassessment techniques. In addition, situated assessment can encompass, notonly action-based, but more cognitively-based learning activities and can beused to evaluate learning in both synchronous and asynchronous instructionalsystems. In sum, situated assessment can extend the capabilities of teachers
165
Figure 9. The instructor interface showing an expert solution. In the initial position (topfigure), the plane is curved and the lines do not intersect orthogonally. This corresponds tothe deformity of the patient’s profile and specifies to the instructor the corrective action thatthe student should take. As the student applies the corrective forces (bottom figure), the planeflattens, the lines intersect orthogonally and the patient’s profile returns to normal.
and enhance multimedia instructional systems for students, teachers, anddesigners alike.
References
Barab, S.A., Fajen, B.R., Kulikowich, J.M. and Young, M.F. (1996). Assessing hypertextnavigation through Pathfinder: Prospects and limitations. Journal of Educational Comput-ing Research 15(3): 175–195.

166
Carello, C., Grosofsky, A., Shaw, R.E., Pittenger, J.B. and Mark, L.S. (1989). Attractivenessof facial profiles is a function of distance from archetype. Ecological Psychology 1(3):227–251.
Cognition and Technology Group at Vanderbilt (1990). Anchored instruction and its relation-ship to situated cognition. Educational Researcher 19(6): 2–10.
Cognition and Technology Group at Vanderbilt (1992). The Jasper experiment: An explo-ration of issues in learning and instructional design. Education Technology, Research andDevelopment 40(1): 65–80.
Cognition and Technology Group at Vanderbilt (1993). Anchored instruction and situatedcognition revisited. Educational Technology March: 52–70.
Effken, J.A. (1993). Coordination of Hemodynamic Monitoring and Control Performance.Unpub PhD. Thesis, University of Connecticut, Storrs, CT.
Effken, J.A., Kim, N-G. and Shaw, R.E. (in press). Making the constraints visible: Testing theecological approach to interface design. Ergonomics.
Foulds, L.R. (1992). Graph Theory Applications. New York: Springer-Verlag.Guyton, A.C. (1980). Arterial Pressure and Hypertension. Philadelphia: W. B. Saunders.Jenkins, H. (1983). Orthodontics, Its Geodesics, Genetics, and Genesis: The Science of Biologic
Shape and Function. Toronto: Sarie Jenkins.Luenberger, D.G. (1984). Linear and Nonlinear Programming. Reading: Addison-Wesley.Schvaneveldt, R.W. (1990). Pathfinder Associative Networks. Norwood: Ablex Publishing Co.Shaw, Kadar and Kinsella-Shaw (1994). Modeling systems with intentional dynamics: A
lesson from quantum mechanics, in K. Pribram, ed., Origins: Brain and Self Organization.Hillsdale: Erlbaum.
Shaw, R.E., Kadar, E., Sim, M. and Repperger, D.W. (1992). The intentional spring: A strategyfor modeling systems that learn to perform intentional acts. Journal of Motor Behavior24(1): 3–28.
Shaw, R.E. and Kinsella-Shaw, J.M. (1988). Ecological mechanics: A physical geometry forintentional constraints. Human Movement Science 7: 155–200.
Shaw, R.E., Kugler, P.N. and Kinsella-Shaw, J.M. (1990). Reciprocities of intentional systems,in R. Warren and A. Wertheim, eds., Perception and Control of Self-Motion. Hillsdale:Lawrence Erlbaum Associates.
Shaw, R.E., Mark, L.S., Jenkins, D.H. and Mingolla, E. (1982). A dynamic geometry forpredicting growth of gross craniofacial morphology, in A. Dixon and B. Sarnat, eds.,Factors and Mechanisms Influencing Bone Growth. New York: Liss.
Shaw, R., McIntyre, M. and Mace, W. (1974). The role of symmetry theory in event perception,in R. MacLeod and H. Pick, eds., Studies in Perception: Essays in Honor of J. J. Gibson.Ithaca: Cornell University Press.
Todd, J.T., Mark, L.S., Shaw R.E. and Pittenger, J.B. (1980). The perception of human growth.Scientific American 24(2): 132–144.
Young, M.F. (1993). Instructional design for situated learning. Educational TechnologyResearch and Development 41(1): 43–58.
Young, M. and McNeese, M. (1995). A situated cognition approach to problem solving, in J.Flach, P. Hancock, J. Caid and K. Vicente, eds., The Ecology of Human-Machine Systems.Hillsdale: Lawrence Erlbaum, Inc.
Copyright © 2022 FDOKUMEN