An Audit Report on the Higher Education Coordinating ...
28
John Keel, CPA State Auditor An Audit Report on The Higher Education Coordinating Board’s Higher Education Accountability System August 2007 Report No. 07-042
-
Upload
khangminh22 -
Category
Documents
-
view
2 -
download
0
Transcript of An Audit Report on the Higher Education Coordinating ...

John Keel, CPA State Auditor
An Audit Report on
The Higher Education Coordinating Board’s Higher Education Accountability System August 2007 Report No. 07-042

An Audit Report on
The Higher Education Coordinating Board’s Higher Education Accountability System
SAO Report No. 07-042 August 2007
This audit was conducted in accordance with Texas Government Code, Section 321.0132.
For more information regarding this report, please contact Verma Elliott, Audit Manager, or John Keel, State Auditor, at (512) 936-9500.
Overall Conclusion The Higher Education Coordinating Board (Coordinating Board) has controls in place to produce accurate Higher Education Accountability System measures. However improvements can be made to provide more accurate and consistent data for higher education accountability, as well as for legislative and policy decision making.
Auditors tested 9 of the 23 key accountability measures the Coordinating Board reported for 2006. Auditors also tested data related to accountability that 16 higher education institutions submitted to the Coordinating Board (see Appendix 3 for a list of those institutions). Results of this testing indicated that the Coordinating Board:
Over-reported two key accountability measures: (1) Nursing and Allied Health Graduates and (2) Class Size.
Calculated two key accountability measures with incorrect information that was reported by three higher education institutions. These two accountability measures included: (1) Full-time Equivalent (FTE) Student/FTE Faculty Ratio and (2) Percentage of FTE Faculty Who Are Teaching Tenure/Tenure Track.
One key accountability measure selected for testing--the Graduation and Persistence Rate--could not be tested effectively. This measure is computed without generating data that can be audited. Therefore, auditors did not test this measure.
Overview of the Higher Education Accountability System
On January 22, 2004, Governor Rick Perry issued Executive Order RP 31, which required the Coordinating Board and each higher education institution and higher education system to work together to provide “the information necessary to determine the effectiveness and quality of the education students receive at individual institutions,” as well as “…the basis to evaluate the institutions’ use of state resources.” See Chapter 4 for more details about the system.
The Higher Education Accountability System includes 23 key accountability measures and 30 contextual measures.
The Coordinating Board’s Higher Education Accountability System Web site, which contains the measure definitions and results can be accessed at http://www.txhighereddata.org/Interactive/Accountability/.

An Audit Report on The Higher Education Coordinating Board’s Higher Education Accountability System
SAO Report No. 07-042
ii
The remaining four key accountability measures tested were reported accurately. Those accountability measures included:
Headcount Enrollment.
Full-Time Equivalent (FTE) Enrollment.
Number of Degrees Awarded.
Computer Science, Engineering, Math, and Physical Science Graduates at the Undergraduate Level.
Appendix 2 of this report contains the definitions of all 23 key accountability measures. This information also can be found on the Coordinating Board’s Web site at http://www.txhighereddata.org/Interactive/Accountability/.
In addition, while the Coordinating Board has adequate information technology controls over the data used to calculate the measures, it should correct certain security-related weaknesses.
The Higher Education Accountability System provides data for 35 public universities, 9 health-related institutions, the 4 Texas State Technical Colleges, and 3 two-year Lamar State Colleges. Each semester, higher education institutions certify and submit institutional data to the Coordinating Board in the form of Coordinating Board Management (CBM) reports. These reports include data on student enrollment, classes, and faculty. The reports are used to calculate enrollment funding, for strategic planning, for aiding and improving institutional effectiveness, and in computing the accountability measures. The accountability measure categories in the Higher Education Accountability System follow the framework of categories specified in the state higher education plan (Closing the Gaps 2015): participation, success, excellence, and research (see Chapter 4 for more details).
Auditors also evaluated the Coordinating Board’s and institutions’ use of the Higher Education Accountability System and determined that use of the system was limited (see Chapter 3 for more details).
Summary of Management’s Response
The Coordinating Board’s responses indicate that it will address the findings in this report.
Summary of Information Technology Review
Overall, the Coordinating Board has adequate controls in place to ensure data accuracy, completeness, and reliability, but it should correct certain security-related weaknesses. Auditors provided the Coordinating Board with detailed

An Audit Report on The Higher Education Coordinating Board’s Higher Education Accountability System
SAO Report No. 07-042
iii
information describing the vulnerabilities and recommendations for correcting them.
Auditors also noted control weaknesses in information technology at some of the 16 higher education institutions visited. These issues included weaknesses in user access, data maintenance, segregation of duties, and business continuity. Auditors provided management of the higher education institutions with details on these issues and associated recommendations.
Summary of Objectives, Scope, and Methodology
The objectives of this audit were to:
Determine whether controls are in place at higher education institutions and at the Coordinating Board to produce accurate, complete, consistent, and timely data used for higher education accountability and for legislative and policy decision-making.
Determine how the Coordinating Board uses the accountability system in developing the long-range, statewide higher education goals.
Determine whether data prepared for the Coordinating Board meets institutional internal management needs and statewide assessment needs.
The audit scope covered accountability measures the Coordinating Board included in its Higher Education Accountability System report dated December 2006. The data used in that report was based on the higher education institutions’ reports for the Spring, Summer, and Fall 2006 semesters, with the exception of the Graduation Report, which covered the Fall 2005 semester and the Spring and Summer 2006 semesters. Auditors also based testing on these semesters.
The audit methodology consisted of selecting measures to audit, recalculating results for accuracy and adherence to the measure definitions, testing data at the institution level, and identifying and assessing controls of the systems that provided information for the measures at both the Coordinating Board and at the higher education institutions visited.

Contents
Detailed Results
Chapter 1 Not All Higher Education Accountability System Measures are Accurate................................................ 1
Chapter 2 The Coordinating Board and Higher Education Institutions Can Improve Controls over Accountability Data and Information Technology .................................. 8
Chapter 3 The Coordinating Board and Higher Education Institutions Use the Higher Education Accountability System for Limited Purposes........................................10
Chapter 4 Information on the Higher Education Accountability System..................................................................11
Appendices
Appendix 1 Objectives, Scope, and Methodology..............................14
Appendix 2 Definitions and Results for the 23 Higher Education Accountability System Key Measures ..............................17
Appendix 3 List of Higher Education Institution Auditors Visited ...........21

An Audit Report on the Higher Education Coordinating Board’s Higher Education Accountability System SAO Report No. 07-042
August 2007 Page 1
Detailed Results
Chapter 1
Not All Higher Education Accountability System Measures are Accurate
Auditors tested the calculation methodology for 9 of the 23 key Higher Education Accountability System measures that the Higher Education Coordinating Board (Coordinating Board) computed and published for 2006. Not all of the measures tested were accurate. Additionally, auditors tested data used to calculate these measures at 16 higher education institutions. To summarize testing results, the Coordinating Board:
Over-reported the results for the Nursing and Allied Health Graduates accountability measure because of definition inconsistencies, and over-reported the results of the Class Size accountability measure because of an error in the automated program used to calculate the measure.
Computed the results for two faculty accountability measures—Full-time Equivalent (FTE) Student/FTE Faculty Ratio and Percentage of FTE Faculty Who Are Teaching Tenure/Tenure Track—with incorrect information that was provided by three higher education institutions.
Calculates the Graduation and Persistence Rate accountability measure without generating data that can be audited; therefore, auditors did not test that measure.
Reported the remaining four accountability measures tested accurately.
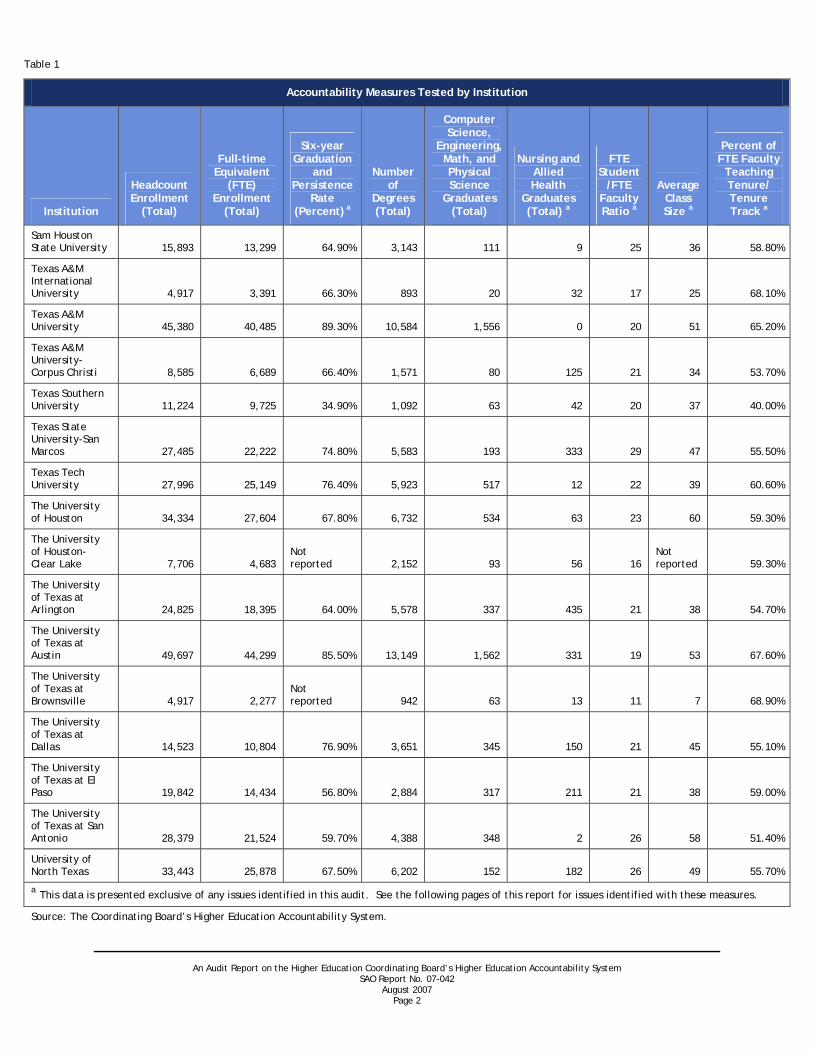
Table 1 on the next page summarizes the accountability measures that auditors tested for 16 institutions.
An Audit Report on the Higher Education Coordinating Board’s Higher Education Accountability System SAO Report No. 07-042
August 2007 Page 2
Table 1
Accountability Measures Tested by Institution
Institution
Headcount Enrollment
(Total)
Full-time Equivalent
(FTE) Enrollment
(Total)
Six-year Graduation
and Persistence
Rate (Percent) a
Number of
Degrees (Total)
Computer Science,
Engineering, Math, and Physical Science
Graduates (Total)
Nursing and Allied Health
Graduates (Total) a
FTE Student
/FTE Faculty Ratio a
Average Class Size a
Percent of FTE Faculty
Teaching Tenure/ Tenure Track a
Sam Houston State University 15,893 13,299 64.90% 3,143 111 9 25 36 58.80%
Texas A&M International University 4,917 3,391 66.30% 893 20 32 17 25 68.10%
Texas A&M University 45,380 40,485 89.30% 10,584 1,556 0 20 51 65.20%
Texas A&M University-Corpus Christi 8,585 6,689 66.40% 1,571 80 125 21 34 53.70%
Texas Southern University 11,224 9,725 34.90% 1,092 63 42 20 37 40.00%
Texas State University-San Marcos 27,485 22,222 74.80% 5,583 193 333 29 47 55.50%
Texas Tech University 27,996 25,149 76.40% 5,923 517 12 22 39 60.60%
The University of Houston 34,334 27,604 67.80% 6,732 534 63 23 60 59.30%
The University of Houston-Clear Lake 7,706 4,683
Not reported 2,152 93 56 16
Not reported 59.30%
The University of Texas at Arlington 24,825 18,395 64.00% 5,578 337 435 21 38 54.70%
The University of Texas at Austin 49,697 44,299 85.50% 13,149 1,562 331 19 53 67.60%
The University of Texas at Brownsville 4,917 2,277
Not reported 942 63 13 11 7 68.90%
The University of Texas at Dallas 14,523 10,804 76.90% 3,651 345 150 21 45 55.10%
The University of Texas at El Paso 19,842 14,434 56.80% 2,884 317 211 21 38 59.00%
The University of Texas at San Antonio 28,379 21,524 59.70% 4,388 348 2 26 58 51.40%
University of North Texas 33,443 25,878 67.50% 6,202 152 182 26 49 55.70%
a This data is presented exclusive of any issues identified in this audit. See the following pages of this report for issues identified with these measures.
Source: The Coordinating Board’s Higher Education Accountability System.

An Audit Report on the Higher Education Coordinating Board’s Higher Education Accountability System SAO Report No. 07-042
August 2007 Page 3
Measure Definition: Number of Nursing and Allied Health
Graduates “Number of degrees awarded in nursing and allied health. Same CIPs as in Closing the Gaps (51.02, 51.06, 51.07 (at the BS or lower levels only; graduate level is not allied health). 51.08, 51.09, 51.10, 51.16, 51.18, 51.23, 51.26, 51.27, 51.31, 51.32, 51.33, 51.34, 51.99) by level. Closing the Gaps only includes students who graduate with a certificate, associate’s or bachelor’s degree. This measure includes all levels of a degree.”
Source: The Coordinating Board’s Texas Higher Education Accountability System, Volume I, December 2006.
Measure Definition: Class Size
“The average class size of organized classes (class type 1, 2 and 4) at the freshman and sophomore level. Composite classes are combined.”
Source: The Coordinating Board’s Texas Higher Education Accountability System, Volume I, December 2006.
The following information provides details on the results of the measures audited.
Number of Nursing and Allied Health Graduates
The Coordinating Board over-reported the number of Nursing and Allied Health Graduates as defined in the measure for seven higher education institutions (see text box for the measure definition). The Coordinating Board reported 2,100 nursing and allied health graduates for these seven institutions in fiscal year 2006; however, auditors calculated 1,900 graduates.
This occurred because the Coordinating Board included graduate-level allied health degrees in its calculation of the measure, when those degrees were specifically excluded in the measure definition. This error affected seven of the institutions tested. The remaining 13 were not affected because the institutions either did not offer this degree plan or did not have any students who graduated with these degrees during fiscal year 2006.
After audit testing was completed, auditors noted the Coordinating Board had updated the definition of this measure on its Web site to include the previously excluded degrees.
Class Size
The Coordinating Board over-reported Class Size for the Fall 2006 semester for 6 of the 16 higher education institutions tested (see text box for the measure definition). The error rates for the six institutions ranged from 2 percent to 22 percent.
This occurred because the automated application that the Coordinating Board used to compute this measure included a programming error. This error allowed students to be counted multiple times if they were enrolled in a “duplicate class.” A duplicate class is a single class that is taught by more than one
faculty member. The institutions affected by this programming error had multiple duplicate classes.

An Audit Report on the Higher Education Coordinating Board’s Higher Education Accountability System SAO Report No. 07-042
August 2007 Page 4
Measure Definition: FTE Student/FTE Faculty Ratio
“CBM008 for FTE faculty (FTFE) – FTE faculty are instructional faculty reported on the CBM008 with rank codes 1-5 and appointment codes 01 and 02. Faculty members without a salary are included. For this measure, undergraduate full-time student equivalents (FTSE’s) are calculated on 15 semester credit hours; master’s pharmacy, law, and other special profession FTSE’s are calculated on 12 semester credit hours; optometry is calculated on 17 semester credit hours; and doctoral FTSE’s are calculated on 9 semester credit hours. Teaching assistants are not included to match the LBB measure.”
Measure Definition: Percentage of FTE Faculty Who Are
Teaching Tenure/Tenure Track “Percentage of all FTE faculty with teaching responsibility (appointment codes 01 and 02 and are reported during the fall semester as the teacher of record on the CBM004) who are tenure or tenure-track. Teacher Assistant’s (TA’s) are included in the denominator. ”
Source: The Coordinating Board’s Texas Higher Education Accountability System, Volume I, December 2006.
Measure Definition: Graduation and Persistence Rate
“Percentage of first-time full-time entering degree-seeking students who enrolled in a minimum of 12 SCH their first fall semester and have graduated from the same or another Texas public university or are still enrolled at the same institution or another Texas public institution after six academic years.”
Source: The Coordinating Board’s Texas Higher Education Accountability System, Volume I, December 2006.
Faculty Measures: Full-time Equivalent (FTE) Student/FTE Faculty Ratio and Percentage of FTE Faculty Who Are Teaching Tenure/Tenure Track
Three of the 16 institutions auditors visited reported incorrect data to the Coordinating Board for these two faculty measures (see text box for the measure definition). The errors were made in faculty data such as appointment codes, rank, and tenure (FTE faculty are instructional faculty with specific rank, tenure status, and appointment codes). Appointment codes reflect how much of a faculty member’s time is spent performing direct instructional activities and how much is spent on administrative assignments that supplement the teaching function.
Inaccurate reporting of faculty information results in the Coordinating Board using erroneous data to calculate these two measures and, therefore, publishing inaccurate measure results.
Graduation and Persistence Rate
Auditors could not effectively test the accuracy of this measure (see text box for the measure definition). The method the Coordinating Board used to calculate this measure produces only a count, and it does not create data that can be audited. Specifically, the students who are counted for this measure are not captured in a way that identifies them individually, and only the total count is retained. In order to count all graduates during the school year, this measure is reported one year behind the other measures.
Additionally, auditors noted differences between this measure’s results reported on the Coordinating Board’s Web
site and the results in the hard copy report of accountability measures that the Coordinating Board published in December 2006.

An Audit Report on the Higher Education Coordinating Board’s Higher Education Accountability System SAO Report No. 07-042
August 2007 Page 5
Measure Definition: Headcount Enrollment
“Unduplicated fall headcount enrollment disaggregated by ethnicity, gender, and age. The student’s age is as of September 1 of the year. Post-baccalaureate students are in a separate category. Flex entry students (including Katrina students) are not included.”
Measure Definition: Full-Time Equivalent (FTE) Enrollment
“All fall semester credit hours (SCH) including non-state-funded by level: undergraduate/15, post-baccalaureate, master’s, and other special professional/12, optometry/17 and doctoral/9. The student’s age is as of September 1 of the year. This will not match the usual FTE count from the CBM004 but had to come off the CBM001 in order to do the disaggregate numbers. Flex entry students are not included.”
Measure Definition: Number of Degrees Awarded
“Number of degrees awarded by level, race/ethnicity, and gender. Certificates are not included.”
Measure Definition: Computer Science, Engineering, Math, and Physical Science Graduates at the
Undergraduate Level “Number of degrees awarded in specific fields by level. Include students in the same CIP codes as Closing the Gaps (CIP 11, 14, 15, 27, 40 and 30.01). Closing the Gaps only includes students who graduate with a certificate or an associate’s or bachelor’s degree. This measure includes all levels of a degree.”
Source: The Coordinating Board’s Texas Higher Education Accountability System, Volume I, December 2006.
Four Accountability Measures Were Reported Accurately
Auditors tested the calculation methodology of the following accountability measures at the Coordinating Board for 20 higher education institutions (and corresponding data at 16 of those 20 institutions) and determined the measures were reported accurately:
Headcount Enrollment.
Full-Time Equivalent (FTE) Enrollment.
Number of Degrees Awarded.
Computer Science, Engineering, Math, and Physical Science Graduates at the Undergraduate Level.
Certain Issues Affect All Accountability Measures
Institutions that wish to ensure the validity of the results of accountability measures are unable to do so because they do not have access to the exact formulas and figures the Coordinating Board uses to calculate the measures. They must, therefore, rely solely on what the Coordinating Board reports for the measures.
Furthermore, institutions are allowed to recertify (and, therefore, revise) the data they have previously submitted to the Coordinating Board. However, if recertification occurs after the Coordinating Board has calculated the accountability measures and reported the results on its Web site, the Coordinating Board (1) does not update the accountability measures calculated using the data and (2) does not retain the data to support the original calculation. Without the original data used in the calculations, it is not possible to verify the Coordinating Board’s calculations of accountability measures.
Recommendations
The Coordinating Board should:
Ensure that its calculation of accountability measures is consistent with the published measure definitions.
Establish a process for conducting systematic quality control checks on higher education accountability data that is reported by the higher education institutions.

An Audit Report on the Higher Education Coordinating Board’s Higher Education Accountability System SAO Report No. 07-042
August 2007 Page 6
Ensure that all of its reports of accountability measure results are consistent or consider using only one method of reporting measure results.
Publish the exact formulas used in calculating accountability measure results on its Web site.
Update the measures affected by recertified data or maintain the data to support the measure results it reports.
Management’s Response
The Coordinating Board staff appreciates the cooperation of the Auditors during this review. The external review has assisted in the improvement of a recently completed project. This system was implemented as a result of legislative action and was put together in a relatively short period to meet the requirement. The recommendations made by the audit team will be addressed and the staff will keep the auditors informed of progress until final completion. The specific responses to recommendations made are addressed below:
Number of Nursing and Allied Health Graduates
As was stated in the report, the definition for this measure has been restated to match the Nursing and Allied Health fields that were included in the Closing the Gaps success measures in 2000. The data will be reproduced as soon as possible and all succeeding years will be corrected. The posting will be completed by September 30, 2007.
Class Size
The class size measure data will be recalculated using the new formula agreed to by the Assistant Commissioner and the Auditor. Once this data is recalculated the information will be updated on the accountability system. The posting will be completed by September 30, 2007.
Faculty Measures
The Coordinating Board will be conducting a series of meetings with each group of institutions included in the Accountability System in August. The staff will stress the importance of accuracy and will report findings to the groups at the meetings. This action will be complete by August 31, 2007.
Graduation and Persistence Rate
There will always be updates made to the data and, in some cases, the formula will be changed in a measure. As a result of this, the printed copies always contain language that encourages the user to use the online version of the data. The Coordinating Board staff will develop an email list to send notices

An Audit Report on the Higher Education Coordinating Board’s Higher Education Accountability System SAO Report No. 07-042
August 2007 Page 7
of updates whenever the online version is changed. The email list will be ready by August 31, 2007 and the notification will be done at the next revision.
Recertification and Formulas
When institutions ask to recertify data that is included in the accountability system the Assistant Commissioner has to make the decision on the impact that the changed data will have on the measures. There will be some changes that are minor and the cost of doing the recalculations and posting is not justified. This decision will be made on a case-by-case basis with input from the institutions.
At the scheduled meetings, the institutions will be reminded that if they have any questions about the calculated measures, they should contact the staff of the Coordinating Board. The formula and program used to calculate the measures are very complex. Publishing the program alone may not be of assistance to the institutions. However, the staff is ready to assist the institution with their questions or requests. To facilitate the request, staff will consider adding a link on the web page of the Accountability System to allow institutions to send questions and information requests to the Coordinating Board Staff. The link will be added to the web page by September 30, 2007.

An Audit Report on the Higher Education Coordinating Board’s Higher Education Accountability System SAO Report No. 07-042
August 2007 Page 8
Chapter 2
The Coordinating Board and Higher Education Institutions Can Improve Controls over Accountability Data and Information Technology
Although the 16 higher education institutions auditors visited had controls over accountability data, auditors identified weaknesses that affected the reliability of certain higher education accountability measures. (See Appendix 3 for a list of the 16 higher education institutions auditors visited.) In addition, improvements should be made regarding the security of the information.
Issues Regarding Institutions’ Student Reports
A few institutions have the ability to backdate students’ class registration and tuition payment dates in the student information systems they use to create the Student Reports that they submit to the Coordinating Board (the Student Reports are also known as the CBM001 reports). This enables an institution to potentially report an ineligible student on the Student Report. Five of the 23 key accountability measures use data from the Student Reports.
Issues Regarding Information Technology
Overall, the Coordinating Board has adequate controls in place to ensure data accuracy, completeness, and reliability, but it should correct certain security-related weaknesses. These weaknesses included issues related to data maintenance and password security. Auditors have provided the Coordinating Board with detailed information describing the vulnerabilities and recommendations for correcting them.
Auditors also noted control weaknesses in information technology at some of the 16 higher education institutions visited. These issues included weaknesses in the following areas:
User access weaknesses such as not sufficiently restricting access to CBM reports containing confidential student data, inability to provide user access lists for student information systems, and lack of procedures to grant access to student information systems.
Data maintenance weaknesses such as storing prior confidential data on shared network drives.
Segregation of duties weaknesses related to maintenance, production, ownership, entry, and review of data.
Business continuity weaknesses such as no off-site storage of backup tapes for student information systems.

An Audit Report on the Higher Education Coordinating Board’s Higher Education Accountability System SAO Report No. 07-042
August 2007 Page 9
Auditors provided the institutions with the details of these issues and associated recommendations.

An Audit Report on the Higher Education Coordinating Board’s Higher Education Accountability System SAO Report No. 07-042
August 2007 Page 10
Chapter 3
The Coordinating Board and Higher Education Institutions Use the Higher Education Accountability System for Limited Purposes
The Coordinating Board currently uses the Higher Education Accountability System to provide reference information to the Legislature and as one of several factors it uses in evaluating institutions’ tuition revenue bond requests.
Auditors surveyed 34 higher education institutions. Of the 28 that responded, the majority use the accountability measures for internal management and for strategic planning. However, in interviews auditors conducted at the institutions visited, some institutions expressed that the Higher Education Accountability System provides the same or similar information as the performance measures they report to the Legislative Budget Board and the data they report to the U.S. Department of Education’s Integrated Postsecondary Education Data System (IPEDS). In addition, some institutions felt that some of the Higher Education Accountability System measure results were very difficult or impossible to replicate, and some felt that it would be helpful if the definitions were more clear and specific. Additionally, some institutions remarked that the accountability measures do not consider institutions’ missions, goals, or resources. For example, some commented that the calculation of the graduation rate measure may favor more traditional institutions.
Changes have been made to some accountability measures to align them with the measures that higher education institutions report to the Legislative Budget Board. However, the measures in the Higher Education Accountability System and the measures that institutions report to the Legislative Budget Board are not fully aligned. According to the Coordinating Board, individual measures on which a consensus has been reached have been adjusted, and the resulting changes have been implemented.

An Audit Report on the Higher Education Coordinating Board’s Higher Education Accountability System SAO Report No. 07-042
August 2007 Page 11
Chapter 4
Information on the Higher Education Accountability System
In January 2004, Governor Rick Perry issued Executive Order RP 31 requiring the Coordinating Board and higher education institutions to work together to determine the effectiveness and quality of the education students receive.
The current Higher Education Accountability System was adopted by the Coordinating Board in October 2004, and the first accountability report was completed in December 2004. The development of the Higher Education Accountability System was a cooperative effort between the Coordinating Board, higher education institution systems, and higher education institutions.
The Higher Education Accountability System provides data for 35 public universities, 9 health-related institutions, the 4 Texas State Technical Colleges, and 3 two-year Lamar State Colleges. The State’s two-year colleges were added to the Higher Education Accountability System in early 2005. The categories of accountability measures and a brief description of each category are as follows:
Participation. Evaluate institutions on the number of students who are prepared, recruited, and retained in higher education, while providing information on the costs of attending an institution.
Success. Provide information regarding the number of degrees and certificates awarded at all institutions, the graduation and retention rates, and targeted degree programs in areas of statewide demand.
Excellence. Describe faculty-to-student ratios, graduate employment rates, class sizes, and certification rates on national exams.
Research. Provide information on the level of research that is carried out by the institutions and the amount of research dollars that are brought into the institutions.
According to the Coordinating Board, institutions have been grouped according to general academic missions and key academic indicators such as size and number of graduate programs, research expenditures, and other factors. The institutions participated in selecting both in-state and out-of-state peers. This allows for comparisons among institutions as noted below.
Research institutions make a minimum of $150 million in research expenditures annually and grant 100 or more doctoral degrees each year in a minimum of 15 disciplines. In-state peers include The University of Texas at Austin and Texas A&M University. Out-of-state peers include Ohio State University and the University of California, Berkeley.

An Audit Report on the Higher Education Coordinating Board’s Higher Education Accountability System SAO Report No. 07-042
August 2007 Page 12
Emerging research institutions award 20 doctoral degrees annually, offer a minimum of 10 doctoral programs, and/or enroll at least 150 doctoral students. In-state peers include Texas Tech University and the University of Houston. Out-of-state peers include the University of New Mexico and the University of Wisconsin-Milwaukee.
Doctoral institutions award a minimum of 10 doctoral degrees annually, have a minimum of 5 doctoral programs, and/or enroll 150 doctoral students. In-state peers include Sam Houston State University and Texas State University - San Marcos. Out-of-state peers include East Tennessee State University and the University of North Carolina at Greensboro.
Comprehensive institutions offer a wide range of baccalaureate programs and are committed to graduate education through master’s degrees. They may offer as many as five doctoral programs. In-state peers include Lamar University – Beaumont and Prairie View A&M University. Out-of-state peers include Arkansas State University and Central Missouri State University.
Master’s institutions offer a wide range of baccalaureate programs, and undergraduate education is the primary mission of these institutions. In-state peers include Angelo State University, Midwestern State University, and Sul Ross State University. Out-of-state peers include Florida Gulf Coast University and the University of Colorado at Colorado Springs.
Alignment with Legislative Budget Board (LBB) Performance Measures
Currently, data on the performance of Texas higher education institutions is collected and reported by both the LBB and the Coordinating Board. The LBB’s measures are calculated by each individual institution and are focused on the performance of each individual institution. The measures in the Coordinating Board’s Higher Education Accountability System are calculated by the Coordinating Board and are intended to convey information about the performance of the entire higher education establishment and its sectors (types of institutions), as well as about individual institutions.
Differences between definitions and calculation methodologies used by the LBB and Coordinating Board have resulted in the publication of different data for measures that appear to be identical. The Legislature sought to eliminate this confusion and align the two systems through Rider 54, page III-258, the General Appropriations Act (79th Legislature):
The Legislative Budget Board and the Texas Higher Education Coordinating Board shall use the appropriations in this Act to work with all institutions of higher education to align the performance measures for all institutions of higher education with the measures included in the statewide accountability system as developed by the Texas Higher

An Audit Report on the Higher Education Coordinating Board’s Higher Education Accountability System SAO Report No. 07-042
August 2007 Page 13
Education Coordinating Board. The Texas Higher Education Coordinating Board shall file a report providing recommendations to align the two sets of measures with the Legislature Budget Board by December 31, 2005.
The Report on the Alignment of Legislative Budget Board Performance Measures and Texas Higher Education Coordinating Board Accountability Measures is available on the Coordinating Board’s Web site at http://www.thecb.state.tx.us/reports/PDF/1304.PDF.

An Audit Report on the Higher Education Coordinating Board’s Higher Education Accountability System SAO Report No. 07-042
August 2007 Page 14
Appendices
Appendix 1
Objectives, Scope, and Methodology
Objectives
The objectives of this audit were to:
Determine whether controls are in place at higher education institutions and at the Higher Education Coordinating Board (Coordinating Board) to produce accurate, complete, consistent, and timely data used for higher education accountability and for legislative and policy decision-making.
Determine how the Coordinating Board uses the accountability system in developing the long-range, statewide higher education goals.
Determine whether data prepared for the Coordinating Board meets institutional internal management needs and statewide assessment needs.
Scope
The scope of this audit covered accountability measures the Coordinating Board included in its Higher Education Accountability System report dated December 2006. The data used in that report was based on the higher education institutions’ reports for the Spring, Summer, and Fall 2006 semesters, with the exception of the Graduation Report, which covered the Fall 2005 semester and the Spring and Summer 2006 semesters. Auditors also based testing on these semesters.
Methodology
Information collected and reviewed and procedures and tests conducted included the following:
Selected measures to be audited based on risk factors identified by the State Auditor’s Office.
Tested formula calculations for accuracy and to ensure that they were consistent with the methodologies outlined in the Coordinating Board’s measure definitions. Using the definitions in the reporting manual, auditors recalculated 9 key measures for 20 higher education institutions and compared the results with the figures reported by the Coordinating Board. The acceptable error rate was 1 percent or less.
Visited 16 higher education institutions to:

An Audit Report on the Higher Education Coordinating Board’s Higher Education Accountability System SAO Report No. 07-042
August 2007 Page 15
Test the accuracy of the information the institutions provided to the Coordinating Board. Testing was designed to include all necessary information outlined in the measure definitions.
Identify and assess the controls over the systems that provided information for the measures. These systems included the institutions’ student information systems and the reporting systems.
Criteria used included the following:
Higher Education Accountability System measures and definitions.
The Reporting and Procedures Manual for Texas Public Universities, Fall 2005.
The Coordinating Board’s Texas Higher Education Accountability System, Volume 1, December 2006.
Title 1, Texas Administrative Code, Chapter 202.
Higher education institutions’ policies and procedures.
Executive Order RP 31, Higher Education Accountability System.
Project Information
Audit fieldwork was conducted from February 2007 through June 2007. This audit was conducted in accordance with generally accepted government auditing standards.
The following members of the State Auditor’s staff performed the audit:
Jules Hunter, CPA, CIA (Project Manager)
Karen Smith, CGAP (Assistant Project Manager)
Rob Bollinger, CPA, CFE
Michael Clayton, CPA, CFE
Michelle DeFrance, MA
Nicole Elizondo, CFE
Lauren Godfrey
Arby Gonzales
Anne Hoel
Terry Nickel, CIA, CGAP, CFE
An Audit Report on the Higher Education Coordinating Board’s Higher Education Accountability System SAO Report No. 07-042
August 2007 Page 16
Anca Pinchas, CPA
Ashley Rutherford
Shelby Cherian, MBA (Information Systems Audit Team)
Cyndie Holmes, CISA (Information Systems Audit Team)
Joe Kozak, CPA, CISA (Information Systems Audit Team)
Worth Ferguson, CPA (Quality Control Reviewer)
Verma Elliott, MBA, CIA, CGAP (Audit Manager)
An Audit Report on the Higher Education Coordinating Board’s Higher Education Accountability System SAO Report No. 07-042
August 2007 Page 17
Appendix 2
Definitions and Results for the 23 Higher Education Accountability System Key Measures
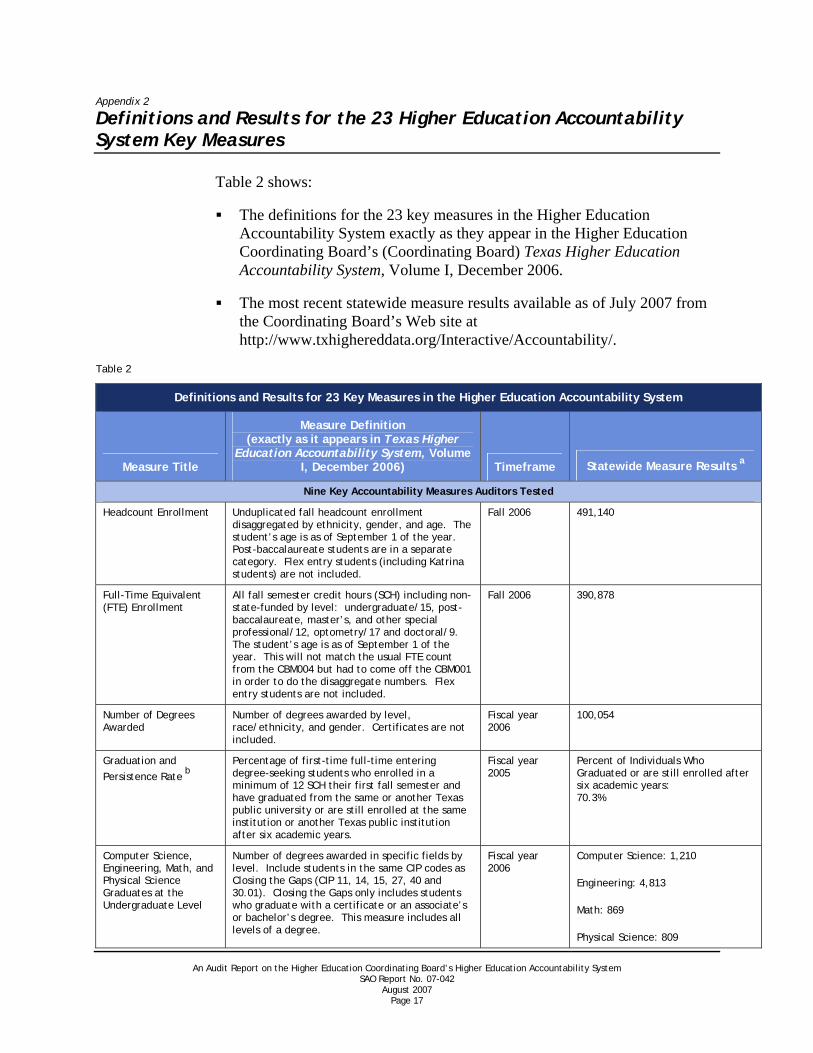
Table 2 shows:
The definitions for the 23 key measures in the Higher Education Accountability System exactly as they appear in the Higher Education Coordinating Board’s (Coordinating Board) Texas Higher Education Accountability System, Volume I, December 2006.
The most recent statewide measure results available as of July 2007 from the Coordinating Board’s Web site at http://www.txhighereddata.org/Interactive/Accountability/.
Table 2
Definitions and Results for 23 Key Measures in the Higher Education Accountability System
Measure Title
Measure Definition (exactly as it appears in Texas Higher
Education Accountability System, Volume I, December 2006) Timeframe Statewide Measure Results a
Nine Key Accountability Measures Auditors Tested
Headcount Enrollment Unduplicated fall headcount enrollment disaggregated by ethnicity, gender, and age. The student’s age is as of September 1 of the year. Post-baccalaureate students are in a separate category. Flex entry students (including Katrina students) are not included.
Fall 2006 491,140
Full-Time Equivalent (FTE) Enrollment
All fall semester credit hours (SCH) including non-state-funded by level: undergraduate/15, post-baccalaureate, master’s, and other special professional/12, optometry/17 and doctoral/9. The student’s age is as of September 1 of the year. This will not match the usual FTE count from the CBM004 but had to come off the CBM001 in order to do the disaggregate numbers. Flex entry students are not included.
Fall 2006 390,878
Number of Degrees Awarded
Number of degrees awarded by level, race/ethnicity, and gender. Certificates are not included.
Fiscal year 2006
100,054
Graduation and Persistence Rate b
Percentage of first-time full-time entering degree-seeking students who enrolled in a minimum of 12 SCH their first fall semester and have graduated from the same or another Texas public university or are still enrolled at the same institution or another Texas public institution after six academic years.
Fiscal year 2005
Percent of Individuals Who Graduated or are still enrolled after six academic years: 70.3%
Computer Science, Engineering, Math, and Physical Science Graduates at the Undergraduate Level
Number of degrees awarded in specific fields by level. Include students in the same CIP codes as Closing the Gaps (CIP 11, 14, 15, 27, 40 and 30.01). Closing the Gaps only includes students who graduate with a certificate or an associate’s or bachelor’s degree. This measure includes all levels of a degree.
Fiscal year 2006
Computer Science: 1,210 Engineering: 4,813 Math: 869 Physical Science: 809

An Audit Report on the Higher Education Coordinating Board’s Higher Education Accountability System SAO Report No. 07-042
August 2007 Page 18
Definitions and Results for 23 Key Measures in the Higher Education Accountability System
Measure Title
Measure Definition (exactly as it appears in Texas Higher
Education Accountability System, Volume I, December 2006) Timeframe Statewide Measure Results a
Nursing and Allied Health Graduates b
Number of degrees awarded in nursing and allied health. Same CIPs as in Closing the Gaps (51.02, 51.06, 51.07 (at the BS or lower levels only; graduate level is not allied health). 51.08, 51.09, 51.10, 51.16, 51.18, 51.23, 51.26, 51.27, 51.31, 51.32, 51.33, 51.34, 51.99) by level. Closing the Gaps only includes students who graduate with a certificate or an associate’s or bachelor’s degree. This measure includes all levels of a degree.
Fiscal year 2006
4,455
FTE Student/FTE Faculty Ratio b
CBM008 for FTE faculty (FTFE) – FTE faculty are instructional faculty reported on the CBM008 with rank codes 1-5 and appointment codes 01 and 02. Faculty members without a salary are included. For this measure, undergraduate full-time-student-equivalents (FTSE’s) are calculated on 15 semester credit hours; master’s pharmacy, law, and other special profession FTSE’s are calculated on 12 semester credit hours; optometry is calculated on 17 semester credit hours; and doctoral FTSE’s are calculated on 9 semester credit hours. Teaching assistants are not included to match the LBB measure.
Fall 2006 20.9
Class Size b The average class size of organized classes (class type 1, 2 and 4) at the freshman and sophomore level. Composite classes are combined.
Fall 2006 40
Percent of FTE Teaching Faculty Who Are Teaching Tenure/Tenure Track b
Percentage of all FTE faculty with teaching responsibility (appointment codes 01 and 02 and are reported during the fall semester as the teacher of record on the CBM004) who are tenure or tenure-track. Teacher Assistant’s (TA’s) are included in the denominator.
Fall 2006 59.2%
Fourteen Key Accountability Measures Not Tested
Graduation Rate Percentage of first-time entering degree-seeking students who enrolled in a minimum of 12 SCH their first fall semester who have graduated from the same institution or another Texas public or independent institution after four, five, and six academic years. This includes Social Security Number (SSN) changes submitted on the CBM00N. First-time determined by the “First-time student flag” on the CBM-001.
Fiscal year 2005
4-year graduation rate: 24.3%
5-year graduation rate: 48.1%
6-year graduation rate: 56.7%

An Audit Report on the Higher Education Coordinating Board’s Higher Education Accountability System SAO Report No. 07-042
August 2007 Page 19
Definitions and Results for 23 Key Measures in the Higher Education Accountability System
Measure Title
Measure Definition (exactly as it appears in Texas Higher
Education Accountability System, Volume I, December 2006) Timeframe Statewide Measure Results a
The Initial Pass Rate of a Cohort of Teacher Education Program Completers
The initial pass rate is the percent of tests passed by a completer cohort through December 31 following the academic year of completion. The pass rate is based only on the tests required to obtain certification in the field(s) in which the person completed a program during the academic year. The rate reflects a candidate’s success on the last attempt made on the test by December 31 following the year of completion. Formula: The number of successful (i.e., passing) last attempts made by the cohort divided by the total number of last attempts made by the cohort. A program completer is an individual who has completed all educator preparation program requirements including: course work, field work, program assessments, and degree requirements. A completer cohort is a group of candidates who complete an educator preparation program during an academic year (September 1 to August 31).
Fiscal year 2005
95.7%
Percent Lower Division SCH
Percent of semester credit hours taught by tenure/tenure track faculty. CBM008 Faculty Report ranks 1-6 and tenure/tenure-track faculty; Semester credit hour data comes from the CBM004 Class Report. SCH are for lower level SCH generated in lower division courses. This is for a fall semester only.
Fall 2006 40.2%
Percent of Baccalaureate Graduates Either Employed or Enrolled in a Texas Graduate or Professional School Within One Year of Graduation
Percentage of baccalaureate graduates who are employed in Texas within one year after the fiscal year in which they graduated, or enrolled in a Texas graduate program within one year. Post-baccalaureate and independent institutions data are included. Only information on student who are employed in Texas are included. Students who are self employed or leave the state to work or continue their education are not found.
Fiscal year 2005
85.4%
Certification or Licensure, Licensure/Certification Rate on State or National Exams (Law, Pharmacy, Nursing, Engineering)
As provided by institutions to the LBB. Not reported by the Coordinating Board
FTE Faculty Federal research expenditures divided by the number of all tenure/tenure-track full-time-equivalent faculty.
Fiscal year 2005
$56,044
Research Expenditures Research expenditures by source of funds as reported in the annual research expenditures report. In the future, reports to the CB will break out pass-through and indirect costs. These amounts will be excluded from the research expenditure numbers.
Fiscal year 2005
$1,242,691,000
Sponsored Research Funds
Sponsored research funds as a percent of state general revenue appropriations.
Fiscal year 2005
28.79%

An Audit Report on the Higher Education Coordinating Board’s Higher Education Accountability System SAO Report No. 07-042
August 2007 Page 20
Definitions and Results for 23 Key Measures in the Higher Education Accountability System
Measure Title
Measure Definition (exactly as it appears in Texas Higher
Education Accountability System, Volume I, December 2006) Timeframe Statewide Measure Results a
Administrative Costs The percentage of funds expended for administrative costs as a percent of operating budget. Administrative costs are Institutional Support expenditure items as designated in the institution's annual financial reports included in the following subcategories: executive management, fiscal operations, general administration and logistical services, administrative computing support, and public relations/development.
Not reported by the Coordinating Board
Facilities Average weekly hours of use for classrooms and labs. Room utilization is based on the number of E&G classrooms in an institution’s facilities inventory and class durations reported on the annual Fall CBM005 Building and Room Use Report. Classroom calculations are based on room type 110 as reported on an institution’s facilities inventory. Lab calculations are based on room type 210 as reported on an institution’s facilities inventory. (Class durations of 50 minutes are used.) This measure will be reviewed.
Fall 2006 Classroom utilization: 31.8 hours per week
Lab utilization: 22.5 hours per week
Appropriations State general revenue appropriations for the fiscal year divided by full-time equivalent student for the fiscal year (using state-funded SCHs) and annual (9 month) full-time equivalent teaching faculty.
Fiscal year 2006
General Revenue Appropriations divided by Full-Time Equivalent Students: $6,259
General Revenue Appropriations divided by Full-Time Equivalent Faculty: $64,678
Historically Underutilized Business Trends
Total HUB expenditures (with and without building and heavy construction) and those figures as a percentage of total expenditures reported by the State Building and Procurement Office.
Not reported by the Coordinating Board
Operating Expenses Per FTE Student
Operating expenses divided by the number of full-time equivalent students.
Fiscal year 2006
$16,113
Total Revenue Total revenue excluding constitutional funds divided by the annual number of full-time equivalent student and full-time equivalent teaching faculty.
Fiscal year 2006
Total Revenue divided by Full-Time Equivalent Students: $17,185
Total Revenue divided by Full-Time Equivalent Faculty: $177,581
a This data is presented exclusive of any issues identified in this audit. b See Chapter 1 for issues identified with these measures.
Sources: The Higher Education Coordinating Board’s Texas Higher Education Accountability System, Volume I, December 2006; the Higher Education Accountability System Web site at http://www.txhighereddata.org/Interactive/Accountability/.

An Audit Report on the Higher Education Coordinating Board’s Higher Education Accountability System SAO Report No. 07-042
August 2007 Page 21
Appendix 3
List of Higher Education Institution Auditors Visited
The State Auditor’s Office visited the following higher education institutions:
Sam Houston State University.
Texas A&M International University.
Texas A&M University.
Texas A&M University - Corpus Christi.
Texas Southern University.
Texas State University - San Marcos.
Texas Tech University.
The University of Houston.
The University of Houston - Clear Lake.
The University of Texas at Arlington.
The University of Texas at Austin.
The University of Texas at Brownsville.
The University of Texas at Dallas.
The University of Texas at El Paso.
The University of Texas at San Antonio.
University of North Texas.

Copies of this report have been distributed to the following:
Legislative Audit Committee The Honorable David Dewhurst, Lieutenant Governor, Joint Chair The Honorable Tom Craddick, Speaker of the House, Joint Chair The Honorable Steve Ogden, Senate Finance Committee The Honorable Thomas “Tommy” Williams, Member, Texas Senate The Honorable Warren Chisum, House Appropriations Committee The Honorable Jim Keffer, House Ways and Means Committee
Office of the Governor The Honorable Rick Perry, Governor
Members of the Higher Education Coordinating Board Mr. Robert Shepard, Chair Mr. Neal W. Adams, Vice Chair Ms. Lorraine Perryman, Secretary Ms. Laurie Bricker Mr. Paul Foster Mr. Fred W. Heldenfels IV Mr. Joe B. Hinton Mr. George L. McWilliams Ms. Elaine Mendoza Ms. Nancy R. Neal Dr. Lyn Bracewell Phillips Mr. Curtis E. Ransom Mr. A. W. “Whit” Riter
Higher Education Coordinating Board Dr. Raymund Paredes, Commissioner of Higher Education
Boards of Regents, Chancellors, and Presidents of the Following Higher Education Institutions Sam Houston State University Texas A&M International University Texas A&M University Texas A&M University - Corpus Christi Texas Southern University Texas State University - San Marcos Texas Tech University The University of Houston The University of Houston - Clear Lake The University of Texas at Arlington The University of Texas at Austin The University of Texas at Brownsville The University of Texas at Dallas The University of Texas at El Paso The University of Texas at San Antonio University of North Texas

This document is not copyrighted. Readers may make additional copies of this report as needed. In addition, most State Auditor’s Office reports may be downloaded from our Web site: www.sao.state.tx.us. In compliance with the Americans with Disabilities Act, this document may also be requested in alternative formats. To do so, contact our report request line at (512) 936-9880 (Voice), (512) 936-9400 (FAX), 1-800-RELAY-TX (TDD), or visit the Robert E. Johnson Building, 1501 North Congress Avenue, Suite 4.224, Austin, Texas 78701. The State Auditor’s Office is an equal opportunity employer and does not discriminate on the basis of race, color, religion, sex, national origin, age, or disability in employment or in the provision of services, programs, or activities. To report waste, fraud, or abuse in state government call the SAO Hotline: 1-800-TX-AUDIT.