An Assessment of the Extent, Distribution, and Change of Bracken (Pteridium aquilinum) in the Peak...
131
i An Assessment of the Extent, Distribution, and Change of Bracken (Pteridium aquilinum) in the Peak District National Park by Julian A.I. McAlpine August 2014 In submitting this dissertation, I confirm that it is my own work. A thesis submitted to the Department of Geography, University of Leicester in partial fulfilment of the requirements for the degree of Global Environmental Change Master of Science
Transcript of An Assessment of the Extent, Distribution, and Change of Bracken (Pteridium aquilinum) in the Peak...
i
An Assessment of the Extent, Distribution, and Change of Bracken (Pteridium aquilinum) in the Peak District
National Park
by
Julian A.I. McAlpine
August 2014
In submitting this dissertation, I confirm that it is my own work.
A thesis submitted to the Department of Geography, University of Leicester in partial fulfilment of the requirements for the degree of
Global Environmental Change
Master of Science
ii
Abstract
An Assessment of the Extent, Distribution, and Change of Bracken (Pteridium aquilinum) in the Peak District National Park
Bracken (Pteridium aquilinum) has a global distribution (apart from Antarctica). By origin a
component of open woodland habitats, due to anthropogenic activities its range has
broadened, and on open ground it displays competitive and invasive characteristics. Bracken
is thus viewed as a pest - in the UK it encroaches into habitats of greater conservation and
economic value, notably in the uplands where control is difficult. The application of asulam,
the most effective narrow-margin herbicide, was made illegal in 2013, however Emergency
Authorisations have allowed spraying to continue in the short-term. An absolute ban will have
wide-ranging implications for the uplands; without asulam spraying bracken extent would
possibly be 50% greater.
In ArcGIS this study mapped 1960s and 2005 imagery for the Peak District National Park. A
comparison of the study periods observed an increase in bracken extent of nearly 1% per
annum, which is not exceptional. However, the data suggest that bracken may have covered
an area of 62 km2 in the Peak District National Park 2005, a 1.8% p.a. increase on 1990
estimations. Despite steady, persistent control since 1990, bracken’s rate of spread may have
accelerated. Land management practices, such as burning, and potentially the influence of
climate change, may be assisting the bracken’s spread. This study observed an increase in
bracken cover at higher elevations and on north- and east-facing slopes, but the diversity of
change, by virtue of anthropogenic activities, masked any evidence of climate change as a
factor in upland bracken distribution. In the future, if the viability of upland economies
becomes more tenuous, the threats from invasive species worsen, and asulam (or herbicide
spraying in general) is prohibited, a decision on the successional direction of upland
environments will be unavoidable. Should plagio-climax communities be maintained, or
should succession towards woodland habitats be promoted?

iii
Acknowledgements
Firstly, I would like to thank Dr Ben Clutterbuck – I am hugely grateful for all his help, advice,
and encouragement, which was always afforded with good humour. He is a good friend and an
inspiration. This study is dedicated to him.
I would also like to thank Professor Sue Page, her enthusiasm has been a real tonic, and her
support, advice and feedback are greatly appreciated. The literature review is much improved
due to her recommendations.
From the Peak District National Park Authority I would like to thank Angela Johnson, Philippa
Davey and Rhodri Thomas. Angela was extremely helpful, patient, and welcoming when I was
searching for imagery. Philippa, too, has been most helpful, and Rhodri’s knowledge of the
Peak District is second to none.
Huge thanks also to Professor Rob Marrs and Penny Anderson, whose replies to my queries
were invaluable, and their inputs have been integral to this study.
I sincerely thank all the above, and all those referenced throughout this study - you have
inspired and informed this study, however all errors and oversights are my own.
And a huge thank you to all my family and friends for their continued support and
encouragement, especially my wife Jennifer, children Sienna and Thomas, and my parents –
I’ll see a lot more of you now (whether you like it or not!).
iv
Table of Contents
Front page i
Abstract ii
Acknowledgements iii
Table of contents iv
Table of figures vii
Table of tables
Title page
ix
xi
1. Introduction 1
1.1 Is the extent of bracken increasing? 2
1.2 The natural history and ecology of bracken 3
1.3 The competitive ability of bracken 5
1.3.1 Factors that have influenced bracken spread in the UK 5
1.3.2 The competitive characteristics of bracken 6
1.3.3 The dynamics of bracken spread 7
1.4 The Uplands 10
1.4.1 Upland characteristics 10
1.4.2 The Peak District National Park (PDNP) 13
1.5 Bracken: extent and distribution, management and control 14
1.5.1 Bracken extent and distribution 14
1.5.2 Bracken management 16
1.5.3 Bracken control 18
1.6 Study rationale 20
1.6.1 Bracken spread in the PDNP 20
1.6.2 Climate change 21
1.6.2.1 Climate change and the uplands 21
1.6.2.2 Bracken and climate change 23
1.6.3 Burn regimes 24
1.7 Summary of study intentions 25
2. Method 26
2.1 Introduction 26
2.2 The study area – the Peak District National Park 26
2.2.1 Dark Peak landscape characteristics 27
2.2.2 Climate 29
2.3 Site selection 29
2.4 Aerial imagery 32
v
2.4.1 Orthocorrection 32
2.4.2 Georeferencing 34
2.5 Geographic Information Systems (GIS) 34
2.6 Mapping bracken cover in ArcGIS 35
2.6.1 Identification of bracken 35
2.6.2 Polygon mapping 36
2.6.3 Image uncertainty 36
2.6.4 Altitude, aspect, and slope data 37
2.7 Statistical analysis 38
2.7.1 Assessment of mapping consistency 38
2.7.2 Bracken coverage in the PDNP in 2005 38
2.7.3 Bracken data for the 2005 sample and sub-sample 38
2.7.3.1 The Pearson correlation test 38
2.7.3.2 The Kolmogorov-Smirnov test 38
2.7.3.3 Sub-sample analysis 39
2.7.3.4 Changes in bracken cover at slopes related to altitude 1960s-2005
39
2.8 Historic climate data 39
3. Results 40
3.1 Assessment of mapping consistency 40
3.2 Bracken coverage in the PDNP in 2005 40
3.3 Bracken extent by combined aspect and slope at altitudinal zones 44
3.4 Representation of bracken in sub-sample data 45
3.5 Change in bracken cover 1960s-2005 48
3.5.1 Changes in bracken cover at altitudinal zones 1960s-2005 49
3.5.2 Changes in bracken cover at aspect 1960s-2005 51
3.5.3 Changes in bracken cover at aspect related to altitude 1960s-2005
51
3.5.4 Changes in bracken cover on slopes 1960s-2005 54
3.5.5 Changes in bracken cover on slopes related to altitude 1960s-2005
56
3.6 Ranking changes in bracken cover (%) 1960s-2005 59
3.7 Results for historic climate data 60
4. Discussion 63
4.1 Bracken in the PDNP in 2005 63
4.2 Comparison of bracken in the 1960s and 2005 66
4.2.1 Comparison of aspect 68
4.2.2 Comparison of aspect 69
vi
4.3 Climate change 70
4.3.1 Climate change and future bracken distribution 70
4.4 The relationship between bracken and heather 71
4.4.1 The effects of climate change on the bracken-heather relationship
73
4.4.2 Heather: state and distribution 73
4.5 The role of anthropogenic activities on bracken distribution 74
4.5.1 Wildfires and burn regimes 74
4.5.2 Bracken control 77
4.6 Future conservation strategies 78
4.6.1 Contradictions of future strategies 80
4.6.2 The succession paradox 80
4.6.3 Confronting misdeeds 81
4.7 Study limitations 82
4.7.1 1960s imagery versus 2005 imagery 82
4.7.2 Problems associated with identifying bracken 83
4.7.2.1 Growing and senesced fronds 83
4.7.2.2 Shadows 84
4.7.3 Climate data 85
4.8 Recommendations for future research 85
4.9 Concluding summary 86
5. Annex 88
5.1 Introduction 88
5.2 The evolution of the study 88
5.2.1 Site selection 88
5.2.2 Variables and the elevation boundary 89
5.2.3 Study period selection 91
5.3 Mapping 91
5.3.1 Mapped data 91
5.3.2 ArcGIS 93
5.4 The results 93
5.5 Bracken: further discussion 93
5.5.1 The value of bracken 94
5.5.2 Albedo and succession 95
5.5.3 Bracken toxicity and hydrology 95
6. References 97
7. Appendix 115
vii
Table of figures:
Figure 1.1 The major morphology of Pteridium spp.: 4
Figure 1.2 The regeneration cycle of bracken and the associated changes in litter and shoots
8
Figure 1.3 The change in height and cover continuity, and depth of origin of fronds between the margin and hinterland in a bracken community
8
Figure 1.4 The distribution of bracken in the British Isles 10
Figure 1.5 Extent and location of the British uplands and marginal uplands recorded by the Countryside Survey 2000
11
Figure 1.6 Location of the Peak District National Park 13
Figure 1.7 Bracken in the Peak District, 2005 15
Figure 1.8 The effects of control on the mean position (m) of the bracken front relative to study start in 1993 at Levisham Moor, North York Moors
19
Figure 1.9 A model of the inter-relationships between climate change, visitors, the environment, and wildfires in UK uplands
23
Figure 1.10 Visible bracken encroachment into burn scars on the North Yorkshire Moors 2002-2009
24
Figure 2.1 The PDNP, with the Dark Peak 26
Figure 2.2 Landscape character types in the PDNP 28
Figure 2.3 An illustration of the problem of identifying bracken with confidence in the 1960s imagery
30
Figure 2.4 The 2005 sample 31
Figure 2.5 The sub-sample of 13 1 km2 study grids in PDNP 31
Figure 2.6 Orthocorrection 33
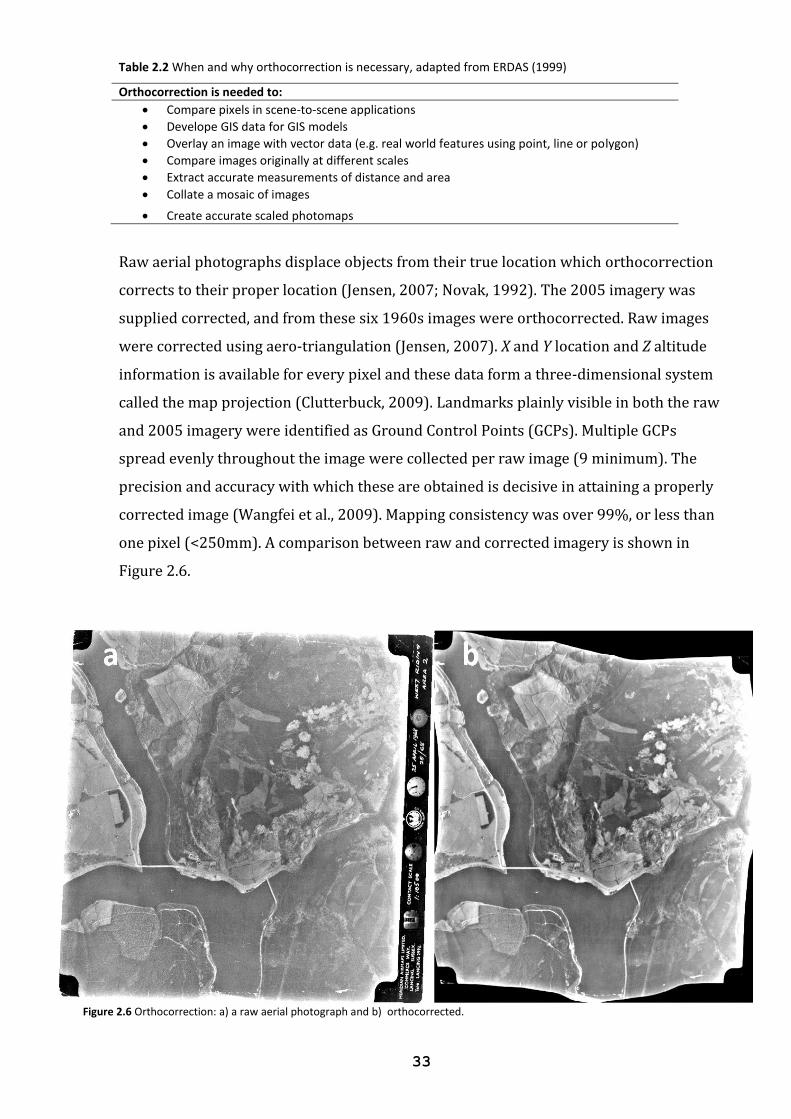
Figure 2.7 ArcMap screen grab in which a georeferencenced 1960s image is compared with orthocorrected 2005 imagery from which its GCPs were taken
34
Figure 2.8 Bracken identification 35
Figure 2.9 ArcGIS mapping 36
Figure 2.10 ArcMap screen-grab showing the attribute table for ‘2005 all bracken aspect’
37
Figure 3.1 Proportion of bracken in altitudinal (50 m zones) in PDNP in 2005 41
Figure 3.2 Areal extent (ha) of bracken by aspect in PDNP in 2005 41
Figure 3.3 Aspects in which bracken cover (ha) was observed at altitudinal zones (50 m) in PDNP, 2005
42
Figure 3.4 Areal extent (ha) of bracken by slope in PDNP in 2005 43
Figure 3.5 Slope zones in which areal extent (ha) of bracken was observed at altitudinal zones (50 m) in PDNP in
44
Figure 3.6 The 2005 sample and sub-sample of bracken in altitudinal zones (m) in PDNP
46
viii
Figure 3.7 Correlation between the full 2005 sample and sub-sample in altitudinal zones (m) in PDNP, illustrating a linear association
47
Figure 3.8 Correlation between the full 2005 sample and sub-sample for aspect 47
Figure 3.9 Correlation between the full 2005 sample and sub-sample for slope 48
Figure 3.10 Change in area (ha) of bracken at altitudinal zones (50 m) from the 1960s to 2005 in PDNP
50
Figure 3.11 Annual change (%) of bracken at altitudinal zones (50 m) from the 1960s to 2005 in PDNP
50
Figure 3.12 Change (% p.a.) of bracken at a north aspect from the 1960s to 2005 in PDNP
52
Figure 3.13 Annual change in area (ha) of bracken at an east aspect from the 1960s to 2005 in PDNP
53
Figure 3.14 Change of bracken cover for aspect at altitudinal zones (50 m) from the 1960s to 2005 in PDNP
54
Figure 3.15 Change in area (ha) of bracken at slope zones from the 1960s to 2005 in PDNP
55
Figure 3.16 Annual change (%) of bracken at slope zones from the 1960s to 2005 in PDNP
56
Figure 3.17 Change in area (ha) of bracken at consolidated slope zones from the 1960s to 2005 in PDNP
58
Figure 3.18 Change (%) of bracken at consolidated slope zones from the 1960s to 2005 in PDNP
58
Figure 3.19 Changes in distribution (%) of bracken in the slope zones for the 1960s and 2005 in PDNP
59
Figure 3.20 Mean summer maximum and minimum temperatures 61
Figure 3.21 Mean winter maximum and minimum temperatures 62
Figure 4.1 1 km2 study grid showing bracken mapped for 2005, illustrating clipping out
64
Figure 4.2 The observed altitudinal limit, 514 m, of bracken in the study grids and bracken at 536 m, Kinder Scout, PDNP
65
Figure 4.3 An example of land-cover change next to the Upper Derwent Reservoir 67
Figure 4.4 The lifecycle of heather is comparable with that of bracken 72
Figure 4.5 Moorland burns at a local scale in the PDNP 75
Figure 4.6 Moorland burns at a large scale in the PDNP 76
Figure 4.7 Areas sprayed by asulam 77
Figure 4.8 The extent and potential extent of bracken in Great Britain with and without sprayed asulam (from Pakeman, 2012)
78
Figure 4.9 The directional options for upland landscapes 80
Figure 4.10 Possible breaches of regulations in the PDNP from 2005 imagery 81
Figure 4.11 Bracken is easily identifiable 83
Figure 4.12 Bracken is not identifiable in the 1960s, but easy to identify in 2005 83
ix
Figure 4.13 The images illustrate how shadows, woodland, and other features such as walls and lone trees were dealt with when mapping bracken in this study
84
Sheep amongst bracken, the PDNP, July 2013 (by author) 87
Figure 5.1 The differences between two- and three-dimensional images 90
Figure 5.2 A 1km2 study grid in which is shown mapped bracken from 2005 overlaid with mapped bracken from the 1960s
91
Figure 5.3 The mapped extents for the 1960s and 2005, and the losses and gains in
bracken extent from the 1960s to 2005 in a 1km2 study grid
91
Table of tables:
Table 1.1 Bracken’s ecological and amenity provisions 2
Table 1.2 Main upland habitats, recorded by the Countryside Survey 2000 13
Table 1.3 Examples of ecosystem services provided by PDNP 14
Table 1.4 Bracken broad habitat in Great Britain 1984-2007 and the UK 1998-2007
15
Table 1.5 Management options for bracken control 17
Table 1.6 The processes driven by climate and their associated upland impacts 22
Table 2.1 Date, source, format and resolution of aerial imagery 32
Table 2.2 When and why orthocorrection is necessary 33
Table 2.3 Typical questions GIS can answer 35
Table 2.4 Month photograph taken and bracken growth-stage 36
Table 3.1 Three bracken stands mapping consistency assessment results 40
Table 3.2 Proportion (%) of bracken by altitudinal zones (50 m) in PDNP in 2005 40
Table 3.3 Proportion (%) of bracken by aspect in PDNP in 2005 41
Table 3.4 Distribution of bracken cover by aspect at altitudinal zones (50 m) in PDNP, 2005
42
Table 3.5 Proportion (%) of bracken by slope in PDNP in 2005 43
Table 3.6 Distribution of bracken cover by slope at altitudinal zones (50 m) in PDNP, 2005
43
Table 3.7 Bracken extent (ha) by aspect and slope in relation to altitude in the PDNP, 2005
45
Table 3.8 2005 sample and sub-sample datasets for bracken in 50 m zones in PDNP
46
Table 3.9 Change in bracken extent (ha) by aspect and slope in relation to altitude in the PDNP, 1960s-2005
49
Table 3.10 Bracken cover and change at altitudinal zones (50 m), 1960s-2005 in PDNP
49
x
Table 3.11 Bracken cover and change at four aspects, 1960s-2005 in PDNP 51
Table 3.12 Bracken cover and change at north aspect, 1960s-2005 in PDNP 51
Table 3.13 East aspect for bracken in the 1960s and 2005 in PDNP 52
Table 3.14 South aspect for bracken in the 1960s and 2005 in PDNP 53
Table 3.15 West aspect for bracken in the 1960s and 2005 in PDNP 53
Table 3.16 Bracken in the 1960s and 2005 in 8 slope zones in PDNP 55
Table 3.17 Low slope for bracken in the 1960s and 2005 in PDNP 56
Table 3.18 low-mid slope for bracken in the 1960s and 2005 in PDNP 57
Table 3.19 Steep-mid slope for bracken in the 1960s and 2005 in PDNP 57
Table 3.20 Steep slope for mapped bracken in the 1960s and 2005 in PDNP 57
Table 3.21 Bracken in the 1960s and 2005 in the consolidated slope zones in PDNP
58
Table 3.22 Distribution (%) of bracken in the slope zones for the 1960s and 2005 in PDNP
59
Table 3.23 Ranking areas (n) and proportion (%) of bracken by percentage change from the 1960s to 2005 in PDNP
60
Table 3.24 Summer period decadal comparison of climatic variables during the study period
60
Table 3.25 Winter period decadal comparison of climatic variables during the study period
61
Table 4.1 Examples of potential causes and effects of climate change in PDNP that might proliferate the spread of bracken
70
Table 4.2 Projected temperature (°C) and precipitation (%) changes for PDNP in 2020s, 2050s and 2080s
71
Table 4.3 The Twelve Ecosystem Approach Principles 79
Table 4.4 A vision for the uplands in 2060 compared to 2009 79
xi
An Assessment of the Extent, Distribution, and Change of Bracken (Pteridium aquilinum) in the Peak District
National Park
by
Julian A.I. McAlpine
August 2014
1
1. Introduction
Bracken (Pteridium aquilinum) is an invasive plant of worldwide significance (Maren et
al., 2008; Da Silva and Matos, 2006; Marrs and Watt, 2006; Schneider, 2004; Potter and
Baird, 2000; Blackman and Pitman, 1999). It is distributed globally apart from the
coldest and hottest desert environments (Hatcher and Batty, 2011; Marrs and Watt,
2006; Page, 1976), the most widely of all pteridophytes (ferns and fern allies) (Marrs
and Watt, 2006), and is one of the five most common plants in the world (Werkman and
Callaghan, 1999; Heads and Lawton, 1984). In temperate regions it is a particularly
successful competitor where it colonises all habitats except calcareous grassland and
mires (Elkington et al., 2001; Marrs et al., 2000).
Farmers, foresters, land managers and conservationists in the UK consider bracken a
weed, and the problems it causes are copious and diverse; invasive, competitive and
toxic, it encroaches into habitats of higher economic and conservation value (Alday and
Marrs, 2014; Alday et al., 2013; Deluca et al., 2013; Hatcher and Batty, 2011; Marrs and
Watt, 2006; Pakeman et al., 1994; Anderson and Radford, 1988; Taylor, 1985; Page,
1982). Bracken can out-compete other vegetation and endure non-polluting herbicides,
repeated burning, and all but the worst droughts due to its physiological and
morphological properties, including an extensive, deep rhizomal system, high
productivity, efficient water-use, dense frond-litter, and a tolerance of a broad range of
soils (Marrs and Watt, 2006; McGlone et al., 2005; Marrs et al., 2000).
Distributed mainly in upland areas and on marginal land, bracken colonises
conservation-priority communities such as heather (Calluna vulgaris) moorland and acid
grassland (Le Duc et al., 2007; Pakeman et al., 2000; Pakeman and Marrs, 1992),
fragmenting or completely replacing these habitats which diminishes biodiversity,
ecosystem functioning and ecosystem services (Anderson et al., 2009; Tong et al., 2006;
Pakeman and Marrs, 1992). Additionally this affects the viability of important upland
economies including farming, forestry and grouse (Lagopus lagopus scotica) shooting
(Alday and Marrs, 2014; Anderson et al., 2009; Pakeman et al., 1997; Varvarigos and
Lawton, 1991).
The control of bracken is viewed as essential to protect unique habitat assemblages and
vulnerable upland economies (Stewart et al., 2007). Control of invasive plants must be
2
cost-effective and ecologically sound (Wiles, 2004), however a ban on the herbicide
asulam, a potent and narrow-spectrum control, may give rise to upland range expansion
(Pakeman, 2012). However, where bracken is not dominant and suppressive, it provides
ecological and amenity value as a component of the landscape mosaic (Marrs and Watt,
2006; Anderson and Radford, 1988, Table 1.1).
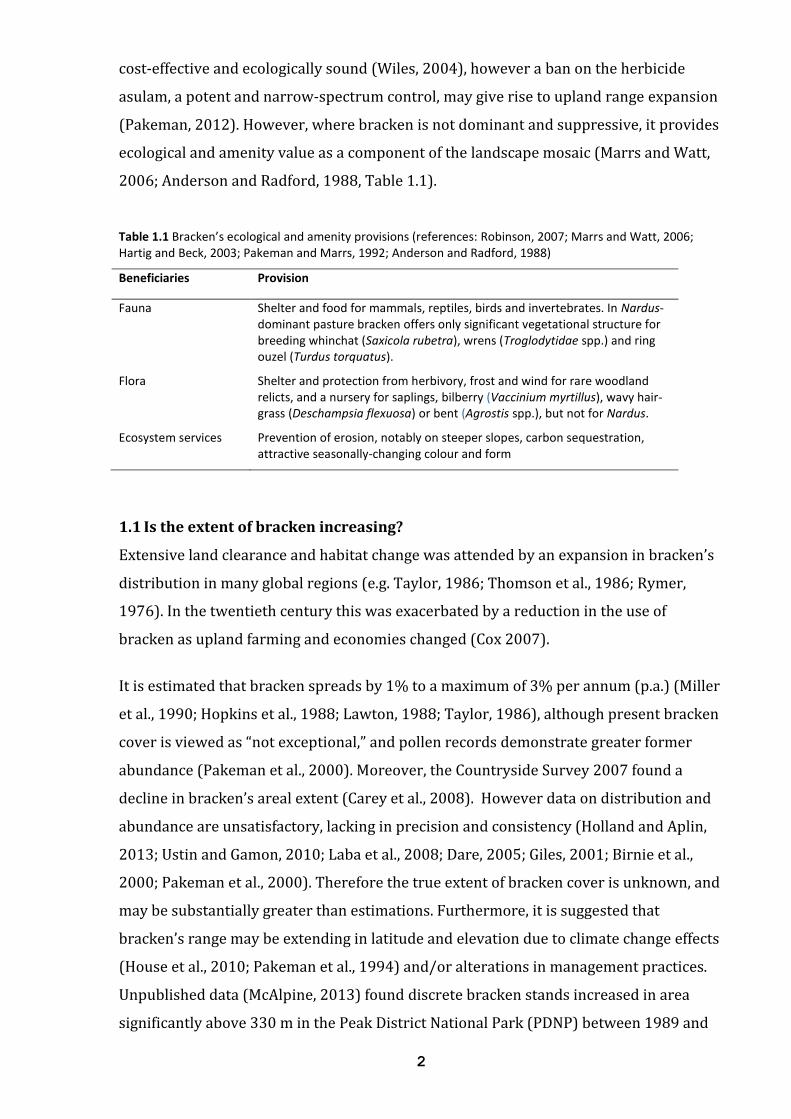
Table 1.1 Bracken’s ecological and amenity provisions (references: Robinson, 2007; Marrs and Watt, 2006; Hartig and Beck, 2003; Pakeman and Marrs, 1992; Anderson and Radford, 1988)
Beneficiaries Provision
Fauna Shelter and food for mammals, reptiles, birds and invertebrates. In Nardus-dominant pasture bracken offers only significant vegetational structure for breeding whinchat (Saxicola rubetra), wrens (Troglodytidae spp.) and ring ouzel (Turdus torquatus).
Flora Shelter and protection from herbivory, frost and wind for rare woodland relicts, and a nursery for saplings, bilberry (Vaccinium myrtillus), wavy hair-grass (Deschampsia flexuosa) or bent (Agrostis spp.), but not for Nardus.
Ecosystem services Prevention of erosion, notably on steeper slopes, carbon sequestration, attractive seasonally-changing colour and form
1.1 Is the extent of bracken increasing?
Extensive land clearance and habitat change was attended by an expansion in bracken’s
distribution in many global regions (e.g. Taylor, 1986; Thomson et al., 1986; Rymer,
1976). In the twentieth century this was exacerbated by a reduction in the use of
bracken as upland farming and economies changed (Cox 2007).
It is estimated that bracken spreads by 1% to a maximum of 3% per annum (p.a.) (Miller
et al., 1990; Hopkins et al., 1988; Lawton, 1988; Taylor, 1986), although present bracken
cover is viewed as “not exceptional,” and pollen records demonstrate greater former
abundance (Pakeman et al., 2000). Moreover, the Countryside Survey 2007 found a
decline in bracken’s areal extent (Carey et al., 2008). However data on distribution and
abundance are unsatisfactory, lacking in precision and consistency (Holland and Aplin,
2013; Ustin and Gamon, 2010; Laba et al., 2008; Dare, 2005; Giles, 2001; Birnie et al.,
2000; Pakeman et al., 2000). Therefore the true extent of bracken cover is unknown, and
may be substantially greater than estimations. Furthermore, it is suggested that
bracken’s range may be extending in latitude and elevation due to climate change effects
(House et al., 2010; Pakeman et al., 1994) and/or alterations in management practices.
Unpublished data (McAlpine, 2013) found discrete bracken stands increased in area
significantly above 330 m in the Peak District National Park (PDNP) between 1989 and
3
2005. Anderson (pers. comm., 2014) regards bracken spread in some areas of PDNP as
“significant”, notably in the region of the Howden/Derwent National Trust estate, whilst
other areas show no appreciable spread.
Effective control is difficult - bracken is exceptionally resilient to non-polluting
herbicides (Cox et al., 2008; Stewart et al., 2008; Marrs and Watt, 2006), and cutting and
ploughing are labour-intensive and confined to accessible areas (Burge and Kirkwood,
1992). In addition, anthropogenic activities can stimulate or accelerate invasion
(Schneider and Fernando, 2010; Mack, 2005), for example by grazing (Holden, 2009),
burning (Alday et al., 2013; Roos et al., 2011; Hartig and Beck, 2003), drainage, and
afforestation (Haigh, 2006).
1.2 The natural history and ecology of bracken
Vascular plants (tracheophytes) are the most species rich and abundant flora, the most
conspicuous of all organisms, and the most influential terrestrial primary producers
(Pryer et al., 2004). After angiosperms (the flowering plants, ~257,000 extant species),
leptosporangiate ferns, the grouping of modern ferns, are the most diverse vascular
plants with over 9,000 extant species in 267 genera (Hatcher and Batty, 211; Sharpe et
al., 2010; Schuettpelz and Pryer, 2007), including the family to which bracken belongs -
Dennstaedtiaceae (rhizomal and mostly creeping) (ITIS, 2011; Lehtonen, 2011; Smith et
al., 2006, appendix i). Bracken is recorded in fossil records dating back to the Tertiary
(~55 mybp) before the continents fully separated, which helps explain its widespread
contemporary distribution (Moran, 2004). Ferns also produce millions of spores, usually
falling very locally but which can disperse over thousands of kilometres (Kessler, 2010;
Schneller and Liebst, 2007), rare occurrences that are however disproportionately
important in their distribution (Renner, 2005). It is thought that unsuitable climatic and
edaphic conditions in the UK prevent successful widespread germination by this method
(Pakeman et al., 2002).
Here, bracken spreads as a travelling geophyte (having the capacity for underground
storage), advancing horizontally through the soil by means of a perennating, expansive,
starch-rich, branching rhizome system (Marrs and Watt, 2006; Parks and Werth, 1993;
Watt, 1940). As the rhizome advances segments die back behind it, and a single,
interconnected plant develops into a myriad of discrete clones. Large stands can be the
product of just one or a few plants, clones of great size and age - one clone’s stand in the
Appalachian mountains covered over 1km2 and was estimated to be 1,200 years old
4
(Hatcher and Batty, 2011). They produce solitary fronds on stems that can reach
between (15)30–180(440) cm in length, procuring sunlight and carbon dioxide (CO2)
that sustain rhizomal branching (Marrs and Watt, 2006).
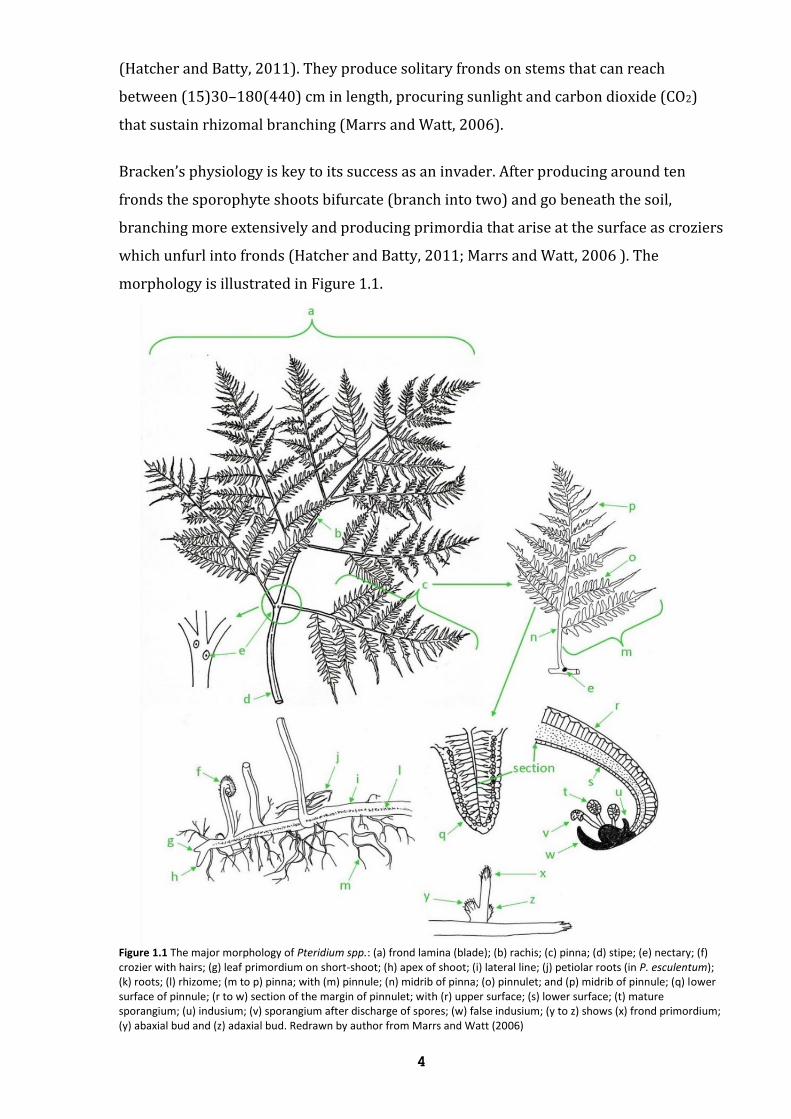
Bracken’s physiology is key to its success as an invader. After producing around ten
fronds the sporophyte shoots bifurcate (branch into two) and go beneath the soil,
branching more extensively and producing primordia that arise at the surface as croziers
which unfurl into fronds (Hatcher and Batty, 2011; Marrs and Watt, 2006 ). The
morphology is illustrated in Figure 1.1.
Figure 1.1 The major morphology of Pteridium spp.: (a) frond lamina (blade); (b) rachis; (c) pinna; (d) stipe; (e) nectary; (f) crozier with hairs; (g) leaf primordium on short-shoot; (h) apex of shoot; (i) lateral line; (j) petiolar roots (in P. esculentum); (k) roots; (l) rhizome; (m to p) pinna; with (m) pinnule; (n) midrib of pinna; (o) pinnulet; and (p) midrib of pinnule; (q) lower surface of pinnule; (r to w) section of the margin of pinnulet; with (r) upper surface; (s) lower surface; (t) mature sporangium; (u) indusium; (v) sporangium after discharge of spores; (w) false indusium; (y to z) shows (x) frond primordium; (y) abaxial bud and (z) adaxial bud. Redrawn by author from Marrs and Watt (2006)
5
1.3 The competitive ability of bracken
“Bracken is one of the most accommodating of plants as regards it requirements.”
C.E. Moss (1913)
Bracken is well adapted to the abiotic conditions where grows because it’s range is
natural (Page, 1982). A “non-aggressive understory species of open-canopied
woodland” (Atkinson, 1989), suppressed by limiting factors of light and water
availability (Berget, 2012; Harmer et al., 2005), bracken often signifies locations of
historic ancient woodland (Rodwell, 1998), and the altitudinal limits of bracken and
trees appear correlated (Moss, 1913). However, the beginning of agriculture by Neolithic
man 6,000 years ago initiated large-scale deforestation and habitat disturbance, due to
which bracken was unshackled from beneath the woodland canopy, and quickly
achieved its modern extensive distribution (Yerkes et al., 2012; Hatcher and Batty, 2011;
Page, 1976).
Contemporary UK bracken distribution - to its ecological limits, excluding permanently
cultivated areas (Marrs and Watt, 2006) - has been encouraged by its dwindling use,
especially in marginal and upland areas (Hatcher and Batty, 2011). Historically bracken
was viewed not as a pest but as a valuable resource as food for humans and livestock,
fuel, fertilizer and mulch, for thatching, bedding, medicine, soap and insect repellent.
Folklore mentions fern seed as an aphrodisiac, with the powers also to bestow invisibility
and invoke rains (Marrs and Watt, 2006; Rymer, 1976).
1.3.1 Factors that have influenced bracken spread in the UK
Modern changes in the activities that preserve open uplands character, predominantly
grazing and burning, have aided bracken’s spread (Holden et al., 2007; Evans et al.,
2006), exacerbated by modern anthropogenic-induced increases in nitrogen deposition
and other atmospheric pollution (Edmondson et al., 2013; Worrall and Evans 2009;
Barker et al., 2004).
These changes include:
Land-use change (e.g. arable to grazing) or abandonment, for example due to the
enforced Highland clearances of the eighteenth and nineteenth centuries (Dodgshon
and Olsson, 2006; Ader, 1988), or, more recently, because farming and shooting often
exist on the edge of economic viability (Arblaster et al., 2009; Holden et al., 2007;
Pakeman et al., 2003).
6
Changes away from mixed-livestock to sheep-dominated grazing practices. Sheep are
less effective than cattle and horses in trampling pioneer bracken, and their grazing
habits (of close cropping) allow bracken invasion into grassland and heather
moorland (Gardner et al., 2009; Evans et al., 2006; Birch, 2002; Pakeman et al., 2002).
Common Agricultural Policy (CAP) subsidies for less favourable areas (LFAs)
resulted in an intensification of sheep farming in the UK uplands, and have
contributed to local soil erosion, a decline of dwarf shrubs (notably Calluna vulgaris),
the spread of unpalatable, competitive species (including bracken), and a decline in
upland biodiversity (Gardner et al., 2009; Fraser et al., 2009; Fuller and Gough,
1999).
There has been an increase in peatland exploitation (Connolly and Holden, 2013;
Holden et al., 2007), and over half of UK peatland has been drained (1.5 of 2.9 million
ha) to lower the water table and make available lands for grazing or forestry (Worrall
and Evans, 2009), and more susceptible to bracken invasion (Marrs and Watt, 2006).
Upland burning of heather moorland for grouse has become more widespread and
extensive (Clutterbuck and Yallop, 2010; Yallop et al., 2009; Evans et al., 2006), and
provide opportunities for bracken invasion (McMorrow et al., 2009; Anderson,
1986).
1.3.2 The competitive characteristics of bracken
The characteristics of bracken are typically those of a plant ‘competitor’ (Grime, 2001),
defined by Trinder et al. (2013) as “the capture of essential resources from a common,
finite pool by neighbouring individuals.” Competition is dynamic, driven by the
mechanisms of leaf, stem and root maintenance and functioning. The resources for
which plants compete are light, water, C02, oxygen and minerals (especially nitrogen and
phosphorus) (Niklas and Hammond, 2013; Trinder et al., 2013).
High productivity and a rhizome system of multitudinous buds that, early in the season,
grow rapidly and form wide-ranging frond canopies, help make bracken a successful
competitor (Hatcher and Batty, 2011; Marrs and Watt, 2006; McGlone et al., 2005; Marrs
et al., 2000). Beneath bracken fronds light penetration is minimal, and in temperate
regions, when fronds senesce in autumn, substantial leaf litter accumulations combine to
prevent the establishment of other species (Marrs and Watt, 2006; Le Duc et al., 2003;
Lawton, 1988). However, Watt (1976) found opportunities for other species to
(re)colonise where the rate of litter accumulation was greater than that of removal.
7
Bracken is especially successful in temperate regions where it maximises growth in mid-
summer (Hatcher and Batty, 2011; Marrs and Watt, 2006), and prospers in a wide range
of non-woodland habitats, thriving most of all in full sunlight, where its maximum
photosynthetic rate is much greater than other ferns (Hatcher and Batty, 2011; Marrs
and Watt, 2006; Dring, 1965). Light levels influence the abundance and vigour of
bracken, which alters its frond morphology and stand structure is response to the
amount of light received (Marrs and Watt, 2006; Dring, 1965), an adaptation of
developmental plasticity which contributes to its success (Hatcher and Batty, 2011;
Alonso-Amelot et al., 2001). Such traits have caused it to be regarded as a “native thug” –
a weed possibly worse than alien invasive species (Marrs et al., 2010; Marrs, 2005;
Pearman, 2004).
Furthermore, bracken is unpalatable and almost completely unaffected by grazing,
invertebrate herbivory, or pathogens (Marrs and Watt, 2006; Lee et al., 1986). In
addition bracken toxins forestall litter decay, reduce soil pH, and, it is suggested, further
prevent re-invasion by allelopathy (Marrs and Watt, 2006; Rasmussen et al., 2005;
Hartig and Beck, 2003; Gliessman and Muller, 1978), whilst stray seeds from potential
competitors can conceivably be consumed by small mammals residing within the litter
(Marrs and Watt, 2006; den Ouden, 2000; Gliessman and Muller, 1978).
On open ground bracken is recognised as a successional species; replacing existing species
and establishing itself throughout a habitat, preventing most re-invasion, and persisting
in relative stability (Rodwell, 1998; Marrs et al., 2000). Hence there is a requirement for
effective, meticulous long-term control, for which it is important to recognize the
dynamics that promote or limit bracken spread (Page, 1982).
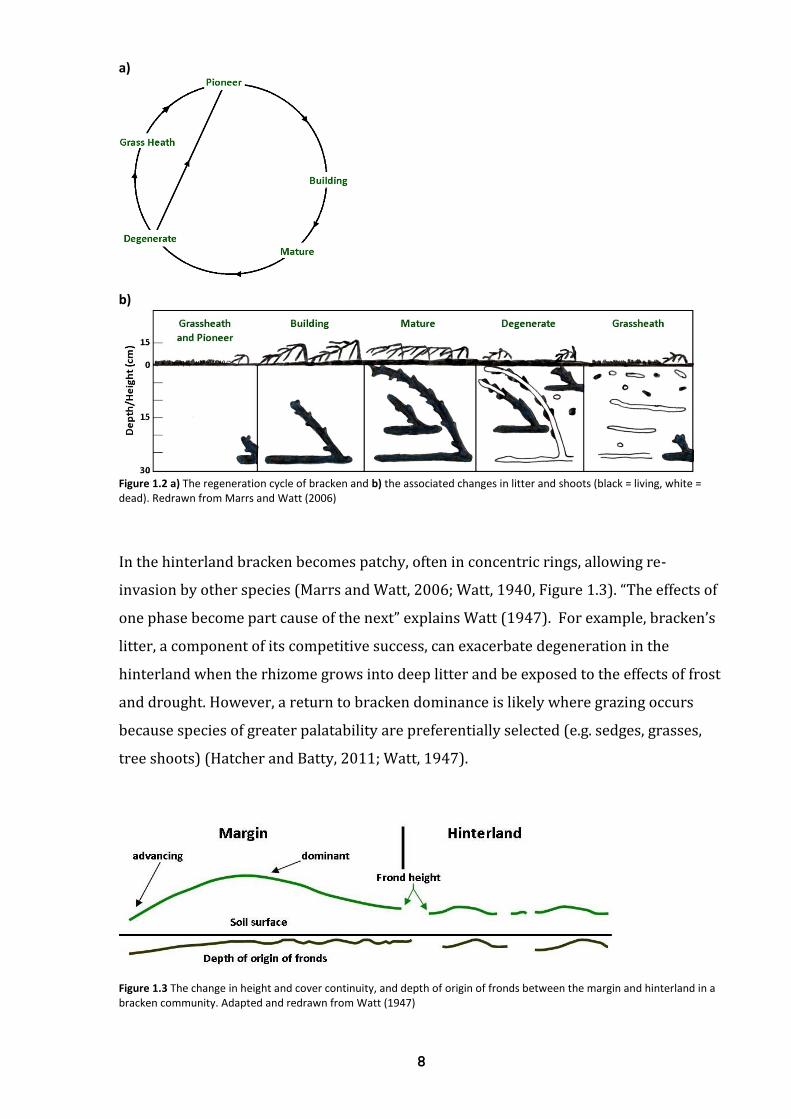
1.3.3 The dynamics of bracken spread
When covering large areas bracken is often patchily distributed due to the plant’s cycle
of regeneration - with stands experiencing cyclical change and a degeneration phase -
and topographic conditions (Marrs and Watt, 2006; Watt, 1976). Typically degeneration
occurs in the ‘hinterland’ in which all five cyclical phases (grass-heath, pioneer, building,
mature, degenerate) exist together in a mosaic, located behind an “advancing margin,” a
zone of uniformly dominant bracken (Marrs and Watt, 2006; Watt, 1976; 1947; 1940,
Figure 1.2).
8
a)
b)
Figure 1.2 a) The regeneration cycle of bracken and b) the associated changes in litter and shoots (black = living, white = dead). Redrawn from Marrs and Watt (2006)
In the hinterland bracken becomes patchy, often in concentric rings, allowing re-
invasion by other species (Marrs and Watt, 2006; Watt, 1940, Figure 1.3). “The effects of
one phase become part cause of the next” explains Watt (1947). For example, bracken’s
litter, a component of its competitive success, can exacerbate degeneration in the
hinterland when the rhizome grows into deep litter and be exposed to the effects of frost
and drought. However, a return to bracken dominance is likely where grazing occurs
because species of greater palatability are preferentially selected (e.g. sedges, grasses,
tree shoots) (Hatcher and Batty, 2011; Watt, 1947).
Figure 1.3 The change in height and cover continuity, and depth of origin of fronds between the margin and hinterland in a bracken community. Adapted and redrawn from Watt (1947)
9
Topography determines where bracken grows (Marrs and Watt, 2006), and in general
bracken flourishes most on a southerly aspect (Atkinson, 1986). It is discernibly affected
by air and ground frosts, which therefore limit its range both in latitude and elevation
(Marrs and Watt, 2006; Watt, 1954). Early frosts can restrict the growing season and
hasten senescence, and growth ceases following the first lethal frost (Pakeman et al.,
1994). Hard frosts during winter are extremely damaging, particularly if there is
insignificant insulation provided by litter or snow, and especially if rhizome apices are
close to the surface (Pakeman et al., 1994; Pakeman and Marrs 1992; Watt, 1950).
Conversely, substantial accumulations of litter can prevent the emergence of fronds and
offer protection from late frosts assuming the rhizome has not grown into the litter
(Atkinson, 1986).
Bracken growth is also affected by wind exposure, and its distribution excludes very
exposed sites (Marrs and Watt, 2006; Paterson et al., 1997; McVean and Ratcliffe, 1962),
and by water-logging, a constraint due to a lack of aeration and nutrients rather than
saturation (Marrs and Watt, 2006; Poel; 1961; Summerhayes et al., 1924). Nowhere in
the UK is it impeded due to excessive rainfall or humidity (Marrs and Watt, 2006).
Although bracken can become water-stressed, notably in spring as it starts to grow, it is
exceptionally drought tolerant, especially if the rhizome is buried deep (Anderson, pers.
comm., 2014; Marrs and Watt, 2006).
Moss (1913) claimed that bracken’s altitudinal limit in the Peak District was about 457-
472 m, above which “it is local and rare,” although he added that Woodhead (1906) had
noted bracken reached 518 m (on Moss Moor in the Pennines), however “in England it is
quite exceptional to meet with the plant at such an altitude.” The recorded limit in the
UK (in the Scottish Highlands) is about 600 m. Globally, as latitudes decrease, bracken
grows at higher altitudes, reaching 3,000 m in parts of the Caribbean and South and
Central America (Marrs and Watt, 2006).
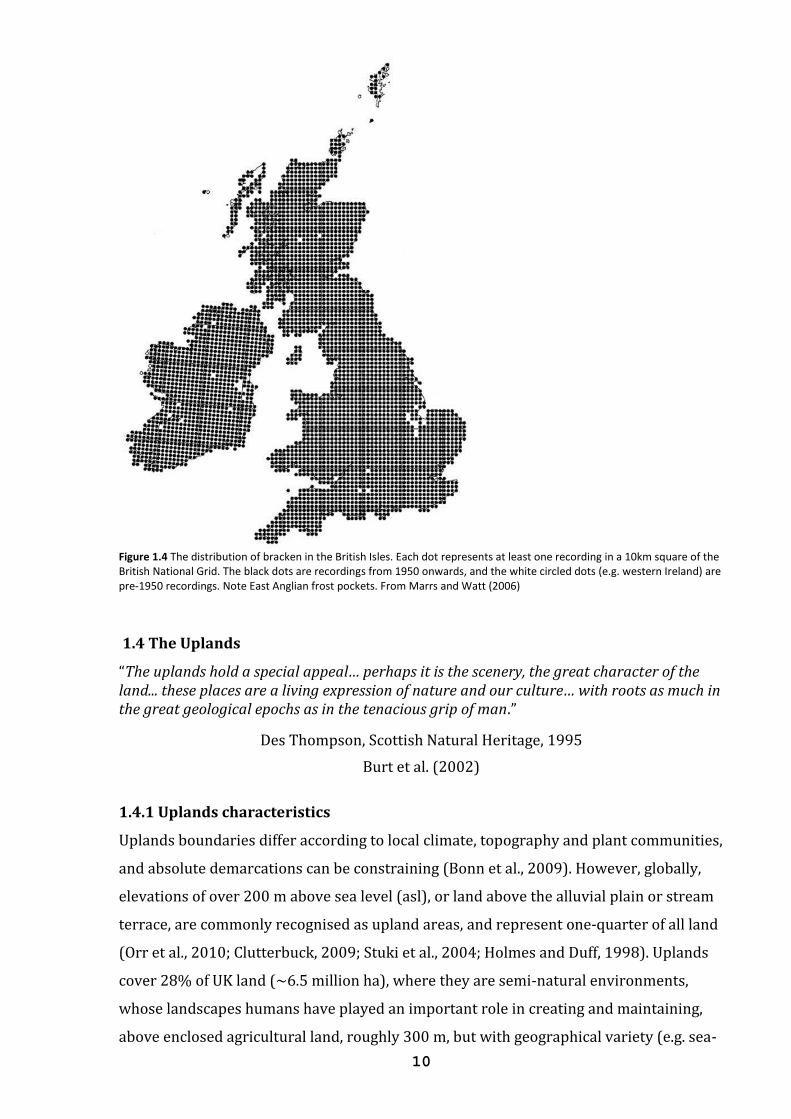
The northern fringes of the British Isles are above bracken’s latitudinal limit, and it is not
found in some East Anglian frost pockets, otherwise it has an almost ubiquitous
distribution up to its altitudinal limit (Figure 1.4). Temperature is regarded as an
important factor in distribution, and climate change warming may assist in extending
bracken’s range in the UK uplands (McMorrow et al., 2009; Marrs and Watt, 2006).
10
Figure 1.4 The distribution of bracken in the British Isles. Each dot represents at least one recording in a 10km square of the British National Grid. The black dots are recordings from 1950 onwards, and the white circled dots (e.g. western Ireland) are pre-1950 recordings. Note East Anglian frost pockets. From Marrs and Watt (2006)
1.4 The Uplands
“The uplands hold a special appeal… perhaps it is the scenery, the great character of the land... these places are a living expression of nature and our culture… with roots as much in the great geological epochs as in the tenacious grip of man.”
Des Thompson, Scottish Natural Heritage, 1995
Burt et al. (2002)
1.4.1 Uplands characteristics
Uplands boundaries differ according to local climate, topography and plant communities,
and absolute demarcations can be constraining (Bonn et al., 2009). However, globally,
elevations of over 200 m above sea level (asl), or land above the alluvial plain or stream
terrace, are commonly recognised as upland areas, and represent one-quarter of all land
(Orr et al., 2010; Clutterbuck, 2009; Stuki et al., 2004; Holmes and Duff, 1998). Uplands
cover 28% of UK land (~6.5 million ha), where they are semi-natural environments,
whose landscapes humans have played an important role in creating and maintaining,
above enclosed agricultural land, roughly 300 m, but with geographical variety (e.g. sea-
11
level in areas of northern Scotland), up to the montane zone, the ecological limit of trees,
approximately 600-750 m (Evans, 2009; JNCC, 2009).
However, there is a powerful connection between enclosure and less intensively farmed
uplands, and as a boundary the term ‘Less Favoured Areas’ (LFA) is used, introduced by
the European Union (EU) as a socio-economic designation for land naturally hindered
by, for example, harsh conditions, low soil fertility, abbreviated growing seasons,
inaccessibility, and remoteness, and as such LFAs correspond usefully with upland
ranges (Defra, 2011; Bonn et al., 2009). Agriculture, determined by climatic and abiotic
factors that affect plant growth, and grouse shooting, reliant upon renewing bird stocks,
function on the margins of economic viability (Dougill et al., 2006).
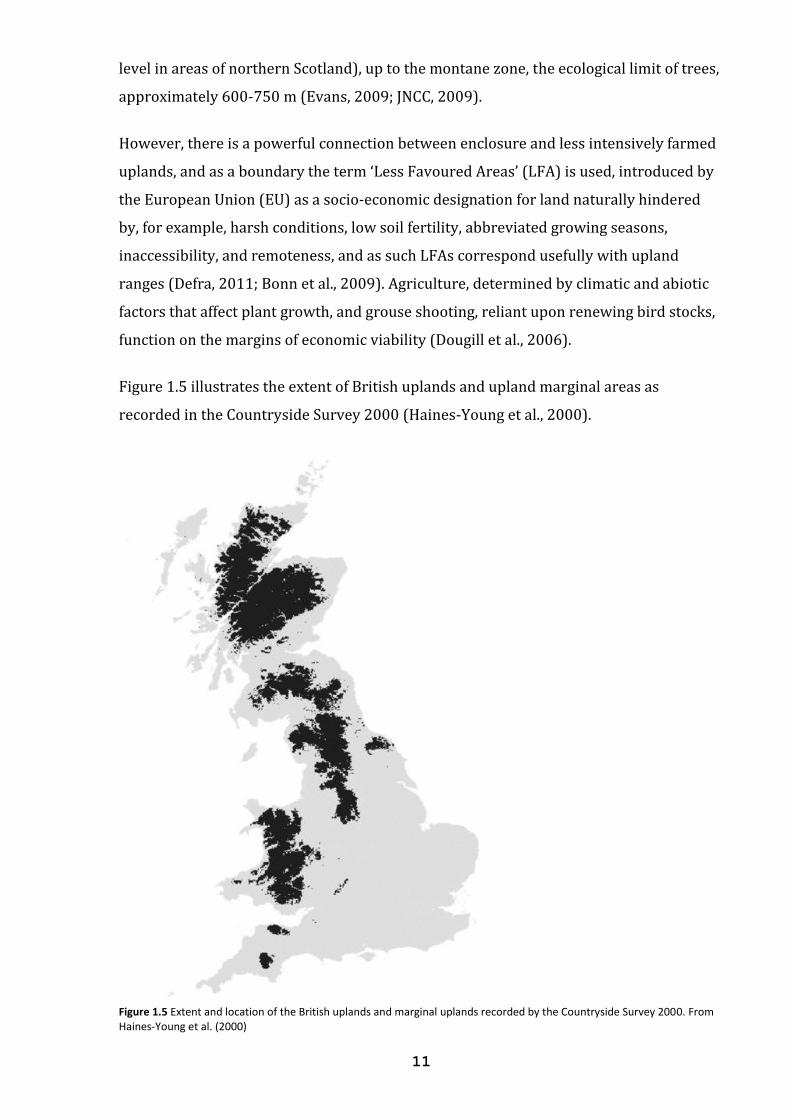
Figure 1.5 illustrates the extent of British uplands and upland marginal areas as
recorded in the Countryside Survey 2000 (Haines-Young et al., 2000).
Figure 1.5 Extent and location of the British uplands and marginal uplands recorded by the Countryside Survey 2000. From Haines-Young et al. (2000)
12
The JNCC (2009) list following habitats as present in UK uplands:
Dwarf shrub heath, dry to wet
Grassland, dry to wet
Moss and lichen heath
Flush and valley bogs
Blanket bogs
Crags, screes and boulder-fields
Springs, rills and flushes
Rivers
Lakes and tarns
The UK uplands contend with prevailing winds from the Atlantic ocean which impose an
oceanic temperate-humid climate characterised by cold conditions, wind and frost
exposure, excessive precipitation, humidity, persistent cloud cover with a corresponding
paucity in sunshine hours, and long-standing snow cover (Clutterbuck, 2009; Holden,
2009; Ratcliffe and Thompson, 1988). This has influenced the formation of rare and
unique habitats and floral assemblages, heritage landscapes, and ecosystem services of
national and international importance (Fontana et al., 2014; Clutterbuck, 2009; Reed et
al., 2009; Thompson et al., 1995). The services provided include the provision of food,
fuel (including renewable energies), timber, clean water supplies, flood mitigation,
carbon sequestration and climate mitigation, and tourism and recreation (Bonn et al.,
2009; Natural England, 2009a; Reed et al., 2009; Yallop and Clutterbuck, 2009, e.g. Table
1.3).
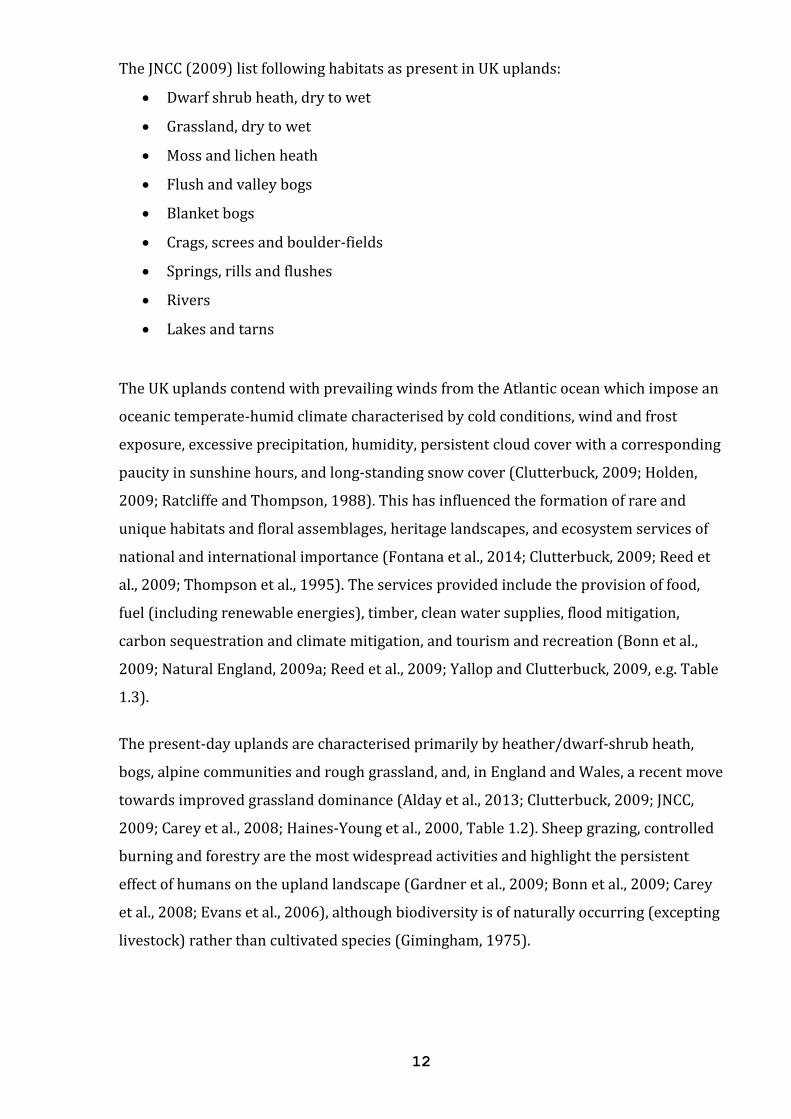
The present-day uplands are characterised primarily by heather/dwarf-shrub heath,
bogs, alpine communities and rough grassland, and, in England and Wales, a recent move
towards improved grassland dominance (Alday et al., 2013; Clutterbuck, 2009; JNCC,
2009; Carey et al., 2008; Haines-Young et al., 2000, Table 1.2). Sheep grazing, controlled
burning and forestry are the most widespread activities and highlight the persistent
effect of humans on the upland landscape (Gardner et al., 2009; Bonn et al., 2009; Carey
et al., 2008; Evans et al., 2006), although biodiversity is of naturally occurring (excepting
livestock) rather than cultivated species (Gimingham, 1975).
13
Table 1.2 Main upland habitats, recorded by the Countryside Survey 2000. From Haines-Young et al. (2000)
Upland habitat % GB upland % England and Wales upland
% Scotland upland
Bog 20.6 6.0 32.4 Dwarf shrub heath 19.1 16.1 21.6 Acid grassland 16.7 17.9 15.8 Improved grassland 14.2 28.1 2.9 Conifer woodland 10.7 5.8 14.7
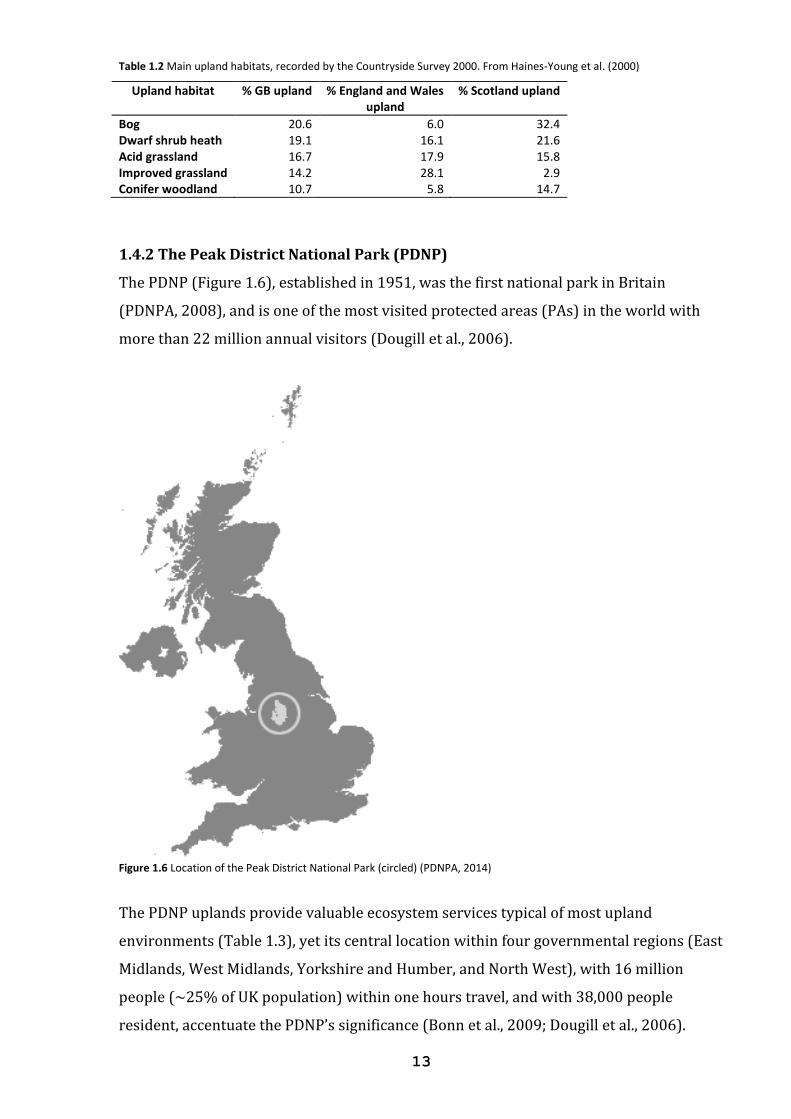
1.4.2 The Peak District National Park (PDNP)
The PDNP (Figure 1.6), established in 1951, was the first national park in Britain
(PDNPA, 2008), and is one of the most visited protected areas (PAs) in the world with
more than 22 million annual visitors (Dougill et al., 2006).
Figure 1.6 Location of the Peak District National Park (circled) (PDNPA, 2014)
The PDNP uplands provide valuable ecosystem services typical of most upland
environments (Table 1.3), yet its central location within four governmental regions (East
Midlands, West Midlands, Yorkshire and Humber, and North West), with 16 million
people (~25% of UK population) within one hours travel, and with 38,000 people
resident, accentuate the PDNP’s significance (Bonn et al., 2009; Dougill et al., 2006).
14
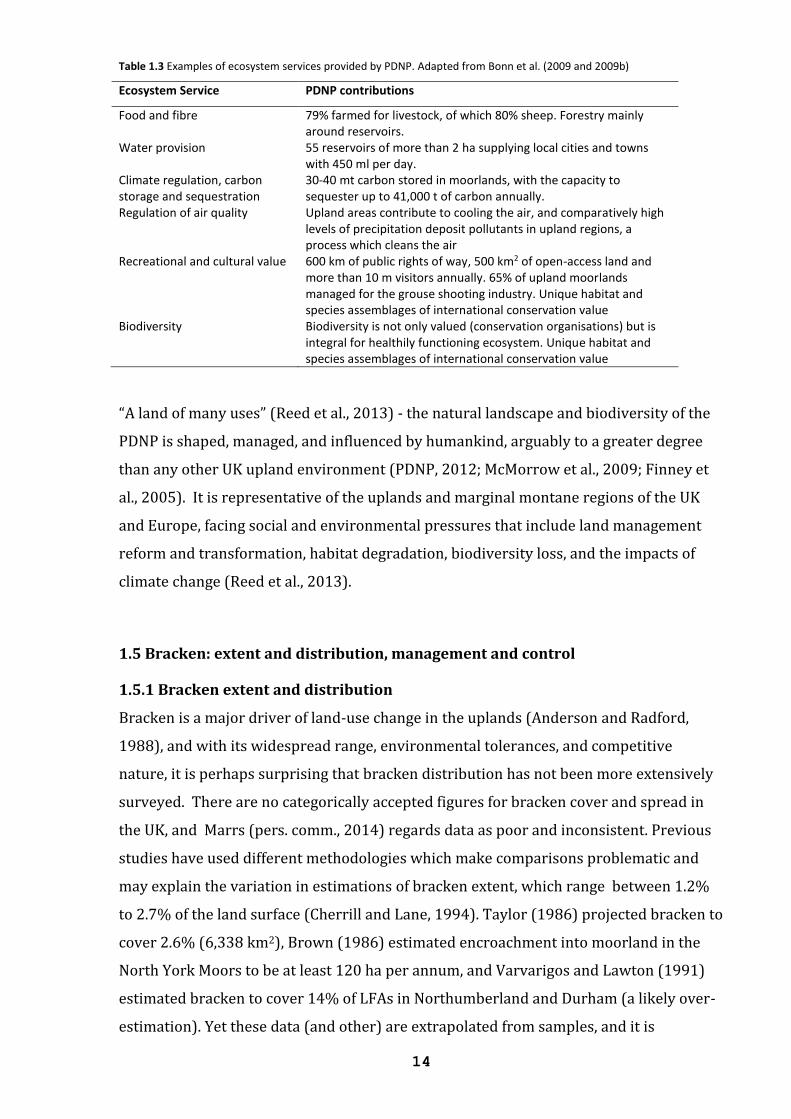
Table 1.3 Examples of ecosystem services provided by PDNP. Adapted from Bonn et al. (2009 and 2009b)
Ecosystem Service PDNP contributions
Food and fibre 79% farmed for livestock, of which 80% sheep. Forestry mainly around reservoirs.
Water provision 55 reservoirs of more than 2 ha supplying local cities and towns with 450 ml per day.
Climate regulation, carbon storage and sequestration
30-40 mt carbon stored in moorlands, with the capacity to sequester up to 41,000 t of carbon annually.
Regulation of air quality Upland areas contribute to cooling the air, and comparatively high levels of precipitation deposit pollutants in upland regions, a process which cleans the air
Recreational and cultural value 600 km of public rights of way, 500 km2 of open-access land and more than 10 m visitors annually. 65% of upland moorlands managed for the grouse shooting industry. Unique habitat and species assemblages of international conservation value
Biodiversity Biodiversity is not only valued (conservation organisations) but is integral for healthily functioning ecosystem. Unique habitat and species assemblages of international conservation value
“A land of many uses” (Reed et al., 2013) - the natural landscape and biodiversity of the
PDNP is shaped, managed, and influenced by humankind, arguably to a greater degree
than any other UK upland environment (PDNP, 2012; McMorrow et al., 2009; Finney et
al., 2005). It is representative of the uplands and marginal montane regions of the UK
and Europe, facing social and environmental pressures that include land management
reform and transformation, habitat degradation, biodiversity loss, and the impacts of
climate change (Reed et al., 2013).
1.5 Bracken: extent and distribution, management and control
1.5.1 Bracken extent and distribution
Bracken is a major driver of land-use change in the uplands (Anderson and Radford,
1988), and with its widespread range, environmental tolerances, and competitive
nature, it is perhaps surprising that bracken distribution has not been more extensively
surveyed. There are no categorically accepted figures for bracken cover and spread in
the UK, and Marrs (pers. comm., 2014) regards data as poor and inconsistent. Previous
studies have used different methodologies which make comparisons problematic and
may explain the variation in estimations of bracken extent, which range between 1.2%
to 2.7% of the land surface (Cherrill and Lane, 1994). Taylor (1986) projected bracken to
cover 2.6% (6,338 km2), Brown (1986) estimated encroachment into moorland in the
North York Moors to be at least 120 ha per annum, and Varvarigos and Lawton (1991)
estimated bracken to cover 14% of LFAs in Northumberland and Durham (a likely over-
estimation). Yet these data (and other) are extrapolated from samples, and it is
15
suggested uplands-derived estimations of spread may not be applicable elsewhere in the
UK. For example, Marrs and Hicks (1986) chronicled minimal increases (0.2% p.a.) of
cover at Lakenheath Warren, Norfolk over a 60 year period despite an absence of
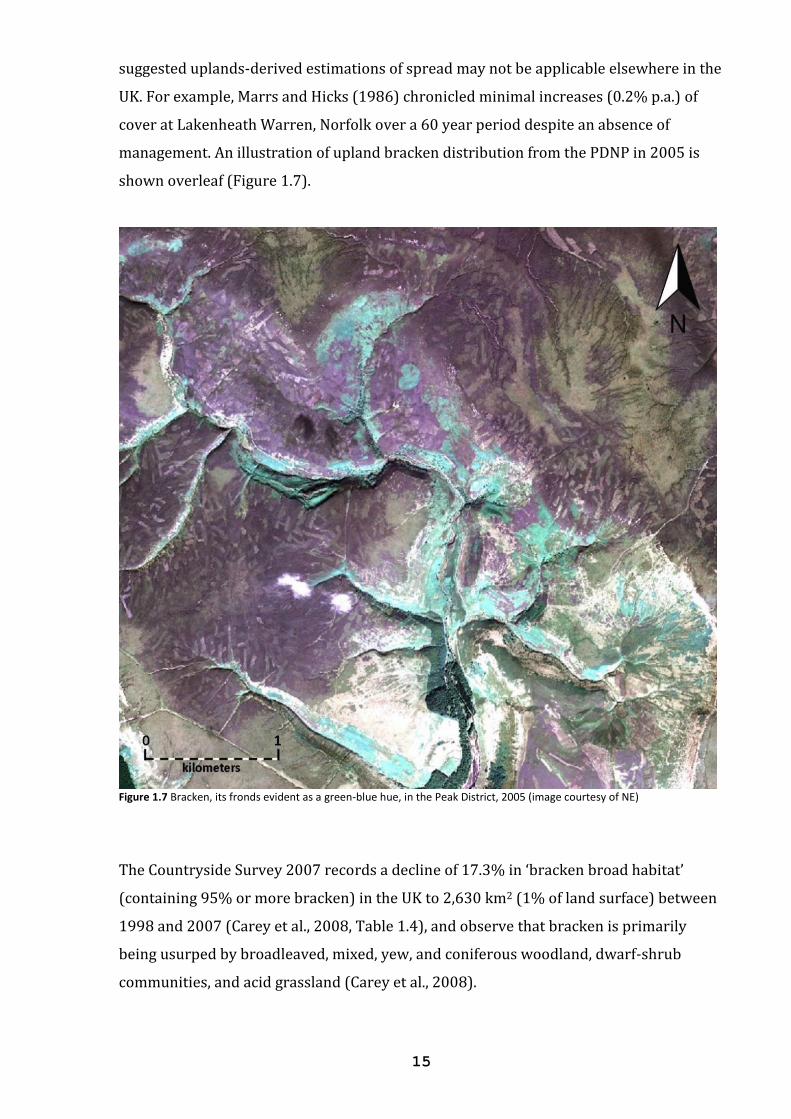
management. An illustration of upland bracken distribution from the PDNP in 2005 is
shown overleaf (Figure 1.7).
Figure 1.7 Bracken, its fronds evident as a green-blue hue, in the Peak District, 2005 (image courtesy of NE)
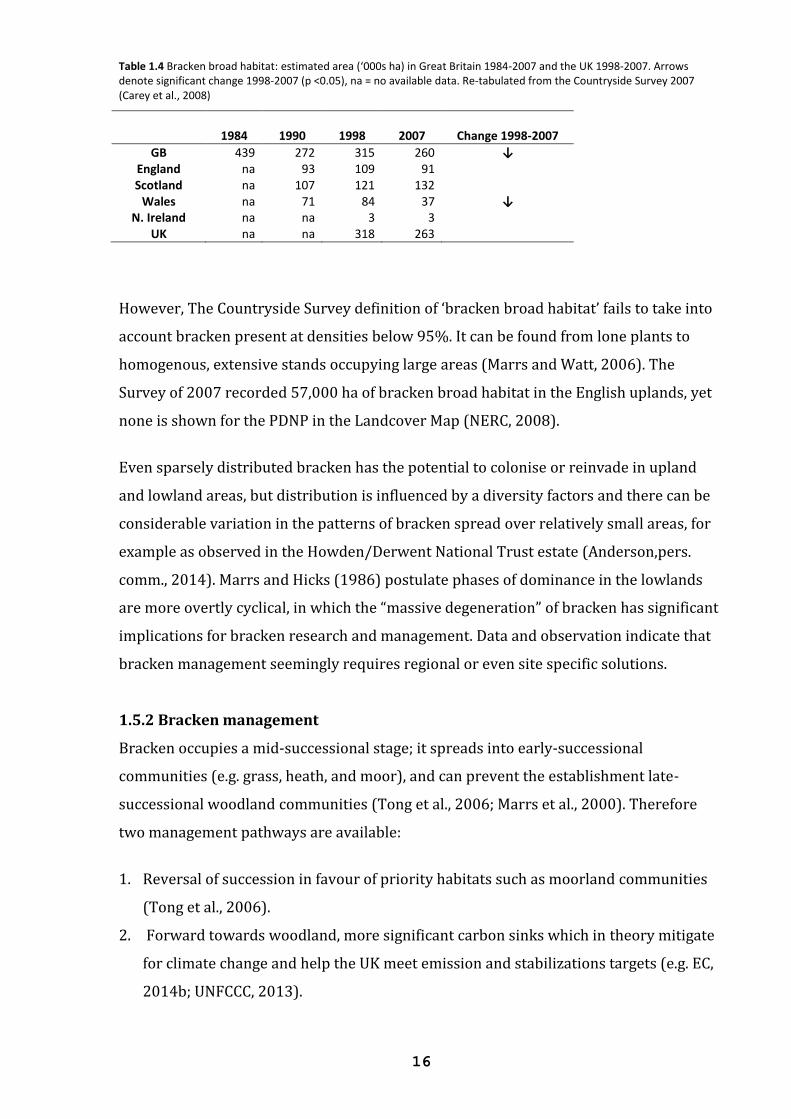
The Countryside Survey 2007 records a decline of 17.3% in ‘bracken broad habitat’
(containing 95% or more bracken) in the UK to 2,630 km2 (1% of land surface) between
1998 and 2007 (Carey et al., 2008, Table 1.4), and observe that bracken is primarily
being usurped by broadleaved, mixed, yew, and coniferous woodland, dwarf-shrub
communities, and acid grassland (Carey et al., 2008).
16
Table 1.4 Bracken broad habitat: estimated area (‘000s ha) in Great Britain 1984-2007 and the UK 1998-2007. Arrows denote significant change 1998-2007 (p <0.05), na = no available data. Re-tabulated from the Countryside Survey 2007 (Carey et al., 2008)
1984
1990
1998
2007
Change 1998-2007
GB 439 272 315 260 ↓ England na 93 109 91 Scotland na 107 121 132
Wales na 71 84 37 ↓ N. Ireland na na 3 3
UK na na 318 263
However, The Countryside Survey definition of ‘bracken broad habitat’ fails to take into
account bracken present at densities below 95%. It can be found from lone plants to
homogenous, extensive stands occupying large areas (Marrs and Watt, 2006). The
Survey of 2007 recorded 57,000 ha of bracken broad habitat in the English uplands, yet
none is shown for the PDNP in the Landcover Map (NERC, 2008).
Even sparsely distributed bracken has the potential to colonise or reinvade in upland
and lowland areas, but distribution is influenced by a diversity factors and there can be
considerable variation in the patterns of bracken spread over relatively small areas, for
example as observed in the Howden/Derwent National Trust estate (Anderson,pers.
comm., 2014). Marrs and Hicks (1986) postulate phases of dominance in the lowlands
are more overtly cyclical, in which the “massive degeneration” of bracken has significant
implications for bracken research and management. Data and observation indicate that
bracken management seemingly requires regional or even site specific solutions.
1.5.2 Bracken management
Bracken occupies a mid-successional stage; it spreads into early-successional
communities (e.g. grass, heath, and moor), and can prevent the establishment late-
successional woodland communities (Tong et al., 2006; Marrs et al., 2000). Therefore
two management pathways are available:
1. Reversal of succession in favour of priority habitats such as moorland communities
(Tong et al., 2006).
2. Forward towards woodland, more significant carbon sinks which in theory mitigate
for climate change and help the UK meet emission and stabilizations targets (e.g. EC,
2014b; UNFCCC, 2013).
17
Loss of upland habitats reduces plant diversity and decreases their capacity to provide
ecosystem services (Fontana et al., 2014). Restoration of moorland (through BAPs and
latterly Aichi Biodiversity Targets) is an International, European, and UK priority (JNCC,
2012), supported nationally by, for example, agri-environment and environmental
stewardship schemes (Natural England, 2009b), and restoration projects such as Moors
for the Future (MFP, 2008), the Moorland Regeneration Project (Moorland Association,
2002), and the Yorkshire Peat Partnership (NYMNPA, 2013). A policy option to maintain
and enhance moorland landscapes and conservation species was integral within 1987’s
Environmentally Sensitive Area (ESA) scheme (Natural England, 2014), and with ESA
funding bracken control increased hugely (Thomas, pers. comm., 2014).
The notional assumption is bracken control increases biodiversity, yet this depends
upon successful re-establishment of priority communities, like heather moorland, rather
than, for example, species-poor grassland (Maren et al., 2008; Pakeman et al., 1997;
Pakeman and Marrs, 1992). Effective restoration requires a programme for replacement
vegetation (Pakeman et al., 2008; Pienkowski et al., 1998), and an understanding of
bracken’s place in community succession (Marrs et al., 2000).
Bracken management requires the consideration of ecological factors. For example
reversal to moorland is difficult in soils enriched by bracken control (e.g. cutting,
burning), in which competitive or late-successional species will have an advantage
(Mitchell et al., 2000; Marrs, 1993). To suit communities such as heather that persist in
nutrient-poor podzols restoration needs to reduce soil nutrient content (Mitchell et al.,
2000; Hetherington and Anderson, 1998; Mitchell et al., 1997). However approaches
such as stripping topsoil and litter, adding or burning straw, and sowing nutrient-
extracting crops have often been unsuccessful, sometimes even increasing nutrient
levels (Marrs, 1985).
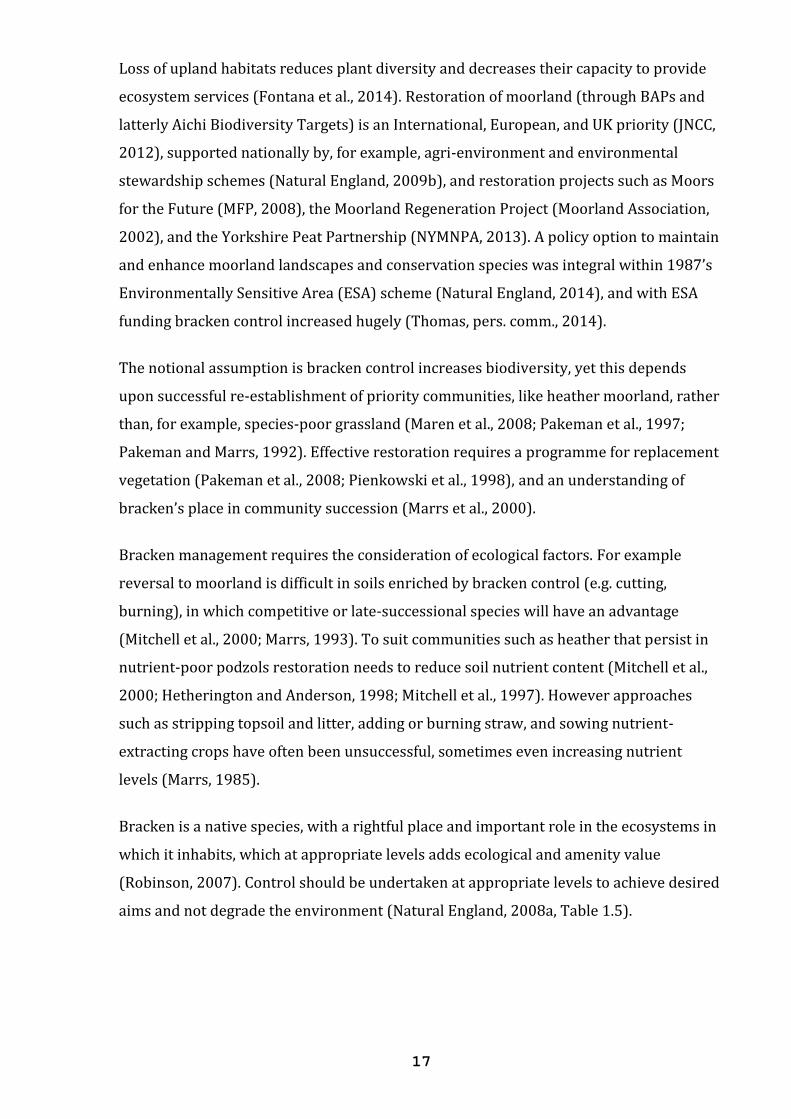
Bracken is a native species, with a rightful place and important role in the ecosystems in
which it inhabits, which at appropriate levels adds ecological and amenity value
(Robinson, 2007). Control should be undertaken at appropriate levels to achieve desired
aims and not degrade the environment (Natural England, 2008a, Table 1.5).
18
Table 1.5 Management options for bracken control (Natural England, 2008)
Management options
Situation
No control On steep slopes, heavily grazed areas, where regeneration of other habitats would be difficult or where wildlife considerations important
Conservation management
Where it is desirable to maintain low intensity or patchy cover for species of conservation value – limited and selective control
Limited control Where the aim is to reduce bracken cover or severely limit vigour and spread, but not eliminate
Eradication Where bracken is to be replaced with other vegetation
1.5.3 Bracken control
“There is no quick fix!”
Dr R.C. Robinson, IATG (2007)
Bracken’s morphology and life-traits make complete eradication extremely difficult,
which have resulted in extensive studies on its control (e.g. Alday and Marrs, 2014; Le
Duc et al., 2007; Pakeman et al., 2007; Robinson, 2007; Pienkowski et al., 1998; Lawton,
1988, and 1986; Williams and Foley, 1975). In essence there are two management
options; that of no control or a commitment to long-term, wide-ranging control
(Pakeman and Marrs, 1992). The first option risks widespread invasion, biodiversity loss
and diminished ecosystem heterogeneity, the second option is expensive, time-
consuming, dependent upon access, requires assiduous and thorough implementation,
yet still is not guaranteed to be successful (Natural England, 2008; Le Duc et al., 2007;
Pakeman and Marrs, 1992). Control involves long-term strategies, usually mechanical
and/or chemical, to achieve management aims which generally fall into 4 categories:
1. Low-level equilibrium grazing: cattle and horses ensure bracken kept in-check by
trampling, a sustainable, long-term option (note that in most upland areas cattle have
been replaced by sheep that are ineffective).
2. Containment: treatment of peripheries and boundaries to halt encroachment into
areas free of bracken.
3. Releasing: a forestry term denoting temporary bracken control during which other
flora can be established, such as saplings.
4. Clearance: eradication of bracken to free-up land for an alternative preferred
vegetation (Robinson, 2007).
The most permanent mode of eradication is by ploughing, however this is unsuitable and
inappropriate for most upland areas (Robinson, 2007). Here the best single method of
19
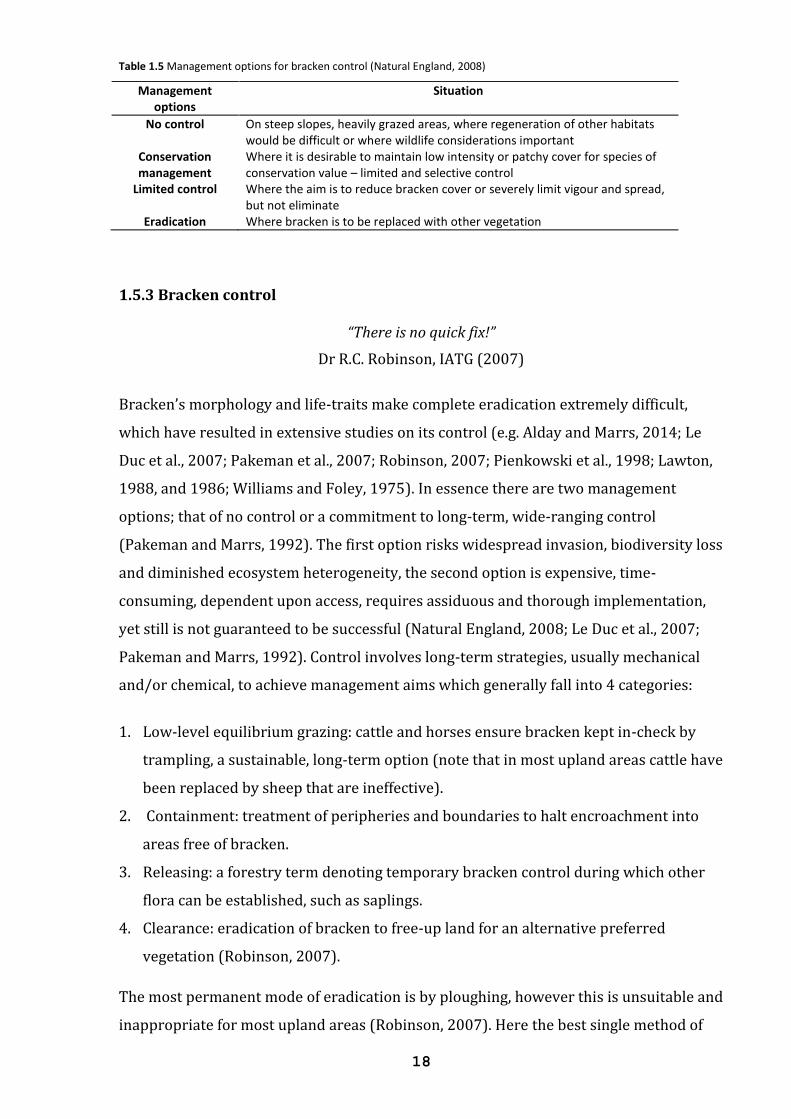
control by spraying asulam, a narrow-spectrum herbicide, onto bracken fronds
(Pakeman, 2012; Maren et al., 2008; Pakeman et al., 2007; Robinson et al., 2000, Figure
1.8). The combination of spraying and cutting, where access permits, is an effective
control (Marrs et al., 2000; Pakeman et al., 1999; Lowday, 1986).
Figure 1.8 The effects of control on the mean position (m) of the bracken front relative to study start in 1993 at Levisham Moor, North York Moors. Redrawn from Pakeman et al. (2007)
The spraying of asulam in the UK has remained relatively constant since 1990 at about
70km2 per year, and without this bracken areal extent has been projected to be 50%
higher (Pakeman, 2012). However, a European Union-wide ban came into force in 2013
making possession of asulam illegal, although Emergency Authorisations were granted
in the UK for the 2013 and 2014 seasons (Bracken Control, 2014).
Pakeman (2012) claims that without asulam spraying “the long-term consequences for
farming and conservation in the UK uplands are serious as control by aerial spraying is
the only option in many areas.” Asulam is “the only herbicide that can be used for
selective bracken control” until a superior replacement can be created Marrs (pers.
comm., 2013; 2014). Alternative herbicides such as broader-spectrum glyphosates are
viewed by Anderson (pers. comm., 2014) as poor alternatives. Their usual use is as
precise ‘follow-up’ sprays and they cannot (or should not) be used in the ‘gardening
phase’ to target small fronds amongst and beneath heather due to their sweeping
toxicity (Robinson, 2001). Wide-scale application is potentially much more harmful to
biodiversity.
20
1.6 Study rationale
“It is increasingly clear that a business as usual approach will be less and less able to address the challenges of the future and that we urgently need to consider how best to sustain the value of the uplands.”
Poul Christensen, Chairman of Natural England Natural England (2009a)
Originally part of open woodland communities, bracken has taken advantage of land-
cover changes to expand its range (Cox, 2007; Marrs et al., 2000; Watt, 1976), with
ecological, economic and cultural costs (e.g. Robinson, 2007; Pakeman and Marrs, 1992).
However, bracken extent is uncertain and rates and patterns of spread are unpredictable
(Pakeman et al., 1995), which, when aligned with changing agricultural and management
practices, and the potential impacts of climate change, intimate that a study of temporal
bracken distribution is timely. This study assesses change among variables of altitude,
aspect, and slope to determine whether bracken has encroached into habitats of greater
conservation and economic value during the study period. The study also attempts to
appraise the influences of climate change on past and future bracken distribution,
following on from unpublished findings (McAlpine, 2013).
1.6.1 Bracken spread in the PDNP
In the PDNP bracken is considered “a serious problem” (Tong et al., 2006). Its historical
distribution in the region was on the steeper slopes and sheltered depressions in the
more lowland areas, however by 1907 bracken control was necessary for grouse
management (Anderson and Radford, 1988), and Moss (1913) recorded spread into
upland heather moorland. By the 1980s it was estimated 6% (~30 km2) of moorland was
bracken-dominant (Anderson and Radford, 1988), a figure that has remained relatively
constant but with considerable variation in the patterns of spread and retreat
determined by climatic and edaphic conditions (Anderson, pers. comm., 2014). In 1990 it
was estimated bracken covered 2.5% of PDNP (35 km2) (Pakeman et al., 1996).
21
1.6.2 Climate change
“Cumulative emissions of CO2 largely determine global mean surface warming by the late 21st century and beyond. Most aspects of climate change will persist for many centuries even if emissions of CO2 are stopped. This represents a substantial multi-century climate
change commitment created by past, present and future emissions of CO2.”
Intergovernmental Panel on Climate Change (IPCC, 2013)
Hotter summers and warmer winters are predicted for the UK, with altered precipitation
patterns, extended summer droughts, increased winter precipitation, and more frequent
and intense extreme weather events (IPCC, 2013; Albert et al., 2012; McMorrow et al.,
2009; Jentsch et al., 2007). A warming climate presents opportunities for invasive
species, pests and diseases to extend their ranges which jeopardize more specialised
species (IPCC, 2013; Bishop, 2012; Stafford-Smith et al., 2012). This can result in
homogenised ecosystems of less conservation value, decreased long-term resilience, and
which provision fewer ecosystem services (Albert et al., 2012; Barnosky et al., 2012;
Ross et al., 2012; Strayer and Dudgeon, 2010).
1.6.2.1 Climate change and the uplands
Future climate projections for the uplands are very difficult due to highly diverse and
localised climatic conditions (Orr et al., 2008). Nonetheless temperatures are recorded
to be rising at a faster rate than lowlands (House et al., 2010; Burt and Holden, 2010; Orr
et al., 2008), notably winter minimum temperatures (Burt and Holden, 2010). By the
2050s ‘heatwave’ summers like 1990 and 1995 are expected once in every three years,
and summer rainfall will 37% less than present (Hulme et al., 2002). The PDNP
currently receives around 400 mm of summer rainfall, and decreases of 10% by 2020,
and 23-45% by 2080 are projected. In winter, during which there is usually more
precipitation, precipitation is projected to increase by 12-23% by 2080, with 50-90%
less as snowfall (McMorrow et al., 2009).
Clark et al. (2010) suggest rainfall patterns and growing season length are the limiting
climatic variables which determine the distribution of upland habitats and soils. Climate
change is likely to transform upland habitats into something more characteristic of the
lowlands, resulting in the loss of stored carbon, notably in peat bogs (Billett et al., 2010),
and other ecosystem services such as water purification (Cornell, 2010). Eastern English
uplands like the PDNP are considered particularly vulnerable in all but the highest places
(Clark et al., 2010).
22
Upland species adapted to harsh environments are more threatened by climate change
impacts (Callaghan et al., 1992). These unique and important ecosystems face increasing
isolation and threats from lowland ecosystems (IPCC, 2013; Albert et al., 2012; House et
al., 2010; Hickling et al., 2006). Environmentally sensitive, specialist species constrained
to higher elevations, in shrinking refuges, are suggested to act as sentinels to impacts
which may materialise at lower altitudes (Lenoir et al., 2008; Nogues-Bravo et al, 2007;
Hickling et al., 2006; Beniston, 2003). Therefore it is important to understand the drivers
and impacts of climate change (such as the effects on bracken distribution) so that
adaptation and mitigation responses can be implemented for both upland and lowland
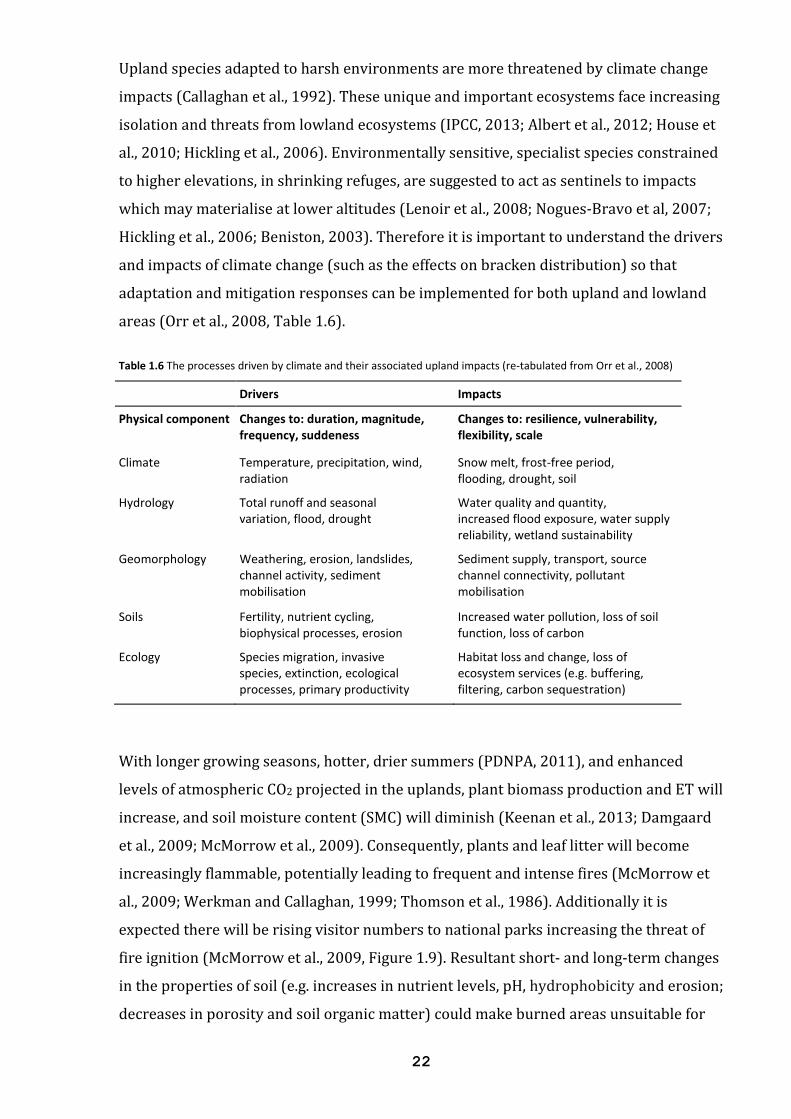
areas (Orr et al., 2008, Table 1.6).
Table 1.6 The processes driven by climate and their associated upland impacts (re-tabulated from Orr et al., 2008)
Drivers Impacts
Physical component Changes to: duration, magnitude, frequency, suddeness
Changes to: resilience, vulnerability, flexibility, scale
Climate Temperature, precipitation, wind, radiation
Snow melt, frost-free period, flooding, drought, soil
Hydrology Total runoff and seasonal variation, flood, drought
Water quality and quantity, increased flood exposure, water supply reliability, wetland sustainability
Geomorphology Weathering, erosion, landslides, channel activity, sediment mobilisation
Sediment supply, transport, source channel connectivity, pollutant mobilisation
Soils Fertility, nutrient cycling, biophysical processes, erosion
Increased water pollution, loss of soil function, loss of carbon
Ecology Species migration, invasive species, extinction, ecological processes, primary productivity
Habitat loss and change, loss of ecosystem services (e.g. buffering, filtering, carbon sequestration)
With longer growing seasons, hotter, drier summers (PDNPA, 2011), and enhanced
levels of atmospheric CO2 projected in the uplands, plant biomass production and ET will
increase, and soil moisture content (SMC) will diminish (Keenan et al., 2013; Damgaard
et al., 2009; McMorrow et al., 2009). Consequently, plants and leaf litter will become
increasingly flammable, potentially leading to frequent and intense fires (McMorrow et
al., 2009; Werkman and Callaghan, 1999; Thomson et al., 1986). Additionally it is
expected there will be rising visitor numbers to national parks increasing the threat of
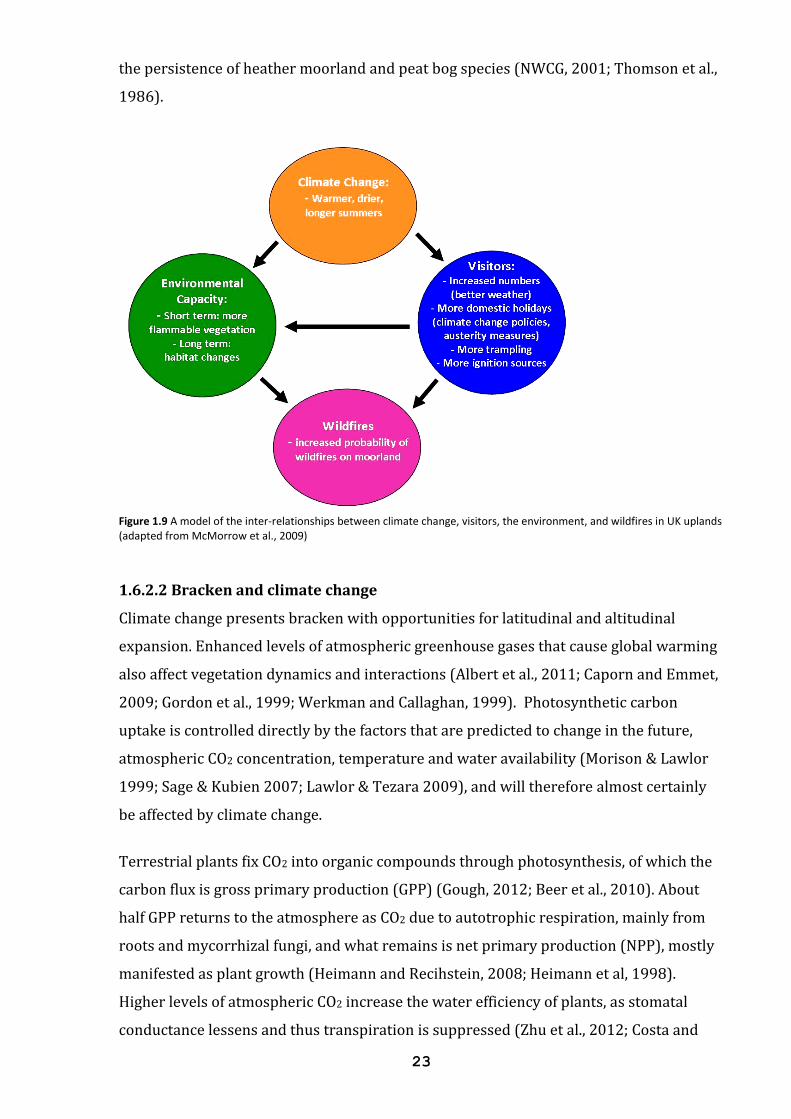
fire ignition (McMorrow et al., 2009, Figure 1.9). Resultant short- and long-term changes
in the properties of soil (e.g. increases in nutrient levels, pH, hydrophobicity and erosion;
decreases in porosity and soil organic matter) could make burned areas unsuitable for
23
the persistence of heather moorland and peat bog species (NWCG, 2001; Thomson et al.,
1986).
Figure 1.9 A model of the inter-relationships between climate change, visitors, the environment, and wildfires in UK uplands (adapted from McMorrow et al., 2009)
1.6.2.2 Bracken and climate change
Climate change presents bracken with opportunities for latitudinal and altitudinal
expansion. Enhanced levels of atmospheric greenhouse gases that cause global warming
also affect vegetation dynamics and interactions (Albert et al., 2011; Caporn and Emmet,
2009; Gordon et al., 1999; Werkman and Callaghan, 1999). Photosynthetic carbon
uptake is controlled directly by the factors that are predicted to change in the future,
atmospheric CO2 concentration, temperature and water availability (Morison & Lawlor
1999; Sage & Kubien 2007; Lawlor & Tezara 2009), and will therefore almost certainly
be affected by climate change.
Terrestrial plants fix CO2 into organic compounds through photosynthesis, of which the
carbon flux is gross primary production (GPP) (Gough, 2012; Beer et al., 2010). About
half GPP returns to the atmosphere as CO2 due to autotrophic respiration, mainly from
roots and mycorrhizal fungi, and what remains is net primary production (NPP), mostly
manifested as plant growth (Heimann and Recihstein, 2008; Heimann et al, 1998).
Higher levels of atmospheric CO2 increase the water efficiency of plants, as stomatal
conductance lessens and thus transpiration is suppressed (Zhu et al., 2012; Costa and
24
Foley, 2000), therefore increasing NPP. Increases in CO2 will potentially aid bracken
spread, but are considered less influential than rising temperatures (Pakeman and
Marrs, 1996), and water and nutrient availability (Albert et al., 2011, Reich et al., 2006;
Caporn et al., 1999), although there exists considerable uncertainty as ecosystem
responses are extremely complex (Albert et al., 2011).
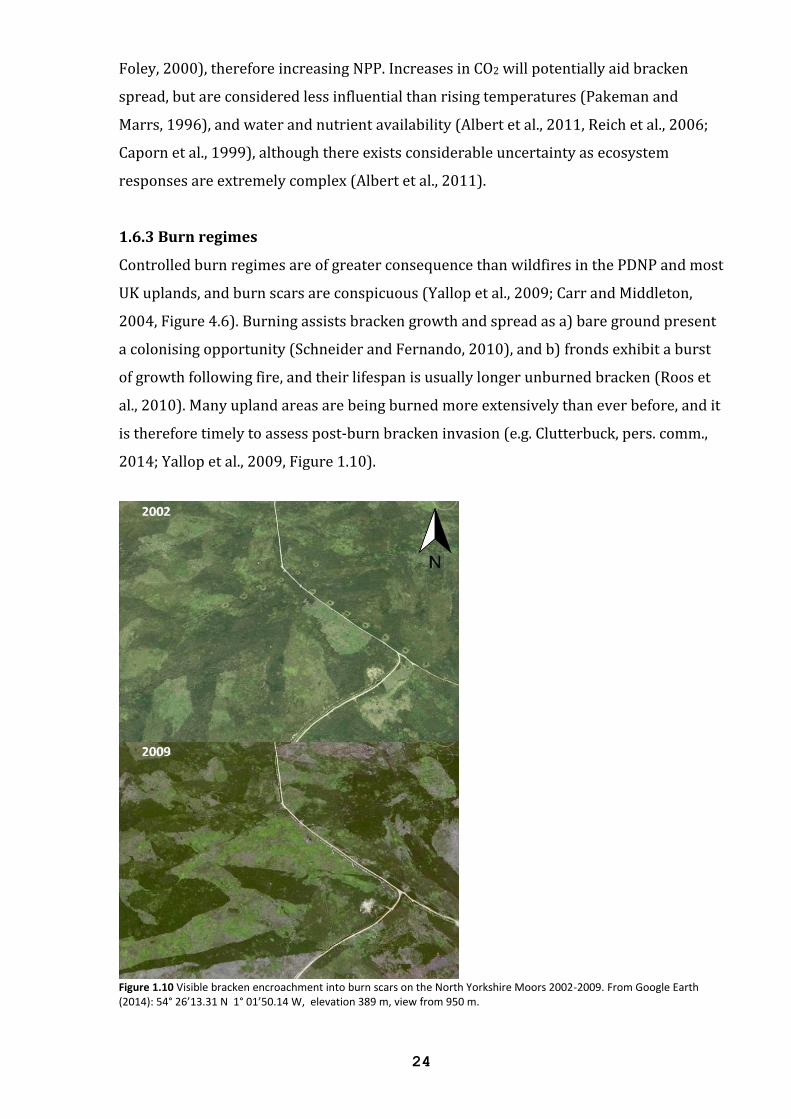
1.6.3 Burn regimes
Controlled burn regimes are of greater consequence than wildfires in the PDNP and most
UK uplands, and burn scars are conspicuous (Yallop et al., 2009; Carr and Middleton,
2004, Figure 4.6). Burning assists bracken growth and spread as a) bare ground present
a colonising opportunity (Schneider and Fernando, 2010), and b) fronds exhibit a burst
of growth following fire, and their lifespan is usually longer unburned bracken (Roos et
al., 2010). Many upland areas are being burned more extensively than ever before, and it
is therefore timely to assess post-burn bracken invasion (e.g. Clutterbuck, pers. comm.,
2014; Yallop et al., 2009, Figure 1.10).
Figure 1.10 Visible bracken encroachment into burn scars on the North Yorkshire Moors 2002-2009. From Google Earth (2014): 54° 26’13.31 N 1° 01’50.14 W, elevation 389 m, view from 950 m.
25
1.7 Summary of study intentions
Historic bracken cover is mapped from available aerial imagery from the 1960s and
2005 in the PDNP to assess bracken extent and distribution with the intent to contribute
knowledge, especially the gaps regarding distributional data, and to answer the
following questions:
Has bracken cover changed in the PDNP?
If yes, how and where has it changed?
Is it possible to determine if climate has had an impact on any change identified?
26
2. Method
2.1 Introduction
In this study bracken extent was mapped for the years 1966, 1968 and 1971 (henceforth
the 1960s), contingent upon the availability of aerial imagery, and the ability to map
bracken cover with confidence, and the year 2005 (the most recent available aerial
imagery). The study assessed and compared bracken distribution during the periods in
order to distinguish patterns of change, and evaluate the importance of elevation, slope,
and aspect, with considerations for the impacts of climate change, historically and in the
future (historical climate data for PDNP spanning the study period were analysed), and
land management practices (see Discussion). Furthermore an estimate was made of
modern bracken extent and patterns of distribution in the PDNP based on the 2005
imagery.
This chapter explains the methods used and the following are described:
Peak District landscape characteristics and climate
Site selection
Aerial imagery
Orthocorrection in ERDAS Imagine 2013 and georeferencing in ArcGIS 10.1
Geographic Information Systems (GIS)
Mapping bracken in ArcGIS 10.0 and 10.1
Statistical analysis
2.2 The study area – the Peak District National Park
The PDNP covers 1,438 km2 and contains 509 km2 of upland moorland (PDNP, 2008).
The most extensive stands of bracken are found above enclosed farming in the Dark
Peak upland areas (Thomas, pers. comm., 2012; Anderson and Radford, 1988, Figure
2.1).
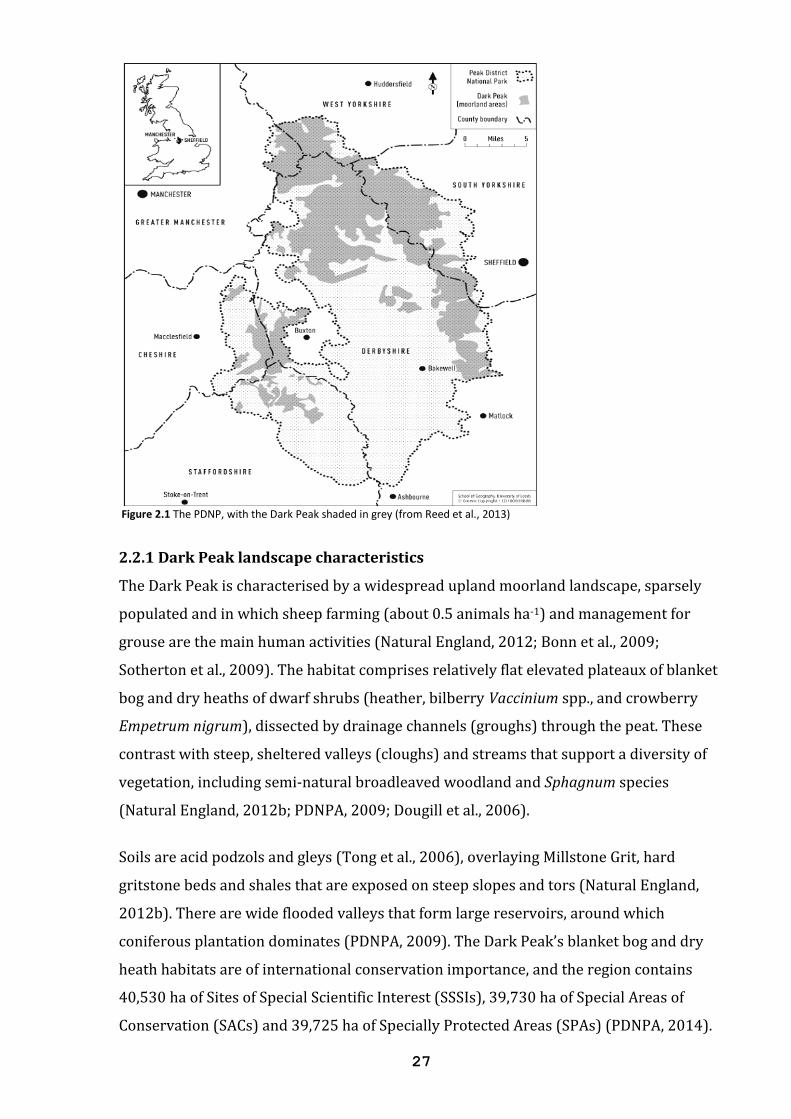
27
Figure 2.1 The PDNP, with the Dark Peak shaded in grey (from Reed et al., 2013)
2.2.1 Dark Peak landscape characteristics
The Dark Peak is characterised by a widespread upland moorland landscape, sparsely
populated and in which sheep farming (about 0.5 animals ha-1) and management for
grouse are the main human activities (Natural England, 2012; Bonn et al., 2009;
Sotherton et al., 2009). The habitat comprises relatively flat elevated plateaux of blanket
bog and dry heaths of dwarf shrubs (heather, bilberry Vaccinium spp., and crowberry
Empetrum nigrum), dissected by drainage channels (groughs) through the peat. These
contrast with steep, sheltered valleys (cloughs) and streams that support a diversity of
vegetation, including semi-natural broadleaved woodland and Sphagnum species
(Natural England, 2012b; PDNPA, 2009; Dougill et al., 2006).
Soils are acid podzols and gleys (Tong et al., 2006), overlaying Millstone Grit, hard
gritstone beds and shales that are exposed on steep slopes and tors (Natural England,
2012b). There are wide flooded valleys that form large reservoirs, around which
coniferous plantation dominates (PDNPA, 2009). The Dark Peak’s blanket bog and dry
heath habitats are of international conservation importance, and the region contains
40,530 ha of Sites of Special Scientific Interest (SSSIs), 39,730 ha of Special Areas of
Conservation (SACs) and 39,725 ha of Specially Protected Areas (SPAs) (PDNPA, 2014).
28
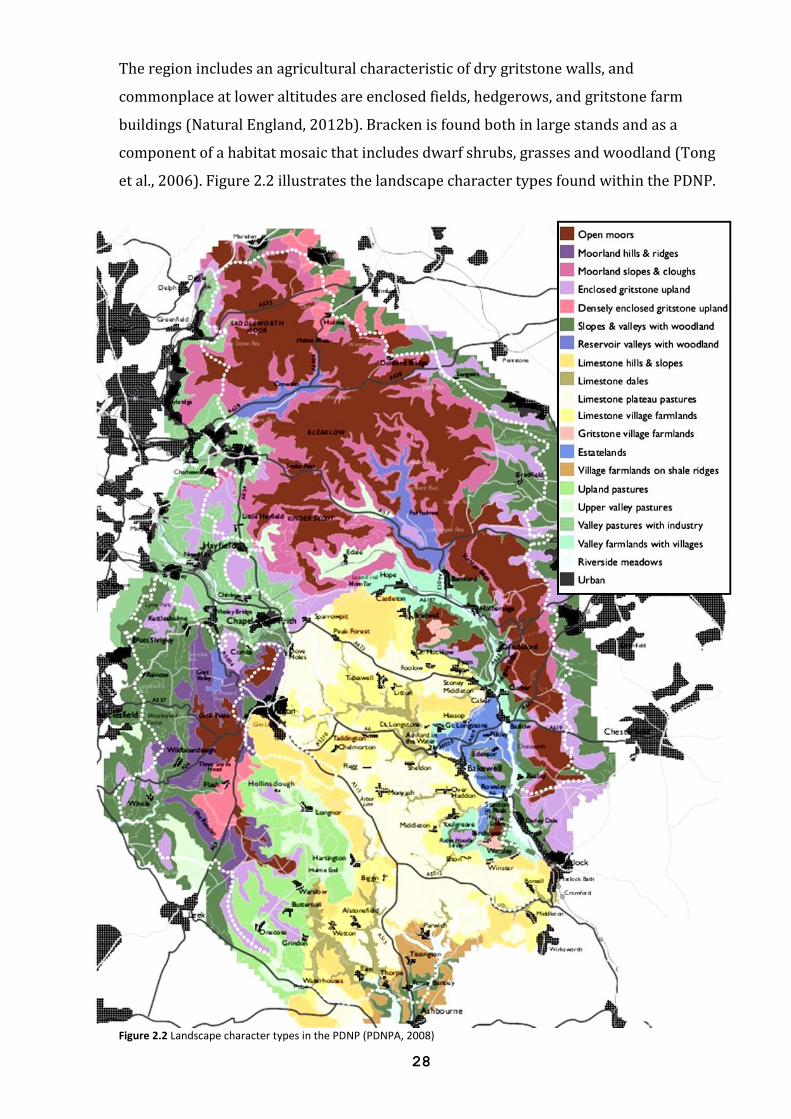
The region includes an agricultural characteristic of dry gritstone walls, and
commonplace at lower altitudes are enclosed fields, hedgerows, and gritstone farm
buildings (Natural England, 2012b). Bracken is found both in large stands and as a
component of a habitat mosaic that includes dwarf shrubs, grasses and woodland (Tong
et al., 2006). Figure 2.2 illustrates the landscape character types found within the PDNP.
Figure 2.2 Landscape character types in the PDNP (PDNPA, 2008)
29
2.2.2 Climate
The mean annual precipitation in the study area is 1050mm (Tong et al., 2006), and the
mean annual temperature from 1961-1990 was 8.20C, which from 1991-2003 rose to
8.90C (PDNPA, 2004). The Peak District has more rain, colder temperatures and fewer
hours of sunshine than the average for England and Wales, although these disparities
have recently become smaller (Caporn and Emmett, 2009; PDNPA, 2004, appendix ii).
However, within the Park exist local variations and micro-climates, and the northern
upland areas tend to be colder and wetter than the south and east (PDNPA, 2004).
Albertson et al. (2011) report no significant recent climatic trends in the PDNP, and
claim “the weather in the Peak District [has been] stationary” since 1976, apparently
contradicting findings in other studies (e.g. PDNPA, 2011; Caporn and Emmett, 2009;
Clutterbuck, 2009).
2.3 Site Selection
The selection of sites in PDNP was random in order to avoid bias (Ennos, 2012).
Originally this was achieved by delineating the study area using 1 km2 ordnance survey
(O/S) grids which prevents manipulation and is an accepted method (e.g. Birnie et al.,
2000; Pakeman et al., 1996). 75 1 km2 O/S grids - equating to approximately 5% of the
national park and thus enabling worthwhile estimations of bracken extent (Loveland et
al., 2002) - were randomly generated by R 3.1.1, “a system for statistical computation
and graphics” (Hornik, 2014).
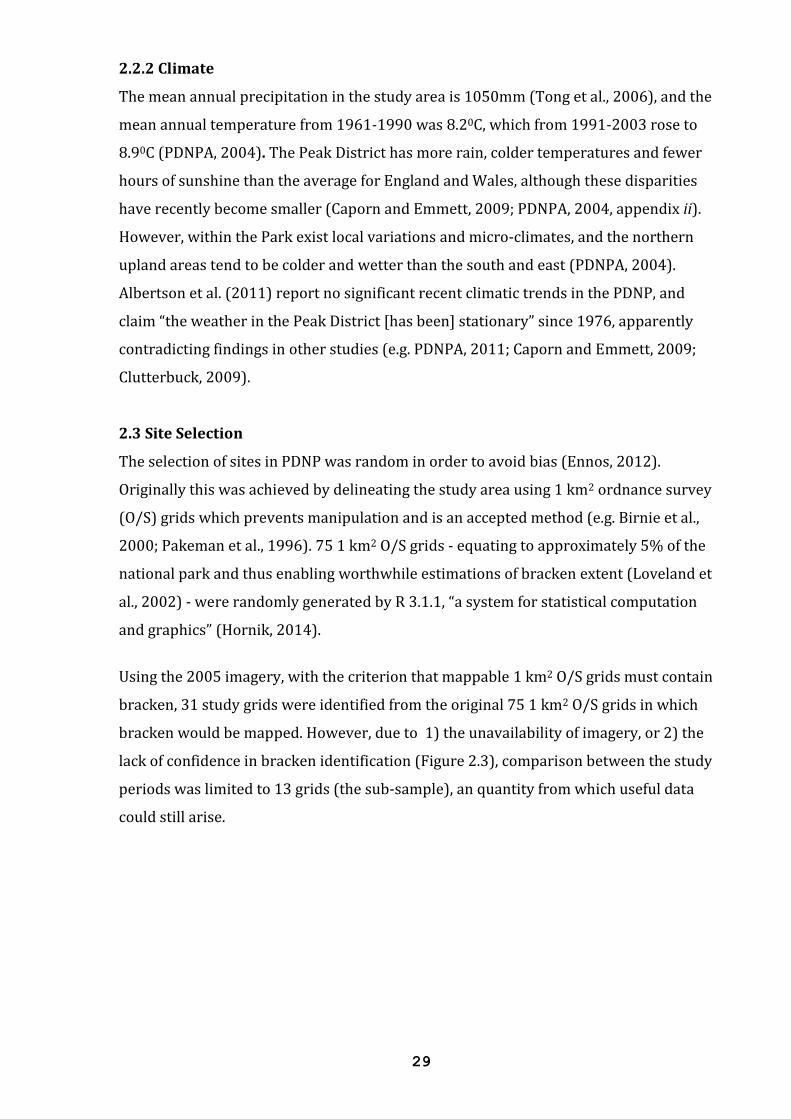
Using the 2005 imagery, with the criterion that mappable 1 km2 O/S grids must contain
bracken, 31 study grids were identified from the original 75 1 km2 O/S grids in which
bracken would be mapped. However, due to 1) the unavailability of imagery, or 2) the
lack of confidence in bracken identification (Figure 2.3), comparison between the study
periods was limited to 13 grids (the sub-sample), an quantity from which useful data
could still arise.
30
Figure 2.3 An illustration of the problem of identifying bracken with confidence in the 1960s imagery: a) 1960s image with mapping for 2005 overlaid, b) the 1960s image in which bracken cannot be confidently identified, and c) 2005 imagery in which bracken was mapped with confidence
31
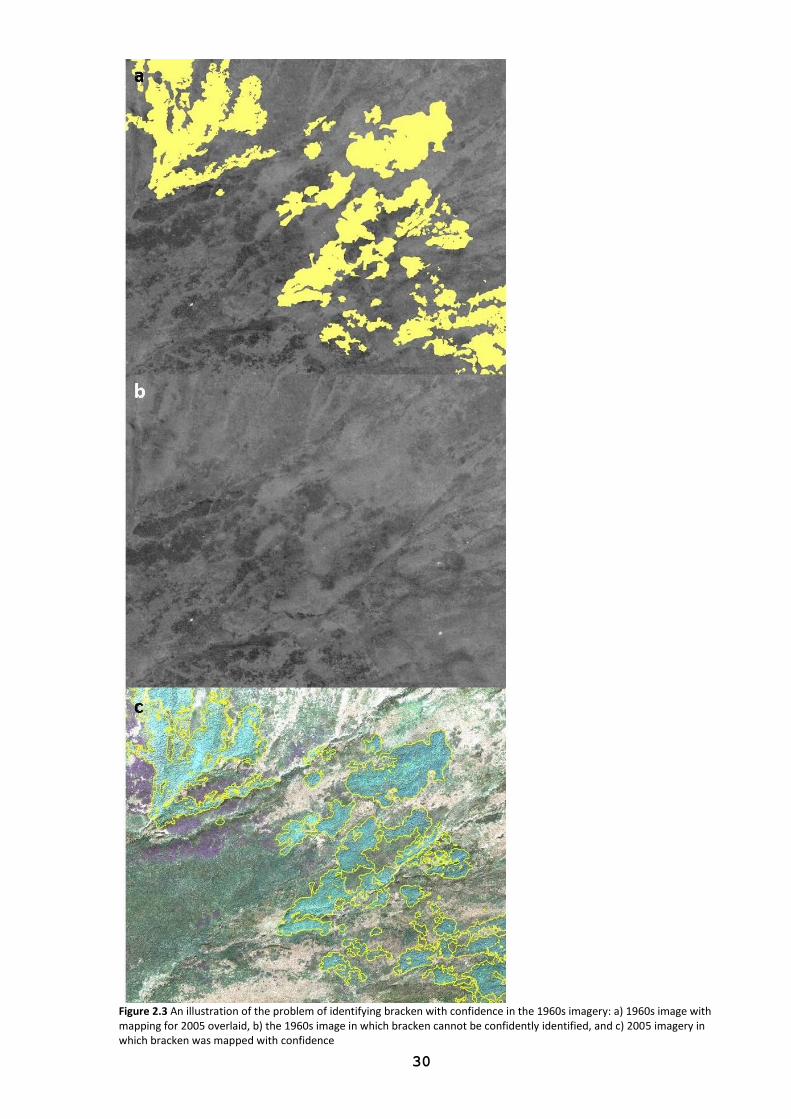
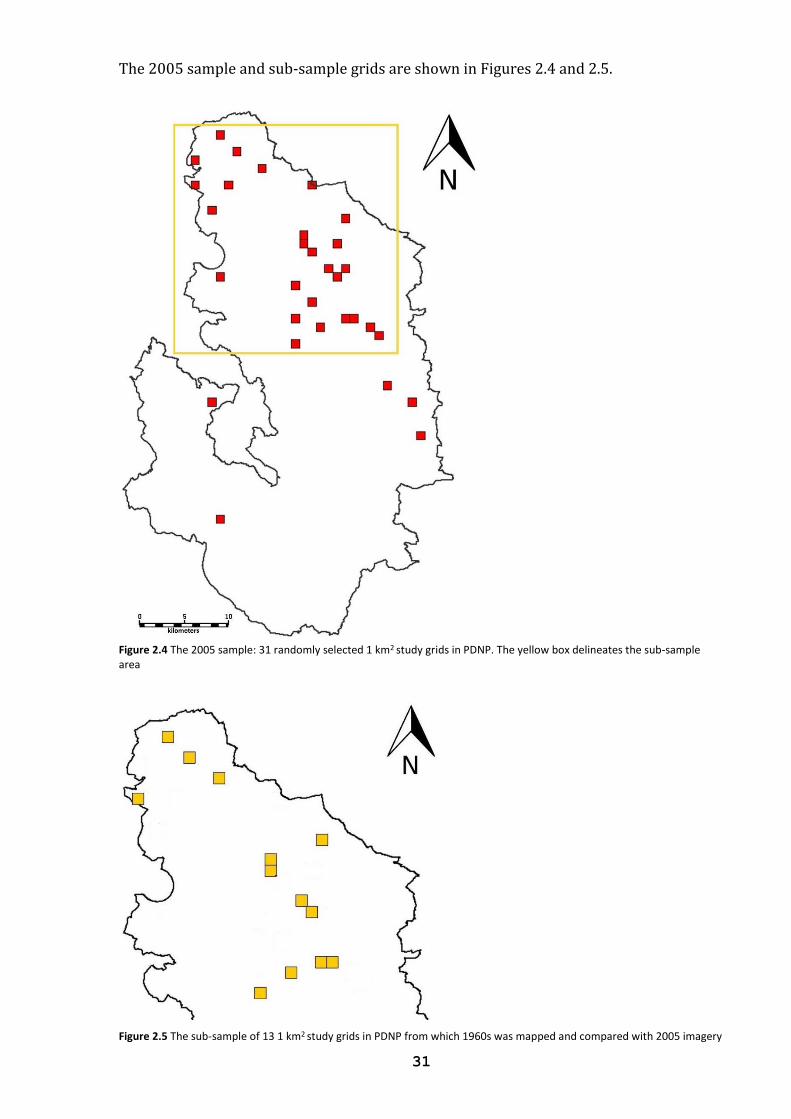
The 2005 sample and sub-sample grids are shown in Figures 2.4 and 2.5.
Figure 2.4 The 2005 sample: 31 randomly selected 1 km2 study grids in PDNP. The yellow box delineates the sub-sample area
Figure 2.5 The sub-sample of 13 1 km2 study grids in PDNP from which 1960s was mapped and compared with 2005 imagery
32
2.4 Aerial imagery
In environmental monitoring observing change is fundamental (Verbesselt et al., 2010;
Aplin, 2005; Coppin et al., 2004), and the interpretation of aerial imagery using GIS is the
most reliable method with which to map landcover and its temporal change (Rocchini
and Di Rita, 2005; Rocchini, 2004). GIS is the most practical and accurate method for
large-scale bracken monitoring (Holland and Aplin, 2013; Blackburn and Pitman, 1999)
and a fine-scale resolution (e.g. 25cm per pixel) allows the mapping of actual extent
rather than approximated, thematic landcover classifications (Jensen, 2007; Aplin,
2004).
The multi-temporal advantages of satellite imagery are tempered presently by limited
resolution quality, and on-the-ground field surveys, which whilst useful, are
substantially error-strewn (Holland and Aplin, 2013 Pakeman et al., 1996). The aerial
imagery spans 39 years from 1966 to 2005 (Table 2.1).
Table 2.1 Date, source, format and resolution of aerial imagery. B/W = black and white, RGB = red green blue (colour)
Date Source Format Resolution (cms/pixel)
21/07/1966 Ordnance Survey/PDNPA B/W 25 26/04/1968 Ordnance Survey/PDNPA B/W 25
25/08/1971 Ordnance Survey/PDNPA B/W 25 08/2005 PDNPA/NE RGB 25
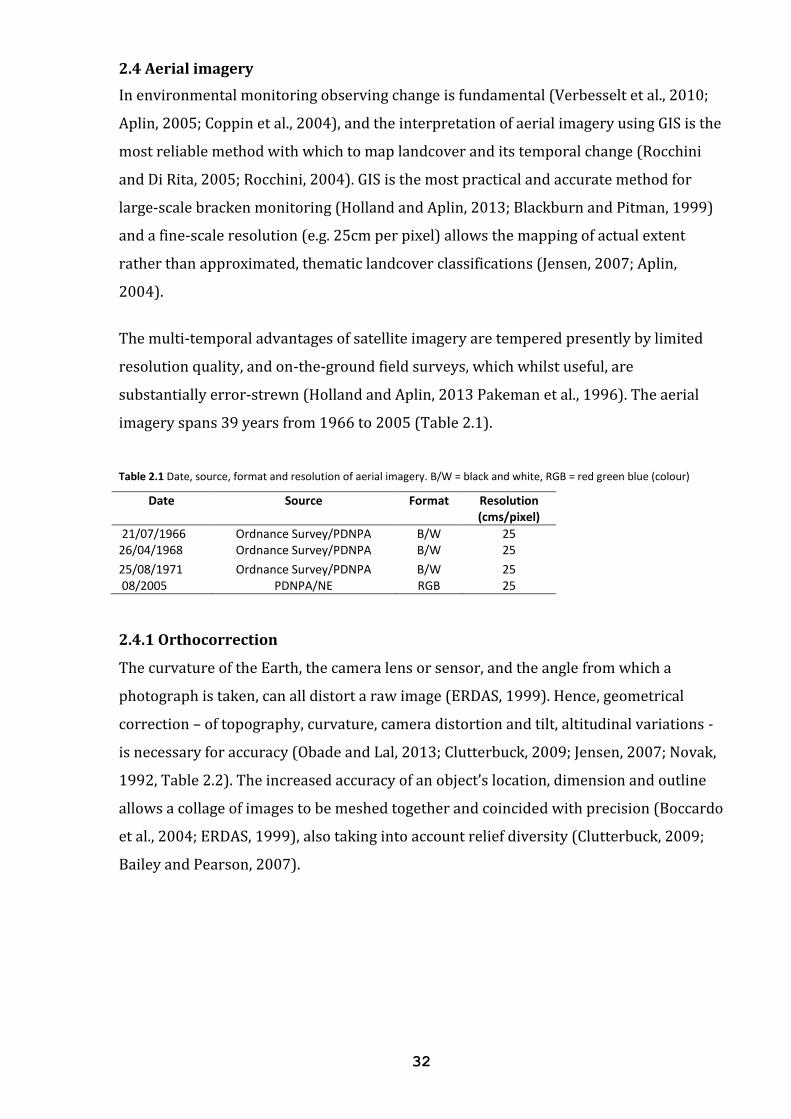
2.4.1 Orthocorrection
The curvature of the Earth, the camera lens or sensor, and the angle from which a
photograph is taken, can all distort a raw image (ERDAS, 1999). Hence, geometrical
correction – of topography, curvature, camera distortion and tilt, altitudinal variations -
is necessary for accuracy (Obade and Lal, 2013; Clutterbuck, 2009; Jensen, 2007; Novak,
1992, Table 2.2). The increased accuracy of an object’s location, dimension and outline
allows a collage of images to be meshed together and coincided with precision (Boccardo
et al., 2004; ERDAS, 1999), also taking into account relief diversity (Clutterbuck, 2009;
Bailey and Pearson, 2007).
33
Table 2.2 When and why orthocorrection is necessary, adapted from ERDAS (1999)
Orthocorrection is needed to:
Compare pixels in scene-to-scene applications
Develope GIS data for GIS models
Overlay an image with vector data (e.g. real world features using point, line or polygon)
Compare images originally at different scales
Extract accurate measurements of distance and area
Collate a mosaic of images
Create accurate scaled photomaps
Raw aerial photographs displace objects from their true location which orthocorrection
corrects to their proper location (Jensen, 2007; Novak, 1992). The 2005 imagery was
supplied corrected, and from these six 1960s images were orthocorrected. Raw images
were corrected using aero-triangulation (Jensen, 2007). X and Y location and Z altitude
information is available for every pixel and these data form a three-dimensional system
called the map projection (Clutterbuck, 2009). Landmarks plainly visible in both the raw
and 2005 imagery were identified as Ground Control Points (GCPs). Multiple GCPs
spread evenly throughout the image were collected per raw image (9 minimum). The
precision and accuracy with which these are obtained is decisive in attaining a properly
corrected image (Wangfei et al., 2009). Mapping consistency was over 99%, or less than
one pixel (<250mm). A comparison between raw and corrected imagery is shown in
Figure 2.6.
Figure 2.6 Orthocorrection: a) a raw aerial photograph and b) orthocorrected.
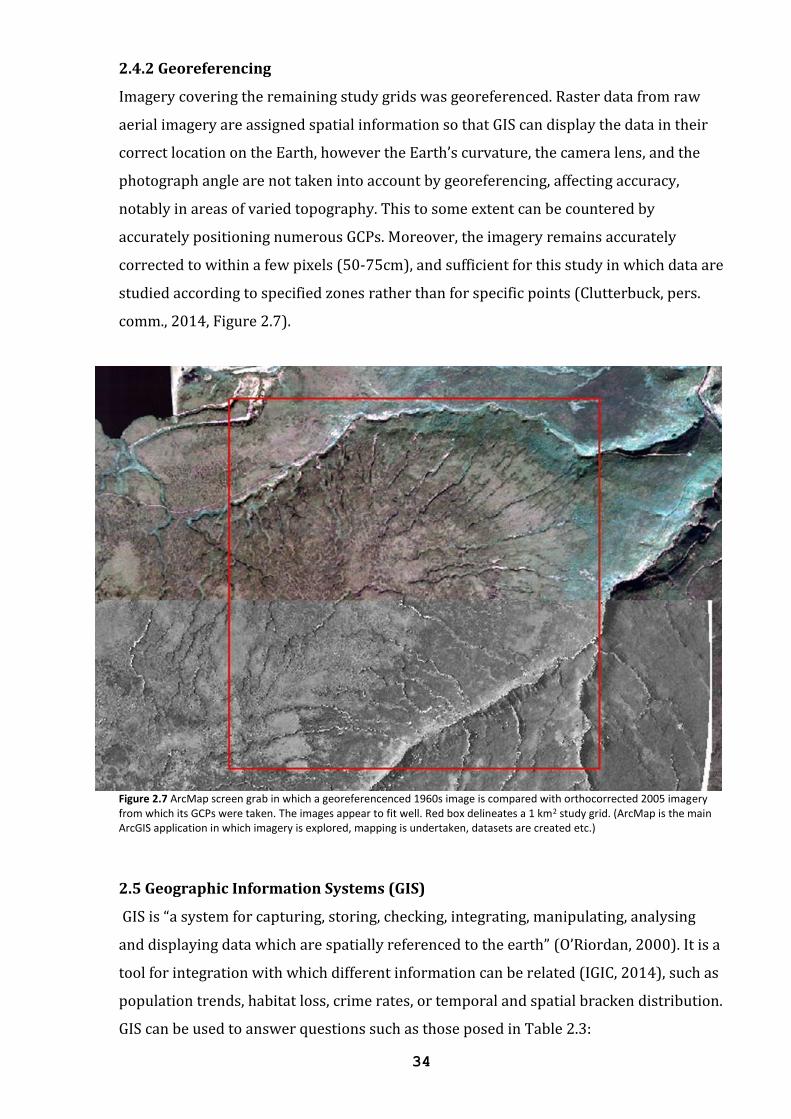
34
2.4.2 Georeferencing
Imagery covering the remaining study grids was georeferenced. Raster data from raw
aerial imagery are assigned spatial information so that GIS can display the data in their
correct location on the Earth, however the Earth’s curvature, the camera lens, and the
photograph angle are not taken into account by georeferencing, affecting accuracy,
notably in areas of varied topography. This to some extent can be countered by
accurately positioning numerous GCPs. Moreover, the imagery remains accurately
corrected to within a few pixels (50-75cm), and sufficient for this study in which data are
studied according to specified zones rather than for specific points (Clutterbuck, pers.
comm., 2014, Figure 2.7).
Figure 2.7 ArcMap screen grab in which a georeferencenced 1960s image is compared with orthocorrected 2005 imagery from which its GCPs were taken. The images appear to fit well. Red box delineates a 1 km2 study grid. (ArcMap is the main ArcGIS application in which imagery is explored, mapping is undertaken, datasets are created etc.)
2.5 Geographic Information Systems (GIS)
GIS is “a system for capturing, storing, checking, integrating, manipulating, analysing
and displaying data which are spatially referenced to the earth” (O’Riordan, 2000). It is a
tool for integration with which different information can be related (IGIC, 2014), such as
population trends, habitat loss, crime rates, or temporal and spatial bracken distribution.
GIS can be used to answer questions such as those posed in Table 2.3:
35
Table 2.3 Typical questions GIS can answer, adapted from O’Riordan (2000)
Type of Question Example
Identification What is at a specific location? Location Where does a specific feature occur?
Trend What features have changed over time? Routes Which way to travel between points? Pattern Is there an association? What if? What will happen if a particular change occurs?
2.6 Mapping bracken cover in ArcGIS
2.6.1 Identification of bracken
Bracken displays considerable seasonal variation (Holland and Aplin, 2013; Birnie et al.,
2000; Pakeman et al., 1996). Between July and August frond growth is at its peak, and
bracken is identifiable due to its blue-green hue and rippled texture. Following the first
frosts (usually mid-October) bracken turns brown, as it senesces, until late March or
early April in the uplands (Birnie et al., 2000; Pakeman et al., 1996). This provides a vivid
contrast to other upland vegetation which can aid identification in colour or black and
white imagery (Figure 2.8). Imagery of poor quality and resolution, and shadows make
identification more problematic.
Figure 2.8 Bracken identification: a) shows senesced bracken amongst heather in 1968, evident even in b/w, grasses at the bottom of the image appear more grey and wispy, b) shows the same area in 2005, bracken’s blue-green hue standing out. Note the darker green grass in the bottom right of the image.
Imagery in which bracken was growing (1966, 1971, and 2005) and was senesced
(1968) was mapped in this study (Table 2.4).
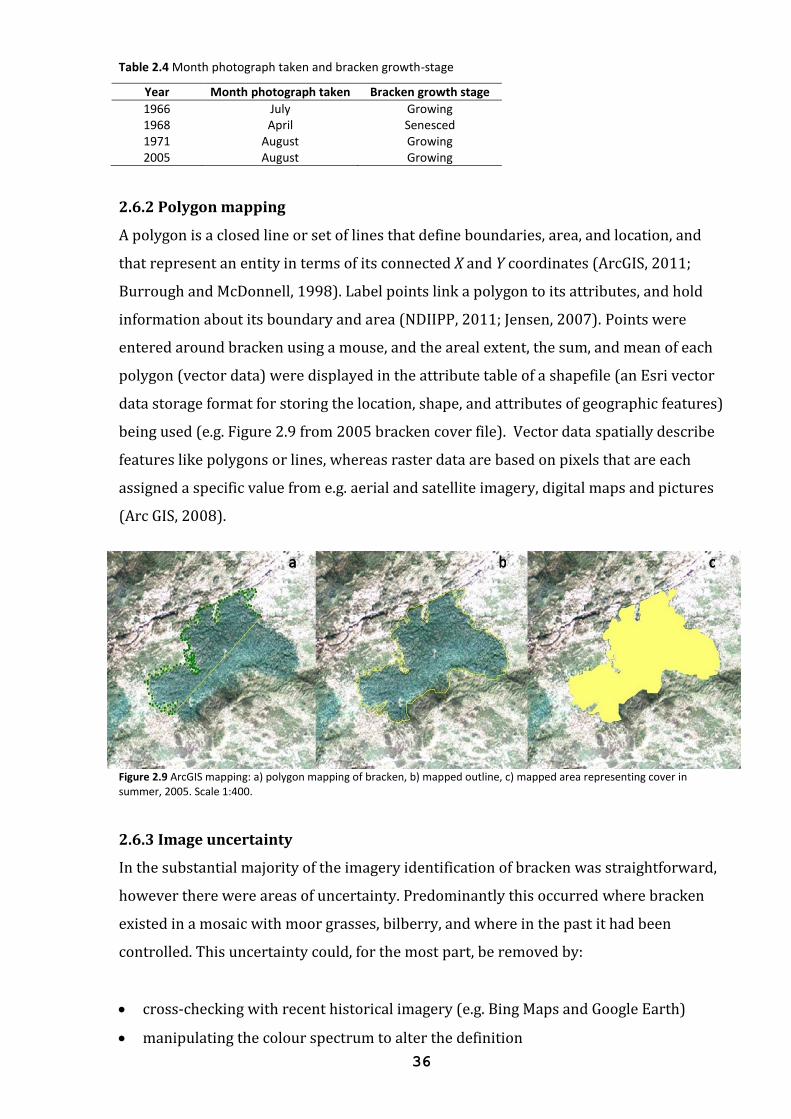
36
Table 2.4 Month photograph taken and bracken growth-stage
Year Month photograph taken Bracken growth stage
1966 July Growing 1968 April Senesced 1971 August Growing 2005 August Growing
2.6.2 Polygon mapping
A polygon is a closed line or set of lines that define boundaries, area, and location, and
that represent an entity in terms of its connected X and Y coordinates (ArcGIS, 2011;
Burrough and McDonnell, 1998). Label points link a polygon to its attributes, and hold
information about its boundary and area (NDIIPP, 2011; Jensen, 2007). Points were
entered around bracken using a mouse, and the areal extent, the sum, and mean of each
polygon (vector data) were displayed in the attribute table of a shapefile (an Esri vector
data storage format for storing the location, shape, and attributes of geographic features)
being used (e.g. Figure 2.9 from 2005 bracken cover file). Vector data spatially describe
features like polygons or lines, whereas raster data are based on pixels that are each
assigned a specific value from e.g. aerial and satellite imagery, digital maps and pictures
(Arc GIS, 2008).
Figure 2.9 ArcGIS mapping: a) polygon mapping of bracken, b) mapped outline, c) mapped area representing cover in summer, 2005. Scale 1:400.
2.6.3 Image uncertainty
In the substantial majority of the imagery identification of bracken was straightforward,
however there were areas of uncertainty. Predominantly this occurred where bracken
existed in a mosaic with moor grasses, bilberry, and where in the past it had been
controlled. This uncertainty could, for the most part, be removed by:
cross-checking with recent historical imagery (e.g. Bing Maps and Google Earth)
manipulating the colour spectrum to alter the definition
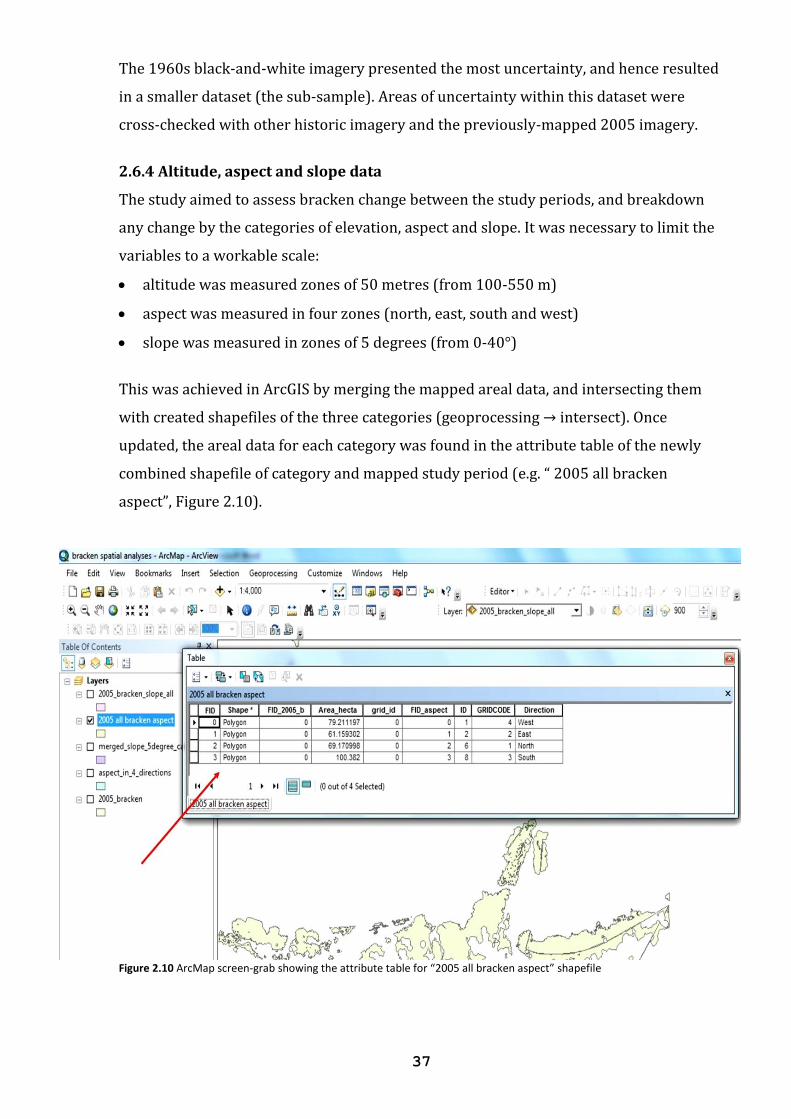
37
The 1960s black-and-white imagery presented the most uncertainty, and hence resulted
in a smaller dataset (the sub-sample). Areas of uncertainty within this dataset were
cross-checked with other historic imagery and the previously-mapped 2005 imagery.
2.6.4 Altitude, aspect and slope data
The study aimed to assess bracken change between the study periods, and breakdown
any change by the categories of elevation, aspect and slope. It was necessary to limit the
variables to a workable scale:
altitude was measured zones of 50 metres (from 100-550 m)
aspect was measured in four zones (north, east, south and west)
slope was measured in zones of 5 degrees (from 0-40°)
This was achieved in ArcGIS by merging the mapped areal data, and intersecting them
with created shapefiles of the three categories (geoprocessing → intersect). Once
updated, the areal data for each category was found in the attribute table of the newly
combined shapefile of category and mapped study period (e.g. “ 2005 all bracken
aspect”, Figure 2.10).
Figure 2.10 ArcMap screen-grab showing the attribute table for “2005 all bracken aspect” shapefile
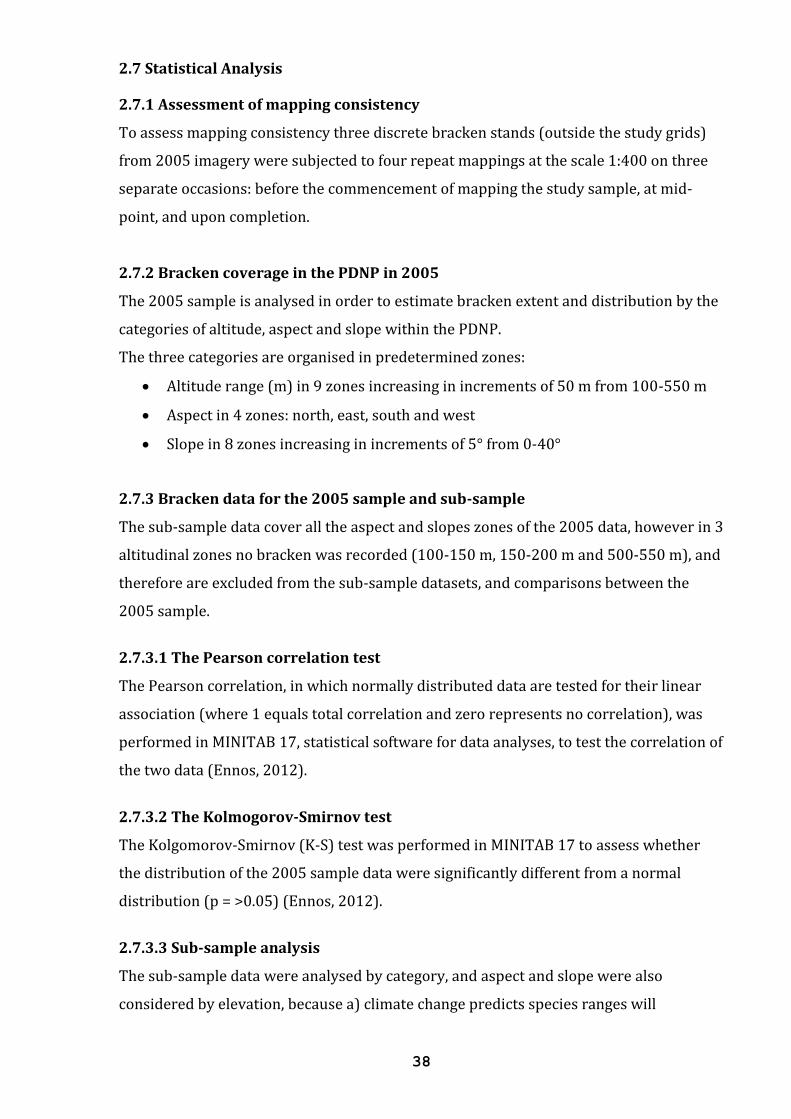
38
2.7 Statistical Analysis
2.7.1 Assessment of mapping consistency
To assess mapping consistency three discrete bracken stands (outside the study grids)
from 2005 imagery were subjected to four repeat mappings at the scale 1:400 on three
separate occasions: before the commencement of mapping the study sample, at mid-
point, and upon completion.
2.7.2 Bracken coverage in the PDNP in 2005
The 2005 sample is analysed in order to estimate bracken extent and distribution by the
categories of altitude, aspect and slope within the PDNP.
The three categories are organised in predetermined zones:
Altitude range (m) in 9 zones increasing in increments of 50 m from 100-550 m
Aspect in 4 zones: north, east, south and west
Slope in 8 zones increasing in increments of 5° from 0-40°
2.7.3 Bracken data for the 2005 sample and sub-sample
The sub-sample data cover all the aspect and slopes zones of the 2005 data, however in 3
altitudinal zones no bracken was recorded (100-150 m, 150-200 m and 500-550 m), and
therefore are excluded from the sub-sample datasets, and comparisons between the
2005 sample.
2.7.3.1 The Pearson correlation test
The Pearson correlation, in which normally distributed data are tested for their linear
association (where 1 equals total correlation and zero represents no correlation), was
performed in MINITAB 17, statistical software for data analyses, to test the correlation of
the two data (Ennos, 2012).
2.7.3.2 The Kolmogorov-Smirnov test
The Kolgomorov-Smirnov (K-S) test was performed in MINITAB 17 to assess whether
the distribution of the 2005 sample data were significantly different from a normal
distribution (p = >0.05) (Ennos, 2012).
2.7.3.3 Sub-sample analysis
The sub-sample data were analysed by category, and aspect and slope were also
considered by elevation, because a) climate change predicts species ranges will
39
experience altitudinous expansion (IPCC, 2013), and b) the 2005 sample suggests
altitude is an important factor in the distribution of bracken.
2.7.3.4 Changes in bracken cover at slopes related to altitude1960s-2005
Due to the small areal coverage of bracken at individual slope zones in the sub-sample
data change was analysed by consolidating two neighbouring zones:
0-5° and 5-10°, henceforth the low slope
10-15° and 15-20°, henceforth the low-mid slope
20-25° and 25-30°, henceforth the steep-mid slope
30-35° and 35-40°, henceforth the steep slope
2.8 Historic climate data
Historic climate data was analysed by looking at summer (April-September) and winter
(October-March) decadal means for maximum and minimum temperature, frost days,
precipitation and sunlight hours. The data were created from Met Office Sheffield station
historic climate data (location 4339E 3872N, 131 m). It is acknowledged that this data is
from just outside the PDNP boundary, at a lower altitude that most study grids, however
it was considered satisfactory to highlight general local climatic trends.
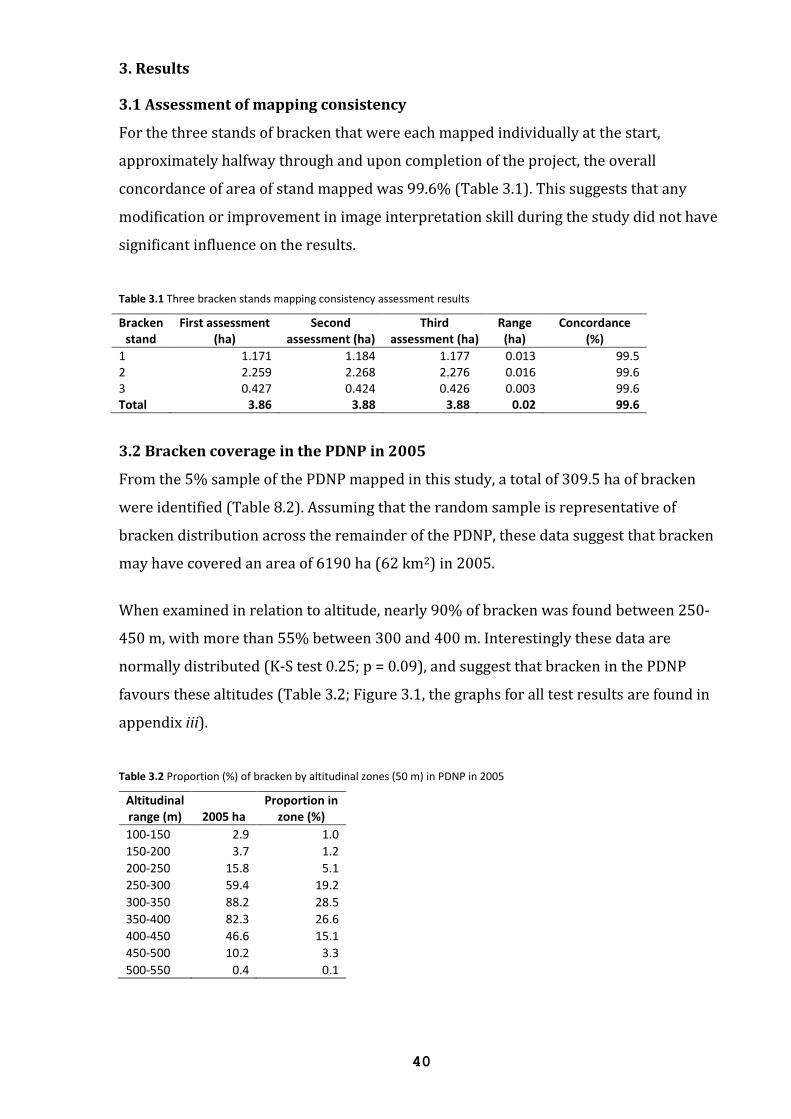
40
3. Results
3.1 Assessment of mapping consistency
For the three stands of bracken that were each mapped individually at the start,
approximately halfway through and upon completion of the project, the overall
concordance of area of stand mapped was 99.6% (Table 3.1). This suggests that any
modification or improvement in image interpretation skill during the study did not have
significant influence on the results.
Table 3.1 Three bracken stands mapping consistency assessment results
Bracken stand
First assessment (ha)
Second assessment (ha)
Third assessment (ha)
Range (ha)
Concordance (%)
1 1.171 1.184 1.177 0.013 99.5 2 2.259 2.268 2.276 0.016 99.6 3 0.427 0.424 0.426 0.003 99.6 Total 3.86 3.88 3.88 0.02 99.6
3.2 Bracken coverage in the PDNP in 2005
From the 5% sample of the PDNP mapped in this study, a total of 309.5 ha of bracken
were identified (Table 8.2). Assuming that the random sample is representative of
bracken distribution across the remainder of the PDNP, these data suggest that bracken
may have covered an area of 6190 ha (62 km2) in 2005.
When examined in relation to altitude, nearly 90% of bracken was found between 250-
450 m, with more than 55% between 300 and 400 m. Interestingly these data are
normally distributed (K-S test 0.25; p = 0.09), and suggest that bracken in the PDNP
favours these altitudes (Table 3.2; Figure 3.1, the graphs for all test results are found in
appendix iii).
Table 3.2 Proportion (%) of bracken by altitudinal zones (50 m) in PDNP in 2005
Altitudinal range (m) 2005 ha
Proportion in zone (%)
100-150 2.9 1.0
150-200 3.7 1.2
200-250 15.8 5.1
250-300 59.4 19.2
300-350 88.2 28.5
350-400 82.3 26.6
400-450 46.6 15.1
450-500 10.2 3.3
500-550 0.4 0.1
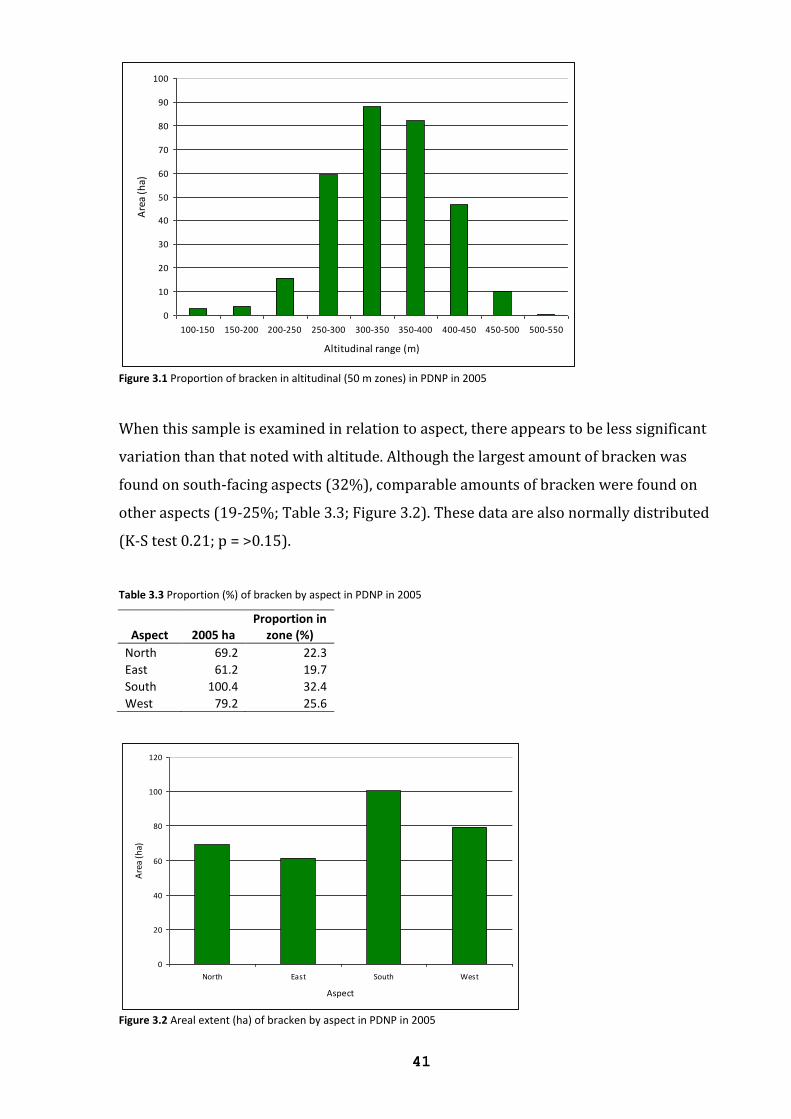
41
0
10
20
30
40
50
60
70
80
90
100
100-150 150-200 200-250 250-300 300-350 350-400 400-450 450-500 500-550
Altitudinal range (m)
Are
a (h
a)
Figure 3.1 Proportion of bracken in altitudinal (50 m zones) in PDNP in 2005
When this sample is examined in relation to aspect, there appears to be less significant
variation than that noted with altitude. Although the largest amount of bracken was
found on south-facing aspects (32%), comparable amounts of bracken were found on
other aspects (19-25%; Table 3.3; Figure 3.2). These data are also normally distributed
(K-S test 0.21; p = >0.15).
Table 3.3 Proportion (%) of bracken by aspect in PDNP in 2005
Aspect 2005 ha Proportion in
zone (%)
North 69.2 22.3
East 61.2 19.7
South 100.4 32.4
West 79.2 25.6
0
20
40
60
80
100
120
North East South West
Aspect
Are
a (h
a)
Figure 3.2 Areal extent (ha) of bracken by aspect in PDNP in 2005
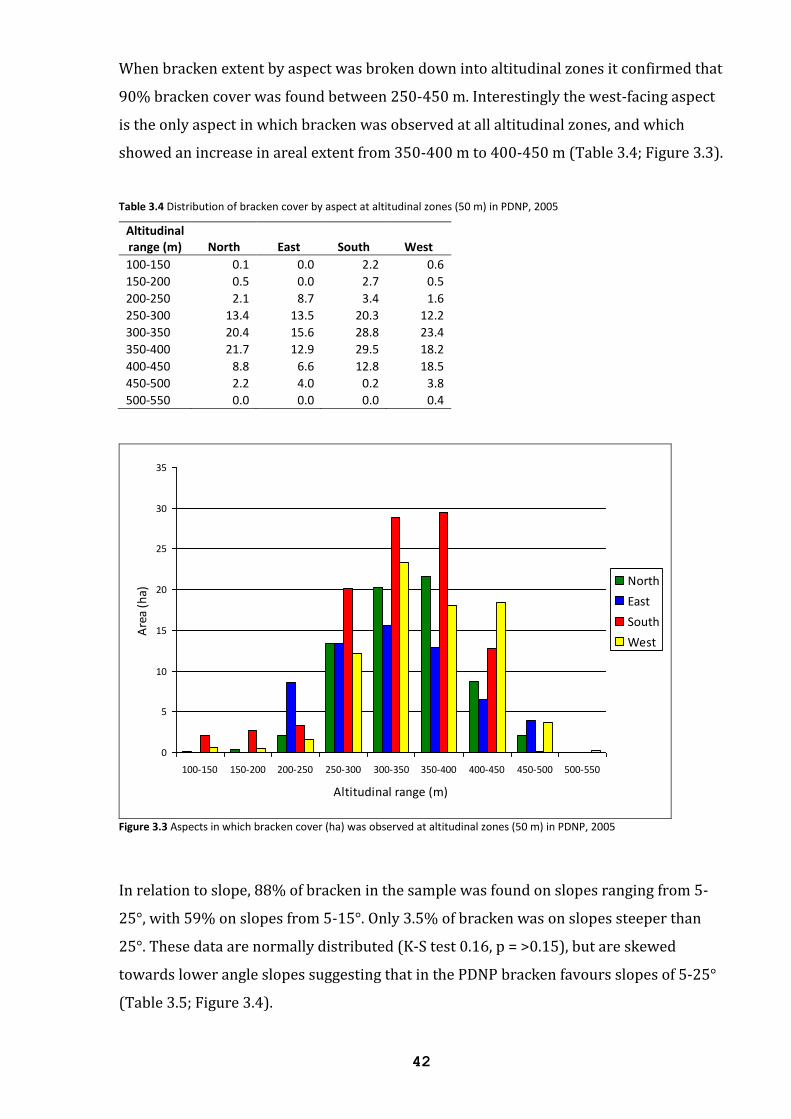
42
When bracken extent by aspect was broken down into altitudinal zones it confirmed that
90% bracken cover was found between 250-450 m. Interestingly the west-facing aspect
is the only aspect in which bracken was observed at all altitudinal zones, and which
showed an increase in areal extent from 350-400 m to 400-450 m (Table 3.4; Figure 3.3).
Table 3.4 Distribution of bracken cover by aspect at altitudinal zones (50 m) in PDNP, 2005
Altitudinal range (m) North East South West
100-150 0.1 0.0 2.2 0.6
150-200 0.5 0.0 2.7 0.5
200-250 2.1 8.7 3.4 1.6
250-300 13.4 13.5 20.3 12.2
300-350 20.4 15.6 28.8 23.4
350-400 21.7 12.9 29.5 18.2
400-450 8.8 6.6 12.8 18.5
450-500 2.2 4.0 0.2 3.8
500-550 0.0 0.0 0.0 0.4
0
5
10
15
20
25
30
35
100-150 150-200 200-250 250-300 300-350 350-400 400-450 450-500 500-550
Altitudinal range (m)
Are
a (h
a)
North
East
South
West
Figure 3.3 Aspects in which bracken cover (ha) was observed at altitudinal zones (50 m) in PDNP, 2005
In relation to slope, 88% of bracken in the sample was found on slopes ranging from 5-
25°, with 59% on slopes from 5-15°. Only 3.5% of bracken was on slopes steeper than
25°. These data are normally distributed (K-S test 0.16, p = >0.15), but are skewed
towards lower angle slopes suggesting that in the PDNP bracken favours slopes of 5-25°
(Table 3.5; Figure 3.4).
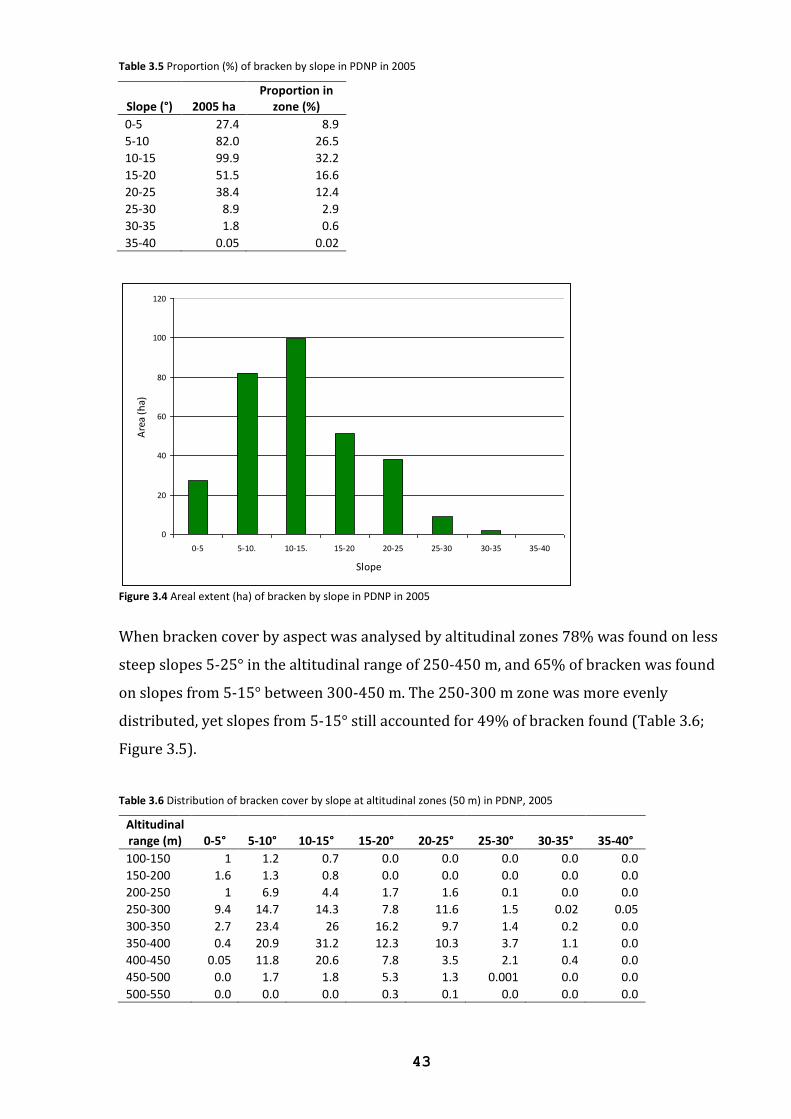
43
Table 3.5 Proportion (%) of bracken by slope in PDNP in 2005
Slope (°) 2005 ha Proportion in
zone (%)
0-5 27.4 8.9
5-10 82.0 26.5
10-15 99.9 32.2
15-20 51.5 16.6
20-25 38.4 12.4
25-30 8.9 2.9
30-35 1.8 0.6
35-40 0.05 0.02
0
20
40
60
80
100
120
0-5 5-10. 10-15. 15-20 20-25 25-30 30-35 35-40
Slope
Are
a (h
a)
Figure 3.4 Areal extent (ha) of bracken by slope in PDNP in 2005
When bracken cover by aspect was analysed by altitudinal zones 78% was found on less
steep slopes 5-25° in the altitudinal range of 250-450 m, and 65% of bracken was found
on slopes from 5-15° between 300-450 m. The 250-300 m zone was more evenly
distributed, yet slopes from 5-15° still accounted for 49% of bracken found (Table 3.6;
Figure 3.5).
Table 3.6 Distribution of bracken cover by slope at altitudinal zones (50 m) in PDNP, 2005
Altitudinal range (m) 0-5° 5-10° 10-15° 15-20° 20-25° 25-30° 30-35° 35-40°
100-150 1 1.2 0.7 0.0 0.0 0.0 0.0 0.0
150-200 1.6 1.3 0.8 0.0 0.0 0.0 0.0 0.0
200-250 1 6.9 4.4 1.7 1.6 0.1 0.0 0.0
250-300 9.4 14.7 14.3 7.8 11.6 1.5 0.02 0.05
300-350 2.7 23.4 26 16.2 9.7 1.4 0.2 0.0
350-400 0.4 20.9 31.2 12.3 10.3 3.7 1.1 0.0
400-450 0.05 11.8 20.6 7.8 3.5 2.1 0.4 0.0
450-500 0.0 1.7 1.8 5.3 1.3 0.001 0.0 0.0
500-550 0.0 0.0 0.0 0.3 0.1 0.0 0.0 0.0
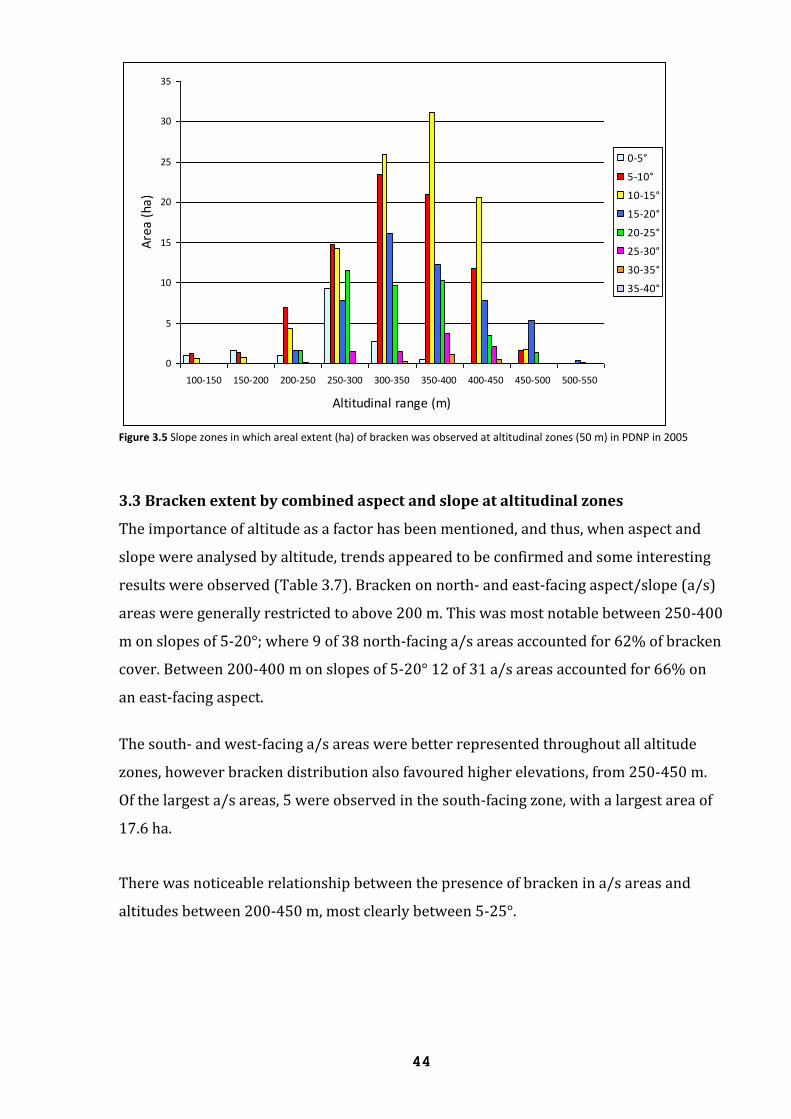
44
0
5
10
15
20
25
30
35
100-150 150-200 200-250 250-300 300-350 350-400 400-450 450-500 500-550
Altitudinal range (m)
Are
a (h
a)0-5°
5-10°
10-15°
15-20°
20-25°
25-30°
30-35°
35-40°
Figure 3.5 Slope zones in which areal extent (ha) of bracken was observed at altitudinal zones (50 m) in PDNP in 2005
3.3 Bracken extent by combined aspect and slope at altitudinal zones
The importance of altitude as a factor has been mentioned, and thus, when aspect and
slope were analysed by altitude, trends appeared to be confirmed and some interesting
results were observed (Table 3.7). Bracken on north- and east-facing aspect/slope (a/s)
areas were generally restricted to above 200 m. This was most notable between 250-400
m on slopes of 5-20°; where 9 of 38 north-facing a/s areas accounted for 62% of bracken
cover. Between 200-400 m on slopes of 5-20° 12 of 31 a/s areas accounted for 66% on
an east-facing aspect.
The south- and west-facing a/s areas were better represented throughout all altitude
zones, however bracken distribution also favoured higher elevations, from 250-450 m.
Of the largest a/s areas, 5 were observed in the south-facing zone, with a largest area of
17.6 ha.
There was noticeable relationship between the presence of bracken in a/s areas and
altitudes between 200-450 m, most clearly between 5-25°.
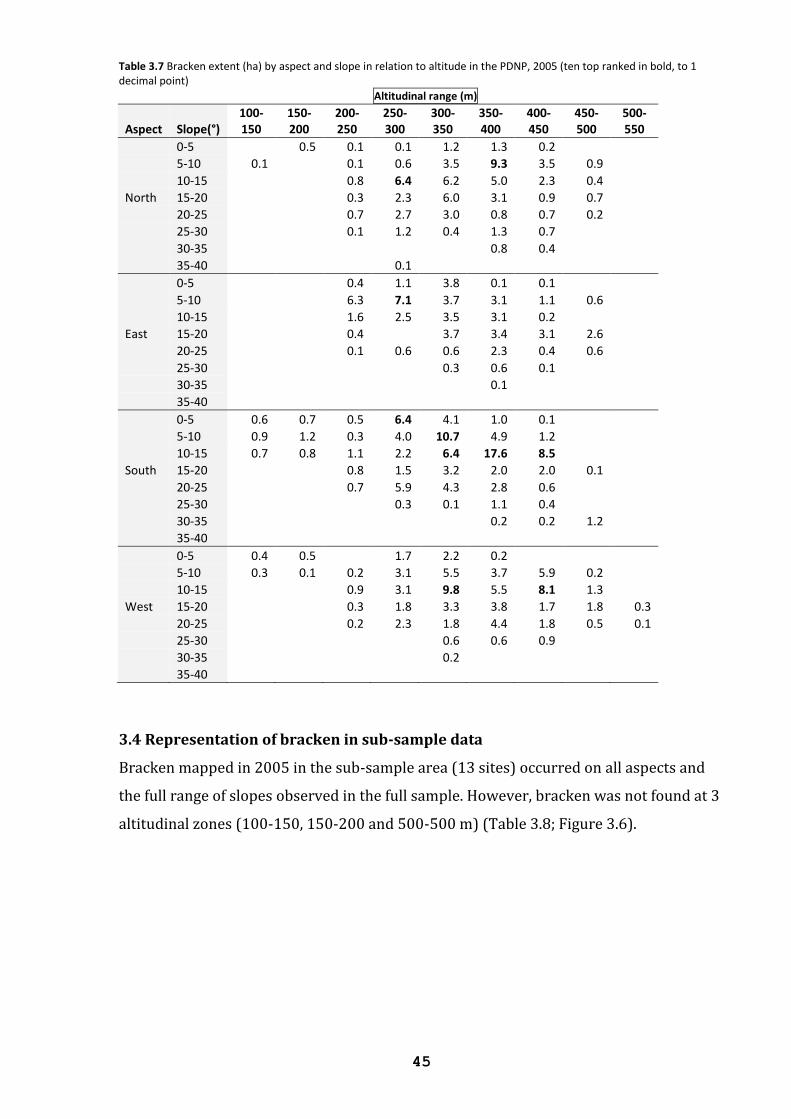
45
Table 3.7 Bracken extent (ha) by aspect and slope in relation to altitude in the PDNP, 2005 (ten top ranked in bold, to 1 decimal point)
Altitudinal range (m)
Aspect Slope(°) 100-150
150-200
200-250
250-300
300-350
350-400
400-450
450-500
500-550
0-5 0.5 0.1 0.1 1.2 1.3 0.2
5-10 0.1 0.1 0.6 3.5 9.3 3.5 0.9
10-15 0.8 6.4 6.2 5.0 2.3 0.4
North 15-20 0.3 2.3 6.0 3.1 0.9 0.7
20-25 0.7 2.7 3.0 0.8 0.7 0.2
25-30 0.1 1.2 0.4 1.3 0.7
30-35 0.8 0.4
35-40 0.1
0-5 0.4 1.1 3.8 0.1 0.1
5-10 6.3 7.1 3.7 3.1 1.1 0.6
10-15 1.6 2.5 3.5 3.1 0.2
East 15-20 0.4 3.7 3.4 3.1 2.6
20-25 0.1 0.6 0.6 2.3 0.4 0.6
25-30 0.3 0.6 0.1
30-35 0.1
35-40
0-5 0.6 0.7 0.5 6.4 4.1 1.0 0.1
5-10 0.9 1.2 0.3 4.0 10.7 4.9 1.2
10-15 0.7 0.8 1.1 2.2 6.4 17.6 8.5
South 15-20 0.8 1.5 3.2 2.0 2.0 0.1
20-25 0.7 5.9 4.3 2.8 0.6
25-30 0.3 0.1 1.1 0.4
30-35 0.2 0.2 1.2
35-40
0-5 0.4 0.5 1.7 2.2 0.2
5-10 0.3 0.1 0.2 3.1 5.5 3.7 5.9 0.2
10-15 0.9 3.1 9.8 5.5 8.1 1.3
West 15-20 0.3 1.8 3.3 3.8 1.7 1.8 0.3
20-25 0.2 2.3 1.8 4.4 1.8 0.5 0.1
25-30 0.6 0.6 0.9
30-35 0.2
35-40
3.4 Representation of bracken in sub-sample data
Bracken mapped in 2005 in the sub-sample area (13 sites) occurred on all aspects and
the full range of slopes observed in the full sample. However, bracken was not found at 3
altitudinal zones (100-150, 150-200 and 500-500 m) (Table 3.8; Figure 3.6).
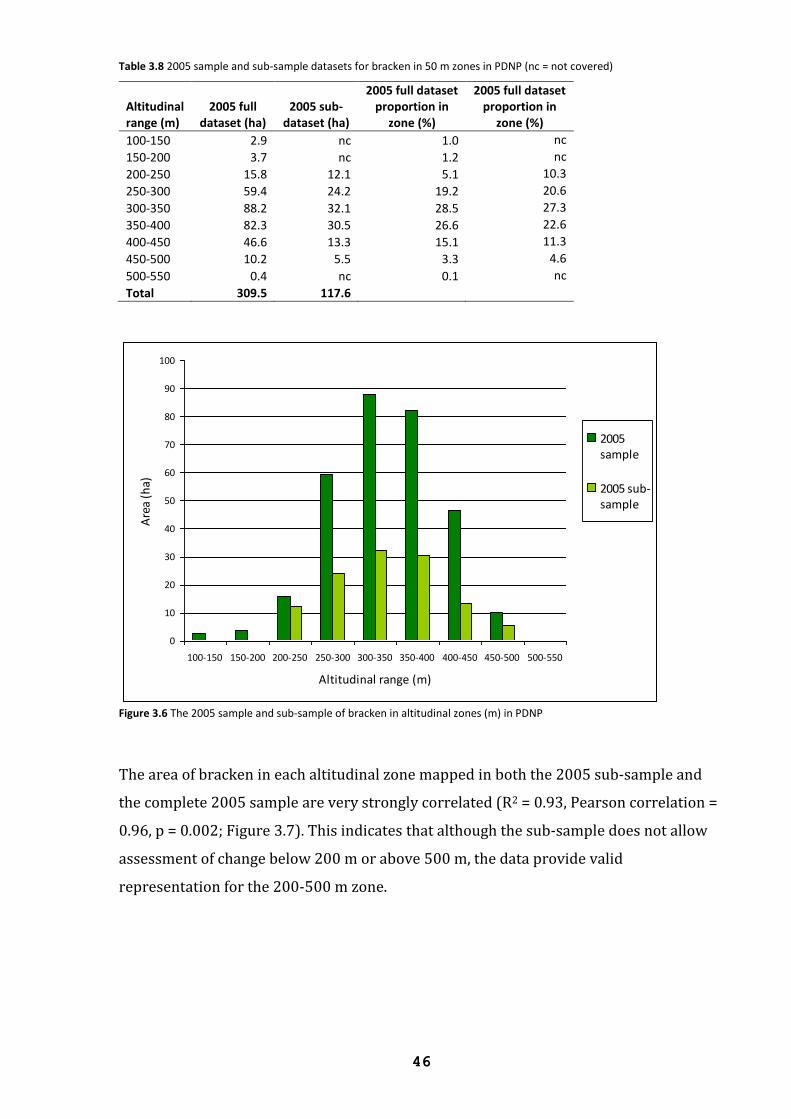
46
Table 3.8 2005 sample and sub-sample datasets for bracken in 50 m zones in PDNP (nc = not covered)
Altitudinal range (m)
2005 full dataset (ha)
2005 sub-dataset (ha)
2005 full dataset proportion in
zone (%)
2005 full dataset proportion in
zone (%)
100-150 2.9 nc 1.0 nc
150-200 3.7 nc 1.2 nc
200-250 15.8 12.1 5.1 10.3
250-300 59.4 24.2 19.2 20.6
300-350 88.2 32.1 28.5 27.3
350-400 82.3 30.5 26.6 22.6
400-450 46.6 13.3 15.1 11.3
450-500 10.2 5.5 3.3 4.6
500-550 0.4 nc 0.1 nc
Total 309.5 117.6
0
10
20
30
40
50
60
70
80
90
100
100-150 150-200 200-250 250-300 300-350 350-400 400-450 450-500 500-550
Altitudinal range (m)
Are
a (h
a)
2005sample
2005 sub-sample
Figure 3.6 The 2005 sample and sub-sample of bracken in altitudinal zones (m) in PDNP
The area of bracken in each altitudinal zone mapped in both the 2005 sub-sample and
the complete 2005 sample are very strongly correlated (R2 = 0.93, Pearson correlation =
0.96, p = 0.002; Figure 3.7). This indicates that although the sub-sample does not allow
assessment of change below 200 m or above 500 m, the data provide valid
representation for the 200-500 m zone.
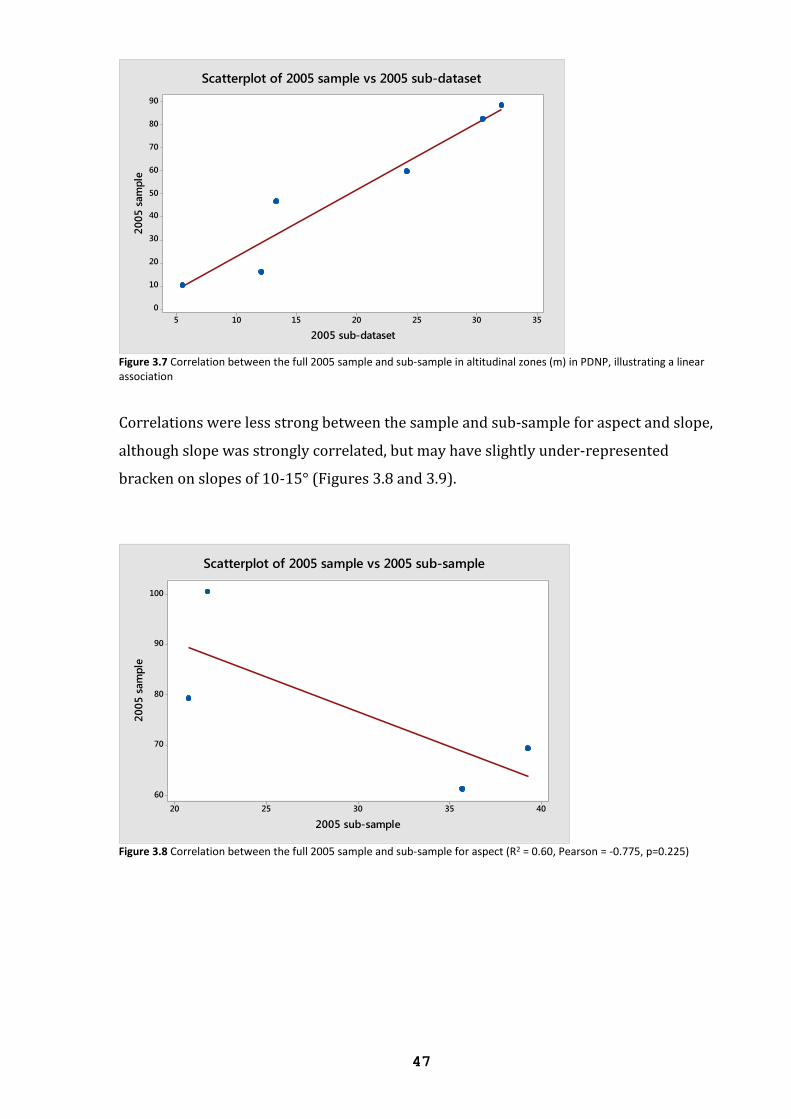
47
3530252015105
90
80
70
60
50
40
30
20
10
0
2005 sub-dataset
20
05
sam
ple
Scatterplot of 2005 sample vs 2005 sub-dataset
Figure 3.7 Correlation between the full 2005 sample and sub-sample in altitudinal zones (m) in PDNP, illustrating a linear association
Correlations were less strong between the sample and sub-sample for aspect and slope,
although slope was strongly correlated, but may have slightly under-represented
bracken on slopes of 10-15° (Figures 3.8 and 3.9).
4035302520
100
90
80
70
60
2005 sub-sample
20
05
sam
ple
Scatterplot of 2005 sample vs 2005 sub-sample
Figure 3.8 Correlation between the full 2005 sample and sub-sample for aspect (R2 = 0.60, Pearson = -0.775, p=0.225)
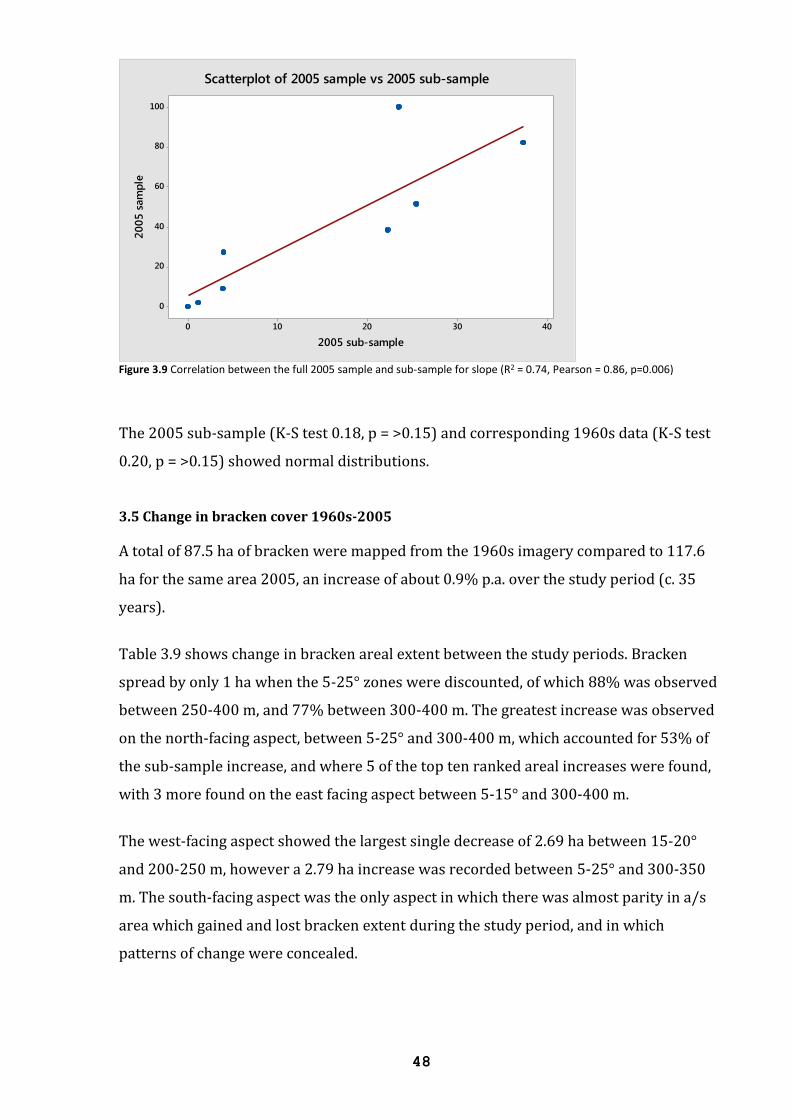
48
403020100
100
80
60
40
20
0
2005 sub-sample
20
05
sam
ple
Scatterplot of 2005 sample vs 2005 sub-sample
Figure 3.9 Correlation between the full 2005 sample and sub-sample for slope (R2 = 0.74, Pearson = 0.86, p=0.006)
The 2005 sub-sample (K-S test 0.18, p = >0.15) and corresponding 1960s data (K-S test
0.20, p = >0.15) showed normal distributions.
3.5 Change in bracken cover 1960s-2005
A total of 87.5 ha of bracken were mapped from the 1960s imagery compared to 117.6
ha for the same area 2005, an increase of about 0.9% p.a. over the study period (c. 35
years).
Table 3.9 shows change in bracken areal extent between the study periods. Bracken
spread by only 1 ha when the 5-25° zones were discounted, of which 88% was observed
between 250-400 m, and 77% between 300-400 m. The greatest increase was observed
on the north-facing aspect, between 5-25° and 300-400 m, which accounted for 53% of
the sub-sample increase, and where 5 of the top ten ranked areal increases were found,
with 3 more found on the east facing aspect between 5-15° and 300-400 m.
The west-facing aspect showed the largest single decrease of 2.69 ha between 15-20°
and 200-250 m, however a 2.79 ha increase was recorded between 5-25° and 300-350
m. The south-facing aspect was the only aspect in which there was almost parity in a/s
area which gained and lost bracken extent during the study period, and in which
patterns of change were concealed.
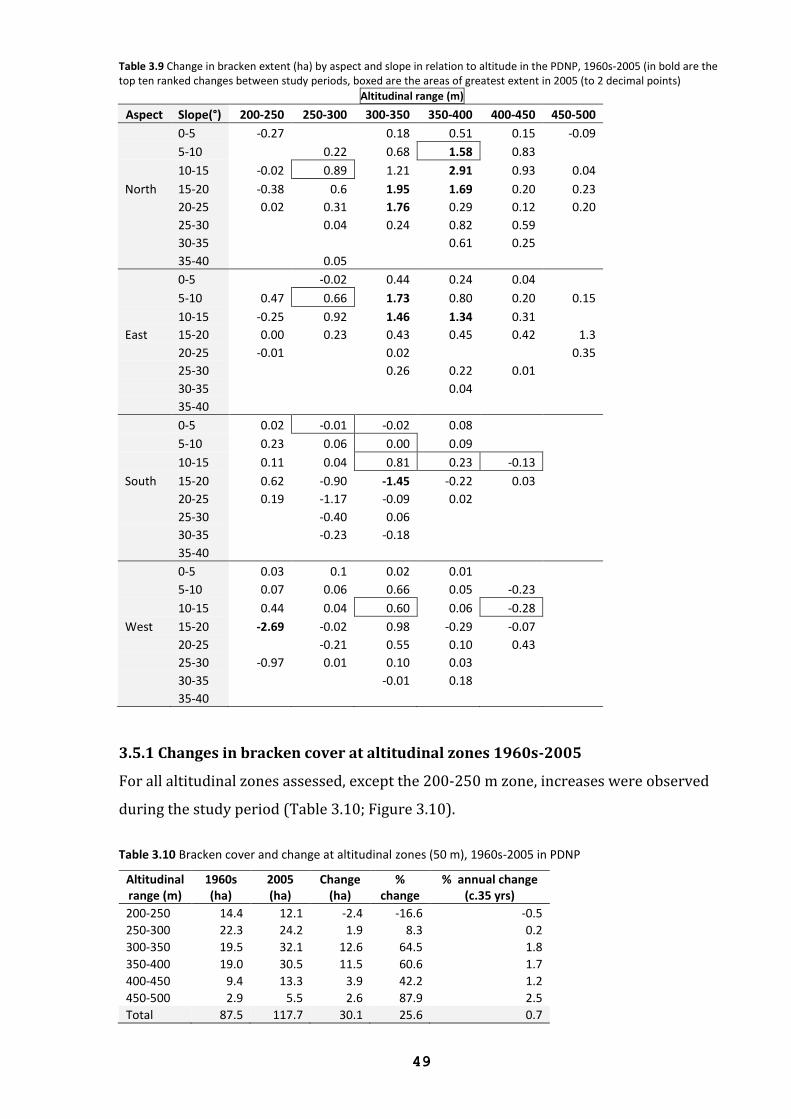
49
Table 3.9 Change in bracken extent (ha) by aspect and slope in relation to altitude in the PDNP, 1960s-2005 (in bold are the top ten ranked changes between study periods, boxed are the areas of greatest extent in 2005 (to 2 decimal points)
Altitudinal range (m)
Aspect Slope(°) 200-250 250-300 300-350 350-400 400-450 450-500
0-5 -0.27 0.18 0.51 0.15 -0.09
5-10 0.22 0.68 1.58 0.83
10-15 -0.02 0.89 1.21 2.91 0.93 0.04
North 15-20 -0.38 0.6 1.95 1.69 0.20 0.23
20-25 0.02 0.31 1.76 0.29 0.12 0.20
25-30 0.04 0.24 0.82 0.59
30-35 0.61 0.25
35-40 0.05
0-5 -0.02 0.44 0.24 0.04
5-10 0.47 0.66 1.73 0.80 0.20 0.15
10-15 -0.25 0.92 1.46 1.34 0.31
East 15-20 0.00 0.23 0.43 0.45 0.42 1.3
20-25 -0.01 0.02 0.35
25-30 0.26 0.22 0.01
30-35 0.04
35-40
0-5 0.02 -0.01 -0.02 0.08
5-10 0.23 0.06 0.00 0.09
10-15 0.11 0.04 0.81 0.23 -0.13
South 15-20 0.62 -0.90 -1.45 -0.22 0.03
20-25 0.19 -1.17 -0.09 0.02
25-30 -0.40 0.06
30-35 -0.23 -0.18
35-40
0-5 0.03 0.1 0.02 0.01
5-10 0.07 0.06 0.66 0.05 -0.23
10-15 0.44 0.04 0.60 0.06 -0.28
West 15-20 -2.69 -0.02 0.98 -0.29 -0.07
20-25 -0.21 0.55 0.10 0.43
25-30 -0.97 0.01 0.10 0.03
30-35 -0.01 0.18
35-40
3.5.1 Changes in bracken cover at altitudinal zones 1960s-2005
For all altitudinal zones assessed, except the 200-250 m zone, increases were observed
during the study period (Table 3.10; Figure 3.10).
Table 3.10 Bracken cover and change at altitudinal zones (50 m), 1960s-2005 in PDNP
Altitudinal range (m)
1960s (ha)
2005 (ha)
Change (ha)
% change
% annual change (c.35 yrs)
200-250 14.4 12.1 -2.4 -16.6 -0.5
250-300 22.3 24.2 1.9 8.3 0.2
300-350 19.5 32.1 12.6 64.5 1.8
350-400 19.0 30.5 11.5 60.6 1.7
400-450 9.4 13.3 3.9 42.2 1.2
450-500 2.9 5.5 2.6 87.9 2.5
Total 87.5 117.7 30.1 25.6 0.7
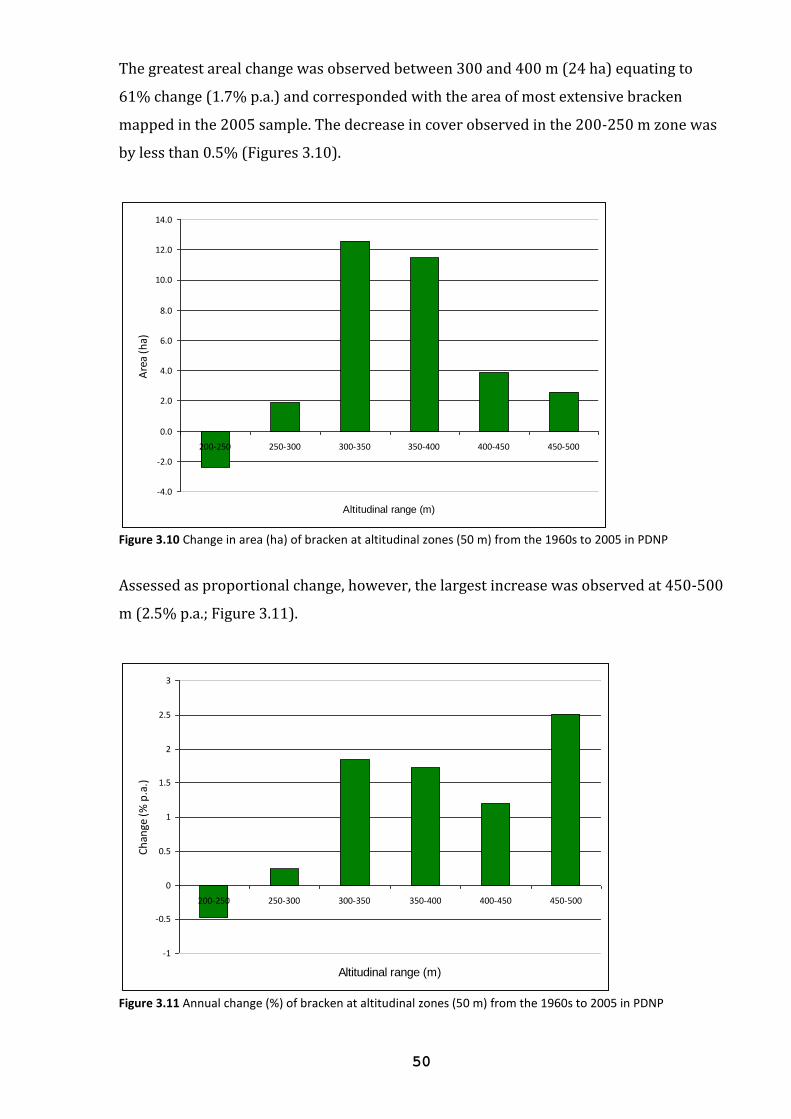
50
The greatest areal change was observed between 300 and 400 m (24 ha) equating to
61% change (1.7% p.a.) and corresponded with the area of most extensive bracken
mapped in the 2005 sample. The decrease in cover observed in the 200-250 m zone was
by less than 0.5% (Figures 3.10).
-4.0
-2.0
0.0
2.0
4.0
6.0
8.0
10.0
12.0
14.0
200-250 250-300 300-350 350-400 400-450 450-500
Altitudinal range (m)
Are
a (h
a)
Figure 3.10 Change in area (ha) of bracken at altitudinal zones (50 m) from the 1960s to 2005 in PDNP
Assessed as proportional change, however, the largest increase was observed at 450-500
m (2.5% p.a.; Figure 3.11).
-1
-0.5
0
0.5
1
1.5
2
2.5
3
200-250 250-300 300-350 350-400 400-450 450-500
Altitudinal range (m)
Ch
ange
(%
p.a
.)
Figure 3.11 Annual change (%) of bracken at altitudinal zones (50 m) from the 1960s to 2005 in PDNP
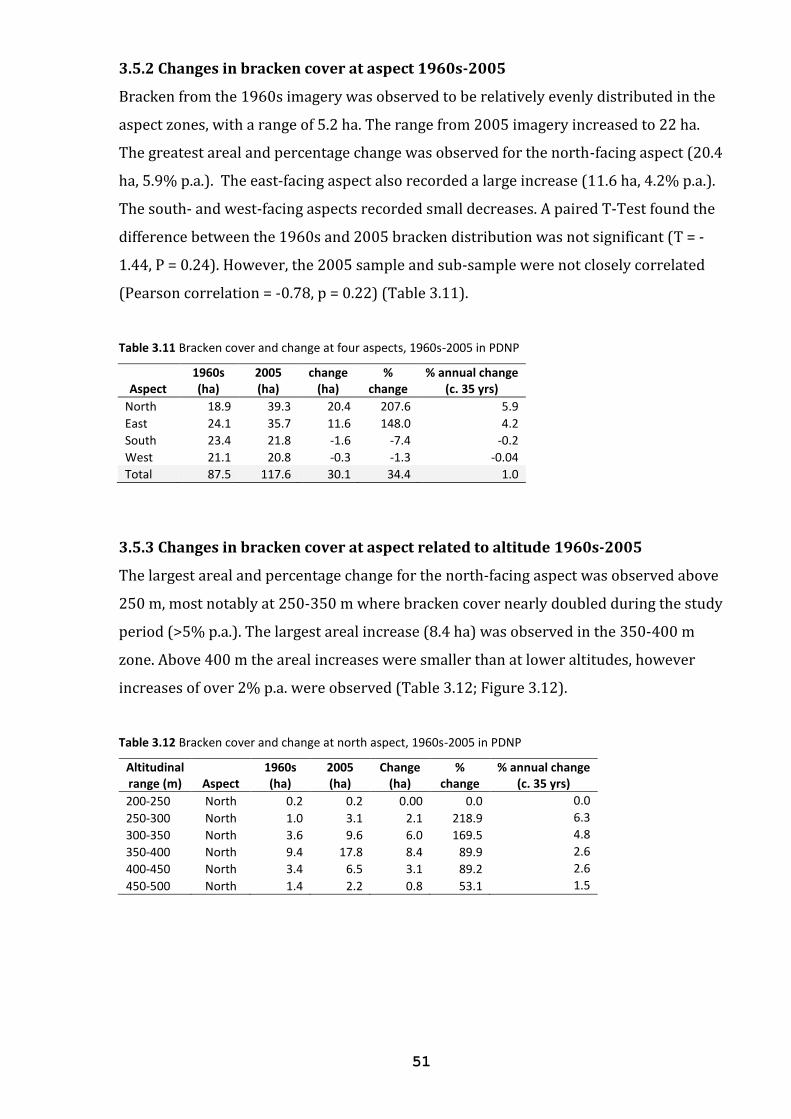
51
3.5.2 Changes in bracken cover at aspect 1960s-2005
Bracken from the 1960s imagery was observed to be relatively evenly distributed in the
aspect zones, with a range of 5.2 ha. The range from 2005 imagery increased to 22 ha.
The greatest areal and percentage change was observed for the north-facing aspect (20.4
ha, 5.9% p.a.). The east-facing aspect also recorded a large increase (11.6 ha, 4.2% p.a.).
The south- and west-facing aspects recorded small decreases. A paired T-Test found the
difference between the 1960s and 2005 bracken distribution was not significant (T = -
1.44, P = 0.24). However, the 2005 sample and sub-sample were not closely correlated
(Pearson correlation = -0.78, p = 0.22) (Table 3.11).
Table 3.11 Bracken cover and change at four aspects, 1960s-2005 in PDNP
Aspect 1960s (ha)
2005 (ha)
change (ha)
% change
% annual change (c. 35 yrs)
North 18.9 39.3 20.4 207.6 5.9
East 24.1 35.7 11.6 148.0 4.2
South 23.4 21.8 -1.6 -7.4 -0.2
West 21.1 20.8 -0.3 -1.3 -0.04
Total 87.5 117.6 30.1 34.4 1.0
3.5.3 Changes in bracken cover at aspect related to altitude 1960s-2005
The largest areal and percentage change for the north-facing aspect was observed above
250 m, most notably at 250-350 m where bracken cover nearly doubled during the study
period (>5% p.a.). The largest areal increase (8.4 ha) was observed in the 350-400 m
zone. Above 400 m the areal increases were smaller than at lower altitudes, however
increases of over 2% p.a. were observed (Table 3.12; Figure 3.12).
Table 3.12 Bracken cover and change at north aspect, 1960s-2005 in PDNP
Altitudinal range (m) Aspect
1960s (ha)
2005 (ha)
Change (ha)
% change
% annual change (c. 35 yrs)
200-250 North 0.2 0.2 0.00 0.0 0.0
250-300 North 1.0 3.1 2.1 218.9 6.3
300-350 North 3.6 9.6 6.0 169.5 4.8
350-400 North 9.4 17.8 8.4 89.9 2.6
400-450 North 3.4 6.5 3.1 89.2 2.6
450-500 North 1.4 2.2 0.8 53.1 1.5
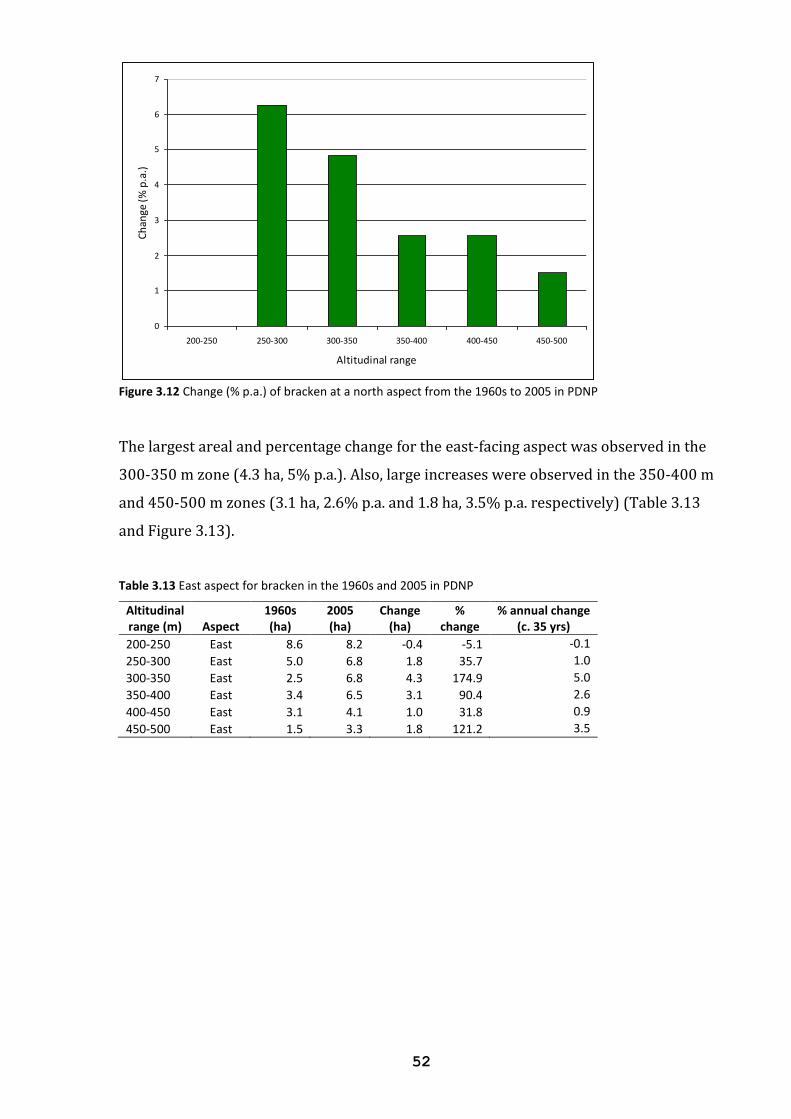
52
0
1
2
3
4
5
6
7
200-250 250-300 300-350 350-400 400-450 450-500
Altitudinal range
Ch
ange
(%
p.a
.)
Figure 3.12 Change (% p.a.) of bracken at a north aspect from the 1960s to 2005 in PDNP
The largest areal and percentage change for the east-facing aspect was observed in the
300-350 m zone (4.3 ha, 5% p.a.). Also, large increases were observed in the 350-400 m
and 450-500 m zones (3.1 ha, 2.6% p.a. and 1.8 ha, 3.5% p.a. respectively) (Table 3.13
and Figure 3.13).
Table 3.13 East aspect for bracken in the 1960s and 2005 in PDNP
Altitudinal range (m) Aspect
1960s (ha)
2005 (ha)
Change (ha)
% change
% annual change (c. 35 yrs)
200-250 East 8.6 8.2 -0.4 -5.1 -0.1
250-300 East 5.0 6.8 1.8 35.7 1.0
300-350 East 2.5 6.8 4.3 174.9 5.0
350-400 East 3.4 6.5 3.1 90.4 2.6
400-450 East 3.1 4.1 1.0 31.8 0.9
450-500 East 1.5 3.3 1.8 121.2 3.5
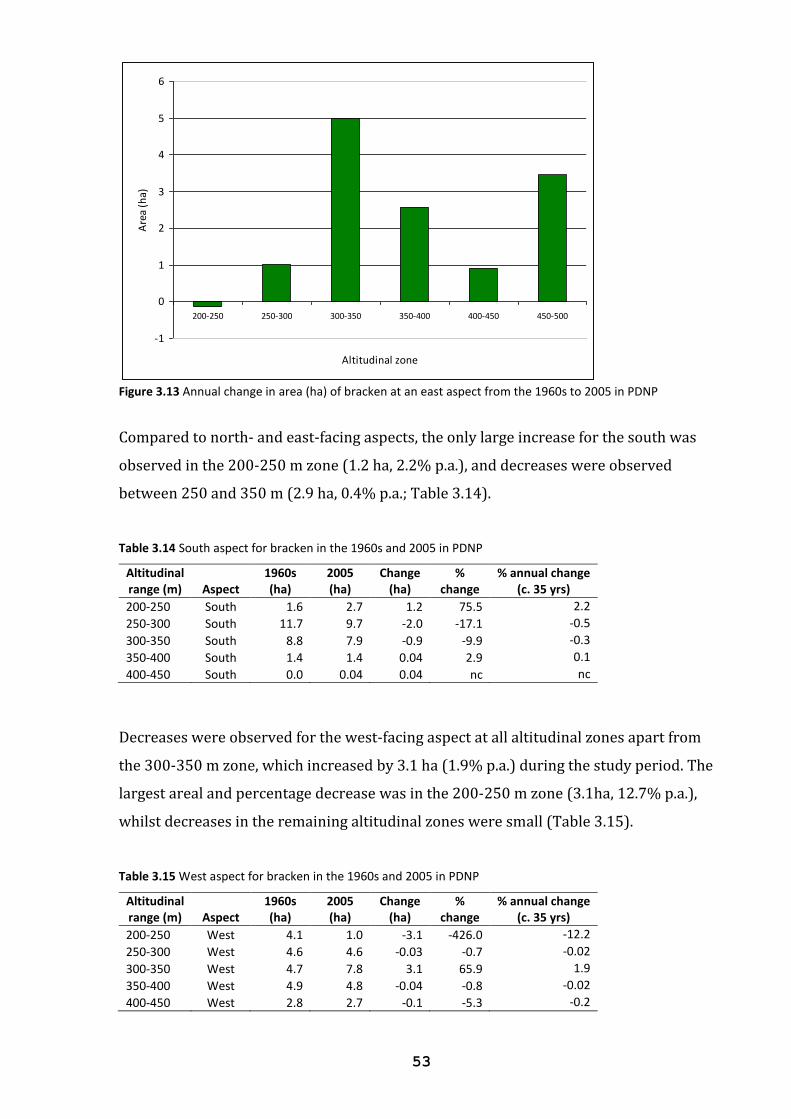
53
-1
0
1
2
3
4
5
6
200-250 250-300 300-350 350-400 400-450 450-500
Altitudinal zone
Are
a (h
a)
Figure 3.13 Annual change in area (ha) of bracken at an east aspect from the 1960s to 2005 in PDNP
Compared to north- and east-facing aspects, the only large increase for the south was
observed in the 200-250 m zone (1.2 ha, 2.2% p.a.), and decreases were observed
between 250 and 350 m (2.9 ha, 0.4% p.a.; Table 3.14).
Table 3.14 South aspect for bracken in the 1960s and 2005 in PDNP
Altitudinal range (m) Aspect
1960s (ha)
2005 (ha)
Change (ha)
% change
% annual change (c. 35 yrs)
200-250 South 1.6 2.7 1.2 75.5 2.2
250-300 South 11.7 9.7 -2.0 -17.1 -0.5
300-350 South 8.8 7.9 -0.9 -9.9 -0.3
350-400 South 1.4 1.4 0.04 2.9 0.1
400-450 South 0.0 0.04 0.04 nc nc
Decreases were observed for the west-facing aspect at all altitudinal zones apart from
the 300-350 m zone, which increased by 3.1 ha (1.9% p.a.) during the study period. The
largest areal and percentage decrease was in the 200-250 m zone (3.1ha, 12.7% p.a.),
whilst decreases in the remaining altitudinal zones were small (Table 3.15).
Table 3.15 West aspect for bracken in the 1960s and 2005 in PDNP
Altitudinal range (m) Aspect
1960s (ha)
2005 (ha)
Change (ha)
% change
% annual change (c. 35 yrs)
200-250 West 4.1 1.0 -3.1 -426.0 -12.2
250-300 West 4.6 4.6 -0.03 -0.7 -0.02
300-350 West 4.7 7.8 3.1 65.9 1.9
350-400 West 4.9 4.8 -0.04 -0.8 -0.02
400-450 West 2.8 2.7 -0.1 -5.3 -0.2
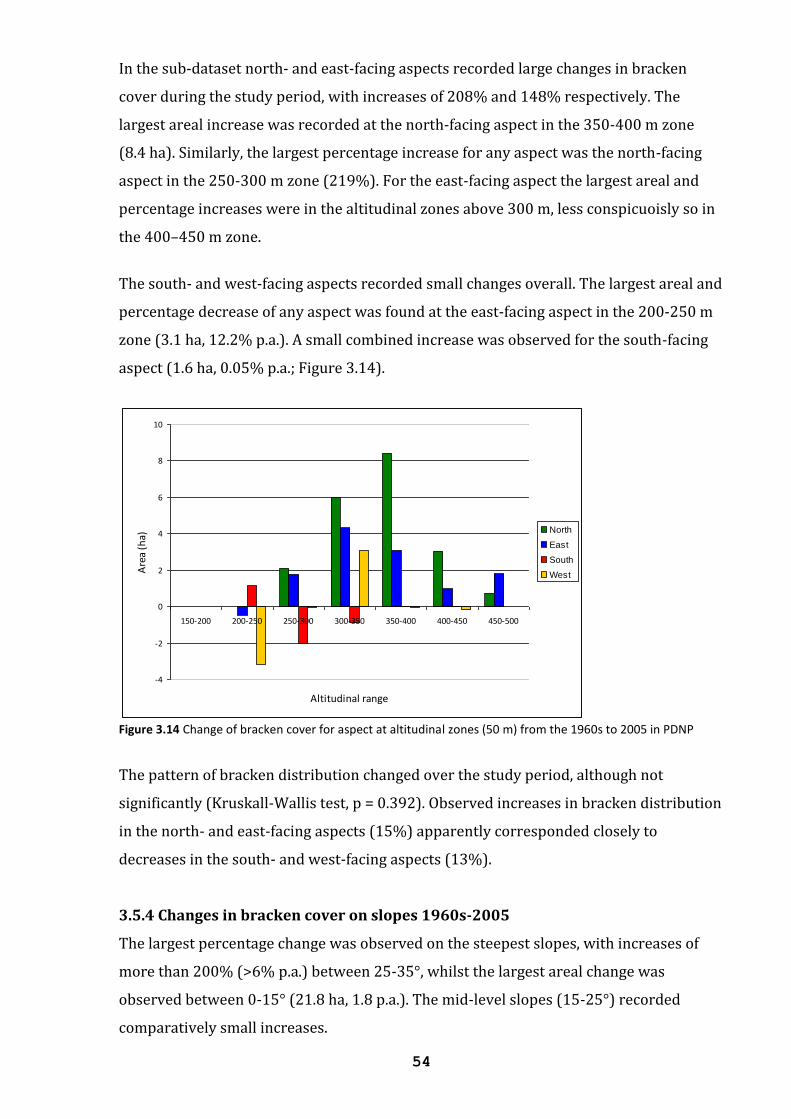
54
In the sub-dataset north- and east-facing aspects recorded large changes in bracken
cover during the study period, with increases of 208% and 148% respectively. The
largest areal increase was recorded at the north-facing aspect in the 350-400 m zone
(8.4 ha). Similarly, the largest percentage increase for any aspect was the north-facing
aspect in the 250-300 m zone (219%). For the east-facing aspect the largest areal and
percentage increases were in the altitudinal zones above 300 m, less conspicuoisly so in
the 400–450 m zone.
The south- and west-facing aspects recorded small changes overall. The largest areal and
percentage decrease of any aspect was found at the east-facing aspect in the 200-250 m
zone (3.1 ha, 12.2% p.a.). A small combined increase was observed for the south-facing
aspect (1.6 ha, 0.05% p.a.; Figure 3.14).
-4
-2
0
2
4
6
8
10
150-200 200-250 250-300 300-350 350-400 400-450 450-500
Altitudinal range
Are
a (h
a)
North
East
South
West
Figure 3.14 Change of bracken cover for aspect at altitudinal zones (50 m) from the 1960s to 2005 in PDNP
The pattern of bracken distribution changed over the study period, although not
significantly (Kruskall-Wallis test, p = 0.392). Observed increases in bracken distribution
in the north- and east-facing aspects (15%) apparently corresponded closely to
decreases in the south- and west-facing aspects (13%).
3.5.4 Changes in bracken cover on slopes 1960s-2005
The largest percentage change was observed on the steepest slopes, with increases of
more than 200% (>6% p.a.) between 25-35°, whilst the largest areal change was
observed between 0-15° (21.8 ha, 1.8 p.a.). The mid-level slopes (15-25°) recorded
comparatively small increases.
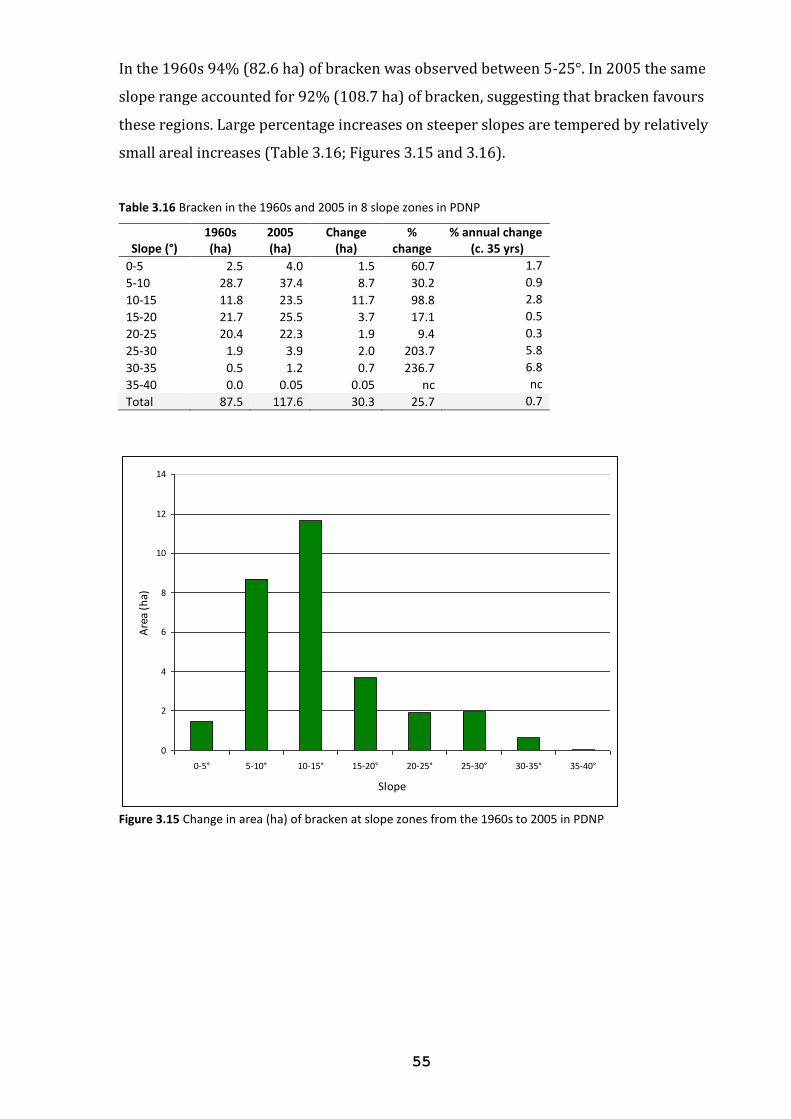
55
In the 1960s 94% (82.6 ha) of bracken was observed between 5-25°. In 2005 the same
slope range accounted for 92% (108.7 ha) of bracken, suggesting that bracken favours
these regions. Large percentage increases on steeper slopes are tempered by relatively
small areal increases (Table 3.16; Figures 3.15 and 3.16).
Table 3.16 Bracken in the 1960s and 2005 in 8 slope zones in PDNP
Slope (°) 1960s (ha)
2005 (ha)
Change (ha)
% change
% annual change (c. 35 yrs)
0-5 2.5 4.0 1.5 60.7 1.7
5-10 28.7 37.4 8.7 30.2 0.9
10-15 11.8 23.5 11.7 98.8 2.8
15-20 21.7 25.5 3.7 17.1 0.5
20-25 20.4 22.3 1.9 9.4 0.3
25-30 1.9 3.9 2.0 203.7 5.8
30-35 0.5 1.2 0.7 236.7 6.8
35-40 0.0 0.05 0.05 nc nc
Total 87.5 117.6 30.3 25.7 0.7
0
2
4
6
8
10
12
14
0-5° 5-10° 10-15° 15-20° 20-25° 25-30° 30-35° 35-40°
Slope
Are
a (h
a)
Figure 3.15 Change in area (ha) of bracken at slope zones from the 1960s to 2005 in PDNP
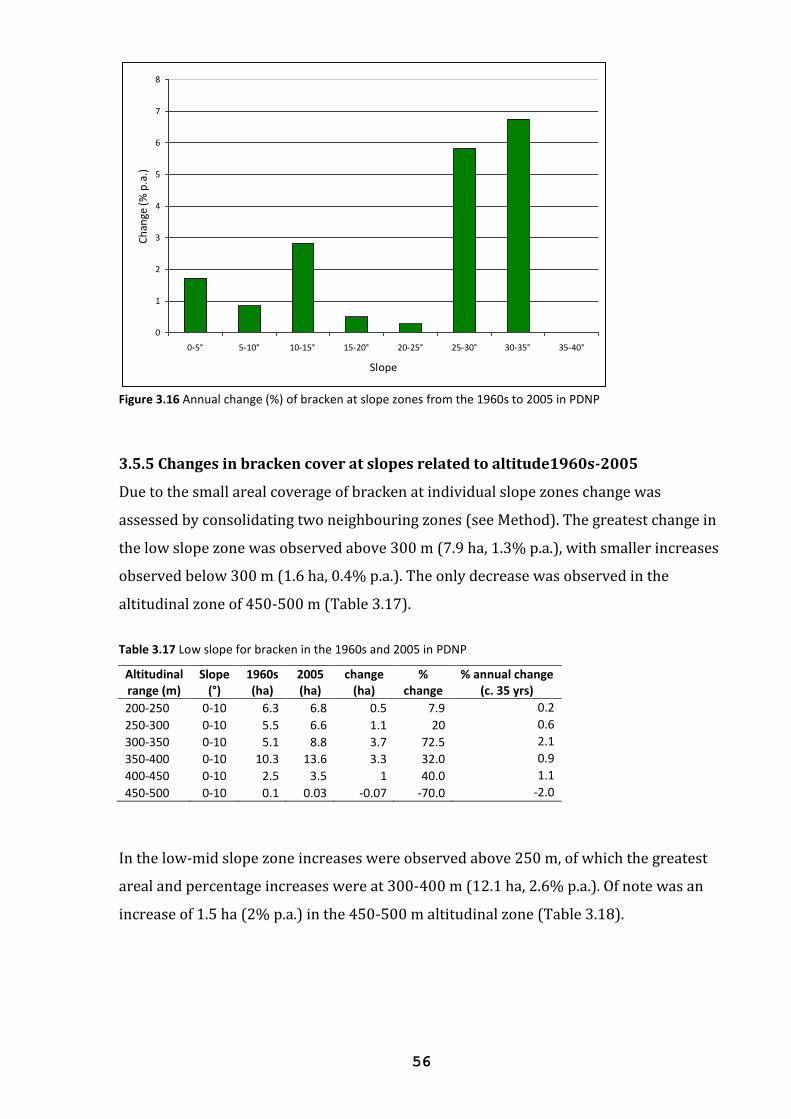
56
0
1
2
3
4
5
6
7
8
0-5° 5-10° 10-15° 15-20° 20-25° 25-30° 30-35° 35-40°
Slope
Ch
ange
(%
p.a
.)
Figure 3.16 Annual change (%) of bracken at slope zones from the 1960s to 2005 in PDNP
3.5.5 Changes in bracken cover at slopes related to altitude1960s-2005
Due to the small areal coverage of bracken at individual slope zones change was
assessed by consolidating two neighbouring zones (see Method). The greatest change in
the low slope zone was observed above 300 m (7.9 ha, 1.3% p.a.), with smaller increases
observed below 300 m (1.6 ha, 0.4% p.a.). The only decrease was observed in the
altitudinal zone of 450-500 m (Table 3.17).
Table 3.17 Low slope for bracken in the 1960s and 2005 in PDNP
Altitudinal range (m)
Slope (°)
1960s (ha)
2005 (ha)
change (ha)
% change
% annual change (c. 35 yrs)
200-250 0-10 6.3 6.8 0.5 7.9 0.2
250-300 0-10 5.5 6.6 1.1 20 0.6
300-350 0-10 5.1 8.8 3.7 72.5 2.1
350-400 0-10 10.3 13.6 3.3 32.0 0.9
400-450 0-10 2.5 3.5 1 40.0 1.1
450-500 0-10 0.1 0.03 -0.07 -70.0 -2.0
In the low-mid slope zone increases were observed above 250 m, of which the greatest
areal and percentage increases were at 300-400 m (12.1 ha, 2.6% p.a.). Of note was an
increase of 1.5 ha (2% p.a.) in the 450-500 m altitudinal zone (Table 3.18).
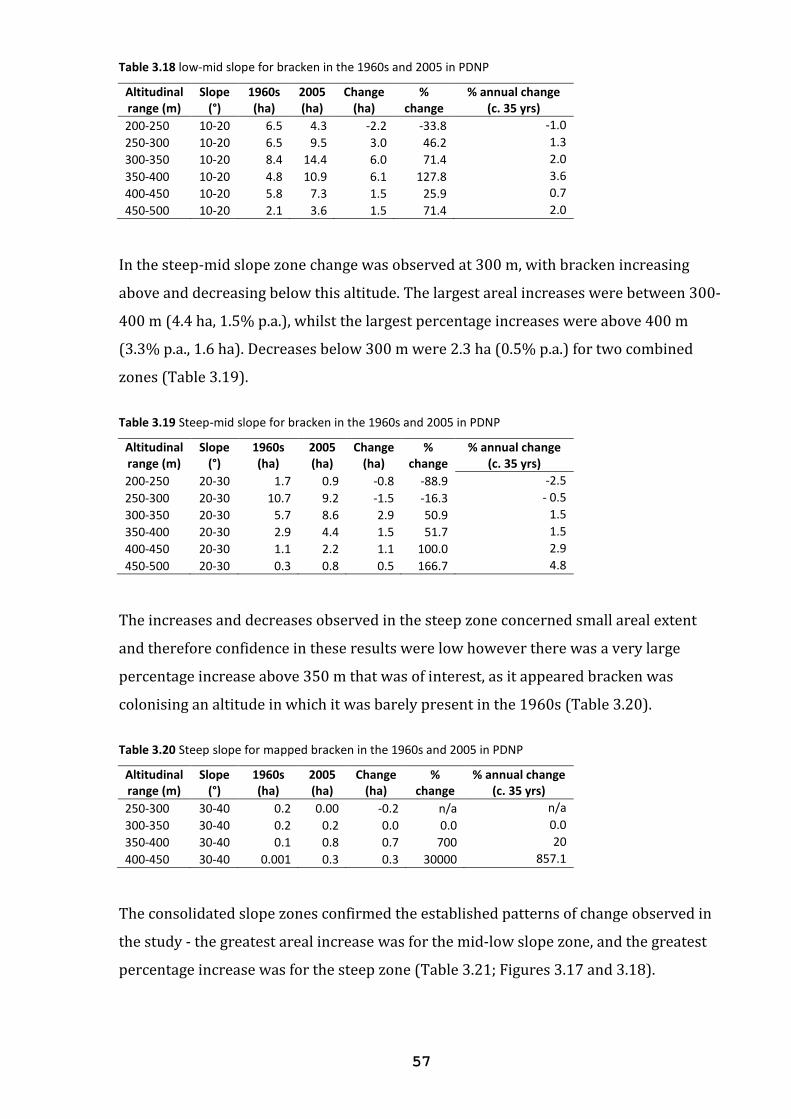
57
Table 3.18 low-mid slope for bracken in the 1960s and 2005 in PDNP
Altitudinal range (m)
Slope (°)
1960s (ha)
2005 (ha)
Change (ha)
% change
% annual change (c. 35 yrs)
200-250 10-20 6.5 4.3 -2.2 -33.8 -1.0
250-300 10-20 6.5 9.5 3.0 46.2 1.3
300-350 10-20 8.4 14.4 6.0 71.4 2.0
350-400 10-20 4.8 10.9 6.1 127.8 3.6
400-450 10-20 5.8 7.3 1.5 25.9 0.7
450-500 10-20 2.1 3.6 1.5 71.4 2.0
In the steep-mid slope zone change was observed at 300 m, with bracken increasing
above and decreasing below this altitude. The largest areal increases were between 300-
400 m (4.4 ha, 1.5% p.a.), whilst the largest percentage increases were above 400 m
(3.3% p.a., 1.6 ha). Decreases below 300 m were 2.3 ha (0.5% p.a.) for two combined
zones (Table 3.19).
Table 3.19 Steep-mid slope for bracken in the 1960s and 2005 in PDNP
Altitudinal range (m)
Slope (°)
1960s (ha)
2005 (ha)
Change (ha)
% change
% annual change (c. 35 yrs)
200-250 20-30 1.7 0.9 -0.8 -88.9 -2.5
250-300 20-30 10.7 9.2 -1.5 -16.3 - 0.5
300-350 20-30 5.7 8.6 2.9 50.9 1.5
350-400 20-30 2.9 4.4 1.5 51.7 1.5
400-450 20-30 1.1 2.2 1.1 100.0 2.9
450-500 20-30 0.3 0.8 0.5 166.7 4.8
The increases and decreases observed in the steep zone concerned small areal extent
and therefore confidence in these results were low however there was a very large
percentage increase above 350 m that was of interest, as it appeared bracken was
colonising an altitude in which it was barely present in the 1960s (Table 3.20).
Table 3.20 Steep slope for mapped bracken in the 1960s and 2005 in PDNP
Altitudinal range (m)
Slope (°)
1960s (ha)
2005 (ha)
Change (ha)
% change
% annual change (c. 35 yrs)
250-300 30-40 0.2 0.00 -0.2 n/a n/a
300-350 30-40 0.2 0.2 0.0 0.0 0.0
350-400 30-40 0.1 0.8 0.7 700 20
400-450 30-40 0.001 0.3 0.3 30000 857.1
The consolidated slope zones confirmed the established patterns of change observed in
the study - the greatest areal increase was for the mid-low slope zone, and the greatest
percentage increase was for the steep zone (Table 3.21; Figures 3.17 and 3.18).
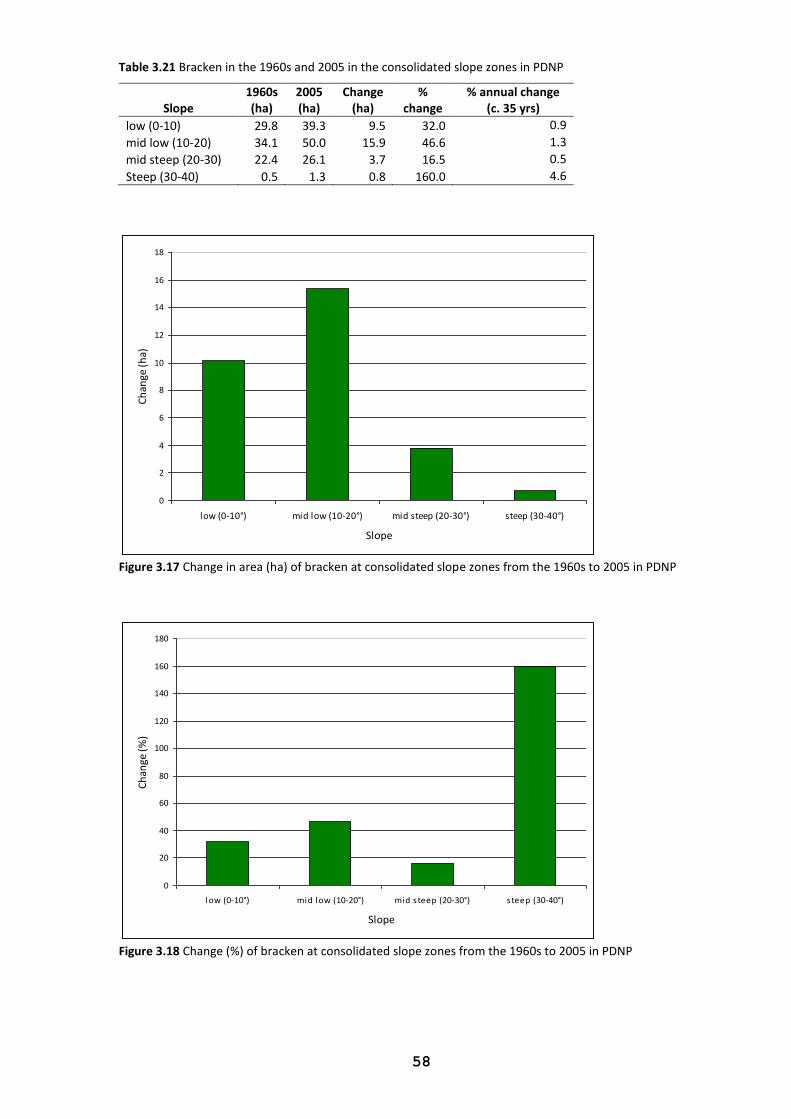
58
Table 3.21 Bracken in the 1960s and 2005 in the consolidated slope zones in PDNP
Slope 1960s (ha)
2005 (ha)
Change (ha)
% change
% annual change (c. 35 yrs)
low (0-10) 29.8 39.3 9.5 32.0 0.9
mid low (10-20) 34.1 50.0 15.9 46.6 1.3
mid steep (20-30) 22.4 26.1 3.7 16.5 0.5
Steep (30-40) 0.5 1.3 0.8 160.0 4.6
0
2
4
6
8
10
12
14
16
18
low (0-10°) mid low (10-20°) mid steep (20-30°) steep (30-40°)
Slope
Ch
ange
(h
a)
Figure 3.17 Change in area (ha) of bracken at consolidated slope zones from the 1960s to 2005 in PDNP
0
20
40
60
80
100
120
140
160
180
low (0-10°) mid low (10-20°) mid s teep (20-30°) s teep (30-40°)
Slope
Ch
ange
(%
)
Figure 3.18 Change (%) of bracken at consolidated slope zones from the 1960s to 2005 in PDNP
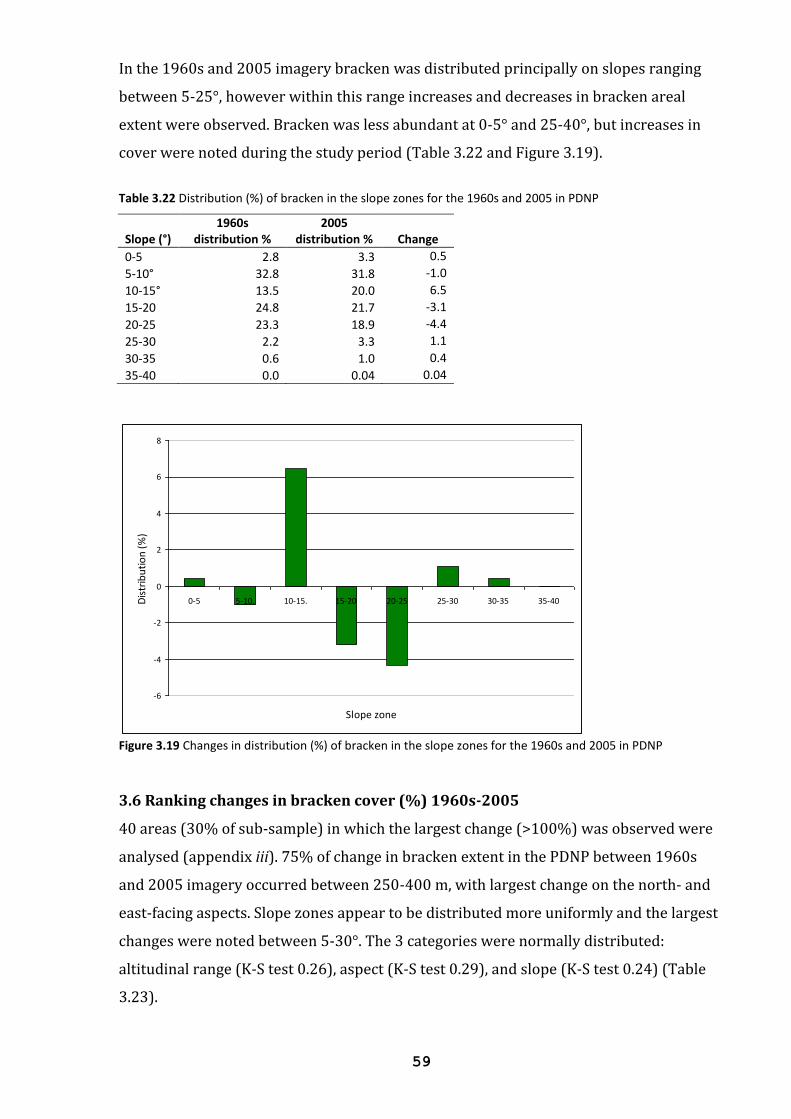
59
In the 1960s and 2005 imagery bracken was distributed principally on slopes ranging
between 5-25°, however within this range increases and decreases in bracken areal
extent were observed. Bracken was less abundant at 0-5° and 25-40°, but increases in
cover were noted during the study period (Table 3.22 and Figure 3.19).
Table 3.22 Distribution (%) of bracken in the slope zones for the 1960s and 2005 in PDNP
Slope (°) 1960s
distribution % 2005
distribution %
Change
0-5 2.8 3.3 0.5
5-10° 32.8 31.8 -1.0
10-15° 13.5 20.0 6.5
15-20 24.8 21.7 -3.1
20-25 23.3 18.9 -4.4
25-30 2.2 3.3 1.1
30-35 0.6 1.0 0.4
35-40 0.0 0.04 0.04
-6
-4
-2
0
2
4
6
8
0-5 5-10. 10-15. 15-20 20-25 25-30 30-35 35-40
Slope zone
Dis
trib
uti
on
(%
)
Figure 3.19 Changes in distribution (%) of bracken in the slope zones for the 1960s and 2005 in PDNP
3.6 Ranking changes in bracken cover (%) 1960s-2005
40 areas (30% of sub-sample) in which the largest change (>100%) was observed were
analysed (appendix iii). 75% of change in bracken extent in the PDNP between 1960s
and 2005 imagery occurred between 250-400 m, with largest change on the north- and
east-facing aspects. Slope zones appear to be distributed more uniformly and the largest
changes were noted between 5-30°. The 3 categories were normally distributed:
altitudinal range (K-S test 0.26), aspect (K-S test 0.29), and slope (K-S test 0.24) (Table
3.23).
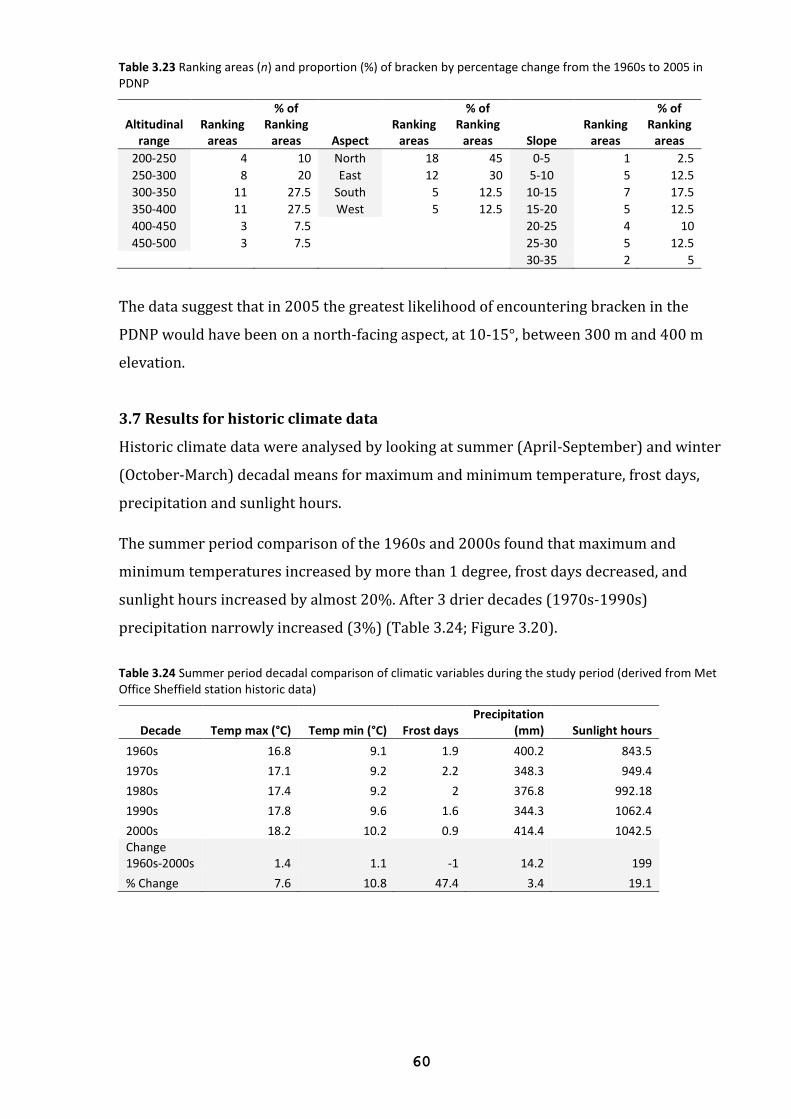
60
Table 3.23 Ranking areas (n) and proportion (%) of bracken by percentage change from the 1960s to 2005 in PDNP
Altitudinal range
Ranking areas
% of Ranking
areas Aspect Ranking
areas
% of Ranking
areas Slope Ranking
areas
% of Ranking
areas
200-250 4 10 North 18 45 0-5 1 2.5
250-300 8 20 East 12 30 5-10 5 12.5
300-350 11 27.5 South 5 12.5 10-15 7 17.5
350-400 11 27.5 West 5 12.5 15-20 5 12.5
400-450 3 7.5 20-25 4 10
450-500 3 7.5 25-30 5 12.5
30-35 2 5
The data suggest that in 2005 the greatest likelihood of encountering bracken in the
PDNP would have been on a north-facing aspect, at 10-15°, between 300 m and 400 m
elevation.
3.7 Results for historic climate data
Historic climate data were analysed by looking at summer (April-September) and winter
(October-March) decadal means for maximum and minimum temperature, frost days,
precipitation and sunlight hours.
The summer period comparison of the 1960s and 2000s found that maximum and
minimum temperatures increased by more than 1 degree, frost days decreased, and
sunlight hours increased by almost 20%. After 3 drier decades (1970s-1990s)
precipitation narrowly increased (3%) (Table 3.24; Figure 3.20).
Table 3.24 Summer period decadal comparison of climatic variables during the study period (derived from Met Office Sheffield station historic data)
Decade Temp max (°C) Temp min (°C) Frost days Precipitation
(mm) Sunlight hours
1960s 16.8 9.1 1.9 400.2 843.5
1970s 17.1 9.2 2.2 348.3 949.4
1980s 17.4 9.2 2 376.8 992.18
1990s 17.8 9.6 1.6 344.3 1062.4
2000s 18.2 10.2 0.9 414.4 1042.5 Change 1960s-2000s 1.4 1.1 -1 14.2 199
% Change 7.6 10.8 47.4 3.4 19.1
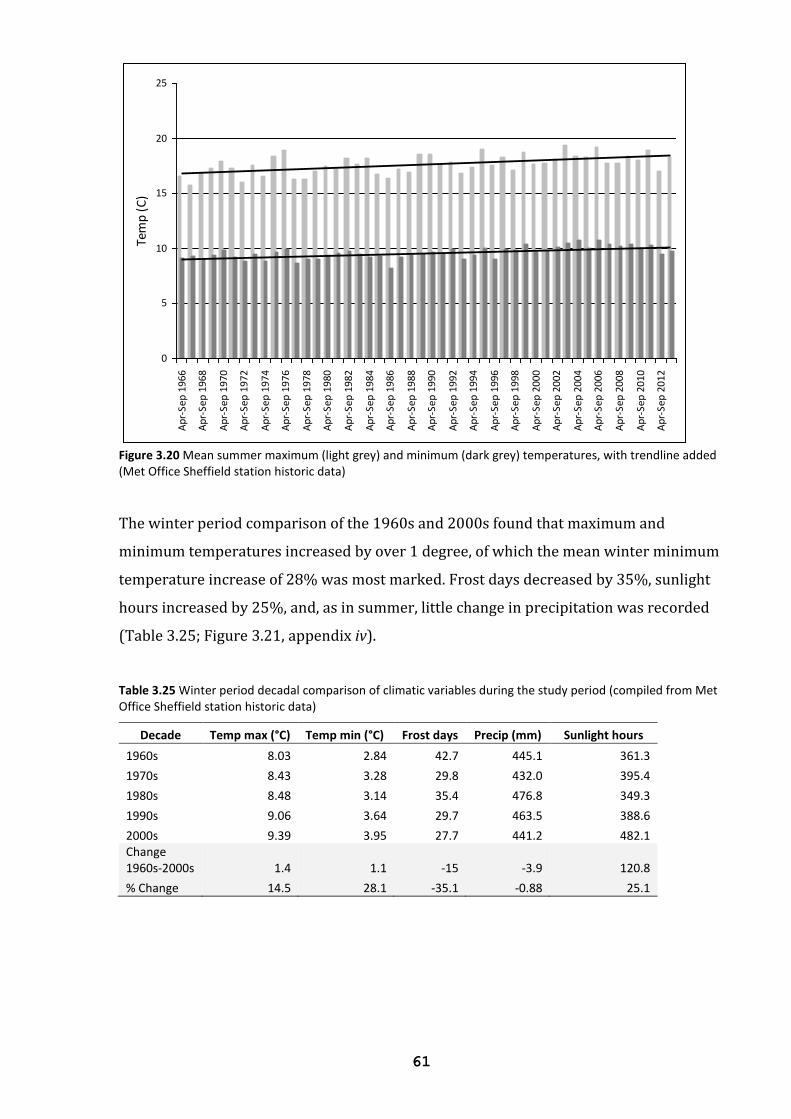
61
0
5
10
15
20
25
Ap
r-Se
p 19
66
Ap
r-Se
p 19
68
Ap
r-Se
p 19
70
Ap
r-Se
p 19
72
Ap
r-Se
p 19
74
Ap
r-Se
p 19
76
Ap
r-Se
p 19
78
Ap
r-Se
p 19
80
Ap
r-Se
p 19
82
Ap
r-Se
p 19
84
Ap
r-Se
p 19
86
Ap
r-Se
p 19
88
Ap
r-Se
p 19
90
Ap
r-Se
p 19
92
Ap
r-Se
p 19
94
Ap
r-Se
p 19
96
Ap
r-Se
p 19
98
Ap
r-Se
p 20
00
Ap
r-Se
p 20
02
Ap
r-Se
p 20
04
Ap
r-Se
p 20
06
Ap
r-Se
p 20
08
Ap
r-Se
p 20
10
Ap
r-Se
p 20
12
Tem
p (
C)
Figure 3.20 Mean summer maximum (light grey) and minimum (dark grey) temperatures, with trendline added (Met Office Sheffield station historic data)
The winter period comparison of the 1960s and 2000s found that maximum and
minimum temperatures increased by over 1 degree, of which the mean winter minimum
temperature increase of 28% was most marked. Frost days decreased by 35%, sunlight
hours increased by 25%, and, as in summer, little change in precipitation was recorded
(Table 3.25; Figure 3.21, appendix iv).
Table 3.25 Winter period decadal comparison of climatic variables during the study period (compiled from Met Office Sheffield station historic data)
Decade Temp max (°C) Temp min (°C) Frost days Precip (mm) Sunlight hours
1960s 8.03 2.84 42.7 445.1 361.3
1970s 8.43 3.28 29.8 432.0 395.4
1980s 8.48 3.14 35.4 476.8 349.3
1990s 9.06 3.64 29.7 463.5 388.6
2000s 9.39 3.95 27.7 441.2 482.1 Change 1960s-2000s 1.4 1.1 -15 -3.9 120.8
% Change 14.5 28.1 -35.1 -0.88 25.1
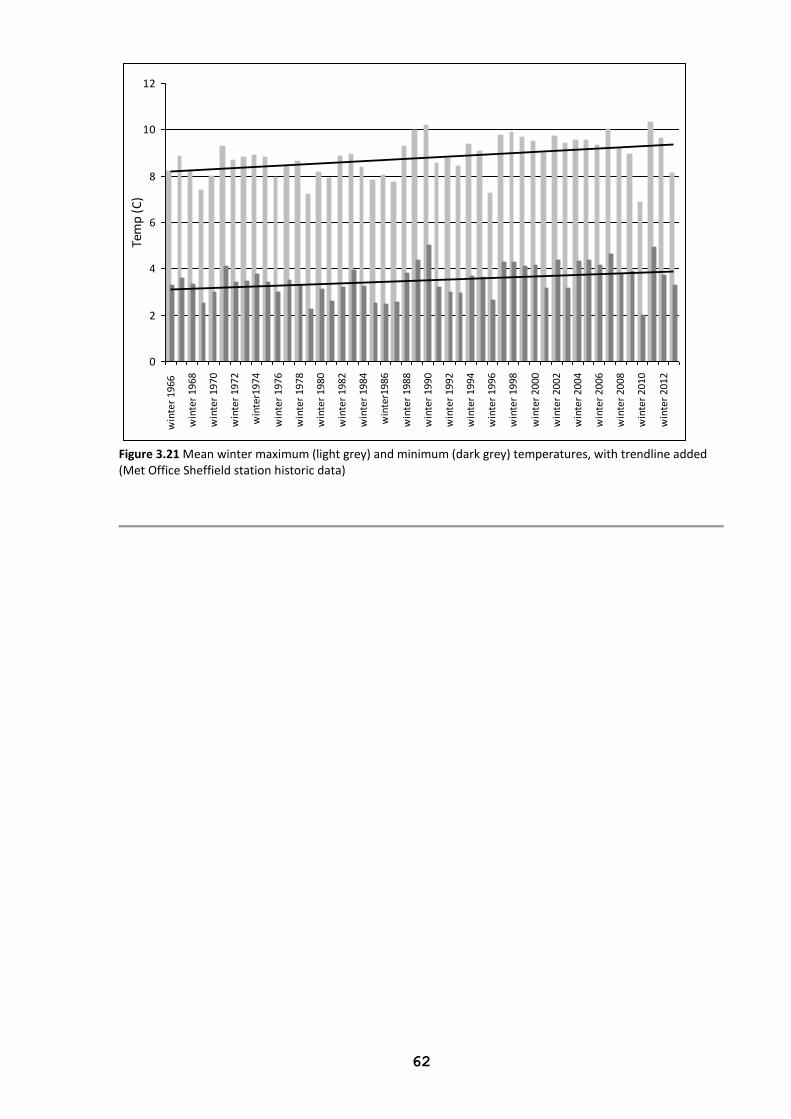
62
0
2
4
6
8
10
12
win
ter
1966
win
ter
1968
win
ter
1970
win
ter
1972
win
ter1
974
win
ter
1976
win
ter
1978
win
ter
1980
win
ter
1982
win
ter
1984
win
ter1
986
win
ter
1988
win
ter
1990
win
ter
1992
win
ter
1994
win
ter
1996
win
ter
1998
win
ter
2000
win
ter
2002
win
ter
2004
win
ter
2006
win
ter
2008
win
ter
2010
win
ter
2012
Tem
p (
C)
Figure 3.21 Mean winter maximum (light grey) and minimum (dark grey) temperatures, with trendline added (Met Office Sheffield station historic data)
63
4. Discussion
4.1 Bracken in the PDNP in 2005
The rate of bracken spread of around 1-3% p.a. has been identified in previous studies
(e.g. Miller et al., 1990; Hopkins et al., 1988), with annual advances of up to 87 cm
recorded in heather moorland (Cox, 2007). However there is uncertainty of bracken’s
true coverage in the UK (Birnie et al., 2000; Pakeman et al., 2000). The 1990 Countryside
Survey estimated there were 930 km2 of bracken broad habitat in England, by 1998
increasing to 1090 km2, and by 2007 declining to 910 km2 (Carey et al., 2008). However,
accurate identification of vegetation classes is problematic (Clutterbuck, pers. comm.,
2014), and standard errors are large (Pakeman et al., 1996).
In the PDNP previous surveys (up to 1990) have broadly consented on bracken’s
distribution and extent – about 30 km2 in the moorlands (Anderson and Radford, 1988),
and 35 km2 in the whole park (Pakeman et al., 1996). This study suggests that bracken
may have covered 62 km2 of PDNP in 2005. If the 2005 sample is representative of the
PDNP, between 1990 and 2005 bracken cover increased by 27 km2, a 1.8% p.a. gain
comparable with previously identified rates of spread, but which is twice that observed
in the sub-sample (0.9% p.a.) comparison between the 1960s and 2005, suggesting both
more rapid recent range expansion, and possibly more effective bracken control
between the 1960s and 1990.
However bracken control remained prevalent in the PDNP after 1990, and management
practices and climate were not exceptional compared to the rest of the country. It is
suggested that if the methods employed in this study - only identified bracken was
mapped, and, as far as possible, within bracken stands areas of grassland, trees, heather,
and bare ground were excluded (or clipped out, Figure 4.1) - were applied to the earlier
surveys the bracken extent may have been larger. For example in the 1990 Countryside
Survey (from which Pakeman et al., 1996 derived bracken’s extent) “estimates were
based on assessments of the cover of bracken as a proportion of each square” (Pakeman
et al., 1996), and may have underestimated bracken’s true extent. Thus, rather than
bracken’s expansion rate doubling after 1990, perhaps gradual and continuous spread
occurred that had not been recognised.
Birnie et al. (2000) acknowledge data deficiencies on actual bracken distribution. There
is poor understanding of the dynamics and drivers of bracken spread and retreat
because it persists over such a broad spectrum of environmental conditions, and it’s
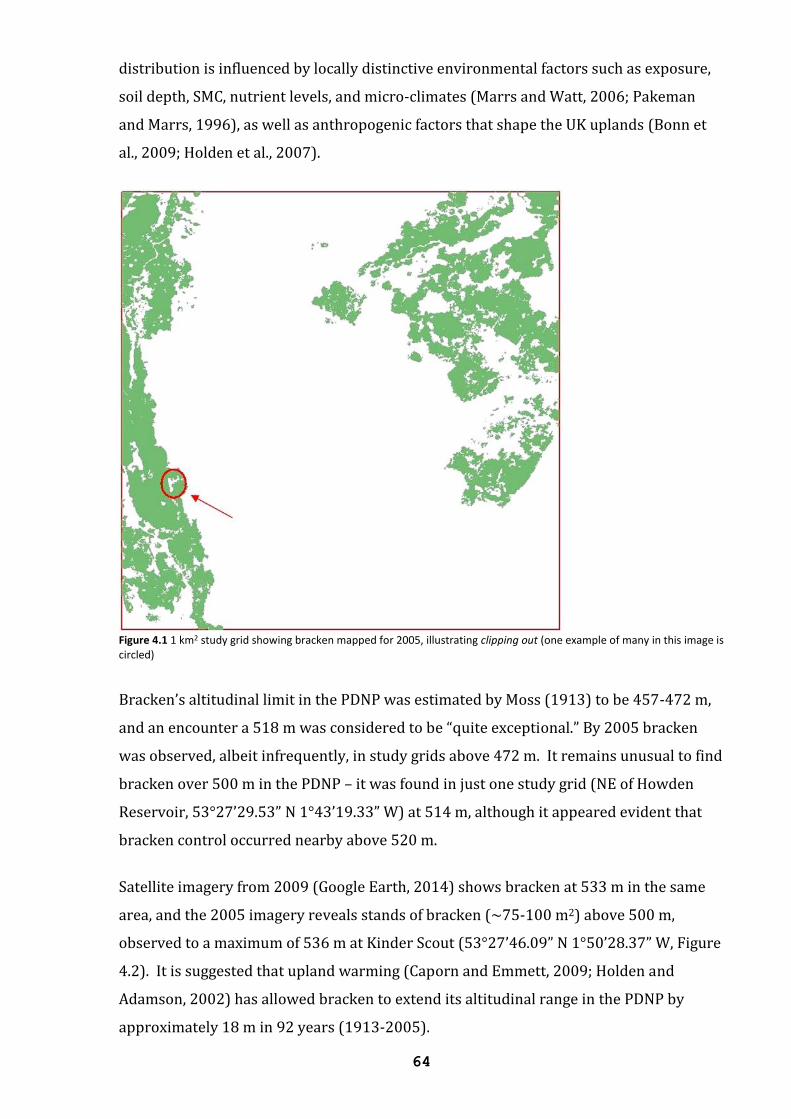
64
distribution is influenced by locally distinctive environmental factors such as exposure,
soil depth, SMC, nutrient levels, and micro-climates (Marrs and Watt, 2006; Pakeman
and Marrs, 1996), as well as anthropogenic factors that shape the UK uplands (Bonn et
al., 2009; Holden et al., 2007).
Figure 4.1 1 km2 study grid showing bracken mapped for 2005, illustrating clipping out (one example of many in this image is circled)
Bracken’s altitudinal limit in the PDNP was estimated by Moss (1913) to be 457-472 m,
and an encounter a 518 m was considered to be “quite exceptional.” By 2005 bracken
was observed, albeit infrequently, in study grids above 472 m. It remains unusual to find
bracken over 500 m in the PDNP – it was found in just one study grid (NE of Howden
Reservoir, 53°27’29.53” N 1°43’19.33” W) at 514 m, although it appeared evident that
bracken control occurred nearby above 520 m.
Satellite imagery from 2009 (Google Earth, 2014) shows bracken at 533 m in the same
area, and the 2005 imagery reveals stands of bracken (~75-100 m2) above 500 m,
observed to a maximum of 536 m at Kinder Scout (53°27’46.09” N 1°50’28.37” W, Figure
4.2). It is suggested that upland warming (Caporn and Emmett, 2009; Holden and
Adamson, 2002) has allowed bracken to extend its altitudinal range in the PDNP by
approximately 18 m in 92 years (1913-2005).
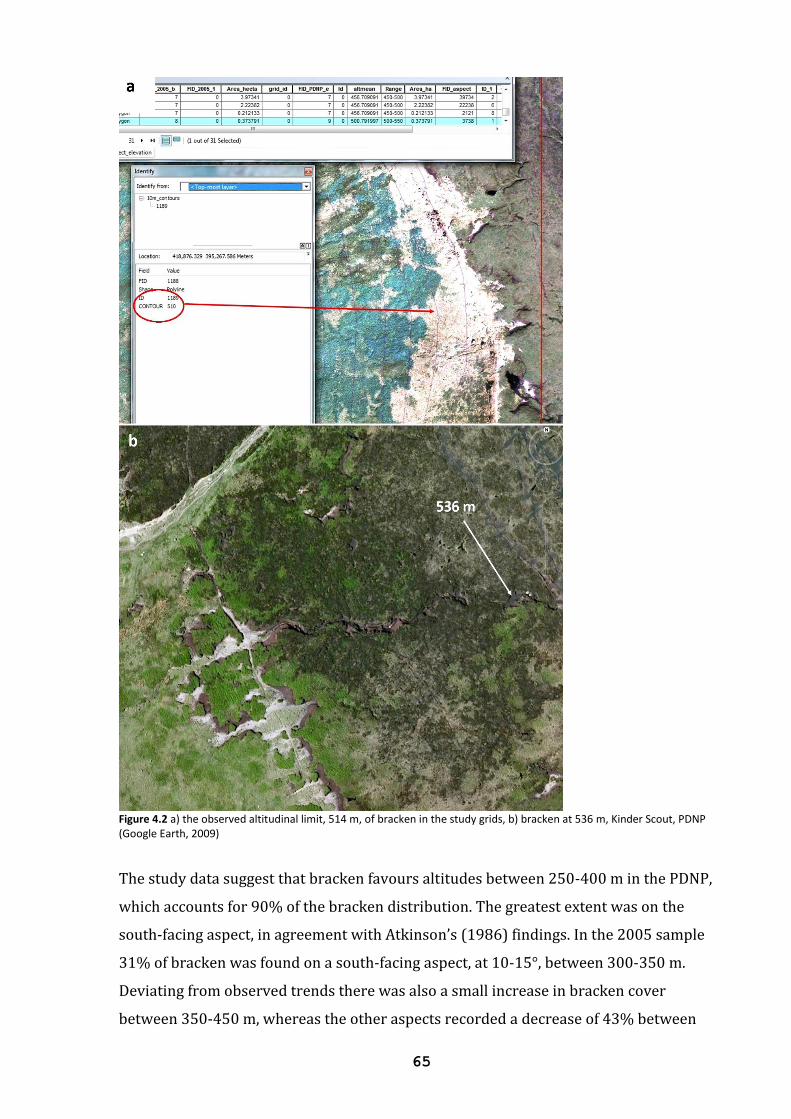
65
Figure 4.2 a) the observed altitudinal limit, 514 m, of bracken in the study grids, b) bracken at 536 m, Kinder Scout, PDNP (Google Earth, 2009)
The study data suggest that bracken favours altitudes between 250-400 m in the PDNP,
which accounts for 90% of the bracken distribution. The greatest extent was on the
south-facing aspect, in agreement with Atkinson’s (1986) findings. In the 2005 sample
31% of bracken was found on a south-facing aspect, at 10-15°, between 300-350 m.
Deviating from observed trends there was also a small increase in bracken cover
between 350-450 m, whereas the other aspects recorded a decrease of 43% between
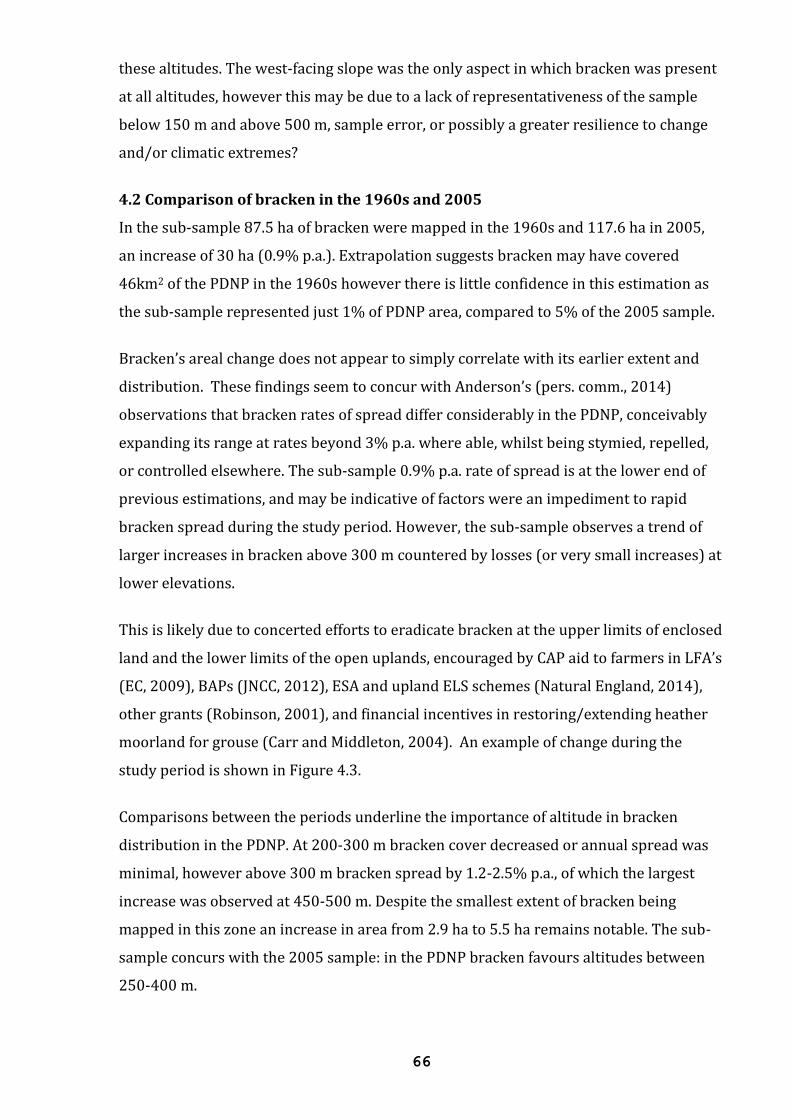
66
these altitudes. The west-facing slope was the only aspect in which bracken was present
at all altitudes, however this may be due to a lack of representativeness of the sample
below 150 m and above 500 m, sample error, or possibly a greater resilience to change
and/or climatic extremes?
4.2 Comparison of bracken in the 1960s and 2005
In the sub-sample 87.5 ha of bracken were mapped in the 1960s and 117.6 ha in 2005,
an increase of 30 ha (0.9% p.a.). Extrapolation suggests bracken may have covered
46km2 of the PDNP in the 1960s however there is little confidence in this estimation as
the sub-sample represented just 1% of PDNP area, compared to 5% of the 2005 sample.
Bracken’s areal change does not appear to simply correlate with its earlier extent and
distribution. These findings seem to concur with Anderson’s (pers. comm., 2014)
observations that bracken rates of spread differ considerably in the PDNP, conceivably
expanding its range at rates beyond 3% p.a. where able, whilst being stymied, repelled,
or controlled elsewhere. The sub-sample 0.9% p.a. rate of spread is at the lower end of
previous estimations, and may be indicative of factors were an impediment to rapid
bracken spread during the study period. However, the sub-sample observes a trend of
larger increases in bracken above 300 m countered by losses (or very small increases) at
lower elevations.
This is likely due to concerted efforts to eradicate bracken at the upper limits of enclosed
land and the lower limits of the open uplands, encouraged by CAP aid to farmers in LFA’s
(EC, 2009), BAPs (JNCC, 2012), ESA and upland ELS schemes (Natural England, 2014),
other grants (Robinson, 2001), and financial incentives in restoring/extending heather
moorland for grouse (Carr and Middleton, 2004). An example of change during the
study period is shown in Figure 4.3.
Comparisons between the periods underline the importance of altitude in bracken
distribution in the PDNP. At 200-300 m bracken cover decreased or annual spread was
minimal, however above 300 m bracken spread by 1.2-2.5% p.a., of which the largest
increase was observed at 450-500 m. Despite the smallest extent of bracken being
mapped in this zone an increase in area from 2.9 ha to 5.5 ha remains notable. The sub-
sample concurs with the 2005 sample: in the PDNP bracken favours altitudes between
250-400 m.
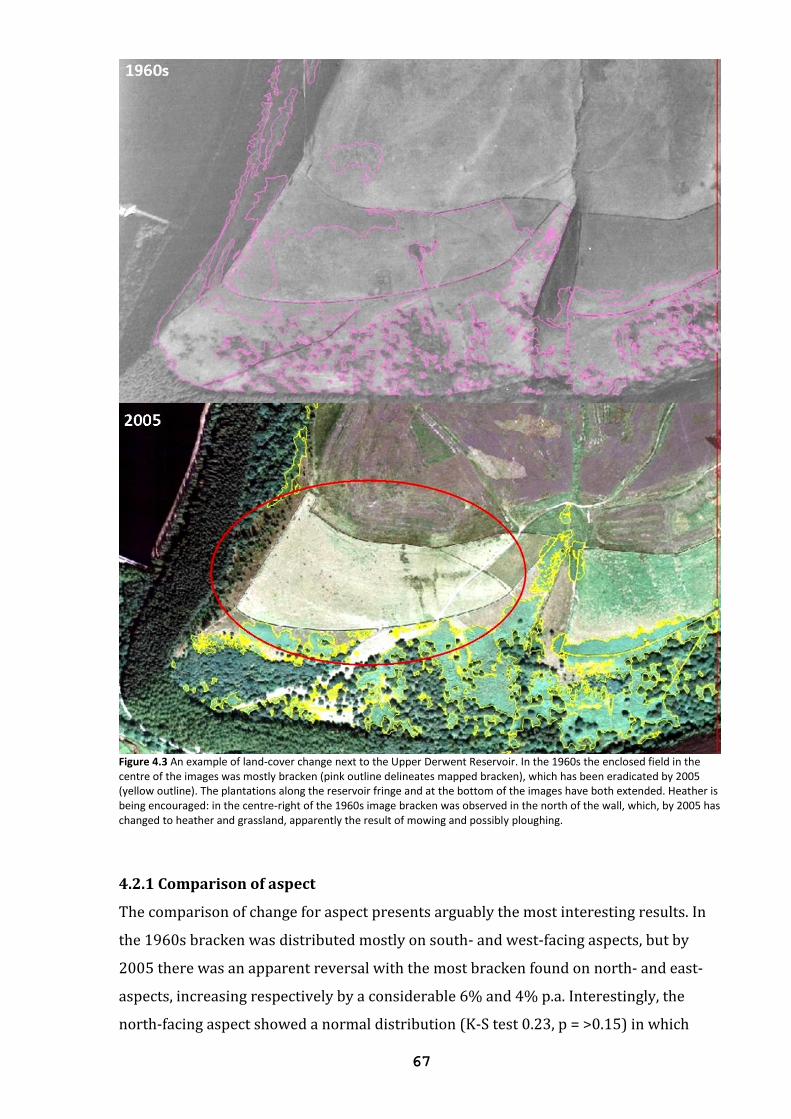
67
Figure 4.3 An example of land-cover change next to the Upper Derwent Reservoir. In the 1960s the enclosed field in the centre of the images was mostly bracken (pink outline delineates mapped bracken), which has been eradicated by 2005 (yellow outline). The plantations along the reservoir fringe and at the bottom of the images have both extended. Heather is being encouraged: in the centre-right of the 1960s image bracken was observed in the north of the wall, which, by 2005 has changed to heather and grassland, apparently the result of mowing and possibly ploughing.
4.2.1 Comparison of aspect
The comparison of change for aspect presents arguably the most interesting results. In
the 1960s bracken was distributed mostly on south- and west-facing aspects, but by
2005 there was an apparent reversal with the most bracken found on north- and east-
aspects, increasing respectively by a considerable 6% and 4% p.a. Interestingly, the
north-facing aspect showed a normal distribution (K-S test 0.23, p = >0.15) in which
68
there was no change below 250 m, the greatest at 250-300 m (6.3% p.a.), and an
incremental decrease in change through the other altitudinal zones (from 4.8-1.5% p.a.),
which suggests bracken to favour altitudes around 250-350 m. A more haphazard
distribution was observed for the east-facing aspect. There were small decreases in
extent in the south- and west-facing aspects, presenting a correlation in which two
aspects increased and two decreased. However, the distributions between aspects were
relatively analogous, suggesting previous barriers to bracken spread in north- and east-
facing slopes had diminished.
The reasons for this change can only be hypothesised. Marrs (pers. comm., 2014)
suggests bracken may be more rapidly expanding into areas that were previously on the
periphery of its range (i.e. northern and eastern areas), whereas in southern and
western areas at corresponding altitudes bracken was already more established. It might
be presupposed that under climate change bracken spread at all aspects would be
similar, but possibly such contrasts may be explained by the diversity of upland
microclimates.
Anderson (pers. comm., 2014) suggested that spring droughts, a more recent
phenomenon, have stymied bracken spread on slopes more susceptible to drying from
the sun and prevailing winds (i.e. south and west facing). Her study of dunes in Jersey
found bracken in dune grassland disappeared during very dry summers. Moreover
heather is less affected by drought unless close to their flowering period in late summer,
and despite drought-tolerance, bracken is sensitive in its early growing phase. One-off
droughts are believed to have more impact on plant phenology than gradual climate
change over the short- and mid-term (Nagy et al., 2013). Such events are likely to
diminish the suitability of a locale for one species, and thus help increase its suitability
for another species (Evans and Pearce-Higgins, 2013).
The data differ from the 2005 sample, in which the most bracken was observed on
south-facing aspects, and it is possible a larger sample for the 1960s would have found
similar results. However, the sub-sample may be an accurate indication of changes above
200 m, local changes, and/or specific, local environmental conditions that both
encourage north- and east-facing bracken spread and discourage south- and west-facing
spread. Or – unlikely as it is - the sub-sample may be more representative and highlight a
trend of bracken distribution
69
The mean location of the sub-sample was more northerly than the 2005 sample, and 11
(85%) of the sample grids covered open heather moorland compared to 21 (60%) of the
2005 sample. This prompts a question of whether this change is representative of
upland moorland change in the Dark Peak, or whether the change is site specific, one
that may not be observable in a larger sample.
In the 2005 sample south-facing aspects remained the dominant aspect in which to find
bracken between 250-400 m, whilst the most bracken at 400-450 m was observed on
west-facing aspects, therefore the findings may be local, even site specific, however they
should not be dismissed. Anderson (pers. comm., 2014) noted variation in bracken
spread, from “significant” change, especially the Howden/Derwent National Trust
region, to areas in which bracken distribution appeared stable.
4.2.2 Comparison of slope
The largest areal extent of bracken was observed on slopes from 5-25° (92%), however
the greatest change occurred on the steepest slopes (>25°). This trend was commonly
observed at all altitudinal ranges, although the mid-slope (20-30°) increased less than
the other zones (0.5% p.a. compared to 0.9-1.6% p.a.). Observations suggest that
bracken is less able to advance on steep slopes due to local physical and environmental
conditions (e.g. shallow soils, leaching, exposure, microclimates). The presence of
bracken on steeper slopes is viewed as beneficial, stabilising the habitat and preventing
erosion (Natural England, 2008).
4.3 Climate change
Anthropogenic climate change is unequivocal and unprecedented change can be
expected (IPCC, 2013). The distributions of species, their capacity to reproduce,
community interactions, and ecosystem functions are under threat (Barnosky et al.,
2012; Hulme, 2005; Berry et al., 2003). Environments of climatic extremes are especially
vulnerable (Callaghan et al., 1992), including uplands that provide important ecosystem
services and are refuges for many rare species adapted to harsh conditions (PDNPA,
2011; Grime et al., 2008, Table 4.1). The ability to adapt or migrate will determine the
future of many upland species, as broad-niche generalists, like bracken, prosper at the
expense of many specialists (Higgins and Richardson, 2014; Albert et al., 2012; Trivedi et
al., 2008).
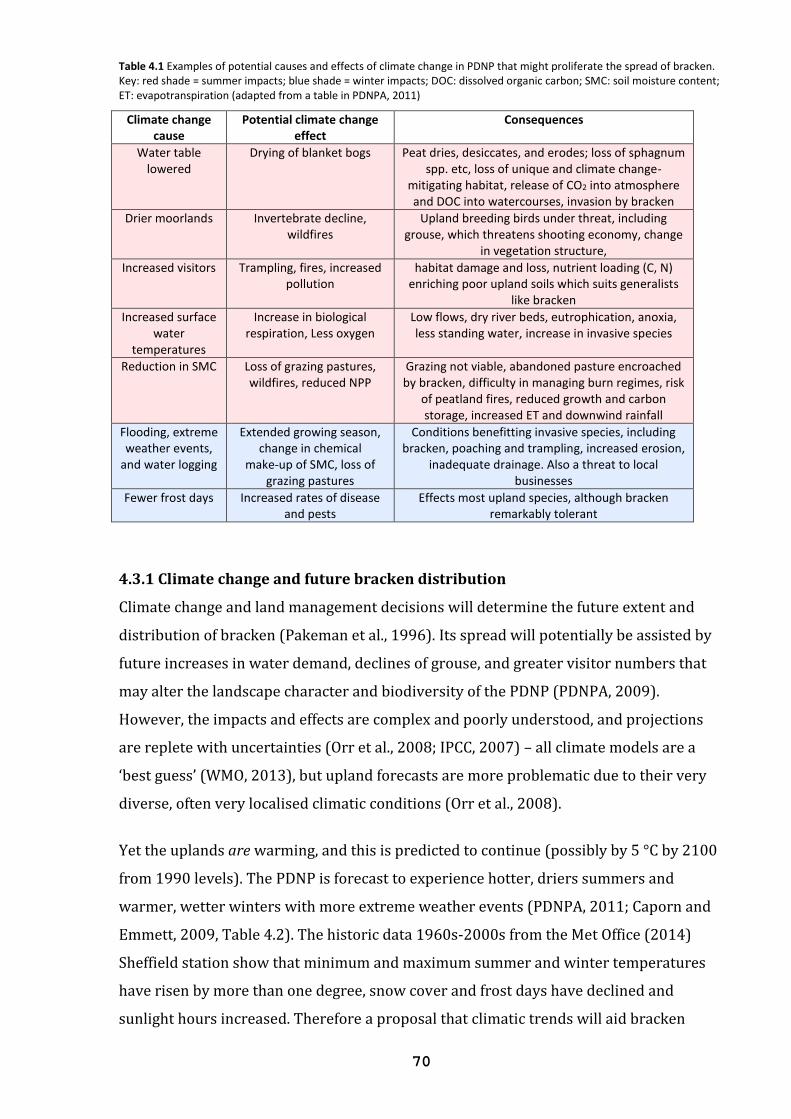
70
Table 4.1 Examples of potential causes and effects of climate change in PDNP that might proliferate the spread of bracken. Key: red shade = summer impacts; blue shade = winter impacts; DOC: dissolved organic carbon; SMC: soil moisture content; ET: evapotranspiration (adapted from a table in PDNPA, 2011)
Climate change cause
Potential climate change effect
Consequences
Water table lowered
Drying of blanket bogs Peat dries, desiccates, and erodes; loss of sphagnum spp. etc, loss of unique and climate change-
mitigating habitat, release of CO2 into atmosphere and DOC into watercourses, invasion by bracken
Drier moorlands Invertebrate decline, wildfires
Upland breeding birds under threat, including grouse, which threatens shooting economy, change
in vegetation structure,
Increased visitors Trampling, fires, increased pollution
habitat damage and loss, nutrient loading (C, N) enriching poor upland soils which suits generalists
like bracken
Increased surface water
temperatures
Increase in biological respiration, Less oxygen
Low flows, dry river beds, eutrophication, anoxia, less standing water, increase in invasive species
Reduction in SMC Loss of grazing pastures, wildfires, reduced NPP
Grazing not viable, abandoned pasture encroached by bracken, difficulty in managing burn regimes, risk
of peatland fires, reduced growth and carbon storage, increased ET and downwind rainfall
Flooding, extreme weather events,
and water logging
Extended growing season, change in chemical
make-up of SMC, loss of grazing pastures
Conditions benefitting invasive species, including bracken, poaching and trampling, increased erosion,
inadequate drainage. Also a threat to local businesses
Fewer frost days Increased rates of disease and pests
Effects most upland species, although bracken remarkably tolerant
4.3.1 Climate change and future bracken distribution
Climate change and land management decisions will determine the future extent and
distribution of bracken (Pakeman et al., 1996). Its spread will potentially be assisted by
future increases in water demand, declines of grouse, and greater visitor numbers that
may alter the landscape character and biodiversity of the PDNP (PDNPA, 2009).
However, the impacts and effects are complex and poorly understood, and projections
are replete with uncertainties (Orr et al., 2008; IPCC, 2007) – all climate models are a
‘best guess’ (WMO, 2013), but upland forecasts are more problematic due to their very
diverse, often very localised climatic conditions (Orr et al., 2008).
Yet the uplands are warming, and this is predicted to continue (possibly by 5 °C by 2100
from 1990 levels). The PDNP is forecast to experience hotter, driers summers and
warmer, wetter winters with more extreme weather events (PDNPA, 2011; Caporn and
Emmett, 2009, Table 4.2). The historic data 1960s-2000s from the Met Office (2014)
Sheffield station show that minimum and maximum summer and winter temperatures
have risen by more than one degree, snow cover and frost days have declined and
sunlight hours increased. Therefore a proposal that climatic trends will aid bracken
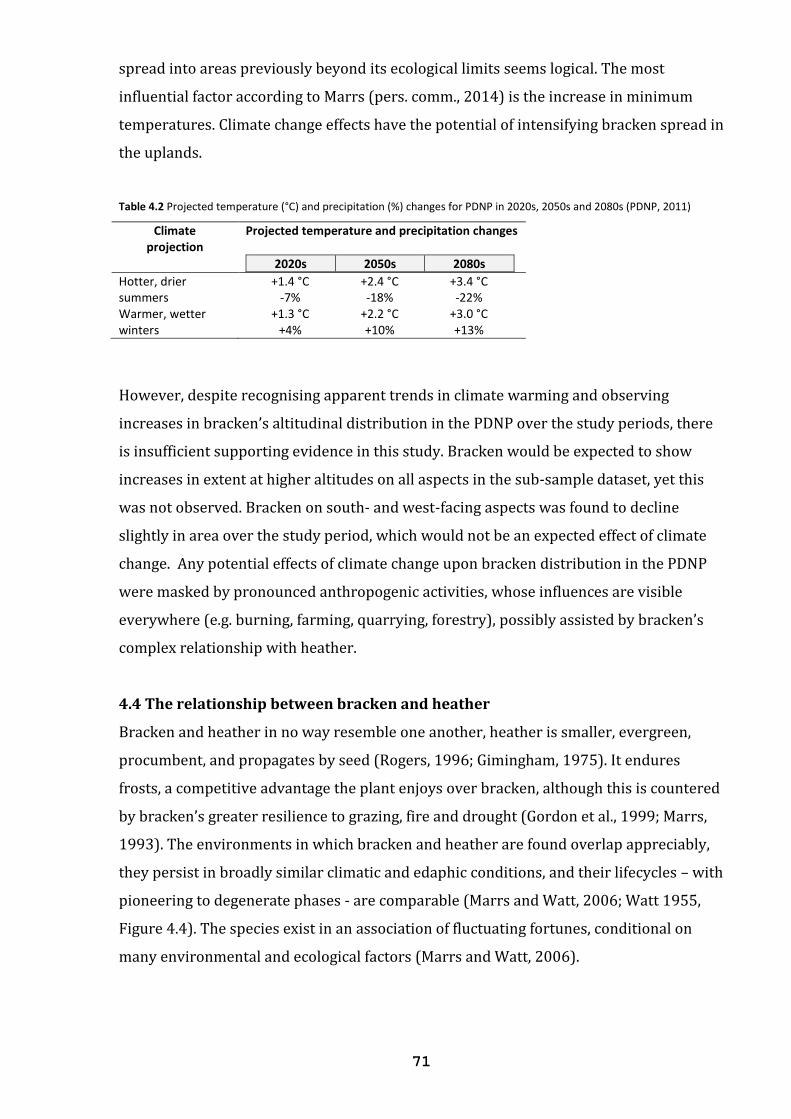
71
spread into areas previously beyond its ecological limits seems logical. The most
influential factor according to Marrs (pers. comm., 2014) is the increase in minimum
temperatures. Climate change effects have the potential of intensifying bracken spread in
the uplands.
Table 4.2 Projected temperature (°C) and precipitation (%) changes for PDNP in 2020s, 2050s and 2080s (PDNP, 2011)
Climate projection
Projected temperature and precipitation changes
2020s 2050s 2080s
Hotter, drier summers
+1.4 °C +2.4 °C +3.4 °C -7% -18% -22%
Warmer, wetter winters
+1.3 °C +2.2 °C +3.0 °C +4% +10% +13%
However, despite recognising apparent trends in climate warming and observing
increases in bracken’s altitudinal distribution in the PDNP over the study periods, there
is insufficient supporting evidence in this study. Bracken would be expected to show
increases in extent at higher altitudes on all aspects in the sub-sample dataset, yet this
was not observed. Bracken on south- and west-facing aspects was found to decline
slightly in area over the study period, which would not be an expected effect of climate
change. Any potential effects of climate change upon bracken distribution in the PDNP
were masked by pronounced anthropogenic activities, whose influences are visible
everywhere (e.g. burning, farming, quarrying, forestry), possibly assisted by bracken’s
complex relationship with heather.
4.4 The relationship between bracken and heather
Bracken and heather in no way resemble one another, heather is smaller, evergreen,
procumbent, and propagates by seed (Rogers, 1996; Gimingham, 1975). It endures
frosts, a competitive advantage the plant enjoys over bracken, although this is countered
by bracken’s greater resilience to grazing, fire and drought (Gordon et al., 1999; Marrs,
1993). The environments in which bracken and heather are found overlap appreciably,
they persist in broadly similar climatic and edaphic conditions, and their lifecycles – with
pioneering to degenerate phases - are comparable (Marrs and Watt, 2006; Watt 1955,
Figure 4.4). The species exist in an association of fluctuating fortunes, conditional on
many environmental and ecological factors (Marrs and Watt, 2006).
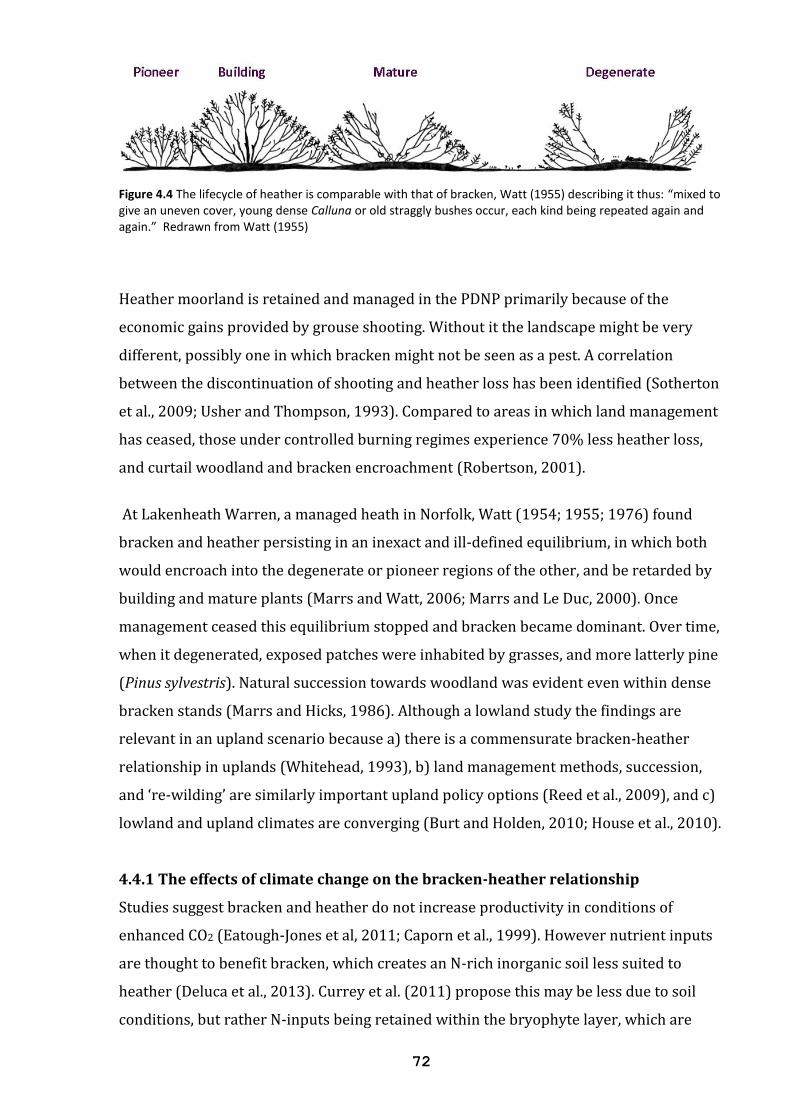
72
Figure 4.4 The lifecycle of heather is comparable with that of bracken, Watt (1955) describing it thus: “mixed to give an uneven cover, young dense Calluna or old straggly bushes occur, each kind being repeated again and again.” Redrawn from Watt (1955)
Heather moorland is retained and managed in the PDNP primarily because of the
economic gains provided by grouse shooting. Without it the landscape might be very
different, possibly one in which bracken might not be seen as a pest. A correlation
between the discontinuation of shooting and heather loss has been identified (Sotherton
et al., 2009; Usher and Thompson, 1993). Compared to areas in which land management
has ceased, those under controlled burning regimes experience 70% less heather loss,
and curtail woodland and bracken encroachment (Robertson, 2001).
At Lakenheath Warren, a managed heath in Norfolk, Watt (1954; 1955; 1976) found
bracken and heather persisting in an inexact and ill-defined equilibrium, in which both
would encroach into the degenerate or pioneer regions of the other, and be retarded by
building and mature plants (Marrs and Watt, 2006; Marrs and Le Duc, 2000). Once
management ceased this equilibrium stopped and bracken became dominant. Over time,
when it degenerated, exposed patches were inhabited by grasses, and more latterly pine
(Pinus sylvestris). Natural succession towards woodland was evident even within dense
bracken stands (Marrs and Hicks, 1986). Although a lowland study the findings are
relevant in an upland scenario because a) there is a commensurate bracken-heather
relationship in uplands (Whitehead, 1993), b) land management methods, succession,
and ‘re-wilding’ are similarly important upland policy options (Reed et al., 2009), and c)
lowland and upland climates are converging (Burt and Holden, 2010; House et al., 2010).
4.4.1 The effects of climate change on the bracken-heather relationship
Studies suggest bracken and heather do not increase productivity in conditions of
enhanced CO2 (Eatough-Jones et al, 2011; Caporn et al., 1999). However nutrient inputs
are thought to benefit bracken, which creates an N-rich inorganic soil less suited to
heather (Deluca et al., 2013). Currey et al. (2011) propose this may be less due to soil
conditions, but rather N-inputs being retained within the bryophyte layer, which are
73
therefore unavailable to heather. However, heather naturally persists in nutrient-poor
soils and Clutterbuck (pers. comm., 2014) questions the validity of this hypothesis.
Pakeman et al. (2002) found bracken, despite asulam spraying, spread by a mean 87cm
p.a. in upland heather moorland, twice the rate of spread recorded by Watt (1954) in
lowland heath. This implies that bracken spread is more influenced by the communities
into which it encroaches than by climate. For the true effects of climate and climate
change on bracken distribution it would be necessary to eliminate the variables of
species community, edaphic conditions, and micro-climates, allowing for a study in
which the only variable is altitude.
4.4.2 Heather: state and distribution
Heather is distributed throughout the UK, home to three-quarters of the global stock,
and the most archetypal communities are found in moorlands (Thompson et al., 1995).
Here, in a landscape mostly free of trees, they are characteristically found on peats soils,
supporting grasses, sedges, dwarf shrubs, ferns, mosses and lichens beneath their
canopy, forming an indiscernible frontier with peat bogs (Holden et al., 2007; Bardgett et
al., 1995; Gimingham, 1975). Heather moorland is widely protected, including under the
Habitats Directive (92/43/EEC), The Wildlife and Countryside Act (1981), the Heather
and Grass etc Burning Regulations for England (2007) and Wales (2008) (EC, 2014a;
RSPB, 2010; Littlewood et al., 2006; English Nature, 2001), and the Control of Pesticides
Regulations 1986 (Defra, 2008).
However just 46% of UK upland heather moorland is in favourable condition (AMEC,
2013), and coverage has declined by an estimated 90% in the last two-hundred years
(Stevenson and Thompson, 1993). Historically this has been due to grazing and
afforestation, and recently perturbations such as burning and trampling (from increased
visitor numbers) have aided encroachment by competitive, invasive species (Anderson
et al., 2009), most notably bracken (Alday and Marrs, 2014), and purple moor grass
(Molina caerulea), which in damper soils can exist with bracken to the exclusion of other
plants (Marrs and Watt, 2006; Milligan et al., 2004; Chambers et al., 1999).
In the PDNP 36% (6,500 ha) of heather moorland was lost from 1913-1991 (PDNPA,
2001), yet recently, with local exceptions, the moorlands have recovered due to
increased control of bracken and restoration initiatives enabled by ESA and agri-
environment schemes, and the Moors for the Future project (Natural England, 2014;
74
Anderson and Ross, 2011; Moors for the Future, 2008). However, bracken encroachment
into heather moorland is stimulated by enduring factors like overgrazing, deforestation,
abandonment of hill pastures, and fire (Anderson and Radford, 1988).
4.5 The role of anthropogenic activities on bracken distribution
Anthropogenic activities can both prevent and aid bracken spread. In the imagery used
for this study human intervention is unmistakable, including forestry, farming,
quarrying, construction and infra-structure changes, peat drainage and gulley blocking,
burning, and vegetation control. The anthropogenic activities that appear to have the
most influence on bracken distribution are those most evident and proximate - burning
and bracken control.
4.5.1 Wildfires and burn regimes
Fire is a natural regenerator, and in the uplands it is important in creating new shoots
for grouse (Yallop et al., 2009; Carr and Middleton, 2004), conserving biodiversity and
fulfilling upland management polices (Davies et al., 2008). However the frontiers of
newly burnt areas, in which there is exposed ground, increased nutrient availability, and
diminished competition, are vulnerable to bracken invasion (Anderson and Radford,
1988; Smith, 1977). Furthermore the consequences of poorly controlled or excessive
burning causes losses of heather, moss and lichen (Sotherton et al., 2009; Tucker, 2003),
associated biodiversity loss (Ramchunder et al., 2009), erosion and degradation of peat
(Hooijer et al., 2014; Worrall and Evans, 2009), and releases CO2 into the atmosphere
and dissolved organic carbon (DOC) into local watercourses (Palmer et al, 2013; Yallop
et al., 2012).
With hotter, drier summers more dry, flammable biomass will be generated (PDNPA,
2011), and pressures - from increased visitor numbers (McMorrow et al., 2009) and to
extend moorland and increase grouse stocks (Harvey-Miller, pers. comm., 2014) - are
expected to lead to an increase in the frequency and intensity of accidental wildfires and
controlled burns (Milin-Chalabi et al., 2014: McMorrow et al., 2009; Davies et al., 2008,
Figures 4.5 and 4.6).
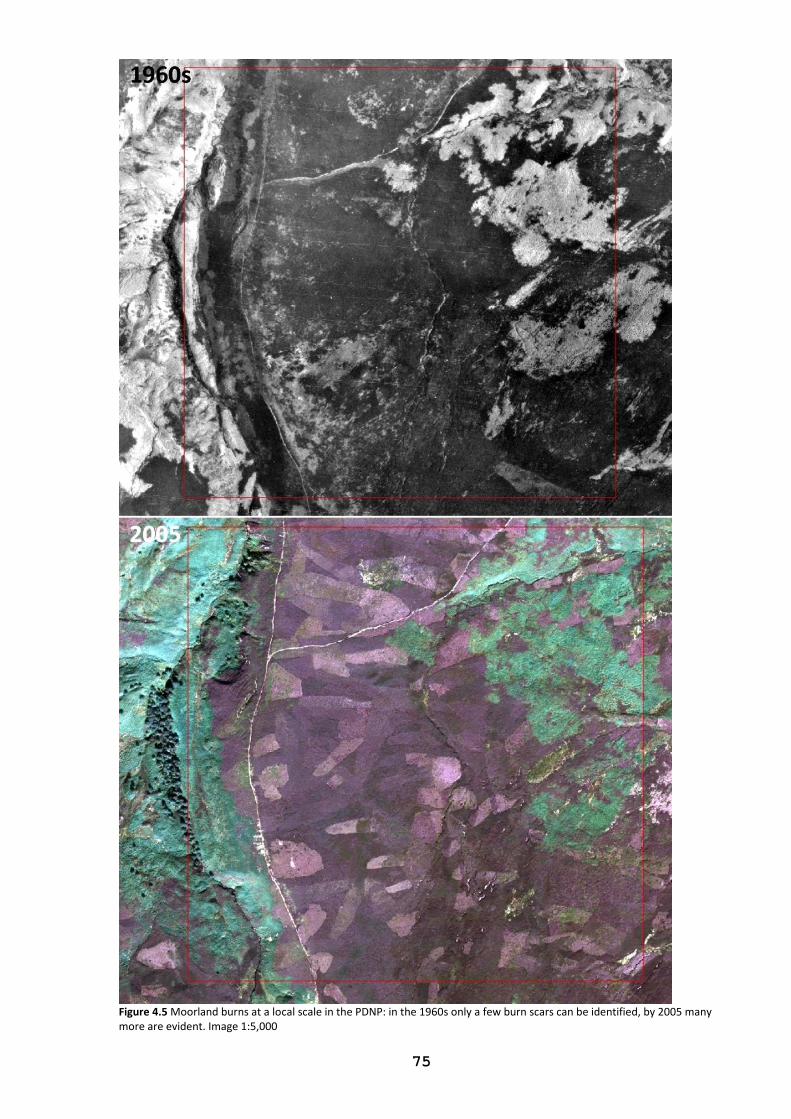
75
Figure 4.5 Moorland burns at a local scale in the PDNP: in the 1960s only a few burn scars can be identified, by 2005 many more are evident. Image 1:5,000
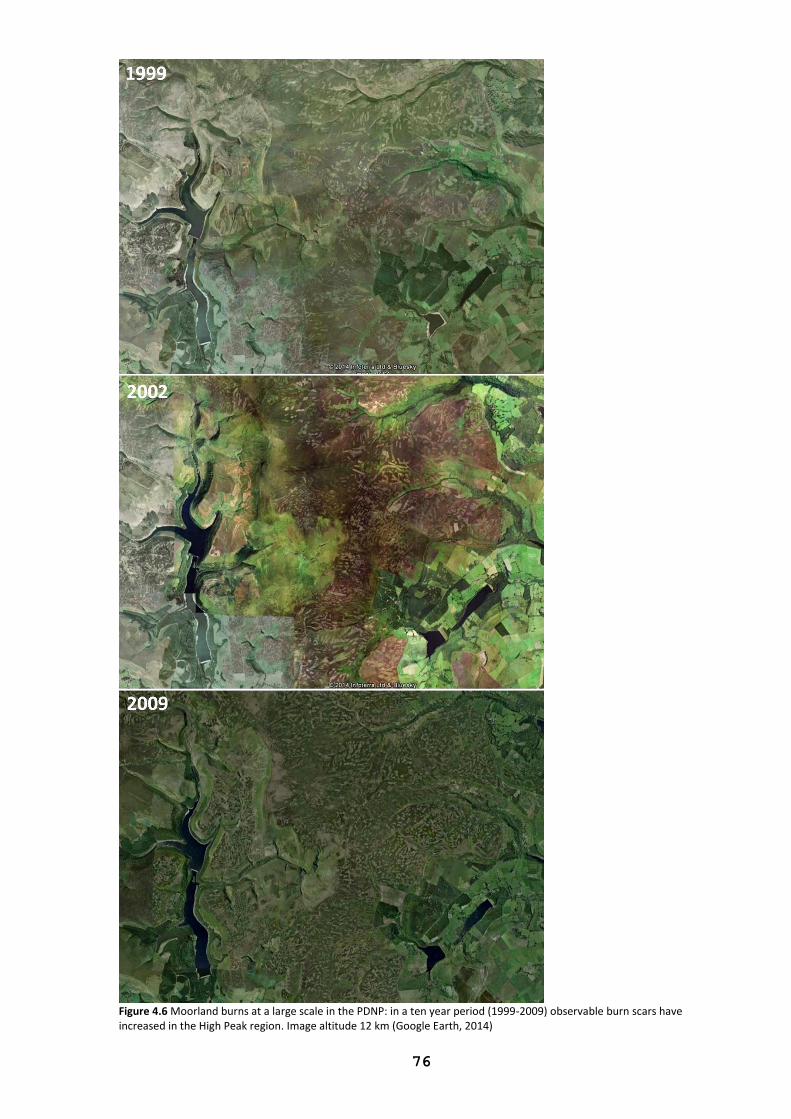
76
Figure 4.6 Moorland burns at a large scale in the PDNP: in a ten year period (1999-2009) observable burn scars have increased in the High Peak region. Image altitude 12 km (Google Earth, 2014)
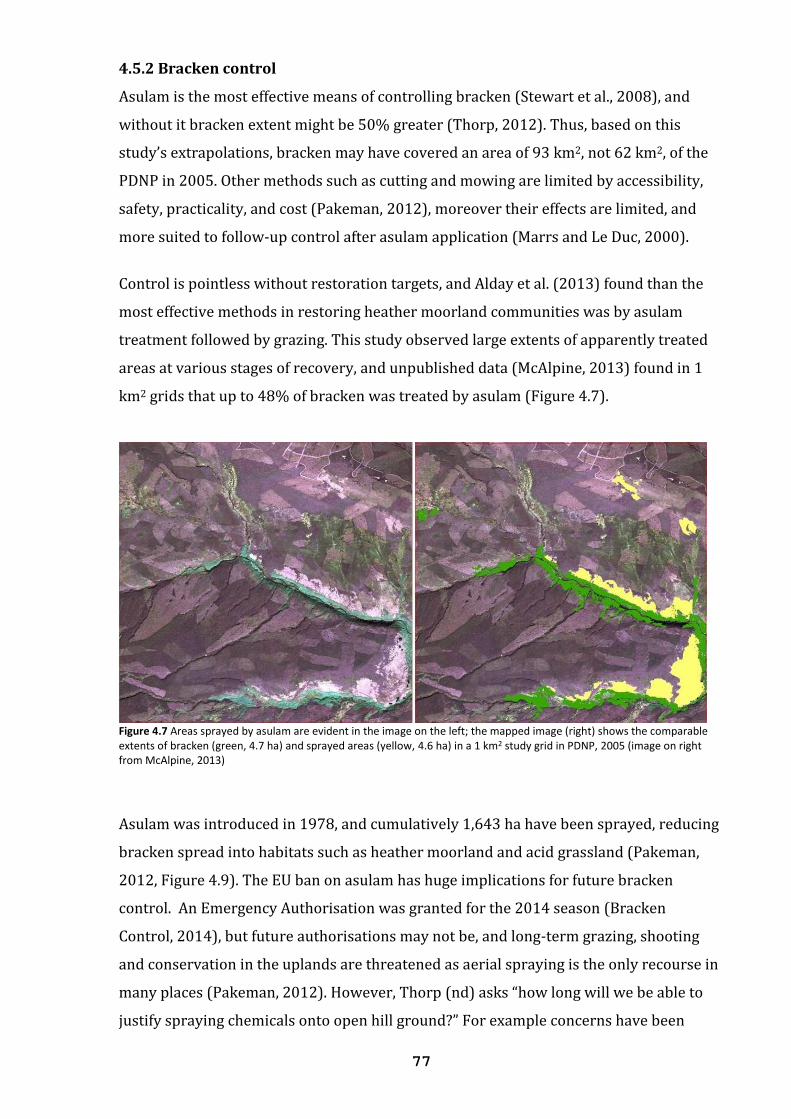
77
4.5.2 Bracken control
Asulam is the most effective means of controlling bracken (Stewart et al., 2008), and
without it bracken extent might be 50% greater (Thorp, 2012). Thus, based on this
study’s extrapolations, bracken may have covered an area of 93 km2, not 62 km2, of the
PDNP in 2005. Other methods such as cutting and mowing are limited by accessibility,
safety, practicality, and cost (Pakeman, 2012), moreover their effects are limited, and
more suited to follow-up control after asulam application (Marrs and Le Duc, 2000).
Control is pointless without restoration targets, and Alday et al. (2013) found than the
most effective methods in restoring heather moorland communities was by asulam
treatment followed by grazing. This study observed large extents of apparently treated
areas at various stages of recovery, and unpublished data (McAlpine, 2013) found in 1
km2 grids that up to 48% of bracken was treated by asulam (Figure 4.7).
Figure 4.7 Areas sprayed by asulam are evident in the image on the left; the mapped image (right) shows the comparable extents of bracken (green, 4.7 ha) and sprayed areas (yellow, 4.6 ha) in a 1 km2 study grid in PDNP, 2005 (image on right from McAlpine, 2013)
Asulam was introduced in 1978, and cumulatively 1,643 ha have been sprayed, reducing
bracken spread into habitats such as heather moorland and acid grassland (Pakeman,
2012, Figure 4.9). The EU ban on asulam has huge implications for future bracken
control. An Emergency Authorisation was granted for the 2014 season (Bracken
Control, 2014), but future authorisations may not be, and long-term grazing, shooting
and conservation in the uplands are threatened as aerial spraying is the only recourse in
many places (Pakeman, 2012). However, Thorp (nd) asks “how long will we be able to
justify spraying chemicals onto open hill ground?” For example concerns have been
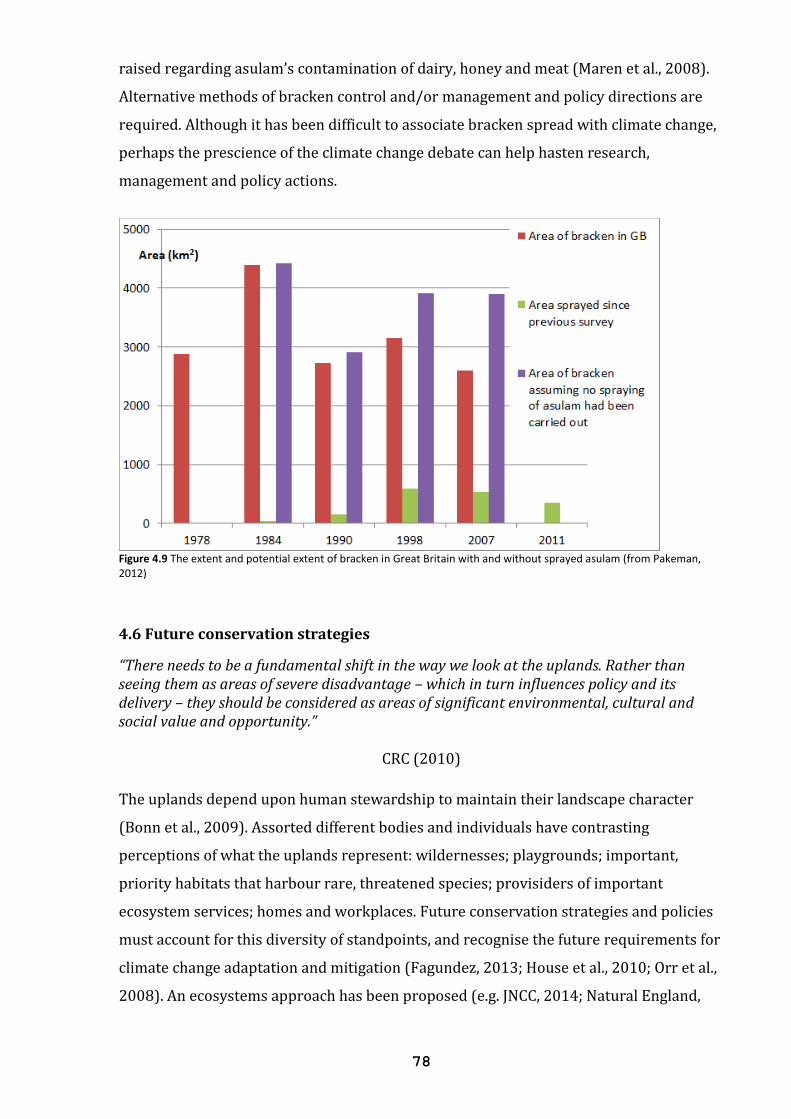
78
raised regarding asulam’s contamination of dairy, honey and meat (Maren et al., 2008).
Alternative methods of bracken control and/or management and policy directions are
required. Although it has been difficult to associate bracken spread with climate change,
perhaps the prescience of the climate change debate can help hasten research,
management and policy actions.
Figure 4.9 The extent and potential extent of bracken in Great Britain with and without sprayed asulam (from Pakeman, 2012)
4.6 Future conservation strategies
“There needs to be a fundamental shift in the way we look at the uplands. Rather than seeing them as areas of severe disadvantage – which in turn influences policy and its delivery – they should be considered as areas of significant environmental, cultural and social value and opportunity.”
CRC (2010)
The uplands depend upon human stewardship to maintain their landscape character
(Bonn et al., 2009). Assorted different bodies and individuals have contrasting
perceptions of what the uplands represent: wildernesses; playgrounds; important,
priority habitats that harbour rare, threatened species; provisiders of important
ecosystem services; homes and workplaces. Future conservation strategies and policies
must account for this diversity of standpoints, and recognise the future requirements for
climate change adaptation and mitigation (Fagundez, 2013; House et al., 2010; Orr et al.,
2008). An ecosystems approach has been proposed (e.g. JNCC, 2014; Natural England,
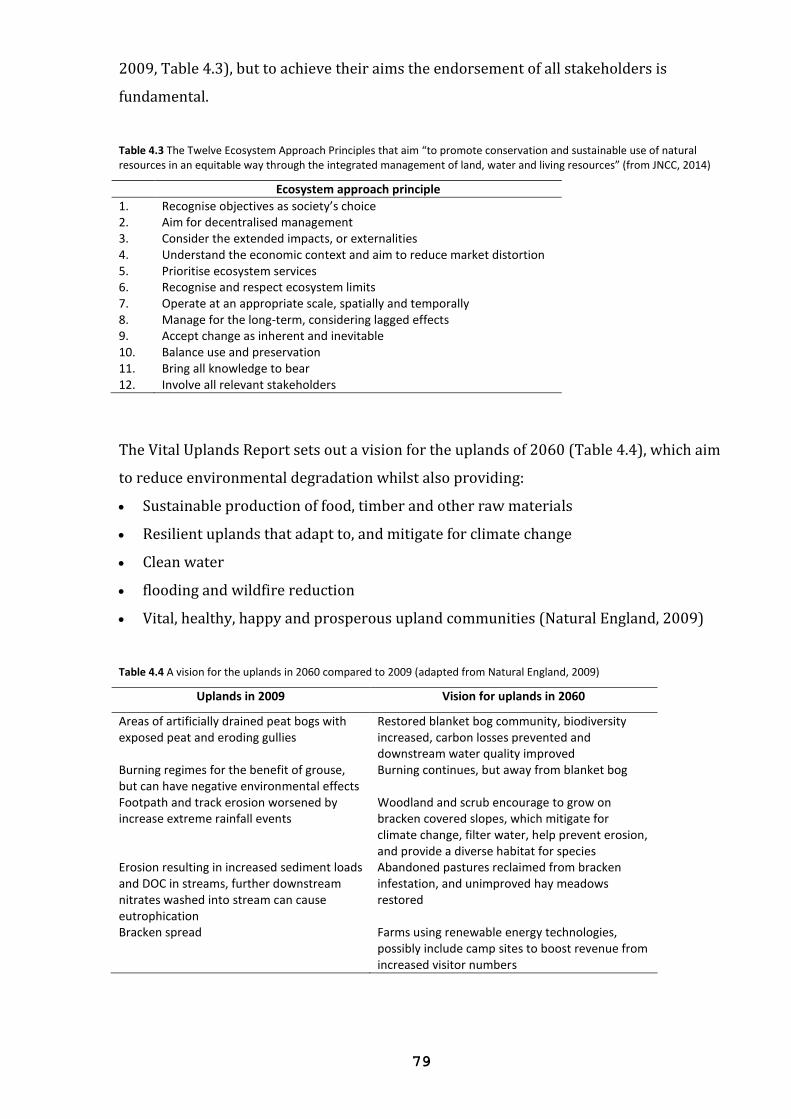
79
2009, Table 4.3), but to achieve their aims the endorsement of all stakeholders is
fundamental.
Table 4.3 The Twelve Ecosystem Approach Principles that aim “to promote conservation and sustainable use of natural resources in an equitable way through the integrated management of land, water and living resources” (from JNCC, 2014)
Ecosystem approach principle
1. Recognise objectives as society’s choice 2. Aim for decentralised management 3. Consider the extended impacts, or externalities 4. Understand the economic context and aim to reduce market distortion 5. Prioritise ecosystem services 6. Recognise and respect ecosystem limits 7. Operate at an appropriate scale, spatially and temporally 8. Manage for the long-term, considering lagged effects 9. Accept change as inherent and inevitable 10. Balance use and preservation 11. Bring all knowledge to bear 12. Involve all relevant stakeholders
The Vital Uplands Report sets out a vision for the uplands of 2060 (Table 4.4), which aim
to reduce environmental degradation whilst also providing:
Sustainable production of food, timber and other raw materials
Resilient uplands that adapt to, and mitigate for climate change
Clean water
flooding and wildfire reduction
Vital, healthy, happy and prosperous upland communities (Natural England, 2009)
Table 4.4 A vision for the uplands in 2060 compared to 2009 (adapted from Natural England, 2009)
Uplands in 2009 Vision for uplands in 2060
Areas of artificially drained peat bogs with exposed peat and eroding gullies
Restored blanket bog community, biodiversity increased, carbon losses prevented and downstream water quality improved
Burning regimes for the benefit of grouse, but can have negative environmental effects
Burning continues, but away from blanket bog
Footpath and track erosion worsened by increase extreme rainfall events
Woodland and scrub encourage to grow on bracken covered slopes, which mitigate for climate change, filter water, help prevent erosion, and provide a diverse habitat for species
Erosion resulting in increased sediment loads and DOC in streams, further downstream nitrates washed into stream can cause eutrophication
Abandoned pastures reclaimed from bracken infestation, and unimproved hay meadows restored
Bracken spread Farms using renewable energy technologies, possibly include camp sites to boost revenue from increased visitor numbers
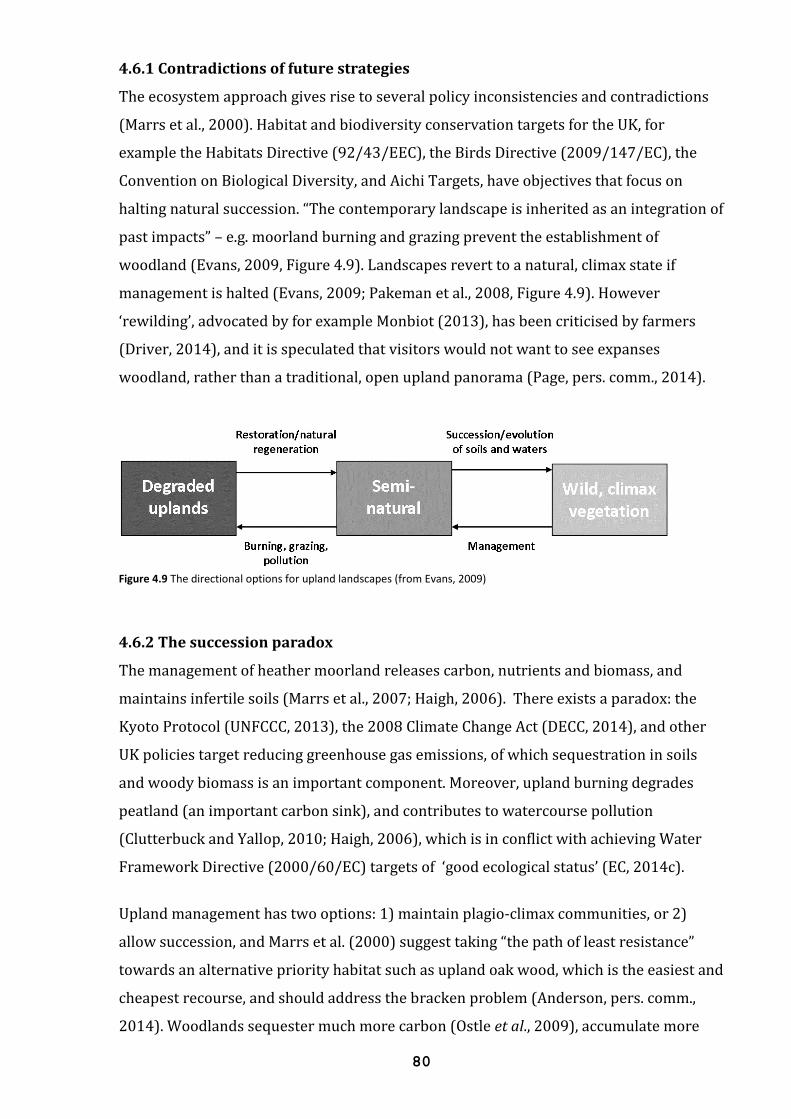
80
4.6.1 Contradictions of future strategies
The ecosystem approach gives rise to several policy inconsistencies and contradictions
(Marrs et al., 2000). Habitat and biodiversity conservation targets for the UK, for
example the Habitats Directive (92/43/EEC), the Birds Directive (2009/147/EC), the
Convention on Biological Diversity, and Aichi Targets, have objectives that focus on
halting natural succession. “The contemporary landscape is inherited as an integration of
past impacts” – e.g. moorland burning and grazing prevent the establishment of
woodland (Evans, 2009, Figure 4.9). Landscapes revert to a natural, climax state if
management is halted (Evans, 2009; Pakeman et al., 2008, Figure 4.9). However
‘rewilding’, advocated by for example Monbiot (2013), has been criticised by farmers
(Driver, 2014), and it is speculated that visitors would not want to see expanses
woodland, rather than a traditional, open upland panorama (Page, pers. comm., 2014).
Figure 4.9 The directional options for upland landscapes (from Evans, 2009)
4.6.2 The succession paradox
The management of heather moorland releases carbon, nutrients and biomass, and
maintains infertile soils (Marrs et al., 2007; Haigh, 2006). There exists a paradox: the
Kyoto Protocol (UNFCCC, 2013), the 2008 Climate Change Act (DECC, 2014), and other
UK policies target reducing greenhouse gas emissions, of which sequestration in soils
and woody biomass is an important component. Moreover, upland burning degrades
peatland (an important carbon sink), and contributes to watercourse pollution
(Clutterbuck and Yallop, 2010; Haigh, 2006), which is in conflict with achieving Water
Framework Directive (2000/60/EC) targets of ‘good ecological status’ (EC, 2014c).
Upland management has two options: 1) maintain plagio-climax communities, or 2)
allow succession, and Marrs et al. (2000) suggest taking “the path of least resistance”
towards an alternative priority habitat such as upland oak wood, which is the easiest and
cheapest recourse, and should address the bracken problem (Anderson, pers. comm.,
2014). Woodlands sequester much more carbon (Ostle et al., 2009), accumulate more
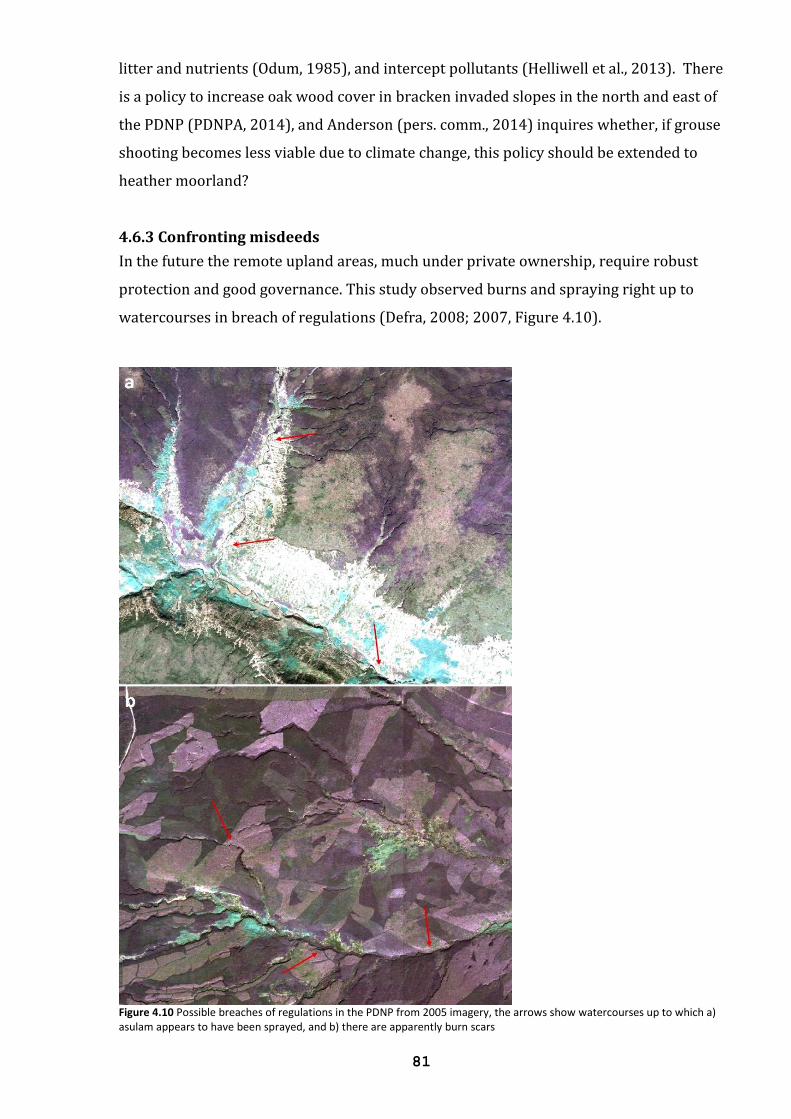
81
litter and nutrients (Odum, 1985), and intercept pollutants (Helliwell et al., 2013). There
is a policy to increase oak wood cover in bracken invaded slopes in the north and east of
the PDNP (PDNPA, 2014), and Anderson (pers. comm., 2014) inquires whether, if grouse
shooting becomes less viable due to climate change, this policy should be extended to
heather moorland?
4.6.3 Confronting misdeeds
In the future the remote upland areas, much under private ownership, require robust
protection and good governance. This study observed burns and spraying right up to
watercourses in breach of regulations (Defra, 2008; 2007, Figure 4.10).
Figure 4.10 Possible breaches of regulations in the PDNP from 2005 imagery, the arrows show watercourses up to which a) asulam appears to have been sprayed, and b) there are apparently burn scars
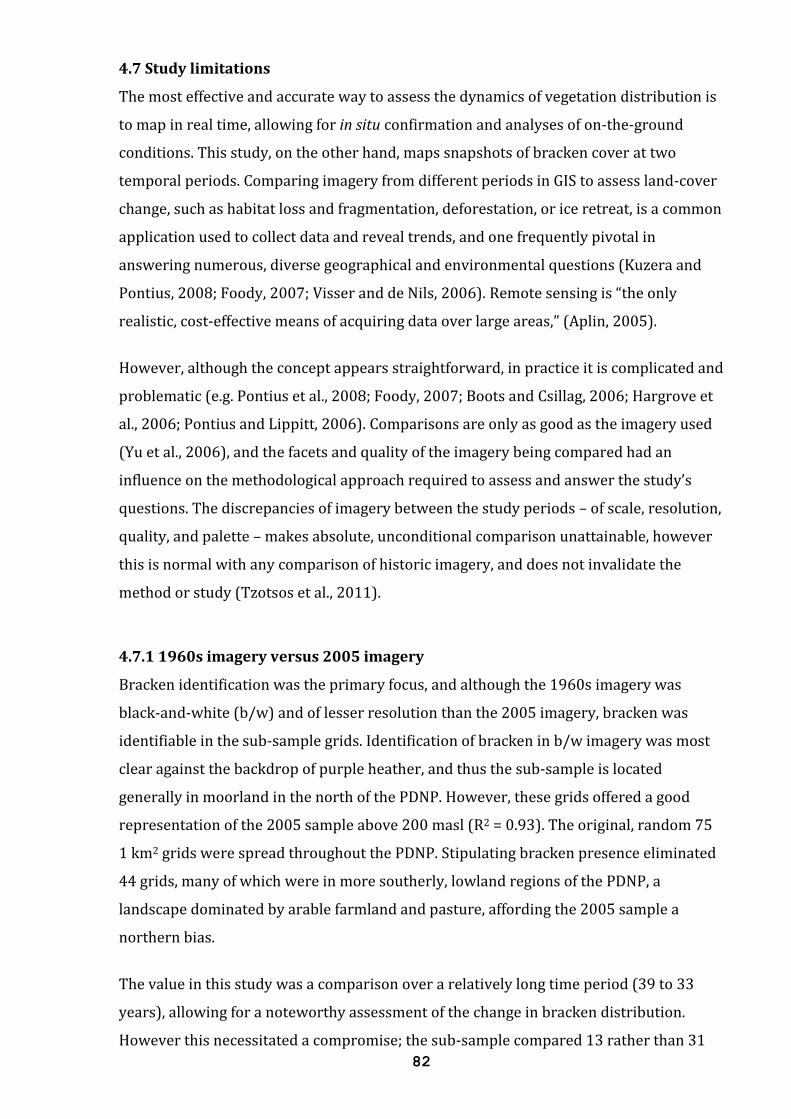
82
4.7 Study limitations
The most effective and accurate way to assess the dynamics of vegetation distribution is
to map in real time, allowing for in situ confirmation and analyses of on-the-ground
conditions. This study, on the other hand, maps snapshots of bracken cover at two
temporal periods. Comparing imagery from different periods in GIS to assess land-cover
change, such as habitat loss and fragmentation, deforestation, or ice retreat, is a common
application used to collect data and reveal trends, and one frequently pivotal in
answering numerous, diverse geographical and environmental questions (Kuzera and
Pontius, 2008; Foody, 2007; Visser and de Nils, 2006). Remote sensing is “the only
realistic, cost-effective means of acquiring data over large areas,” (Aplin, 2005).
However, although the concept appears straightforward, in practice it is complicated and
problematic (e.g. Pontius et al., 2008; Foody, 2007; Boots and Csillag, 2006; Hargrove et
al., 2006; Pontius and Lippitt, 2006). Comparisons are only as good as the imagery used
(Yu et al., 2006), and the facets and quality of the imagery being compared had an
influence on the methodological approach required to assess and answer the study’s
questions. The discrepancies of imagery between the study periods – of scale, resolution,
quality, and palette – makes absolute, unconditional comparison unattainable, however
this is normal with any comparison of historic imagery, and does not invalidate the
method or study (Tzotsos et al., 2011).
4.7.1 1960s imagery versus 2005 imagery
Bracken identification was the primary focus, and although the 1960s imagery was
black-and-white (b/w) and of lesser resolution than the 2005 imagery, bracken was
identifiable in the sub-sample grids. Identification of bracken in b/w imagery was most
clear against the backdrop of purple heather, and thus the sub-sample is located
generally in moorland in the north of the PDNP. However, these grids offered a good
representation of the 2005 sample above 200 masl (R2 = 0.93). The original, random 75
1 km2 grids were spread throughout the PDNP. Stipulating bracken presence eliminated
44 grids, many of which were in more southerly, lowland regions of the PDNP, a
landscape dominated by arable farmland and pasture, affording the 2005 sample a
northern bias.
The value in this study was a comparison over a relatively long time period (39 to 33
years), allowing for a noteworthy assessment of the change in bracken distribution.
However this necessitated a compromise; the sub-sample compared 13 rather than 31
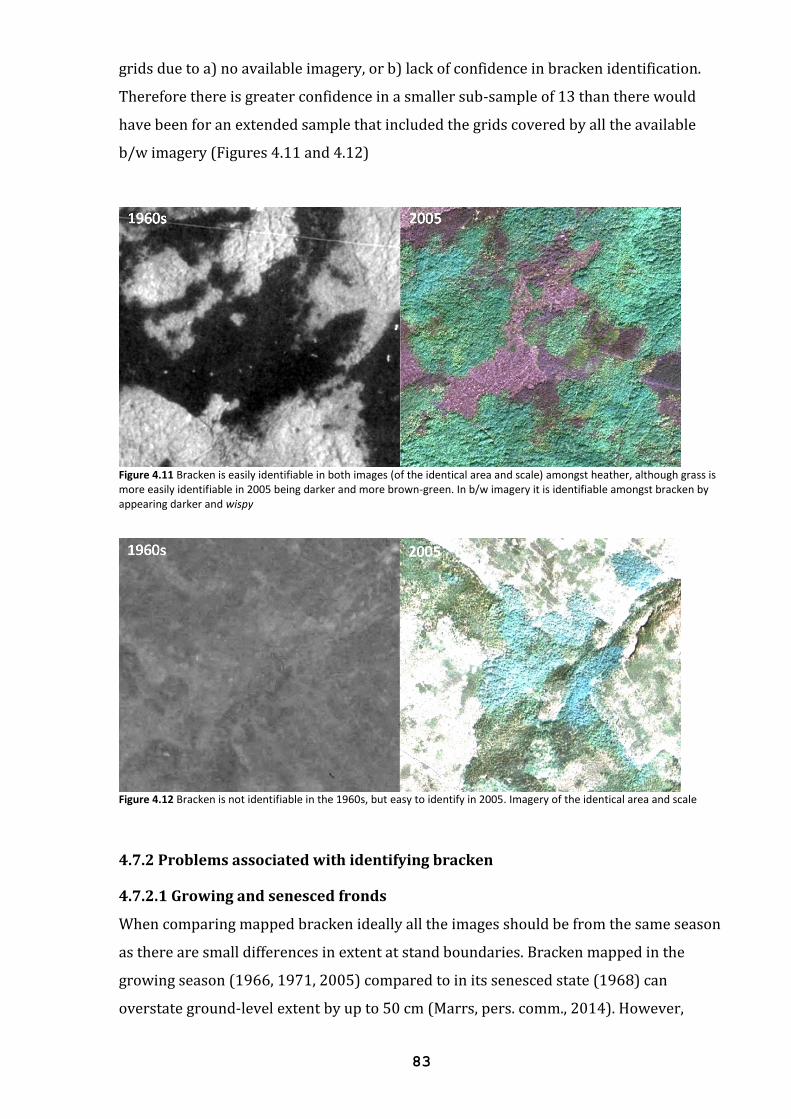
83
grids due to a) no available imagery, or b) lack of confidence in bracken identification.
Therefore there is greater confidence in a smaller sub-sample of 13 than there would
have been for an extended sample that included the grids covered by all the available
b/w imagery (Figures 4.11 and 4.12)
Figure 4.11 Bracken is easily identifiable in both images (of the identical area and scale) amongst heather, although grass is more easily identifiable in 2005 being darker and more brown-green. In b/w imagery it is identifiable amongst bracken by appearing darker and wispy
Figure 4.12 Bracken is not identifiable in the 1960s, but easy to identify in 2005. Imagery of the identical area and scale
4.7.2 Problems associated with identifying bracken
4.7.2.1 Growing and senesced fronds
When comparing mapped bracken ideally all the images should be from the same season
as there are small differences in extent at stand boundaries. Bracken mapped in the
growing season (1966, 1971, 2005) compared to in its senesced state (1968) can
overstate ground-level extent by up to 50 cm (Marrs, pers. comm., 2014). However,
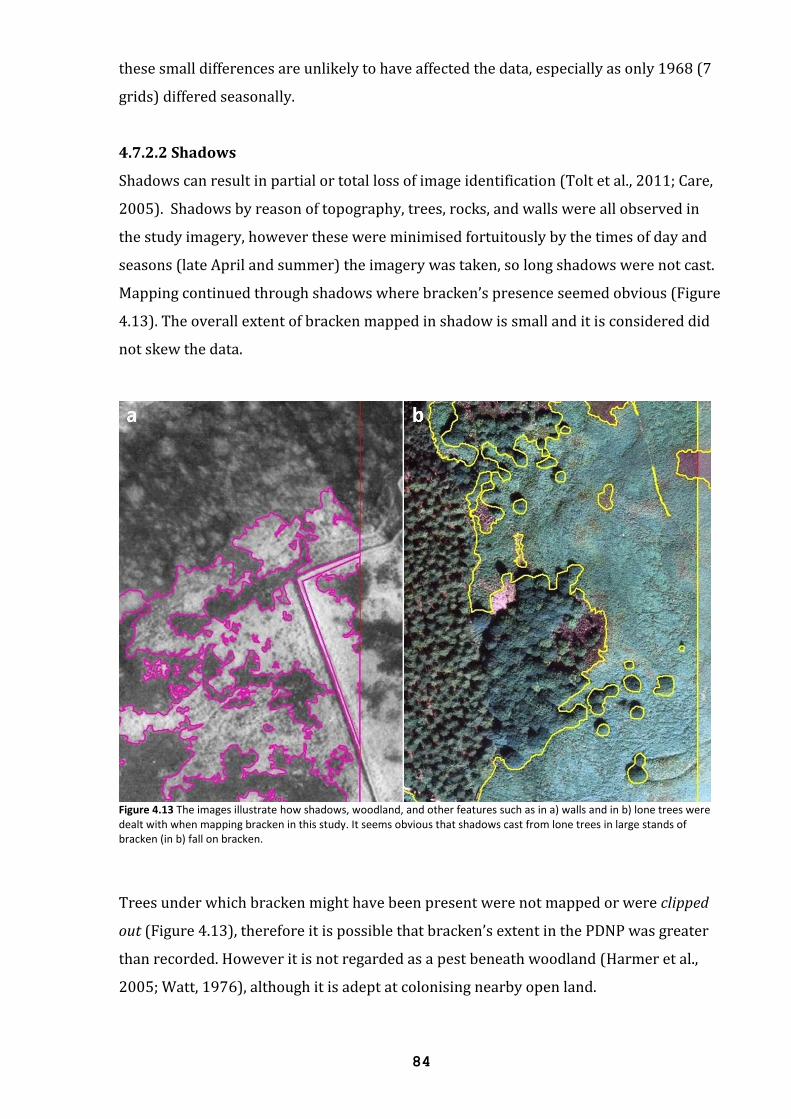
84
these small differences are unlikely to have affected the data, especially as only 1968 (7
grids) differed seasonally.
4.7.2.2 Shadows
Shadows can result in partial or total loss of image identification (Tolt et al., 2011; Care,
2005). Shadows by reason of topography, trees, rocks, and walls were all observed in
the study imagery, however these were minimised fortuitously by the times of day and
seasons (late April and summer) the imagery was taken, so long shadows were not cast.
Mapping continued through shadows where bracken’s presence seemed obvious (Figure
4.13). The overall extent of bracken mapped in shadow is small and it is considered did
not skew the data.
Figure 4.13 The images illustrate how shadows, woodland, and other features such as in a) walls and in b) lone trees were dealt with when mapping bracken in this study. It seems obvious that shadows cast from lone trees in large stands of bracken (in b) fall on bracken.
Trees under which bracken might have been present were not mapped or were clipped
out (Figure 4.13), therefore it is possible that bracken’s extent in the PDNP was greater
than recorded. However it is not regarded as a pest beneath woodland (Harmer et al.,
2005; Watt, 1976), although it is adept at colonising nearby open land.
85
4.7.3 Climate data
The temperature data were obtained from a meteorological station (Sheffield) situated
at a lower altitude (131 masl) than the study sites, and about 15 km from the PDNP.
Additionally, temperatures acquired near towns can be higher on account of heat island
effects (Barry and Chorley, 2010). However, it was apparent that establishing a link
between climate and the altitudinal spread of bracken would be problematic due to
masking by anthropogenic upland activities. Therefore, establishing regional climate
trends was considered appropriate for an appraisal of their potential influences.
4.8 Recommendations for future research
“What I decided I could not continue doing was making decisions about intervening when I had no idea whether I was doing more harm than good”
Dr Archibald L. Cochrane (1909-1988)
From Pullin et al. (2013)
This study mapped 310 ha of bracken from 2005 imagery, and from this sample it was
extrapolated that bracken covered 62 km2 in the PDNP. Bracken extent and distribution
from the 1960s and 2005 was also compared using altitude, aspect, and slope to isolate
and analyse data (Chapter 3). However, it would be of great benefit to ascertain
conditions on-the-ground (edaphic, ecological, micro-climatic, and land management) to
understand better the dynamics of bracken spread, both driving and limiting it. Thus,
combined with remotely sensed data, areas vulnerable to colonisation can be identified.
Bracken distribution in other UK upland areas may be different than in the PDNP, and
therefore similar mapping and ground surveys are recommended, ideally to compile a
complete up-to-date UK upland database.
Climate change threatens to alter the uplands (e.g. House et al., 2010; Orr et al., 2008),
and House et al. (2010) state that maintaining “vegetation cover is a key win–win
management strategy that will reduce erosion and loss of soil carbon, and protect a
variety of services such as the continued delivery of a high quality water resource.”
This will not necessarily be achieved by maintaining business-as-usual management
practices, but require adaptation, possibly by allowing natural succession (Marrs et al.,
2000). If management practices continue, and emergency authorisations for the spraying
of asulam are rejected, an alternative, narrow-spectrum herbicide needs to be developed
that meets robust environmental standards (Berget, 2012), or otherwise biological
control needs to advance past trialling (Pakeman and Marrs, 1992; Lawton, 1988).
86
Conservation is about tackling the problems associated with anthropogenic exploitation
and degradation of the environment (Pullin et al., 2013; Kapos et al., 2009). Scrutiny has
never been greater regarding the decision-making process and project implementation,
and Pullin and Knight (2009) believe questions like “are conservation interventions
effective?” and “are they doing more harm than good?” will be asked more often in the
future. Therefore future decisions for the PDNP, the UK uplands, and the wider
environment, need to be based on sound evidence, and be unambiguous, unequivocal,
and (as far as possible) future-proofed.
4.9 Concluding summary
“Landscape is not a static background which we inhabit, but the interaction of a society and the habitat it lives in, and if either man or the habitat changes then so inevitably must the resulting landscape. Landscape = habitat + man.”
Nan Fairbrother (1970) From the Landscape Strategy 2008 of the Peak District National Park Authority
Bracken has a worldwide distribution except Antarctica, and is found in a broad range of
environmental conditions where it is often viewed as an invasive weed. In the UK
uplands it encroaches into habitats of greater conservation and economic value,
although, at appropriate levels, it is a beneficial component of the landscape mosaic.
Mapping in ArcGIS recorded almost 310 ha of bracken in the 2005 sample, an increase
twice the per annum increase from 1990 estimations (1.8% p.a.) than increases
observed in the sub-sample between the 1960s and 2005 (0.9%), although within
accepted estimation of spread. This suggests that bracken spread has increased in recent
years, a conclusion that concurs with unpublished work (McAlpine, 2013) of mapping in
the PDNP between 1989 and 2005. However bracken extent may also have been under-
estimated in earlier years, in which case bracken’s expansion may have been more
regular and gradual.
Since 1990 bracken control by asulam spraying has remained constant, however heather
moorland burning has increased. This implies that increased burning, possibly combined
with the effects of climate change, has facilitated increased bracken spread more
recently. The implications of a ban on spraying asulam, the most effective control, are
accelerated encroachment, especially under scenarios of future uplands warming. This
therefore makes the discussion on successional paths relevant.
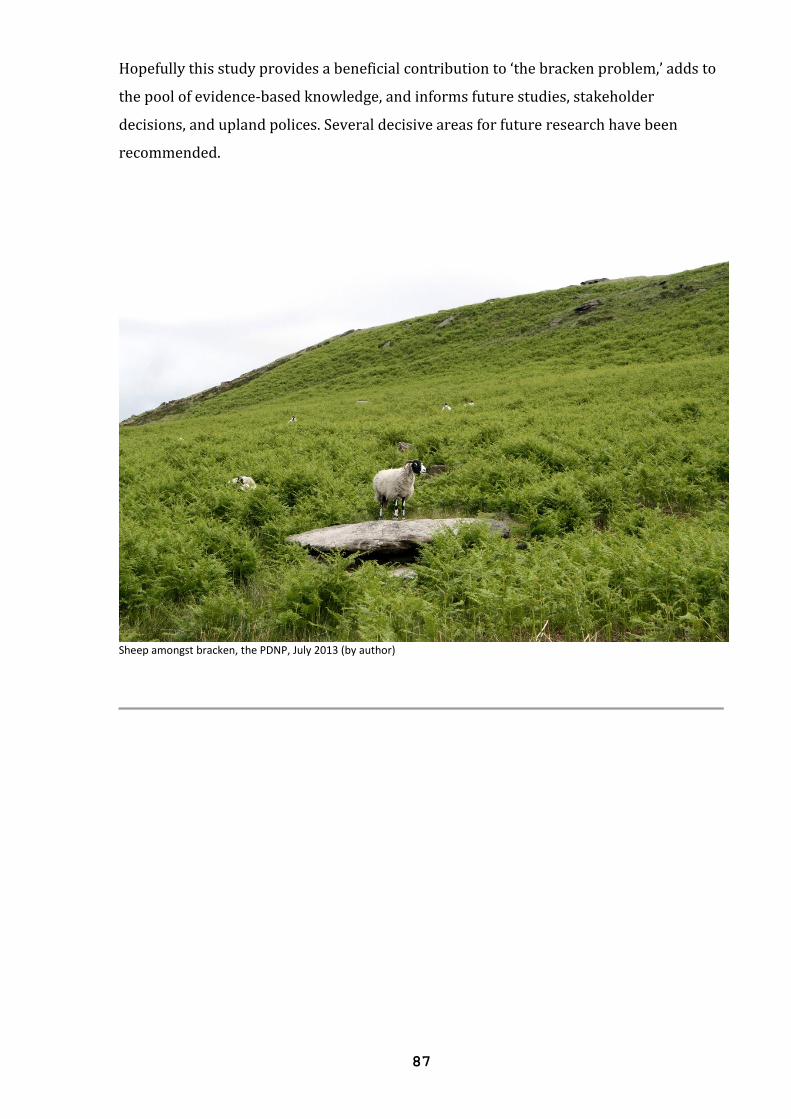
87
Hopefully this study provides a beneficial contribution to ‘the bracken problem,’ adds to
the pool of evidence-based knowledge, and informs future studies, stakeholder
decisions, and upland polices. Several decisive areas for future research have been
recommended.
Sheep amongst bracken, the PDNP, July 2013 (by author)
88
5. Annex
“At the end of the day… it will be the ethics and desires of the people, not their leaders, who give power to governments and NGOs or take it away. They will decide if there are to be more or fewer reserves, and choose whether particular species live or die”
Edward O. Wilson (2002) From The Future of Life
5.1 Introduction
The original proposal was for an assessment and comparison of bracken (Pteridium
aquilinum) areal extent in the 1940s and 2005 at elevations above 350 m in three upland
English regions - the Peak District National Park (PDNP), the North York Moors National
Park, and the Lake District National Park. My previous unpublished study found discrete
stands above 350 m in the PDNP had spread significantly more than accepted
estimations (McAlpine, 2013). The aim was to compare bracken distribution in the
uplands for the study periods, and describe changes in distribution by altitude, aspect
and slope, and describe the patterns of change.
By creating zones of elevation, and taking into account aspect and slope, it was hoped
that a more specific examination of the change in bracken distribution might highlight
where bracken is likely to spread, the dynamics involved, and whether this spread may
have been influenced by climate change (e.g. altitudinal increases in bracken’s historic
range).
However, this proposal evolved into the finished study: An Assessment of the Extent,
Distribution, and Change of Bracken (Pteridium aquilinum) in the Peak District National
Park, a one-region study in the PDNP which offers greater detail and more robust data
than would a broader, multi-region study.
5.2 The evolution of the study
5.2.1 Site selection
The original idea of the multi-region study was to constrain as many physical factors as
possible including altitude, aspect, and slope. At an elementary level this would comprise
finding bracken in a number of places at the same elevation, on a similar slope and with
similar aspect. It would then be logical to look at the same elevation and slope with a
different aspect, and the same aspect with a different slope, and so on. In essence the
number of samples would increase dramatically to fulfil the multitude of scenarios.
89
Time constraints would have allowed for only a coarse assessment across the three
national parks, therefore one park was sampled comprehensively. The PDNP was
selected because a) imagery for 2005 was in-hand, b) it allowed comparisons to be made
with earlier work (McAlpine, 2013), c) the PDNP is representative of English uplands in
its ecosystems, management and threats, and d) it was the most proximate. Helpfully,
this removed regional climatic differences as a variable, although, of course, local and
micro-climatic variations exist within the PDNP (as they do elsewhere).
5.2.2 Variables and the elevation boundary
The use of 1 km2 Ordnance Survey grids has been used in other studies (Birnie et al., 2000;
Pakeman et al., 1996) and is essentially random compared to groundcover. From 75 1 km2
random grids, 44 were rejected and 31 were selected on the study pre-requisite of
containing bracken (see Methods). ArcGIS was used to assign mean elevation, slope and
aspect to a trial grid in which bracken was observed. Whilst trialling the strategy it
became apparent that within each grid was a potential diversity of variables. For
example Figure 5.1 illustrates the issue: the two-dimensional image of a grid with a
mean 350 m altitude masks the reality uncovered in three dimensions; topographic
heterogeneity in which bracken is present at elevations ranging from 256 to 417 m, and
on at least three opposing aspects and a range of slopes.
Whilst elevation is a vital component of the final study, the 350 m limit was abandoned.
Instead elevation was graded zonally (see Method) and bracken presence could be
assessed and compared by its distributions in zones of altitude, aspect and slope. This
discovery prompted various trains of thought, as it appeared that a 1 km2 grid may be
too coarse to constrain variables (mean slope and aspect for Figure 5.1 would be
meaningless). For example one thought was to map whole squares and delineate areas of
bracken and assign the variables to discrete portions for a multivariate analysis. Another
option considered was to map a large number of discrete stands (perhaps use a point
sample to identify stands to map), and determine change and compare to a larger
number of variables.
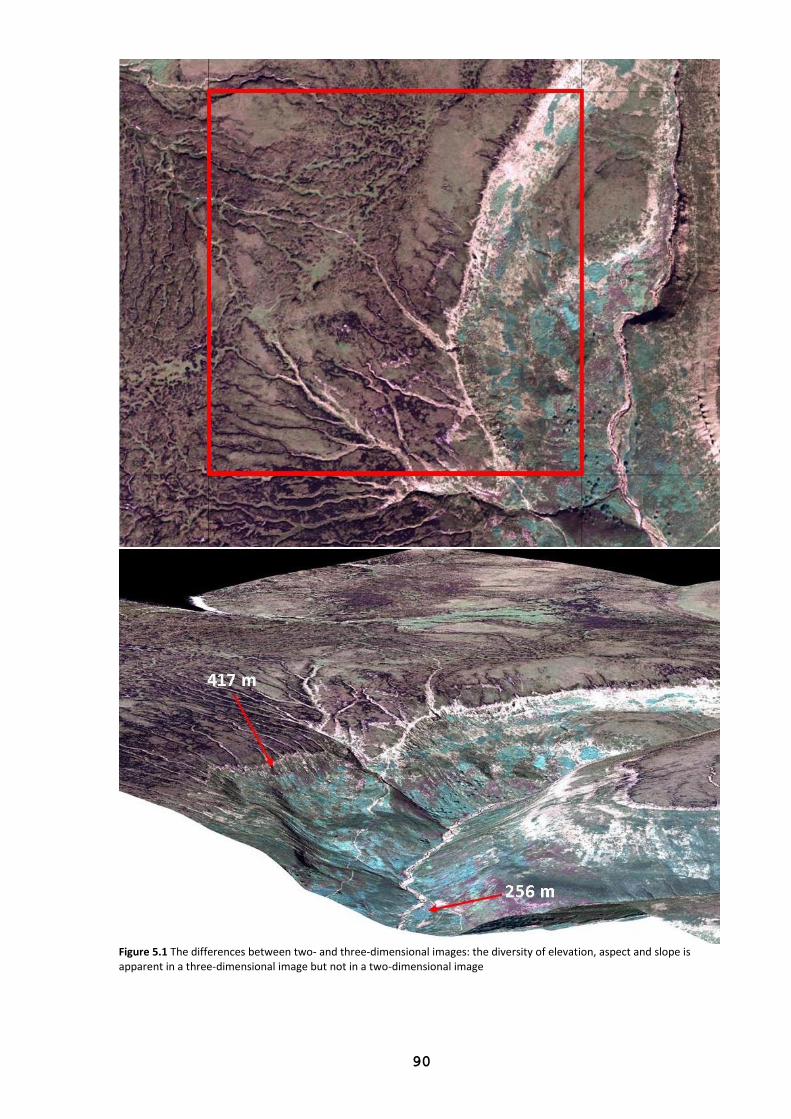
90
Figure 5.1 The differences between two- and three-dimensional images: the diversity of elevation, aspect and slope is apparent in a three-dimensional image but not in a two-dimensional image
91
The chosen method in this study, in which all the bracken observed was mapped in the
2005 sample and sub-sample study grids is considered the most robust (see Method). It
avoided introducing new parameters, and resulted in a useful areal estimation of
bracken extent in the PDNP in 2005 (62 km2), and interesting comparisons by altitude,
aspect and slope for the 2005 sample, and between study periods in the sub-sample.
5.2.3 Study period selection
The study hope to assess change over the longest possible period, however imagery for
the 1940s and 1950s in the PDNP was not of suitable quality in which to confidently
identify bracken in sufficient study grids. At the PDNP Authority in Bakewell a decision
was made to use imagery taken in 1966, 1968, and 1971, which were of better quality
and covered a good proportion of the 31 1 km2 study grids previously selected. In the
end just 13 grids from the 1960s could be confidently mapped.
5.3 Mapping
5.3.1 Mapped data
Mapping may be regarded as the straightforward, prosaic element of the study. Yet it is
the study. All the subsequent data are derived from the hundreds of thousands of
individual points mapped. Until the data are copied from attribute tables in GIS one is
totally unaware of the extent mapped, their potential significance, and the trends that
may emerge (e.g. of bracken apparently favouring certain altitudinal ranges). Thus it is a
nervous and exciting time when the data are merged, tabulated and analysed.
The maps showing how bracken has spread during the study period, its gains and losses,
are interesting and illustrate temporal bracken distribution at a local scale. However,
this study concentrated on total change, which enabled a robust assessment from which
projections could be made and trends emerged. Site-specific change is more the result of
a single random selection although the change that occurs is valid, yet in combination
the individual study grids generate the bigger picture.
The maps provide an ancillary benefit; they are pictorial representations of change,
easily understood, and thus useful tools for stakeholders. Figure 5.2 shows a mapped
grid from the sub-sample with the 1960s mapped extent overlaying the 2005 mapped
extent. Figure 5.3 demonstrates the mapped periods separately, and the gains and losses
of bracken extent from the 1960s to 2005.
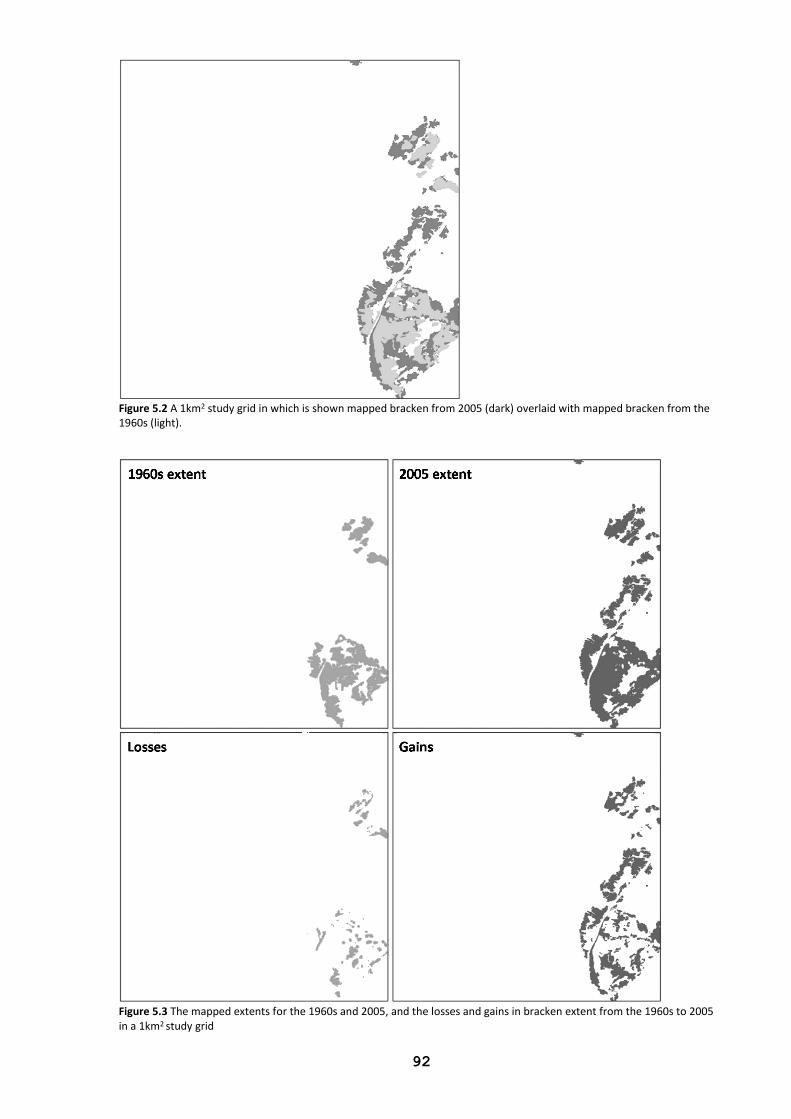
92
Figure 5.2 A 1km2 study grid in which is shown mapped bracken from 2005 (dark) overlaid with mapped bracken from the 1960s (light).
Figure 5.3 The mapped extents for the 1960s and 2005, and the losses and gains in bracken extent from the 1960s to 2005 in a 1km2 study grid
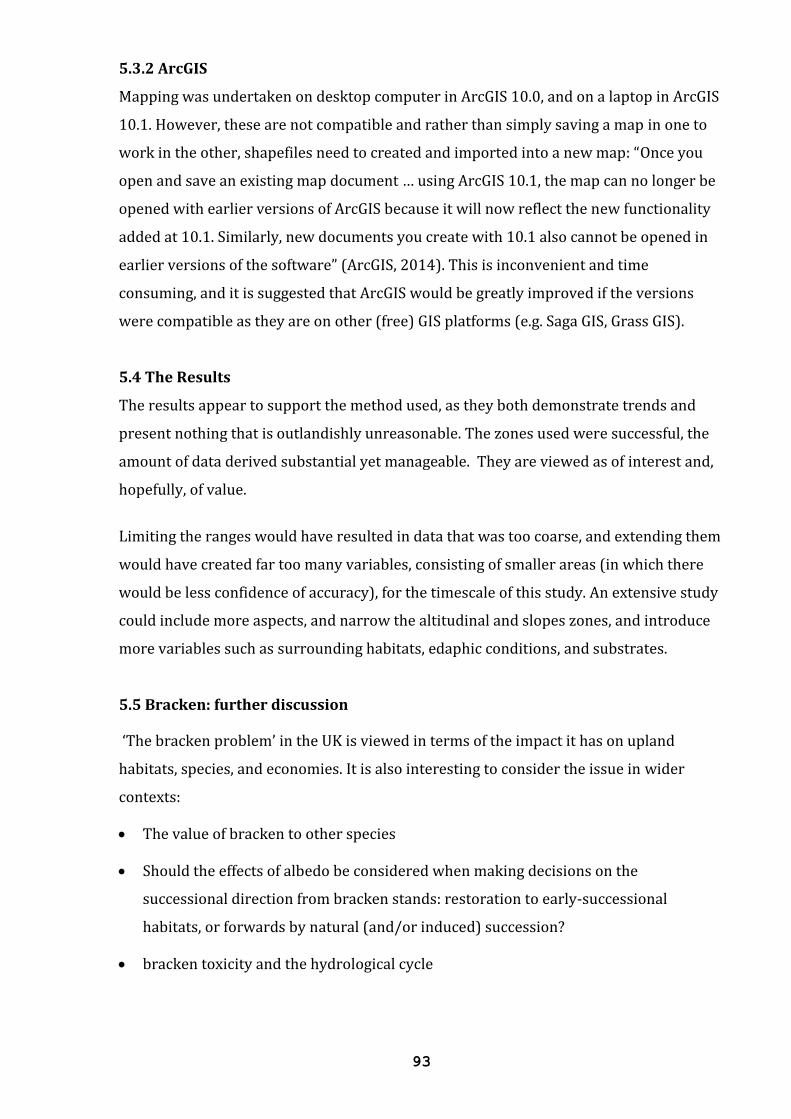
93
5.3.2 ArcGIS
Mapping was undertaken on desktop computer in ArcGIS 10.0, and on a laptop in ArcGIS
10.1. However, these are not compatible and rather than simply saving a map in one to
work in the other, shapefiles need to created and imported into a new map: “Once you
open and save an existing map document … using ArcGIS 10.1, the map can no longer be
opened with earlier versions of ArcGIS because it will now reflect the new functionality
added at 10.1. Similarly, new documents you create with 10.1 also cannot be opened in
earlier versions of the software” (ArcGIS, 2014). This is inconvenient and time
consuming, and it is suggested that ArcGIS would be greatly improved if the versions
were compatible as they are on other (free) GIS platforms (e.g. Saga GIS, Grass GIS).
5.4 The Results
The results appear to support the method used, as they both demonstrate trends and
present nothing that is outlandishly unreasonable. The zones used were successful, the
amount of data derived substantial yet manageable. They are viewed as of interest and,
hopefully, of value.
Limiting the ranges would have resulted in data that was too coarse, and extending them
would have created far too many variables, consisting of smaller areas (in which there
would be less confidence of accuracy), for the timescale of this study. An extensive study
could include more aspects, and narrow the altitudinal and slopes zones, and introduce
more variables such as surrounding habitats, edaphic conditions, and substrates.
5.5 Bracken: further discussion
‘The bracken problem’ in the UK is viewed in terms of the impact it has on upland
habitats, species, and economies. It is also interesting to consider the issue in wider
contexts:
The value of bracken to other species
Should the effects of albedo be considered when making decisions on the
successional direction from bracken stands: restoration to early-successional
habitats, or forwards by natural (and/or induced) succession?
bracken toxicity and the hydrological cycle
94
5.5.1 The value of bracken
Bracken has been acknowledged in this study as a valuable component of the landscape
mosaic at ‘appropriate’ levels, and for having conservation value (e.g. Marrs and Watt,
2006). But its value is considered low in comparison to the habitats into which it spreads
(e.g. Alday et al., 2013; Reed et al., 2009; Cox, 2007). Pakeman and Marrs (1992)
described its encroachment of heather moorland as “disastrous” for hitherto-
endangered birds like grouse and merlin (Falco columbarius). However bracken retains
value for a diversity of species groups (expanding on Table 1.1):
Mammals: bracken contributes shelter for fox (Vulpes vulpes) earths, badger (Meles
meles) setts, and rabbit (Oryctolagus cuniculus) burrows (Pakeman and Marrs, 1992).
Red (Cervus elaphus) and fallow (Dama dama) deer, and smaller mammals can hide
within bracken (Marrs and Watt, 2006; Nicholson and Paterson, 1976). The following
mammals also found in bracken habitats include: roe deer (Capreolus capreolus),
shrew (Sorex spp.) hedgehog (Erinaceus europaeus), wood mouse (Apodemus
sylvaticus), field vole (Microtus agrestis), and bank vole (Clethrionomys glareolus)
(Nicholson and Paterson, 1976).
Birds: bracken is regarded as of minimal ornithological value, and some birds
actively avoid it (e.g. red grouse, curlew (Numenius arquata), merlin, golden plover
(Pluvvialis apricaria), hen harrier (Circus cyaneus), short-eared owl (Asio flammeus),
and green-shank (Tringa nebularia)) (RSPB, 2012), for example 33 bird species
breed in heather moorland, 25 in acid grassland, compared to 15 in bracken
(Ratcliffe, 1977). Birds found in bracken habitats include: whinchat (Saxicola
rubetra), warblers (Phylloscopus spp.), ring ouzel (Turdus torquatus), tree pipit
(Anthus trivalis), nightjar (Caprimulgus europaeus), wrens (Troglodytidae spp.), and
twite (Carduelis flavirostis) (Pakeman and Marrs, 1992).
Reptiles: In bracken litter reptiles such as the common lizard (Lacerta vivipara),
sand lizard (Lacerta agilis), smooth snake (Coronella austriaca), and adder (Vipera
berus) can be found hibernating, although they require nearby open ground for
basking and courting (Marrs and Watt, 2006).
Invertebrates: bracken has a relatively small diversity, supporting only 27 “core”
invertebrates that feed either entirely or commonly on above-ground bracken and 11
that eat the rhizome (Marrs and Watt, 2006; Lawton et al., 1987). The only
95
Coleoptera identified with bracken is the aptly named bracken chafer (Phyllopertha
horticola) (Marrs and Watt, 2006). The shelter that bracken affords to plants like
common cow-wheat (Melampyrum pratense) and dog violet (Viola riviniana) attract
scarce butterflies, including the pearl-bordered fritillary (Bolorio euphrosyne), small
pearl-bordered fritillary (Bolorio selene), heath fritillary (Mellicta athalia), and high
brown fritillary (Argynnis adippe) (Anderson, pers. comm., 2014; Warren and Oates,
1995).
5.5.2 Albedo and succession
Succession and ‘rewilding’ were discussed in the study, and future climate change
potentially brings the debate to the fore. Reforestation heeds UNFCCC and Kyoto
Protocol policies of climate change mitigation (Arora and Montenegro, 2011; Reyer et al.,
2009), and policies to prevent deforestation (UNFF, 2011).
However albedo (reflectivity) can determine if reforestation contributes to climate
change, rather than mitigating for it (Montenegro et al., 2009; Betts, 2000). In the tropics
evaporative cooling establishes cooler, moister conditions (Galos et al., 2013;
Montenegro et al., 2009). In boreal or taiga zones solar radiation creates warmth
through absorption (Wang et al., 2014; Betts, 2011; Bala et al., 2007). In temperate
climates there is less certainty, and it is disputed whether reforestation causes cooling,
or warming, or, indeed, if there is temperature any change at all (South et al., 2011;
Arora and Montenegro, 2011; Schwaiger and Bird, 2010). The recommended strategies
for climate change mitigation are: increase reforestation and prevent deforestation in
the tropics, whilst desisting from reforestation in the northern latitudes (Arora and
Montenegro, 2011).
Whether the albedo-effect will have any influence on successional policy in the PDNP is
unlikely as the effects are expected to be minimal in either direction, and the likelihood
of albedo-induced warming probably decreases under future climate change scenarios.
5.5.3 Bracken toxicity and hydrology
A further factor which may influence future successional policy is bracken’s toxicity.
Ptaquiloside “is a carcinogenic norsesquiterpene glucoside produced by bracken”
(Rasmussen et al., 2005), and it is a risk to human and animal health (Marrs and Watt,
2006), for example it contributes to the death of 1 million cattle p.a. in Brazil by plant
poisoning (Tokarnia et al., 2002). Following precipitation, it is thought to leach into the
96
soil, potentially reaching potable water sources (Ramwell et al., 2010; Rasmussen et al.,
2005). However the amounts are difficult to quantify, being small and concealed by other
pollution within watercourses (Ramwell et al., 2010; Green et al., 2007). Can it be worse
than the effects of bracken herbicide run-off?
This study has been a pleasure to undertake, I hope it has been enjoyable – or at least
enlightening – to read.
Julian McAlpine, August 2014
97
6. References ADER, K.G. (1988) Factors controlling the distribution and spread of bracken (Pteridium aquilinum) in Scotland. Phd Thesis, Department of Geography, University of Glasgow ALBERT, K.R., RO-POULSEN, H., MIKKELSEN, T.N., MICHELSEN, A., VAN DER LINDEN, L. and BEIER, C. (2011) Interactive effects of elevated CO2, warming, and drought on photosynthesis of Deschampsia flexuosa in a temperate heath ecosystem. Journal of Experimental Botany, 62 (12), 4253–4266 ALBERT, K.R., KONGSTAD, J., SCHMIDT, I.K., MIKKELSEN, T.N., MICHELSEN, A., VAN DER LINDEN, L. and BEIER, C. (2012) Temperate heath plant response to dry conditions depends on growth strategy and less on physiology. Acta Oecologica, 45, 79-87 ALBERTSON, K., AYLEN, J., CAVAN, G. and MCMORROW, J. (2011) Climate change and the future occurrence of moorland wildfires in the Peak District of the UK. Contribution to CR Special 24 ‘Climate change and the British Uplands.’ Climate research, 45 (1), 105-119 ALCAMO, J.M., VOROSMARTY, C.J., NAIMAN, R.J., LETTENMAIER, D.P. and PAHL-WOSTL, C. (2008) A grand challenge for freshwater research: understanding the global water system. Environmental Research Letters, 3, 1-6 ALDAY, J.G., COX, E.S., PAKEMAN, R.S., HARRIS, M.P.K., LE DUC, M.G. and MARRS, R. H. (2013) Effectiveness of Calluna-heathland restoration methods after invasive plant control. Ecological Engineering, 54, 218–226 ALDAY, J.G. and MARRS, R. H. (2014) A simple test for alternative states in ecological restoration: the use of principal response curves. Applied Vegetation Science, 17, 302–311 ALLEN, M.R. and INGRAM, W.J. (2002) Constraints on future changes in climate and the hydrologic cycle. Nature, 419, 224-232 ALONSO-AMELOT, M.E., OLIVEROS, A., CALCAGNO, M.P. and ARELLANO, E. (2001) Bracken adaptation mechanisms and xenobiotic chemistry. Pure and Applied Chemistry, 73 (3), 549–553 AMEC (ENVIRONMENT & INFRASTRUCTURE LTD)(2013) [online] 1.Biodiversity [Accessed: 15/08/2014] Available: www.gov.uk/government/uploads/system/uploads/attachment_data/file/274005/Appendix_B_DECC_SEA_Enviro_Report.pdf ANDERSON, P. (1986) Accidental Moorland Fires in the Peak District: A Study of Their Incidence and Ecological Implications. Peak District Moorland Restoration Programme, PDNPA, Bakewell ANDERSON, P. and RADFORD, E. (1988) Bracken: A review of its role in the moorlands of the Peak District National Park. Moorland Management Project Steering Group, March 1988, 1-74 ANDERSON, P., BUCKLER,, M. and WALKER, J. (2009) Moorland restoration: potential and progress. From BONN, A., ALLOTT, T., HUBACEK, K. and STEWART, J. (eds.) Drivers of Environmental Change in Uplands. Routledge, Abingdon ANDERSON, P. and ROSS, S. (2011) United Utilities Sustainable Management Catchment Programme, Volume 4: The Restoration of Upland Vegetation. Penny Anderson Associates Ltd., Buxton ANDERSON, P. (2014) personal communications, June-August 2014 APLIN, P. (2005) Remote sensing: ecology. Progress in Physical Geography, 29 (1), 104-113 ARBLASTER, K., REED, M.S., FRASER, E.D.G. and POTTER, C. (2009) Using scenarios to explore UK upland futures. From: BONN, A., ALLOTT, T., HUBACEK, K. and STEWART, J. (eds.) Drivers of Environmental Change in Uplands. Routledge, Abingdon ARCGIS (2008) [online] What is raster data? [Accessed: 14/07/2014] http://webhelp.esri.com/arcgisdesktop/9.2/index.cfm?TopicName=What_is_raster_data%3F
98
ARCGIS (2011) [online] Resource Center – Polygon [Accessed: 14/07/2014] Available: http://help.arcgis.com/en/arcgisdesktop/10.0/help/index.html#//000v000000n1000000 ARCGIS (2014) [online] ArcGIS Resources – ArcGIS 10.1 Help [Accessed: 20/08/2014] Available: http://resources.arcgis.com/en/help/main/10.1/index.html#//006600000253000000
ARNETH, A., HARRISON, P., ZAEHLE, S., TSIGARIDIS, K., MENON, S., BARTLEIN, P.J., FEICHTER, J., KORHOLA, A., KULMALA, M., O’DONNELL, D., SCHURGERS, G., SORVARI, S. and VESALA, T. (2010) Terrestrial biogeochemical feedbacks in the climate system. Nature Geoscience, 3, 525-532 ARORA, V.K. AND MONTENEGRO, A. (2011) Small temperature benefits provided by realistic afforestation efforts. Nature Geoscience, 4, 514-518 ATKINSON, T.P. (1986) Bracken on the Malvern Hills: The influence of Topographic and Management Factors on early-season Emergence and Biomass. From SMITH, R.T. and TAYLOR, J.A. (eds.) Bracken: Ecology, land use and control technology, Parthenon Publishing Group, Carnforth ATKINSON, T.P. (1989) Seasonal and altitudinal variation in Pteridium aquilinum (L.) Kuhn: frond and stand types. New Phytologist, 113 (3), 359-365 BAILEY, B. And PEARSON, A.W. (2007) Change Detection Mapping and Analysis of Salt Marsh Areas of Central Southern England from Hurst Castle Spit to Pagham Harbour, Journal of Coastal Research, 23 (6), 1549-1564 BALA, G., CALDEIRA, K., WICKETT, M., PHILLIPS, T.J., LOBELL, D.B., DELIRE, C. and MIRIN, A. (2007) Combined climate and carbon-cycle effects of large-scale deforestation. Proceedings of the National Academy of Sciences of the United States of America, 104 (16), 6550-6555 BARDGETT, R.D., MARSDEN, J.H. and HOWARD, D.C. (1995) The extent and condition of heather on moorland in the uplands of England and Wales. Biological Conservation, 71 (2), 155-161 BARKER, C.G., POWER, S.A., BELL, J.N.B. and ORME, C.D.L. (2004) Effects of habitat management on heathland response to atmospheric nitrogen deposition. Biological Conservation, 120, 41–52 BARNOSKY, A.D, HADLY, E.A., BASCOMPTE, J., BERLOW, E.L., BROWN, J.H., FORTELIUS, M., GETZ, W.M., HARTE, J., HASTINGS, A., MARQUET, P.A., MARTINEZ, N.D., MOOERS, A., ROOPNARINE, P., VERMEIJ, G., WILLIAMS, J.W., GILLESPIE, R., KITZES, J., MARSHALL, C., MATZKE, N., MINDELL, D.P., REVILLA, E. and SMITH, A.B. (2012) Approaching a state shift in Earth’s biosphere. Nature, 486, 52-58 BARRY, R.G. and CHORLEY, R.J. (2010) Atmosphere, weather and climate. Routledge, Abingdon
BEDDINGTON, J. (2009) Food, Energy, Water and the Climate: A Perfect Storm of Global Events? Government Office for Science, September & October 2009, presentations at The Thailand Science Park, Bangkok, Thailand & The National University of Science, Hanoi, Vietnam BEER, C., REICHSTEIN, M., TOMELLERI, E., CIAIS, P., JUNG, M., CARVALHAIS, N., RÖDENBECK, C., ARAIN, M.A., BALDOCCHI, D., BONAN, G.B., BONDEAU, A., CESCATTI, A., LASSLOP, G., LINDROTH, A., LOMAS, M., LUYSSAERT, S., MARGOLIS, H., OLESON, K.W., ROUPSARD, O., VEENENDAAL, E., VIOVY, N., WILLIAMS, C., WOODWARD, F.I. AND PAPALE, D. (2010) Terrestrial Gross Carbon Dioxide Uptake: Global Distribution and Covariation with Climate. Science, 329, 834-838 BENISTON, M. (2003) Climatic change in mountain regions: a review of possible impacts. Climate Change, 59, 5–31 BERGET, C. (2012) Invasion of Bracken Fern in Southern Mexico: Local Knowledge and Perceptions in Two Indigenous Communities in the Chinantla Region, Oaxaca, Mexico. Florida International University Thesis, Paper 704 BERRY, P.M., DAWSON, T.P., HARRISON, P.A., PEARSON, R. and BUTT, N. (2003) The sensitivity and vulnerability of terrestrial habitats and species in Britain and Ireland to climate change. Journal for Nature Conservation, 11 (1), 15-23
99
BETTS, R.A. (2000) Offset of the potential carbon sink from boreal forestation by decreases in surface albedo. Nature, 408, 187-190 BETTS, R.A. (2011) Afforestation cools more or less. Nature Geoscience, 4, 504-505 BIRCH, C.P.D. (2002) The influence of position on genet growth: a simulation of a population of bracken (Pteridium aquilinum (L.) Kuhn) genets under grazing. Evolutionary Ecology, 15, 463–483 BIRNIE, R.V., MILLER, D.R., HORNE, P.L., LEADBETTER, S. and MACDONALD, A. (2000) The Potential Distribution and Impact of Bracken in Upland Scotland: An Assessment using a GIS-based Niche Model. Annals of Botany, 85 (B), 53-62 BLACKBURN, G.A. and PITMAN, J.I. (1999) Biophysical controls on the directional spectral reflectance properties of bracken (Pteridium aquilinum) canopies: results of a field experiment. International Journal of Remote Sensing, 20 (11), 2265-2282 BOOTS, B. and CSIILLAG, F. (2006) Categorical maps, comparisons, and confidence. Journal of Geographical Systems, 8, 109-118 BONN, A., ALLOTT, T., HUBACEK, K. and STEWART, J. (2009) Drivers of Environmental Change in Uplands: concepts, threats and opportunities. From: BONN, A., ALLOTT, T., HUBACEK, K. and STEWART, J. (eds.) Drivers of Environmental Change in Uplands. Routledge, Abingdon BONN, A., REBANE, M. and REID, C. (2009b) Ecosystem services: A new rationale for conservation of upland environments. From: BONN, A., ALLOTT, T., HUBACEK, K. and STEWART, J. (eds.) Drivers of Environmental Change in Uplands. Routledge, Abingdon BRACKEN CONTROL (2014) [online] News items [Accessed: 05/06/2014] Available: www.brackencontrol.co.uk/News BROWN, R.W. (1986) Bracken in the North York Moors: Its ecological and amenity implications in National Parks. From: SMITH, R.T. and TAYLOR, J.A. Bracken. Parthenon, Carnforth BURGE, M.N. and KIRKWOOD, R.C. (1992) The Control of Bracken. Critical Reviews in Biotechnology, 12 (4), 299-333 BURROUGH, P.A. and MCDONNELL, R.A. (1998) Principles of Geographical Information Systems. Oxford University Press, Oxford BURT, T.P. and HOLDEN, J. (2010) Changing temperature and rainfall gradients in the British Uplands. Contribution to CR Special 24 ‘Climate change and the British Uplands,’ Climate Research, 45, 57–70 CALDEIRA, K., BALA, G. and CAO, L. (2013) The Science of Geoengineering. The Annual Review of Earth and Planetary Sciences, 41, 231–56 CALLAGHAN, T., CARLSSON, B.A., JONSDOTTIR, I.S., SVENSSON, B.M. and JONASSON, S. (1992) Clonal Plants and Environmental Change: Introduction to the Proceedings and Summary. Oikos, 63 (3), 341-347 CAPORN, S.J.M., BROOKS, A.L., PRESS, M.C. and LEE, J.A. (1999) Effects of long-term exposure to elevated CO2 and increased nutrient supply on bracken (Pteridium aquilinum). Functional Ecology, 13 (1), 107-115 CAPORN, S.J.M. and EMMETT, B.A. (2009) Threats from air pollution and climate change to upland systems; past, present and future. From: BONN, A., ALLOTT, T., HUBACEK, K. and STEWART, J. (eds.) Drivers of Environmental Change in Uplands. Routledge, Abingdon CAREY, P.D., WALLIS, S., CHAMBERLAIN, P.M., COOPER, A., EMMETT, B.A., MASKELL, L.C., MCCANN, T., MURPHY, J., NORTON, L.R., REYNOLDS, B., SCOTT, W.A., SIMPSON, I.C., SMART, S.M. and ULLYETT, J.M. (2008) Countryside Survey: UK Results from 2007. Centre for Ecology and Hydrology, Lancaster CARR, G. and MIDDLETON, P. (2004) Breeding Bird Survey of the Peak District Moorlands 2004. Moors for the Future Report No. 1. Moors for the Future, Castleton, Derbyshire
100
CBD (CONVENTION ON BIOLOGICAL DIVERSITY) (2008) Climate change & biodiversity. CBD, Bonn CHAHINE, M.T. (1992) The hydrological cycle and its influence on climate. Nature, 359, 373-380 CHALLENGER, G. (1992) Monitoring Landscape Change Project –Bracken. Peak District National Park Authority, Bakewell CHAMBERS, F.M., MAUQUOY, D. and TODD, P.A. (1999) Recent rise to dominance of Molinia caerulea in environmentally sensitive areas: new perspectives from palaeoecological data. Journal of Applied Ecology, 36 (5), 719-733 CHERRILL, A.J. and LANE, A.M. (1994) Bracken (Pteridium aquilinum (L.) Kuhn) infestation of rough grazing land in the catchment of the River Tyne, northern England. Watsonia, 20, 104-115 CLARK, J.M., ORR, H.G., FREER, J., HOUSE, J.I., SMITH, P. and FREEMAN, C. (2010) Assessment of projected changes in upland environments using simple climatic indices. Contribution to CR Special 24 ‘Climate change and the British Uplands.’ Climate Research, 45, 87-104 CLUTTERBUCK, B. (2009) Land management (specifically controlled heather burning) as a factor controlling carbon loss from upland peat soils. DPhil Thesis, Cranfield University, Cranfield, Bedfordshire CLUTTERBUCK, B. and YALLOP, A.R. (2010) Land management as a factor controlling dissolved organic carbon release from upland peat soils 2: Changes in DOC productivity over four decades. Science of the Total Environment, 408, 6179–6191 CLUTTERBUCK, B. (2014) Personal communications, May-August 2014 CONNOLLY, J. and HOLDEN, N.M. (2013) Classification of peatland disturbance. Land Degradation & Development, 24, 548–555 COPPIN, P., JONCKHEERE, I., NACKAERTS, K. and MUYS, B. (2004) Digital change detection methods in ecosystem monitoring: a review. International Journal of Remote Sensing, 25, 1565–1596
COSTA, M.H. and FOLEY, J.A. (2000) Combined Effects of Deforestation and Doubled Atmospheric CO2 Concentrations on the Climate of Amazonia. Journal of Climate, 18 (13), 18-34 COX, E.S. (2007) The implications and effects of bracken (Pteridium aquilinum (L.) Kuhn) control on species diversity, re-vegetation and bracken performance. DPhil Thesis, University of Liverpool COX, E.S., MARRS, R.H., PAKEMAN, R.J., LE DUC, M.G. (2007) A multi-site assessment of Pteridium aquilinum control across the UK. Applied Vegetation Science, 10 (3), 429–440 CRC (COMISSION FOR RURAL COMMUNITIES) (2010) High ground, high potential – a future for England’s upland communities. CRC, Cheltenham CURREY, P.M., JOHNSON, D., DAWSON, L.A., VAN DER WAL, R., THORNTON, B., SHEPPARD, L.J., LEITH, I.D. and ARTZ, R.R.E. (2011) Five years of simulated atmospheric nitrogen de position have only subtle effects on the fate of newly synthesized carbon in Calluna vulgaris and Eriophorum vaginatum. Soil Biology and Biochemistry, 43, 495-502 DAMGAARD, C., RIIS-NIELSEN, T. and SCHMIDT, I.K. (2009) Estimating plant competition coefficients and predicting community dynamics from non-destructive pin-point data: a case study of Calluna vulgaris and Deschampsia flexuosa. Plant Ecology, 201, 687-697 DARE, P.M. (2005) Shadow Analysis in High-Resolution Satellite Imagery of Urban Areas. Photogrammetric Engineering & Remote Sensing, 71 (2), 169–177 DA SILVA, U. and MATOS, D. (2006) The invasion of Pteridium aquilinum and the impoverishment of the seed bank in fire prone areas of Brazilian Atlantic Forest. Biodiversity and Conservation, 15, 3035–3043
101
DAVIES, M.G., GRAY, A., HAMILTON, A. and LEGG, C.J. (2008) The future of fire management in the British uplands. International Journal of Biodiversity Science & Management, 4 (3), 127-147 DECC (DEPARTMENT OF ENERGY AND CLIMATE CHANGE) (2014) [online) Reducing the UK’s greenhouse gas emissions by 80% by 2050 [Accessed: 17/08/2014] Available: www.gov.uk/government/policies/reducing-the-uk-s-greenhouse-gas-emissions-by-80-by-2050 DEFRA (DEPARTMENT FOR ENVIRONMENT, FOOD AND RURAL AFFAIRS) (2007) The Heather and Grass Burning Code. Defra, London DEFRA (DEPARTMENT FOR ENVIRONMENT, FOOD AND RURAL AFFAIRS) (2008) Guidance Note on the Aerial Spraying of herbicides or pesticides. Defra, London DEFRA (DEPARTMENT FOR ENVIRONMENT, FOOD AND RURAL AFFAIRS) (2011) Uplands Policy Review. Defra, London DELUCA, T.H., ZEWDIE, S.A., ZACKRISSON, O., HEALEY, J.R. and JONES, D.L. (2013) Bracken fern (Pteridium aquilinum L. kuhn) promotes an open nitrogen cycle in heathland soils. Plant and Soil, 367 (1-2), 521-534 DEN OUDEN, J. (2000) The role of bracken (Pteridium aquilinum) in forest dynamics. PhD thesis, Wageningen University, Wageningen, The Netherlands DODGSHON, R.A. and OLSSON, G.A. (2006) Heather moorland in the Scottish Highlands: the history of a cultural landscape, 1600–1880. Journal of Historical Geography, 32 (1), 21-37 DOUGILL, A.J., FRASER, E.D.G., HOLDEN, J., HUBACEK, K., PRELL, C., REED, M.S., STAGL, S. AND STRINGER, L.C. (2006) Learning from Doing Participatory Rural Research: Lessons from the Peak District National Park. Journal of Agricultural Economics, 57 (2), 1–17 DRING, M.J. (1965) The influence of shaded conditions on the fertility of bracken. British Fern Gazette, 9, 222-227 DRIVER, A. (2014) [online] Hill farmers hit back at Monbiot over rewilding calls [Accessed: 16/08/2014] Available: www.farmersguardian.com/home/latest-news/hill-farmers-hit-back-at-monbiot-over-rewilding-calls/61850.article EATOUGH JONES, M., FENN, M.E. and PAINE, T.D. (2011) The effect of nitrogen additions on bracken fern and its insect herbivores at sites with high and low atmospheric pollution. Arthropod-Plant Interactions, 5 (3), 163-173 EC (EUROPEAN COMMISSION) (2009) [online] Aid to farmers in Less Favoured Areas (LFA) [Accessed: 12/08/2014] Available: http://ec.europa.eu/agriculture/rurdev/lfa/index_en.htm EC (EUROPEAN COMMISSION) (2014a) [online] The Habitats Directive [Accessed: 01/06/2014] Available: http://ec.europa.eu/environment/nature/legislation/habitatsdirective/index_en.htm EC (EUROPEAN COMMISSION) (2014b) [online] EU greenhouse gas emissions and targets [Accessed: 04/06/2014] Available: http://ec.europa.eu/clima/policies/g-gas/index_en.htm EC (EUROPEAN COMMISSION) (2014c) [online] The EU Water Framework Directive - integrated river basin management for Europe. [Accessed: 17/08/2014] Available: http://ec.europa.eu/environment/water/water-framework/index_en.html EDMONDSON, J., TERRIBILE, E., CARROLL, J.A., PRICE, E.A.C. AND CAPORN, S.J.M (2013) The legacy of nitrogen pollution in heather moorlands: Ecosystem response to simulated decline in nitrogen deposition over seven years. Science of the Total Environment, 444,138–144 EEA (EUROPEAN ENVIRONMENT AGENCY) (2013) [online] Atmospheric greenhouse gas concentrations (CSI 013/CLIM 052) [Accessed: 10/05/2014] Available: http://www.eea.europa.eu/data-and-maps/indicators/atmospheric-greenhouse-gas-concentrations-2/assessment-1
102
ELKINGTON, T., DAYTON, N., JACKSON, D.L. and STRACHAN, I.M. (2001) National Vegetation Classification: Field guide to mires and heaths. JNCC, Peterborough ENGLISH NATURE (2001) State of Nature; the upland challenge. External Relations Team, English Nature, Peterborough ENNOS, R. (2012) Statistical and Data Handling Skills in Biology. Pearson Education Limited, Harlow ERDAS (1999) ERDAS Field Guide. ERDAS, Inc., Atlanta, Georgia EVANS, D.M., REDPATH, S.M., ELSTON, D.A., EVANS, S.A., MITCHELL, R.J. and DENNIS, P. (2006) To graze or not to graze? Sheep, voles, forestry and nature conservation in the British uplands. Journal of Applied Ecology, 43, 499-505 EVANS, M. (2009) Natural changes in upland landscapes. From: BONN, A., ALLOTT, T., HUBACEK, K. and STEWART, J. (eds.) Drivers of Environmental Change in Uplands. Routledge, Abingdon EVANS, K. and PEARCE-HIGGINS, J. (2013) Terrestrial biodiversity climate change impacts report card technical paper. 14. Mechanisms driving UK biodiversity responses to climate change: assessment and indicators. Department of Animal and Plant Sciences, Sheffield, and British Trust for Ornithology, Thetford FAGUNDEZ, J. (201) Heathlands confronting global change: drivers of biodiversity loss from past to future scenarios. Annals of Botany, 111(2), 151-72 FALLOON, P. and BETTS, R. (2010) Climate impacts on European agriculture and water management in the context of adaptation and mitigation—The importance of an integrated approach. Science of the Total Environment, 408, 5667–5687 FINNEY, S.K., PEARCE-HIGGINS, J.W. and YALDEN, D.W. (2005) The effect of recreational disturbance on an upland breeding bird, the golden plover Pluvialis apricaria. Biological Conservation, 121 (1), 53-63 FOODY, G.M. (2007) Map comparison in GIS. Progress in Physical Geography, 31 (4), 439-445 FONTANA, V., RADTKE, A., WALDE, J.,TASSER, E., WILHALM, T, ZERBE, S. and TAPPEINER, U. (2014) What plant traits tell us: Consequences of land-use change of a traditional agro-forest system on biodiversity and ecosystem service provision. Agriculture, Ecosystems & Environment, 186, 44–53 FRASER, M.D., THEOBALD, V.J., GRIFFITHS, J.B., MORRIS, S.M. and MOORBY, J.M. (2009) Comparative diet selection by cattle and sheep grazing two contrasting heathland communities. Agriculture, Ecosystems & Environment, 129 (1–3), 182–192 FULLER, R.J. and GOUGH, S.J. (1999) Changes in sheep numbers in Britain: implications for bird populations. Biological Conservation, 91, 73-89 GALOS, B., HAGEMANN, S., HÄNSLER, A., KINDERMANN, G., RECHID, D., SIECK, K., TEICHMANN, C. AND JACOB, D. (2013) Case study for the assessment of the biogeophysical effects of a potential afforestation in Europe. Carbon Balance and Management, 8 (3), 1-12 GARDNER, S.M., WATERHOUSE, A. and CRITCHLEY, C.N.R. (2009) The effect of policy change on upland grazing, vegetation and farm economics. From: BONN, A., ALLOTT, T., HUBACEK, K. and STEWART, J. (eds.) Drivers of Environmental Change in Uplands. Routledge, Abingdon GILES, P. (2001) Remote sensing and cast shadows in mountainous terrain, Photogrammetric Engineering & Remote Sensing, 67 (7), 833–839 GIMINGHAM, C.H. (1975) An Introduction to Heathland Ecology. Oliver & Boyd, Edinburgh GLIESSMAN, S.R. and MULLER, C.H. (1978) The allelopathic mechanisms of dominance in bracken (Pteridium aquilinum) in Southern California. Journal of Chemical Ecology, 4 (3), 337-362 GOOGLE EARTH (2014) [online] various PDNP imagery available at: http://earth.google.com
103
GORDON, C., WOODIN, S.J., ALEXANDER, I.J. and MULLINS, C.E. (1999) Effects of increased temperature, drought and nitrogen supply on two upland perennials of contrasting functional type: Calluna vulgaris and Pteridium aquilinum. New Phytologist, 142 (2), 243-258 GOUGH, C. M. (2012) Terrestrial Primary Production: Fuel for Life. Nature Education Knowledge, 3 (10), 28 GREEN, C.H., DONNER, E., FAULKNER, H.P., GARELICK, H., JONES, H., REVITT, D.M. and SCHOLES, L.N.L. (2007) Sustainable water: chemical science priorities summary report. Royal Society of Chemistry, London GRIME, J.P. (2001) Plant Strategies and Vegetation Processes. John Wiley & Sons, Chichester GRIME, J.P., FRIDLEY, J.D., ASKEW, A.A., THOMPSON, K., HODGSON, J.G. and BENNETT, C.R. (2008) Long-term resistance to simulated climate change in an infertile grassland. Proceedings of the National Academy of Sciences, 105 (29), 10028–10032 HAIGH, M. (2006) Environmental Change in Headwater Peat Wetlands, UK. Environmental Role of Wetlands in Headwaters, NATO Science Series: IV: Earth and Environmental Sciences, 63, 237-255 HAINES-YOUNG, R.H., BARR, C.J., BLACK, H.I.J., BRIGGS, D.J., BUNCE, R.G.H., CLARKE, R.T., COOPER, A., DAWSON, F.H., FIRBANK, L.G., FULLER, R.M., FURSE, M.T., GILLESPIE, M.K., HILL, R., HORNUNG, M., HOWARD, D.C., MCCANN, T., MORECROFT, M.D., PETIT, S., SIER, A.R.J., SMART, S.M., SMITH, G.M., STOTT, A.P., STUART, R.C. and WATKINS, J.W. (2000) Accounting for nature: assessing habitats in the UK countryside. Department of the Environment, Transport and the Regions, London HARDIN, G. (1960) The Competitive Exclusion Principle. Science, 131 (3409), 1292-1297 HARGROVE, W.W., HOFFMAN, F.M. and HESSBURG, P.F. (2006) Mapcurves: a quantitative method for comparing categorical maps. Journal of Geographical Systems, 8, 187-208 HARMER, R., BOSWELL, R. and ROBERTSON, R. (2005) Survival and growth of tree seedlings in relation to changes in the ground flora during natural regeneration of an oak shelterwood. Forestry, 78 (1), 21-32. HARPER, J.L. (1977) Population Biology of Plants. Academic Press, London HARTIG, K. and BECK, E. (2003) The Bracken Fern (Pteridium Arachnoideum (Kaulf.) Maxon) Dilemma in the Andes of Southern Ecuador. Ecotropica, 9, 3-13 HARVEY-MILLER, N. (2014) Grouse moor land-manager, personal communication, 07/08/2014 HATCHER, P. E. and BATTY, N. (2011) Biological Diversity: Exploiters and Exploited. John Wiley and Sons, Chichester HEIMANN, M., ESSER, G., HAXELTINE, A., KADUK, J., KICKLIGHTER, D.W., KNORR, W., KOHLMAIER, G.H., MCGUIRE, A.D., MELILLO, J., MOORE, B. III, OTTOFI, D., PRENTICE, I.C., SAUF, W., SCHLOSS, A., SITCH, S., WITTENBERG, U. and WURTH, G. (1998) Evaluation of terrestrial carbon cycle models through simulations of the seasonal cycle of atmospheric CO2: First results of a model intercomparison study. Global Biogeochemical cycles, 12 (1), 1-24 HEIMANN, M. and REICHSTEIN, M. (2008) Terrestrial ecosystem carbon dynamics and climate feedbacks. Nature, 451, 289-292 HELLIWELL, R., AVERY, L., CONNIFF, A., MCNAY, D. and GORMAN, J. (2013) Reducing pollution from forestry related activities in the Galloway and Eskdalemuir forests: A review of Best Management Practices to reduce diffuse pollution. CREW project CD2012/41. Centre of Expertise for Waters (CREW), Aberdeen HICKLING, R., ROY, D.B., HILL, J.K., FOX, R. and THOMAS, C.D. (2006) The distribution of a wide range of taxonomic groups are expanding polewards. Global Change Biology, 12, 450–455 HIGGINS, S.I. and RICHARDSON, D.M. (2014) Invasive plants have broader physiological niches. Proceedings of the National Academy of Sciences, 111 (29), 10610-10614 HOLDEN, J. and ADAMSON, J.K. (2002) The Moor House long term upland temperature record: new evidence of recent warming. Weather, 57, 119-127
104
HOLDEN, J., SHOTBOLT, L., BONN, A., BURT, T.P., CHAPMAN, P.J., DOUGILL, A.J., FRASER, E.D.G, HUBACEK, K., IRVINE, B., KIRKBY, M.J., REED, M.S., PRELL, C., STAGL, S., STRINGER, L.C., TURNER, A. and WORRALL, F. (2007) Environmental change in moorland landscapes. Earth-Science Reviews, 82, 75–100 HOLDEN, J. (2009) Upland hydrology. From: BONN, A., ALLOTT, T., HUBACEK, K. and STEWART, J. (eds.) Drivers of Environmental Change in Uplands. Routledge, Abingdon HOLLAND, J. and APLIN, P. (2013) Super-resolution image analysis as a means of monitoring bracken (Pteridium aquilinum) distributions. ISPRS Journal of Photogrammetry and Remote Sensing, 75, 48–63 HOLMES, A. (auth.) and DUFF, D. (ed.) (1998) Holmes’ Principles of Physical Geology. Stanley Thornes, Cheltenham HOOIJER, A., PAGE, S.E., NAVRATIL, P., VERNIMMEN, R., VAN DER VAT, M., TANSEY, K., KONECNY, K., SIEGERT, F., BALLHORN, U. and MAWDSLEY, N. (2013) Carbon Emissions from Drained and Degraded Peatland in Indonesia and Emission Factors for Measurement, Reporting and Verification (MRV) of Peatland Greenhouse Gas Emissions. A summary of KFCP research results for practitioners. Indonesia-Australia Forest Carbon Partnership, Jakarta HOPKINS, A., WAINWRIGHT, J., MURRAY, P. J., BOWLING, P. J. and WEBB, M. (1988) 1986 survey of upland grassland in England and Wales: changes in age structure and botanical composition since 1970-72 in relation to grassland management and physical features. Grass and Forage Science, 43,185-198 HORNIK, K. (2014) [online] The R FAQ [Accessed: 07/08/2014] Available: http://CRAN.R-project.org/doc/FAQ/R-FAQ.html HOUSE, J.I., ORR, H.G., CLARK, J.M., GALLEGO-SALA, A.V., FREEMAN, C., PRENTICE, I.C. and SMITH, P. (2010) Climate change and the British Uplands: evidence for decision-making. Contribution to CR Special 24 ‘Climate change and the British Uplands,’ Climate Research, 45, 3-12 HULME, M., TURNPENNY, J. and JENKINS, G. (2002) Climate Change Scenarios for the United Kingdom. The UKCIP02 Briefing Report, April 2002. UK Climate Impacts Programme, Tyndall Centre for Climate Change Research, School of Environmental Sciences, University of East Anglia, Norwich HULME, P.E. (2005) Adapting to climate change: is there scope for ecological management in the face of a global threat? Journal of Applied Ecology, 42 (5), 784–794 HUNTINGTON, T.G. (2006) Evidence for intensification of the global water cycle: Review and synthesis. Journal of Hydrology, 319, 83–95 IEA (INTERNATIONAL ENERGY AGENCY) (2013) Redrawing the Energy-Climate Map. World Energy Outlook Special Report. IEA, Paris IGIC (INDIANA GEOGRAPHIC INFORMATION COUNCIL) (2014) [online] What is GIS? [Accessed: 13/07/2014] Available at: www.igic.org/about/index.html IPCC (INTERGOVERNMENTAL PANEL ON CLIMATE CHANGE) (2007) Climate Change 2007: Impacts, Adaptation and Vulnerability. IPCC Secretariat, Geneva IPCC (INTERGOVERNMENTAL PANEL ON CLIMATE CHANGE) (2013) Climate Change 2013: The Physical Science Basis. Working Group I Contribution to the IPCC Fifth Assessment Reprt (5AR), Climate Change 2013: The Physical Science Basis, Stockholm, 23-26 September 2013 ITIS (INTERAGENCY TAXONOMIC INFORMATION SYSTEM) (2011) [online] Pteridium aquilinum ssp. aquilinum (L.) Kuhn [Accessed: 20/05/2014] Available: www.itis.gov/servlet/SingleRpt/SingleRpt?search_topic=TSN&search_value=897810 JENSEN, J.R. (2007) Remote Sensing of the Environment: An Earth Resource Perspective. Pearson Prentice Hall, Upper Saddle River, NJ JENTSCH, A., KREYLING, J. and BEIERKUHNLEIN, C. (2007) A new generation of climate-change experiments: events, not trends. Frontiers in Ecology and the Environment, 5 (7), 365–374
105
JNCC (JOINT NATURE CONSERVATION COMMITTEE) (2009) Common Standards Monitoring Guidance for Upland habitats, Version July 2009. JNCC, Peterborough JNCC (JOINT NATURE CONSERVATION COMMITTEE) (2012) [online] The UK Biodiversity Action Plan (UK BAP) 1992–2012 [Accessed 12/08/2014] Available: http://jncc.defra.gov.uk/page-5155 JNCC (JOINT NATURE CONSERVATION COMMITTEE) (2014) [online] Ecosystem Approach [Accessed: 17/08/2014] Available: http://jncc.defra.gov.uk/default.aspx?page=6276 KAPOS, V., BALMFORD, A., AVELING, R., BUBB, P., CAREY, P., ENTWISTLE, A., HOPKINS, J., MULLIKEN, T., SAFFORD, R., STATTERSFIELD, A., WALPOLE, M. and MANICA, A. (2009) Outcomes, not implementation, predict conservation success. Oryx, 43, 336-342 KESSLER, M. (2010) Biogeography of Ferns. From: MEHLTRETER, K., WALKER, L.R. and SHARPE, J.M. Fern Ecology. Cambridge University Press, Cambridge KUNDZEWICZ, Z.W. (2008) Climate change impacts on the hydrological cycle. Ecohydrological Processes and Sustainable Floodplain Management, 8 (2-4), 195-203 KUZERA, K. AND PONTIUS, R.G. Jr. (2008) Importance of Matrix Construction for Multiple-Resolution Categorical Map Comparison. GIScience and Remote Sensing, 45 (3), 1-26 LABA, M., DOWNS, R., SMITH, S., WELSH, S., NEIDER, C., WHITE, S., RICHMOND, M., PHILPOT, W. and BAVEYE, P. (2008) Mapping invasive wetland plants in the Hudson River National Estuarine Research Reserve using Quickbird satellite imagery, Remote Sensing of Environment , 112 (1), 286–300 LAWRENCE, P.J., FEDDEMA, J.J., BONAN, G.B., MEEHL, G.A., O’NEILL, B.C., OLESON, K.W., LEVIS, S., LAWRENCE, D.M., LUZEK, E.K., LINDSAY, K. and THORNTON, P.E. (2012) Simulating the Biogeochemical and Biogeophysical Impacts of Transient Land Cover Change and Wood Harvest in the Community Climate System Model (CCSM4) from 1850 to 2100. Journal of Climate, 25 (9), 3071-3095 LAWTON, J.H. (1986) Biological control of bracken: plans and possibilities. From SMITH, R.T. and TAYLOR, J.A. (eds.) Bracken: Ecology, Land Use and Control Technology, Parthenon Publishing Group, Carnforth LAWTON, J. H., MACGARVIN, M. and HEADS, P.A. (1987) Effects of Altitude on the Abundance and Species Richness of Insect Herbivores on Bracken. Journal of Animal Ecology, 56 (1), 147-160 LAWTON, J. H. (1988) Biological Control of Bracken in Britain: Constraints and Opportunities. Philosophical Transactions of the Royal Society of London, 38 (1189), 335-355 LE DUC, M.G., PAKEMAN, R.J. and MARRS, R.H. (2003) Changes in the rhizome system of bracken subjected to long-term experimental treatment. Journal of Applied Ecology, 40 (3), 508-522 LE DUC, M.G., PAKEMAN, R.J. and MARRS, R.H. (2007) A restoration experiment on moorland infested by Pteridium aquilinum: Plant species responses. Agriculture, Ecosystems and Environment, 119, 53-59 LEE, H.C., COOK, J.A. and BINES, T.J. (1986) The structure of a grazed upland bracken community. From SMITH, R.T. and TAYLOR, J.A. (eds.) Bracken Fern: Environmental and Land-Use Implications, Taylor & Francis Limited, London LEHTONEN, S. (2011) Towards Resolving the Complete Fern Tree of Life. PLoS One, 6 (10), 1-6
LENOIR, J., GEGOUT, J.C., MARQUET, P.A., DE RUFFRAY, P. and BRISSE, H. (2008) A Significant Upward Shift in Plant Species Optimum Elevation During the 20th Century. Science, 320 (5884), 1768-1771
LITTLEWOOD, N.A., PAKEMAN, R.J. and WOODIN, S.J. (2006) Field Assessment of the Success of Moorland Restoration in the Rehabilitation of Whole Plant Assemblages. Applied Vegetation Science, 9 (2), 295-306 LOVELAND, T.R., SOHL, T.L., STEHMAN, S.V., GALLANT, A.L., SAYLER, K.L. and NAPTON, D.E. (2002) A strategy for estimating the rates of recent United States land-cover changes. Photogrammetric Engineering & Remote Sensing, 68 (10), 1091-1099
106
LOWDAY, J.E. (1986) A comparison of the effects of cutting with those of the herbicide asulam on the control of bracken. From SMITH, R.T. and TAYLOR, J.A. (eds.) Bracken: Ecology, land use and control technology, Parthenon Publishing Group, Carnforth MACK, R. N. (2005) Assessing biotic invasions in time and space: The second imperative. From MOONEY, H.A., MACK, R.N., MCNEELY, J., NEVILLE, L., SCHEI, P.J. and WAAGE, J. (eds.) Invasive alien species: A new synthesis. Island Press, Washington, DC. MAREN, I.E., VANDVIK, V. and EKELUND, K. (2008) Restoration of bracken-invaded Calluna Vulgaris heathlands: Effects on vegetation dynamics and non-target species. Biological Conservation, 141 (4), 1032-1042 MARRS, R.H. and HICKS, M.J. (1986) Study of Vegetation Change at Lakenheath Warren: A Re-examination of A. S. Watt’s Theories of Bracken Dynamics in Relation to Succession and Vegetation Management. Journal of Applied Ecology, 23 (3), 1029-1046 MARRS, R.H. (1993) An assessment of change in Calluna heathlands in Breckland, eastern England, between 1983 and 1991. Biological Conservation, 65 (2), 133-139 MARRS, R.H., JOHNSON, S.W. and LE DUC, M.G. (1998) Control of bracken and restoration of heathland. VIII. The regeneration of the heathland community after 18 years of continuous bracken control or 6 years of control followed by bracken recovery. Journal of Applied Ecology, 35 (6), 857-870 MARRS, R.H., LE DUC, M.G., MITCHELL, R.J., GODDARD, D., PATERSON, S. and PAKEMAN, R.J. (2000) The Ecology of Bracken: Its Role in Succession and Implications for Control. Annals of Botany, 85 (Supplement B), 3-15 MARRS, R.H. and LE DUC, M.G. (2000) Factors controlling vegetation change in long-term experiments designed to restore heathlands in Breckland, UK. Applied Vegetation Science, 3 (2), 135-146 MARRS, R.H. (2005) Putting a brake on bracken. Research Intelligence, University of Liverpool, Liverpool MARRS, R.H. and WATT, A.S. (2006) Biological Flora of the British Isles: Pteridium aquilinum (L.) Kuhn. Journal of Ecology, 94, 1272-1321 MARRS, R.H., LE DUC, M.G., SMART, S.M., KIRBY, K.J., BUNCE, R.G.H. and CORNEY, P.M. (2010) Aliens or natives: who are the ‘thugs’ in British woods? Kew Bulletin, 65 (4), 583-594 MARRS, R.H. (2013) Personal communications, 08/01/2013; 28/01/2013; 18/02/2013; 19/03/2013 MARRS, R.H. (2014) Personal communications, May-August 2014 MCALPINE, J.A.I. (2013) An assessment of the bracken (Pteridium aquilinum) problem in the UK, including GIS mapping and analysis of bracken distribution at two sites in the Peak District between 1968 and 2005. BSc dissertation, Nottingham Trent University, unpublished MCGLONE, M.S., WILMSHURST, J.M. and LEACH, H.M. (2005) An ecological and historical review of bracken (Pteridium esculentum) in New Zealand, and its cultural significance. New Zealand Journal of Ecology, 29 (2) 165-184 MCMORROW, J., LINDLEY, S., AYLEN, J., CAVAN, G., ALBERTSON, K. and BOYS, D. (2009) Moorland wildfire risk, visitors and climate change. From BONN, A., ALLOTT, T., HUBACEK, K. and STEWART, J. (eds.) Drivers of Environmental Change in Uplands. Routledge, Abingdon MCVEAN, D.N. and RATCLIFFE, D.A. (1962) Plant communities of the Scottish Highlands: A study of Scottish mountain, moorland and forest vegetation. HMSO, London MET OFFICE (2014) [online] Historic station data: Sheffield [Accessed: 08/06/2014] Available: www.metoffice.gov.uk/climate/uk/stationdata/sheffielddata.txt MILLER, D.R., MORRICE, J.G. and WHITWORTH, P.L. (1990) Bracken distribution and spread in upland Scotland: an assessment using digital mapping techniques. AIAS Occasional Publication, 40, 121-132
107
MILLIGAN, A.L., PUTWAIN, P.D., COX, E.S., GHORBANI, J., LE DUC, M.G. and MARRS, R.H. (2004) Developing an integrated land management strategy for the restoration of moorland vegetation on Molinia caerulea-dominated vegetation for conservation purposes in upland Britain. Biological Conservation, 119 (3), 371–385 MITCHELL, R.J., AULD, M.H.D., HUGHES, J.M. and MARRS, R.H. (2000) Estimates of nutrient removal during heathland restoration on successional sites in Dorset, southern England. Biological Conservation, 95 (3), 233-346 MOORLAND ASSOCIATION (2002) Northern Uplands Regeneration Project. The Moorland Association, Lancaster MOORLAND ASSOCIATION (2010) A Guide to Upland Policy Formation: Heather Moorland. The Moorland Association, Lancaster MOORS FOR THE FUTURE (2008) Moorland Restoration in the Peak District National Park. Research note No. 7, January 2008, 1-6 MONBIOT, G. (2013) [online] A Manifesto for Rewilding the World [Accessed: 16/08/2014] Available: www.monbiot.com/2013/05/27/a-manifesto-for-rewilding-the-world/ MONTENEGRO, A., EBY, M., MU, Q., MULLIGAN, M., WEAVER, A.J., WIEBE, E.C. and ZHAO, M. (2009) The net carbon drawdown of small scale afforestation from satellite observations. Global Planet Change, 69, 195–204 MORAN, R. (2004) A Natural History of Ferns. Timber Press, Portland, Oregon MOSS, C.E. (1913) Vegetation of the Peak District. Cambridge University Press, Cambridge NAGY, L., KREYLING, J., GELLESCH, E., BEIERKUHNLEIN, C. And JENTSCH, A. (2013) Recurring weather extremes alter the flowering phenology of two common temperate shrubs. International Journal of Biometeorology, 57 (4), 579-588 NASA (NATIONAL AERONAUTICS AND SPACE ADMINISTRATION) (2014) [online] Landsat Look Viewer [Accessed: 09/06/2014] Available: http://landsatlook.usgs.gov/ NATURAL ENGLAND (2008a) Bracken management: ecological, archaeological and landscape issues and priorities. Natural England Technical Information Note TIN047, Natural England, Sheffield NATURAL ENGLAND (2008b) Bracken management and Control. Natural England Technical Information Note TIN048, Natural England, Sheffield NATURAL ENGLAND (2009a) Vital Uplands: A 2060 vision for England’s upland environment. Natural England, Sheffield NATURAL ENGLAND (2009b) Farming with Nature: Agri-Environment Schemes in Action. Natural England, Sheffield NATURAL ENGLAND (2012) [online] Agri-Environment Schemes in England report [Accessed: 07/08/2014] Available: www.naturalengland.org.uk/ourwork/farming/funding/aesiereport.aspx NATURAL ENGLAND (2012b) National Character Area Profile: 51. Dark Peak. Natural England, Sheffield NATURAL ENGLAND (2014) [online] Environmentally Sensitive Areas Scheme (ESA) [Accessed: 04/06/2014] Available: www.naturalengland.gov.uk/ourwork/farming/funding/closedschemes/esa/default.aspx NDIIPP (NATIONAL DIGITAL INFORMATION INFRASTRUCTURE AND PRESERVATION PROGRAM) (2011) [online] ESRI ArcInfo Coverage - Identification and description [Accessed: 14/07/2014] Available: www.digitalpreservation.gov/formats/fdd/fdd000284.shtml NERC (NATURAL ENVIRONMENT RESEARCH COUNCIL) (2008) Countryside Survey: England Results from 2007. Centre for Ecology and Hydrology, Lancaster
108
NICHOLSON, I.A. and PATERSON, I.S. (1976) The ecological implications of bracken control to plant/animal systems. Botanical Journal of the Linnean Society, 73, 267-283 NIKLAS, K.J. (2007) Maximum plant height and the biophysical factors that limit it. Tree Physiology, 27, 433–440 NIKLAS, K.J. and HAMMOND, S.T. (2013) Biophysical effects on plant competition and coexistence. Functional Ecology, 27, 854–864 NOGUES-BRAVO, D., ARAUJO, M.B., ERREA, M.P. and MARTIN-RICA, J.P. (2007) Exposure of global mountain systems to climate warming during the 21st Century. Global Environmental Change, 17 (3-4), 420-428 NOVAK, K., (1992) Rectification of digital imagery. Photogrammetric Engineering & Remote Sensing, 58 (3), 339-344 NWCG (NATIONAL WILDFIRE COORDINATING GROUP) (2001) Fire Effects Guide PMS 481. British Columbia Ministry of Agriculture, Vancouver NYMNPA (NORTH YORK MOORS NATIONAL PARK AUTHORITY) (2013) Peatland Conservation. Item 11. NYMNPA, York OBADE, V. de P. and LAL, R. (2013) Assessing land cover and soil quality by remote sensing and geographical information systems (GIS). Catena, 104, 77-92 O’RIORDAN, T. (2000) Environmental Science for Environmental Management. Pearson, Harlow ORR, H.G., WILBY, R.L., MCKENZIE HEDGER, M. and BROWN, I. (2008) Climate change in the uplands: a UK perspective on safeguarding regulatory ecosystem services. Climate Research, 37, 77–98 PAGE, C.N. (1976) The taxonomy and phytogeography of bracken—a review. Botannical Journal of the Linnean Society, 73 (1-3), 1-34 PAGE, C.N. (1982) The history and spread of bracken in Britain. Proceedings of the Royal Society of Edinburgh, 81 (B), 3-10 PAGE, S.E. (2014) Personal communication, 14/08/2014 PAKEMAN, R.J. and MARRS, R.H. (1992) The conservation value of bracken Pteridium aquilinum (L.) Kuhn-dominated communities in the UK, and an assessment of the ecological impact of bracken expansion or its removal. Biological Conservation, 62 (2), 101-114 PAKEMAN, R.J., MARRS, R.H. and JACOB, P.J. (1994) A Model of Bracken (Pteridium aquilinum) Growth and the Effects of Control Strategies and Changing Climate. Journal of Applied Ecology, 31 (1), 145-154 PAKEMAN, R.J. and MARRS, R.H. (1996) Modelling the Effects of Climate Change on the Growth of Bracken (Pteridium aquilinum) in Britain. Journal of Applied Ecology, 33 (3), 561-575 PAKEMAN, R.J., MARRS, R.H., HOWARD, D.C., BARR, C.J. and FULLER, R.M. (1996) The bracken problem in Great Britain: its present extent and future changes. Applied Geography, 16 (1), 65-86 PAKEMAN, R.J., LE DUC, M.G. and MARRS, R.H. (1997) Moorland vegetation succession after the control with asulam. Agriculture, Ecosystems and Environment, 62 (1), 41-52 PAKEMAN, R.J., THWAITES, R.H., LE DUC, M.G. and MARRS, R.H. (2002) The effects of cutting and herbicide treatment on Pteridium aquilinum encroachment. Applied Vegetation Science, 5, 203-212 PAKEMAN, R.J., HULME, P.D., TORVELL, L. and FISHER, J.M. (2003) Rehabilitation of degraded dry heather [Calluna vulgaris (L.) Hull] moorland by controlled sheep grazing. Biological Conservation, 114, 389–400
109
PAKEMAN, R.J., LE DUC, M.G. and MARRS, R.H. (2007) Controlling bracken encroachment and the long- term success of bracken control. From: HAMMOND, M. (ed.) Moorland Research Review 2000-2005. NYMNPA, York PAKEMAN, R.J., LE DUC, M.G., MARRS, R.H., CONDLIFFE, I., ENRIGHT, D., FROMENT, M., SMALLSHIRE, D. and LACEY, P. (2008) [online] Bracken Management and Control: Natural England Technical Information Note TIN048. [Accessed: 04/06/2014] Available: publications.naturalengland.org.uk/file/97003 PAKEMAN, R.J. (2012) [online] Bracken and the Asulam ban [Accessed: 05/06/2014] Available: http://www.knowledgescotland.org/briefings.php?id=275 PALMER, S., WEARING, C., JOHNSON, K., HOLDEN, J. and BROWN, L. (2013) Impact of managed moorland burning on DOC concentrations in soil solutions and stream waters. EGU General Assembly 2013, 7-12 April, in Vienna, Austria PANDE, A., WILLIAMS, C.L., LANT, C.L. and GIBSON, D.J. (2007) Using map algebra to determine the mesoscale distribution of invasive plants: the case of Celastrus orbiculatus in Southern Illinois, USA. Biological Invasions, 9, 419-431 PARKS, J.C. and WERTH, C.R. (1993) A Study of Spatial Features of Clones in a Population of Bracken Fern, Pteridium aquilinum (Dennstaedtiaceae). American Journal of Botany, 80 (5), 537-544 PARMESAN, C., BURROWS, M.T., DUARTE, C.M., POLOCZANSKA, E.S., RICHARDSON, A.J., SCHOEMAN, D.S. AND SINGER, M.C. (2013) Beyond climate change attribution in conservation and ecological research. Ecology Letters, 16 (s1), 58-71 PATERSON, S., PAKEMAN, R.J. and MARRS, R.H. (1997) Evaluation of a bracken (Pteridium aquilinum (L.) Kuhn) growth model in predicting the effects of control strategies across a range of climatic zones in Great Britain. Annals of Applied Biology, 130 (2), 305–318 PDNPA (PEAK DISTRICT NATIONAL PARK AUTHORITY) (2001) Heather Moorland Action Plan, from: The Biodiversity Action Plan, PDNPA, Bakewell PDNPA (PEAK DISTRICT NATIONAL PARK AUTHORITY) (2004) [online] Climate Available: http://resources.peakdistrict.gov.uk/pubs/sopr/update/climate.pdf [Accessed: 07/08/2014] PDNPA (PEAK DISTRICT NATIONAL PARK AUTHORITY) (2008) Peak District Landscape Character Assessment. PDNPA, Bakewell PDNPA (PEAK DISTRICT NATIONAL PARK AUTHORITY) (2009) Peak District Landscape Character Assessment: 3: Dark Peak. PDNPA, Bakewell PDNPA (PEAK DISTRICT NATIONAL PARK AUTHORITY) (2011) Adapting to Climate Change in the Peak District National Park. PDNPA, Bakewell PDNPA (PEAK DISTRICT NATIONAL PARK AUTHORITY) (2012) A Summary of the Peak District National Park Management Plan 2012-2017. PDNPA, Bakewell PDNPA (PEAK DISTRICT NATIONAL PARK AUTHORITY) (2014) [online] Upland Oakwoods [Accessed: 02/07/2014] Available: www.peakdistrict.gov.uk/looking-after/biodiversity/peak-district-biodiversity/peak-district-habitats/upland-oakwoods PEARMAN, D.A. (2004) Invading Aliens - on Invading Natives? Botanical Society of Britain and Ireland News, 96, 41-42 PIENKOWSKI, M.W., WATKINSON, A.R., KERBY, G., MARRS, R.H., JOHNSON, S.W. and LE DUC, M.G. (1998) Control of bracken and restoration of heathland. VI. The response of bracken fronds to 18 years of continued bracken control or 6 years of control followed by recovery. Journal of Applied Ecology, 35 (4), 479-490 POEL, L.W. (1961) Soil aeration as a limiting factor in the growth of Pteridium aquilinum (L.) Kuhn. Journal of Ecology, 49, 107-111
110
PONTIUS, R.G. Jr., THONTTEH, O. and CHEN, H. (2008) Components of information for multiple resolution comparison between maps that share a real variable. Environmental and Ecological Statistics, PONTIUS, R.G. Jr. and LIPPITT, C.D. (2006) Can error explain map differences over time? Cartography and Geographic Information Science, 33 (2), 159-171 POTTER, D.M. and BAIRD, M.S. (2000) Carcinogenic effects of ptaquiloside in bracken fern and related compounds. British Journal of Cancer, 83(7), 914–920 PRYER, K.M., SCHUETTPELZ, E., WOLF, P.G., SCHNEIDER, H., SMITH, A.R. and CRANFILL, R. (2004) Phylogeny and evolution of ferns (Monilophytes) with a focus on the early Leptosporangiate divergences. American Journal of Botany, 91 (10), 1582–1598 PULLIN, A.S. and KNIGHT, T.M. (2009) Doing more harm than good – Building an evidence base for conservation and environmental management. Biological Conservation. 142 (5), 931-934 PULLIN, A.S., SUTHERLAND, W., GARDNER, T., KAPOS, V. and FA, J.E. (2013) Conservation priorities: identifying need, taking action and evaluating success. From MACDONALD, D.W. and WILLS, K.J. (eds.) Key Topics in Conservation Biology 2. John Wiley & Sons, Oxford RAMCHUNDER, S.J., BROWN, L.E. and HOLDEN, J. (2009) Environmental effects of drainage, drain-blocking and prescribed vegetation burning in UK upland peatlands. Progress in Physical Geography, 33 (1), 49-79 RAMWELL, C. T., VAN BEINUM, W., ROWBOTHAN, A., PARRY, H., PARSONS, S.A., LUO, W. and EVANS, G (2010) Ptaquiloside and other bracken toxins: a preliminary risk assessment. Final Report, The Food and Environmental Research Agency, Sand Hutton RASMUSSEN, L.H., HANSEN, H.C.B. and LAUREN, D. (2005) Sorption, degradation and mobility of ptaquiloside, a carcinogenic Bracken (Pteridium sp.) constituent, in the soil environment. Chemosphere, 58 (6), 823–835 RATCLIFFE, D.A. (1977) Uplands and birds - an outline. Bird Study, 24 (3), 140-58 RATCLIFFE, D.A. and THOMPSON, D.B.A. (1988) The British uplands: their ecological character and international significance. From: USHER, M.B. and THOMPSON, D.B.A. (eds.) Ecological change in the uplands. Blackwell Scientific Publications, Edinburgh REED, M.S, ARBLASTER, K., BULLOCK, C., BURTON, R.J.F., DAVIES, A.L., HOLDEN, J., HUBACEK, K., MAY, R., MITCHLEY, J., MORRIS, J., NAINGGOLAN, D., POTTER, C., QUINN, C.H., SWALES, V. and THORP, S. (2009) Using scenarios to explore UK upland futures. Futures, 41 (9), 619-630 REED, M. S., HUBACEK, K., BONN, A., BURT, T.P., HOLDEN, J., STRINGER, L.C., BEHARRY-BORG, N., BUCKMASTER, S., CHAPMAN, D., CHAPMAN, P.J., CLAY, G.D., CORNELL, S.J., DOUGILL, A.J., EVELY, A.C., FRASER, E.D.G., JIN, N., IRVINE, B.J., KIRKBY, M.J., KUNIN, W.E., PRELL, C., QUINN, C.H., SLEE, B., STAGL, S., TERMANSEN, M., THORP, S. AND WORRALL, F. (2013) Anticipating and managing future trade-offs and complementarities between ecosystem services. Ecology and Society, 18 (1), 1-20 REICH, P.B., HUNGATE, B.A. and LUO, Y. (2006) Carbon-Nitrogen Interactions in Terrestrial Ecosystems in Response to Rising Atmospheric Carbon Dioxide. The Annual Review of Ecology, Evolution, and Systematics, 37, 611-636 RENNER, S.S. (2005) Relaxed molecular clocks for dating historical plant dispersal events. Trends in Plant Science, 10 (11), 550-558 REYER, C., GUERICKE, M. and IBISCH, P.L. (2009) Climate change mitigation via afforestation, reforestation and deforestation avoidance: and what about adaptation to environmental change? New Forests, 38, 15–34 ROBERTSON, P.A., PARK, K.J. and BARTON, A.F. (2001) Loss of heather Calluna vulgaris moorland in the Scottish uplands: the role of red grouse Lagopus lagopus scoticus management. Wildlife Biology, 7, 11-16 ROBINSON, R.C. (2001) Improved bracken management on heather moorland in the North York Moors National Park. From: CHARLES, R., WIGHTMAN, S. and HAMMOND, M. (eds.) Moorland Research Review 1995–2000. North York Moors National Park Authority, York
111
ROBINSON, R.C. (2007) The NYM Bracken Clearance Proving Trial: a progress report. Bracken clearance as a land management strategy. From: HAMMOND, M. (ed.) Moorland Research Review 2000-2005. North York Moors National Park Authority, York ROCCHINI, D. (2004) Misleading information from direct interpretation of Geometrically Incorrect aerial photographs. The Photogrammetric Record, 19 (106), 138–148 ROCCHINI, D. and DI RITA, A. (2005) Relief effects on aerial photos geometric correction. Applied Geography, 25 (2), 159-168 ROCKSTROM, J., STEFFEN, W., NOONE, K., PERSSON, A., CHAPIN III, F.S., LAMBIN, E.F., LENTON, T.M., SCHEFFER, M., FOLKE, C., SCHELLNHUBER, H.J., NYKVIST, B., DE WIT, C.A., HUGHES, T., VAN DER LEEUW, S., RODHE, H., SORLIN, S., SNYDER, P.K., COSTANZA, R., SVEDIN, U., FALKENMARK, M., KARLBERG, L., CORELL, R.W., FABRY, V.J., HANSEN, J., WALKER, B., LIVERMAN, D., RICHARDSON, K., CRUTZEN, P. and FOLEY, J.A. (2009) A safe operating space for humanity. Nature, 461(24), 472–475 RODWELL, J.S. (1998) British Plant Communities Vol. 1: Woodlands and Scrub. Cambridge University Press, Cambridge ROGERS, G.M. (1996) Control, demography, and post-control response of heather in the central North Island: Part 2. Science for Conservation, 29, 1-35 ROOS, K., ROLLENBECK, R., PETERS, T., BENDIX, J. and BECK, E. (2010) Growth of Tropical Bracken (Pteridium arachnoideum): Response to Weather Variations and Burning. Invasive Plant Science and Management, 3, 402–411 ROOS, K., RODEL, H.G. and BECK, E. (2011) Short- and long-term effects of weed control on pastures infested with Pteridium arachnoideum and an attempt to regenerate abandoned pastures in South Ecuador. Weed Research, 51 (2), 165–176 ROSS, L.C, WOODIN, S.J., HESTER, A.J., THOMPSON D.B.A. and BIRKS, H.J.B. (2012) Biotic homogenization of upland vegetation: patterns and drivers at multiple spatial scales over five decades. Journal of Vegetation Science, 23 (4), 755-770 RSPB (ROYAL SOCIETY FOR THE PROTECTION OF BIRDS) (2010) Wild Birds and the Law: England and Wales. RSPB, Sandy RYMER, L. (1976) The history and ethnobotany of bracken. Botanical Journal of the Linnean Society, 73, 151-17 SCHNEIDER, L.C. (2004) Bracken Fern Invasion in Southern Yucatán: A Case for Land-Change Science. The Geographical Review, 94 (2), 229-241 SCHNEIDER, L.C. and FERNANDO, D.N. (2010) An Untidy Cover: Invasion of Bracken Fern in the Shifting Cultivation Systems of Southern Yucatan, Mexico. Biotropica, 42(1), 41–48 SCHNELLER, J. and LIEBST, B. (2007) Patterns of variation of a common fern (Athyrium filix-femina; Woodsiaceae): population structure along and between altitudinal gradients. American Journal of Botany, 94 (6), 965-971 SCHUETTPELZ, E. and PRYER, K.M. (2007) Fern phylogeny inferred from 400 leptosporangiate species and three plastid genes. Taxon, 56 (4), 1037–1050 SCHWAIGER, H.P. and BIRD, D.N. (2010) Integration of albedo effects caused by land use change into the climate balance: Should we still account in greenhouse gas units? Forest Ecology and Management, 260 (3), 278-286 SHARPE, J.M., MEHLTRETER, K. and WALKER, L.R. (2010) Ecological Importance of Ferns. From: MEHLTRETER, K., WALKER, L.R. and SHARPE, J.M. Fern Ecology. Cambridge University Press, Cambridge SMITH, A.R., PRYER, K.M., SCHUETTPELZ, E., KORALL, P., SCHNEIDER, H. and WOLF, P. (2006) A classification for extant ferns. Taxon, 55 (3), 705-731
112
SMITH, R.T. (1977) Bracken in Britain: I background to the problem of bracken infestation. School of Geography, University of Leeds, Leeds SOUTH, D.B., LEE, X. and MESSINA, M.G. (2011) Will afforestation in temperate zones warm the Earth? Journal of Horticulture and Forestry, 3 (7), 195-199 SOTHERTON, N., MAY, R., EWALD, J., FLETCHER, K. and NEWBORN, D. (2009) Managing uplands for game and sporting interests: An industry perspective. From BONN, A., ALLOTT, T., HUBACEK, K. and STEWART, J. (eds.) (2009) Drivers of Environmental Change in Uplands. Routledge, Abingdon STEVENSON, A.C. and THOMPSON, D.B.A. (1993) Long-term changes in the extent of heather moorland in upland Britain and Ireland: palaeoecological evidence for the importance of grazing. The Holocene, 3 (1), 70-76 STEWART, G., COX, E.S., LE DUC, M.G., PAKEMAN, R.J., PULLIN, A. and MARRS, R.H. (2008) Control of Pteridium aquilinum: Meta-analysis of a Multi-site Study in the UK. Annals of Botany, 101 (7), 957–970 SUMMERHAYES, V.S., COLE, L.W., WILLIAMS, P.H. and RICHARDS, O.W. (1924) Studies on the ecology of English Heaths I. The vegetation of unfelled portions of Oxshott Heath and Esher Common, Surrey. Journal of Ecology, 12, 287-306 TAYLOR, J.A. (1985) Bracken encroachment rates in Britain. Soil Use and Management, 1 (2), 53–56 TAYLOR, J.A. (1986) The Bracken Problem: a local hazard and global issue. From SMITH, R.T. and TAYLOR, J.A. (eds.) Bracken Fern: Environmental and Land-Use Implications, Taylor & Francis Limited, London TAYLOR, J.A. (1990) The bracken problem: a global perspective. From THOMSON, J.A. and SMITH, R.T. (eds.) Bracken Biology and Control, Australian Institute of Agricultural Science Occasional Publication No. 40, Sydney THOMAS, R. (2012) Personal communication, 26/11/2012 THOMAS, R. (2014) Personal communication, 10/07/2014 THOMPSON, D.B.A., MACDONALD, A.J., MARSDEN, J.H. and GALBRAITH, C.A. (1995) Upland heather moorland in Great Britain: a review of international importance, vegetation change and some objectives for nature conservation. Biological Conservation, 71, 163–178 THOMSON, J.A., WILLOUGHBY, C. and SHEARER, C.M. (1986) Factors affecting the distribution, abundance and economic status of bracken (Pteridium esculentum) in New South Wales. From SMITH, R.T. and TAYLOR, J.A. (eds.) Bracken: Ecology, land use and control technology, Parthenon Publishing Group, Carnfort THOMSON, J.A. (2004) Towards a taxonomic revision of Pteridium (Dennstaedtiaceae). Telopea, 10, 793-803 THORP, S. (nd) Bracken control: with or without asulam. The Heather Trust, Dumfries TOKARNIA, C.H., DOBEREINER, J. And PEIXOTO, P.V. (2002) Poisonous plants affecting livestock in Brazil. Toxicon, 40 (12), 1635-1660 TOLT, G., SHIMONI, M. and AHLBERG, J. (2011) A shadow detection method for remote sensing images using VHR hyperspectral and LIDAR data. Geoscience and Remote Sensing Symposium (IGARSS), 2011 IEEE (Institute of Electrical and Electronics Engineers) International. IEEE, New York TONG, C., LE DUC, M.G., GHORBANI, J. and MARRS, R.H. (2006) Linking restoration to a wider landscape: A study of a bracken control experiment within an upland moorland landscape mosaic in the Peak District, UK. Landscape and Urban Planning, 78, 115-134 TRINDER, C.J., BROOKER, R.W. and ROBINSON, D. (2013) Plant ecology’s guilty little secret: understanding the dynamics of plant competition. Functional Ecology, 27, 918-929
113
TRIVEDI, M.R., MORECROFT, M.D., BERRY, P.M. and DAWSON, T.P. (2008) Potential effects of climate change on plant communities in three montane nature reserves in Scotland, UK. Biological Conservation, 141 (6), 1665-1675 TUCKER, D. (2003) Review of the impacts of heather and grassland burning in the uplands on soils. English Nature Research Report 550, English Nature, Peterborough TZOTSOS, A., KARANTZALOS, K. and ARGIALAS, D. (2011) Object-based image analysis through nonlinear scale-space filtering. ISPRS Journal of Photogrammetry and Remote Sensing, 66 (1), 2-16 UNFCCC (UNITED NATIONS FRAMEWORK CONVENTION ON CLIMATE CHANGE) (2013) [online] Article 2: Objective [Accessed: 04/06/2014] Available: http://unfccc.int/essential_background/convention/background/items/1353.php UNFF (UNITED NATIONS FORUM ON FORESTS) (2011) [online] Global Objectives [Accessed: 29/08/2014] Available: http://www.un.org/en/events/iyof2011/forests-for-people/global-objectives/ USTIN, S.L. and GAMON, J.A. (2010) Remote sensing of plant functional types. New Phytologist, 186 (4), 795-816 VARVARIGOS, P. and LAWTON, J. H. (1991) Farmers' Perceptions of the Scale of the Bracken Problem on Farms in Less Favoured Areas in England and Wales. Journal of Applied Ecology, 28 (3), 988-1003 VERBESSELT, J., HYNDMAN, R., NEWNHAM, G. and CULVENOR, D. (2010) Detecting trend and seasonal changes in satellite image time series. Remote Sensing of Environment, 114 (1), 106-115 WANG, Y., YAN, X. and WANG, Z. (2014) The biogeophysical effects of extreme afforestation in modeling future climate. Theoretical and Applied Climatology, 1-11 WANGFEI, Z., JIANGUO, G., TIANSHU, X. and YANRU, H. (2009) The Selection of Ground Control Points in a Remote Sensing Image Correction Based on Weighted Voronoi Diagram. Proceedings of the 2009 International Conference on Information Technology and Computer Science, 2, 326-329 WARREN, M.S. and OATES, M.R. (1995) The importance of bracken habitats to fritillary butterflies and their management for conservation. From SMITH, R.T. and TAYLOR, J.A. (eds.) Bracken: An Environmental Issue, IBG, Aberystwyth WATT, A.S. (1940) Contributions to the ecology of bracken (Pteridium aquilinum) I. The rhizome. New Phytologist, 39 (4), 401-422 WATT, A.S. (1947) Pattern and Process in the Plant Community. Journal of Ecology, 35 (1/2), 1-22 WATT, A.S. (1950) Contributions to the Ecology of Bracken (Pteridium aquilinum). V. Bracken and Frost. New Phytologist, 49 (3), 308-327 WATT, A.S. (1954) Contributions to the Ecology of Bracken (Pteridium aquilinum). VI. Frost and the Advance and Retreat of Bracken. New Phytologist, 53 (1), 117-130 WATT, A. S. (1955) Bracken versus Heather, A Study in Plant Sociology. Journal of Ecology, 43 (2), 490-506 WATT, A.S. (1976) The ecological status of bracken. Botanical Journal of the Linnean Society, 73 (1-3), 217-239 WERKMAN, B.R. and CALLAGHAN, T.V. (1999) Effects of increased temperature and nitrogen availability on the displacement of Calluna vulgaris by Pteridium aquilinum. Applied Vegetation Science, 2 (2), 201-208 WHITEHEAD, S.J. (1993) The morphology and physiology of moorland bracken (Pteridium aquilinum (L.) Kuhn) and their implications for its control. DPhil Thesis, University of York, York WILES, L.J. (2004) Economics of weed management: principles and practices. Weed Technology, 18, 1403-1407
114
WILLIAMS, G.H. and FOLEY, A. (1975) Effect of herbicides on bracken rhizome survival. Annals of Applied Biology, 79 (1), 109-111 WILSON, E.O. (2002) The Future of Life. Abacus, London WOODHEAD, F.L.S. (1906) Ecology of Woodland Plants in the Neighbourhood of Huddersfield. Botanical Journal of the Linnean Society of London, 37 (261), 333–406 WORRALL, F. and EVANS, M.G. (2009) The carbon budget of upland peat soils. From: BONN, A., ALLOTT, T., HUBACEK, K. and STEWART, J. (eds.) Drivers of Environmental Change in Uplands. Routledge, Abingdon YALLOP, A.R. and CLUTTERBUCK, B. (2009) Land management as a factor for controlling dissolved carbon release from upland peat soils 1: Spatial variation in DOC productivity. Science of the Total Environment, 407, 3803-3813 YALLOP, A.R., CLUTTERBUCK, B. and THACKER, J.I. (2009) Burning Issues: The history and ecology of managed fires in the uplands. From: BONN, A., ALLOTT, T., HUBACEK, K. and STEWART, J. (eds.) Drivers of Environmental Change in Uplands. Routledge, Abingdon YALLOP, A.R., CLUTTERBUCK, B. and THACKER, J.I. (2012) Changes in water colour between 1986 and 2006 in the headwaters of the River Nidd, Yorkshire, UK: a critique of methodological approaches and measurement of burning management. Biogeochemistry, 111 (1-3), 97-103 YERKES, R.W., KHALAILY, H. and BARKAI, R. (2012) Form and Function of Early Neolithic Bifacial Stone Tools Reflects Changes in Land Use Practices during the Neolithization Process in the Levant. PLoS ONE, 7 (8), 1-11 YU, Q., GONG, P., CLINTON, N., BIGING, G., KELLY, M. and SCHIROKAUER, D. (2006) Object-based Detailed Vegetation Classification with Airborne High Spatial Resolution Remote Sensing Imagery. Photogrammetric Engineering and Remote Sensing, 72 (7), 799–811 ZHU, Q., JIANG, H., PENG, C., LIU, J., FANG, X., WEI, X., LIU, S. and ZHOU, G. (2012) Effects of future climate change, CO2 enrichment, and vegetation structure variation on hydrological processes in China. Global and Planetary Change, 80–81, 123–135
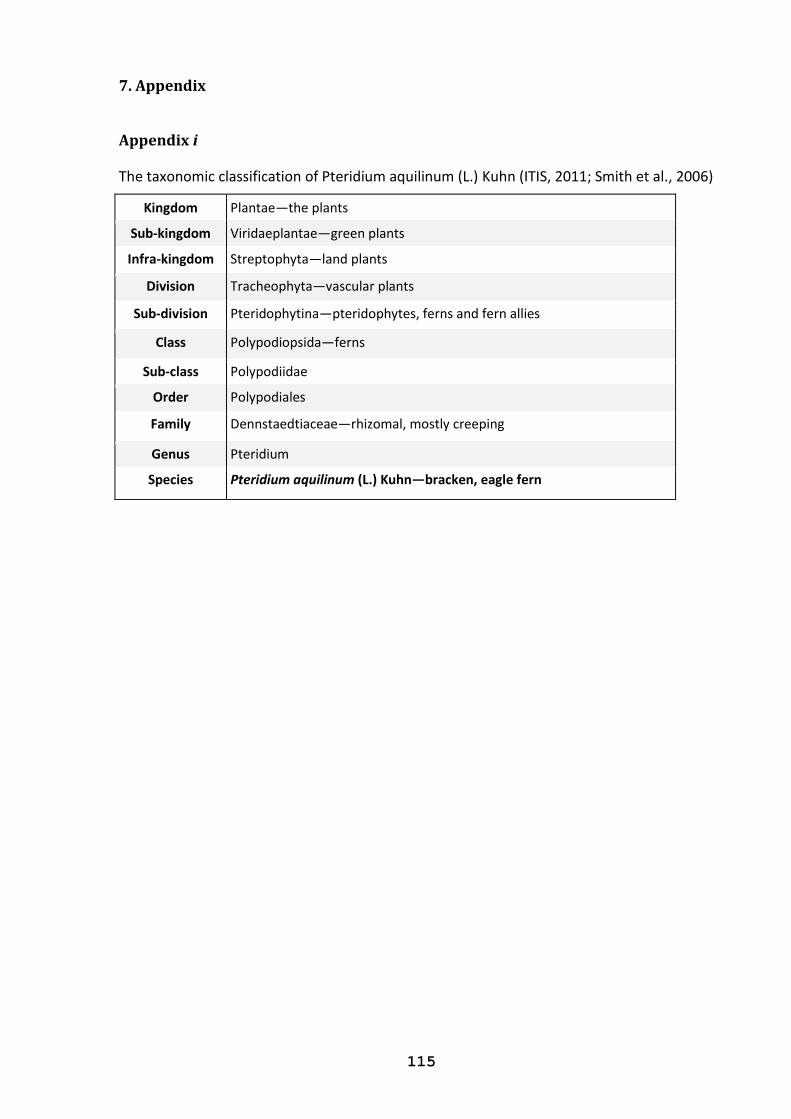
115
7. Appendix Appendix i The taxonomic classification of Pteridium aquilinum (L.) Kuhn (ITIS, 2011; Smith et al., 2006)
Kingdom Plantae—the plants
Sub-kingdom Viridaeplantae—green plants
Infra-kingdom Streptophyta—land plants
Division Tracheophyta—vascular plants
Sub-division Pteridophytina—pteridophytes, ferns and fern allies
Class Polypodiopsida—ferns
Sub-class Polypodiidae
Order Polypodiales
Family Dennstaedtiaceae—rhizomal, mostly creeping
Genus Pteridium
Species Pteridium aquilinum (L.) Kuhn—bracken, eagle fern
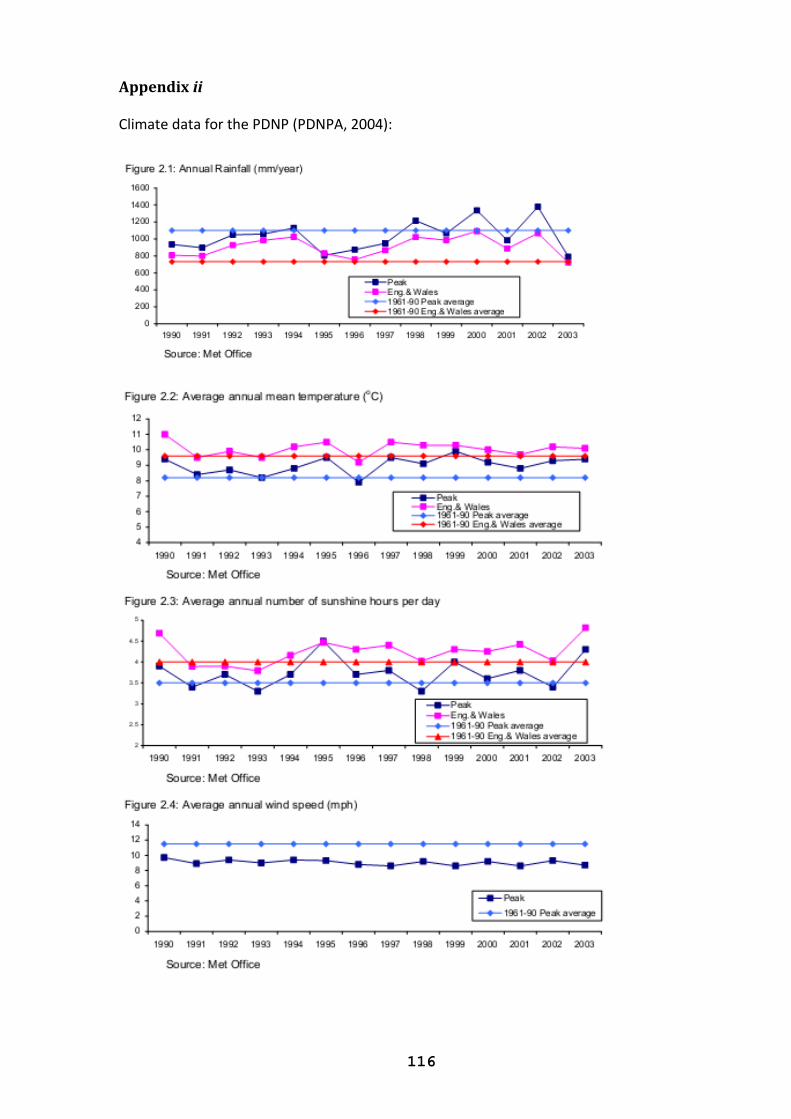
116
Appendix ii
Climate data for the PDNP (PDNPA, 2004):
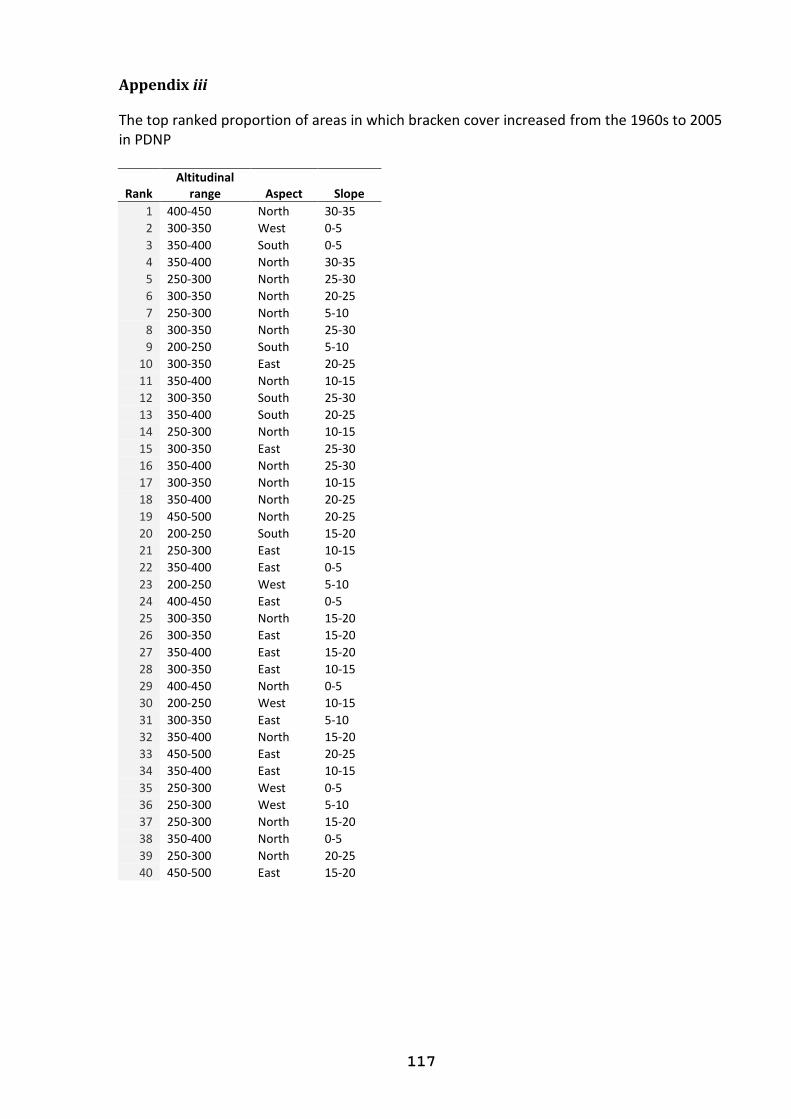
117
Appendix iii
The top ranked proportion of areas in which bracken cover increased from the 1960s to 2005 in PDNP
Rank Altitudinal
range Aspect Slope
1 400-450 North 30-35
2 300-350 West 0-5
3 350-400 South 0-5
4 350-400 North 30-35
5 250-300 North 25-30
6 300-350 North 20-25
7 250-300 North 5-10
8 300-350 North 25-30
9 200-250 South 5-10
10 300-350 East 20-25
11 350-400 North 10-15
12 300-350 South 25-30
13 350-400 South 20-25
14 250-300 North 10-15
15 300-350 East 25-30
16 350-400 North 25-30
17 300-350 North 10-15
18 350-400 North 20-25
19 450-500 North 20-25
20 200-250 South 15-20
21 250-300 East 10-15
22 350-400 East 0-5
23 200-250 West 5-10
24 400-450 East 0-5
25 300-350 North 15-20
26 300-350 East 15-20
27 350-400 East 15-20
28 300-350 East 10-15
29 400-450 North 0-5
30 200-250 West 10-15
31 300-350 East 5-10
32 350-400 North 15-20
33 450-500 East 20-25
34 350-400 East 10-15
35 250-300 West 0-5
36 250-300 West 5-10
37 250-300 North 15-20
38 350-400 North 0-5
39 250-300 North 20-25
40 450-500 East 15-20
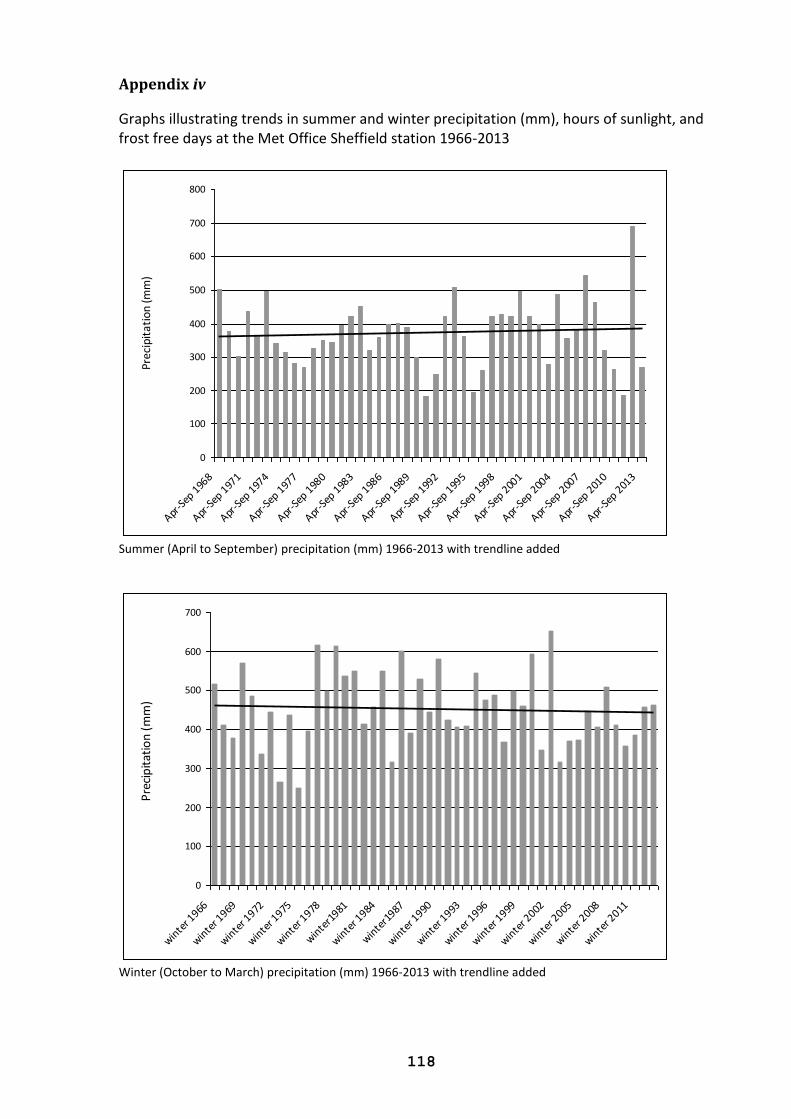
118
Appendix iv
Graphs illustrating trends in summer and winter precipitation (mm), hours of sunlight, and frost free days at the Met Office Sheffield station 1966-2013
0
100
200
300
400
500
600
700
800
Apr-S
ep 1
968
Apr-S
ep 1
971
Apr-S
ep 1
974
Apr-S
ep 1
977
Apr-S
ep 1
980
Apr-S
ep 1
983
Apr-S
ep 1
986
Apr-S
ep 1
989
Apr-S
ep 1
992
Apr-S
ep 1
995
Apr-S
ep 1
998
Apr-S
ep 2
001
Apr-S
ep 2
004
Apr-S
ep 2
007
Apr-S
ep 2
010
Apr-S
ep 2
013
Prec
ipit
atio
n (m
m)
Summer (April to September) precipitation (mm) 1966-2013 with trendline added
0
100
200
300
400
500
600
700
winte
r 1966
winte
r 1969
winte
r 1972
winte
r 1975
winte
r 1978
winte
r1981
winte
r 1984
winte
r1987
winte
r 1990
winte
r 1993
winte
r 1996
winte
r 1999
winte
r 2002
winte
r 2005
winte
r 2008
winte
r 2011
Pre
cip
itat
ion
(m
m)
Winter (October to March) precipitation (mm) 1966-2013 with trendline added
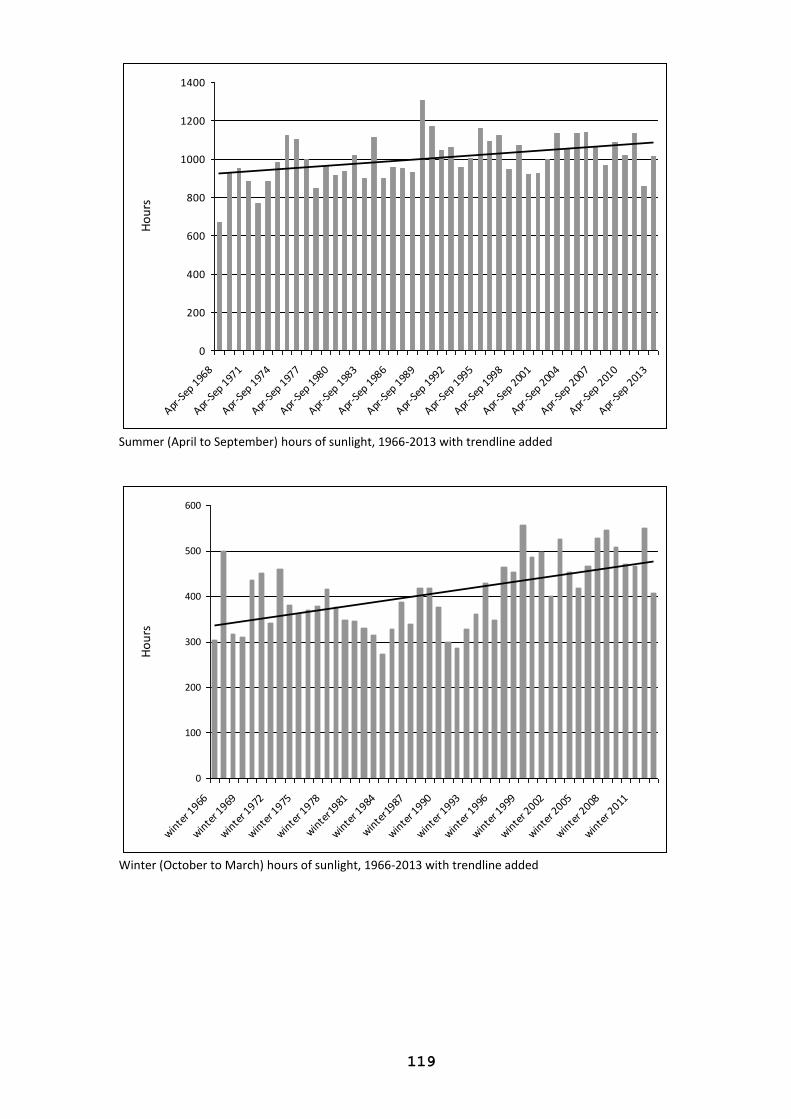
119
0
200
400
600
800
1000
1200
1400
Apr-S
ep 1
968
Apr-S
ep 1
971
Apr-S
ep 1
974
Apr-S
ep 1
977
Apr-S
ep 1
980
Apr-S
ep 1
983
Apr-S
ep 1
986
Apr-S
ep 1
989
Apr-S
ep 1
992
Apr-S
ep 1
995
Apr-S
ep 1
998
Apr-S
ep 2
001
Apr-S
ep 2
004
Apr-S
ep 2
007
Apr-S
ep 2
010
Apr-S
ep 2
013
Ho
urs
Summer (April to September) hours of sunlight, 1966-2013 with trendline added
0
100
200
300
400
500
600
winte
r 1966
winte
r 1969
winte
r 1972
winte
r 1975
winte
r 1978
winte
r1981
winte
r 1984
winte
r1987
winte
r 1990
winte
r 1993
winte
r 1996
winte
r 1999
winte
r 2002
winte
r 2005
winte
r 2008
winte
r 2011
Ho
urs
Winter (October to March) hours of sunlight, 1966-2013 with trendline added
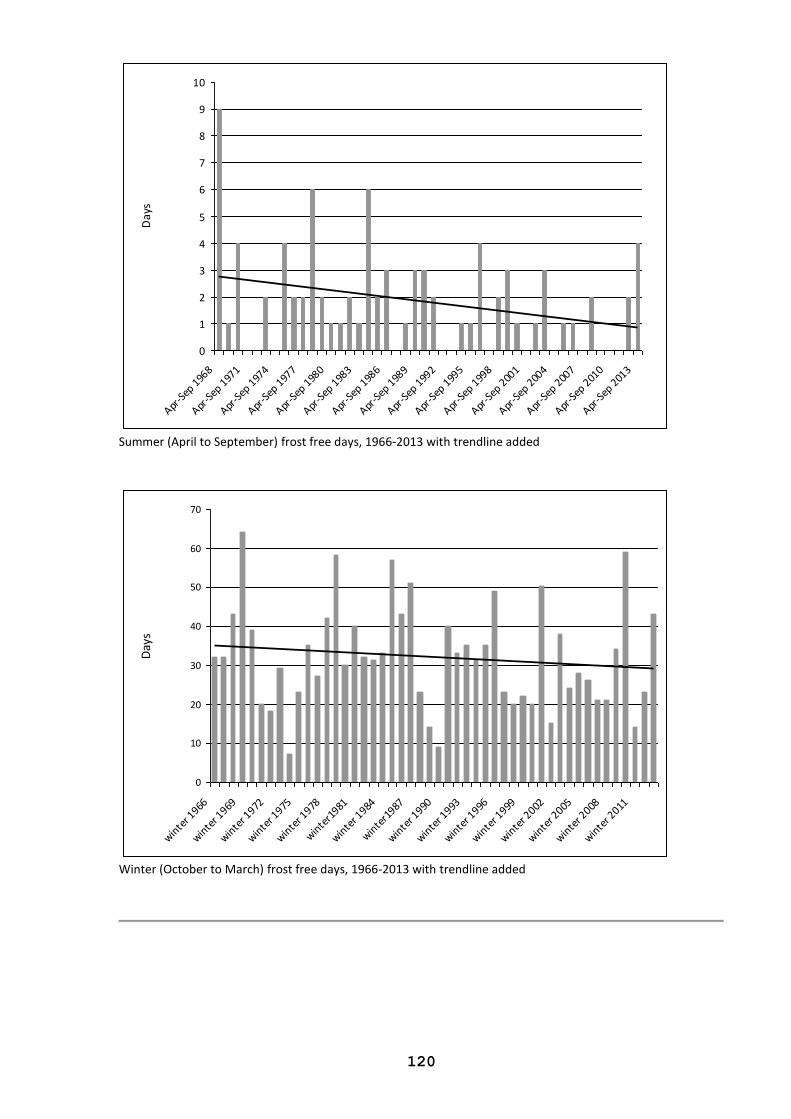
120
0
1
2
3
4
5
6
7
8
9
10
Apr-S
ep 1
968
Apr-S
ep 1
971
Apr-S
ep 1
974
Apr-S
ep 1
977
Apr-S
ep 1
980
Apr-S
ep 1
983
Apr-S
ep 1
986
Apr-S
ep 1
989
Apr-S
ep 1
992
Apr-S
ep 1
995
Apr-S
ep 1
998
Apr-S
ep 2
001
Apr-S
ep 2
004
Apr-S
ep 2
007
Apr-S
ep 2
010
Apr-S
ep 2
013
Day
s
Summer (April to September) frost free days, 1966-2013 with trendline added
0
10
20
30
40
50
60
70
winte
r 1966
winte
r 1969
winte
r 1972
winte
r 1975
winte
r 1978
winte
r1981
winte
r 1984
winte
r1987
winte
r 1990
winte
r 1993
winte
r 1996
winte
r 1999
winte
r 2002
winte
r 2005
winte
r 2008
winte
r 2011
Day
s
Winter (October to March) frost free days, 1966-2013 with trendline added