An Assessment of Integrated Climate Change Impacts on the Agricultural Economy of Egypt
27
AN ASSESSMENT OF INTEGRATED CLIMATE CHANGE IMPACTS ON THE AGRICULTURAL ECONOMY OF EGYPT DAVID N. YATES National Center for Atmospheric Research, Boulder, CO, U.S.A. KENNETH M. STRZEPEK Civil, Environmental, and Architectural Engineering, University of Colorado, Boulder, CO, U.S.A. Abstract. This study used a quadratic programming sector model to assess the integrated impacts of climate change on the agricultural economy of Egypt. Results from a dynamic global food trade model were used to update the Egyptian sector model and included socio-economic trends and world market prices of agricultural goods. In addition, the impacts of climate change from three bio-physical sectors – water resources, crop yields, and land resources – were used as inputs to the economic model. The climate change scenarios generally had minor impacts on aggregated economic welfare (sum of Consumer and Producer Surplus or CPS), with the largest reduction of approximately 6 percent. In some climate change scenarios, CPS slightly improved or remained unchanged. These scenarios generally benefited consumers more than producers, as world market conditions reduced the revenue generating capacity of Egyptian agricultural exporters but decreased the costs of imports. Despite increased water availability and only moderate yield declines, several climate change scenarios showed producers being negatively affected by climate change. The analysis supported the hypothesis that smaller food importing countries are at a greater risk to climate change, and impacts could have as much to do with changes in world markets as with changes in local and regional biophysical systems and shifts in the national agricultural economy. God has shown Pharaoh what he is about to do. Seven years of great abundance are coming throughout the land of Egypt, but seven years of famine will follow. The seven years of abundance in Egypt came to an end and the seven years of famine began, just as Joseph had said. (Genesis 41: 29–30; 53–54) (Holy Bible, New International Version, 1984) 1. Introduction Egypt has been facing climate variability and its influence on agricultural produc- tion for at least four thousand years, since Joseph averted a disaster through a series of resource management decisions. Joseph was able to develop an optimal agricul- tural management plan because he had a ‘perfect’ hydroclimatic forecast. Today, however, Egyptian planners do not have the luxury of perfect forecasts and must rely on the scientific understanding and analysis of physical and socio-economic systems. The understanding of these complex systems allows for improved plan- ning in light of local and regional climatic variability, untimely and/or limited Climatic Change 38: 261–287, 1998. c 1998 Kluwer Academic Publishers. Printed in the Netherlands.
-
Upload
independent -
Category
Documents
-
view
0 -
download
0
Transcript of An Assessment of Integrated Climate Change Impacts on the Agricultural Economy of Egypt

AN ASSESSMENT OF INTEGRATED CLIMATE CHANGE IMPACTSON THE AGRICULTURAL ECONOMY OF EGYPT
DAVID N. YATESNational Center for Atmospheric Research, Boulder, CO, U.S.A.
KENNETH M. STRZEPEKCivil, Environmental, and Architectural Engineering, University of Colorado, Boulder, CO, U.S.A.
Abstract. This study used a quadratic programming sector model to assess the integrated impactsof climate change on the agricultural economy of Egypt. Results from a dynamic global food trademodel were used to update the Egyptian sector model and included socio-economic trends andworld market prices of agricultural goods. In addition, the impacts of climate change from threebio-physical sectors – water resources, crop yields, and land resources – were used as inputs tothe economic model. The climate change scenarios generally had minor impacts on aggregatedeconomic welfare (sum of Consumer and Producer Surplus or CPS), with the largest reduction ofapproximately 6 percent. In some climate change scenarios, CPS slightly improved or remainedunchanged. These scenarios generally benefited consumers more than producers, as world marketconditions reduced the revenue generating capacity of Egyptian agricultural exporters but decreasedthe costs of imports. Despite increased water availability and only moderate yield declines, severalclimate change scenarios showed producers being negatively affected by climate change. The analysissupported the hypothesis that smaller food importing countries are at a greater risk to climate change,and impacts could have as much to do with changes in world markets as with changes in local andregional biophysical systems and shifts in the national agricultural economy.
: : :God has shown Pharaoh what he is about to do. Sevenyears of great abundance are coming throughout the land ofEgypt, but seven years of famine will follow.: : :The seven years of abundance in Egypt came to an endand the seven years of famine began, just as Joseph had said.
(Genesis 41: 29–30; 53–54)(Holy Bible, New International Version, 1984)
1. Introduction
Egypt has been facing climate variability and its influence on agricultural produc-tion for at least four thousand years, since Joseph averted a disaster through a seriesof resource management decisions. Joseph was able to develop an optimal agricul-tural management plan because he had a ‘perfect’ hydroclimatic forecast. Today,however, Egyptian planners do not have the luxury of perfect forecasts and mustrely on the scientific understanding and analysis of physical and socio-economicsystems. The understanding of these complex systems allows for improved plan-ning in light of local and regional climatic variability, untimely and/or limited
Climatic Change38: 261–287, 1998.c 1998Kluwer Academic Publishers. Printed in the Netherlands.

262 DAVID N. YATES AND KENNETH M. STRZEPEK
resource availability, and socio-economic uncertainty. The potential for anthro-pogenic climate change due to green house gas emissions heightens the needfor sound development plans. Strategies to deal with the potential problems andimpacts of climate change on the agricultural system of Egypt requires qualitativeand quantitative analysis.
Egypt’s historic vulnerability to climatic fluctuation changed greatly with thecompletion of the High Aswan dam. The reservoir can hold more than two timesthe average annual flow, which allows for the storage of surpluses in wet years to besaved for dry years. The entire Egyptian Agricultural system is based upon Egypt’streaty with The Sudan, which annually allocates 55.5 billion cubic meters from theNile to Egypt. Increased greenhouse gases and potential global and regional climatechange could affect River Nile flows and Egypt’s water resource availability. Howclimate induced changes in water resource availability, crop yields, crop water use,land resources and global agricultural markets affect Egyptian agriculture are thefocus of this paper.
A mathematical sector model of Egyptian agriculture was used in conjunctionwith a previous study of the macro-economy, agronomy, water resources and landresources of Egypt to study the integrated impacts of climate change on the agri-cultural economy of Egypt. This work is an extension of Strzepek et al. (1995) thatincluded economy-wide effects of water resources, the results from a more detailedhydrologic model of the River Nile and additional socio-economic scenarios (Yatesand Strzepek, 1996; Strzepek and Yates, 1996).
Examples of other integrated studies of climate change impacts on agriculturalsystems include: the MINK study on Minnesota, Iowa, Nebraska, and Kansas(Bowes and Crosson, 1993; Crosson and Rosenburg, 1993); the St. Lawrence RiverBasin (Mortsch et al., 1993); Southeast Asia (Parry et al., 1992); U.S. agriculture(Adams et al., 1990, 1995) and world food trade (Fischer et al., 1994; Rosenzweigand Parry, 1993; Darwin et al., 1995).
2. Egypt: A Background Sketch
2.1. GEOGRAPHY AND CLIMATE
Egypt occupies the northeastern corner of Africa (Figure 1) from 22� to 31� Northlatitude and 24� to 36� East Longitude. It is bounded in the east by the Red Sea,in the west by Libya, in the north by the Mediterranean Sea and in the south bySudan. The total land area is 997,688 square kilometers and is made up of fivemajor geographical regions: the Nile Valley (upper Egypt, lower Egypt, the NileDelta), the Eastern Desert, Sinai, and the Western Desert. These geographical areasare divided into 26 administrative units or governorates that are grouped into fouraggregate regions: Urban Egypt, Lower Egypt, Upper Egypt, and Frontier Egypt.
Most economic activity is located in the narrow, 1000 kilometer Nile Valleycorridor from the High Aswan Dam in the South to the Nile Delta in the North.

AN ASSESSMENT OF INTEGRATED CLIMATE CHANGE IMPACTS 263
Figure 1. The Nile Basin in relation to Africa and Egypt (note, political boundaries are not exact).
The Nile Delta region is particularly important as it accounts for 60 percent of theagricultural land and over 60 percent of the population. Egypt’s northern coastlineis currently subsiding at a rate of 1 cm per decade, largely attributable to reducedsediment load to the Nile delta due to the High Aswan Dam. This has led tothe loss of agricultural lands and reduced productivity in coastal lands due towaterlogging and salinity. In addition, 15 percent of the Nile Delta is below the 1meter contour, which poses a threat to a significant portion of Egypt’s agriculturallands due to subsidence and salinization (Nicholls and Leatherman, 1995). Egyptis an arid country with only trace rainfall from the southern border to just southof Cairo, limited rainfall in the Delta, and up to 200 mm in a narrow strip alongthe Mediterranean Coast. Egypt is effectively desert land except for a very narrowstrip along the coast and the Nile Valley ‘oasis’.

264 DAVID N. YATES AND KENNETH M. STRZEPEK
Table IAgricultural land in Egypt, 1990
Agro-climatic zone Area Percentage(103 feddans)
Upper Egypt 1076 18Middle Egypt 1192 20Delta 3624 62
Total 5892 100
2.2. A SNAP SHOT OF THE EGYPTIAN AGRICULTURAL SECTOR
Egypt, with its very arid climate, has a unique agricultural system. Virtually all theagricultural land is irrigated with Nile River water which is stored in Lake Nasserbehind the High Aswan Dam. Currently agriculture is practiced on 3 millionhectares (5.892 million feddans�) or only 3 percent of the area of Egypt. New, lessfertile land on the fringe of the Delta and in the Sinai are being reclaimed, whilemore productive land (old land) is being lost to urbanization (Humphries, 1991).Table I shows the aggregate distribution of agricultural land within Egypt.
The agricultural year has three crop seasons. The winter season starts fromOctober to December and ends between April and June. Its main crops are wheat,barley, berseem,�� lentils, winter onions and vegetables. The summer crops –cotton, rice, maize, sorghum, sesame, groundnuts, summer onions and vegetables– are sown from March to June and harvested from August to November. A thirdgrowing season known as ‘nili’ is a delayed summer season where rice, sorghum,berseem and some vegetables are grown. A piece of land cannot be planted in bothsummer and nili crops in any one year because nili and summer cropping seasonsoverlap. There are significant perennial crops such as sugarcane in Upper andMiddle Egypt and citrus, grapes, bananas, mangoes, olives and dates (Humphries,1991). An elaborate crop rotation is practiced to prevent soil degradation and croploss due to pests.
In 1990, agriculture (including livestock) accounted for nearly 20 percent ofGross Domestic Product and employed 37 percent of the labor force. These figuresdo not include Agro-industries such as textiles or food processing (Onyeji, 1992).Agricultural exports accounted for approximately 20 percent of export earnings.Egypt is currently importing over two-thirds of its wheat and vegetable oils andone-third of its corn, despite some of the most productive agricultural land in theworld. Agricultural imports have increased three-fold since 1975, resulting in anannual agricultural import bill of over $3 billion. This is due to a combination ofgovernmental policies, international commodity prices, foreign food aid and pop-
� A feddan is the Egyptian unit of land measurement. It is equal to 1.1 acres or 0.48 hectares.�� Berseem is an Egyptian clover used for fodder.

AN ASSESSMENT OF INTEGRATED CLIMATE CHANGE IMPACTS 265
ulation growth (FAO, 1991; Hansen, 1991). Agricultural production has increasedby 46 percent over the period 1978 to 1990, while the population has grown 28percent resulting in a per capita increase in agricultural production of 14 percentover this period.
2.3. EGYPT’S FUTURE
Egypt’s 2060 population is estimated to more than double (2.2 times) 1990 pop-ulation estimates. This represents a 1 percent average annual growth rate over a70 year period (based on World Bank estimates; Fischer et al., 1994). The grow-ing Egyptian population puts stress on efforts to increase agricultural productionthrough land reclamation and technological improvement. Future socio-economicconditions in the country will depend on the sign and magnitude of the differencein the economic and population growth rates.
There are two quite opposite views about Egypt’s long-range economic devel-opment (O’Mara and Hawary, 1992). The pessimists see Egypt having dug itselfinto a deep economic hole. Very low overall economic growth and the prospect ofunchecked population growth and slow changes in government policies will leadto short-term consumption rather than long term investment. Egypt will continueto be a ‘major’ consumer through inexpensive imports of food commodities. For-eign debt will increase, as public policy will continue to hinder economic growth.Significant investments in new technologies will remain small. Economic reformwill be difficult because of the short term pain associated with structural reform, aspolicy makers will be unwilling to take agonizing short run risks without knowingthe long-run benefits. The economic ‘hole’ will only grow deeper. Resource andenvironmental conditions will constrain growth.
The optimists believe that in spite current debt and low technology industries,Egypt will invest in new, innovative technologies in the mid and long term and willactually surpass some countries with aging, less productive technologies (Lofgren,1994). This group sees Egypt as the South Korea of the 21st century. Trade lib-eralization, an advantageous location on the Mediterranean, control over the SuezCanal and a fairly well-educated yet inexpensive labor force will allow Egypt tobecome a major center for manufactured goods using imported factor inputs. High-er agricultural prices will accelerate economic growth and generate employmentfor the poor in the non-agricultural sector in the long-run. The possible short termeffect is higher prices, which will reduce the purchasing power of the poor, incur-ring high short-run costs on this group. Decreased government intervention willincrease the flexibility of the agriculture and non-agriculture sectors to changingnational and global markets. Both will benefit from liberalized policies. Resourceand environmental conditions will not be a major constraint to growth.
The description of the Egyptian economy in 1990 suggests a sensitivity to thetypes of impacts postulated for Egypt as a consequence of climatic changes. With20 percent of GDP and 38 percent of the labor force involved directly in agriculture,

266 DAVID N. YATES AND KENNETH M. STRZEPEK
any impact is likely to have economy wide effects. In addition, major investmentsto mitigate impacts will take away from more productive investments. Futureassumptions are crucial to analyzing the effect of climate change on the futureeconomy of Egypt. However, these scenarios are not forecasts and only representtwo plausible future scenarios. Given the structure of the economy, impacts maygreatly vary. We look at Egypt’s vulnerability to climate change in the next section.
2.4. EGYPT’S VULNERABILITY TO CLIMATE CHANGE
Egypt is very dependent on natural resources that are vulnerable to climate change.A large portion of the arable land is in the Nile Delta and is particularly vulnerableto sea-level rise. Agriculture needs water from the Nile for irrigation which isvulnerable to precipitation and temperature changes within the entire Nile basin.Crop yields and crop water use could be affected by climate change.
Previous studies of climate change impacts on Egypt suggest that this countrycould be particularly sensitive to climate variability. Broadus et al. (1986) and El-Raey et al. (1995) both suggest land losses of 12 to 15 percent of Egypt’s currentarable land for a one meter sea-level rise. A study of the Nile Basin by Gleick (1991)suggested that it is extremely sensitive to changes in temperature and precipitation.Aside from the low elevation of the Nile Delta, Egypt’s vulnerability to sea-levelrise is further heightened by the damming of the Nile by the High Aswan Damwhich has reduced the sediment flux to the delta and increased land subsidenceand soil salinization. Nicholls and Leatherman (1995) estimated that a mean, 1meter global sea-level rise by 2100 would give rise to a 0.37 meter sea-level rise atthe Nile delta. This, combined with a non-climate induced subsidence of the NileDelta of 0.38 meters would result in the movement of the shoreline to the current0.75 meter contour and a 5 percent loss of Egyptian agricultural land by 2060.Agriculture below an elevation of one meter is very difficult due to salinizationand sea-water intrusion and requires careful water management (Rosenzweig andHillel, 1994).
Egypt must rely solely on the Nile, as there are few water supply options whichare economically feasible. Climate change could affect flow in the Nile and theavailability of water for Egypt. Also, Nile flows are likely to be influenced byupstream development in countries like Sudan and Ethiopia. Increased temper-atures would increase evapotranspiration, which is likely to increase crop waterrequirements and lower crop yields (Eid and Saleh, 1992).
3. Sectoral Impacts of Climate Change Based on Select GCM Scenarios
Climate change scenarios were based on a GCM approach and included: the Geo-physical Fluid Dynamics Laboratory (GFDL), the United Kingdom MeteorologicalOffice (UKMO), and the Goddard Institute for Space Studies (GISSA) models. Two

AN ASSESSMENT OF INTEGRATED CLIMATE CHANGE IMPACTS 267
Table IISummary of GCM climate change scenarios. GISSA transient values aretaken from the 2050 decade (Rosenzweig et al., 1995)
GCM Resolution CO2 (ppm) Change in average global:(lat.� long.) in 2060 Temp. (�C) Precip. (%)
GFDL 4:4� 7:5 600 4.0 8UKMO 5:0� 7:5 640 5.2 15GISSA 7:8� 10 630 2.5 6
See Phillips (1994) for model summaries.
of the scenarios are steady state GCMs (GFDL and UKMO) and the third is a tran-sient GCM (GISSA). Table II is a summary of select globally averaged climatevariables for each GCM.
Table III contains the climate variables (temperature and precipitation) for fourregions within the Nile Basin. This includes the upper lakes region in the southernportion of the Nile, the Sudd Swamp region including the Bahr El Gazal and theSobat basins, the Blue Nile including Tana and the upper and lower portions of theBlue and the Atbara basin. The UKMO model is the warmest, with temperatureincreases as high as 4.8�C. The GISSA scenario is the wettest, with regionalprecipitation increases of over 150 percent.
A linked monthly water balance model of 13 Nile sub-basins was combined withmodels of the Equatorial Lakes, Sudd Swamps and Lake Nasser to determine annualavailable water to Egypt – Table IV (see Yates and Strzepek, 1997; Yates, 1996).Two of the three GCMs predicted increased average annual water availability toEgypt (UKMO and GISSA), while GFDL gave an approximate 9 percent decline.Model results indicated that the Nile Basin, on the whole, is quite sensitive tochanges in precipitation. Nemec and Schaake (1982) support this finding and pointto the strong non-linearities between precipitation and runoff. They modeled atributary of Lake Victoria and found that a 20 percent increase in precipitation,combined with 6 percent decrease in potential evapotranspiration, can lead to agreater than 80 percent increase in runoff! A 5 percent land loss due to sea-levelrise and land subsidence was assumed under all climate change scenarios.
Two agricultural scenarios were used for each of the three GCMs. The first tookinto account the positive physiological impacts of a CO2doubling on yield while thesecond accounted for CO2 fertilization as well as extensive adaptation measures,including: (1) significant shifts in planting dates, increased fertilizer application,and the development of new crop varieties (see Rosenzweig et al., 1995). Table Vshows the percent change in crop yields between 1990 and 2060 for the three GCMscenarios. Yield changes were not dependent upon the pessimistic or optimisticsocio-economic scenario. The UKMO model showed the most negative impacts,primarily due to larger temperature changes, while the GISSA scenario producedmoderate yield declines.

268 DAVID N. YATES AND KENNETH M. STRZEPEK
Table IIIAnnual changes in temperature and precipitation for the main regions of the Nile Basin
GFDL UKMO GISSA�T �C RatioP �T �C RatioP �T �C RatioP
Lake region 2.7 1.14 4.8 1.20 2.1 1.22Swamps 3.3 1.02 4.7 1.17 2.1 1.28Blue Nile 3.5 0.95 4.8 1.29 2.2 1.30Atbara 3.6 0.95 4.8 1.42 2.2 1.29
�T �C is the absolute change in temperature:T (2�CO2)� T (1�CO2). RatioP is theprecipitation ratio:P (2�CO2)=P (1�CO2). The GISSA scenario is taken for the decadeof 2050.
Table IVRunoff from the Nile Basin and annual water availability to Egypt forthe baseline and 3 GCM scenarios (in billions of m3)
BASE GFDL UKMO GISSA
Natural inflow 84 74 132 130Sudan abstraction 18.5 13.6 42.5 41.0Evaporation loss at Aswan 10.0 10.6 11.9 11.6
Total available for Egypt 55.5 49.8 77.6 77.4
Crop water use is a difficult metric because it is heavily dependent upon man-agement and agricultural practices. Irrigation efficiencies for Egypt are low due toinefficient flood irrigation practices, as evaporation tends to be a larger share thanplant transpiration in flood irrigation (Rosenzweig and Hillel, 1994). Water effi-ciencies could increase if Egypt were to adopt high technology irrigation. Table VIgives the changes in crop water use under the climate change scenarios relativeto the 1990 base. In some cases, crop water use declined due to reduced planttranspiration as a consequence of CO2 fertilization affects. The protein feed, otherfood and non-food crops showed the most significant increases in water use, whilethe crop water demand for wheat and coarse grain crops declined.
4. A Forward-Linkage, Sector Approach to Impact Assessment
The forward-linkage method applied two statically coupled economic models (Fig-ure 2). First, an Egypt specific Computable General Equilibrium (CGE) sub-model(the Standard National Model-SNM) of the Basic Linked System (BLS) was used(Fischer et al., 1988; Yates, 1996). Impacts of climate change on crop yields, cropwater use, water supply and land resources were applied linearly over the 70 yeartime horizon within the Egyptian SNM. National socio-economic trends (both opti-mistic and pessimistic) were also applied, as were world market prices taken from

AN ASSESSMENT OF INTEGRATED CLIMATE CHANGE IMPACTS 269
Table VPercent change in crop yields relative to 1990 for the three GCMs
GFDL UKMO GISSAw/CO2 ADPT II w/CO2 ADPT II w/CO2 ADPT II
Wheat –26.0 –13.0 –51.0 –25.0 –5.0 –2.5Rice –7.0 –3.0 –27.0 –13.0 –5.0 –2.5Grains –17.0 –8.0 –30.0 –15.0 –20.0 –10.0Protein feed –1.0 0.0 –21.0 –10.0 –3.0 –1.5Other food –1.0 0.0 –21.0 –10.0 –3.0 –1.5Non-food –1.0 0.0 –21.0 –10.0 –3.0 –1.5Fruit –6.0 –3.0 –21.0 –10.0 –3.0 –1.5
W /CO2 is the impact of climate change on crop yield with CO2 fertilization considered.ADPT II are farmer adaptation as defined by Rosenzweig and Parry (1993), which includesthe physiological effects of carbon dioxide and climatic variables (temperature and precipi-tation) as well as high cost adaptation measures.
Table VIPercent change in water use for the three GCM scenarios relative to the 1990 basescenario
GFDL UKMO GISSACO2 ADPT II CO2 ADPT II CO2 ADPT II
Wheat –10.0 –10.0 –8.0 –8.0 –15.0 –15.0Rice 6.0 6.0 13.0 13.0 0.0 0.0Grains –10.0 –10.0 0.0 0.0 –10.0 –10.0Protein feed 20.0 20.0 25.0 25.0 0.0 0.0Other food 20.0 20.0 25.0 25.0 0.0 0.0Non-food 20.0 20.0 25.0 25.0 0.0 0.0
Four crop simulations were performed in Egypt using detailed physiological cropmodels (Rosenzweig and Parry, 1993) and included wheat, rice, maize and soybeans.Wheat, rice and grains were considered as maize. Protein feed, other food and non-food agriculture were mapped to soybean. A negative value indicates a decrease incrop water use.
previous simulations of the BLS. Output from the Egyptian SNM served as inputto the Egyptian Agricultural Sector Model (EASM).
Briefly, the BLS is a recursively dynamic CGE model and incorporates sever-al national models linked together through international markets which globallybalance commodities and adjust international prices to generate a balanced globaleconomic state of prices and demands. There are 16 linked SNMs and 4 uniquenational models (U.S.A., India, China and the former planned economies of theEastern Block) which together comprise almost 80 percent of the agricultural activ-ity of the globe (i.e., production, demand and land usage). Additionally, 14 regionalmodels comprise the remaining 20 percent and are generally grouped according to

270 DAVID N. YATES AND KENNETH M. STRZEPEK
Figure 2. Schematic of the forward-linkage approach to an integrated assessment of climate changeimpacts on Egypt using an agricultural sector model.
socio-economic conditions (i.e., African oil exporters, African low-income calorieimporters, Asia low income, etc.). Egypt is one of the sixteen Standard NationalModels.
The SNM includes 10 agricultural and 1 non-agricultural commodities at theinternational level. Non-agriculture supply is determined through a Cobb-Douglasproduction function dependent upon labor and capital, while supply within the10 agricultural commodities is based on revenue-maximization and feed-mix costminimization given availability of factor inputs (fertilizer, land, labor and water)at current domestic prices. Processing of agricultural products, intermediate inputsand non-agricultural inputs are also part of agricultural production.
The BLS is a world trade model, but this work focuses on a single country.Fortunately, the SNM is able to run in a stand-alone-mode, where world marketprices are taken as exogenous from a previous global simulation of the entire BLSsystem. It was assumed that Egypt’s influence on international markets was notgreat enough to significantly impact the global market – a small country assumption.

AN ASSESSMENT OF INTEGRATED CLIMATE CHANGE IMPACTS 271
Figure 3. Representation of consumer and producer surplus. Rotation and/or shift of the commoditydemand curve can be used to reflect demand changes.
Crop yields, crop water use, annual available Nile water and land changes dueto sea-level rise were inputs to the Egyptian SNM to the year 2060 (Figure 2) (Fis-cher et al., 1988, 1994; Yates and Strzepek, 1996). Egyptian domestic commoditydemands and domestic consumer and producer prices in 2060 were taken from theEgyptian SNM. 2060 scenario specific water availability, land availability, cropyield and crop water use were entered into a modified Egyptian Agricultural SectorModel (EASM-CC – Egyptian Agricultural Sector Model for assessing ClimaticChange).
The EASM is a partial equilibrium, quadratic programming model which sim-ulates a single agricultural year and captures water, land, crop, livestock, laborand other components at a sub-national scale. The EASM was first developedby Kutcher (1981) in the context of a UNDP funded, World Bank managed waterresource master planning study aimed at rationalizing a proposed sequence of waterresource investments. It has since been updated by Humphries (1991) to perform adrought policy study, a study of new land development (Farag et al., 1993), and aclimate change study (Strzepek et al., 1995). The model maximizes the sum of allcommodities consumer-producer surplus (CPS) according to the specification ofsupply and demand curves derived from domestic prices and demand elasticities(see Hazell and Norton, 1986). Samuelson (1952) showed that under a competitivemarket, maximizing the area between the supply and demand curves (CPS) drivesthe solution to a competitive equilibrium position in terms of price and quantity,Pe andQe. The grayed area in Figure 3 represents CPS.

272 DAVID N. YATES AND KENNETH M. STRZEPEK
Two approaches were possible for assessing the impacts of climate changewith the single year EASM-CC model. The first was to apply bio-physical projec-tions on present day socio-economic conditions – apresent-dayapproach. Secondwas to apply biophysical and socio-economic changes on a future projection –a forward-linkageapproach. The likelihood that future conditions in Egypt willbe significantly different than today’s motivated the use of theforward linkageapproach for this study. Future socio-economic conditions can lead to changes indemand for certain commodities due to price changes and income effects, but theEASM can not account for these because income is not modeled in this partialequilibrium model. Instead, results from the SNM were used to update demandsand commodity prices, as demand elasticities were held constant. Demand curvescould be shifted and/or rotated, with a shift maintaining the current slope of thedemand curve and requiring an update of the intercept,� to �0 (Figure 3). A rota-tion maintains the intercept but changes the slope,� to�0 (and would require someestimate of income changes), while shifting and rotating the demand curve wouldrequire updating both� and�.
Commodity-specific demand curves were updated through an upward shift andwith no rotation. The new intercept,�0, was estimated from demands and pricestaken from the BLS, with prices assumed to be demand inelastic (i.e., fixed priceswith given demand). 2060 demand estimates for the EASM were specified bymultiplying the observed 1990 levels by the results from the baseline and climatechange scenarios from the BLS.
5. Generation of Baseline Scenarios
Two 2060 base scenarios were generated based on an optimistic and pessimistic sce-nario for Egypt (2060-OPT and 2060-PES). A 1990 baseline using 1990 observedpopulation, land and water resources, technology and agricultural policy constraintswas generated and referenced to the 2060 baseline scenarios. Several constraintsand assumptions applied in 1990 were removed or adapted for 2060, while impor-tant agronomic constraints remained. Changes include:
� Removing the upper limit on sugar processing, the upper bound on citrus,cotton and vegetables;
� The removal of the exogenous herd of camels, donkeys and goats;� Crop by-product fodder utilization of only 50 percent of 1990 (assumption of
specialization);� Labor availability as a linear increase of total population;� The addition of equally distributed new lands in the Upper Valley and the Nile
Delta comprising 2 million feddans;� Land subsidence in the Nile Delta which removed 124,000 feddans of agricul-
tural area;� Removal of the navigational requirement;

AN ASSESSMENT OF INTEGRATED CLIMATE CHANGE IMPACTS 273
� Removal of bounds on imports and exports, with exports limited to a fixedpercentage of the global total.
Changes in crop yields were taken from BLS based on exogenous technologicalgrowth rates and crop production functions. Crops in 2060 (baseline scenarios)were assumed to require more water as yields increased and more inputs wereapplied. Crop water requirements were assumed to be 25 percent of the yieldchange based on experimental data from the Southwestern U.S.A. (Rosenzweig,1994). Inputs such as mechanization, fertilizer, etc. were taken from the BLS aspercent increases or decreases from 1990 data. Restrictive taxes and subsidies wereremoved from the marketing costs for the 2060 base scenarios. Marketing costswere assumed to be true mark ups between domestic prices and farm gate prices.Export marketing prices were assumed to be 20 percent greater than the domesticmarketing costs. International commodity prices were taken from previous BLSsimulations (Fischer et al., 1994) and were used to update the EASM-CC prices.
5.1. OPTIMISTIC BASELINE SCENARIO-2060 (2060-OPT)
2060-OPT was based on a consistent scenario for 2060 with population, commod-ity demands and yield changes taken from the BLS. Land and water resourceswere based on current climate, and crop water use was based on agronomic andtechnological assumptions in 2060 (Strzepek et al., 1995).
Characteristics of the optimistic scenario were:
� High investment rate (12 percent above depreciation rate for non-agriculturalsector);
� High non-agricultural productivity rate increase (2%/year);� High labor transformation rate: The movement of labor from agricultural to
non-agricultural activity;� High-quality, competitively-priced non-agricultural good was reflected through
a competitively priced non-agricultural good available on the world market;� Increased labor rate relative to population growth. The labor force was rapidly
assimilated into the economy;� Non-agricultural sector became more dominant into the 21st century;� Non-agricultural sector became less dependent on the agricultural sector.
5.2. PESSIMISTIC BASELINE SCENARIO-2060 (2060-PES)
The 2060-PES scenario for Egypt focused on recent trends and future predictionsof population growth, limited natural resources, and waning foreign investment.
Characteristics of the pessimistic scenario are:
� Low investment rate (8 percent above depreciation rate of non-agriculturalsector);
� Low non-agricultural productivity rate increase (1%/year);

274 DAVID N. YATES AND KENNETH M. STRZEPEK
� Low labor transformation rate;� No non-agricultural advantage to Egypt, reflected in higher relative prices on
the world market;� Decreasing or constant labor rate relative to population growth, slow mobility
from the agricultural to non-agricultural sector;� Non-agricultural sector remained labor intensive: i.e., limited foreign capital
investment;� Agricultural sector remained a large portion of the economy into the 21st
century;� Non-agricultural sector remained highly dependent upon the agricultural sec-
tor.
5.3. OPTIMISTIC AND PESSIMISTIC BASELINE SCENARIOS– ECONOMY-WIDERESULTS
Table VII is a compilation of socio-economic indicators for the baseline scenariostaken from the SNM of Egypt. Generally, the pessimistic case maintained higherlevels of agricultural output (reflected in higher agricultural GDP) as compared withthe optimistic scenario, as fewer resources were diverted to the non-agriculturalsector. Non-agricultural growth was approximately three times greater for the opti-mistic scenario, driven by higher investment rates and agricultural-non-agriculturaltransformation rates with respect to capital and labor.
For the optimistic scenario, a larger portion of labor was occupied in the non-agricultural sector and labor participation outpaced population growth. The popu-lation in 2060 was 2.22 times greater than in 1990 and employment in 2060 was2.26 times the 1990 value. In the pessimistic scenario, a larger share of economicactivity remained in the agricultural sector, hence labor assimilation (2.23 times1990) barely outpaced population growth (2.22 times 1990).
Incomes in the optimistic scenario rose considerably, yet falling domestic cropprices (measured by the crop price index) negatively affected the agriculturalsector as parity (a relative metric comparing agricultural and non-agricultural wageearnings) declined by 42 percent. In the pessimistic scenario, the agricultural sectormaintained a larger share of total GDP; and per-capita GDP increased by a modest38 percent from 1990. The gap between the agricultural and non-agricultural wageearner (parity) increased by a more modest 7 percent.
5.3.1. The Agricultural Sector in 2060-EASMEconomic Indicators of the Agricultural Sector.Table VIII is a summary ofagricultural economic indictors for 1990 and the two 2060 baselines from theEASM-CC model. Not surprising, there was considerable growth in consumer andproducer surplus – the principle welfare indicator. Consumer surplus was muchgreater than producer surplus, driven by increased food demands from the growingpopulation and higher domestic agricultural prices. Producer surplus, on the other

AN ASSESSMENT OF INTEGRATED CLIMATE CHANGE IMPACTS 275
Table VIIEconomic and resource indicators for 1990 (absolute) andthe two 2060 reference scenarios (percent change from 1990)from BLS solutions
Indicator BLS1990 2060 OPT 2060 PES
Population 54156 122 122GDP Ag 1143 96 135GDP non-Ag 4878 617 224GDP/cap. 256 178 38Parity 0.30 –42 –7Trade balance 247 –19.3 –45.2Cal./day 2587 24.5 8.9Crop price index 1.19 –22 –22Food price index 1.16 6.9 –3.4
For the 1990 Base, the above indicators are as follows:GDP – millions of 1970 dollars.Trade balance – Net import (positive) or export (negative) inmillions of 1970 dollars, agriculture and non-agriculture.Cal./day – Daily calorie intake per capita.Parity – Agricultural GDP per capita of one agricultural wageearner divided by non-agricultural GDP per capita of onenon-agricultural wage earner; an equity indicator.Crop price index – Index of crop pricesFood price index – Index of food prices.OPT – Optimistic scenario; PES – Pessimistic scenario.
hand, did not keep pace with population under the pessimistic scenario and isslightly higher under the optimistic scenario.
The baseline scenarios implied significant structural adjustment of the agricul-tural sector, with Egypt becoming increasingly dependent on international marketsto meet domestic demand. This was reflected in decreased food self-sufficiency.Per capita food consumption (calories per capita per day) increased by 8.8 percentunder the optimistic baseline and decreased by 2.6 percent under the pessimisticbaseline. The volume of imports and exports both rose, but the agricultural tradedeficit continued to increase under both 2060 baseline scenarios. The import toexport ratio in 1990 was 1.6:1.0. By 2060 this had become 3.7:1.0 and 2.5:1.0 forthe optimistic and pessimistic scenarios, respectively.
Agricultural Commodity and Factor Input Changes for Baseline Scenarios.Alarge portion of the increased demand forbovine and ovine meatanddairy(meat andmilk) were met through imports, while demand increases forother animalproducts(poultry meat and eggs) were met through increased national production (Figure 4).Domestic production of basic foodstuffs –wheat, riceandcoarse grains– did notkeep pace with population growth, as larger shares were met through imports.

276 DAVID N. YATES AND KENNETH M. STRZEPEK
Table VIIIEconomic indicators for the agricultural sector for 1990(absolute) and the2060 OPTand2060 PESreference scenario(percent change from 1990)
Indicator EASM-CC1990 base 2060 OPT 2060 PES
Cons./prod. surplus 36995 518 369Consumer surplus 28112 639 451Producer surplus 8883 136 108Trade balance –1631 1437 914Cal./day 3000 8.8 –2.6Self sufficiency 0.51 –39 –31Imports 4447 720 559Exports 2816 305 353Water use 35.2 28 28Harvested area 4530 30 30
The above indicators are as follows:Cons./prod. Surplus – Consumer-producer surplus (1990Egyptian Pounds).Consumer and producer surplus – 1990 Egyptian Pounds.Trade balance – Net import (positive) or export (negative) in1990 Egyptian Pounds. The positive percent change for 2060OPT and 2060 PES represent increases in the trade defecit.Cal./day – Per capita calorie intake.Self sufficiency – Commodity weighted ratio of total caloriesdomestically produced to total consumed.Imports and exports – 1990 Egyptian Pounds.Water use – Consumptive use for agricultural production, includ-ing fodder production (km3).Harvested area – Total cropped area in hectares.
The pessimistic scenario maintained a higher production of staple commodities(wheatandrice), reducednon-food agricultureand increasedlivestockagriculture(except forother animals) when compared with the optimistic scenario. The foodself sufficiency ratios of the pessimistic scenario were higher than the optimistic(Table VIII) pointing to an agricultural sector meeting a larger share of domesticfood demand.
Despite decreased world market prices forother foodandnon-food agricultureproducts, production remained high to meet domestic demand and to leveragethe differences between domestic and international prices. The optimistic scenarioincreasedother-food imports relative to exports because domestic prices weregenerally higher than world market prices, while the pessimistic scenario reducedother-foodimports due to lower domestic prices (Figure 5).Non-food agricultureimports and exports were practically the same for both the optimistic and pessimisticbaselines scenarios.

AN ASSESSMENT OF INTEGRATED CLIMATE CHANGE IMPACTS 277
Figure 4. Change in domestic production for the optimistic and pessimistic scenarios in 2060 as apercent of 1990.� Protein feed for EASM is green fodder (berseem) used for animal feed.
Spatial and temporal disaggregation in the EASM-CC model allowed for theredistribution of factor inputs. Winter water use increased relative to summermonths in response to cropping pattern changes which conserved water (Figure 6).The shadow price or marginal value� on water in 1990 was zero, reflecting a surplusrelative to the more scarce resource, land (with a positive shadow price in 1990).Overall water use by 2060 had increased by almost 30 percent, reflected in a pos-itive shadow price for water. Commodity disaggregation and spatial and temporaldisaggregation allowed for adjustments in national agricultural production. Cheap-er imports were used to make-up for deficits in domestic food demand (wheatandcoarsegrains) and select commodities were produced for export revenue generation(such ascotton).
6. Integrated Assessment of Climate Change Impacts on the AgriculturalSector of Egypt
Relative values of select model output from the climate change scenarios werecompared to the baselines and across scenarios. Analyzing the large number ofscenarios in detail (2 baselines and 12 climate change scenarios) can be over-
� Shadow price or marginal value is the change of the model objective function at the margin tothe addition or subtraction of an additional unit of a resource. If a resource is in surplus at the optimalvalue, then the shadow price is zero. A positive shadow price means that the resource is limiting andthe objective will increase by the marginal value if an additional unit of the resource can be suppliedor decrease if a unit is removed.

278 DAVID N. YATES AND KENNETH M. STRZEPEK
Figure 5. Net import and export ofother-foodandnon-food agricultural.
Figure 6. Percentage change relative to 1990 of agricultural water use for the optimistic and pes-simistic scenarios (with annual water availability of 55.5 milliards for Egypt).
whelming and not greatly instructive, so a only a select number were chosen tohighlight broad lessons for Egypt.
6.1. EXOGENOUS GLOBAL CONDITIONS FROM THE BLS
The three GCMs gave a mixed picture of world market prices (Table IX). UKMOresults showed the largest price increases for most commodities due to decreased

AN ASSESSMENT OF INTEGRATED CLIMATE CHANGE IMPACTS 279
Table IXRelative index of international commodity prices. 1990 values (1990= 100:0)
2060 GFDL GFDL UKMO UKMO GISSA GISSABASE w/CO2 ADPT II w/CO2 ADPT II w/CO2 ADPT II
Wheat 102 105 86 226 129 70 58Rice 89 126 97 216 126 80 61Coarse grains 91 115 84 249 126 69 50Bov. and ov. meat 104 107 105 117 106 104 102Dairy 97 100 97 121 101 94 91Other animal 91 93 88 107 96 85 80Protein feed 152 152 124 365 193 92 76Other food 74 73 65 115 87 55 49Non-food ag. 59 63 54 106 70 44 38Non-ag. 100 100 100 100 100 100 100
global production. The GISSA scenario gave slight increases to large decreases inrelative prices, as moderate temperature changes in the low latitudes and favorablechanges at higher latitudes led to greater global production of agricultural goods.In all cases (with the exception ofUKMO w/CO2 fertilization) both non-foodagriculture (for Egypt this would be cotton and flax fiber) andother food(fruitsand vegetables and other cash crops) decreased in price due to global increases inproduction and other market forces.
The integrated assessment results are presented below for each of the scenarios.Summarizing the sectoral climate change impacts:
� Under all scenarios crop yields declined and crop water requirements increased– albeit some greater than others;
� Agricultural land was lost to sea-level rise (5 percent);� Domestic commodity demand showed moderate declines, with a slight increase
under the GISSA scenario;� Nile water resources declined under GFDL and increased for the GISSA and
UKMO scenarios.
6.2. CLIMATE CHANGE IMPACTS ON THE AGRICULTURAL SECTOR OF EGYPT
The analysis showed there are likely winners and losers within the agriculturaleconomy of a food importing, developing country such as Egypt. This outcome isin large part due to the inelastic demand for most agricultural commodities. All ofthe scenarios pointed to the strong role of domestic and world market prices onthe agricultural sector of Egypt. Generally, when world market prices were high,producers benefited (UKMO); and when world market prices were low, consumersbenefited (GISSA). When resources were reduced and there was a mix of impactson the international markets due to global climate change, then both consumer

280 DAVID N. YATES AND KENNETH M. STRZEPEK
Table XPercent change in economic indicators for the climate change scenarios referenced from thepessimistic baseline scenario
Pessimistic (percent change from 2060-PES baseline)GFDL GFDL UKMO UKMO GISSA GISSAw/CO2 ADPT II w/CO2 ADPT II w/CO2 ADPT II
Cons./prod. surplus –5.6 –3.1 –6.1 –0.6 0.6 6.2Consumer surplus –4.5 0.0 –15 –1.6 6.5 12Producer surplus –15 –29 69 8.2 –49 –45Trade balancea 47 36 48 24 19 3.7Cal./day –2.2 0.0 –7.1 –1.0 2.7 5.2Self sufficiency –23 –11 –29 –5.7 –8.6 0.0Imports 18 –3.2 72 12 –20 –34Exports –19 –55 102 –2.6 –72 –84Marginal land –43 –52 186 71 –19 –48Marginal water 64 21 –57 –64 –100 –100
See Table VIII for a description of indicators.a A positive percent change in trade balance is an increase in the trade deficit, since the 2060trade balance is negative for Egypt.
and producer surplus declined (GFDL). These results could only be found via anintegrated (and global) analysis. Sector results (water resources, agronomics, landresources) pointed to a range of variability, but different conclusions were drawnwhen linked to global conditions via the BLS.
Producer surplus (PS) was dependent upon international prices and producerscapacity for revenue generation on international markets. 8 of 12 climate changescenarios gave a drop in PS, with declines in PS occurring even for scenarioswhere the national climate change impacts were marginal. Export prices (other-food and non-food agriculture in particular) were often low, hurting Egyptianproducers (reflected in lower producer surplus). Only in the UKMOw/CO2scenariodid the relative price of other-food and non-food agricultural increase, resultingin increased export earnings and higher producer surplus. Consumers generallybenefited from lower international world market prices of both food and non-foodagricultural commodities. Tables X and XI are the changes for each scenario relativeto their respective 2060-OPT or 2060-PES baseline.
The integrated climate change assessment of the Egyptian agricultural economygave changes in consumer-producer surplus (CPS) ranging from a decrease of 6.1percent (UKMO PESw/CO2) to an increase of 6.2 percent (GISSA PESADPT II)relative to their 2060 Baseline. PS showed a wide range of variability – droppingby almost 50 percent under the GISSA PESw/CO2 scenario and increasing almost70 percent under the UKMO PESw/CO2 scenario. Consumer surplus (CS) alsoshowed a range of variability (from a 12.3 percent increase to a 15 percent decrease),although more moderate than producer surplus due to its relative larger magnitude.

AN ASSESSMENT OF INTEGRATED CLIMATE CHANGE IMPACTS 281
Table XIPercent change in economic indicators for the climate change scenarios references from thepessimistic baseline scenario
Optimistic (percent change from 2060-OPT baseline)GFDL GFDL UKMO UKMO GISSA GISSAw/CO2 ADPT II w/CO2 ADPT II w/CO2 ADPT II
Cons./prod. surplus –2.9 –2.6 –3.1 –0.8 0.4 2.8Consumer surplus –1.6 0.0 –9.0 –1.5 4.9 6.9Producer surplus –15 –28 55 6.8 –44 –38Trade balancea 41 25 49 14 3.8 –15Cal./day –1.0 0.0 –4.5 –0.9 2.0 3.1Self sufficiency –29 –16 –29 –6.5 0.0 9.7Imports 25 –1.4 73 14 –22 –36Exports –11 –60 127 14 –77 –81Shadow price land –60 –68 140 24 –36 –68Shadow price water 89 56 –44 –44 –100 –100
The agricultural trade deficit increased under all scenarios (except GISSA OPTADPT II), indicating increased dependency on imports to meet domestic demand.The scenario which gave the largest negative impact on CPS (UKMO) was theonly one which showed increased surplus to producers, despite the fact that ithad the largest negative impact on commodity yields. The brunt of the negativeeffects of climate change were felt by consumers under the UKMO scenarios –primarily driven by increased domestic and international agricultural prices. Theclimate change scenarios with marginal impacts or improvements in CPS tendedto benefit consumers more than producers, except the GFDL scenarios whereboth consumers and producers were negatively affected. The GFDL scenarios hadreduced water resources, diminished yields, higher international food prices andlower international prices on key exports (non-foodandother foodagriculture).These factors combined to reduce both national production and export earnings,increase dependenceon food imports and increase domestic food prices. The GFDLscenarios could be considered a ‘worst case’ for Egypt, as even significant farmeradaptation (ADPT II) did not greatly reduce the negative effects of climate change.Farmer adaptation tended to benefit consumers and not producers, through thereduction in domestic and international food prices.
Four of six adaptation scenarios produced a counter-intuitive (but explainable)result, due in large part to the assumption of uniform global adaptation. Nationally,adaptation benefited consumers more than producers due to improved global pro-duction, which lowered international prices and reduced Egyptian export earnings.Imports of low cost flood staples from the international market increased, improv-ing CS but reducing Egypt’s food self sufficiency. The GISSA scenario showed theonly improvement in PS under adaptation, as local production was used to meet

282 DAVID N. YATES AND KENNETH M. STRZEPEK
a larger share of national consumption given marginal yield declines and amplewater. It should be noted, however, that the GISSA scenario also gave the largestreduction in total agricultural output relative to the 2060 baseline. This is largelydue to falling national and world market prices and highlighted the importance ofanalyzing both relative and absolute changes, as a single metric can be misleading.Adaptation did improve producer surplus; but the improvement was within a muchsmaller agricultural sector (see Tables X and XI), as adaptation largely benefitedconsumers.
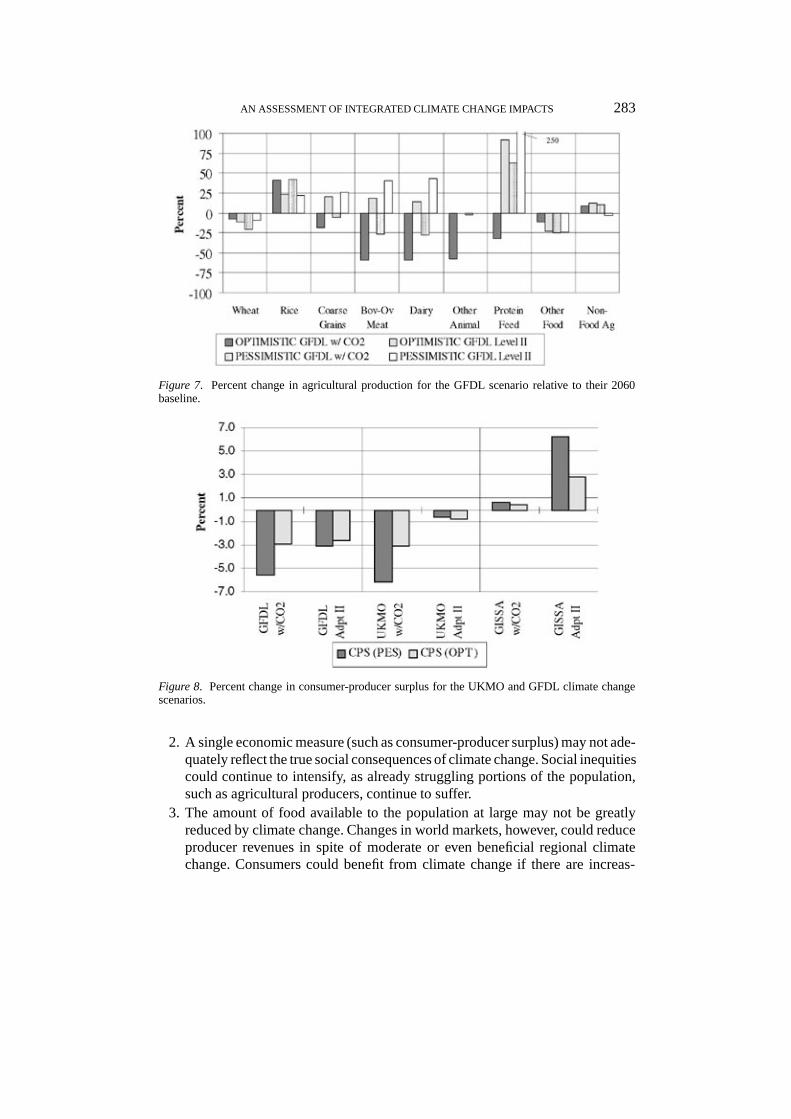
Significant shifts in agricultural production patterns were observed (allowedthough the removal of restrictive constraints), but it was assumed that theses changeswere made gradually over the 70 year period. The socio-economic scenario didnot produce a significant difference in CPS but it did play a role in the structuralmake-up of the agricultural sector. Adaptation also impacted the structure of theagricultural markets. Figure 7 is an example of the structural shifts within theagricultural sector for the GFDL scenarios. TheGFDL OPTand PESw/CO2 sce-narios reduced the national production of livestock, as a greater share of demandswere met through imports. Adaptation increased rice, coarse grain and livestockproduction which reduced dependence on imports to meet domestic demand. Thepessimistic scenario produced less wheat and more coarse grains and kept a largerlivestock sector fed by local fodder. Despite lower water availability, rice was still amajor component of cropped agriculture due to the high world market price whichtended to favor national production for domestic consumption. Smaller amounts ofavailable irrigation water increased its marginal value relative to land and forced ashift in cropping activity. The monthly re-distribution of agricultural water dimin-ished the negative effects of reduced water and depressed yields, particularly forthe GFDL scenarios.
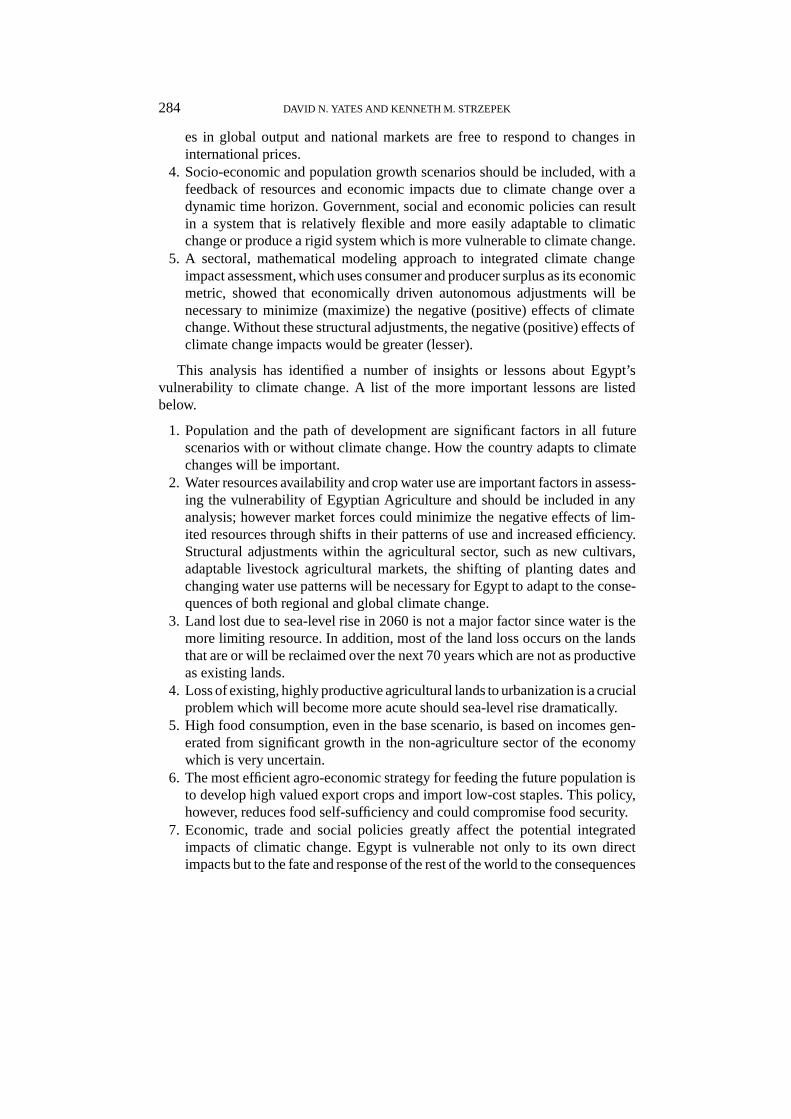
Farmer adaptation and the socio-economic projection (either optimistic or pes-simistic) played a role in determining climate change impacts, with the relativeimportance of each being scenario dependent. Figure 8 includes the change inCPS for the three scenarios relative to their 2060 baselines. UKMO with farmeradaptation (UKMO ADPT II) greatly reduced the overall impact of climate changeon CPS regardless of the socio-economic scenario, as adaptation largely benefitedconsumers due to greater national and global production which led to loweredprices. For GFDL, benefits from adaptation were moderate, especially under opti-mistic socio-economic assumptions where the negative impacts on consumers weresmall. GISSA was considered a ‘best case’ scenario.
The results of this analysis not only provide lessons for Egypt but provide formore general lessons that may be applicable to a number of nations or regions ofthe world. These are as follows:
1. When performing an integrated analysis it is essential that all scenarios andassumptions be consistent across each sector or integrated results can be mis-leading.
AN ASSESSMENT OF INTEGRATED CLIMATE CHANGE IMPACTS 283
Figure 7. Percent change in agricultural production for the GFDL scenario relative to their 2060baseline.
Figure 8. Percent change in consumer-producer surplus for the UKMO and GFDL climate changescenarios.
2. A single economic measure (such as consumer-producer surplus) may not ade-quately reflect the true social consequences of climate change. Social inequitiescould continue to intensify, as already struggling portions of the population,such as agricultural producers, continue to suffer.
3. The amount of food available to the population at large may not be greatlyreduced by climate change. Changes in world markets, however, could reduceproducer revenues in spite of moderate or even beneficial regional climatechange. Consumers could benefit from climate change if there are increas-
284 DAVID N. YATES AND KENNETH M. STRZEPEK
es in global output and national markets are free to respond to changes ininternational prices.
4. Socio-economic and population growth scenarios should be included, with afeedback of resources and economic impacts due to climate change over adynamic time horizon. Government, social and economic policies can resultin a system that is relatively flexible and more easily adaptable to climaticchange or produce a rigid system which is more vulnerable to climate change.
5. A sectoral, mathematical modeling approach to integrated climate changeimpact assessment, which uses consumer and producer surplus as its economicmetric, showed that economically driven autonomous adjustments will benecessary to minimize (maximize) the negative (positive) effects of climatechange. Without these structural adjustments, the negative (positive) effects ofclimate change impacts would be greater (lesser).
This analysis has identified a number of insights or lessons about Egypt’svulnerability to climate change. A list of the more important lessons are listedbelow.
1. Population and the path of development are significant factors in all futurescenarios with or without climate change. How the country adapts to climatechanges will be important.
2. Water resources availability and crop water use are important factors in assess-ing the vulnerability of Egyptian Agriculture and should be included in anyanalysis; however market forces could minimize the negative effects of lim-ited resources through shifts in their patterns of use and increased efficiency.Structural adjustments within the agricultural sector, such as new cultivars,adaptable livestock agricultural markets, the shifting of planting dates andchanging water use patterns will be necessary for Egypt to adapt to the conse-quences of both regional and global climate change.
3. Land lost due to sea-level rise in 2060 is not a major factor since water is themore limiting resource. In addition, most of the land loss occurs on the landsthat are or will be reclaimed over the next 70 years which are not as productiveas existing lands.
4. Loss of existing, highly productive agricultural lands to urbanization is a crucialproblem which will become more acute should sea-level rise dramatically.
5. High food consumption, even in the base scenario, is based on incomes gen-erated from significant growth in the non-agriculture sector of the economywhich is very uncertain.
6. The most efficient agro-economic strategy for feeding the future population isto develop high valued export crops and import low-cost staples. This policy,however, reduces food self-sufficiency and could compromise food security.
7. Economic, trade and social policies greatly affect the potential integratedimpacts of climatic change. Egypt is vulnerable not only to its own directimpacts but to the fate and response of the rest of the world to the consequences
AN ASSESSMENT OF INTEGRATED CLIMATE CHANGE IMPACTS 285
of climate change. Global commodity production and prices and how they areinfluenced by climate change could be one of the most significant determinantsof climate change effects on Egypt.
7. Summary and Recommendations
Egypt is vulnerable to the warming and potential changes in agriculture, waterand land resources and the local and global agricultural markets that are forecastto accompany greenhouse-gas-induced climate change. This study has shown thata single sector can not provide sufficient information regarding broader impactsof climate change on the agro-economy. Indeed, a collection of sector impacts,placed within an integrated assessment, can provide keen insight into the potentialconsequences of climate change on a major food importing country such as Egypt.This insight would not have been possible without the integrated approach. Climatechange would likely affect many socio-economic groups, influencing people’s foodentitlement based on prices and incomes, the agricultural sector’s productivity andthe economy’s ability to import and export agricultural commodities to maintainsome reasonable level of trade deficit. Sectors which are directly affected by climateshould be analyzed in concert with other sectors in sufficient detail so that feedbacksare part of the analysis.
Future research needs include the development and application of more cropmodels that include CO2 effects and cover a broader range of important crops. Thereis a need for improved understanding of potential agricultural/water adaptationsto climate change, an improved understanding of sea-level rise impacts on deltaicagricultural lands, development of better macro and sectoral economic modelsand improved understanding of the bio-geophysical resources of the Nile Basin.Future socio-economic development of Nile Basin countries should be considered,as this could play a critical role in the future policy and development of Egypt.Finally, global scenarios which include non-uniform adaptation between developedand developing nations should be created. These kinds of scenarios are highlyplausible given the technological advantage of developed countries. These newscenarios could have a large influence on global markets, as global markets wereshown to greatly affect the climate change impact assessment on a food importingcountry such as Egypt.
Acknowledgements
This work was made possible through the International Institute for Applied Sys-tems Analysis, the U.S. Country Studies Program, and the Advanced Studies Pro-gram at the National Center for Atmospheric Research. Special thanks is givento Cynthia Rosenzweig and Gunther Fischer for their helpful discussions, and theinformative and helpful comments of three anonymous reviewers.

286 DAVID N. YATES AND KENNETH M. STRZEPEK
References
Adams, R., Rosenzweig, C., Peart, R., Ritchie, McCarl, B., Glyer, D., Curry, B., Jones, J., Boote, K.,and Allen, H.: 1990, ‘Global Climate Change and U.S. Agriculture’,Nature345, 219–223.
Adams, R., Fleming, R., Chang, C., McCarl, B., and Rosenzweig, C.: 1995, ‘A Reassessment of theEconomic Effects of Global Climate Change on U.S. Agriculture’,Clim. Change30, 147–165.
Biswas, A.: 1993, ‘Land Resources for Sustainable Agricultural Development in Egypt’,Ambio22,556–560.
Bowes, M. and Crosson, P.: 1993, ‘Consequences of Climate Change for the MINK Economy:Impacts and Responses’,Clim. Change24, 131–158.
Broadus, J., Milliman, S., Edwards, D., Aubrey, D., and Gable, F.: 1986, ‘Rising Sea Level andDamming of Rivers: Possible Effects in Egypt and Bangladesh’, in Titus, J. (ed.),Effects ofChanges in Stratospheric Ozone and Global Climate Volume 4: Sea Level Rise, United NationsEnvironment Programme and the U.S. Environmental Protection Agency, pp. 165–189.
Crosson, P. and Rosenberg, N.: 1993, ‘An Overview of the MINK Study’,Clim. Change24, 159.Darwin, R., Tsigas, M., Lewandrowski, J., and Raneses, A.: 1995,World Agriculture and Climate
Change: Economic Adaptations, Agricultural Economic Report No. 703, U.S. Department ofAgriculture, p. 86.
Eid, H. and Saleh, M.: 1992,Modeling of Climate Change Impacts on Egyptian Agriculture,Unpublished manuscript, International Institute for Applied Systems Analysis, Laxenburg, Aus-tria, p. 15.
El-Raey, M., Nasr, S., Frihi, S., Desouki, S., and Dewidar, K.: 1995, ‘Potential Impacts of AcceleratedSea-Level Rise on Alexandria Governorate, Egypt’,J. Coastal Res.14, 190–204.
FAO (1991)AGROSTAT/PC, United Nations Food and Agricultural Organization, Rome, Italy.Farag, S., McCarl, B., and Attia, B.: 1993,Investigation of New Land Development in the Egyptian
Agricultural Sector, Department of Agricultural Economics, Texas A&M University, 24 March,p. 12.
Fischer, G., Frohberg, K., Keyzer, M., and Parikh, K.: 1988,Linked National Models: A Tool forInternational Food Policy, Kluwer Academic Press, IIASA, Laxenburg, Austria, p. 214.
Fischer, G., Frohberg, K., Parry, M. L., and Rosenzweig, C.: 1994, ‘Climate Change and World FoodSupply, Demand, and Trade: Who Benefits, Who Loses?’,Global Environ. Change4, 7–23.
Gleick, P.: 1991, ‘The Vulnerability of Runoff in the Nile Basin to Climate Changes’,Environ.Profess.13,66–73.
Hansen, B.: 1991,The Political Economy of Poverty, Equity and Growth: Egypt and Turkey, OxfordUniversity Press, New York, Oxford, p. 572.
Hazell, P. and Norton, R.: 1986,Mathematics Programming for Economic Analysis in Agriculture,Macmillian Publishing, New York, pp. 164–165.
Humphries, J.: 1991,EASM91 – A Users Manual, Unpublished publications of the Egyptian Ministryof Public Works and Water Resources, Cairo, Egypt, p. 210.
Kulshreshtra, S. N.: 1993,World Water Resources and Regional Vulnerability: Impacts of FutureChanges, RR-93-10, International Institute for Applied Systems Analysis, Laxenburg, Austria,p. 124.
Kutcher, G.: 1981, ‘Water Master Plan: The Agroeconomic Model’, Technical Report No. 16, UNDP-EGY/73/24, Ministry of Irrigation, Cairo, Egypt.
Lofgren, H.: 1994,Personal Communication, American University of Cairo, Cairo, Egypt.Mortsch, L., Koshida, G., and Tavares, D. L.: 1993,Adapting to the Impacts of Climate Change and
Variability, Proceedings of the Great Lakes–St. Lawrence Basin Project, 9–11 February, 1993,Quebec City, Environment Canada, Downsview, Ontario, p. 69 + 2 Appendices.
Nemec, J. and Schaake, J.: 1982, ‘Sensitivity of Water Resource Systems to Climate Variation’,J.Sci. Hydrol.27, 327–243.
Nicholls, R. and Leatherman, S.: 1995, ‘Global Sea Level Rise’, in Strzepek, K. and Smith, J.(eds.),As Climate Changes, International Impacts and Implications, Cambridge University Press,Cambridge, p. 92.

AN ASSESSMENT OF INTEGRATED CLIMATE CHANGE IMPACTS 287
O’Mara, G. and Hawary, E.: 1992,The Response of Egyptian Farmers to Cotton Policy Intervention,A Report to the Egyptian Ministry of Agriculture and the United States Agency for InternationalDevelopment (October).
Onyeji, S. C.: 1992,A Socioeconomic Analysis of Integrated Climate Change Impacts in Egypt, AReport Prepared for the United States Environmental Protection Agency, p. 45.
Parry, M. L., Blantran de Rozari, M., Chong, A. L., and Panich, S.: 1992,The Potential Socio-Economic Effects of Climate Change in Southeast Asia, United Nations Environment Programme,Nairobi, Kenya, p. 126.
Phillips, T.: 1994,A Summary Documentation of the AMIP Models, Report No. 18, PCMDI, LawrenceLivermore National Laboratory, Livermore CA, UCRL-ID-116384, p. 343.
Rosenzweig, C. and Parry, M.: 1993, ‘Potential Impacts of Climate Change on World Food Supply:A Summary of a Recent International Study’, in Kaiser, H. and Drennen, T. (eds.),AgriculturalDimensions of Global Climate Change, St. Lucie Press, FL, pp. 87–116.
Rosenzweig, C.: 1994,Personal Communication, International Institute for Applied Systems Analy-sis, Laxenburg, Austria.
Rosenzweig, C. and Hillel, D.: 1994,Egyptian Agriculture in the 21st Century, CP-94-12, IIASA,Laxenburg, Austria, p. 29.
Rosenzweig, C., Parry, M., and Fischer, G.: 1995, ‘World Food Supply’, in Strzepek, K. and Smith,J. (eds.),As Climate Changes: International Impacts and Implications, Cambridge UniversityPress, Cambridge, p. 27.
Said, R.: 1993,The River Nile: Geology, Hydrology and Utilization, Pergaman Press, Oxford, p. 320.Samuelson, P.: 1952, ‘Spatial Price Equilibrium and Linear Programming’,Amer. Econ. Rev.42,
283–303.Strzepek, K., Oneyji, C., Saleh, M., and Yates, D.: 1995, ‘An Assessment of Integrated Climate Change
Impacts on Egypt’, in Strzepek, K. and Smith, J. (eds.),As Climate Changes: International Impactsand Implications, Cambridge University Press, Cambridge, p. 180.
Strzepek, K. and Yates, D.: 1996, ‘Economic and Social Adaptations to Climate Change Impacts onWater Resources: A Case Study of Egypt’,Water Resour. Develop.12, 229–224.
Yates, D.: 1996,Integrating Water into an Economic Assessment of Climate Change Impacts on Egypt,WP-96-31, International Institute for Applied Systems Analysis, Laxenburg, Austria, p. 52.
Yates, D. and Strzepek, K.: 1996, ‘Modeling Economy-Wide Climate Change Impacts on Egypt: ACase for an Integrated Approach’,Environ. Model. Assess.1, 119–135.
Yates, D. and Strzepek, K.: 1997, ‘Modeling the Nile Basin under Climatic Change’,J. Hydrol.Engin., accepted for publication.
(Received 13 August 1996; in revised form 22 July 1997)