An Analysis of the United States of America International ...
58
An Analysis of the United States of America International Trade in Ornamental Fish PROJECT FlNAL REPORT University of Florida Submitted to University of Hawaii Prepared by Frank A. Chapman’, Sharon Fitz-Coy, Eric Thunberg 2 Jeffrey T. Rodrick 2 , Charles M. Adams 2 and Michel Andre 2 ‘Department of Fisheries and Aquatic Sciences ‘Food and Resource Economics Department University of Florida Phone: (904) 392-9617 FaxPhone: (904) 392-3462 AUGUST 1994
-
Upload
khangminh22 -
Category
Documents
-
view
3 -
download
0
Transcript of An Analysis of the United States of America International ...
An Analysis of the United States of AmericaInternational Trade in Ornamental Fish
PROJECT FlNAL REPORTUniversity of Florida
Submitted toUniversity of Hawaii
Prepared by
Frank A. Chapman’, Sharon Fitz-Coy,Eric Thunberg2 Jeffrey T. Rodrick2
,
Charles M. Adams2 and Michel Andre2
‘Department of Fisheries and Aquatic Sciences‘Food and Resource Economics Department
University of FloridaPhone: (904) 392-9617
FaxPhone: (904) 392-3462
AUGUST 1994
AN ANALYSIS OF THE UNITED STATES OF AMERICAINTERNATIONAL TRADE IN ORNAMENTAL FISH
Frank A. Chapman, Sharon Fitz-Coy,Eric Thunberg, Jeffrey T. Rodrick,
Charles M. Adams and Michel Andre
SYNOPSIS
Households in the United States of America, Canada, Europe, and Japan are the principal
keepers of ornamental fish in the world. Trade figures on the U.S.A. ornamental fish imports
and exports indicates that this industry is consistently expanding. As import and export numbers
and value of ornamental fish increase, the net trade deficit also continues to rise. Recently
released figures, indicate imports of ornamental fish into the U.S. totalled $45.2 million in 1993,
a 10% increase from 1992. Exports of ornamental fish totalled $17.3 million (5% higher than
the previous year) for a net trade deficit of $27.9 million. This latter value is approximately a
13.9% net trade deficit increase from 1992.
Most ornamental (aquarium) fish sold through the pet trade are farm-raised freshwater
species and imported from Southeast Asia. The second largest source of ornamental fish is South
America where most species are collected from the wild. Florida is considered the major
domestic source of farm-raised ornamental freshwater fishes.
Collection from the wild is the principal source of saltwater ornamental fishes. The
Philippines and Indonesia are the main exporters of marine omamentals. In the U.S. saltwater
ornamental fishes are primarily collected from the coastal waters of Florida and Hawaii.
Approximately 201 million fish valued at $44.7 million were declared as ornamental
(tropical) imports during the year 1992. Freshwaster fishes account for approximately 96% and
80%, respectively, of the total volume and value of U.S. ornamental fish imports. Although
marine fish have a high market value (20% of the declared value of the imports), the volume
of these fish in the trade appears to have stabilized at around 4 % .
Of 1,539 species declared as ornamental fish, only 32 species dominate the trade. These
are all of freshwater origin. The neon tetra and the guppy are the most popular ornamental fish
kept in U.S. households. However, as more species become available (or cultured) a greater
variety of species tend to penetrate the market. The average prices paid for imported ornamental
freshwater fishes were 45 cents (egg layers) and 22 cents (live bearers).
Patterns of import and export trade activities indicate that Los Angeles (39% of all trade
activity), Miami (22 %), New York (16%), Tampa (6 %), and Honolulu (6 % ) are the major ports
for distribution of ornamental fish in the United States of America.
Key words: ornamental fish, imports, exports, value
Partial financial support for this work was provided by the Center for Tropical and
Subtropical Aquaculture through a grant from the United States Department of Agriculture
(USDA grant # 91-38500-5899).

INTRODUCTION
Few studies and statistics exist to document the trade of the domestic or international
market for ornamental (aquarium) fish (Andrews 1990, Ramsey 1985, Hemley 1984, Conroy
1975). The United States of America, however, is considered the largest market for ornamental
fish in the world (Hemley 1984 and Conroy 1975). In 1993 the pet trade industry in the U.S.
was worth an estimated $3.6 billion (Pet Dealer 1993). In 1992, the largest number of animals
kept in American households were ornamental freshwater and marine fish
followed by cats and dogs (approx. 62 and 53 million, respectively). Of
(approx. 89 million),
the present estimated
54 million pet-owning households, growth in ownership of ornamental freshwater and marine
fish aquariums was the most impressive, from approximately 7 million households in 1988 to
10 million households in 1992 (Pet Business 1992; Pet Age 1992). The number of households
owning cats and dogs (35 million) has leveled off. The canine population declined from
approximately 54 million in 1990 to 53 million in 1992.
In this report trends in total import and export value of the U.S. trade of ornamental fish
are reported. The number and value of the ornamental fish species most commonly imported into
the U.S. are also examined.
The first part of the report details data sources and the problems in the data collection
process over the time period of analyses. Trends in import and export trade activities are then
discussed in two subsequent sections. A summary and inferences for future developments in the
U.S. trade in ornamental fish are offered in each section.
DATA SOURCES
The data in this report were obtained from two major sources: 1) Trade information of
U.S.A. import and export data compiled by the Bureau of the Census in the U.S. Department
of Commerce, available in microfiche copies or CD-ROM files in the University of Florida
library archives and 2) Analyzing the information recorded in the U.S. Fish and Wildlife Service
Form 3-177, “Declaration for Importation or Exportation of Fish or Wildlife”. The declaration
of shipments (Form 3-177) to U.S. Custom’s officials were obtained from the U.S. Department
of the Interior, Fish and Wildlife Service, Division of Law Enforcement, through a Freedom of
Information Act request.
Microfiche and CD-ROM files
The recording of import and export data for the United States has been, at least since
1982, the responsibility of the Bureau of the Census. These data are obtained from the
declarations of shipments (e.g. Form 3-177) recorded with U.S. Custom’s officials, as required
by law for nearly all overseas transfers (U.S. Department of Commerce). Prior to 1989, the
Bureau classified commodities and commodity groups using a 7-digit coding system. During this
period, however, no specific category was establish to represent the imports and exports of
ornamental fish. Rather, according to the Bureau, ornamental fish data were grouped in a more
general category: “fish or shellfish-live-other than for human consumption” (7-digit code:
0340094). Also included in this grouping were live trout, live carp, live eels, and live fish.
Based on data after 1989, when these other commodities were assigned separate codes, the
import and export value of these commodities were relatively small when compared to
ornamental fish. Therefore, while we cannot be certain of the actual numbers for ornamental fish
2
in the pre-1989 period, we can reasonably assume that imports and exports of ornamental fish
accounted for the majority of the totals for this grouping. All of the data for the period 1982-
1987 were obtained from microfiche copies of the monthly reports of imports and exports
distributed by the Bureau, found in the University of Florida library archives.
The year 1988 was one of transition for the Bureau as a new, more complete lo-digit
commodity coding system was being readied for use in the coming year. Using a modified 7-
digit system, ornamental fish data for this year, were placed in the extremely broad category:
“live animals- NSPF” (Code: 1009640). This grouping was apparently comprised of several
different species. Because of the impossibility of obtaining an accurate measure of ornamental
fish totals within this group, the data for 1988 was eliminated from our investigation.
In 1989 the Bureau employed the more detailed l0-digit coding system, with ornamental
fish data now being placed in a separate category: “fish-ornamental-live” (10-digit code:
0301100000) . Data for this period was obtained either directly from the Bureau (1989) or
downloaded from CD-ROM files kept at the University library (1990-1992).
Form 3-177
Specific fish species entries were obtained directly from the U.S. Fish and Wildlife
Service Form 3-177, “Declaration for importation or Exportation of Fish or Wildlife”. A copy
of one of the 3-177 forms is found in the Appendix. The declaration form 3-177 distinguishes
if the fish are for import or export, and identifies the exporter and importer agents; the port of
export and entry are also given. The form also identifies the quantity, scientific name, common
name, domestic value, and country of origin of the fish species being traded. Data declared in
a given shipment, however, was in many cases troublesome to interpret. The most difficulty was
3
---k
in identifying the fish being traded. The scientific names, traditional common names and regional
synonyms (for common names) were used to distinguish a particular fish species. Not all import
declaration forms indicated if the species were cultured or collected from the wild so it was not
possible to discern the culture origin of each species. Furthermore, the country of origin of the
shipments was not always known since transhipments were often common.
Included in the declaration forms were invertebrates such as shrimps, corals, sea urchins,
crabs and live rock. The total number and monetary value of these invertebrates were
significantly low and not included in the analyses.
The species entry forms (3-177) analyzed for this report included only those for the
month of October 1992. Ramsey (1985) conducted a similar study of ornamental fish imported
by the United States of America during October 1971. This month, therefore, provided a
comparison period for detecting major shifts in the trade after a 20 year period. Also, in terms
of fish numbers and monetary values of the shipments, October represents an average season
(Figure 3).
After the data collection process had been completed, monthly totals for each country and
fish species were manually recorded in table form. The data was subsequently grouped by
geographic regions (see Figure 1) to aid in determining the areas of the world most active in the
ornamental fish trade. Prices for individual fish were derived from shipping invoices attached
to each declaration of importation form. An overall average mean price and confidence limits
(at the 95% interval level) for a species were calculated from the mean value attributed to each
shipment box containing a given number fish. All data discussed in the text and tables represent
import and export values, and are given in terms of value (nominal US. dollars).
Figure 1 : Data Collectlon Regions
:igure 1. Geographical Data Collection Regions ’
U.S.A. ORNAMENTAL FISH IMPORTS
Value of Ornamental Fish Imports
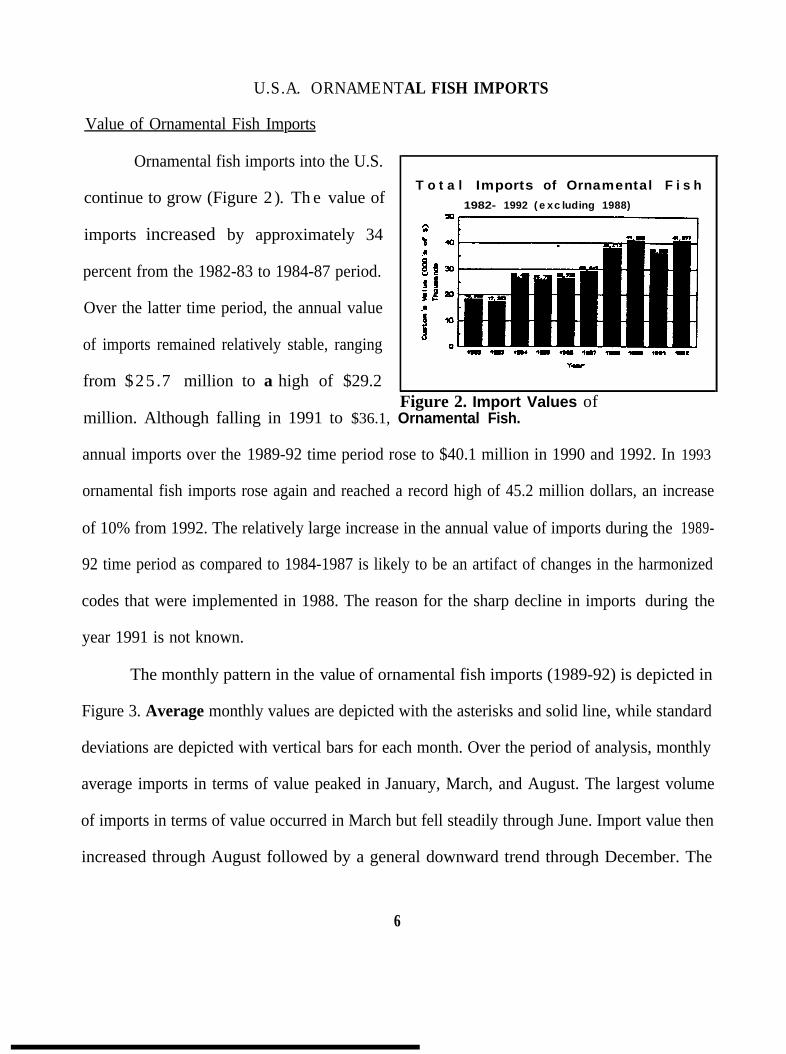
Ornamental fish imports into the U.S.
continue to grow (Figure 2). The value of
imports increased by approximately 34
percent from the 1982-83 to 1984-87 period.
Over the latter time period, the annual value
of imports remained relatively stable, ranging
from $25.7 million to a high of $29.2
T o t a l Imports of Ornamental F i s h1982- 1992 (excluding 1988)
Figure 2. Import Values ofmillion. Although falling in 1991 to $36.1, Ornamental Fish.
annual imports over the 1989-92 time period rose to $40.1 million in 1990 and 1992. In 1993
ornamental fish imports rose again and reached a record high of 45.2 million dollars, an increase
of 10% from 1992. The relatively large increase in the annual value of imports during the 1989-
92 time period as compared to 1984-1987 is likely to be an artifact of changes in the harmonized
codes that were implemented in 1988. The reason for the sharp decline in imports during the
year 1991 is not known.
The monthly pattern in the value of ornamental fish imports (1989-92) is depicted in
Figure 3. Average monthly values are depicted with the asterisks and solid line, while standard
deviations are depicted with vertical bars for each month. Over the period of analysis, monthly
average imports in terms of value peaked in January, March, and August. The largest volume
of imports in terms of value occurred in March but fell steadily through June. Import value then
increased through August followed by a general downward trend through December. The
6
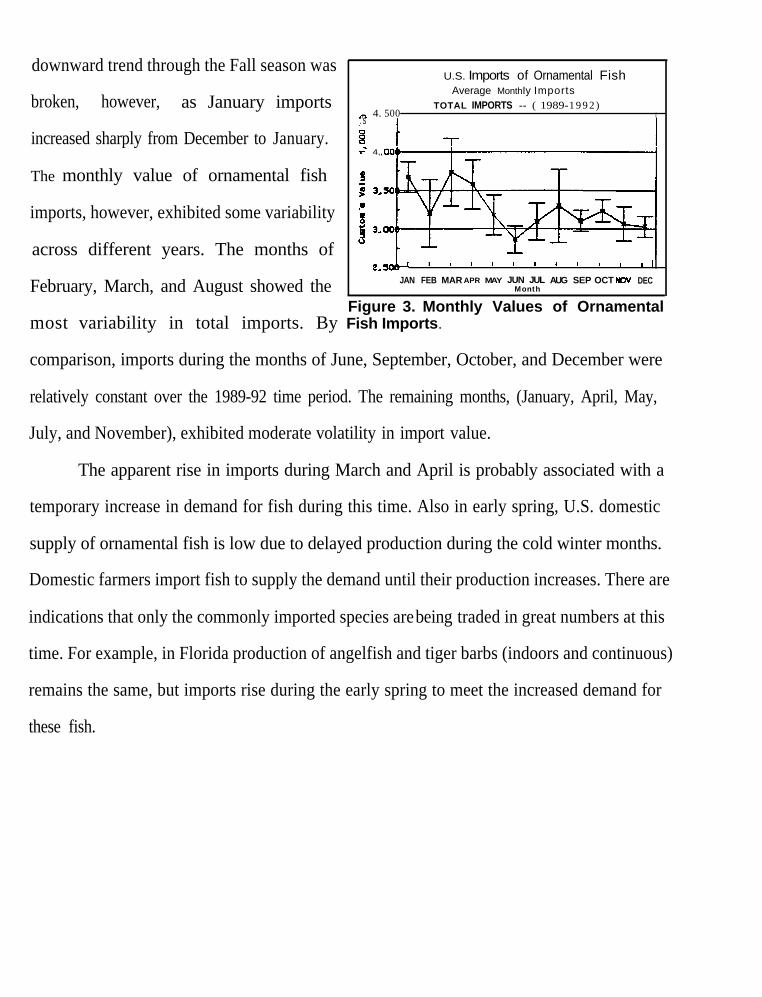
downward trend through the Fall season was
broken, however, as January imports
increased sharply from December to January.
The monthly value of ornamental fish
imports, however, exhibited some variability
across different years. The months of
February, March, and August showed the
U.S. Imports of Ornamental FishAverage MonthIy Imports
TOTAL IMPORTSS -- ( 1989-1 9 9 2 )4. 500 t:'s I
v- 4,
2,s0bL ’ ’ ’ ’ ’ ’ ’ ’ ’ ’ ‘JJAN FEB MAR APR MAY JUN JUL
MonthAUG SEP OCTNOVDEC
Figure 3. Monthly Values of Ornamentalmost variability in total imports. By Fish Imports.
comparison, imports during the months of June, September, October, and December were
relatively constant over the 1989-92 time period. The remaining months, (January, April, May,
July, and November), exhibited moderate volatility in import value.
The apparent rise in imports during March and April is probably associated with a
temporary increase in demand for fish during this time. Also in early spring, U.S. domestic
supply of ornamental fish is low due to delayed production during the cold winter months.
Domestic farmers import fish to supply the demand until their production increases. There are
indications that only the commonly imported species are being traded in great numbers at this
time. For example, in Florida production of angelfish and tiger barbs (indoors and continuous)
remains the same, but imports rise during the early spring to meet the increased demand for
these fish.
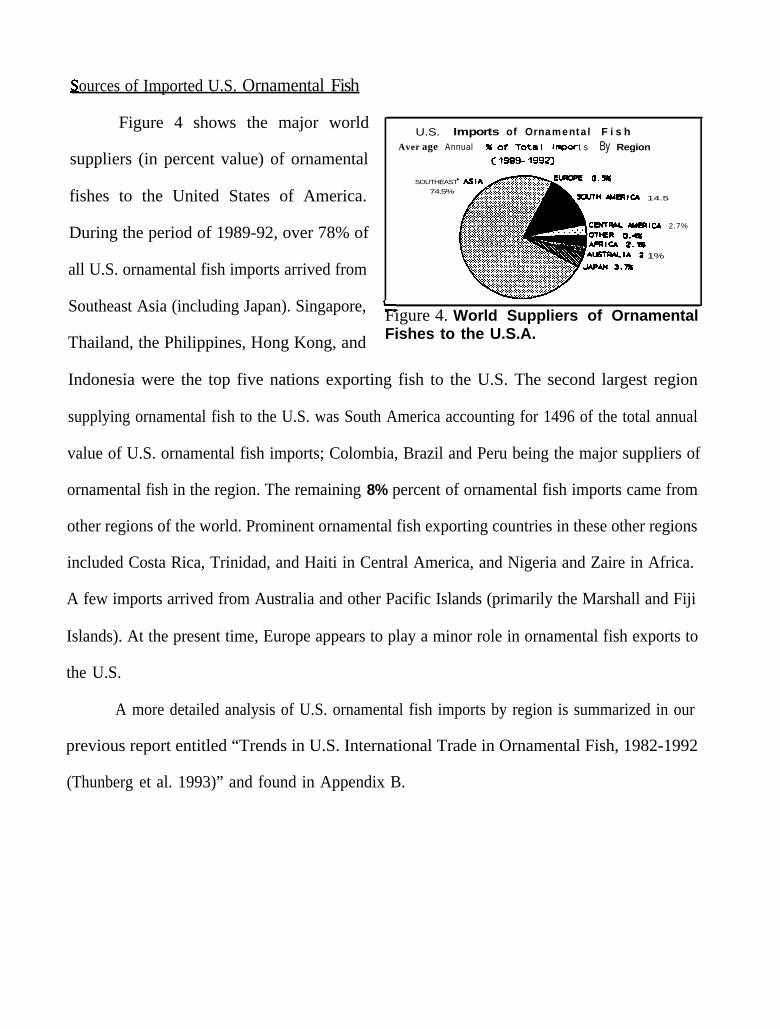
ources of Imported U.S. Ornamental Fish
Figure 4 shows the major world
suppliers (in percent value) of ornamental
fishes to the United States of America.
During the period of 1989-92, over 78% of
all U.S. ornamental fish imports arrived from
U.S. Imports of Ornamental F i s hAver age Annual t s By Region
SOUTHEAST74.5%
14.5
ICA 2.7%
1%
Southeast Asia (including Japan). Singapore, Figure 4. World Suppliers of Ornamental
Thailand, the Philippines, Hong Kong, and Fishes to the U.S.A.
Indonesia were the top five nations exporting fish to the U.S. The second largest region
supplying ornamental fish to the U.S. was South America accounting for 1496 of the total annual
value of U.S. ornamental fish imports; Colombia, Brazil and Peru being the major suppliers of
ornamental fish in the region. The remaining 8% percent of ornamental fish imports came from
other regions of the world. Prominent ornamental fish exporting countries in these other regions
included Costa Rica, Trinidad, and Haiti in Central America, and Nigeria and Zaire in Africa.
A few imports arrived from Australia and other Pacific Islands (primarily the Marshall and Fiji
Islands). At the present time, Europe appears to play a minor role in ornamental fish exports to
the U.S.
A more detailed analysis of U.S. ornamental fish imports by region is summarized in our
previous report entitled “Trends in U.S. International Trade in Ornamental Fish, 1982-1992
(Thunberg et al. 1993)” and found in Appendix B.
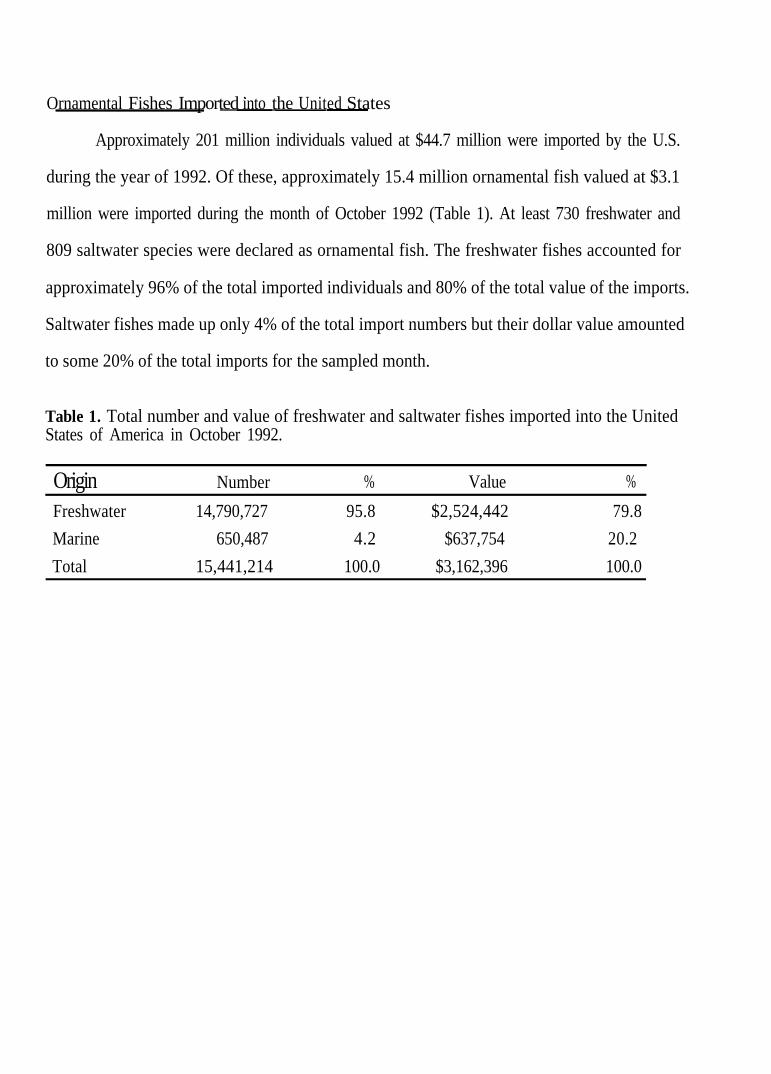
.Ornamental Fishes Imported into the United States
Approximately 201 million individuals valued at $44.7 million were imported by the U.S.
during the year of 1992. Of these, approximately 15.4 million ornamental fish valued at $3.1
million were imported during the month of October 1992 (Table 1). At least 730 freshwater and
809 saltwater species were declared as ornamental fish. The freshwater fishes accounted for
approximately 96% of the total imported individuals and 80% of the total value of the imports.
Saltwater fishes made up only 4% of the total import numbers but their dollar value amounted
to some 20% of the total imports for the sampled month.
Table 1. Total number and value of freshwater and saltwater fishes imported into the UnitedStates of America in October 1992.
Origin Number % Value %
Freshwater 14,790,727 95.8 $2,524,442 79.8Marine 650,487 4.2 $637,754 20.2Total 15,441,214 100.0 $3,162,396 100.0
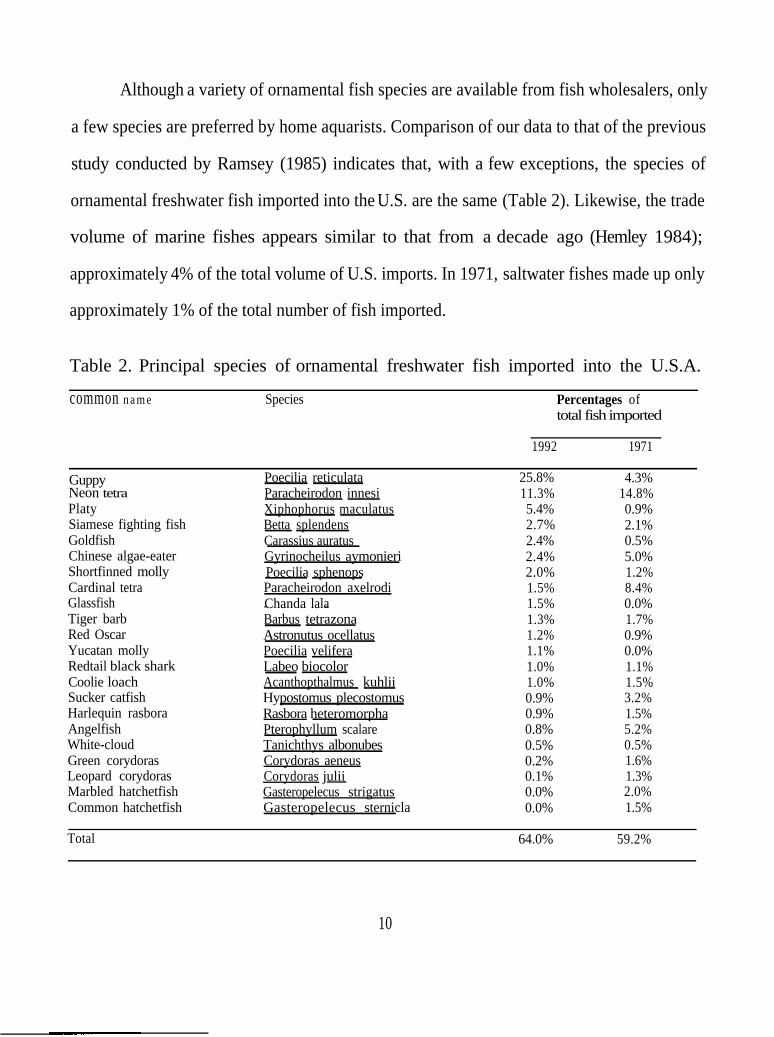
Although a variety of ornamental fish species are available from fish wholesalers, only
a few species are preferred by home aquarists. Comparison of our data to that of the previous
study conducted by Ramsey (1985) indicates that, with a few exceptions, the species of
ornamental freshwater fish imported into the U.S. are the same (Table 2). Likewise, the trade
volume of marine fishes appears similar to that from a decade ago (Hemley 1984);
approximately 4% of the total volume of U.S. imports. In 1971, saltwater fishes made up only
approximately 1% of the total number of fish imported.
Table 2. Principal species of ornamental freshwater fish imported into the U.S.A.
common n a m e Species Percentages oftotal fish imported
1992 1971
GuppyNeon tetraPlatySiamese fighting fishGoldfishChinese algae-eaterShortfinned mollyCardinal tetraGlassfishTiger barbRed OscarYucatan mollyRedtail black sharkCoolie loachSucker catfishHarlequin rasboraAngelfishWhite-cloudGreen corydorasLeopard corydorasMarbled hatchetfishCommon hatchetfish
reticulataPoeciliaParacheirodon innesiXiphophorus maculatusBetta splendensCarassius auratusGyrinocheilus aymonieriPoecilia sphenopsParacheirodon axelrodiChanda lala- -
tetrazonaBarbusAstronutus ocellatusPoecilia veliferaLabeo biocolorAcanthopthalmus kuhliiHypostomus plecostomusRasbora heteromorphaPterophyllum scalareTanichthys albonubesCorydoras aeneusCorydoras juliiGasteropelecus strigatusGasteropelecus sternicla
25.8% 4.3%11.3% 14.8%5.4% 0.9%2.7% 2.1%2.4% 0.5%2.4% 5.0%2.0% 1.2%1.5% 8.4%1.5% 0.0%1.3% 1.7%1.2% 0.9%1.1% 0.0%1.0% 1.1%1.0% 1.5%0.9% 3.2%0.9% 1.5%0.8% 5.2%0.5% 0.5%0.2% 1.6%0.1% 1.3%0.0% 2.0%0.0% 1.5%
Total 64.0% 59.2%
10
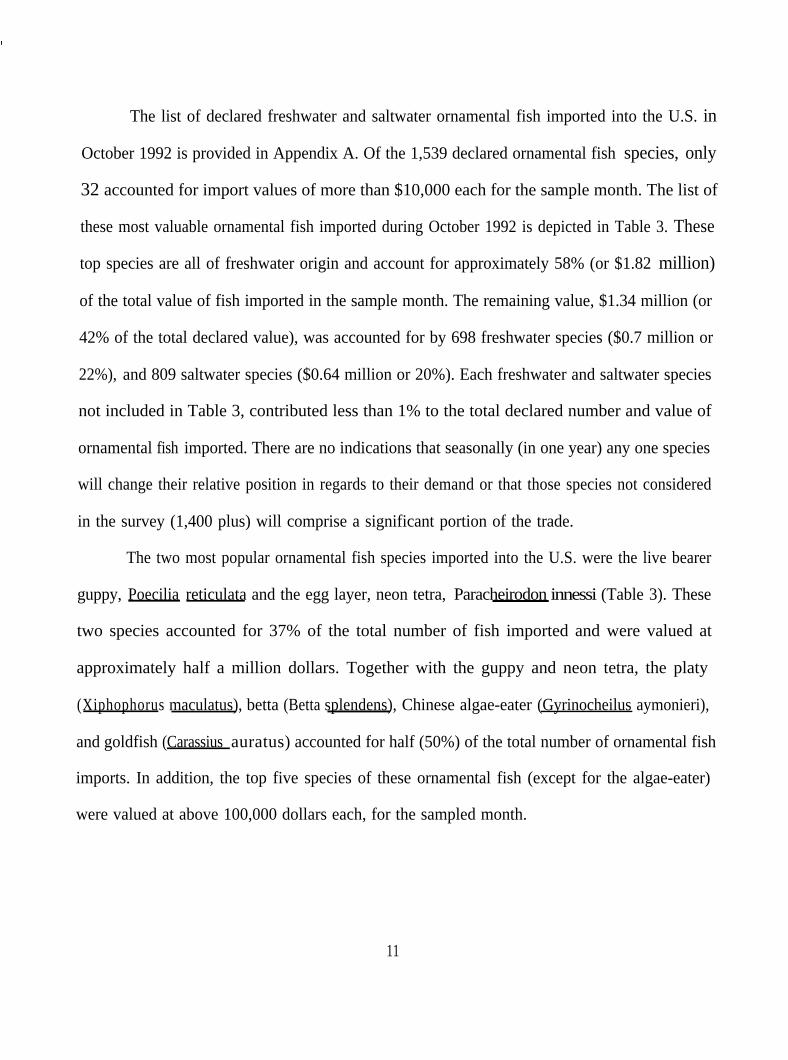
The list of declared freshwater and saltwater ornamental fish imported into the U.S. in
October 1992 is provided in Appendix A. Of the 1,539 declared ornamental fish species, only
32 accounted for import values of more than $10,000 each for the sample month. The list of
these most valuable ornamental fish imported during October 1992 is depicted in Table 3. These
top species are all of freshwater origin and account for approximately 58% (or $1.82 million)
of the total value of fish imported in the sample month. The remaining value, $1.34 million (or
42% of the total declared value), was accounted for by 698 freshwater species ($0.7 million or
22%), and 809 saltwater species ($0.64 million or 20%). Each freshwater and saltwater species
not included in Table 3, contributed less than 1% to the total declared number and value of
ornamental fish imported. There are no indications that seasonally (in one year) any one species
will change their relative position in regards to their demand or that those species not considered
in the survey (1,400 plus) will comprise a significant portion of the trade.
The two most popular ornamental fish species imported into the U.S. were the live bearer
guppy, Poecilia reticulata and the egg layer, neon tetra, Paracheirodon innessi (Table 3). These
two species accounted for 37% of the total number of fish imported and were valued at
approximately half a million dollars. Together with the guppy and neon tetra, the platy
(Xiphophorus maculatus), betta (Betta splendens), Chinese algae-eater (Gyrinocheilus aymonieri),
and goldfish (Carassius auratus) accounted for half (50%) of the total number of ornamental fish
imports. In addition, the top five species of these ornamental fish (except for the algae-eater)
were valued at above 100,000 dollars each, for the sampled month.
11
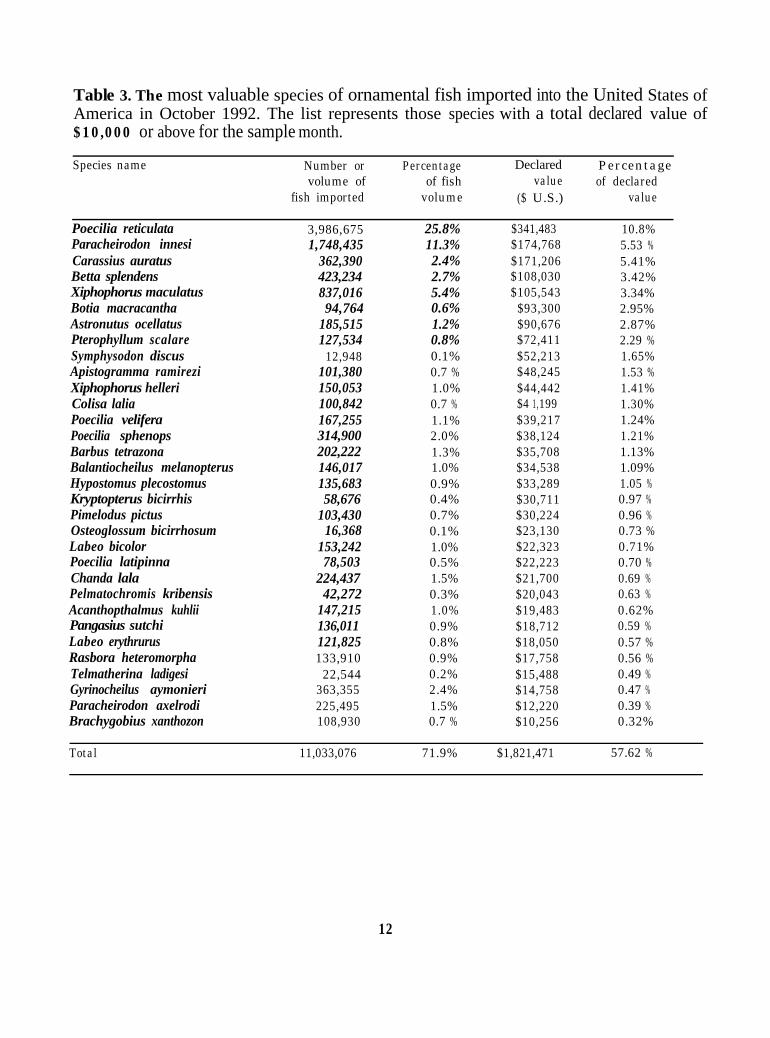
Table 3. The most valuable species of ornamental fish imported into the United States ofAmerica in October 1992. The list represents those species with a total declared value of$10,000 or above for the sample month.
Species name Number or Percentagevolume of of fish
fish imported volume
Declaredvalue
($ U.S.)
Percentage of declared
value
Poecilia reticulataParacheirodon innesiCarassius auratusBetta splendensXiphophorus maculatusBotia macracanthaAstronutus ocellatusPterophyllum scalareSymphysodon discusApistogramma ramireziXiphophorus helleriColisa laliaPoecilia veliferaPoecilia sphenopsBarbus tetrazonaBalantiocheilus melanopterusHypostomus plecostomusKryptopterus bicirrhisPimelodus pictusOsteoglossum bicirrhosumLabeo bicolorPoecilia latipinnaChanda lalaPelmatochromis kribensisAcanthopthalmus kuhliiPangasius sutchiLabeo erythrurusRasbora heteromorphaTelmatherina ladigesiGyrinocheilus aymonieriParacheirodon axelrodiBrachygobius xanthozon
3,986,675 25.8%1,748,435 11.3%
362,390 2.4%423,234 2.7%837,016 5.4%94,764 0.6%
185,515 1.2%127,534 0.8%
12,948 0.1%101,380 0.7 %150,053 1.0%100,842 0.7 %167,255 1.1%314,900 2.0%202,222 1.3%146,017 1.0%135,683 0.9%58,676 0.4%
103,430 0.7%16,368 0.1%
153,242 1.0%78,503 0.5%
224,437 1.5%42,272 0.3%
147,215 1.0%136,011 0.9%121,825 0.8%
133,910 0.9%22,544 0.2%
363,355 2.4%225,495 1.5%108,930 0.7 %
Total 11,033,076 71.9% $1,821,471 57.62 %
$341,483$174,768$171,206$108,030$105,543
$93,300$90,676$72,411$52,213$48,245$44,442$4 1,199$39,217$38,124$35,708$34,538$33,289$30,711$30,224$23,130$22,323$22,223$21,700$20,043$19,483$18,712$18,050$17,758$15,488$14,758$12,220$10,256
10.8%5.53 %5.41%3.42%3.34%2.95%2.87%2.29 %1.65%1.53 %1.41%1.30%1.24%1.21%1.13%1.09%1.05 %0.97 %0.96 %0.73 %0.71%0.70 %0.69 %0.63 %0.62%0.59 %0.57 %0.56 %0.49 %0.47 %0.39 %0.32%
12
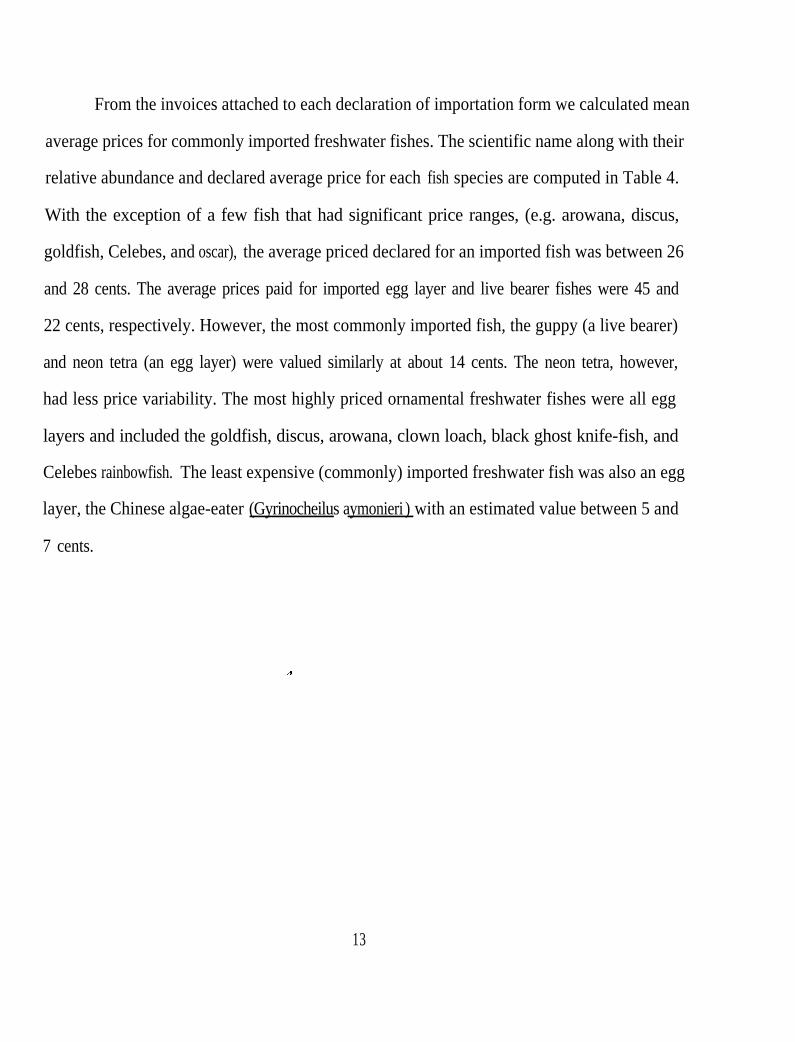
From the invoices attached to each declaration of importation form we calculated mean
average prices for commonly imported freshwater fishes. The scientific name along with their
relative abundance and declared average price for each fish species are computed in Table 4.
With the exception of a few fish that had significant price ranges, (e.g. arowana, discus,
goldfish, Celebes, and oscar), the average priced declared for an imported fish was between 26
and 28 cents. The average prices paid for imported egg layer and live bearer fishes were 45 and
22 cents, respectively. However, the most commonly imported fish, the guppy (a live bearer)
and neon tetra (an egg layer) were valued similarly at about 14 cents. The neon tetra, however,
had less price variability. The most highly priced ornamental freshwater fishes were all egg
layers and included the goldfish, discus, arowana, clown loach, black ghost knife-fish, and
Celebes rainbowfish. The least expensive (commonly) imported freshwater fish was also an egg
layer, the Chinese algae-eater (Gyrinocheilus aymonieri ) with an estimated value between 5 and
7 cents.
13
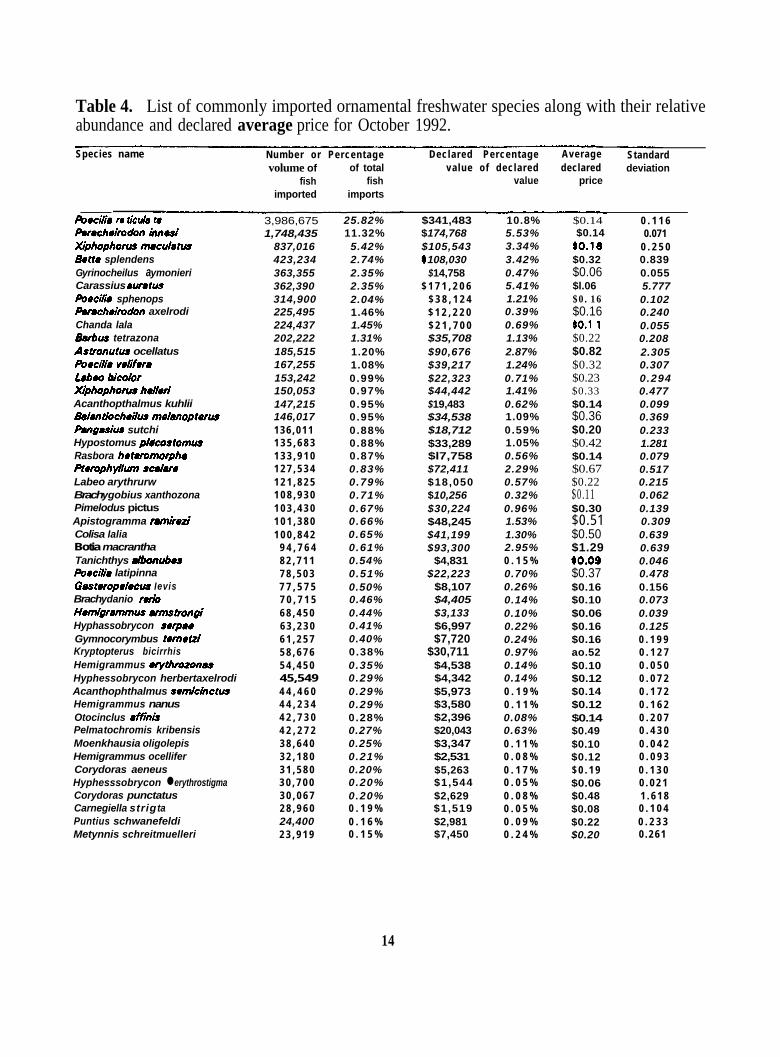
Table 4. List of commonly imported ornamental freshwater species along with their relativeabundance and declared average price for October 1992.Species name Number or Percentage
volume of of totalfish fish
imported imports
Declared Percentage Averagevalue of declared declared
value price
Standarddeviation
hedie ra tied8 taPar8chak?o&n hnasiXiphaphorw macu&w8atta splendensG yrinocheilus a ymonieriCarassius 8ur8tusPbacriia sphenopsAsrochatmdbn axelrodiChanda lala0arbw tetrazonaAstronulw ocellatusPoaci~ie vafifaraLabw bicokarXi@ophorw haHariAcanthopthalmus kuhliiBaIantiochat7w WanoptarwPWgasiw sutchiHypostomus pt#costomwRasbora hatamtmrphaPtarophyllcun scahuaLabeo arythrurwBrachygobius xanthozonaPimelodus pictusApistogramma ranu~aziColisa IaliaBotia macranthaTanichthys &onubas*aciTe latipinnaGastaropalacw IevisBrachydanio ra&Ham&ammw umslrongiHyphassobrycon sarpaoGymnocorymbus tame&iKryptop terus bicirrhisHemigrammus uythrvzonatHyphessobrycon herbertaxelrodiAcanthophthalmus sarnicinctwHemigrammus nanusOtocinclus 8iW&Pelma tochromis kribensisMoenkhausia oligolepisHemigrammus ocelliferCorydoras aeneusHyphesssobryconn lerythrostigmaCorydoras punctatusCarnegiella strig taPuntius schwanefeldiMetynnis schreitmuelleri
3,986,675 25.82%1,748,435 11.32%
837,016 5.42%423,234 2.74%363,355 2.35%362,390 2.35%314,900 2.04%225,495 1.46%224,437 1.45%202,222 1.31%185,515 1.20%167,255 1.08%153,242 0.99%150,053 0.97%147,215 0.95%146,017 0.95%1 3 6 , 0 1 1 0.88%1 3 5 , 6 8 3 0.88%1 3 3 , 9 1 0 0.87%1 2 7 , 5 3 4 0.83%1 2 1 , 8 2 5 0.79%1 0 8 , 9 3 0 0.71%1 0 3 , 4 3 0 0.67%1 0 1 , 3 8 0 0.66%1 0 0 , 8 4 2 0.65%
9 4 , 7 6 4 0.61%8 2 , 7 1 1 0.54%7 8 , 5 0 3 0.51%7 7 , 5 7 5 0.50%7 0 , 7 1 5 0.46%6 8 , 4 5 0 0.44%6 3 , 2 3 0 0.41%6 1 , 2 5 7 0.40%5 8 , 6 7 6 0.38%5 4 , 4 5 0 0.35%45,549 0.29%4 4 , 4 6 0 0.29%4 4 , 2 3 4 0.29%4 2 , 7 3 0 0.28%4 2 , 2 7 2 0.27%3 8 , 6 4 0 0.25%3 2 , 1 8 0 0.21%3 1 , 5 8 0 0.20%3 0 , 7 0 0 0.20%3 0 , 0 6 7 0.20%2 8 , 9 6 0 0 . 1 9 %24,400 0 . 1 6 %2 3 , 9 1 9 0 . 1 5 %
$341,483$174,768$105,543 108,030
$14,758$ 1 7 1 , 2 0 6
$ 3 8 , 1 2 4$ 1 2 , 2 2 0$ 2 1 , 7 0 0$35,708$90,676$39,217$22,323$44,442$19,483$34,538$18,712$33,289$l7,758$72,411$18,050$10,256$30,224$48,245$41,199$93,300
$4,831$22,223
$8,107$4,405$3,133$6,997$7,720
$30,711$4,538$4,342$5,973$3,580$2,396$20,043$3,347$2,531$5,263$1,544$2,629$1,519$2,981$7,450
10.8%5.53%3.34%3.42%0.47%5.41%1.21%0.39%0.69%1.13%2.87%1.24%0.71%1.41%0.62%1.09%0.59%1.05%0.56%2.29%0.57%0.32%0.96%1.53%1.30%2.95%0 . 1 5 %0.70%0.26%0.14%0.10%0.22%0.24%0.97%0.14%0.14%0 . 1 9 %0 . 1 1 %0.08%0.63%0 . 1 1 %0 . 0 8 %0 . 1 7 %0 . 0 5 %0 . 0 8 %0 . 0 5 %0 . 0 9 %0 . 2 4 %
$0.14 0 . 1 1 6$0.14 0.071a0.16 0 . 2 5 0$0.32 0.839$0.06 0.055$l.06 5.777$0.16 0.102$0.16 0.240to.1 i 0.055$0.22 0.208$0.82 2.305$0.32 0.307$0.23 0.294$0.33 0.477$0.14 0.099$0.36 0.369$0.20 0.233$0.42 1.281$0.14 0.079$0.67 0.517$0.22 0.215$0.11 0.062$0.30 0.139$ 0 . 5 1 0.309$0.50 0.639$1.29 0.639ao.09 0.046$0.37 0.478$0.16 0.156$0.10 0.073$0.06 0.039$0.16 0.125$0.16 0 . 1 9 9ao.52 0 . 1 2 7$0.10 0 . 0 5 0$0.12 0 . 0 7 2$0.14 0 . 1 7 2$0.12 0 . 1 6 2$0.14 0 . 2 0 7$0.49 0 . 4 3 0$0.10 0 . 0 4 2$0.12 0 . 0 9 3$ 0 . 1 9 0 . 1 3 0$0.06 0 . 0 2 1$0.48 1 . 6 1 8$0.08 0 . 1 0 4$0.22 0 . 2 3 3$0.20 0 . 2 6 1
14

Table 4 (continued). List of commonly imported ornamental freshwater species along with theirrelative abundance and declared average price for October 1992.
Hyphessobrycon fl-us 20,465Corydorss pa/es&s 22,097Corydoras metae 16,640OsteogIossum bicirhosum 1 6 , 3 6 8Morulius chrysopheksdhn 14,568Cotydotas j&i 14,425Punttius nigfo fescis tus 14,280738 ye& ob fiqu8 14,215
Symph ysodon o’iscus 12,948Helostom~ tenwn/‘nckfi 12,870Corydotu 8gsssriri’ 1 1 , 7 2 0Cypnhus csrpio 7 , 7 2 0
Mim8goni8 tes micro/epis 7 , 2 0 0Corydoras degans 6 , 7 0 0Toxo tes j8CUl8 tot 6 , 5 5 8Chibdus punctitus 6 , 4 6 2Sternwchus 8Jbifons 5,971&8/r wti yncus k8JJop terus 5 , 9 4 5Nsnnostomus m8tgin8tus 5 , 8 0 0Bunocephslw cot8coidew 5 , 5 1 7Hyphessobrycon pulchn;oPri3 5 , 3 7 0Hoplosternurn thOr8CStum 5 , 1 1 0Copein 8tnoidi 4 , 8 0 0Puntius conchonius 4 , 7 6 3Gwph8gus jutup8ri 4 , 2 0 7Nannostomus hw&oni 3 , 4 6 5Metynnlj meculstus 3 , 3 9 5Sphserich th ys osphronemoides 2 , 8 9 0Gssteropelecus s ternicJ8 2 , 6 6 080 ti8 sidthimunki 2 , 5 5 0N8nn8C8r8 8nOm818 1,700Lerbc8ssti sr’emensis 1,528Hemhdus semitaeniatus 220Aequidens pottdegtensk 100
0 . 1 5 %0 . 1 3 %0 . 1 3 %0 . 1 1 %0 . 1 1 %0 . 0 9 %0 . 0 9 %0 . 0 9 %0 . 0 9 %0 . 0 8 %0 . 0 8 %0 . 0 8 %0 . 0 5 %0 . 0 5 %0 . 0 4 %0 . 0 4 %0 . 0 4 %0 . 0 4 %0 . 0 4 %0 . 0 4 %0 . 0 4 %0 . 0 3 %0 . 0 3 %0 . 0 3 %0 . 0 3 %0 . 0 3 %0 . 0 2 %0 . 0 2 %0 . 0 2 %0 . 0 2 %0 . 0 2 %0 . 0 1 %0 . 0 1 %0 . 0 0 %0 . 0 0 %
$ 1 5 , 4 8 8$ 1 , 5 9 6$ 5 , 2 4 3$ 2 , 5 3 9
$ 2 3 , 1 3 0$ 2 , 8 1 5$ 1 , 3 7 5$ 3 , 5 0 1$ 2 , 0 7 0
$ 5 2 , 2 1 3$ 2 , 9 6 9$ 1 , 6 3 3$ 4 , 8 7 5
$ 3 6 9$ 4 4 0
$ 2 , 4 3 9$ 3 , 0 3 5$ 6 , 6 7 2$ 1 , 5 3 7
$ 9 5$ 1 , 1 5 7
$ 6 5 7$ 2 , 2 9 4
$ 2 1 0$ 1 , 3 9 8$ 1 , 7 4 6
$ 2 6 0$ 1 , 4 7 1
$ 7 5 8$ 1 3 3
$ 1 , 5 3 0$ 1 1 6$ 4 7 5
$ 2 7$ 2 5
0 . 0 5 %0 . 1 7 %0 . 0 8 %0 . 7 3 %0 . 0 9 %0 . 0 4 %0 . 1 1 %0 . 0 7 %1 . 6 5 %0.09 %0 . 0 5 %0 . 1 5 %0 . 0 1 %0 . 0 1 %0 . 0 8 %0 . 1 0 %0 . 2 1 %0 . 0 5 %0 . 0 0 %0 . 0 4 %0 . 0 2 %0 . 0 7 %0 . 0 1 %0.04%0.06%0.01%0 . 0 5 %0 . 0 2 %0 . 0 0 %0 . 0 5 %0 . 0 0 %0 . 0 2 %0 . 0 0 %0 . 0 0 %
$ 1 . 0 4$ 0 . 0 9$ 0.31$ 0 . 1 7$ 7 . 2 3$ 0 . 2 1$ 0 . 1 5$ 0 . 2 7$ 0 . 1 6$ 4 . 4 2$ 0 . 4 4$ 0 . 1 9$ 0 . 6 7$ 0 . 0 6$ 0 . 0 8$0.41$ 0 . 4 2$ 1 . 4 8$ 0 . 2 8$ 0 . 0 2$ 0 . 4 2$ 0 . 1 3$ 0 . 4 8$ 0 . 0 5$ 0 . 3 3$ 0 . 5 5$ 0 . 1 3$ 0 . 7 3$ 0 . 2 7$ 0 . 0 5$ 0 . 6 0$ 0 . 1 8$ 0 . 4 1$0.12$ 0 . 2 5
4 . 3 0 60 . 0 5 20 . 1 8 30 . 0 7 44 . 7 8 90 . 1 3 90 . 2 0 30 . 2 0 60 . 0 6 62 . 2 5 21 . 3 1 30 . 2 4 10 . 5 8 20 . 0 0 60 . 0 8 40 . 1 5 90 . 6 1 20 . 7 1 90 . 1 5 30 . 0 1 20 . 1 6 80 . 0 5 40 . 4 6 40 . 0 0 70 . 1 9 20 . 4 3 30 . 1 3 10 . 8 5 40 . 0 6 5
n.a.
O.ii?0 . 6 0 70 . 0 2 2
n.8.
Subtotal 12,169,687 7 8 . 8 % $1,960,215 6 2 . 0 0 %
Other (647) freshwater specie8 2,621,040Saltwater (809) speciee 6 5 0 , 4 8 7
1 7 . 0 %4 . 2 %
$ 5 6 4 , 4 2 7$ 6 3 7 , 7 5 4
1 7 . 8 0 %2 0 . 2 0 %
Total 15,441,214 100.00% $3,162,396 100.00%
n.a. = Seme price declared for all shipments or not available.
15
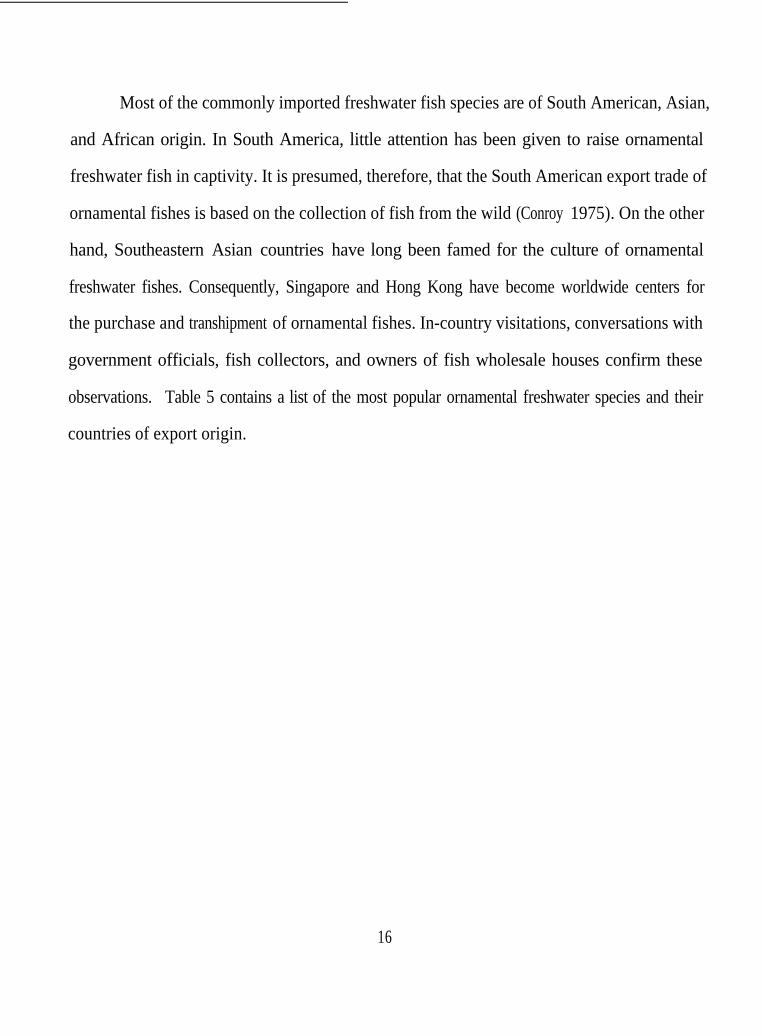
Most of the commonly imported freshwater fish species are of South American, Asian,
and African origin. In South America, little attention has been given to raise ornamental
freshwater fish in captivity. It is presumed, therefore, that the South American export trade of
ornamental fishes is based on the collection of fish from the wild (Conroy 1975). On the other
hand, Southeastern Asian countries have long been famed for the culture of ornamental
freshwater fishes. Consequently, Singapore and Hong Kong have become worldwide centers for
the purchase and transhipment of ornamental fishes. In-country visitations, conversations with
government officials, fish collectors, and owners of fish wholesale houses confirm these
observations. Table 5 contains a list of the most popular ornamental freshwater species and their
countries of export origin.
16
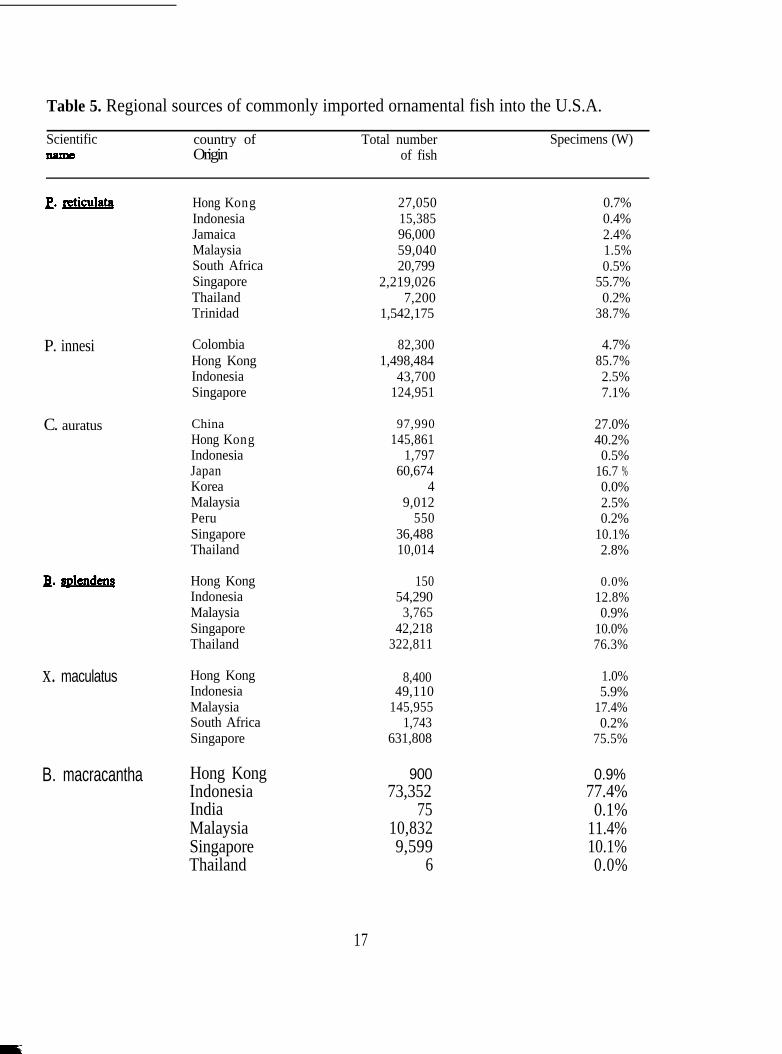
Table 5. Regional sources of commonly imported ornamental fish into the U.S.A.
Scientific country of Total numberOrigin of fish
Specimens (W)
Hong Kong 27,050 0.7%Indonesia 15,385 0.4%Jamaica 96,000 2.4%Malaysia 59,040 1.5%South Africa 20,799 0.5%Singapore 2,219,026 55.7%Thailand 7,200 0.2%Trinidad 1,542,175 38.7%
P. innesi
C. auratus
x. maculatus
Colombia 82,300 4.7%Hong Kong 1,498,484 85.7%Indonesia 43,700 2.5%Singapore 124,951 7.1%
China 97,990 27.0%Hong Kong 145,861 40.2%Indonesia 1,797 0.5%Japan 60,674 16.7 %Korea 4 0.0%Malaysia 9,012 2.5%Peru 550 0.2%Singapore 36,488 10.1%Thailand 10,014 2.8%
Hong Kong 150 0.0%Indonesia 54,290 12.8%Malaysia 3,765 0.9%Singapore 42,218 10.0%Thailand 322,811 76.3%
Hong KongIndonesiaMalaysiaSouth AfricaSingapore
B. macracantha Hong Kong 900 0.9%Indonesia 73,352 77.4%India 75 0.1%Malaysia 10,832 11.4%Singapore 9,599 10.1%Thailand 6 0.0%
8,40049,110
145,9551,743
631,808
1.0%5.9%
17.4%0.2%
75.5%
17
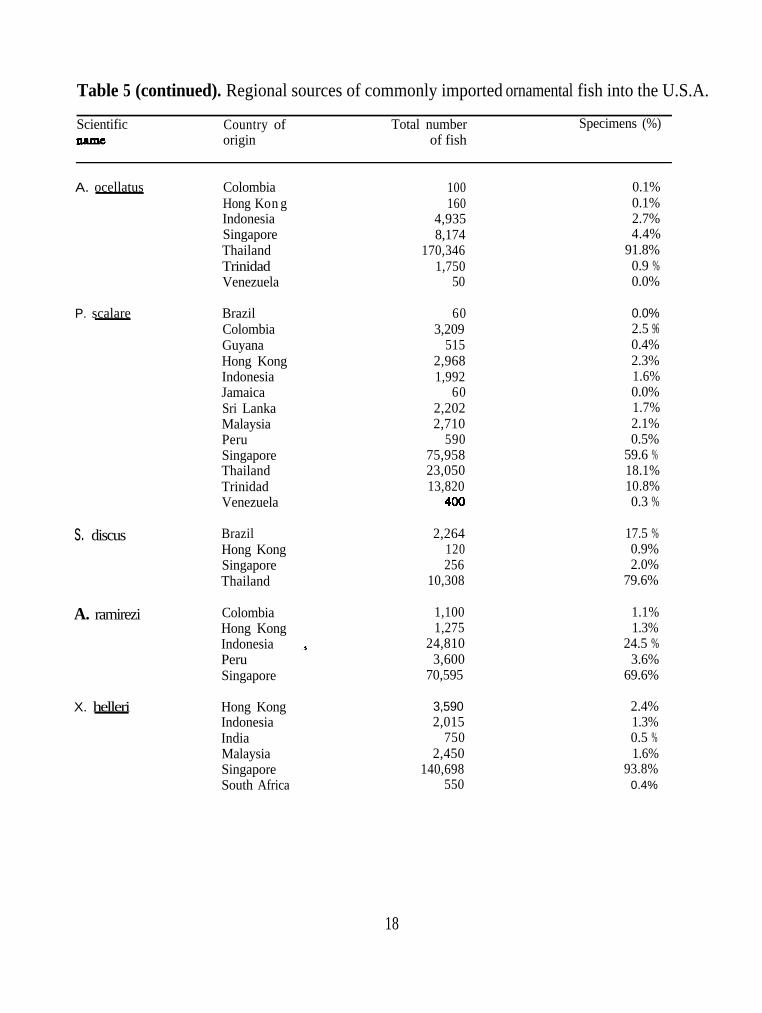
Table 5 (continued). Regional sources of commonly imported ornamental fish into the U.S.A.
Scientific Country of Total numberorigin of fish
Specimens (%)
A. ocellatus Colombia 100 0.1%Hong Kong 160 0.1%Indonesia 4,935 2.7%Singapore 8,174 4.4%Thailand 170,346 91.8%Trinidad 1,750 0.9 %Venezuela 50 0.0%
P. scalare
s. discus
A. ramirezi
X. helleri
BrazilColombiaGuyanaHong KongIndonesiaJamaicaSri LankaMalaysiaPeruSingaporeThailandTrinidadVenezuela
Brazil 2,264 17.5 %Hong Kong 120 0.9%Singapore 256 2.0%Thailand 10,308 79.6%
ColombiaHong KongIndonesiaPeru Singapore
Hong Kong 3,590 2.4%Indonesia 2,015 1.3%India 750 0.5 %Malaysia 2,450 1.6%Singapore 140,698 93.8%South Africa 550 0.4%
603,209
5152,9681,992
602,2022,710
59075,95823,05013,820
1,100 1.1%1,275 1.3%
24,810 24.5 %3,600 3.6%
70,595 69.6%
0.0%2.5 960.4%2.3%1.6%0.0%1.7%2.1%0.5%
59.6 %18.1%10.8%0.3 %
18
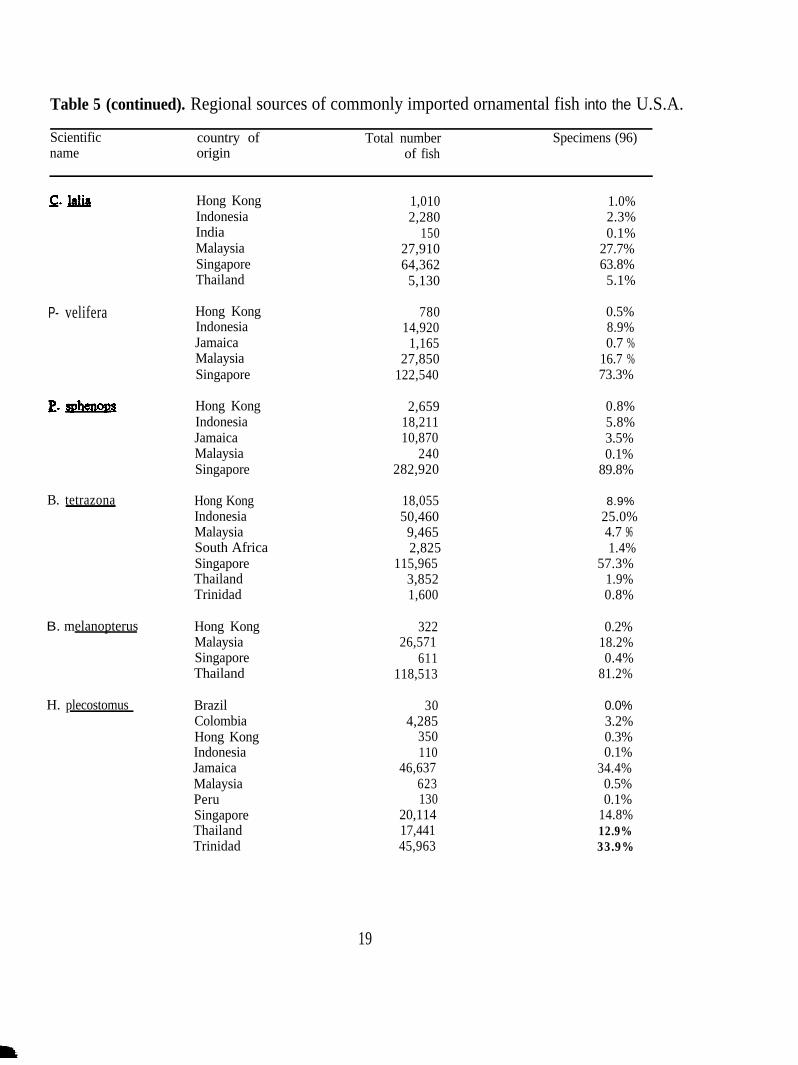
Table 5 (continued). Regional sources of commonly imported ornamental fish into the U.S.A.
Scientificname
country oforigin
Total numberof fish
Specimens (96)
Hong Kong 1,010 1.0%Indonesia 2,280 2.3%India 150 0.1%Malaysia 27,910 27.7%Singapore 64,362 63.8%Thailand 5,130 5.1%
P- velifera Hong KongIndonesiaJamaicaMalaysiaSingapore
Hong KongIndonesiaJamaicaMalaysiaSingapore
B. tetrazona Hong Kong 18,055 8.9%Indonesia 50,460 25.0%Malaysia 9,465 4.7 96South Africa 2,825 1.4%Singapore 115,965 57.3%Thailand 3,852 1.9%Trinidad 1,600 0.8%
B. melanopterus Hong KongMalaysiaSingaporeThailand
H. plecostomus Brazil 30 0.0%Colombia 4,285 3.2%Hong Kong 350 0.3%Indonesia 110 0.1%Jamaica 46,637 34.4%Malaysia 623 0.5%Peru 130 0.1%Singapore 20,114 14.8%Thailand 17,441 12.9%Trinidad 45,963 33.9%
780 0.5%14,920 8.9%
1,165 0.7 %27,850 16.7 %
122,540 73.3%
2,659 0.8%18,211 5.8%10,870 3.5%
240 0.1%282,920 89.8%
32226,571
611118,513
0.2%18.2%0.4%
81.2%
19
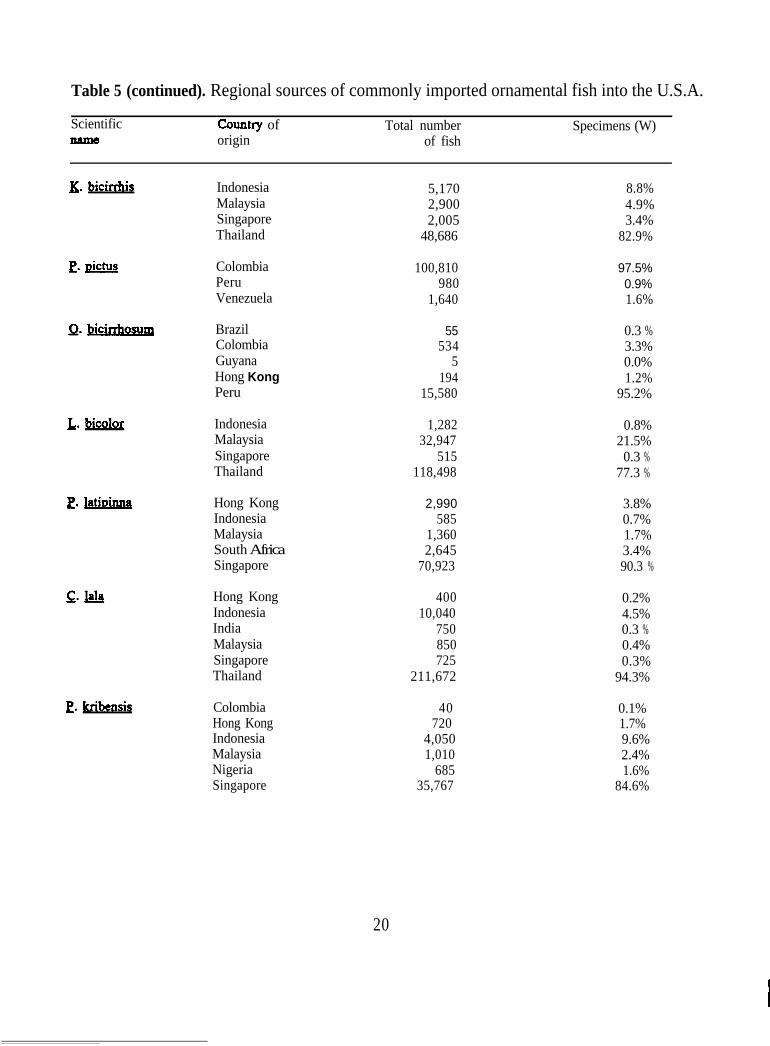
Table 5 (continued). Regional sources of commonly imported ornamental fish into the U.S.A.
Scientific chlntly of Total numberorigin of fish
Specimens (W)
g. bicirrhiq Indonesia 5,170 8.8%Malaysia 2,900 4.9%Singapore 2,005 3.4%Thailand 48,686 82.9%
p. g&g
p. m
L. bicolot*
2. Jatioinllq
2. kribensi.q
Colombia 100,810 97.5%Peru 980 0.9%Venezuela 1,640 1.6%
Brazil 55Colombia 534Guyana 5Hong Kong 194Peru 15,580
Indonesia 1,282 0.8%Malaysia 32,947 21.5%Singapore 515 0.3 %Thailand 118,498 77.3 %
Hong Kong 2,990 3.8%Indonesia 585 0.7%Malaysia 1,360 1.7%South Africa 2,645 3.4%Singapore 70,923 90.3 %
Hong KongIndonesiaIndiaMalaysiaSingaporeThailand
Colombia 40 0.1%Hong Kong 720 1.7%Indonesia 4,050 9.6%Malaysia 1,010 2.4%Nigeria 685 1.6%Singapore 35,767 84.6%
40010,040
750850725
211,672
0.3 %3.3%0.0%1.2%
95.2%
0.2%4.5%0.3 %0.4%0.3%
94.3%
20
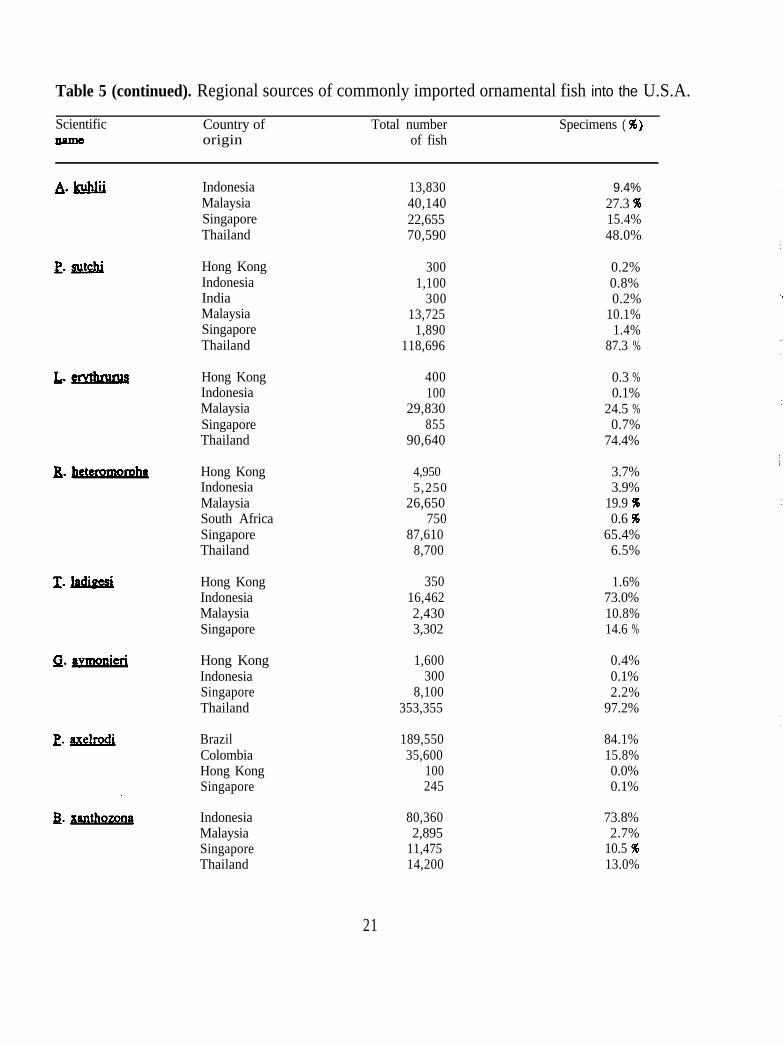
Table 5 (continued). Regional sources of commonly imported ornamental fish into the U.S.A.
Scientific Country oforigin
Total numberof fish
Specimens ( W)
Indonesia 13,830Malaysia 40,140Singapore 22,655Thailand 70,590
Hong KongIndonesiaIndiaMalaysiaSingaporeThailand
300 0.2%1,100 0.8%
300 0.2%13,725 10.1%
1,890 1.4%118,696 87.3 %
Hong Kong 400Indonesia 100Malaysia 29,830Singapore 855Thailand 90,640
Hong Kong 4,950Indonesia 5,250Malaysia 26,650South Africa 750Singapore 87,610Thailand 8,700
Hong Kong 350Indonesia 16,462Malaysia 2,430Singapore 3,302
Hong Kong 1,600Indonesia 300Singapore 8,100Thailand 353,355
Brazil 189,550Colombia 35,600Hong Kong 100Singapore 245
Indonesia 80,360Malaysia 2,895Singapore 11,475Thailand 14,200
9.4%27.3 9615.4%48.0%
0.3 %0.1%
24.5 %0.7%
74.4%
3.7%3.9%
19.9 960.6 96
65.4%6.5%
1.6%73.0%10.8%14.6 %
0.4%0.1%2.2%
97.2%
84.1%15.8%0.0%0.1%
73.8%2.7%
10.5 9613.0%
21
The most commonly imported saltwater fish include a list of approximately 809 species
which belong to a varied list of families. Saltwater ornamental fish species with high monetary
value were principally imported from the Philippines (44.1%), Indonesia (25.5 W), and the
Marshall Islands (6.2%). Nigeria (3.7%) and Costa Rica (3.6%) were the largest exporters of
highly prized marine fish in Africa and Latin America, respectively. Other valuable marine
species were imported from Sri Lanka (3.2%) and Australia (2.6%). Due to the great variability
in individual prices, average prices for marine fish were not estimated.
To our knowledge, little is known on the culture of marine ornamental fishes.
Conversations with government officials, fish collectors, and owners of fish wholesale houses
indicate that ornamental saltwater fishes are collected, almost exclusively, from the wild.
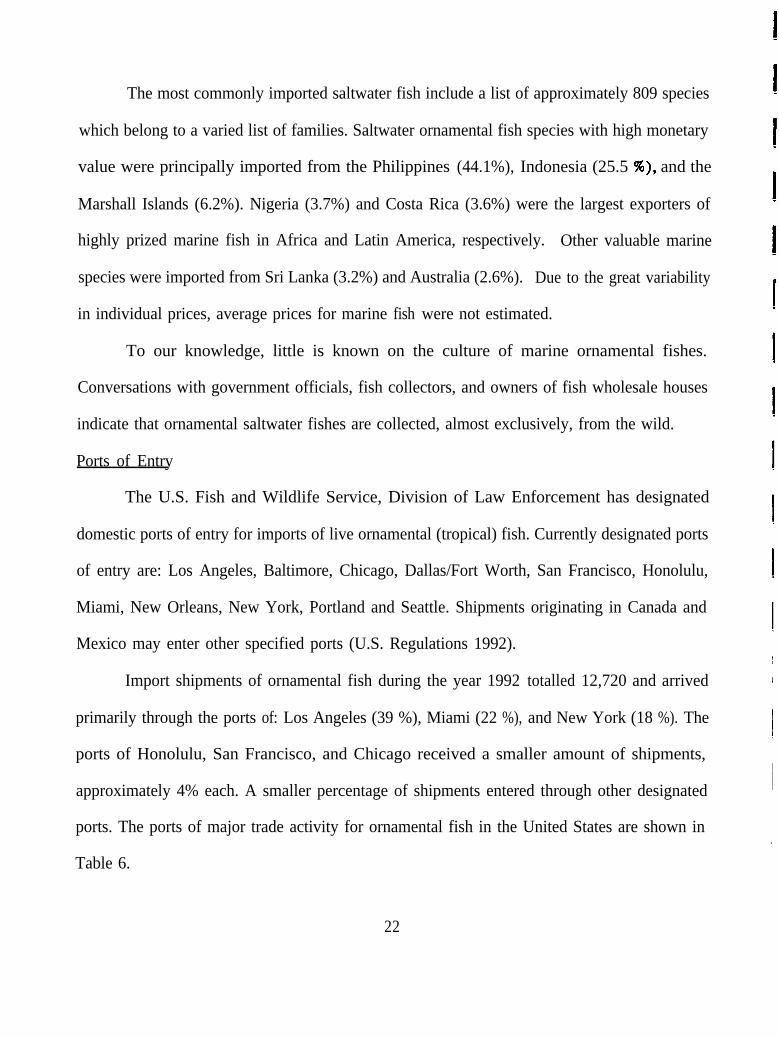
Ports of Entry
The U.S. Fish and Wildlife Service, Division of Law Enforcement has designated
domestic ports of entry for imports of live ornamental (tropical) fish. Currently designated ports
of entry are: Los Angeles, Baltimore, Chicago, Dallas/Fort Worth, San Francisco, Honolulu,
Miami, New Orleans, New York, Portland and Seattle. Shipments originating in Canada and
Mexico may enter other specified ports (U.S. Regulations 1992).
Import shipments of ornamental fish during the year 1992 totalled 12,720 and arrived
primarily through the ports of: Los Angeles (39 %), Miami (22 %), and New York (18 %). The
ports of Honolulu, San Francisco, and Chicago received a smaller amount of shipments,
approximately 4% each. A smaller percentage of shipments entered through other designated
ports. The ports of major trade activity for ornamental fish in the United States are shown in
Table 6.
22
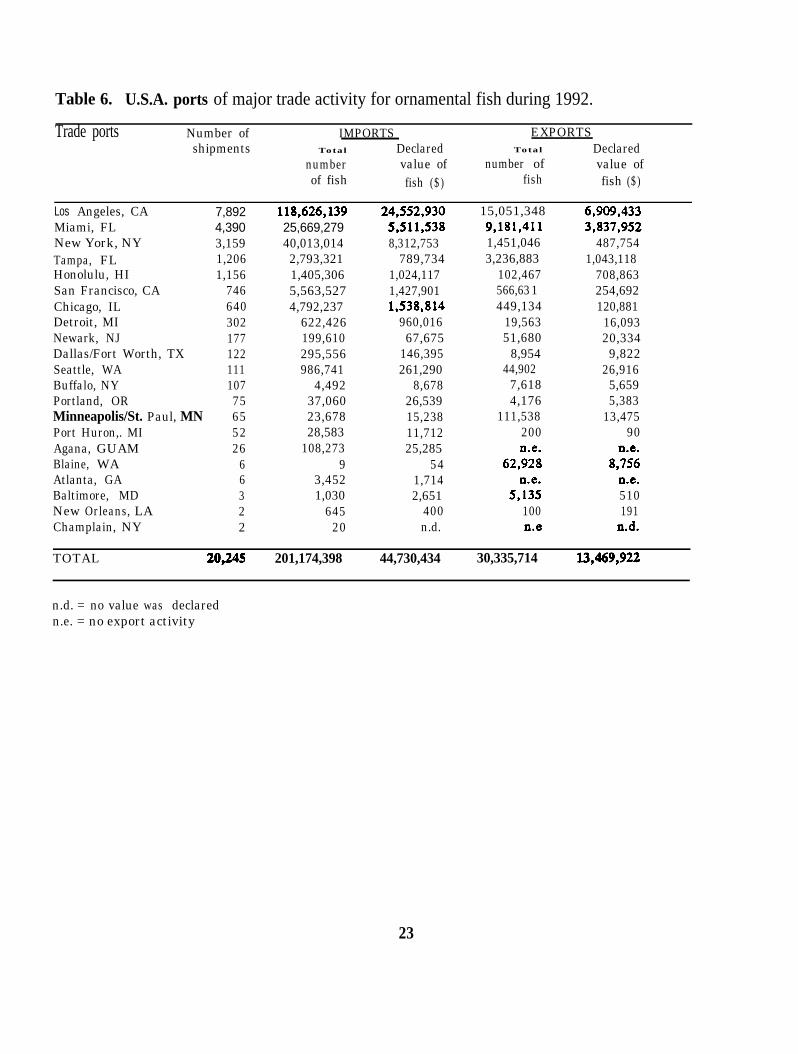
Table 6. U.S.A. ports of major trade activity for ornamental fish during 1992.
Trade ports Number of IMPORTS EXPORTSshipments Total Declared Total Declared
number value of number of value ofof fish fish ($) fish fish ($)
Los Angeles, CAMiami, FLNew York, NYTampa, FLHonolulu, HISan Francisco, CAChicago, ILDetroit, MINewark, NJDallas/Fort Worth, TXSeattle, WABuffalo, NYPortland, ORMinneapolis/St. Paul, MNPort Huron,. MIAgana, GUAMBlaine, WAAtlanta, GABaltimore, MDNew Orleans, LAChamplain, NY
7,892 118,626,139 24.552.930 15,051,348 6.909.4334,390 25,669,279 5,511,5383,159 40,013,014 8,312,7531,206 2,793,321 789,7341,156 1,405,306 1,024,117
746 5,563,527 1,427,901640 4,792,237 L538.814302 622,426 960,016177 199,610 67,675122 295,556 146,395111 986,741 261,290107 4,492 8,67875 37,060 26,53965 23,678 15,23852 28,583 11,71226 108,273 25,285
6 9 546 3,452 1,7143 1,030 2,6512 645 4002 20 n.d.
9,181,4111,451,0463,236,883
102,467566,631449,134
19,56351,680
8,95444,902
7,6184,176
111,538200
62,kei
5,rE100n.e
3,837,952487,754
1,043,118708,863254,692120,881
16,09320,3349,822
26,9165,6595,383
13,47590
8,;;n-e.510191
n.d.
TOTAL 2035 201,174,398 44,730,434 30,335,714 W&9,922
n.d. = no value was declaredn.e. = no export activity
23
U.S.A. ORNAMENTAL FISH EXPORTS
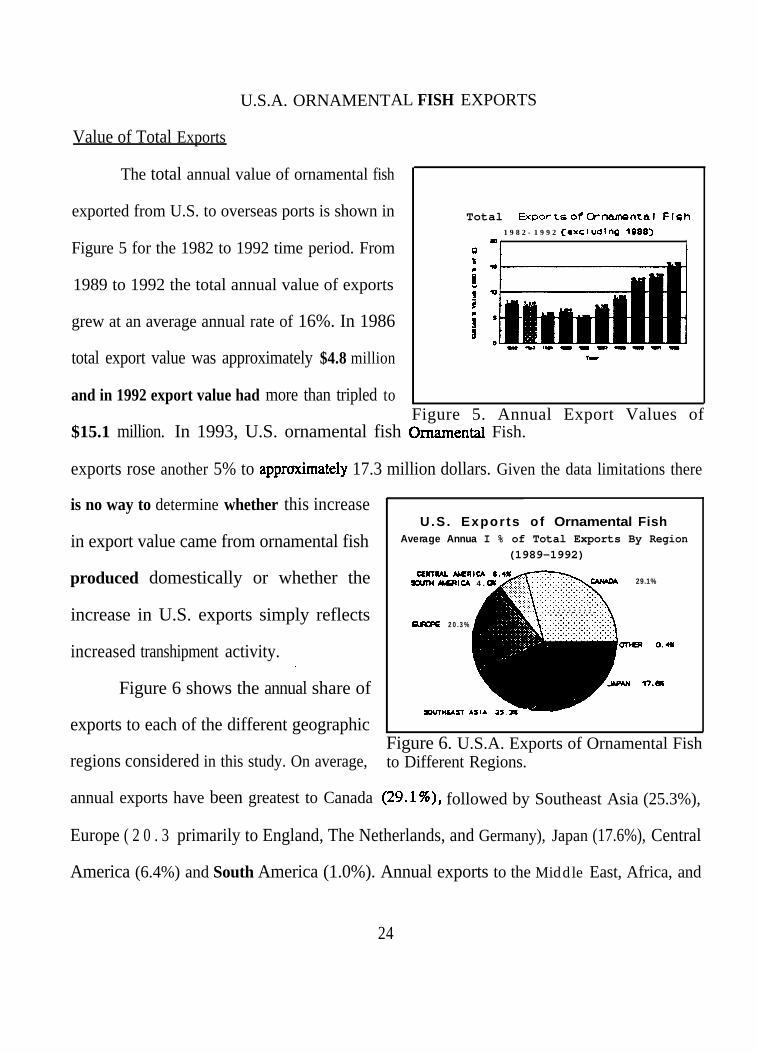
Value of Total Exports
The total annual value of ornamental fish
exported from U.S. to overseas ports is shown in
Figure 5 for the 1982 to 1992 time period. From
1989 to 1992 the total annual value of exports
grew at an average annual rate of 16%. In 1986
total export value was approximately $4.8 million
and in 1992 export value had more than tripled to
Total Exports of Qznamental Fish1 9 8 2 - 1 9 9 2 Cexcludlng lQ88>
1
Figure 5. Annual Export Values of$15.1 million. In 1993, U.S. ornamental fish 0rnamenta.l Fish.
exports rose another 5% to apprcbcimately 17.3 million dollars. Given the data limitations there
is no way to determine whether this increase
in export value came from ornamental fish
produced domestically or whether the
increase in U.S. exports simply reflects
increased transhipment activity.‘i
Figure 6 shows the annual share of
exports to each of the different geographic
regions considered in this study. On average,
annual exports have been greatest to Canada
U.S. Exports of Ornamental FishAverage Annua I % of Total Exports By Region
(1989-1992)
CwtRAl MmlcnSDUTW~ICA 4 . 29.1%
-.........:.* . . . . . . . .. . . . . . . . . . .. . . . . . . . . . .E 20.3%
Figure 6. U.S.A. Exports of Ornamental Fishto Different Regions.
(29.1%), followed by Southeast Asia (25.3%),
Europe ( 2 0 . 3 primarily to England, The Netherlands, and Germany), Japan (17.6%), Central
America (6.4%) and South America (1.0%). Annual exports to the Middle East, Africa, and
24
Pacific Islands combined were less than one
percent of the total export value.
The seasonal pattern of average total
monthly exports from the U.S. is shown in
Figure 7 for the 1989 to 1992 period. With
the exception of four months (January,
March, April, and December), average
monthly exports wereFigure 7. Monthly Values of Ornamental Fish
within a $200,000 Exports.
range from $800,000 to $l,OOO,OOO. Total monthly average exports peaked in April, dropped
U.S. Exports of Ornamental FishAverage Monthly Exports
G 2,000TOTAL U.S. EXPORTS -- (1989-1992)
in May and June but increased gradually through January. After January, another drop occurred
followed by sharp increases in both March and April. In the latter month, average export value
was nearly $1,400,000. Over the four year period monthly export values showed considerable
variability during April, but were only moderately volatile for the rest of the year.
A comparison between the monthly pattern in total value of ornamental fish imports and
exports (Figures 3 and 7), indicates that U.S. trade flows may include a substantial amount of
transhipments of ornamental fish. For example, the largest volume of ornamental fish imports.
in terms of value occurred in March but the export values peaked in April. Thus, a portion of
the value of U.S. exports is produced domestically while the remaining product is imported/or
exported, for example, from/to Singapore, repackaged and exported to other parts of the world.
The summary of ornamental fish export data by U.S. to other countries worldwide
appeared in our previous report entitled “Trends in U.S. International Trade in Ornamental Fish,
1982-1992 (Thunberg et al. 1993)” and is reprinted in the Appendix B.
25
ies ExnodS
Domestic production of freshwater ornamental fish is predominately practiced in the State
of Florida. Most of the ornamental fish in Florida are of freshwater origin and raised in outdoor
ponds. Newly released figures indicate that Florida ornamental fish sales totaled $46.7 million
in 1993 (F.A.S.S.). The 1993 survey showed that egg layers contributed $28.7 million and
livebearers $18.0 million in net sales value.
The more prominent cultured ornamental fish include guppies, mollies, swordtails,
platies, gouramies, barbs, tetras, armored catfishes, and a variety of cichlid species. Ornamental
marine fish are primarily collected from the wild and originate from the coastal waters of Florida
and Hawaii. Only a handful of marine fish species are culture and only those of the genus
were exported in great numbers. From the declaration forms we could not
distinguish if the ornamental fish were bred and raised domestically or imported for later resale.
26
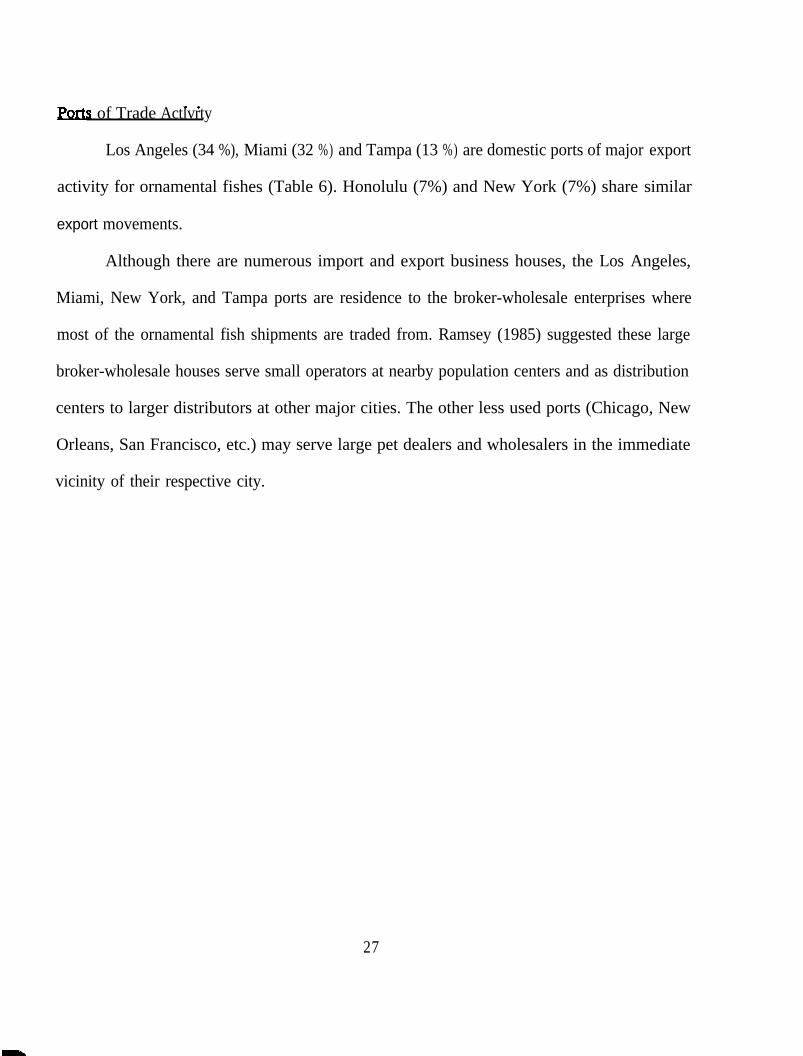
.of Trade Actlvrty
Los Angeles (34 %), Miami (32 %) and Tampa (13 %) are domestic ports of major export
activity for ornamental fishes (Table 6). Honolulu (7%) and New York (7%) share similar
export movements.
Although there are numerous import and export business houses, the Los Angeles,
Miami, New York, and Tampa ports are residence to the broker-wholesale enterprises where
most of the ornamental fish shipments are traded from. Ramsey (1985) suggested these large
broker-wholesale houses serve small operators at nearby population centers and as distribution
centers to larger distributors at other major cities. The other less used ports (Chicago, New
Orleans, San Francisco, etc.) may serve large pet dealers and wholesalers in the immediate
vicinity of their respective city.
27
REFERENCES
Andrews, C. 1990. The ornamental fish trade and fish conservation.J. Fish Biology. 37 (Suppl. A): 53-59.
Conroy, D.A. 1975. An evaluation of the present state of world trade in ornamental fish.FAO Fisheries Technical Paper No. 146. FAO: Rome, Italy.
F.A.S.S. 1994. Aquaculture, Florida Agriculture. Florida Agricultural Statistics Service(F.A.S.S.): Orlando, Florida.
Hemley G. 1984. U.S. Imports millions of ornamental fish annually.Traffic U.S.A. 5 (4): 1.
Pet Dealer. 1993. The Pet Dealer 17th annual survey of independent pet stores in theU.S. The Pet Dealer.
Ramsey, J.S. Sampling aquarium fishes imported by the United States.J. Alabama Acad. Science. 56 (4): 220-245.
U.S.D.A. 1994. Aquaculture: situation and outlook report. Economic Research Service,U.S. Department of Agriculture. AQS-12.
U.S. Regulations. 1992. Title 50, code of federal regulations, part 14, importation, exportation,and transportation of wildlife.
U.S. Department of Commerce, Bureau of Census, Foreign Trade Division, Schedule A GeneralImports and Exports, Washington D.C. (various years).
28
IIIIIIII
APPENDN A
List of freshwater species declared as imported into the U.S.A. during October 1992.
Abramites hypselonotusAcanthophthalmus anguillarisAcanthophthalmus javanicusAcanthophthalmus kuhliiAcanthophthalmus myersiAcanthophthalmus pangiaAcanthophthalmus semicinctusAcanthopsis choirorhynchusAcarichthys geayiAcarichthys heckeliiAcestrorhynchus falcatusAchirus lineatusAdioryx diademaAeoliscus strigatusAequidens curvicepsAequidens latifronsziAequidens maroniAequidens portalegrensisAequidens pulcherAequidens rivulatusAequidens viridisAgamyxis chaestomaAgamyxis pectinifronsAgmus lyriformisAmbassis reticulataAmblydoras hancockiAmphipnous cuchniaAncistrus dolichopterusAncistrus lineolatausAncistrus sp.Ancistrus triradiatusAnguilla bicolorAnomalochromis thomasiAnostomus anostomusAnostomus trimaculatusAphyocharax anisitsiAphyocharax feligeraAphyocharax rubripinnisAphyosemion amietiAphyosemion australe
Aphyosemion gardneriAphyosemion striatumApistogramma agassiziApistogramma borelliApistogramma cacatuoidesApistogramma inconspicuaApistogramma ortmaniApistogramma ramireziApistogramma steindachneriApistogramma trifasciatumAplocheilus dayiAplocheilus panchaxApteronotus albifronsApteronotus leptorhynchusArnoldichthys spilopterusAstronotus ocellatusAstyanax fasciatusAstyanax mexicanusAulonocara nyassaeAulonocara sp.Aulonocranus dewindtiBadis badisBagrichthys hypselopterusBagrichthys sp.Balantiocheilos melanopterusBarbichthys laevisBarbus aruliusBarbus oligolepisBarbus schubertiBarbus tetrazonaBarbus titteyaBeaufortia kweichowensisBeaufortia leverttiBedotia geayiBelontia signataBetta brederiBetta imbellisBetta pugnaxBetta smaragdinaBetta splendens
29
Biotodoma cupidoBlennius pavoBoehlkea cochuiBoehlkea fredcochuiBotia beaufortiBotia berdmoreiBotia darioBotia horaeBotia hymenophysaBotia leconteiBotia lohachataBotia lucasBotia macracanthaBotia modestaBotia morletiBotia rostrataBotia sidthimunkiBotia striataBoulengerella maculataBrachydanio albolineatusBrachydanio frankeiBrachydanio rerioBrachygobius doriaeBrachygobius nunusBrachygobius xanthozonaBrienomyrus brachyistiusBrochis britskiiBrochis coeruliusBrochis splendensBrycinus longipinnisBrycinus taeniurusBrycon dentexBrycon sp.Bunocephalus amaurusBunocephalus coracoideusBunocephalus kneriButis butisCallichthys callichthysCampylomormyrus cassaicusCampylomormyrus rhynchophorusCarassius auratusCarassius carassiusCarinotetraodon somphongsiCarnegiella marthae
Carnegiella myersiCarnegiella strigataCatoprion mentoChaca bankenensisChaca chacaChaetostoma thomasiChalceus erythrurusChalceus macrolepidotusChalinochromis ndobhoiChanda baculisChanda buruensisChanda lalaChanda wolfiiChanna argusChanna asiaticaChanna maruliusChanna micropeltesChanna orientalisChanna striatusChanos chanosCharax gibbosusChela laubucaChilatherina bleheriChilodus fasciatusChilodus punctatusChilotilapia rhodesiiChrysichthys ornatusCichla ocellarisCichla temensisCichlasoma alfariCichlasoma aureumCichlasoma carpinteCichlasoma citrinellumCichlasoma cyanoguttatumCichlasoma festaeCichlasoma festivumCichlasoma labiatumCichlasoma managuenseCichlasoma meekiCichlasoma nicaraguenseCichlasoma nigrofasciatumCichlasoma octofasciatumCichlasoma salviniCichlasoma severum
30
Cichlasoma synspilusCichlasoma temporalisCobitis taeniaCochliodon hondaeColisa fasciataColisa labiosaColisa laliaColisa sotaColomesus asellusColomesus pgitticusColossoma bidensColossoma brachypomumColossoma macropomumCopeina guttataCopella arnoldiCopella nigrofasciatusCorydoras aeneusCorydoras agassiziiCorydoras arcuatusCorydoras atropersonatusCorydoras blochiCorydoras caudimaculatusCorydoras columbianaeCorydoras de&rCorydoras delfaxCorydoras elegansCorydoras garbeiCorydoras haraldschultziCorydoras hastatusCorydoras juliiCorydoras leucomelasCorydoras metanistiusCorydoras melanotaeniaCorydoras meIiniCorydoras metaeCorydoras nanusCorydoras paIeatusCorydoras pandaCorydoras punctatusCorydoras rabautiCorydoras reticularusCorydoras robineaeCorydoras sangamaCorydoras sanjuan
Corydoras schwartziCorydoras sterbaiCorydoras sychriCrenicara maculateCrenicichla geayiCrenicichla lepidotaCrenicichIa maculataCrenicichla saxatilisCrenicichla sp.Crenicichla strigattaCrossocheilus oblongusCrytocoryne balansaeCtenobrycon spihrrusCtenolucius hujetaCtenopoma ansorgiiCtenopoma nobilisCyathopharynx firciferQnoglossus microlepisCynolebias boitoneiCyphotilapia frontosaQprinus carpioDanio malabaricusDatnioides microlepisDatnioides quadr~ifasciatusDermogenys indonesiensisDemogenys pusillusDianema longibarbisDianema urostriataDistichodus afinisDistichodus sexfasciatusDormitator maculatusEigenmannia goajiraEigenmannia virescensEIectrophoncr electricusEIeotrides sttigataEIeotris mannoratlisEleotris pictaEleotris sp.EpaIzeorhynchus kaloptewEpalzeorhynchus siamensisEretmodus cyanostictusEIpetoichthys calabaricusEsomus danricusEtroplus chromide
31
Etroplus macukuusEtro&s surantensisEutropiellus debauwiExodon paradoxusFarlowella acusFarlowella gracilisFugu sp.Gagata ceniaGarra ceylonisisGarra taeniaraGasteropelecus maculataGasteropelecus sterniclaGastromyzon boreneensisGeophagus bakaniiGeophagus hondaeGeophagus jurupariGeophagus pelrigriniGeophagur steindachneriGeophagus surinamensisGIossolepis incisusGlypotothora;r calloptemsGlypotothorax sp.Gnasholepis knightiGnathonemus abadiiGnuthonemus mooreiGnathonemus petersiGnathonemw tamanduaGnathonodon speciosusGoekiiella equesGymnarchus niloticusGymnocorymbus ternetziGymnocorymbus thayeriGymrwthorax polyuranodonGymnotus anguillarisGymrwtus carapoGyrirwcheilos aymonieriHampala macrolepidotaHaplochromis burtoniHaplochromis compressicepsHaplochromis electraHaplochromis firscotaeniatusHaplochromis johnstoniHapIochromis livingstoniHaplochromis mloto
HapIochromis mooriiHapIochromis tostratuSHaplochromis venustusHapIochromis virginalisHara haraHara jerdoniHassar inheringih%ssar richterHelogenes marmoratusHelostoma temminckiHemichromis bimaculatusHemichromis elongatesHemichromis payneiHemidoras microstomusHemigrammopetersius caudalisHemigrammus blehetiHemigrammus boesemaniHemigrammus caudovittatusHemigrarnmus erythrozonusHemigrammus hyanuaryHemigrammus levisHemigrammus nanaHemigrammus ocelliferHemigrammus p&herHemigrammus rhodostomusHemigrammus rodwayiHemigrammus ulreyiHemiodopsis goeldiHemiodopsis gracilisHemiodopsis immacukuusHemiodopsis semitaeniatusHemiodus unimaculatusHemistichodus vaillantiHerotiIapia muItispinosaHeterocharax macrolepisHeteropneustes fossilisHomaloptera orthogoniataHomaIoptera pIecostomusHomaloptera tollingen’Hoplerythrinus unitaeniatusHoplias malabaricusHoplostemum thoracatumHusu husoHypancistrus zebra
32
Hyphessobtycon bentosiHyphessobrycon copelandiHyphessobrycon erythrostigmaHyphessobrycon flammeusHyphessobrycon herbertaxelrodiHyphessobrycon loretoensisHyphessobrycon pulchripinnisHyphessobrycon robertiHyphessobrycon serpaeHyphessobrycon socolofHyphessobrycon sp.Hypopomus artediHypopomus brevirostrisHypoptopoma gulareHypostomus plecostomurHypostomus punctatusIctaluncr melasInpaichthys kerriIodotropheus sprengeraeIriatherina werneriJordanella floridaeJulidochromis dic5feldiJulidochromis marlieriJulidochromis ornatusJulidochromis reganiJulidochromis transcriptusKryptopterus bicirrhisKryptoptencr limpokKryptopterus macrocephalusLabeo bicolorLabeo calbasaLabeo erythnmrusLabeo frenatusLabeo numensisLabeo tropheus trewasseLabidochromis sp.Labiobarbus festivaLamprologus brichardiLamprologus buscheriLamprologus calvurLamprologus caudopunctatusLamprologus compressicepsLamprologus daflodilLamprologus leleupi
Lamprologus mocquardiLamprologus signatusLamprologus tetracanthusLamprologus tretocephalusLasiancistms punctattissimusLates calcanferLeiocassis mystusLeiocassis siamensisLepidocephalus gunteaLepidocephalus thermalisLepisosteus spatulaLeporinus arcusLeporinus fasciatusLeporinus maculatusLeptobarbus hoeveniLeptobotia elongataLeptobotia guilinensisLeptobotia pellegriniLeptolucania ommataLo&aria parvaeLuciocephalus pulcherLuciosoma bleekeriLuciosoma setigerumMacrognathus aculeatusMacrognathus circumcinctusMacrognathus siamensisMacropodus cupanusMacropodus opercularisMalaptenrrus electricusMarcusenius angolensisMarcusenius isidoriMastacembelus arcusMastacembelus armatusMastacembelus circumcintusMastacembelus erythrotaeniaMastacembelus freaoliMastacembelus frenatusMastacembelus pancalusMastacenbelus maculaturMegalamphodus megalopterusMegalamphodus sweglesiMelanochromis auratusMelanochromis johanniMelanotaenia boesemani
33
Melanotaenia jluviah’IisMelanotaenia lacustrisMelanotaenia maccullochiMeIanotaenia nigransMelanotaenia stxlineataMelanotaenia splendidaMelanotaenia tnifasciataMerodontotus tigrinusMetynnis aIbonubesMetynnis argenteusMetynnis hypsauchenMetynnis lunaMetynnis maculatusMicrogeophagur altispinosMicroglanis inheringiMicroglanis paraphyboeMicr0glani.s poecilusMicrophis boajaMimagoniates microlepisMisgunw anguillicaudaMisgunurs fossilisMisgumus mizolepisMoenkhausia lepiduraMoenkhausia oEgorepisMoenkhausia pittieriMoenkhausia robertsiMoenkhausia sanctaeJ~omenaeMorwcirrhus polyacanzhusMonodactylus argenteusMonodactylus sebaeMonopterus albusMonnyrops boulengeriMormyrus IongirostrisMorulius chrysophekadionMyleus pacuMyreus rubripinnisMyIossoma aureumMystus cavasiusMystus micracanthusMystus nemurusMystus tengaraMystus vittatusMyxocypn’nus asiaticusNannacara anomala
Nannostomus auratusNannostomus becI$ordiNannostomus espeiNannostomus harrisoniNannostomus marginatwNannostomus triifacciancrNannostomus unifasciatusNanochromis nudicepsNanochromis pa&sNanochromis sp.Nematobrycon lacorteiNematobrycon palmeriNeosiIurus aterNeosilurus sp.Nomorhamphus celebensisNomorhamphus IiemiNothobranchius pat&iiNotopterus aferNotopterus chitalaNotopterus mikereediOmpok bimaculatusOmpok pabdaOmpok sabanusOphisternon sp.Ophthalmotilapia nasutusOphthalmotilapia ventralisOpsaridium christyiOpsariichthys platypusOryzias javanicusOryzias melanostigmaOsphronemur goramyOsteochilus hasseltiOsteoglossum bicirrhosumOsteoglossum ferreiraiOtocinclw acusOtocincIus aflnisOtocincIus arnoldiOxyeleotris marmoratusPanaque nigrolineatusPanaque suttoniPangasius IamaudiPangasius micronzmirPangasius sutchiPantodon buchholzi
34
Paracheirodon axelrodiParacheirodon innesiParacrossocheilus vittatusParagoniates alburnusParambassis gulliveriParapocryptes setperasterPecklotia pulcherPecklotia vittataPelmatochromis kribensisPelteobagrus ornatusPelvicachromis taeniatusPelvicachromis thomasiPeriophthalmus barbarusPeriophthalmus koelreutetiPen’ophthalmus regiusPetitella georgiaePetrocephalus simusPetrochromis trewavasaePhenacogrammus aurantiacusPhenacogrammus interruptusPhractocephalus hemiliopterusPimelodella gracilisPimelodella lineatusPimelodus albofaciatusPimelodus clariasPimelodus omatusPimelodus pictusPlatydoras costatusPlatystomatichthys sturioPlatytropius siamensisPlecostomus atabapoPlecostomus trinidadPoecilia latipinnaPoecilia reticulataPoecilia sphenopsPoecilia veliferaPoecilobrycon auratusPoecilocharax weitzmaniPollimyncr castelnauiPolycentrus schomburgkiPolynemus paradiseusPolypterus delheziPolyptems lapradPolyptems ornatipinnis
Polypterus palmasPolyptems retropinnisPolyptems senegalusPoptella orbicularisPotamorrhaphis goctosPotamorrhaphis guianensisPotamotrygon hystrixPotamotrygon laticepsPotamotrygon leopoldiPotamotryson motoroPotamotrygon reticulatusPrionobrama filigeraPristella maxillarisPristella riddleiProtopterus annectensProtoptems dolloiPseudacanthicus spinosusPseudobagrus fir1vidracoPseudodoras holdeniPseudodoras nigerPseudogastromyzon fasciatusPseudogastromyzon myersiPseudomugil signiferPseudoplatystoma fascianunPseudorinelepis pelegriniPseudotropheus atherinoidesPseudotropheus artratusPseudotropheus brevisPseudotropheus cobaltPseudotropheus eduardiaPseudotropheus elongatusPseudotropheus johanniPseudotropheus kenyiiPseudotropheus livingstoniiPseudotropheus lombardoiPseudotropheus SP-Pseudotropheus tropheopsPseudotropheus zebraPterolebias zonatusPterophyllum altumPterophyllum sea IarePterotilapia tridentigerPterygoplichthys ansitsiPterygoplichthys gibbiceps
35
Puntius altusPuntius bimaculatusPuntius conchoniusPuntius cummingiPuntius daruphaniPun&s everettiPuntius farciolatusPuntius jxunentosusPuntius hexazonaPunt& lateristtigaPuMus lineatusPuntius nigr0fQsciatu.sPuntius orphidePuntius phutunioPuntius pinnauratusPun&s sahyadriensisPuntius schwanenfeldiiRachovia brevisRasbora drgyrOtaeniaRasbora borapetensisRasbora caudimaculataRasbora danicontusRasbora dorsiocellataRasbora einthoveniRasbora elegansRasbora heteromorphaRasbora kalochromaRasbora maculataRasbora meinkeniRasbora pauciperforataRasbora trilineataRasbora vatenijlorisRhamphichthys rostratusRhaphiodon vulpinusRhinogobius wuiRhinomugil corsulaRhodeus ocellatusRineloricaria fallaxRineloricaria hasemaniRineloricaria lanceolataSawbwa resplendensScleropages jardiniScleropages leichardtiSemaprochilodus squamilentus
Semaprochilodus taeniurusSemaprochilodus theraponuraSerrasalmus natiereriSerrasalmus notarusSerrasalmus sp.Siniperca chuatsiSinogastromyzon wuitfangSorubim limaSphaerichthys osphromenoidesSteatocranus casuariusSteatocranus mpozoensisSteatocranus ubangiensisStigmatogobius sadanundioSturisoma aureumSturisoma panamenseSymphysodon aequifasciataSymphysodon discusSynbranchus marmoratusSynodontis acanthomiasSynodontis angelicusSynodontis brichardiSynodontis caudilisSynodontis contractusSynodontis decorusSynodontis flavitaeniatusSynodontis granrrlosusSynodontis greshoflSynodontis multipunctatusSynodontis nigriventtisSynodontis notatusSynodontis schoutedeniSynodontis soloniTanganicodus irsacaeTanichthys albonubesTelmatherina celebesTerapon jarbuaTetragonopterus sp.Tetraodon cutcutiaTetraodon fluviatilisTetraodon mbuTetraodon miurusTetraodon nigropunctatusTetraodon palembangensisTetraodon schourcdeni
36
Tetraodon somphongsi??tayeria boehlkeiThayeria gymnocorymbuThayetia obliquaThayeria santaemariaeThoracocharar stellatusl?wracocharax strigattaThoracochrax securisnlapia mariaeToxotes chatareusToxotes jaculatorTrichogaster leeriTtichogaster microlepisTn’chogaster pectoralisTrichogarter trichopterusTrichopsis pumilusTrichopsis vittatwTriglachromis otostigmaTripo?the&s albusTropheus duboisiTropheus mooriiUaru amphiacanthoidesWallago ath4Xenent&n cancilaXenomystus nigriXenotilapia melanogenysXiphophorur helleriXiphophonu maculatusXiphophonrs variates
37
APPENDIX B
Excerpts from “Trends in U.S. International Trade in Ornamental Fish, 1982-1992(Thunberg et al. 1993)“.
U S.A. Ornamental Fish lmoorts Bv Regionl
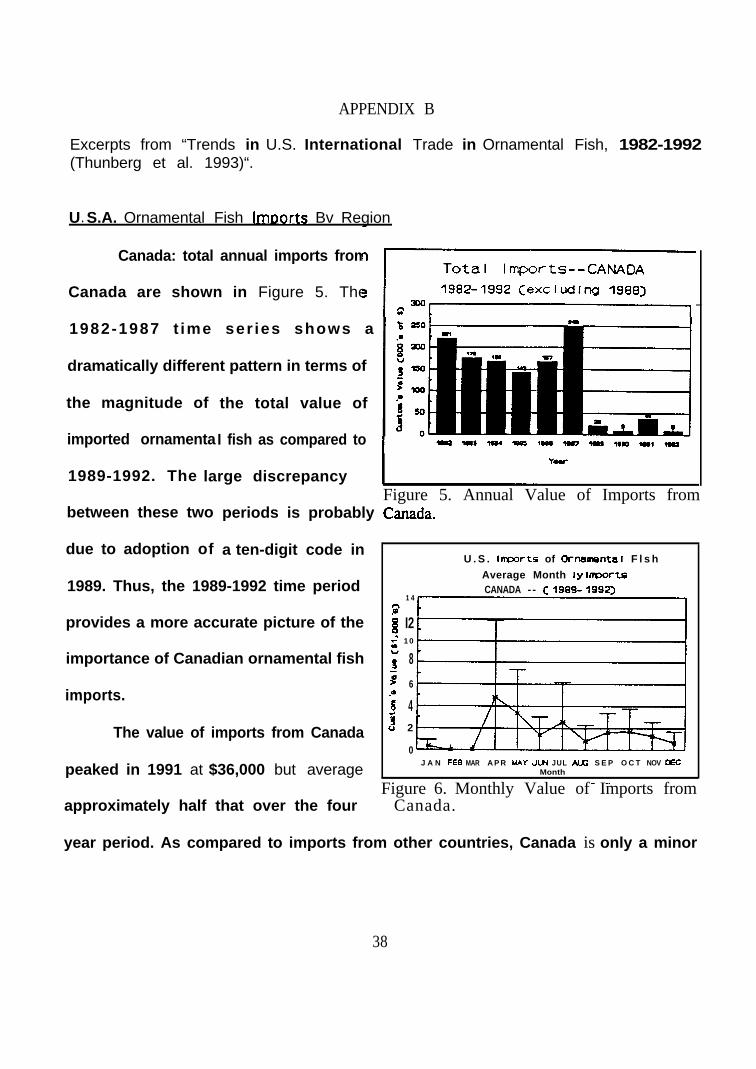
Canada: total annual imports from
-/Canada are shown in Figure 5. The
1982-1987 t ime ser ies shows a
dramatically different pattern in terms of
the total value of
I fish as compared to
the magnitude of
imported ornamenta
1989-1992. The
between these two
due to adoption of
large discrepancy
periods is probably C&ads.
a ten-digit code in
Figure 5. Annual Value of Imports from
U . S . Irroofts of OrnainsntaI F l s h
1989. Thus, the 1989-1992 time periodAverage Monthly InportsCANADA
14- - c 1989- 1992)
provides a more accurate picture of the3Q I2r;’ 10
importance of Canadian ornamental fish i 8e
imports.6
P8 4
The value of imports from Canada 5! 2
0
peaked in 1991 at $36,000 but average J A N FEE MAR A P R UAY JW JUL Au; S E P O C T NOV OECMonth
_ -Figure 6. Monthly Value of Imports fromapproximately half that over the four Canada.
year period. As compared to imports from other countries, Canada is only a minor
38
source of ornamental fish for the U.S. The seasonal pattern of Canadian imports is
shown in Figure 6.
As was the case for total U. S. imports, imports from Canada are greatest in
April followed by another small peak in July. After July average Canadian imports
decline in August and rise slightly in
September before gradually declining to
less than $1,000 during the winter
months. On average, monthly imports
are greater than $2,000 during only
April, May, and July and fall to less than
that for the rest of the year. However,
Total Iffports-CENTRAL WICA d UCIIBBEAN1992-1992 Cmaldrq lsc)
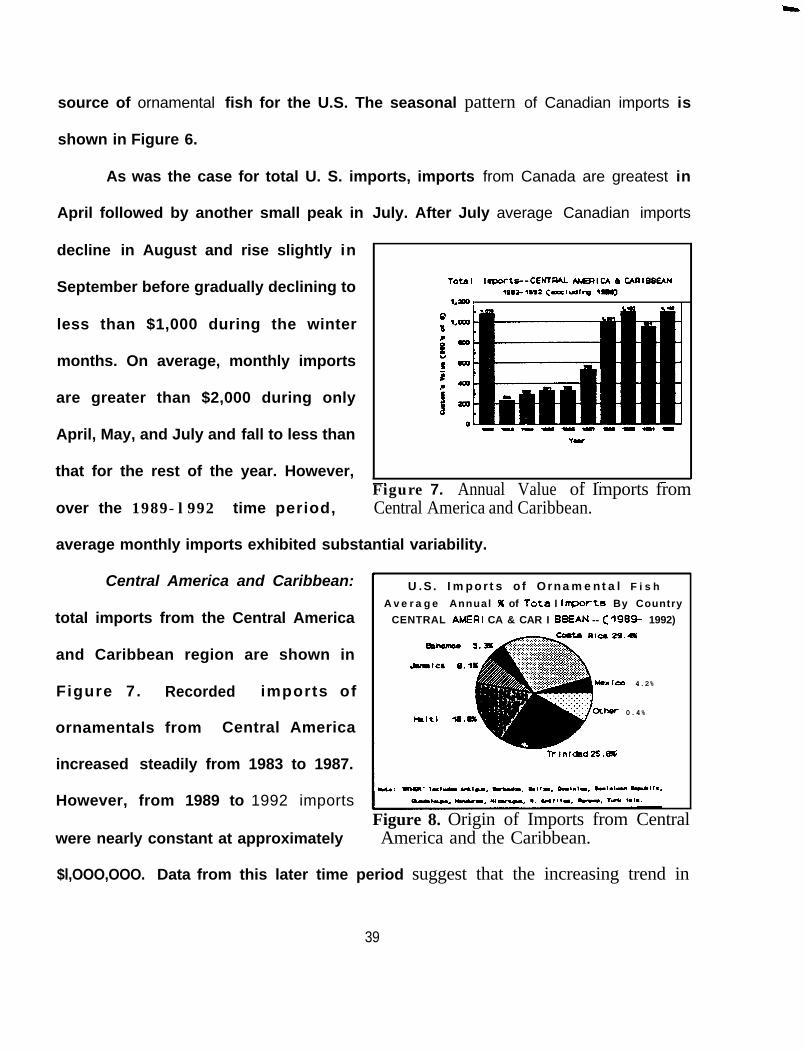
1.m I 1
Figure 7. Annual Value of Imports fromover the 1989-l992 time period, Central America and Caribbean.
average monthly imports exhibited substantial variability.
Central America and Caribbean:
total imports from the Central America
and Caribbean region are shown in
Figure 7. Recorded imports of
ornamentals from Central America
increased steadily from 1983 to 1987.
However, from 1989 to 1992 imports
U.S. Imports of Ornamental F i s hAverage Annual % of Tota I Inports By Country
CENTRAL AMERI CA & CAR I BEAN -- C1984- 1992)
Rlai 29.aw- 5.
Jumlc9 0.1
xrco 4.2%
0.4%
Tr inrbsd25.8%
Figure 8. Origin of Imports from Centralwere nearly constant at approximately America and the Caribbean.
$l,OOO,OOO. Data from this later time period suggest that the increasing trend in
39
imports of commodities listed under the
seven digit code used prior to 1989 may
have come from sources other than
growth in ornamental fish trade.
Average annual shares of imports
for individual countries are shown in
Figure 8. Overall, the majority ofQure 9. Monthly Value of Imports fromE
imports originate in Costa Rica followed Central America and Caribbean Regions.
by Trinidad, Haiti, Jamaica, the Bahamas, and Mexico. This ranking does not fully
reflect current conditions due to the political upheaval in Haiti and the subsequent drop
in Haitian imports after 1991. The proportions shown in Figure 8 were calculated
using only 1989-1991 data for Haiti. This was done to show the importance of Haitian
imports and to highlight the potential impact on ornamental fish trade when Haiti is
able to return to its pre-1992 production levels.
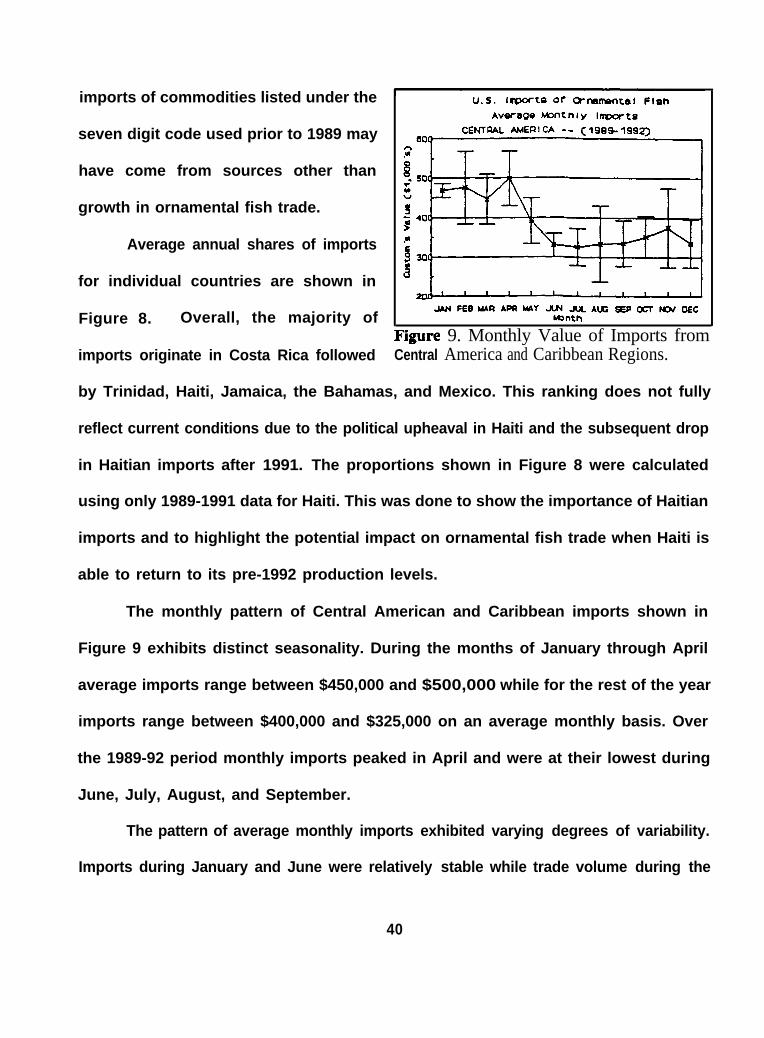
The monthly pattern of Central American and Caribbean imports shown in
Figure 9 exhibits distinct seasonality. During the months of January through April
average imports range between $450,000 and $500,000 while for the rest of the year
imports range between $400,000 and $325,000 on an average monthly basis. Over
the 1989-92 period monthly imports peaked in April and were at their lowest during
June, July, August, and September.
The pattern of average monthly imports exhibited varying degrees of variability.
Imports during January and June were relatively stable while trade volume during the
40
months of July, September, October, and December seemed to be slightly more
variable. Trade volume during the remaining months, exhibited a higher degree of
volatility with August, November, and January being particularly variable.
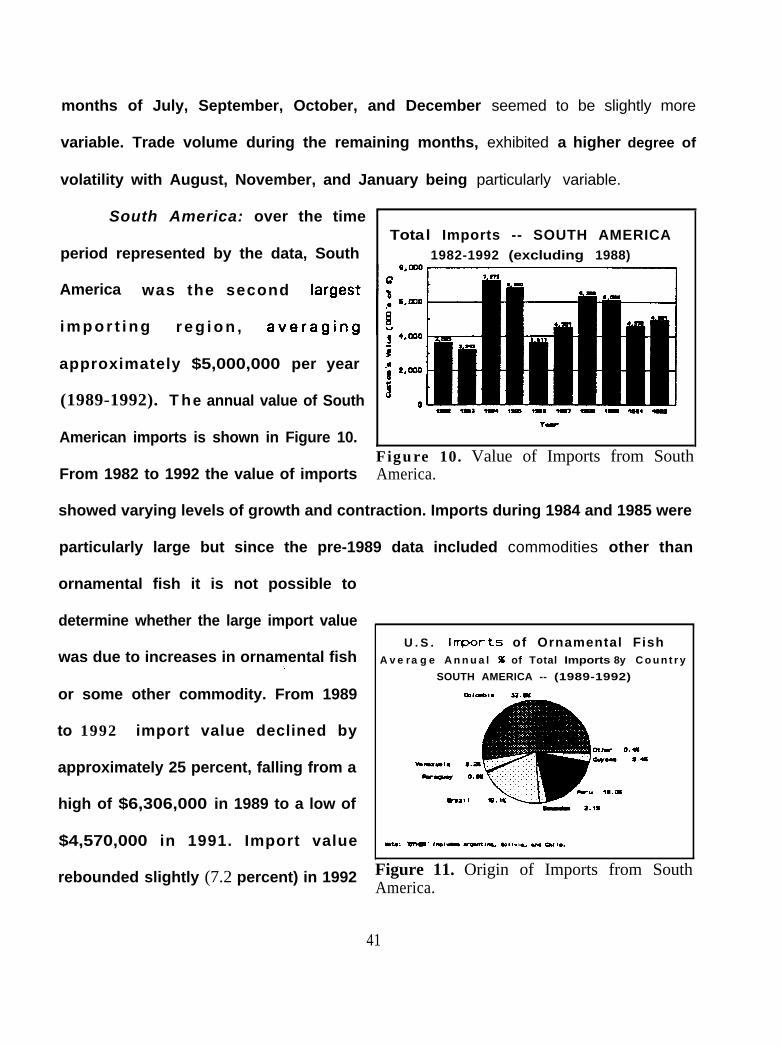
South America: over the time Total Imports -- SOUTH AMERICA
period represented by the data, South 1982-1992 (excluding 1988)
America was the second
i m p o r t i n g r e g i o n ,
approximately $5,000,000 per year
(1989-1992). T he annual value of South
American imports is shown in Figure 10.Figure 10. Value of Imports from South
From 1982 to 1992 the value of imports America.
showed varying levels of growth and contraction. Imports during 1984 and 1985 were
particularly large but since the pre-1989 data included commodities other than
ornamental fish it is not possible to
determine whether the large import value
was due to increases in ornamental fish
or some other commodity. From 1989
to 1992 import value declined by
approximately 25 percent, falling from a
high of $6,306,000 in 1989 to a low of
$4,570,000 in 1991. Import value
rebounded slightly (7.2 percent) in 1992
U . S . lrrports of Ornamental FishA v e r a g e A n n u a l % of Total Imports 8y C o u n t r y
SOUTH AMERICA -- (1989-1992)
aplodlm s2.m
Figure 11. Origin of Imports from SouthAmerica.
41
but there is not possible to determine whether this increase will continue into 1993I
and beyond.
The average annual distribution of
South American imports by country of
origin is shown in Figure 11. From 1989-
1992 ornamental fish from Colombia
comprised more than half of the total
value of imports from South America.
When Brazilian and Peruvian imports areqgure 12. Monthly Value of Imports from
added to Colombia’s total, these three South America.
U.S. Imports of Ornamental FishAverrge Uonthly Imports
i5Wl-E AMERICA -- C 1989- 1 9 9 2 )700
c l- I
countries comprised approximately than 91 percent of the value of South American
ornamental fish imports to the U. S. Countries such as Ecuador, Guyana, Venezuela,
and Paraguay averaged 2.1 percent of the total value of imports from the region.
Thus, if the value of ornamental fish imports from the region are to return to 1989
levels, the majority of that growth will depend upon favorable economic and political
conditions in Colombia, Peru, and Brazil.
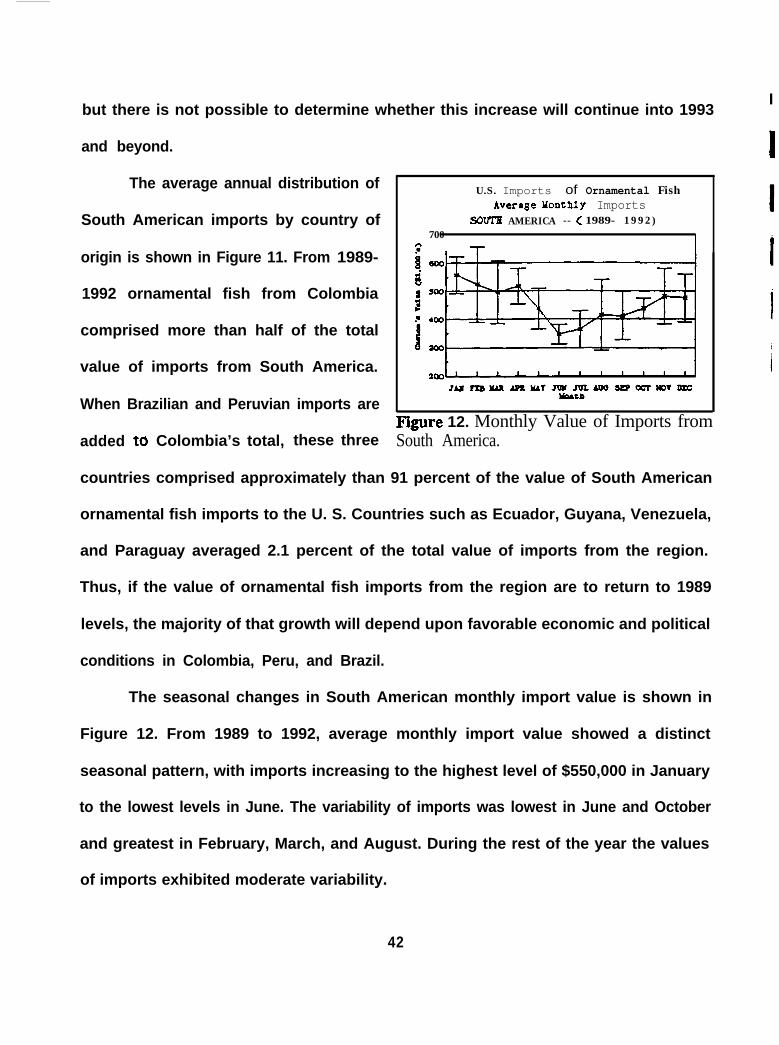
The seasonal changes in South American monthly import value is shown in
Figure 12. From 1989 to 1992, average monthly import value showed a distinct
seasonal pattern, with imports increasing to the highest level of $550,000 in January
to the lowest levels in June. The variability of imports was lowest in June and October
and greatest in February, March, and August. During the rest of the year the values
of imports exhibited moderate variability.
42
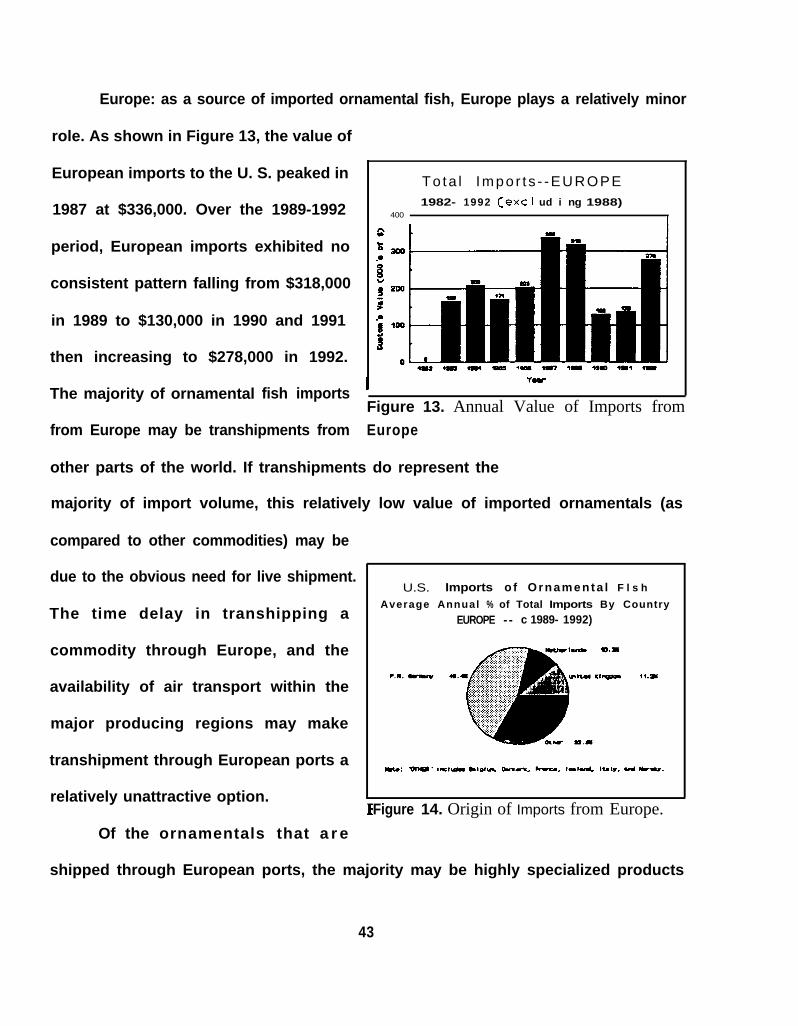
Europe: as a source of imported ornamental fish, Europe plays a relatively minor
role. As shown in Figure 13, the value of
European imports to the U. S. peaked in
1987 at $336,000. Over the 1989-1992
period, European imports exhibited no
consistent pattern falling from $318,000
in 1989 to $130,000 in 1990 and 1991
then increasing to $278,000 in 1992.
The majority of ornamental fish imports
To ta l Impo r t s - -EUROPE1982- 1992 Cexc I ud i ng 1988)
400I
I YW
Figure 13. Annual Value of Imports fromfrom Europe may be transhipments from Europe
other parts of the world. If transhipments do represent the
majority of import volume, this relatively low value of imported ornamentals (as
compared to other commodities) may be
due to the obvious need for live shipment.
The time delay in transhipping a
commodity through Europe, and the
availability of air transport within the
major producing regions may make
transhipment through European ports a
relatively unattractive option.
Of the ornamentals that a r e
U.S. Imports o f Ornamenta l F l s h
Average Annual % of Total Imports By Country
EUROPE - - c 1989- 1992)
Figure 14. Origin of Imports from Europe.
shipped through European ports, the majority may be highly specialized products
43
destined for
market. Such
the advanced aquarium U.S. Imports of Ornaaentel Fish
I I
Average MontNy Impartsproducts are likely to be &IJROPE -- ClSSS- 1 9 9 2 )
no.a 1
high in value, but are traded in small
quantities.
The distribution of average annual
European imports by country is shown in
Figure 14. In terms of import shares
Germany leads all other European
itt TT l-I I I
I I I -I- -I
Figure 15. Monthly Imports from Europe.
countries with an average annual share of 45.4 percent. Of the remaining countries
only the Netherlands (10.3%) and the United Kingdom (11.2%) had an import share
greater than 5 percent.
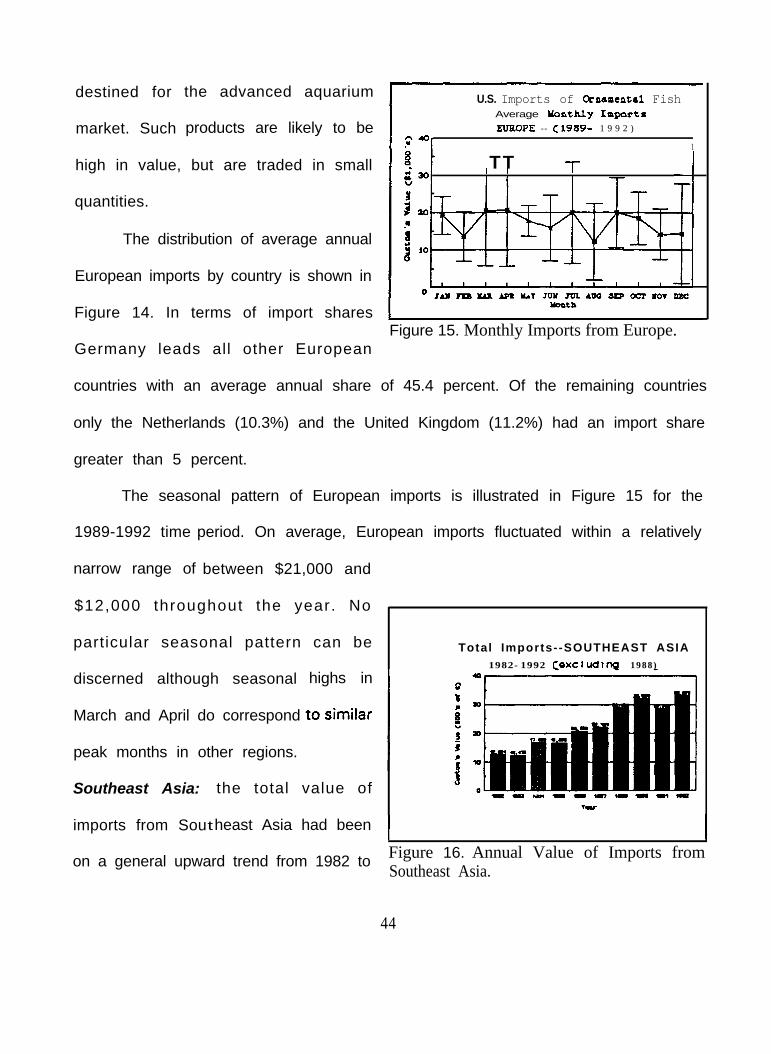
The seasonal pattern of European imports is illustrated in Figure 15 for the
1989-1992 time period. On average, European imports fluctuated within a relatively
narrow range of between $21,000 and
particular seasonal pattern can be Total Imports--SOUTHEAST ASIA. 1982-1992 CexcIud1na 1988)
discerned although seasonal
March and April do correspond
peak months in other regions.
highs in 1
Southeast Asia: the total value of
$12,000 throughout the year. No
imports from Southeast Asia had beenI I
on a general upward trend from 1982 to Figure 16. Annual Value of Imports fromSoutheast Asia.
44
1992 (Figure 161. This upward trend has
continued since 1986 interrupted only by
a small decrease in import value in 1991.
The value of imports was $33,070,000
in 1992, which represents an increase of
approximately 60 percent compared to
the 1986 level.
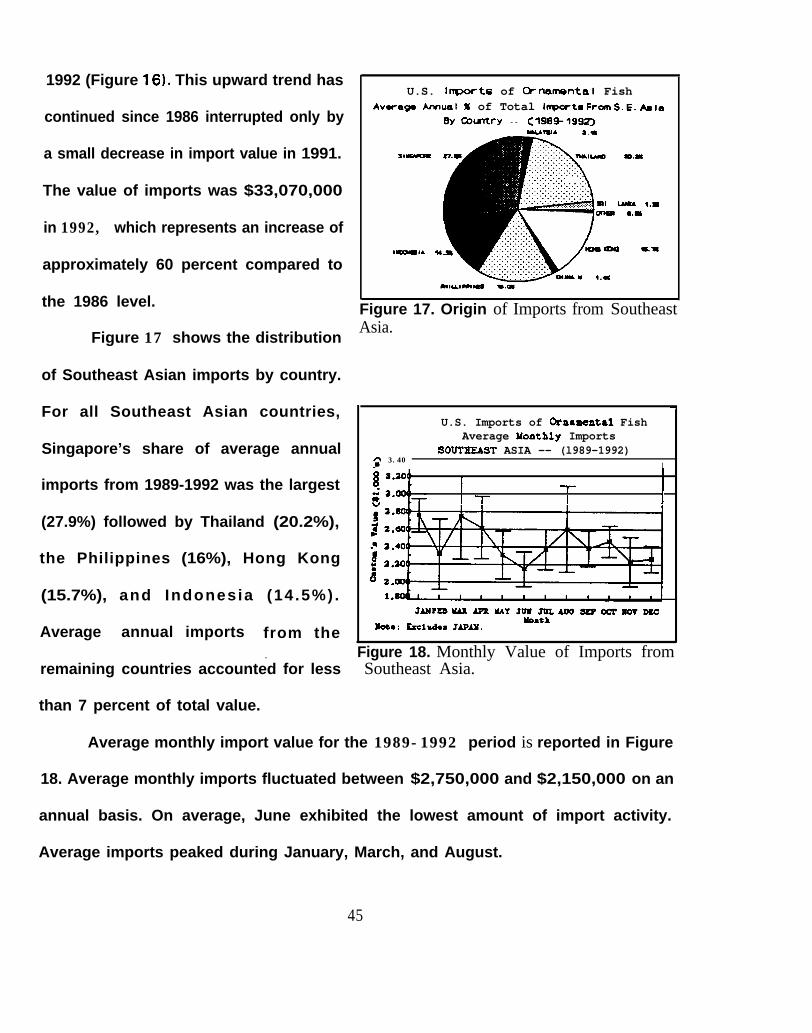
Figure 17 shows the distribution
of Southeast Asian imports by country.
For all Southeast Asian countries,
Singapore’s share of average annual
imports from 1989-1992 was the largest
(27.9%) followed by Thailand (20.2%),
the Philippines (16%), Hong Kong
(15.7%), and Indonesia (14 .5%) .
Average annual imports from the
U.S. Imports of Ornamental FishAvra9. Amusl x of Total hpcrts Fran S.E. kla
By Gxmtry -- c1989-'19%a.*
=.I
~.~.~.~.~.‘.‘_~.‘.‘,~:::::::
a1 UYI ,.IQlwI @.I,
t-4. Y. mn ..I
Figure 17. Origin of Imports from SoutheastAsia.
7
U.S. Imports of Osnaoental FishAverage Yonthly Imports
2 3.40SOUTEEAST ASIA -- (l989-1992)
I
I
II
-I-I -I- I I
. Figure 18. Monthly Value of Imports fromremaining countries accounted for less Southeast Asia.
than 7 percent of total value.
Average monthly import value for the 1989-1992 period is reported in Figure
18. Average monthly imports fluctuated between $2,750,000 and $2,150,000 on an
annual basis. On average, June exhibited the lowest amount of import activity.
Average imports peaked during January, March, and August.
45
Average Southeast Asian import values exhibited substantial variability over the
year particularly during the months of February, March, and August. In each of these
months, the standard deviation about the mean was approximately $500,000. In the
remaining months the standard deviation was consistently less.
Australia and Pacific Islands: total
Total Imports--AUSTRALIA 81 PACIFIC ISL.1982-1992 (.XCludlng 1988)
imports from Australia and the Pacific
Islands increased substantially over the
1982 to 1992 time period (Figure 19).
Growth in annual imports was
particularly dramatic from 1989-1992 as
compared to the earlier time period.
Much of the growth can be attributed to Pacific Islands
increases in imports through Australian, Marshall Islands, and Fijian ports.
Figure 19. Annual Imports from Australia and
Imports of ornamental fish
increased slightly more than 25 percent
from 1989 to 1991, before dropping 9..
percent in 1992. The total value of
imports from the region peaked in 1991
at $1,042,000.
The relative share of average
annual import value by country is shown
-
U.S. In-ports of Ornamental FishAverage Annual % of Total Imorts BY C o u n t r y
AUSTRALIA 41 PACIFIC ISLANDS -- (1989-1992)
Figure 20. Origin of Imports from Australiaand Pacific Islands.
in Figure 20. Average annual import value is greatest from the Marshall Islands
46
(28.9%) followed by Australia (20.5%),
Fiji Islands (10.8%), Tonga Islands (5%)
and Cook Islands (3.8%). Import value in
the “Other” category represents nearly
one-third of the region’s total value. The
countries in the “Other” category
exhibited either an erratic pattern of
U.S. Imports of 0rnrrmta.l F ishAverage Monthly Imports
AUSTRALIA A PACIFIC ISLANDS -- (1989-1992)
Figure 21. Monthly Value of Imports fromimports or the data only showed import Australia and Pacific Islands.
values for one or two years from 1989 to 1992. For example, Palau had less than
$10,000 per year in import value for 1989 and 1990. In 1991 and 1992, however,
Palau’s imports increased ten-fold to $110,OO per year.
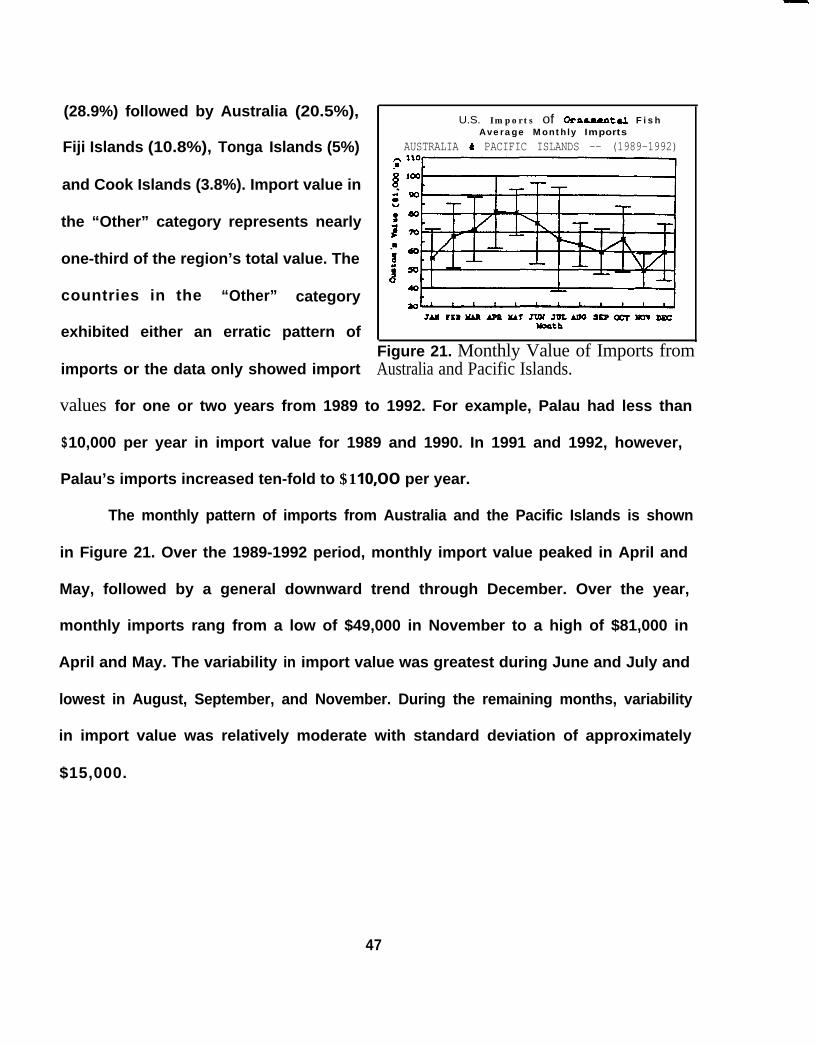
The monthly pattern of imports from Australia and the Pacific Islands is shown
in Figure 21. Over the 1989-1992 period, monthly import value peaked in April and
May, followed by a general downward trend through December. Over the year,
monthly imports rang from a low of $49,000 in November to a high of $81,000 in
April and May. The variability in import value was greatest during June and July and
lowest in August, September, and November. During the remaining months, variability
in import value was relatively moderate with standard deviation of approximately
$15,000.
47
A frica : the total value of
ornamental fish imported from Africa is
shown in Figure 22 for 1982 to 1992.
The total annual value of imports has
declined steadily since 1989. Imports
were valued at $1,046,000 in 1989 and
$638,000 in 1992. Annual import value
fell more than 20 percent from 1989 to
T o t a l Ir?morts--AFRICA
1982- 1992 Cexc I ua I ng igee)
;?gure 22. Annual Imports from Africa.
1990 and fell even more (nearly 29Oh) from 1990 to 1991. By comparison, 1992
imports were only 5 percent less than 1991.
The share of total annual average
import value is shown in Figure 23 for
countries in the African region. As Figure
23 shows, from 1989 to 1992, Nigeria
(51.7%) and Zaire (24.9%) accounted
for approximately 75% of the total value
of ornamental fish imported to the
United States from the African region.
U.S. Imports of Ornamental FlshAverage Annual % of Total Imports 9y Country
AFRICA -- c 1989- 199zgY I”1 ,.I
Figure 23. Origin of Imports from Africa.
Kenya is the only other country that had an import share greater than 5 percent. For
the entire region, many countries showed somewhat erratic patterns of imports having
at least some, but highly variable, imports in each of the four years or showing
imports in only small amounts in only three or fewer years. Even countries with high
48
import values showed considerable U.S. Imports of &nrruntrl Fish
variability in import value. For example,
the import value for Nigeria declined
from $617,700 in 1989 to nearly half of
that amount in each of the next three
years.
Avcr8& UontNy ImportsAFRICA -- < 1989-1992)
The seasonal pattern of monthly
import values from the African region areF@weAfrica.
24. Monthly Value of Imports from
shown in Figure 24. Monthly African imports are notable for two reasons. First,
average’ monthly import value peaks sharply in March (more than $150,000) as
compared to the rest of the year. March imports, however, show substantial variability
with a standard deviation of nearly $125,000. Second, for the rest of the year, there
is very little variability in monthly import value. The standard deviation for all months
other than March is only slightly more than $50,000. After March, import values
decline steadily through August. After August, imports rise steadily to a moderate
peak in November, decline slightly in December, and rise over January and February
to the March peak.
49

Middle East: the total annual
import value from Middle Eastern
countries is shown in Figure 25. The
Custom’s data showed no imports of
ornamental fish or other commodities
falling into the ornamentals category
prior to 1989. However, with theL
Total Imports--MIDDLE EAST1982-1992 Cexcludlng 19ae)
Q,
exception of 1990,Figure! 25. Annual Imports from the Middle
Middle Eastern East.
imports have remained nearly constant ranging from $68,100 and $64,900 per year.
Of the countries that for the Middle Eastern region only Israel and Bahrain had non-
zero export values over the 1989-1992 period. Of these two countries, Bahrain was
54% of average annual imports, with Israel making up the balance of total imports.
Average monthly import values from the Middle East showed no particular pattern and
were highly variable in most months.
5 0
U.S.A. Ornamental Fish Exports By Region
Canada: total annual U.S. exports
to Canada are shown in Figure 29. Total
annual exports reached a low of
$993,000 in 1987, but more than
doubled f rom 1989 to 1990 by
increasing from $1,796,000 t o
$4,181,000. Since 1990, the total value
of exports to Canada has remained nearly
constant, averaging $4,105,000 per
year. The pattern of average monthly
export value is shown in Figure 30. With
the exception of May and June, average
monthly U.S. export values to Canada
range from a high of $330,000 and
Figure 29. Annual Value of Exports to Canada.
Tota l E x p o r t s - - C A N A D A1982- 1992 (exc l uding 1988)
5.w , I
Year
U . S . boorts of o-rmmntol Fish
Awraoe Monthly ticports
c4m - - Cl~S-lS~
$280,000. Average export value duringFigure 30. Monthly Values of Exports to
May and June drops below $250,000. Canada.
Otherwise, average monthly export value is nearly constant. However, the standard
deviation of $100,000 for most months indicates that over a period of analysis, U.S.
export trade with Canada exhibited a fair amount of volatility.
51
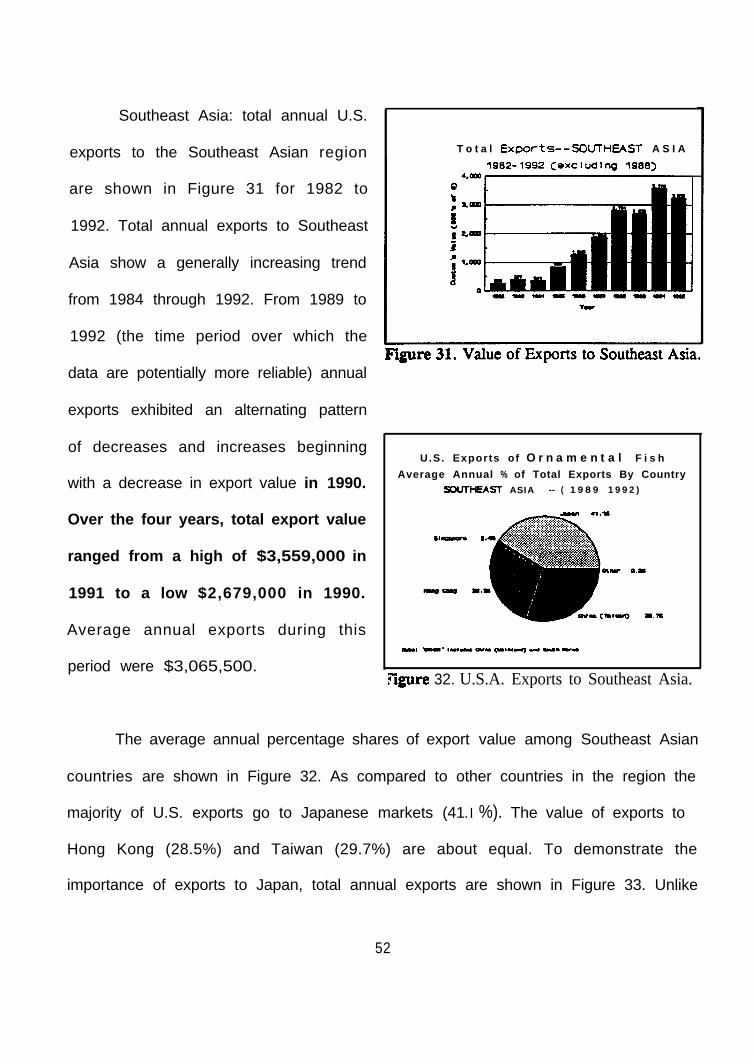
Southeast Asia: total annual U.S.
exports to the Southeast Asian region
are shown in Figure 31 for 1982 to
1992. Total annual exports to Southeast
Asia show a generally increasing trend
from 1984 through 1992. From 1989 to
1992 (the time period over which the
data are potentially more reliable) annual
exports exhibited an alternating pattern
of decreases and increases beginning
with a decrease in export value in 1990.
Over the four years, total export value
ranged from a high of $3,559,000 in
1991 to a low $2,679,000 in 1990.
Average annual exports during this
period were $3,065,500.
T o t a l Exports--SOmHEAST A S I A
U.S. Exports of O r n a m e n t a l F i s h
Average Annual % of Total Exports By Country
WI-EAST ASIA -- ( 1989 1992)
&ure 32. U.S.A. Exports to Southeast Asia.
The average annual percentage shares of export value among Southeast Asian
countries are shown in Figure 32. As compared to other countries in the region the
majority of U.S. exports go to Japanese markets (41.l %). The value of exports to
Hong Kong (28.5%) and Taiwan (29.7%) are about equal. To demonstrate the
importance of exports to Japan, total annual exports are shown in Figure 33. Unlike
52
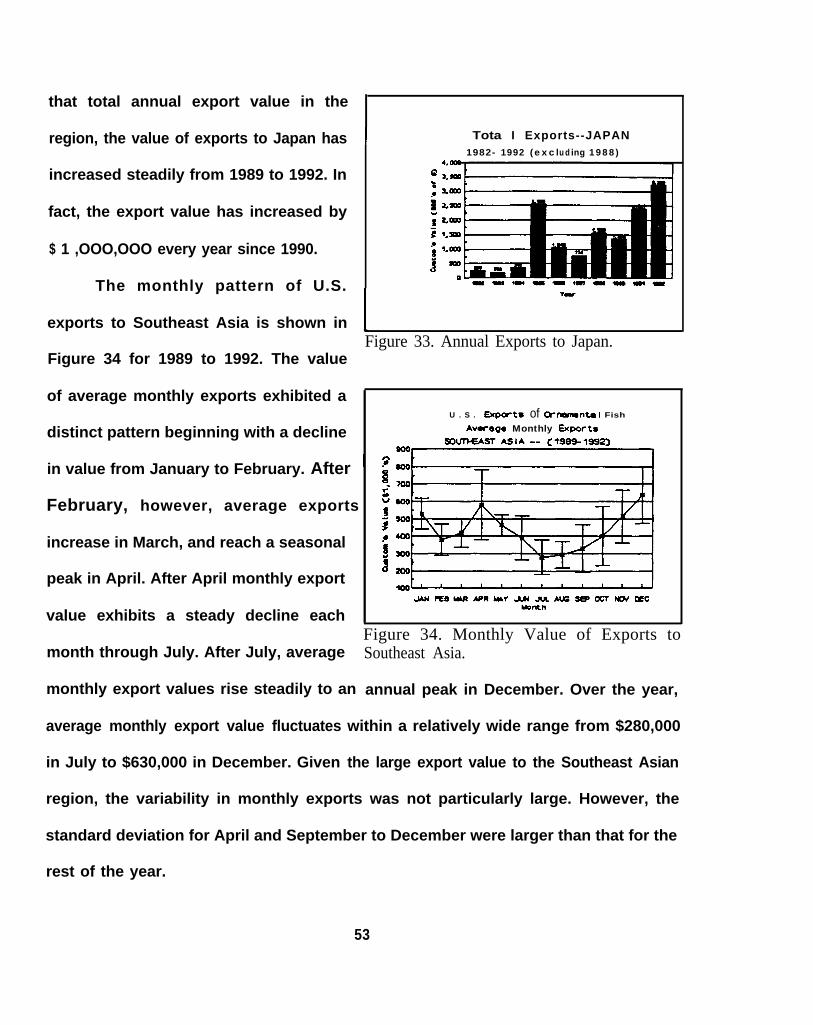
that total annual export value in the
region, the value of exports to Japan has
increased steadily from 1989 to 1992. In
fact, the export value has increased by
$ 1 ,OOO,OOO every year since 1990.
The monthly pattern of U.S.
exports to Southeast Asia is shown in
Figure 34 for 1989 to 1992. The value
of average monthly exports exhibited a
distinct pattern beginning with a decline
in value from January to February. After
February, however, average exports
increase in March, and reach a seasonal
peak in April. After April monthly export
value exhibits a steady decline each
month through July. After July, average
monthly export values rise steadily to an
Tota I Exports--JAPAN1982- 1992 (excl udi ng 1988)
Figure 33. Annual Exports to Japan.
I PQ5’”
f
5)1
U . S . ExDwts of OV’WVIS~~~I Fish
Avuago Monthly Exwrts
Figure 34. Monthly Value of Exports toSoutheast Asia.
annual peak in December. Over the year,
average monthly export value fluctuates within a relatively wide range from $280,000
in July to $630,000 in December. Given the large export value to the Southeast Asian
region, the variability in monthly exports was not particularly large. However, the
standard deviation for April and September to December were larger than that for the
rest of the year.
53
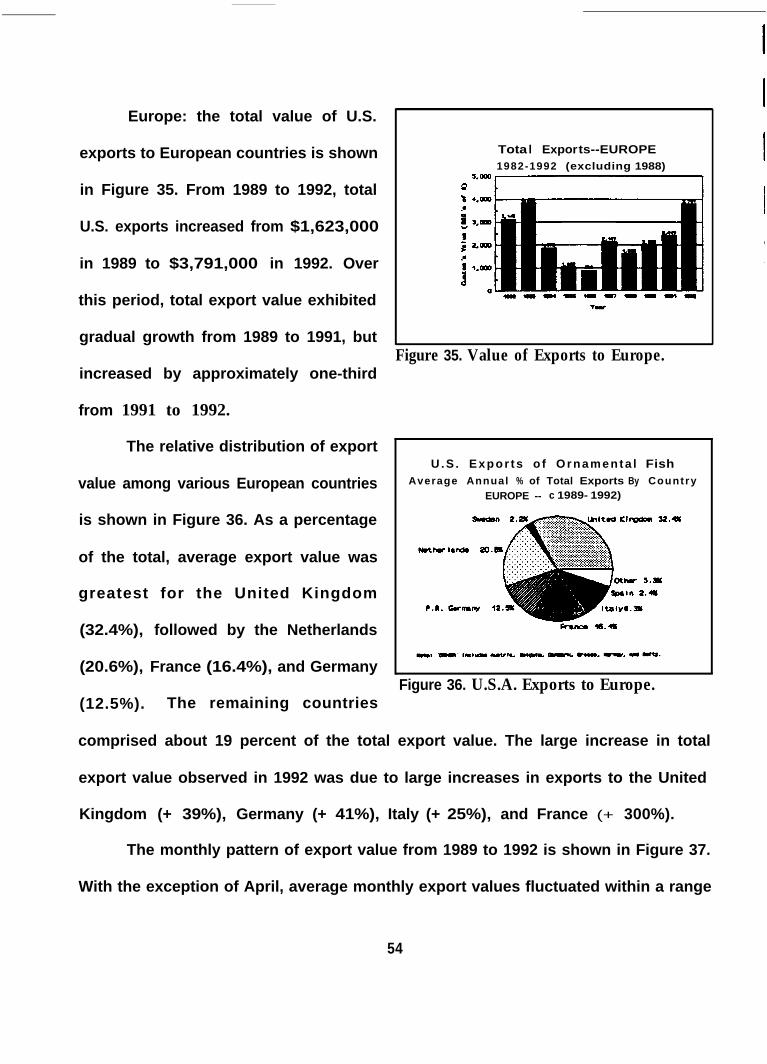
Europe: the total value of U.S.
exports to European countries is shown
in Figure 35. From 1989 to 1992, total
U.S. exports increased from $1,623,000
in 1989 to $3,791,000 in 1992. Over
this period, total export value exhibited
Tota l Exports--EUROPE1982-1992 (excluding 1988)
gradual growth from 1989 to 1991, butFigure 35. Value of Exports to Europe.
increased by approximately one-third
from 1991 to 1992.
The relative distribution of export
value among various European countries
is shown in Figure 36. As a percentage
of the total, average export value was
greatest for the United Kingdom
(32.4%), followed by the Netherlands
(20.6%), France (16.4%), and Germany
(12.5%). The remaining countries
U.S . Expor ts o f Ornamenta l FishAverage Annual % of Total Exports By Country
EUROPE -- c 1989- 1992)
Figure 36. U.S.A. Exports to Europe.
comprised about 19 percent of the total export value. The large increase in total
export value observed in 1992 was due to large increases in exports to the United
Kingdom (+ 39%), Germany (+ 41%), Italy (+ 25%), and France (+ 300%).
The monthly pattern of export value from 1989 to 1992 is shown in Figure 37.
With the exception of April, average monthly export values fluctuated within a range
54
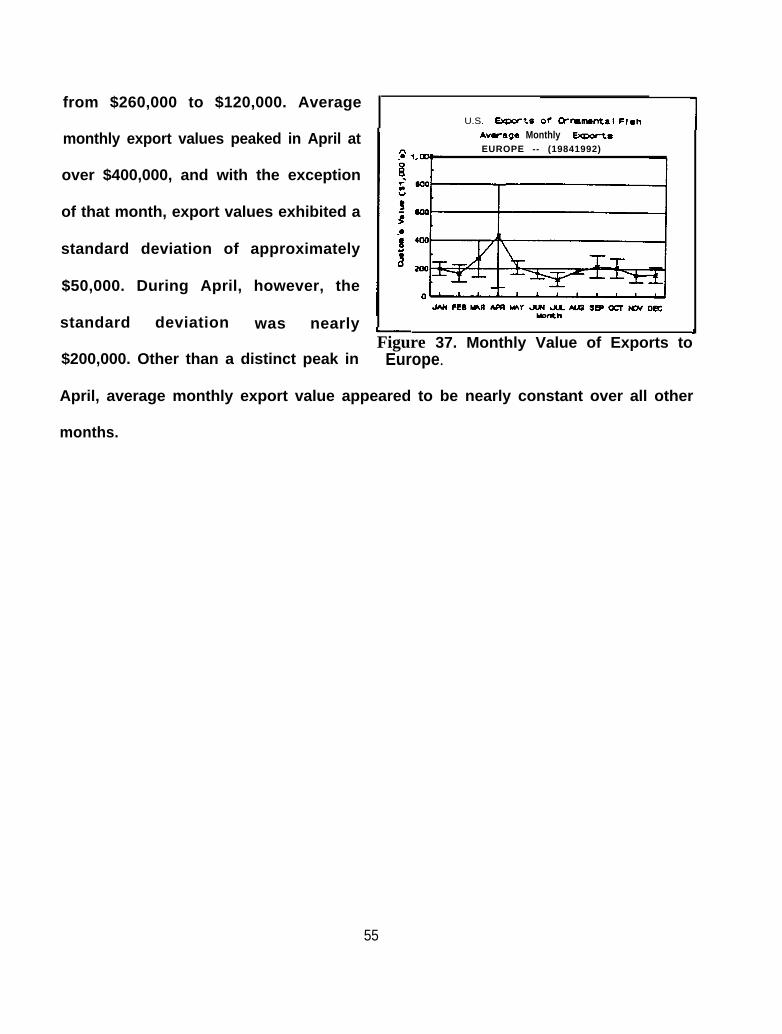
from $260,000 to $120,000. AverageU.S. Ucporte or Crmmm8I Ffsh
h+uage Monthly tqxxtsEUROPE -- (19841992)
monthly export values peaked in April at
over $400,000, and with the exception
of that month, export values exhibited a
standard deviation of approximately
$50,000. During April, however, the
standard deviation was nearly I
$200,000. Other than a distinct peak inFigure 37. Monthly Value of Exports to Europe.
1
April, average monthly export value appeared to be nearly constant over all other
months.
55


![A second visit to the United States of North America [microform]](https://static.fdokumen.com/doc/165x107/6336583562e2e08d490372db/a-second-visit-to-the-united-states-of-north-america-microform.jpg)