
HiT United States of America - WHO | World Health Organization
467
United States of America Health system review Vol. 15 No. 3 2013 Health Systems in Transition Thomas Rice • Pauline Rosenau Lynn Y. Unruh • Andrew J. Barnes Richard B. Saltman • Ewout van Ginneken (editors)
-
Upload
khangminh22 -
Category
Documents
-
view
1 -
download
0
Transcript of HiT United States of America - WHO | World Health Organization

United States of AmericaHealth system review
Vol. 15 No. 3 2013
Health Systems in Transition
Thomas Rice • Pauline RosenauLynn Y. Unruh • Andrew J. Barnes
Richard B. Saltman • Ewout van Ginneken (editors)

Richard B. Saltman and Ewout van Ginneken (Editors) and Reinhard Busse (Series editor) were responsible for this HiT
Editorial Board
Series editorsReinhard Busse, Berlin University of Technology, GermanyJosep Figueras, European Observatory on Health Systems and PoliciesMartin McKee, London School of Hygiene & Tropical Medicine, United KingdomElias Mossialos, London School of Economics and Political Science, United KingdomSarah Thomson, European Observatory on Health Systems and PoliciesEwout van Ginneken, Berlin University of Technology, Germany
Series coordinatorGabriele Pastorino, European Observatory on Health Systems and Policies
Editorial teamJonathan Cylus, European Observatory on Health Systems and PoliciesCristina Hernández-Quevedo, European Observatory on Health Systems and PoliciesMarina Karanikolos, European Observatory on Health Systems and PoliciesAnna Maresso, European Observatory on Health Systems and PoliciesDavid McDaid, European Observatory on Health Systems and PoliciesSherry Merkur, European Observatory on Health Systems and PoliciesPhilipa Mladovsky, European Observatory on Health Systems and PoliciesDimitra Panteli, Berlin University of Technology, GermanyWilm Quentin, Berlin University of Technology, GermanyBernd Rechel, European Observatory on Health Systems and PoliciesErica Richardson, European Observatory on Health Systems and PoliciesAnna Sagan, European Observatory on Health Systems and Policies
International advisory boardTit Albreht, Institute of Public Health, SloveniaCarlos Alvarez-Dardet Díaz, University of Alicante, SpainRifat Atun, Harvard University, United StatesJohan Calltorp, Nordic School of Public Health, SwedenArmin Fidler, The World BankColleen Flood, University of Toronto, CanadaPéter Gaál, Semmelweis University, HungaryUnto Häkkinen, Centre for Health Economics at Stakes, FinlandWilliam Hsiao, Harvard University, United StatesAllan Krasnik, University of Copenhagen, DenmarkJoseph Kutzin, World Health OrganizationSoonman Kwon, Seoul National University, Republic of KoreaJohn Lavis, McMaster University, CanadaVivien Lin, La Trobe University, AustraliaGreg Marchildon, University of Regina, CanadaAlan Maynard, University of York, United KingdomNata Menabde, World Health OrganizationEllen Nolte, Rand Corporation, United KingdomCharles Normand, University of Dublin, IrelandRobin Osborn, The Commonwealth Fund, United StatesDominique Polton, National Health Insurance Fund for Salaried Staff (CNAMTS), FranceSophia Schlette, Federal Statutory Health Insurance Physicians Association, GermanyIgor Sheiman, Higher School of Economics, Russian FederationPeter C. Smith, Imperial College, United KingdomWynand P.M.M. van de Ven, Erasmus University, The NetherlandsWitold Zatonski, Marie Sklodowska-Curie Memorial Cancer Centre, Poland

Health Systems in TransitionThomas Rice, Fielding School of Public Health, University of California, Los AngelesPauline Rosenau, School of Public Health, Health Science Center, University of Texas, HoustonLynn Y. Unruh, Department of Health Management and Informatics at the University of Central FloridaAndrew J. Barnes, Virginia Commonwealth University School of Medicine
Editors: Richard B. Saltman, Emory University in Atlanta and European Observatory on Health Systems and PoliciesEwout van Ginneken, Berlin University of Technology and European Observatory on Health Systems and Policies
Health System Review2013
United States of America:
The European Observatory on Health Systems and Policies is a partnership, hosted by the WHO Regional Office for Europe, which includes the Governments of Belgium, Finland, Ireland, the Netherlands, Norway, Slovenia, Spain, Sweden, the United Kingdom and the Veneto Region of Italy; the European Commission; the European Investment Bank; the World Bank; UNCAM (French National Union of Health Insurance Funds); the London School of Economics and Political Science; and the London School of Hygiene & Tropical Medicine.

Keywords:
DELIVERY OF HEALTH CARE
EVALUATION STUDIES
FINANCING, HEALTH
HEALTH CARE REFORM
HEALTH SYSTEM PLANS – organization and administration
UNITED STATES OF AMERICA
© World Health Organization 2013 (acting as the host organization for, and secretariat of, the European Observatory on Health Systems and Policies).
All rights reserved. The European Observatory on Health Systems and Policies welcomes requests for permission to reproduce or translate its publications, in part or in full.
Please address requests about the publication to: Publications, WHO Regional Office for Europe, UN City, Marmorvej 51, DK-2100 Copenhagen Ø, Denmark
Alternatively, complete an online request form for documentation, health information, or for permission to quote or translate, on the Regional Office web site (http://www.euro.who.int/en/what-we-publish/publication-request-forms).
The views expressed by authors or editors do not necessarily represent the decisions or the stated policies of the European Observatory on Health Systems and Policies or any of its partners.
The designations employed and the presentation of the material in this publication do not imply the expression of any opinion whatsoever on the part of the European Observatory on Health Systems and Policies or any of its partners concerning the legal status of any country, territory, city or area or of its authorities, or concerning the delimitation of its frontiers or boundaries. Where the designation “country or area” appears in the headings of tables, it covers countries, territories, cities, or areas. Dotted lines on maps represent approximate border lines for which there may not yet be full agreement.
The mention of specific companies or of certain manufacturers’ products does not imply that they are endorsed or recommended by the European Observatory on Health Systems and Policies in preference to others of a similar nature that are not mentioned. Errors and omissions excepted, the names of proprietary products are distinguished by initial capital letters.
The European Observatory on Health Systems and Policies does not warrant that the information contained in this publication is complete and correct and shall not be liable for any damages incurred as a result of its use.
Printed and bound in the United Kingdom.
ISSN 1817–6127 Vol. 15 No. 3
Suggested citation:Rice T, Rosenau P, Unruh LY, Barnes AJ, Saltman RB, van Ginneken E. United States of America: Health system review. Health Systems in Transition, 2013; 15(3): 1– 431.

Co
nten
ts
Contents
Preface . . . . . . . . . . . . . . . . . . . . . . . . . . . . . . . . . . . . . . . . . . . . . . . . . . . . . . . . . . . . . . . . . . . . . . . . . . . . . . . . . . . . . . . . . . . . . . . . . . . . . . . . . vAcknowledgements . . . . . . . . . . . . . . . . . . . . . . . . . . . . . . . . . . . . . . . . . . . . . . . . . . . . . . . . . . . . . . . . . . . . . . . . . . . . . . . . . . . . viiList of abbreviations . . . . . . . . . . . . . . . . . . . . . . . . . . . . . . . . . . . . . . . . . . . . . . . . . . . . . . . . . . . . . . . . . . . . . . . . . . . . . . . . . . . ixList of tables, figures and boxes . . . . . . . . . . . . . . . . . . . . . . . . . . . . . . . . . . . . . . . . . . . . . . . . . . . . . . . . . . . . . . . . xvAbstract . . . . . . . . . . . . . . . . . . . . . . . . . . . . . . . . . . . . . . . . . . . . . . . . . . . . . . . . . . . . . . . . . . . . . . . . . . . . . . . . . . . . . . . . . . . . . . . . . . . . xixExecutive summary . . . . . . . . . . . . . . . . . . . . . . . . . . . . . . . . . . . . . . . . . . . . . . . . . . . . . . . . . . . . . . . . . . . . . . . . . . . . . . . . . . xxi
1. Introduction . . . . . . . . . . . . . . . . . . . . . . . . . . . . . . . . . . . . . . . . . . . . . . . . . . . . . . . . . . . . . . . . . . . . . . . . . . . . . . . . . . . . . . . . . . . . . 11.1 Geography and sociodemography . . . . . . . . . . . . . . . . . . . . . . . . . . . . . . . . . . . . . . . . . . . . . . . . . . . . . . . . . . . . . . 11.2 Economic context . . . . . . . . . . . . . . . . . . . . . . . . . . . . . . . . . . . . . . . . . . . . . . . . . . . . . . . . . . . . . . . . . . . . . . . . . . . . . . . . . . . . . 51.3 Political context . . . . . . . . . . . . . . . . . . . . . . . . . . . . . . . . . . . . . . . . . . . . . . . . . . . . . . . . . . . . . . . . . . . . . . . . . . . . . . . . . . . . . . . . 81.4 Health status . . . . . . . . . . . . . . . . . . . . . . . . . . . . . . . . . . . . . . . . . . . . . . . . . . . . . . . . . . . . . . . . . . . . . . . . . . . . . . . . . . . . . . . . . . 11
2. Organization and governance . . . . . . . . . . . . . . . . . . . . . . . . . . . . . . . . . . . . . . . . . . . . . . . . . . . . . . . . . . . . . . . 252.1 Overview of the health-care system . . . . . . . . . . . . . . . . . . . . . . . . . . . . . . . . . . . . . . . . . . . . . . . . . . . . . . . . . 262.2 Historical background . . . . . . . . . . . . . . . . . . . . . . . . . . . . . . . . . . . . . . . . . . . . . . . . . . . . . . . . . . . . . . . . . . . . . . . . . . . . 332.3 Organization . . . . . . . . . . . . . . . . . . . . . . . . . . . . . . . . . . . . . . . . . . . . . . . . . . . . . . . . . . . . . . . . . . . . . . . . . . . . . . . . . . . . . . . . . . 402.4 Decentralization and centralization . . . . . . . . . . . . . . . . . . . . . . . . . . . . . . . . . . . . . . . . . . . . . . . . . . . . . . . . . 472.5 Planning . . . . . . . . . . . . . . . . . . . . . . . . . . . . . . . . . . . . . . . . . . . . . . . . . . . . . . . . . . . . . . . . . . . . . . . . . . . . . . . . . . . . . . . . . . . . . . . . 542.6 Intersectorality . . . . . . . . . . . . . . . . . . . . . . . . . . . . . . . . . . . . . . . . . . . . . . . . . . . . . . . . . . . . . . . . . . . . . . . . . . . . . . . . . . . . . . . 592.7 Health information management . . . . . . . . . . . . . . . . . . . . . . . . . . . . . . . . . . . . . . . . . . . . . . . . . . . . . . . . . . . . . 632.8 Regulation . . . . . . . . . . . . . . . . . . . . . . . . . . . . . . . . . . . . . . . . . . . . . . . . . . . . . . . . . . . . . . . . . . . . . . . . . . . . . . . . . . . . . . . . . . . . . 702.9 Patient empowerment . . . . . . . . . . . . . . . . . . . . . . . . . . . . . . . . . . . . . . . . . . . . . . . . . . . . . . . . . . . . . . . . . . . . . . . . . . . . . 80
3. Financing . . . . . . . . . . . . . . . . . . . . . . . . . . . . . . . . . . . . . . . . . . . . . . . . . . . . . . . . . . . . . . . . . . . . . . . . . . . . . . . . . . . . . . . . . . . . . . . 913.1 Health expenditure . . . . . . . . . . . . . . . . . . . . . . . . . . . . . . . . . . . . . . . . . . . . . . . . . . . . . . . . . . . . . . . . . . . . . . . . . . . . . . . . . 923.2 Sources of revenue, financing and financial flows . . . . . . . . . . . . . . . . . . . . . . . . . . . . . . . . . . . 1023.3 Medicare . . . . . . . . . . . . . . . . . . . . . . . . . . . . . . . . . . . . . . . . . . . . . . . . . . . . . . . . . . . . . . . . . . . . . . . . . . . . . . . . . . . . . . . . . . . . . . 1083.4 Medicaid . . . . . . . . . . . . . . . . . . . . . . . . . . . . . . . . . . . . . . . . . . . . . . . . . . . . . . . . . . . . . . . . . . . . . . . . . . . . . . . . . . . . . . . . . . . . . . . 1203.5 Private health insurance . . . . . . . . . . . . . . . . . . . . . . . . . . . . . . . . . . . . . . . . . . . . . . . . . . . . . . . . . . . . . . . . . . . . . . . . . 1303.6 Out-of-pocket payments . . . . . . . . . . . . . . . . . . . . . . . . . . . . . . . . . . . . . . . . . . . . . . . . . . . . . . . . . . . . . . . . . . . . . . . . . 1463.7 Payment mechanisms . . . . . . . . . . . . . . . . . . . . . . . . . . . . . . . . . . . . . . . . . . . . . . . . . . . . . . . . . . . . . . . . . . . . . . . . . . . . . 148

Health systems in transition United States of Americaiv
4. Physical and human resources . . . . . . . . . . . . . . . . . . . . . . . . . . . . . . . . . . . . . . . . . . . . . . . . . . . . . . . . . . . . . 1594.1 Physical resources . . . . . . . . . . . . . . . . . . . . . . . . . . . . . . . . . . . . . . . . . . . . . . . . . . . . . . . . . . . . . . . . . . . . . . . . . . . . . . . . . 1604.2 Human resources . . . . . . . . . . . . . . . . . . . . . . . . . . . . . . . . . . . . . . . . . . . . . . . . . . . . . . . . . . . . . . . . . . . . . . . . . . . . . . . . . . 181
5. Provision of services . . . . . . . . . . . . . . . . . . . . . . . . . . . . . . . . . . . . . . . . . . . . . . . . . . . . . . . . . . . . . . . . . . . . . . . . . . . . 2075.1 Patient pathways . . . . . . . . . . . . . . . . . . . . . . . . . . . . . . . . . . . . . . . . . . . . . . . . . . . . . . . . . . . . . . . . . . . . . . . . . . . . . . . . . . . . 2085.2 Public health . . . . . . . . . . . . . . . . . . . . . . . . . . . . . . . . . . . . . . . . . . . . . . . . . . . . . . . . . . . . . . . . . . . . . . . . . . . . . . . . . . . . . . . . . 2155.3 Outpatient services: primary care . . . . . . . . . . . . . . . . . . . . . . . . . . . . . . . . . . . . . . . . . . . . . . . . . . . . . . . . . . . 2245.4 Outpatient services: specialty care . . . . . . . . . . . . . . . . . . . . . . . . . . . . . . . . . . . . . . . . . . . . . . . . . . . . . . . . . . 2325.5 Outpatient services: ambulatory surgical, emergency and urgent care . . . . . . . 2355.6 Acute inpatient care . . . . . . . . . . . . . . . . . . . . . . . . . . . . . . . . . . . . . . . . . . . . . . . . . . . . . . . . . . . . . . . . . . . . . . . . . . . . . . 2405.7 Dental care . . . . . . . . . . . . . . . . . . . . . . . . . . . . . . . . . . . . . . . . . . . . . . . . . . . . . . . . . . . . . . . . . . . . . . . . . . . . . . . . . . . . . . . . . . . . 2485.8 Mental health care . . . . . . . . . . . . . . . . . . . . . . . . . . . . . . . . . . . . . . . . . . . . . . . . . . . . . . . . . . . . . . . . . . . . . . . . . . . . . . . . . 2515.9 Pharmaceutical care . . . . . . . . . . . . . . . . . . . . . . . . . . . . . . . . . . . . . . . . . . . . . . . . . . . . . . . . . . . . . . . . . . . . . . . . . . . . . . 2565.10 Post-acute care: rehabilitation, intermittent home care and subacute care . 2595.11 Long-term care . . . . . . . . . . . . . . . . . . . . . . . . . . . . . . . . . . . . . . . . . . . . . . . . . . . . . . . . . . . . . . . . . . . . . . . . . . . . . . . . . . . 2645.12 Palliative care . . . . . . . . . . . . . . . . . . . . . . . . . . . . . . . . . . . . . . . . . . . . . . . . . . . . . . . . . . . . . . . . . . . . . . . . . . . . . . . . . . . . . . 2725.13 Complementary and alternative medicine . . . . . . . . . . . . . . . . . . . . . . . . . . . . . . . . . . . . . . . . . . . . . . 2745.14 Services from informal care-givers . . . . . . . . . . . . . . . . . . . . . . . . . . . . . . . . . . . . . . . . . . . . . . . . . . . . . . . 2795.15 Health services for specific populations . . . . . . . . . . . . . . . . . . . . . . . . . . . . . . . . . . . . . . . . . . . . . . . . . 281
6. Principal health reforms . . . . . . . . . . . . . . . . . . . . . . . . . . . . . . . . . . . . . . . . . . . . . . . . . . . . . . . . . . . . . . . . . . . . . . 2916.1 History of United States health reforms . . . . . . . . . . . . . . . . . . . . . . . . . . . . . . . . . . . . . . . . . . . . . . . . . . 2926.2 The Affordable Care Act . . . . . . . . . . . . . . . . . . . . . . . . . . . . . . . . . . . . . . . . . . . . . . . . . . . . . . . . . . . . . . . . . . . . . . 3006.3 Vulnerabilities during implementation . . . . . . . . . . . . . . . . . . . . . . . . . . . . . . . . . . . . . . . . . . . . . . . . . . . . 3156.4 The future of the ACA . . . . . . . . . . . . . . . . . . . . . . . . . . . . . . . . . . . . . . . . . . . . . . . . . . . . . . . . . . . . . . . . . . . . . . . . . . . 319
7. Assessment of the health system . . . . . . . . . . . . . . . . . . . . . . . . . . . . . . . . . . . . . . . . . . . . . . . . . . . . . . . . . . . 3217.1 Stated objectives of the health system . . . . . . . . . . . . . . . . . . . . . . . . . . . . . . . . . . . . . . . . . . . . . . . . . . . . . 3227.2 Financial protection: access and equity . . . . . . . . . . . . . . . . . . . . . . . . . . . . . . . . . . . . . . . . . . . . . . . . . . . 3237.3 Health outcomes, health services outcomes and quality of care . . . . . . . . . . . . . . . . . 3377.4 Health system expenditures and out-of-pocket costs . . . . . . . . . . . . . . . . . . . . . . . . . . . . . . . . 3607.5 Health system efficiency . . . . . . . . . . . . . . . . . . . . . . . . . . . . . . . . . . . . . . . . . . . . . . . . . . . . . . . . . . . . . . . . . . . . . . . . 367
8. Conclusions . . . . . . . . . . . . . . . . . . . . . . . . . . . . . . . . . . . . . . . . . . . . . . . . . . . . . . . . . . . . . . . . . . . . . . . . . . . . . . . . . . . . . . . . . . . 373
9. Appendices . . . . . . . . . . . . . . . . . . . . . . . . . . . . . . . . . . . . . . . . . . . . . . . . . . . . . . . . . . . . . . . . . . . . . . . . . . . . . . . . . . . . . . . . . . . . 3759.1 References . . . . . . . . . . . . . . . . . . . . . . . . . . . . . . . . . . . . . . . . . . . . . . . . . . . . . . . . . . . . . . . . . . . . . . . . . . . . . . . . . . . . . . . . . . . . 3759.2 Useful web sites . . . . . . . . . . . . . . . . . . . . . . . . . . . . . . . . . . . . . . . . . . . . . . . . . . . . . . . . . . . . . . . . . . . . . . . . . . . . . . . . . . . . 4259.3 HiT methodology and production process . . . . . . . . . . . . . . . . . . . . . . . . . . . . . . . . . . . . . . . . . . . . . . . 4279.4 The review process . . . . . . . . . . . . . . . . . . . . . . . . . . . . . . . . . . . . . . . . . . . . . . . . . . . . . . . . . . . . . . . . . . . . . . . . . . . . . . . . 4299.5 About the authors . . . . . . . . . . . . . . . . . . . . . . . . . . . . . . . . . . . . . . . . . . . . . . . . . . . . . . . . . . . . . . . . . . . . . . . . . . . . . . . . . . 430

Preface
Preface
The Health Systems in Transition (HiT) series consists of country-based reviews that provide a detailed description of a health system and of reform and policy initiatives in progress or under development in a
specific country. Each review is produced by country experts in collaboration with the Observatory’s staff. In order to facilitate comparisons between countries, reviews are based on a template, which is revised periodically. The template provides detailed guidelines and specific questions, definitions and examples needed to compile a report.
HiTs seek to provide relevant information to support policy-makers and analysts in the development of health systems in Europe. They are building blocks that can be used:
• to learn in detail about different approaches to the organization, financing and delivery of health services and the role of the main actors in health systems;
• to describe the institutional framework, the process, content and implementation of health-care reform programmes;
• to highlight challenges and areas that require more in-depth analysis;• to provide a tool for the dissemination of information on health systems
and the exchange of experiences of reform strategies between policy-makers and analysts in different countries; and
• to assist other researchers in more in-depth comparative health policy analysis
Compiling the reviews poses a number of methodological problems. In many countries, there is relatively little information available on the health system and the impact of reforms. Due to the lack of a uniform data source, quantitative data on health services are based on a number of different sources,

Health systems in transition United States of Americavi
including the World Health Organization (WHO) Regional Office for Europe’s European Health for All database, data from national statistical offices, Eurostat, the Organisation for Economic Co-operation and Development (OECD) Health Data, data from the International Monetary Fund (IMF), the World Bank’s World Development Indicators and any other relevant sources considered useful by the authors. Data collection methods and definitions sometimes vary, but typically are consistent within each separate review.
A standardized review has certain disadvantages because the financing and delivery of health care differ across countries. However, it also offers advantages, because it raises similar issues and questions. HiTs can be used to inform policy-makers about experiences in other countries that may be relevant to their own national situation. They can also be used to inform comparative analysis of health systems. This series is an ongoing initiative and material is updated at regular intervals.
Comments and suggestions for the further development and improvement of the HiT series are most welcome and can be sent to [email protected].
HiTs and HiT summaries are available on the Observatory’s web site (http://www.healthobservatory.eu).
Ackn
ow
ledg
emen
ts
Acknowledgements
The Health Systems in Transition (HiT) profile on the United States was written by Thomas Rice (University of California, Los Angeles), Pauline Rosenau (University of Texas), Lynn Unruh (University of Central Florida)
and Andrew Barnes (Virginia Commonwealth University). It was edited by Ewout van Ginneken (Berlin University of Technology) and Richard Saltman (Emory University). The Research Director for this HiT was Reinhard Busse (Berlin University of Technology).
The European Observatory on Health Systems and Policies is grateful to Gerard Anderson (Johns Hopkins University), Lawrence D. Brown (Columbia University), Nick Fahy (Independent consultant and researcher), Jon Gabel (NORC at the University of Chicago), George Greenberg (U.S. Department of Health and Human Services, Office of the Assistant Secretary for Health – ASPE), Richard Kronick (ASPE), Jonathan Oberlander (University of North Carolina-Chapel Hill), Mark Peterson (University of California, Los Angeles), Marc Rodwin (Suffolk University Law School), Richard Scheffler (University of California, Berkeley), Katherine Swartz (Harvard University), and Leon Wyszewianski (University of Michigan) for reviewing all or part of the report. All opinions are those of the authors and do not reflect the views of the reviewers. The authors are also grateful to Beth Umland of Mercer for providing information on the scope of private insurance coverage for Chapter 3.
Thomas Rice thanks the Rockefeller Foundation for providing him with a residency at its Bellagio Center in Italy, during which he worked on Chapter 7 of the book. Pauline Rosenau thanks the University of Otago Medical School in New Zealand for setting time aside to work on the book during her William Evans Visiting Fellowship. Lynn Unruh thanks the University of Central Florida for providing a sabbatical to work on Chapters 4 and 5 of the book.

Health systems in transition United States of Americaviii
Ewout van Ginneken thanks the Commonwealth Fund for allowing him to work on this HiT while on a Commonwealth Fund Harkness Fellowship in Health Care Policy and Practice at the Harvard School of Public Health.
The current series of HiT profiles has been prepared by the staff of the European Observatory on Health Systems and Policies. The European Observatory on Health Systems and Policies is a partnership between the WHO Regional Office for Europe, the Governments of Belgium, Finland, Ireland, the Netherlands, Norway, Slovenia, Spain, Sweden, the United Kingdom and the Veneto Region of Italy, the European Commission, the European Investment Bank, the World Bank, UNCAM (French National Union of Health Insurance Funds), the London School of Economics and Political Science, and the London School of Hygiene & Tropical Medicine. The Observatory team working on the HiT profiles is led by Josep Figueras, Director, and Elias Mossialos, Co-Director, and heads of the Research Hubs Martin McKee, Reinhard Busse and Richard Saltman. The production and copy-editing process was coordinated by Jonathan North, with the support of Caroline White, Mary Allen (copy-editing), Steve Still (design and layout) and Sarah Cook (proofreading).
Special thanks are extended to the OECD Health Data from which international data on health and health services were extracted; and to the Commonwealth Fund for data from their International Health Policy Surveys. The HiT reflects data available in November 2012.

List of abbreviations
Abbreviations
AARP American Association of Retired Persons
ABMS American Board of Medical Specialists
ACA Affordable Care Act
ACAOM Accreditation Commission for Acupuncture and Oriental Medicine
ACO Accountable Care Organization
ADA Americans with Disabilities Act
ADLs activities of daily living
ADN Associate Degree in Nursing
AHA American Hospital Association
AHIP America’s Health Insurance Plans
AHRQ Agency for Healthcare Research and Quality
AIAN American Indian and Alaska Native
ALF Assisted Living Facility
AMA American Medical Association
AMP average manufacturer price
AOA American Osteopathic Association
APC Ambulatory Payment Classification
APHA American Public Health Association
APRN advanced practice registered nurse
ARRA American Recovery and Reinvestment Act
ASC ambulatory surgical centre
ATSDR Agency for Toxic Substances and Disease Registry
BLS United States Bureau of Labor Statistics
BMI body mass index
BSN Bachelor of Science Degree in Nursing
CAHPS Consumer Assessment of Health Plan Survey
CAM complementary and alternative medicine
CBO Congressional Budget Office
CCRC Continuing Care Retirement Community
List o
f abb
reviation
s
Health systems in transition United States of Americax
Abbreviations
CDC Centers for Disease Control and Prevention
CDRH Center for Devices and Radiological Health
CERCLA Comprehensive Environmental Response, Compensation and Liability Act
CfCs Conditions for Coverage
CHC Community Health Center
CHIP Children’s Health Insurance Program
CHW community health worker
CLASS Community Living Assistance Services and Support Act
CMS Centers for Medicare & Medicaid Services
CNA certified nursing assistant
COBRA Consolidated Omnibus Budget Reconciliation Act
COMLEX Comprehensive Osteopathic Medical Licensing Exam
CON Certificate of Need
CO-OP Consumer Operated and Oriented Plans Program
COPD chronic obstructive pulmonary disease
CoPs Conditions of Participations
CPOE computerized provider-order entry
CR cost reimbursement
CT computerized axial tomography
DDS Doctor of Dental Surgery
DERP Drug Effectiveness Review Project
DMD Doctor of Dental Medicine
DNP Doctor of Nursing Practice
DRG diagnosis-related group
DSH disproportionate share hospital
DTP diphtheria, tetanus and pertussis
ED Emergency Department
EHR electronic health record
EIA Environmental Impact Assessments
EMC emergency medical condition
EMR electronic medical record
EMT emergency medical technician
EMTALA Emergency Treatment and Active Labor Act
EPA Environmental Protection Agency
ERISA Employee Retirement Income Security Act
FDA Food and Drug Administration
FFS fee for service
FIFRA Federal Insecticide, Fungicide, and Rodenticide Act
FMAP Federal Medical Assistance Percentage
FPL Federal Poverty Level
FTE full-time equivalent

Health systems in transition United States of America xi
Abbreviations
GAO Government Accountability Office
GDP gross domestic product
HCFAC Health Care Fraud and Abuse Control Program
HEDIS Healthcare Effectiveness Data and Information Set
HHS Department of Health and Human Services
HIE Health Information Exchange
HIMSS Health Information and Management Systems Society
HIPAA Health Insurance Portability and Accountability Act
HIT health information technology
HITECH Health Information Technology for Economic and Clinical Health
HIV/AIDS human immunodeficiency virus/acquired immunodeficiency syndrome
HMO health maintenance organization
HPSA Health Professional Shortage Area
HQA Hospital Quality Alliance
HQID Hospital Quality Incentive Demonstration
HRSA Health Resources and Services Administration
HSA Health Savings Account
HTA health technology assessment
IADL instrumental activities of daily living
ICF/MR/DD Intermediate Care Facilities for the Mentally Retarded or Developmentally Disabled
ICU intensive care unit
IHCIA Indian Health Care Improvement Act
IHS Indian Health Service
IMG international medical graduate
IMPACT Improving Mood: Promoting Access to Collaborative Care
ING international nursing graduate
IOM Institute of Medicine
IPAB Independent Payment Advisory Board
IRF-PAI Inpatient Rehabilitation Facility-Patient Assessment Instrument
IRS Internal Revenue Service
LPN licensed practical nurse
LTC long-term care
LVN licensed vocational nurse
MCBS Medicare Current Beneficiary Survey
MCO managed care organization
MDS Minimum Data Set
MDS-HC Minimum Data Set for Home Care
MDS-NH Minimum Data Set for Nursing Homes
MedCac Medicare Evidence Development and Coverage Advisory Committee
MEDPAC Medicare Payment Advisory Commission
MHS Military Health System

Health systems in transition United States of Americaxii
Abbreviations
MLR medical loss ratio
MRI magnetic resonance imaging
MSE medical screening examination
MSN Master of Science in Nursing
MUA Medically Underserved Area
NACCHO National Association of County and City Health Officials
NAPLEX North American Pharmacist Licensure Exam
NASMHPD National Association of State Mental Health Program Directors
NCCAM National Center for Complementary and Alternative Medicines
NCCAOM National Certification Commission for Acupuncture and Oriental Medicine
NCCPA National Commission on Certification of Physician Assistants
NCLEX-RN National Council Licensure Examination–Registered Nurses
NCQA National Committee for Quality Assurance
NGO nongovernmental organization
NHIS National Health Interview Survey
NHPCO National Hospice and Palliative Care Organization
NHVBP Nursing Home Value-Based Purchasing project
NIH National Institutes of Health
NIOSH National Institute of Occupational Safety and Health
NP nurse practitioner
OAM Office of Alternative Medicine
OASIS Outcome and Assessment Information Set
OECD Organisation for Economic Co-operation and Development
OHRP Office for Human Research Protections
OMB Office of Management and Budget
OOP out of pocket
OPPS Outpatient Prospective Payment System
OSCAR Online Survey Certification and Report
OSCP Office of Science Coordination and Policy
OSHA Occupational Safety and Health Administration
OT occupational therapist
OTA Office of Technology Assessment
P4P pay-for-performance
PA physician assistant
PBM pharmaceutical benefits manager
PBMSHG Pharmacy Benefits Management Strategic Healthcare Group
PCMH patient-centred medical home
PCMH-N PCMH neighbourhoods
PCORI Patient-centered Outcomes Research Institute
PCP primary care provider
PDP Prescription Drug Plan

Health systems in transition United States of America xiii
Abbreviations
PEC Department of Defense Pharmacoeconomic Center
PEPFAR United States President’s Emergency Plan for AIDS Relief
PHP prepaid health plan
PHR personal health record
POS point of service
PPO preferred provider organization
PPP purchasing power parity
PSQIA Patient Safety and Quality Improvement Act
PT physical therapist
PTSD post-traumatic stress disorder
QI quality improvement
RAI Resident Assessment Instrument
RBRVS Resource-based Relative Value Scale
RCT randomized controlled trial
RHIO Regional Health Information Organization
RN registered nurse
RT respiratory therapist
SAMHSA Substance Abuse and Mental Health Services Administration
SAP Scientific Advisory Panel
SGR Sustainable Growth Rate
SSA Social Security Administration
SSI Social Security Income
STD sexually transmitted disease
TCM traditional Chinese medicine
TFL TriCare for Life
UCAA Urgent Care Association of America
UCC urgent care centre
UIHO urban Indian health organization
USAID United States Agency for International Development
USDA United States Department of Agriculture
USMLE United States Medical Licensing Examination
USPHS United States Public Health Service
VA The Office of Veterans Affairs
VAT value added tax
VHA Veterans Health Administration
VISN Veterans Integrated Service Network
VistA Veterans Health Information Systems and Technology Architecture
WHO World Health Organization
WIC women, infants and children


List of tables, figures and boxes
Tables page
Table 1.1 Demographic indicators, United States, selected years 4
Table 1.2 Macroeconomic indicators, United States, selected years 5
Table 1.3 Life expectancy and mortality rates, United States, selected years 11
Table 1.4 Life expectancy (years), OECD countries, selected years 12
Table 1.5 Infant, neonatal and post-neonatal mortality rates, United States, selected years 13
Table 1.6 Infant mortality, OECD countries, selected years: deaths per 1 000 live births 15
Table 1.7 Potential years of life lost, OECD countries, selected years 16
Table 1.8 Leading causes of death and numbers of deaths, United States, 1980 and 2007 17
Table 1.9 Five-year cancer survival rates, United States, selected years 19
Table 1.10 Current cigarette smoking in adults, United States, selected years 20
Table 1.11 Selected health conditions and risk factors in adults, United States, selected years 21
Table 1.12 Obesity among children and adolescents, United States, selected years 22
Table 1.13 Alcohol use in adults, United States, 1997 and 2009 23
Table 3.1 Trends in United States national health expenditures, selected years 92
Table 3.2 Government health expenditures, selected years 94
Table 3.3 Government health expenditures as a percentage of total national health expenditures, OECD countries, selected years 95
Table 3.4 Health expenditures as a percentage of GDP, OECD countries, selected years 96
Table 3.5 National health expenditures per capita (US$ PPP), OECD countries, selected years 97
Table 3.6 Distribution of health expenditures and type of expenditure (%), selected years 98
Table 3.7 National health expenditures by condition and service, selected years 99
Table 3.8 Relationship between regional differences in spending and the content, quality and outcomes of care 101
Table 3.9 Distribution of health expenditures by source of revenue (%), selected years 102
Table 3.10 Major sources of health coverage in the United States in 2010 109
Table 3.11 Cost-sharing and premium rules in Medicaid 126
Table 3.12 Personal health-care expenditures by source of funds and type of expenditure, 1970–2011 147
Table 3.13 Payment mechanisms for health services 148
List o
f tables, fi
gu
res and
bo
xes

Health systems in transition United States of Americaxvi
Tables page
Table 4.1 Number of selected types of health-care facility in the United States, 1975–2009 161
Table 4.2 Acute-care hospital beds per 1 000 population in seven OECD countries, 2000–2010 169
Table 4.3 Average length of stay in acute-care hospitals in seven OECD countries, 1990–2010 170
Table 4.4 Number of CT scanners and MRI units per million population in seven OECD countries, 1990–2011 177
Table 4.5 Employed United States health-care personnel per 1 000 population, 1990–2010 186
Table 5.1 Utilization of non-federal short-stay hospital services in the United States, 1980–2007 243
Table 5.2 Mental health admissions per 100 000 population 252
Table 7.1 Healthy People 2020 topic areas 322
Table 7.2 Cost-related access problems in the past year 332
Table 7.3 Adults’ experiences with access to health care in 11 high-income countries, 2010 334
Table 7.4 Problems with health insurance in the past year (%) 335
Table 7.5 Immunization rates for selected diseases 346
Table 7.6 Cancer screening rates, 2008 347
Table 7.7 Cancer survival rates, 2003 348
Table 7.8 Asthma admission rates, 2009 349
Table 7.9 Coordination problems in the past two years 350
Table 7.10 Medical, medication or laboratory test errors in the past two years 351
Table 7.11 Doctor–patient relationship and communication 351
Table 7.12 Patient engagement in care management for chronic conditions 352
Table 7.13 Practice use of IT on a routine basis for core tasks 353
Table 7.14 Financial incentives and targeted support 354
Table 7.15 Expenses for health care by selected population characteristics, 2008 363
Table 7.16 Efficiency measures 371
Figures page
Fig. 1.1 Map of USA 2
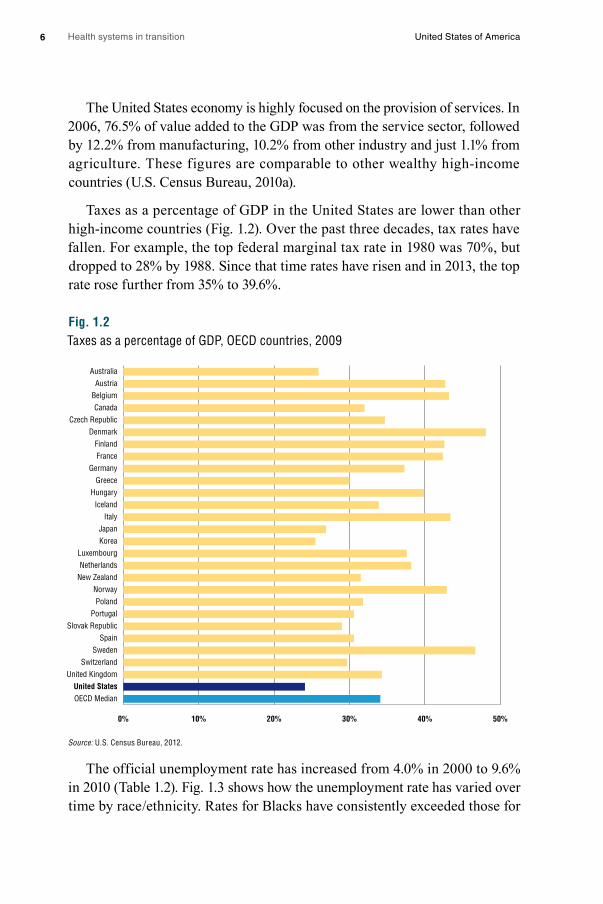
Fig. 1.2 Taxes as a percentage of GDP, OECD countries, 2009 6
Fig. 1.3 Percent population unemployed, United States, by race/ ethnicity, 1980–2010 7
Fig. 1.4 Percent population below poverty level, United States, by race/ ethnicity, 1980–2009 8
Fig. 2.1 Organization of the U.S. Health System, 2013 27
Fig. 2.2 Organization of the U.S. Health System after Implementation of the Affordable Care Act 29
Fig. 2.3 Organization of the Department of Health and Social Services 30
Fig. 3.1 Growth in national health expenditures, selected years 93
Fig. 3.2 Variation among states in the United States in health-care spending per capita, 2009 100
Fig. 3.3 Financial flows 105
Fig. 3.4 Health insurance coverage by poverty level, 2011 123
Fig. 3.5 Health insurance coverage of low-income children and adults, 2012 124

Health systems in transition United States of America xvii
Figures page
Fig. 4.1 Median average age of hospital plants in the United States, 1990–2010 164
Fig. 4.2 External sources of capital to United States hospitals: percentage of hospitals reporting levels of importance 165
Fig. 4.3 Hospital profit margins 1991–2010 167
Fig. 4.4 Number of beds in United States community hospitals, psychiatric institutions and nursing homes per 1 000 population, 1970–2010 168
Fig. 4.5 Occupancy rates in acute-care hospitals in seven OECD countries, 1990–2010 171
Fig. 4.6 Distribution of outpatient vs inpatient revenues in hospitals, 1991–2011 172
Fig. 4.7 Number of beds/ 100 000 population in United States psychiatric facilities by type of facility 173
Fig. 4.8 Physicians per 1 000 population in seven OECD countries, 1990–2010 189
Fig. 4.9 Nurses per 1 000 population in seven OECD countries, 2000–2010 190
Fig. 4.10 Pharmacists per 1 000 population in seven OECD countries, 2000–2010 191
Fig. 4.11 Dentists per 1 000 population in six OECD countries, 1990–2010 191
Fig. 5.1 Health-care pathways for insured patients 210
Fig. 5.2 Health-care pathways for uninsured patients 213
Fig. 7.1 Health insurance coverage of the non-elderly by poverty level, 2010 325
Fig. 7.2 Health insurance coverage of low-income non-elderly adults and children, 2010 327
Fig. 7.3 Percentage with no usual source of health care: Community-dwelling individuals by insurance and poverty status, 2003–2004 327
Fig. 7.4 Percentage who received cancer screening: Community-dwelling adults with and without a usual source of health care, 2000 328
Fig. 7.5 Barriers to health care among non-elderly adults, by insurance status, 2009 329
Fig. 7.6 Diagnosis of late-stage cancer: uninsured vs privately insured 330
Fig. 7.7 Percentage confidence of being able to afford the necessary care should individuals become seriously ill, selected countries 333
Fig. 7.8 Mortality amenable to health care 340
Fig. 7.9 Doctors use electronic patient medical records 353
Fig. 7.10 Physician satisfaction with practising medicine 355
Fig. 7.11 Mortality amenable to health care by state 357
Fig. 7.12 State variations: Hospital admissions indicators 358
Fig. 7.13 State variations: Ambulatory care quality indicators 359
Fig. 7.14 Cumulative increases in health insurance premiums, workers’ contributions to premiums, inflation and workers’ earnings, 1999–2011 362
Fig. 7.15 National health expenditures per capita in six countries, 1970–2008 365
Boxes page
Box 2.1 The Patient Protection and Affordable Care Act 31
Box 2.2 Efforts to provide universal health coverage in the United States 41
Box 2.3 Health policy innovations in six states 49
Box 3.1 Overview of the federal government budgeting process 103
Box 3.2 Insurers and health plans 106

Health systems in transition United States of Americaxviii
Boxes page
Box 3.3 Accountable Care Organizations 120
Box 3.4 Medicare payment mechanisms 149
Box 4.1 The United States health-care workforce 182
Box 5.1 Example of an insured person’s health-care pathway 211
Box 5.2 Example of an uninsured person’s health-care pathway 212
Box 5.3 Core public health functions and essential services 216
Box 5.4 Federal public health agencies 217
Box 7.1 Shorter Lives, Poorer Health 338
Box 7.2 The Veterans Health Administration 367

Ab
stract
Abstract
This analysis of the United States health system reviews the developments in organization and governance, health financing, health-care provision, health reforms and health system performance. The US health system
has both considerable strengths and notable weaknesses. It has a large and well-trained health workforce, a wide range of high-quality medical specialists as well as secondary and tertiary institutions, a robust health sector research program and, for selected services, among the best medical outcomes in the world. But it also suffers from incomplete coverage of its citizenry, health expenditure levels per person far exceeding all other countries, poor measures on many objective and subjective measures of quality and outcomes, an unequal distribution of resources and outcomes across the country and among different population groups, and lagging efforts to introduce health information technology. It is difficult to determine the extent to which deficiencies are health-system related, though it seems that at least some of the problems are a result of poor access to care. Because of the adoption of the Affordable Care Act in 2010, the United States is facing a period of enormous potential change. Improving coverage is a central aim, envisaged through subsidies for the uninsured to purchase private insurance, expanded eligibility for Medicaid (in some states) and greater protection for insured persons. Furthermore, primary care and public health receive increased funding, and quality and expenditures are addressed through a range of measures. Whether the ACA will indeed be effective in addressing the challenges identified above can only be determined over time.


Execu
tive sum
mary
Executive summary
Introduction
The United States economy is the largest in the world, and its gross national income per head is among the highest in the world. The United States has a federal system of government, with substantial authority delegated to
its regional governments – the 50 states – and a historical reluctance regarding central planning or control either at federal or state level.
The United States health-care system reflects this wider context, having developed largely through the private sector, and combining high levels of funding with a distinctively low level of government involvement. The United States spends far more money on health care per head than any other country – 53% more than the second-highest country, Norway. As with many such national averages in this report there are wide variations within this, though, with spending per head ranging from about $5000 per head in Utah to more than $10 000 in the District of Colombia. International comparison shows a varied picture with respect to quality and outcomes, though, with very good indicators for some diseases (e.g. certain cancers) and poor ones for others (e.g. asthma). With regard to health behaviours, the picture is again varied; the United States has been notably effective in reducing smoking rates but equally ineffective in grappling with nutritional health and obesity. Most Americans still receive their coverage from private health insurance; unusually for high-income countries, over one-sixth of the population lacks health insurance, although this proportion is expected to be cut nearly in half if the main elements of the Affordable Care Act are implemented in 2014.

Health systems in transition United States of Americaxxii
Organization and Governance
The United States health-care system can be thought of as multiple systems that operate independently and, at times, in collaboration with each other. Powers in the health sector are divided between the federal and state governments. For example, states fund and manage many public health functions, pay part of the cost of Medicaid and shape its organization within that state, and set the rules for health insurance policies that are not covered by self-insured employer plans. On the other hand, products such as pharmaceuticals and medical devices are regulated at federal level. Regulations to achieve objectives of quality, access and cost control in health care may be set by public or private entities, at any or all of federal, state or local levels. However, there is relatively limited planning in terms of regulation, with little coordinated system-level planning in the United States in comparison to other countries, although incentives are sometimes used (for example to promote service provision in underserved areas).
Private sector stakeholders play a stronger role in the US health-care system than in other high-income countries; the private sector led the development of the health insurance system in the early 1930s, with the major federal government health insurance programmes, Medicare and Medicaid, only arriving in the mid-1960s. Medicare provides coverage for seniors and some of the disabled and Medicaid covers health-care services for some of the poor and near-poor. Both public and private payers purchase health-care services from providers subject to regulations imposed by federal, state and local governments as well as by private regulatory organizations.
Reflecting this multiplicity of actors, strengthening the use of health information systems to link different actors has become a priority of the federal government, most recently with national legislation promoting increased use of electronic health records by providers and their exchange and integration between organizations.
Financing
Public sources constitute 48% of health-care expenditures in the United States, private third party payer sources 40%, with the remaining 12% being paid by individuals out of pocket. Even though the proportion of public and private spending on health care is roughly comparable, only a minority (30%) of the United States population is covered by the public financing system – mainly

Health systems in transition United States of America xxiii
through Medicare and Medicaid. Currently, the majority of Americans (54%) receive their coverage from private health insurance, with most privately insured individuals obtaining coverage through an employer. Purchasers in the form of health maintenance organizations (HMOs, which provide health-care services on a prepaid basis through a network of providers) grew rapidly during the 1980s and early 1990s. Their market share has fallen substantially since then, due to a backlash against the tight restrictions put on patients, and preferred provider organizations (PPOs) have come to dominate the private insurance market. These contract with a network of providers but they tend to pay physicians on a fee-for-service basis, and make it easier to seek care outside the network. In 2012, among insured employees, 56% were in PPOs and only 25% in HMOs or similar plans.
One in six Americans is uninsured. Even among those with coverage, high out-of-pocket costs can be a barrier to receiving timely care and medications; one estimate is that medical costs are responsible for over 60% of personal bankruptcies in the country. Out-of-pocket (OOP) payments (e.g. direct payment by consumers for health services, coinsurance, co-payments, and deductible amounts) per capita have increased substantially in real terms in recent years, though because of the growth in overall health expenditure, the percentage that OOP spending represents of total health expenditure has decreased. Increases in real OOP spending over the last 40 years are not unique to the United States, although the United States has consistently ranked near the top in OOP spending among high-income countries.
Payment for health services in the United States depends on the service provided, the type of health provider making the service available, and the funder, as well as the type of facility and geographical location where the service is offered. Given this complexity, payment mechanisms for each type of health service (e.g. inpatient hospital care, prescription drugs) vary widely according to the payer involved.
Physical and human resources
Since the 1970s there has been an increase in ambulatory facilities, such as physician and dentist offices and ambulatory surgical centres, and a decrease in institutional settings such as hospitals and nursing homes. The number of hospital beds has also fallen (and is amongst the lowest per head among high-income countries), yet despite this decrease in beds, occupancy rates in hospitals remain low, primarily due to a dramatic decrease in inpatient length of

Health systems in transition United States of Americaxxiv
stay. The United States uses relatively more medical technologies such as MRIs and CT scanners than in comparable countries, which may also be a factor in its relatively low average length of stay, but the average age of its physical infrastructure, such as hospital buildings, is slightly increasing.
Employment of physicians, chiropractors, nurses, physician assistants and all types of therapists has increased since 1990. Particularly high increases in employment of physician assistants and therapists over the last three decades (and moderate increases in nurses) may indicate increasing reliance on these professionals for primary health care. On the other hand, employment of dentists, optometrists and pharmacists has decreased slightly in this period. Relative to comparable countries, the United States is around the median in physician supply, but towards the top in nurse supply. Licensing and certification of health professionals are carried out at state level; there is reciprocal recognition of licences between most states, but not all.
The United States benefits from net inward migration of health-care professionals from other countries. However, it suffers from internal maldistribution of the health-care workforce: by practice and setting (with a disproportionate number of specialist physicians compared to primary care physicians); by geographical location (with variations in physician to population ratios of more than 50%, with more professionals in the Mid-Atlantic and the Northeast than in the South and the Mountain West, and greater shortages of physicians in rural areas); and by racial and ethnic representation in the workforce (with African Americans, Latinos and American Indians underrepresented). There is no consensus regarding the overall adequacy of the future supply of physicians. Different forecasts are predicted based on different assumptions about future demand and supply. For nurses, the history of nursing workforce adequacy in the United States is one of cyclical but deepening shortages in the past few decades, and nursing workforce forecasts uniformly predict some degree of shortage in the future unless significant steps are taken to increase supply. While greater demand for health care under the Affordable Care Act will exert further pressures on the health-care workforce, other provisions that expand the workforce under the ACA and other recent federal policies may help ameliorate these problems.

Health systems in transition United States of America xxv
Provision of Services
Insured individuals tend to enter the health-care system through a primary care provider, though with some kinds of insurance (e.g. PPO) individuals may go directly to a specialist. Uninsured individuals often do not have a regular primary care provider, but instead visit community health centres (which provide primary care for low-income, uninsured and minority populations) and hospital emergency rooms for their health care, which hinders continuity of care. Due to out-of-pocket costs they may be reluctant or unable to seek out specialty, surgical or inpatient care unless they need emergency care; emergency departments in hospitals that receive payment from Medicare (which is nearly all hospitals in the US) are required by law to provide care to anyone needing emergency treatment until they are stable. Retail clinics (in pharmacies or large stores) are also emerging as places to go for treatment of minor medical conditions.
The number of acute inpatient (hospital) discharges and length of stay have fallen over the past decades, with more acute-care services, such as surgery, being performed on an outpatient basis. For example, in 2010 more than three-quarters of all surgeries were provided in an outpatient setting. Mental health services have also shifted predominantly from inpatient to outpatient, accompanied by substantially increased use of pharmaceuticals and reduction in provision of psychotherapy and mental health counselling. The utilization of post-acute-care services such as rehabilitation, intermittent home care and sub acute-care has increased over the past decades due to the financial need for hospitals to discharge patients not requiring acute care. Palliative care is received mostly through hospice services, either in the patient’s home, or in a hospital, nursing home or other institutional setting. Hospice care has increased due to an expansion of Medicare benefits in 1983. The informal caregiver (usually family or friends) plays an important role in United States health care; 23% of Americans provide some form of informal care.
Pharmaceuticals are highly utilized in the United States compared to other industrialized countries, and their use has been growing. The use of complementary and alternative medicine (CAM) is also growing in the United States. Although physicians initially opposed the use of CAM, their stance has softened due to its popularity with the public and some scientific evidence regarding the efficacy of certain therapies. Patients must pay out-of-pocket for most forms of CAM.

Health systems in transition United States of Americaxxvi
Vulnerable populations in the United States include racial and ethnic minorities, those with low income, the uninsured, the disabled, the homeless, women, children, persons with HIV/AIDS, the mentally ill, the elderly, and those living in rural areas. Federal, state, and private agencies have programmes for reducing disparities in health and health care for these populations. Populations that have special access to health services include American Indians and Alaska Natives, military personnel, veterans, and those who are institutionalized, such as prisoners.
United States public health is decentralized, with the main locus of power at the state level. The actual public health structures at the state level vary significantly; in some states, public health functions are further decentralized (e.g. to county level). At federal level, the United States Public Health Service brings together eight federal public health agencies (including the Centers for Disease Control and Prevention, the Food and Drug Administration, and the National Institutes of Health). Federal, state and local public health services have been underfunded, and tend to be driven by immediate concerns; for example, as concerns rose over terrorist attacks in the United States, much of the public health funding and services switched to terrorism preparedness, leaving holes in other areas of public health.
Principal health reforms
The Patient Protection and Affordable Care Act (ACA) of 2010 constitutes the most significant health reform in the United States since Medicare, though its adoption was highly controversial and its content reflects the general American preference for minimal government intervention. Improving coverage is a central aim, with the ACA introducing a requirement for nearly all individuals to have some form of health insurance. Improved coverage is envisaged through both the public and private sectors: subsidies are provided for the uninsured to purchase private insurance (there is no government-provided health-care delivery option), and in some states, more low-income people will obtain coverage through expanded eligibility for Medicaid. The ACA also addresses underinsurance, providing greater protection for insured persons from their insurance being too limited in scope, inadequate in coverage or even being cancelled once they become ill. There are also increased funds for primary care to improve access. Public health is also strengthened, with increased funding for public health programmes, and requirements for chain restaurants and vending machines to display calories for food products.

Health systems in transition United States of America xxvii
Improving quality and controlling expenditures are also addressed through a range of measures. These are broadly a combination of incentives for efficiency and better-quality care plus penalties linked to inefficient care (e.g. for hospital readmissions), rather than any major restructuring of the health system as such; there are also some time-limited reductions in particular areas of spending (e.g. on pharmaceuticals). However, the ACA also contains measures pulling in the other direction; for example, a ban on US residents from buying and importing medication from other countries where it is cheaper, and preventing the use of cost-benefit analysis for health-care practice or reimbursement in the Medicare programme. The overall quality and financial impact of the ACA are disputed and difficult to predict.
Implementation has been ongoing in stages since the law was signed in March 2010, with most aspects of the law scheduled to be fully operational by 2014, but before then political, economic, and social variables could change both the substance and the timetable. For example, a ruling of the US Supreme Court has already made the participation of individual states in the expansion of Medicaid effectively optional, with some states planning to opt out. Many states have decided not to implement a state “exchange” for the purchase of insurance in the private market, relying instead of the federal government’s exchange. A few states are partnering with the federal government to set up an exchange. States are permitted to change their policies on this in the future.
Assessment of the health system
The United States health system has both considerable strengths and notable weaknesses. It has a large and well-trained health workforce, and a wide range of high-quality medical specialists, as well as secondary and tertiary institutions, a robust health sector research program and, for selected services, among the best medical outcomes in the world. But it also suffers from incomplete coverage, underinsurance, and inadequate care for the uninsured. Additional problems include health expenditure levels per person that far exceed all other countries, poor results on many objective and subjective measures of quality and outcomes, an unequal distribution of resources and outcomes across the country and among different population groups, and lagging efforts to introduce health information technology.
Overall, compared to other high-income countries, life expectancy in the United States is lower and mortality is higher, although there is disagreement over whether or not this relatively poor performance on mortality is due to
Health systems in transition United States of Americaxxviii
structural problems with the health-care system. Because a myriad of cultural, socioeconomic, environmental and genetic factors affect health status, it is difficult to determine the extent to which deficiencies are health-system related, though it seems that at least some of the problems with United States performance with respect to health outcomes are a result of poor access to care.
For the future, since the birth rate in the United States is higher than that of most high-income countries, its dependency ratio – those too young or too old to work, divided by the working-age population – is expected to grow more slowly than in most other high-income countries. The budgetary pressure from demographic ageing on paying for social service programmes will therefore be less acute than in most other high-income countries. Nevertheless, given high costs and mixed performance, major concerns about the macro-level efficiency of the United States health system remain.
Conclusions
It is difficult to generalize about the United States health-care system and, accordingly, hard to draw overall conclusions about its performance. In some respects it is unquestionably among the best in the world, yet in other respects there are significant shortcomings.
One factor that sets the United States apart from its counterparts is the more limited government involvement. Historically, there has been distaste for central planning, lack of control over the dissemination of medical technologies, reluctance to take advantage of the potential bargaining power afforded through large government insurers, lack of centralized prices and prospective budgeting and, most importantly, the absence of guaranteed insurance coverage.
There is general agreement among those on the left and the right that reforms are necessary to control spending. There is less agreement on whether there is a quality problem, nor much agreement on the need to provide coverage for the uninsured. In spite of these disagreements and because of the adoption of the Affordable Care Act in 2010, the United States is facing a period of enormous potential change. Whether the ACA will indeed be effective in addressing the challenges identified above can only be determined over time.
Such changes in health-care delivery will take a great deal of time. The ACA addresses major challenging issues such as geographic variation in the use of services and a bias towards subspecialty rather than primary care services, but mainly through small programmes and pilot studies. The type of changes

Health systems in transition United States of America xxix
needed in health-care delivery are unlikely to result from legislation. Rather, they need to be innovated and supported by both the public and private sectors as each grapples with the cost, quality and access issues they face. They also hinge on changing individual and provider behaviours.
Americans face an even more fundamental challenge: the lack of effective dialogue, much less consensus, on how to improve their health-care system. There is very little agreement among the Democratic and Republican parties on the solutions to problems and, with a few exceptions, little in the way of working towards common solutions. Such a climate tends to result in stasis, slowing down the country’s ability to further innovate and improve the system. Solving the most vexing health-care financing, delivery and policy issues depends as much on finding common ground as it does on medical, social, behavioural and organizational sciences.


1. Intro
du
ction
1. Introduction
The United States economy is the largest in the world and its gross national income per head is among the highest in the world. The United States has a federal system of government, with substantial authority delegated to
its regional governments – the 50 states – and a historical reluctance regarding central planning or control either at federal or state level.
The United States health-care system reflects this wider context, having developed largely through the private sector and combining high levels of funding with a distinctively low level of government involvement. The United States spends far more money on health care per head than any other country – 53% more than the second-highest country, Norway. As with many such national averages in this report there are wide variations within this, though, with spending per head ranging from about $5000 per head in Utah to more than $10 000 in the District of Colombia. International comparison shows a varied picture with respect to quality and outcomes, though, with very good indicators for some diseases (e.g. certain cancers) and poor ones for others (e.g. asthma). With regard to health behaviours, the picture is again varied; the United States has been notably effective in reducing smoking rates but equally ineffective in grappling with nutritional health and obesity. Most Americans still receive their coverage from private health insurance; unusually for high-income countries, over one-sixth of the population lacks health insurance, although this proportion is expected to be cut nearly in half if the main elements of the Affordable Care Act are implemented in 2014.
1.1 Geography and sociodemography
The United States is located on the North American continent in the Western Hemisphere. The contiguous 48 states that exclude Alaska and Hawaii are bordered by the Atlantic and Pacific Oceans on the east and west, respectively,

Health systems in transition United States of America2
Fig.
1.1
Map
of U
SA
Sour
ce: A
utho
rs’ o
wn
com
pila
tion.
Lake
Erie
Lake
Huro
nLa
ke O
ntar
ioLa
keM
ichi
gan
Lake
Sup
erio
r
Grea
t Sal
t Lak
e
Paci
fic O
cean
Atla
ntic
Ocea
n
Gulf
of M
exic
o
Stra
its o
f Flo
rida
Cana
da
Mex
ico
Baha
mas
WAS
HING
TON
D.C.
Was
hing
ton
Ore
gon
Calif
orni
aNev
ada
Idah
o
Mon
tana
Wyo
min
g
Uta
h
Colo
rado
Kans
as
Okl
ahom
a
Mis
sour
i
Arka
nsas
Loui
sian
a
Mis
siss
ippi
Alab
ama
Geo
rgia Fl
orid
a
Tenn
esse
e
Kent
ucky
Virg
inia
MD
DE
Wes
tVi
rgin
ia
Nor
th C
arol
ina
Sout
hCa
rolin
a
Texa
s
New
Mex
ico
Ariz
ona
Neb
rask
aIo
wa
Sout
h D
akot
a
Nor
th D
akot
a
Min
neso
ta
Wis
cons
in
Mic
higa
n
Illin
ois
Indi
ana
Ohi
oPe
nnsy
lvan
iaN
J
New
York
Mai
ne
Mas
sach
uset
ts
CT
VT
NH
RI
San
Fran
cisc
oPh
ilade
lphi
a
New
Yor
k
Hous
ton
Chic
ago
Los
Ange
les
Dalla
s
San
Jose
San
Anto
nio
Phoe
nix
San
Dieg
o
Jack
sonv
ille
Indi
anap
olis
Aust
in
Colu
mbu
s
CanadaJu
neau
Alas
ka
020
0ml
100m
l
Paci
fic O
cean
Kaua
iOa
hu
Lana
i
Mol
okai M
aui
Niih
au
Hono
lulu
Haw
aii
021
0ml
210k
m

Health systems in transition United States of America 3
by Canada on the north and by Mexico and the Gulf of Mexico on the south (Fig. 1.1). The total area is 9.7 million km2 (3.7 million square miles), which ranks third in the world after Russia and Canada and above China.
The country is highly varied in topography and climate, with regions well below sea level to mountains above 6100 m (20 000 ft) and average annual temperatures ranging from a high of 26°C (78°F) to a low of -13°C (9°F) in a part of Alaska and -3°C (27°F) in the contiguous states. Similarly, precipitation ranges from a desert climate to tropical rainforest.
At the beginning of 2012, the population of the United States was almost 313 million (U.S. Census Bureau, 2011), which ranks third worldwide after China and India, both of which have over 1 billion1 people. The racial and ethnic make-up is quite varied, with approximately 65% White, 16% Hispanic or Latino, 13% Black or African American and the remainder other and / or mixed racial and ethnic groups (U.S. Census Bureau, 2012). (Race and ethnicity categories are self-reported in the Census and there are no fixed criteria as to how a person identifies himself or herself.) Hispanics and Latinos are the fastest growing group, with a 49% population increase between 2000 and 2010, compared to just 5% for others (Ennis, Ríos-Vargas & Albert, 2011).
The population figures reflect all people in the United States, both legally and undocumented. While there is not an agreed figure for the latter, some estimates put it at about 11–12 million persons (Camarota & Jensenius, 2009; Zuckerman, Waldmann & Lawton, 2011). This number increased rapidly at the beginning of the new century, growing by nearly 40% between 1999 and 2007 (Zuckerman, Waldmann & Lawton, 2011) but tapering off at the end of the decade during a major recessionary period.
Table 1.1 provides several demographic indicators and how they have changed from 1970 to the present time. Several are typical of high-income countries. Of particular note, however, is the relatively high fertility rate. Unlike many European countries, fertility rates in the United States are at about the generally accepted “replacement rate” of 2.1 children per woman and have been relatively steady over the past 40 years. In contrast, many OECD countries have rates below 1.5 and in Japan and Korea it is around 1.2. Part of the reason is the relatively high immigration and birth rate among the Hispanic population, but even among United States Whites the birth rate is considerably higher than in most OECD countries.
1 1 billion = 1 thousand million.

Health systems in transition United States of America4
Table 1.1Demographic indicators, United States, selected years
1970 1980 1990 2000 2010
Population (millions) 205.1 227.7 250.1 282.4 308.7
Females (per cent) 51.3 51.4 51.2 51.0 50.8
Population (% of total)
0–14 years 28.5 22.6 21.7 21.4 19.8
65 years and older 9.8 11.3 12.5 12.4 13.0
85 years and older NA 1.0 1.2 1.5 1.8
Annual population growth (%) 1.3 c 1.1 0.9 1.2 0.4
Population density (per sq. mile) a 56.7 62.9 69.1 78.0 85.3
Fertility rate (births per woman) 2.02 1.80 1.99 2.04 2.07
Birth rate (per 1 000 women) 18.4 15.9 16.7 14.4 14.3 d
Age-adjusted death rate (per 100 000 people) 1 222.6 1 039.1 938.7 869.0 760.2 d
Age-dependency ratio b 62.1 51.0 51.9 51.0 48.8
Rural population (%) 26.3 26.3 24.8 21.0 NA
Education level of adults over 25 years
Less than high school graduate 44.8 31.4 22.4 15.9 12.9
High school graduate or some college 44.2 51.6 56.3 58.5 57.2
Bachelor’s or advanced degree 11.0 17.0 21.3 25.6 29.9
Source: U.S. Census Bureau, 2012.Notes: a Figures are based on a total area of 3.619 million sq. miles during all time periods. b Age-dependency ratio is the ratio of population (0 –14 and 65+) / 15 – 64. c Growth rate since 1960. d Figure is for 2007. NA, not available.
Partly as a result, the age-dependency ratio – essentially, the number of people who are too young or too old to be in the labour force, divided by the working-age population – is likely to grow more slowly in the United States than in other high-income countries over the next few decades, as the higher fertility rate will translate into a larger working-age population. The OECD (OECD, 2009) projects that between 2010 and 2050, the United States age-dependency ratio will rise from 0.50 to 0.61. At the most extreme, Spain’s ratio is expected to increase from 0.47 to 0.94 and Japan’s from 0.55 to 0.98. On average, for all OECD countries it is predicted to rise from 0.48 to 0.74. Most of the increase is the result of the greater proportion of the population age 65 and over compared to the working-age population. While there is much concern in the United States as to how the country will be able to afford to pay for old-age pensions and health-care benefits in future decades, from a strictly demographic perspective the problem is less acute than in most other high-income countries.
The other noteworthy figures in Table 1.1 concern educational attainment. Over time, the United States is becoming more educated, with over 87% of adults now having a high school degree and almost 30% attending four or more years of college. These figures, however, do not fully reflect the quality of education. There is increasing concern that the United States is losing its edge over other countries, particularly in mathematics and science. The most recent

Health systems in transition United States of America 5
cross-national test results, from 2007, show that the United States ranked 11th in maths and 8th in science among 36 countries that tested fourth graders and 9th in maths and 11th in science among 48 countries that tested eighth graders (U.S. National Center for Education Statistics, 2009). Both former President George W. Bush and President Barack Obama have made improving the quality of education a major public policy goal.
Nevertheless, in higher education, the United States still sets international standards. The Academic Ranking of World Universities (2012) ranks United States universities as comprising 8 of the top 10 and 17 of the top 20, in the world. Other rankings, while more favourable to other countries, still list more than half of the top universities in the United States.
1.2 Economic context
Table 1.2 presents trends in several macroeconomic indicators. In 2010, the United States had a GDP of over $14 trillion, more than twice as high as any other country in the world. Per capita GDP ranks around 10th worldwide depending on the data source. GDP grew much more slowly in the 2000s (at an annual rate of 0.6% to 2010), only one-third the rate of most previous decades since 1970. Inflation rates were relatively low between 1990 and 2000, at 3.4% per year and lower still after 2000, at 1.6% per year. The budget deficit, however, has been rising quickly, a trend common among most high-income countries but still one of much concern to the United States policy community, driving much current economic policy in the country.
Table 1.2Macroeconomic indicators, United States, selected years
1970 1980 1990 2000 2010
GDP ($B) 1 038 2 788 5 801 9 952 14 660
Real GDP (2005, $B) 4 270 5 839 8 034 11 226 13 248
Real GDP per capita (2005, $) 20 820 25 640 32 112 39 750 42 722
Annual growth rate in real GDP per capita (%)(since previous period)
2.7 1.9 2.1 2.0 0.6
Annual growth rate in consumer prices (%)(since previous period)
5.7 13.5 5.4 3.4 1.6
Federal budget debt (% of GDP) 37.6 33.4 55.9 57.3 93.2
Unemployment rate (%) 4.9 7.1 5.6 4.0 9.6
Poverty rate (%) 12.6 13.0 13.5 11.3 14.3 b
Gini coefficient a 0.394 0.404 0.428 0.462 0.468 b
Source: U.S. Census Bureau, 2012. Notes: a The Gini coefficient is a measure of income inequality; higher figures indicate greater inequality among the population. b Figure is for 2009; $B, billion $.
Health systems in transition United States of America6
The United States economy is highly focused on the provision of services. In 2006, 76.5% of value added to the GDP was from the service sector, followed by 12.2% from manufacturing, 10.2% from other industry and just 1.1% from agriculture. These figures are comparable to other wealthy high-income countries (U.S. Census Bureau, 2010a).
Taxes as a percentage of GDP in the United States are lower than other high-income countries (Fig. 1.2). Over the past three decades, tax rates have fallen. For example, the top federal marginal tax rate in 1980 was 70%, but dropped to 28% by 1988. Since that time rates have risen and in 2013, the top rate rose further from 35% to 39.6%.
Fig. 1.2Taxes as a percentage of GDP, OECD countries, 2009
Source: U.S. Census Bureau, 2012.
The official unemployment rate has increased from 4.0% in 2000 to 9.6% in 2010 (Table 1.2). Fig. 1.3 shows how the unemployment rate has varied over time by race / ethnicity. Rates for Blacks have consistently exceeded those for
0% 10% 20% 30% 40% 50%
OECD MedianUnited States
United KingdomSwitzerland
SwedenSpain
Slovak RepublicPortugal
PolandNorway
New ZealandNetherlands
LuxembourgKoreaJapan
ItalyIceland
HungaryGreece
GermanyFranceFinland
DenmarkCzech Republic
CanadaBelgiumAustria
Australia

Health systems in transition United States of America 7
other racial and ethnic groups, with Hispanics the second highest. Whites and Asian / Pacific Islanders have had the lowest rates. The gap, however, has been reduced over time.
Fig. 1.3Percent population unemployed, United States, by race/ ethnicity, 1980–2010
Source: U.S. Census Bureau, 2011.
Officially defined poverty rates, while varying year to year, have held fairly steady at around 12–13% since 1980, although they have risen since 2009 to about 15%. Fig. 1.4 shows how they have varied according to race / ethnicity. These differences are somewhat more pronounced than for unemployment. While rates have fallen for Blacks and Hispanics, both absolutely and relative to Whites and Asians, they still exceeded 25% in 2009.
Percentage
3
6
9
12
15
Hispanic
Asian/Pacific Islander
Black
White
2010200019901980

Health systems in transition United States of America8
Fig. 1.4Percent population below poverty level, United States, by race/ ethnicity, 1980–2009
Source: U.S. Census Bureau, 2012.
The final figure in Table 1.2 is the Gini coefficient, a measure of income inequality, where higher numbers indicate greater income inequality. Income inequality has risen in the United States since 1970, although rates have been relatively steady in the 2000s. The 2009 United States rate of about 0.47 compares to rates that generally range from 0.26 to 0.36 among most European countries (U.S. Central Intelligence Agency, 2010).
1.3 Political context
The United States is a federal constitutional democracy, with decision-making authority divided between the federal government and the state governments. It includes 50 states; the District of Columbia, which is home to the seat of the federal government in Washington, DC; and several territories including Puerto Rico, Guam and the United States Virgin Islands. Power is shared among three branches of government: the executive, legislative and judicial.
The President of the United States is elected every four years and is limited to two four-year terms. Rather than elections being based on popular vote, the United States uses the “Electoral College”. Each state, as well as the District of Columbia, has the same number of representatives in the Electoral College as
Percentage
0
5
10
15
20
25
30
35
Hispanic
Asian/Pacific Islander
Black
White
2009200520001995199019851980
Health systems in transition United States of America 9
the total number of representatives in Congress that they are assigned. With a few recent exceptions, the presidential candidate who receives the most popular votes in a state is given all the state’s vote in the Electoral College. As a result, occasionally the candidate who receives a plurality of the national popular vote does not win the presidency. This has occurred four times – three in the nineteenth century and most recently, in 2000.
The United States Congress, the legislative branch of the federal government, comprises the Senate and the House of Representatives. The former contains two members per state (100 total) with a term of six years and the latter 435 members allotted to the states based on their populations, with a term of two years. The judicial branch of the federal government includes the Supreme Court, which has nine members who are appointed for life and various district (regional) and appeals courts. Each state has a popularly elected governor whose term, except in one state, is four years. Most states limit governors to two terms. All but one state have two elected legislative bodies.
On a more local level, within states there are numerous county and city governments.
While it is difficult to summarize the roles played by the different levels of government, the United States Constitution enumerates specific responsibilities as being under the purview of the federal government, including war and defence and international and interstate commerce – but also other laws that are
“necessary and proper”. In general, state and local governments have authority over such activities as children’s education, public safety / prosecution of crime and a host of other domains, including many public health activities. As discussed in section 2.8, the states regulate the licensing of health professionals as well. There are also a number of areas in which the federal government and states share authority (road construction is one example). In the health area, the primary example is the Medicaid programme (described in Chapter 3), which provides health insurance to low-income individuals and families. Medicaid is jointly funded but is administered by states, which in turn must meet certain federal requirements.
There are two main political parties, the Democratic Party and the Republican Party. Generally, the Democratic Party is viewed as left-of-centre and the Republican Party as right-of-centre. Control of the presidency and the two chambers of Congress have changed hands several times in recent decades. More often than not, power was divided. In 2008 the Democrats gained control of the presidency and both chambers of the Congress. In 2010, however, the Republicans gained control of the House of Representatives,

Health systems in transition United States of America10
re-creating a divided federal government. In the election of November 2012, the Democrats held on to the Presidency and the Senate and the Republicans continued to control the House of Representatives, continuing the divided federal government.
Over the past two decades there has been less bipartisanship in Congress. The trend accelerated with the 112th Congress, which served from 2010 to 2012, passing fewer bills than any Congress in the previous generation (Steinhauer, 2012). Partisanship in the United States Senate is particularly important, even to the majority party. Senate rules require 60 votes in order to close debate; thus, a group of 41 Senators can, in most cases, effectively block legislation advocated by the majority from being considered by refusing to close debate, a procedure known as “filibuster”.
Lobbying and organized advocacy plays a large and growing role in United States politics, with spending at an estimated $3.5 billion in 2009 (BusinessWeek, 2010). Advertising expenditures for the 2008 presidential race amounted to almost half a billion dollars (CNN, 2008), and total spending to $1.7 billion (Bloomberg, 2008). Spending by Congressional candidates in the 2009–2010 election cycle was approximately $1.8 billion (Federal Election Commission, 2013). While there were, until recently, some limits on the donations of organizations to election contributions, in 2010 a Supreme Court ruling struck down some of these regulations as violations of the right to freedom of speech, which is guaranteed by the first amendment of the United States Constitution. This ruling is resulting in greater campaign spending than in the past. One set of estimates put total spending for political advertising on all 2012 elections at about $10 billion – 40% higher than the $7 billion figure from 2008 (Borrell Associates, 2012).
As in any country, there are numerous controversial political issues, several of which affect health care. One that has received a great deal of attention in recent years concerns illegal immigration, usually from Mexico. The issue of the undocumented has garnered greater visibility in recent years, particularly in the wake of rising unemployment rates and budget deficits. It is currently estimated that 8% of United States births are to parents who are in the United States undocumented; by law, all children born in the country are United States citizens (Pew Hispanic Center, 2010).

Health systems in transition United States of America 11
1.4 Health status
In recent years there has been increasing recognition that the health-care system is not the main contributor to people’s health. Other factors – sometimes called “social determinants of health” – include a vast array of cultural and environmental factors and are often far more important. A list of such factors is lengthy and includes parents’ education, poverty, family upbringing, language barriers, neighbourhood effects, racial segregation, safety, workforce issues, social capital and a host of environmental factors such as clean air and water. Moreover, these factors interact with each other. Higher incomes make it possible, for example, to avoid dangerous jobs and having to live in dangerous neighbourhoods. These social determinants form a backdrop for the data reported below on health status in the United States.
The United States has experienced marked increases in life expectancy and reductions in most types of mortality in recent decades. Nevertheless, as other high-income countries have shown similar trends, the United States has not gained in relative standing and continues to rank near the bottom with regard to such indicators as overall life expectancy, infant mortality and potential years of life lost. While the United States has among the lowest smoking rates, it has the highest obesity rates.
1.4.1 Life expectancy and mortality
Life expectancy at birth has climbed steadily, rising from 70.8 years in 1970 to 77.9 in 2007 (Table 1.3). The increase for males (12%) exceeds that for females (8%). Age-adjusted mortality has declined by 38% over the same time period, to 760.2 deaths per 100 000 population in 2007.
Table 1.3Life expectancy and mortality rates, United States, selected years
1970 1980 1990 2000 2005 2006 2007
Life expectancy at birth
All persons 70.8 73.7 75.4 76.8 77.4 77.7 77.9
Male 67.1 70.0 71.8 74.1 74.9 75.1 75.4
Female 74.7 77.4 78.8 79.3 79.9 80.2 80.4
Age-adjusted death rate per 100 000 population
All persons 1 222.6 1 039.1 938.7 869.0 798.8 776.5 760.2
Male 1 542.1 1 348.1 1 202.8 1 053.8 951.1 924.8 905.6
Female 971.4 817.9 750.9 731.4 677.6 657.8 643.4
Source: U.S. Department of Health and Human Services, 2011a.

Health systems in transition United States of America12
Of the 28 high-income OECD countries shown in Table 1.4, the United States ranked sixth lowest in life expectancy, at 78.2 years in 2009, about two years below the median. The only countries that are lower are located in Eastern Europe: the Czech Republic, Estonia, Hungary, Poland and the Slovak Republic. The relative position of the United States has fallen over time. In 1980, for example, United States life expectancy was at the median, exceeding countries such as Austria, Belgium, Germany and the United Kingdom. When looking at life expectancy at age 65, the United States rates somewhat higher internationally – around the median for males but somewhat below the median for females (OECD 2010 data, not shown in table).
Table 1.4Life expectancy (years), OECD countries, selected years
1970 1980 1990 2000 2005 2006 2007 2008 2009
Australia 70.8 74.6 77.0 79.3 80.9 81.1 81.4 81.5 81.6
Austria 70.0 72.6 75.6 78.2 79.4 80.0 80.3 80.5 80.4
Belgium 71.1 73.3 76.1 77.8 79.0 79.5 79.8 – 80.0
Canada – 75.3 77.6 79.0 80.1 80.4 80.7 – –
Czech Republic 69.6 70.4 71.5 75.1 76.1 76.7 77.0 77.3 77.3
Denmark 73.3 74.3 74.9 76.8 78.2 78.4 78.4 78.8 79.0
Estonia – – 69.6 70.6 72.7 72.9 72.9 73.9 75.0
Finland 70.8 73.6 75.0 77.7 79.1 79.5 79.5 79.9 80.0
France 72.2 74.3 76.9 79.0 80.3 80.7 80.9 81.0 81.0
Germany 70.6 72.9 75.3 78.2 79.4 79.8 80.0 80.2 80.3
Greece 72.0 74.5 77.1 78.0 79.3 79.6 79.5 80.0 80.3
Hungary 69.2 69.1 69.4 71.7 72.8 73.2 73.3 73.8 74.0
Iceland 74.3 76.7 78.0 80.1 81.2 81.2 81.2 81.3 81.5
Ireland 71.2 72.9 74.9 76.6 79.5 79.8 79.7 79.9 80.0
Israel – 73.9 76.7 78.8 80.2 80.6 80.6 81.1 81.6
Italy – 74.0 77.1 79.8 80.8 81.3 81.5 – –
Japan 72.0 76.1 78.9 81.2 82.0 82.4 82.6 82.7 83.0
Korea 62.2 65.9 71.4 76.0 78.5 79.1 79.4 79.9 80.3
Luxembourg – 72.8 75.6 78.0 79.5 79.4 79.4 80.6 80.7
Netherlands 73.7 75.9 77.0 78.0 79.4 79.8 80.2 80.2 80.6
New Zealand 71.5 73.2 75.5 78.4 79.8 80.1 80.2 80.4 80.8
Norway 74.4 75.9 76.6 78.7 80.1 80.4 80.5 80.6 81.0
Poland 70.0 70.2 70.7 73.9 75.1 75.3 75.4 75.6 75.8
Portugal 66.7 71.4 74.1 76.7 78.1 78.9 79.1 79.3 79.5
Slovak Republic 69.8 70.6 71.0 73.3 74.0 74.3 74.3 74.8 75.0
Slovenia – – 73.3 75.5 77.7 78.4 78.2 78.8 79.0
Spain 72.0 75.4 77.0 79.4 80.3 81.1 81.1 81.2 81.8
Sweden 74.7 75.8 77.6 79.7 80.6 80.8 81.0 81.2 81.4
Switzerland 73.1 75.6 77.5 79.9 81.4 81.7 81.9 82.2 82.3
United Kingdom 71.9 73.2 75.7 77.9 79.1 79.5 79.7 – 80.4
United States 70.9 73.7 75.3 76.7 77.4 77.7 77.9 – 78.2
Median 71.2 73.7 75.6 78.0 79.4 79.8 79.8 80.2 80.3
Source: OECD, 2012a.

Health systems in transition United States of America 13
A similar pattern exists with respect to infant mortality (Table 1.5). Overall death rates per 1000 live births declined by 36% between 1985 and 2006, to 6.7. The reductions were approximately the same for neonatal deaths (under 28 days) and post-neonatal deaths (28 days to 11 months). There are, however, notable differences according to race / ethnicity, with rates for Whites, Hispanics / Latinos and Asians / Pacific Islanders significantly lower than those for Blacks / African Americans. Rates for the latter are 2.4 times higher than for Whites.
Table 1.5Infant, neonatal and post-neonatal mortality rates, United States, selected years
1985 1990 1995 2000 2005 2006
Infant deaths per 1 000 live births
All mothers 10.4 8.9 7.6 6.9 6.9 6.7
White 8.6 7.2 6.3 5.7 5.8 5.6
Black or African American 18.3 16.9 14.7 13.6 13.6 13.3
Hispanic or Latina 8.8 7.5 6.3 5.6 5.6 5.4
Asian or Pacific Islander 7.8 6.6 5.3 4.9 4.9 4.5
American Indian or Alaska Native 13.1 13.1 9.0 8.3 8.1 8.3
Neonatal deaths per 1 000 live births
All mothers 6.8 5.7 4.9 4.6 4.5 4.5
White 5.8 4.6 4.1 3.8 3.8 3.7
Black or African American 12.3 11.1 9.6 9.1 8.9 8.7
Hispanic or Latina 5.7 4.8 4.1 3.8 3.9 3.7
Asian or Pacific Islander 4.8 3.9 3.4 3.4 3.4 3.2
American Indian or Alaska Native 6.1 6.1 4.0 4.4 4.0 4.3
Postneonatal deaths per 1 000 live births
All mothers 3.6 3.2 2.6 2.3 2.3 2.2
White 3.1 2.7 2.2 1.9 2.0 1.9
Black or African American 6.3 5.9 5.0 4.3 4.3 4.2
Hispanic or Latina 3.2 2.7 2.1 1.8 1.8 1.7
Asian or Pacific Islander 2.9 2.7 1.9 1.4 1.5 1.4
American Indian or Alaska Native 7.0 7.0 5.1 3.9 4.0 4.0
Source: U.S. Department of Health and Human services, 2011a. Notes: Infant is under 1 year of age; neonatal is under 28 days; post-neonatal from 28 days to 11 months.
A conundrum that appears in many (but not all) United States health indicators is the relatively good statistics for Hispanics and Latinos, whose overall infant mortality rates are slightly lower than Whites. This is sometimes termed the Latino “health paradox”. While Latinos have very high uninsurance rates as well as lower incomes and educational levels on average compared to Whites, many health indicators are nevertheless comparable to their wealthier, better educated and insured counterparts (Vega, Rodriquez & Gruskin, 2009).

Health systems in transition United States of America14
In spite of these encouraging declines, in the most recent year in which comparable data are available (2008), the United States had the highest infant mortality rate of all 31 high-income OECD countries. United States rates were more than double those of the Czech Republic, Finland, Iceland, Ireland, Japan, Luxembourg, Norway, Slovenia and Sweden. Although United States rates have dropped considerably – 35% in the 20-year period ending in 2005 – other countries have declined faster. In 1970 the United States rate was almost at the median. Spain is an example of how much other countries have improved. In 1970 its infant mortality rate was 40% higher than the United States; in 2006 it was 43% lower (Table 1.6).
One possible reason for the poor showing of the United States relates to pre-term babies. More such babies are born, which could be due both to problems with prenatal care and the health of mothers, but also because more of an effort is made in the United States to save such babies (MacDorman & Mathews, 2010). Moreover, the United States is more likely to define very low-weight babies as live births compared to other countries, raising calculated infant mortality rates (Sachs et al., 1995; Joseph et al., 2012). In a study of 25 countries in which the United States ranked 22nd in neonatal mortality (infant death within the first 28 days of birth), its ranking rose to 11th – a lower neonatal mortality rate than exhibited in Canada, Denmark, England and the Netherlands – when only live births of more than 1000g were considered (Joseph et al., 2012).
Another measure of mortality is potential years of life lost, which is defined here by summing the total number of years of life lost due to death before the age of 70. Table 1.7 shows this for high-income OECD countries. While the United States figure fell by 46% between 1970 and 2005, it remains the fifth highest among those countries reporting data for 2005 and highest among all non-Eastern European countries.
1.4.2 Specific diseases
Table 1.8 compares the 10 leading causes of death in the United States for two years – 1980 and 2007 – separately for men and women and for Whites and Blacks / African Americans. Most notable is how little the leading causes changed over this 26-year period, with the large majority of deaths coming from chronic conditions.

Health systems in transition United States of America 15
Table 1.6Infant mortality, OECD countries, selected years: deaths per 1 000 live births
1970 1980 1990 2000 2005 2006 2007 2008 2009
Australia 17.9 10.7 8.2 5.2 5.0 4.7 4.2 4.1 4.3
Austria 25.9 14.3 7.8 4.8 4.2 3.6 3.7 3.7 3.8
Belgium 21.1 12.1 8.0 4.8 3.7 4.0 4.0 3.4 3.4
Canada 18.8 10.4 6.8 5.3 5.4 5.0 5.1 – –
Czech Republic 20.2 16.9 10.8 4.1 3.4 3.3 3.1 2.8 2.9
Denmark 14.2 8.4 7.5 5.3 4.4 3.8 4.0 4.0 3.1
Estonia 17.7 17.1 12.3 8.4 5.4 4.4 5.0 5.0 3.6
Finland 13.2 7.6 5.6 3.8 3.0 2.8 2.7 2.6 2.6
France 18.2 10.0 7.3 4.5 3.8 3.8 3.8 3.8 3.9
Germany 22.5 12.4 7.0 4.4 3.9 3.8 3.9 3.5 3.5
Greece 29.6 17.9 9.7 5.4 3.8 3.7 3.6 2.7 3.1
Hungary 35.9 23.2 14.8 9.2 6.2 5.7 5.9 5.6 5.1
Iceland 13.3 7.8 5.8 3.0 2.3 1.4 2.0 2.5 1.8
Ireland 19.5 11.1 8.2 6.2 4.0 3.7 3.1 – 3.2
Israel – 15.6 9.9 5.5 4.4 4.0 3.9 3.8 3.8
Italy 29.0 14.6 8.2 4.5 3.8 3.7 3.7 3.7 3.7
Japan 13.1 7.5 4.6 3.2 2.8 2.6 2.6 2.6 2.4
Korea 45.0 – – – 4.7 4.1 – – –
Luxembourg 24.9 11.5 7.3 5.1 2.6 2.5 1.8 1.8 2.5
Netherlands 12.7 8.6 7.1 5.1 4.9 4.4 4.1 3.8 3.8
New Zealand 16.7 13.0 8.4 6.3 5.0 5.1 4.8 4.9 4.7
Norway 12.7 8.1 6.9 3.8 3.1 3.2 3.1 2.7 3.1
Poland 36.7 25.5 19.3 8.1 6.4 6.0 6.0 5.6 5.6
Portugal 55.5 24.2 11.0 5.5 3.5 3.3 3.4 3.3 3.6
Slovak Republic 25.7 20.9 12.0 8.6 7.2 6.6 6.1 5.9 5.7
Slovenia 24.5 15.3 8.4 4.9 4.1 3.4 2.8 2.1 2.4
Spain 28.1 12.3 7.6 4.4 3.8 3.8 3.7 3.5 3.3
Sweden 11.0 6.9 6.0 3.4 2.4 2.8 2.5 2.5 2.5
Switzerland 15.5 9.0 6.7 5.3 4.2 4.4 3.9 4.0 4.3
United Kingdom 18.5 12.1 7.9 5.6 5.1 5.0 4.8 4.7 4.6
United States 20.0 12.6 9.2 6.9 6.9 6.7 6.5 6.5 –
Median 19.8 12.2 8.0 5.2 4.1 3.8 3.9 3.7 3.6
Source: OECD, 2012a.
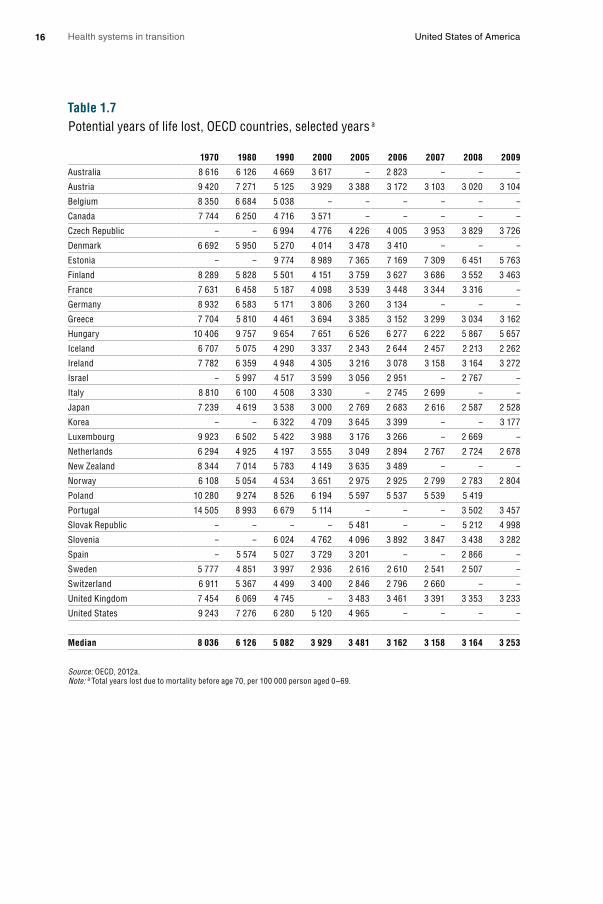
Health systems in transition United States of America16
Table 1.7Potential years of life lost, OECD countries, selected years a
1970 1980 1990 2000 2005 2006 2007 2008 2009
Australia 8 616 6 126 4 669 3 617 – 2 823 – – –
Austria 9 420 7 271 5 125 3 929 3 388 3 172 3 103 3 020 3 104
Belgium 8 350 6 684 5 038 – – – – – –
Canada 7 744 6 250 4 716 3 571 – – – – –
Czech Republic – – 6 994 4 776 4 226 4 005 3 953 3 829 3 726
Denmark 6 692 5 950 5 270 4 014 3 478 3 410 – – –
Estonia – – 9 774 8 989 7 365 7 169 7 309 6 451 5 763
Finland 8 289 5 828 5 501 4 151 3 759 3 627 3 686 3 552 3 463
France 7 631 6 458 5 187 4 098 3 539 3 448 3 344 3 316 –
Germany 8 932 6 583 5 171 3 806 3 260 3 134 – – –
Greece 7 704 5 810 4 461 3 694 3 385 3 152 3 299 3 034 3 162
Hungary 10 406 9 757 9 654 7 651 6 526 6 277 6 222 5 867 5 657
Iceland 6 707 5 075 4 290 3 337 2 343 2 644 2 457 2 213 2 262
Ireland 7 782 6 359 4 948 4 305 3 216 3 078 3 158 3 164 3 272
Israel – 5 997 4 517 3 599 3 056 2 951 – 2 767 –
Italy 8 810 6 100 4 508 3 330 – 2 745 2 699 – –
Japan 7 239 4 619 3 538 3 000 2 769 2 683 2 616 2 587 2 528
Korea – – 6 322 4 709 3 645 3 399 – – 3 177
Luxembourg 9 923 6 502 5 422 3 988 3 176 3 266 – 2 669 –
Netherlands 6 294 4 925 4 197 3 555 3 049 2 894 2 767 2 724 2 678
New Zealand 8 344 7 014 5 783 4 149 3 635 3 489 – – –
Norway 6 108 5 054 4 534 3 651 2 975 2 925 2 799 2 783 2 804
Poland 10 280 9 274 8 526 6 194 5 597 5 537 5 539 5 419
Portugal 14 505 8 993 6 679 5 114 – – – 3 502 3 457
Slovak Republic – – – – 5 481 – – 5 212 4 998
Slovenia – – 6 024 4 762 4 096 3 892 3 847 3 438 3 282
Spain – 5 574 5 027 3 729 3 201 – – 2 866 –
Sweden 5 777 4 851 3 997 2 936 2 616 2 610 2 541 2 507 –
Switzerland 6 911 5 367 4 499 3 400 2 846 2 796 2 660 – –
United Kingdom 7 454 6 069 4 745 – 3 483 3 461 3 391 3 353 3 233
United States 9 243 7 276 6 280 5 120 4 965 – – – –
Median 8 036 6 126 5 082 3 929 3 481 3 162 3 158 3 164 3 253
Source: OECD, 2012a.Note: a Total years lost due to mortality before age 70, per 100 000 person aged 0–69.

Health systems in transition United States of America 17
Table 1.8Leading causes of death and numbers of deaths, United States, 1980 and 2007
1980 2007
Cause of death Deaths Cause of death Deaths
Male All causes 1 075 078 All causes 1 203 968
1 Diseases of heart 405 661 Diseases of heart 309 821
2 Malignant neoplasms 225 948 Malignant neoplasms 292 857
3 Unintentional injuries 74 180 Unintentional injuries 79 827
4 Cerebrovascular diseases 69 973 Chronic lower respiratory diseases 61 235
5 Chronic obstructive pulmonary diseases
38 625 Cerebrovascular diseases 54 111
6 Pneumonia and influenza 27 574 Diabetes mellitus 35 478
7 Suicide 20 505 Suicide 27 269
8 Chronic liver disease and cirrhosis 19 768 Influenza and pneumonia 24 071
9 Homicide 18 779 Nephritis, nephrotic syndrome and nephrosis
22 616
10 Diabetes mellitus 14 325 Alzheimer’s disease 21 800
Female All causes 914 763 All causes 1 219 744
1 Diseases of heart 355 424 Diseases of heart 306 246
2 Malignant neoplasms 190 561 Malignant neoplasms 270 018
3 Cerebrovascular diseases 100 252 Cerebrovascular diseases 81 841
4 Unintentional injuries 31 538 Chronic lower respiratory diseases 66 689
5 Pneumonia and influenza 27 045 Alzheimer’s disease 52 832
6 Diabetes mellitus 20 526 Unintentional injuries 43 879
7 Atherosclerosis 17 848 Diabetes mellitus 35 904
8 Chronic obstructive pulmonary diseases
17 425 Influenza and pneumonia 28 646
9 Chronic liver disease and cirrhosis 10 815 Nephritis, nephrotic syndrome and nephrosis
23 832
10 Certain conditions originating in the perinatal period
9 815 Septicaemia 18 989
White All causes 1 738 607 All causes 2 074 151
1 Diseases of heart 683 347 Diseases of heart 531 636
2 Malignant neoplasms 368 162 Malignant neoplasms 483 939
3 Cerebrovascular diseases 148 734 Cerebrovascular diseases 118 081
4 Unintentional injuries 90 122 Chronic lower respiratory diseases 114 695
5 Chronic obstructive pulmonary diseases
52 375 Unintentional injuries 106 252
6 Pneumonia and influenza 48 369 Alzheimer’s disease 68 933
7 Diabetes mellitus 28 868 Diabetes mellitus 56 390
8 Atherosclerosis 27 069 Influenza and pneumonia 45 947
9 Chronic liver disease and cirrhosis 25 240 Nephritis, nephrotic syndrome and nephrosis
36 871
10 Suicide 24 829 Suicide 31 348

Health systems in transition United States of America18
1980 2007
Cause of death Deaths Cause of death Deaths
Black or African American All causes 233 135 All causes 289 585
1 Diseases of heart 72 956 Diseases of heart 71 209
2 Malignant neoplasms 45 037 Malignant neoplasms 64 049
3 Cerebrovascular diseases 20 135 Cerebrovascular diseases 17 085
4 Unintentional injuries 13 480 Unintentional injuries 13 559
5 Homicide 10 172 Diabetes mellitus 12 459
6 Certain conditions originating in the perinatal period
6 961 Homicide 8 870
7 Pneumonia and influenza 5 648 Nephritis, nephrotic syndrome and nephrosis
8 392
8 Diabetes mellitus 5 544 Chronic lower respiratory diseases 7 901
9 Chronic liver disease and cirrhosis 4 790 Human immunodeficiency virus (HIV) disease
6 470
10 Nephritis, nephrotic syndrome and nephrosis
3 416 Septicaemia 6 297
Source: U.S. Department of Health and Human Services, 2011a.
Some of the patterns observed are:• The appearance of septicaemia as the 10th leading cause of death among
females and Blacks / African Americans in 2007, which may point to a lack of access to immediate, high-quality medical care.
• The appearance of Alzheimer’s disease on the list, which is most likely caused by changes in the coding for dementia.
• The appearance of HIV on the list as the 9th leading cause of death among Blacks / African Americans in 2007.
Even in cases where relative rankings have not changed, there are important patterns on the actual number of deaths. Most notably, while diseases of the heart ranked as the leading cause of death for all population groups in both years and malignant neoplasms (cancer) ranked second, their trends diverged. The number of heart-related deaths fell by 19% between 1980 and 2007 in spite of a large population of older Americans, but cancer deaths rose by 35%. Some of this is undoubtedly due to the fact that Americans are living longer – in part as a result of reduced heart disease – and therefore have more opportunity to succumb to cancer-related death.
Table 1.8 – continuedLeading causes of death and numbers of deaths, United States, 1980 and 2007

Health systems in transition United States of America 19
Five-year cancer survival rates have been improving in the United States. Over a 30-year period ending in 2007, they rose by 62% among Whites (from 42.9% to 69.3%) and by 93% among Blacks / African Americans (from 32.8% to 63.2%) (Table 1.9). Most impressive is the near-universal survival rates from prostate cancer among men, where 30 years earlier five-year survival rates were less than 70%.
Table 1.9Five-year cancer survival rates, United States, selected years
White Black or African American
1975–77 1987–89 1996–2000 2001–07 1975–77 1987–89 1996–2000 2001–07
Male
All sites 42.9 53.0 65.4 69.3 32.8 39.0 58.7 63.2
Oral cavity and pharynx
54.0 54.2 60.4 65.2 29.8 29.8 34.5 40.5
Oesophagus 4.8 11.1 15.9 19.7 1.6 5.3 9.6 10.6
Stomach 13.2 15.6 19.5 24.2 16.1 16.6 21.2 23.2
Colon 50.7 61.7 64.9 67.2 43.9 50.8 54.8 53.0
Rectum 47.5 59.1 64.3 69.5 41.8 47.7 54.2 59.0
Pancreas 2.6 3.1 4.8 5.8 2.6 5.1 3.6 3.3
Lung and bronchus 11.1 12.1 13.2 14.5 10.7 10.8 11.1 12.1
Prostate gland 69.0 84.8 98.9 99.9 61.0 71.5 95.6 97.9
Urinary bladder 74.6 82.2 81.3 82.4 56.5 67.6 66.0 67.9
Non-Hodgkin’s lymphoma
46.4 48.4 59.5 69.6 42.6 41.7 50.1 57.9
Leukaemia 33.8 45.7 49.4 57.2 30.0 33.7 38.9 52.0
Female
All sites 56.7 60.8 65.5 67.8 46.3 47.8 52.9 55.1
Colon 51.4 60.1 63.9 65.8 46.1 53.8 52.4 56.1
Rectum 49.5 58.5 65.7 67.8 46.9 57.1 55.3 62.7
Pancreas 2.3 3.3 3.8 6.1 1.9 5.8 5.4 4.3
Lung and bronchus 15.6 15.4 17.5 19.2 13.8 11.2 14.8 15.0
Melanoma of skin 86.2 91.3 93.4 95.3 – 90.3 76.0 73.7
Breast 75.9 85.3 90.2 91.4 62.2 71.3 77.5 77.4
Cervix uteri 69.8 72.5 73.8 70.3 64.5 57.3 66.6 60.9
Corpus uteri 88.7 84.9 86.6 86.3 61.3 57.9 63.4 62.0
Ovary 35.3 38.2 42.9 43.3 41.9 33.8 37.6 36.0
Non-Hodgkin’s lymphoma
47.6 55.5 63.7 72.0 54.9 52.1 58.4 67.0
Source: U.S. Department of Health and Human Services, 2011a.
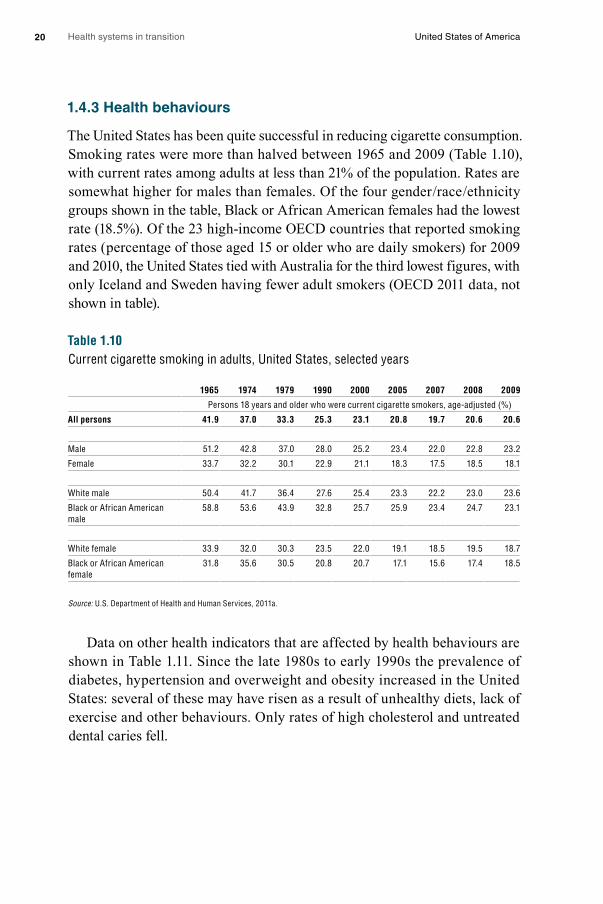
Health systems in transition United States of America20
1.4.3 Health behaviours
The United States has been quite successful in reducing cigarette consumption. Smoking rates were more than halved between 1965 and 2009 (Table 1.10), with current rates among adults at less than 21% of the population. Rates are somewhat higher for males than females. Of the four gender / race / ethnicity groups shown in the table, Black or African American females had the lowest rate (18.5%). Of the 23 high-income OECD countries that reported smoking rates (percentage of those aged 15 or older who are daily smokers) for 2009 and 2010, the United States tied with Australia for the third lowest figures, with only Iceland and Sweden having fewer adult smokers (OECD 2011 data, not shown in table).
Table 1.10Current cigarette smoking in adults, United States, selected years
1965 1974 1979 1990 2000 2005 2007 2008 2009
Persons 18 years and older who were current cigarette smokers, age-adjusted (%)
All persons 41.9 37.0 33.3 25.3 23.1 20.8 19.7 20.6 20.6
Male 51.2 42.8 37.0 28.0 25.2 23.4 22.0 22.8 23.2
Female 33.7 32.2 30.1 22.9 21.1 18.3 17.5 18.5 18.1
White male 50.4 41.7 36.4 27.6 25.4 23.3 22.2 23.0 23.6
Black or African American male
58.8 53.6 43.9 32.8 25.7 25.9 23.4 24.7 23.1
White female 33.9 32.0 30.3 23.5 22.0 19.1 18.5 19.5 18.7
Black or African American female
31.8 35.6 30.5 20.8 20.7 17.1 15.6 17.4 18.5
Source: U.S. Department of Health and Human Services, 2011a.
Data on other health indicators that are affected by health behaviours are shown in Table 1.11. Since the late 1980s to early 1990s the prevalence of diabetes, hypertension and overweight and obesity increased in the United States: several of these may have risen as a result of unhealthy diets, lack of exercise and other behaviours. Only rates of high cholesterol and untreated dental caries fell.
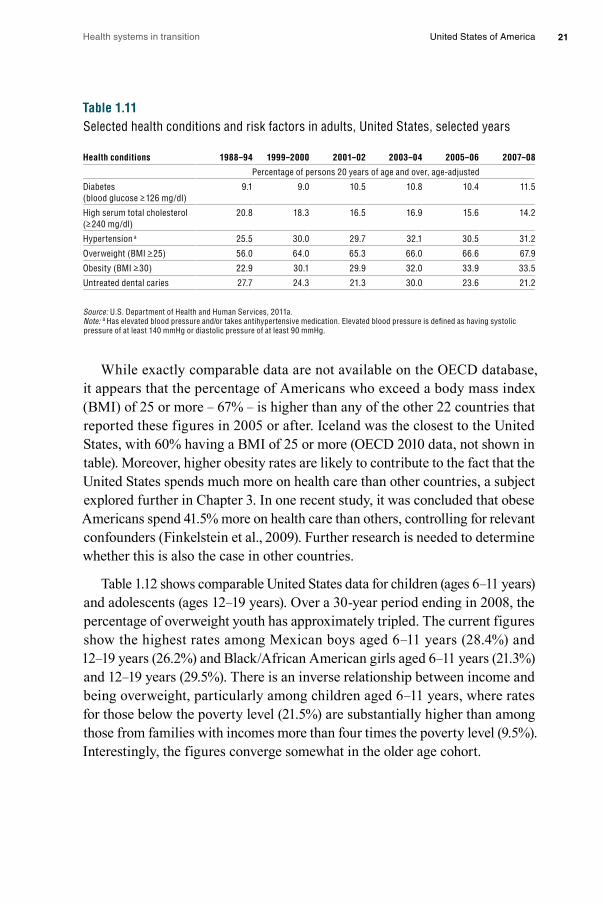
Health systems in transition United States of America 21
Table 1.11Selected health conditions and risk factors in adults, United States, selected years
Health conditions 1988–94 1999–2000 2001–02 2003–04 2005–06 2007–08
Percentage of persons 20 years of age and over, age-adjusted
Diabetes (blood glucose > 126 mg/dl)
9.1 9.0 10.5 10.8 10.4 11.5
High serum total cholesterol (> 240 mg/dl)
20.8 18.3 16.5 16.9 15.6 14.2
Hypertension a 25.5 30.0 29.7 32.1 30.5 31.2
Overweight (BMI > 25) 56.0 64.0 65.3 66.0 66.6 67.9
Obesity (BMI > 30) 22.9 30.1 29.9 32.0 33.9 33.5
Untreated dental caries 27.7 24.3 21.3 30.0 23.6 21.2
Source: U.S. Department of Health and Human Services, 2011a.Note: a Has elevated blood pressure and / or takes antihypertensive medication. Elevated blood pressure is defined as having systolic pressure of at least 140 mmHg or diastolic pressure of at least 90 mmHg.
While exactly comparable data are not available on the OECD database, it appears that the percentage of Americans who exceed a body mass index (BMI) of 25 or more – 67% – is higher than any of the other 22 countries that reported these figures in 2005 or after. Iceland was the closest to the United States, with 60% having a BMI of 25 or more (OECD 2010 data, not shown in table). Moreover, higher obesity rates are likely to contribute to the fact that the United States spends much more on health care than other countries, a subject explored further in Chapter 3. In one recent study, it was concluded that obese Americans spend 41.5% more on health care than others, controlling for relevant confounders (Finkelstein et al., 2009). Further research is needed to determine whether this is also the case in other countries.
Table 1.12 shows comparable United States data for children (ages 6–11 years) and adolescents (ages 12–19 years). Over a 30-year period ending in 2008, the percentage of overweight youth has approximately tripled. The current figures show the highest rates among Mexican boys aged 6–11 years (28.4%) and 12–19 years (26.2%) and Black / African American girls aged 6–11 years (21.3%) and 12–19 years (29.5%). There is an inverse relationship between income and being overweight, particularly among children aged 6–11 years, where rates for those below the poverty level (21.5%) are substantially higher than among those from families with incomes more than four times the poverty level (9.5%). Interestingly, the figures converge somewhat in the older age cohort.
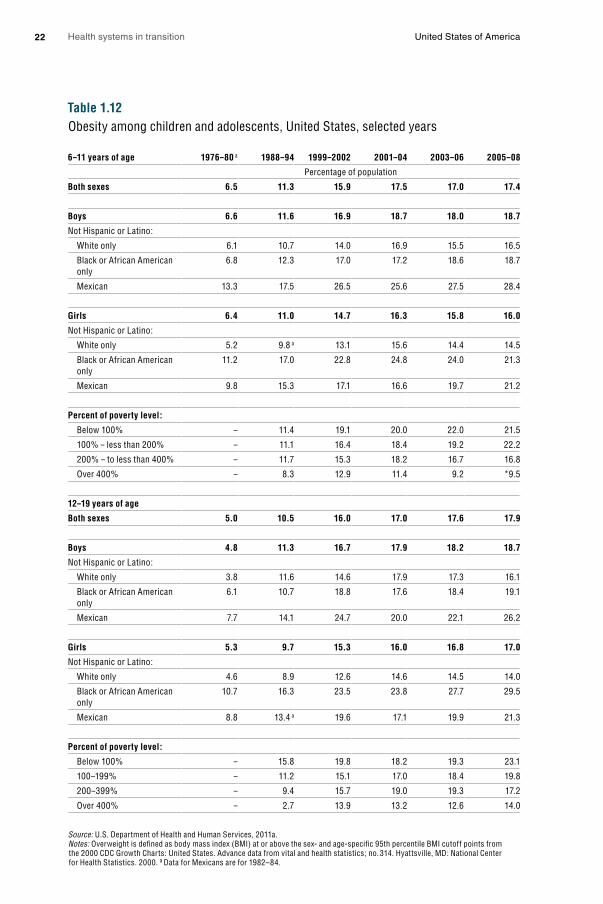
Health systems in transition United States of America22
Table 1.12Obesity among children and adolescents, United States, selected years
6–11 years of age 1976–80 a 1988–94 1999–2002 2001–04 2003–06 2005–08
Percentage of population
Both sexes 6.5 11.3 15.9 17.5 17.0 17.4
Boys 6.6 11.6 16.9 18.7 18.0 18.7
Not Hispanic or Latino:
White only 6.1 10.7 14.0 16.9 15.5 16.5
Black or African American only
6.8 12.3 17.0 17.2 18.6 18.7
Mexican 13.3 17.5 26.5 25.6 27.5 28.4
Girls 6.4 11.0 14.7 16.3 15.8 16.0
Not Hispanic or Latino:
White only 5.2 9.8 a 13.1 15.6 14.4 14.5
Black or African American only
11.2 17.0 22.8 24.8 24.0 21.3
Mexican 9.8 15.3 17.1 16.6 19.7 21.2
Percent of poverty level:
Below 100% – 11.4 19.1 20.0 22.0 21.5
100% – less than 200% – 11.1 16.4 18.4 19.2 22.2
200% – to less than 400% – 11.7 15.3 18.2 16.7 16.8
Over 400% – 8.3 12.9 11.4 9.2 *9.5
12–19 years of age
Both sexes 5.0 10.5 16.0 17.0 17.6 17.9
Boys 4.8 11.3 16.7 17.9 18.2 18.7
Not Hispanic or Latino:
White only 3.8 11.6 14.6 17.9 17.3 16.1
Black or African American only
6.1 10.7 18.8 17.6 18.4 19.1
Mexican 7.7 14.1 24.7 20.0 22.1 26.2
Girls 5.3 9.7 15.3 16.0 16.8 17.0
Not Hispanic or Latino:
White only 4.6 8.9 12.6 14.6 14.5 14.0
Black or African American only
10.7 16.3 23.5 23.8 27.7 29.5
Mexican 8.8 13.4 a 19.6 17.1 19.9 21.3
Percent of poverty level:
Below 100% – 15.8 19.8 18.2 19.3 23.1
100–199% – 11.2 15.1 17.0 18.4 19.8
200–399% – 9.4 15.7 19.0 19.3 17.2
Over 400% – 2.7 13.9 13.2 12.6 14.0
Source: U.S. Department of Health and Human Services, 2011a. Notes: Overweight is defined as body mass index (BMI) at or above the sex- and age-specific 95th percentile BMI cutoff points from the 2000 CDC Growth Charts: United States. Advance data from vital and health statistics; no. 314. Hyattsville, MD: National Center for Health Statistics. 2000. a Data for Mexicans are for 1982–84.

Health systems in transition United States of America 23
One likely cause of rising obesity is lack of physical exercise. Recent data indicate, however, that exercise rates are now increasing – albeit they are still low. In 2010, 20.7% of American adults met both aerobic activity and muscle-strengthening guidelines established by the federal government, compared to 14.3% in 1998. There was a similar drop in the percentage who met neither of the guidelines (U.S. Department of Health and Human Services, 2011a, Table 73). Data for children also show a mild upswing in exercise. In 2003 68.7% did not get daily vigorous physical activity. The figure dropped to 62.3% in 2007 (U.S. Department of Health and Human Services, 2011a, Table 66).
Table 1.13Alcohol use in adults, United States, 1997 and 2009
Current drinker a Heavier drinker a
Five or more drinks in a day on at least 1 day
in the past year
Characteristic 1997 2009 1997 2009 1997 2009
Percent of adults
18 years and over, age-adjusted 63.1 65.3 4.9 5.3 21.1 23.6
Males 69.8 71.6 6.1 6.2 30.7 33.0
Females 57.0 59.6 3.9 4.5 12.2 14.7
18–24 years 62.2 62.0 5.3 6.2 31.8 35.5
25–44 years 71.6 73.5 5.2 5.4 28.5 31.2
45–64 years 63.3 66.2 5.5 5.8 15.9 18.7
65 years and over 43.4 47.0 3.1 3.5 4.9 5.2
White only 66.0 68.4 5.2 5.9 22.9 26.0
Black or African American only 47.8 53.2 4.0 3.3 11.7 14.2
Hispanic or Latino 53.4 54.9 3.9 3.1 20.4 19.9
Asian only 45.8 45.7 1.9 b 1.7 b 11.4 10.8
American Indian or Alaska Native only 53.9 57.2 – b 4.4 b 29.2 24.5
Below 100% 46.1 49.7 4.8 5.2 17.3 18.4
100–199% 52.8 53.1 4.9 5.2 18.4 20.6
200–399% 62.1 63.9 4.9 5.1 21.0 23.1
400% or more 74.6 76.8 5.1 5.5 24.3 27.2
Source: U.S. Department of Health and Human Services, 2011a.Notes: a Current drinkers had at least 12 drinks in their lifetime and at least one drink in the past year. Heavier drinking is based on self-reported responses to questions about average alcohol consumption and is defined as more than 14 drinks per week for men and more than seven drinks per week for women on average. b Estimates are considered unreliable. Data not shown have an RSE of greater than 30%.
Finally, Table 1.13 provides data on three measures of alcohol use for both 1997 and 2009: the percentage of adults who are current drinkers, those who are heavy drinkers and those who had five or more drinks in a day on one or

Health systems in transition United States of America24
more days in the past year (binge drinkers). Perhaps the most notable pattern in the table is the increase in heavy and binge drinking – in spite of concerted public anti-alcohol abuse campaigns. With respect to the current time period, the main differences are that men are much more likely to have engaged in binge drinking than women and heavy drinking declines with age. In addition, Whites drink more than most minority groups, with the exception of binge drinking, where American Indians and Alaskan Natives have the highest rates. Finally, all types of drinking increase with income. In particular, wealthier people are more likely to be current drinkers or binge drinkers than those near or below the poverty level.

2. O
rgan
ization
and
go
vernan
ce
2. Organization and governance
The United States health-care system can be thought of as multiple systems that operate independently and, at times, in collaboration with each other. Powers in the health sector are divided between the federal
and state governments. For example, states fund and manage many public health functions, pay part of the cost of Medicaid and shape its organization within that state, and set the rules for health insurance policies that are not covered by self-insured employer plans. On the other hand, products such as pharmaceuticals and medical devices are regulated at federal level. Regulations to achieve objectives of quality, access and cost control in health care may be set by public or private entities, at any or all of federal, state or local levels. However, there is relatively limited planning in terms of regulation, with little coordinated system-level planning in the United States in comparison to other countries, although incentives are sometimes used (for example to promote service provision in underserved areas).
Private sector stakeholders play a stronger role in the US health-care system than in other high-income countries; the private sector led the development of the health system in the early 1930s, with the major federal government health insurance programmes, Medicare and Medicaid, only arriving in the mid-1960s. Medicare provides coverage for seniors and some of the disabled and Medicaid covers health-care services for some of the poor and near-poor. Both public and private payers purchase health-care services from providers subject to regulations imposed by federal, state and local governments as well as by private regulatory organizations.
Reflecting this multiplicity of actors, strengthening the use of health information systems to link different actors has become a priority of the federal government, most recently with national legislation promoting increased use of electronic health records by providers and their exchange and integration between organizations.

Health systems in transition United States of America26
2.1 Overview of the health-care system
In the United States health-care system, public and private payers purchase health-care services from providers subject to regulations imposed by federal, state and local governments as well as by private regulatory organizations. Fig. 2.1 illustrates the interplay between four main actors: (1) government; (2) private insurance; (3) providers; and (4) regulators, as well as the types of relationship that connect them. A second schematic is presented (Fig. 2.2) that shows what the United States health-care system will look like if the ACA is fully implemented as specified in the 2010 reform law.
Government, insurers, providers, and public and private regulators each play an important role in the United States health-care system. Government actors include those at the federal, state and local levels. Both the federal and state governments have executive, legislative and judicial branches (although the figure only shows this under the federal government). Under the executive branch of the federal government, the Department of Health and Human Services (HHS) plays the largest administrative role in the United States health-care system. HHS includes agencies such as the Centers for Medicare & Medicaid Services (CMS) that administer the public Medicare and Medicaid programmes, and the Children’s Health Insurance Program (CHIP). Other selected agencies within HHS include the Agency for Healthcare Research and Quality (AHRQ), the Centers for Disease Control and Prevention (CDC), the Food and Drug Administration (FDA) and the National Institutes of Health (NIH).
The Office of Veterans Affairs (VA), which oversees the Veterans Health Administration (VHA) to provide care to military veterans, is a federal agency independent of HHS. The Department of Defense is in charge of providing health care to active duty military and their families through TriCare. The Indian Health Service is a federal-level health system, within the HHS, that provides health services to members of federally recognized tribes of Native Americans and Alaskan Natives (see section 2.3.1).
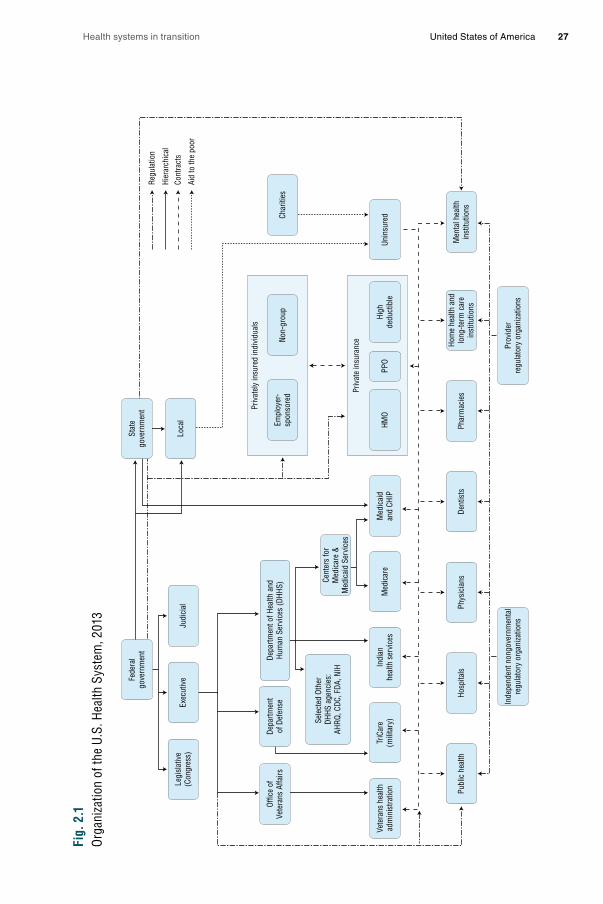
Health systems in transition United States of America 27
Fig.
2.1
Orga
niza
tion
of th
e U.
S. H
ealth
Sys
tem
, 201
3
Priv
atel
y in
sure
d in
divi
dual
s
Fede
ral
gove
rnm
ent
Stat
ego
vern
men
t
Loca
lEx
ecut
ive
Legi
slat
ive
(Con
gres
s)
Offic
e of
Vete
rans
Affa
irsDe
partm
ent
of D
efen
seDe
partm
ent o
f Hea
lth a
ndHu
man
Ser
vice
s (D
HHS)
Sele
cted
Oth
er
DHHS
age
ncie
s:AH
RQ, C
DC, F
DA, N
IHCe
nter
s fo
rM
edic
are
&M
edic
aid
Serv
ices
Empl
oyer
-sp
onso
red Pr
ivat
e in
sura
nceNo
n-gr
oup
Char
ities
HMO
PPO
High
dedu
ctib
leUn
insu
red
Hosp
itals
Judi
cial
Dent
ists
Inde
pend
ent n
ongo
vern
men
tal
regu
lato
ry o
rgan
izatio
nsPr
ovid
erre
gula
tory
org
aniza
tions
Phar
mac
ies
Hom
e he
alth
and
long
-term
car
ein
stitu
tions
Men
tal h
ealth
inst
itutio
nsPh
ysic
ians
Publ
ic h
ealth
TriC
are
(mili
tary
)In
dian
heal
th s
ervi
ces
Med
icar
eM
edic
aid
and
CHIP
Vete
rans
hea
lthad
min
istra
tion
Regu
latio
n
Hier
arch
ical
Cont
ract
s
Aid
to th
e po
or

Health systems in transition United States of America28
Public purchasers include federal and state agencies. The largest public purchaser is Medicare. The programme provides nearly universal coverage for Americans aged 65 and older, the disabled and those with end-stage renal disease. State governments, along with funds provided by the federal government, purchase health-care services through Medicaid and CHIP. Both programmes are state administered and primarily cover poor mothers and their children. Medicaid also covers disabled adults, long-term care services after individuals have used up all their own income and assets, and, along with Medicare, low-income seniors (these programmes are discussed in more detail in sections 3.3 and 3.4).
Both state and local government are also involved in health care in a number of ways that make it possible for low-income and other disadvantaged individuals and families to obtain care. These include such functions as operating public hospitals, providing medical and preventive services through state and local health departments and their associated clinics and community health centres, as well as other public health activities including regulating restaurant safety.
In addition to government purchasers, private insurers and individuals also purchase health care in the United States. Private insurance falls predominantly into three categories: health maintenance organizations (HMOs), preferred provider organizations (PPOs) and high-deductible plans (see section 3.5 for more details). The vast majority of Americans with private insurance obtain it through an employer. Only 10% have individually purchased coverage. In 2009 there were roughly 50 million people living in the United States without any health insurance, constituting 17% of the total population and about one in five adults under the age of 65 (U.S. Census Bureau, 2010a). Health services for the uninsured are often provided by a safety-net system of public and community clinics, as well as by hospitals and physicians.
The categories of health-care providers and services mirror those of other high-income countries and include: hospital, physician, dental, prescription drug, home health and long-term care, mental health, other professional, and public health services. Regulation of the United States health-care system, which is discussed in more detail in section 2.8, occurs at three levels: federal, state and private. Much of the regulation at the federal level comes under the HHS. Fig. 2.3 presents the organization of the regulatory bodies within HHS, which oversees programmes, issues regulations, and carries out federal government policy on a number of health-care and related matters.

Health systems in transition United States of America 29
Fig.
2.2
Orga
niza
tion
of th
e U.
S. H
ealth
Sys
tem
afte
r Im
plem
enta
tion
of th
e Af
ford
able
Car
e Ac
t
Regu
latio
n
Hier
arch
ical
Cont
ract
s
Aid
to th
e po
or
Larg
er e
mpl
oyer
spon
sore
d
Priv
atel
y in
sure
d in
divi
dual
s
Acco
unta
ble
Care
Org
aniz
atio
ns
Exch
ange
s
Smal
l em
ploy
ersp
onso
red
Indi
vidu
als
Hosp
itals
Phys
icia
nsDe
ntis
tsPh
arm
acie
sHo
me
heal
th a
ndlo
ng-te
rm c
are
inst
itutio
ns
Men
tal h
ealth
inst
itutio
nsOt
her p
rofe
ssio
nal
serv
ices
Publ
ic h
ealth
Fede
ral
gove
rnm
ent
Stat
ego
vern
men
t
Loca
lEx
ecut
ive
Legi
slat
ive
(Con
gres
s)
Offic
e of
Vete
rans
Affa
irsDe
partm
ent
of D
efen
seDe
partm
ent o
f Hea
lth a
ndHu
man
Ser
vice
s (D
HHS)
Sele
cted
Oth
er
DHHS
age
ncie
s:AH
RQ, C
DC, F
DA, N
IHCe
nter
s fo
rM
edic
are
&M
edic
aid
Serv
ices
Priv
ate
insu
ranc
e
Char
ities
HMO
PPO
High
dedu
ctib
leUn
insu
red
Judi
cial
Inde
pend
ent n
ongo
vern
men
tal
regu
lato
ry o
rgan
izatio
nsPr
ovid
erre
gula
tory
org
aniza
tions
TriC
are
(mili
tary
)In
dian
heal
th s
ervi
ces
Med
icar
eM
edic
aid
and
CHIP
Vete
rans
hea
lthad
min
istra
tion
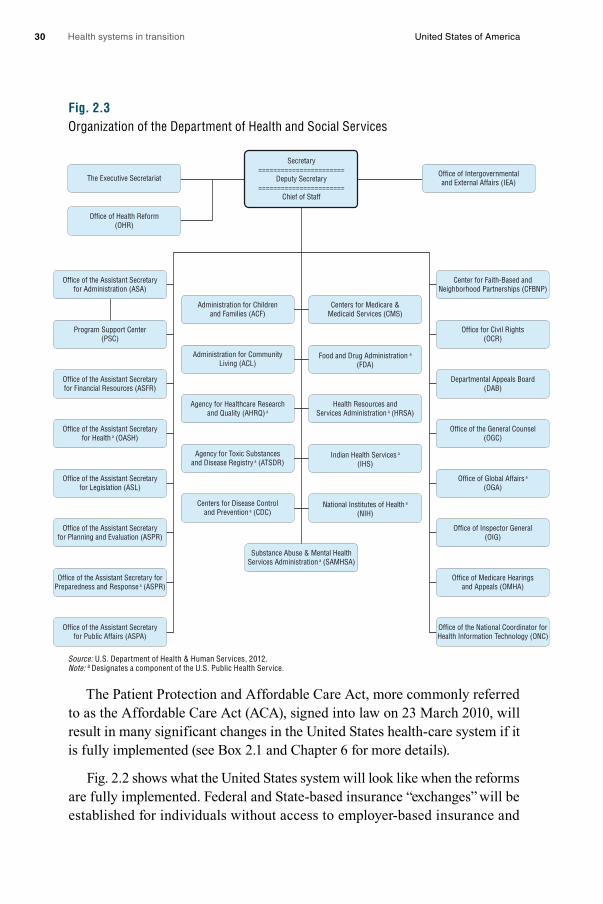
Health systems in transition United States of America30
Fig. 2.3Organization of the Department of Health and Social Services
Source: U.S. Department of Health & Human Services, 2012.Note: a Designates a component of the U.S. Public Health Service.
The Patient Protection and Affordable Care Act, more commonly referred to as the Affordable Care Act (ACA), signed into law on 23 March 2010, will result in many significant changes in the United States health-care system if it is fully implemented (see Box 2.1 and Chapter 6 for more details).
Fig. 2.2 shows what the United States system will look like when the reforms are fully implemented. Federal and State-based insurance “exchanges” will be established for individuals without access to employer-based insurance and
Office of Health Reform(OHR)
Office of Intergovernmentaland External Affairs (IEA)
Center for Faith-Based andNeighborhood Partnerships (CFBNP)
Office for Civil Rights(OCR)
Departmental Appeals Board(DAB)
Office of the General Counsel(OGC)
Office of Global Affairs a
(OGA)
Office of Inspector General(OIG)
Office of Medicare Hearingsand Appeals (OMHA)
Office of the National Coordinator forHealth Information Technology (ONC)
Office of the Assistant Secretaryfor Administration (ASA)
Administration for Childrenand Families (ACF)
Administration for CommunityLiving (ACL)
Agency for Healthcare Researchand Quality (AHRQ) a
Agency for Toxic Substancesand Disease Registry a (ATSDR)
Centers for Disease Controland Prevention a (CDC)
Centers for Medicare &Medicaid Services (CMS)
Food and Drug Administration a
(FDA)
Health Resources andServices Administration a (HRSA)
Indian Health Services a
(IHS)
National Institutes of Health a
(NIH)
Program Support Center(PSC)
Office of the Assistant Secretaryfor Financial Resources (ASFR)
Office of the Assistant Secretaryfor Health a (OASH)
Office of the Assistant Secretaryfor Legislation (ASL)
Office of the Assistant Secretaryfor Planning and Evaluation (ASPR)
Substance Abuse & Mental HealthServices Administration a (SAMHSA)
Office of the Assistant Secretary forPreparedness and Response a (ASPR)
Office of the Assistant Secretaryfor Public Affairs (ASPA)
Secretary=======================
Deputy Secretary=======================
Chief of Staff
The Executive Secretariat
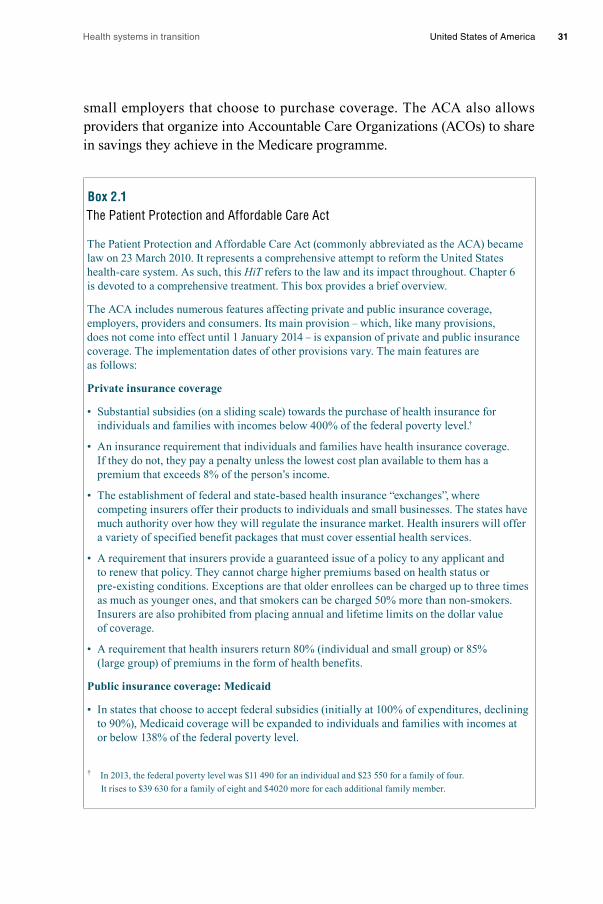
Health systems in transition United States of America 31
small employers that choose to purchase coverage. The ACA also allows providers that organize into Accountable Care Organizations (ACOs) to share in savings they achieve in the Medicare programme.
Box 2.1The Patient Protection and Affordable Care Act
The Patient Protection and Affordable Care Act (commonly abbreviated as the ACA) became law on 23 March 2010. It represents a comprehensive attempt to reform the United States health-care system. As such, this HiT refers to the law and its impact throughout. Chapter 6 is devoted to a comprehensive treatment. This box provides a brief overview.
The ACA includes numerous features affecting private and public insurance coverage, employers, providers and consumers. Its main provision – which, like many provisions, does not come into effect until 1 January 2014 – is expansion of private and public insurance coverage. The implementation dates of other provisions vary. The main features are as follows:
Private insurance coverage
• Substantial subsidies (on a sliding scale) towards the purchase of health insurance for individuals and families with incomes below 400% of the federal poverty level.†
• An insurance requirement that individuals and families have health insurance coverage. If they do not, they pay a penalty unless the lowest cost plan available to them has a premium that exceeds 8% of the person’s income.
• The establishment of federal and state-based health insurance “exchanges”, where competing insurers offer their products to individuals and small businesses. The states have much authority over how they will regulate the insurance market. Health insurers will offer a variety of specified benefit packages that must cover essential health services.
• A requirement that insurers provide a guaranteed issue of a policy to any applicant and to renew that policy. They cannot charge higher premiums based on health status or pre-existing conditions. Exceptions are that older enrollees can be charged up to three times as much as younger ones, and that smokers can be charged 50% more than non-smokers. Insurers are also prohibited from placing annual and lifetime limits on the dollar value of coverage.
• A requirement that health insurers return 80% (individual and small group) or 85% (large group) of premiums in the form of health benefits.
Public insurance coverage: Medicaid
• In states that choose to accept federal subsidies (initially at 100% of expenditures, declining to 90%), Medicaid coverage will be expanded to individuals and families with incomes at or below 138% of the federal poverty level.
† In 2013, the federal poverty level was $11 490 for an individual and $23 550 for a family of four. It rises to $39 630 for a family of eight and $4020 more for each additional family member.

Health systems in transition United States of America32
Box 2.1 – continuedThe Patient Protection and Affordable Care Act
Public insurance coverage: Medicare
• A provision that certain preventive services be provided with zero co-payment.
• Gradual removal of the “doughnut hole” for prescription drug coverage.
• Reduction of government payments to Medicare Advantage plans.
• Provision of bonuses to Medicare Advantage plans that achieve high quality scores.
• Formation of a board that will make binding recommendations to contain costs (unless overridden by Congress) if fee-for-service Medicare costs grow more quickly than one percentage point above gross domestic product.
Employers
• A requirement that employers with 50 or more employees offer health insurance coverage. If they do not, they pay a penalty.
• Provision of tax credits to some small employers that offer insurance coverage.
• Imposition of an excise tax (called the “Cadillac Tax”) for particularly generous employer health insurance coverage: those policies whose value exceeds $10 200 for individual and $27 500 for family coverage.
Providers
• Allowing providers to organize into Accountable Care Organizations that will share in savings they achieve in the Medicare programme.
• Establishment of a pilot programme to develop “bundled” payments for entire episodes of care.
• Link Medicare payment to hospitals and physicians on meeting specific performance targets.
• An increase in the number of positions for physicians working in primary care and in rural and other underserved areas, partly through scholarships and loans.
• Various forms of support to encourage more nurses, including additional federal support for training programmes, grants for loan repayment and establishing a career ladder for nursing.
Consumers
• An increase in taxes on unearned and investment income, as well as on payroll taxes earmarked to Medicare, for high-income individuals and families.
• A requirement that certain restaurants and vending machines post nutritional content such as calories.
• Making it easier for consumers to compare and choose health insurance policies by providing insurance information in a standard format.

Health systems in transition United States of America 33
2.2 Historical background
The United States health-care system developed largely through the private sector. No major government health insurance programmes operated until the mid 1960s and most government involvement until then was through state rather than federal regulations. While more Americans have private rather than public insurance – and the 2006 inclusion of prescription drugs under Medicare and the 2010 comprehensive reforms both relied on expanding the private insurance market – public and private sector spending are now roughly equal (see section 3.1). This is primarily because Medicare beneficiaries – seniors and the permanently disabled population – are more costly to cover than others.
2.2.1 Early developments
Through most of the nineteenth century, many different types of practitioner competed to provide care in the United States, much of which was of poor quality (Starr, 1982). Physicians typically had neither particularly high incomes nor social status. This changed only gradually towards the beginning of the twentieth century with the confluence of various factors including: a more scientific basis for medicine, improvements in medical training and the quality of hospitals, and consolidation of competing physician interests under the auspices of local (county) and state medical societies and nationally through the American Medical Association (AMA).
The 1910 publication of the Flexner Report represented a turning point in US health policy. Commissioned by the Carnegie Foundation, the report provided a detailed account of the poor quality of most United States medical schools at the time. This eventually led to the closure of some of the worst facilities, and improvements in medical school curriculum, the length of training, the quality of admitted students and the training facilities. As a result, individuals faced higher barriers in entering the field.
During the latter part of the nineteenth century and the first part of the twentieth century, hospitals also changed dramatically. Previously their reputation was poor; they were places to be avoided by those who had alternatives (i.e. people who could afford it received care in their home), and they mainly served the poor. As the scientific basis of medicine improved, facilities were enhanced and physicians became better trained – the hospital was transformed. The modern hospital largely evolved as a not-for-profit organization wherein physicians were granted privileges to treat their own patients. This was particularly appealing to the medical community because
Health systems in transition United States of America34
physicians could avail themselves of the latest technology and a cadre of trained nurses free of charge – which has been dubbed a “rent-free workshop” (Gabel & Redisch, 1979).
2.2.2 The origins and growth of private health insurance
Private health insurance in the United States had its beginnings around the early 1930s, with the establishment of non-profit Blue Cross plans for hospital care, and soon thereafter Blue Shield plans for physician care. The genesis of Blue Cross was a desire for hospital coverage on the part of workers and employers on the one hand, and the need for a steady stream of revenues on the part of hospitals mired in the Great Depression, on the other. The first hospital insurance plan began in 1929 in Dallas, Texas. In other parts of the country, hospitals banded together to provide this coverage under the auspices of Blue Cross, allowing enrollees to have the freedom to choose their own hospital. These arrangements were non-profit and did not require the cash reserves typical of private insurance because hospitals guaranteed the provision of services, which was possible because of empty beds during the Depression (Starr, 1982). Near the end of the 1930s, Blue Shield plans that covered physicians’ services were established under similar principles: non-profit status and free choice of provider.
Blue Cross and Blue Shield plans began to encounter competition from commercial (for-profit) insurers, particularly after the Second World War. While the Blues had, until that time, used “community rating” (where all contracting groups pay the same price for insurance), commercial insurers employed
“experience rating” (where premiums vary based on the past health status of the insured group), allowing them to charge lower prices to employer groups with lower expected medical expenses. Eventually, the Blues had to follow suit and switch to “experience rating” to remain competitive, blurring the distinction between the non-profit and for-profit insurers (Law, 1974; Starr, 1982). By 1951, more Americans obtained their hospital insurance from commercial insurers rather than Blue Cross (Law, 1974). More recently, a number have reorganized to become for-profit organizations.
The number of Americans with private health insurance coverage grew dramatically in the 1940s and 1950s. While only 6 million had some type of health insurance coverage in 1939, this had risen to 75 million people – half the United States population – by 1950. By the time Medicare and Medicaid were enacted in 1965, insurance coverage (public and private) had further expanded to 156 million – 80% of the United States population (Jost, 2007).

Health systems in transition United States of America 35
The tremendous growth rate in private insurance during this period was due in part to the fact that employer contributions to employee private health insurance plans were not considered taxable income for the employee (Gabel, 1999; Helms, 2008). There were other reasons for the expansion of private insurance through employment, however. Unions negotiated for coverage for their members and this was viewed as an important benefit because health-care costs were rising at the time (Jost, 2007). There are also economies of scale involved in purchasing through a group, and premiums tend to be lower since there is less concern about adverse selection. These factors, coupled with rising incomes with the onset and conclusion of the Second World War and new organizational forms to provide coverage, also help explain the growth (Cunningham, 2000). With no systematic government programme for providing coverage until the mid-1960s, this demand was satisfied through the employment-based system.
2.2.3 Medicare and Medicaid
In 1965, the first major federal health insurance programmes, Medicare and Medicaid, were established. Previous to their creation, a variety of indigent and charity care programmes existed for low-income patients. In one such programme, begun in 1950, the federal government matched state payments to medical providers for those receiving public assistance. In another, the Kerr-Mills Act of 1960 provided assistance to states to help seniors who were not on public assistance, but who required help with their medical bills (U.S. Department of Health and Human Services, 2000a).
Medicare covered Americans aged 65 and older, and Medicaid covered about half of those with low incomes.1 At its inception, Medicare was divided into two parts. Part A: Hospital Insurance was social insurance in that it was funded by payroll taxes on the working population. Part B: Supplemental Medical Insurance, covered outpatient and physicians’ visits and, although voluntary, was purchased by nearly all seniors since 75% of the premiums was paid from general federal revenues. Medicaid, in contrast, reflected a welfare model in that only those who met both income and certain categorical eligibility requirements (e.g. children under the age of 18 and female adults with children) could receive the coverage, which was largely provided free of patient charges. As discussed in section 3.4, states have had some flexibility in defining who is
1 In 1972 Medicare coverage was also expanded to include the disabled population as well as those with end-stage renal disease.
Health systems in transition United States of America36
eligible for coverage; however, their discretion in this regard will be reduced substantially in 2014 with the implementation of Medicaid expansion under the ACA for states opting to expand.
Prior to the enactment of Medicare, it was common for elderly Americans to be without health insurance. According to the HHS (U.S. Department of Health and Human Services, 2010a), just over half of Americans age 65 and older had hospital coverage, with far fewer being insured for surgery or outpatient care. Amy Finkelstein (2005) reported that hospital coverage among seniors in 1963 varied by region, from a low of 43% to a high of 68%.
Passage of the Medicare legislation – which is Title XVIII of the Social Security Act, whose current title is “Health Insurance for the Aged and Disabled” – was difficult. Proposals to cover seniors had been before Congress for more than a decade but did not make headway in part due to opposition from organized medicine.2 Passage of the legislation did not occur until a number of compromises were made, including: payments to hospitals based on their costs, payments to physicians based on their charges, and the use of private insurers to administer the programme. Eventually the federal government moved to enact payment reforms to control Medicare costs. In 1983, Congress adopted the diagnosis-related groups (DRGs) system for Medicare, which changed hospital reimbursement from being based on costs to one involving a fixed prospective payment based on the patient’s diagnosis. Then, in 1989 Congress enacted a Medicare fee schedule for physicians in the form of a Resource-based Relative Value Scale (RBRVS) to replace the previous charge-based system, with further controls being put on annual rates of increase in aggregate programme payments. The RBRVS system also aimed to reduce the gap in payments for provision of primary care services compared to specialist services (for more on payment mechanisms see Box 3.4).
One notable gap in Medicare benefits was outpatient prescription drug coverage. In 1988 the “Medicare Catastrophic Coverage Act” was signed into law. The law added drug coverage as well as other provisions related particularly to long-term care, but Congress repealed it just a year later. One reason was that the new benefit was to be funded entirely by Medicare beneficiaries. Many of them, however, already had supplemental prescription drug coverage through a former employer. There was also tremendous confusion about what the law did and did not cover (Rice, Desmond & Gabel, 1990).
2 For accounts of the history of Medicare, see Feder (1977) or Marmor (2000).

Health systems in transition United States of America 37
Almost two decades later, in 2006, a drug benefit was successfully added to Medicare. Beneficiaries obtain their drug coverage by purchasing it from private insurers, who compete for subscribers among Medicare beneficiaries. The benefit is subsidized in the order of 75.5% by general federal revenues.
2.2.4 Health planning
While the United States has dabbled in health planning activities – albeit far less than many other high-income countries – those involving regulation have been out of favour for the past two decades. If one defines the concept more broadly, to include public investments aimed at increasing the supply of selected services, however, then such activities have been more prevalent.
An early planning initiative in the United States was the Hill-Burton Act, which became law in 1946. It provided grants that allowed municipalities to build or expand hospitals until a particular bed-to-population ratio was achieved. In return, hospitals were required to provide a reasonable volume of services to persons unable to pay and to make their services available to all persons residing in the facility’s area (U.S. Department of Health and Human Services, 2010b). While the programme stopped providing funding in the late 1990s, many hospitals are still required to continue providing charity care.
Certificate of Need (CON) programmes were introduced in a number of states in the 1970s. These were designed to control hospital expenditures – primarily beds and equipment. They reached their peak soon after the passage of the National Health Planning and Resources Development Act of 1974, which required the establishment of local Health Systems Agencies, which were administered by local boards with a majority of members representing local consumers (Starr, 1982). Originally, hospitals needed permission from Health Systems Agencies for investments of greater than $100 000.
Most research has found that CON was not effective in controlling hospital spending. While in some areas the number of hospital beds grew more slowly than they might have otherwise, one spillover was an increase in capital spending per hospital bed (Salkever & Bice, 1976). A major problem was that the Health Systems Agencies were local boards. Communities would tend to benefit from higher hospital spending (more jobs, better equipped hospitals) but would bear little of the costs since health care is largely paid for by public and private insurers (Rice & Kominski, 2007). Moreover, funding was made available to carry out the plan (Institute of Medicine, Committee on Health Planning Goals and Standards, 1981; Hyman, 1982). The federal requirement that states employ CON was repealed in 1987, although most states (36 at the

Health systems in transition United States of America38
time of publication) still maintain a variety of CON regulations (Yee et al., 2011). Beyond CON, there has been little in the way of health-care capital controls in the United States. In general, hospitals are not restricted by government in the purchase of medical equipment and capital expenditures.
There have been a number of initiatives to encourage providers to go into primary care or to provide services in underserved areas. One notable effort that began in the 1970s and still exists today is the National Health Service Corps, which provides scholarships and loan repayments for physicians who practise at approved sites such as federally supported health centres, rural areas, Indian Health Service clinics, public health department clinics, prisons, and United States Immigration and Customs Enforcement sites.
2.2.5 Recent organizational and delivery developments
A number of innovative organizational forms of health-care delivery were developed in the United States. HMOs are organizations that provide, or contract to provide, health-care services on a largely prepaid basis to members through a network of providers. They existed in the United States for most of the twentieth century, although the term itself was not used until it was coined by Paul Ellwood in 1970. The first prepaid group practice was the Ross-Loos Medical Group, which began in Los Angeles, California, in 1929, and provided prepaid care to about 2000 municipal employees. The largest of the early HMOs – and still the largest today – was Kaiser Permanente, which was started by physician Sidney Garfield in the 1930s for construction, steel and shipyard workers in Southern California.
While early HMOs had their own dedicated physician staff, in recent years the market has shifted to the practice association and network model – sometimes called an HMO without walls. Under these arrangements the HMO contracts with multiple medical groups and hospitals to provide services to enrollees. In most arrangements, all care except for emergencies must be provided by network providers, while in others (Point-of-Service plans) an enrollee can go out of the network but at a substantial out-of-pocket (OOP) cost.
HMO enrolment grew rapidly beginning in the 1980s, particularly with the rise of the practice association and network models, which unlike group and staff model HMOs tended to be for-profit organizations. This stemmed, in part, from the passage of the HMO Act of 1973, which among other things required that employers with more than 25 employees that offered health insurance include at least one HMO option if one was available in their geographical area. Since the late 1990s, however, the market share of HMOs has fallen

Health systems in transition United States of America 39
substantially. One reason for this is a managed care backlash that occurred in the mid- to late -1990s, as patients rebelled against the tight restrictions that HMOs put on such things as seeking specialist care and hospital admission (Journal of Health Politics, Policy and Law, 1999), as well making it difficult to be reimbursed for care received.
Since then, PPOs have come to dominate the private insurance market. PPOs contract with a network of providers but they tend to pay physicians on a (discounted) fee-for-service basis and generally make it easier to seek care outside the network, in particular for specialist services. In 2012, among insured employees, 56% were in PPOs and only 25% in HMO or point-of-service plans (Claxton et al., 2012). (Most of the remainder are in high-deductible plans.) The popularity of PPOs stems in large part from their flexibility: employers can design a health benefits plan tailored to their specifications, and patients can seek care from any provider they wish but pay less out of pocket when they use their PPO’s network. Moreover, as HMOs removed many of their more onerous restrictions, their cost advantage over PPOs substantially declined (Hurley, Strunk & White, 2004). Finally, some enrollees feel more comfortable when their providers do not have strong financial incentives to control the amount of services provided.
A more recent development is the ACO. Briefly, ACOs are health-care providers, often consortia of independent organizations, that work in concert to improve patients’ health and reduce costs. The key element is coordinating patient care across a range of settings. Often participating providers and organizations are rewarded by public and / or private payers with part of the savings that may accrue, as well as for quality improvement. ACOs are described in more detail in Box 3.3 in Chapter 3.
A final development over the past few decades has been the gradual movement towards the corporatization of medicine in the United States. Increasingly, hospitals, physician groups, and insurers have been merging, thereby forming larger entities – and often becoming publicly traded – in part to take advantage of economies of scale but more often to increase their leverage in bargaining with other entities in the health-care sector. To give a single example – trends in for-profit ownership in the United States – between 1980 and 2006, the percentage of for-profit increases are as follows:• hospitals increased from about 10% to 20%• HMO enrolment increased from about 10% to nearly 70%• home health agencies increased from less than 10% to 40%• dialysis units increased from about 35% to 80%.

Health systems in transition United States of America40
In contrast, the percentage of nursing home facilities that were for-profit fell slightly (Rice & Unruh, 2009).
2.2.6 Comprehensive health-care reform
In March 2010, the United States enacted major health-care reform. The ACA expands coverage to the majority of uninsured Americans, through: (1) subsidies aimed at lower-income individuals and families to purchase coverage; (2) a mandate that most Americans obtain insurance or face a penalty; (3) a requirement that firms with over 50 employees offer coverage or pay a penalty; (4) a major expansion of Medicaid; and (5) regulating health insurers by requiring that they provide and maintain coverage to all applicants and not charge more for those with a history of illness, as well as requiring community rating, guaranteed issue, non-discrimination for pre-existing conditions, and conforming to a specified benefits package. Most of the major provisions are scheduled to go into effect in 2014. A brief summary of the ACA was included in Box 2.1, above. Chapter 6 is devoted to the ACA and the specifics of the legislation are deferred until then.
Although the ACA does not result in universal health-care coverage, it represents – along with Medicare and Medicaid – a major effort to move towards that goal. Efforts to provide comprehensive, national health insurance in the United States go back to the Great Depression, and nearly every president since Harry S. Truman – who held the position from 1945 to 1953 – proposed some form of national health insurance. Box 2.2 provides a brief summary of some of these efforts.
2.3 Organization
2.3.1 Federal and state government organizations
The President names the heads of major health agencies at the national level with the consent of the Senate. Governors play the same role in their respective 50 states. These individuals set the agenda, make policy and supervise the implementation of health laws and administrative orders. When a new President is elected, substantial changes may take place at the highest level of leadership in United States public health sector organizations. New offices and administrative agencies are sometimes added and, on occasion, some agencies are eliminated. This reflects the different policy priorities of the newly elected President. Career civil servants are numerous and carry out most

Health systems in transition United States of America 41
Box 2.2Efforts to provide universal health coverage in the United States
Prior to the enactment of the ACA, there had been a number of unsuccessful efforts to provide universal health coverage to the United States population. These efforts date back to the early part of the twentieth century. They failed for a variety of reasons: strong opposition from interest groups such as the AMA; Americans’ reticence to allow what they sometimes perceived as a “government takeover” of the health-care system; difficulties in reaching consensus even among groups supporting the concept; and problems in reaching a consensus in and between both houses of Congress and the president. This section provides a brief recap of some of these efforts. It is based on a number of sources: Altman & Shactman, 2011; Blumenthal & Morone, 2009; Johnson & Broder, 1996; Oberlander, 2003, 2012; and Starr, 2011.
The earliest efforts for universal coverage date back to the 1910s and were mainly spurred on by organized labour in the Progressive Movement. These efforts did not result in federal legislation; efforts were instead aimed at states but they were unsuccessful everywhere. The movement was successful, however, in enacting state-based Workmen’s Compensation laws that provided income when a worker was injured on the job. In part this was the result of timing: opponents of universal health insurance argued that America did not want to emulate Germany, its enemy in the First World War, nor should it follow a socialistic path that was argued by opponents to be akin to what was happening in Russia after the revolution. Equally important was opposition from key groups, particularly employers and insurers, who did not want to see an overly strong federal presence in the private market. Interestingly, insurers did not sell health insurance at that time but they did want to protect a related business – insurance for the costs of funerals.
The first real opportunity for a federal law came in the mid-1930s when the United States approved the Social Security Act, which provided old-age pensions and unemployment insurance. Some in the Roosevelt Administration thought this was an opportune time to provide health coverage to the population as well but it became clear that inclusion of health insurance was controversial and would put at risk passage of the old-age pensions and unemployment insurance. While there is disagreement among analysts as to how committed Roosevelt was to universal coverage, it is clear that the proposals faced strong opposition, particularly from the AMA. The AMA was quite blunt in equating support of national health insurance with communism but implicit were concerns that a federal programme would lead to budgetary authority that could result in tight fee controls and a movement towards prepaid group practice.
With Roosevelt’s death in 1945, President Truman became the first president to actively champion for universal coverage, believing that health insurance coverage was a basic right. A bill proposed by three members of Congress would have provided coverage to all Americans, not just workers. This effort also failed, with the bill not making it out of committee onto the floor of either chamber of the house – as a result of a forceful campaign led by the AMA, but also because even though Democrats held the presidency and both Houses of Congress, legislation was blocked by a coalition of the Republicans and conservative Democrats from the southern states.
There was little movement towards universal coverage during the 1950s. Rather, there was tremendous growth in private health insurance provided through employers. There was, however, renewed interest in health care under the Kennedy and Johnson Administrations
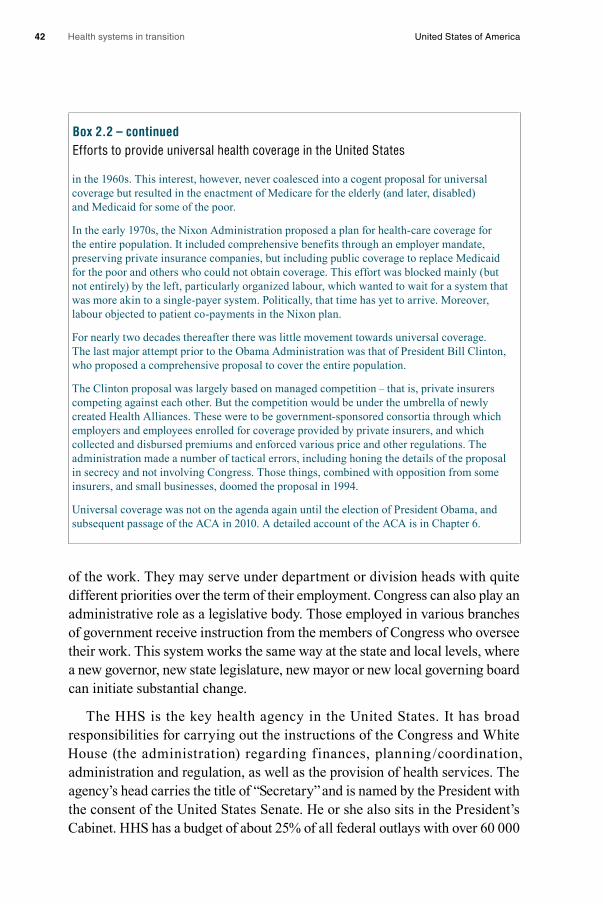
Health systems in transition United States of America42
of the work. They may serve under department or division heads with quite different priorities over the term of their employment. Congress can also play an administrative role as a legislative body. Those employed in various branches of government receive instruction from the members of Congress who oversee their work. This system works the same way at the state and local levels, where a new governor, new state legislature, new mayor or new local governing board can initiate substantial change.
The HHS is the key health agency in the United States. It has broad responsibilities for carrying out the instructions of the Congress and White House (the administration) regarding finances, planning / coordination, administration and regulation, as well as the provision of health services. The agency’s head carries the title of “Secretary” and is named by the President with the consent of the United States Senate. He or she also sits in the President’s Cabinet. HHS has a budget of about 25% of all federal outlays with over 60 000
Box 2.2 – continuedEfforts to provide universal health coverage in the United States
in the 1960s. This interest, however, never coalesced into a cogent proposal for universal coverage but resulted in the enactment of Medicare for the elderly (and later, disabled) and Medicaid for some of the poor.
In the early 1970s, the Nixon Administration proposed a plan for health-care coverage for the entire population. It included comprehensive benefits through an employer mandate, preserving private insurance companies, but including public coverage to replace Medicaid for the poor and others who could not obtain coverage. This effort was blocked mainly (but not entirely) by the left, particularly organized labour, which wanted to wait for a system that was more akin to a single-payer system. Politically, that time has yet to arrive. Moreover, labour objected to patient co-payments in the Nixon plan.
For nearly two decades thereafter there was little movement towards universal coverage. The last major attempt prior to the Obama Administration was that of President Bill Clinton, who proposed a comprehensive proposal to cover the entire population.
The Clinton proposal was largely based on managed competition – that is, private insurers competing against each other. But the competition would be under the umbrella of newly created Health Alliances. These were to be government-sponsored consortia through which employers and employees enrolled for coverage provided by private insurers, and which collected and disbursed premiums and enforced various price and other regulations. The administration made a number of tactical errors, including honing the details of the proposal in secrecy and not involving Congress. Those things, combined with opposition from some insurers, and small businesses, doomed the proposal in 1994.
Universal coverage was not on the agenda again until the election of President Obama, and subsequent passage of the ACA in 2010. A detailed account of the ACA is in Chapter 6.

Health systems in transition United States of America 43
employees. Its various components administer grants and provide / purchase health insurance for about 25% of the population. HHS coordinates and monitors the performance of many state and local health organizations. The financing for many programmes that are jointly administered at the federal government, state and local level, flows through HHS. The department includes more than 300 programmes, covering a wide spectrum of activities. These programmes not only provide services nationwide but they also enable the collection of national health and other data.
Key government organizations within HHS include the following (see Fig. 2.3 for HHS organization):• The CMS is by far the largest agency in HHS because it administers
the Medicare, Medicaid and CHIP programmes, which cover about 100 million Americans. It has about 5000 employees and annual expenditures on various coverage programmes and agencies of $794 billion in 2013.
• The AHRQ focuses on comparative effectiveness, quality improvement and safety, health information technology, preventive and care management and health-care value. It is generally viewed as the main federal government agency that focuses on health services research, although many other organizations address health services. AHRQ’s budget in 2013 was approximately $400 million.
• The CDC works with partner organizations to accomplish its mission through such areas as health monitoring, prevention research, promotion of healthy behaviours, and fostering safe and healthful environments. Its 2013 budget was nearly $6.7 billion.
• The FDA is responsible for assuring the safety, efficacy and security of human and veterinary drugs, biological products, medical devices, food supply, cosmetics, and products that emit radiation. It also regulates tobacco manufacturing, marketing and distribution, with special interest in reducing tobacco use by minors. Its 2013 budget was approximately $2.5 billion.
• The National Institute of Health (NIH) fosters fundamental discoveries, developing resources to prevent disease and promoting scientific integrity. NIH has within it about two dozen institutes and centres, examples of which are the National Cancer Institute, the National Institute on Aging, the National Heart, Lung, and Blood Institute, and the National Library of Medicine. Its 2013 budget was approximately $31.8 billion.

Health systems in transition United States of America44
• The Indian Health Service, also under HHS, serves nearly 2 million individuals with an annual budget of about $4.7 billion (Indian Health Services, 2013), and is funded through federal government general revenues.
Congress is also advised by several federal organizations, including the Congressional Budget Office (CBO), Medicare Payment Advisory Commission (MEDPAC), and, under the ACA, the Independent Payment Advisory Board (IPAB). The CBO produces non-partisan analysis to Congress to support its budget process. CBO reports provide independent analysis to inform the health policy process. MEDPAC is an independent body that advises Congress on payments to private health plans, fee-for-service providers, and access and quality of care issues related to the Medicare programme. IPAB has the authority to recommend proposals to the secretary of HHS to limit Medicare spending growth. The secretary is required to implement IPAB proposals unless Congress adopts alternative proposals yielding equivalent savings (Kaiser Family Foundation, 2010a).
The VHA is operated by the U.S Department of Veterans Affairs. It covers 6 million veterans at 1400 sites across the country, including approximately 170 medical centres, employing more than 250 000 people, and including over 100 academic health systems (U.S. Department of Veterans Affairs, 2010). Spending on VHA medical care exceeded $40 billion in 2009 and is covered through general federal government revenues. TriCare – financed through federal general revenues – pays for civilian health services used by active military and their families and some retirees, serving almost 10 million people. Generally, services must be received through the programme’s managed care networks, and require modest premiums and co-payments. Total spending on military care was about $50 billion in 2010.
Public health organizations exist at every level: national, state, county and city. Public health functions are carried out by administrative units in diverse parts of the governmental organizations. The CDC, an HHS agency, is a principal component. Another example is the Commissioned Corps of the United States Public Health Service, headed by the Surgeon General. The public health services are organized as a military unit with a Commissioned Corps of 6000 that includes uniformed service and rankings that parallel military lines. Members of the United States Public Health Service Commission Corps serve throughout the various offices and agencies in HHS as well as the Environmental Protection Agency, and the United States Departments of Defense, Agriculture, and Homeland Security.

Health systems in transition United States of America 45
Each of the main public health systems in the United States has a complex set of structural arrangements. Some health programmes in the United States health system, such as Medicaid, are organized and administered differently in each of the states, which makes it difficult to cover them in any depth here. Medicare is examined in some detail because it is a national programme.
The CMS has responsibility for the administration of the Medicare programme, which in 2009 cost $509 billion dollars. Official federal statistics show that the direct administrative costs constitute less than 2% of the total Medicare programme expenditures – 1.4% for Part A of Medicare, 1.6% for Part B and 0.6% for Part D (Klees, 2009, p.17). Estimates by outside agencies, however, are larger (Litow, 2006). In addition, a Board of Trustees, comprised of both public and government appointees, is required to report to Congress annually about the financial and actuarial status of the Medicare programme. The financing of Medicare is discussed in Chapter 3.
The Social Security Administration (SSA) makes the initial determination as to whether or not an individual who applies for Medicare fulfils eligibility requirements. SSA also arranges for the Part B premiums to be withheld from the participant’s Social Security benefit cheque and determines an individual’s premium level, as these differ depending on a beneficiary’s income. In addition, SSA maintains the database for Medicare in conjunction with its own records. As of 2012, it has responsibilities pertaining to the establishment of Medicare Part D for pharmaceuticals and it now withholds monthly premiums for this programme upon request from a beneficiary. The Internal Revenue Service (IRS), which is part of the United States Department of the Treasury, collects Part A payroll taxes from workers and their employers. IRS data from an individual’s tax return are used to determine eligibility for income-adjusted subsidies for Part B and D Medicare (Klees, 2009).
One critical issue is that United States government health-care system organizations overlap, and programmes between the various actors in Fig. 2.1 sometimes duplicate each other. This can leave gaps in services in particular coverage areas and duplication in other areas, which can be confusing to patients and providers. For example, two public programmes – Medicare and Medicaid – each cover some long-term care, but they are not closely coordinated.
2.3.2 Private organizations
Purchasers and providers have national-level professional organizations that represent their common interest, operate as spokesmen for them and lobby policy-makers in Congress to advance their respective policy preferences. For

Health systems in transition United States of America46
example, America’s Health Insurance Plans (AHIP) is a national organization that represents about 1300 private for-profit companies that provide health insurance coverage, dental insurance, long-term care insurance and disability income insurance, as well as a variety of other insurance products.
Each payer listed in Fig. 2.1 has a different organizational structure, though they share some organizational characteristics. Most private sector employers that offer health insurance are publicly traded. They have corporate structures and are subject to the accounting and reporting obligations of the Securities and Exchange Commission (the stock exchange). Employers that qualify as private companies (not listed on the stock exchange) have greater freedom and fewer reporting obligations than public companies.
Until the main provisions of the ACA take effect in 2014, very few employers in the United States have been required to provide health insurance for their employees, though there are tax advantages for doing so. Most large employers, public or private, “self-insure”, which means that they offer health insurance to their employees directly rather than purchasing it from an insurance company. They may hire an outside agency or an insurance company, sometimes referred to as a third party administrator, to manage their company health insurance plan. Companies that self-insure assume the financial risk but they may purchase insurance to cover any employees that incur large medical costs, a practice that is referred to as reinsurance.
In addition, there are some significant private or independent organizations that play an important role. For example, the National Committee for Quality Assurance (NCQA) measures and reports on quality of care of those physicians, hospitals and health plans that pay to be evaluated. Another is the Joint Commission – formerly the Joint Commission on Accreditation of Healthcare Organizations – that accredits and monitors the quality of health-care organizations.
2.3.3 States
The 50 state government organizations are major actors in the United States health-care system. They share important roles with the federal government in finance, planning, administration, regulation and the provision of health care through Medicaid, mental health services, public hospitals and health departments (with the cities and counties). They monitor and enforce environmental regulations, some of which are issued by the federal government. They license physicians, nurses and other health-care workers and regulate the sale of health insurance. However, there are serious questions about the
Health systems in transition United States of America 47
effectiveness of state medical boards, since they often fail to discipline doctors with a record of hospital actions against them (Levine, Oshel & Wolfe, 2011). Research suggests that state medical licensing boards that have sufficient staff, that are better organized and that maintain a certain independence from the state government are more conscientious about disciplining doctors (Law & Hansen, 2010).
States accomplish their roles in the health-care system through various organizational structures. Most states have a Division of Insurance as well as a Department of Health, Human Services or Social Services. These administrative departments are generally organized much like their equivalents on the federal level. Many large cities have a similar organization. Most states, unlike the federal government, may not legally run a budgetary deficit and this affects how they fulfill their functions. States emphasize health care to varying degrees, which makes for wide variations in health services offered to citizens.
Medicaid is jointly funded by the federal and state governments. Although administered by the states, numerous federal requirements apply. The ACA aims, in part, to reduce the wide Medicaid eligibility variations across the states. In 2010, an Arkansas parent could receive Medicaid coverage only if his or her income was 17% or less of the federal poverty level, while in Minnesota the limit was more than 10 times as high at 211% (Kaiser Family Foundation, 2010b). Medicaid plays a key role in the United States health-care system. In 2003, for example, Medicaid financed 41% of the births in the country (Kaiser Family Foundation, 2010c).
2.4 Decentralization and centralization
In the United States decentralization and centralization operate through federalism. Federal government and state responsibilities were partitioned by the Constitution. The resulting federal system sets the stage for the organization of the health sector and defines the respective responsibilities of the states and the federal government. They share many powers, with primacy shifting between them over time. There are advantages and disadvantages to centralization and decentralization as played out under the auspices of United States federalism. In theory, the 50 states innovate and test policies that may later be adopted by the federal government. Examples of innovations in health policy from several states suggest that this does not always work out as anticipated. The cases

Health systems in transition United States of America48
of Hawaii, Tennessee, Oregon, Maryland, Massachusetts and Vermont are discussed below in Box 2.3. However, the United States federal system also has given rise to inequality of services across the different states.
Decentralization in the United States is complicated and includes devolution, delegation and privatization. The organization of the United States health-care system is inf luenced by the balance of power between the federal government and states. In addition, coordination among the centres of authority, administrative / financial capability of responsible actors and the regulatory framework for public–private partnerships complicates system organization. An explanation of the complex and varied history of United States federalism is helpful in understanding current trends in centralization and decentralization.
2.4.1 History and evolution of federalism
The United States Constitution defines the structure of American federalism. The federal government and the states have specific responsibilities designated to them by the 10th Amendment to the United States Constitution, ratified in 1791 (Weissert & Weissert, 2006). In addition, a “residual powers clause” in that amendment mandates that “the powers not delegated to the United States by the Constitution, nor prohibited by it to the States, are reserved to the States respectively, or to the people”. However, understanding exactly what this means is subject to legal debate (Weissert & Weissert, 2006, p.247).
Throughout United States history, power has shifted back and forth between federal and state governments. Centralization followed the American Civil War that freed the slaves (1861–1865), as the federal government emerged more powerful. The Reconstruction Era (1865–1877) followed, with the federal government attempting to not only rebuild the Southern Confederacy states, but also transform the culture of these states that lost the Civil War. Government by the United States Army was imposed, temporarily, until elections – which included former slaves – could be organized. These and other Reconstruction Era policies were met by a backlash after 1877. Subsequently, governmental decentralization, which increased the power of the states, eventually led to the segregation and disenfranchisement of African Americans in the South that continued for almost a century. The pendulum of federalism changed with The New Deal (1933–1936), in President Franklin D. Roosevelt’s first term. Centralization resulted as the federal government took action to meet the challenges of the Great Depression. The civil rights movement of the 1960s also brought major change (Baker BE, 2007).

Health systems in transition United States of America 49
Box 2.3Health policy innovations in six states
Hawaii, Tennessee, Oregon, Maryland, Massachusetts and Vermont illustrate the range of policy innovations that are associated with reorganization of state health-care systems.
HawaiiHawaii’s health insurance innovations dating from 1974 reorganized health insurance around an employer mandate. Employers were required to offer health insurance to all those who worked full-time (Lewin & Sybinsky, 1993). Former President Richard Nixon had proposed this type of health insurance for the United States (1969–1974) but it was not adopted at the national level. Hawaii’s insurance plans are regulated with low co-payments and no deductibles. For the most part, insurers in this state are large, not-for-profit companies. Administrative costs are lower than other states, about 7%. Hawaii’s near-universal system is one of the least expensive in the United States and outcomes in terms of longevity are among the best (Harris, 2009).
TennesseeTennessee received a waiver to experiment with cost control and expanded access (Mirvis et al., 1995). Called TennCare, it was adopted in 1994 and it included publicly paid health insurance for both the very poor and those with pre-existing conditions that made them uninsurable. Access to health care was rapidly expanded, but cost overruns required that Tennessee reduce participation in 2005. Physicians complained bitterly about the low reimbursement rates (Johnson, 2009).
OregonBetween 1989 and 1993 the state of Oregon reorganized its Medicaid programme. It adopted legislation that permitted the use of Medicaid funds to serve about 20% of the lowest income residents of that state. This Oregon Health Plan was a form of Medicaid expansion administered by the private sector. It included explicit prioritization of health services based on a ranking of the perceived efficacy of 700 health services (Kitzhaber, 1993). Rankings were carried out by medical professionals and consumers using the evidence-based information that was available. Those services deemed most helpful and efficacious to the patient were covered to the extent that financial resources permitted. This was reviewed by the legislature every two years. The underlying philosophy of the programme was that it is better to provide “fewer services to more people rather than more services to fewer people” (Somnath, Coffman & Smits, 2010, p.18).
The Oregon Health Plan’s fiscal viability declined when the state experienced an economic downturn. The federal authorities refused to permit Oregon to remove some services from the list of covered services. Co-payments and deductibles were added. Enrolment declined and the programme was closed to new enrollees (Oberlander, 2006).
MarylandSince 1977 the state of Maryland has set prices for hospital care with an all-payer system (Zhang, 2009). Prices are periodically negotiated with stakeholders. Positive assessments report that inner-city hospitals that care for the very poor and uninsured have remained financially solvent across decades. Hospitals are compensated when they care for the uninsured. Hospital profit margins are more stable than for hospitals in other states. Maryland’s hospital charges for average care are about 60% lower than the national average (Vestal, 2011; Murray, 2012).

Health systems in transition United States of America50
Box 2.3 – continuedHealth policy innovations in six states
However, there is disagreement as to the success of the Maryland “all-payer system” (Pauly & Town, 2012). While Maryland’s hospital regulated price system survived the deregulation movement in the 1970s, as well as the escalation of hospital prices in recent decades in the United States, it is threatened by doctors who are setting up “outside operations such as ambulatory surgery centers, medical imaging and diagnostic testing in smaller facilities” (Vestal, 2011). These outside facilities undercut the prices of regulated hospitals and clients have an incentive to move to these lower cost, smaller physician-owned facilities. The advantage of the regulated price system is that the cost of uncompensated care is spread across the hospital system but the physician-owned facilities are advantaged because they do not share this burden.
MassachusettsIn 2006 Massachusetts enacted health reform (called MassCare) that included a mandate that state residents obtain health insurance. The goal of the Massachusetts health-care reform was to reach near-universal health insurance with responsibility being shared by individuals, employers and government. A state-sponsored agency called the Commonwealth Health Insurance Connector organizes a web site exchange for purchasing insurance for those with or without state government subsidies. Subsidized insurance is offered to those with low incomes. Residents with incomes below 150% of the FPL are fully subsidized, and those with incomes between 150% and 300% of the FPL receive partial subsidies on a sliding scale. Employers with 11 or more employees must offer insurance that meets a state-specified standard to their employees and if they fail to do so, they are penalized, albeit a relatively small payment – $295 per employee per year.
Everyone in Massachusetts is required to have insurance through their employer from Medicaid or through Commonwealth Care – which helps individuals to find affordable private insurance if they do not qualify for Medicaid or employer insurance. Those who do not obtain coverage face a financial penalty. While uninsurance rates were lower than average prior to the reform, they are now far lower than any other state in the country – one third of the national average (Kaiser Family Foundation, 2012a).
The ACA is similar to MassCare but some differences exist and changes will have to be made to the programme by January 2014 so the state complies with federal law. For example, subsidies will have to be extended to those with incomes up to 400% of the poverty line. To carry out its health reform, Massachusetts received a Medicaid waiver from the federal government.
The largest remaining problem is costs, as per capital spending exceeds the national average by 15% (Kaiser Family Foundation, 2012a). The state is now focusing on cost containment with several initiatives, including some oriented towards movement away from FFS payment.
VermontIn 2011 Vermont adopted legislation to implement a single-payer system organized around a publicly financed insurance system. Vermont’s single-payer plan includes an all-payer system with a global budget for the state’s health-care costs. If it is actually implemented between 2014 and 2017 as planned, it will be the first state in the United States to adopt this form of organizational health-care system. Payments will be based on fee-for-service. A special five-member board, the Green Mountain Care Board, will be established to control
Health systems in transition United States of America 51
2.4.2 Federalism in the health sector
States play an important governance role in the health sector. To review, states fund and manage many public health functions, pay part of the cost of Medicaid and mental health care for the poor, support public hospitals and health departments, and monitor environmental protection. States set the rules for health insurance policies that are not covered by self-insured employer plans; self-insured employers are regulated by the federal government under the terms of the ERISA, which preempts state law (section 2.8). States may, if they choose, regulate increases in health insurance rates (Weissert & Weissert, 2006, p.236). State boards of health and state public health advisory boards provide important functions in about half the states. The role of these agencies varies from that of a quasi-legislative organization to that of quasi-judicial “enforcement of rules or regulations through hearings and appeals”. In some cases they hold agency oversight functions and the “authority to appoint or remove the state health officer, or make binding agency personnel, fiscal or organizational decisions” (Hughes et al., 2011, pp.37–38).
States educate, provide credentials and regulate medical care providers. The responsibility for the licensure of practitioners is delegated to the states under the terms of the Constitution’s “residual powers clause”. National-level, nongovernmental professional associations set standards for the education and certification of practitioners. This serves to counterbalance the power of the individual states to some degree. These functions of education and providing credentials represent a type of reassignment of what is, in many countries, a government function. This transfers power from public to private non-profit entities and voluntary organizations that set their own standards for admission.
Box 2.3 – continuedHealth policy innovations in six states
costs by establishing reimbursement rates for providers and by streamlining “administration into a single, unified system” (Howard, 2011). The goals are to reduce the cost of administration, to simplify the health insurance systems and to shrink overall costs (Wallack, 2011). Projected costs savings after the first year of operation are predicted to be close to 25% (Hsiao et al., 2011). Vermont already has experience with several policy components that will go into the make-up of its single-payer system. However, it must obtain a federal government waiver because its single-payer reform departs from the standard federal Medicaid system requirements.

Health systems in transition United States of America52
2.4.3 Weighing decentralization and centralization
The performance of the states in terms of their policy-making capacity in the health sector has improved over time (Weissert & Weissert, 2006, p.234). However, the states have been challenged by repeated recessions and the unpredictability of their income and sales-based revenue sources. Most state constitutions prohibit running a budget deficit while the federal government has no similar constraint. This means that many states have difficulty managing their respective health-care systems, even though, in theory, they have the power to raise and spend additional revenues on their own (Weissert & Weissert, 2006, p.251).
The argument in favour of decentralization is that the states know the needs of their local citizens better than the federal government. Indeed, the United States is a large country with a population in 2012 of about 314 million. Size makes centralization and coordination difficult. In addition, regions vary widely with respect to lifestyle health variables and this complicates national-level policy-making (Krueger, Tajudaullah & Rosenau, 2009). At the same time, decentralization in the United States leads to greater inequality between the states. Historical factors, reviewed above, explain some of the variations in state policies – for example solidarity and fairness (Chen & Weir, 2009). Today, the Medicaid programme is an example of how inequality can develop in decentralized programmes. Citizens of some states have lower rates of access to safety-net health services and their overall health varies widely depending on the state in which they reside. There are significant differences in mortality amenable to health care from state to state. Top performing states registered 64 deaths per 100 000 population in 2004–2005 that were attributed to causes amenable to health care. The lowest performing state exhibited a loss of 142 lives per 100 000 population (McCarthy et al., 2009). Some states do as well as many of the top high-income countries on health indicators, while the lowest performing states rank far below (Nolte & McKee, 2008).
2.4.4 Federalism and the ACA
The collaboration between the federal government and the states regarding the ACA is an example of a work in progress for federalism; it is an attempt to balance decentralization and centralization. It illustrates the open character of United States federalism in that it permits those states that wish to do so to exceed the federal requirements at the same time that exemptions and waivers

Health systems in transition United States of America 53
have been agreed upon for states that wish to avoid participation in federal programmes (Conlan & Posner, 2011). In many cases, the states are allowed to use their own methods to achieve or exceed federal goals.
One implicit federal goal of the ACA is to reduce disparities between the states in the health sector. The federal government sets the minimum eligibility requirements for programmes such as Medicaid that the states must respect. There is some devolution of power to the states for certain forms of operating authority such as setting up and managing the health insurance exchanges, determining what constitutes essential benefits for health plans and monitoring insurance premiums. The HHS is instructed, under the terms of the ACA, to monitor the performance of the states and to intervene should a state be unable or unwilling to provide services, such as a functioning health insurance exchange where individuals and small businesses can purchase insurance. The default in cases where states fail to set up an exchange is that the federal government will provide one for those who live in these states. Some state political leaders view the ACA as an effort toward re-centralization.
2.4.5 States as innovators for the federal level
The health policy innovations of several states are reviewed in Box 2.3. The states are said to serve as policy laboratories for the federal government. In this perspective, policy innovations at the state level can inspire federal legislation that is then adopted at the national level and applied to all the states (Weissert & Weissert, 2006, pp.276–78). For example, the use of DRGs by the Medicare programme was originally based on a similar system first implemented in New Jersey. One prominent example of state policy that appears to have influenced the ACA is that of Massachusetts. In 2006, Massachusetts adopted legislation to provide near-universal health insurance for state residents (Weissman & Bigby, 2009).
Others argue, however, that state policy innovations are of limited value to the federal government because states differ so much (Oberlander, 2006). In addition, to be relevant for the federal level, state experiments must stand the test of time. Innovations discussed above in Oregon and Tennessee have not survived this test of time. Some state-level policy experiments and demonstration projects based on Medicaid waivers were financed by the federal government but few have led to federal legislation. Empirical research suggests that between 1973 and 2002 the House of Representatives did not pay much attention to state innovations (Volden & Wiseman, 2011).

Health systems in transition United States of America54
2.5 Planning
There is a range of public and private organizations that undertake planning relevant to health systems in the United States. In general, extensive planning by the public sector is rare. However, planning for emergencies and natural disasters is given serious consideration in both the government and the private sector. The CDC plans for national and international responses to public health emergencies. In some cases, government organizations formulate and publish a plan for action to meet public health needs. State and local governments accomplish much of the health sector planning. The United States participates in international health plans.
2.5.1 Health sector planning by the public and private sectors
As in other countries, planning in the United States health sector is not just a government activity: private corporations, public–private partnerships and nongovernmental organizations (NGOs) all engage in planning activities, internal to their organizations, to some extent. Coordinated health planning by various players / actors as outlined in Fig. 2.1 is not highly developed. In part this reflects the pluralist and market-oriented nature of the United States health-care system. Each system in Fig. 2.1 generally functions independently when it comes to planning, and it does so within its designated mandate. While government organizations may have elaborate internal planning for future activities, coordination between national programmes – for example, the VA and Medicare – receive less attention. Planning at the federal government level is also a matter of navigating within and between state systems.
Planning by private corporations is important in the health sector in the United States. It takes place at the level of the business itself with the goal of assuring financial viability. The private sector innovates in ways that are not always available to government. For example, in an effort to reduce costs, private United States insurers have experimented with managed care, higher deductibles, consumer oriented and directed health plans, and even payment for services abroad (Mexico) or in other United States state locations. This includes patient mobility for discretionary medical procedures (Rosenau, 1997). On the other hand, the fact that insurance and accreditation is a state-level responsibility discourages planning across state borders.
Business planning involves attaining efficiency within the private sector and the failure to plan efficiently may lead to bankruptcy and dissolution of the private corporation. Corporate planning necessarily focuses on fiduciary

Health systems in transition United States of America 55
responsibility to shareholders rather than accountability to patients and society. Government planning involves direct intervention whereas the private sector does so to a far lesser extent. However, private planning is not without constraint from regulatory agencies. This is discussed in section 2.8.
Government and the corporate sector do not formally coordinate their activity on the basis of a comprehensive national plan in the health sector but outsourcing means that they work together indirectly. For example, Medicare delegates many responsibilities to private contractors, which undertake substantial planning activity.
Government planning receives more attention here than private sector and corporate planning because more is known about it. Planning in the corporate sector is often proprietary and concerns about competitors obtaining proprietary information can discourage transparency.
2.5.2 Ambivalence about planning
Comprehensive, coordinated, decision-making and system-level planning is not widespread in the United States for a variety of reasons (Wildavsky, 1973; Friedman & Friedman, 1990).
Compared to other countries, there is little coordinated system-level planning in the United States. Policy-makers associate planning with a comprehensive method, rather than the incremental one they prefer. The conviction is widespread that incrementalism, defined as the “successive limited extensions of past approaches”, is the best way to proceed (Lindblom, 1959; DeSario, 1982, p.172). Planning also interferes with the give and take of behind-the-scenes negotiations that typically go into formulating policy in the United States (Lindblom, 1959; Wildavsky, 1973). The role of active stakeholders in the United States policy-making process constitutes a subtle source of interference with planning processes and funding decisions (Raab, 1981). Minimalist planning also reflects public distrust of the federal government and confidence in markets as an appropriate nongovernmental mechanism or substitute for planning.
Finally, little of the planning activity in the public sector is highly coordinated with planning in the private sector to address major health-care system concerns, such as national health-care costs or the social determinants of health. There is no national, evidence-based plan for action in the United States health sector. The absence of much planning has consequences. For example,
“providing and paying for long-term care in the United States reflects piecemeal development history and shared federal-state responsibility. The result can be

Health systems in transition United States of America56
confusion among patients and providers, amid seemingly illogical patterns of insurance coverage and available services” (Ng, Harrington & Kitchener, 2010, p.1).
2.5.3 Minimalist planning in the United States
The human resources area is an example of minimalist planning in the United States health-care system. Given the private ownership and competition-based model of provision in the United States health-care system, the number, type and location of health facilities, beds and expensive technology is initially determined by private sector actors, based on their estimates of their ability to make a profit or, in the case of non-profits, to cover their costs and generate a surplus. Local and state governments influence the supply of health providers because they control licensing and permits. It is also difficult for states or the private sector within a federal system to plan for human resources because of employment mobility.
The absence of societal level health planning sometimes leaves rural areas and underserved inner cities without necessary services while there may be an excess of services available in affluent urban areas. Public sector options sometimes cover indigent care with public and federally qualified clinics. The ACA, however, includes provisions to provide more medical and surgical residency positions in underserved areas, as well as increasing the training of nurses while also encouraging them to relocate to underserved areas.
Some government organizations do plan improvements for the United States health-care system. In 1996, the Task Force on Community Preventive Services was set up by HHS to assess which community-based health promotion and disease prevention interventions were empirically viable and which were not. The CDC was the HHS agency that provided technical and administrative support for this Task Force (Truman et al., 2000). The web site of the Community Preventive Services remains a resource for community planning today but it does not have systematic funding to reinforce community efforts.
Although government agencies plan, not all of them have the power to finance and implement the plans they systematically develop. Examples are discussed below. Again emergency and natural disaster plans are an exception where financing and implementation are more likely to be assured.
Nongovernmental bodies seek to influence public opinion and attentive policy-makers who are open to suggestions for policies in the health sector but they do not have the capacity to implement change. When a problem is

Health systems in transition United States of America 57
identified, a task force may be formed. Sometimes research is commissioned and study results are made public. In some cases, health sector planning is undertaken by NGOs such as the Institute of Medicine (IOM). An example of such documents was published by the IOM in 2000 about the need to pay more attention to safety and reduce errors in the United States health-care system. Recommendations for changes were formulated and have had an important influence on policy and led to measures being taken to reduce errors (Kohn et al., 2000). In 2009, the Institute of Medicine published an influential report about the consequences of uninsurance (Institute of Medicine, 2009).
2.5.4 Planning for emergencies and natural disasters
In cases where the public health consequences are serious, planning by governmental bodies is well supported by the public. Examples include times of war, epidemics, national security situations, terrorism and natural catastrophes. Natural disasters and emergency preparedness planning receive quite a bit of attention. The CDC’s grant programme titled “Preparedness and Emergency Response Learning Centers” is an example. Here, university-based schools of public health are funded to develop and train the public health workforce at the state and local level as part of a national plan to ensure that the United States national security needs are met in times of emergency (Centers for Disease Control and Prevention, 2010a). The AHRQ, funded by the HHS’s Office of the Assistant Secretary for Preparedness and Response, prepared and distributed guides to hospitals so that they may plan, conduct and evaluate exercises to prepare for emergencies. Federal, state and local government, multi-sector disaster-planning, risk management and preparedness need improvement and efforts are being made. Too often this takes place only after a tragic system failure, such as that of Hurricane Katrina in New Orleans in 2005, where nearly 2000 people died. Coordinating between federal, state and local governmental entities adds to the challenge of planning.
2.5.5 State and local planning
Considerable planning activity takes place at the state or community / local level. These programmes are heavily subsidized by federal government. Some state governments have focused more on planning than others. For example, Vermont’s “Healthy Babies” programme provides a wide array of services and benefits to new mothers, including home visits, nutrition advice, health insurance for their children and other services that have been found to be cost–effective in the long term (Vermont Department of Health-Barre, 2007). Additional state efforts at planning innovations are outlined above in Box 2.3.
Health systems in transition United States of America58
2.5.6 The role of the United States in international health planning
The United States has a substantial role in managing and coordinating health-related international development assistance through governmental and nongovernmental organizations. On the government side, the United States participates in international health planning through the United States Agency for International Development (USAID). USAID was established in 1961 with the passage of the Foreign Assistance Act. It focuses on investments to provide assistance for basic human needs, including food, nutrition and health. Its staff operate in more than 100 countries. Programme areas for food and nutrition target food security, agricultural research and development, food assistance, and expanding agricultural markets and trade. USAID also invests in advancing water supply and hygiene. Global health programme areas include family planning, HIV / AIDS, health systems, malaria, maternal and child health, neglected tropical diseases, nutrition, pandemic influenza and tuberculosis. USAID goals for global health are to reduce maternal mortality by 30%, reduce under-5 child mortality by 35%, prevent 54 million unintended pregnancies, and reduce the burden of malaria by half in Africa. In 2010, the top 20 countries given aid from USAID received $10.5 billion dollars in assistance, including $4 billion to Afghanistan and Pakistan. At $6 billion, health was the largest sector of USAID investment. Much of its assistance flows through NGOs in addition to foreign governments.
With the goal of eradicating HIV / AIDS, tuberculosis and malaria, the United States under President George W. Bush authorized $48 billion dollars under the United States President’s Emergency Plan for AIDS Relief (PEPFAR) in 2008. PEPFAR’s targets for 2010–2014 include preventing 12 million new HIV infections, training 140 000 new health-care workers to strengthen foreign health systems, and providing direct support for more than 4 million people on HIV / AIDS treatment. In 2009, under President Obama, the Obama Global Health Initiative was created to move United States investments away from targeting diseases and towards developing international health systems. This initiative established a separate office with a budget of $63 billion dollars over 6 years – $51 billion of this total was to further support PEPFAR. In 2012, this office was disestablished and redistributed under USAID, the CDC and the Office of the Global AIDS Coordinator.
Health systems in transition United States of America 59
In addition to government efforts, there are numerous NGOs involved in United States global health policy. These include the Bill and Melinda Gates Foundation and the Clinton Foundation, and several university-based research centres. These NGOs may target their investments towards eradicating specific diseases or more broadly aim to improve health systems through development.
2.6 Intersectorality
Health outcomes are related to other areas of societal activity, not considered to be principally health, such as transportation, safety, housing, environment, agriculture (food), nutrition, income, education and employment. The HHS has an important influence on intersectoral activities, including those between and within the Departments of Agriculture, Education, Housing and Urban Development, Justice, Interior, Veterans Affairs, and the Environmental Protection Agency (EPA). Examples of collaboration include intersectoral policies on food, transportation, safety and injury. Taxes on alcohol products are a form of intersectoral policy. Another example involves restrictions on tobacco use and smoking. Government, private sector policy-makers and voluntary organizations participate in the intersectorality of health. These relationships receive substantial public attention because they garner media coverage.
2.6.1 Intersectorality between federal government organizations
Cross-sector health planning activity in the United States frequently takes place between government departments at the federal level or within federal governmental agencies. For example, the Healthy People programme discussed above has federal interagency work groups within the Departments of Agriculture, Education, Housing and Urban Development, Justice, Interior, Veterans Affairs, and the Environmental Protection Agency (EPA). The National Environmental Policy Act adopted in 1970 requires that federal authorities consider the environmental effects, including the health impact, of projects and programmes before they are implemented. In some cases the CDC is involved in environmental impact assessments. In many cases, health impact assessments and Environmental Impact Assessments (EIAs) (technically called Environmental Impact Statements within the context of law) have considerable weight in deciding whether or not a project may go forward (U.S. Environmental Protection Agency, 2011).

Health systems in transition United States of America60
Several government departments and agencies coordinate across a wide variety of health-relevant sectors in the United States on subjects related to complex scientific topics, such as the environment. The EPA is an example of a government organization that is concerned with intersectoral health-related activities. Its Office of Science Coordination and Policy (OSCP) plays a role in the “coordination, leadership, peer review, and synthesis of science and science policy” for the Office of Chemical Safety and Pollution Prevention. The OSCP coordinates information about potentially dangerous exposures. It undertakes hazard assessments related to endocrine disruptors and biotechnology that are used across many sectors. The OSCP’s empirically based guidance provides the scientific basis for pesticide and chemical management policies that are formulated by the EPA’s Scientific Advisory Panel (SAP). The Federal Insecticide, Fungicide, and Rodenticide Act (FIFRA) SAP is made up of biologists, statisticians, toxicologists and others with highly technical competence from a wide variety of sectors. This panel provides impartial experts to the EPA. Their advice ranges across sectors and includes topics related to health and safety. The NIH is involved in the panel selection.
The OSCP’s function is to ensure that decision-making by the EPA in a variety of highly technical sectors from agriculture to international activities is made on the basis of the best scientific evidence available. It coordinates with the White House and with other executive branches of government and specialized agencies. It serves the same function of harmonizing best practices policy between governmental agencies within the EPA and between regional EPA offices, and with international agencies on these extremely complicated and technical topics. It develops screening procedures and mechanisms for testing pesticides and commercial chemicals as well as environment contaminates that might be harmful to human health.
Research suggests that social determinants of health are related to transportation, the environment, wealth, agriculture, education, employment and housing. Overall, the United States does poorly on social determinants of health indicators and on aligning policy across sectors (Raphael, 2007; Marmot & Bell, 2009). For example, the generosity of family policy – as measured by the total expenditure level – is correlated with child poverty levels, and the United States has the poorest performance among the high-income countries on this measure (Baker, Metzler & Galea, 2005; Commission on Social Determinants of Health, 2008, p.11).
Health systems in transition United States of America 61
There is no government department in the United States that focuses on the intersectoral policy topic of the social determinants of health and how they influence the health of the population. There is some recent evidence that policies related to these variables, conscious or not, directly or indirectly, influence health. These include inequality, socioeconomic status, the distribution of power, social support networks, stress levels, early life experience, social inclusion / exclusion, unemployment, physical activity / inactivity and the redistribution of other resources (Lynch et al., 1998; Wilkinson & Marmot, 2003).
2.6.2 Intersectorality between government and the private sector
Intersectorality in the United States may involve monitoring health-relevant activities across sectors. This depends on cooperation and collaboration between the public and private sectors as well as participation by voluntary organizations. The legitimacy of intersectoral activity by all players is related to public support. Seldom can major activity take place if it is not considered legitimate in the eyes of the public. In addition, intersectoral activity that goes against stakeholder opinion is sometimes more difficult to implement compared to when it is deemed appropriate by stakeholders. Extensive consultation with stakeholders who may be affected by intersectoral regulations is common in the United States.
The need to monitor the quality and safety of medication and foods is an intersectoral area of importance for public health. Media coverage draws attention to the complexity of intersectoral policy in the agriculture / food sector. Some argue that domestic and international inspection programmes need additional resources (Harris, 2011b; Levinson, 2011). The United States recently adopted legislation to remedy some of the problems that the FDA has encountered with food safety, and most importantly this legislation improves the FDA’s ability to work with state and local partners (Stewart & Gostin, 2011).
Another area of importance for food policy involves the marketing of food to children. The IOM summarized research on the effects of advertising food and beverages to children. It reports that food marketed to children increases this group’s long-term health risks. These foods are not consistent with healthy eating patterns and weight maintenance. The IOM has recommended major changes in food advertising targeted at children (Institute of Medicine, 2005). Governmental regulation of the food industry in general is not extensive and sometimes viewed by industry as optional rather than compulsory. The federal government has taken the lead in requiring that chain restaurants with more than 20 outlets list the number of calories on their menus (Bernstein, 2011).

Health systems in transition United States of America62
Transportation and land-use policies are closely linked to population health. Research makes a convincing case for action, though government response is erratic (Torbati, 2010). The CDC prioritizes strategies that are intersectoral and that integrate community planning, transportation and land-use policy. The goals are to increase physical activity while reducing injury, to increase access to healthy foods that are not always available in poor socioeconomic areas, and to improve air and water quality.
Transportation policy also affects air pollution and asthma as well as mortality and morbidity related to vehicle crashes. For example, reduced traffic in a city centre area cuts ozone pollution, and this in turn significantly lowers the asthma attacks children experience (Friedman et al., 2001). Numerous studies confirm this intersectoral link between air pollution and asthma in children (Renzetti et al., 2009). Urban planning may be designed to encourage biking and walking through the construction of infrastructure such as sidewalks and bicycle lanes, both of which enhance the health of the population. This type of intersectoral policy is beneficial because children who walk to school are healthier (Watson & Dannenberg, 2008).
Safety and injury policy is intersectoral, and involves the workplace, the playground, transportation, the community and the home. In the United States intersectoral policy on gun ownership is politically controversial (Wintemute, Braga & Kennedy, 2010). Public support for gun control, while high in opinion polls in the early 1990s (over 70%), shrank to 44% in 2010 (Newport & Saad, 2011). As many as 40% of gun sales in the United States are “private” and subject to little regulation, though this method of supplying firearms is the main source of guns used in crimes (Wintemute, Braga & Kennedy, 2010). One challenge with intersectoral planning in this sector is that policies enacted by some municipalities and states have been consistently overruled by the United States Supreme Court for violating constitutional protections for private gun ownership (Luo, 2011).
2.6.3 Intersectorality and voluntary organizations
Voluntary organizations play an important role in seeking to inform and educate the public in the United States about intersectoral linkages. For example, the American Public Health Association (APHA) has an online tool kit to assist activist citizens interested in the topic of transportation and health. It posts relevant research and provides information on local and community practices. It organizes webinars on topics amenable to intersectoral collaboration such as climate change, injury, violence prevention, drug abuse and motor vehicle safety.
Health systems in transition United States of America 63
While policy-makers understand the links between sectors that influence health, coordination amongst these sectors in specific situations is not always well developed or carefully coordinated. Intersectoral activity within the private sector, or between the private sector and government, is complicated by proprietary concerns. Regulations must be formulated with considerable care and in consultation with the private sector that is to be regulated.
Intersectoral policy arenas can impinge on the division of authority between the states and the federal government. An example is policy regarding highway speed limits that are set by states. As a result of the oil price crisis in 1973 the speed limit in the United States was set at 55 miles per hour by the federal government. This speed was considered optimal for minimizing gasoline consumption. It had the beneficial side-effect of reducing motor vehicle fatalities. Since 1987, however, states with long stretches of open highways have been authorizing higher speed limits.
2.7 Health information management
This section discusses health information management in the United States, including health technology assessment, health information systems and the use of these technologies to improve quality of care.
2.7.1 Health technology assessment
Health technology assessment (HTA) is the evaluation of the effectiveness, safety, costs and patient-reported outcomes of health-care technology with the aim of informing health policy-making (Sullivan et al., 2009). HTA is conducted in the United States by public and private payers, universities, hospitals, research institutes or manufacturers. HTA has a long history in the United States. However, several earlier organizations, such as the Office of Technology Assessment, no longer exist due to lack of funding as well as political pressures (Sullivan et al., 2009).
Currently, on the federal side, Medicare conducts HTA through the Medicare Evidence Development and Coverage Advisory Committee (MedCac), an appointed body of national experts on medical technology that holds public meetings to examine the evidence regarding health technologies. Cost-effectiveness cannot be part of the consideration. CMS places the evidence presented at the committee meetings and final coverage policies on the CMS web site. Assessment of pharmaceuticals covered by Medicare is separate from

Health systems in transition United States of America64
this process. Medicare coverage of pharmaceuticals – the Part D programme – is a privately administered benefit, so all pharmaceutical coverage decisions are made by Part D private contractors, with the exception of coverage restrictions placed by Medicare.
The AHRQ is the largest federal funder of HTA research (Sullivan et al., 2009). It funds three external research programmes that conduct systematic evidence reviews to assess the effectiveness, comparative effectiveness and safety of medical technologies and interventions. At times, cost-effectiveness analyses are conducted. The HTA reports are published on the agency’s web site and in print.
Both the federally run VHA and the Military Health System (MHS) conduct HTAs on pharmaceuticals to help with decision-making regarding medications to use within these systems. The VHA does this through the Pharmacy Benefits Management Strategic Healthcare Group (PBMSHG), whereas the MHS does this through the Department of Defense Pharmacoeconomic Center (PEC).
The FDA does not conduct formal technology assessments of pharmaceuticals but instead evaluates the safety and efficacy of drugs by providing research guidelines and reviewing the studies conducted by external researchers. The FDA focuses on controlled trials of the effectiveness and safety of each drug rather than studies of the comparative cost-effectiveness of drugs (see section 2.8.3).
With the passage of the ACA in 2010, the federal government will step up research on comparative effectiveness. The ACA created the Patient-Centered Outcomes Research Institute (PCORI), a public–private organization that will fund comparative effectiveness research (Iglehart, 2010). Funds for the research will come from Medicare and private insurers. The PCORI will establish a research agenda based on private stakeholder recommendations rather than government or scientist-initiated recommendations. The ACA charges the private stakeholders to focus on technologies for the most common conditions, especially chronic ones, and those affecting minorities. The research cannot include cost–effectiveness.
At the state government level, many Medicaid programmes support HTA for pharmaceuticals and medical technologies (Sullivan et al., 2009). Although these HTA programmes are usually administered by state Medicaid staff with support from clinical experts, state administrators often purchase HTAs from private organizations. Budgets for HTAs usually come from the state alone (no federal support). Medicaid agencies in 14 states have relied on pharmaceutical

Health systems in transition United States of America 65
evaluations conducted by the Drug Effectiveness Review Project (DERP), created in 2001 by the Oregon Health and Sciences University. The publicly available reports from DERP have a description of the HTA issues, a description and synthesis of the relevant literature, and a judgment on the quality of the evidence. Cost-effectiveness is not considered and the reports do not provide recommendations about coverage.
Many of the larger private insurers and pharmacy benefit management companies have HTA programmes with their own researchers, financial analysts and data systems (Sullivan et al., 2009). Smaller health plans have more limited abilities to conduct the research internally, and often depend on HTAs from external private or public agencies. Most private organizations consider their HTA programmes to be proprietary.
2.7.2 Health information systems
This subsection discusses the use of health information for the purposes of personal, organizational and system-wide health management. Health information systems can be used for clinical, administrative, financial, quality and safety purposes. For example, health information technology (HIT) can be used to manage patient clinical records, administrative data (such as use of resources), utilization, quality (such as health status, health outcomes, and patient satisfaction) and safety (such as adverse events and medical errors). HIT systems collect, store, transmit and analyse data in these areas. Common users are consumers, providers, payers and the government (Blumenthal & Glaser, 2007). Some systems provide only one function, such as electronic charting, while others share interoperability across functions, for example, systems that connect across different clinical areas and that link to financial applications. Some systems share information only within the institution, whereas others are interoperable systems that connect to other institutions or users (have
“interconnectivity”). The systems currently in use can be classified into those that are: (1) maintained by separate organizations, with operability that is limited to those separate organizations; (2) maintained by or on behalf of individual patients, with varying levels of operability between providers; (3) maintained at a regional system or greater level, and that involve health information exchange (Blumenthal & Glaser, 2007). Each of these three types of HIT is discussed. A review of the role of HIT in quality improvement and recent governmental efforts to step up the pace of HIT adoption in health care follows.
Health systems in transition United States of America66
HIT with organizational operability: electronic medical (or electronic health) recordsElectronic medical records (EMRs), or electronic health records (EHRs), are HIT systems that operate primarily at an organizational level and are used by health-care providers for maintaining and updating patient health information, entering physician orders, and reporting results, observations and care (Kazley & Ozcan, 2008). EMR is used interchangeably with EHR but according to the Health Information and Management Systems Society (HIMSS), EMRs are the legal medical record of a health-care facility and are not interactive with other organizations, whereas EHRs have inter-organizational operability (Garets & Davis, 2006). Even though the extent of operability for EHRs in the United States is still at the organizational level, the literature tends to refer to both EMRs and EHRs as EHRs so this chapter also uses the term EHR to refer to either type of system.
The IOM defines the four core components of an EHR as: (1) clinical documentation; (2) results reporting; (3) physician order entry; and (4) clinical decision support (Jha et al., 2009). Each of these components has multiple features that may or may not be present in a given system. Basic EHRs are defined as having most of the first three components indicated above in at least one organizational unit (Jha et al., 2009; Hing & Hsiao, 2010). Comprehensive or fully functional EHRs have all the features of all components in all units.
The adoption of these systems has been slow in the United States. In 2007, 34.8% of office-based physicians used at least one EHR component in their office but only 12% of physician EHRs met the criteria for having a basic system and only 4% met the criteria for having fully functional systems (Hing & Hsiao, 2010). Multi-specialty and larger physician offices (11 or more physicians) were more likely to adopt EHRs, whereas physicians in solo or single-specialty offices were the least likely. Offices run by older physicians were also less likely to adopt EHRs. A 2007 estimate put the percentage of physicians using some type of EHR in 2010 at close to 54% (Hing & Hsiao, 2010).
In 2008 only a small percentage of hospitals (1.5%) had a comprehensive EHR system in all clinical units (Jha et al., 2009). A slightly larger percentage (7.6 –10.9%) of hospitals had a basic EHR system in at least one clinical unit. An examination of the types of function adopted by hospitals reveals that in 2008 over 75% of United States hospitals had electronic laboratory and radiological reporting systems, 44% had electronic physician notes in at least one unit, and 38% had computerized provider-order entry (CPOE) in at least one unit. However, only 12% of hospitals had electronic physician notes across all units

Health systems in transition United States of America 67
in the hospital, while only 17% had a CPOE system for medications across all units. Thirty-six per cent of hospitals had electronic nursing documentation in all units.
Several hospital characteristics predict the adoption of an EHR system. Larger urban hospitals with intensive care units (ICUs) are more likely to adopt one or more EHR components in one or more hospital units (Jha et al., 2009). Teaching hospitals are also more likely to have an EHR system. In a 2008 survey, hospitals cited the following barriers to adoption: inadequate capital for purchase, maintenance costs, physician resistance, unclear return on investment, and lack of staff with expertise to operate the systems (Jha et al., 2009). Facilitators to adoption included financial incentives such as additional reimbursement for EHR adoption and use and the availability of technical support.
Other types of health-care provider are also adopting EHRs. Information regarding the adoption of EHRs in nursing homes is inconsistent but estimates put implementation at 18–47%, with 16–48% having CPOE (Kramer et al., 2010). In 2007, about 41% of home health and hospice organizations had EHRs and an additional 15% planned to have EHRs within the next year (Bercovitz, Sengupta & Jamison, 2010). Of the home health and hospice organizations with EHRs, 98% used components for recording patient demographics, 83% used clinical notes, and over half used clinical decision-support systems or computerized physician-order entry. EHRs are used extensively in free-standing dialysis facilities, particularly in large for-profit dialysis chains. All the five largest dialysis chains use EHRs (Kochevar et al., 2011). Even many small dialysis facilities use EHRs (around 61% in 2010).
Most EHRs at the time of writing are actually EMRs, that is, they are not interoperable between different providers. Health-care policy aims at eventually developing this interoperability but progress is slow due to the difficulty in linking numerous proprietary systems, and issues regarding privacy and security. This next stage in HIT is discussed in the subsection on regional HITs below.
A few large health-care systems have achieved EHRs that are interoperable between providers within the same health-care system. The VHA – the largest integrated health-care system in the United States – is an example. The VHA has developed an HIT system called the Veterans Health Information Systems and Technology Architecture (VistA) that is capable of interconnectivity between all providers within the VHA system (Byrne et al., 2010). Since 2004
Health systems in transition United States of America68
the VHA has achieved close to 100% adoption of several VistA components, including inpatient and outpatient EHRs, bar code medication administration and CPOE.
Another example is Kaiser Permanente, the largest non-profit integrated health-care system in the United States, with 8.7 million members in eight regions (Chen et al., 2009). Kaiser Permanente provides group health insurance, outpatient care such as primary and specialty care, testing, imaging and pharmaceuticals, and inpatient hospital care. Kaiser implemented a system-wide EHR – HealthConnect – in 2004. The EHR provides clinical documentation and decision support across care settings, and real-time connectivity to testing, imaging, pharmacy and other ancillary systems (Chen et al., 2009).
HIT managed by and for patients: personal health recordsHealth information that is managed and used by the individual patient is commonly known as a personal health record (PHR). PHRs electronically store patient health information from multiple sources in a central place. Essential components of PHRs are patient control over the information, the ability to warehouse patient health history, and portability of the information across providers (Grossman, Zayas-Cabán & Kemper, 2009). PHRs can be used by both individual patients and their providers.
Several large integrated health-care systems offer PHRs. The VHA has developed MyHealthVet (Kahn, Aulakh & Bosworth, 2009). The PHR supports appointment scheduling, medication requests and other services. Kaiser Permanente, the Cambridge Health Alliance and other providers offer PHRs through the Epic system.
Even non-health-care companies are entering the PHR business. From 2008 to 2011 Google offered PHR services through an internet site called Google Health (Kahn, Aulakh & Bosworth, 2009). In 2007 Microsoft established HealthVault, a web-based PHR (Kahn, Aulakh & Bosworth, 2009). With these online and personal computer-based tools, patients can develop their PHRs through the internet and their home computers without having to access other technologies.
The interconnectivity and portability of PHRs are positive features but these very features make it difficult to progress in PHR development. Getting data from a patient’s various providers (each of which may use a different HIT) into a standardized and centralized data warehouse is a level of technology that is underdeveloped at this time (Kahn, Aulakh & Bosworth, 2009). At the same time, privacy issues involved in data access and transfers are major concerns.
Health systems in transition United States of America 69
Health information exchanges: regional HITsHealth Information Exchanges (HIEs), or Regional Health Information Organizations (RHIOs), are local groups (such as physician offices, hospitals, insurance companies, employers, pharmacies, consumer groups and government agencies) that are connected through HIT systems maintained by the organizations themselves (Blumenthal & Glaser, 2007). In 2009, the United States had 75 functioning RHIOs covering approximately 14% of hospitals and 3% of ambulatory practices (Adler-Milstein, Bates & Jha, 2011a). None of these was fully functioning in the sense of including all providers in the full sharing of patient records and other health information. Instead, most connected hospitals with ambulatory care practices focused on sharing test results. In 2009, 17% of the 75 functioning RHIOs covered 3% of hospitals and 9% of ambulatory practices in the area.
Underfunding, privacy and proprietary issues are major barriers to the development of RHIOs. Many RHIOs fail due to lack of funding. In 2009 over 67% of RHIOs did not meet criteria for financial viability (Adler-Milstein, Bates & Jha, 2011a). Privacy issues are the same ones that plague EHRs: how to share patient information securely. Proprietary issues involve the disadvantages of sharing information with competitors. Providers state that if they share information about patients with competitors they could lose their competitive edge with those patients (Adler-Milstein, DesRoches & Jha, 2011b).
Quality reportingA number of quality reporting systems are in place in the United States. These include quality reports required by the federal government and voluntary reports for private organizations such as the Joint Commission. Quality reporting is conducted in different health-care settings, although the focus is on hospitals. The quality reporting systems for several different types of health-care service are reviewed in Chapter 5 and not repeated here. What is discussed here, in general, is the use of HIT in the collection, storage and transmittal of quality data.
Health-care providers in the United States have used some form of HIT to collect, store and transmit quality and safety data for a number of years. If the provider does not have an EHR, quality data is collected by risk management or quality improvement departments. Some quality data can be extracted from the patients’ administrative records submitted to CMS for payment of care, whereas other data are obtained through chart reviews, incident reports or other patient records. The data must then be hand-entered into electronic databases. Once collected and stored electronically, it may be analysed for internal

Health systems in transition United States of America70
quality improvement and transmitted electronically to external agencies. If the provider has an EHR with a quality reporting application, the mining of data for quality reporting can be performed automatically from EHR records, making this a much more efficient method of data mining and processing. EHR-based reporting may provide customized reports of quality and safety for internal use (quality improvement and evidence-based practice) as well as external use (reports required by external agencies). As quality reporting becomes a requirement for payment by CMS and other payers, this type of EHR application becomes more and more necessary.
Government efforts to expand HITThe United States government has put significant funding into the expansion of HIT. The most recent effort was the passage in 2009 of the Health Information Technology for Economic and Clinical Health (HITECH) Act as part of the American Recovery and Reinvestment Act (ARRA). Under this law, starting in 2011 physicians and hospitals can receive federal grants of up to $44 000 over five years per organization to adopt EHRs (Adler-Milstein, Bates & Jha, 2011a). The HITECH Act also allocated funds to build HIEs (RHIOs) at state and regional levels.
HITECH financial incentives for adopting EHRs are linked to the “meaningful use” of the EHR systems. If meaningful use is not obtained by 2015, penalties will be assessed (Kochevar et al., 2011). Stage one of meaningful use focuses on meeting basic system and reporting requirements. Some of the core requirements for stage one are that the providers use CPOE with drug alerts, maintain up-to-date patient records, maintain privacy and security, report standardized quality measures to CMS, and provide patients with electronic copies of medical records upon request (Ralston et al., 2010). Later stages of meaningful use, to be defined in 2013 and 2015, will be more demanding and will focus on the uses of EHRs that would improve processes of care and outcomes. This includes the ability of patients to communicate directly with health-care providers and to have electronic access to test results.
2.8 Regulation
Regulation in the United States health-care system may be imposed by private or public entities at the federal, state and local county and city levels as a response to “the constant need to balance the objectives of enhancing quality, expanding
Health systems in transition United States of America 71
access, and controlling costs in healthcare” (Field, 2007). All actors in the health-care system are subject to regulation, often from multiple government and nongovernment agencies.
As introduced in section 2.1, major federal regulatory organizations include the CMS, the CDC and the FDA, all under the umbrella of the HHS. State regulatory bodies include public health departments, provider licensing boards and insurance commissioners. Local counties and cities also regulate health care through their public health and health services departments. Independent nongovernment and provider organizations such as the AMA and the Joint Commission also have a regulatory role in the United States health-care system. This section discusses the role of regulation and governance by public and private regulators on third party payers, providers, pharmaceuticals, medical devices and aids, capital investment, patient privacy and human subjects, and public health.
2.8.1 Regulation of third party payers
Regulation and governance of private insurers, or third party payers, in the United States is shared by federal and state agencies. The current regulatory environment facing third party payers has arisen primarily out of two pieces of legislation: the McCarran-Ferguson Act and the ERISA.
In reaction to a Supreme Court ruling that the business of insurance was interstate commerce and therefore subject to Congressional regulation and federal antitrust laws, the McCarran-Ferguson Act was passed by Congress in 1945 to counteract the Supreme Court decision and reaffirm the power of states to regulate and tax insurance products of third party payers (Government Accountability Office, 2005). The Act exempted certain insurance practices from existing federal antitrust laws (i.e. Sherman, Clayton, Federal Trade Commission Acts) to which other interstate businesses were subject (Government Accountability Office, 2005). This exemption applied to activities that: constitute the “business of insurance”; are “regulated by State law”; and do not constitute an agreement or act “to boycott, coerce, or intimidate”. In essence, this Act reserved authority to regulate third party payers for state authorities. Many, if not all, states have provisions in their codes to prohibit insurers from engaging in unfair or deceptive acts or practices in their states (Government Accountability Office, 2005). However, beginning in 2011 as part of the ACA, CMS – a federal agency – will take over the review of health insurance rates

Health systems in transition United States of America72
increasing in excess of 10% annually from some states due to a lack of or inadequate state regulation of health insurance products sold to individuals and small businesses (The New York Times, 2011).
The other key piece of legislation regarding the regulation of third party payers is the ERISA, enacted by Congress in 1974 (CRS Report for Congress, 2009). ERISA regulations fall under the Department of Labor, in contrast to McCarran-Ferguson’s focus on state-level regulation. They set minimum standards to protect individuals participating in most voluntarily established pension and health insurance private sector employee benefit plans (i.e. self-insured employers). ERISA does not require that private employers offer health insurance but governs the administration of these plans if employers self-insure and defines how disputes are handled. Group health plans established by government or church organizations and plans that only apply to workers’ compensation or disability, or unemployment are not governed by ERISA (U.S. Department of Labor, 2011). Regulations of employer-sponsored health insurance plans imposed by ERISA include the requirement that plans provide enrollees with information about plan features and funding, fiduciary responsibilities for managers of plan assets, and procedures for establishing grievances, appealing denied claims for benefits, and rights to sue for benefits and breach of fiduciary duties (U.S. Department of Labor, 2011).
Preemption of state regulatory laws is an important cornerstone of ERISA. United States courts have upheld that ERISA preempts certain state health policies, such as employer insurance mandates, financial reserve requirements, premium taxes and managed care standards, placing constraints on states’ abilities to regulate insurance benefits and enact health-care reforms (Butler, 2000; Gabel, Jensen & Hawkins, 2003). The preemption was included by Congress to “avoid multiplicity of regulation in order to permit nationally uniform administration of employee benefits” for employers with workers in multiple states (CRS Report for Congress, 2009). However, ERISA does not regulate benefits to the extent that the states do. Employer insurance plans that fall under ERISA have different (and often less comprehensive and less expensive) benefit structures than employer-sponsored plans that fall under state insurance regulations.
About 55% of employees in the United States work for employers who are self-insured and are therefore affected by ERISA’s preemption of state regulation (Gabel, Jensen & Hawkins, 2003; Pierron & Fronstin, 2008). Although ERISA broadly preempts state laws governing the administration of health plans and definition of how grievances are resolved, as noted earlier, states regulate many
Health systems in transition United States of America 73
other components of the third party payer market. Since its enactment in 1974, there have been several substantial amendments to ERISA. The Consolidated Omnibus Budget Reconciliation Act (COBRA) of 1985 provided some workers and their families the right to continue their health-care coverage for a limited time after job loss and other specific events (Department of Labor, 2011). This is significant because, as mentioned earlier, nearly half of Americans receive their health insurance coverage through their employer. The Health Insurance Portability and Accountability Act (HIPAA) of 1996 amended ERISA to include limitations on exclusions from health insurance coverage based on pre-existing medical conditions events (Department of Labor, 2011). The Mental Health Parity Act of 1996 was added to ERISA so that health insurance plans offering mental health coverage had annual and lifetime benefits on a par with those for medical and surgical benefits (Department of Labor, 2011). The final two amendments to ERISA – the Newborns’ and Mothers’ Health Protection Act passed in 1996 and the Women’s Health and Cancer Rights Act passed in 1998 – respectively established minimum maternity lengths of stay and covered reconstructive surgery after mastectomies (Department of Labor, 2011).
The 2010 ACA included several new regulations governing the third party payer market. These are discussed in Box 2.2 and Chapter 6. Most importantly, health plans are required to offer and renew coverage to everyone and cannot charge more to those who have pre-existing health conditions.
2.8.2 Regulation of providers
Physicians and hospitals are regulated by public agencies at the federal and state level and by national nongovernmental and provider regulatory organizations. Physicians, as well as nurses and many allied health professionals, are accredited by licensing boards in the state in which they practise. Across the various health professions more than 650 state licensing boards exist (Cohen, 1980). State licensing boards issue new licences to health-care professionals with the requisite educational credentials, renew licences and enforce basic standards of practice through their power to suspend or revoke licences to practise (Field, 2007).
In addition to state-level regulation, physicians are also regulated at the federal level by the CMS imposing criteria for reimbursing providers for services rendered. For example, Medicare requires physicians to meet certain requirements, many of which overlap with state-licensing requirements (Centers for Medicare & Medicaid Services, 2011a). Since Medicare patients make up a significant portion of many physicians’ payer mix, the requirement for

Health systems in transition United States of America74
reimbursement serves as a form of provider regulation. Furthermore, CMS does not reimburse physicians for self-referred services. Also known as the Stark Law, this regulation prohibits payment to physicians for referrals to services in which they or their family members have a financial interest (Centers for Medicare & Medicaid Services, 2011b).
Physicians are also regulated by managed care organizations (e.g. HMOs, PPOs) and by the hospitals at which they practise or have admitting privileges. Through various mechanisms for controlling costs (e.g. capitation, gatekeeping and pre-authorization) and improving quality (e.g. disease management), managed care organizations regulate physician behaviour. Managed care organizations also give credentials to physicians in their network, again ensuring providers are able to demonstrate basic requirements to practise similar to those required by state licensing boards and CMS. Physicians may be disciplined by managed care organizations through exclusion from the network. Hospitals at which physicians practise also regulate physicians through providing credentials and periodically renewing them. Hospitals oversee physician practice through review boards and can discipline physicians for substandard care by requiring additional medical education or supervision by colleagues, or suspension or revocation of clinical privileges (Field, 2007).
Hospital regulation in the United States occurs primarily via certification requirements by the nongovernmental Joint Commission, by federal law on who must be treated at hospitals, and by eligibility for reimbursement criteria imposed by CMS. Some of the most important hospital oversight results from the self-policing role of accreditation by the Joint Commission. This organization is a nongovernmental regulatory body that includes more than 4000 hospitals (82%) in the United States (Joint Commission, 2011). Auditors from the Joint Commission survey hospitals, unannounced, and evaluate compliance with Joint Commission standards by tracing care delivered to patients, acquiring documentation from the hospital, tracking hospital quality measures and on-site observation. Annual fees for hospitals range from $2000 to $37 000. Re-accreditation surveys occur every three years (Joint Commission, 2011).
The Emergency Treatment and Active Labor Act (EMTALA), passed in 1986, requires that all hospitals participating in Medicare provide “a medical screening examination (MSE) when a request is made for examination or treatment for an emergency medical condition (EMC), including active labour, regardless of an individual’s ability to pay” (Centers for Medicare & Medicaid Services, 2011c). After screening, hospitals are required to stabilize patients with EMCs or, if they are unable to stabilize a patient (e.g. due to capacity

Health systems in transition United States of America 75
constraints), transfer the patient for stabilization. As a result of EMTALA, the emergency department has become an access point commonly used by patients with otherwise limited access to primary care (e.g. uninsured).
As a result of the Hill-Burton Act, discussed in section 2.8.5, many United States hospitals are required to take Medicare and Medicaid patients and are therefore subject to CMS eligibility criteria for reimbursement through Conditions of Participations (CoPs) and Conditions for Coverage (CfCs). CMS is able to regulate hospital care by ensuring facilities receiving CMS reimbursement meet minimum quality and safety standards (Centers for Medicare & Medicaid Services, 2011d). In fact, these CoPs and CfCs also apply to many other health services delivery organizations (e.g. nursing homes, psychiatric hospitals). The conditions laid out by CMS cover most of the essential components of hospital or other health services facilities, including requirements for staffing, patient rights and medical records.
2.8.3 Regulation of pharmaceuticals
Pharmaceuticals in the United States are primarily regulated at the federal level by the FDA. The present day FDA evolved from legislation adopted in response to public health epidemics resulting from unsafe foods and drugs.
The FDA approval process for new drugs or biological products consists of animal testing and then four phases of testing in humans, three of which are completed before the drug can go on the market and the last continues on after the drug has been released. The clinical trials stage often takes several years with costs largely borne by the sponsor (e.g. the drug manufacturer). DiMasi, Hansen & Grabowski (2003) estimated this process took, on average, 90.3 months and cost 802 million United States dollars per drug (including the cost of drugs failing to complete the clinical trials). Considering growth since then, the current figure would exceed far more than $1 billion. However, Light and Warburton have contended that the actual costs are far lower, due to methodological issues regarding the sample of drug companies and drugs chosen, the over-counting of various types of costs, and how taxes and profits were treated in the analysis (Light & Warburton, 2011). However, for biological products, the ACA includes new statutory provision to expedite the FDA approval process for drugs that are “biosimilar” with an FDA-approved biological product (Food and Drug Administration, 2012).
Similar to the European Medicines Agency, the FDA does not require economic analyses of drugs during the approval process. Therefore, drugs need only be effective, not cost-effective or comparably effective, for FDA

Health systems in transition United States of America76
approval. The ACA created a non-profit Patient-centered Outcomes Research Institute (PCORI) to study the comparative effectiveness of medical treatments, including drugs. However, the ACA stipulates that the comparative effectiveness findings from this institute “may not be construed as mandates, guidelines, or recommendations for the payment, coverage, or treatment or used to deny coverage” (Kaiser Family Foundation, 2011a).
The FDA also regulates pharmaceutical advertising through its labelling requirements and its ability to penalize drug companies conducting advertising it deems excessive or misleading. From the 1990s, drug companies started advertising directly to consumers. Among the high-income countries, the United States and New Zealand permit direct-to-consumer advertising of prescription-only drugs (Magrini, 2007). While no laws exist in the United States preventing drug companies from advertising prescription drugs to consumers directly, the FDA can prosecute manufacturers for advertising that is false or misleading. Since 2004, major United States pharmaceutical companies have paid more than $7 billion in fines related to off-label marketing of their products (Evans, 2009).
The United States does not have national pr ice regulations on pharmaceuticals, although Medicaid and the VA are exceptions (Adams, Soumerai & Ross-Degnan, 2001). Under the auspices of patent protection and the FDA regulatory framework, drug manufacturers in the United States long held de facto monopolies in the pharmaceutical market often resulting in much higher prices compared to some other countries. Prior to 1984, generic versions of branded drugs were held to the same standard of the four-phase clinical trial process. This stymied the entry of generics into the market. In 1984, Congress adopted legislation that would allow generics to use some of a branded drug’s FDA safety and efficacy data in exchange for extending patents on branded drugs from 20 to 25 years (Field, 2007). Under the ACA, the FDA can approve generic biological products after 12 years’ patent protection to further promote the use of generics (Kaiser Family Foundation, 2011a).
During the 1980s, in an effort to rein in spending on pharmaceuticals, states began repealing anti-substitution laws and enacting substitution laws to facilitate the prescribing and filling of cheaper therapeutic alternatives to branded drugs (Field, 2007). The Medicaid Drug Rebate Program, created in 1990 as part of the Omnibus Budget Reconciliation Act, required pharmaceutical companies to give states and the Federal government rebates for drugs sold to Medicaid and VHA patients (Centers for Medicare & Medicaid Services, 2011e). More than

Health systems in transition United States of America 77
500 drug companies participate in the rebate programme, a requirement for Medicaid drug coverage, with rebates ranging from 10% to 15% of the average market price for the drug (Centers for Medicare & Medicaid Services, 2011e).
The United States does not allow the re-importing of drugs previously manufactured in the United States but sold at lower prices in foreign markets or the importing of drugs by individuals directly from foreign producers. The 1987 Prescription Drug Marketing Act made it illegal for drugs to be imported into the United States except by the original United States manufacturer. The ACA continued the ban on importation of prescription drugs (see Chapter 6). In response to increasing prices and shifting control of Congress and the White House, the importance of drug importation as a policy goal vacillated in the following decades. The Medicine Equity and Drug Safety Act of 2000 and the Medicare Modernization Act of 2003 both aimed to increase the availability of re-imported drugs (U.S. Department of Health and Human Services, 2011b). However, Congress required the Health and Human Secretary to assure that re-imported drugs were safe and effective. With the Health and Human Secretary unable to verify the safety of re-imported drugs, a stalemate is created wherein the legislation has been passed but cannot be implemented (Center for American Progress, 2004; U.S. Department of Health and Human Services, 2011b). Consequently, re-importation of drugs from Canada and Western Europe remains limited in scope. Recent scandals involving the importation of fake cancer treatment drugs has served to reinforce the continued ban on re-importation and mail-order purchase from foreign pharmacies (Weaver, Whalen & Faucon, 2012).
2.8.4 Regulation of medical devices and aids
In addition to regulating pharmaceuticals, the FDA is also the principal regulator of medical devices and radiation-emitting products used in the United States. FDA’s Center for Devices and Radiological Health (CDRH) regulates firms that manufacture, repackage, re-label and / or import medical devices and radiation-emitting electronic products (medical and non-medical) such as lasers, X-ray systems, ultrasound equipment, microwave ovens and colour televisions (Food and Drug Administration, 2011a). CDRH divides medical devices into Classes I, II and III with the level of regulatory control increasing with the class. Generally, Class I devices are exempt from FDA notification before marketing, most Class II devices require premarket notification and most Class III devices require premarket approval from the FDA. The FDA also monitors reports

Health systems in transition United States of America78
of adverse events and other problems with medical devices and alerts health professionals and the public when needed to ensure proper use of devices and the health and safety of patients (Food and Drug Administration, 2011b).
2.8.5 Regulation of capital investment
Federal-level regulation on capital investment arose with the Hospital Survey and Construction Act of 1946 – also referred to as the Hill–Burton Act – and also the National Health Planning Law of 1974. The Hill–Burton Act provided construction funds to increase the capacity of health services throughout the country. In exchange for the funds, hospitals, nursing homes and other health facilities were required to provide a certain amount of uncompensated care to individuals living in the area (U.S. Department of Health and Human Services, 2010d). Hill–Burton funds were distributed through local and state health planning boards. These boards in turn regulated the construction of the facilities built within their jurisdiction. Hospitals had to present a CON in order to access Hill–Burton construction funds (Starr, 1982). The CON programme is discussed in more detail in section 2.2.
From 1972 to 1995, the Office of Technology Assessment (OTA) aided Congress in the identification and consideration of existing and probable impacts of technologies, including medical technologies (Federation of American Scientists, 2011). During its existence, the OTA conducted a number of cost–effectiveness studies related to capital investment so as to inform regulators about policy decisions regarding these investments. The OTA was similar to government offices in other high-income countries in its cost-effectiveness research. In 1995 Congress de-funded the OTA (Princeton University, 2012).
2.8.6 Regulation of patient privacy and human subjects
Regulations regarding the privacy of health information in the United States were initiated in the HIPAA Privacy and Security Rules passed by Congress in 1996. The privacy component of the law provides federal protections for personal health information and gives patients rights with respect to that information (U.S. Department of Health and Human Services, 2011c). The security portion has administrative, physical and technical safeguards to ensure the confidentiality of patients’ electronic information. HIPAA privacy and security rules are enforced by the Office of Civil Rights under HHS. The Patient Safety and Quality Improvement Act of 2005 (PSQIA) Patient Safety
Health systems in transition United States of America 79
Rule protects “identifiable information being used to analyze patient safety events and improve patient safety” (U.S. Department of Health and Human Services, 2011c).
The Office for Human Research Protections (OHRP) within the HHS regulates the protection of human subjects used in clinical and non-clinical research. Its purview “applies to all research involving human subjects conducted, supported or otherwise subject to regulation by any federal department or agency” and includes “research conducted by federal civilian employees or military personnel” and “research conducted, supported, or otherwise subject to regulation by the federal government outside the United States” (Office for Human Research Protections, 2011). Since the vast majority of the research on health in the United States is funded by various government grant mechanisms or regulated by some federal agency, OHRP regulations regarding human subjects research affect much of the research involving people. In addition to OHRP, many individual research institutions, such as universities, also have departments that verify whether human subjects research is warranted and will be conducted safely, effectively and with dignity.
2.8.7 Regulation of public health
Regulation of public health occurs at multiple levels of government. At the federal level, the CDC (discussed earlier), the EPA, the United States Department of Agriculture (USDA), and the Occupational Safety and Health Administration (OSHA) all regulate various aspects of public health. State and local offices of public health also play important roles in regulating public health.
The United States has 50 state-level public health agencies. In addition, many of the more than 3000 counties and 15 000 municipalities have some type of local health department or have their own public health regulations (Diller, 2007). These governmental agencies regulate a range of public health topics including: air quality, alcohol, animals, cemeteries and burial, communicable diseases, emergency medical services and ambulances, fair and affordable housing, firearms, food, garbage collection and disposal, housing and building codes, mass gatherings, massage establishments, noise, nuisances, pest control, sewer systems, smoking, swimming pools and spas, tobacco sales and water wells (McCarty et al., 2009).
The USDA regulates and inspects food services. It also recommends nutritional guidelines and the fortification of certain food staples (e.g. milk, bread, salt), regulates the import and export of animals and plants, and regulates the marketing of foods (U.S. Department of Food and Agriculture, 2011).

Health systems in transition United States of America80
The EPA regulates public exposure to harmful environmental contaminants. In 1970 Congress passed the National Environmental Protection Act, the Clean Water Act, and the Clean Air Act, giving the newly created EPA the authority to establish and enforce environmental protection standards (U.S. Environmental Protection Agency, 2011). The EPA’s reach expanded in 1980 when Congress, in response to chemical contaminants in groundwater from toxic dumps, passed the Comprehensive Environmental Response, Compensation and Liability Act (CERCLA). CERCLA gave the EPA the charge of cleaning up toxic waste at “Superfund” sites, assessing liability and financial responsibility for the contamination, and suing to recover clean-up costs (U.S. Environmental Protection Agency, 2011).
OSHA also plays a role in public health regulation. Its charge is to mitigate the harm caused from employee exposure to workplace hazards through regulation and training (Office for Human Research Protections, 2011).
2.9 Patient empowerment
Patients in the United States have a great deal of information available to them about health-care choices, and the amount of data is increasing. However, they do not always use it efficiently. Information on the price of medical care, for example, is not widely available in advance of treatment. Few consumers have an unrestricted choice of health insurers. Complaint procedures are codified but public participation is low.
2.9.1 Patient information
There is insufficient information about prices of medical care before treatment in the United States but quality indicators for making health-related decisions are increasingly available to patients. These include data on physician and hospital quality as well as the comparative cost of insurance. The United States government web site offers free quality ratings of providers, including hospitals, nursing homes, home health care, and dialysis facilities. This web site is designed to educate the public and to provide tools for individuals to use in determining provider competence. It also seeks to educate the public as to alternative treatment choices, for example, consumer information about vaccines.

Health systems in transition United States of America 81
The NCQA, a private sector, not-for-profit organization, rates the quality of hospitals and doctors. It provides some information to consumers for free, but it charges for more detailed data. Providers must pay to be rated and they retain the right to withhold the results of the NCQA assessment from publication if they so choose. NCQA report cards – the Healthcare Effectiveness Data and Information Set (HEDIS) – is used by over 90% of America’s health plans.
Other sources of patient information include independent publications such as Consumer Reports that do not receive funds from government or those entities it rates. In most cases, educational information is free, but detailed data on quality and cost information are available only to subscribers to this publication. Consumer Reports and several United States government health sector agencies partner with the NCQA to make information available to the public.
The most common source of health information and education for consumers in the United States is the internet. Before contacting their physician, many patients consult the internet about medical issues, the effectiveness of health-care procedures and medications (Hesse et al., 2005). Quality of internet health information varies. Some web sites are highly respected, such as the Mayo Clinic’s patient information. Blogs, personal stories and unverified information are also distributed.
2.9.2 Patient choice
Only a minority of Americans has a choice of health insurer. Consumers in some large urban areas find that due to mergers and acquisitions in the health insurance sector, they have fewer choices for health insurance plans than those living in geographical areas where such consolidation has not taken place. About 96% of the Metropolitan Statistical Areas in the United States exhibits market consolidation (Ross & Detsky, 2009). Rural areas are less profitable and fewer insurance plans or providers are available.
Employer-based insurance is very important in the United States. In 2012 most working-age adults – 56.2% of non-elderly Americans – obtained health insurance from their employer and 60% of employers offered insurance to their employees. Employers choose the plans and, while some offer more than one choice, the relative cost of premiums may influence the plan workers choose. In 2012, 82% offered only one type of insurance plan. Large employers with more than 200 workers were more likely than small employers to provide health insurance and to offer a choice of plans (Kaiser Family Foundation and Health Research and Educational Trust, 2012). Twenty-five per cent of large employers
Health systems in transition United States of America82
offer health benefits to workers after they retire but this rate is falling over time. Not all employers offer workers the option to add a spouse and dependants to that plan for an additional charge (Ross & Detsky, 2009). A patient’s choice of hospital or physician may be limited by the insurance plan to a narrow panel of providers with whom the insurer has negotiated discounts. In some cases an employee may choose to go outside the panel of providers offered by the employer but in these cases they may have to pay a higher co-payment and deductible. This is because the provider is outside the network. Those who receive health benefits from the VA or the active military have limited choices.
Medicaid offers choices to many recipients. Because Medicaid is a jointly administrated state-federal programme, choices may vary from state to state. Increasingly states employ managed care for their Medicaid population and these insurers limit the choice of providers. Some, but not all, states offer those eligible for Medicaid a choice of plans.
Choices are more uniform for the federally managed Medicare programme though they still vary because of differences in regional availability of some private plans. In general Medicare beneficiaries may choose between private sector Medicare (Medicare Advantage) or traditional Medicare (government administered). Almost a dozen supplementary Medicare plans (known as “Medigap” plans) are available with varying benefits, co-payments and deductibles, which make for greater choice. Medigap plan benefits have been standardized since 1992 and are revised from time to time. Not all Medigap policies are available in every geographical area but Medicare offers assistance to those seeking to purchase a policy, as do other independent online sources.
To the extent that Medicaid and Medicare reimbursements are reduced by government payers, providers may no longer accept patients with these forms of insurance. To date the evidence is mixed. Should this become a problem, patient choice would be reduced.
The ACA makes information available to patients about their health insurance choices, the respective cost of insurance plans and the quality of each plan. State governments, on the advice of the National Association of Insurance Commissioners, are expected to structure regulations and limit insurance discretion so as to assure that variation among insurance plans is clearly indicated and understandable (Haberkorn, 2010).
Health systems in transition United States of America 83
2.9.3 Patient rights
The United States does not have a national comprehensive Patient Bill of Rights (WHO, 2007). The right to health care is not in the United States Constitution and it remains controversial, though some states have enacted a Patient Bill of Rights. An attempt by the United States Congress in 2001 to adopt a Patient Bill of Rights that would provide broad protection for the whole country failed to be adopted despite the fact that both the House of Representatives and the Senate actually passed the legislation (Paasche-Orlow et al., 2009). The two houses of Congress could not agree on a final bill in Conference Committee.
The Americans with Disabilities ActSome patient rights in the United States have been initiated by the court system. For example, the Supreme Court ruled that individuals with disabilities have the right to receive services in non-institutional settings whenever possible. Since the 1990 passage of the Americans with Disabilities Act (ADA), those in the United States with physical and / or mental disabilities have been granted additional civil rights. These rights fall under the four titles in the legislation covering accessibility in employment, government services, businesses (including medical offices and facilities), and telecommunication services.
The list of requirements under the ADA is extensive. In general, it stipulates that private and government health facilities must provide the same access to facilities to those with disabilities as are made available to those without disabilities. An independent federal agency called the United States Access Board ensures that the provisions of the ADA are enforced. It focuses on accessibility to federally funded facilities. The board coordinates the activities of many federal government agencies. Half of its members are from such agencies, and the other half are from the public, the majority of whom are disabled. Despite the ADA, there remain barriers to access in the medical care system. While there are no nationally representative data available, there is substantial evidence from smaller research studies as well as documentation from legal cases (Kirschner, Breslin & Iezzoni, 2007).
The Health Insurance Portability and Accountability ActThe HIPAA of 1996 governs the security and confidentiality of patient information, as explained in section 2.8.6. As a result of this legislation, the way patient information is collected, stored and transferred is subject to careful protection. The Office for Civil Rights enforces the HIPAA Privacy Rule. Other important legislation has changed practice far less than HIPPA and in some cases providers are not aware of it. The PSQIA of 2005 requires disclosure of errors to affected patients. This law protects those who report medical errors

Health systems in transition United States of America84
and at the same time encourages providers to voluntarily report errors because these admissions will not be used against them in a court of law (Howard et al., 2010).
The Affordable Care ActThe ACA legislation of 2010 is sometimes described by proponents as though it included a Patient Bill of Rights (Families USA, 2011a). This is because some elements of the ACA protect patients by regulating aspects of the insurance industry. These are discussed in Chapter 6. Under the ACA, patients will have the right to appeal claims that are denied by health insurance companies to a greater extent than in the past. It makes uniform rules and regulations that apply across all states. In addition, the federal government offers grants to the states to strengthen their appeal process. In the absence of action by a state that is not providing an appropriate appeal process for denied claims, federal law will apply (Galewitz & Andrews, 2010).
2.9.4 Complaint procedures
This section is divided into three subsections: complaints related to injuries, disputes about insurer coverage decisions, and the medical malpractice system.
Medical errors have received considerable attention in the United States. The IOM estimated that in 1997 as many as 98 000 Americans died in hospitals due to medical errors, which exceeds the death rates from more publicized causes such as traffic accidents, breast cancer and AIDS (Institute of Medicine, 2000; Kaiser Family Foundation, 2008). More are injured but do not die, and many are also harmed in ambulatory care settings. One recent set of estimates finds that one-third of hospital patients have adverse events while in hospital (Classen et al., 2011). As a result, there is a renewed emphasis on patient safety in the country, a topic focused on in Chapter 5.
Complaints related to injuriesA patient who believes that he or she has been injured has several alternative courses of action. Some relate to receiving compensation for the injuries, while others relate to punishing the party (usually the provider but sometimes the insurer) held responsible. Although a patient may ultimately file a lawsuit, as discussed in greater detail below under medical malpractice, there are other avenues by which such complaints can be resolved.
There are various ways in which a patient can lodge a complaint against a physician. One way is to report the physician to his or her medical or specialty society. Examples include the AMA, state medical societies and societies

Health systems in transition United States of America 85
of particular specialists. Patients may also file a complaint with the state licensing board, which has the authority to revoke a physician’s licence. While any of these can lead to sanctions against the physician, it does not secure a financial settlement.
The patient may begin by discussing the complaint with the physician; on occasion a resolution can be accomplished simply with an apology. Another option is to bring it to the attention of the medical group in which the physician belongs. (The great majority of physicians are now in groups; in 2008, only 18% of family physicians were in solo offices (Harris, 2011a)). If this does not lead to resolution, a lawsuit may be filed.
Hospitals typically have formal grievance procedures for when a patient lodges a complaint. If the patient does not receive a satisfactory outcome, he or she can often take the grievance to a state agency such as the state’s Department of Public Health. Further avenues include the state and / or the American Hospital Association and the Joint Commission, which is responsible for the accreditation of all United States hospitals. As in the case of physicians, however, this will not lead to a financial settlement. Thus, lawsuits are the final remedy.
Disputes about insurer coverage decisionsThe most common complaint against private insurers relates to reimbursement: not covering all or part of a medical care expense that the patient believes should be covered. This can stem from one of two issues: disagreements about whether a service should have been covered under the insurance contract and disagreements about whether a service that otherwise was covered was indeed medically necessary.
The grievance mechanism depends on the nature of the insurance contract. If a person’s employer is not self-insured or if insurance is purchased individually (see the discussion on ERISA in section 2.8.1), such complaints are first brought to the insurer for reconsideration. If the patient disagrees with the decision, in most states insurers are required to allow the claim to be adjudicated by an independent panel of experts. This is known as independent or external review (one provision of the ACA is to require such a system in all states). One problem with this system, however, is that there could be a conflict of interest whereby such review organizations tend to rule in favour of the insurer. This is because the review organization may rely on the insurer for other business and fear that a negative ruling could risk future referrals (Rodwin, 2011).

Health systems in transition United States of America86
For those who work for a self-insured employer, coverage decision complaints are filed with the employer, which, generally, is also required to allow for a subsequent independent review if the patient disagrees with the coverage decision. Moreover, if it is alleged that the coverage decisions harmed his or her health, then the patient may choose to file a lawsuit (Lieberman, Peppe & Lundy, 2005).
While it is difficult to generalize about Medicaid – because processes differ between states – typically, coverage decision complaints are filed with the state Medicaid department. Medicare has a formal appeals process with many common elements across those in traditional Medicare (Parts A and B) and Medicare Advantage plans (Part C). There is a five-step appeals process, beginning with the private company that handles reimbursement for Medicare beneficiaries in that area (Parts A and B) or the Medicare Advantage plan itself. Following that is an independent review by a reviewer that was not part of the original denial. Third is appeal to an administrative law judge, followed by appeal to the Medicare Appeals Council. The final appeal is through the federal court system.
The medical malpractice system3
Lawsuits are often pursued when there is not a satisfactory resolution to a complaint. In the United States, a great deal of attention has been paid to the medical malpractice legal system since the late 1960s. Over this period, for a variety of reasons, the premiums that hospitals and physicians pay for malpractice insurance, particularly in certain high-risk specialties, have grown faster than many other medical costs.4 At the same time (and related to this), it has been difficult for some physicians to secure coverage. Those on the right as well as the provider communities have called the current system unfair to doctors, leading both to departures from the labour force through retirement, as well as the provision of additional services to protect doctors against lawsuits (known as “defensive medicine”). They further believe that it encourages frivolous lawsuits and that jury awards are often far greater than the damages inflicted. Those on the left, many attorneys and consumer advocates counter
3 Space does not permit a thorough discussion of the medical malpractice system. A thorough treatment can be found in Sloan & Chepke (2008). For a more subjective treatment of the topic that argues that there is not a malpractice insurance “crisis”, see Baker T. (2007).
4 In constant dollars, insurer expenditures on malpractice claims rose by four-fold to ten-fold between 1975 and 2001. The four-fold number is based on “incurred losses”, in which costs are claims that were made in a particular year. The ten-fold number is based on “paid losses”, which are the actual payments made by the insurer in a given year irrespective of when the malpractice claim was reported (U.S. General Accounting Office, 2003). National health expenditures rose about 3.2-fold over this period (also in constant dollars).

Health systems in transition United States of America 87
that it is important that patients be fully compensated for their losses, including pain and suffering, and that, furthermore, the system as currently structured is a critical deterrent against provision of poor medical care.
There are both direct and indirect costs of the malpractice system. The direct costs include payments made for economic, noneconomic and punitive damages; and administrative expenditures for both sides of the dispute as well as overhead costs. Mello et al., (2010) estimate this amounted to about $10 billion in 2008, equal to about 0.4% of national health expenditures. Viewed this way, it is difficult to contend that the malpractice insurance system is a major factor in rising United States health-care costs. Nevertheless, there is substantial variation across geographical areas. The U.S. General Accounting Office (2003) reports that average premiums in 2002 for general surgeons charged by the largest insurer in Florida were $175 000 per year compared to just over $10 000 in Minnesota. Rodwin and colleagues calculate that for three specialties with high malpractice premiums, these premiums constituted 10% of total practice expenses in the most expensive region compared to only 5% in the least expensive. As a percentage of total practice expenses, the share physicians devoted to malpractice insurance premiums in high-cost specialties declined from 11% to 7% between 1986 and 2000 (Rodwin, Chang & Clausen, 2006).
A number of studies have been conducted on the costs of defensive medicine, which, nearly all analysts agree, are greater than the direct costs. However, there is little agreement on how much greater the costs of defensive medicine are. The most recent estimates, which include both hospital and physician costs, are about $46 billion. When combined with the $10 billion in direct costs, the total estimate of the cost of the system is $56 billion, which constituted 2.4% of national health-care expenditures in 2008 (Mello et al., 2010).
Regardless of the costs of the malpractice system in general and defensive medicine in particular, there are benefits that should be taken into account. Firstly, providing compensation to someone who is injured can be viewed as a benefit to society. Secondly, some of the additional tests that are conducted provide information that would not be gathered otherwise. Moreover, part of the motivation for additional tests might not be defensive medicine per se, but rather, physician-payment systems that provide additional compensation for ordering tests.
The ACA does not directly address the issues of medical malpractice. The legislation provides demonstration grants for up to five years to states to test alternatives to the current system. Indeed, states have been pivotal in enacting reforms to the system. The most common ones relate to discouraging frivolous

Health systems in transition United States of America88
lawsuits and limiting the size of noneconomic damages (e.g. pain and suffering). California’s law has received the most attention. Since 1974, the noneconomic damages have been limited to $250 000. Currently, about two-thirds of states have imposed some limit on damages that can be awarded (Kaplan, 2011). While there seems to be general agreement that laws such as these reduce malpractice insurance premiums, the reductions seem to be fairly modest. Thorpe (2004) concluded that states with caps on damages have premiums that are 17% lower than those without them.
Physicians in the United States are at considerable risk of being sued at some point in their career. Even among physicians in low-risk specialties such as psychiatry, 75% face a malpractice claim over their career. The figure for high-risk specialties such as surgery is 99%. However, since most suits do not end in an award, the chances of the insurer having to make a payment on behalf of a physician over his or her career are lower: 19% in low-risk specialists and 71% in the high-risk areas. The average (mean) award has been calculated to be about $275 000, and the median, about $110 000 (Jena et al., 2011).
It is generally agreed that the medical malpractice system does not operate optimally. The Harvard Medical Practice Study found that only between 2% and 14% of instances of negligence in the hospital led to the filing of a malpractice claim (and thus, even fewer are compensated) (Localio et al., 1991). This is due to several factors, including: patients not recognizing that they were the victims of negligence, not wanting to adversely affect their relationship with their physician, and not wanting to deal with the legal system, and the reticence of attorneys to take on cases where they believe the chances of victory are small or the ultimate award will not be sufficient to compensate them for their efforts (Localio et al., 1991). A newer study examined whether awards go to those who were not harmed or in which there was no medical error. It estimated that 16% of patients who filed claims but who were not injured received compensation, and that 28% who were injured, but not due to negligence, also received compensation. This was the exception, however, as 73% of those who were the victims of negligence and filed a claim did receive compensation (Studdert et al., 2006).
Moreover, most malpractice claims are abandoned before they are settled. This is the case for a variety of reasons, including the acquisition of additional information by plaintiffs or their attorneys that the case against the provider is not as strong as originally thought. Nevertheless, substantial time and costs are expended on the cases that are ultimately dropped (Golann, 2011).

Health systems in transition United States of America 89
An idiosyncrasy with the malpractice system is that individuals who work for self-insured firms – about 55% of employees (Pierron & Fronstin, 2008) – are governed by federal government regulation as specified by ERISA rather than the tort law specified by the state. These individuals have the right to sue their doctors for negligence but they have very limited rights if the harm they incurred was as a result of a provider or health plan not providing a service. In such cases, those subject to ERISA can only be reimbursed for the cost of the service that was denied. Thus, whether an American can receive compensation, particularly for services not provided, depends on the nature of their employment contract, which creates a substantial inequity (Korobkin, 2003).
Over the years a number of proposals have been put forward to reform medical malpractice. Besides limiting total damages, these include caps in attorney’s fees, which commonly are set at 33% of the total award. These
“contingency fees” encourage attorneys to take up lawsuits; supporters point out that without them, many consumers would not be able to afford to hire lawyers because they could not afford the hourly fees but opponents contend that it encourages large numbers of sometimes frivolous cases.
Broader reforms have also been suggested. One example is “no-fault” insurance, where payments are made to patients who have experienced an adverse medical event, but where negligence does not have to be proven. In the United States, the Workers Compensation system offers an example. If an employee is injured on the job, he or she can receive compensation irrespective of whether the employer was at fault (Tappan, 2005). Variations of no-fault for medical errors exist in Finland, New Zealand and Sweden.
Proponents argue that no-fault will allow more patients who experience harm to be compensated and will reduce the considerable legal and overhead costs associated with the current system. Opponents have brought up a number of objections, including the difficulty in coming up with a compensation schedule and that such a system may remove an important deterrent to the provision of poor medical care (Roemer, 2007).
2.9.5 Patient participation
Consumer representation has proved difficult to harness effectively in the health sector. Many providers, particularly physicians, remain sceptical about the value of consumer participation in the health sector (Hurley et al., 2009). In some cases, publicly solicited participation is not empowerment so much

Health systems in transition United States of America90
as pro forma involvement to legitimize organizations (Van de Bovenkamp & Trappenburg, 2009). Consumers are represented but assigned formal roles in established, public sponsored decision-making bodies.
Overall, patient participation exists at the national level but it is greater at the state and local levels (Daw, Truong & Rosenau, 2011). The FDA is an exception because it provides visible and effective opportunities for citizens to play a strong role on national health policy-making. Consumers are active members on most FDA advisory committees though they never constitute a majority, nor do they serve as chair. They often have the right to vote, however. There is little consumer activity in Medicare or Medicaid nor are there any top-level consumer positions at the VHA. The ACA has included a consumer advisory council for the new Independent Payment Advisory Board, the function of which is to limit spending growth in the Medicare programme (Kaiser Family Foundation, 2010a)
Some states encourage consumers to participate in newborn screening advisory boards (Hiller, Landenburger & Natowicz, 1997). Consumers participate in the national Bioethics Advisory Panels (President’s Council on Bioethics, 2009). Under the terms of the United States Public Health Services Act, active patients hold 51% of positions on the local governance boards of Federally Qualified Health Centers. Consumer members have significant input on issues related to access, utilization and community outreach (Daw, Truong & Rosenau, 2011).
Consumers also participate as stakeholder advocates or interest groups that lobby to influence policy, often on health-specific issues. These disease-specific or illness-specific consumer groups are especially active in the United States. For example, there are 141 patient advocacy groups on the topic of brain tumours and 40 for melanoma. This amounts to one advocacy group for every 205 brain tumour patients. There is some evidence that such a proliferation of advocacy groups is counterproductive as groups compete for the same resources (Marcus, 2006). Many consumer-oriented advocacy groups have strong local connections, such as the National Alliance on Mental Illness. Some specialize narrowly while others, such as the American Association of Retired Persons (AARP), advocate for a much broader range of issues.
3. Fin
ancin
g
3. Financing
Public sources constitute 48% of health-care expenditures in the United States, private third party payer sources 40%, with the remaining 12% being paid by individuals out of pocket. Even though the proportion
of public and private spending on health care is roughly comparable, only a minority (30%) of the United States population is covered by the public financing system – mainly through Medicare and Medicaid. Currently, the majority of Americans (54%) receive their coverage from private health insurance, with most privately insured individuals obtaining coverage through an employer. Purchasers in the form of health maintenance organizations (HMOs, which provide health-care services on a prepaid basis through a network of providers) grew rapidly during the 1980s and early 1990s. Their market share has fallen substantially since then, due to a backlash against the tight restrictions put on patients, and preferred provider organizations (PPOs) have come to dominate the private insurance market. These contract with a network of providers but they tend to pay physicians on a fee-for-service basis, and make it easier to seek care outside the network. In 2012, among insured employees, 56% were in PPOs and only 25% in HMOs or similar plans.
One in six Americans is uninsured. Even among those with coverage, high out-of-pocket costs can be a barrier to receiving timely care and medications; one estimate is that medical costs are responsible for over 60% of personal bankruptcies in the country. Out-of-pocket (OOP) payments (e.g. direct payment by consumers for health services, coinsurance, co-payments, and deductible amounts) per capita have increased substantially in real terms in recent years, though because of the growth in overall health expenditure, the percentage that OOP spending represents of total health expenditure has decreased. Increases in real OOP spending over the last 40 years are not unique to the United States, although the United States has consistently ranked near the top in OOP spending among high-income countries.

Health systems in transition United States of America92
Payment for health services in the United States depends on the service provided, the type of health provider making the service available, and the funder, as well as the type of facility and geographical location where the service is offered. Given this complexity, payment mechanisms for each type of health service (e.g. inpatient hospital care, prescription drugs) vary widely according to the payer involved.
3.1 Health expenditure
The United States spends far more money on health care than any other country both on an absolute and a per capita basis. In 2011, total spending exceeded $2.7 trillion (Centers for Medicare & Medicaid Services, 2012a). Table 3.1 shows United States trends in spending from 1970 to 2011. After adjusting for inflation, real per capita expenditures increased by more than four-fold over this period and represented 17.9% of GDP in 2011. While it is difficult to anticipate how much spending will grow in future years, especially in light of the recent system reforms, the United States government currently estimates that by 2019 spending will rise to $4.5 trillion and comprise 19.3% of GDP (Truffer et al., 2010).
Table 3.1 Trends in United States national health expenditures, selected years
1970 1980 1990 2000 2010 2011
Current ($B) 75 256 724 1 377 2 600 2 700
Real (2010) ($B) 422 677 1 208 1 744 2 600 2 617
Current per capita 356 1 110 2 854 4 878 8 417 8 680
Real (2010) per capita 2 001 2 937 4 762 6 177 8 417 8 414
Percent of GDP 7.2 9.2 12.5 13.8 17.9 17.9
Source: Centers for Medicare & Medicaid Services, 2012a.
Historically, national health expenditure growth has outpaced that of the GDP (Fig. 3.1). Nevertheless, these growth rates have declined over the last 40 years. It is generally believed that the main factor for reduced growth rates in the 1990s was the proliferation of restrictive managed care practices. It is less clear why there has been a decline in the rate of growth since the mid-2000s. Part of the reason is probably related to financial constraints: it is difficult to afford sustained growth in health-care spending when the national economy

Health systems in transition United States of America 93
is largely stagnant. This has been illustrated by the increased number of uninsured persons, growth in premiums and cost-sharing requirements borne by consumers, all of which quell service usage.
Fig. 3.1Growth in national health expenditures, selected years
Source: Centers for Medicare & Medicaid Services, 2012a.
The government sector has also experienced large increases in health expenditures over the past 40 years. Compared to 1970, in 2008 the public (federal, state and local) share of total national health expenditures increased nearly 10 percentage points, from 37.5 to 47.3 (Table 3.2). Currently, about half of each health-care dollar in the United States was paid for by the government – a figure that would probably surprise those who think of the system as largely a private one. Similarly, the proportion of all government spending accounted for by health care has risen from 8.9% in 1970 to 20.7% in 2008. The share of GDP represented by government spending on health care has almost tripled since 1970. According to the 2011 United States Federal Budget, total spending on Medicare and Medicaid exceeded both that of the Department of Defense and Social Security, which provides retirement income to seniors (defined here as those aged 65 and older) and disabled populations (Congressional Budget Office, 2012a).
Average annual percentage change from previous year
0
2
4
6
8
10
12
14
United States population
Gross domestic product (current US$)
National health expenditures (current US$)
201120102000199019801970
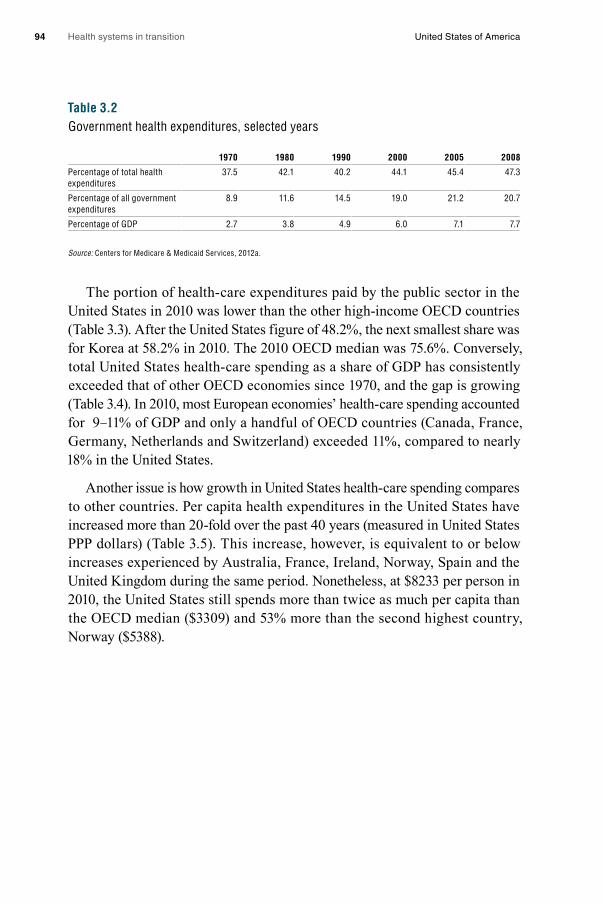
Health systems in transition United States of America94
Table 3.2Government health expenditures, selected years
1970 1980 1990 2000 2005 2008
Percentage of total health expenditures
37.5 42.1 40.2 44.1 45.4 47.3
Percentage of all government expenditures
8.9 11.6 14.5 19.0 21.2 20.7
Percentage of GDP 2.7 3.8 4.9 6.0 7.1 7.7
Source: Centers for Medicare & Medicaid Services, 2012a.
The portion of health-care expenditures paid by the public sector in the United States in 2010 was lower than the other high-income OECD countries (Table 3.3). After the United States figure of 48.2%, the next smallest share was for Korea at 58.2% in 2010. The 2010 OECD median was 75.6%. Conversely, total United States health-care spending as a share of GDP has consistently exceeded that of other OECD economies since 1970, and the gap is growing (Table 3.4). In 2010, most European economies’ health-care spending accounted for 9–11% of GDP and only a handful of OECD countries (Canada, France, Germany, Netherlands and Switzerland) exceeded 11%, compared to nearly 18% in the United States.
Another issue is how growth in United States health-care spending compares to other countries. Per capita health expenditures in the United States have increased more than 20-fold over the past 40 years (measured in United States PPP dollars) (Table 3.5). This increase, however, is equivalent to or below increases experienced by Australia, France, Ireland, Norway, Spain and the United Kingdom during the same period. Nonetheless, at $8233 per person in 2010, the United States still spends more than twice as much per capita than the OECD median ($3309) and 53% more than the second highest country, Norway ($5388).
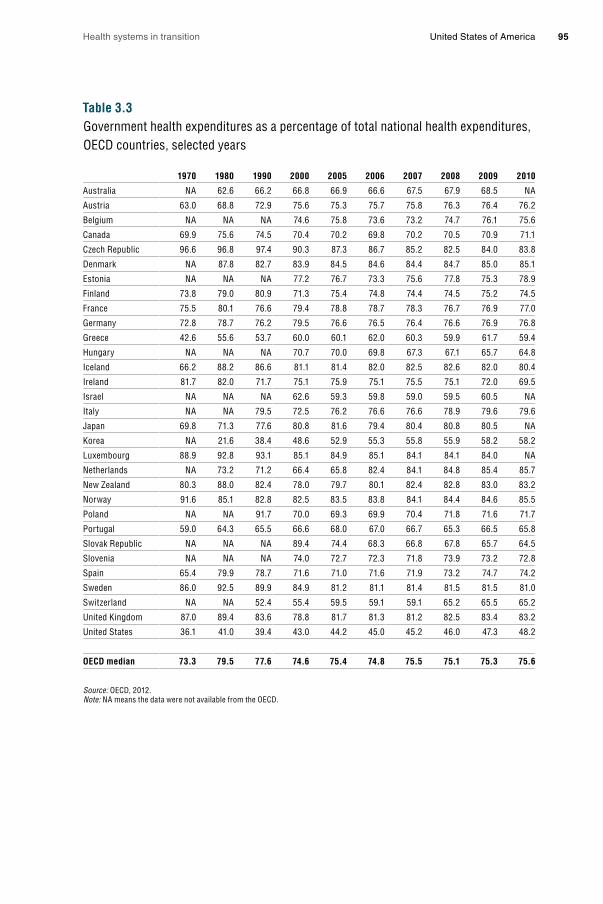
Health systems in transition United States of America 95
Table 3.3Government health expenditures as a percentage of total national health expenditures, OECD countries, selected years
1970 1980 1990 2000 2005 2006 2007 2008 2009 2010
Australia NA 62.6 66.2 66.8 66.9 66.6 67.5 67.9 68.5 NA
Austria 63.0 68.8 72.9 75.6 75.3 75.7 75.8 76.3 76.4 76.2
Belgium NA NA NA 74.6 75.8 73.6 73.2 74.7 76.1 75.6
Canada 69.9 75.6 74.5 70.4 70.2 69.8 70.2 70.5 70.9 71.1
Czech Republic 96.6 96.8 97.4 90.3 87.3 86.7 85.2 82.5 84.0 83.8
Denmark NA 87.8 82.7 83.9 84.5 84.6 84.4 84.7 85.0 85.1
Estonia NA NA NA 77.2 76.7 73.3 75.6 77.8 75.3 78.9
Finland 73.8 79.0 80.9 71.3 75.4 74.8 74.4 74.5 75.2 74.5
France 75.5 80.1 76.6 79.4 78.8 78.7 78.3 76.7 76.9 77.0
Germany 72.8 78.7 76.2 79.5 76.6 76.5 76.4 76.6 76.9 76.8
Greece 42.6 55.6 53.7 60.0 60.1 62.0 60.3 59.9 61.7 59.4
Hungary NA NA NA 70.7 70.0 69.8 67.3 67.1 65.7 64.8
Iceland 66.2 88.2 86.6 81.1 81.4 82.0 82.5 82.6 82.0 80.4
Ireland 81.7 82.0 71.7 75.1 75.9 75.1 75.5 75.1 72.0 69.5
Israel NA NA NA 62.6 59.3 59.8 59.0 59.5 60.5 NA
Italy NA NA 79.5 72.5 76.2 76.6 76.6 78.9 79.6 79.6
Japan 69.8 71.3 77.6 80.8 81.6 79.4 80.4 80.8 80.5 NA
Korea NA 21.6 38.4 48.6 52.9 55.3 55.8 55.9 58.2 58.2
Luxembourg 88.9 92.8 93.1 85.1 84.9 85.1 84.1 84.1 84.0 NA
Netherlands NA 73.2 71.2 66.4 65.8 82.4 84.1 84.8 85.4 85.7
New Zealand 80.3 88.0 82.4 78.0 79.7 80.1 82.4 82.8 83.0 83.2
Norway 91.6 85.1 82.8 82.5 83.5 83.8 84.1 84.4 84.6 85.5
Poland NA NA 91.7 70.0 69.3 69.9 70.4 71.8 71.6 71.7
Portugal 59.0 64.3 65.5 66.6 68.0 67.0 66.7 65.3 66.5 65.8
Slovak Republic NA NA NA 89.4 74.4 68.3 66.8 67.8 65.7 64.5
Slovenia NA NA NA 74.0 72.7 72.3 71.8 73.9 73.2 72.8
Spain 65.4 79.9 78.7 71.6 71.0 71.6 71.9 73.2 74.7 74.2
Sweden 86.0 92.5 89.9 84.9 81.2 81.1 81.4 81.5 81.5 81.0
Switzerland NA NA 52.4 55.4 59.5 59.1 59.1 65.2 65.5 65.2
United Kingdom 87.0 89.4 83.6 78.8 81.7 81.3 81.2 82.5 83.4 83.2
United States 36.1 41.0 39.4 43.0 44.2 45.0 45.2 46.0 47.3 48.2
OECD median 73.3 79.5 77.6 74.6 75.4 74.8 75.5 75.1 75.3 75.6
Source: OECD, 2012.Note: NA means the data were not available from the OECD.

Health systems in transition United States of America96
Table 3.4Health expenditures as a percentage of GDP, OECD countries, selected years
1970 1980 1990 2000 2005 2006 2007 2008 2009 2010
Australia NA 6.1 6.7 8.0 8.4 8.5 8.5 8.7 9.1 NA
Austria 5.2 7.4 8.4 10.0 10.4 10.2 10.3 10.5 11.2 11.0
Belgium 3.9 6.3 7.2 8.1 10.1 9.6 9.6 10.0 10.7 10.5
Canada 6.9 7.0 8.9 8.8 9.8 10.0 10.0 10.3 11.4 11.4
Czech Republic NA NA 4.5 6.3 6.9 6.7 6.5 6.8 8.0 7.5
Denmark NA 8.9 8.3 8.7 9.8 9.9 10.0 10.2 11.5 11.1
Estonia NA NA NA 5.3 5.0 5.0 5.2 6.0 7.0 6.3
Finland 5.5 6.3 7.7 7.2 8.4 8.3 8.0 8.3 9.2 8.9
France 5.4 7.0 8.4 10.1 11.2 11.1 11.1 11.0 11.7 11.6
Germany 6.0 8.4 8.3 10.4 10.8 10.6 10.5 10.7 11.7 11.6
Greece 5.5 5.9 6.7 8.0 9.7 9.7 9.8 10.1 10.6 10.2
Hungary NA NA NA 7.2 8.4 8.3 7.7 7.5 7.7 7.8
Iceland 4.7 6.3 7.8 9.5 9.4 9.1 9.1 9.1 9.6 9.3
Ireland 5.0 8.2 6.0 6.1 7.6 7.6 7.8 8.9 9.9 9.2
Israel NA 7.7 7.1 7.5 7.8 7.5 7.5 7.6 7.5 NA
Italy NA NA 7.7 8.0 8.9 9.0 8.6 8.9 9.3 9.3
Japan 4.4 6.4 5.8 7.6 8.2 8.2 8.2 8.6 9.5 NA
Korea NA 3.7 4.0 4.5 5.7 6.0 6.3 6.5 6.9 7.1
Luxembourg 3.1 5.2 5.4 7.5 7.9 7.7 7.1 6.8 7.9 NA
Netherlands NA 7.4 8.0 8.0 9.8 9.7 10.8 11.0 11.9 12.0
New Zealand 5.2 5.8 6.8 7.6 8.4 8.8 8.5 9.3 10.0 10.1
Norway 4.4 7.0 7.6 8.4 9.0 8.6 8.7 8.6 9.8 9.4
Poland NA NA 4.8 5.5 6.2 6.2 6.3 6.9 7.2 7.0
Portugal 2.4 5.1 5.7 9.3 10.4 10.0 10.0 10.2 10.8 10.7
Slovak Republic NA NA NA 5.5 7.0 7.3 7.8 8.0 9.2 9.0
Slovenia NA NA NA 8.3 8.3 8.3 7.8 8.3 9.3 9.0
Spain 3.5 5.3 6.5 7.2 8.3 8.4 8.5 8.9 9.6 9.6
Sweden 6.8 8.9 8.2 8.2 9.1 8.9 8.9 9.2 9.9 9.6
Switzerland 5.5 7.4 8.2 10.2 11.2 10.8 10.6 10.7 11.4 11.4
United Kingdom 4.5 5.6 5.9 7.0 8.2 8.5 8.5 8.8 9.8 9.6
United States 7.1 9.0 12.4 13.7 15.8 15.9 16.2 16.6 17.7 17.6
OECD median 5.2 6.7 7.2 8.0 8.4 8.6 8.5 8.9 9.8 9.6
Source: OECD, 2012.Note: NA means the data were not available from the OECD.
Table 3.6 shows how health dollars are spent in the United States. Over the past 40 years, the share spent on hospitals has declined from 36% in 1970 to 32% in 2011. The shares of the total accounted for by other professional and personal health care, nursing home and home health care, prescription drugs, and administration have increased. Conversely, the shares accounted for by dental services, other medical products, government public health activities and
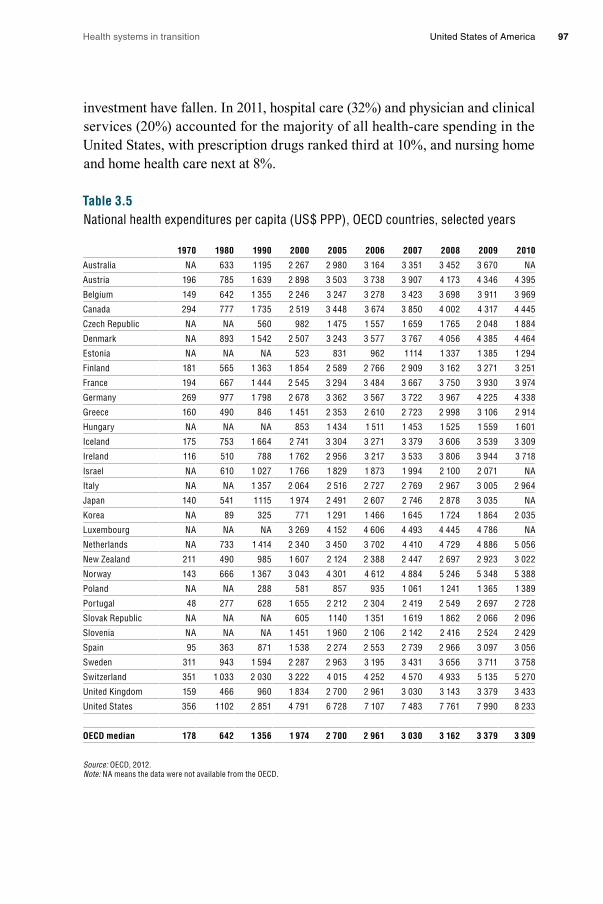
Health systems in transition United States of America 97
investment have fallen. In 2011, hospital care (32%) and physician and clinical services (20%) accounted for the majority of all health-care spending in the United States, with prescription drugs ranked third at 10%, and nursing home and home health care next at 8%.
Table 3.5National health expenditures per capita (US$ PPP), OECD countries, selected years
1970 1980 1990 2000 2005 2006 2007 2008 2009 2010
Australia NA 633 1 195 2 267 2 980 3 164 3 351 3 452 3 670 NA
Austria 196 785 1 639 2 898 3 503 3 738 3 907 4 173 4 346 4 395
Belgium 149 642 1 355 2 246 3 247 3 278 3 423 3 698 3 911 3 969
Canada 294 777 1 735 2 519 3 448 3 674 3 850 4 002 4 317 4 445
Czech Republic NA NA 560 982 1 475 1 557 1 659 1 765 2 048 1 884
Denmark NA 893 1 542 2 507 3 243 3 577 3 767 4 056 4 385 4 464
Estonia NA NA NA 523 831 962 1 114 1 337 1 385 1 294
Finland 181 565 1 363 1 854 2 589 2 766 2 909 3 162 3 271 3 251
France 194 667 1 444 2 545 3 294 3 484 3 667 3 750 3 930 3 974
Germany 269 977 1 798 2 678 3 362 3 567 3 722 3 967 4 225 4 338
Greece 160 490 846 1 451 2 353 2 610 2 723 2 998 3 106 2 914
Hungary NA NA NA 853 1 434 1 511 1 453 1 525 1 559 1 601
Iceland 175 753 1 664 2 741 3 304 3 271 3 379 3 606 3 539 3 309
Ireland 116 510 788 1 762 2 956 3 217 3 533 3 806 3 944 3 718
Israel NA 610 1 027 1 766 1 829 1 873 1 994 2 100 2 071 NA
Italy NA NA 1 357 2 064 2 516 2 727 2 769 2 967 3 005 2 964
Japan 140 541 1 115 1 974 2 491 2 607 2 746 2 878 3 035 NA
Korea NA 89 325 771 1 291 1 466 1 645 1 724 1 864 2 035
Luxembourg NA NA NA 3 269 4 152 4 606 4 493 4 445 4 786 NA
Netherlands NA 733 1 414 2 340 3 450 3 702 4 410 4 729 4 886 5 056
New Zealand 211 490 985 1 607 2 124 2 388 2 447 2 697 2 923 3 022
Norway 143 666 1 367 3 043 4 301 4 612 4 884 5 246 5 348 5 388
Poland NA NA 288 581 857 935 1 061 1 241 1 365 1 389
Portugal 48 277 628 1 655 2 212 2 304 2 419 2 549 2 697 2 728
Slovak Republic NA NA NA 605 1 140 1 351 1 619 1 862 2 066 2 096
Slovenia NA NA NA 1 451 1 960 2 106 2 142 2 416 2 524 2 429
Spain 95 363 871 1 538 2 274 2 553 2 739 2 966 3 097 3 056
Sweden 311 943 1 594 2 287 2 963 3 195 3 431 3 656 3 711 3 758
Switzerland 351 1 033 2 030 3 222 4 015 4 252 4 570 4 933 5 135 5 270
United Kingdom 159 466 960 1 834 2 700 2 961 3 030 3 143 3 379 3 433
United States 356 1 102 2 851 4 791 6 728 7 107 7 483 7 761 7 990 8 233
OECD median 178 642 1 356 1 974 2 700 2 961 3 030 3 162 3 379 3 309
Source: OECD, 2012. Note: NA means the data were not available from the OECD.

Health systems in transition United States of America98
Table 3.6Distribution of health expenditures and type of expenditure (%), selected years
1970 1980 1990 2000 2010 2011
Hospital care 36 39 35 30 31 32
Physician and clinical services 19 19 22 21 20 20
Other professional and personal health-care services
1 1 2 3 3 3
Dental services 6 5 4 5 4 4
Nursing home and home health care
6 7 8 9 8 8
Prescription drugs 7 5 6 9 10 10
Other medical products 6 5 5 4 3 3
Government administration 1 1 1 1 1 1
Net cost of health insurance 3 4 4 5 6 6
Government public health activities
2 3 3 3 3 3
Investment 10 8 7 6 6 6
Source: Centers for Medicare & Medicaid Services, 2012a.
From 1996 to 2007 (years chosen because of availability of data) a number of changes occurred in the distribution of national health-care expenditures by health condition and service (Table 3.7). For example, in 1996, the largest share of expenditures went to treating heart conditions ($58 billion). The majority (65%) of this care occurred in the inpatient setting. By 2007, however, expenditures on treating heart conditions ($82 billion) were surpassed by cancer ($98 billion) and trauma-related disorders ($83 billion), even though, as noted in section 1.4, heart disease remained the leading cause of death in the United States. With regard to cancer care in 2007, more was spent on treatment in outpatient (45%) than inpatient (42%) settings. This is a common trend across conditions, where a larger share of expenditures is moving from inpatient care to outpatient care and prescriptions drugs.
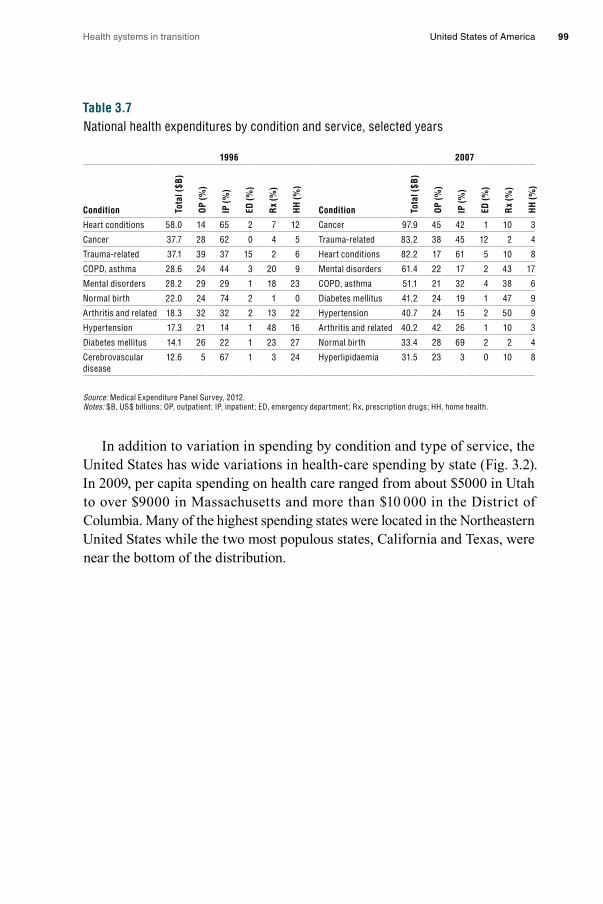
Health systems in transition United States of America 99
Table 3.7National health expenditures by condition and service, selected years
1996 2007
Condition Tota
l ($B
)
OP
(%)
IP (%
)
ED (%
)
Rx
(%)
HH
(%)
Condition Tota
l ($B
)
OP
(%)
IP (%
)
ED (%
)
Rx
(%)
HH
(%)
Heart conditions 58.0 14 65 2 7 12 Cancer 97.9 45 42 1 10 3
Cancer 37.7 28 62 0 4 5 Trauma-related 83.2 38 45 12 2 4
Trauma-related 37.1 39 37 15 2 6 Heart conditions 82.2 17 61 5 10 8
COPD, asthma 28.6 24 44 3 20 9 Mental disorders 61.4 22 17 2 43 17
Mental disorders 28.2 29 29 1 18 23 COPD, asthma 51.1 21 32 4 38 6
Normal birth 22.0 24 74 2 1 0 Diabetes mellitus 41.2 24 19 1 47 9
Arthritis and related 18.3 32 32 2 13 22 Hypertension 40.7 24 15 2 50 9
Hypertension 17.3 21 14 1 48 16 Arthritis and related 40.2 42 26 1 10 3
Diabetes mellitus 14.1 26 22 1 23 27 Normal birth 33.4 28 69 2 2 4
Cerebrovascular disease
12.6 5 67 1 3 24 Hyperlipidaemia 31.5 23 3 0 10 8
Source: Medical Expenditure Panel Survey, 2012.Notes: $B, US$ billions; OP, outpatient; IP, inpatient; ED, emergency department; Rx, prescription drugs; HH, home health.
In addition to variation in spending by condition and type of service, the United States has wide variations in health-care spending by state (Fig. 3.2). In 2009, per capita spending on health care ranged from about $5000 in Utah to over $9000 in Massachusetts and more than $10 000 in the District of Columbia. Many of the highest spending states were located in the Northeastern United States while the two most populous states, California and Texas, were near the bottom of the distribution.

Health systems in transition United States of America100
Fig. 3.2Variation among states in the United States in health-care spending per capita, 2009
Source: Centers for Medicare & Medicaid Services, 2011g.
0 2000 4000 6000 8000 10000 12000
Utah
Arizona
Georgia
Idaho
Nevada
Texas
Colorado
Arkansas
California
Alabama
Virginia
South Carolina
Tennessee
North Carolina
Oklahoma
Mississippi
Oregon
Kentucky
Michigan
Montana
New Mexico
Indiana
Illinois
Washington
Kansas
Louisiana
Hawaii
Iowa
Missouri
Wyoming
Nebraska
South Dakota
Ohio
Florida
Wisconsin
Minnesota
Maryland
New Jersey
Vermont
West Virginia
Pennsylvania
North Dakota
New Hampshire
Rhode Island
New York
Delaware
Maine
Connecticut
Alaska
Massachusetts
District of Columbia
United States
9 278
9 128
7 839
7 749
7 730
7 667
7 635
7 583
7 492
7 409
7 233
7 156
5 735
5 658
5 467
5 434
6 815
10 349
9 278
9 128
8 654
8 521
8 480
8 341
8 309
7 839
7 749
7 730
7 667
7 635
7 583
7 492
7 409
7 233
7 156
7 076
7 056
7 048
7 040
6 967
6 921
6 856
6 795
6 782
6 782
6 756
6 666
6 651
6 640
6 618
6 596
6 580
6 571
6 532
6 444
6 411
6 323
6 286
6 272
6 238
6 167
5 994
5 924
5 735
5 658
5 467
5 434
5 031
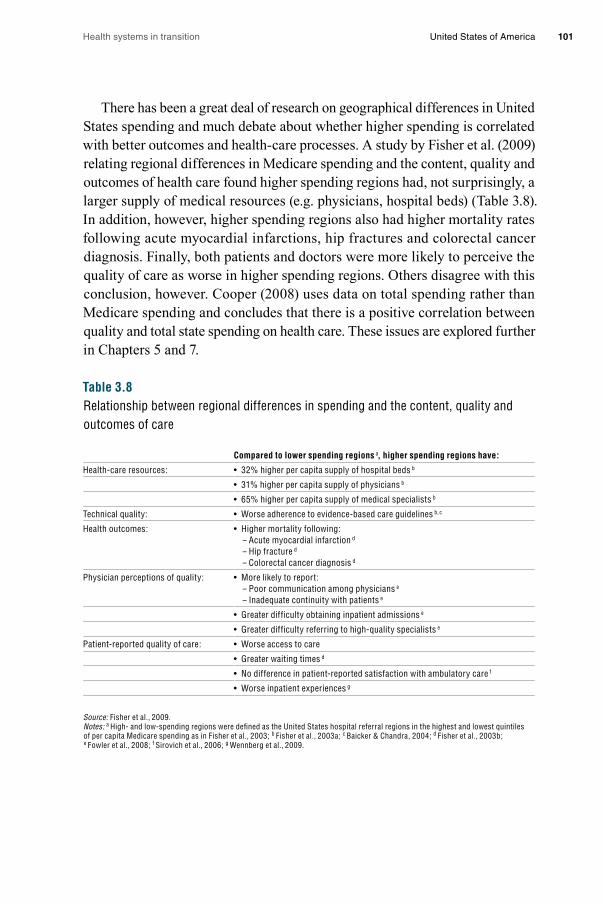
Health systems in transition United States of America 101
There has been a great deal of research on geographical differences in United States spending and much debate about whether higher spending is correlated with better outcomes and health-care processes. A study by Fisher et al. (2009) relating regional differences in Medicare spending and the content, quality and outcomes of health care found higher spending regions had, not surprisingly, a larger supply of medical resources (e.g. physicians, hospital beds) (Table 3.8). In addition, however, higher spending regions also had higher mortality rates following acute myocardial infarctions, hip fractures and colorectal cancer diagnosis. Finally, both patients and doctors were more likely to perceive the quality of care as worse in higher spending regions. Others disagree with this conclusion, however. Cooper (2008) uses data on total spending rather than Medicare spending and concludes that there is a positive correlation between quality and total state spending on health care. These issues are explored further in Chapters 5 and 7.
Table 3.8Relationship between regional differences in spending and the content, quality and outcomes of care
Compared to lower spending regions a, higher spending regions have:
Health-care resources: • 32% higher per capita supply of hospital beds b
• 31% higher per capita supply of physicians b
• 65% higher per capita supply of medical specialists b
Technical quality: • Worse adherence to evidence-based care guidelines b, c
Health outcomes: • Higher mortality following: – Acute myocardial infarction d – Hip fracture d – Colorectal cancer diagnosis d
Physician perceptions of quality: • More likely to report: – Poor communication among physicians e – Inadequate continuity with patients e
• Greater difficulty obtaining inpatient admissions e
• Greater difficulty referring to high-quality specialists e
Patient-reported quality of care: • Worse access to care
• Greater waiting times d
• No difference in patient-reported satisfaction with ambulatory care f
• Worse inpatient experiences g
Source: Fisher et al., 2009. Notes: a High- and low-spending regions were defined as the United States hospital referral regions in the highest and lowest quintiles of per capita Medicare spending as in Fisher et al., 2003; b Fisher et al., 2003a; c Baicker & Chandra, 2004; d Fisher et al., 2003b; e Fowler et al., 2008; f Sirovich et al., 2006; g Wennberg et al., 2009.
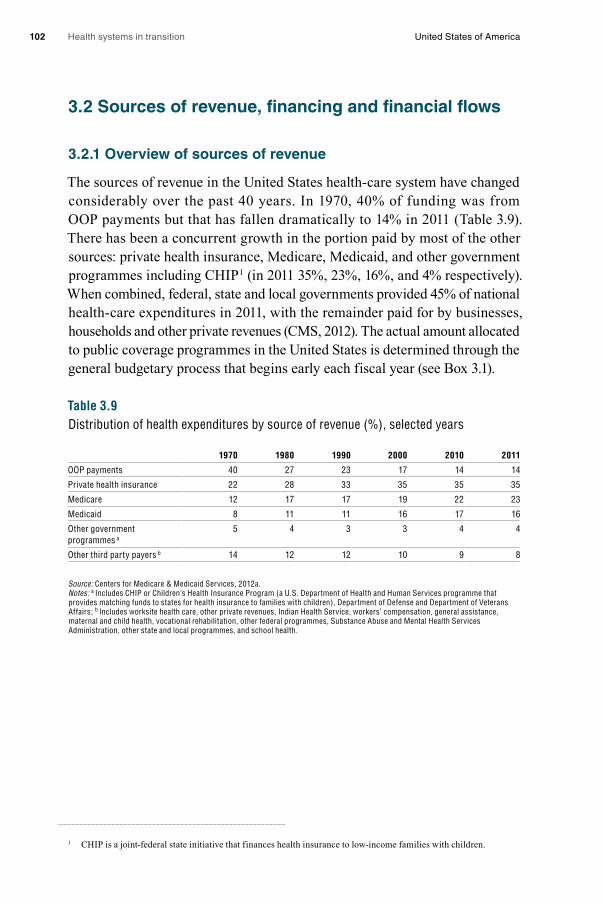
Health systems in transition United States of America102
3.2 Sources of revenue, financing and financial flows
3.2.1 Overview of sources of revenue
The sources of revenue in the United States health-care system have changed considerably over the past 40 years. In 1970, 40% of funding was from OOP payments but that has fallen dramatically to 14% in 2011 (Table 3.9). There has been a concurrent growth in the portion paid by most of the other sources: private health insurance, Medicare, Medicaid, and other government programmes including CHIP1 (in 2011 35%, 23%, 16%, and 4% respectively). When combined, federal, state and local governments provided 45% of national health-care expenditures in 2011, with the remainder paid for by businesses, households and other private revenues (CMS, 2012). The actual amount allocated to public coverage programmes in the United States is determined through the general budgetary process that begins early each fiscal year (see Box 3.1).
Table 3.9Distribution of health expenditures by source of revenue (%), selected years
1970 1980 1990 2000 2010 2011
OOP payments 40 27 23 17 14 14
Private health insurance 22 28 33 35 35 35
Medicare 12 17 17 19 22 23
Medicaid 8 11 11 16 17 16
Other government programmes a
5 4 3 3 4 4
Other third party payers b 14 12 12 10 9 8
Source: Centers for Medicare & Medicaid Services, 2012a.Notes: a Includes CHIP or Children’s Health Insurance Program (a U.S. Department of Health and Human Services programme that provides matching funds to states for health insurance to families with children), Department of Defense and Department of Veterans Affairs; b Includes worksite health care, other private revenues, Indian Health Service, workers’ compensation, general assistance, maternal and child health, vocational rehabilitation, other federal programmes, Substance Abuse and Mental Health Services Administration, other state and local programmes, and school health.
1 CHIP is a joint-federal state initiative that finances health insurance to low-income families with children.

Health systems in transition United States of America 103
Box 3.1Overview of the federal government budgeting process
The actual amount allocated to public coverage programmes in the United States is determined through the general budgetary process that begins early each fiscal year when the President sends a proposed budget to Congress for consideration with detailed recommendations for health-care programmes that involve federal government spending. The President’s proposed budget is prepared over many months with input and assistance from several administrative agencies within the Executive Office of the President such as the Office of Management and Budget (OMB), the Government Accountability Office (GAO), and the United States Treasury Department. Each federal executive department and independent agency has input into the President’s budget request to Congress, including those involving the pooling of public funds for health care. The President’s request to Congress is for the subsequent fiscal year. The budget reflects the current president’s fiscal policy and is influenced by desired level of spending, assumptions about revenues and goals for the deficit.
Congressional budget committees in the House and Senate each propose budget resolutions in response to the President’s proposed budget. Each chamber passes a budget appropriations bills. The two chambers reconcile differences between House and Senate bills and vote on them. The appropriations bill (budget) is then sent to the President for signature. A President may veto the appropriations bill in which case the Congress may override the veto with a 2 / 3rd vote in each chamber or modify it so as to obtain the President’s approval. Congress almost always votes for different appropriations than the President’s requested allocations for Medicare, Medicaid, the VA and other public health-care programmes. It does so within the Congressional budgetary process that includes a complex set of rules and laws that govern Congressional action on the budget. This makes for a process that is informed by careful study within House and Senate budgetary and appropriations committees and subcommittees. Congress also relies heavily on information generated by expert agencies within and outside government.
Despite the expertise and objective data available to Congress, the budgetary and appropriations process is generally conflict ridden, reflecting political divisions within the Congress. Congress sometimes combines the various appropriations bills generated by the Congressional budgetary process into an omnibus reconciliation bill. Reconciliation bills are “utilized when Congress issues directives to legislate policy changes in mandatory spending (entitlements) or revenue programs (tax laws) to achieve the goals in spending and revenue contemplated by the budget resolution” (U.S. Department of State, 2011).
In the Senate the reconciliation procedure is designed to avoid the filibuster process. Reconciliation bills usually condense especially contentious or controversial budget measures proposed by various legislative committees into one piece of legislation. Much health-care legislation, and changes to existing health-care programmes, has been included in these reconciliation bills in the last few decades.
Significantly, the reconciliation process was instrumental in the Obama Administration’s getting the ACA passed by Congress. With the death of Democratic Senator Edward Kennedy and his replacement by a Republican, the Democrats no longer had the 60 votes that were needed to stop a filibuster. Since reconciliation only requires a majority, most of the key elements of the legislation were approved through this process. This is further discussed in Chapter 6.
Health systems in transition United States of America104
While OOP payments have fallen as a percentage of the total, real OOP spending has actually risen considerably. This is because the size of the health-care system has grown so fast. In 1970, current per capita OOP costs were approximately $117. In 2008, they had risen to $922, or by almost eight-fold.2 In contrast, the consumer price index over this same period grew by only 5.2-fold.
3.2.2 Financing and financial flows
Financing in the United States health-care system originates from employers, employees and individuals. From them, financing flows to private insurers and health plans (see Box 3.2 for definitions of insurers and health plans), as well as to state and federal governments. Private and public purchasers then transfer dollars to providers through a variety of payment mechanisms. Fig. 3.3 depicts financial flows in the United States health-care system.
Beginning with the left-hand side of Fig. 3.3, employers, employees, individuals and charities pay into the health-care system through various taxes, premiums and other OOP expenses, and donations. Health-care financing by employers includes payments in the form of corporate taxes to general federal and state revenue funds. Corporate tax rates are progressive, varying from 15% at the lowest levels of corporate income up to 35%. Firms also contribute to private health insurance by paying all or part of employee health insurance premiums. Both employers and employees contribute equally through a mandatory payroll tax to fund the Hospital Insurance part of Medicare (Part A). In 2011 employers and employees each paid 1.45% of an employee’s income. The ACA increases this contribution for wealthy individuals (see section 3.3.2). The self-employed are responsible for the entire 2.9% share of the Medicare payroll tax.
2 This was calculated by taking per capita health expenditures in 1970 and 2006 ($356 and $7681, respectively) and multiplying them by the proportion paid out of pocket (33% and 12%).
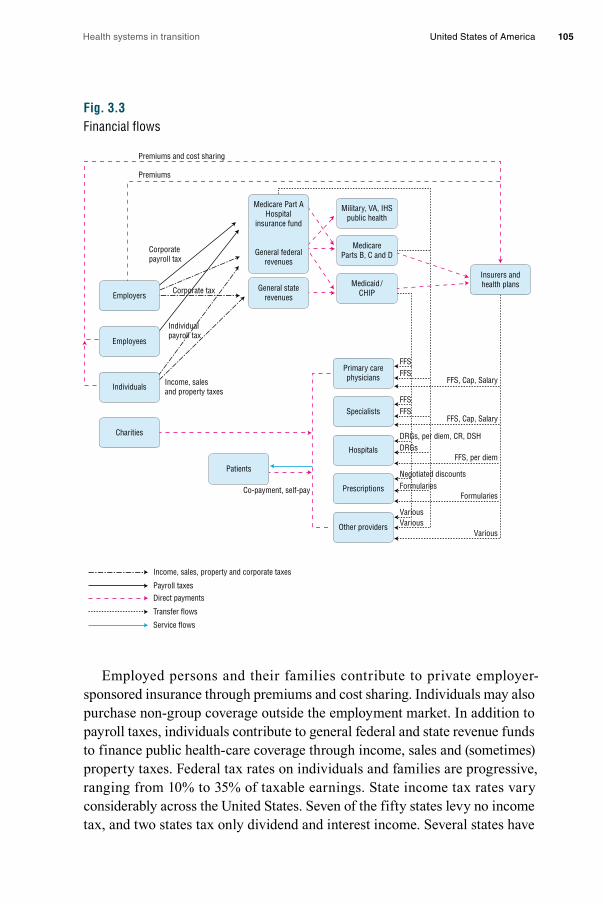
Health systems in transition United States of America 105
Fig. 3.3Financial flows
Employed persons and their families contribute to private employer-sponsored insurance through premiums and cost sharing. Individuals may also purchase non-group coverage outside the employment market. In addition to payroll taxes, individuals contribute to general federal and state revenue funds to finance public health-care coverage through income, sales and (sometimes) property taxes. Federal tax rates on individuals and families are progressive, ranging from 10% to 35% of taxable earnings. State income tax rates vary considerably across the United States. Seven of the fifty states levy no income tax, and two states tax only dividend and interest income. Several states have
Income, sales, property and corporate taxes
Payroll taxes
Direct payments
Transfer flows
Service flows
Employers
Employees
Individuals
Charities
General staterevenues
Medicare Part AHospital
insurance fund
General federalrevenues
Military, VA, IHSpublic health
MedicareParts B, C and D
Medicaid/CHIP
Insurers andhealth plans
Specialists
Primary carephysicians
Hospitals
Prescriptions
Other providers
Patients
Corporatepayroll tax
Corporate tax
Individualpayroll tax
Income, salesand property taxes
FFSFFS
FFS, Cap, Salary
FFSFFS
FFS, Cap, Salary
DRGs, per diem, CR, DSHDRGs
FFS, per diem
Negotiated discountsFormularies
Formularies
VariousVarious
Various
Co-payment, self-pay
Premiums and cost sharing
Premiums

Health systems in transition United States of America106
flat income tax rates while others, such as California, similar to the federal government, tax the wealthier more (the rate for the wealthiest Californians is 9.55%). Furthermore, some cities, such as New York City, also levy income taxes. Similarly, sales taxes, which are levied by states, also vary, with five states having no sales taxes and the remainder having rates varying from 2.9% to 8.25%. Some states exempt food or other necessities from sales taxes. There is no value added tax (VAT) in the United States, and proposals to enact a VAT
Box 3.2Insurers and health plans
In the United States, the terms “health insurers” and “health plans” are often used synonymously. In keeping with that, this review uses the terms interchangeably. While the term “health insurer” is generally well understood as a public or private organization that provides protection against health-care costs in return for a premium (or some other criterion determining eligibility such as income and assets in the Medicaid programme), the term “health plan” is used much more broadly.
To illustrate, the United States Code of Federal Regulations (Section 160.103) lists 17 different entities that, either individually or in combination, constitute “health plans”. These include: health insurers, employer-group products, HMOs, Medicare FFS, Medicare Advantage (Part C), Medicaid, state Children’s Health Insurance Programs, an issuer of Medicare supplemental insurance or long-term care, the programmes providing for activity military personnel, veterans and Native Americans, the Federal Employees Health Benefits Program, high-risk pools established by states, or “any other individual or group plan, or combination of individual or group plans, that provides or pays for the cost of medical care”. Thus, the exact entity to which the term “health plan” refers can be understood only in context.
The ambiguity of the term may date back to the growth of managed care around the 1990s. Previously, it was probably accurate to refer to managed care companies as either being HMOs or PPOs. Eventually, though, these organizations began to offer a choice of several distinct products that could include both financing and delivery of care: HMOs, PPOs, POS plans, and later on high-deductible plans, some of which include tax-advantaged savings vehicles. Some of these companies still continued to offer traditional health insurance products. The term “health plan” is therefore often used to denote the companies that offer a large array of financing and delivery products. The five largest private health plans in the United States are United Healthcare, Wellpoint, Kaiser, Aetna and Humana.
Most health plans offer a variety of different coverage arrangements. These “products” or “policies” are also referred to as “plans”. Again, the terms are often used interchangeably. The clearest way to denote these might be to call the different arrangements (e.g. HMO, PPO, high-deductible plan) “products”, and the contract or agreement between the organization and the individual as “policies”, but in common parlance they are frequently called “plans”. For example, Wellpoint offers a variety of products to employers, one or more of which are PPOs. A person who works for the employer and who chooses one of the PPO products would be said to have health insurance coverage with Wellpoint. That is, Wellpoint is their health insurer or health plan. The person could also be said to have a PPO health plan.
Health systems in transition United States of America 107
have never been seriously considered by Congress. Property taxes, the rates of which also vary across the country (and average about 1% of home value), are generally collected on a sub-state (county) basis and are used to fund local programmes, which include safety-net health-care services. The wide variation in public financing for coverage programmes between states contributes to the discrepancy in populations and services covered by state-sponsored and state–federal-sponsored public programmes, particularly Medicaid (see section 3.4).
Care for low-income and uninsured individuals is financed through a variety of mechanisms. Private charities, with monies from donations and endowments, assist individuals without health insurance and some special needs populations to purchase health-care services. As discussed further in Chapter 5, health services for the uninsured are often provided by a safety-net system of public and community clinics, as well as by hospitals and physicians. Some funding comes from general tax revenues but in many cases the care received is uncompensated and therefore is borne by providers. It is estimated that of the $57 billion in uncompensated care expenditures, hospitals contribute 61%, and physicians 14%, with the remainder coming from a variety of community organizations (Kaiser Family Foundation, 2011f). Patients can also pay for services directly (e.g. self-pay or uninsured) or may be insured but have co-payments to make at the time services are received.
Revenues from the sources described above are paid to federal and state government, insurers and health plans, or directly to providers. Payroll taxes flow to the Hospital Insurance Fund at the federal level. Revenue from this fund finances Medicare Part A, and the Part A component (mainly hospital care) of Part C coverage. Federal general revenue funds allocate dollars to Medicare (Parts B, C and D) and both federal and state general revenues are used to fund Medicaid programmes or other federal, state and local health agencies. Revenues from Medicare, Medicaid and insurers and health plans are transferred to providers through a variety of payment mechanisms. Payments from Medicare and Medicaid are made directly to providers or indirectly through insurers and health plans that provide managed care coverage to beneficiaries (e.g. Medicaid managed care organizations or Part C Medicare Advantage plans). The following paragraphs briefly describe the payment mechanisms by which revenues are transferred to providers (more detail on provider payments is provided in section 3.7).
Medicare Part B insurance pays primary care physicians and specialists on a fee-for-service (FFS), or retrospective, basis using a predetermined fee schedule. Conversely, Medicare hospital payments (Part A) are prospective and based on

Health systems in transition United States of America108
DRGs. Medicare Part D subsidizes premiums for prescription drug coverage provided by private insurance organizations. Each of the private prescription drug plans establishes its own formularies determining which drugs will be paid for by the plans, subject to certain Medicare restrictions.
Depending on the state Medicaid programme, Medicaid may pay primary care doctors and specialists directly on a FFS basis. Alternatively, Medicaid may pay private managed care organizations (MCOs) a capitated rate and the MCOs then pay primary care doctors and specialists on either a capitated or FFS basis. Medicaid payments for hospital services vary by state and fall into three groups: DRGs, per diem and cost reimbursement (CR). Hospitals serving a large proportion of Medicaid and uninsured patients can be designated as disproportionate share hospitals (DSHs) and receive additional payments from states. Under the ACA, DSH allotments to states will be reduced beginning in 2014. Medicaid pays for prescription drugs based on negotiated discounts. Among the services falling under “other providers”, Medicaid is the primary source of funding for long-term care services, paying for more than 40% of all long-term care (Kaiser Family Foundation, 2011b).
Insurers and health plans transfer payments to primary care physicians and specialists on a FFS, capitated or salary basis. Hospital services are paid for by insurers and health plans using primarily per diem payments typically negotiated between each hospital and insurer on an annual basis. Similar to private health plans in Medicare Part D, insurers and health plans pay for prescription drugs based on formularies. Subsequent sections in this chapter provide greater depth on the sources of revenue in the United States health-care system, financing as it relates to Medicare, Medicaid and private insurers, the scope of OOP costs, and payment mechanisms to providers.
3.3 Medicare
The next three sections discuss the major sources of coverage in the United States. Table 3.10 presents a summary of the sources of health-care coverage in the United States, how they are financed, who is eligible, and the breadth, depth and scope of coverage as of 2010 for comparison. Unlike citizens in other high-income countries, only a minority of the United States population is covered by the public financing system (30%) – mainly through Medicare (seniors and the disabled) and Medicaid (poor and near-poor); the latter is
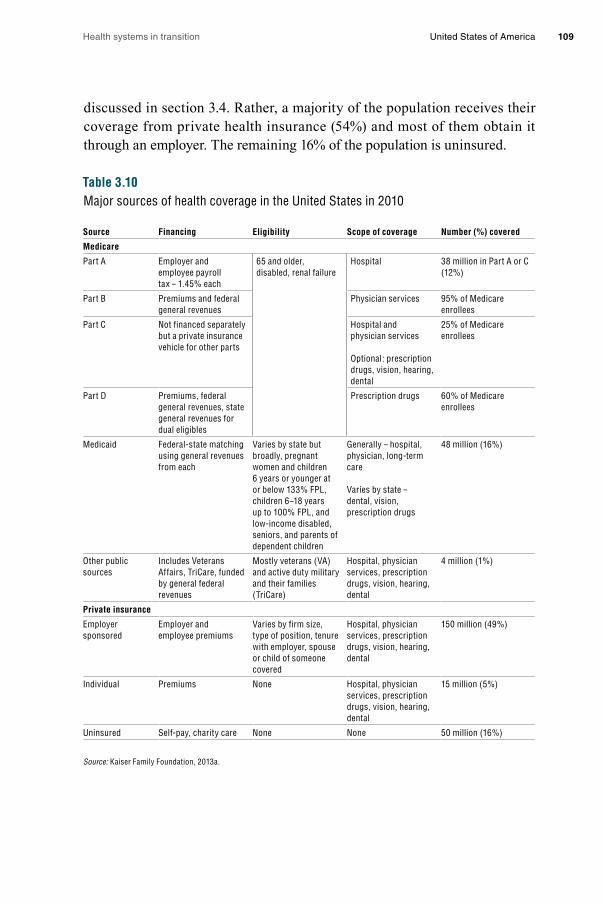
Health systems in transition United States of America 109
discussed in section 3.4. Rather, a majority of the population receives their coverage from private health insurance (54%) and most of them obtain it through an employer. The remaining 16% of the population is uninsured.
Table 3.10Major sources of health coverage in the United States in 2010
Source Financing Eligibility Scope of coverage Number (%) covered
Medicare
Part A Employer and employee payroll tax – 1.45% each
65 and older, disabled, renal failure
Hospital 38 million in Part A or C (12%)
Part B Premiums and federal general revenues
Physician services 95% of Medicare enrollees
Part C Not financed separately but a private insurance vehicle for other parts
Hospital and physician services
Optional: prescription drugs, vision, hearing, dental
25% of Medicare enrollees
Part D Premiums, federal general revenues, state general revenues for dual eligibles
Prescription drugs 60% of Medicare enrollees
Medicaid Federal-state matching using general revenues from each
Varies by state but broadly, pregnant women and children 6 years or younger at or below 133% FPL, children 6–18 years up to 100% FPL, and low-income disabled, seniors, and parents of dependent children
Generally – hospital, physician, long-term care
Varies by state – dental, vision, prescription drugs
48 million (16%)
Other public sources
Includes Veterans Affairs, TriCare, funded by general federal revenues
Mostly veterans (VA) and active duty military and their families (TriCare)
Hospital, physician services, prescription drugs, vision, hearing, dental
4 million (1%)
Private insurance
Employer sponsored
Employer and employee premiums
Varies by firm size, type of position, tenure with employer, spouse or child of someone covered
Hospital, physician services, prescription drugs, vision, hearing, dental
150 million (49%)
Individual Premiums None Hospital, physician services, prescription drugs, vision, hearing, dental
15 million (5%)
Uninsured Self-pay, charity care None None 50 million (16%)
Source: Kaiser Family Foundation, 2013a.
Health systems in transition United States of America110
It is noteworthy, however, that the recent United States reforms are likely to expand both the public and private sectors as the number of uninsured persons declines. More uninsured poor and near-poor individuals and families will receive Medicaid coverage in some states, and many others who are uninsured, whose incomes are too high to qualify for Medicaid, will receive subsidies that will be used to purchase private health insurance after 2014. Before discussing these types of coverage, however, the Medicare programme is described.
3.3.1 Coverage
Breadth of coverage The Medicare programme provides health insurance coverage to nearly all Americans aged 65 and older, as well as to many disabled Americans – those who have received federal disability payments for two or more years as well as people with end-stage renal disease. Medicare is divided into four parts, labelled Parts A, B, C and D.
• Part A, Hospital Coverage, includes not only hospital care, but also some post-acute nursing home, home health and hospice care. Individuals and their spouses aged 65 and older who worked for at least 10 years during which time they contributed federal payroll taxes that supported both Social Security (the United States statutory retirement pension system) and Medicare are entitled to Part A coverage. In 2008, 44.9 million people were enrolled (U.S. Department of Health and Human Services, 2010c, Table 142).
• Part B, Supplemental Medical Insurance, is a voluntary programme with essentially the same eligibility requirements as Part A. It covers physicians’ services (both inpatient and outpatient); outpatient care; medical equipment, tests and X-rays; home health care; some preventive care; and a variety of other medical services. Despite its voluntary nature, about 95% of those eligible enrol in it because it is heavily subsidized, as discussed in section 3.3.2.
• Part C, Medicare Advantage, is an alternative to Parts A and B. Enrolment is voluntary. It provides coverage for the same services and, at the discretion of the organization offering coverage, sometimes additional benefits such as vision, hearing and / or dental care. One of the main differences between Part C and the preceding two parts, which are sometimes called “traditional Medicare”, is that Part C coverage is offered through private organizations (e.g. insurers and HMOs). Put another way, when a beneficiary receives a service under Part A or B, the Medicare

Health systems in transition United States of America 111
programme pays the provider directly for services (though payments are processed through private organizations called “intermediaries” and “carriers”). In contrast, under Part C, Medicare pays the Medicare Advantage plan a fixed amount of money per month for each enrollee based on the characteristics (e.g. demographics, medical diagnoses) of the particular enrollees in the plan. (The formula is a complicated one that has been revised several times over the years.) Enrollees sometimes also pay a premium to the Part C health plan depending on the size of the plan’s bid for providing services. Research has shown that historically, Part C plans have been paid more than their costs (Congressional Budget Office, 2007). As a result, the ACA substantially reduces Part C payment rates. The organization, in turn, is responsible for providing or paying for the service, enjoying part of the financial gain from excess revenues and being at risk of financial loss for shortfalls. A second difference is that Medicare Advantage plans tend to cover beneficiaries living in a defined geographical area, covering one or more counties (a subdivision of a state). Thirdly, plans compete with each other in part on the basis of premiums. That is, rather than everyone paying the same premium, as they do under Part B, in Part C each plan sets its own premium, which will depend not only on the costs of providing required services but also whether additional benefits are offered. Premiums are paid direct to health plans. Fourthly, as noted, most Medicare Advantage plans offer coverage for some types of services not covered by Parts A and B, such as vision, hearing or dental care.
The exact nature of the benefits under Part C depends on the type of health plan in which a beneficiary enrolls. HMOs are the most common, followed by PPOs and private FFS plans. The last of these is different from the others in various ways: enrollees are generally not limited to a particular network or providers; providers can charge more, meaning that OOP expenses can be higher than with other Part C plans such as HMOs; and physicians typically are paid on a FFS basis. The law allowing for private FFS plans was established by Congress in 1997 as an option for beneficiaries who did not want to be subject to utilization management techniques typically used by managed care plans (Miller, 2007).
In 2010 24% of Medicare beneficiaries were enrolled in Medicare Advantage plans, a doubling of the rate from just five years before (Kaiser Family Foundation, 2010b). The remaining 76% remained in “traditional Medicare”. The most common explanation for the growth in Part C enrolment is that as payments by CMS (which, as noted, are based on
Health systems in transition United States of America112
a formula) began to exceed the costs of plans, the plans were able to offer additional benefits and have had an incentive to market intensively. The ACA reduces payments to Medicare Advantage plans, which could result in increased beneficiary premiums or a reduction in additional services offered. These reduced payments will be phased in over six years starting in 2011. The Congressional Budget Office estimates that the payment reductions will reduce Medicare Advantage enrolment by 35% over what it otherwise would have been in 2019 (Congressional Research Service, 2010). However, in the first year of the cuts, the exact opposite happened – premiums were lower and enrolment increased by 10% to 27 million (Kaiser Family Foundation, 2012a).
• Part D, Prescription Drug Coverage, began in 2006 and is also voluntary. Prior to that, Medicare did not provide coverage for prescription drugs received outside hospital. Similar to Part C, Part D benefits are provided through private organizations (usually insurers, HMOs or PPOs). In 2010, there were over 40 choices among Part D plans in each state – in addition to dozens of Medicare Advantage plans providing drug coverage in many urban areas. Also as with Part C, premiums and benefits vary by plan, with competition occurring based not only on premium differences, but also on differences in benefits and, in particular, the drugs that are included on a plan’s formulary that are listed as “preferred” drugs and which therefore are subject to lower patient co-payments.
About 60% of Medicare beneficiaries are covered under Part D – about two-thirds from “stand-alone” plans that provide coverage only for prescription drugs, and the remaining one-third from the drug benefits provided through Medicare Advantage plans. Most other beneficiaries have drug coverage from another source, such as coverage from a former employer, but 10% do not have any drug coverage (Kaiser Family Foundation, 2010e).
Scope of coverage In general, Medicare covers most medically necessary services as determined by providers. Unlike many private health insurance plans, pre-authorization is not required for hospitalizations. With the onset of coverage of outpatient prescription drugs in 2006, and the gradual increase in coverage for preventive services in recent years (and which is being expanded through the ACA), the main services not covered are extended long-term care and dental care. There are a few other explicit exclusions: cosmetic surgery, acupuncture, hearing aids, and, except in limited circumstances, glasses. Some of these services, however, are covered under selected Medicare Advantage plans.
Health systems in transition United States of America 113
The largest of these excluded services is extended long-term care. Precisely which services are covered by Medicare is rather complex because the programme does include some coverage for nursing home and home health care. This coverage, however, is aimed at acute-care illnesses. Skilled nursing care must be deemed medically necessary by a physician; custodial care is not covered. Moreover, nursing home care can only be covered if it follows an inpatient hospital stay of at least three days and coverage is provided for a maximum of 100 consecutive days.
Medicare is not involved in determining whether a particular service to a specific beneficiary is covered. Rather, these decisions are generally made by private organizations that contract with Medicare. As a result of a compromise between legislators and providers to assuage provider concerns about the government making coverage decisions, under Parts A and B Medicare contracts with “intermediaries” and “carriers”, respectively. Coverage decisions are made directly by the private health plan under Parts C and D. The Medicare programme has a formal appeals process when disputes occur.
Depth of coverage As implied above, Medicare coverage is both broad and wide: nearly all seniors are covered and almost all services are covered, the two major exceptions being long-term care and routine dental care. Coverage is not as deep, however. As a result, about 90% of all beneficiaries obtain some form of supplemental insurance coverage. In 2006, Medicare paid just under half – 48% – of total medical and long-term care expenses. Private insurance paid 14%, and 8% was paid by Medicaid on behalf of low-income beneficiaries. Direct spending by beneficiaries constituted 25% of total expenditures. These costs comprised: Medicare premiums (39%), long-term care (19%), medical providers and supplies (15%), prescription drugs (14%), dental (6%) and other (7%). Altogether, beneficiaries spend an average of 16.2% of their income on health-care expenses (Kaiser Family Foundation, 2010e). In 2004, the most recent year for which data are available, direct spending (premiums and OOP costs) for those aged 65 and older averaged about three times that of younger adults: $2205 vs $722 (Centers for Medicare & Medicaid Services, 2010). Moreover, because their incomes are also lower, it was estimated that in 2003, the share of income spent on medical care was more than five times as high for seniors as it was for younger people (Desmond et al., 2007).
Health systems in transition United States of America114
Coverage for hospital care under Part A contains two significant gaps. Firstly, there is a deductible for each inpatient hospital stay; in 2012, the amount was $1156. Secondly, for those rare stays that exceed 60 days, there are substantial daily co-payments: $289 per day for days 61–90, and $578 per day for days 91–150.3
As noted, Part A’s nursing home coverage is limited because it is only for short-term skilled care following a hospital admission, rather than long-term care. For eligible stays, up to 100 days are covered. During the first 20 days, there are no co-payments, but there is a substantial daily co-payment for days 21–100 of a stay – $144.50 in 2012. In contrast, there is no co-payment for home health-care services.
Coverage for physicians’ and other medical services under Part B are also subject to patient cost sharing. The patient is responsible for 20% of all covered expenses (with no maximum) after meeting an annual deductible of $162, in 2011. The 20% coinsurance requirement is perhaps the main reason why the vast majority of Medicare beneficiaries seek some form of supplemental insurance coverage, which is discussed below.
It is difficult to generalize about the depth of coverage under Part C because each plan has its own benefit structure. Federal minimum requirements are that coverage be at least as comprehensive as under Parts A and B. As noted, most Part C plans offer additional services. About 80% offer prescription drug coverage.
Beneficiaries obtain outpatient prescription drug coverage in one of three ways: through a Part C Medicare Advantage plan (discussed above), a stand-alone drug insurance plan called a Prescription Drug Plan (PDP) under Part D of Medicare, or employer-provided job or retiree health insurance coverage. In 2012, premiums for PDPs averaged $39.40 a month (Kaiser Family Foundation, 2011c).
Whereas Part D drug benefits vary depending on a particular plan’s benefit structure, there is a standard plan that health plans are allowed to offer that in 2012 had the following benefits. The beneficiary paid a $320 annual deductible for drug expenses. For annual drug spending between $320 and $2930, the plan paid 75% of expenses and thus, the beneficiary was subject to a 25%
3 Medicare’s benefit structure is based on a “benefit period”, which begins with a hospitalization and ends after 60 days have elapsed from discharge from a hospital or nursing home. The benefits mentioned in the text apply to each benefit period, with the exception of the 60 lifetime-reserve days, which can be used only once and are subject to the same substantial daily co-payments discussed above.
Health systems in transition United States of America 115
coinsurance rate. For spending between $2930 and $6657, no coverage was provided – this is the so-called “doughnut hole”. Finally, for expenses over $6657 annually, the beneficiary paid 5%.
As noted, about 90% of Medicare beneficiaries have some form of supplemental insurance coverage. The main sources are (Kaiser Family Foundation, 2010e):• Former (and occasionally, current) employers: 33% of beneficiaries
have such coverage. It is considered desirable because it often covers a greater share of expenses than private (“Medigap”) insurance and because premiums are usually partially subsidized by the employer.
• Medicare Advantage plans: 24% have this form of coverage. It is usually included as a form of supplemental insurance because, as noted, these plans tend to cover some expenses beyond what is paid for by Parts A and B.
• Medicaid: 15% have this coverage, which is available to Medicare beneficiaries with low incomes and assets. This group, which qualifies for both Medicaid and Medicare, is referred to as “dual eligibles”. It covers most services at zero or nominal costs. Of note is the fact that Medicaid often becomes a payer of last resort when a beneficiary is institutionalized in a nursing home and “spends down” his or her income and assets.
• Medigap: 17% of beneficiaries purchase (unsubsidized) private health insurance. Premiums vary by health plan; to illustrate, the annual premium cost of the most popular benefit configuration in California in 2010, for a 65-year-old woman, varied from $1626 (from the lowest cost insurer) to $5467 (the highest cost insurer) (California Department of Insurance, 2010).
• The Medigap market is unusual in two respects. Firstly, unlike most other types of insurance, in which states are responsible for insurance regulation, Medigap is subject to strong federal oversight. Secondly, Medigap policies must conform to strict benefit standardization requirements; health plans are only allowed to sell benefit configurations that exactly match federal standards.
3.3.2 Revenue collection
Revenue collection differs among the various parts of Medicare. Part A was designed to be a social insurance programme, and accordingly, it is financed almost entirely (excepting beneficiary cost-sharing requirements) through
Health systems in transition United States of America116
a payroll tax with nearly all seniors as well as many disabled Americans automatically eligible for coverage. Parts B and D, in contrast, are voluntary and funded by a combination of general revenue and premium contributions by beneficiaries. Part C is funded by the sources similar to Parts A and B.
Overview of Medicare expenditures In 2011, total Medicare expenditures were $549 billion (Boards of Trustees, 2012). Most of this is spent on inpatient hospital care (43%) and physicians’ services (22%). In spite of the fact that Medicare services seniors and the disabled populations, just 12% was spent on nursing home and home health care. This reflects the programme’s traditional orientation towards covering acute rather than long-term care (Centers for Medicare & Medicaid Services, 2012a).
Revenue in the four different parts of Medicare American workers and their employers are subject to a mandatory payroll tax that fully funds Part A of Medicare. Since 1990 the rates have not changed; they are 15.3% of payroll up to a “taxable maximum”, evenly split between the employer and employees. Self-employed individuals are responsible for paying the entire amount themselves. Of the 15.3%, 12.4% is earmarked for Social Security (the federal pension system) and 2.9% for Part A of Medicare. Because employees are often unaware of their employer’s contribution, they may think of the tax as being a total of 7.65%.
The system is somewhat regressive because the Social Security component of the tax applies only to the first $106 800 of earned income in 2011. This is ameliorated somewhat, however, because since 1994 there has been no taxable maximum on the Medicare component. Progressivity is increased by the ACA, which raises the Medicare tax by 0.9% for individuals earning more than $200 000, and married couples earning more than $250 000, in 2013. In addition, it imposes an additional 3.8% tax on unearned (mainly, investment) income for these wealthier Americans.
Part B is funded by two sources. Premiums, which are paid monthly by beneficiaries as deductions from their Social Security cheques, cover 25% of total revenue. The remaining amount is paid by general federal revenues. In 2012, the premium for most beneficiaries was $99.90 per month. Those with incomes above $85 000 (individual) or $170 000 (family) pay more on a sliding scale.
The Supplementary Medicare Insurance (Part B) Trust Fund’s adequacy is not of great significance because each year, Part B premiums and general revenues are re-set so as to meet projected expenses. In contrast, with regard

Health systems in transition United States of America 117
to the Hospital Insurance (Part A) Trust Fund, each year the Board of Trustees reports on the solvency of the Fund, going 75 years into the future. In their 2012 report, the trustees indicated that the Trust Fund was projected to be depleted in 2024. Nevertheless, the report noted that the future solvency of the Trust Fund depends heavily on how successful Medicare is in controlling future expenditures (Boards of Trustees, 2012). It should be recognized, however, that even if the Trust Fund becomes depleted, the amount of the deficit will be relatively small in the short run, giving Congress time to adjust benefits downwards or revenue upwards.
The funding sources for Part C are the same as noted earlier for Parts A and B. Some companies charge a premium in addition to the Part B premium, but others do not. On average, in 2011 the monthly premium for Part C plans covering prescription drugs was $39, in addition to the Part B premium (the latter of which is usually required for Part C coverage) (Kaiser Family Foundation, 2011d).
Similar to Part B, Part D is subsidized through general federal revenues, which pay for 74.5% of programme costs. Most of the remainder of the funding comes from beneficiary premiums. The federal government also contributes towards the premiums and cost-sharing requirements of low-income Medicare beneficiaries. While there is not a Trust Fund per se for Part D, there is a
“Part D account” that is under the purview of the Board of Trustees.
3.3.3 Pooling of funds and risk
Funds flow from collection agencies to pooling agencies in a variety of ways. The techniques employed for the pooling of funds vary widely across the numerous subsystems in the United States: Medicare, Medicaid, employer-based insurance, the VA, the independent insurance market, etc. Financial resources flow from collection agencies to pooling agencies but, depending on the subsystem, this may involve, for example, transfers from a taxing agency to a public statutory programme or from individuals to a private insurance company. Risk pooling is defined here as the formation of a group so that the costs of individual health risks can be shared among everyone in the group. In certain United States subsystems there is little pooling of risk at all (individual insurance market), while in others it can be substantial (Medicare). This is because private insurers generally use experience rating, where different groups and individuals are charged premiums based on their expected costs (based on
Health systems in transition United States of America118
the individual’s health status), while Medicare charges the same premiums to everyone (except for some of the very wealthy, who pay more, and the poor, who are subsidized) irrespective of health status and costs.
There are separate Trust Funds for Parts A and B to pool revenue. In considering the Trust Funds, it is necessary to understand that Medicare, in the same way as Social Security, is funded on a “pay-as-you-go” basis – which is typical in social insurance programmes worldwide. That is, contributions made by workers and their employers are not earmarked for the workers themselves but instead are used to pay for the expenses associated with current retirees. It is, in essence, an intergenerational transfer. Technically, though, all contributions are directed to the trust funds and all payments are made from the trust funds.
Medicare Part A funds are pooled into the Hospital Insurance Trust Fund from the 2.9% mandatory payroll tax paid by employers and employees (1.45% each). These funds pay for hospital services for all Medicare enrollees. There are no premiums for enrollees and cost-sharing for covered services is uniform across enrollees regardless of age, health status, gender or use of past health services. Part B and D funds are pooled at the level of general federal revenues in the Supplementary Medical Trust Fund programme. Part B premiums and cost-sharing are equivalent for all enrollees except for those with the highest incomes. For Medicare Advantage (Part C), financial resources flow from the government, which is the principal collection agency, to private insurance companies that sell insurance and pool funds. Payment to Part C plans from the government are capitated and risk-adjusted based on beneficiaries’ health conditions, dual-eligible status, disability eligibility status and institutional status. The insurance company collects any premiums charged from the individual Medicare beneficiary while the co-payment and deductible may go directly to the provider to offset charges billed to the private insurer. Pooling for Part D is similar to Part C in that general revenue funds are paid to private health plans on a capitated risk-adjusted basis. Enrollees pay premiums with the amount dependent upon the number and type of drugs they take as well as where they live.
3.3.4 Purchasing and purchaser–provider relations
The role of purchasing and purchaser–provider relations in Medicare depends on whether a Medicare beneficiary belongs to the traditional (FFS) Medicare system or is in a Medicare Advantage plan, most of which rely on managed care.

Health systems in transition United States of America 119
Since the passage of the ACA, CMS has also begun contracting with teams of providers to coordinate care in the hope of improving quality and reducing costs. These groups are called ACOs and are discussed further in Box 3.3.
Traditional Medicare An unusual aspect of the physician payment system regards the “assignment” of services. Physicians can choose to accept assignment for all services, or alternatively, to do so on a selective basis. For assigned services, Medicare pays its share (generally, 80% of the Medicare fee after the patient meets a small annual deductible) directly to the physician, which removes the risk of default on most of the bill. In return, the physician agrees to accept the Medicare fee schedule amount as payment in full for the service. For non-assigned services, Medicare pays its share directly to the patient, and as a result, the physician needs to collect his or her entire bill from the patient. The advantage to the physician is that he or she is allowed to bill the patient up to 15% more than the amount for the service as specified by the Medicare fee schedule.
Medicare has made it advantageous to physicians to become “participating providers”, in which they agree to accept all services on assignment. Incentives to do so include 5% more in reimbursement from Medicare, being listed in a national directory of participating physicians and faster claims payments. In response to these incentives, overtime assignment rates have risen from 50% from the mid-1960s to the 1980s to almost 100%, mainly because almost all physicians have chosen to become participating physicians (Medicare Payment Advisory Commission, 2011a).
Medicare Advantage Under Medicare Advantage (Part C) and Part D, the Medicare programme contracts with insurers and managed care companies to provide benefits to programme beneficiaries. For Part C, the CMS contracts with health plans to provide managed health-care coverage for all Part A and Part B services as well as other services not generally covered by traditional Medicare. Rates are not negotiated between the government and Medicare Advantage plans. Rather, the plans provide bids for counties that they wish to serve. The federal government establishes a “benchmark” that is a dollar amount. It is based on a number of factors including the cost of providing services under traditional Medicare in a specific county. For bids over the benchmark,4 enrollees pay the difference in premiums. If the bid is lower than the benchmark, Medicare takes 25% of the difference with the remaining 75% allocated to the plan. The plan can either provide rebates to enrollees or, more commonly, enhance
4 For a discussion of how the benchmark is set and policy issues surrounding it, see Health Affairs (2011).

Health systems in transition United States of America120
benefits (Kaiser Family Foundation, 2010d). Part C plans are required by CMS to provide additional services in an amount equal to any excess remaining in their plans for the contract year and to return any remaining funds to the Medicare Trust Fund.
3.4 Medicaid
Unlike Medicare, which is available to nearly all individuals aged 65 and older, Medicaid is a means-tested programme. It is designed to provide health insurance for those with the lowest income levels and fewest assets, the disabled, and to poor seniors with Medicare coverage, as well as the disabled and seniors who have exhausted their financial resources, often as a result of very high long-term care expenses. Medicaid is a key resource for some of the poorest and sickest Americans.
Medicaid programmes are state based, but they are funded jointly by the states and the federal government. In return for federal dollars, states are required to meet certain federal government standards. Participation by the
Box 3.3Accountable Care Organizations
While some integrated delivery systems exist in the United States, most public and private purchasers pay physicians, hospitals and other providers separately for services to a patient. Often the care delivered is not coordinated across providers creating inefficiencies, increasing costs and reducing quality. Accountable Care Organizations (ACOs) are health-care providers that may be independent organizations but work in concert to improve patients’ health and reduce costs. These organizations may, for example, share a patient’s medical records to ensure that care is coordinated, duplication of services and tests is avoided, and that prescription drug interactions are not harmful. Care is coordinated across a range of settings, from doctors’ offices to hospitals and long-term residential care facilities. Individual providers and organizations that participate are rewarded by public and private purchasers with part of the savings that may accrue through improvements in coordination and quality of care. Under the Medicare shared savings programme for ACOs established by the ACA, Medicare is able to contract with ACOs. Patients who receive most of their care from providers in an ACO are assigned to that ACO to allow CMS to establish the patient population that providers will be “accountable” for. Utilization, cost and quality performance of an ACO will be measured and reported publicly so that patients may monitor them and providers will be held to minimum quality standards in order to continue participation. In Medicare alone, the Congressional Budget Office estimates ACOs will save $5 billion dollars during the first eight years. ACO success in Medicare is likely to engender wider adoption by private payers and Medicaid (Health Affairs, 2010).
Health systems in transition United States of America 121
states is voluntary, though historically all the states have chosen to participate. Services are largely purchased from the private sector. This section of the chapter also includes information about CHIP, a coverage programme for children in families whose incomes exceed Medicaid eligibility limits but who do not have private coverage.
3.4.1 Coverage5
Breadth of coverage Medicaid covers several distinct population groups. The breadth of coverage varies across states according to these population groups.
The main groups covered by Medicaid are:• low-income children• low-income pregnant women• low-income disabled persons• low-income senior citizens• low-income parents of dependent children.
For adults, in some states not only are there income restrictions but also asset limitations that can preclude eligibility. Even more significantly, currently Medicaid does not generally provide coverage to low-income adults who do not care for dependent children.
Medicaid eligibility requirements have been liberalized over the years. Originally, to be eligible for Medicaid, it was necessary to also be receiving cash assistance payments (often connoted as “welfare”). This is no longer true, as states have expanded eligibility to other groups and those with higher incomes, taking advantage of federal government matching funds to provide further assistance to their residents.
Compared to Medicare, Medicaid covers roughly 10 million more Americans (a total of 60 million), including 45% of Americans with incomes below the poverty level. As noted, the breadth of coverage varies considerably by eligibility group. Children and pregnant women have the most liberal eligibility requirements. States are required to cover pregnant women and children up to the age of 6 if their incomes are at or below 138% of the Federal Poverty Level (FPL), and children aged 6–18 up to 100% of the FPL. (In 2011, the federal
5 Unless otherwise noted, factual information in section 3.4.1 was obtained from: Kaiser Family Foundation Medicaid: A Primer, June 2010. Washington, DC: Kaiser Family Foundation. http://www.kff.org/medicaid/upload/7334-04.pdf (Kaiser Family Foundation, 2013c).

Health systems in transition United States of America122
poverty level was $11 179 for a single individual and $23 050 for a family of four.) Many states employ even higher thresholds. When combined with CHIP coverage, the median state provides coverage to children up to 235% of the FPL, and pregnant women up to 185%. Arguably, then, coverage of pregnant women and children is quite broad. To illustrate the critical role that Medicaid plays for pregnant women, the programme pays for 42% of all births in the United States.
Coverage is somewhat narrower for seniors and the disabled, however, with eligibility mandated up to 75% of the FPL. It should be considered, however, that most of these people have Medicare coverage as well, so Medicaid is providing them with supplementary insurance that covers Medicare’s co-payments and some uncovered services, especially long-term care. Nevertheless, lower-income Medicare beneficiaries who are not eligible for Medicaid coverage usually do not have access to other forms of supplemental insurance coverage, and therefore are at financial risk associated with Medicare’s co-payments as well as services not covered by the programme.
With respect to one particular disabled population of note – those with HIV or AIDS – Medicaid provides coverage for 40% of this population. To be eligible, one must not only be disabled through HIV / AIDS, but also have an income that is low enough to qualify. Of particular importance is the programme’s coverage of anti-viral drugs. However, despite Medicaid coverage for this vulnerable population, HIV / AIDS care constitutes less than 2% of the total programme expenditures (Kaiser Family Foundation, 2009).
Low-income parents of dependent children face the most stringent eligibility requirements. The median state covers working parents only up to 64% of the FPL, and eight states cover them only if their incomes are below 30% – with Arkansas providing such coverage only up to 17% of the FPL (that is, an annual income even as low as $2000 would disqualify an individual from coverage in that state). In contrast, eight states cover these adults at 180% or higher of the FPL, taking advantage of the joint funding by the federal government. This illustrates the large variation in breadth of coverage that currently exists between states.
Putting all this together gives a picture of the overall breadth of Medicaid (and for children, CHIP) coverage. Fig. 3.4 shows health insurance coverage by income level in 2011. While it is not surprising that employer coverage is lowest and Medicaid coverage highest for those with lower incomes, what stands out is the high uninsurance rates. More than one-third of Americans with incomes below the poverty level are uninsured. The numbers stay quite high for those

Health systems in transition United States of America 123
close to poverty: 23% of those with incomes between one and two times the FPL are insured, as are 9% of people with incomes between two and three times the FPL.
Fig. 3.4Health insurance coverage by poverty level, 2011
Source: Kaiser Family Foundation, 2013b.Note: Columns may not add to 100% due to rounding error.
Another way to view this is to focus on the type of person rather than the income. Fig. 3.5 examines low-income children and their parents. Compared to their parents, children’s coverage by Medicaid is far broader, with 70% of poor children covered by the programme in 2012. Among adults without children, who were generally not eligible for Medicaid before passage of the ACA, a remarkably high proportion of those below the poverty level – 47% – lacked health insurance.
0
20
40
60
80
100
400%+ FPL200–399% FPL100–199% FPL<100% FPL
Uninsured
Medicaid/Other public
Employer/Other private
42%
34%
24%
37%
23%
41%
19%
9%
73%
6%
4%
90%
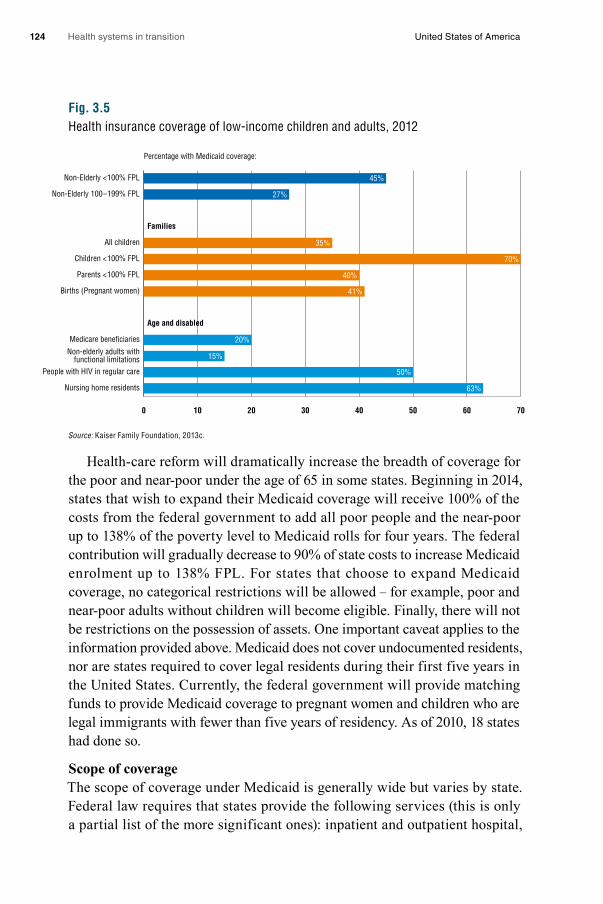
Health systems in transition United States of America124
Fig. 3.5Health insurance coverage of low-income children and adults, 2012
Source: Kaiser Family Foundation, 2013c.
Health-care reform will dramatically increase the breadth of coverage for the poor and near-poor under the age of 65 in some states. Beginning in 2014, states that wish to expand their Medicaid coverage will receive 100% of the costs from the federal government to add all poor people and the near-poor up to 138% of the poverty level to Medicaid rolls for four years. The federal contribution will gradually decrease to 90% of state costs to increase Medicaid enrolment up to 138% FPL. For states that choose to expand Medicaid coverage, no categorical restrictions will be allowed – for example, poor and near-poor adults without children will become eligible. Finally, there will not be restrictions on the possession of assets. One important caveat applies to the information provided above. Medicaid does not cover undocumented residents, nor are states required to cover legal residents during their first five years in the United States. Currently, the federal government will provide matching funds to provide Medicaid coverage to pregnant women and children who are legal immigrants with fewer than five years of residency. As of 2010, 18 states had done so.
Scope of coverage The scope of coverage under Medicaid is generally wide but varies by state. Federal law requires that states provide the following services (this is only a partial list of the more significant ones): inpatient and outpatient hospital,
Percentage with Medicaid coverage:
0 10 20 30 40 50 60 70
Nursing home residents
People with HIV in regular care
Non-elderly adults withfunctional limitations
Medicare beneficiaries
Age and disabled
Births (Pregnant women)
Parents <100% FPL
Children <100% FPL
All children
Families
Non-Elderly 100–199% FPL
Non-Elderly <100% FPL 45%
27%
35%
70%
40%
41%
20%
15%
50%
63%
Health systems in transition United States of America 125
physician, nurse practitioner, laboratory and radiology, nursing home and home health care for those aged 21 and older, health screening for those under age 21, family planning, and transportation.
Other services are optional for states. This designation means that if a state chooses to cover the service, it will receive matching funds from the federal government. Optional services include some major services such as prescription drugs and dental care, but also such things as care provided by professionals besides physicians and nurse practitioners, durable medical equipment, glasses, rehabilitation, various types of institutional care, home and community-based services, personal care services, and hospice care.6
While technically “optional”, many of these services are covered to some extent by the states. All states, for example, provide some prescription drug coverage. Many states limit the number or type of services, as discussed below. It is estimated that 30% of Medicaid spending is for these optional services (Kaiser Family Foundation, 2005).
Depth of coverageIt is difficult to summarize Medicaid’s depth of coverage, except to say that as like most aspects of the programme, it varies considerably by state and by population group. On the one hand coverage is deep in that a large majority of health-care expenses are covered by the programme, with enrollee cost-sharing requirements generally kept low – albeit rising as states seek ways to reduce utilization and raise revenue. On the other hand, coverage is often not deep in three meaningful ways: (1) recently, states have been able to impose premiums and non-trivial cost-sharing requirements on some Medicaid beneficiaries; (2) states often put restrictions on the number of services and / or types that are covered; and (3) access to private practising physicians is often limited, meaning that enrollees must seek care from public facilities or clinics.
While it was noted that cost-sharing for patients is generally low, federal government rules, as specified in the Deficit Reduction Act of 2005 and the Tax Relief and Health Care Act of 2006, are complex and for some groups there can be considerable cost-sharing. (Previously, premiums were prohibited and cost-sharing, if any, had to be “nominal”.) As noted by one observer, the result of this legislation “is a confusing array of rules that provide for different treatment based on a beneficiary’s income, Medicaid coverage category, and the type of services being provided” (Solomon, 2007). Essentially, the legislation allows
6 An interactive web site that indicates which optional services are offered by which states can be found at: http://medicaidbenefits.kff.org/

Health systems in transition United States of America126
states to tailor Medicaid benefits in a way that is akin to private insurance, where premiums and cost-sharing are the norm (Centers for Medicare & Medicaid Services, 2008).
As shown in Table 3.11, premiums are not allowed for children and adults below 150% of the FPL, but are allowed for those with higher incomes (Solomon, 2007). Cost-sharing is generally not required for children below 138% of the FPL, and adults below 100%. States are allowed to impose cost-sharing up to 10% of most services for other children and adults up to 150% of the FPL, and up to 20% for those above 150% of the FPL. When allowed, many states have raised premiums and cost-sharing for higher-income eligibles in recent years as a result of severe budget shortfalls. It is noteworthy, however, that premiums and cost-sharing cannot exceed 5% of family income (Solomon, 2007).
Table 3.11Cost-sharing and premium rules in Medicaid
Cost-sharing and premiums for children
Mandatory (under 6 years) with income < 133% of
the poverty line; 6–17 years < 100%
Other children – income to 150% of the poverty line
Income >150%of the poverty line
Most services Not allowed Up to 10% of the cost of the service
Up to 20% of the cost of the service
Prescription drugs Nominal for non-preferred; 0 for preferred
Nominal for non-preferred Up to 20% of the cost for non-preferred
Non-emergency use of ER Nominal Two times nominal Any amount
Enforceability of co-payments No Yes Yes
Premiums Not allowed Not allowed Allowed
Cost-sharing and premiums for non-exempt adults
Income < 100% of the poverty line
Income 100–150% of the poverty line
Income >150% of the poverty line
Most services Nominal cost-sharing Up to 10% of the cost of the service
Up to 20% of the cost of the service
Prescription drugs Nominal cost-sharing Nominal cost-sharing Up to 20% of the cost of the drug for non-preferred
Non-emergency use of ER Nominal cost-sharing Two times nominal No limit
Enforceability of co-payments No Yes Yes
Premiums Not allowed Not allowed Allowed
Source: Solomon, 2007.
It was noted earlier that there are a number of mandatory services covered by Medicaid, including inpatient and outpatient hospital and physician care (a full list of required services in 2012 is available on Medicaid’s web site). States are, however, allowed to set limits to the number of such services provided, for
Health systems in transition United States of America 127
both mandatory and optional services – a marked difference between Medicare and most private insurance policies provided through employment. These can significantly reduce the depth of coverage under the programme. In 2008, for example, there were at least eight states that limited physician visits to 12 or fewer per year (derived from Kaiser Family Foundation’s Online Database). Similarly, many states limit the number of prescriptions that can be filled; a typical limit is 4–6 per month depending on the state.
Finally, because Medicaid provider payments are low compared to other insurance, access to care in physicians’ offices has been problematic, a situation that has existed since the programme’s inception. (Provider payment is discussed in more detail in section 3.7.) In 2003, Medicaid physician fees, on average, were only 69% as high as Medicare’s, which in turn tended to be lower than those paid by private insurers (Zuckerman et al., 2004a). This should change on implementation of the ACA in 2013 when Medicaid payment rates to primary care physicians are required to meet Medicare’s level at least for the first two years of the programme.
Low physician payment rates puts patients with Medicaid at a distinct disadvantage in obtaining care from privately practising office-based physicians. Only about 60% of physicians accept all or most Medicaid patients who seek care; primary care physicians accept only slightly more than half (Zuckerman et al., 2004a).
One development with the potential to provide more mainstream access to physician office care is the movement towards the use of managed care in the Medicaid programme. Over 70% of Medicaid beneficiaries are in managed care plans. While the exact nature of these arrangements varies both between and within states, they may include capitation (rather than FFS) for providers and / or primary care case management. An important recent development is the use of managed care not only for pregnant women and children, but also for those with chronic diseases and those who are jointly covered by Medicare and Medicaid. States often prefer managed care as a means of both enhancing quality and controlling costs, and are likely to rely on it as the programme expands through provisions in the ACA. It is key, however, that capitation rates paid to managed care organizations be sufficient to provide high quality care with access to physician offices (Kaiser Family Foundation, 2010f).
Health systems in transition United States of America128
3.4.2 Revenue collection7
Medicaid is financed jointly between the federal and state governments. In general, both finance their shares from general revenues – mainly taxes. Unlike Parts A and B of Medicare, there is no Trust Fund dedicated to the programme’s financing.
In 2009, total Medicaid expenditures were $374 billion – about three-quarters of the $502 billion spent on Medicare (Centers for Medicare & Medicaid Services, 2012a, Table 3) and 15% of total health expenditures in the United States. Medicaid constitutes about 7% of the federal government budget and 16% of state spending. The only state budget component with a larger share is elementary and secondary education, which constitutes roughly twice the share (35%) of total state spending.
About 60% of total Medicaid spending is devoted to acute care, and 40% to long-term care. Of note is the fact that while only 25% of enrollees are senior citizens or the disabled, they account for two-thirds of programme spending. In fact, average spending for a disabled enrollee ($14 481 in 2007) or a senior ($12 499) exceeded spending for children ($2135) and non-elderly adults ($2541) by about five-fold.
3.4.3 Pooling of funds and risk
Some of the more general issues surrounding the pooling of funds in the United States health-care system were discussed in section 3.3.3. Currently, the main pooling activity that occurs in Medicaid is through the Federal Medical Assistance Percentage (FMAP) formula, which allots a greater proportion of federal government dollars to states with lower per capita incomes.
The formula by which states’ respective shares of federal Medicaid monies is divided up is called the FMAP. The following formulas are used:• Federal share: 1–0.45 x (state per capita income / United States per capita
income).• State share: 0.45 x (state per capita income / United States per capita
income).
Thus, states where per capita income is at the national average will receive 55%. By law, no state pays more than 50%, with the poorest state receiving about 76%. On average, the federal government share is 57%.
7 Unless otherwise noted, factual information in section 3.4.2 was obtained from: National Health Policy Forum (2008, 2011).

Health systems in transition United States of America 129
The above formula is applicable to most Medicaid expenditures for medical services. Some services, and administrative costs, are determined by separate laws. Administrative costs, for example, are split 50 / 50 between the federal and state government irrespective of the state’s per capita income.
A perennial issue surrounding the FMAP formula is that it does not respond to the counter-cyclical nature of Medicaid. When there is an economic downturn, state revenues fall. This is problematic for states in several ways:• Since the formula is in part based on national income, if all states have
declining per capita income during a recession, they will not, on average, receive higher federal government contributions.
• During such an economic downturn, unemployment rises, which means Medicaid eligibility (and therefore costs) also rises.
• The formula is based on past rather than current per capita income. For example, the 2010 FMAP was based on incomes during 2005, 2006 and 2007. States in which economies were growing during that period would have received a smaller federal government match in 2010, even if they suffered more from the recession.
Issues surrounding the pooling of funds, specifically the size and content of Medicaid budgets, can lead to negotiations between the federal government and individual states. For example, the state of Massachusetts negotiated a waiver from the federal government so that it could fund programmes for low-income citizens. To receive this waiver Massachusetts had to demonstrate that more people would benefit than under the national Medicaid standards. Massachusetts has used the federal money designated for Medicaid programmes in that state to provide over one million low-income children, families and individuals with affordable insurance coverage through MassHealth and Commonwealth Care, the subsidized premium assistance programme for the poor.
3.4.4 Purchasing and purchaser–provider relations
Since Medicaid programme reimbursement and other features vary considerably across states, it is difficult to generalize about purchaser–provider relations under the programme. Moreover, as with Medicare, the nature of these relationships is different depending on whether a patient is in a FFS system or in a Medicaid managed care programme.
As noted above, 70% of Medicaid beneficiaries are in managed care. Two types of managed care models predominate in the Medicaid managed care market: risk programmes and primary care case management. For risk
Health systems in transition United States of America130
programmes, Medicaid state agencies contract with health plans to provide or arrange for the provision of an agreed upon set of services in exchange for a capitated amount per enrollee. The contractor assumes the financial risk for providing care to Medicaid enrollees. Contractors participating in risk programmes include MCOs and prepaid health plans (PHPs). MCOs contract to provide a comprehensive set of benefits that include inpatient hospitalization plus some additional services (e.g. outpatient, home health). PHPs are risk contractors providing less comprehensive coverage and include prepaid inpatient health plans and prepaid ambulatory health plans (i.e. inpatient services not covered). In primary care case management programmes, primary care providers are assigned the responsibility for Medicaid enrollee care but do not typically assume any financial risk for providing care to beneficiaries. The specified provider receives payment on a FFS basis plus a monthly case management fee (Kaye, 2005).
3.5 Private health insurance
This section focuses mainly on employer-group insurance but also covers individual insurance. It begins with a discussion of the market role and size of the private insurance sector, and then discusses market structure, market conduct and selected public policy issues.
3.5.1 Market role and size
In 2010, 165 million Americans aged 0–64 were covered by private insurance, 90% (150 million) of whom had employer-sponsored coverage, with the remainder – the self-employed – purchasing it individually and generally without subsidy. (By comparison, total enrolment in Medicare was about 46 million and in Medicaid, about 44 million for those under age 65.) In spite of these numbers, expenditures on private health insurance are lower than those of government-sponsored programmes. The former comprise 35% of total national expenditures, far less than the 49% from Medicare and Medicaid (U.S. Department of Health and Human Services, 2010c, Table 126). This is because, in serving a working-age population, per capita expenditures tend to be much lower than for Medicare, which serves the over-65 population and the disabled, and for Medicaid, which while it does serve younger people, also provides nursing home care to seniors and has the disabled among its beneficiaries. In fact, about two-thirds of Medicaid spending is for senior citizens.

Health systems in transition United States of America 131
Perhaps the clearest way to illustrate the gaps in the scope of coverage is by examining the characteristics of the uninsured. In 2009, 18.9% of the population under the age of 65 did not have any health insurance coverage, an increase from 17.0% in 2000. This proportion, however, is not evenly distributed among population subgroups. Subgroups with the highest uninsurance rates include (U.S. Department of Health and Human Services, 2010c, Table 138):• Ages 18–24: 29.6%• Ages 25–34: 27.8%• Hispanic or Latino: 32.9%• Below federal poverty level: 30.4%• 100–199% poverty level: 29.8%
The number that may be most surprising is that over 30% of those with incomes below the poverty level are uninsured, meaning they do not get Medicaid. As described in section 3.4, several population groups, particularly adults, are not eligible either because they do not have dependent children, or because they have incomes too high to qualify for Medicaid in their states.
These patterns illustrate several barriers in obtaining employer-sponsored private coverage. Firstly, it is necessary to be employed or be a family member of someone employed. The current labour force participation rate in the United States is about 64%, although many of those not in the labour force can receive coverage from a family member (Bureau of Labor Statistics, 2011, Table A-1). Secondly, the employer has to offer coverage; that is completely voluntary on the part of the employer. Only 68% of firms with 3 –199 employees offer coverage, compared to over 99% with 200 employees or more.8 Thirdly, if coverage is offered, the employee has to be eligible for it. Overall, this is true on average, for about 80% of employees. Nevertheless, part-time employees (often young adults) are offered coverage by only 25% of firms. And fourthly, even if eligible, the employee has to be willing to pay the employee’s share of the premiums, which as noted below can be considerable. So-called “take-up rates” – defined as the percentage of employees that are offered coverage by their employers who actually purchase it – average around 75–80% (Kaiser Family Foundation and Health Research and Educational Trust, 2010). To reiterate, all four of the above are necessary for a person to obtain employer-sponsored coverage.
8 The 68% offer rate in 2010 for firms with fewer than 200 employees was far higher than the previous year’s figure of 59%; it should be viewed with caution.

Health systems in transition United States of America132
It is the people who are better off economically who are able to meet the four conditions mentioned above. They are more likely to be employed or have a family member who is in a firm that offers coverage, have an employment arrangement (e.g. full-time work) that results in coverage, and be able to afford their share of premiums. To illustrate, 84% of working-age Americans earning four or more times the poverty level, compared to 33% of those with incomes between one and two times the poverty level, possess it (U.S. Department of Health and Human Services, 2010c, Table 136).
Individuals and families without an entry into the employer insurance market, and who are not eligible for Medicare and Medicaid, often seek coverage individually. Individual coverage, however, has several disadvantages over employer-group coverage and therefore would normally be purchased only if the alternative is unavailable. It is usually unsubsidized; administrative costs tend to be high (25 – 40%); health examinations are often necessary; cost-sharing requirements are, on average, higher; fewer types of services tend to be covered (e.g. maternity care may be excluded); and frequently the insured person is put in an actuarial group characterized by poor or uncertain health (Whitmore et al., 2011).
Finally, a number of factors drive the demand for coverage, including the size of the employed population and subsidies available to employers to provide coverage. One of the main drivers is the cost of insurance. As health-care costs rise, insurance becomes more costly to both the employer and the employee, depressing both offer and take-up rates. Moreover, coverage becomes less comprehensive through increases in patient cost-sharing requirements. Kronick & Gilmer (1999) concluded that declines in employer-sponsored coverage were due almost entirely to the fact that per capita health spending rose more quickly than personal income.
Another driver is the changing nature of employment in the United States and in particular, the gradual decline in manufacturing jobs and the increase in retail jobs – as well as the move from larger to smaller employers and full-time to part-time jobs. One result was fewer workers in unions, and traditionally, those in unions are more likely to have health insurance (Swartz, 2006).
3.5.2 Market structure
Some employers, particularly larger ones, offer a choice of health insurance products to their employees. Among firms offering a choice, only 19% of employees nationally can choose among three or more plans (California HealthCare Foundation, 2009). For federal government employees, however,

Health systems in transition United States of America 133
there can be dozens of choices. Generally, firms hold an open enrolment period prior to the beginning of the year. In the United States the term open enrolment refers to the period of time when employees can switch to a different plan irrespective of their health history or status.
The most common arrangement offered by employers is a PPO. Among firms with 200 or more employees, 83% offer one or more PPO choices, compared to 32% that offer one or more HMO plans. Of these employers 25% offer a point-of-service plan, and 15% a high-deductible plan. Not surprisingly, then, actual enrolment is highest in PPOs. Among all covered workers, in 2010 58% were enrolled in PPOs, 19% in HMOs, 8% in point-of-service plans, 13% in high-deductible plans, and only 1% in conventional insurance (traditional FFS) plans (Kaiser Family Foundation and Health Research and Educational Trust, 2010).
The biggest change in recent years has been the relatively rapid rise of high-deductible plans with a savings option, many of which are classified as Health Savings Accounts (HSAs). Legislation encouraging their adoption was approved during the administration of President George W. Bush. In HSAs, the policy-holder agrees to purchase insurance with a high deductible (currently averaging about $2000 annually for individual coverage and twice that for family coverage). Premium contributions can be made by the individual and / or employer. These contributions are tax deductible, can accumulate year to year if unspent and therefore can be used for future medical expense. They can be withdrawn to pay for eligible medical care.9
Advocates claim that they encourage people to purchase coverage that protects against major rather than minor expenses, the latter of which need not be insured. (Most HSAs provide first-dollar coverage for preventive services (Council for Affordable Health Insurance, 2009).) This, in turn, makes their premiums lower and therefore more affordable. Detractors suggest that they favour the young, healthy and wealthy (who can afford the large deductible). While evidence is conflicting, most studies have found that HSAs and other kinds of “consumer directed” health insurance products experience favourable
9 After the age of 65, money can be withdrawn without penalty and therefore can be used for non-medical expenses. However, in such a case, the person has to pay income tax on the amount of money withdrawn.
Health systems in transition United States of America134
selection10 (Lo Sasso, Shah & Frogner, 2010). This is problematic in two ways. Firstly, those whose behaviour could be most affected by the cost-containment potential of HSAs will be less likely to enrol in them. And secondly, to the extent that they experience favourable selection, other insurers will obtain a less healthy mix of patients. HSAs will still exist under the ACA, as the lowest of the benefit packages allowed, called “Bronze”, contains the same OOP maximum spending restrictions as do HSAs.
As employment is the cornerstone for United States health care, employers generally subsidize not only the employees’ coverage but also family members. Often, however, the subsidy for family members is smaller. One of the earliest provisions of the ACA, which went into effect in 2011, was to require employers offering this coverage to include children up to the age of 26 (rather than the previous limit, age 23).
Employers finance health insurance in different ways and this will not change markedly with the passage of the ACA. They collect funds directly or indirectly from employees through the premiums they charge, and augment these funds with their own to pay for health care. This is typically done in one of two ways.
Firstly, employers may act as direct agents for their employees and seek out health insurance coverage for those whom they deem eligible. This places the risk on the insurer if health expenses are higher than anticipated. In this case employers pay for all or part of the cost of the insurance policy they purchase for their employees and pass on the remainder, in the form of premiums, to employees. Today, there is no regulation that governs the proportion of the cost of insurance to be paid by the employer and the employee. The ACA provides an incentive for employers to ensure that the premium passed on to the employee does not constitute more than 9% or 10% of the employee’s income. If it amounts to more, large employers will incur obligations to offer the employee a voucher towards the purchase of an insurance policy on the state exchange or a penalty will be imposed.
10 “Selection bias” is a major issue in the United States insurance market. There are two types of bias: favourable selection and adverse selection. These are defined from the perspective of the insurer, that is, when there is favourable selection the insurer enjoys healthier enrollees, and conversely, with adverse selection their enrollees are less healthy. The terms are commonly used, however, in two very different ways. One just compares the health status or expected expenditures of enrollees vs non-enrollees. The other is somewhat more nuanced, with adverse selection implying that there are differences in health status or expected expenditures that the insurer cannot detect. This implies that they will lose (or make less) money in the presence of adverse selection because they will price their product too conservatively.

Health systems in transition United States of America 135
Secondly, employers may choose to self-insure. This means that they pay for the health care for their employees and purchase services for them directly, rather than purchasing a health insurance policy from a health insurance company. In addition, however, they contract with an insurance company to carry out administrative tasks such as claims processing, provider payment and utilization management. In that role insurers are often called “third party administrators” providing “administrative services only”. Rather than bear the entire risk, many of them also purchase reinsurance or some other form of stop-loss coverage that limits the employer’s liability if, in a particular year, employer medical expenses are higher than anticipated. In 2010 about 59% of those with employer-based insurance were in self-insured plans (Employee Benefit Research Institute, 2009.)
There are several advantages to self-insuring: it makes the firm less subject to state mandates (e.g. covering particular services) because self-insured firms are subject to the federal ERISA rather than state regulations; state taxes (on premiums and state high-risk insurance pools) are typically lower; premiums do not have to be paid in advance; and with less money going to insurance companies, administrative expenses are lower. The main determinant of self-insuring is firm size, which relates to how well a firm could afford unexpected medical losses and take advantage of the laws of large numbers. While only 12% of firms with 3–199 employees are self-insured, it is true of 88% of those with 5000 or more employees. Small firms generally do not self-insure because they do not want to be at risk if one or more employees have extremely expensive illnesses. Moreover, firms of that size usually do not have sophisticated human resources departments that can effectively negotiate such arrangements.
The self-insurance arrangement is an unusual feature of the United States system: much of the work of United States insurers does not entail taking on much risk but rather is purely administrative. Employers reimburse insurers for this administrative work even when they are self-insured.
Small businesses (up to 50 or 100 employees) have a much harder time, compared with large businesses, in providing health insurance for their employees at reasonable cost. It is harder to pool funds and reduce risks because with fewer workers the chance of incurring very high costs when a few employees fall ill is very great. For this reason 35 states in the United States have organized small business purchasing pools, which insured around 200 000 individuals in 2009 (National Conference of State Legislators, 2011). This type

Health systems in transition United States of America136
of pooling of small groups reduces the insurer’s risk and lowers the costs of insurance to small businesses, making it easier for them to provide insurance for their employees.
Similar to the small group market, pooling funds and reducing risk in the individual market has been difficult in the United States. Prior to the ACA, most states allowed insurers in the individual market to underwrite each applicant separately using information about their medical history and age. Insurers in the individual market were therefore able to select whom to cover and at what price, leaving many high-risk individuals without adequate or affordable coverage (Baicker & Dow, 2009).
Market share in health insurance is dominated by larger firms that generally market nationally. (Blue Cross Blue Shield Plans, while having a national presence, usually markets in individual states.) The top five firms (United-Health Group, Wellpoint, Aetna, Health Care Services Corporation and CIGNA) control about 50% of the market (Congressional Research Service, 2009). A study by the AMA concluded that in almost 95% of metropolitan areas in the United States, the health insurance market is highly concentrated (American Medical Association, 2007). Mainly as a result of mergers and acquisitions, enrolment for the two largest insurers in the country rose from 32 to 67 million between 2000 and 2007 (American Medical Association, 2007).
Market shares in the small group market (fewer than 50 employees) vary markedly by state. In 2008, the top insurance carrier controlled 21% of the private small group market in Arizona (PacifiCare Life Assurance Company) compared to 96% in Alabama (Blue Cross Blue Shield of Alabama); the average among all states was 47%. In just over half the states the five largest insurers controlled 90% of the small group insurance market. These market shares had increased over the previous six years, indicating a growing concentration of the small group market. For example, in 2002 the average market share of the top carrier in a state was 33%, but this had risen to 47% six years later (U.S. Government Accountability Office, 2009). Nationally, by far the most significant players were Blue Cross Blue Shield plans. Their total market share was 51% in 2008, up from 34% in 2002.

Health systems in transition United States of America 137
3.5.3 Market conduct
Nearly all health insurance products in the United States provide benefits in the form of service rather than cash. Although there are some policies that provide certain dollar benefits per day in hospital, or if a disease such as cancer is contracted, they are fringe products that constitute only a tiny fraction of the market.
Premium rating systems There are, in general, two ways in which insurers price their products: experience rating and community rating. Under experience rating, which is the most common technique used, insurers charge employers (or individuals) on the basis of past cost experiences or, when data is lacking, on predicted expenditures. In contrast, community rating entails charging the same amount to all groups (or even individuals). Sometimes community rating is adjusted so that, for example, everyone of a particular age is charged the same amount. As discussed in section 2.2.2, when commercial insurers entered the health insurance marketplace after the Second World War, they were able to use experience rating to attract younger and healthier groups from Blue Cross and Blue Shield plans, which were then forced to move to experience rating.
Many states require that insurers price their products within a rate band in the small employer market, for example around plus or minus 25% of the average premium charged (Families USA, 2011b). Insurers employ actuaries to determine what rates should be charged. While past health claims are perhaps the most important determinant of rates, other factors include the characteristics of the employees such as their age, gender, occupation, region where living and health habits. Since health insurance is a competitive business, the premiums charged by insurers are bound by competitive pressures. Other elements in the premium calculation besides expected medical expenses are a “risk premium” to account for uncertainty on the part of the insurers, administrative expenses and profits. One of the main ways in which premiums can be controlled is to employ larger co-payments or limitations on services covered. These topics are discussed below.
In the individual insurance market, premiums are generally experience rated. Each individual goes through medical underwriting to assess their risks. In general, there is no requirement that a person be offered insurance. In contrast, four states (Massachusetts, New York, New Jersey and Vermont) require community rating in the individual market – that is, they prohibit medical underwriting (Whitmore et al., 2011). This can lead, however, to higher average premiums and effectively discourages healthier individuals
Health systems in transition United States of America138
from entering the market because of the high cost of premiums. This occurred in New Jersey, which instituted a community-rating requirement in 1993. As a result, premiums rose as healthier people left the market. Within seven years, premiums had risen two-fold to three-fold, and enrolment had fallen by half (Monheit et al., 2004). This phenomenon is sometimes called a “premium death spiral”. As sicker people join the risk pool, premiums rise; as a result, many healthier people choose to leave the market because they can no longer afford the premiums.
An example of how adverse selection can lead to a “death spiral” involved a generous FFS option offered by United of California to its employees. Because of its liberal benefits, it was attractive to those in poorer health. As a result, for individual coverage, yearly premiums rose from $750 in 1993 to $17 000 in 2001. Premiums for family coverage exceeded $40 000 in 2001. By then, only a handful of members remained in the plan (Buchmueller, 1998).
Under the ACA, federal and state-based exchanges combined with the individual mandate to purchase insurance are intended to reduce adverse selection problems in the individual and small group market by requiring plans selling in exchanges to use community rating (older individuals can be charged more than younger but differences within age cohorts will be prohibited), rather than experience rating, and by increasing risk pooling to a far greater extent than has been the case in the past in the United States. Exchanges will also reduce or eliminate the need for individuals to purchase insurance through agents or brokers, whose fees can absorb 20% of the total premium during the first year of enrolment (Whitmore et al., 2011).
One of the key requirements of the ACA is that individuals purchase coverage or pay a penalty. Similarly, firms with more than 50 employees will also have to provide coverage or pay a penalty. These “sticks”, combined with the “carrots” of subsidies for individuals to purchase coverage, will, it is hoped, lead to a system in which community rating will be viable.
Risk adjustment Payments to insurers and health plans may be adjusted for differences in the risk characteristics of the population enrolled in coverage. Risk adjustment is designed to compensate insurers for the risks they assume and reduce their incentive to select enrollees based on risk, particularly when insurers are constrained in their ability to vary premiums by enrollee health status. Among employer-based plans, risk adjustment can be used to modify payments to insurers when firms offer multiple plan options. If, for example, a firm offers both low-cost and high-cost sharing plans, high utilizers of health care may

Health systems in transition United States of America 139
opt to enrol in the low-cost sharing plan. The low-cost sharing plan would have higher premiums than the high-cost sharing plan due to differences in the actuarial values between them. However, the premiums may not reflect the full effect of sicker employees enrolling in the low-cost sharing plan. Risk adjustment can therefore be used by a health plan to reallocate funds to adjust for selection in cases where premiums reflect differences in plan design but are unable to fully account for adverse selection (American Academy of Actuaries, 2010). However, despite evidence of adverse selection when employers offer multiple plans, formal risk adjustment is extremely rare in the employer-sponsored market. Possible reasons for the slow rate of adoption posited include: lack of available data, concern by firms about validity of risk-adjustment models and the prevalence of other mechanisms attempting to address biased selection in the market (Ellis, 2001). Unlike the employer-sponsored market, risk-adjustment payments are quite common among United States public purchasers. CMS uses risk adjustment in Medicare Advantage plans and Medicare Part D drug plans. Many state Medicaid programmes also make use of risk adjustment in payments to managed care organizations. Finally, under the ACA, plans sold in the individual and small group market will be subject to risk adjustment (American Academy of Actuaries, 2010).
Premiums and cost sharing There are significant user charges associated with private insurance. Beginning with premiums, the average cost of employer-based single coverage was $5049 in 2010, 18% of which, or $899, was paid by the employee. For family coverage (generally, employee, spouse and one or more children) 29%, or $3997, of the total cost of $13 770 was paid by the worker. The percentage of family coverage paid by the employee has risen considerably over the past decade – by 9.5% per year compared to 7.3% for the share paid by the employer. This is one of several examples of how employers have shifted more costs onto employees as health-care costs have risen. High-deductible plans with savings options, not surprisingly, have lower premiums than other plan types – about 12% less than HMOs and PPOs (Kaiser Family Foundation and Health Research and Educational Trust, 2010).
Employer plans also employ cost-sharing requirements, which also have been rising considerably over time (in part as a way to reduce premium increases). Beginning with annual deductibles and co-payments, among PPOs – the most common plan in use – 77% required a deductible in 2010, and among those, the average amount was $675 for individual coverage. Interestingly, deductibles in firms with 3–199 employees ($1146) were more than double those in large firms ($460). The percentage of employees in PPOs with a $1000 deductible
Health systems in transition United States of America140
rose from 12% to 22% from 2006 to 2010. Similarly, the median co-payment for a physician office visit was $20 in 2010, up from $15 six years earlier. For specialty physician visits it was $30, compared to $25 six years earlier (Kaiser Family Foundation and Health Research and Educational Trust, 2010).
As is the case in many high-income countries, there are often substantial co-payments for prescription drugs. In most employer-sponsored plans, there are multiple “tiers”, each of which has its own cost-sharing requirements. Their purpose is mainly to encourage the use of cheaper drugs, particularly generics, the use of which has grown substantially in recent years (see section 3.7 for more details).
One way in which employer coverage tends to be more generous than Medicare’s is that there is usually a limit on annual OOP expenditures. Over 80% of employer-sponsored health plans establish such a maximum. In 2010 the median OOP maximum for an employee with individual coverage was in the range $2000–2500. However, the actual situation is more complicated. Some employers do not include the deductible or co-payments in the OOP spending figure. Not surprisingly, for high-deductible plans it was much higher, with a medium of $3000 or more (Kaiser Family Foundation and Health Research and Educational Trust, 2010).
Premiums vary by age in the individual market. Nationally in 2007, a 55-year-old would pay about $5000 annually for PPO or point-of-service (POS) premiums, compared to about $1800 for a 25-year-old. Age differences in premiums generally do not exist in employer-sponsored coverage, which highlights the lack of cross-subsidization in the individual market. Deductibles are also much higher in the individual market. For those with a deductible in 2007, the average was over $2100 for individual coverage, about three times as high as in the employer-sponsored market (Whitmore et al., 2011).
Services covered As with most aspects of employer-sponsored coverage, it is difficult to generalize about particular service types. One reason is that while some states have strict rules on which services must be covered, many employers are not subject to these rules because they are self-insured. Further, national data are scarce regarding how common it is for particular services to be covered by employer-sponsored plans. One exception is a 2010 survey conducted by the firm Mercer, where it was found that nearly all firms offering coverage – 100% of large employers and 97% of small employers – offer coverage for prescription drugs. The figures are nearly as high (97% and 92%, respectively) for mental health and substance abuse benefits. There is, however, a marked difference

Health systems in transition United States of America 141
between large employers and small employers with respect to offering dental benefits. While 97% of large employers offer this coverage, it is true of only 72% of small employers (Mercer, 2010).
The federal government has also collected data on employer-based health plan coverage for the years 2008 and 2009 (U.S. Department of Health and Human Services, 2011d). The tabulations, however, are not very useful because they are unable to distinguish whether a service is not covered, or if, alternatively, it was covered but not mentioned in the plan materials that were examined by the researchers. To illustrate: 66% of employees are in plans that explicitly list that maternity care is a covered benefit, but for 33% of employees, whether it is covered is not mentioned. Similarly, 27% of employees are in plans in which it is mentioned that kidney dialysis is covered, but the other 73% may or may not have coverage; the service was not mentioned in the health plan’s materials one way or the other.
The tabulations are clear, however, that nearly all covered employees receive coverage for hospital, doctors’ offices and inpatient mental health care, and the vast majority for outpatient mental health care and emergency services. It should be kept in mind that there are often limits on coverage. To illustrate, the median co-payment for hospital admissions is $250; for doctors’ office visits, $20; and for emergency hospital visits, $100.
One thing that can limit the scope of coverage is utilization management activities (previously called utilization review). These include such activities as requiring prior permission to be hospitalized or obtain certain services; second opinions before obtaining reimbursable services; and retrospective reviews after services are already received. Some of these activities, it may be argued, have the potential to reduce unnecessary services, thereby enhancing the quality of care.
Perhaps the most notable difference between the individual and employer-sponsored markets concerns services covered. Only 43% in the individual market had coverage for maternity care, 62% for inpatient mental health care and 77% for outpatient mental health care. Similarly, coverage for chemical dependency was around 60% (Whitmore et al., 2011). From the surveys noted above, it is clear that at least in the case of inpatient mental health care, coverage is far more likely in employer-based rather than individual plans, and somewhat more likely for outpatient mental health care.

Health systems in transition United States of America142
Administrative costs and profits Administrative costs tend to be higher in private insurance than government-sponsored programmes such as Medicare and Medicaid. This is a result of several factors in addition to the need for profits. Private insurers engage in
“underwriting” activities, which involve examining past claims expenses to determine a competitive, yet still profitable, premium to charge. Insurers may require blood, urine and saliva testing and investigate the medical history of the applicant’s providers. They also need to market and advertise since, unlike government programmes, they do not have a captive audience. This involves the use of brokers or agents who have to earn commissions – more often in the individual than employer-group market. Finally, to protect themselves against unexpectedly high claims, insurers often need to factor in a risk premium.
Estimates vary on the size of administrative costs (including profits and taxes). What is agreed, however, is that administrative costs are much higher for insurance policies covering individuals and small firms. One study, conducted by a United States actuarial firm, estimated that in 2003, Medicare spent 5.2% on administration, compared to 16.7% for private insurers. Among the latter, administrative costs were estimated to be 30% in the individual market, 23% in the small employer market and 12.5% for large employers (Milliman Inc., 2006). The non-partisan Congressional Budget Office (2008) writes, “… the average share of the policy premium that covers administrative costs varies from about 7% for employment-based plans with 1000 or more enrollees to nearly 30% for policies purchased by very small firms and by individuals” (p.60).
The Congressional Research Service (2009) examined the profitability of 74 industries in 2008. Two measures of profitability were used: as a percentage of revenues and as a percentage of assets. The “Insurance and Managed Care” industry ranked 46th by the first of these measures, and 35th by the second. In contrast, the pharmaceutical industry ranked 3rd and 9th, respectively. More recently, however, health insurance profits have become the focus of a policy debate. In 2010, the Obama Administration – citing record profits for the industry – criticized proposed premium increases in the individual market (Seelye, 2010).
Another measure of note is the medical loss ratio: the proportion of premiums returned to policy-holders in the form of health services. A.M. Best Company examined trends in loss ratios. Among nine insurers for which there were data in both 2000 and 2008, average medical loss ratios had dropped a little more than two percentage points, from 84.5% to 82.1%. The ACA has set the medical

Health systems in transition United States of America 143
loss ratio for insurers at 80% for small group insurance and 85% for large group insurance. In 2012, the first year this provision was in effect, insurers refunded over $1 billion in premiums to policy-holders.
3.5.4 Public policy issues
This subsection discusses two sets of public policy issues regarding private health insurance: its content and sale, and its tax treatment.
Content and sale of health insurance As discussed in section 2.8, by and large the regulation of private insurance has traditionally been left to the states. The type and extent of regulation, however, varies greatly by state. For example, some states review health insurance premiums before giving their approval, while others simply require that rates and rate increases be filed with the state. Other regulations may include such things as: providing consumers with information about plan rules and benefits; rules governing disputes, particularly when a claim is denied; requiring that group or individuals not be denied coverage or renewed coverage based on health status; limiting the extent of annual premium increases; and the mandating of coverage for particular benefits or providers (e.g. minimum maternity lengths of stay and / or coverage of reconstructive surgery after mastectomies; coverage of psychologist and / or chiropractor services – to name a few) (Kofman & Pollitz, 2006).
Since health insurance has previously not been mandatory, there are few federal regulations regarding the ownership and content of private health insurance policies. As discussed in section 2.8, the major exception is ERISA, which governs self-insured employer-sponsored plans. These plans account for more than half of covered employees. ERISA, however, does not dictate the content of coverage.
As noted, ERISA does not require that employers offer health insurance but governs the administration of the plans that are offered. ERISA has been amended several times over the years. Some of the current requirements are that plans: provide enrollees with information about plan features and funding; establish procedures governing grievances, appeal of denied medical claims, and rights to sue; provide patients with the right to continue coverage (for a fee that is usually somewhat higher than the total premium that was paid by the employer and employee during employment) for a limited time after the loss of a job; provide annual and lifetime mental health benefits equivalent to

Health systems in transition United States of America144
those provided for medical and surgical benefits if they offer mental health coverage; and cover minimum maternity lengths of stay and reconstructive surgery after mastectomies.
The ACA, if fully implemented, will have a major impact on private health insurance (see Box 2.1). Scheduled to go into effect in January 2014, the act will include the following:• Nearly all individuals will be required to obtain health insurance or pay
a penalty. To make this more affordable, subsidies will be available on a sliding scale to those with incomes up to four times the federal poverty level (approximately $90 000 in 2010 for a family of four).
• Employers with more than 50 employees will be required to offer health insurance, or pay a penalty.
• Health insurance exchanges will be established by each state to coordinate the marketing and sale of health insurance policies to individuals and small firms. States that do not establish them will have the responsibility ceded to the federal government.
• Minimum benefits must be provided by the health insurance policies. While all plans must provide these benefits, different “tiers” can employ different patient cost-sharing requirements. The tiers (e.g. Gold, Silver and Bronze) indicate the expected amount of health-care costs covered by the policies. Policies sold in the exchanges cannot have deductibles in excess of $2000 for individuals and $4000 for families.
• Insurers operating in the exchanges are required to accept all applicants and charge the same premium irrespective of health status or pre-existing conditions. (Older individuals can be charged no more than three times the premium as younger ones, and smokers can be charged 1.5 times as much as non-smokers.) The renewability of policies is guaranteed.
• Insurers are prohibited from placing a lifetime limit (e.g. $2 million) or an annual limit on coverage.
• Insurers are required to present information about their plans in a standard format, and a web site will be developed to allow for the comparison of plans.
• Insurers must provide, without any cost sharing on the part of the patient, particular preventive services.
• Medical loss ratios must be at least 80% in the individual and small group market and 85% in the large group market.
Health systems in transition United States of America 145
• Insurers with particularly expensive benefit packages will be subject to a surcharge (the “Cadillac Tax”, discussed below).
• States are required to monitor health plan premium increases and require that particularly large increases be justified.
This last point has been a major focus of the Obama Administration.11 Ten states that did not have the authority to carry out effective monitoring of premium increases in either or both the individual and small group market were identified; the federal government subsequently took control to oversee these monitoring activities. Furthermore, the federal government plans to examine any proposed rate increases of more than 10% and determine whether they are justified (Pear, 2011a). Moreover, insurers are required to post on their web sites their intent to raise rates by more than 10%, along with an explanation. This information will also be posted on a federal government web site (Levey, 2011).
In spite of these efforts, the ACA does not provide the federal government with the authority to block large rate increases. Moreover in 30 states, in 2010, state authorities did not have the authority to deny rate increases.
Taxation of health benefits As discussed in section 2.2, tax regulations have, historically, had a major impact on the private insurance market. Since the Second World War, employer contributions to employee fringe benefits such as health insurance have not been considered as taxable income for the employee. This so-called tax expenditure is estimated to cost $260 billion in lost revenue in 2009 (Gruber, 2010).
Moreover, tax exemptions on fringe benefits have encouraged employers to provide coverage – and more comprehensive coverage – in lieu of higher wages. To illustrate, suppose that an employee obtains family health insurance coverage from his or her employer, and that the family’s taxable income is $75 000. In 2010, the average family plan cost the employer $10 000 in premiums (the employee paid another $4000) (Claxton et al., 2010). Furthermore, the marginal federal tax rate was 25% at that income level. State tax rates vary. In California, one of the higher states, it was 8.25%. Thus, the total marginal tax rate was 33.25% in California. If the employer share of premiums was not tax deductible, the family would have had to pay $3325 more in income taxes. This encourages employees and unions to seek more of their compensation in health benefits
11 A case can be made that one of the things that sparked passage of the legislation was the announcement of a large premium increase. Anthem Blue Cross Blue Shield, California’s largest for-profit insurer, announced proposed increases in its non-group policies as large as 39% (due to the public outcry, the proposed increases were rescinded) (Blumberg, 2010). The proposed premium increases came to light in early February 2010, at the height of the debate on the final legislation (The New York Times, 2010).

Health systems in transition United States of America146
rather than income. Not coincidentally, perhaps, labour disputes in the United States now are more likely to be over cuts in health benefits rather than about wages.
For decades, advocates of managed competition have called for the elimination or capping of this tax exclusion (Enthoven, 1980; Enthoven & Kronick, 1989). One provision of the ACA is that it caps the tax-exempt status for very generous health plans. Called the “Cadillac Tax”, starting in 2018, it levies a 40% surcharge on health plans that are worth more than $10 200 for individual coverage and $27 500 for family coverage.
3.6 Out-of-pocket payments
OOP payments are health-care related costs paid by consumers. They include direct payment for health services, coinsurance, co-payments and deductibles. While OOP payments have fallen as a percentage of the total, real OOP spending has actually risen considerably. This is because the size of the health-care system has grown so fast. In 1970, per capita OOP spending was $128 of the $319 dollars spent on personal health care per capita, representing a 40% share (Table 3.12). By 2011, United States health-care consumers spent $1146 in OOP payments of the $8187 dollars spent per capita on personal health expenditures, or 14%. In contrast, the consumer price index over this same period grew by only 5.8-fold. In the midst of this general upward trend in recent decades in OOP payments among OECD countries, the United States has historically ranked second highest in per capita OOP spending, after Switzerland (OECD, 2012a).
The growth rate in OOP payments was not distributed equally across subgroups of the United States population and the services they use. The largest increases in OOP spending between 1995 and 2006 were experienced by those with non-Medicaid public insurance (60%), the uninsured (46%) and individuals at or below the poverty line (35%), compared to those with private coverage (15%) (Paez, Zhao & Hwang, 2009).
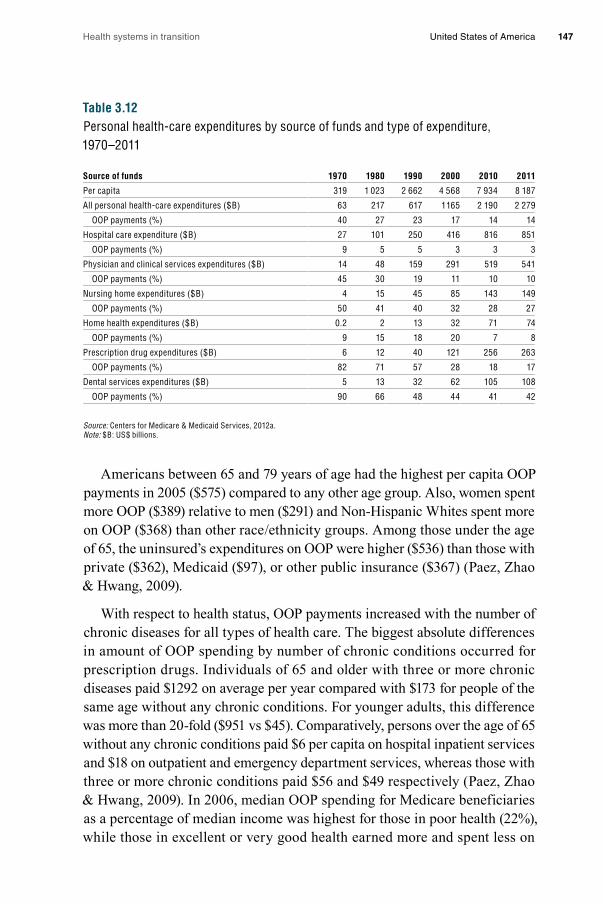
Health systems in transition United States of America 147
Table 3.12Personal health-care expenditures by source of funds and type of expenditure, 1970–2011
Source of funds 1970 1980 1990 2000 2010 2011
Per capita 319 1 023 2 662 4 568 7 934 8 187
All personal health-care expenditures ($B) 63 217 617 1 165 2 190 2 279
OOP payments (%) 40 27 23 17 14 14
Hospital care expenditure ($B) 27 101 250 416 816 851
OOP payments (%) 9 5 5 3 3 3
Physician and clinical services expenditures ($B) 14 48 159 291 519 541
OOP payments (%) 45 30 19 11 10 10
Nursing home expenditures ($B) 4 15 45 85 143 149
OOP payments (%) 50 41 40 32 28 27
Home health expenditures ($B) 0.2 2 13 32 71 74
OOP payments (%) 9 15 18 20 7 8
Prescription drug expenditures ($B) 6 12 40 121 256 263
OOP payments (%) 82 71 57 28 18 17
Dental services expenditures ($B) 5 13 32 62 105 108
OOP payments (%) 90 66 48 44 41 42
Source: Centers for Medicare & Medicaid Services, 2012a. Note: $B: US$ billions.
Americans between 65 and 79 years of age had the highest per capita OOP payments in 2005 ($575) compared to any other age group. Also, women spent more OOP ($389) relative to men ($291) and Non-Hispanic Whites spent more on OOP ($368) than other race / ethnicity groups. Among those under the age of 65, the uninsured’s expenditures on OOP were higher ($536) than those with private ($362), Medicaid ($97), or other public insurance ($367) (Paez, Zhao & Hwang, 2009).
With respect to health status, OOP payments increased with the number of chronic diseases for all types of health care. The biggest absolute differences in amount of OOP spending by number of chronic conditions occurred for prescription drugs. Individuals of 65 and older with three or more chronic diseases paid $1292 on average per year compared with $173 for people of the same age without any chronic conditions. For younger adults, this difference was more than 20-fold ($951 vs $45). Comparatively, persons over the age of 65 without any chronic conditions paid $6 per capita on hospital inpatient services and $18 on outpatient and emergency department services, whereas those with three or more chronic conditions paid $56 and $49 respectively (Paez, Zhao & Hwang, 2009). In 2006, median OOP spending for Medicare beneficiaries as a percentage of median income was highest for those in poor health (22%), while those in excellent or very good health earned more and spent less on

Health systems in transition United States of America148
OOP payments. With respect to chronic diseases, Medicare recipients with Alzheimer’s disease spent 26% of their income on OOP expenditures, those with congestive heart failure 25%, and Medicare beneficiaries with cancer spent 23% of their income on OOP expenses (AARP, 2011). In part as a result of rising OOP payments among some of the most vulnerable in the United States, nearly half of all United States families filing bankruptcy in 2001 cited medical debt as a cause (Himmelstein et al., 2005).
3.7 Payment mechanisms
In the United States, the way in which health services are paid depends on the service provided, the type of health worker providing it, the funder, as well as where the service is provided (e.g. hospital or ambulatory care centre, California or New York). Given this complexity, the payment mechanisms for each type of health service (e.g. inpatient hospital care, prescription drugs) are discussed according to the payer involved (e.g. Medicare, insurers and health plans). Table 3.13 summarizes the primary mechanisms by which funders pay for health services.
Table 3.13Payment mechanisms for health services
Payers
Medicare Medicaid / CHIPInsurers and health plans
Insured individuals
Uninsured individuals
Services
Inpatient hospital care
DRG DRG, Per diem, CR
FFS, Per diem Co-payment, co-insurance
Direct
Physicians and other health professionals
FFS FFS, Capitation FFS, Capitation, Salary
Co-payment, co-insurance
Direct
Prescription drugs
Subsidies for premiums
DAWP Formularies Co-payment, co-insurance
Direct
Long-term care and home health
PPS for limited duration
PPS, CR Per diem for limited duration
Direct Direct
Notes: CR, cost reimbursement; DAWP, discounted average wholesale price; DRG, diagnosis-related group; FFS, fee for service; PPS, prospective payment system.
Medicare The main complaint about Medicare from providers concerns the level of reimbursement. Hospitals and physicians often state that provider payments do not cover their costs. The American Hospital Association (2010) calculates that Medicare pays only 90% of the costs associated with treating programme

Health systems in transition United States of America 149
beneficiaries, leading to a shortfall of $25 billion in 2009. Moreover, this 10% shortfall has reportedly risen substantially over time, from only about $1 billion in 2000. These figures are similar, although somewhat higher, than the 5.2%
“negative margin” or loss to hospitals reported by the Medicare Payment Advisory Commission (Medicare Payment Advisory Commission, 2011b), which provides Congress with analysis and advice on Medicare payment policy.
Inpatient hospital care. Since 1983, Medicare Part A has used a prospective payment system to reimburse for hospital services (Shi & Singh, 2008, p.227). The amount paid per patient per hospital stay is a bundled payment called a DRG payment. More information on DRGs and other Medicare payment mechanisms is presented in Box 3.4. Although additional payments can be made to hospitals for extremely lengthy or expensive inpatient stays, hospitals are generally “at risk” in the sense that with a prospective bundled payment they make money on some Medicare patients and lose money on others.
Box 3.4Medicare payment mechanisms
Relative value based scaleMedicare Part B pays for physician services using a Resource-based Relative Value Scale (RBRVS) fee schedule. If providers agree to take the Medicare payment as full payment they are not allowed to charge anything additional to the patient above the deductible and co-payment. RBRVS-based payments from CMS for each service are a prospective function of physician work, office expenses and liability, and are adjusted for geographical differences in resource costs. Payments are calculated by multiplying the physician’s resource costs by a conversion factor determined by CMS and are adjusted for geographical differences in resource costs (American Medical Association, 2012). As a FFS model, the more productive a physician is under RBRVS, the more he or she will be paid.
Sustainable growth rateMost Medicare payments for non-physician services are adjusted for inflation each year by CMS; however, payments for physicians are adjusted using a conversion factor based on a formula called the “Sustainable Growth Rate” (SGR). The SGR is based on four variables: the estimated percentage change in fees for physician services (inflation in prices of goods and services), the estimated percentage change in the average number of Medicare FFS beneficiaries, the estimated 10-year average annual percentage change in real per capita GDP, and the estimated percentage change in expenditures due to changes in law or regulations (Centers for Medicare & Medicaid Services, 2011f).
The SGR is calculated each year and used to update yearly and cumulative expenditure targets. Each year, adjustments to payment rates for physician services are made to align spending on these services with expenditure targets. If spending exceeds expenditure targets, payments to physicians would, according to the legislation, be cut by adjusting payment rates over several years to bring cumulative spending in line with the cumulative expenditure

Health systems in transition United States of America150
Reimbursements for inpatient psychiatric services by Medicare are per diem (rather than a bundled amount per case, as for inpatient general acute care) and based upon modified DRGs. Stop-loss measures are included in this Medicare reimbursement programme to prevent psychiatric hospitals from excessive losses (Shi & Singh, 2008, p.227).
Physicians and other health professionals. The adequacy of Medicare payment to physicians has received a great deal of attention from policy-makers. While some publicity has been given to anecdotal evidence that many physicians are no longer seeing Medicare patients, this does not seem to be the case in the aggregate. Nevertheless, there are some access problems, particularly for primary care providers. Moreover, as discussed below, Congress has been
Box 3.4 – continuedMedicare payment mechanisms
target. If spending falls below the target, the adjustment is positive. When spending and targets align, physician payment rates are adjusted for inflation using the Medicare Economic Index (Congressional Budget Office, 2006). However, as noted earlier, generally the adjustment rates have been negative leading Congress to override the SGR mechanism in order to prevent a decline in physician reimbursement rates.
Diagnosis-related groupsSince 1983, Medicare Part A has used a prospective payment system to reimburse for hospital services (Shi & Singh, 2008, p.227). The amount paid per patient per hospital stay is a bundled payment called a diagnosis-related group (DRG) payment. The roughly 750 DRGs classify all human diseases. The classification accounts for up to eight diagnoses in addition to the primary diagnosis. The payment calculation for a DRG is complicated. It includes information about the affected organ system, surgical procedures performed, and the morbidity and sex of a patient. DRGs are assigned unique weights by CMS to allow reimbursement for the same DRG to vary across hospitals due to wage differences between hospital markets, whether the hospital is in an urban or rural market, whether the hospital is a teaching hospital, and the share of low-income patients it treats (Shi & Singh, 2008, p.227). Although additional payments can be made to hospitals for extremely lengthy or expensive inpatient stays, hospitals are generally “at risk” in the sense that with a prospective bundled payment they make money on some Medicare patients and lose money on others.
Outpatient Prospective Payment SystemThe Medicare Outpatient Prospective Payment System (OPPS) is used by Medicare to pay for outpatient ambulatory care services. The OPPS characterizes ambulatory care into over 300 procedural groups, called Ambulatory Payment Classification (APC), defined by similarities in the medical procedures and resources required to provide the outpatient service. Medicare assigns bundled payment rates for the APCs based on the median cost of services in the procedure group and geographical variation in wages (Shi & Singh, 2008, p.228).
Health systems in transition United States of America 151
keeping physician payments considerably higher than dictated by a formula. If it chooses not to do so in the future, and instead relies on the formula, access problems could accelerate rapidly.
Medicare Part B pays for physician services using a RBRVS fee schedule. The RBRVS divides the cost of providing services into three categories – physician work, office expense and professional insurance. The payment is determined by multiplying the costs by a conversion factor set by the CMS (Kaiser Family Foundation, 2012b). Box 3.4 contains further details on the RBRVS. While most Medicare payments for non-physician services are adjusted each year by CMS for inflation, payments for physicians are adjusted using a conversion factor based on a formula called the Sustainable Growth Rate (SGR). The SGR is based on several variables, is designed to keep annual and cumulative Medicare Part B spending within targets (see Box 3.4 for more details).
Medicare Advantage (Part C) plans can be local HMOs and PPOs, private FFS plans or HMOs for specific high needs patients (e.g. those in long-term care with chronic conditions). There are two alternative ways in which physicians are paid – two-tier and three-tier systems. In two-tier systems, Medicare pays the managed care company, which in turn pays the physician directly. In the more common three-tier arrangement, there is an intermediary: the medical group where the physician works. In these situations, Medicare pays the managed care company, which in turn pays the medical group. The group pays the physician in any manner that is mutually agreed upon.
Thus, there is a fairly distant relationship between the purchaser (Medicare) and the provider. The main issue affecting physicians is the adequacy of payment rates from Medicare to the managed care organization. In recent years these payments have been, by most accounts, very generous. When HMOs first began contracting with Medicare, payment systems were designed to save Medicare 5% compared to what it would have paid in the FFS system. This did not occur, in part because of favourable selection (healthier patients) enrolling in managed care organizations, but also because over time payment formulas have become more generous. Researchers have found that the payments actually exceed what Medicare would have paid in the FFS section by an average of about 12% (Biles et al., 2006). While this did allow Medicare Advantage plans to offer additional benefits, it has been costly to the Medicare programme.

Health systems in transition United States of America152
The ACA reduces payments to Medicare Advantage plans to put payments on a par with those in the traditional Medicare programme. These cuts will be phased in over several years and are expected to result in a decline in the Medicare Advantage enrolment – which currently constitutes 24% of Medicare beneficiaries – by 35%, or down to about 16% of beneficiaries (Congressional Research Service, 2010). The expected fall in enrolment is mainly because Medicare Advantage plans will no longer be able to offer as many extra benefits compared to what is provided in the traditional programme, but also because plans will probably have to charge higher premiums and co-payments. However, in 2011 – the first year of cuts – the expected fall in Medicare Advantage enrolment was not observed. In fact enrolment rates increased and premiums decreased.
Similar to inpatient care, Medicare uses a prospective payment system to reimburse for ambulatory care services (e.g. clinic visits, outpatient procedures) called the Medicare Outpatient Prospective Payment System (see Box 3.4 for more details). While traditional Medicare does not cover dental services, some Medicare Part C Advantage plans do cover dental services as part of the enhanced benefits described above and pay dentists on a FFS basis.
Prescription drugs. Medicare subsidizes premiums for voluntarily purchased Medicare Part C Advantage plans with a prescription drug benefit and stand-alone Medicare Part D prescription drug plans. These private plans then reimburse pharmacies based on negotiated prices for specific drugs (i.e. formularies) (Boards of Trustees, 2011).
In Part D, drug plans submit bids to CMS each year based on their expected benefit payments and administrative costs after deducting federal reinsurance subsidies and enrollee premiums. Plans base bids on a Medicare enrollee of average health. CMS then risk adjusts payments based on the actual health status of plan enrollees including diagnoses, age, sex, disabled status, low income status and long-term institutionalization status. CMS pays plans a direct subsidy prospectively for each enrollee monthly and reconciles the payments and actual plan costs annually (Medicare Payment Advisory Commission, 2008a).
Long-term care and home health. Although Medicare does not pay for extended or custodial long-term care (this falls under Medicaid’s purview, discussed below), Medicare Part A does pay for post-acute nursing home care for beneficiaries with a prior inpatient stay who need these services (Georgetown University Long-Term Care Financing Project, 2007). It pays the full amount for 20 days and then a much smaller subsidized amount up

Health systems in transition United States of America 153
to 100 days. Medicare pays for these services using the prospective payment system, setting per discharge payment rates for different case-mix groups called Medicare severity long-term care DRGs (Medicare Payment Advisory Commission, 2008b). In addition to a limited amount of nursing home care, Medicare pays for home health services related to medical treatment but not for assistance with activities of daily living (Georgetown University Long-Term Care Financing Project, 2007).
Medicaid Inpatient hospital care. The American Hospital Association (2010) reports that Medicaid pays, on average, 89% of the actual cost of care – almost the same as Medicare’s 90%. The cumulative loss on Medicaid patients was reported to be about $11 billion.
State Medicaid agencies vary considerably in how they pay health-care providers for services provided to Medicaid beneficiaries. In the managed care framework, which comprises 70% of Medicaid enrollees, Medicaid pays health plans to provide a defined set of services to beneficiaries at a fixed rate. States establish managed care rates for various demographic groups using FFS claims data or encounter data (Medicaid and CHIP Payment Access Commission, 2011, p.171). All but three states have a comprehensive Medicaid managed care programme and penetration rates – or the extent of the Medicaid market that managed care comprises – vary by state with more than half the states having Medicaid managed care penetration rates over 50% (Kaiser Family Foundation, 2011e). Most state Medicaid agencies pay for hospital inpatient care using a DRG-based method. Less common Medicaid payment mechanisms for hospital services include per diem and cost reimbursement methods. In per diem reimbursement, state agencies pay each hospital a specific rate and this rate is applied to each inpatient day for all patients in that particular hospital. A handful of states use cost reimbursement. Under cost reimbursement, a state Medicaid agency receives a claim from a hospital and pays a proportion of the claim. After the hospital has submitted its annual report, any balances owed to the hospital or the Medicaid agency are reconciled (Center for Healthcare Strategies, 2010).
Physicians and other health professionals. On average Medicaid pays only 66% as much as Medicare for primary care services. Payment for specialist services is higher: for obstetric care, the average is 93%. (The average for all services is 72%.) There is, however, considerable variation by state. For primary care, the ratio varies from 37% of the Medicare reimbursement rate in New Jersey to 143% in Wyoming (Kaiser Family Foundation, 2011f).

Health systems in transition United States of America154
Medicaid payment methods for physician services also vary by state. Many state reimbursement methods are based on fee schedules. Fee schedules are created in such a way that physician services requiring more inputs or resources are paid at higher rates (i.e. relative value). Medicaid fees for an office visit can vary more than five-fold between states. The Health Care and Education Reconciliation Act, passed after the ACA, requires state Medicaid agencies to pay 100% of the Medicare payment rate for primary care services provided by physicians for the years 2013 and 2014. The federal government will pay the difference between the state and Medicare payments for these primary care services (Medicare Payment Advisory Commission, 2011, pp.168–169).
Both low reimbursements and administrative hassles have resulted in reduced physician participation in Medicaid. A national study of over 3700 paediatricians conducted in 2000 found that 55% of paediatricians accepted all Medicaid patients. Rates varied considerably by state, ranging from 20% in Tennessee to 96% in North Dakota. In states with payment rates in the lowest quartile of all states, about half the paediatricians accepted all new patients, compared to over 65% of those in states where reimbursements were in the highest quartile. A similar inverse relationship was found between accepting all Medicaid patients and perceived concerns about the amount of time it took to complete paperwork (Berman et al., 2002). A second, more recent national study with data from 2005 found that the average amount of time it takes a physician to receive Medicaid reimbursement varied from 37 days to 115 days. These delays acted to offset the effect of higher fees (Cunningham & O’Malley, 2008).
Medicaid pays dentists based on fee schedules. In regard to other outpatient services, most state Medicaid agencies pay for these services using cost reimbursement methods (Center for Health Care Strategies, 2010). The cost reimbursement methods Medicaid uses for outpatient services are similar to those described above for inpatient care with the exception of laboratory services, which are paid using Medicare’s clinical lab fee schedule (Center for Health Care Strategies, 2010). Some states develop their own fee schedules or adopt the fee schedule Medicare previously used for ambulatory surgical centres (rather than the prospective Ambulatory Payment Classification (APC) system it uses now, see above). Others use Medicare’s APC groups to reimburse outpatient hospital services. Less common are reimbursements based on ambulatory patient groups that are “enhanced” in that more services are bundled in payment compared to APCs (Center for Health Care Strategies, 2010).
Health systems in transition United States of America 155
Prescription drugs. Unlike Medicare Part D, pharmacies are paid directly by state Medicaid agencies. States and the federal government determine reimbursement amounts based on federal guidelines. Reimbursement amounts are based on the average wholesale price discounted by a predetermined percentage plus a dispensing fee. For some multiple-source drugs, states use a ceiling price based on the federal upper limit for the drug or a state-based maximum allowable cost. The federal government also mandates that states receive rebates from manufacturers. These rebates are paid quarterly to State Medicaid agencies and are equal to the greater of 15.1% of the average manufacturer price (AMP) or the difference between the AMP and the lowest price available to any United States purchaser. Generic drugs are rebated at 11% of the AMP (U.S. Department of Health and Human Services Office of the Inspector General, 2009).
Long-term care and home health. Medicaid is the primary source of funding for long-term care services, paying for more than 40% of all long-term care (Kaiser Family Foundation, 2011b). To qualify for long-term care in nursing homes under Medicaid, individuals, mostly aged over 65 or disabled, must not exceed income or other financial resource thresholds set by states. Typically, the financial eligibility criteria are defined as receiving Social Security Income (SSI) and having less than $2000 ($3000 if a couple needs care) in assets, excluding a home, car and some personal belongings. (Generally, a beneficiary’s primary residence and one car are not counted towards the financial eligibility criteria.) Payment mechanisms for long-term care services vary by state. Most states use prospective payment systems similar to those in Medicare. Others reimburse actual costs up to a predetermined statewide per beneficiary spending cap. States pay directly or use third-party managed care administrators (National Care Planning Council, 2012).
Insurers and health plans Inpatient hospital care. Private insurance plans typically negotiate with hospitals annually to set payment rates. These rates are either per diem, discounted FFS or a variation of Medicare’s DRGs. For FFS payment mechanisms, private insurers will typically negotiate a discount that applies to all prices on services a hospital provides (New York Times, 2009). Discounted FFS payments are more commonly used by smaller private insurance companies. Some private insurers pay for inpatient care using Medicare’s DRGs but may assign different payment weights by hospital and episode bundle (Reinhardt, 2006).

Health systems in transition United States of America156
Physicians and other health professionals. Many insurers pay physicians based on the Medicare RBRVS fee schedule but use their own conversion factors. Differences in fee schedule payments made to physicians across private insurers are a result of differences in office size, network size and local doctor labour supply. Larger practices may be better positioned to negotiate prices with an insurer to the extent they can leverage the importance of participation in an insurer’s network. Smaller practices may be more inclined to take the fee schedules as given. Most specialists, with the exception of many hospital-based specialists, are paid using standard schedules rather than negotiated fee schedules. On average, physician rates fall within 20% of Medicare rates (Center for Studying Health Systems Change, 2010).
Physicians may also be paid by insurers on a capitated basis. Here, insurance premiums are allocated to physicians and provider groups under contract with an insurer to cover services for the beneficiaries. Some large health maintenance organizations, academic institutions and corporate- or physician-owned practices pay physicians a salary (New England Journal of Medicine, 2004).
Private dental insurance is often a stand-alone plan in which private insurers and health plans also pay for dental services based on fee schedules. Variations in fee schedules across insurers – and across markets for a given insurer – are a function of the same economic factors driving differences in physician fee schedules described in this section. Private insurers and health plans often pay for other outpatient services, such as outpatient surgeries, using bundled payments similar to the APC system employed by Medicare and Medicaid discussed earlier (Reinhardt, 2006).
Prescription drugs. Insurers and health plans purchase pharmaceuticals often with the assistance of a pharmaceutical benefits manager (PBM), who helps purchasers sift through often complicated pricing and distribution schemes. Plans tie their co-payments for particular drugs to formularies. Often, insurers use a four-tier pricing system where drugs are either (1) generic, (2) preferred brand, (3) other branded products, or (4) specialty, with co-payments rising, often substantially, from the generic to the preferred to the non-preferred brand to specialty tiers (Schweitzer & Comanor, 2007).
The use of so many tiers is a relatively new phenomenon; the proportion of employees in plans with three or more tiers rose from 27% in 2000 to 78% in 2009. Moreover, over this time period, while co-payments for generics increased

Health systems in transition United States of America 157
by 25%, they rose by 80% for preferred drugs, 59% for non-preferred drugs and 44% for specialty drugs. In 2009, average co-payments in the four tiers were $10, $27, $46 and $85, respectively (Kaiser Family Foundation, 2010g).
Long-term care and home health. In 2004, private long-term care insurance paid for 4% of nursing home and home health services. Long-term care insurance products are purchased in individual or group markets. Premiums vary based on whether the plans have inflation protection, and by the age and health status of the insured. Beneficiaries can collect the benefit once they demonstrate the need for substantial assistance with at least two of six activities of daily living (e.g. bathing, dressing) and a waiting period of 90 or more days has expired. Insurers then pay a set amount per day – $100 on average for policies purchased in 2000 – generally for 2–5 years (Johnson & Uccello, 2005).
Uninsured individualsUninsured individuals either pay for health services directly or, in some cases, receive them at no cost as charity or uncompensated care. Hospitals, physicians and other health professionals can negotiate prices with uninsured persons on a case-by-case basis. Some providers use means testing when determining the final payment owed by uninsured individuals (Reinhardt, 2006). Often, however, the uninsured pay prices far in excess of what public or private insurers pay (Anderson, 2007). Compared to those with insurance, the uninsured are frequently required to pay the full cost of the health-care service before it will be provided (Asplin et al., 2005; Kaiser Family Foundation, 2011g). For those who are unable to pay, hospitals, physicians and other health-care professionals may provide services without compensation. Uncompensated care totalled $57 billion in 2008 with 75% of these costs borne by federal, state and local government funds reserved for caring for the uninsured (Hadley et al., 2008; Kaiser Family Foundation, 2011g). As discussed in Chapter 5 and section 7.2, many uninsured persons go without needed health care or visit local emergency departments because they have no access to primary care.
Pay-for-performanceIn addition to the payment mechanisms described above, providers may be compensated based on performance. Pay-for-performance (P4P) “refers to financial incentives that reward providers for the achievement of a range of payer objectives, including delivery efficiencies, submission of data and measures to payers, and improved quality and patient safety” (McNamara, 2006, p.5S). By 2007, more than 100 P4P programmes had been launched in the private health sector (Institute of Medicine, 2007). Some states, as well as CMS, have also created or launched demonstration projects to align provider-payments

Health systems in transition United States of America158
with quality. Leveraging its purchasing power, Medicare has several P4P demonstration projects. These include projects in which hospital payments are tied to performance on quality measures and physician FFS payments are tied to quality and efficiency measures. Providers and insurers are rewarded for improving the care management of patients with chronic conditions (Centers for Medicare & Medicaid Services, 2005). However, P4P rewards are seldom more than 5% of a United States physician’s salary (Advisory Board Company & Foundation, 2008) and improved performance tends to taper off after four to five years (Werner et al., 2011).
4. Ph
ysical and
hu
man
resou
rces
4. Physical and human resources
Since the 1970s there has been an increase in ambulatory facilities, such as physician and dentist offices and ambulatory surgical centres, and a decrease in institutional settings such as hospitals and nursing homes.
The number of hospital beds has also fallen (and is amongst the lowest per head among high-income countries), yet despite this decrease in beds, occupancy rates in hospitals remain low, primarily due to a dramatic decrease in inpatient length of stay. The United States uses relatively more of medical technologies such as MRIs and CT scanners than comparable countries, which may also be a factor in its relatively low average length of stay, but the average age of its physical infrastructure, such as hospital buildings, is slightly increasing.
Employment of physicians, chiropractors, nurses, physician assistants and all types of therapist has increased since 1990. Particularly high increases in employment of physician assistants and therapists over the last three decades (and moderate increases in nurses) may indicate increasing reliance on these professionals for primary health care. On the other hand, employment of dentists, optometrists and pharmacists has decreased slightly in this period. Relative to comparable countries, the United States is around the median in physician supply, but toward the top in nurse supply. Licensing and certification of health professionals are carried out at state level; there is reciprocal recognition of licences between most states, but not all.
The United States benefits from net inward migration of health-care professionals from other countries. However, it suffers from internal maldistribution of the health-care workforce: by practice and setting (with a disproportionate number of specialist physicians compared to primary care physicians); by geographical location (with variations in physician to population ratios of more than 50%, with more professionals in the Mid-Atlantic and the Northeast than in the South and the Mountain West, and greater shortages of physicians in rural areas); and by racial and ethnic representation in
Health systems in transition United States of America160
the workforce (with African Americans, Latinos and American Indians underrepresented). There is no consensus regarding the overall adequacy of the future supply of physicians. Different forecasts are predicted based on different assumptions about future demand and supply. For nurses, the history of nursing workforce adequacy in the United States is one of cyclical but deepening shortages in the past few decades, and nursing workforce forecasts uniformly predict some degree of shortage in the future unless significant steps are taken to increase supply. While greater demand for health care under the Affordable Care Act will exert further pressures on the health-care workforce, other provisions that expand the workforce under the ACA and other recent federal policies may help ameliorate these problems.
4.1 Physical resources
4.1.1 Capital stock and investments
Current capital stock The physical facilities for providing health care in the United States can be placed into several categories corresponding to the types of service discussed in the next chapter. This section will touch upon several types of facility in the following categories: primary / ambulatory care; specialized ambulatory and inpatient care; and long-term care. Primary and ambulatory care facilities include doctors’ and dentists’ offices and community and public health buildings. Hospitals and ambulatory surgical centres are two important types of specialized ambulatory and inpatient care facility. Institutional forms of long-term care facilities include nursing homes, while non-institutional forms include home health-care agencies, hospices and end-stage renal facilities. There are several other types of facility in each of these categories.
Health-care facilities may be under public or private ownership, and may be licensed by state governments, certified by the CMS for the Medicare programme and / or accredited by private agencies. Hospitals and nursing homes, for example, are licensed by each state and may receive certification from CMS and accreditation by the Joint Commission (formerly the Joint Commission on Accreditation of Healthcare Organizations), a private not-for-profit organization. Licensing and certification require that the facility meets standards for the physical structure and for the quality and safety of services provided by the
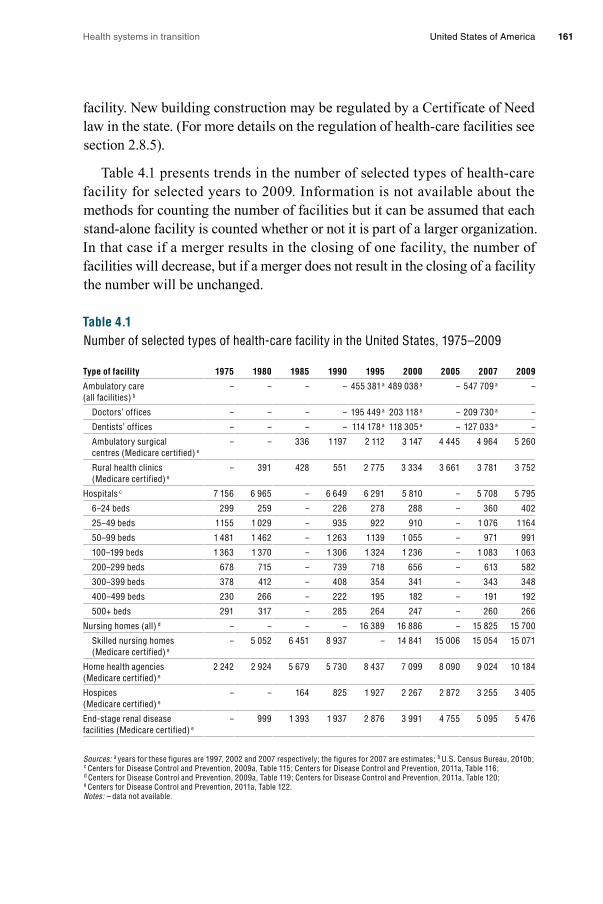
Health systems in transition United States of America 161
facility. New building construction may be regulated by a Certificate of Need law in the state. (For more details on the regulation of health-care facilities see section 2.8.5).
Table 4.1 presents trends in the number of selected types of health-care facility for selected years to 2009. Information is not available about the methods for counting the number of facilities but it can be assumed that each stand-alone facility is counted whether or not it is part of a larger organization. In that case if a merger results in the closing of one facility, the number of facilities will decrease, but if a merger does not result in the closing of a facility the number will be unchanged.
Table 4.1Number of selected types of health-care facility in the United States, 1975–2009
Type of facility 1975 1980 1985 1990 1995 2000 2005 2007 2009
Ambulatory care (all facilities) b
– – – – 455 381 a 489 038 a – 547 709 a –
Doctors’ offices – – – – 195 449 a 203 118 a – 209 730 a –
Dentists’ offices – – – – 114 178 a 118 305 a – 127 033 a –
Ambulatory surgical centres (Medicare certified) e
– – 336 1 197 2 112 3 147 4 445 4 964 5 260
Rural health clinics (Medicare certified) e
– 391 428 551 2 775 3 334 3 661 3 781 3 752
Hospitals c 7 156 6 965 – 6 649 6 291 5 810 – 5 708 5 795
6–24 beds 299 259 – 226 278 288 – 360 402
25–49 beds 1 155 1 029 – 935 922 910 – 1 076 1 164
50–99 beds 1 481 1 462 – 1 263 1 139 1 055 – 971 991
100–199 beds 1 363 1 370 – 1 306 1 324 1 236 – 1 083 1 063
200–299 beds 678 715 – 739 718 656 – 613 582
300–399 beds 378 412 – 408 354 341 – 343 348
400–499 beds 230 266 – 222 195 182 – 191 192
500+ beds 291 317 – 285 264 247 – 260 266
Nursing homes (all) d – – – – 16 389 16 886 – 15 825 15 700
Skilled nursing homes (Medicare certified) e
– 5 052 6 451 8 937 – 14 841 15 006 15 054 15 071
Home health agencies (Medicare certified) e
2 242 2 924 5 679 5 730 8 437 7 099 8 090 9 024 10 184
Hospices (Medicare certified) e
– – 164 825 1 927 2 267 2 872 3 255 3 405
End-stage renal disease facilities (Medicare certified) e
– 999 1 393 1 937 2 876 3 991 4 755 5 095 5 476
Sources: a years for these figures are 1997, 2002 and 2007 respectively; the figures for 2007 are estimates; b U.S. Census Bureau, 2010b; c Centers for Disease Control and Prevention, 2009a, Table 115; Centers for Disease Control and Prevention, 2011a, Table 116; d Centers for Disease Control and Prevention, 2009a, Table 119; Centers for Disease Control and Prevention, 2011a, Table 120; e Centers for Disease Control and Prevention, 2011a, Table 122. Notes: – data not available.

Health systems in transition United States of America162
In terms of ambulatory care, the number of total establishments in the United States increased by over 20%, from about 450 000 in 1997 to nearly 550 000 in 2007. The number of doctors’ offices, a subset of the total ambulatory care establishments, has grown slowly since 1997 and was about 210 000 in 2007. The size of these offices varies. A plurality of physicians in 2007 were in solo practice (30.5%) (Hsiao et al., 2010). Another 12% were in offices with just two physicians, and close to 31% had three to five physicians. At the larger end of office size, 18% had 6 –10 doctors, while 9% had 11 or more. Office size has undergone a change since 1997, with solo offices decreasing 21% since 1997 and larger offices of 6 –10 physicians increasing 46% (both of these changes were statistically significant) (Chung et al., 2010). Another subset of ambulatory care establishments – dentists’ offices – also experienced an increase, from about 115 000 in 1997 to 127 000 in 2007. Medicare certified ambulatory surgical centres grew nearly 10-fold between 1985 and 2000 and more than doubled between 1995 and 2009. Rural health clinics experienced a similar trajectory, having not quite a 10-fold increase between 1980 and 2009.
In contrast to the growth in ambulatory care, the number of hospitals decreased significantly from 1975 to 2009. The consolidations and closings of hospitals since the 1980s that contributed to this decline are related to changes in hospital payment and the rise of managed care (Sloan, Ostermann & Conover, 2003; Harrison, 2007). The change from retrospective to prospective payment by Medicare and other payers, reductions in payment rates, and managed care practices promoted reductions in patient lengths of stay, increased competition among hospitals, and increased hospital financial constraints. These operational changes stimulated hospital consolidation and closing. The decrease in the number of hospitals occurred across all sizes of hospital with the exception of the smallest (6 – 24 beds), which have increased in numbers over this time period.
Data from the American Hospital Association (AHA, 2010a) (not presented in the table) indicate that in 2009 the United States had 5815 registered hospitals with a total of 951 045 beds. Registered hospitals are those that meet the AHA’s criteria to be registered as a hospital facility. Of those hospitals, 5010 (86%) were community hospitals, defined as non-federal, short-term general, and other specialized hospitals. Forty per cent of the community hospitals were located in rural areas.
Nursing homes in the United States may be certified by Medicare, Medicaid, both Medicare and Medicaid, or may not be certified. The total number of certified and non-certified nursing homes in 2009 was 15 700, while the number of Medicare certified skilled nursing homes was slightly less, at 15 071

Health systems in transition United States of America 163
(see Table 4.1). Although the total number of nursing homes has been decreasing since 1995, the number of Medicare certified nursing homes tripled between 1980 and 2000. From 2000 to 2009 the number of Medicare certified nursing homes has remained steady.
The number of Medicare certified home health agencies increased four-fold from 1975 to 2009, and stood at 10 184 in 2009 (see Table 4.1). Medicare certified hospice agencies increased even more drastically, most likely in response to the initiation of Medicare payment for hospice care in 1982. Since 1980 the number of end-stage renal disease facilities increased five-fold.
Information on the age of buildings in the United States is available for hospitals only. As Fig. 4.1 shows, the average (median) age of hospital buildings increased from 7.9 years in 1990 to 9.9 years in 2005, levelling out at 9.8 to 10.1 throughout 2010 (AHA, 2012). A 2007 breakdown of the age of hospitals by ownership status shows that government-owned and private non-profit hospitals were older on average (10.7 and 11.1 years respectively) than for-profit hospitals (6.5 years) (Schuhmann, 2009). The older age of buildings at the end of the decade persisted despite a hospital building boom in the first half of the 2000s. In 2004 capital spending was characterized as being flat and not keeping up with the demand for hospital services (HFMA, 2004). Forty-one per cent of hospitals were not keeping up with depreciation (HFMA, 2004).
Investment funding United States hospitals fund capital investments through internal reserves and several different external sources. Internal reserves primarily arise from positive net income (operating and non-operating cash flow), investment reserves and the divestment or monetization of assets (HFMA, 2003). Divestment of assets may involve the sale of non-core assets, such as medical office buildings, or the sale of the hospital itself to another hospital or health-care system. This may involve a conversion from non-profit to for-profit ownership.

Health systems in transition United States of America164
Fig. 4.1Median average age of hospital plants in the United States, 1990–2010
Source: AHA, 2012.
External sources of capital funding are borrowed money (debt), equity offerings, venture capital, capitalized leases, real estate investment trusts, public grants and donations (HFMA, 2003). Debt funding can be from bank or other financial service company loans, tax-exempt bonds or taxable bonds. The importance of each of these external sources of funding varies. Fig. 4.2 shows that hospitals in general give tax-exempt bonds the highest importance, followed by bank and other loans, philanthropy, taxable bonds and equity / venture capital.
Years
0
2
4
6
8
10
12
’10’09’08’07’06’05’04’03’02’012000’99’98’97’96’95’94’93’92’91’90
9.89.79.99.89.99.89.89.89.7
10.19.89.7
9.99.89.99.89.89.89.79.4
9.29.39.28.98.8
8.68.4
8.28.07.9
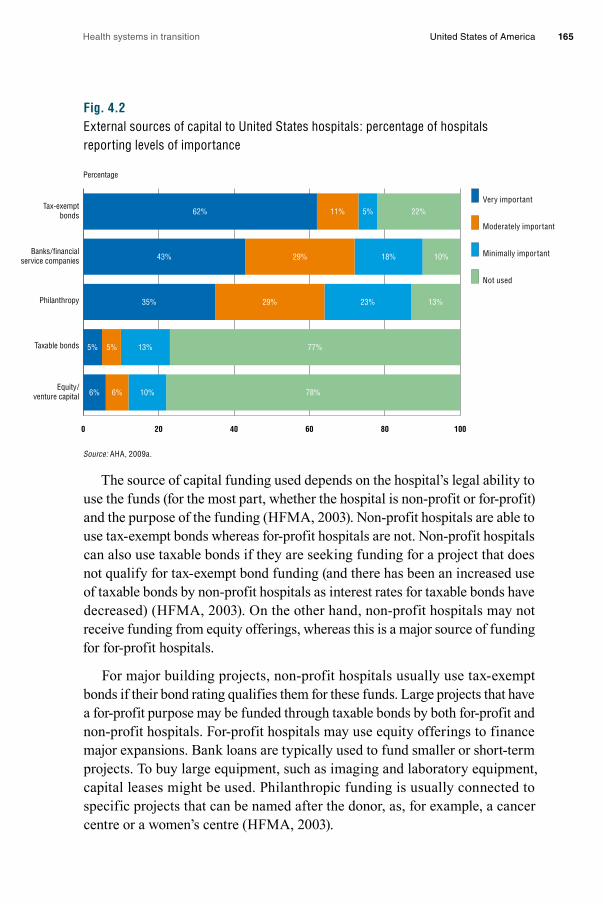
Health systems in transition United States of America 165
Fig. 4.2External sources of capital to United States hospitals: percentage of hospitals reporting levels of importance
Source: AHA, 2009a.
The source of capital funding used depends on the hospital’s legal ability to use the funds (for the most part, whether the hospital is non-profit or for-profit) and the purpose of the funding (HFMA, 2003). Non-profit hospitals are able to use tax-exempt bonds whereas for-profit hospitals are not. Non-profit hospitals can also use taxable bonds if they are seeking funding for a project that does not qualify for tax-exempt bond funding (and there has been an increased use of taxable bonds by non-profit hospitals as interest rates for taxable bonds have decreased) (HFMA, 2003). On the other hand, non-profit hospitals may not receive funding from equity offerings, whereas this is a major source of funding for for-profit hospitals.
For major building projects, non-profit hospitals usually use tax-exempt bonds if their bond rating qualifies them for these funds. Large projects that have a for-profit purpose may be funded through taxable bonds by both for-profit and non-profit hospitals. For-profit hospitals may use equity offerings to finance major expansions. Bank loans are typically used to fund smaller or short-term projects. To buy large equipment, such as imaging and laboratory equipment, capital leases might be used. Philanthropic funding is usually connected to specific projects that can be named after the donor, as, for example, a cancer centre or a women’s centre (HFMA, 2003).
Percentage
0 20 40 60 80 100
Equity /venture capital
Taxable bonds
Philanthropy
Banks / financialservice companies
Tax-exemptbonds
Very important
Moderately important
Minimally important
Not used
62% 11% 5% 22%
43% 29% 18% 10%
35% 29% 23% 13%
5% 5% 13% 77%
6% 6% 10% 78%

Health systems in transition United States of America166
In investment funding, access to capital is a key concern. A hospital’s access to capital depends on its financial performance and its plans for the use of the new capital. Access to capital in United States hospitals has been linked to their organizational characteristics, geography and operational characteristics (HFMA, 2003). Hospitals with broad access to capital tend to be larger, non-profit private or government-owned, teaching and rural. Hospitals with limited access tended to be for-profit, teaching and urban. Access differs by state due to differences in Medicaid reimbursement and certificate of need laws, and hospital rate setting in some states. Operational characteristics associated with broad access to capital were a lower percentage of long-term debt as a percentage of net fixed assets, a low average length of patient stay, and higher operating margins and amounts of cash on hand. Operational characteristics associated with limited access to capital were a high proportion of Medicaid patients, a low occupancy rate, a high percentage of non-salary costs, a high average length of patient stay, low productivity, and lower operating margins and amounts of cash on hand.
The Medicare payment structure, and its changes over the decades, has had a strong influence on capital access. Prior to the 1990s, Medicare paid hospitals a “pass through” component that reimbursed the hospital retrospectively for a portion of their capital expenses. This was changed to a fixed prospective payment rate for capital expenses in 1992. Hospitals that had high long-term debt going into the new system found it difficult to cover capital costs. The change in payment may also have contributed to reduced capital investment by hospitals overall, with the effect of the ageing of facilities discussed in the previous section. In contrast, hospitals granted “critical access” status by Medicare receive cost-based reimbursement from Medicare instead of the usual prospective reimbursement. These hospitals – around one-third of all rural hospitals – have had higher profit margins and therefore better capital access than their non-critical access rural counterparts (HFMA, 2003).
The level of capital spending has been falling and investment strategies have been changing due to financial constraints encountered in the 2000s, particularly since the economic downturn that began in 2008 (Schuhmann, 2009; Steinberg, 2010). Internal sources of capital financing have been especially affected. A decline in hospital admissions and a greater proportion of patients unable to pay for care have contributed to lower profit margins (in some hospitals margins have been negative), which has left hospitals less able to finance investments through net operating income. Fig. 4.3 shows that between 1991 and 2010 average hospital profit margins from operations fluctuated between 2% and 4%. While the total margin has been between 4%

Health systems in transition United States of America 167
and 6% (except for a dip in 2007 – 2008), the margin from patient care has been negative. Also, the decline in the stock market and low interest rates reduced the value of non-income reserves. At the same time, external sources of capital have also been affected, for example charitable donations have fallen and debt financing has been more difficult for some hospitals due to the downgrading of their bond ratings. Non-profit hospitals’ ability to access tax-exempt bonds has been severely affected (Steinberg, 2010). As a result of these developments, hospitals with limited access to capital are increasing (HFMA, 2004), and by the end of the decade 71% of United States hospitals had reduced capital spending (Steinberg, 2010).
Fig. 4.3Hospital profit margins 1991–2010
Source: AHA, 2012.Notes: Total margins is calculated as a difference between total net revenues and total expenses divided by total net revenues. Operating margins is calculated as a difference between operating net revenues and total expenses divided by operating net revenues. Patient margins is calculated as a difference between patient net revenues and total expenses divided by patient net revenues.
4.1.2 Institutional infrastructure
This section examines trends in the infrastructure of three types of institutional health-care facilities: community hospitals, psychiatric institutions and skilled nursing homes. Unless stated otherwise, data are at the national level, and it must be kept in mind that trends may be different at the state and local level. Changes in the number of beds in community hospitals, psychiatric institutions and skilled (Medicare certified) nursing homes from 1970 to 2010 are presented
Percentage
-5
-4
-3
-2
-1
0
1
2
3
4
5
6
7
8
Patient margin
Operating margin
Total margin
20102009200820072006200520042003200220012000199919981997199619951994199319921991

Health systems in transition United States of America168
in Fig. 4.4. Between 1970 and 1990 the number of community hospital beds per 1000 population declined 14%. From 1990 to 2009, the decline was even greater, at 30%. In 2009, the United States had just 2.6 community hospital beds per 1000 persons.
Fig. 4.4Number of beds in United States community hospitals, psychiatric institutions and nursing homes per 1 000 population, 1970–2010
Sources: Centers for Disease Control and Prevention, 2006, 2007, 2008a, 2009a, 2011a. Table 119; 2011a. Table 117; 2003, 2004, 2005, 2006, 2007, 2008a, 2009a, 2011a. Notes: Community hospitals are defined as nonfederal, short-term general and other specialized hospitals. The types of facilities included in the category of community hospitals have changed over time. Psychiatric institutions are defined as all 24-hour psychiatric hospitals and residential treatment organizations. Skilled nursing homes are those that are certified with the Centers for Medicare and Medicaid Services.
The psychiatric institutions represented in Fig. 4.3 include both psychiatric hospitals and residential treatment organizations. The number of beds in these institutions fell 58% from 1970 to 1990, and another 36% from 1990 to 2000, levelling off in 2000. The number of beds is still on a slight decline, however, as the number per 1000 population went from 0.75 in 2000 to 0.71 in 2004, a drop of 5% (Foley et al., 2004).
The number of skilled nursing home beds has also fallen (see Fig. 4.4). From 1990 to 2009 the number of skilled nursing home beds per 1000 population fell nearly 15%. Given the fact that the number of nursing homes increased in this period (see Table 4.1), the decrease in beds indicates that skilled nursing facilities are on average getting smaller.
per 1 000 population
0
1
2
3
4
5
6
7
8
Nursing homes
Psychiatric institutions
Community hospitals
201020092008200720062005200420032002200120001995199019801970

Health systems in transition United States of America 169
In comparison to six other OECD countries, the United States has the smallest number of acute-care hospital beds per population (Table 4.2). Canada, the U.K. and the Netherlands have slightly more hospital beds per population than the United States The Netherlands represents the median number of hospital beds for these seven countries. France has about 30% more acute-care hospital beds than the United States, while Germany has around twice as many and Japan has around three times as many.
Table 4.2Acute-care hospital beds per 1 000 population in seven OECD countries, 2000–2010
2000 2001 2002 2003 2004 2005 2006 2007 2008 2009 2010
Canada 3.2 3.1 3.1 2.9 2.9 2.8 1.8 1.8 1.8 1.7 –
France 4.1 4.0 3.9 3.8 3.7 3.7 3.6 3.6 3.5 3.5 3.5
Germany 6.4 6.3 6.1 6.1 5.9 5.9 5.7 5.7 5.6 5.7 5.7
Japan 9.6 9.3 8.9 8.5 8.4 8.2 8.2 8.2 8.1 8.1 8.1
Netherlands 3.2 3.1 3.2 3.1 3.1 3.1 3.0 2.9 3.1 3.1 3.0
United Kingdom 3.1 3.1 3.1 3.1 3.1 3.0 2.8 2.8 2.7 2.6 2.4
United States 2.9 2.9 2.9 2.8 2.8 2.7 2.7 2.7 2.6 2.6 –
Mean 4.54 4.46 4.33 4.27 4.21 4.13 4.09 3.27 3.60 3.90 3.20
Median 3.2 3.1 3.2 3.1 3.1 3.1 3.0 2.9 3.1 3.1 3.5
Source: AHA, 2009a.
Since 2000 the number of acute hospitals beds per population has fallen in all countries. The greatest decline was in Canada, which experienced an 18% decrease in acute-care hospital beds between 2000 and 2009, while the lowest decline was in the Netherlands, which had only a 6% decrease between 2000 and 2010. The differences in the rate of decrease may be due to several factors, such as political decisions in countries with strong national health systems or strong government regulation of health care (most countries except the United States), the growth of managed care (especially in the United States), changes in reimbursement that discouraged inpatient care and other changes. The lower rate of decrease in the United States may also be because the ratio was low to begin with and there was little room for reducing it more.
The decrease in hospital, psychiatric and nursing home beds per population in the United States in the past decades begs the question of whether there is still adequate physical capacity to care for patients needing these types of institutional care. As far as hospitals are concerned, the indicators in Table 4.3 and Fig. 4.5 suggest that the United States still has adequate acute-care hospital capacity. Table 4.3 shows that patient length of stay has fallen from 7.3 days in

Health systems in transition United States of America170
1990 to 5.4 days in 2010. Combined with a slow growth in inpatient admissions, this has meant that the number of inpatient days in hospitals actually fell between 1970 and 2007 (AHA, 2009b). If inpatient days can be seen as a proxy for demand, and the number of beds a proxy for supply, it would appear that the demand for hospital beds has declined and the decrease in beds has been an appropriate response by hospitals.
Table 4.3Average length of stay in acute-care hospitals in seven OECD countries, 1990–2010
1990 1995 2000 2001 2002 2003 2004 2005 2006 2007 2008 2009 2010
Canada 10.2 7.2 7.2 7.3 7.4 7.3 7.3 7.2 7.4 7.5 7.7 7.7 –
France 7.0 6.2 5.6 5.7 5.7 5.6 5.5 5.4 5.3 5.3 5.2 5.2 5.2
Germany – 10.8 9.2 9.0 8.6 8.3 8.2 8.1 7.9 7.8 7.6 7.5 7.3
Japan – 33.2 24.8 23.5 22.2 20.7 20.3 19.8 19.2 19.0 18.8 18.5 18.2
Netherlands 11.2 9.9 9.0 8.6 8.4 7.9 7.5 7.2 6.6 6.3 6.0 5.6 5.6
United Kingdom – – 8.2 8.6 8.5 8.3 8.1 7.9 7.6 7.2 6.9 6.8 6.6
United States 7.3 6.5 5.8 5.8 5.7 5.7 5.6 5.6 5.6 5.5 5.5 5.4 5.4
Median 8.75 8.55 7.7 7.95 7.9 7.6 7.4 7.2 7.4 7.2 7.7 7.7 –
Source: OECD, September 2012.Notes: – data not available. Average length of stay is computed by dividing the number of days stayed (from the date of admission in an in-patient institution) by the number of discharges (including deaths) during the year. Some countries may include same day separations (counted either as 0 or 1 day), thereby resulting in an under-estimation of average length of stay compared with countries that exclude them. Also, some countries may only include data related to general hospitals, while others might include data also for specialized hospitals (generally involving higher length of stays than in general hospitals). Caution should be exercised when making international comparisons due to the possibility that countries may provide data for different types of institutions.
Fig. 4.5 shows that the occupancy rate – an indicator of capacity – stands at a low 65% in United States hospitals in 2010, nearly the same as it was in 1990. The unchanged occupancy rate indicates that the reduction in the supply of hospital beds just matched the reduced demand over this period. The relatively low occupancy rate indicates that the physical capacity of hospitals is more than adequate at this time.

Health systems in transition United States of America 171
Fig. 4.5Occupancy rates in acute-care hospitals in seven OECD countries, 1990–2010
Source: OECD, September 2012.
In fact, as Fig. 4.5 shows, compared to other OECD countries the United States has had nearly the lowest occupancy rate and patient length of stay in acute-care hospitals since 1990. Only France has had lower patient lengths of stay than the United States, and only the Netherlands has had an occupancy rate lower than the United States (since 2007). The average patient length of stay in Japan is the highest of the seven OECD countries in our comparison. It has been very high – 33.2 days in 1995, down to 18 days in 2010. The occupancy rate has been the highest in Canada, ranging from 78.6% in 1990 to 89% in 2009. The United States is well below the median in all years for both indicators.
The changes in acute-care hospital inpatient volume in the United States is shown in Fig. 4.6, which shows the shift from inpatient to outpatient care between 1990 and 2010. In 1990 only around 20% of United States hospital revenues came from outpatient care. By 2010, over 35% of revenues came from outpatient care. Since this graph only shows the proportion of inpatient and outpatient care in hospitals and does not include outpatient acute care delivered outside hospitals, it only tells part of the story regarding the extent of acute care performed in an outpatient setting.
50
55
60
65
70
75
80
85
90
95
100
United Kingdom
Netherlands
JapanGermanyFrance
Canada
United States
2010200920082007200620052004200320022001200019951990

Health systems in transition United States of America172
Fig. 4.6Distribution of outpatient vs inpatient revenues in hospitals, 1991–2011
Source: AHA, 2012.
To summarize, as indicated by the fall in inpatient days, the demand for inpatient hospital care has fallen over the past decades. More acute care is occurring on an outpatient basis both inside and outside hospitals. Supply has responded as indicated by the reduction in the number of inpatient beds. Occupancy rate has remained at relatively low levels. It appears that the physical capacity of hospitals, specifically the number of beds, has kept pace with the demand for hospital beds and is adequate at this time.
Psychiatric institutional capacity has been affected by the decline in beds over the past decades. A key issue is that the downward trend in psychiatric beds has not been uniform across all types of facility, as Fig. 4.7 shows. The beds in freestanding private psychiatric hospitals, non-federal general hospitals with separate psychiatric services and “all other mental health organizations” increased slightly between 1970 and 2002, while those in state and county institutions decreased from 207 / 100 000 persons in 1970 to 20 / 100 000
Percentage of revenue
0
20
40
60
80
100
201120102009200820072006200520042003200220012000199919981997199619951994199319921991
434241393838373635353535343333
31302827
2524
575859606162636364656565656667676970737576
Gross inpatient revenue
Gross outpatient revenue

Health systems in transition United States of America 173
persons in 2002 (Foley et al., 2004). (“All other mental health organizations” includes freestanding psychiatric outpatient clinics, partial care organizations and multiservice mental health organizations.) To put the change in public institutions into perspective, two reports by the Treatment Advocacy Center indicate that the number of public psychiatric beds per 100 000 went from 340 in 1955 to 14 in 2010 (Torrey et al., 2008, 2012). The latest available data on freestanding psychiatric hospital beds and general acute-care psychiatric beds indicate that between 2002 and 2005 the number of these beds also declined slightly (3%) (Salinsky & Loftis, 2007).
Fig. 4.7Number of beds/ 100 000 population in United States psychiatric facilities by type of facility
Source: Foley et al., 2004. Note: “All other mental health organizations” includes freestanding psychiatric outpatient clinics, partial care organizations and multiservice mental health organizations.
This drop in psychiatric beds reflects a planned transformation of United States psychiatric care from a long-term institutional focus to a short-term inpatient and outpatient focus. The process of deinstitutionalization began in the 1960s in response to revelations of the deplorable conditions in many state mental institutions, in which patients were kept for long periods of time (Salinsky & Loftis, 2007). Public budget tightening also played a role in the shift. The transformation was made possible by the development of antipsychotic and other psychotropic drugs that allowed persons with long-term mental illnesses to live in the community (Salinsky & Loftis, 2007). As long-term institutionalized
0
20
40
60
80
100
120
140
160
180
200
220
240
260
20022000199419901986198019761970
State and county mental hospitals
Private psychiatric hospitals
Non-federal general hospitals with separate psychiatric services
VA medical centres
Residential treatment centres for emotionally disturbed children
All other mental health organizations
Number of beds
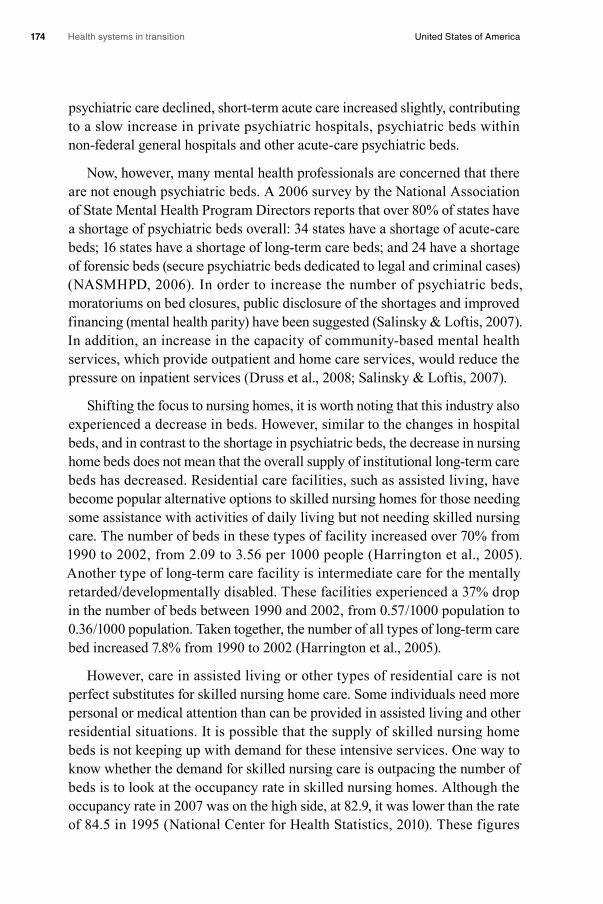
Health systems in transition United States of America174
psychiatric care declined, short-term acute care increased slightly, contributing to a slow increase in private psychiatric hospitals, psychiatric beds within non-federal general hospitals and other acute-care psychiatric beds.
Now, however, many mental health professionals are concerned that there are not enough psychiatric beds. A 2006 survey by the National Association of State Mental Health Program Directors reports that over 80% of states have a shortage of psychiatric beds overall: 34 states have a shortage of acute-care beds; 16 states have a shortage of long-term care beds; and 24 have a shortage of forensic beds (secure psychiatric beds dedicated to legal and criminal cases) (NASMHPD, 2006). In order to increase the number of psychiatric beds, moratoriums on bed closures, public disclosure of the shortages and improved financing (mental health parity) have been suggested (Salinsky & Loftis, 2007). In addition, an increase in the capacity of community-based mental health services, which provide outpatient and home care services, would reduce the pressure on inpatient services (Druss et al., 2008; Salinsky & Loftis, 2007).
Shifting the focus to nursing homes, it is worth noting that this industry also experienced a decrease in beds. However, similar to the changes in hospital beds, and in contrast to the shortage in psychiatric beds, the decrease in nursing home beds does not mean that the overall supply of institutional long-term care beds has decreased. Residential care facilities, such as assisted living, have become popular alternative options to skilled nursing homes for those needing some assistance with activities of daily living but not needing skilled nursing care. The number of beds in these types of facility increased over 70% from 1990 to 2002, from 2.09 to 3.56 per 1000 people (Harrington et al., 2005). Another type of long-term care facility is intermediate care for the mentally retarded / developmentally disabled. These facilities experienced a 37% drop in the number of beds between 1990 and 2002, from 0.57 / 1000 population to 0.36 / 1000 population. Taken together, the number of all types of long-term care bed increased 7.8% from 1990 to 2002 (Harrington et al., 2005).
However, care in assisted living or other types of residential care is not perfect substitutes for skilled nursing home care. Some individuals need more personal or medical attention than can be provided in assisted living and other residential situations. It is possible that the supply of skilled nursing home beds is not keeping up with demand for these intensive services. One way to know whether the demand for skilled nursing care is outpacing the number of beds is to look at the occupancy rate in skilled nursing homes. Although the occupancy rate in 2007 was on the high side, at 82.9, it was lower than the rate of 84.5 in 1995 (National Center for Health Statistics, 2010). These figures

Health systems in transition United States of America 175
indicate that although skilled nursing home bed capacity may be tight, it has not worsened over the past two decades. However, relying on occupancy rate to measure capacity does not take into account unmet demand. One study relates that unmet demand for skilled nursing care can be seen in the placement of high dependency residents in residential care facilities, rather than nursing homes (Netten, Darton & Williams, 2003).
4.1.3 Medical equipment
Medical equipment is another important part of the physical resources needed to provide health care. Diagnostic, surgical and medical equipment are just some of the types of device used. The use of medical equipment has skyrocketed over the past decade as part of the overall increased use of medical technology. This transformation is linked to the changes described earlier. Reduction in hospital length of stay and the provision of more acute care on an outpatient basis require a greater use of medical equipment to quickly diagnose and treat illnesses and conditions, both within and outside the institutional setting. In turn, the development of new technology enables that transformation of care (Danzon & Pauly, 2001).
Medical equipment is funded in part through reimbursement from the three major payers in United States health care: Medicare, Medicaid and private insurance companies. These payers indirectly contribute to the costs of medical equipment in medical facilities, and directly cover the costs of medical equipment to individuals. Payment to medical facilities is made as part of the overall reimbursement for care. Costs of acquiring and maintaining medical equipment are wrapped into discounted FFS, per diem, DRG, APC and other payments for care from insurance and the government (Tunis & Kang, 2001). Individuals who need to use medical equipment, such as breathing, diagnostic or transportation equipment, in their homes are reimbursed for all or part of the costs of the equipment if it is deemed necessary and covered by the payer. Individuals who do not have insurance coverage for the equipment have to pay out of pocket for the item. Often, medical equipment used by individuals in their homes is rented.
The costs of some equipment may not be reimbursed by the payer. Medicare, for example, pays hospitals for most technologies, and the devices or equipment that go with the technology, out of bundled payments (DRGs or APCs) for treating a particular condition (see Box 3.4). Technologies that don’t fit into the bundled payment category must undergo a review process in which clinical evidence is provided showing that the benefits of the technology and devices

Health systems in transition United States of America176
outweigh the harm. With new devices the danger is that there may be a period of time in which there is no revenue stream to back up the purchase. The same exclusions on new technologies and devices exist with Medicaid and private insurance.
The reimbursement for the costs of medical equipment in health-care facilities is amortized over time, while the initial purchase price must be met up front. Hospitals considering the purchase of big ticket items, for example MRI machines, may utilize the same set of financing mechanisms discussed in the section on capital investment (and equipment is part of capital investment). Common methods of investment include tax-exempt bonds, bank debt, standard leasing, tax-exempt leasing and equipment rental (Conbeer, 2007).
Availability of medical equipment depends on the size and location of the facility, the acceptance of the technology by payers and regulations. Rural and small hospitals adopt medical technology more slowly than do larger and urban ones (Hartley & Christianson, 1996). Equipment falling into the category of new technologies may be scarce due to lack of reimbursement for the related services by public and private payers (Danzon & Pauly, 2001). Large expensive items, such as CT scanners and MRIs, may be regulated by state CON laws (see section 2.8.6) (Rivers, Fottler & Frimpong, 2010).
There are few data on the quality and quantity of specific medical devices in the United States. Two pieces of equipment that are tracked are computerized axial tomography (CT) scanners and magnetic resonance imaging (MRI) machines. Table 4.4 presents the numbers of those machines per million population from 1990 to 2011 for the United States and six other OECD countries. The United States has more of both machines per population than most of the other countries: currently up to four to six times more than in the United Kingdom for both, and around four times more than France for both. The United States had around 10 times as many MRI units as Canada and France until 2001, at which time the rate of growth of these units increased in Canada. In France the rate of growth did not pick up until 2004. There are few data points for Japan, but it appears that it is the one country with more CT scanners and MRI units than the United States.

Health systems in transition United States of America 177
Table 4.4Number of CT scanners and MRI units per million population in seven OECD countries, 1990–2011
1990 1995 2000 2001 2002 2003 2004 2005 2006 2007 2008 2009 2010 2011
CT scanners
Canada a 7.1 8.0 – 9.8 – 10.5 10.8 11.5 12.0 12.7 – 13.8 14.2 15.1
France 6.7 9.2 9.5 9.0 9.7 8.4 7.5 9.8 10.0 10.3 10.8 11.1 11.8 12.5
Germany b – 9.0 12.7 13.3 14.2 14.7 15.4 – – – 16.7 17.2 17.7 –
Japan c 55.2 – – – 92.6 – – – – – 97.3 – – –
Netherlands – – – – – – – 8.2 8.4 – 10.2 11.2 12.3 –
United Kingdom d – – 4.5 5.8 7.1 6.7 7.0 7.5 7.6 – 7.3 – 8.2 8.9
United States e – – – 28.9 – 29.2 32.2 – 34.0 34.3 – – – 40.7
MRI units
Canada a 0.7 1.4 2.5 4.2 – 4.6 4.9 5.7 6.2 6.7 – 7.9 8.2 8.6
France 0.8 2.1 2.6 2.4 2.7 2.8 3.2 4.7 5.3 5.7 6.1 6.4 6.9 7.5
Germany b – 2.3 4.9 5.5 6.0 6.2 6.6 – – – 8.7 9.7 10.3 –
Japan c 6.1 – – – 35.3 – – – – – 43.1 – – –
Netherlands – – – – – – – 6.6 – – 10.4 10.9 12.2 –
United Kingdom d – – 4.7 5.2 4.8 4.4 5.0 5.4 5.6 5.6 5.5 – 5.9 5.9
United States e – 12.3 – 20.1 – 21.9 26.6 – 26.5 25.9 – – 31.5 –
Sources: Centers for Disease Control and Prevention, 2007, Table 119; OECD, September 2012.Notes: – data not available. a The number of units in freestanding imaging facilities was imputed for years prior to 2003 based on data collected in the 2003 National Survey of Selected Medical Imaging Equipment, conducted by the Canadian Institute for Health Information. MRI units in Quebec are not included in 2000. b The data include equipment installed in acute-care hospitals and prevention and rehabilitation homes. c Prior to 2000, the data include only equipment in hospitals. d The data include devices in public sector establishments only. 2006 is estimated. e Data are from the MRI Census and are comparable to the OECD definition. The devices in United States territories are not included.
The sufficiency of medical equipment in the United States has not been studied. It is possible that there is an urban–rural or regional maldistribution of medical equipment and technology, with rural areas and certain regions having less supply. Indirectly, studies have shown that there are regional differences in health-care spending and utilization (Wennberg, Fisher & Skinner, 2002; Song et al., 2010), which could indicate regional differences in medical equipment.
Most discussion related to the supply of medical equipment focuses on the appropriate use of medical technology. The issue is whether technology is being used in an appropriate and efficient manner. The comparison above showing the United States out in front of other OECD countries with regard to the number of CT scanners and MRI units per population suggests that the United States may not make efficient use of medical technology and equipment. Other evidence from the 1990s points to the same conclusion: the United States had three times more cardiac surgery units and catheterization laboratories and twice as many coronary artery bypass graft surgeries than most developed nations (Bodenheimer, 2005). These data from the 1990s must be interpreted with

Health systems in transition United States of America178
caution, however, as more recent data may show that the differences between the United States and other nations are narrowing. Also, it must be kept in mind that the United States has one of the lowest average patient lengths of stay of OECD countries and that there may be a synergy between inpatient utilization and the use of medical technology.
There is no consensus among United States health-care economists and policy analysts over whether the United States has the right amount of medical technology. One group believes that the benefits of technology outweigh the costs (Cutler & McClellan, 2001). An example is the ability through technology to perform more surgeries on an outpatient basis, thus reducing hospital-acquired infections and costs of care (Morrisey, 2006). Another group believes that technologies are overused or misused and that new technologies may not be more effective than existing ones (Bodenheimer, 2005; Robinson, 2008). An example is the proliferation of “me-too” drugs that have not demonstrated therapeutic gains over the older medications yet cost much more (Angell, 2004).
4.1.4 Information technology
Health information technology (HIT), defined as the application of computers and related technologies in health-care settings, has become an important part of health care (Hersh, 2009). On the provider side, much of the medical record-keeping, decision-making, imaging and prescribing can now be aided by computer and internet data storage, organization and retrieval, and computers are integrated into the operation of medical devices (see also section 2.7.2). On the consumer side, the internet has become a source of information (and misinformation) on health care, and patients may be able to communicate with doctors through email (see also sections 2.7.2 and 2.9.1). HIT is slowly transitioning to integrate the provider and consumer sides so that patients can view and add to their medical record online (Hogan & Kissam, 2010) (see also section 2.7.2).
The growth of HIT is driven in part by the desire to improve patient safety and increase the efficiency and quality of health-care delivery. There is some evidence that certain EHR functions, such as clinical decision support and computerized physician order entry, can improve safety and quality and reduce unnecessary care (DesRoches et al., 2010). HIT has been shown to make an improvement in adherence to clinical guidelines, to increase surveillance and monitoring, and to reduce medication errors (Chaudry et al., 2006). Efficiency gains in terms of provider time have not been consistent,but instead seem to be related to the specific system and application. For example, it appears

Health systems in transition United States of America 179
that the use of bedside charting and point-of-care systems reduces nurses’ documentation time but increases doctors’ documentation time, while the use of centralized computers for physician ordering also increases physician work time (Poissant et al., 2005). A more consistent efficiency gain is decreased health services utilization (Chaudry et al., 2006).
Increasing the use of information technology in health care has been a policy priority since 2004. In that year, a series of federal initiatives were begun that led to the 2009 enactment of the HITECH Act as part of the ARRA (DesRoches et al., 2010). The ARRA provides $20 billion in grants and financial incentives to promote the adoption of EHRs among health-care providers. Providers must show that their HIT adoptions have “meaningful use” by 2012 before they receive federal dollars (DesRoches et al., 2010). “Meaningful use” means that providers must have systems that include several core components, including electronic patient history, electronic prescribing, health information exchange (sharing clinical data among clinicians and hospitals), automated reporting of quality performance, and at least one clinical decision support tool (Jha et al., 2010).
Despite the policy emphasis on greater integration of HIT in health care, the adoption of HIT systems in health-care settings in the United States has been slow. One of the primary reasons appears to be that HIT systems are very expensive to implement and maintain (Christensen & Remler, 2009; Goldzweig et al., 2009). Another reason is practitioner reluctance to use the systems (Goldzweig et al., 2009).
The latest data from a 2008 survey of 2758 physicians indicates that only 4% have a comprehensive EHR system in their office (DesRoches et al., 2008). A comprehensive system was defined as having all components in four functions: (1) patient records for clinical and demographic data; (2) laboratory tests and imaging; (3) CPOE, including prescriptions; and (4) clinical decision-making support, including warning about drug interactions and contraindications. Thirteen per cent of physicians have a basic system, defined as having fewer components in each of the first two functions, having only prescription capabilities in the order entry function and having no decision support capabilities. Between 75% and 85% of doctors are using EHR functions that meet some of the “meaningful use” criteria.
Using similar definitions of comprehensive and basic EHR systems, an AHA survey of 4493 hospitals in 2009 found that only 2.7% had a comprehensive system (Jha et al., 2010). The percentage of hospitals with basic systems that included physician and nurses’ notes was 9.2%, up from 7.2% the year before

Health systems in transition United States of America180
(Jha et al., 2010). Critical access, small, public, non-teaching and rural hospitals were less likely to have adopted an EHR system in the last year than large, private, teaching and urban hospitals.
The degree to which individual EHR functions are integrated throughout a hospital varies. The same 2009 survey of hospitals found that 85% of hospitals had electronic radiology reports in at least one unit, but only 33% had CPOE for medications and electronic physicians’ notes in at least one unit, and 32% had electronic clinical guidelines in at least one unit (Jha et al., 2010).
In 2009, only 2% of United States hospitals had EHRs that met all the federal “meaningful use” criteria (Jha et al., 2010). Fifty-three per cent met five or more of the nine core measures and twenty-one per cent only needed to add one or two more components to meet the core criteria. The components that hospitals tended to lack were the health information exchange function, the drug warning system, the data reporting capability and CPOE for medications.
United States consumers have also begun to use information technology in their health behaviours (for a discussion about the information available to consumers, see section 2.9.1). The consumer use of internet and email for health information and management has been aided by the increased use of personal computers and the internet in the home and school settings since the mid-1980s. Smart phones with health-care applications are also coming on the scene (Sarasohn-Kahn, 2010). The United States Census Bureau reports that in 1984 only 8% of the United States population had a computer in their home, and in 1997 only 18% had internet service in their home (U.S. Census Bureau, 2009). By 2003, 62% of American households owned at least one computer, and 55% had internet connection. In 2010, 77% of households owned a computer and 71% had internet connection (OECD, 2012a). This utilization was less than that of the six OECD comparison countries in this book (76 – 92% for the ownership of a computer and 74 – 91% for internet service) (OECD, 2012a). Most primary and secondary school students also have access to computers at school (DeBell & Chapman, 2006). The use of computers is not the same across racial, socioeconomic and educational groups, however. A survey of school-age children in 2003 found that computer and internet use are higher among Whites and Asians than Blacks and Hispanics, among those with higher income, and among those in more educated households (DeBell & Chapman, 2006).
A growing number of adults who have access to computers and the internet make use of these technologies for their health care. Of the adult respondents who had internet access in 2010, approximately 80% used the internet to search for information about health or health care (Fox, 2011).
Health systems in transition United States of America 181
4.2 Human resources
4.2.1 The United States health-care workforce
Due to the fact that health care is a complex set of services provided in a variety of settings, it is not surprising that the human resources needed to provide these services are also varied and complex. The United States Bureau of Labor Statistics (BLS) categorizes health-care personnel into three main categories: “healthcare diagnosing and treating practitioners”, “healthcare technologists and technicians” and “healthcare support occupations” (BLS, 2011a,b). The first category includes practitioners with both diagnostic and treatment capabilities, such as chiropractors, dentists, optometrists, physicians, podiatrists, pharmacists, registered nurses (RNs) and physician assistants. It also includes a large grouping of therapists with diagnostic and treatment roles: occupational, physical, respiratory, speech-language and other therapists. In providing their specialized care these therapists consult and practise with other health professionals. The second category is comprised of a large number of technologists and technicians, such as clinical laboratory technologists and technicians, dental hygienists, licensed practical (vocational) nurses (LPNs) and medical record technicians. The distinction between technologist and technician involves the level of education, which is longer for technologists, and work roles, which are more complex and analytical for technologists. In addition, technologists may supervise the work of technicians. The last category is the health-care support occupations, some examples of which are several types of aide (nursing, psychiatric and home health) and dental assistants.
Box 4.1 lists some of the important occupations under each of the three BLS categories and provides a brief summary of the BLS descriptions of a selection of these occupations at the time of publication. The box includes a description of one type of health-care worker that is not currently tracked by the BLS – the community health worker (CHW), also called community health advisers, lay health advocates, community health representatives, peer health promoters and other titles.

Health systems in transition United States of America182
Box 4.1The United States health-care workforce
Health-care diagnosing and treating practitioners
Physicians form the second largest health-care occupation in the United States. Physicians diagnose illnesses and prescribe and administer treatment for people suffering from illnesses. They can be generalists (also known as primary care physicians) or specialists. Primary care areas are family practice, internal medicine, paediatrics and obstetrics–gynaecology. Primary care is usually the first contact the patient has with the health-care system for each episode of care. Physicians in these areas diagnose and treat a wide variety of conditions and tend to remain with the same patient for a period of time. Areas of specialties include general surgery, neurology, neurosurgery, cardiology, cardiac surgery, radiology and psychiatry. Physicians in these areas see patients for one specific need and may not follow the patient over time. Physicians are also divided into two main groups: doctors of medicine (MDs) or doctors of osteopathy (DOs). While both types of physician are similar in their use of all accepted methods of treatment, DOs differ from MDs in their emphasis on the musculoskeletal system, and preventive, holistic care.
Over 70% of physicians work in ambulatory care settings and most of these own their own practice, either solo, with partners, or through a physician group (Liebhaber & Grossman, 2007). Practices tend to be single-specialty, although the size of physician practices has been increasing: the number of practices with fewer than six physicians decreased from 1996 to 2005 while the number of practices with six or more physicians increased (Liebhaber & Grossman, 2007). In this same period physician ownership of their practices declined from 62% to 54% (Liebhaber & Grossman, 2007). Non-ownership options for physicians practising in ambulatory care include employment in HMOs and physician practice management companies. In 2005 only 12% of physicians worked in hospitals (as hospitalists or chiefs of medical staff) and another 10% in other institutional settings such as community health and long-term care settings (Liebhaber & Grossman, 2007). Nine per cent of physicians in 2005 were employed as faculty in medical schools.
Chiropractors, dentists, optometrists and podiatrists diagnose and treat patient conditions in the following respective areas: musculoskeletal, oral (teeth and mouth), eyes and feet.
Pharmacists oversee the dispensing of prescription drugs to individuals. They interact with health-care providers and patients, advising them on the selection, dosage, interactions and side-effects of medications. They also work with physicians and other health-care providers to monitor patients on medications to make sure that the medications are being taken properly and that levels of the medication are within recommended limits.
Registered nurses (RNs) are the largest health-care occupation in the United States. It is no wonder, since their roles span those of an independent specialized practitioner, some with a scope of practice similar to a primary care physician (advanced practice RNs such as NPs), to home care and bedside care givers employed in health-care institutions such as hospitals, home health agencies and nursing homes.
Over 90% of employed RNs work in patient care settings, with 62% in hospitals, 10.5% in ambulatory care, 8% in public and community health, 6.4% in home health and 5.3% in long-term care (BHPr, 2010). Only 3.8% work in academic settings and 4% in insurance, and other non-patient care settings. In hospitals, RNs are likely to be staff nurses, managers, patient coordinators and educators. Advanced practice RNs (APRNs) – just over 6% of the RN workforce in 2008 – include nurse practitioners, nurse anaesthetists, nurse midwives and clinical nurse specialists. Nurse practitioners and nurse midwives tend to work in

Health systems in transition United States of America 183
Box 4.1 – continuedThe United States health-care workforce
community settings where they provide primary health care to women, families and children, whereas nurse anaesthetists and nurse clinicians tend to work in hospitals and other institutional settings.
The duties of APRNs are determined by state law. APRNs practise independently or with limited physician oversight in 43 states. In many states they can diagnose conditions, refer patients to other providers, order tests and prescribe certain drugs (Friedman, 2008). APRNs may practise as nurse practitioners, nurse anaesthetists, nurse midwives and clinical nurse specialists (Whitcomb, 2006).
Physician assistants (PAs) provide diagnostic, therapeutic and preventive health-care services under the supervision of physicians. PAs may work in primary care areas, such as general internal medicine, paediatrics and family medicine, or in specialties such as general surgery, thoracic surgery, emergency medicine, orthopaedics and geriatrics. PAs should not be confused with medical assistants, who perform routine clinical and clerical tasks.
The duties of PAs are determined by state law. PAs are licensed to practise medicine with physician supervision. They may perform examinations, diagnose, order tests and treatments and prescribe certain medications. These health-care professionals may be the principal care providers in rural or inner-city clinics.
Occupational therapists (OTs) work with patients who are disabled or injured to help them improve their ability to perform activities of daily living and to recover or develop new work skills. For patients with permanent loss of function, OTs help them find ways to compensate for the loss.
Physical therapists (PTs) diagnose and treat patients with illnesses or injuries that limit movement and physical function. They focus on improving patient movement, pain reduction, restoration of physical function to the highest degree possible and prevention of disability if possible. PTs also work to prevent loss of mobility and improve patients’ health by promoting fitness and wellness-oriented programmes.
Respiratory therapists (RTs) care for patients with cardiopulmonary (heart and lung) disorders. They practise under the direction of physicians and consult with physicians and other health-care staff. They are responsible for supervising and providing all respiratory care therapeutic treatments and diagnostic procedures. RTs typically care for patients on ventilators in intensive care units of hospitals, a role that requires a high level of independent judgement.
Speech-language therapists (pathologists) diagnose and treat disorders of speech, language, cognition, communication and swallowing. They diagnose speech and language problems and work with patients and families to improve these problems in patients to the highest degree possible.
Health-care technologists and technicians
Clinical laboratory technologists and technicians, also known as medical technologists and technicians respectively, perform laboratory testing for the detection, diagnosis and treatment of disease.
Dental hygienists perform dental examinations, cleaning and education of patients. The tasks they may perform may vary by state.

Health systems in transition United States of America184
Box 4.1 – continuedThe United States health-care workforce
Licensed practical or vocational nurses (LPNs or LVNs) provide basic bedside care – under the direction of physicians and registered nurses – for people who are sick, injured, convalescent or disabled. They perform technical aspects of care such as taking patients’ vital signs, giving injections, drawing blood, monitoring intravenous lines, inserting and monitoring urinary catheters, dressing wounds and other such care. They may assist patients with bathing, dressing, feeding, moving in bed, standing and walking.
Medical records and health information technicians maintain patients’ health information and medical records. This includes the patient’s history, symptoms, diagnostic and treatment orders and results, and other health-care provider services. Technicians must ensure that patients’ medical records are accurate, accessible and secure. Their work entails regular communication with physicians and other health-care professionals to clarify or obtain additional information. With the increasing use of EHRs, many of these technicians work with EHR computer software.
Health-care support occupations
Nurses’ aides (nursing assistants or unlicensed assistive personnel) work in institutions such as hospitals and nursing homes and perform routine tasks under the supervision of nurses and physicians. Nurses’ aides may or may not be required to be certified by the state. They help patients with activities of daily living such as eating, dressing, feeding, bathing and mobility. They also escort patients, answer call lights, deliver messages, serve meals and make beds. Nurses’ aides may be responsible for routine nursing care such as taking a patient’s vital signs. In nursing homes, nursing aides are the principal caregivers and have the greatest contact with the residents.
Psychiatric aides care for mentally or emotionally impaired individuals in psychiatric units and facilities. These aides typically work under the direction of psychiatric nurses. In addition to helping patients with activities of daily living, they socialize with patients and work with patients in recreational activities, observing and reporting on patient status to the professional staff.
Home health aides and personal and home care aides help people who require personal care in their homes, residential facilities, hospices and day programmes. As with other types of aide, they work under the supervision of a nurse. They may provide long-term care for individuals with physical or mental problems who need more care than family members can provide, or they may provide short-term care to individuals who are recovering from illness or surgery (such as someone just discharged from hospital). Personal care aides may do light housekeeping jobs such as washing clothes, shopping for food, preparing meals and accompanying patients on errands or to medical appointments.
Dental assistants work under the supervision of a dentist in dental offices. They prepare dental instruments, update records and assist the dentist with procedures.
Community health workers (CHWs) are lay members of communities who work either for pay or as volunteers under the supervision of health-care professionals in urban and rural community health-care settings (HRSA, 2007). Since CHWs often have community and ethnic ties they may provide interpreting and translation services, culturally appropriate health education and informal counselling, and are therefore ideal conduits for reducing health-care disparities (HRSA, 2007). CHWs may provide some hands-on services such
Health systems in transition United States of America 185
4.2.2 Trends in the United States health-care workforce and international comparisons
Table 4.5 presents the numbers of workers employed in the United States in the occupations described above (with the exception of CHWs) from 1990 to 2010. Unless stated otherwise, data are at the national level and it must be remembered that trends may be different at the state level. Increases in employment occurred with physicians, chiropractors, optometrists, pharmacists, registered nurses (RNs), physician assistants (PAs), all the therapist occupations, most of the technologist and technician occupations, and all the support occupations. The increases in PAs, and several types of therapists were significant – greater than 70%. Decreases in employment occurred with dentists, podiatrists, and clinical laboratory technologists and technicians. What is noteworthy about these trends is that most decreases occurred in the higher paid professional occupations. In some of these occupations (such as dentist), one can see a decrease in the number of professionals but an increase in the corresponding technical (dental hygienist) and support (dental assistant) occupations, indicating substitution of the professional workforce by technical and non-professional workers. The moderate increases in physicians and RNs, and the large increases in PAs and therapists do not seem to be due to a per capita increase in utilization of services, since hospital admissions and days of care decreased and outpatient visits to physicians and for screenings (such as mammograms) increased only slightly in this time period (National Center for Health Statistics, 2011). The increase in RNs and PAs may indicate increasing reliance on these professionals for primary health care (Hooker & McCaig, 2001; Naylor & Kurtzman, 2010).
Box 4.1 – continuedThe United States health-care workforce
as first aid and screening. They may help patients with filling out insurance applications, following treatment plans, and working out their wellness or disease management goals (Bielaszka-DuVernay, 2011). They may go with patients to appointments or help them find transport or child care.
The use of CHWs in the United States is growing, particularly now that the country is in a period of professional workforce shortages and tight state and federal budgets. Using CHWs in the health-care team is also in line with the WHO, which in 2006 called for “a health workforce which is matched in number, knowledge and skill sets to the needs of the population and which contributes to the achievement of health outcomes by utilizing a range of innovative methods” (WHO, 2006).
Sources: BLS (2011b) and references noted in box text.
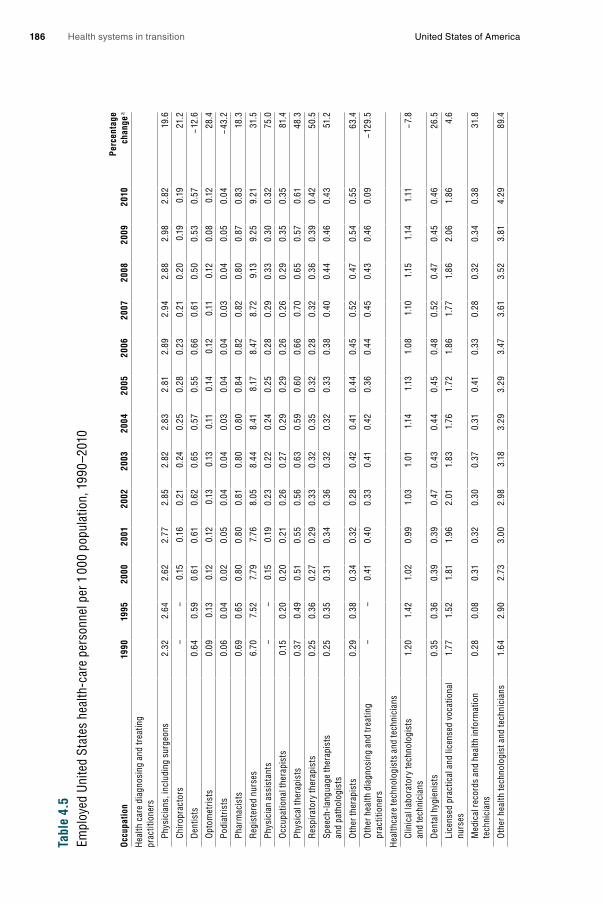
Health systems in transition United States of America186
Tabl
e 4.
5Em
ploy
ed U
nite
d St
ates
hea
lth-c
are
pers
onne
l per
1 0
00 p
opul
atio
n, 1
990–
2010
Occ
upat
ion
1990
1995
2000
2001
2002
2003
2004
2005
2006
2007
2008
2009
2010
Perc
enta
ge
chan
ge a
Hea
lth c
are
diag
nosi
ng a
nd tr
eatin
g pr
actit
ione
rs
Ph
ysic
ians
, inc
ludi
ng s
urge
ons
2.32
2.64
2.62
2.77
2.85
2.82
2.83
2.81
2.89
2.94
2.88
2.98
2.82
19.6
Ch
iropr
acto
rs
––
0.15
0.16
0.21
0.24
0.25
0.28
0.23
0.21
0.20
0.19
0.19
21.2
D
entis
ts
0.64
0.59
0.61
0.61
0.62
0.65
0.57
0.55
0.66
0.61
0.50
0.53
0.57
− 12.
6
O
ptom
etris
ts
0.09
0.13
0.12
0.12
0.13
0.13
0.11
0.14
0.12
0.11
0.12
0.08
0.12
28.4
Po
diat
rists
0.
060.
040.
020.
050.
040.
040.
030.
040.
040.
030.
040.
050.
04− 4
3.2
Ph
arm
acis
ts
0.69
0.65
0.80
0.80
0.81
0.80
0.80
0.84
0.82
0.82
0.80
0.87
0.83
18.3
R
egis
tere
d nu
rses
6.
707.
527.
797.
768.
058.
448.
418.
178.
478.
729.
139.
259.
2131
.5
Ph
ysic
ian
assi
stan
ts
––
0.15
0.19
0.23
0.22
0.24
0.25
0.28
0.29
0.33
0.30
0.32
75.0
O
ccup
atio
nal t
hera
pist
s 0.
150.
200.
200.
210.
260.
270.
290.
290.
260.
260.
290.
350.
3581
.4
Ph
ysic
al th
erap
ists
0.
370.
490.
510.
550.
560.
630.
590.
600.
660.
700.
650.
570.
6148
.3
R
espi
rato
ry th
erap
ists
0.
250.
360.
270.
290.
330.
320.
350.
320.
280.
320.
360.
390.
4250
.5
Sp
eech
-lang
uage
ther
apis
ts
an
d pa
thol
ogis
ts
0.25
0.35
0.31
0.34
0.36
0.32
0.32
0.33
0.38
0.40
0.44
0.46
0.43
51.2
O
ther
ther
apis
ts0.
290.
380.
340.
320.
280.
420.
410.
440.
450.
520.
470.
540.
5563
.4
O
ther
hea
lth d
iagn
osin
g an
d tr
eatin
g
pr
actit
ione
rs–
–0.
410.
400.
330.
410.
420.
360.
440.
450.
430.
460.
09− 1
29.5
Hea
lthca
re te
chno
logi
sts
and
tech
nici
ans
Cl
inic
al la
bora
tory
tech
nolo
gist
s
an
d te
chni
cian
s 1.
201.
421.
020.
991.
031.
011.
141.
131.
081.
101.
151.
141.
11− 7
.8
D
enta
l hyg
ieni
sts
0.35
0.36
0.39
0.39
0.47
0.43
0.44
0.45
0.48
0.52
0.47
0.45
0.46
26.5
Li
cens
ed p
ract
ical
and
lice
nsed
voc
atio
nal
nu
rses
1.
771.
521.
811.
962.
011.
831.
761.
721.
861.
771.
862.
061.
864.
6
M
edic
al re
cord
s an
d he
alth
info
rmat
ion
tech
nici
ans
0.28
0.08
0.31
0.32
0.30
0.37
0.31
0.41
0.33
0.28
0.32
0.34
0.38
31.8
O
ther
hea
lth te
chno
logi
st a
nd te
chni
cian
s1.
642.
902.
733.
002.
983.
183.
293.
293.
473.
613.
523.
814.
2989
.4
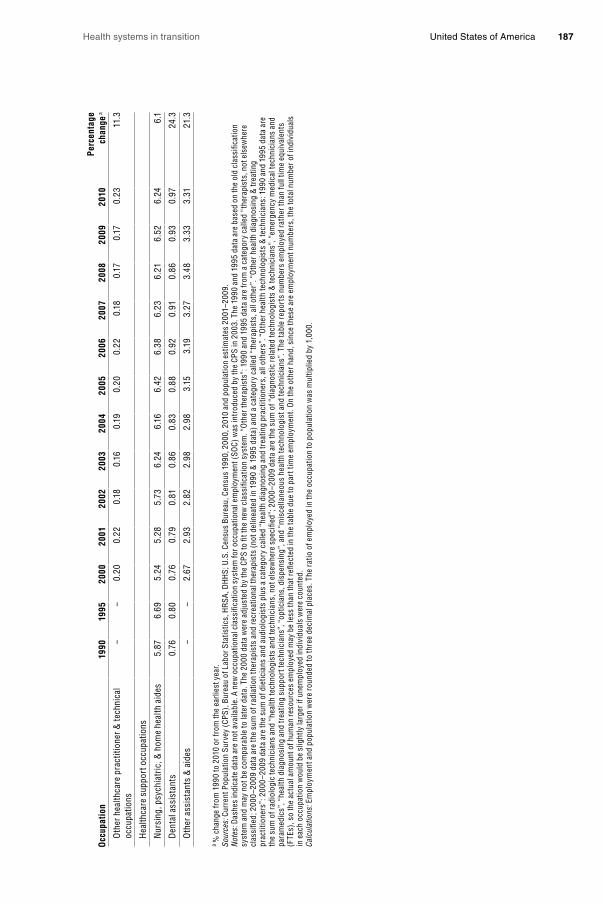
Health systems in transition United States of America 187
Occ
upat
ion
1990
1995
2000
2001
2002
2003
2004
2005
2006
2007
2008
2009
2010
Perc
enta
ge
chan
ge a
O
ther
hea
lthca
re p
ract
ition
er &
tech
nica
l
occu
patio
ns
––
0.20
0.22
0.18
0.16
0.19
0.20
0.22
0.18
0.17
0.17
0.23
11.3
H
ealth
care
sup
port
occ
upat
ions
N
ursi
ng, p
sych
iatr
ic, &
hom
e he
alth
aid
es
5.87
6.69
5.24
5.28
5.73
6.24
6.16
6.42
6.38
6.23
6.21
6.52
6.24
6.1
D
enta
l ass
ista
nts
0.76
0.80
0.76
0.79
0.81
0.
860.
830.
880.
920.
910.
860.
930.
9724
.3
O
ther
ass
ista
nts
& a
ides
––
2.67
2.93
2.82
2.98
2.98
3.15
3.19
3.27
3.48
3.33
3.31
21.3
a %
cha
nge
from
199
0 to
201
0 or
from
the
earli
est y
ear.
Sour
ces:
Cur
rent
Pop
ulat
ion
Surv
ey (
CPS)
, Bur
eau
of L
abor
Sta
tistic
s, H
RSA
, DH
HS;
U.S
. Cen
sus
Bure
au, C
ensu
s 19
90, 2
000,
201
0 an
d po
pula
tion
estim
ates
200
1–20
09.
Not
es: D
ashe
s in
dica
te d
ata
are
not a
vaila
ble.
A n
ew o
ccup
atio
nal c
lass
ifica
tion
syst
em fo
r occ
upat
iona
l em
ploy
men
t (SO
C) w
as in
trod
uced
by
the
CPS
in 2
003.
The
199
0 an
d 19
95 d
ata
are
base
d on
the
old
clas
sific
atio
n sy
stem
and
may
not
be
com
para
ble
to la
ter d
ata.
The
200
0 da
ta w
ere
adju
sted
by
the
CPS
to fi
t the
new
cla
ssifi
catio
n sy
stem
. “O
ther
ther
apis
ts”:
199
0 an
d 19
95 d
ata
are
from
a c
ateg
ory
calle
d “t
hera
pist
s, n
ot e
lsew
here
cl
assi
fied;
200
0–20
09 d
ata
are
the
sum
of r
adia
tion
ther
apis
ts a
nd re
crea
tiona
l the
rapi
sts
(not
del
inea
ted
in 1
990
& 1
995
data
) and
a c
ateg
ory
calle
d “t
hera
pist
s, a
ll ot
her”
. “O
ther
hea
lth d
iagn
osin
g &
trea
ting
prac
titio
ners
”: 2
000–
2009
dat
a ar
e th
e su
m o
f die
ticia
ns a
nd a
udio
logi
sts
plus
a c
ateg
ory
calle
d “h
ealth
dia
gnos
ing
and
trea
ting
prac
titio
ners
, all
othe
rs”.
“Oth
er h
ealth
tech
nolo
gist
s &
tech
nici
ans:
199
0 an
d 19
95 d
ata
are
the
sum
of r
adio
logi
c te
chni
cian
s an
d “h
ealth
tech
nolo
gist
s an
d te
chni
cian
s, n
ot e
lsew
here
spe
cifie
d”; 2
000–
2009
dat
a ar
e th
e su
m o
f “di
agno
stic
rela
ted
tech
nolo
gist
s &
tech
nici
ans”
, “em
erge
ncy
med
ical
tech
nici
ans
and
para
med
ics”
, “he
alth
dia
gnos
ing
and
trea
ting
supp
ort t
echn
icia
ns”,
“opt
icia
ns, d
ispe
nsin
g”, a
nd “
mis
cella
neou
s he
alth
tech
nolo
gist
and
tech
nici
ans”
. The
tabl
e re
port
s nu
mbe
rs e
mpl
oyed
rat
her t
han
full
time
equi
vale
nts
(FTE
s), s
o th
e ac
tual
am
ount
of h
uman
reso
urce
s em
ploy
ed m
ay b
e le
ss th
an th
at re
flect
ed in
the
tabl
e du
e to
par
t tim
e em
ploy
men
t. O
n th
e ot
her h
and,
sin
ce th
ese
are
empl
oym
ent n
umbe
rs, t
he to
tal n
umbe
r of i
ndiv
idua
ls
in e
ach
occu
patio
n w
ould
be
slig
htly
larg
er if
une
mpl
oyed
indi
vidu
als
wer
e co
unte
d.Ca
lcul
atio
ns: E
mpl
oym
ent a
nd p
opul
atio
n w
ere
roun
ded
to th
ree
deci
mal
pla
ces.
The
rat
io o
f em
ploy
ed in
the
occu
patio
n to
pop
ulat
ion
was
mul
tiplie
d by
1,0
00.

Health systems in transition United States of America188
Changes in BLS classification may be responsible for some of the changes. The large increase in the “other” category of therapists may be due to changes in BLS inclusion criteria for that occupation. The decrease in podiatrists may also reflect changes in the BLS occupational classification system since the values changed significantly in 2000, and the trend since 2000 shows an increase in numbers.
Since there is no BLS occupational code for reporting numbers of CHWs, there are no official estimates of the number of CHWs in the United States. A recent survey by the Health Resources and Services Administration (HRSA) estimated their numbers by approximating the percentage of workers in occupations in which CHWs were likely to have been included in BLS reports. HRSA reported that in 2000 there were approximately 86 000 CHWs (HRSA, 2007). California and New York had the most (8000 – 9000 each).
Figs 4.8 – 4.11 provide a seven-country international comparison of trends in doctors, nurses, pharmacists and dentists respectively. Comparisons must be made with caution due to differences in the data collected from country to country and over time. Most of the data are of head counts of the professionals while some report full-time equivalents (FTEs). Countries may also differ in whether they report all licensed professionals, only those who are professionally active or only those who are practising in direct care. Definitions of these categories are in the tables.
Fig. 4.8 demonstrates that three of seven OECD countries – France, Germany and the Netherlands – tend to utilize a greater number of physicians per population than the remaining four. Of those three, the Netherlands’ physician to population ratio grew the most, making it the country with the highest ratio from 2004 to 2008 (note that the Netherlands reported the number of licensed physicians, which will be higher than the number of professionally active or practising physicians). Of the four countries with lower physician to population ratios, the United Kingdom’s ratio started at the bottom in 1990 and increased to be the highest of the four by 2010. The United States was just below the United Kingdom in 2010. Canada had very little change in physician to population ratio in these years.

Health systems in transition United States of America 189
Fig. 4.8Physicians per 1 000 population in seven OECD countries, 1990–2010
Source: OECD Health Data, September 2012. Notes: a Data from Germany, Japan, United Kingdom, United States = number of practising physicians; from Canada, France = number of professionally active physicians; from Netherlands = number of licensed physicians. Practising physicians provide services directly to patients. Professionally active physicians include practising physicians plus those who work outside direct patient care. Licensed physicians are all physicians who hold a licence, whether working directly with patients, working outside patient care or not working.
Fig. 4.9 plots the trends in nurses from 2000 to 2010. (Data were not available for international comparisons prior to 2000.) The United States had the highest nurse to population ratios of all seven countries in all years except 2010, though the ratio has increased the least. It may be that the numbers are higher because the United States includes licensed practical nurses in the count while other countries may not include a comparable category of nurse. Ratios in Germany, the Netherlands and the United Kingdom are also high and grew moderately over the eight years. Ratios in Canada actually fell from 2000 to 2004. France had the lowest ratio through all years, and even though the ratio increased significantly it was still much lower in 2010 than in any other country. This result could be partially due to the fact that the ratio reflected FTEs instead of head counts.
1.50
1.75
2.00
2.25
2.50
2.75
3.00
3.25
3.50
3.75
United Kingdom
Netherlands
Japan
Germany
France
CanadaUnited States
20102008200620042002200019981996199419921990

Health systems in transition United States of America190
Fig. 4.9Nurses per 1 000 population in seven OECD countries, 2000–2010
Source: OECD, September 2012. Notes: The total number of nurses corresponds to the sum of professional nurses and associate professional nurses. For the United States, data include Registered Nurses (RN) as well as Licensed Practical and Licensed Vocational Nurses (LPN and LVN). Head counts are reported for all countries except France, which reports FTEs. Canada, Germany, Japan, Netherlands, United Kingdom = practising nurses; France, United States = professionally active nurses. Practising nurses are those who provide services directly to patients. Professionally active nurses include practising nurses plus those who work outside of direct care. Japan, United Kingdom, United States include midwives in the count.
Fig. 4.10 shows the trends in pharmacists in seven OECD countries from 2000 to 2010. The United States follows the median trend, along with Canada. Japan has the highest ratios, and the Netherlands (a densely populated country) has the lowest by a significant amount. In all countries ratios increased steadily but only slightly over the eight years.
Fig. 4.11 presents the trends in dentists in seven OECD countries from 1990 to 2010. The United States occupies a median position. In France, the United States and the Netherlands the ratio did not change from 2000 to 2008 (note that BLS statistics in Table 4.5 indicate a decline in dentists in the United States). Germany has had the most dentists per population, and along with Japan had the biggest increase. The Netherlands had the fewest dentists per population.
6.5
7.0
7.5
8.0
8.5
9.0
9.5
10.0
10.5
11.0
11.5
United Kingdom
NetherlandsJapan
Germany
France
Canada
United States
201020082006200420022000
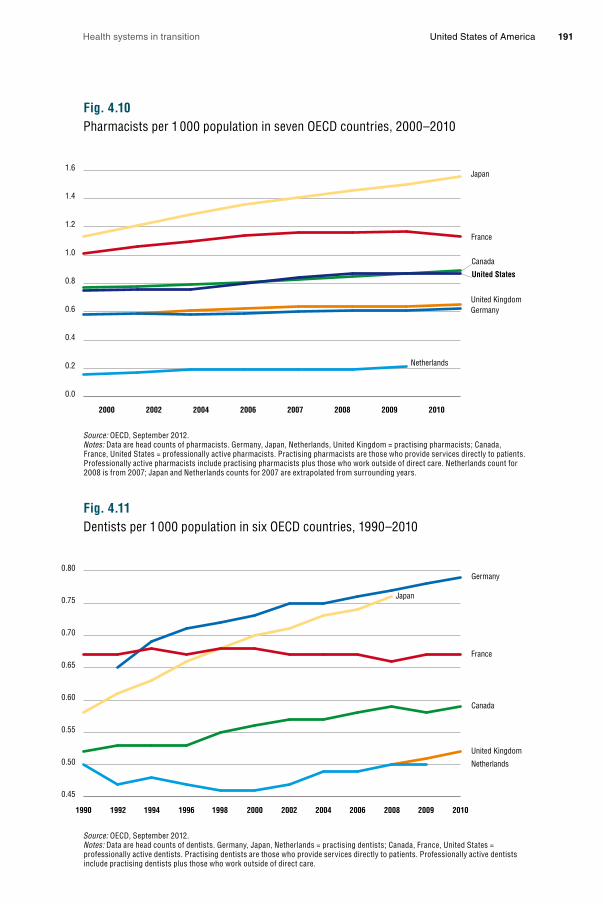
Health systems in transition United States of America 191
Fig. 4.10Pharmacists per 1 000 population in seven OECD countries, 2000–2010
Source: OECD, September 2012. Notes: Data are head counts of pharmacists. Germany, Japan, Netherlands, United Kingdom = practising pharmacists; Canada, France, United States = professionally active pharmacists. Practising pharmacists are those who provide services directly to patients. Professionally active pharmacists include practising pharmacists plus those who work outside of direct care. Netherlands count for 2008 is from 2007; Japan and Netherlands counts for 2007 are extrapolated from surrounding years.
Fig. 4.11Dentists per 1 000 population in six OECD countries, 1990–2010
Source: OECD, September 2012. Notes: Data are head counts of dentists. Germany, Japan, Netherlands = practising dentists; Canada, France, United States = professionally active dentists. Practising dentists are those who provide services directly to patients. Professionally active dentists include practising dentists plus those who work outside of direct care.
0.0
0.2
0.4
0.6
0.8
1.0
1.2
1.4
1.6
United Kingdom
Netherlands
Japan
Germany
France
Canada
United States
20102009200820072006200420022000
0.45
0.50
0.55
0.60
0.65
0.70
0.75
0.80
United Kingdom
Netherlands
Japan
Germany
France
Canada
201020092008200620042002200019981996199419921990

Health systems in transition United States of America192
4.2.3 International mobility of the health-care workforce
Included in the numbers of United States health-care professionals in the previous section are international immigrants, who add to the number of practising health-care professionals. In contrast, health-care professionals also emigrate from the United States, which reduces their United States number. Whether the total numbers of health-care professionals are higher or lower depends on the net migration. For physicians, the World Health Organization (WHO) has found that the high-income countries, including the United States, have experienced a positive net migration (Arah, Ogbu & Okeke, 2008). Between 23% and 28% of physicians in the United States, Canada, the United Kingdom and Australia received their medical degrees outside the host countries (Mullen, 2005). In 2004, 25.6% of physicians in the United States were international medical graduates (IMGs) (Akl et al., 2007). Immigration of nurses to the United States has tripled since 1994, and in 2005 the United States had more nurse immigrants than any other country in the world (Aiken, 2007). Around 8% of the United States nursing workforce in 2000 consisted of international nursing graduates (INGs) (Aiken, 2007).
Forty to seventy-five per cent of the source countries for international medical graduates in the United States were low to middle-income countries (Mullen, 2005; Starfield & Fryer, 2007). Eighty per cent of foreign nurses in the United States are from lower income countries (Aiken, 2007). India, the Philippines, the Middle East and North Africa have been key source countries for physician and nurse immigration to the United States (Cooper, 2005; Aiken, 2007). The Philippines accounts for 30% of nursing immigrants (Aiken, 2007). High-income countries contribute only a small percentage to the United States physician and nurse workforce.
These source countries can least afford to lose health-care personnel. Firstly, they have fewer economic resources to put into training health-care professionals (Mullen, 2005; Starfield & Fryer, 2007). Secondly, they tend to have lower physician and nurse to population ratios than other countries (Starfield & Fryer, 2007). One study found that the countries that contribute primary care physicians to United States have higher infant mortality rates, lower life expectancies and lower immunization rates than countries that contribute specialists (Starfield & Fryer, 2007). However, another study found that the source countries with more resources and better health outcomes contributed more physicians to the United States, Canada, Australia and the United Kingdom than the poorest countries with the worst health outcomes (Arah, Ogbu & Okeke, 2008).

Health systems in transition United States of America 193
These international migration patterns have a number of causes. Although countries of all income levels have faced health-care workforce shortages, the higher income countries have had the advantage of being attractive migration destinations and have actively recruited medical and nursing graduates from low and middle income countries. These graduates are attracted to the United States for the prospects of higher income and greater freedom (Hussey, 2007).
There have been few studies of the impact of international medical and nursing graduates on the United States health-care system. Obviously, immigrants add to the health-care workforce supply but there is no evidence that they improve distributional issues, such as primary care specialty or geographical maldistributions (addressed in the following section). There is no evidence, for example, that nurse immigrants locate in areas of health-care need, such as rural areas, in any greater proportion than native-born nurses (Aiken, 2007). It also appears that IMGs don’t work in areas of need any more than native-born physicians (Akl et al., 2007). Furthermore, a reliance on health-care professional immigration reduces the incentive to expand educational capacity, increase matriculates, raise wages, improve working conditions or create incentives to work in high need areas in the United States. As a consequence, future workforce shortages and maldistributions could be exacerbated (Flynn & Aiken, 2002). On the positive side, international graduates are ethnically more diverse than native-born graduates. However, relatively small proportions of international graduates are Black or Hispanic, which are the predominant racial and ethnic groups in the United States (Aiken, 2007).
United States physician and nursing workforce experts have called for greater accountability by the United States so that the country is not responsible for a
“brain drain” from other countries. It is generally recognized that supplementing the United States health-care workforce with foreign graduates is only a short-term solution and that factors contributing to underlying shortages in the United States need to be addressed. Experts encourage adherence to the WHO recommendations for recipient countries to: (1) promote temporary stays; (2) assist lower income countries to develop measures that will motivate their graduates to stay; (3) commit to ethical practices that consider the effects of migration on developing countries; and (4) engage in agreements with developing countries that will maintain immigration within acceptable limits (Cooper, 2005; Aiken, 2007).

Health systems in transition United States of America194
4.2.4 Distribution of the health-care workforce
In addition to the net migration of the health-care workforce, the distribution of workers must be considered when assessing workforce adequacy. This section addresses three types of distributional issues with the health-care workforce. The first involves the type of practice and setting. The second is geographical. The third is racial and ethnic representation in the workforce.
Practice and setting distribution The United States has had a disproportionate number of specialist physicians compared to primary care physicians for many years. According to Bodenheimer & Pham (2010), the 65% increase in physicians between 1965 and 1992 was almost entirely in specialist areas. For reasons discussed in section 4.2.7, the growth of specialists slowed in the 1990s but picked back up again in 2000. In 2005, even though 56% of visits to doctors’ offices were for primary care, only 37% of physicians (both medical doctors and osteopaths) were in that field (BHPr, 2008). In 2006, less than 45% of primary care residencies were filled and 56% of these were filled with IMGs (Friedman, 2008). A 2007 survey of fourth-year students at several United States medical schools found that only 7% planned careers in adult primary care (Bodenheimer & Pham, 2010). Nurse practitioners (NPs) and PAs have been filling in some of the gaps. In 2005 they constituted around 22% and 6% of the primary care workforce respectively (Steinwald, 2008).
There is evidence that the primary–specialty physician imbalance is affecting access to primary care. In 2008, 28% of Medicare beneficiaries without a primary care physician had problems getting a physician appointment, a 17% increase from 2006, whereas only 11% had problems finding a specialist, a 54% decrease from 2006 (MedPAC, 2009). Bodenheimer & Pham (2010) cite other facts: in 2008, 22% of Medicare beneficiaries and 31% of privately insured beneficiaries had unwanted delays in appointments for routine care; only 27% of adults with a usual doctor or source of care could easily contact their physician over the phone, receive medical advice after hours or obtain a timely office visit.
In nursing, the biggest distributional issue with regard to area of practice is the low number of RNs in nursing education. In 2008, the percentage of RNs employed in nursing education was 3.8%, essentially the same as it was in 1980 (BHPr, 2006, 2010). This low number of RN faculties creates bottlenecks in the educational process and contributes to nursing shortages. Seventy-one per cent of schools of nursing attribute faculty shortages as a reason for not accepting all qualified applicants into entry-level nursing programmes (AACN, 2008).

Health systems in transition United States of America 195
Another distribution issue in nursing involves the practice setting. Institutional settings, such as hospitals and nursing homes, appear to have more nurse staffing issues than ambulatory settings such as doctors’ offices, home care and school health. Until recently, hospitals had reported double or high single-digit vacancy rates for many years (Buerhaus, Auerbach & Staiger, 2007). The percentage of RNs working in hospitals (in direct patient care, supervisory, and advanced practice roles) peaked at 68% of RN supply in 1984, declined to 56% by 2004 (BHPr, 2006), then rose to 62% in 2008 (BHPr, 2010). Community health settings are also understaffed. Federally funded Community Health Centers (CHCs) have had RN vacancy rates similar to those of hospitals (WWAMI, 2006).
Geographical distribution Physician supply varies by region and urban or rural locations. Physician to population ratios vary between United States hospital-referral regions by more than 50%, and the variation does not appear to be related to health-care needs (Goodman & Fischer, 2008). Urban areas tend to have higher physician to population ratios than rural areas, and wealthy urban areas higher ratios than poor urban areas. In a 2008 survey, physician shortages were reported in rural areas by 75.4% of the hospital CEOs in those areas (MacDowell et al., 2010).
Primary care physicians are especially affected by uneven geographical distribution. States with the highest levels of primary care physicians are in the Mid-Atlantic and Northeast, while states with the lowest are in the South and Mountain West (Cunningham, 2011). In urban areas the ratio of primary care physicians to population is 100 per 100 000 population, while in rural areas it is less than half (46 per 100 000) (Bodenheimer & Pham, 2010). Poorer urban areas also have fewer primary care physicians than wealthier urban areas. Some areas have such a shortage of primary care professionals that they have been designated as Primary Care Health Professional Shortage Areas (areas with ratios of population to primary care practitioners greater than 2000 to 1).
The regional density of RNs varies two-fold across the country (BHPr, 2010). The District of Colombia, New England states, and West North Central states (e.g. Iowa, Nebraska, Kansas and Minnesota) have the highest employed RN to population ratios. The West South Central (Arkansas, Louisiana, Oklahoma and Texas), Mountain and Pacific states have the lowest. Geographical variation in employment also occurs by employment setting (BHPr, 2010). The New England states employ a smaller percentage of RNs in hospitals (57.1%) and ambulatory care settings than other regions, but a higher percentage in nursing homes than other regions. In the Pacific region RNs are more likely to be

Health systems in transition United States of America196
employed in ambulatory care settings (13.2%) than in other regions. In the West South Central states a higher percentage of RNs are employed in home care than in other regions.
There is not much information on whether there are differences in RN supply between urban and rural areas. A 2007 study found that RN shortages tend to be more acute in rural areas compared to urban areas (Zigmond, 2007). In another study of RN supply in Nebraska, hospital shortages were much more severe in rural areas (Cramer et al., 2006). The CHC RN shortages noted in the section above were highest in isolated small rural areas and urban areas, and lowest in large and less isolated rural areas (WWAMI, 2006).
Ethnic and racial disparities Compared to their proportion in the general population, African Americans, Latinos and American Indians are under represented in the health professions (Grumbach & Mendoza, 2008). The only setting in which population proportions of minorities exist in the health workforce is in public health. Educational programmes are attempting to change this situation but progress is slow. Between 1990 and 2005, baccalaureate nursing programmes increased underrepresented minorities from 12% to 18%, but allopathic and osteopathic medicine and pharmacy programmes have made no improvement (Grumbach & Mendoza, 2008). Dentistry programmes have shown a slight improvement in this period.
4.2.5 Adequacy of the health-care workforce
Adequacy of physicians As evidenced by difficulties in obtaining access to physician care in certain areas, and by the reliance on IMGs for a significant proportion of physician services, some stakeholders such as state medical societies, hospital associations and researchers believe that there is currently a physician shortage in the United States (Igelhart, 2008). Furthermore, projections of the future adequacy of physicians using several forecasting models indicate a future shortage of physicians of 5 – 20% of the workforce by 2020 (Blumenthal, 2004; COGME, 2005; BHPr, 2008). Key to these forecasts of future shortages are assumptions of continued growth in population and GNP and the ageing of the population – all of which will stimulate greater demand for health care – and an ageing physician workforce, in which supply will grow at too slow a rate. Health-care reform, with its expansion of Medicaid and health insurance, will also add to demand. However, provisions under the ACA help build physician and

Health systems in transition United States of America 197
nurse supply by funding training in the health professions, and scholarships and loan repayment for those who agree to serve in designated Health Professional Shortage Areas for two to five years (Iglehardt, 2010).
Other analysts believe that while a small increase in physicians may be needed to meet population growth and to decrease reliance on IMGs, many more allopathic physicians are not needed since the growth in non-physician providers and osteopathic doctors can supplement this supply (Wilson, 2005; Weiner, 2007). Still others contend that perceptions of a shortage of physicians may be partially due to primary care shortages and geographical imbalances of physicians (Wilson, 2005; Forrest, 2006; Scheffler, 2008). Better workforce distribution, such as increasing the number of primary care physicians and rural physician practices, could avoid the need for large increases in physicians overall (Goodman & Grumbach, 2008).
There is also no consensus regarding the supply of primary care and specialty physicians. While it appears that the supply of primary care practitioners for the care of children will be adequate for the next two decades, growth of the aged population will increase needs for adult primary care practitioners above expected supply (Bodenheimer & Pham, 2010). One projection of primary care supply states that even when NPs and PAs are included in the primary care professional workforce, primary care supply is expected to fall 9% from 2005 to 2020 (Bodenheimer & Pham, 2010). However, the BHPr (2008) has a different projection. Since the supply of primary care physicians is currently growing faster than demand, says the agency, the shortage of primary care physicians should be relieved somewhat. Instead, the BHPr projects a growing shortage of specialists. Surgical specialists especially will be in short supply. It appears that one reason why the BHPr projects an adequate supply of primary care but a shortage of specialists is because it assumes that demand for primary care will not grow at the same pace as the demand for specialty care.
Adequacy of nurses The history of nursing workforce adequacy in the United States is one of cyclical but deepening shortages in the past few decades. The most recent shortage lasted from the late 1990s to 2008. The shortage began to ease when the economic downturn began in 2008. Part-time and unemployed nurses returned to full-time employment if their spouses became unemployed, while hospital demand dropped as the number of admissions fell (Buerhaus et al., 2006; Unruh, 2010). In general, hospital demand has been a key factor in the shortages, as hospitals are the chief employer of nurses (62% of all nurses). Hospital demand for nurses is observed to vary given population demand and
Health systems in transition United States of America198
reimbursement for care (Unruh, 2010). During periods of low demand and reimbursement, such as the managed care period during the 1980s and early 1990s, hospital demand fell and shortages disappeared. During periods of higher demand and reimbursement, such as the one initiated in the late 1990s by the relaxing of managed care pressures, hospital demand for nurses rose and shortages re-emerged. Nursing supply appears to respond to the ebbs and flows in hospital demand as well as to economic factors (Unruh, 2010). Due to educational periods of 2 – 4 years for an RN, there are lags in supply meeting new upturns or downturns in demand.
Nursing workforce forecasters predict a large shortage of RNs in the future. BHPr models for RNs predict that from 2000 to 2020 RN demand per United States resident will grow 18%, while supply per resident will fall 11% 1 (BHPr, 2002; Unruh & Fottler, 2005). Using informal methods, Buerhaus and colleagues project that due to past growth in demand for RNs of around 2 – 3% per year, along with a much slower projected growth for RN supply, the deficit of RNs will grow to 16% by 2025 (Buerhaus, Staiger & Auerbach, 2008). Factors taken into consideration in these analyses are similar to those of physicians: growth and ageing of the population, which will increase demand, and an ageing nursing workforce, which will slow the growth of supply. Another factor with nursing supply is stressful work environments, which contribute to nurses leaving bedside nursing at younger than retirement ages (Unruh & Fottler, 2005; Buerhaus et al., 2006). A final factor for nursing supply is the educator shortage, which creates bottlenecks in increasing supply (AACN, 2008). In the past, shortages have been ameliorated somewhat with international immigration. Workforce analysts caution against dependency on these nursing graduates, however, as they are a “brain drain” on the donor country and can delay needed measures to improve supply in the host country (Aiken, 2007). In summary, there is little debate among forecasters, that without an increase in new graduates and better retention of younger RNs, there will be a severe RN shortage in the future.
4.2.6 Education and training of the health-care workforce
Most health-care workers are licensed professionals who are college graduates, or who have formal educational training beyond high school. Entry to some of these professions, such as that of physician, advanced practice nursing,
1 These projections are quite outdated. The last BHPr forecast for RNs was in 2002 and was based on 1996 demand and 2000 supply data from the quadrennial National Sample Survey of RNs, Area Resource Files, Bureau of Labor Statistics, Occupational Employment Statistics, American Hospital Association (AHA) Annual Survey, National Home and Hospice Care Survey, and other sources. These numbers are calculations made by Unruh & Fottler (2005) based on results from the BHPr.

Health systems in transition United States of America 199
physician assistant and the therapies requires advanced degrees and long educational periods. In contrast, unlicensed non-professionals usually have only a high school education and may or may not receive additional formal training and certificates.
This section focuses on the education and training of several of the professional occupations categorized as “health diagnosing and treating occupations” by the BLS: physicians, dentists, pharmacists, nurses and PAs. All of these professional occupations require several years of college, graduation from an accredited school in the specific occupation, and licensing or certification by the professional’s state of practice. Periods of residency training may also be required. All information is taken from the Occupational Outlook Handbook, 2010 – 2011 edition (BLS, 2011b) (see also section 2.8.2).
Physicians To become a physician requires the greatest amount of formal education and training among all the health-care occupations. A physician typically completes four years of undergraduate school, four years of medical school, and three to eight years of internship and residency. An individual pursuing a career in medicine may either go for a medical doctorate (MD) or doctor of osteopathy (DO) degree. In 2008, there were 129 medical schools accredited for MD medical education programmes and 25 schools in 31 locations accredited for a DO degree. Following medical school, most MDs enter a residency in their specialty. Most DOs go into a 12-month internship before entering a two to six year residency.
All states, the District of Columbia and United States territories require that physicians be licensed in order to practise. To be eligible to take licensing exams, physicians must graduate from an accredited medical school. To be licensed, MDs must pass the United States Medical Licensing Examination (USMLE) and DOs must pass the Comprehensive Osteopathic Medical Licensing Exam (COMLEX). The exams and licences are given at the state level. Reciprocity is granted by most, but not all, states. IMGs can receive a licence after passing the exam and completing a United States residency.
MDs and DOs seeking board certification in a specialty may spend up to seven years in residency training. To be certified by the American Board of Medical Specialists (ABMS) or the American Osteopathic Association (AOA) they must take a certification exam. The ABMS covers 24 specialties and the AOA covers 18 specialties. To be certified in a subspecialty, another one to two years of residency is required.

Health systems in transition United States of America200
A medical career, along with many of the health-care professions, requires that individuals continue their education and training throughout their lifetime in order to keep up with medical advances and changes in the occupation. The medical profession requires continuing education credits in order for physicians to keep their licence. In addition to “keeping up” with changes, physicians may advance their career by gaining expertise, developing a reputation for excellence among colleagues and patients, teaching medical students, residents and new physicians, and becoming supervisors or administrators.
Dentists To become a dentist, an individual must graduate from an accredited dental school and pass written and practical licensing examinations. Dental school is usually four academic years. During the second half of their education, students begin to treat patients under the supervision of licensed dentists. On completion of studies and practicum, students will receive a degree of Doctor of Dental Surgery (DDS) or Doctor of Dental Medicine (DMD). In 2008 there were 57 accredited dental schools in the United States
All 50 states and the District of Columbia require dentists to be licensed. In most states the licence is awarded to students who graduated from an accredited dental school and who passed the National Board Dental Examination and a practical exam administered by state or regional testing agencies. Specialty licences in nine different areas require 2 – 4 years of postgraduate education and may also require the completion of a residency and a special state examination. Most new dentists open their own practice immediately after dental school but some work for established dentists as associates for one or two years to gain experience and save money to equip an office of their own.
Pharmacists To practise in the United States, a pharmacist must acquire a PharmD degree from an accredited college or school of pharmacy. These programmes usually take four years to complete. After graduating from a PharmD programme, some graduates go for further training in residency programmes or fellowships, especially if they plan to work in clinical settings, where a residency may be required. Pharmacists may obtain a master’s degree in business administration in order to help them run their own pharmacy.
Pharmacists must have a licence to practise. To obtain a licence, an individual must have graduated from an accredited PharmD programme and must pass several exams. All states require that pharmacists pass the North American Pharmacist Licensure Exam (NAPLEX), which tests pharmacy

Health systems in transition United States of America 201
skills and knowledge. Other exams are required depending on the state. Hours of experience in a practice setting are also required. Often this can be accomplished while in the PharmD programme.
Registered nurses The educational requirements for RNs are complex because there are three educational paths to becoming an RN: a diploma, an Associate Degree in Nursing (ADN) and a Bachelor of Science Degree in Nursing (BSN). In addition, to become an advanced practice registered nurse (APRN) – which includes clinical nurse specialist, nurse anaesthetist, nurse–midwife and nurse practitioner – a Master of Science in Nursing (MSN) is required, and a Doctor of Nursing Practice (DNP) is becoming common (Cronenwet et al., 2011).
An ADN is the most common entry into the profession, followed by BSN. ADN programmes take two to three years to complete while BSN programmes take four years. Diploma programmes, which take three years to complete, do not result in a degree and are conducted by hospitals. They are a remnant of the old educational system, and few remain today. Of the three programmes, the BSN gives the student more training in areas such as communication, leadership and critical thinking, which are important in nursing practice today. It also provides more clinical experience in nonhospital settings. The BSN is usually required for administrative positions. For these reasons the BSN offers the graduate more employment and advancement opportunities. Since many RNs with ADNs return for a BSN, special RN-to-BSN programmes have been designed by most schools of nursing. Accelerated programmes also exist that allow a college graduate in another field to complete their BSN in 12 – 18 months. Graduates of an accredited school of nursing must also pass the National Council Licensure Examination (NCLEX-RN) to practise. Licences are granted on a state-by-state basis with reciprocity in most states.
RNs engage in lifelong learning. Continuing education is required by many states. To demonstrate expertise in a specific area, RNs may choose, or their job may require them, to be credentialled through the American Nursing Credentialing Center, the National League for Nursing or other agencies. Specialty areas of credentialling include ambulatory care, gerontology, informatics, paediatrics and many others.
There are many opportunities for advancement in nursing. Most RNs begin as staff (bedside) nurses in hospitals but many move to other settings or are promoted to managerial, administrative or teaching positions within the hospital. With an advanced practice degree, RNs can work independently or in collaboration with physicians. Each state defines its requirements for advanced

Health systems in transition United States of America202
practice roles. For example, in some states APRNs may prescribe medicine but in other states they cannot. Some RNs go on to become educators in schools of nursing, which requires an MSN or PhD. Other RNs start their own businesses in ambulatory, home care or chronic care. Still others join insurance, managed care or pharmaceutical companies.
Physician assistant To become a PA an individual must graduate from an accredited programme and pass a national certification exam. Many entering students are RNs, emergency medical technicians (EMTs) and paramedics. The programmes, offered at community colleges, academic medical centres, medical schools and colleges, take at least two years full-time. The PA programme combines classroom instruction with clinical experience. Students may have the opportunity of internships with physicians while in training, which may lead to employment after graduation. Upon completion of an accredited PA programme the graduate is eligible to sit for the PA certification exam and may in addition receive an associate, bachelor’s, or master’s degree.
To obtain a certificate to practise, graduates of accredited PA programmes must pass the Physician Assistant National Certifying Examination, administered by the National Commission on Certification of Physician Assistants (NCCPA). PAs must engage in continuing education to remain certified. Every two years they must complete 100 hours of continuing education, and every six years they must pass a recertification examination or complete a programme that includes a take-home exam. PAs can pursue further education in medicine, rural primary care, emergency medicine, surgery, paediatrics, neonatology and occupational medicine.
4.2.7 Physician and RN career paths
This section investigates some of the factors involved in the career choices of these two professions. Major factors include levels of reimbursement, malpractice insurance costs and working conditions.
Factors in physician career paths Career choices among physicians include choice of specialty (primary care versus one of several specialties), location of practice (regional and urban or rural), and whether to stay active in the profession. The choice of specialist over primary care careers among physicians has, for some time, led to an imbalance in the workforce in these areas. With new patients being brought

Health systems in transition United States of America 203
into primary care due to health-care reform, the future imbalance is particularly problematic. Chief among the factors that contribute to these career choices is physician payment.
Despite improvements in primary care physician reimbursement in the 1990s, a primary care-specialty payment gap remains. Primary care payment improved relative to specialty care with the introduction of the RBRVS by the CMS in 1992, and with the managed care restructuring of the physician payment system to better reward primary care physicians in this same period. The improvement slowed when managed care mechanisms were loosened in the late 1990s. At that time primary care incomes declined and the income gap between primary and specialty care grew (Bodenheimer & Pham, 2010). The latest available official data for physician salaries indicates that in 2003 the average annual salary of a primary care physician was $146 405, compared to $235 820 for a specialist (Tu & Ginsburg, 2006). Among specialists, medical practitioners earned $211 299 on average while surgical specialists earned $271 652 in 2003. The hours-adjusted internal rate of return on the educational investment for primary care physicians was 16% in 1997, compared with 18% for procedure-based medicine (surgery, obstetrics, radiology, anaesthesiology and medical subspecialties) (Weeks & Wallace, 2002). Compared with 10 other OECD countries, the United States has the next to highest specialist to primary care physician salary ratio (the Netherlands had the highest) (Fujisawa & Lafortune, 2008).
Practice conditions and medical and societal devaluing of primary care also contribute to the primary care-specialty imbalance (Friedman, 2008; Bodenheimer & Pham, 2010). Primary care practice tends to involve more hours, on-call and night work, and rotating shifts compared to specialty practices. Specialty care is more prestigious and the medical educational system places a higher value on specialty practice. An example of the lower prestige of primary care is that it is much less likely that a primary care physician will become a medical school dean or achieve other positions of leadership (Friedman, 2008). The culture in some medical schools works against primary care by encouraging students to go into specialty practices (Brooks et al., 2002; Friedman, 2008).
Several factors contribute to a physician choosing not to practise in an underserved urban or rural area. As with primary care, rural practices involve longer hours, less specialty support and fewer opportunities for advancement

Health systems in transition United States of America204
(Brooks et al., 2002; Dussault & Francheschini, 2006). Rural locations have less social and cultural opportunities and are more professionally isolated, with fewer opportunities for career advancement (Dussault & Francheschini, 2006).
That being said, some medical schools are better than others at graduating physicians who go to underserved and rural areas. Physicians graduating from medical schools with rural curricula and rotations and a positive culture regarding rural practice are more likely to practise in rural areas (Brooks et al., 2002; Rabinowitz et al., 2008). Scholarships and loan-repayment programmes tied to rural practice on graduation are also good incentives (Friedman, 2008).
There are several factors that create dissatisfaction among physicians, which can lead to them leaving patient care practices. These factors include working with managed care plans, malpractice insurance costs, discrepancies between practice ideals and reality, administrative burdens and lack of time to complete necessary tasks (Landon, Reschovsky & Blumenthal, 2003; Mechanic, 2003; Zuger, 2004). Frustrations with managed care and insurance company billing, policies and requirements have been the focal point of many of these issues. Under managed care, physicians’ administrative tasks have grown over the years, giving them less time to perform clinical work. They have had less autonomy to refer patients to specialists, or to prescribe tests, treatments and medications. Additional governmental quality improvement requirements, such as P4P, have added to the administrative burden.
Factors in RN career paths Career choices among RNs include the decision to become a nurse educator, whether to practise in a hospital or other health-care setting, and whether to stay in bedside nursing. Factors that are thought to contribute to the low number of RNs going into education include: low academic salaries; more attractive jobs in other careers for RNs with graduate degrees (partially a result of the first factor); long periods of clinical work prior to pursuing graduate education and an academic career; high educational costs (put that together with low salary and the returns to educational investment are low); and insufficient governmental funding of nursing education (Yordy, 2006). In addition, dissatisfaction among those who have gone into nursing education contributes to nurses leaving the field. Nursing faculties are dissatisfied with their heavy workloads and low remuneration (Yordy, 2006).
With regard to RNs’ decisions regarding work settings, studies have shown that the major issue with working in a hospital is the difficult working conditions for RNs. Staffing levels, workload, the degree of autonomy, shift

Health systems in transition United States of America 205
work, scheduling, overtime and professional development are several of the factors leading to dissatisfaction with hospital bedside nursing (Buerhaus et al., 2006; Stone et al., 2006).
RNs’ intention to leave bedside nursing is also mainly related to working conditions. Chief among the work environment issues are: inadequate staffing, high workload, high work pressure, high job demands, lack of time to do adequate work, lack of supervisor support, lack of respect, disempowerment and poor relations with physicians (Geiger-Brown et al., 2004; Dunn, Wilson & Esterman, 2005; Khowaja, Merchant & Hirani, 2005). Salaries and benefits can also be an issue in hospitals, nursing homes and other settings (McHugh et al., 2011).
Influencing career path choices of physicians and nurses Policies are needed to encourage physicians and nurses to take career paths that are optimum for the functioning of the United States health-care system. The difficulty is that the career choice must be an optimum one for the individual health-care professional as well. The issues discussed above provide information about some of the factors that need to be changed in order to accomplish this transformation: improvement in reimbursement to primary care, work in underserved areas and nursing education; medical and nursing education that encourages a proper distribution of those professionals; improvements in working conditions; and societal values that improve the prestige of currently undervalued careers. Until changes are made in these areas and others, these health-care professionals will continue to make personal career choices that result in a less than optimum workforce distribution in the United States.
Some recent initiatives will be of help. The 2009 American Recovery and Reinvestment Act (ARRA) invested $300 million in the National Health Service Corps, which recruits the primary care workforce in underserved areas (Kaiser Family Foundation, 2011h). Teaching health centres are receiving an additional $230 million to start primary care residency programmes. Under the ACA, the Medicare fee schedules provide 10% bonuses for primary care starting in 2011 (Kaiser Family Foundation, 2011h). By 2014, Medicaid primary care provider reimbursements must be at least as much as Medicare.


5. Pro
vision
of services
5. Provision of services
Insured individuals tend to enter the health-care system through a primary care provider, though with some kinds of insurance (PPO) individuals may go directly to a specialist. Uninsured individuals often do not have a regular
primary care provider, but instead visit community health centres (which provide primary care for low-income, uninsured and minority populations) and hospital emergency rooms for their health care, which hinders continuity of care. Due to out-of-pocket costs they may be reluctant or unable to seek out specialty, surgical, or inpatient care unless they need emergency care; emergency departments in hospitals that receive payment from Medicare (which is nearly all hospitals in the US) are required by law to provide care to anyone needing emergency treatment until they are stable. Retail clinics (in pharmacies or large stores) are also emerging as places to go for treatment of minor medical conditions.
The number of acute inpatient (hospital) discharges and length of stay have fallen over the past decades, with more acute-care services, such as surgery, being performed on an outpatient basis. For example, in 2010 more than three-quarters of all surgeries were provided in an outpatient setting. Mental health services have also shifted predominantly from inpatient to outpatient, accompanied by substantially increased use of pharmaceuticals and reduction in provision of psychotherapy and mental health counselling. The utilization of post-acute-care services such as rehabilitation, intermittent home care, and sub-acute care has increased over the past decades due to the financial need for hospitals to discharge patients not requiring acute care. Palliative care is received mostly through hospice services, either in the patient’s home, or in a hospital, nursing home or other institutional setting. Hospice care has increased due to an expansion of Medicare benefits in 1983. The informal caregiver (usually family or friends) plays an important role in United States health care; 23% of Americans provide some form of informal care.
Health systems in transition United States of America208
Pharmaceuticals are highly utilized in the United States compared to other industrialized countries, and their use has been growing. The use of complementary and alternative medicine (CAM) is also growing in the United States. Although physicians initially opposed the use of CAM, their stance has softened due to its popularity with the public and some scientific evidence regarding the efficacy of certain therapies. Patients must pay out-of-pocket for most forms of CAM.
Vulnerable populations in the United States include racial and ethnic minorities, those with low income, the uninsured, the disabled, the homeless, women, children, persons with HIV / AIDS, the mentally ill, the elderly, and those living in rural areas. Federal, state, and private agencies have programs for reducing disparities in health and health care for these populations. Populations that have special access to health services include American Indians and Alaska Natives, military personnel, veterans, and those who are institutionalized, such as prisoners.
United States public health is decentralized, with the main locus of power at the state level. The actual public health structures at the state level vary significantly; in some states, public health functions are further decentralized (e.g. to county level). At federal level, the United States Public Health Service brings together eight federal public health agencies (including the Centers for Disease Control and Prevention, the Food and Drug Administration, and the National Institutes of Health). Federal, state and local public health services have been underfunded, and tend to be driven by immediate concerns; for example, as concerns rose over terrorist attacks in the United States, much of the public health funding and services switched to terrorism preparedness, leaving holes in other areas of public health.
5.1 Patient pathways
This section presents two scenarios representing the pathways for care for an insured and an uninsured individual in the United States. A patient pathway is the route individuals take from their first contact with the health-care system to the completion of care. It includes their initial entry into the system, provider visits, referrals, tests and treatments. The route may be anything from a short visit to a primary care provider to a more complicated path through a series of services, culminating in institutionalized care. The route may also involve only

Health systems in transition United States of America 209
primary care services, only acute-care services, only long-term care services or all of these. Two issues to note from the two sets of pathways are access to care and coordination of services.
Fig. 5.1 presents pathways for an insured patient and Box 5.1 discusses an example of a pathway for an insured individual. Individuals with all types of insurance seeking preventive care, such as annual check-ups, will most probably go to a primary care provider on a regular basis. A primary care provider will also be the first contact with the system for individuals needing care for a medical or surgical problem (not an emergency) who are in an HMO, even if the individual needs to see a specialist. The primary care provider (PCP) will evaluate the patient first and make appropriate referrals to specialists, order imaging, testing and medications. If the PCP believes that the patient needs immediate hospitalization, the doctor will have the patient admitted to the hospital, obtaining a referral from the HMO if needed. If the individual is in a PPO or has traditional FFS insurance he or she may go directly to a specialist for medical care. Specialists may order imaging, testing, medications and treatments, including surgery or hospitalization if needed. Surgery may be performed on an outpatient basis (“same-day surgery”) or with the patient admitted to the hospital (inpatient). For an acute medical condition that is life threatening or that occurs after office hours, an individual may also enter the health-care system through an emergency department (hospital-based) or urgent care centre (free-standing or hospital-based). Visits to these outpatient settings may or may not result in hospitalization.
Once a patient is hospitalized, he or she may be discharged home or may continue in the health-care system by going into rehabilitation or some type of subacute or long-term care, such as home care, assisted living or nursing home care. Finally, patients may progress to palliative care, such as hospice services. Whether a patient receives rehabilitation, long-term care or palliative services, and the duration of those services, may depend on the individual’s insurance coverage. Private health insurance generally does not cover long-term care. Long-term care insurance will cover nursing home care, but the great majority of individuals do not carry this supplemental coverage. For those with public insurance (e.g. Medicare and Medicaid), there are limitations on the length of care and extent of coverage. For example, Medicare only pays for long-term care if the patient has been hospitalized first, and the post-hospitalization coverage is limited to a certain number of visits or days along with co-payments from the patients (see section 3.7).

Health systems in transition United States of America210
Fig. 5.1Health-care pathways for insured patients
Notes: the short solid arrows pointing to the services along the periphery of the figure indicate the various ways a patient may enter the health-care system depending upon his or her condition and type of insurance. The broken lines with arrows indicate the paths that can be taken once an individual enters the system.
Home care, nursing home care, assisted living and palliative care may also be accessed by patients without going through primary or acute-care services. In these cases patients will be paying out-of-pocket or will have Medicaid or private long-term care insurance to cover the services.
Primary care services Secondary and tertiary care services
Imaging andtesting
Specialty care
Dental andeye care
Communityhealth services
Primary carephysician office
Complementary andalternative care
Pharmaceuticalcare
Rehabilitation/Intermediate care
Long-term care
Palliative care
Home care
Assisted living
Nursing home care
Outpatient care
Inpatient careAcute care
Urgent care
ED care
Same day surgery
Mental healthcare

Health systems in transition United States of America 211
Other portals of entry to the health-care system for insured individuals include community health services (the “health-care safety-net” such as community health centres and public hospitals), which may be used by an insured person for services such as immunizations (e.g. f lu vaccinations). Because community health services tend to be used for discrete short-term issues by insured patients, there tend to be no further referrals or connections to other parts of the health-care system. Insured individuals may utilize CAM, but this also tends not to be integrated into the medical side of the health-care system. Individuals may seek mental health care, which their insurance may partially cover or they may pay out-of-pocket. Supplemental insurance or OOP payment is usually the way for individuals to receive dental and eye care. First contact providers in those services may refer the patient to other specialists, imaging, testing, medications or hospitalization. Patients with dental, eye or mental problems may also first present to their primary care provider who will refer them to the respective service.
The pathways for an uninsured patient are quite different, as can be seen in Fig. 5.2 and Box 5.2. Fig. 5.2 indicates that there are effectively fewer options for uninsured patients and less continuity of care. Typically, individuals who are uninsured (who have neither private nor public insurance) will skip regular
Box 5.1Example of an insured person’s health-care pathway
A pathway over a three-year period for an insured (through Medicare) 85-year-old male patient with COPD might be as follows: The patient uses his PCP for regular checkups. The PCP has ordered medications for the patient’s COPD. When the patient presents at a regular visit with increased shortness of breath and weakness, the PCP refers him to a pulmonologist and a cardiologist. The pulmonologist performs tests and changes the patient’s COPD medications. The cardiologist performs tests, diagnoses the patient with atrial fibrillation and orders medication for the condition. The patient has one follow-up visit to the two specialists. Within a year the patient passes out at home and is brought into the hospital emergency department. His atrial fibrillation is not being controlled by the medication. The patient is hospitalized, a pacemaker is inserted and his medications are adjusted once again. He is discharged home under the care of his elderly wife and nearby children. Six months later he becomes dizzy and weak and has mobility problems. He is readmitted to hospital. There, medications are adjusted; he is stabilized and he is then transferred to a rehabilitation centre. After several weeks in rehab he returns to his home. His mobility problems return after a few months so his family contacts a home care agency to have a home health aide help with baths twice a week. Eventually he becomes too much to handle at home and he is admitted to a nursing home. While he is in the nursing home he is hospitalized several times for various illnesses, including pneumonia. His condition does not improve and his family does not wish to pursue more interventions so he receives palliative care prior to dying peacefully in a hospice.
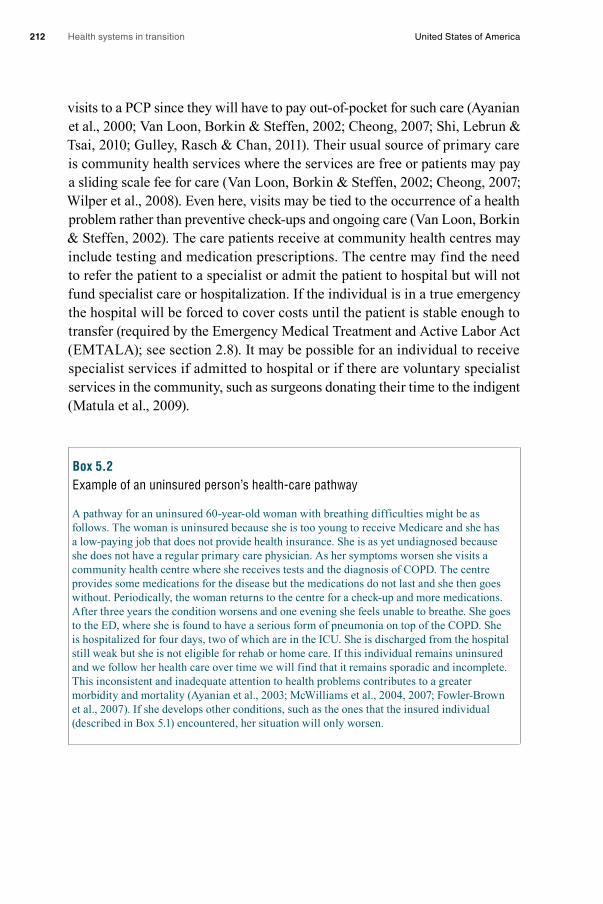
Health systems in transition United States of America212
visits to a PCP since they will have to pay out-of-pocket for such care (Ayanian et al., 2000; Van Loon, Borkin & Steffen, 2002; Cheong, 2007; Shi, Lebrun & Tsai, 2010; Gulley, Rasch & Chan, 2011). Their usual source of primary care is community health services where the services are free or patients may pay a sliding scale fee for care (Van Loon, Borkin & Steffen, 2002; Cheong, 2007; Wilper et al., 2008). Even here, visits may be tied to the occurrence of a health problem rather than preventive check-ups and ongoing care (Van Loon, Borkin & Steffen, 2002). The care patients receive at community health centres may include testing and medication prescriptions. The centre may find the need to refer the patient to a specialist or admit the patient to hospital but will not fund specialist care or hospitalization. If the individual is in a true emergency the hospital will be forced to cover costs until the patient is stable enough to transfer (required by the Emergency Medical Treatment and Active Labor Act (EMTALA); see section 2.8). It may be possible for an individual to receive specialist services if admitted to hospital or if there are voluntary specialist services in the community, such as surgeons donating their time to the indigent (Matula et al., 2009).
Box 5.2Example of an uninsured person’s health-care pathway
A pathway for an uninsured 60-year-old woman with breathing difficulties might be as follows. The woman is uninsured because she is too young to receive Medicare and she has a low-paying job that does not provide health insurance. She is as yet undiagnosed because she does not have a regular primary care physician. As her symptoms worsen she visits a community health centre where she receives tests and the diagnosis of COPD. The centre provides some medications for the disease but the medications do not last and she then goes without. Periodically, the woman returns to the centre for a check-up and more medications. After three years the condition worsens and one evening she feels unable to breathe. She goes to the ED, where she is found to have a serious form of pneumonia on top of the COPD. She is hospitalized for four days, two of which are in the ICU. She is discharged from the hospital still weak but she is not eligible for rehab or home care. If this individual remains uninsured and we follow her health care over time we will find that it remains sporadic and incomplete. This inconsistent and inadequate attention to health problems contributes to a greater morbidity and mortality (Ayanian et al., 2003; McWilliams et al., 2004, 2007; Fowler-Brown et al., 2007). If she develops other conditions, such as the ones that the insured individual (described in Box 5.1) encountered, her situation will only worsen.

Health systems in transition United States of America 213
Fig. 5.2Health-care pathways for uninsured patients
Notes: the short solid arrows pointing to the services along the periphery of the figure indicate the various ways a patient may enter the health-care system depending upon his or her condition and ability to pay. The dark broken lines with arrows indicate the paths that can be taken once an individual enters the system. The light dotted lines are possible paths if the patient can afford the care.
The uninsured may avoid necessary dental, eye and mental health care due to the OOP costs associated with that care (Winters et al., 2008; Shi et al., 2010). They may also miss or stop taking needed medications for the same reason (Wilper et al., 2008; Kullgren & McLaughlin, 2010; Shi et al., 2010; Gulley, Rasch & Chan, 2011). To alleviate the pharmaceutical access problem, state and federal governments and private organizations have set up programmes to make medications more affordable to those in need. Pharmaceutical companies sponsor patient assistance programmes but little is known about how many patients are served and the application process is cumbersome (Choudhry et al., 2009; Felder et al., 2011). Although there is no evidence one way or the other
Primary care services Secondary and tertiary care services
Imaging andtesting
Specialty care
Dental andeye care
Communityhealth services
Primary carephysician office
Complementary andalternative care
Pharmaceuticalcare
Rehabilitation/Intermediate care
Long-term care
Palliative care
Home care
Assisted living
Nursing home care
Outpatient care
Inpatient careAcute care
Urgent care
ED care
Same day surgery
Mental healthcare
Health systems in transition United States of America214
whether the uninsured utilize CAM services, in an attempt to stay healthy they may use this type of care even though it must also be paid out-of-pocket and can be expensive.
For urgent and emergency care the uninsured tend to use urgent care centres and emergency departments (Cheong, 2007; Wilper et al., 2008). As mentioned, if an individual is experiencing a life-threatening emergency a hospital must treat the individual. Therefore a common way for uninsured individuals to receive hospital services is to present seriously ill to the emergency services. However, the uninsured will not receive rehabilitation following hospitalization, nor any long-term or palliative care unless they pay out of pocket.
For both the health-care pathways discussed above, a closer scrutiny brings out additional issues. The first concerns the coordination of care. Since services have become more specialized over time, it has been increasingly difficult to coordinate and integrate those services. This is especially problematic in the patient with multiple morbidities; the patient may be seeing multiple specialists and may undergo testing and receive treatment and medications for several conditions (Vogeli et al., 2007; Bodenheimer, 2008).
Care coordination is needed when the patient receives care from more than one provider. Theoretically, the primary care provider coordinates care. However, these providers tend to carry a large patient load and are pressed for time so they find it difficult to keep track of the results of patient consultations, referrals, treatments and institutional admissions, discharges and transfers (Bodenheimer, 2008; Schoenberg, Leach & Edwards, 2009; Liss et al., 2011). In addition, specialists and institutional providers may send inadequate and late reports (Bodenheimer, 2008). At the same time, many patients, especially the uninsured, do not have a primary care provider. In this case, it may be that no health-care provider is attempting to coordinate the care of the patient.
Poor coordination of health-care services can lead to “wasteful duplication of diagnostic testing, perilous polypharmacy, and confusion about conflicting care plans” (Bodenheimer, 2008). It contributes to poorer quality of care, greater Emergency Department (ED) use and avoidable hospitalizations (Saultz & Lochner, 2005; Cheng, Chen & Hou, 2010). Several programmes are being implemented to improve care coordination in the United States. These include electronic referral systems and referral agreements between primary care providers and specialists, disease management programmes, the use of APRNs, and improved hospital discharge planning (medication reconciliation, patient education and post-discharge follow-up) (Bodenheimer, 2008).

Health systems in transition United States of America 215
System-wide changes are needed to give primary care providers the time and resources to be at the centre of care coordination. The concept of the
“medical home” is a recent development in this direction (Bodenheimer, 2008). Medical homes are certified for meeting specific requirements of primary care, including the coordination of care. The development of medical homes is discussed in more detail in section 5.3.
The second issue with health-care pathways is how well the services respect the individuality of the patient and include the patient and family as active partners in care. This is termed “patient-centred care” or “patient and family centred care”. The relationship between health-care provider and patient until recent years was usually not “patient-centred”. Instead, physicians “knew best”, made decisions for the patient, and told the patient what to do. This provider-centric focus began to change following an Institute of Medicine report in 2001 that included patient-centred care as one of six key elements of high-quality care (Committee on Quality of Health Care in America, 2001). Definitions of patient-centred care vary but the core concept is that patients are treated “as persons in context of their own social worlds, listened to, informed, respected, and involved in their care – and their wishes are honored (but not mindlessly enacted) during their health care journey” (Epstein & Street, 2011, p.100).
It is unclear to what extent care is patient-centred in the United States today. One survey of physicians found that 33% in larger practices (50 or more practitioners) had adopted 6 of 11 practices considered to be patient-centred but only 14% of solo physicians reached this level (Audet, Davis & Schoenbaum, 2006).
Patient-centred approaches can be implemented in various health-care settings without the services in those settings being coordinated. A recent model that combines both is the “patient-centered medical home (PCMH)”, a model developed by primary care specialty societies in 2007 and endorsed by purchasers, payers, providers and consumers (Rittenhouse et al., 2011). PCMH is discussed in greater detail in section 5.3.3.
5.2 Public health
Public health focuses on promoting health at the population level through investigating and intervening in the environmental, social and behavioural factors in health and disease. It deals with prevention and health promotion rather than treatment of disease and recovery of health, which is the domain of

Health systems in transition United States of America216
medical care. It attempts to influence social, economic, political and medical factors that affect health and illness (Shi & Singh, 2012). The three core functions of public health defined by the IOM are assessment, policy development and assurance (Salinsky, 2010). The 10 essential services identified by the APHA that correspond to these core functions are listed in Box 5.3. (Salinsky, 2010).
Box 5.3Core public health functions and essential services
IOM core functions: American Public Health Association essential services
Assessment: Monitor health status to identify community health problems. Diagnose and investigate health problems and health hazards in
the community.
Policy development: Inform, educate and empower people about health issues. Mobilize community partnerships to identify and solve
health problems. Develop policies and plans that support individual and community
health efforts.
Assurance: Enforce laws and regulations that protect health and ensure safety. Link people to needed personal health services and assure the
provision of health care when otherwise unavailable. Assure a competent public health and personal health-care workforce. Evaluate effectiveness, accessibility and quality of personal and
population-based health services. Research for new insights and innovative solutions to health problems.
Source: Salinsky, 2010.
5.2.1 Organization of public health services
Public health is promoted mostly through public agencies, primarily at the state level, but some private agencies also play a role. At the federal level, public health services are headed by the United States Public Health Service (USPHS), a division of the HHS. The USPHS is comprised of eight agencies listed in Box 5.4 (U.S. Department of Health and Human Services).

Health systems in transition United States of America 217
The AHRQ, HRSA, NIH and Substance Abuse and Mental Health Services Administration (SAMHSA) are the chief federal agencies for funding health-care programmes and research. The AHRQ funds research on quality, costs and administrative issues in health care, while the NIH funds biomedical and clinical research primarily. Although the AHRQ and NIH are considered to be part of the USPHS, in reality the bulk of their research is on medical, not public health, issues. The HRSA funds programmes and research on the indigent, uninsured, rural residents, other special need populations, and the health-care workforce. Another major function of the HRSA is to collect data on the health-care workforce. The HRSA’s functions have more of a public health purpose in that they help assure adequate health-care resources, yet as with the AHRQ and NIH most of these resources go into providing medical care. The SAMHSA funds programmes and conducts its own studies into the prevention and treatment of alcoholism, substance abuse and mental illness. The SAMHSA’s funding is delivered mostly through block grants and contracts with state health agencies.
The Agency for Toxic Substances and Disease Registry (ATSDR) monitors and protects against exposure to hazardous wastes, and works to minimize ill health effects of hazardous waste emergencies and pollution from hazardous wastes. The CDC is responsible for the surveillance, identification, and prevention of disease and injury in the United States, and provides assistance to other countries and international health organizations regarding these health concerns. Major components of the CDC include identification and prevention of infectious and chronic diseases (including human immunodeficiency
Box 5.4 Federal public health agencies
Agency for Toxic Substances and Disease Registry (ATSDR)
Agency for Healthcare Research and Quality (AHRQ)
Centers for Disease Control and Prevention (CDC)
Food and Drug Administration (FDA)
Health Resources and Services Administration (HRSA)
Indian Health Service (IHS)
National Institutes of Health (NIH)
Substance Abuse and Mental Health Services Administration (SAMHSA)
Health systems in transition United States of America218
virus / acquired immunodeficiency syndrome (HIV / AIDS) and sexually transmitted disease (STD) prevention), injury prevention, immunization, health promotion, environmental health, occupational safety and health, emergency and terrorism preparedness, and cancer screening. The CDC also funds and collects data for public health research in these areas.
The FDA oversees the Federal Food, Drug, and Cosmetic Act, several related public health laws, and food safety (along with the United States Department of Agriculture). Areas supervised include new medical devices, experimental drugs, biological products, cosmetics, food additives, food labels, domestic and imported foods (except for meat and poultry) and food given to livestock. The United States Department of Agriculture is responsible for meat and poultry safety (more information on the FDA, CDC and other HHS agencies can be found in sections 2.3 and 2.8).
The Indian Health Service (IHS) provides public health services to American Indians and Native Alaskans, primarily on Indian reservations and in Eskimo villages. More than half of all American Indians, however, do not live on reservations and are not eligible for these services. When resources are available, services include preventive, ambulatory and hospital care, community health, alcohol programmes and rehabilitative services.
At the state level, all 50 states have state health agencies that carry out public health efforts. States legally have the greatest authority for carrying out public health. While influencing state and local practices, federal laws tend to give states the leeway to determine the scope and amount of services and to establish the vehicles for providing those services.
As a result, the organizational structure of state public health agencies and the services provided by those agencies vary significantly across the states, making general descriptions difficult. Public health functions can be the sole domain of one state agency or part of the function of an agency that is also in charge of social services, licensing and regulation of acute and long-term care, the administration of Medicaid or insurance regulation (Salinsky, 2010). Public health functions can also be spread over more than one state agency or can be performed in partnership with private organizations. Public health functions administered in public agencies outside the main state health agency include the regulation and inspection of health-care facilities, the licensure of health professionals and the control of disease vectors such as mosquitoes. States also differ with regard to whether the relationship between state and
Health systems in transition United States of America 219
local public health agencies is decentralized, centralized or a hybrid of the two. In more decentralized models, local public health agencies have greater administrative control.
Many public health functions are delegated to local public health agencies (usually called “health departments”) within that jurisdiction. Jurisdictions can be at the county, city, town or township levels (Salinsky, 2010). According to Salinsky (2010) most local health departments (60%) are at the county level, 18% cover a city, town or township, 11% are joint city–county jurisdictions, and 9 per cent are multicounty.
5.2.2 Public health services
Communicable disease controlControl of communicable disease is carried out by local and state health agencies in collaboration with the CDC. Local and state agencies conduct surveillance of communicable diseases, and collect and analyse the data. Both private and state labs analyse specimens. Examples of communicable diseases of public health concern for becoming epidemics or pandemics are meningitis, West Nile Virus, Hanta Virus, influenza strains such as H1N1, and the plague. The CDC is notified of unusual or alarming outbreaks or trends. Outbreaks of communicable diseases, once reported to the CDC, are further investigated by this agency. Control and prevention measures are then implemented by the CDC in collaboration with the affected area(s). For communicable diseases that are endemic, such as STDs and tuberculosis, local public health departments offer both screening and treatment (see “Health promotion and prevention services” below) (Salinsky, 2010).
Environmental hazardsEnvironmental hazards are prevented, detected and corrected by federal, state and local public health agencies, or in some states an environmental agency. At the federal level the ATSDR is responsible for identifying people at risk of exposure to hazardous substances, evaluating the risk of hazardous substances in the environment, and preventing or minimizing the effects on health. The types of hazard typically controlled are air pollution, contaminated food and water, chemical spills, radon gas, mosquitoes and other disease vectors (Salinsky, 2010; CDC, 2010).
Emergency and terrorism preparednessEfforts to prepare for emergencies and terrorism are led by the CDC and the HHS Office of the Assistant Secretary for Preparedness and Response, which publish protocols for action for state and local government agencies. However,
Health systems in transition United States of America220
each local agency is responsible for developing a customized plan based on CDC protocols, and state governments play a key role by devoting resources to local preparedness planning (Salinsky, 2010). Preparedness and response efforts include surveillance, laboratory testing, outbreak investigation, and the treatment and quarantine of the population. Plans must have a coordinated emergency medical response. In the event of an incident, state and local agencies are responsible for implementing the plan in collaboration with the CDC.
Promotion of occupational healthPromoting of occupational health is carried out by the National Institute of Occupational Safety and Health (NIOSH), a part of the CDC, and the OSHA, a part of the United States Department of Labor (CDC, 2010). The NIOSH funds research, investigates workplace safety, and provides information, education and training in occupational safety and health, while the OSHA is responsible for developing and enforcing workplace safety and health regulations. State health agencies are also involved since they may be the first to be called regarding a safety issue. The NIOSH encourages employers and employees at all worksites to report possible safety violations. When a possible occupational hazard is reported, the NIOSH’s Health Hazard Evaluation Program investigates the claim. The NIOSH employs a research-to-practice philosophy, in which it encourages the translation of research findings, technologies and information into prevention practices and products that can be adopted in the workplace. The NIOSH also engages in prevention through its Total Worker Health Program, which combines occupational safety with health promotion to prevent illness and injury. This combination of research, regulations, prevention and surveillance comprises the core occupational health functions of the United States public health system.
Surveillance of population health and well-beingSurveillance involves the collection, processing and maintenance of data on the following population measures: vital statistics (e.g. births and deaths); demographic characteristics (age, sex, race, ethnicity, education, employment, income and residence); childhood immunizations; behavioural risk factors; incidence of cancer, trauma and occupational injuries; communicable, acute and chronic diseases; insurance coverage; and health-care utilization and expenditures (Centers for Disease Control and Prevention, 2010b). State agencies collect much of this data through provider reports, hospital discharge databases, registries, and population surveys (Salinky, 2010). Federal agencies contributing to this surveillance include the AHRQ, BLS, CMS, National Cancer Institute, SAMSHA, and the United States Census Bureau (Centers for Disease Control and Prevention, 2010b). Private agencies that contribute data

Health systems in transition United States of America 221
include various medical associations and the Dartmouth Institute. The data from these agencies are shared with the CDC, which additionally sponsors several surveys that collect data on ambulatory care, hospital inpatient care, home and hospice care, nursing home care, vital statistics, immunizations, nutrition and population health (Centers for Disease Control and Prevention, 2010b). For example, the CDC’s population health survey – the National Health Interview Survey (NHIS) – collects information on illnesses, injuries, activity limitation, chronic diseases, health insurance coverage and utilization of health care. United States data are also compared internationally using OECD data. The CDC places much of this data, aggregated to the national level, into a publicly available (on the internet) annual report entitled Health, United States (Centers for Disease Control and Prevention, 2010b).
Health promotion and prevention servicesThese services are funded by federal and state governments while local health departments and community health centres provide the services. Most local public health departments provide screening and treatment for communicable diseases such as STDs and tuberculosis. Many also provide services to high-risk women and children (low income, special health-care needs). Services may include perinatal home visits, well child clinics, developmental screening, and women, infants and children (WIC) nutrition counselling. Some other prevention services provided are: adult and childhood immunizations; screening for diabetes, cardiovascular and other chronic diseases; smoking prevention and cessation; and prevention of HIV / AIDs, unintended pregnancy, obesity, inactivity, substance abuse, injuries and violence. Supported educational activities include media campaigns, outreach to high risk groups and general population education. Some activities are conducted in partnership with NGOs, non-health-care related local government agencies or state health agencies. The amount of resources devoted to health promotion and prevention activities and the engagement of agencies varies by state and locality. Larger local health departments are more likely to provide a comprehensive set of services (Salinsky, 2010).
Public health screening programmesThere is no national public health screening programme in place in the United States, and screening programmes vary from state to state. State and local departments of health may screen for communicable diseases such as STDs and tuberculosis, newborn congenital diseases, and chronic diseases such as diabetes and cardiovascular disease. Screening programmes are also available in community health centres, doctors’ offices and retail health-care settings (shopping malls, general stores, etc.). Outreach to the most vulnerable
Health systems in transition United States of America222
populations is always an issue, however. Many other diseases are screened in the United States (for example, breast and colon cancer) but whether these are offered to the individual patient is up to the discretion of the primary care provider and cannot be considered part of a public health effort except to the extent that there is public health education regarding the need to be screened.
Other servicesServices funded or directly provided by state government include mental, correctional and child health services. Some state governments engage in the direct provision of mental and correctional health services, while most delegate the services to private agencies. Most states directly provide services for children with special health needs.
Licensing, regulation and planning of health-care facilities and workforceThese functions are generally under the jurisdiction of state and local public health agencies. These agencies inspect and license health-care facilities. State agencies license health-care professionals, and certify the non-professional health-care workforce (see also section 4.2.6). State agencies may also measure the performance of health-care providers and facilities, publish quality report cards based on those measures and engage in other activities to improve the quality of health-care services. Other organizations that measure and publish quality data on providers are federal agencies such as CMS (through its Hospital Compare and other reports) and the AHRQ (through its National Health Care Quality Report), and numerous private agencies such as the NCQA. Some private agencies such as the Joint Commission, monitor quality but do not publish results. Most state health departments also inspect and license food processing facilities, solid waste removal services and other health-related facilities (see sections 2.5, 2.6 and 2.8 for more information).
5.2.3 Accessibility, adequacy and quality of public health services
In addition to the observations above about the organization and functioning of the United States public health system, federal, state and local services have been underfunded, resources at the local level are inadequate, and services tend to be driven by immediate concerns and political expediency rather than a long-term vision (IOM, 1988, 2003; Baker et al., 2005; Salinsky, 2010). The public health workforce (as a ratio of public health workers to population) has declined over a 30-year period (Baker et al., 2005) and is insufficiently trained (IOM, 2003). Many agencies operate with outdated facilities and technologies,

Health systems in transition United States of America 223
including informatics (Baker et al., 2005). Until the early 2000s many agencies had fragmented information systems with limited or no access to the internet and electronic mail, leading to lack of population-based data on public health diseases and exposures (IOM, 2003). The anthrax and West Nile outbreaks overwhelmed the monitoring capabilities of laboratories. Funding and resource availability has also been noted to vary substantially by locality, so that some agencies have sufficient resources while others are significantly lacking (Mays & Smith, 2009). In 2005, for example, per capita spending by local agencies ranged from $1 to $200 (Mays & Smith, 2009).
It has also been difficult to systematically prioritize the allocation of services based on scientific analysis of needs (IOM, 2003; Salinsky, 2010). Instead, activities have been prioritized according to immediate public health threats and political expediency. For example, as concerns rose over terrorist attacks in the United States, much of the public health funding and services switched to terrorism preparedness, leaving holes in other areas of public health (Editorial, 2005). As a consequence, it is thought by some that the focus on terrorist attacks contributed to the inadequate response to Hurricane Katrina (Editorial, 2005). This failure to develop an overall evidence-based direction for public health services may play into the fragmentation of services just discussed.
A 2003 report by the IOM summarized the United States public health system as having “incomplete domestic preparedness and emergency response capabilities, and communities without access to essential public health services”, which left the population vulnerable not only to “exotic germs and bioterrorism” but also to “social and other environmental conditions (that) undermine health, including toxic water, air, and housing; inaccurate and confusing health information; poverty; a lack of health care; and unequal opportunities for health” (p.3).
Public health improvement initiatives began in the 1990s in response to the 1988 IOM recommendations and the Healthy People 2000 objective of having 90% of the population served by effective public health services by the year 2000 (Scutchfield, Mays & Lurie, 2009). The Public Health Improvement Act enacted by Congress in 2000 called for a plan to assure the preparedness of every community in the nation and allocated additional funds to upgrade public health programmes (Baker et al., 2005). Professional associations, such as the National Association of County and City Health Officials (NACCHO) and the CDC, assessed local public health services and developed guidelines, strategies and performance measures (Scutchfield, Mays & Lurie, 2009).
Health systems in transition United States of America224
These developments succeeded in improving the access to and quality of public health services. Overall funding increased for several years, and the coordination, planning and delivery of services improved. But lack of funding threatens future progress. Budget cuts in state funding, which began before the 2008 recession and have deepened since, threaten the progress made to date (Baker et al., 2005; Calmes, 2011). The ACA established a Prevention and Public Health Fund dedicated to public health and disease prevention (Haberkorn, 2012) but it too is undergoing cuts.
5.3 Outpatient services: primary care
5.3.1 Definition and services
Primary care is defined as “the provision of integrated, accessible health-care services by clinicians who are accountable for addressing a large majority of personal health-care needs, developing a sustained partnership with patients, and practicing in the context of family and community” (IOM, 1994, p.15). The
“four pillars” of primary care are: (1) first contact with the health-care system; (2) continuity of care over time; (3) concern for the whole patient rather than a disease or part of the patient; and (4) coordination of care (Starfield, 1998).
Primary care practitioners are generalists who coordinate patients’ care and see patients over an extended period of time. In the United States several specialties have been subsumed under the primary care umbrella since providers in these fields may be the primary provider for the patient and may see the patient over a period of time. The specialty fields of primary care are family medicine, internal medicine, paediatrics, obstetrics and gynaecology (Bodenheimer & Pham, 2010). A practitioner of family medicine cares for all family members, regardless of age or sex, throughout their lifetime. A practitioner of internal medicine, or an internist, is concerned with the prevention, diagnosis, and treatment of adult diseases. A practitioner of paediatrics is responsible for the overall care of children up to the age of 18 years. A practitioner of obstetrics cares for pregnant women, while a practitioner of gynaecology deals with female reproductive issues.
Primary care practitioners include physicians, NPs, PAs and nurse midwives. Visits to a primary care physician comprised 59.6% of the 955 969 visits to physicians in the United States in 2008 (Centers for Disease Control and
Health systems in transition United States of America 225
Prevention, 2011a). Of the total number of physician visits, those to general and family practice physicians were 23.2%, those to internists, 16%, to paediatricians 12.1%, and to obstetricians and gynaecologists 8.3%.
The proportion of physician visits for primary care has declined since 1980 when it was 66.2% of all physician visits. This is congruent with a progressive decline in the proportion of primary care physicians since the 1950s (Centers for Disease Control and Prevention, 2011a). However, the decline in the proportion of primary care physicians and physician visits does not represent an absolute decrease in primary care services, since the primary care physician to population ratio continues to grow (albeit slowly: 1% over 10 recent years), and there has been a substantial growth in other primary care providers, such as NPs (9% over 10 recent years) and PAs (4% over 10 recent years) (Steinwald, 2008) (see also section 4.2.4).
There are several venues for the delivery of primary care. A major one is the private clinic of physicians. Another primary care venue is the public or non-profit community health centre, which provides access to primary care for low-income, uninsured, and minority populations (Bodenheimer & Pham, 2010). Other government settings include clinics for the military (such as those run by the VHA), prisons, the IHS, and centres for migrants and the homeless (Bodenheimer & Pham, 2010; Shi et al., 2010). Urban public and teaching hospitals may also have outpatient clinics for primary care services, typically serving underserved populations (Bodenheimer & Pham, 2010). A small number of integrated care systems, such as Kaiser Permanente and Geisinger Health System, provide primary care as part of their integrated systems which cover primary, specialty, emergency, hospital and other care (Bodenheimer & Pham, 2010). Finally, workplace wellness programmes and retail clinics are providing some primary care services by providing screening, health promotion and basic prevention services (Baicker, Cutler & Song, 2010; RAND, 2010).
Primary care practices in private clinics provide care to patients who are insured or who can afford substantial OOP expenses. Patients receive all types of primary care service, including screening, diagnosis and treatment for chronic and acute conditions, with the exception of health promotion and education, which tend to be neglected in some physician practices (McMenamin et al., 2004). Most primary care physician private practices are physician-run and / or owned. Most are small: 32% of primary care physicians are in solo practice and 46% are in practices with two to five physicians (Bodenheimer & Pham, 2010). However, two trends are leading to physicians’ offices becoming larger and more integrated: firstly, physicians are finding that larger, more

Health systems in transition United States of America226
integrated, practices are cost-effective and provide financial security and, secondly, hospitals are buying up and consolidating primary care practices (Bodenheimer & Pham, 2010).
Around 20 million people in the United States receive their primary care in approximately 1200 CHCs in 6000 urban and rural areas (Bodenheimer & Pham, 2010; Hawkins & Groves, 2011). Individuals seen by CHCs tend to be at or below the federal poverty level. More than 60% are minorities, 40% are uninsured and 35% receive Medicaid or CHIP for families that don’t qualify for Medicaid but can’t afford insurance (Bodenheimer & Pham, 2010). Care is provided at no or little cost to the individual (Shi, Stevens & Politzer, 2007). Consequently, these centres are a major part of the “health care safety-net” for people who are under or uninsured.
CHCs receive funding from federal, state and local sources, Medicaid, CHIP, private insurance and patient fees (NCSL, 2011). Most CHCs are federally qualified and funded. To qualify, public or private non-profit CHCs must serve an underserved population, offer a sliding scale fee, provide comprehensive services and engage in quality improvement (HRSA, 2012). Other CHCs meet the CMS definition of a centre, but do not receive federal funding.
CHCs provide comprehensive, coordinated primary care using a team approach. Physicians constitute about 70% of the practitioners, NPs 20%, PAs 9% and nurse midwives 1% (Hing, Hooker & Ashman, 2011). Community health workers may also be utilized (HRSA, 2007). Patients going to CHCs may receive any of the specialty primary care services described above and they may additionally receive dental and mental health care (Druss et al., 2008). The centres provide preventive care, including health education and screening, chronic and acute condition care, pre-surgery and post-surgery care, medication prescription and specialty referral services. To receive federal funding, centres must also have case management, translation and transportation services (Hing, Hooker & Ashman, 2011). Studies have shown that CHCs provide as good or better quality of care compared with other providers (Hawkins & Groves, 2011). Funds for Federally Qualified Clinics are expected to double as a result of the ACA legislation.
Retail clinics, located in pharmacies, general stores and department stores such as Target and Walgreens, are emerging as places to go for treatment of minor medical conditions (RAND, 2010). After experiencing a boom in 2007–2008, the number of new retail clinic openings levelled off. The ACA, however, has renewed interest and expansion of this model for delivering primary care in the United States (Dolan, 2011).

Health systems in transition United States of America 227
Retail clinics tend to be staffed by non-physician practitioners, such as NPs or PAs, and they treat a limited number of conditions and needs, such as skin conditions, sore throats, pregnancy testing, infections, diabetes screening and immunizations (Mehrotra et al., 2008). On the positive side, retail clinics are able to treat these minor conditions with similar health outcomes at less cost than the ED (Mehrotra et al., 2009; RAND, 2010; Weinick, Burns & Mehrotra, 2010). They also have extended hours compared with doctors’ offices or emergency centres.
There are some concerns, however, regarding the role of retail clinics in primary care. The first concern is the lack of continuity. Although one study concluded that retail clinics are unlikely to disrupt the primary care–patient relationship – because 60% of the patients who seek care at retail clinics do not have a primary care provider – at retail clinics patients do not establish ongoing relationships with primary care practitioners and so the clinics do nothing to reduce the fragmentation of primary care (Mehrotra et al., 2008). In response to that concern, some experts point to the need for integration between the clinics and physician groups or hospital chains (Pollack, Gidengil & Mehrotra, 2010). One other concern is whether the clinics do anything to improve access to care for the underserved. Since most clinics are outside medically underserved areas, and require full payment for services, they do not seem to be improving access for that population (RAND, 2010).
5.3.2 Accessibility, adequacy and quality of primary care
Access to primary care requires that patients have the ability to pay for care, adequate transportation to care, and the health literacy to demand and use the care, among other patient factors. It also requires that the supply, distribution and time of providers is adequate (Horton & Johnson, 2010; Shi & Singh, 2012). Patient inability to pay for care is one of the chief barriers to primary care in the United States (see Chapter 3). Over 17% of the population is without health insurance, and many others face high OOP expenses due to underinsurance (Mendez, 2012). The underinsured include elderly individuals who receive Medicare but cannot afford supplemental insurance or the OOP expenses associated with Medicare (Horton & Johnson, 2010). Those covered by Medicaid also have insurance but may experience problems accessing primary care due to their inability to find a private physician who accepts Medicaid patients and OOP expenses associated with safety-net providers (Shi & Singh, 2012). Many with private insurance also have deductibles or co-payments that are difficult to afford. While health-care safety-net facilities (CHCs, migrant centres, urban teaching hospital clinics and others) provide care for low fees, the
Health systems in transition United States of America228
services may not be nearby or individuals may not be aware of them (Horton & Johnson, 2010). Individuals may be able to pay practitioner fees but cannot afford medication or other primary care treatments. So despite the safety-net, inability to pay for primary care remains a barrier to many.
Patients must also have adequate transportation to and from primary care facilities in order to obtain access to primary care. Individuals may not have private transportation and may need mass transportation with stops close to the provider facility. Some individuals cannot walk far and need car or van transportation. Patients in rural areas may find it impossible to get to primary care facilities that are some distance away.
Language difficulties and illiteracy have also been identified as barriers to outpatient physician services (Baker et al., 2004). Such illiterate patients say that their reading difficulties discourage them from going to a doctor because they will have difficulty finding their way around and reading the instructions on forms and they fear rude treatment by health-care personnel (Baker et al., 2004).
On the provider side, patients may not be able to find primary care practitioners who are able or willing to provide care, or who can provide care in a timely way. The proportion of people looking for a primary care physician but having difficulty finding one has been increasing (Bodenheimer & Pham, 2010). In 2008, 22% of Medicare beneficiaries and thirty-one per cent of privately insured patients had a delay in obtaining an appointment for routine care (Bodenheimer & Pham, 2010). Among ED users polled in a 2006 California survey, 42% of Medicare beneficiaries found it difficult or impossible to access routine primary care and ended up going to the ED (California HealthCare Foundation, 2006).
There are many reasons for this effective shortage of primary care practitioners. Although the primary care physician to population ratio has continued to grow slowly, the growth has lagged behind that of specialists and the primary care workload is higher than that of specialists. For example, while only 37% of physicians are primary care providers, 56% of visits to doctors’ offices are for primary care (Bodenheimer & Pham, 2010). Many primary care physicians carry heavy workloads comprised of patients with multiple problems, have excessive administrative requirements and work in inefficient workplaces (Bodenheimer & Pham, 2010).
Health systems in transition United States of America 229
Reimbursement rates, especially those from Medicare and Medicaid, may be another source of insufficient primary care physician supply. A 2004 national survey of primary care physicians found that 20% restricted acceptance of Medicare beneficiaries and 22% were not accepting any new patients (Bodenheimer & Pham, 2010). In response to low reimbursement from public and private insurance, some physicians are going to concierge medicine, offering their services exclusively to patients who pay cash for special access on a contractual basis (Sullivan, 2011). In some cases, for an advance fee of up to several thousand dollars per month, the physician agrees to take only a limited number of patients, and in return provides unlimited visits of extended duration up to 24 hours a day, 7 days a week.
Geographical maldistribution of primary care providers contributes to shortages in rural and disadvantaged urban areas (see also section 4.2.4). The primary care provider to population ratio in rural areas is less than half that of urban areas (46 per 100 000 compared to 100 per 100 000) (Bodenheimer & Pham, 2010). In 2009, 65 million people lived in areas designated by HRSA as having a primary care shortage (Bodenheimer & Pham, 2010). The difficulty in recruiting primary care providers to work in federally qualified community health centres is slowing down the expansion of those facilities (Bodenheimer & Pham, 2010; Friedman, 2008).
The patient and practitioner factors affecting access to primary care are among several factors that may negatively affect the quality of primary care. In a survey of primary care and specialty physicians, factors contributing to lower quality of care were insurance company rejection of practitioner decisions, patient payment issues, patient noncompliance and inadequate time with the patients (Deshpande & DeMello, 2011). Primary care physicians were more likely than specialty physicians to report problems due to inadequate time with patients.
Another factor affecting the quality of primary care is the fragmentation of services. Services are delivered through isolated provider facilities (e.g. private doctors’ offices). Some services are provided from primary care specialties, such as obstetrics and gynaecology, which focus on one body system rather than the whole person) (Wilkin, 2002). First contact care is often provided by specialists rather than primary care practitioners. There is also a small business culture “with doctors, dentists, pharmacists and others running their own independent businesses” (Wilkin, 2002, p.309). These characteristics indicate that the “four pillars” of primary care are not always well implemented in the United States.

Health systems in transition United States of America230
5.3.3 Initiatives to improve primary care
While socioeconomic status, social capital, and racial and ethnic inequality are strong determinants of health, access to primary health care is also important (Phillips & Bazemore, 2010; Ahnquist, Wamala & Lindstrom, 2012). Studies show that access to quality primary care is important for good health outcomes, equitable health care, and lower health system expenditures. A review of studies found that health is better and less expensive when more primary care is available (Starfield, Shi & Macinko, 2005). Subsequent studies support these findings (Friedberg, Hussey & Schneider, 2010; Phillips & Bazemore, 2010). Primary care is especially beneficial for poor people, who, despite the negative influence of poverty on health, have better immunization rates, blood pressure control, dental health, quality of life and lower mortality if they have access to primary care (Phillips & Bazemore, 2010).
Studies indicate that access to primary care also reduces health-care utilization and costs. Individuals with access to primary care are more likely to receive preventive care and treatment before more severe problems develop and they have fewer emergency department visits and hospital admissions (Petterson et al., 2009; Phillips & Bazemore, 2010). For people at or below the poverty level, those who use community health centres have fewer ED visits compared to those who do not (Bodenheimer & Pham, 2010). Two studies indicate that the existence of rural CHCs in a community is associated with fewer hospitalizations among elderly rural residents with problems that could be treated in an ambulatory setting (Zhang et al., 2006; Probst, Laditka & Laditka, 2009).
Increasing the number of Americans with insurance is one of the chief goals of the ACA, which will be explained in Chapter 6. Depending on the state where a person lives, Medicaid is being expanded to include all persons up to 138% of poverty level. Sliding scale subsidies to help obtain health insurance will go to persons between 138% and 400% of the poverty level. Another important component of the ACA is to increase funding to community health centres.
Many policies are being implemented to increase the supply of primary care practitioners (see also section 4.2.7). To increase primary care physician supply and reduce maldistributions, medical school admissions and curricula are putting a greater focus on primary and rural practices (Bodenheimer & Pham, 2010). Loan-repayment programmes that use incentives to practise in areas of need after graduation are another method of increasing practitioner supply (Weiner, 2007). Policies are also being implemented to increase the supply of non-physician practitioners (Goodman & Fisher, 2008). By increasing
Health systems in transition United States of America 231
provider supply, primary care patient loads can be reduced. Another way to reduce patient load is to rely more on teams and less on physicians working alone (Bodenheimer & Pham, 2010).
The Patient Centered Medical Home (PCMH) is an initiative underway in the United States to reduce the fragmentation of primary care (Phillips & Bazemore, 2010). Characteristics are that: (1) each patient has an ongoing relationship with a primary care provider; (2) the primary care provider directs the medical team; (3) the primary care provider has responsibility for caring for all the patient’s health needs through all stages of the patient’s life; (4) patient care is coordinated across all health-care settings; (5) services are safe, evidence-based and of high quality, with patients actively participating in decision-making; (6) patients have access to care; (7) payment systems recognize the added value of PCMH (Rittenhouse et al., 2011).
The PCHM model is being implemented in eight states in the form of demonstration projects sponsored by the CMS (Rittenhouse et al., 2011). Some primary care and multi-specialty physician groups have begun implementing aspects of the model in their practices but the use of medical homes is low overall and practices that are adopting it are mostly large physician groups (140 or greater) (Rittenhouse et al., 2011). Early evaluation of PCMH indicates some favourable effects on patient outcomes, some unfavourable effects on costs (increasing them) and otherwise inconclusive results (Peikes et al., 2012).
ACOs are a method of care coordination for the Medicare programme initiated by the ACA in 2010. ACOs are groups of providers in an area – including primary and specialty care physicians, hospitals and others – who coordinate their care for Medicare patients (CMS, 2012). The purpose of ACOs is to ensure that patients receive the right care at the right time without duplication of services and medical errors. ACOs differ from PCMHs in that payment from Medicare is tied to the performance of the ACO, thus conferring financial risk for members, whereas with PCMHs there is no direct relationship between payment and membership. When an ACO succeeds both in efficiency and high quality, it will share in the savings. At the time of writing, the impact of ACOs is not known. ACOs are further discussed in Box 3.3.
Health systems in transition United States of America232
5.4 Outpatient services: specialty care
5.4.1 Definition and services
Specialty care focuses on one part, disease or organ system of the individual. It is often a short-term or intermittent relationship. It does not coordinate the overall care of the individual and is often received after care is sought at the primary care level. Since each specialist is caring for a different aspect of the individual, specialty care is one of the aspects of health care that primary care seeks to interface and coordinate with. However, the coordination is often weak (Chen & Yee, 2009).
Specialty care practitioners have specific education and training in the specialty area. They treat their patients only for problems or interventions in that area of expertise (see also section 4.2.1). Specialists practise in private practices or in hospital EDs or other diagnostic or treatment departments or facilities. As with primary care, physicians are the main practitioners of specialty care. However, APRNs and PAs also practise in specialty areas. Physician specialty areas are allergy / immunology, anaesthesia, cardiology, cardiac surgery, dermatology, emergency medicine, general surgery, gerontology, neurology, neurosurgery, oncology, ophthalmology, orthopaedics, plastic surgery, pulmonology, rheumatology, radiology, psychiatry and urology. Physician assistant specialty practices can be found in most of the physician specialty areas (Morgan & Hooker, 2010). APRNs specialize in anaesthesia (nurse anaesthetist) or in clinical nurse specialty areas such as acute care, community health, dermatology, family health, gerontology, paediatrics, psychiatric and mental health, and school nursing. In some of these areas the APRN fills a primary care role (e.g. family health, community health, paediatrics).
Visits to a specialty care physician comprised 40% of the 955 969 visits to physicians in the United States in 2008 (Centers for Disease Control and Prevention, 2011a). This represents an increase since 1980 when the proportion was 34% of all physician visits. The increase corresponds to a substantial growth in the number of specialists: from 1965 to 1992 the specialist-to-population ratio increased by 120% (Bodenheimer & Pham, 2010).
5.4.2 Accessibility, adequacy and quality of specialty care
Many of the issues with access to primary care are also a concern with specialty care. Payer issues are an even greater problem with specialty care than primary care. One reason for this is that a primary care safety-net exists for underinsured

Health systems in transition United States of America 233
and uninsured individuals but the safety-net does not cover specialty care to the same extent (Cook et al., 2007; Bellinger et al., 2010; Sequist, 2011). Safety-net organizations, such as CHCs and urban hospital clinics, often do not have funding to offer specialty services and must refer these services to practitioners outside the organization (Hadley & Cunningham, 2004). When the underinsured patient is referred to a specialist outside the safety-net, the lower reimbursements may not be accepted by the specialist.
Payment-related barriers to specialty care reported by CHC directors in a 2007 study were that: (1) specialists would not care for patients with certain types of insurance; (2) the patient’s insurance did not cover the care; and (3) patients were unable to meet the upfront OOP costs (Cook et al., 2007). Private insurance may not cover the care because of insurance rules regarding access to specialty services. Closed access HMOs do not allow direct access to specialists, while HMOs and other managed care plans control specialist referrals and limit access to some types of specialist. Specialists in California report that they are reluctant to care for patients with MediCal (California Medicaid) because of administrative burdens and low reimbursement rates (Wang et al., 2004). It has been found that payer status influences whether a referral to a specialist is even made by a primary care practitioner, with the odds of an uninsured person receiving a referral 0.58 times that of an insured person (Forrest et al., 2006).
On top of payment-related issues with specialty care, there are also significant geographical maldistributions of specialists (Bellinger et al., 2010; Sequist, 2011). In many rural and underserved communities, access to specialty care is very limited (Sequist et al., 2011). It is difficult to recruit specialists to work in remote settings “where resources are scarce, opportunities to interact with specialist colleagues are limited, and the clinical caseload may not justify the presence of a full-time subspecialist” (Sequist et al., 2011, p.2258).
Assessing the quality of outpatient specialty care is difficult at this time. Health plan quality measures such as HEDIS and Consumer Assessment of Health Plan Survey (CAHPS) are applied across all types of practice without distinguishing the practice type. Furthermore, performance is reported on an individual provider and health plan basis and there are no national or state summaries of HEDIS or CAHPS results. There is not a consensus on the expected role of specialists or consistent standards by which to measure specialist performance (Forrest, 2009).
Care coordination is a growing issue in the United States, where the typical Medicare beneficiary sees two primary care physicians and five specialists a year (Bodenheimer, 2008). Patients with multiple conditions may see up to

Health systems in transition United States of America234
16 physicians a year (Bodenheimer, 2008). In the current health-care system coordinated care appears to be the exception rather than the rule (Chen & Yee, 2009). “Patients who transition between primary care and specialty care often encounter lapses in communication, duplication of diagnostic testing, and ambiguity regarding physician duties and responsibilities” (Chen & Yee, 2009). Overtreatment, undertreatment, conflicting treatment and polypharmacy can occur (Bodenheimer, 2008).
5.4.3 Initiatives to improve specialty care
Areas in which specialty care needs to be strengthened are in the ability of the underinsured and uninsured to pay for care, the willingness of specialty practitioners to care for them and the distribution of specialty practitioners. The ACA is increasing the number of people with public or private health insurance, which will improve access to specialists. Another ACA provision is to provide greater funding to safety-net organizations so that they can contract with more specialty practitioners.
To improve the interface between primary and specialist care, PCMH is being expanded into PCMH neighbourhoods (PCMH-N). In addition to the characteristics of the PCMH, the PCMH-N has integrated decision-making (using EHRs where feasible), clear indications for referral, and timely sharing of information between all providers (Yee, 2011). It is too early to say whether the PCMH-N achieves its integration goals. Another way that primary and specialist care is being integrated is the establishment of multi-specialty group practices (Forrest, 2009).
“Patient navigation” is a coordination of care model that has been utilized for a number of years in cancer care – an area of health care in which patients may see a number of different specialists. Barriers to accessing cancer care are identified and patients are assigned a “navigator” to reduce delays in accessing cancer care services (Paskett, Harrop & Wells, 2011, p.238). Navigators can be lay people, nurses, social workers, health educators or cancer survivors. There is some evidence that for several cancers patient navigation has contributed to an improvement in screening rates, follow-up visits after a screening abnormality, and timeliness of resolving an abnormality.

Health systems in transition United States of America 235
5.5 Outpatient services: ambulatory surgical, emergency and urgent care
5.5.1 Ambulatory surgical care
Improvements in surgical equipment, techniques and anaesthesia have led to more and more surgeries being performed on an outpatient basis in the United States. Compared to inpatient surgery, outpatient surgery has the advantage of convenient hours and locations, a lower risk of infection and recovery from surgery at home (Plotzke & Courtemanche, 2011). The disadvantage is that reduced professional oversight during the recovery period can lead to complications.
In 2010, more than three-quarters of all surgeries were in the outpatient (or ambulatory) setting (Barie, 2010). Ambulatory surgery can be performed in three different settings: doctors’ offices, hospital day surgery departments and free-standing ambulatory surgical centres (ASCs) (Winter, 2003). Operations performed in doctors’ offices tend to be minor ones, such as aspirating cysts, excising lesions and sewing up lacerations (Fleury, 1981; Henderson, 1989). Outpatient surgeries performed in hospital departments and free-standing surgical centres are less minor. Common surgeries in these settings include those for back problems, cataracts, cancers, colonoscopy, diverticuli, inguinal hernia repair, gallstones and many orthopaedic problems (Cullen, Hall & Golosinskiy, 2009). Cardiovascular procedures such as angiography and angioplasty (with or without stent) are now also being done on an outpatient basis (Gradinscak et al., 2004). Surgeries not done on an outpatient basis are those with high risk, of long duration or with serious physical or mental limitations for the patient during recovery. Examples are open-heart surgery and hip replacement.
More serious surgeries are being performed on an outpatient basis as improvements in drugs and techniques reduce the surgical time, the invasiveness of the procedure and the length of the recovery period. Knee replacement is an example of a complex surgery that used to take several hours to perform, was extremely invasive and required a long, supervised physical recovery period, but that is now transitioning to an outpatient procedure (Press, 2009).
There is little information about the practice of minor ambulatory surgery in doctors’ offices. In fact, a report on ambulatory surgery prepared for the CDC in 2006 considers only hospital-based and freestanding outpatient surgeries. Hospital-based ambulatory surgeries were 57% of outpatient surgeries in 2006 –

Health systems in transition United States of America236
a figure that has not changed since 1996 (Cullen, Hall & Golosinskiy, 2009). Freestanding ambulatory surgeries made up 43% of outpatient surgeries: an increase of 300% since 1996 (Cullen, Hall & Golosinskiy, 2009).
Compared to hospital-based surgical centres, ASCs are perceived to have more convenient scheduling for both physician and patient, greater physician and patient satisfaction, and lower costs due to competition with hospitals (Barie, 2010; Plotzke & Courtemanche, 2011). However, studies do not necessarily verify these perceptions (Gardner et al., 2005; Cullen, Hall & Golosinskiy, 2009). Disadvantages of ASCs include inefficient referral patterns, excessive utilization and a concern that ASCs serve the less sick, more profitable patients, leaving the sicker, less profitable patients in hospital-based centres (Winter, 2003; Hollenbeck et al., 2010; Plotzke & Courtemanche, 2011).
Although one study found no differences between ASCs and hospital-based centres in 7-day and 30-day mortality and unexpected hospitalizations (Chukmaitov et al., 2008), ASCs have come under fire for infection control problems (Barie, 2010; Schaefer et al., 2010). Infectious outbreaks in ASCs in several states led the HHS in 2009 to dedicate ARRA funds to state surveys of infection control practices and to mandate that ASCs maintain infection control programmes directed by a health-care professional with training in infection control (Barie, 2010).
The selective referral process typical of ASCs indicates that uninsured patients and those with lower paying insurance, such as Medicaid, find it difficult to utilize ASCs. Instead, if these patients have an emergent condition, they will be treated in hospitals. In fact, these individuals may be unable to access outpatient surgery in general, since they may be unable to afford it. Instead, they may wait until their condition is so severe that the surgery must be performed on an inpatient basis.
5.5.2 Emergency Department care
In 2008 Americans paid 0.41 visits per person on average to a hospital ED (Centers for Disease Control and Prevention, 2008b). Of these visits, 3.7% were classified as immediate (the person should be seen immediately), 11.9% as emergent (within 15 minutes), 38.9% as urgent (within an hour), 21.2% as semi-urgent (within two hours), 8% as non-urgent (within 24 hours), and 16.3% as unknown (Centers for Disease Control and Prevention, 2008b). Reasons for the visits included fever, cough, vomiting, gastrointestinal pain and spasm, skin rash, pain in the ear, head, throat and back, lacerations, fractures, accidents, dizziness, fainting and difficulty breathing (Centers for Disease Control and

Health systems in transition United States of America 237
Prevention, 2008b). Emergent visits included trauma, poisoning, burns and surgical emergencies (e.g. appendicitis). The median waiting time to see a physician was 35 minutes. Median time spent in the ED was 154 minutes.
The number of ED visits per person has grown over time. Between 1997 and 2007, ED visits per 1000 persons rose from 353 to 390 (Tang et al., 2010). Most of the increase in visits was from adults with Medicaid. Those visits rose from 694 to 947.2 per 1000 persons. Of these visits, those that could have been treated outside a hospital (“ambulatory care sensitive”) increased from 66 to 84 per 1000 persons.
EDs are a major part of the United States health-care safety-net (Trzeciak & Rivers, 2003; Shen, & Hsia, 2010). EDs in hospitals that receive payment from Medicare are required by the EMTALA to provide care to anyone needing emergency treatment. This allows underinsured and uninsured persons access to the ED for emergency conditions. Hospitals must care for the individuals until they are stable, which could include inpatient admission and surgery. Legally, individuals are responsible for paying for care not covered by insurance but they may be unable to do so and the hospital may write off the payment as “charity care” or “bad debt”, two accounting terms for “uncompensated care”. Hospitals make up for some of the revenue loss through Medicare funds earmarked for safety-net care and through higher charges to other payer groups. An increase in the number of uninsured people over the years has put a strain on hospitals’ ability to maintain this safety-net.
EDs tend to be overused for non-urgent problems and for serious problems that could have been prevented with better primary and specialty care (GAO, 2009). When patients do not have regular primary care, they may go to the ED to seek primary care services. They may also wait until they are seriously ill and then appear in an ED. Lower primary care density is a predictor of higher ED utilization (Richman et al., 2007) and low-income individuals have higher ED utilization rates than other individuals (DeLia & Cantor, 2009).
The overuse of EDs for conditions that could be seen in a non-emergency setting is one of several contributors to ED overcrowding and delays in care (Trzeciak & Rivers, 2003). Another contributor to ED overcrowding is lack of ED space and staff (nurses and physicians) (Natal, 2007; GAO, 2009). While the number of ED visits has increased over the years, the number of EDs has actually decreased (Shen & Hsia, 2010) and many of those that exist do not have sufficient capacity. Another major contributor is inadequate inpatient

Health systems in transition United States of America238
capacity (beds and staffing) (Trzeciak & Rivers, 2003; Natal, 2007; GAO, 2009). A review of articles suggested that this last factor is the main one affecting overcrowding (GAO, 2009).
ED overcrowding, with long waiting times, hospital diversions and patient boarding has been a problem for many years. A 2009 GAO report found that the situation has not improved (GAO, 2009). Waiting times continue to exceed the recommended time. Individuals requiring immediate care, which should be initiated within one minute, are being seen in 28 minutes on average. Emergent cases, which should be seen by a physician in 1–14 minutes, waited 37 minutes, more than twice as long as recommended. Diverting ambulances away from the ED, allowed only when the ED is demonstrably full, is another indicator of overcrowding. Approximately one-quarter of hospitals go on ambulance diversion at least once a year (GAO, 2009; AHA, 2010b).
The 2009 GAO report assessed the evidence on the effect of ED overcrowding on quality of care. Some studies find relationships between diversion or patient boarding for more than 6 hours and mortality. However, the GAO concludes that the consequences of crowded EDs on quality of care have not been studied comprehensively and that additional studies are needed.
A final issue with ED services involves geographical access. A study by Lee et al. (2007) found that areas in which individuals had to travel further to an ED also had less utilized EDs. Another study by Shen & Hsia (2010) found that between 2001 and 2005, journey times to the nearest ED increased for around 5% of the population. This was more prevalent in the south and in poor communities.
According to the GAO, ED access and quality can be improved through reducing the number of unnecessary visits (input), improving patient throughput, and reducing impediments to output (GAO, 2009). Some research suggests that using co-payments to reduce inappropriate use of EDs does not work, at least not for the Medicaid population (Mortensen, 2010). Instead, reducing unnecessary ED visits will best be accomplished through system-wide reforms that improve access to primary care, such as those being implemented under the ACA (see Chapter 6). Throughput changes that have been implemented include instituting a fast-track system that sorts non-urgent patients into a separate track for care, establishing a satellite laboratory to speed up testing and using computer systems that are linked to inpatient records, thus reducing time spent in administrative tasks (GAO, 2009). Policies to improve output have included increasing the capacity of inpatient beds, particularly in ICUs, and stabilizing elective admissions to allow sufficient openings for ED admission.
Health systems in transition United States of America 239
5.5.3 Urgent care
Urgent care is provided outside the ED setting in centres that provide care on a walk-in basis, have extended hours into the evening, Monday to Friday and at least one day over the weekend, and have on-site laboratories and radiology (Weinick, Bristol & DesRoches, 2009a). The scope of services in these centres is broader than those in many primary care offices or retail clinics and falls somewhere between that of a primary care practitioner’s office and an ED (Weinick & Betancourt, 2007; Weinick, Burns & Mehrotra, 2010). Services focus on acute episodic care, and include care for minor illnesses and emergencies such as upper respiratory infections, urinary tract infections, conjunctivitis, headache, backache, lacerations, burns, strains and fractures (Weinick & Betancourt, 2007; Weinick, Burns & Mehrotra, 2010). Medical care is typically performed by family physicians, physician specialists, NPs and PAs (Weinick, Bristol & DesRoches, 2009a).
Around half of all urgent care centres (UCCs) are owned independently (Weinick & Betancourt, 2007). Around 25% are owned by hospitals, 8% by multi-specialty medical groups and the remainder by other types of ownership. Independently owned centres may be located in a single facility or part of a small chain (average number of locations of 2.7). A survey carried out in 2010 by the Urgent Care Association of America (UCAA) indicates that physician or group physician ownership accounts for approximately 50% (Bruno, 2011). Corporations owned around 14% of UCCs and non-physician individuals around 8%.
In 2007 there were 12 000 – 20 000 UCCs in the United States (Weinick & Betancourt, 2007). Urgent care services have expanded in response to difficulties in seeing primary care practitioners on an urgent basis and after hours, high ED costs, and long ED waiting times (Scott et al., 2009; Weinick, Bristol & DesRoches, 2009a). The ability to get same-day test results and medications also make them popular (Scott et al., 2009). Some individuals use UCCs because they do not have a regular source of primary care (Scott et al., 2009).
Access and continuity of care issues with urgent care are similar to those of retail clinics. An individual must have insurance or pay out-of-pocket for care, and it is not clear whether centres are conveniently located for indigent populations. Most UCCs attempt to promote continuity of care despite their episodic nature. A survey of centres found that 86% maintain a list of primary care physicians and 95% have a list of specialists to whom they can refer patients (Weinick, Bristol & DesRoches, 2009a). The survey also found that 48% of the
Health systems in transition United States of America240
centres send a copy of the patient’s chart to the patient’s regular physician (if they have one), 36% send a consultation note and 23% call the physician. However, continuity of care requires that patients comply with referrals and that physicians follow up when notified by the UCC. Lack of insurance or other factors may cause the patient to fail to follow up with the referral, while physician overwork may contribute to poor follow-up on his part.
The quality and costs of care in UCCs have not been subjected to much research. Of studies that have been conducted, no major issues with quality have emerged (Weinick, Bristol & DesRoches, 2009b). One study estimated that 13.7–27.1% of all current ED visits could safely take place at retail clinics or UCCs (Weinick, Burns & Mehrotra, 2010). This would lower patients’ waiting times and save on the extra cost of ED care.
5.6 Acute inpatient care
5.6.1 Definition, classification and utilization
Individuals who are acutely ill and need to have round-the-clock nursing care require inpatient care provided in hospitals. Some of the most common reasons for hospitalization include asthma, bronchitis, chronic obstructive pulmonary disease (COPD), pneumonia, appendicitis, gallstones, injury, fracture, cancer, childbirth, diabetes, mental problems, heart attack, heart failure, arrythmias, hypertension and stroke (Centers for Disease Control and Prevention, 2011a). Several of these conditions and many others require surgical intervention. Several of them, such as heart failure, heart attack and arrhythmias, may require care in an ICU.
Hospitals may be classified by type of service, ownership, size (in terms of number of beds) and length of stay. The AHA uses a typology of hospital classifications that combines these classifications. AHA designates, firstly, whether the hospital is federal or non-federal, then whether the non-federal hospital is community or non-community, and then lists some of the types of community hospital based on the services provided (Centers for Disease Control and Prevention, 2011a).
Federal hospitals are those operated by the federal government and include hospitals in the VA and IHS. Non-federal hospitals are divided into community and non-community hospitals. Community hospitals are non-federal short-stay hospitals that are open to the local public. Short-stay means that the average

Health systems in transition United States of America 241
length of stay is less than 30 days. Community hospitals form the bulk of hospitals and hospital beds in the United States, and they provide general or specialty services. General community hospitals provide a broad range of services and do not specialize in any type of service. Specialty community hospitals provide only a specific type of service, such as obstetrics and gynaecology; eye, ear, nose and throat; orthopaedics; paediatrics; psychiatric care; and cardiovascular services. Non-community hospitals are those not open to the local public. Examples of non-community hospitals are prison hospitals and state mental hospitals.
The AHA classifies all community hospitals by ownership: non-profit, for-profit, and state and local government (Centers for Disease Control and Prevention, 2011a). Non-profit hospitals are controlled by non-profit organizations such as religious organizations and fraternal societies. For-profit hospitals are owned by individuals, partnerships or corporations. State and local hospitals are controlled by state and local governments. The AHA also places all community hospitals into eight categories of size by the number of beds, ranging from 6 to 24 beds in the smallest category, to 500 and greater beds in the largest category (Centers for Disease Control and Prevention, 2011a).
A government or non-profit community hospital can also be designated as “teaching” or not. Teaching hospitals educate and train medical professionals, conduct medical research and provide care for the most serious conditions (AHA, 2009c). Teaching hospitals also have a mission of caring for the uninsured and indigent, and for providing community services such as health screening and fairs, support groups and information centres. Most teaching hospitals are non-profit, with one-tenth being public institutions (AHA, 2009c). Another consideration when classifying types of hospital is the category of critical access hospital. This designation was begun in 1997 to address disparities in acute-care services through added cost-based funding to small hospitals in rural areas. A hospital can be designated as a critical access hospital if it is located in a rural area that is 35 miles from another hospital (or 15 miles in mountainous terrain), has fewer than 25 beds and has an average length of stay of 96 hours or less per patient (Centers for Disease Control and Prevention, 2011a).
A final category of hospital is the specialty hospital. If two-thirds or more of inpatient claims are in one or two major diagnostic categories, or two-thirds of the inpatient claims are for diagnostically related surgical groups, the facility is considered to be a specialty hospital (Blackstone & Fuhr, 2007). A broad grouping of specialty hospitals includes non-surgical hospitals providing care for cancer, psychiatric illnesses, rehabilitation, long-term needs (excluding
Health systems in transition United States of America242
nursing homes and skilled nursing facilities), children and women, and surgical hospitals serving cardiac, orthopaedic or general surgical patients (Schneider et al., 2008). The surgical specialty hospitals are a newer phenomenon. They are usually small, averaging 52 beds for cardiac, 16 for orthopaedic and 14 for surgical patients (MedPAC, 2005). Most surgical specialty hospitals are investor owned, with individual physicians sharing a small part of ownership and national for-profit companies or local non-profit hospitals sharing the rest (Guterman, 2006). They tend to be located in states that do not have CON laws (e.g. South Dakota, Kansas, Oklahoma and Texas).
In 2009 there were 5795 hospitals across the United States (Centers for Disease Control and Prevention, 2011a). Of this total, federal hospitals were 4%, and non-federal were 96% (211 and 5584 respectively). Of non-federal hospitals, 90% (5008) were community hospitals and 10% (576) were non-community hospitals. Of all community hospitals in 2009, 58% were non-profit, 20% were for-profit and 22% were state and local government (Kaiser Family Foundation, 2010h). In 2007 1000 of the community hospitals were teaching hospitals (AHA, 2009c), while in 2011 over 1000 were critical access (RAC, 2012). In 2005 there were a total of 2108 non-surgical and surgical specialty hospitals (Schneider et al., 2008). Of those, in 2006 there were around 100–120 surgical specialty hospitals in the United States (Morrisey, 2006).
The percentages of federal, non-federal and community hospitals have not changed much since 1980. Non-federal hospitals in 1980 were 95% of all hospitals, and community hospitals were 88% of these (Centers for Disease Control and Prevention, 2011a). Exceptions to this stability are shifts in the ownership structure of United States hospitals and the recent growth in specialty hospitals. The percentage of non-profit hospitals is virtually unchanged but for-profit hospitals grew from 12.5% of community hospitals in 1980 to 20% in 2008, while state and local government hospitals declined from 30% in 1980 to 22% in 2008. The number of specialty hospitals grew 16% between 2000 and 2005, nearly four times the 4% growth in the number of general hospitals (Schneider et al., 2008).
What has changed the most over a 30-year time period is the utilization of hospital services. As outpatient visits for acute-care services have been increasing in the United States, inpatient stays in hospitals have been decreasing. Table 5.1 provides information on inpatient discharges, length of stay and days of care in United States non-federal short-stay hospitals from 1980 to 2007 (Centers for Disease Control and Prevention, 2011a). The table shows that age-adjusted admissions in United States hospitals per 10 000 population

Health systems in transition United States of America 243
fell from 1744 in 1980 to 1124 in 2007. Length of stay declined even more, falling 45% in this time period. Days of care are the number of discharges (or admissions) times the average length of stay, so it is no surprise that they declined 85%. Due to the shorter hospital stays, the ageing of the population and the movement to outpatient services, the acuity level of patients in hospitals today is much higher than it has been in the past (Deb, 2010).
Table 5.1 Utilization of non-federal short-stay hospital services in the United States, 1980–2007
1980 1985 1990 1995 2000 2005 2006 2007
Admissions per 10 000 population 1 744 1 522 1 252 1 180 1 133 1 162 1 153 1 124
Average length of stay 7.5 6.6 6.5 5.4 4.9 4.8 4.7 4.8
Days of care per 10 000 population 13 027 10 018 8 189 6 386 5 576 5 541 5 474 5 404
Source: CDC, 2011a, Table 99.
5.6.2 Accessibility, adequacy and quality of inpatient hospital care
The availability, extent and quality of hospital services depends on the insurance status of the individual seeking care, the type of hospital providing care and the geographical area. For those who have private insurance, Medicare or Medicaid, access to hospital care is usually not a problem. Care is accessed through a physician referral, either on an elective or an emergency basis. Insurance may require pre-authorization, which the physician arranges. The individual may go to any appropriate hospital that the physician recommends and that is on the insurance company provider list. Individuals who are insured under Federal programmes such as the VA or IHS are fully covered for care in VA and IHS hospitals respectively but not if they seek care outside those hospitals (except for emergencies).
While in the hospital, the insured patient will generally receive the tests and therapies recommended by the patient’s physician(s). The patient’s hospital stay may be short, since public and private insurance reimbursement systems currently encourage short stays. However, with the exception of some excesses in the 1990s, shorter hospital stays have not produced adverse consequences (Bueno et al., 2010). On the contrary, given current issues with hospital-acquired infections and other complications, shorter stays may be preferred (Hauck & Zhao, 2011). Once the individual is discharged from hospital, follow-up care – such as home care (discussed in sections 5.10.2 and 5.11.1) – may also be prescribed and received.

Health systems in transition United States of America244
For those who do not have insurance or are underinsured and must pay large OOP expenses for hospitalization, access becomes more complicated and more dependent on the type of hospital providing care. If the patient is acutely ill, any hospital receiving payment from Medicare (which is nearly all hospitals in the United States) must provide care to that patient until he or she is stabilized. This requirement, a result of the EMTALA law discussed in section 5.5.2, applies to individuals who show up on a hospital doorstep with a serious condition that requires immediate attention from a specialist and / or surgeon.
However, when the patient’s condition is not an emergency, access to hospital care becomes more dependent on hospital ownership. Government-owned (public) hospitals, at the local, county or state level, must provide charity care to those who do not have insurance or cannot pay for OOP portions of their care (Weissman, Gaskin & Reuter, 2003). These hospitals provide the majority of charity care in the United States for the uninsured, Medicaid and other vulnerable patients (Ferrier & Valdmanis, 2008; Weiner et al., 2008).
Charity care is also part of the mission of non-profit hospitals. These hospitals finance their charity care through special payments for treating Medicaid patients (“disproportionate share”) from the federal government, non-profit tax exemptions and cross-subsidies from other payers (Weissman, Gaskin & Reuter, 2003). None of these methods provides direct payments for the uninsured and the more competitive environment under managed care has decreased the ability to cross-subsidize or cost shift (Weissman, 2005). Whereas non-profit hospitals are able to finance certain levels of charity care, large amounts of charity care place a financial burden on them (Rosko, 2004) so it is prudent for them to find ways to limit the amount of charity care they provide. Since there is no requirement to treat individuals needing non-emergency care and there are no prohibitions about attempting to collect payment from patients, hospitals may bill their uninsured patients who receive emergency care after receiving the care, and they may ask for full or partial payment for non-emergency (“elective”) services before providing care (Ferrier & Valdmnais, 2008). Hospitals may ask for their full charges (which are higher than charges to public or private insurers) or for an amount on a sliding scale based on the patient’s income. These methods of controlling the amount of charity care result in hospitals either receiving full or partial payment for care or completely turning patients away. The result of these actions is predictable: uninsured patients are less likely to be admitted to hospitals for non-emergency care compared to insured patients (Danis et al., 2006).

Health systems in transition United States of America 245
Teaching hospitals carry a large proportion of charity care. Yet even these hospitals do not provide charity care for all who need it. A study of 121 academic health centres in the United States found that nearly one-quarter of the faculty felt that they were unable to admit patients or had to limit their care because the patient was uninsured and that they were rarely or never able to obtain non-emergency admissions for uninsured patients (Weissman et al., 2003).
In recent years issues have arisen regarding the management and amount of non-profit charity care. Some non-profit hospitals have been observed failing to inform patients about charity care, billing them undiscounted charges, and employing rough tactics to collect payment, including suing them for payment, garnishing wages and back accounts, seizing homes, and contributing to personal bankruptcies (Helvin, 2008). Non-profit hospitals have been criticized for failing to provide amounts of charity care commensurate with the amounts of their tax exemptions (Helvin, 2008; Hellinger, 2009).
For-profit hospitals also provide charity care but they do not receive tax exemptions for this. Studies are mixed as to whether they provide similar (Cram et al., 2010) or lesser (Schlesinger, Mitchell & Gray, 2003) amounts of charity compared to non-profit hospitals. A study by Weiner et al. (2008) found that for-profit hospitals provided required emergency charity care but severely limited other charity services. Surgical specialty hospitals are exceptions. These for-profit hospitals specialize in surgeries reimbursable by Medicare and private insurance, and as a rule do not take charity cases (Guterman, 2006; Blackstone & Fuhr, 2007).
So it can be seen that uninsured individuals who need non-emergency hospital care for medical or surgical treatment will have a difficult time receiving that care and unless they can be seen at a public hospital they may wait until the condition worsens and becomes an emergency. This will be the case even if the person appears in a private hospital ED for care – it may be that he or she will only be treated if the condition is an emergency.
The differences in hospital care for insured and uninsured individuals do not stop there. If an uninsured person is admitted to a hospital, the care received may be different from that of an insured person. A recent review found that among 29 studies meeting review eligibility criteria the uninsured were less likely to receive critical care services than those with insurance, and if admitted to an ICU had fewer procedures and were more likely to have life support withdrawn (Fowler et al., 2010).

Health systems in transition United States of America246
These access issues play out in disparities in hospital outcomes between the insured and uninsured. Several studies have found higher severity of illness with the uninsured on entering hospital (Shen & Washington, 2007) and higher mortality among uninsured patients while in hospital (Danis et al., 2006; Shen & Washington, 2007; Hasan, Orav & Hicks, 2010). Other studies have recorded that compared with insured patients, uninsured patients had a greater likelihood of perceiving that they had not fully recovered after hospitalization for injury and that they were in worse health after the onset of a chronic condition (Hadley, 2007).
There are also geographical differences in access to and the quality of hospital care. Rural hospitals are often small and provide only a narrow range of services (Fleming et al., 1995). They may also be situated a significant distance from the patients that need access to them. The issue of distance has been exacerbated in recent years due to the closing of some rural hospitals that were under financial distress following the transition to prospective payment systems (Fleming et al., 1995). In an older study the average travel distance and time to the nearest hospital after closure was 25.7 miles and 30.2 minutes, respectively (Fleming et al., 1995). However, this study showed that the remaining hospitals offered more services than the ones that closed and suggested that there was a trade-off between scope of services and rapid access for emergency conditions.
Other disparities in hospital care exist along racial and ethnic lines. These are addressed in section 5.15.
5.6.3 Initiatives to improve inpatient care
The expansion of health insurance, as being undertaken through the ACA, is expected to improve access to inpatient care in the United States. An improvement in access also reduces hospitals’ uncompensated care costs, cost shifting and other irrationalities of the system. Reductions in the variation in reimbursement between payers would improve access by reducing incentives for private hospitals to avoid certain types of patient and to focus on others. For example, Medicaid pays the least of all insurance, which produces an incentive for private hospitals to limit Medicaid admissions, whereas private insurance tends to pay the most, creating an incentive to encourage such admissions. Some have called for an “all-payer” system that standardizes payments by all payers (Reinhardt, 2011) – akin to those existing in such countries as France, Germany and Japan, and to the system of payment in place for hospital care in Maryland in the United States (Vestal, 2011). Also, adjustments in prospective payment distortions that reimburse higher amounts for certain DRGs with
Health systems in transition United States of America 247
similar resource use as lower paid DRGs would improve access by reducing incentives to focus on the treatment of patients within certain DRG groups, as do the surgical specialty hospitals.
Hospitals in the United States engage in quality improvement (QI) using a number of measures and initiatives from both public and private organizations. CMS has implemented P4P QI reporting requirements that hospitals must meet in order to receive the maximum reimbursement for Medicare payment. Hospitals must report measures of patient experiences, processes and outcomes of care, use of medical imaging and patient safety. CMS pays hospitals merely for reporting the measures (the payment being a return of an amount withheld) (Meddings & McMahon, 2008). The data collected from these reporting requirements are placed on a public web site where a person can look up the QI information on individual hospitals and compare hospitals with each other. CMS also has designated certain hospital-acquired conditions that are considered to be “never events”. CMS will not pay for the care for any one of these events (Meddings & McMahon, 2008).
The Hospital Quality Incentive Demonstration (HQID) is a joint public–private initiative by CMS and Premier Inc. A ranking system is used in which the top 10–20% of hospitals on a composite quality score receive a bonus (Meddings & McMahon, 2008; Premier, 2011). Studies are equivocal as to whether it has improved quality in participating hospitals (Meddings & McMahon, 2008; Ryan, 2009; Premier, 2011).
The Joint Commission has a set of “core measures” for quality. These are process measures for various conditions such as heart failure, asthma and myocardial infarction (JCAHO, 2011). The Joint Commission also has a set of
“Sentinel events” – incidents causing death or severe injury – which hospitals must report to the Joint Commission and which should never occur (similar to CMS “never events”).
In 2002, United States hospitals, consumer representatives, physician and nursing organizations, employers and government agencies started the Hospital Quality Alliance, a national public–private collaboration. The HQA makes hospital performance indicators accessible to the public and provides incentives to improve quality.
There is some controversy over whether QI efforts really result in improvement in hospital performance. Studies have shown that despite a number of indicators, many are inappropriate and gaps in measurement remain (Dimick,

Health systems in transition United States of America248
Welch & Birkmeyer, 2004; Copnell et al., 2009). Studies are also mixed as to whether public reporting of quality measures helps to improve hospital quality (Barr et al., 2006; Alexander et al., 2007).
5.7 Dental care
5.7.1 Services, utilization and settings
Dental services include preventive and corrective care of the teeth and gums. Preventive care involves fluoridation, teeth cleaning, X-rays of the teeth and inspection of the mouth, gums and teeth. Corrective care is wide-ranging and includes filling of cavities, placing of sealants, repairing of fractures of the teeth, straightening teeth, fitting dentures, and surgical treatment of gum disease (BLS, 2012).
Poor oral health can have a large impact on the quality of life (Caban-Martinez et al., 2007) and regular dental visits are necessary for prevention and the early diagnosis and treatment of dental problems (Dolan, Atchison & Huynh, 2005). In 2010, 65% of Americans over the age of 2 years received dental care at least once in the past year (Centers for Disease Control and Prevention, 2011a). This percentage has changed relatively little since 1997. However, when broken down by age group, an increase in utilization occurred in children under 18 years and in adults older than 64 years, but a decrease occurred in adults aged 18–64 years. The dental health of older adults, which in the past was poor, has improved over the past 50 years (Dolan, Atchison & Huynh, 2005).
The decrease in the percentage of annual dental visits in adults between 18 and 64 years of age corresponds to a United States Surgeon General report in 2000 that there are significant numbers of working Americans with unmet dental needs (Caban-Martinez et al., 2007). Between 19% and 58% of workers in the survey had received no dental care in the preceding year. Females in construction and food service and males in health and food service occupations had the highest rates of unmet dental health needs.
The financing of dental care may be related to these utilization patterns. Only 6% of dental care is funded through public agencies (Bailit & Beazoglou, 2008). Most of this funding is from the Medicaid programme for low-income families. Medicare only pays for a small fraction of dental care because it only covers dental care when it is linked to the treatment of a medical problem
Health systems in transition United States of America 249
(Bailit & Beazoglou, 2008). The remaining 94% of dental care financing is from private sources, 53% of which is from dental insurance and the rest from OOP payments. OOP financing includes both the co-payments and deductibles associated with dental insurance and the total payment for care from those without dental insurance.
Americans may receive dental care in private settings, for which they must have dental insurance or pay for out-of-pocket, or in community settings, where they pay a sliding scale fee for the service. Community-based clinics form the dental safety-net for those with limited incomes. They are sponsored by local public health departments, CHCs, IHS, not-for-profit service agencies, dental schools and school-based clinics (Byck, Cooksey & Russinof, 2005).Community-based services are usually provided in stationary buildings but the use of dental vans allows for mobility of services in some areas. Some of the community-based services are partnerships between local dental schools and community organizations (Formicola et al., 2008). Federally subsidized CHCs and local health departments provide the bulk of safety-net dental services (Byck, Cooksey & Russinof, 2005). In 2002, 530 federally funded CHCs (77% of the total CHCs) and 10–30% of local public health departments provided some dental care (Byck, Cooksey & Russinof, 2005). In addition to these provider settings, fluoridation is also provided through many city drinking water systems.
5.7.2 Accessibility, adequacy and quality of dental care
The unmet dental needs and disparities in care mentioned above indicate issues with access to dental care. A 2002 study found that “a sizable segment of the population does not have access to dental care through the traditional private practice model” (Mertz & O’Neil, 2002, p.71). In a 2010 national household survey 13.3% reported that they had neglected dental care in the last 12 months due to costs (Centers for Disease Control and Prevention, 2011a). The percentage was higher (18–20%) among working adults. Among those below the poverty line who were uninsured up to or over 12 months, it was 34% and 44% respectively.
Access to dental care varies by age, income, insurance status, race, ethnicity, socioeconomic status, geographical location and special needs (Guay, 2004). In particular, Medicaid beneficiaries, the uninsured, the “working poor” and underserved minorities are more likely to have access problems (Mertz & O’Neil, 2002; Guay, 2004; Shi, Lebrun & Tsai, 2010).

Health systems in transition United States of America250
Safety-net clinics provide much of the care for underinsured or uninsured individuals but these clinics “have limited resources and only modest capacity to provide dental services” (Byck, Cooksey & Russinof, 2005, p.1014). Waiting times are long (Byck, Cooksey & Russinof, 2005). The clinics provide less than 5% of total dental care (Byck, Cooksey & Russinof, 2005).
Public insurance, such as Medicaid and the CHIP, removes some of the financial barriers to dental care for a portion of the population. Medicaid coverage of dental services for adults varies by state, but under federal law, Medicaid must cover dental services for children (Centers for Medicare & Medicaid Services, 2011h). CHIP programmes receiving expansion funds from Medicaid must also cover these services. However, private dentists may refuse to provide care to these beneficiaries due to low payments and other reasons (Decker, 2011; Wang, Norton & Rozier, 2007), and safety-net clinics are over capacity. Despite these difficulties, a child with one of these forms of public insurance is more likely to see a dentist than one who is uninsured (Wang, Norton & Rozier, 2007; Decker, 2011).
Access to dental care through the safety-net clinics does not guarantee that all needed services will be provided. Often, the clinics cannot provide specialized services and referrals to specialists outside the clinic are difficult to make (Byck, Cooksey & Russinof, 2005). Again, this appears to be due to private dentists’ unwillingness to treat lower income patients.
A 2005 study of safety-net dental services in Illinois provides an example of these observations (Byck, Cooksey & Russinof, 2005). The safety-net clinics in Illinois provided less than 2% of dental care. The clinics treated mainly low-income patients who were either uninsured or covered by public insurance programmes such as Medicaid or CHIP. The clinics also treated people with special needs, such as those with HIV / AIDS, the homeless, migrant farm workers and people with disabilities. Only 1% of these clinics’ revenue came from dental insurance. Rural Illinois counties had lower dentist-to-population ratios (32 dentists per 100 000) whereas urban Cook county, which contains Chicago, had a higher ratio (65 dentists per 100 000 population). Eighty per cent of Illinois counties were fully or partially designated as dental health professional shortage areas.
5.7.3 Initiatives to improve dental care
To improve dental health, the Surgeon General recommends a change in perceptions regarding oral health so that oral health becomes an accepted component of general health (U.S. Department of Health and Human Services,
Health systems in transition United States of America 251
2000b, 2004). Community health educational programmes are one way to accomplish this goal. The Surgeon General also calls for an effective health infrastructure that meets the oral health needs of all Americans and integrates oral health effectively into overall health. Expansion of health insurance to a greater percentage of the population and the expansion of CHCs through the ACA is a step forward in this area.
Productivity of dental services is being improved through the increased use of dental hygienists and dental assistants, as discussed in section 4.2.2 (Mertz & O’Neil, 2002; Byck, Cooksey & Russinof, 2005). Pilot studies have shown that expanded practice models are a safe and effective way to reach underserved populations (Mertz & O’Neil, 2002). Initiatives to redistribute the dental workforce (between urban and rural locations) may also be needed in order to improve capacity in shortage areas (Mertz & O’Neil, 2002).
In order to encourage better acceptance of Medicaid patients among dental professionals, collaborative partnerships between dental professionals, local government agencies, hospitals and CHCs have been encouraged (Caban-Martinez et al., 2007). States are being encouraged to adopt improved Medicaid models with better incentives for acceptance of Medicaid patients (Caban-Martinez et al., 2007).
Since the key to improving dental care for underserved populations is to make dental services visible, affordable and convenient, the integration of dental care into primary care is being explored in some communities (Mertz & O’Neil, 2002). Primary care providers have more routine contact with underserved populations, and they can conduct preliminary dental screening and education and make referrals to dental providers.
5.8 Mental health care
5.8.1 Services and settings
As discussed in Chapter 4, the mental health-care landscape has changed significantly over the past few decades. Long-term institutionalization, which until the 1970s was a major treatment strategy for many mental health problems, is no longer the preferred way to treat such problems. Instead, treatment occurs through outpatient care and short-term inpatient stays. Table 5.2 shows that admissions have moved away from state and county mental hospitals to private psychiatric and general hospitals and that more admissions are on an outpatient
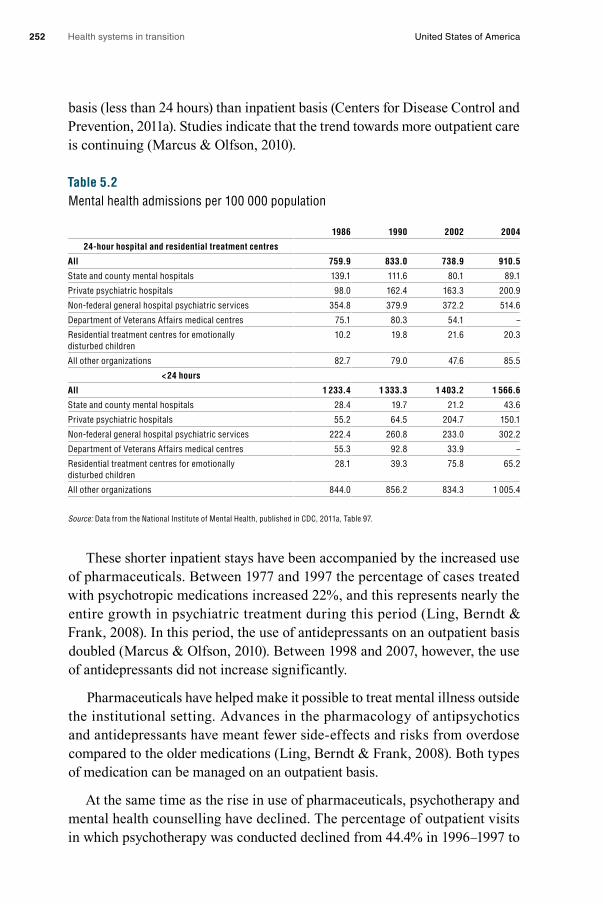
Health systems in transition United States of America252
basis (less than 24 hours) than inpatient basis (Centers for Disease Control and Prevention, 2011a). Studies indicate that the trend towards more outpatient care is continuing (Marcus & Olfson, 2010).
Table 5.2 Mental health admissions per 100 000 population
1986 1990 2002 2004
24-hour hospital and residential treatment centres
All 759.9 833.0 738.9 910.5
State and county mental hospitals 139.1 111.6 80.1 89.1
Private psychiatric hospitals 98.0 162.4 163.3 200.9
Non-federal general hospital psychiatric services 354.8 379.9 372.2 514.6
Department of Veterans Affairs medical centres 75.1 80.3 54.1 –
Residential treatment centres for emotionally disturbed children
10.2 19.8 21.6 20.3
All other organizations 82.7 79.0 47.6 85.5
< 24 hours
All 1 233.4 1 333.3 1 403.2 1 566.6
State and county mental hospitals 28.4 19.7 21.2 43.6
Private psychiatric hospitals 55.2 64.5 204.7 150.1
Non-federal general hospital psychiatric services 222.4 260.8 233.0 302.2
Department of Veterans Affairs medical centres 55.3 92.8 33.9 –
Residential treatment centres for emotionally disturbed children
28.1 39.3 75.8 65.2
All other organizations 844.0 856.2 834.3 1 005.4
Source: Data from the National Institute of Mental Health, published in CDC, 2011a, Table 97.
These shorter inpatient stays have been accompanied by the increased use of pharmaceuticals. Between 1977 and 1997 the percentage of cases treated with psychotropic medications increased 22%, and this represents nearly the entire growth in psychiatric treatment during this period (Ling, Berndt & Frank, 2008). In this period, the use of antidepressants on an outpatient basis doubled (Marcus & Olfson, 2010). Between 1998 and 2007, however, the use of antidepressants did not increase significantly.
Pharmaceuticals have helped make it possible to treat mental illness outside the institutional setting. Advances in the pharmacology of antipsychotics and antidepressants have meant fewer side-effects and risks from overdose compared to the older medications (Ling, Berndt & Frank, 2008). Both types of medication can be managed on an outpatient basis.
At the same time as the rise in use of pharmaceuticals, psychotherapy and mental health counselling have declined. The percentage of outpatient visits in which psychotherapy was conducted declined from 44.4% in 1996–1997 to

Health systems in transition United States of America 253
28.9% in 2004–2005, a drop of 35% (Olfson & Marcus, 2010). Many outpatient visits (57% in 2007) only involve the dispensing of medications (Olfson & Marcus, 2010). Still, therapy remains a significant treatment modality for mental illness. Therapists may be psychologists, social workers, nurses or others with training in mental health counselling (Shi & Singh, 2012).
Mental health care is provided in many settings, as indicated by Table 5.2. Public settings include county, state and federal hospitals (e.g. VA and military) (Centers for Disease Control and Prevention, 2011a; Shi & Singh, 2012). Private settings include doctors’ offices, specialty psychiatric clinics and hospitals, and psychiatric units of general hospitals. Some of the settings included in the
“other” category in the table include CHCs and nursing homes (Shi & Singh, 2012).
Insured patients generally receive mental health care in the ambulatory settings of offices of private psychiatrists, psychologists and licensed social workers, and inpatient settings of private psychiatric and general hospitals (Shi & Singh, 2012). Patients without insurance who cannot pay OOP expenses are treated in state and county mental health hospitals, CHCs, EDs and hospitals (if the individual is in a severe crisis) (Shi & Singh, 2012). In 2003, 73% of CHCs offered mental health services (Druss et al., 2008). Seventy per cent of CHCs offered on-site mental health treatment, 20% had 24-hour crisis services and 50% had substance abuse services.
5.8.2 Accessibility, adequacy and quality of mental health care
It is estimated that only about one-third of Americans with mental health problems actually receive treatment for their problem (Cunningham, 2009). In a 2004–2005 survey of primary care physicians 67% said that they were unable to obtain high-quality outpatient mental health services for their patients, while 34% said that they were unable to get specialist referrals (Cunningham, 2009). A significant number also reported the inability to get non-emergency hospital admissions or imaging. Access issues are quite notable among children and the aged. It is estimated that only one-quarter to one-third of children and only half of older adults needing mental health services receive them (Solway et al., 2010).
Insurance issues are a major source of these access problems. In the 2004 –2005 survey of primary care physicians, predominant reasons for their inability to obtain services for their patients were patients’ lack of adequate health insurance coverage and health plan barriers (Cunningham, 2009). These insurance issues created difficulties in obtaining outpatient services, specialty referrals, and non-emergency hospital admissions.

Health systems in transition United States of America254
Shortages of mental health providers are also reducing access to care. In the 2004 – 2005 survey, a provider shortage was cited as a barrier to obtaining outpatient services (Cunningham, 2009). Further analysis showed that perceptions of provider shortages were correlated with geographical areas with fewer than eight psychiatrists per 100 000 persons.
As can be seen, the low level of mental health-care utilization is due to access issues that are common to other aspects of health care, such as financial, provider and geographical barriers. But it is also due to an access issue that is not common to other types of health care: the stigma that is attached to mental illness. This stigma regarding mental illness goes back centuries. While progress has been made to eliminate it, vestiges remain.
The mental illness stigma has three behavioural levels: (1) a stereotyping of mental illness; (2) prejudicial behaviour, where the stereotypes are internalized; and (3) discrimination, manifested through such behaviours as avoidance of contact with and denial of employment to a person perceived to be mentally ill (Corrigan, 2004). Social and institutional structures also exhibit a stigma towards mental illness. For example, one-third of states restrict the rights of individuals with mental illness. Another example is that health insurance coverage for mental health care may not be as full as the coverage for physical illness. Due to these negative interpersonal and social consequences, people try to avoid being labelled as mentally ill and are reluctant to seek care for mental problems (Corrigan, 2004; Solway et al., 2010).
Turning to quality issues in mental health care, the measurement of mental health quality is underdeveloped and marginalized from the rest of health care. In a 2004 report on the state of quality measurement in health care by the AHRQ, only four out of 179 quality indicators were related to mental health care (Patel, Butler & Wells, 2006). The quality measures that do exist in mental health care are not standardized nor systematically collected.
Problems go beyond measurement to actual practice. The IOM reported in 2006 that a discrepancy exists between mental health care that is known to be effective and what is actually being delivered. A review of studies published in 2002 found lack of adherence to clinical practice guidelines for many different mental illnesses (Bauer, 2002). Studies continue to find deviations from evidence-based practice guidelines for many mental illnesses (IOM, 2006).
Failure to obtain mental health care and substandard care can lead to injury and death. In one study, 58% of errors in a state psychiatric hospital led to patient harm (Grasso et al., 2003). It is estimated that the use of seclusion
Health systems in transition United States of America 255
and restraints in inpatient mental health facilities causes 150 deaths in the United States each year (SAMHSA, 2004). Untreated mental illness can lead to incidents as severe as suicide (IOM, 2006).
5.8.3 Initiatives to improve mental health care
For mental health care to be accessible to more of the population, efforts are under way to reduce the financial, provider and geographical barriers to care and the stigma against mental illness. In its 2006 report, the IOM (2006) called on the government to promote mental health benefit standardization and mental health parity in health insurance plans. The ACA, enacted since the IOM report, will promote mental health parity by expanding insurance coverage for mental health and the numbers who will be covered. Insurance regulation will prohibit discrimination against those with pre-existing conditions, including mental health conditions. It will also be against the law to increase rates or cancel insurance for those who develop mental health conditions. The eventual elimination of the Medicare Part D doughnut hole will also help Medicare patients with chronic mental health conditions meet their need for ongoing medication.
The IOM made several recommendations for improving the quality of mental health care in 2006. One recommendation was to synthesize and disseminate evidence collected by various agencies (such as SAMHSA, NIMH and others) on effective treatments and services. This matches calls from others to build an infrastructure for evidence-based interventions (Patel, Butler & Wells, 2006). Another recommendation from the IOM was to form a public–private partnership between the HHS and an entity similar to the NQF to engage in consensus building on a standard set of mental health quality measures. The IOM also recommended using a patient-centred approach and the use of EHRs in mental health (2006). Other recommendations call for quality improvement to be applicable to a diverse set of mental health disorders, patients and settings and to promote financial incentives for quality improvement (Patel, Butler & Wells, 2006). Health-care stakeholders and the community need to be engaged in quality improvement efforts.
Some examples of mental health quality improvement programmes that have had success are the Partners in Care, Youth Partners in Care, Improving Mood: Promoting Access to Collaborative Care (IMPACT), Collaborative Care for Anxiety and Panic, and Assertive Community Treatment (Patel, Butler & Wells, 2006). The Partners in Care programme, for example, promoted collaborative, community-based care for people with depression in impoverished

Health systems in transition United States of America256
neighbourhoods (Chung et al., 2010). Multiple agencies were involved and patients participated in their care. The impact of the programme was studied and results indicate that at one year the quality of care and the health outcomes and employment of individuals improved and the number of medical visits did not increase (Patel, Butler & Wells, 2006). At five years, probable depression was reduced and the programme with cognitive behavioural therapy reduced outcome disparities for African American and Latinos. Most programmes have focused on depression so it is hoped that such collaborative community-based programmes can be expanded into other types of mental illness.
5.9 Pharmaceutical care
5.9.1 Definition, services and utilization
Pharmaceuticals are highly utilized in the United States compared to other industrialized countries (Squires, 2011) and their use has been growing. Between 1988 and 1994, 39% of the population was on at least one prescription drug and 12% of the population was on three or more (Centers for Disease Control and Prevention, 2011a). By 2005–2008, those figures had climbed to 47% and 21% respectively. Expenditures on pharmaceuticals in 2009 reached $956 per capita, which was 12% of expenditures on health (OECD, 2011).
Pharmaceutical production and marketing in the United States are completely privatized but regulated by the FDA of the federal government. Prices are not regulated, not even for drugs obtained for publicly insured individuals, although the government negotiates payment discounts in some of its programmes, such as Medicaid (but not Medicare, where a provision in the Part D legislation prohibits Medicare from negotiating bulk discounts on drugs).The regulation of pharmaceuticals is discussed in section 2.8.3.
Strictly speaking, “pharmaceutical care” includes both the drugs that patients receive and the advice and information from pharmacists regarding those medications (Shi & Singh, 2012). Pharmacists advise both physicians and patients regarding drug effects, side-effects and interactions. They assist the physician in deciding the optimum medication to prescribe and with titration of dosage.
Health systems in transition United States of America 257
In the ambulatory care setting, pharmaceutical care is provided in pharmacies located in clinics and commercial stores, where physician prescriptions are filled for the public. Institutional settings, such as hospitals and nursing homes, have pharmacy departments that dispense medications and information.
5.9.2 Accessibility, adequacy and quality of pharmaceutical care
Pharmaceuticals are both overused and underused in the United States. Overuse and inappropriate use has been noted to occur with certain medications such as antibiotics and antidepressants, especially with certain age groups such as children and the elderly (Conti, Busch & Cutler, 2011; Misurski, Lipson & Changolkar, 2011; Polinski et al., 2011a). Among the elderly, inappropriate prescribing and polypharmacy are major concerns. Inappropriate medications are those for which the potential risk outweighs the potential benefit and for which a good alternative is available (Van der Hooft et al., 2005). Polypharmacy is the concurrent use of nine medications or more. It can cause serious adverse events in the elderly since their bodies have more difficulty absorbing, metabolizing and eliminating drugs (Dwyer et al., 2010). It is estimated that 5% of all hospital admissions in older people are due to adverse drug reactions (Jesson, 2011). In 2004, polypharmacy among nursing home residents was 40% (Dwyer et al., 2010).
Underuse is associated mainly with financial barriers. In 2010, 8.3% of the United States population did not fill out a form for a prescription drug in the previous 12 months because they could not afford it (Centers for Disease Control and Prevention, 2011a). For uninsured individuals below the poverty level, 32% did not fill out a prescription form due to cost.
Pharmaceuticals are high expense health-care items. For those who do not have insurance coverage, and who must pay out-of-pocket, the cost of certain prescription medications can comprise a significant proportion of their monthly income. Many cannot afford the medications and will either not fill prescriptions or will try to stretch the medications out over longer periods of time by cutting pills in half and other dangerous measures. Others may receive samples from their physicians or through drug company promotions (Sorensen, Song & Westberg, 2004). Less expensive medications may be prescribed even if the patient needs the more expensive ones. So even if uninsured individuals have access to medications, they may not receive those that are optimal and coverage may not be consistent (Sorensen, Song & Westberg, 2004).

Health systems in transition United States of America258
For those who have insurance with drug benefits, coverage of pharmaceuticals is uneven. Co-payments, deductibles, caps and other cost-sharing methods are used by both public and private (mostly employer-based) insurance. Medicare only recently (in 2006) added a drug benefit option. As discussed in Chapter 3, there are significant gaps in coverage in the new Medicare drug plans.
Medicaid drug plans differ from state to state. Although outpatient prescription drugs are an optional benefit, all states currently provide coverage (Gencarelli, 2003). States are allowed considerable flexibility in the drugs they cover (Gencarelli, 2003). They are permitted to have formularies and to exclude several classes of drugs, such as those for weight loss, fertility, barbiturates and tranquillizers. They may also limit the quantity of drugs per prescription, the number of prescription refills or the number of prescriptions that can be filled per month. States may require nominal co-payments (up to $5.00) from Medicaid beneficiaries, except for some exempt groups of beneficiaries such as children and pregnant women, and for some services such as emergency and family planning. Pharmacies, however, may not refuse to dispense medications if the beneficiary cannot pay the co-payment.
Employer-based insurance plans often have prescription drug benefits but formularies may be limited and there is cost-sharing, sometimes significant. These plans may have deductibles that must be met before the benefits kick in, co-payments for each prescription, or a cap on the amount covered in a year. Employer-based plans may also cover generic drugs at a higher rate than non-generics (BLS, 2011c).
In 2010, 69% of all private industry workers had outpatient prescription drug coverage available through their place of employment and 50% actually received outpatient prescription drug benefits (BLS, 2011c). Prescription drug coverage varied by worker and employment characteristics. Higher wage workers had greater access and participation in outpatient prescription drug coverage than lower wage workers (BLS, 2011c). Workers in places of work with 500 or more workers had a 67% participation rate, compared to 38% for places of work with 1– 49 workers. Most workers were in plans that required co-payments for drugs (BLS, 2011c).
Several studies have shown that the cost-sharing strategies of all types of insurance can lead to underutilization of necessary and effective medications (Shi, Lebrun & Tsai, 2010). For example, a 2006 study showed that a $1000 cap on drug benefits resulted in lower drug use and poorer control of blood pressure, lipid levels, and glucose levels in Medicare beneficiaries (Hsu et al., 2006). In another study Medicare beneficiaries who reached the doughnut hole

Health systems in transition United States of America 259
were twice as likely to discontinue their medication compared to those who had not (Polinski et al., 2011b). A 2011 study found that individuals with no co-payments had better medication adherence and fewer vascular events than those with co-payments (Choudry et al., 2011). This evidence is particularly noteworthy since patient cost-sharing is increasing (Dor & Encinosa, 2010).
Disparities in access to pharmaceuticals exist along race, ethnicity, socioeconomic and other demographic lines. Compared to Whites, Hispanics are less likely to receive prescriptions (Shi, Lebrun & Tsai, 2010). Those who are Hispanic, Black, over the age of 74, unmarried, in poor health, have a low- to middle-income or have less than a high school degree are more likely to be covered for medications through a public programme or to have no insurance for medications (Kanavos & Gemmill-Toyama, 2010).
5.9.3 Initiatives to improve pharmaceutical care
Polypharmacy and inappropriate prescription of medications among the elderly are being addressed by physicians through the use of screening criteria such as the Beers criteria and the systematic discontinuation of a proportion of medications. The Beers criteria tool, first developed in 1997 and updated in 2002, classifies drugs according to those that should be avoided in older adults, those that exceed a maximum recommended daily dose and those that should be avoided in combination with certain patient comorbidities (Van der Hooft et al., 2005). The tool, with adjustments, is being used in elderly and non-elderly populations that use a large number of medications. Systematic reduction of medications has been shown to improve the health of patients with polypharmacy (Garfinkel & Mangin, 2010).
Underuse of medications due to affordability concerns is being improved through coverage expansion of general insurance under the ACA. For Medicare patients, in 2011 the gradual reduction of coinsurance (doughnut hole) began; coinsurance will be phased down gradually through 2020.
5.10 Post-acute care: rehabilitation, intermittent home care and subacute care
This section covers three categories of post-acute care services – rehabilitation, “intermittent” home care and subacute care – that are situated in intensity and length of services between acute care and long-term care. Patients receiving these services do not require the intensive monitoring and treatments of acute

Health systems in transition United States of America260
care but they still require monitoring, therapies, education or other professional care. A patient may receive the services for a longer period of time than is typical in acute care but there is an end point to the services and the patient does not continue to receive the services for the remainder of life as in long-term care. The goal of these services is an improvement in condition so that the patient can return to prior levels of self-care and can return to the community, or the prevention of a worsening of the condition. Finally, the services may be provided in both institutions and the home.
5.10.1 Rehabilitation
Rehabilitative care aims to cure, improve, or prevent a worsening of a condition. Examples are physical, occupational, speech and other therapies following a stroke, or physical therapy following orthopaedic replacement surgeries such as hip or knee. These services are often a part of the other two types of service addressed in this section – intermittent home care and subacute care.
Rehabilitation settings include outpatient centres, inpatient rehabilitation departments, freestanding rehabilitation hospitals, departments in subacute care facilities and nursing homes, and through home care (CMS, 2006, 2011b; Shi & Singh, 2012). The proportion of rehabilitation services that occurs in each of these settings is unknown. Services include physical, occupational, speech–language and respiratory therapy. Medicare certified outpatient centres must also have social and psychological services (Centers for Medicare & Medicaid Services, 2011i).
In a 2008 study, around 53% of respondents reported being unable to receive needed rehabilitation services (Elrod & DeJong, 2008). Access to rehabilitation services depends on financial, personal and systemic factors (Ottenbacher & Graham, 2007). Lack of insurance is one of the biggest barriers to rehabilitation care (Elrod & DeJong, 2008; Nirula, Nirula & Gentilello, 2009). But even those with insurance may have difficulties. In the 2008 study, insurance provided “widely disparate coverage” for rehabilitation (Elrod & DeJong, 2008, p.114). Those who had Medicaid were more likely than those with Medicare or private insurance to receive rehabilitation services.
Patients lack of awareness of services and negative attitudes toward rehabilitation are personal barriers to access (Ottenbacher & Graham, 2007). Underdeveloped referral systems, insufficient rehabilitation professionals and lack of provider support for rehabilitation are systemic barriers to care.
Health systems in transition United States of America 261
Both general and specific measures are available to assess the quality of rehabilitation care. A general instrument is the Inpatient Rehabilitation Facility-Patient Assessment Instrument (IRF-PAI) (Bryant et al., 2004). Since 2002 CMS has required the collection of data for the IRF-PAI in facilities in which 75% or more of the patients receive intensive rehabilitation. Measures that pertain to rehabilitation in the Minimum Data Set (MDS) for Nursing Home Resident Assessment and Care Screening have also been used to assess the quality of rehabilitation (Silverstein, Findley & Bode, 2006). However, these measures were tested in one study and found to be inadequate (Silverstein, Findley & Bode, 2006). Based on search results for quality and performance measures in rehabilitation, it appears that cardiac rehabilitation is a specific area in which quality measurement is active.
5.10.2 Intermittent home care
Intermittent home care refers to home care services that are provided for a short time and that require visits by a health-care professional such as an RN. The care typically follows a hospitalization and may be covered by public or private insurance (Kovner & Knickman, 2011). This type of home care grew in the 1980s and 1990s as hospital lengths of stays fell and Medicare reimbursement for home care was generous. Patients were being discharged home sicker than before and with health-care needs that continued for several days post discharge. Home care allowed many surgeries to be performed on an outpatient basis or with short inpatient stays because the care normally provided in the hospital could be performed in the home. Patients with medical problems could also be discharged sooner if they could be followed up at home.
While the number of home care admissions for Medicare patients has remained steady since the 1990s, the number of home visits per Medicare patient has fallen from 74 per client in 1996 to 35 in 2008 (NAHC, 2010). The reason for this decline was the Balanced Budget Act of 1997, which instituted prospective payment for Medicare recipients of home care, effectively reducing the number of reimbursable home care visits for Medicare patients (McCall et al., 2003). Consequently, the number of home health agencies has also declined since 1997. The number of Medicaid patients, however, has grown significantly since 1996 but this has not been enough to offset the decline in home health agencies.
Intermittent home care is provided to patients who need skilled nursing care or therapy but who are unable to drive to the hospital or clinic to receive the care (Shi & Singh, 2012). Home health-care agencies provide the care
Health systems in transition United States of America262
by hiring the professional and non-professional staff, obtaining necessary certifications (such as a Medicare certification to treat Medicare patients) and setting up relationships with hospitals and other health-care organizations (NAHC, 2010). Home care nurses, therapists, technicians and home health aides provide care in their areas of expertise, with the RN coordinating the care. A patient returning home following knee replacement surgery, for example, will receive post-operative nursing care and education from RNs regarding mobility restrictions and medications, among other nursing care. With a shorter number of allotted home care visits, the visiting nurse must instruct the patient and family in self-care. The patient will also receive physical therapy to restore function to the joint, a type of rehabilitative care mentioned earlier. As with the nursing care, the physical therapist must train the patient in the exercises and restrictions he or she will have for some time after discharge from home care. Some patients may also need home health aides to help them with baths and other personal care until they are able to care for themselves. As long as the patient is receiving nursing care or therapies they may be eligible for aide visits.
The term “intermittent” is used to differentiate from “private duty” home care. The term “private duty” pertains to care provided by home health aid organizations or units of home health-care organizations that may be custodial and may continue over a long period of time (NAHC, 2010). Due to these characteristics, private duty home care is discussed in the next section on long-term care.
Home health-care agencies may provide one or both of these types of services. They may also offer home hospice services, which will be discussed in section 5.12.1 on palliative care. Based on numbers of patients for all three types of home care, the National Association for Home Care estimates that
“approximately 12 million individuals currently receive care from more than 33,000 providers (for causes including acute illness, long-term health conditions, permanent disability, or terminal illness)” (NAHC, 2010, p.1). In 2009, annual expenditures for home health care were estimated at $72.2 billion.
Access to intermittent home care is largely through Medicare, and to a lesser degree through Medicaid and private insurance. For those who do not have either public or private insurance, intermittent home care must be paid for out of pocket. This can be a deterrent to the utilization of these services.
Two sets of quality measures are currently being used in home care (Bryant et al., 2004). The Outcome and Assessment Information Set (OASIS) is required by all Medicare certified home care agencies. OASIS provides measures for risk-adjusted outcomes of home health care in order to promote quality

Health systems in transition United States of America 263
improvement. OASIS data is used by Medicare to publicly report quality in home care agencies through Home Health Compare, an online reporting system similar to Hospital Compare discussed in the section on acute care. The Minimum Data Set for Home Care (MDS-HC) was derived from the nursing home MDS. Items that are different from the nursing home version include instrumental activities of daily living, social support, social functioning, health conditions, environment and service utilization.
5.10.3 Subacute care
The Joint Commission defines subacute care as “a goal-oriented treatment rendered immediately after or instead of acute hospitalization to treat one or more specific, active, complex medical conditions or to administer one or more technically complex treatments, in the context of a person’s underlying long-term conditions and overall situation” (Lewin-VHI, 1994). Subacute care is for patients who are stable enough to be cared for outside an intensive care unit in a hospital, who will need care for a longer period of time than a hospital length of stay recommends and who require more intense medical supervision and therapy than in a typical nursing home’s skilled nursing beds (Qaseem, Weech-Maldonado & Mkanta, 2007). Patients may have rehabilitative or complex medical needs and require monitoring and other nursing care. Prior to the 1980s, patients such as these remained in hospitals for weeks, up to months at a time, but after the advent of PPS and managed care, insurance payments to hospitals were not enough to continue this practice (Weech-Maldonado, Qaseem & Mkanta, 2009). This led to the advent of the subacute care industry.
Subacute care is usually provided in dedicated units in skilled nursing facilities, general hospitals and specialty hospitals. Beds have become available through both expansion and conversion of existing acute and long-term care beds (Fogel & Gossman-Klim, 1995). In hospitals, for example, a percentage of acute-care beds were converted to subacute care beds as hospitals transitioned to shorter acute-care lengths of stay. Facilities that combine acute and subacute care or subacute and long-term care have the advantage of offering more of a care continuum (Fogel & Gossman-Klim, 1995).
The duration of subacute care varies from short term (3–30 days), to intermediate (31–90 days), to long term (91 days – 2 years) but there is a definite end point (Lewin-VHI, 1994). Patients who become well enough will go home. A small number of patients die. Patients who require care beyond the long-term period may be transferred to a specialized unit in a nursing home or other long-term institutional setting.
Health systems in transition United States of America264
The American Subacute Care Association states that a wide range of subacute services are available (Lewin-VHI, 1994). These include brain injury care, high intensity stroke, cardiac and orthopaedic care, ventilator care, complex wound care and infusion therapy. These services are provided through physician supervision, nursing care, therapies, laboratory services, pharmacy services and case management. Rehabilitation services play an important role in many cases.
Subacute care is expensive. Medicare will cover up to 100 days of subacute care if the beneficiary was admitted to subacute care following three inpatient days in a hospital. Medicaid coverage for those who are eligible varies from state to state. Private insurance, likewise, may cover care up to length of stay limits. However, without these forms of coverage, individuals must pay out of pocket. Such expenditures may be out of their reach or may result in large debts, even bankruptcies.
As with rehabilitation, both general quality measures as well as those that are specific to the subacute care setting exist (Bryant et al., 2004). Two general data sets are the Medical Outcomes Study Short Form-36 (SF-36) and the Medicare Current Beneficiary Survey (MCBS). The SF-36 contains items and scales regarding physical functioning and limitations, pain, social functioning, mental and emotional health, vitality and health perceptions. The MCBS is a rotating four-year national sample of Medicare beneficiaries that is combined with administrative data and that assesses health status and function. Many of these items map to the Resident Assessment and Care Screening data set (RAI) used in nursing homes. Some setting-specific quality measures for subacute care can be found in the MDS and the IRF-PAI, discussed in section 5.10.1 (Bryant et al., 2004).
5.11 Long-term care
Long-term care is a category of health care containing a number of different health-care services for individuals with conditions that are part of normal ageing, or that are not expected to significantly improve, and that need ongoing care. The long-term care population includes older people, people with physical and mental disabilities and people with chronic diseases. Several of the long-term care services – on a continuum from community-based to institutional care – include private duty home care, adult day care, independent living, assisted living, specialized intermediate care and nursing home care. Other formal services for long-term care that are not addressed in this section
Health systems in transition United States of America 265
are adult foster care, senior centres, home delivered and congregate meals, homemaker services, continuing care retirement communities (CCRCs), Alzheimer’s facilities, and residential and personal care facilities (Shi & Singh, 2012). Informal care-giving, which is a significant proportion of long-term care, will be discussed in section 5.14.
5.11.1 Private duty home care
Private duty home care is an option for individuals who need ongoing nursing or custodial care and whose families have the resources to keep the patient at home. With this type of long-term care, a nurse and / or home health aide goes to the patient’s home for a prescribed period of time and frequency, anywhere from a few hours on a few days a week, to a several hours daily, to round the clock (NAHC, 2010). Private duty home care has the advantage of allowing the patient to remain at home rather than being institutionalized. One disadvantage is that it can be difficult for family members to arrange their home and schedules to accommodate the person needing care. Another disadvantage is that it can be costly. Private duty services are not covered by Medicare or private health insurance, and may or may not be covered by Medicaid (coverage is on a state-by-state basis) (NAHC, 2010) and long-term care insurance. If a patient does not have insurance coverage, the family will have to pay out of pocket. For services of a few hours a week, the costs are significantly less than those of a nursing home and this makes private duty home care an attractive alternative to nursing home care. But as the amount of time increases, the costs become significant. At some point, nursing home care is less expensive than home care.
Private duty services may be part of the services of a home health-care agency that also provides intermittent care, or they may be provided by dedicated home care aide agencies that only provide private duty home aide care (NAHC, 2010). Since private duty home aide services are not covered by Medicare, the agencies that provide private duty care exclusively are not certified by Medicare.
5.11.2 Adult day care
Adult day care is an option for individuals who need supervision during the day, support with meals, activities to participate in and opportunities for socialization. Adult day care services vary between two foci: medical and social (Sanders, 2004). Centres that focus on medical care have a strong professional health-care staff, including RNs, LPNs and nursing assistants, as well as physical, occupational and speech therapists, social workers and dietitians. Centres that
Health systems in transition United States of America266
focus on social functioning employ fewer nursing staff but retain therapists, nutritionists and social workers to organize social activities, recreational activities and nutrition counselling. Some centres provide both medical and social services. All centres offer meals, a certain amount of personal care and activities. Optional services include transportation to and from the centre, nursing care, counselling, social services and therapies.
The type of individual that a day care centre will accept depends upon these foci and staff. Those centres that focus on medical care are more likely to accept individuals needing nursing and custodial care whereas the centres focusing on social activities do not have the capabilities to take these patients. In general, adult day care would not work for individuals that need heavy amounts of custodial or skilled nursing care, such as frequent monitoring of vital signs and invasive treatments. For this reason, centres tend to establish limits in terms of the number and types of deficits in activities of daily living a person can have, and the intensity of medical care the person needs. Adult day care has been a good option for individuals with cognitive impairment. Over half the adult day care clients have cognitive impairment (Sanders, 2004).
Adult day care is often used by families to keep a family member in the home whom otherwise would need institutionalization. The family member can go to the day care centre while family members are working. This kind of arrangement, however, means a commitment by the family to ongoing care in the hours that the individual is not in day care (evenings, nights and weekends) – a significant amount of informal care-giving. Families may supplement adult day care with private duty home care services (discussed in section 5.11.1) (O’Brien, 1994).
Adult day care is not covered by Medicare but may be covered by Medicaid (on a state-by-state basis) (Sanders, 2004). It is usually part of long-term care insurance (Shi & Singh, 2012). Otherwise, individuals and families must pay out of pocket. A sliding scale may be available to low-income individuals paying out of pocket.
5.11.3 Independent living
Independent or retirement living centres do not deliver clinical services but do offer facilities that are geared towards supporting the needs of frail and / or disabled adults while allowing them to maintain their own independent lifestyles. Examples of such support include railings in hallways, large bathrooms that allow for wheelchairs, grab bars in the bathrooms and pull cords to call for help in the event of an emergency (Shi & Singh, 2012). Facilities may also

Health systems in transition United States of America 267
provide transportation for shopping and outings and may organize recreational activities and social events (Shi & Singh, 2012). Some facilities provide one or two meals a day in a communal area. If a resident needs more intensive services for a period of time, the individual must usually arrange these services with a home health-care agency in the area. Living arrangements vary from multi-unit apartments to apartment complexes.
The advantage of independent living arrangements compared to an individual maintaining their own house or apartment is in the specialized support mentioned earlier, and in the amenities such as transportation and recreational activities. A person living in a retirement centre may also have more of a social life than someone who stays at home. Another advantage is that someone in an independent living centre may have the ability to transfer to more intensive services as he or she becomes more frail or disabled. This depends on the services in a specific facility and arrangements that are made between the resident and facility. CCRCs are a type of full service facility that allows residents to transfer from independent living to assisted living and to skilled nursing care as needed (Shi & Singh, 2012). CCRCs require transactions upfront, entrance fees and private financing.
5.11.4 Assisted living
Assisted Living Facilities (ALFs) provide 24-hour supervision, assistance with activities of daily living (ADLs), social services, recreational activities, and some nursing and rehabilitation services (Shi & Singh, 2012). The ADL assistance provided by ALFs is with eating, bathing, dressing, toileting and walking (ALFA, 2009). This is more than that provided in independent living facilities. Three communal meals are available every day. Housekeeping, laundry and transportation are provided. ALFs are for individuals who can walk but who need help with some personal care. The typical ALF resident is a senior citizen who needs some assistance with two to three ADLs (e.g. bathing, dressing, cooking).
One advantage of assisted living over living alone or with family is the supervision that occurs. Someone who, for example, may have a tendency to fall will be checked on periodically. Another advantage is that the individual will receive personal services that otherwise would have to be provided by family members or home health aides. ALFs are also good for providing a stronger social milieu than might occur if the individual lived alone. Socializing

Health systems in transition United States of America268
can occur during meal times or in recreational activities. Finally, the ALF environment is more home-like and less clinical than that of a skilled nursing facility (Shi & Singh, 2012).
Medicare and private health insurance do not cover assisted living. Medicaid programmes in 41 states offer waivers that allow low-income residents to live in ALFs rather than nursing homes but funds are limited (ALFA, 2009; Shi & Singh, 2012). A few individuals have long-term care insurance that covers the costs but the majority of assisted living residents (86%) pay out of pocket for the care (ALFA, 2009).
All 50 states regulate assisted living. Regulations establish the services the facilities are mandated to provide. These will vary from state to state except that all states require 24-hour care and supervision for those who need assistance (ALFA, 2009).
5.11.5 Specialized intermediate care facilities for the mentally retarded or developmentally disabled
Intermediate Care Facilities for the Mentally Retarded or Developmentally Disabled (ICF/ MR/ DD) provide room and board, 24-hour nursing care, therapies and social services for mentally retarded and developmentally disabled persons who qualify for Medicaid. Each patient has a treatment programme to help him or her acquire behaviours to achieve as much independence as possible and to prevent or reduce the loss of function. Most of the individuals who receive care provided by these specialized facilities have other disabilities as well as mental retardation. Many are unable to walk. Many have seizures, behaviour problems, mental illness, visual or hearing impairments or a combination of disabilities.
In 2009 there were 7400 ICF/ MRs, serving approximately 129 000 people. All 50 states have at least one facility. Access is limited to Medicaid beneficiaries only. While there will continue to be a need for institutional care for some of the more severely mentally retarded, trends in the treatment of developmental disability and mental retardation are turning towards a greater attempt to keep these individuals in the community living in their own homes.
5.11.6 Nursing home care
In 2009 around 1.4 million Americans were residents of nursing homes, slightly less than the number in 1995 (Centers for Disease Control and Prevention, 2011a). The change is indicative of a decline since 1990 in the proportion of elderly who are in nursing homes. At that time, 10.2% of Americans aged 75

Health systems in transition United States of America 269
and older were residing in nursing homes (Nasser, 2007). In 2000 it was 8.1%, and in 2006 7.4%. These changes are most likely due to the use of the alternative long-term care settings already described. Despite this downward trend, nursing home care is still a significant part of the long-term care services in the United States.
Skilled nursing facilities are regulated by both state and federal government (Shi & Singh, 2012). They must be licensed by the state and may additionally receive certification from CMS. To receive a licence from the state the nursing home must comply with licensing requirements in that state. Most states establish minimum qualifications for administrators, building standards and safety codes. All states set minimum staffing levels although these will differ from state to state. Nursing homes that receive Medicare and/or Medicaid patients must meet the federal certification standards of CMS for caring for those patients.
Nursing homes may be classified as skilled nursing facilities, nursing facilities, dually certified facilities or non-certified (Shi & Singh, 2012). Skilled nursing facilities are certified to admit Medicare patients. By being licensed in the state these facilities may also admit private patients. Nursing facilities are certified to admit Medicaid patients and may also admit private patients. Dually certified facilities are certified as both a skilled facility and nursing facility and may take private patients. Non-certified facilities are not certified for either Medicare or Medicaid patients and take only private patients. Close to 88% of all nursing homes were dually certified in 2004 (Centers for Disease Control and Prevention, 2009b).
The nursing home classifications have both a regulatory / payment and a clinical meaning (Shi & Singh, 2012). Medicare patients are covered for a limited number of days of care in a nursing home and must be undergoing rehabilitation to be covered. They are usually admitted post-hospitalization, and may be more acutely ill than the Medicaid or private populations. Medicaid and private patients do not have length of stay restrictions and are not necessarily as acutely ill. Since facilities admitting Medicare patients will be admitting proportionately more acutely ill short-term residents needing rehabilitation, they will tend to provide more “skilled” care than facilities that only admit Medicaid and / or private patients.

Health systems in transition United States of America270
Most nursing homes belong to chains, the largest 10 of which operate 14% of the nursing home beds in the United States (Shi & Singh, 2012). Nursing homes are also mostly for-profit: in 2004 61% were proprietary, 31% were non-profit and 8% were government-run (Centers for Disease Control and Prevention, 2009b).
In nursing homes an individual receives all the services that are provided in ALFs plus skilled nursing care. Resident plan of treatment is authorized by a physician and nursing care is supervised by an RN administrator and provided by RNs, LPNs and certified nursing assistants (CNAs). Most of the care is for ADLs and this is provided by CNAs. Many residents take a number of medications, usually administered by an LPN. Residents may receive special diets supervised by a nutritionist, therapies from physical, occupational and respiratory therapists and speech–language pathologists, and counselling from social workers. Activities are arranged for residents who are able to participate.
In 2006, over 80% of nursing home residents were not independently mobile, 66% had continence problems, 47% needed help eating and 37% needed help in all three areas (Shi & Singh, 2012). More than half of all nursing home residents were totally dependent or required extensive assistance in all five ADLs (bathing, dressing, toileting, transferring, eating) (Centers for Disease Control and Prevention, 2009b).
Through a complex web of personal and public financing, essentially all Americans have access to nursing homes. However, many must pay out of personal funds and many of those paying with personal funds eventually run out of money and assets, at which time they can be covered by Medicaid. The financial options are as follows: if an elderly person is admitted to a nursing home post-hospitalization, Medicare will cover a limited amount of skilled nursing days, contingent upon rehabilitation progress. If the individual needs to stay beyond Medicare-covered days, he or she must pay out of pocket or through Medicaid, if eligible. Medicaid covers care for those who are low income and who have minimal assets so in order to receive Medicaid coverage an individual has to use up (“spend down”) personal assets first (this does not include a family home and other exclusions). A private room in a nursing home averages $75 000 a year (Kovner & Knickman, 2011) (but varies greatly by geographical location) so it is easy to see why those paying out of pocket soon run out of money. Long-term care (LTC) insurance covers nursing home care but few Americans take out this type of insurance (LTC insurance covered 7.5% of nursing home expenses in 2005) (Kovner & Knickman, 2011). Annual premiums for LTC

Health systems in transition United States of America 271
insurance are high so those that have it tend to be more affluent. Nevertheless, the number of people who carry this insurance is growing and is predicted to rise to 17% by 2020.
Most nursing home residents enter nursing homes as private patients and spend down their private assets within a few months, at which time they are eligible for Medicaid coverage (Centers for Disease Control and Prevention, 2009b). A national nursing home survey in 2004 found that at admission, most residents (42%) paid out of pocket, followed by those who were covered by Medicare (36%) and Medicaid (35%) (Centers for Disease Control and Prevention, 2009b). However, as mentioned above, financing shifts during a resident’s stay so that the prevalence of payers at any given time in a nursing home is 13% for Medicare, 66% for private and 60% for Medicaid. These percentages add up to more than 100% because residents may have more than one financial source (Centers for Disease Control and Prevention, 2009b).
Despite the Medicaid safety-net for nursing home care, studies have shown that African American elders are less likely to go into nursing homes than Whites, even though they have on average poorer health status and greater need (Akamigbo & Wolinsky, 2007). Explanations for this disparity are that there is a strong African American cultural aversion to going into a nursing home and that families provide the care themselves. It is also thought that geographical barriers may be a contributing factor.
Nursing homes have experienced problems with quality for several decades. The issues have been with inadequate staffing, overuse of restraints and urinary catheters, failure to treat residents with respect, failure to prevent and adequately care for pressure sores, unsanitary food and resident malnutrition, unsanitary and unsafe environment, failure to have social programmes and activities, and insufficient rehabilitation services, among many others (Harrington, Carrillo & Blank, 2010). In response, federal and state governments have enacted regulations and certification requirements aimed at improving the quality of care. Nursing homes are not only required by state regulations to meet physical, resource and service standards (staffing, sanitation, building codes, etc.) but to be certified they must also collect data on a number of quality indicators and meet the standards set by these indicators.
Currently, data are collected for two sets of quality improvement measures: the Online Survey Certification and Report (OSCAR), and the Minimum Data Set for Nursing Homes (MDS-NH). The OSCAR must be conducted by states within a 15-month period on an average of every 12 months (Harrington, Carrillo & Blank, 2010). Data on a number of indicators are obtained by facility

Health systems in transition United States of America272
self-report and surveyor review and site visit. If facilities do not meet standards in the required areas they will receive a deficiency citation in that area. Extra surveys are required to check on the progress following a deficiency, when there are changes in a facility’s organization and management, and when there has been a complaint.
The MDS-NH is a component of the RAI, a resident-level set of resident characteristics and process and quality indicators. Nursing homes that receive Medicare payment must periodically collect and report RAI data on all aspects of the residents’ physical, mental, emotional, behavioural and social status. The MDS-NH data are used by Medicare to publicly report quality in nursing homes. This is being done through Nursing Home Compare, an online system similar to the Hospital Compare and Home Health Compare systems discussed in previous sections. The web site provides comparisons of patient outcomes across nursing homes.
In addition to these quality initiatives, CMS began a three-year P4P demonstration project – the Nursing Home Value-Based Purchasing (NHVBP) project – in three states in 2009. CMS is making payment awards to nursing homes that achieve a high level of performance or exceptional improvement based on quality-of-care measures, including staffing, appropriate hospitalizations, outcome measures from the MDS and OSCAR survey deficiencies.
5.12 Palliative care
5.12.1 Definition and services
Palliative care is the care of persons for whom there is no hope of recovery from a terminal illness. It entails the relief of pain and other symptoms to make the person comfortable, and psychosocial and spiritual support. Core values of palliative care are that end-of-life care should be an integral and important part of health care and that care should involve the patient and family and respect their wishes (Field & Cassel, 1997).
For reimbursement purposes, payers make a distinction between palliative and hospice care. Palliative care is any number of treatments that may be given at any time following the diagnosis of a terminal illness. Details can be found at the National Hospice and Palliative Care Organization (NHPCO) web site. Palliative care may be provided by hospitals, clinics, nursing homes, home care agencies and other health-care organizations. The care may occur in homes,

Health systems in transition United States of America 273
hospitals, and long-term care facilities. Hospice care is a comprehensive set of palliative care services for the terminally ill who have a life expectancy of months (usually six or less). Hospice care is a set of defined services that fall under specific Medicare regulations.
The use of hospice care grew in the United States following an expansion of Medicare benefits in 1983 to include hospice care (Shi & Singh, 2012). It can be provided in the home or in an institutional setting such as a hospital, nursing home or retirement centre. There are also freestanding hospice centres. The majority of hospices are independent (58%) (NHPCO, 2010). Others are part of a hospital system (21%), home health agency (19.5%) or nursing home (1.4%). All hospice care involves a team of providers: a doctor, nurses, social worker, chaplain, volunteers, home health aides and others.
Medicare requires participating hospices to use volunteers for at least 5% of all patient care hours. In 2009, 468 000 hospice volunteers provided 22 million hours of service (NHPCO, 2010). Volunteer activities are in three areas: spending time with patients and families; providing clerical and other support services; and helping with fundraising.
Hospice services were delivered to 1.56 million persons in 2009 (NHPCO, 2010). The majority of these persons were 65 years of age or older. Common diagnoses for patients receiving palliative care are: cancer (over 50% of hospice patients), congestive heart failure, chronic obstructive pulmonary disease, chronic pain, organ transplant, AIDS, severe trauma and stroke (Ervin, 2004; Shi & Singh, 2012).
Palliative care and hospice care differ in terms of reimbursement of services. Medicare pays for only some palliative care treatments and medications but all hospice charges. Medicaid also pays for some palliative care and in 47 states it pays for all hospice charges. Private insurance covers some palliative care treatments and most plans also have a hospice benefit. Hospice care is a cost-effective option for palliative care. For every dollar spent for hospice care, it is estimated that Medicare saves $1.52 in Part A and B expenditures (Shi & Singh, 2012).
5.12.2 Accessibility of palliative care
Exactly to what extent palliative care is covered by public and private insurance varies, so financial barriers to palliative care cannot be summarized other than to say that they could be significant. However, insurance coverage of hospice care is more consistent and transparent. As outlined above, Medicare, Medicaid

Health systems in transition United States of America274
(in most states), and most private insurance plans cover hospice care, so most individuals with some form of insurance are able receive hospice care without any financial barriers.
Due to the fact that most hospice care is for the elderly, and the elderly are fully covered by Medicare, the number of uninsured individuals needing hospice care is actually quite small (Lorenz et al., 2003). For the small number of individuals without insurance coverage of hospice services, hospice care may still be available due to the mission of many hospices, especially those that are non-profit, to provide care regardless of ability to pay (Pietroburgo, 2006).
Access to hospice requires more than the absence of financial barriers. Other issues that need to be addressed include lack of patient and family awareness of hospice services, and patient and family mistrust (Born et al., 2004). Language barriers may also exist.
5.12.3 Initiatives to improve palliative care
Quality improvement efforts have made significant headway in palliative care. In 1997 the IOM recommended an expansion of palliative care settings, development of measures of quality, performance monitoring, and provider payment that does not restrict access to care, among several other recommendations (Field & Cassel, 1997). Since then, strides have been made in the development of clinical guidelines for quality palliative care services and quality measures based on those guidelines (National Consensus Project for Quality Palliative Care, 2004). A 2009 review identified 142 quality indicators that covered all but one domain of care: the cultural (Pasman et al., 2009). Most quality indicators pertain to outcomes or processes of care.
5.13 Complementary and alternative medicine
5.13.1 Definition, services and utilization
Complementary and alternative medicines (CAM) are a group of therapeutic and preventive practices that do not follow conventional medical methods (Shi & Singh, 2012). The therapies use a variety of approaches, including chiropractic, naturopathy, homeopathy, massage therapy, energy healing therapy / Reiki, acupuncture / acupressure, traditional Chinese medicine (TCM), herbal formulas, meditation, yoga, Ayurveda, Taichi, biofeedback, spiritual guidance or prayer, and other holistic approaches (Su & Li, 2011; Shi & Singh, 2012).

Health systems in transition United States of America 275
CAM tends to see health problems as integral to other aspects of the human mind, body and spirit, and approaches treatments as adjustments that need to be made to make the body whole. These approaches are in contrast to the dominant allopathic approach in the United States, in which a health problem is approached as an isolated problem that must be overcome. Complementary medicine refers to alternative medicines that are used together with allopathic medicine, while alternative medicine refers to therapies that are used instead of conventional medicine.
CAM practitioners such as naturopaths, homeopaths, massage therapists, acupuncturists and chiropractors operate out of offices. Other CAM therapies do not require practitioners and can be obtained by individuals through health food stores, exercise clubs (such as yoga) and the internet. Web sites are a common way for individuals to learn about CAM and to obtain therapies such as herbal remedies.
Some CAM practitioners, such as chiropractors and acupuncturists, are licensed by the states (NCCAM, 2011a). States vary on licensing of other practitioners such as TCM. Schools that teach acupuncture and TCM can be accredited by the federally recognized Accreditation Commission for Acupuncture and Oriental Medicine (ACAOM). Around one-third of the states that license acupuncture require graduation from an ACAOM-accredited school. Certification programmes run by the National Certification Commission for Acupuncture and Oriental Medicine (NCCAOM) are also available for acupuncture, Chinese herbology and Oriental bodywork. Almost all states that license acupuncture and TCM require practitioner completion of NCCAOM’s national written exam and some states also require a practical exam.
Other CAM modalities may also be regulated. Herbs (botanicals) are regulated as dietary supplements by the FDA. The FDA is concerned with the marketing of herbs, with the health claims that are made, and with any health hazards that may exist. Botanicals that are considered to be a health hazard can be banned although it is more difficult to withdraw herbs in the United States than in other Western countries (Baker, 2011). Ironically, this seems to be the case because botanicals are more integrated into mainstream medicine in other countries, and are therefore subject to similar or the same regulations as pharmaceuticals, as in Germany (Baker, 2011). An example of a botanical that has long been illegal in the United States is marijuana. Kava is another botanical that was close to being banned in the United States, was banned in Germany and remains banned in Switzerland (Baker, 2011).

Health systems in transition United States of America276
The banning of herbs is quite controversial. For example, kava was banned based on its association with liver toxicity in some individuals. Yet the evidence was based on case studies, rather than controlled studies – most of the individuals who took kava and developed liver failure had other covariates for liver failure (Baker, 2011). In contrast, reviews of randomized controlled trials (RCTs) of kava suggest that it is both effective and safe (Baker, 2011).
The use of CAM has grown tremendously. Based on the NHIS, which is conducted every few years, in 1990 34% of the population used some form of CAM, including prayer (Pagan & Pauly, 2005). By 2002 the figure was 62%. The latest 2007 NHIS indicates that the percentage has held steady at 61% (Su & Li, 2011). The 2007 survey shows that provider-based CAM, particularly acupuncture, chiropractic and massage therapy, increased more than non-provider-based CAM (Su & Li, 2011). Since 1990, there have been more visits to CAM providers than to primary care physicians (IOM, 2005).
People seek CAM for several reasons (Shi & Singh, 2012). Many believe that they have not been helped by allopathic treatments. Many have chronic pain that is not being controlled well with allopathic pain medications. Some fear the side-effects of allopathic treatments and believe that CAM will do less harm. People also feel that CAM practitioners spend more time with them and listen to their life issues as a whole. The most common clinical conditions for seeking CAM include back problems, allergies, fatigue, arthritis and headaches.
CAM has had an uneasy relationship with allopathic medicine. A few decades ago, medical practitioners and organizations, such as the AMA, opposed its use (Meeker, 2000; Kaptchuk & Miller, 2005). In response to the spontaneous popularity of CAM among the population, and to some scientific evidence regarding the efficacy of certain therapies, that stance has softened. Medical practitioners still voice concerns about the efficacy of the use of alternative therapies but they are beginning to integrate them with their allopathic medicine. Some physicians and hospitals are now offering selected CAM therapies, such as biofeedback and relaxation, counselling and psychotherapy, behavioural medicine, and diet and exercise (Meeker, 2000; Kaptchuk & Miller, 2005). Chiropractic therapy is becoming more accepted (Meeker, 2000). CAM is a topic at medical conferences and continuing education programmes.
Integrative CAM centres are being developed, many with ties to medical schools and teaching hospitals (Kaptchuk & Miller, 2005). Cancer treatment centres have begun to use CAM therapies in conjunction with conventional approaches (Kaptchuk & Miller, 2005). For example, an Integrative Medicine

Health systems in transition United States of America 277
Service is offered by Memorial Sloan-Kettering Cancer Center. The service provides music therapy, massage, ref lexology and mind–body therapies (Kaptchuk & Miller, 2005).
Medical schools are also exploring the integration of CAM into their curricula. Many have added courses to educate physicians about CAM. Of 117 medical schools responding to a 1997–1998 survey, 64% had some type of CAM instruction (Wetzel, Eisenberg & Kaptchuk, 1998). Most CAM courses were elective. Some required courses included information on CAM.
HMOs are beginning to include CAM in their covered services because it has the potential to improve quality and save money (Shi & Singh, 2012). This is especially the case for health problems such as fatigue and non-specific aches and pains that have been difficult to diagnose and improve with conventional medicine. Stress management, meditation and other therapies are lower in cost than conventional medicine.
5.13.2 Accessibility of CAM
There are significant financial barriers to obtaining CAM. Medicare does not cover CAM, with the exception of some of the Medicare Advantage plans that may include chiropractic care (Reynolds, 2010). Medicaid plans also tend to exclude CAM, with the exception of chiropractic and acupuncture. Private health insurance is beginning to cover CAM, but mostly chiropractic care, massage and acupuncture (NCCAM, 2011c; Shi & Singh, 2012). Even if the CAM therapy is covered by private insurance, pre-authorization may be needed, there may be network restrictions, the deductibles and co-payments may be higher than for conventional care, and there may be limits on the number of visits or reimbursements. Some insurance plans only offer CAM through riders.
Due to thin insurance coverage, OOP costs form a significant portion of payments for CAM. In 2007 OOP expenses for CAM formed 11.2% of total OOP expenses for health care and 1.5% of total health-care expenditures (Shi & Singh, 2012). Although this would seem to indicate significant access issues for low-income and uninsured persons, the costs of CAM compared to many allopathic alternatives are low. So CAM is seen as an option by many people who do not have insurance. One study found that the use of CAM is more likely when the individual has unmet conventional care needs (as for example delayed or lack of care due to costs) (Su & Li, 2011).
Health systems in transition United States of America278
5.13.3 Efficacy of CAM
As mentioned above, the efficacy of CAM is often questioned. In order to understand more about the effects of CAM, RCTs are being conducted internationally. Results so far are mixed, depending on the type of CAM and the health problem it is being used for. Some examples of results follow. A systematic review of RCTs evaluating CAM therapies for cancer pain summarized that significant benefits appear to occur with support groups, hypnosis, relaxation / imagery, acupuncture and music (Bardia et al., 2006). However, the review reported that few of the studies had adequate power, duration and control. Cochrane reviews, noted for their rigour and transparency, have found support for acupuncture’s effectiveness in reducing pain in migraines and tension headaches, neck disorders, and peripheral joint osteoarthritis, but deemed it ineffective or inconclusively effective for other types of pain (Lee & Ernst, 2011).
5.13.4 Initiatives to improve CAM
Noting the increasing popularity of CAM and the need for more research regarding its effects, in 1993 Congress established the Office of Alternative Medicine (OAM). From this, an institute in the National Institutes of Health was added: the National Center for Complementary and Alternative Medicines (NCCAM). The mission of NCCAM is to “define, through rigorous scientific investigation, the usefulness and safety of complementary and alternative medicine interventions and their roles in improving health and health care” (NCCAM, 2011a). The NCCAM has funded many studies involving CAM therapies (Meeker, 2000).
While research on CAM continues, the IOM recommends the development of guidelines and tools to aid medical practitioners in their decision-making regarding CAM: whether to offer it or not, where to make referrals, and organizational structures for the delivery of integrated care (IOM, 2005). The IOM believes that it is important to understand how CAM and conventional medical treatments interact, and encourages providers to maintain care that is safe, evidence-based, patient-centred and interdisciplinary. As part of this process, the Federation of State Medical Boards has developed Model Guidelines for the Use of Complementary and Alternative Therapies in Medical Practice. The IOM also encourages research examining the ways in which conventional and alternative treatments can be integrated (IOM, 2005). Such research focuses on identifying the elements, outcomes and cost-effectiveness of integration.

Health systems in transition United States of America 279
5.14 Services from informal care-givers
5.14.1 Definition and services
Previous sections have discussed the formal (paid) care provided for health-care services in the United States. Much health care, however, is delivered by unpaid, or informal, providers, such as family and friends. In fact, most long-term care is actually performed by informal care-givers (Kovner & Knickman, 2011; Shi & Singh, 2012). Informal care reduces the use of formal home health-care services and delays the entry into a nursing home. Individuals who are fortunate enough to have informal care-givers tend to remain in the community longer than those who do not. Informal care plays a key role in coordinating different health-care services and managing transitions between settings such as hospitals and nursing homes (Shi & Singh, 2012). Informal care-giving is also heavily involved in end-of-life (palliative) care.
Twenty-three per cent of Americans provide some type of informal care, including custodial, nursing, transportation, management of care and other services (Donelan et al., 2002). A high percentage of care involves help with or complete performance of ADLs, including bathing, dressing, eating, walking or transferring to a wheelchair, transportation and communication (such as phone calls) (Donelan et al., 2002). In some cases, more complex nursing care is required, including administration of medications, dressing changes, wound care, working with equipment and other nursing care.
The amount of informal care-giving in the United States varies from less than a few hours a week to continuous (Donelan et al., 2002). Sixty-seven per cent of care-givers provide 20 hours or less a week, while 20% provide more than 40 hours (Donelan et al., 2002). Duration of care also varies from less than one year (22%) to 10 years or more (19%).
Informal care involves a large amount of assistance that used to be provided by paid care-givers. Shorter hospital stays and cutbacks in home care funding have left more health-care services to be provided on an unpaid basis (Donelan et al., 2002). Informal care thus creates a large amount of value although the exact amount is unknown. In one year in New York State alone, family members contributed an average of 22 hours per week, estimated to be worth $7.5–11.2 billion (Kovner & Knickman, 2011).
Health systems in transition United States of America280
5.14.2 Accessibility, adequacy and quality of informal care-givers
Access to informal care is dependent on individual relationships and situations. Unpaid informal care usually comes from family, friends, or the social and religious affiliations of the person needing care. Without such resources, the individual or his or her advocates will need to seek formal, paid care. This can be an issue at the present time but it is even more of a concern for the future. There will most likely be an insufficient supply of informal care-givers in the future due to the “baby boom” generation entering old age and an increase in the number of elderly who are divorced, unmarried, and / or without children (Shi & Singh, 2012).
The quality of informal care is directly related to the care-giver’s level of knowledge and skills concerning the care, and the ability of the care-giver to handle the stresses involved in care-giving. Informal care-givers often have no formal training and do not have to acquire certifications or licences to perform their care. They may learn their skills by trial-and-error, or through some hospital or home care instruction (Bee, Barnes & Luker, 2009), and may feel that they are not given adequate training (Bee, Barnes & Luker, 2009). A 2002 survey of informal care-givers found that more than one-half of those who helped with ADLs and one-fifth of those administering multiple medications had no formal training to do so (Donelan et al., 2002). When informal care- givers do not have adequate training to perform complex medical tasks, such as medication administration, errors can result (Donelan et al., 2002). Even custodial tasks, such as turning a bed-ridden patient, can result in both care-giver and patient injuries if not performed correctly.
Informal care-givers also have to deal with financial, emotional, physical and social difficulties (Shi & Singh, 2012). They often face financial challenges due to medical and custodial costs for the person they are caring for. Emotional issues include anger, guilt, dissatisfaction and family conflict. Physically the work can be very demanding and exhausting and can even result in injuries. The care-givers themselves may be elderly or ill (Donelan et al., 2002). It has been found that care-giver health tends to be poorer than that of non-care-givers (Shi & Singh, 2012). Isolation from friends and community may occur due to care-giving demands. As a result of all these issues, burnout can occur, and this can affect the quality of care provided.
Health systems in transition United States of America 281
Due to these factors, informal care is performed with varying degrees of quality. Furthermore, there is no monitoring of the care. Often, the only knowledge of poor quality of care comes when the individual is seen by formal care-givers, who spot the issues. At that time, the individual may have sustained injuries or illness due to improper or inadequate care.
5.14.3 Initiatives to improve informal care-giving
Informal care-givers need educational, financial, physical, emotional and social support. Educational classes and instruction in the home would improve knowledge and skills (Donelan et al., 2002). Hospital, home care agencies and nursing homes help in the skills training of informal care-givers by providing education and training when patients in these settings receive ongoing informal care (Bee, Barnes & Luker, 2009).
Access to respite services helps informal care-givers with their physical, emotional and social issues. Respite care is any type of care that relieves informal care-givers of their duties for a (usually short) period of time. This gives informal care-givers a chance to take a break and “recharge their batteries”. The respite care can be more informal care, such as may be offered by a church, or formal care, such as adult day care, home health care or temporary institutionalization (Shi & Singh, 2012). One initiative enacted in 2000 is the National Family Caregiver Support Program (Donelan et al., 2002; Kovner & Knickman, 2011). The programme has established networks to provide information about the availability of support services, assistance in gaining access to them, counselling services and respite care (AOA, 2011).
5.15 Health services for specific populations
This final section of the chapter on health-care services in the United States focuses on vulnerable populations and those that have special access to health services. The term “vulnerable” refers to populations that are at higher risk for poor health and poor health outcomes. This includes racial and ethnic minorities, those with low income, the uninsured, the disabled, the homeless, women, children, persons with HIV / AIDS, the mentally ill, the elderly and those living in rural areas, among others (Schor et al., 2011; Shi & Singh, 2012). Populations that have special access to health services include American Indians and Alaska Natives, military personnel, veterans, and those who are institutionalized, such as prisoners.

Health systems in transition United States of America282
5.15.1 Racial and ethnic minorities, low-income individuals and the uninsured
Discussion on the health and health-care issues of racial and ethnic minorities, low-income individuals and the uninsured is combined because these populations frequently overlap. Many individuals who are low income are also uninsured, and many low-income and uninsured individuals are racial and ethnic minorities. Programmes for improvement often address all these populations simultaneously. There are, of course, separate issues within each population. Racial and ethnic minorities, for example, may face discrimination and health-care treatment that is different. However, when overlaps occur, there are numerous social, cultural, economic and structural barriers to accessing quality health care and to being in good health.
The demographics of race, ethnicity, low income and lack of insurance are as follows. In 2010 racial and ethnic minorities were around 41% of the United States population: 12.6% were Black or African American, 16.3% were Hispanic, 4.8% were Asian and 7.3% were other races (Humes, Jones & Ramirez, 2011). Fifteen per cent of the United States population was in poverty in 2010, a percentage that has been increasing for a number of years (DeNavas-Walt, Proctor & Smith, 2011). Over 16% of the population had no insurance in 2010 (DeNavas-Walt, Proctor & Smith, 2011). Those with low incomes were more likely to be uninsured than those with higher incomes, and Blacks and Hispanics were more likely to have a low income than Whites, and less likely to have health insurance (Copeland, 2005; DeNavas-Walt, Proctor & Smith, 2011; Shi & Singh, 2012). The health of racial and ethnic minorities is generally poorer than that of Whites, the health of low-income persons is poorer than that of persons with higher incomes, and the health of those without insurance is poorer than that of the general population (Copeland, 2005; Cheong, Feeley & Servoss, 2007; Shi & Singh, 2012).
These disparities in health have both non-health-care causes and health-care causes. Non-health-care contributions to poorer health include differences in physical environment and in educational and employment opportunities (Richardson & Norris, 2010). Unsafe neighbourhoods, lack of recreational opportunities, crowded and substandard housing, lack of access to healthy food, and exposure to pollutants and allergens can adversely affect health. Cultural norms can also negatively affect a person’s health behaviours and therefore their health. For racial and ethnic minorities, racism and discrimination also play a role in their health (Richardson & Norris, 2010).
Health systems in transition United States of America 283
Health care contributes to health disparities in terms of both access to care and the quality of care (Richardson & Norris, 2010). Disparities in access to care are more than just financial barriers, such as lack of insurance, but also include geographical, provider and cultural barriers (Copeland, 2005; Richardson & Norris, 2010). While it is clear that those with a low income and lack of insurance will have difficulty with access to health care, racial and ethnic minorities experience disparities in access to health care that cannot be explained by income and insurance status (Shi, Lebrun & Tsai, 2010).
Research indicates racial and ethnic minorities receive poorer quality of care than whites (Bloche, 2004; AHRQ, 2011). There are many reasons for this but discrimination plays a role (Egede, 2006). In one study, approximately 5% of respondents experienced discrimination that resulted in less preventive care.
Federal, state and private agencies have worked at reducing disparities in health and health care for these populations for a number of years. The IOM has been active in assessing and reducing disparities in access and quality of health care for racial and ethnic minorities (Smedley, Stith & Nelson, 2003). The AHRQ publishes an annual National Healthcare Disparities Report on the state of health-care disparities in the United States and opportunities for reducing them (AHRQ, 2011). Effectiveness of care, patient safety, timeliness, patient centredness, efficiency and access to care are assessed. The 2010 report endorsed recommendations by the IOM and cited the need to reduce disparities in preventive care and population health. AHRQ promotes research on disparities in health and health care.
Currently, community health centres play an important role in providing access to health care for the uninsured and those with low incomes. In one study, Medicaid recipients and uninsured patients who received care in community health centres were more likely to report that they had access to care than those that did not (Shi, Stevens & Politzer, 2007).
A major initiative that health-care leaders believe will improve access to care for low-income and uninsured individuals is the ACA (Stremikis et al., 2011), though as explained in Chapter 6 the Supreme Court’s 2012 decision limited the Medicaid expansion. Improvement will be accomplished through expansion of Medicaid, individual health insurance mandates with assistance for the needy, expansion of community health centres and other measures. Emphasis on patient-centred medical homes will also improve the quality of care delivered to these vulnerable populations. Despite the advances that are possible with the ACA, more remains to be done. A report by the Commonwealth Fund discusses the need to adequately reimburse providers for care to Medicaid recipients

Health systems in transition United States of America284
and other low-income patients, eliminate gaps in insurance coverage, protect patients from high OOP costs, improve the coordination of care and integrate health care with community resources (Schor et al., 2011).
5.15.2 American Indians and Alaska Natives and the Indian Health Service
A small minority of 5.2 million people – a little over 2% of the United States population – classify themselves as American Indians and Alaska Natives (AIANs), either alone or in combination with other races (Humes, Jones & Ramirez, 2011). The removal of Native Americans from their ancestral lands, relocation to reservations and other detrimental developments have left them with few political and economic resources.
Over the past decades the search for educational, employment and housing opportunities by these indigenous populations has resulted in a migration from traditionally rural to urban areas (Castor et al., 2006). In 2000, 61% lived in urban areas (Castor et al., 2006). However, in urban areas, these populations are still twice as likely to be poor, unemployed and less educated than the rest of the population (Castor et al., 2006).
AIANs are in worse health and have shorter lifespans than the general population (IHS, 2011a). They have a higher incidence and prevalence of diabetes, hypertension, infant mortality and morbidity, and chemical (alcohol and drugs) dependency. They also have higher death rates due to alcoholism, tuberculosis, diabetes, injuries, suicide and homicide.
Many of these health disparities are due to their lower socioeconomic status (IHS, 2011a). For example, higher mortality rates due to injuries among AIAN children have been found to be associated with poverty (Castor et al., 2006). However, access to quality health care is also a factor (IHS, 2011a). This is the case despite the special services available to people of AIAN descent.
People of AIAN descent are eligible to receive services provided by the IHS, a federal agency within the HSS (IHS, 2011). Appropriations for the IHS are authorized through the Indian Health Care Improvement Act (IHCIA), which requires periodic reauthorization by the United States Congress (U.S. Department of Health and Human Services, 2010d). IHS services are located mainly on or near reservations and rural communities in 35 states, mostly in the western United States and Alaska. With tribal involvement, comprehensive services are provided for around 2 million people. Given AIAN migration to urban areas, the IHS also awards contracts and grants to non-profit agencies

Health systems in transition United States of America 285
in urban areas to provide similar services in those areas. These agencies are referred to as urban Indian health organizations (UIHOs). In 2012 there were 34 UIHOs in the United States (IHS, 2011b).
On or near reservations, the IHS maintains clinics that provide primary care services and diagnostics free of charge to AIANs (Zuckerman et al., 2004b). Selected specialty services are provided free of charge in some sites. In many communities the clinics are small and must contract out for specialty care, radiology and other diagnostic services. Public health outreach and educational services for injury control, alcoholism, diabetes, mental health, HIV / AIDS, maternal and child health, and other conditions are also provided. Hospitals are available at some sites.
For AIANs not on or near reservations, their access to health care follows the pattern of the general population unless a UIHO is nearby. Given the high rates of poverty and uninsurance and few UIHOs, this means that AIANs in urban areas have difficulty accessing health-care services.
Due to inadequate funding, services provided by the IHS are sporadic and do not provide adequate access to necessary health care for all AIANs needing the services (Zuckerman et al., 2004b; Sequist et al., 2011). Performance of IHSs on several measures is also below that of Medicare and Medicaid providers (Sequist et al., 2011). As a result, studies show that, despite the existence of the IHS and UIHOs, health-care utilization is lower among AIANs than in the general population (Zuckerman et al., 2004b). Although it is recognized that socioeconomic and cultural factors are involved in this underutilization, the lack of availability of health-care services remains a factor (Zuckerman et al., 2004b). A 2004 study found that over half of low-income uninsured AIANs did not have access to the IHS (Zuckerman et al., 2004b).
Health-care leaders and policy-makers have pushed for improvement in IHS services for many years. Lack of funding is a primary problem. The IHS services are thought to be underfunded by around 50% (Sequist et al., 2011). A 2010 study found that the services from the IHS were improving but were still limited by lack of resources (Sequist et al., 2011).
Provisions in the ACA make the IHCIA permanent and expand provided services to include hospice, assisted living, long-term, and home-based and community-based care. Indian health facilities will be allowed to collect reimbursement from Medicare, Medicaid and CHIP. Tribal organizations will be allowed to purchase health insurance coverage, including the Federal Employees Health Benefits Program, for IHS beneficiaries. The ACA also

Health systems in transition United States of America286
allows AIANs to purchase insurance on state-based exchanges in 2014 (Healthcare.gov, 2011). Some members of this group will not be obliged to pay co-payments or deductibles if their income is less than 300% of the FPL or about $66 000 for a family of four ($83 000 in Alaska) (Healthcare.gov, 2011).
5.15.3 The disabled
Around 20% of the United States population has at least one disability and most of the population will have a disability at some time in their life (Centers for Disease Control and Prevention, 2011b). A disability is defined by the WHO as an impairment, an activity limitation or a difficulty in participating in life situations (WHO, 2012). Whether a person has a disability is usually assessed through performance of ADL or instrumental activities of daily living (IADL) (Shi & Singh, 2012). The number of disabilities increases with age and in rural areas, and is more common among African Americans and AIANs (Clancy & Andresen, 2002).
People with disabilities are more likely to report having poorer health, lack of insurance and less access to health care (Clancy & Andresen, 2002). In some studies, those with major disabilities are less likely to have preventive care, such as Pap smears and mammograms (Clancy & Andresen, 2002). People with disabilities often also need custodial services. Yet one study showed that around one-third of people with disabilities do not receive assistance with ADLs, and as a consequence they do not bathe, follow a dietary regimen, or engage in other ADLs they need assistance for. Many are likely to experience falls.
The 1991 ADA made provisions for the disabled in public settings. Examples include ramps, lifts and special toilets in public places. Meeting the special health-care needs of the disabled has also been a priority of health-care research and policy. The IOM has convened two committees to address the health needs of the disabled (Clancy & Andresen, 2002). The first committee report recommended moving away from a “medical model” of disability to one that does not consider it synonymous with impairment but instead sees it as socially determined. The second report addressed rehabilitation. Several surveys, such as the NHIS, contribute to data on the disabled. The disabled are a priority population for AHRQ research funding (Clancy & Andresen, 2002).
5.15.4 The homeless
A person is considered homeless if he or she lacks a “fixed, regular, and adequate night-time residence” and has a primary night residency that is a public or private shelter or place not designed for sleeping (NCH, 2009). The
Health systems in transition United States of America 287
exact number of homeless persons in the United States is unknown, but one estimate puts it at 3.5 million (a little over 1% of the population) (NCH, 2009). At some point in their lives, approximately 14% of the population will be homeless for a period of time.
The most basic need of the homeless, is shelter and food. Yet these needs are often not met. A survey of 50 cities found that the estimated number of homeless in every city exceeded the number of emergency shelters and transitional housing (NCH, 2009). At the same time, although 9% of the homeless live in rural areas, there are few shelters in these areas.
The homeless often have acute and chronic health problems (NCH, 2009). They may have injuries and illnesses due to environmental exposures, drugs, alcohol, sleeping sitting up and walking with poorly fitting shoes. They are also at risk of being the victim of violent crimes. Homeless women may have reproductive issues and may experience abuse.
Although they have more health-care needs than the general population, the homeless have a number of barriers to receiving health care. In addition to financial and transportation barriers, which are substantial, the homeless frequently have personal barriers, such as substance abuse and mental illness, which prevent them from seeking care. Even if they receive care, they may not be compliant with treatment if they have no way to store medications or food. They are also frequently unable to provide basic wound care for themselves. As a result, they experience a high rate of hospitalization.
CHCs are the primary venue for primary care for the homeless. A joint public–private programme – the National Health Care for the Homeless Council – works with the CHCs and clinicians to provide primary health care for the homeless (NHCHC, 2012). The NHCHC is financed through HRSA, other public funding and private donations, and has over 100 organizational members. The NHCHC promotes advocacy to reduce homelessness, education regarding the health care and other needs of the homeless, and policies to provide universal access to health care.
5.15.5 Active-duty military personnel and veterans
Active-duty military personnel and veterans face a higher incidence of physical injury and mental stress than the general population (Zeber et al., 2010). Traumatic brain injury, wounds, loss of limbs, burns, traumatic stress and a host of other injuries can occur while in active duty. Many veterans return from

Health systems in transition United States of America288
wars with permanent disabilities and stress-related mental problems, such as post-traumatic stress disorder (PTSD). These populations require and deserve accessible and specialized health-care services.
The federal government provides special health-care services for active-duty and retired personnel and veterans of the United States military. Active-duty and retired members of the military can receive health care through the MHS, which is part of the Department of Defense. Dependants and survivors of the military may also receive care if resources are available. The MHS offers flexible and agile deployment of health-care services and operates a number of hospitals and clinics worldwide (Best, 2005). A major component of MHS is TriCare (formerly CHAMPUS), which came about due to shortages of military health-care facilities following closings of military bases in the 1990s (Best, 2005). TriCare is an insurance programme with managed care features that provides care through the use of military providers supplemented by civilian providers. Elderly beneficiaries enrolled in Medicare Part B may also enroll in TriCare for Life (TFL), which covers OOP costs and provides additional benefits covered by TriCare but not Medicare.
Veterans of the United States military who served on active duty in the Army, Navy, Air Force, Marines or the Coast Guard may be eligible to receive care through the VHA of the VA. If a veteran enrolls in the programme, he or she is placed in a priority category based on service-related injuries, income level and other factors. Acceptance for treatment in the programme is dependent on the yearly VA budget and the individual’s priority category (Kaiser Family Foundation, 2011i).
A number of United States veterans are over 65 years of age and are eligible for both VA health care and Medicare. Veterans who are enrolled in both Medicare and VA health care must choose one of the two to pay for services each time they need care (Kaiser Family Foundation, 2011i). Medicare can help pay for some co-payments charged by the VA but the VA will not contribute to care that is being covered by Medicare.
The VHA provides comprehensive benefits, including primary, outpatient, inpatient, nursing home and dental care, and prescription drugs (Kaiser Family Foundation, 2011i). Some of these benefits are available for veterans in the low priority categories only when resources permit. The VHA focuses on prevention, health promotion and chronic care for veterans with disabilities. It uses an outpatient model of care. Benefits are also available for dependants of permanently disabled veterans and survivors of military personnel who died in combat or from combat-related injuries.

Health systems in transition United States of America 289
The VHA provides care to over 5 million veterans (Kaiser Family Foundation, 2011i). It is the largest integrated health services system in the United States. In 2011 the VHA had 152 hospitals and nearly 1400 outpatient clinics, nursing homes and other facilities (VHA, 2012). The VHA is organized into 21 regional Veterans Integrated Service Networks (VISNs). Each VISN organizes the hospitals, outpatient clinics, nursing homes and other services in its jurisdiction.
The VHA is funded through tax dollars. Funding constraints tend to lead to over-capacity and lack of adequate resources. As a result, many veterans in lower priority categories do not have access to care or cannot obtain timely care (Shi & Singh, 2012).
As of 2004, one in eight, or 12.7% of United States veterans under 65 years lack health insurance or access to care at VHA hospitals. This is because about half of these uninsured veterans are ineligible for VA health care because they are classified in the lowest priority group, while the rest are eligible but live too far from VHA facilities to access the services (Kaiser Family Foundation, 2011i).
After years of being known for uneven quality of care, the VHA has become a leader in quality improvement and quality of care. The VHA has implemented large data gathering systems that monitor quality. Sources of quality problems are identified and changes in the system are made. The MHS has also undertaken major quality improvement initiatives. A further discussion of the recent successes of the VHA system appears in Box 7.2.


6. Prin
cipal h
ealth refo
rms
6. Principal health reforms
The Patient Protection and Affordable Care Act (ACA) of 2010 constitutes the most significant health reform in the United States since Medicare, though its adoption was highly controversial and its content reflects the
general American preference for minimal government intervention. Improving coverage is a central aim, with the ACA introducing a requirement for nearly all individuals to have some form of health insurance. Improved coverage is envisaged through both the public and private sectors: subsidies are provided for the uninsured to purchase private insurance (there is no government-provided health-care delivery option), and, in some states, more low-income people will obtain coverage through expanded eligibility for Medicaid. The ACA also addresses underinsurance, providing greater protection for insured persons from their insurance being too limited in scope, inadequate in coverage or even being cancelled once they became ill. There are also increased funds for primary care to improve access. Public health is also strengthened, there is increased funding for public health programmes, and requirements for chain restaurants and vending machines to display calories for food products.
Improving quality and controlling expenditures are also addressed through a range of measures. These are broadly a combination of incentives for efficiency and better-quality care plus penalties linked to inefficient care (e.g. for hospital readmissions), rather than any major restructuring of the health system as such; there are also some time-limited reductions in particular areas of spending (e.g. on pharmaceuticals). However, the ACA also contains measures pulling in the other direction; for example, a ban on US residents from buying and importing medication from other countries where it is cheaper, and preventing the use of cost-benefit analysis for health-care practice or reimbursement in the Medicare programme. The overall quality and financial impact of the ACA is disputed and difficult to predict.

Health systems in transition United States of America292
Implementation has been ongoing in stages since the law was signed in March 2010 with most aspects of the law scheduled to be fully operational by 2014, but before then political, economic, and social variables could change both the substance and the timetable. For example, a ruling of the US Supreme Court has already made the participation of individual states in the expansion of Medicaid effectively optional, with some states planning to opt out. Many states have decided not to implement a state “exchange” for the purchase of insurance in the private market, relying instead of the federal government’s exchange. A few states are partnering with the federal government to set up an exchange. States are permitted to change their policies on this in the future.
6.1 History of United States health reforms
Efforts to reform the health system in the United States date back to the original passage of Social Security in 1935 – and even before. These efforts are reviewed in Box 2.2. In many ways the ACA represents the next step in a process that began with the passage of Medicare (elderly) and Medicaid (poor) in 1965.
6.1.1 Aims, objectives and goals of the ACA
The ACA – adopted in March 2010 – reflects the broad public goals of the Obama Administration and was echoed in Congress by the diverse collection of policy-makers – all of whom were Democrats – who voted for the legislation. Any broad consensus as to goals disguised deep divisions within society as to how those goals could best be achieved. The goals themselves, even when expressed in their simplest form, were not separate and independent but rather related to one another, intertwined and interdependent.
This discussion is organized around three reform priorities; access, cost and quality. Firstly, at the time the ACA was being formulated it was estimated that 43.8 million people (14.7%) were uninsured, 55.9 million (18.7%) had been uninsured for at least part of the year, and 31.7 million (10.6%) had been uninsured for more than a year (Cohen & Martinez, 2007; Connors & Gostin, 2010). Private and public insurance expansion was the proposed means to achieve increased access. An individual mandate with government subsidies for the premiums of the low-income uninsured ineligible for Medicaid and employer-sponsored insurance expansion for companies with more than 50 full-time employees in the private sector were the means for reducing the uninsured rate. Broadened Medicaid eligibility was a key part of coverage expansion. Enhanced insurance regulation to ensure guaranteed issue (requiring

Health systems in transition United States of America 293
insurers to sell policies to all who wished to buy them), and community rating (requiring that premiums be the same for everyone in the same demographic category in the same geographical region), were also adopted to reduce the percentage uninsured.
Underinsurance was a parallel problem affecting an estimated 25 million people. Many in the United States found that their insurance was inadequate when they actually needed to use it (Schoen et al., 2008). Essential Health Benefits policies and the requirement of 60% actuarial value were important aspects of the ACA policy to deal with underinsurance. Improved access required an immediate end to the practice of cancelling insurance after someone becomes ill (a practice called rescission) (Reuters, 2010). Pre-existing condition limitations on insurance also compromised access to health care. Protections against these restrictions on access were implemented for children in 2010 and are scheduled to be expanded to adults in 2014. Lifetime caps on insurance are now illegal under the ACA and annual caps will be eliminated altogether in 2014 for new plans. A “cap” is a stipulated limit as to the maximum amount that an insurance company will pay for a policy holder.
Secondly, both the level of costs and the rate of cost increase needed to be managed. For some this goal meant reducing United States health-care costs dramatically; for others it meant reducing the rate at which health-care costs were increasing. Driving this goal was the fact that annual per capita health-care costs were nearly double those of several other high-income countries (OECD, 2010). A related objective was that the ACA did not contribute to the already large United States deficit. In short, one objective was to formulate legislation that was budget neutral or that actually reduced the national deficit as determined by the Congressional Budget Office, which calculated the cost of various elements included in the legislation (Oberlander, 2011).
Finally, the quality of health care was a focus of the ACA (Schoenbaum et al., 2011; Nolte & McKee, 2012). Geographical variations of health-care costs and practice differences across the United States raised the question of what is “best practice” and what is appropriate health care (Schoenbaum et al., 2011, p.3). The finding that as much as 30% of health care did not improve patient health fuelled calls for both cost savings and quality improvement (Institute of Medicine, 2010; Gabow, Halvorson & Kaplan, 2012). At the same time some experts contend that 55% of patients in the United States receive care that follows “best practices” or medical guidelines (McGlynn et al., 2003).

Health systems in transition United States of America294
6.1.2 Underlying issues in the development of the ACA
This section examines the context of United States health reform legislation: its history, the culture, the divided policy environment and institutional structures (including federalism). Policy experts disagree as to whether the context for health-care reform in 2009–2010 was positive or negative. Some argued that no historical period since the New Deal of the 1930s offered a more favourable climate for reform (Peterson, 2011). But this was a minority opinion, as many policy experts and White House advisers counselled President Obama against making health-care reform a priority (Jacobs & Skocpol, 2010).
The political culture of the United States influenced the content of the ACA. In the United States there is confidence in market competition and in entrepreneurship (Page & Jacobs, 2009). Individual rights and personal responsibility play an important role in United States political values. This meant that many of the ACA’s goals had to be accomplished with a “limited increase in federal governing authority” (Morgan & Campbell, 2011, p.387).
Health-care reform was initiated in 2009, at a time when research indicates that political partisanship was at historic highs (Galston, 2010; Murray & O’Connor, 2013). Data suggest that the political differences between the Republicans and the Democrats elected to Congress were greater than at any other time since the 1880s (McCarty, Poole & Rosenthal, 2008). Substantial political differences also existed within each political party (Marsh et al., 2012a,b). Thus constant negotiation and renegotiation on the content of the ACA legislation was required within the majority party, the Democrats. While the Democratic Party was the majority party in both houses of Congress, its margin of control in the United States Senate was narrow because of the need to have a “super majority” of 60 out of 100 seats to ensure the passage of contentious legislation in that chamber (Morgan & Campbell, 2011). On the other hand, due to his margin of victory in the 2008 election, President Obama’s political capital was high. He had not supported health-care reform to the same extent as had other Democratic Party candidates seeking the nomination of their party during the 2008 election campaign. But once elected he changed his priorities and made it a major goal of his administration (Jacobs & Skocpol, 2010). In his first year in office he lost some of the leaders he had counted on to support his proposed reform and to work with Congress to implement it. His first nominee to head the Department of Health and Human Services (HHS), Senator Tom Daschle, withdrew because of a legal matter related to taxes. Senator Chris Dodd was sidelined with cancer and Senator Ted Kennedy died in August 2009. This was not a promising beginning.
Health systems in transition United States of America 295
One of the major underlying issues in the development of the ACA was the need to settle on an agenda for the health reform. The Democrats were not in agreement as to what reform would best meet their goals. A few supported a single-payer system. A public option, in which a government-sponsored insurance plan would compete with private insurers, remained under discussion but was eliminated in the final bill due to intense political opposition. To appease those who wanted a public option, the law included grants and loans to establish at least one state-level cooperative health insurer but funding for this was withdrawn in December 2012. This is discussed in more detail below in section 6.2.
From the point of view of the economy, 2009 was a difficult time to undertake health-care reform partly because the health-care sector of the economy was one of the few remaining bright spots. The United States was just emerging from the longest recession in over 50 years. The unemployment rate was also at a high level. The housing market had faltered. Foreclosures abounded. The financial infrastructure was in a poor condition as some major banks were close to collapse in 2008 and had to be rescued by the government.
Finally, United States political structures posed an obstacle for health-care reform legislation and this had to be taken into consideration by policy-makers. In the United States presidential political system, with its separation of powers, it is very difficult to adopt comprehensive, rational, cohesively formulated policy programmes such as those more commonly observed in parliamentary systems of government (Rice & Unruh, 2009, Ch.10). In the United States each elected legislator can be independent of his or her party on any given issue and the system tends to be more open to stakeholder influence than in a parliamentary system (Rosenau, 1994).
Evidence-based research points to constraints on health-care reform legislation and the ACA bears out the findings (Volden & Wiseman, 2011). As an institution, Congress is subject to enormous outside influence because it is complex, made up of two chambers, many committees and even more subcommittees. Evidence also suggests that health policy legislation needs strong majority party support and leadership to be adopted. It is not the case that moderate and bipartisan approaches to health policy in Congress are more successful and the ACA did not have a single Republican vote but it was still enacted. Historically, health policy legislation is more likely than policy proposals in other issue sectors to end up in Congressional gridlock and this was a worry for the ACA, which passed by the narrowest of margins (Volden & Wiseman, 2011).
Health systems in transition United States of America296
6.1.3 How the content of the ACA was developed
The ACA is an enormous piece of legislation and, if fully implemented as written, it will transform the United States health system. This section considers how the content of the legislation was developed. The President and Congress can both formulate legislation. They shared significant roles in the development of the ACA, as did the two main political parties. Stakeholders also played an important role in the development of the bill, including health-care providers, pharmaceutical manufacturers, insurers, businesses and the states.
The President, Congress and the partiesA president’s role is very important in the United States but presidents vary as to the success with which they use their authority and influence. In matters of domestic legislation, such as health care, the president’s influence is more limited (Neustadt, 1991). The president is not like a prime minister who can order the governing coalition in parliament to vote for legislation. A winning coalition in the United States Senate or House of Representatives has to be negotiated for each piece of legislation. Members of both the Democratic Party and the Republican Party can be quite independent of their political party if they choose. Each party is a diverse collection of interests with substantial internal diversity (Marsh et al., 2012a,b). This means that support of the Congressional leadership of the majority party in the Senate and House of Representatives is critical in gathering enough members together to achieve a winning coalition on any piece of legislation (Volden & Wiseman, 2011).
President Obama’s strategy in moving forward with health reform was influenced by former President Clinton’s failed attempt at health-care reform in 1993 (Brown, 2011). From that experience Obama encouraged Congress to take the lead in 2009 and simultaneously ensured that stakeholders with vested interests in health-care reform did not sabotage the effort. This meant allowing Congress to formulate the legislation at the same time as he offered stakeholders incentives to stay committed. The Democrats attempted to secure a few Republican votes for the legislation so that it could be designated as bipartisan but their efforts failed. On only a few of the essential votes leading up to the adoption of the ACA did any Republican members of Congress vote for it.
By the end of 2009, both the House of Representatives and the Senate had adopted health-care reform bills, albeit different versions. In January 2010 the Democratic Party lost a special election held in Massachusetts for a Senate seat, leaving Obama’s party in the Senate one vote short of the number needed to finalize the bill by a straightforward vote. In the end, the Democratic leadership

Health systems in transition United States of America 297
in Congress employed a legislative mechanism called “reconciliation”, generally reserved for budget legislation, in order to pass the final bill (New York Times, 2011).
The Supreme CourtThe Supreme Court is the “referee” in the United States political system. One of its main roles is to judge the constitutionality of final legislation once it is adopted. In November 2011, the Supreme Court announced that it would hear challenges to the ACA brought by a majority of the states (Bravin, 2011; Liptak, 2011). The Supreme Court agreed to rule on the constitutionality of some aspects of the ACA, including the individual mandate and the Medicaid expansion (Baker, 2011b). The Attorneys General of the suing states argued that Congress exceeded its power by requiring that states respect the higher federal eligibility standards or they would lose federal government matching funds for their entire Medicaid programme. The states argued that this violated their sovereignty under the Constitution (Abelson, Harris & Pear, 2011).
In June 2012 the Supreme Court held that the ACA was largely constitutional. The individual mandate requiring most individuals to possess public or private health insurance coverage or pay a penalty was upheld. However, the court argued that in the case of Medicaid expansion, “Congress could not constitutionally force the states to implement a new program under the threat of losing existing program funding” (Jost & Rosenbaum, 2012; Supreme Court of the United States, 2012). Technically the decision did not strike down the Medicaid expansion but instead prevented the HHS from requiring that states participate in it. This left the participation in Medicaid expansion effectively optional for each state. However, many incentives remain for states to expand Medicaid. The federal government agrees to reimburse states for 100% of the cost of new enrollees for the first 3 years, and 90% thereafter. Failure to expand Medicaid could negatively affect state budgets and increase the cost of uncompensated care for states. It would reduce the multiplier effect of federal funds flowing into a state’s economy (Musumeci, 2012). In addition, the Supreme Court’s two major decisions about the law had the unintended effect of making it virtually impossible for many people with incomes below 100% of the poverty level who live in states that don’t fully participate in the Medicaid expansion to obtain health insurance at a price they could afford.
Stakeholders and their inputMany nongovernmental stakeholders affected by the ACA were involved in its development. Health-care providers were “at the table” negotiating the content of the ACA (Hacker, 2011). Physician groups were split, which handicapped

Health systems in transition United States of America298
them (Quadagno, 2011). Conservative state physician associations such as the Texas Medical Association (Austin American-Statesman, 2010) and the left-of-centre Physicians for a National Health Program opposed the ACA for different reasons. But the influential AMA provided limited support at first, later opposed some points, but in the end endorsed both the Senate and the House bills (Hacker, 2011). Physician groups hoped for relief from a very restrictive provision threatening negative annual Medicare physician fee schedule price updates and other revenue enhancing provisions.
The American Hospital Association, the Federation of American Hospitals and the Catholic Health Association agreed to accept $155 billion less in Medicare payments for a period of 10 years. In exchange they expected an increase in revenues of around $171 billion because many more Americans would have insurance and charity care would be reduced (Jacobs & Skocpol, 2010, pp.70–71). Hospitals agreed to a gradual reduction of $50 billion in government payments for treating the uninsured. They also agreed to changes that would reduce federal payments for hospital patient readmissions by about $2 billion. Finally, a lower Medicare payment update to hospitals and other payment cuts were projected to yield $103 billion in savings to the government (Terry, 2009).
Pharmaceutical manufacturers received the assurance that they would not be closely regulated by the government. There would be no price controls on drugs such as those in effect in most other high-income countries. As requested by the pharmaceutical manufacturing sector, the ACA also prohibited United States residents from buying and importing medication from other countries where drugs are less expensive. The volume of drugs sold was anticipated to increase among the working age population as a result of the insurance expansions of the ACA, and among seniors due to more complete coverage under Part D of Medicare. To obtain these benefits the pharmaceutical manufacturers gave up roughly $85 billion in revenues. But they can look forward to “tens of billions of dollars in additional revenue as more people with insurance visit doctors and fill prescriptions” (Abelson, 2010). In the end the pharmaceutical sector accepted the ACA and put around $100 million in to advertising to support its passage (Jacobs & Skocpol, 2010, pp.70–71).
Insurers represented by America’s Health Insurance Plans vacillated but they did not seek to sabotage health-care reform legislation as they had in 1993. In exchange for accepting greater government regulation, they received an assurance that nearly everyone would be required to purchase insurance and that there would be no robust competition from a public sector insurance

Health systems in transition United States of America 299
company. Government support for state-level consumer-controlled insurance cooperatives was not viewed as threatening at this point. HHS initially awarded substantial funds to these organizations. Later, during the implementation of the ACA most of the $6 billion for these Consumer Operated and Oriented Plans (CO-OPs) was rescinded. The new regulations that the insurance companies agreed to were significant in the United States context: some price controls, guaranteed issue (selling insurance to all who sought to buy it even if the individual had pre-existing conditions), modified community rating and the requirement that insurers spend 80 –85% of premiums on patient care – called a medical loss ratio (MLR) (Quadagno, 2011).
The business community was divided. Large employers who self-insure will not have to meet certain requirements of the ACA (Pecquet & Baker, 2011; Linehan, 2010). These and other employers received “grandfathering” status for their health plans as long as they do not make important changes, which meant that they do not have to implement some elements in the ACA immediately. On the other hand, starting in 2015 the law will impose a penalty of about $2000 per employee on employers with more than 50 employees if they do not provide insurance. Small business interests were much more united in their opposition to the ACA.
States as stakeholdersStates are also stakeholders and they too participated in the formulation of the health reform legislation. But the interests of the 50 states are diverse. Some were led by Republican governors while others were led by Democrats. Some states such as Massachusetts and Vermont already had high-performing health systems (as defined by dozens of empirical indicators) while others did not (Commonwealth Fund, 2007; Silow-Carroll & Moody, 2011). The states did not all agree on the goals that the ACA sought to achieve, such as increased access. Some states took their cases against the ACA to the Supreme Court as discussed above. One issue the states did agree on was that the federal government should fund increased costs arising from the adoption of the ACA (Greer, 2011). They lobbied together on this issue though they often disagreed on how federal funds should be divided among the states.
Public involvement in developing the ACAThe role of the public in determining the content of the ACA was less decisive than that of other stakeholders (Cook, 2011). Public interest in health-care legislation was high while it was under consideration and the media focused attention on it (Jacobs & Skocpol, 2010). Overall support for the ACA remained below 50% in 2012 with 41% of Americans favourable to it and 41% unfavourable

Health systems in transition United States of America300
(Kaiser Poll, 2012). At the same time, public approval of specific elements in the legislation was quite high – for example requiring insurance companies to sell insurance to everyone including those with pre-existing medical conditions (Kaiser Family Foundation, 2011j). The majority of the public was, however, set against the idea of the individual mandate (requiring that everyone have health insurance). Only about one-third of the public agreed with the argument that everyone must be included for health insurance to work properly. It is possible, however, that even if they understood this argument they may have disagreed with the mandate for philosophical reasons.
6.2 The Affordable Care Act
The adoption of the Patient Protection and Affordable Care Act (ACA) in the United States in 2010 was a major accomplishment after decades of failed attempts. The scope of those accomplishments is outlined in section 6.2.1 and notable limitations of the ACA are discussed in section 6.2.2. In short, depending on how it is implemented, access to insurance could be improved for many, especially those already ill and those for whom costs are prohibitive. Increased regulation of the health insurance industry was one of the most important accomplishments of the ACA. Mechanisms to control costs and improve quality were also included in the ACA. Yet much was not accomplished: implementation was delayed and many will be left uninsured (some of those with low income, many undocumented immigrants, those who are eligible but do not enrol, those who prefer to pay a penalty rather than buy insurance, those who would have to pay more than 8% of their income to purchase insurance and some individuals with religious objections). In states that do not choose to expand Medicaid, many very poor people will remain without health insurance. Administrators did not receive the power to enforce some important elements of the legislation, as explained in section 6.2.2. below. The absence of a public insurer meant limited competition between the public sector and for-profit sectors in the individual market. A long-term care benefit failed to be implemented even though it was included in the legislation. Many potential mechanisms to control costs were not included.
Accomplishments and limitations of legislation are difficult to analyse in isolation. They are also difficult to analyse before many of the provisions that were enacted have taken effect. Elements of the bill that were designed to control costs were, in some cases, also intended to improve quality. This means that any assessment of the accomplishments of the ACA in discrete

Health systems in transition United States of America 301
categories is difficult and accomplishments necessarily involve overlap across the performance criteria employed. For example, the ACA requires free preventive and screening services that are designed to improve access, control costs and improve quality of care.
6.2.1 Major characteristics of the ACA
This section examines how the ACA is expected to achieve increased access. A combination of new and already existing insurance arrangements is anticipated through: (1) a mandate to have insurance or to purchase it through exchanges; and (2) Medicaid expansion in many states. Low-income Americans benefit most because in 2014 they will receive Medicaid insurance if they live in a state where Medicaid expansion goes forward. Others in this group will receive subsidies for purchasing insurance. The very poor living in states that forgo Medicaid expansion, however, may not benefit.
The section also examines claims by proponents that the ACA was designed to control costs and reduce the national deficit. These measures include greater regulation of insurance pricing, increased competition to lower the price of insurance through the exchanges, reform of payments to Medicare, bundled payment systems and future implementation of the results of several pilot projects. Also reviewed are the policy strategies in the ACA expected to pay for health system reform and at the same time reduce the national deficit.
The ACA included quality improvement measures that are discussed below. Improved medical care may result from the ACA’s emphasis on primary care and ACOs. The use of comparative effectiveness information will be encouraged. Incentive systems in some programmes and pilot research projects will attempt to link quality to outcomes. More information on the best medical care available will be made public and transparency will be encouraged.
In addition, the ACA’s potential impact outside the health sector is reviewed. This includes the elimination of job-lock, reduction of bankruptcy due to health-care bills, reviews of insurance company proposals to increase premiums, and consumer protections.
Early implementation in 2010–2012A number of reform measures in the ACA had already been introduced by the end of 2012. One provision enables 3.1 million young adults to be insured by permitting them to remain on their parent’s health insurance until the age of 26. Also, insurance companies may no longer refuse health insurance to children with pre-existing conditions and MLR limits now restrict the amount
Health systems in transition United States of America302
that insurers spend on administration, marketing, profits and CEO salaries. Additionally the Medicare population now receives free preventive benefits without co-payments and gaps in their medication insurance are closing. Some small businesses receive tax credits for providing employees with insurance. Federal high-risk pools made insurance available to the uninsured until the ACA’s insurance reforms are in place in 2014. There are also temporary special tax credits to many small employers to encourage them to purchase insurance for their employees (Tolbert, 2010). Comparative effectiveness research is being funded and grants for research on innovations on the topics of payments, delivery and organization of health care are being distributed. Many consumer protections are in place already, including the external review of appeals of health insurance company decisions about coverage. A centralized web site to provide consumer information is functional. Some states have received federal funds to establish and/or expand consumer assistance offices (Kaiser Family Foundation, 2011a).
AccessIn 2014 the ACA will require health insurers to sell policies to all those seeking to purchase them (guaranteed issue) at a fixed rate for each age category, with a specific family size and within a regional area (community rating). Community rating within the ACA permits limited differential charges but these are limited to specific and closely defined characteristics: age, family size, geography and tobacco use. The most significant of these is the one regarding age, where the legislation requires that premiums charged to older adults be no more than three times those of younger adults. Discrimination on the basis of gender or health status (an individual’s health history) will not be allowed for plans sold on the insurance exchanges. An annual ceiling of approximately $6250 for OOP costs and premiums for individuals, and $12 500 for families, is also required by the ACA. In 2014 minimum standards as to what must be included in all health insurance plans will go into effect, addressing the problem of the 25 million
“underinsured” – those with less than adequate coverage (Commonwealth Fund, 2010a). States will have an important role in setting up and implementing these standards.
The ACA includes a mandate that every resident must have health insurance starting in 2014. There are exemptions for those with moral or religious objections, for American Indians, for undocumented immigrants, for those in prison, for those who can prove that the lowest cost plan option exceeds 8% of their income, for those whose income is so low that they are not required to file a tax return and for the very poor residing in states that do not expand Medicaid (Kaiser Family Foundation, 2011a).
Health systems in transition United States of America 303
Individuals will obtain health insurance in various ways. Some will acquire it through their employer, others through programmes such as Medicare and the VA. In some states the poor and near-poor individuals and families at or below 138% of the federal poverty level will be eligible for expanded Medicaid insurance (Grogan, 2011). The Supreme Court’s decision in 2012 made Medicaid expansion optional and some states have decided to opt out of this programme, arguing that they cannot afford it, a range of options is available to states. There is no deadline for states to make choices about Medicaid expansion and some may do so at a later date though they may not receive the full array of financial incentives offered to states that expand Medicaid in 2014. Because the funding for expansion is largely the responsibility of the federal government, states have an incentive to participate. “Specifically, for people who become newly eligible for Medicaid under the expansion, the federal government will cover 100% of those costs from 2014 through 2016 and a share declining to 90% of the costs in 2020 and thereafter” (Congressional Budget Office, 2012b, p.9).
It is not entirely certain how much the Supreme Court’s 2012 decision on the Medicaid expansion will reduce access to health insurance for the poor (Congressional Budget Office, 2012b). Estimates suggest that at least 14 states will not participate in the Medicaid expansion in 2014. In several additional states governors support expansion but legislative approval may not be forthcoming immediately (Advisory Board Company, 2013). Some states are likely to expand Medicaid at a later date and they are free to do so. That said, HHS has said that states cannot partially expand Medicaid at the 100% match. While many of the poorest individuals live in states that are not planning to expand Medicaid, those with incomes below 100% of the FPL will remain uninsured, without access to the exchanges for purchasing insurance or federal subsidies to help pay for it. However, those with incomes above 101% of the FPL may meet the requirements for purchasing insurance on the exchanges with substantial federal subsidies in their state (Congressional Budget Office, 2012b, p.11). Individuals may, of course, be exempt from purchasing insurance for other reasons outlined above. Still, the overall effect of a possible Congressional
“drafting error” related to exchanges in this complex legislation – together with the Supreme Court’s unanticipated decision about Medicaid expansion – is to leave some of the very poor in the United States uninsured (Oberlander, 2012a).
Most people in the United States obtain health insurance through their employer. Access to insurance through employers will continue though there is no way of knowing, in advance, how many employers will offer it. Employers with 50 or more full-time employees who do not offer insurance will be obliged to pay a penalty. The same is true if coverage does not meet state standards, if it
Health systems in transition United States of America304
is too expensive for employees to afford or if employers ask new employees to wait more than 60 days for coverage to begin (Tolbert, 2010). Employers with fewer than 50 employees will be encouraged to offer insurance through special tax deductions but they are exempt from penalties.
The ACA includes the mandatory creation of state health insurance exchanges – online markets where private and (in states where they exist) cooperative insurers will compete to sell policies to individuals and small businesses that meet state and/or federal requirements. If states choose not to implement an exchange, the ACA mandates the federal government to step in and make a federal exchange available to the residents of these states. Up to half the states are likely to allow the federal government to run these exchanges for them. Congress must appropriate funds to finance federal administration of the exchanges when states decline to do so or the federal government must find additional funds within existing budgets to finance these activities. Several states are working out a partnership with the federal government to organize and implement an exchange (Mercer, 2013). However, states can change their mind and take over the responsibility at any time in the future. The ACA includes sliding scale subsidies for individuals and families with incomes between 138% and 400% of the federal poverty level to help them purchase insurance through these exchanges. Most individuals making between $14 856 and $44 680 in 2012, and families with incomes between $30 657 and $92 200 are eligible (Sullivan & Stoll, 2010).
The ACA expands access to primary care by increasing funds for local clinics and Federally Qualified Health Centers (Abrams et al., 2011). Close to $11 billion was originally anticipated for these programmes but this was reduced by Congress after the bill was adopted. Nevertheless, in 2011 more than 500 CHCs in 44 states were participating in demonstration programmes related to this initiative (U.S. Department of Health and Human Services, 2011e).
Cost controls and deficit reduction mechanismsThe financial impact of the ACA is fiercely disputed. Proponents contend that it is designed to be revenue neutral. They also argue that cost-control mechanisms have already been implemented and others are scheduled to be put in place. The Congressional Budget Office estimated that an overall reduction in the United States deficit would result from the passage of the ACA (Congressional Budget Office, 2010a,b, 2011). While there is no expectation that the ACA’s policies will lead to dramatic reductions in national health-care costs (Connors & Gostin, 2010; Rice, 2011), proponents hope that the rate of increase in costs will slow (Cutler, Davis & Stremikis, 2009). Opponents of the bill point out that the

Health systems in transition United States of America 305
CBO at one point revised its initial assessment and reported that the bill would incur cost. After the Supreme Court’s decision the CBO once again revised its estimate downward to $1.168 billion for years 2012–2022 (Congressional Budget Office, 2012b). Opponents also worry that some employers will drop employee insurance coverage altogether, preferring to pay the penalty. Whether proponents or opponents are correct is difficult to predict in advance.
Items in the ACA intended to protect against increases in the national deficit include productivity improvement incentives, reductions in subsidies to Medicare Advantage programmes (described in Chapter 3) (Biles, Arnold & Guterman, 2011), penalties paid by hospitals for poor performance (e.g. readmissions) and by large employers who fail to provide workers with adequate insurance. To reduce costs, the law also includes bundled payment systems (explained below), implementation of recommendations of a board independent of Congress to reduce Medicare costs and revenue from a surtax imposed on unearned investment income on wealthy taxpayers. Finally, the law will be financed by a 40% excise tax on high-premium insurance plans, typically characterized by low or no deductibles and co-payments; health industry fees; rate reviews; increased Medicare taxes for the wealthy; and a reduction in payments to Medicare Advantage plans (Congressional Budget Office, 2010b). Numerous pilot projects designed to test measures that, if adopted, could reduce costs were included in the ACA but Congress declined to fund some of the pilots.
An IPAB was established by the ACA legislation and charged with reducing Medicare payments if Medicare expenditures exceed agreed upon limits. If the established targets for cost increases are not met, the IPAB will be called upon to act. The IPAB is to focus on reducing waste and ferreting out areas where cost reductions would improve quality in the Medicare programme. Its recommendations will become law unless they are overridden by Congress in a short period of time. The ACA specifically states that the IPAB cannot ration care, increase taxes or change Medicare benefits (co-payments, deductibles or eligibility requirements). Cost-control mechanisms targeting Medicare are expected to have an impact on the larger health system because Medicare sets an example for private insurers, which sometimes update their own payment schedules when Medicare changes payment methodologies.
The Bundled Payments for Care Improvement programme in the ACA is another policy intended to control costs. It is voluntary and offers physicians, hospitals and other providers a single payment to cover all medical services required to care for a patient for a specific episode of illness (a specific medical

Health systems in transition United States of America306
condition or problem of expected limited duration). Traditionally, providers have been paid separately for each service received by a patient, a practice that some believe increases costs. Initially, this new bundled payment system will be offered by CMS to Medicare providers but could be expanded to the rest of the health system if results are positive (U.S. Department of Health and Human Services, 2011f).
The competitive markets for health insurance – called exchanges – will open in late 2013 in preparation for 1 January 2014 when the mandate goes into effect. They were designed to create price competition among insurers. If the exchanges encourage price comparison, they could lower costs.
Another already implemented cost-control measure in the ACA requires that insurers spend a minimum of 80% (for small insurers) and 85% (for large insurers) of sales revenue on medical care for policy holders. This is called the medical loss ratio (MLR), a term referring to the fact that money spent on medical care, rather than administration, represents a “loss” to insurers (Harrington, Mukamel & Rosenau, 2012). The MLR encourages “health insurance companies to eliminate wasteful administrative spending and increase the value consumers receive for their premium dollars” (Davis, Schoen & Stremikis, 2010; Baker, 2011a). In 2012 insurers that did not keep MLRs below the ACA target refunded $1.1 billion to policy holders (Goodnough, 2012).
Several other elements in the ACA may also lower costs and/or increase government revenue. Flexible spending accounts that allow participating employees to use pre-tax dollars to pay for medical expenses will be reduced. This will increase tax revenues to the federal government as employees in all income brackets will have to pay taxes on more of the income that they spend on health care (Oberlander, 2011).
The ACA encourages states and HHS to undertake rate reviews of insurance companies’ proposed premium increases and to publicize those deemed unfair (Adamy, 2011). It also allocates $250 million over five years to states to review proposed premium increases, thus enabling states to establish rate review boards and strengthen state review committees (Mills, Engelhard & Tereskerz, 2010).
The administrative provisions of the ACA – requirements building on existing legislation such as the Health Insurance Portability and Accountability Act of 1996 (HIPAA) – include measures designed to reduce administrative costs, encourage accurate accounting and promote careful and efficient record
Health systems in transition United States of America 307
keeping. They establish compliance and certification rules that should reduce fraud. Penalties for violations of administrative record keeping are included (Centers for Medicare and Medicaid Services, ndb).
Improving qualityThe ACA contains measures that could improve the quality of care at both the individual patient level and for the population in general by encouraging primary care, prevention, new models of integrated care (such as medical homes), the use of comparative effectiveness information by providers, quality measurement, the reporting of information about quality to consumers and improved medical care itself (Commonwealth Fund, 2010c; Kaiser Family Foundation, 2011k). It also discourages the overuse of medical care (Jacobs & Skocpol, 2010, pp.140–144) and sets forth a national strategy for quality improvement. Increased payments to providers for primary care are designed to encourage medical students to choose these specialties.
ACOs are expected to improve quality by promoting integrated health care in the Medicare programme. Providers and patients are being encouraged to participate on a voluntary basis. These organizations are made up of health-care providers who work in teams and often share a Medicare patient’s medical records to ensure that care is coordinated, that duplication of services and tests is avoided, and that prescription drugs are not harmful. Care is integrated across a range of settings, from doctors’ offices to hospitals and long-term residential care facilities. Individual providers and organizations that participate are rewarded with part of the savings that accrue under the Medicare Shared Savings Program (U.S. Department of Health and Human Services, 2011g). Quality performance of an ACO will be reported publicly so that patients may monitor it (Commonwealth Fund, 2010b). If ACOs work well for Medicare, this programme is likely to expand to the private sector.
The ACA funds comparative effectiveness research. In 2011, the National Health Care Quality Strategy and Plan was prepared and the resulting recommendations reported to Congress for action. This plan will be updated annually (Agency for Healthcare Research and Quality, 2011). The ACA authorizes the collection of data on health-care disparities including race, ethnicity, gender, linguistic minorities, the disabled and those who are underserved because of geographical location (rural and frontier populations).
Both positive and negative financial incentives are being put in place, studied in pilot programmes and demonstrations or set to be implemented. Beginning in 2011, a Center for Medicare and Medicaid Innovation Program was set up to undertake pilot programmes and demonstration projects that reward doctors

Health systems in transition United States of America308
and hospitals for quality health care (Zezza, Abrams & Guterman, 2011). Starting from 2015, the ACA will deny federal payments for Medicaid services that are associated with some hospital-acquired infections. For hospitals with excessive preventable hospital readmissions Medicare reimbursements are reduced. Value-based Medicare payments will link payment with results for physicians, hospitals, skilled nursing facilities, home health agencies and ambulatory surgical centres. The hope is that this will permit Medicare to become an active purchaser of higher quality health services, which could both reduce costs and improve quality of care (Centers for Medicare and Medicaid Services, ndc). Bonus payments to Medicare Advantage plans that provide high quality have been implemented. Greater access to preventive services for Medicare patients could also improve quality (U.S. Department of Health and Human Services, 2011h).
The ACA includes nursing home transparency regulations designed to improve protective services for elderly residents through closer oversight, which could result in better quality nursing home care if consumers and their representatives are vigilant and monitor the information. Nursing home patients will have broader rights to internal and external appeal of decisions by insurers, including coverage denials. The success of these measures depends on the appropriation of adequate funds; such funds are not assured.
Other ACA provisions inside and outside the health sectorThe ACA contains a number of programmes outside the formal health sector. They include: opportunities and benefits for consumers, increased transparency, improved public health, an amplified role for the FDA, support for education of medical staff, increased research funding, an end to job-lock, redistribution of wealth and reduced fraud.
For example, consumer bankruptcy rates could be reduced. Sixty-two per cent of those who plead personal bankruptcy in the United States do so because of medical bills they cannot pay. Seventy-five per cent of those who go bankrupt actually have health insurance (Himmelstein et al., 2009; Abelson, 2009). Because the ACA requires almost everyone to purchase insurance and because it will set standards for insurance policies to be sold on the exchanges, the number of people who go bankrupt because of medical bills is likely to fall. This could lower the burden on bankruptcy courts at the same time as protecting consumers.
Consumer choices of health insurance for those individuals and small businesses that purchase it on the open market are likely to be simplified. Each insurance plan’s co-payments and deductibles are to be explained in
Health systems in transition United States of America 309
understandable language and the differences between the options will be clearly indicated. There will be four levels of insurance on the individual market (and for small businesses) through the exchanges. Each has a different level of protection (actuarial value) with the highest level being the Platinum Plan, which will cover 90% of a purchaser’s health bills. The Gold Plan will cover 80% and the Silver Plan 70%. The Bronze Plan, the cheapest, will cover 60% of the insured individual’s expenses (RAND Corporation, 2010). There is a catastrophic plan, with a high deductible, for those under 30 who could not otherwise afford insurance.
Premiums for each of these different plans will be set by the insurers who will compete on the package and the price at each actuarial level. This means that insurers will have an incentive to bargain with providers for discounts and to limit the services provided where possible. To discourage insurers from picking and choosing which markets they will compete in, all insurers will be required to offer at least one Silver Plan and one Gold Plan within each exchange in which they participate. Insurers will not, however, be required to offer plans at all four levels in every exchange in which they participate.
In 2014, the ACA will require that all health plans sold in exchanges offer basic health benefits but how this is achieved will vary from state to state. There will not be a “single uniform set of ‘essential health benefits’ that must be provided by insurers. Instead, the ACA will allow each state to specify the benefits within broad categories” (Pear, 2011b). Once established at the state level, this basic minimum of services must be covered by all plans (Bronze, Silver, Gold and Platinum). Due to the cost-sharing element, the value of the benefits will vary for the Bronze, Silver, Gold and Platinum plans. Under the ACA, insurance plans must be “equal to the scope of benefits provided under a typical employer plan”. Each state will have the flexibility to define the 10
“categories of ‘essential health benefits’ that must be provided by insurance offered in the individual and small group markets, starting in January 2014” (Pear, 2011b). Basic health benefits and services are required in the following categories: ambulatory patient services; emergency services; hospitalization; maternity and newborn care; mental health and substance use disorder services, including behavioural health treatment; prescription drugs; rehabilitative and habilitative services and devices; laboratory services; preventive and wellness services and chronic disease management; and paediatric services, including oral and vision care. Many health insurance plans will be exempt from some of these requirements. Those plans that are “grandfathered” and employers that self-insure are excused from some, but not all, of the ACA rules.
Health systems in transition United States of America310
A web site was established by the federal government in 2010 to provide consumer information. It already provides multi-dimensional comparative quality ratings for many providers. It is intended to interface with the ACA’s exchanges at the state level starting in 2014 and to assist individuals in determining if they are exempt from the requirement to purchase insurance as well as whether their health insurance plan meets ACA requirements. It is expected to increase transparency as well by providing price information to individuals and small businesses (U.S. Department of Health and Human Services, 2011i). In 2013 the ACA also requires full disclosure of financial relationships between doctors, specialists, hospitals, pharmacists and pharmaceutical manufacturers and distributors of drugs, devices, biological products and medical supplies, which also boosts transparency. www.healthcare.gov
The ACA improves public health in various ways. There is a 10% tax on visits to tanning shops (Fisher & James, 2010). The law includes about $7 billion over five years for prevention and public health programmes such as smoking cessation and efforts to combat obesity. Also important to public health is the requirement that chain restaurants in the United States and vending machine operators display calories for their food products. The ACA assigns new responsibilities to the FDA to regulate and improve food labelling, and to assess and approve generic versions of biological medications.
The ACA also includes provisions for health education and research. It provides medical students with financial incentives to pursue a career in primary care. Training programmes and loan cancellation are offered to those in primary care who agree to work in underserved areas. It provides a range of health professionals with scholarships and loans to further their education. It increases Medicare payments for primary care residency programmes in Federally Qualified Health Centers. Research funding for comparative effectiveness, prevention and emergency medicine is also included.
When fully implemented, the ACA may well end job-lock. Many people who feared changing jobs because someone on their policy had a pre-existing condition are no longer constrained from doing so, because in 2014 insurers will be required to sell insurance to those with pre-existing conditions.
The ACA is redistributive and this may lead to improved population health (Wilkinson, 1996). Firstly, it implicitly redistributes from the healthy to the sick through community rating and guaranteed issue. Second, it redistributes wealth (Rice, 2011). To be deficit neutral, the ACA included fiscal policies that produced revenue to support increases in access through insurance expansion.

Health systems in transition United States of America 311
The redistribution will provide subsidies to the poor, financed by taxes on the wealthy, corporations and medical device manufacturers who will subsidize the less fortunate. The wealthy (defined as individuals with incomes of more than $200 000 per year and families with more than $250 000 per year) will pay 2.35% of their wages to Medicare, an increase from the previous rate of 1.45%. In 2013 the wealthier will also pay a 3.8% tax on unearned income (stock market gains, real estate sales, dividends, annuities, etc.) (Tax Policy Center, 2010).
The ACA includes measures to reduce fraud in health care, a serious problem in the United States. Better screening for patient eligibility and monitoring providers halted many abuses in the Medicare and Medicaid programmes. Auditing has also lowered fraud. Penalties and sentences for criminal activity were also implemented immediately and HHS was authorized to employ the same technology as credit card companies to fight fraud. The Health Care Fraud and Abuse Control Program (HCFAC), in existence prior to the ACA, registered $4 billion in recoveries in 2010. Indictments were increased dramatically. Predicted reductions in costs from the elimination of fraud in the future are approximately $1.8 billion per year to 2015 (U.S. Department of Health and Human Services, 2011j). The ACA promises to further strengthen these efforts.
The ACA includes elements designed to keep the coalition of stakeholder support together over the long period of its implementation. For insurance companies the promise of more business in the form of many more customers who are required to purchase their product is an important incentive (Grogan, 2011). In addition, a risk pool for insurers was an added incentive. This risk pool is designed to guarantee that insurers that receive more than their fair share of enrollees with large claims will be compensated. This is an important protection for insurers because in the United States about 5% of the population consumes half of health-care expenditures (Hall, 2011). In 2014 the ACA will provide tax credits of up to 50% to small businesses (defined as those with fewer than 25 employees with an average wage of less than $50 000) that provide health insurance. As discussed earlier, those with fewer than 50 employees are exempt from new employer responsibility policies.
6.2.2 Limitations of the ACA legislation
Even after the ACA is fully implemented, many will not be insured. Implementation is delayed by waivers and “grandfathering” clauses. No authority was given for follow-through or enforcement of some elements of the ACA. Competition between the private and public sectors is unlikely in

Health systems in transition United States of America312
part because the CO-OPs were defunded midway through their implementation. HHS decided in 2011 that the provision in the ACA for a voluntary insurance programme to help pay for long-term care will not, in fact, be implemented. Aspects of the law designed to control costs were discussed in section 6.2.1.
Uninsured and underinsured groupsThe ACA did not provide an immediate remedy for all the uninsured in the United States. Before the Supreme Court ruling that made the ACA’s Medicaid expansion optional for the states, 32–33 million non-elderly people were expected to gain health insurance because of this law, 94% of the population would have been insured, up from 83% prior to the ACA (Congressional Budget Office, 2010b; Schoen et al., 2011). As a result of the Supreme Court’s decision, an estimated four million fewer individuals will be insured in 2014 (Pear, 2012; Congressional Budget Office, 2012b).
Most of the 30 million who are expected to remain uninsured after the ACA is implemented will be low-income individuals (Zuckerman, Waldmann & Lawton, 2011; Oberlander, 2012a). Many of the uninsured will be undocumented immigrants. They are disadvantaged in several ways. They are not permitted under the terms of the ACA to buy insurance on the exchanges (Congressional Budget Office, 2010b) and if their employers work with the exchanges to insure their employees, undocumented workers will be excluded. Individuals eligible for health insurance that fail to enrol in programmes such as Medicaid will continue to be uninsured. The magnitude of this problem is evident because only 67% of Medicaid-eligible individuals are currently enrolled. Rates of participation vary among the states; for example, it is between 44% in Oklahoma and 88% in Washington DC (Sommers & Epstein, 2010). Another anomaly that results from the Supreme Court’s ruling on the Medicaid expansion is that some of those below 100% of the federal poverty level may not be eligible for subsidies. One hundred per cent of the federal poverty line in 2013 was $11 490 for individuals and $23 550 for a family of four.
The ACA requires those who choose not to purchase health insurance to pay a penalty fee. Some may prefer to pay the penalty as it costs less than an insurance policy. Also exempt from the requirement to purchase health insurance are those for whom it would be unaffordable (costing more than 8% of income). This determination will be based on the price of insurance available on the exchanges. Insurance policies purchased on the exchanges are predicted to be expensive for the poor and for the middle classes. The most generous health insurance plans offered on the exchanges (low deductibles and co-payments) may be too expensive for many. The high deductibles and co-payments of the

Health systems in transition United States of America 313
lower-cost Bronze Plan are associated with adverse outcomes for the very poor (Goodell & Swartz, 2010). Co-payments and deductibles discourage low-income patients from seeking not only inappropriate care but also appropriate care (Nyman, 2008). The ACA will include basic requirements as to what must be included in the health plans sold on the exchanges, which should protect against underinsurance. But insurers are worried about whether they can meet the ACA’s requirements for coverage and still keep insurance affordable.
Waivers and grandfatheringSome elements of the ACA will not go into effect for several years. This deliberate delay resulted in part from budgetary reasons but it was also because of negotiations with stakeholders and legislators.
A “flexible” approach to implementation prevailed. “Grandfathering” of some of the most important sections in the ACA meant that existing health plans did not have to meet new ACA standards for some time. Grandfathering clauses reflect legislators’ desire for a smooth transition (Kaiser Family Foundation, 2011l). While some provisions apply despite grandfathering status, for others, implementation of the ACA will be postponed as long as an employer does not introduce major modifications to its health plan (Carey, 2010).
A second reason for delays in implementation involves the award of waivers by HHS to states, corporations and insurers. Most of these waivers are temporary and lapse on or before 2014. Approximately 1500 waivers were granted in the first one and a half years after the ACA became law (Baker, 2011c). Those receiving waivers argued that the ACA would lead to large premium increases such that they could not continue to offer health insurance to their employees. At least “222 insurers, unions and employers with policies covering 1.5 million people have been granted such waivers, including insurers Aetna and CIGNA, and employers such as McDonald’s, Waffle House and Darden Restaurants” (Appleby, 2010).
The ACA’s implementation includes flexibility. For example, providers balked at the rigour of the administrative rules written by the Obama Administration for the new ACOs. When estimates suggested that only about 5% of physicians were planning to participate in an ACO, the rules were made more lenient, which had the effect of doubling the number of potential participants.
Weak enforcementSome elements of the ACA lack enforcement mechanisms. For example, on the topic of insurance premiums the ACA failed to “grant federal regulators the power to deny increases that are deemed unreasonable” (Mills, Engelhard

Health systems in transition United States of America314
& Tereskerz, 2010, p.900). Proponents of the ACA argue that this authority is needed as some insurers increased premiums for employer-sponsored insurance and reduced benefits once the ACA became law (Aizenman, 2011).
The ACA provides for the establishment of an agency to undertake and fund comparative effectiveness research (discussed above) but it rules out the use of this information in medical practice or by insurers for reimbursement purposes. The ACA also implies a “broad ban on the use of cost-utility analyses”. This information cannot be “construed as mandates for practice guidelines…”. (Neumann & Weinstein, 2010, p.1495).
Weak competition between private and public health insuranceSome ACA supporters contend that the ACA strengthened the private insurance sector and diminished the possibility of real competition between the public and non-profit sectors on one hand and the private sector on the other. This is because the United States insurance sector will be organized largely by the private, for-profit enterprises in future (Grogan, 2011). These proponents believe that this approach could increase costs by reducing the role of private non-profits, which sometimes have lower costs (Rosenau & Linder, 2003). Having one cooperatively owned and managed insurance company in each state could mitigate this effect. The ACA offered the CO-OP Program where consumers were allowed to participate in these private, non-profit, consumer-organized and managed health insurance companies. The ACA included funds for grants and loans to set up CO-OPs amounting to $6 billion (Lopez, 2011). But funding was reduced over time and eventually entirely eliminated in 2013 (Kliff, 2013).
Failure to establish a viable long-term care componentThe ACA included a voluntary and self-financed insurance programme for long-term care called the Community Living Assistance Services and Support (CLASS) Act to help cover the cost of daily needs for the elderly. However, some actuaries calculated that it could not be implemented as it was written. This was because it could not meet the requirement that the programme be self-financing over a period of 75 years (Greenlee, 2011). Voluntary programmes, it was argued, attract those who have the highest probability of making claims in the future (Gitterman & Scott, 2011). Never implemented, the CLASS Act was officially repealed by Congress on 1 January 2013 (Kliff, 2013).

Health systems in transition United States of America 315
6.3 Vulnerabilities during implementation
The law may face substantial stakeholder resistance despite the fact that many stakeholders agreed to cooperate earlier. The ACA is also vulnerable to further legal challenge despite the Supreme Court’s initial decision in June 2012 that it was largely constitutional. As is always true in a democracy, if the political environment changes, the reform may be in jeopardy. Opposition to the ACA remains strong, as are calls to repeal and/or replace it. The constrained financial resources of the federal and state governments could also endanger the future of the ACA. Professionalism and ability to implement programmes vary widely by state, and state cooperation with the federal government is essential if the ACA is to be effective.
6.3.1 Stakeholder resistance
Stakeholders are likely to be affected in different ways by the adoption of the ACA. Even though stakeholders were “at the table” and “struck a deal”, their situation may change during the implementation process and this could test their support of the law.
If the ACA proves to be highly effective in its efforts to contain costs through reductions in payments to providers, the legislation could be vulnerable to disruptive provider revolt. What will happen if physicians or hospitals do not accept Medicaid or Medicare patients? Research suggests that this is unlikely (Sommers, Paradise & Miller, 2011). However, as discussed in Chapter 2, the number of physicians who accept Medicaid patients has declined substantially in recent years (Cunningham & May, 2006).
Another vulnerability of the ACA is related to employer-sponsored insurance. The ACA assumes that most Americans will continue to obtain insurance from their employer, just as they did before the ACA was adopted. However, there has been some suggestion that many employers will drop insurance altogether because it will be cheaper to pay the penalty the ACA imposes on large employers than to offer insurance. To date, between 7% and 10% of employers have indicated that they will stop offering coverage in the next several years but only 2% of companies with more than 1000 employees are likely to do so (Radnofsky, 2012).

Health systems in transition United States of America316
6.3.2 Vulnerabilities due to political will and Republican opposition
The ACA was enacted without bipartisan support in 2010. The Democrats were in favour of it and the Republicans opposed it. The re-election of President Obama in 2012 increased the probability that the implementation will go ahead. The fact that implementation is stretched out over a decade gives most of those affected by it the time to adjust to its provisions but this does not altogether remove political vulnerability.
Republicans have held a majority in the House of Representatives since 2010. They remain opposed to the ACA and some of them continue to speak of repeal though this is unlikely because the Democrats have the majority in the Senate. Some argue that the ACA could increase the budget deficit by billions of dollars and this would have to be recovered by cuts in other programmes (Congressional Budget Office, 2011). Nevertheless, many Republican stakeholder supporters will benefit from the law and they do not favour outright repeal.
The ACA is vulnerable to Congressional delay in its implementation. Under Republican leadership, funding allocations for the ACA implementation in 2011 were reduced (Radnofsky, 2011b). In addition, pilot programmes have gone unfunded. For example, the $50 million set aside by the ACA for testing alternatives to medical malpractice litigation was not appropriated despite protests from the AMA, which supports these pilot programmes. Approximately $25 million that would enhance patient safety met a similar fate. Other programmes that were either not funded or only partially funded include $24 million to access regional emergency care systems. Only $15 million of the $50 million authorized in the ACA to support demonstration programmes in which nurse practitioners manage health clinics was appropriated by Congress. A project to “monitor for-profit nursing home chains and a program to increase use of information technology such as electronic health records in nursing homes” was left with no funding despite ACA authorization (Galewitz, 2011b).
In time the ACA will be even more vulnerable to Congressional funding. If Congress does not release full funding for subsidies for individuals to purchase coverage on the exchanges, many will not be able to buy health insurance as required by the ACA. In addition, the ACA authorized large payments to the states to help them pay for Medicaid expansion. If Congress fails to appropriate these funds Medicaid expansion will be in jeopardy.

Health systems in transition United States of America 317
The ACA is vulnerable to the availability of resources at many other levels. The United States has a large national deficit for which the federal government must account. The states find themselves with inadequate financial resources. Many states cannot legally run a deficit and this limits their ability to participate in many of the ACA programmes that require their funding (Weissert & Weissert, 2006).
The federal budget compromise enacted by Congress in March 2011 reduced funding for many programmes as part of a package of budget cuts required to ensure that the federal government could continue to function in the face of almost unbridgeable differences between Democrats and Republicans. The Obama Administration “diverted some of the $11 billion set aside in the health-overhaul law for health center expansion initiatives and instead used it to keep the existing centers operating at current levels” (Galewitz, 2011b). This could result in a shortage of health-care providers to serve the newly insured in 2014, though some research suggests that the newly insured are likely to continue to use the safety-net providers to which they are accustomed (Katz, 2011).
Negotiations over the “fiscal cliff” crisis in December 2012 led to important reductions in the ACA (Kliff, 2013). The ACA’s carefully constructed budget-neutral accounting is vulnerable on many counts including aggressive stakeholder action. Stakeholders continue to lobby Congress for changes in the legislation. In some cases they would like to revise the commitments that they made to cost reductions during the negotiations that went on while the law was making its way through Congress. However, even small, unanticipated changes in health system financing threaten to upset the ACA’s negotiated balance sheet (Pollack, 2011).
6.3.3 Vulnerability due to dependence on the states
The ACA is vulnerable to the will and ability of the states. The states’ role in the ACA is very large. States may set up exchanges and must manage the Medicaid expansion if they choose to go forward with it, whether fully or in part. They monitor rate reviews of insurers and publicize excessive premium increases (Greer, 2011) (see section 2.2.3). States can “slow down implementation, divert priorities, and entangle the implementation process in legal arguments” (Greer, 2011, p.471).
After the results of the 2012 election, several states in the South indicated that they would not set up and regulate insurance exchanges (Mercer, 2013). The ACA specifies that the federal government will establish an exchange in states that fail to do so. While the funding assistance offered by the federal

Health systems in transition United States of America318
government to the states for administering the ACA is extremely generous, this does not remove its vulnerability to state opposition, some of which is about jurisdictional issues rather than finances (Jost & Hall, 2011). Four states have informed the federal government that they won’t enforce the ACA’s insurance protections for consumers (Galewitz, 2013). In these and a few other states where enforcement of the ACA is not possible at the state level, the Centers for Medicare and Medicaid Services will be responsible for enforcement; however, federal enforcement requires appropriated funds for that purpose. Finally, in some states administrative capacity and technical competence to manage programmes are lacking (Weissert & Weissert, 2006; Greer, 2011).
6.3.4 Low public support for the ACA and low levels of knowledge
Fifty-seven per cent of the population knows little about the content of the ACA and how it will affect them personally, which leaves the law vulnerable to political challenges (Gold, 2013). After enactment, public support for the ACA seldom reached 50% over the course of the first two years. In 2011 a “majority of respondents supported repealing the act – and 40%, in an NBC poll in late 2010, called repeal ‘strongly acceptable’ ” (Kersh, 2011, p.621). Eighteen months after the passing of the bill, 46% of the United States public thought that the ACA had already been repealed or were not sure about this. Only 52% understood that it remained in effect (Brodie et al., 2011b).
A majority of the United States population supports most of the individual elements of the ACA when queried by pollsters. Ninety-two per cent of the population supports setting up exchanges; however, a minority approves of the individual mandate.
The law presupposes an active role for consumers who purchase insurance on the exchanges. Information about insurance choices is more broadly available to consumers in the United States now than before the adoption of the ACA. Extensive data designed to assist consumers in making choices about the quality and cost of health care were made available online, shortly after the adoption of the ACA in 2010. However, research indicates that few people avail themselves of such data when making health-care decisions (Dixon, Greene & Hibbard, 2008; Abaluck & Gruber, 2009). For markets to function properly purchasers must be knowledgeable and informed. If, in the health sector, purchasers and insurance companies do not meet these standards, they may not compete on quality or cost (Morgan & Campbell, 2011, p.390).
Health systems in transition United States of America 319
6.4 The future of the ACA
Policy “take back” is difficult even when legislation is unpopular and the ACA is no exception. It is now the status quo and time is on the side of those supporting health-care reform. Voters and stakeholders become accustomed to the benefits they receive and removing them is increasingly difficult as time passes. Revisions to the ACA will be ongoing; health system reform is never final. There will be unanticipated consequences emerging, as with any law that confronts the real world and interacts with a multitude of variables. Human ingenuity leads to gaming and efforts to get around regulations and rules. In addition, the outcome of policy is difficult to predict and the ACA is no exception. Stakeholder resistance – even to those aspects agreed upon in the negotiations over the contents of ACA – could arise and contractual agreements may be revisited. The courts, possibly even the Supreme Court, could be called to rule about the finer points of the ACA as new legal challenges emerge in the future.
Policy decisions not taken when the ACA was drafted could resurface in the form of new problems. The absence of a robust public insurance plan to compete with the private sector insurers could contribute to less than adequate competition in the health insurance market. Appropriate authority for regulators could require new legislation. Some cost-control mechanisms that were overlooked by the ACA may have to be reconsidered. For example, costs might be reduced through regulatory solutions to the high costs of administration in the United States health system (Bodenheimer & Grumbach, 2012). Pilot programmes, if funded, could point the way to new legislation. The number of individuals remaining uninsured may require attention in the future, especially if the cost of insurance results in many people being exempt from the requirement to purchase it because it would be “unaffordable” for them. The issue of long-term care insurance could also resurface.


7. Assessm
ent o
f the h
ealth system
7. Assessment of the health system
The United States health system has both considerable strengths and notable weaknesses. It has a large and well-trained health workforce and a wide range of high-quality medical specialists, as well as secondary and
tertiary institutions, a robust health sector research programme and, for selected services, among the best medical outcomes in the world. But it also suffers from incomplete coverage, underinsurance and inadequate care for the uninsured. Additional problems include health expenditure levels per person that far exceed all other countries, poor results on many objective and subjective measures of quality and outcomes, an unequal distribution of resources and outcomes across the country and among different population groups, and lagging efforts to introduce health information technology.
Overall, compared to other high-income countries, life expectancy in the United States is lower and mortality is higher, although there is disagreement over whether or not this relatively poor performance on mortality is due to structural problems with the health-care system. Because a myriad of cultural, socioeconomic, environmental, and genetic factors affect health status, it is difficult to determine the extent to which deficiencies are health-system related, though it seems that at least some of the problems with United States performance with respect to health outcomes are a result of poor access to care.
For the future, since the birth rate in the United States is higher than that of most high-income countries, its dependency ratio – those too young or too old to work, divided by the working-age population – is expected to grow more slowly than in most other high-income countries. The budgetary pressure from demographic ageing on paying for social service programmes will therefore be less acute than in most other high-income countries. Nevertheless, given high costs and mixed performance, major concerns about the macro-level efficiency of the United States health system remain.

Health systems in transition United States of America322
7.1 Stated objectives of the health system
The United States does not have a single national health policy act. The country’s Surgeon General has set national voluntary objectives in the Healthy People Initiative. It is a set of ideal objectives that began in the late 1970s. Every 10 years the Surgeon General develops and publishes a list of goals for the United States health-care system and evaluates progress over the previous 10 years. This section reviews the most recent document, Healthy People 2020.
Healthy People 2020 was unveiled in December 2010 by President Obama’s Secretary of Health and Human Services. It has four overall goals relating to higher quality and longer life, health equity, improving social and physical environments, and promoting health behaviours (U.S. Department of Health and Human Services, 2011k).
To evaluate the country’s subsequent success in meeting the goals, system performance is divided into 42 topic areas. These are listed in Table 7.1. These range from prevention and behaviours (e.g. nutrition and weight status, physical activity, tobacco use) to particular diseases (e.g. cancer, heart disease and stroke, HIV) to age groups (e.g. early and middle childhood, adolescents, older adults) to more macro targets (e.g. educational and community-based programmes, environmental health, social determinants of health, global health).
Table 7.1Healthy People 2020 topic areas
Access to health services HIV
Adolescent health Immunization and infectious diseases
Arthritis, osteoporosis, and chronic back conditions Injury and violence prevention
Blood disorders and blood safety Lesbian, gay, bisexual and transgender health
Cancer Maternal, infant and child health
Chronic kidney disease Medical product safety
Dementias, including Alzheimer’s disease Mental health and mental disorders
Diabetes Nutrition and weight status
Disability and health Occupational safety and health
Early and middle childhood Older adults
Educational and community-based programmes Oral health
Environmental health Physical activity
Family planning Preparedness
Food safety Public health infrastructure
Genomics Respiratory diseases
Global health Sexually transmitted diseases
Health Communication and Health Information Technology Sleep health
Health-care-associated infections Social determinants of health
Health-related quality of Life and well-being Substance abuse
Hearing and other sensory or communication disorders Tobacco use
Heart disease and stroke Vision
Health systems in transition United States of America 323
Within each of these topic areas, Healthy People 2020 sets specific objectives. For example, there are 20 sets of objectives related to cancer. One of them is to reduce invasive uterine cancer rates by 10%, from 7.9 new cases per 100 000 women in 2007 to 7.1 new cases by 2020. In the area of nutrition and weight status, one of the 22 sets of objectives is to increase the percentage of schools that do not offer sweetened drinks to students from 9.3% in 2006 to 21.3%.
There is no dedicated funding to meet the Healthy People objectives. They are to be met with existing (and future targeted) funds, which are often considerable. For example, for cancer, the National Cancer Institute – part of the NIH – had funding of over $5 billion in 2010. This is augmented by spending from a number of other federal agencies as well as private philanthropy.
7.2 Financial protection: access and equity
Insurance coverage in the United States is not universal. About 17% of those under the age of 65 do not have public or private health insurance. Those without health insurance – a group, not surprisingly, that is disproportionately represented by those with lower incomes – often do not have a regular physician and are likely to receive free or reduced fee care outside doctors’ offices (e.g. CHCs, emergency departments) or, alternatively, forgo some or all the services or prescription drugs that they need. Paying for care in the absence of insurance can cause financial strain and sometimes bankruptcy.
For the non-elderly in the United States, health insurance is largely tied to employment. Employers, however, are not required to offer coverage (one of several major facets of the system that will change in 2014 if the major provisions of the ACA are implemented). Currently only about half the lower income individuals are eligible for Medicaid coverage. Those who can afford to can try purchasing individual insurance coverage but this is expensive and often unavailable to those with a history of health problems. Moreover, for those with insurance, premiums and cost-sharing requirements have increased rapidly in recent years, causing some to forgo coverage even when employers pay part of the premium.
7.2.1 Insurance coverage and usual source of care
In 2009, it is estimated that there were 50.7 million Americans uninsured at a particular point in time during the year, constituting one-sixth (16.7%) of the total population and about one-fifth of those under the age of 65 years

Health systems in transition United States of America324
(U.S. Census Bureau, 2010a).1 This is up from 40 million people 10 years earlier – a 25% increase in comparison to just a 10% increase in total population.2 One factor responsible for the rise in the uninsured is growth in health-care costs and, most recently, a declining economy. Higher costs simultaneously reduce employer-sponsored coverage and make insurance increasingly difficult for employees and other individuals to afford. An indication of the impact of the declining economy is the fact that the number of uninsured rose by nearly 4.5 million between 2008 and 2009 – from 15.4% to 16.7% in a single year.3
A second factor is the changing nature of employment in the United States. Over the past few decades, there has been a decline in manufacturing jobs and an increase in retail. Accompanying this was a gradual shift towards smaller employers. A parallel shift has been a continued downward trend in unionization in the private sector. Another shift has been the movement from full-time to part-time jobs, and from employment to contractual employment relationship – all of which has contributed to higher rates of uninsurance (Swartz, 2006).
The distribution of the uninsured is skewed towards those who are economically most vulnerable. In 2009, more than one-third of the non-elderly (aged 65 and younger) with incomes below the poverty level 4 were uninsured, as were nearly as many of those between 100% and 200% of the poverty level, compared to just 5% of those whose income exceeded 400% of the poverty level (Fig. 7.1). Coverage varies considerably by race / ethnicity as well (not included in figures). Among those under the age of 65, about 14% of non-Hispanic whites, 21% of African Americans, and 17% of Asians are uninsured. This compares to 32% of Hispanics /Latinos (U.S. Department of Health and Human Services, 2010c, Table 141).
1 The surveys on which these estimates are based include citizens, other legal residents and undocumented residents. These figures do not distinguish between the latter two groups. Other data sources provide some indication of how many of the 50.7 million uninsured are undocumented individuals. The Pew Research Center (2011) estimates that there were 11.2 million undocumented persons in the United States in 2010 making up 3.7% of the population. About 23% of them were from California. Other survey data from the California Health Interview Survey show that in that state, there were 1.17 million uninsured, undocumented individuals (UCLA, 2007). Putting these two data sets together, it would appear that roughly 5 million uninsured in the country are undocumented immigrants. Because official United States sources do not separate the uninsured into those who are legal residents vs undocumented, all figures in this chapter include both groups.
2 Estimates of the number who were uninsured for at least one month over a four-year period increase the total number of uninsured to over 80 million (Short & Graefe, 2003).
3 Rising health-care costs were probably not responsible for too much of this single-year growth in uninsurance since total United States health expenditures rose by only 4% between 2008 and 2009.
4 In 2009, the federal poverty level for a family of four was $20 050. Despite differences in the cost of living, it does not vary by geographical area with the exception of Alaska and Hawaii, which have separate (higher) levels.
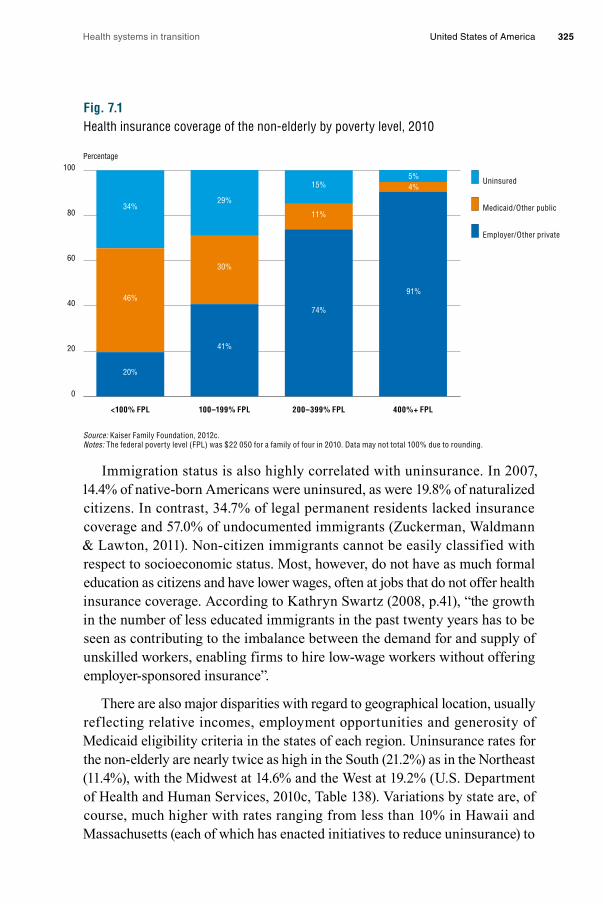
Health systems in transition United States of America 325
Fig. 7.1Health insurance coverage of the non-elderly by poverty level, 2010
Source: Kaiser Family Foundation, 2012c. Notes: The federal poverty level (FPL) was $22 050 for a family of four in 2010. Data may not total 100% due to rounding.
Immigration status is also highly correlated with uninsurance. In 2007, 14.4% of native-born Americans were uninsured, as were 19.8% of naturalized citizens. In contrast, 34.7% of legal permanent residents lacked insurance coverage and 57.0% of undocumented immigrants (Zuckerman, Waldmann & Lawton, 2011). Non-citizen immigrants cannot be easily classified with respect to socioeconomic status. Most, however, do not have as much formal education as citizens and have lower wages, often at jobs that do not offer health insurance coverage. According to Kathryn Swartz (2008, p.41), “the growth in the number of less educated immigrants in the past twenty years has to be seen as contributing to the imbalance between the demand for and supply of unskilled workers, enabling firms to hire low-wage workers without offering employer-sponsored insurance”.
There are also major disparities with regard to geographical location, usually ref lecting relative incomes, employment opportunities and generosity of Medicaid eligibility criteria in the states of each region. Uninsurance rates for the non-elderly are nearly twice as high in the South (21.2%) as in the Northeast (11.4%), with the Midwest at 14.6% and the West at 19.2% (U.S. Department of Health and Human Services, 2010c, Table 138). Variations by state are, of course, much higher with rates ranging from less than 10% in Hawaii and Massachusetts (each of which has enacted initiatives to reduce uninsurance) to
0
20
40
60
80
100
400%+ FPL200–399% FPL100–199% FPL<100% FPL
Uninsured
Medicaid/Other public
Employer/Other private
Percentage
5%4%
91%
15%
11%
74%
29%
30%
41%
34%
46%
20%
Health systems in transition United States of America326
a high of 28% in Texas (the second most populous state in the United States). Two other high-population states, California and Florida, also have very high rates: 21% and 25% respectively (Kaiser Family Foundation, 2011m). All three of these states have relatively high proportions of immigrants, which is partly though not entirely responsible for the high uninsurance rates.
Poor and near-poor children are the one group that has had increasing insurance coverage. Their uninsurance rate is less than half the rate of poor and near-poor parents and adults without children. The rate for poor children, for example, was 17% in 2010, compared to 44% for poor parents and 46% for poor adults without children (Fig. 7.2). The lower rates for poor and near-poor children reflect in part a United States policy initiative – specifically, CHIP. The purpose of the programme, which began in 1997, was to provide insurance coverage for uninsured children whose families had low incomes but whose incomes were not low enough to qualify for Medicaid. Medicaid rules in most states prohibit coverage for adults without children or may make it difficult for adult parents to qualify (except for pregnant women). In contrast, Medicaid income eligibility limits for children are higher than for adults. Moreover, lower income adults often work for small firms and others that typically do not provide health insurance.
In the United States, there is a direct relationship between insurance status and having one’s usual source of medical care as a doctor’s office. Generally, those with private health insurance and Medicare have access to private practices. This is not the case, however, for most of the uninsured and many of those on Medicaid. Because Medicaid pays substantially less than other insurers, particularly in some states, physicians often limit the number of Medicaid enrollees in their practice.
As shown in Fig. 7.3, those who have insurance nearly always have a usual source of care, irrespective of income. In contrast, those who are chronically uninsured (as indicated in the right third of the figure) are far more likely to lack such a source, with figures exceeding 50% for poor adults and 44% for children in poor families.
Having a usual source of care provides a critical entry into the health-care system through access to primary care, preventive services and referrals to specialists. The impact of its absence is illustrated in Fig. 7.4. Colorectal cancer screening rates are three times as high for those with a usual source of care, and rates for Pap smears are twice as high for women aged 40 and older and about 50% higher for women aged 25 and older who have a usual source of care compared to uninsured counterparts.

Health systems in transition United States of America 327
Fig. 7.2Health insurance coverage of low-income non-elderly adults and children, 2010
Source: Kaiser Family Foundation, 2012c.Notes: Children includes all individuals under the age of 19 years. The federal poverty level (FPL) was $22 050 for a family of four in 2010. Data may not total 100% due to rounding.
Fig. 7.3Percentage with no usual source of health care: Community-dwelling individuals by insurance and poverty status, 2003–2004
Sources: McCarthy & Leatherman, 2006; National Center for Health Statistics, 2006 (data).Notes: Poor means income below the FPL. Not poor means income 200% of FPL and above. (Near-poor category omitted for clarity.) Rates for non-elderly adults were age-adjusted to the 2000 United States standard population.
0 20 40 60 80 100 120
Near-poor
Poor
Near-poor
Poor
Near-poor(100–199% Poverty)
Poor(<100% Poverty)
Employer/Other private
Medicaid/Other public
Uninsured
Percentage of Children
Percentage of Parents
Percentage of Adults without children
40%21%40%
46%28%26%
33%20%48%
44%40%16%
13%50%37%
17%69%14%
Percentage
0
10
20
30
40
50
60
Not poorPoorNot poorPoorNot poorPoor
Insured continuouslyall 12 months
Uninsured upto 12 months
Children (ages 0–17)
Non-elderly(ages 18–64)
Uninsured morethan 12 months
5%
11%
2%
9%
21%
34%
10%
29%
44%
56%53%
27%
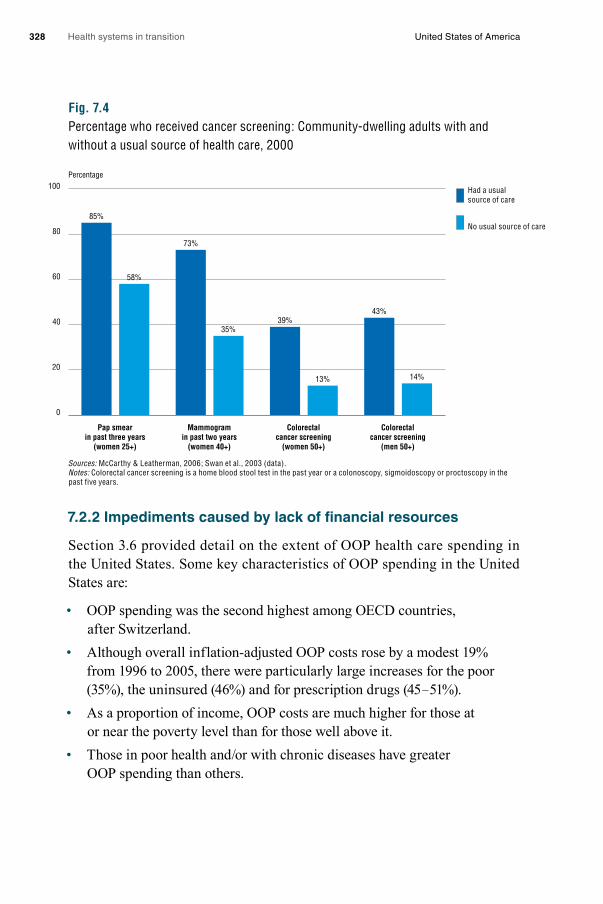
Health systems in transition United States of America328
Fig. 7.4Percentage who received cancer screening: Community-dwelling adults with and without a usual source of health care, 2000
Sources: McCarthy & Leatherman, 2006; Swan et al., 2003 (data).Notes: Colorectal cancer screening is a home blood stool test in the past year or a colonoscopy, sigmoidoscopy or proctoscopy in the past five years.
7.2.2 Impediments caused by lack of financial resources
Section 3.6 provided detail on the extent of OOP health care spending in the United States. Some key characteristics of OOP spending in the United States are:
• OOP spending was the second highest among OECD countries, after Switzerland.
• Although overall inflation-adjusted OOP costs rose by a modest 19% from 1996 to 2005, there were particularly large increases for the poor (35%), the uninsured (46%) and for prescription drugs (45 – 51%).
• As a proportion of income, OOP costs are much higher for those at or near the poverty level than for those well above it.
• Those in poor health and/or with chronic diseases have greater OOP spending than others.
Percentage
0
20
40
60
80
100
Colorectalcancer screening
(men 50+)
Colorectalcancer screening
(women 50+)
Mammogramin past two years
(women 40+)
Pap smearin past three years
(women 25+)
14%
35%
73%
58%
85%
13%
39%43%
Had a usualsource of care
No usual source of care

Health systems in transition United States of America 329
High OOP costs have a number of implications for access to care. As before, the most noticeable pattern relates to insurance status. Figures from United States surveys are examined first, and then from comparative international surveys.
United States data Fig. 7.5 shows the relationship between insurance status and the use of particular services. The most striking figures relate to preventive care, where 42% of the uninsured report obtaining no preventive care, versus just 6% for those with employer coverage or Medicaid. Among the uninsured, 26% report that they did not obtain needed care due to costs and 27% say that they could not afford a prescription drug. By comparison, less than half of those with Medicaid report either of these problems, and less than one-quarter of those with private insurance do so. These figures demonstrate that the critical role Medicaid plays is facilitating access to care among those with low incomes.
Fig. 7.5Barriers to health care among non-elderly adults, by insurance status, 2009
Source: Kaiser Family Foundation, 2012c.Note: a in past 12 months. Respondants who said usual source of care was emergency department were included among those not having a usual source of care.
Not surprisingly, lacking insurance also has other financial consequences. Twenty per cent of the uninsured report using up all or most of their savings to obtain medical care. Fourteen per cent say they are unable to pay for basic necessities due to medical expenses, and 22% report being contacted by a
Percentage of adults (aged 18–24) reporting:
0 10 20 30 40 50 60
Could not affordprescription drug a
Went withoutneeded caredue to cost a
No preventive care
No usualsource of care
13%
6%
26%
6%
6%
27%
42%
9%
55%
11%
11%
4%
Uninsured
Medicaid/Other public
Employer /Other private

Health systems in transition United States of America330
collection agency about their medical bills. In all cases, rates for those with insurance are no more than half of these figures (Kaiser Family Foundation, 2011n).
One final impact is noteworthy: the stage at which a person is diagnosed for particular cancers. In all four cancers shown in Fig. 7.6 – colorectal, lung, melanoma and breast – the uninsured are between two and three times as likely as the insured to be diagnosed at stage III or IV compared to stage I.
Fig. 7.6Diagnosis of late-stage cancer: uninsured vs privately insured
Source: Kaiser Family Foundation, 2012c.
Access to health care has been deteriorating in recent years as a result of higher health-care costs, greater patient cost-sharing and lower insurance rates. Two of the many metrics are examined here: not obtaining prescription drugs and not getting dental care, due to costs. Between 1997 and 2009, the incidence of the former rose from 4.8% to 8.4%, and the latter from 8.6% to 13.3%. Trends for particular sociodemographic groups are more dramatic: their access problems are greater and deteriorating more quickly. Among Hispanics or Latinos with incomes below the poverty level, those forgoing prescription drugs due to costs doubled between 1997 and 2009, from 10.6% to 21.0% – a percentage also more than double the rate for the general population. The
Ratio of probability of diagnosis of late vs. early stage cancer, uninsured/private insurance
0.0
0.5
1.0
1.5
2.0
2.5
3.0
Breast cancerMelanomaLung cancerColorectal cancer
2.9
2.2
2.0
2.3
Workercontribution
Equal likelihood between uninsured and insured

Health systems in transition United States of America 331
fraction of poor Hispanics forgoing dental care due to costs rose from 16.1% to 28.8% over the same time period (U.S. Department of Health and Human Services, 2010c, Table 76).
The percentage of people with problems accessing preventive services has also grown. Rates of breast cancer screening – an area where the United States compares well with other countries, as shown in section 7.3 – have been declining, albeit slightly, in recent years. Age-adjusted mammography screening rates (specifically, having a mammogram in the past two years) for women aged 50 and over declined from 73.7% to 70.3% between 2000 and 2008. Even larger declines were seen for Pap smears within the past three years – from 81.3% to 75.6% over the same period (U.S. Department of Health and Human Services, 2010c, Tables 86 and 87).
Urban and rural areas differ in terms of rates of access to different types of service. The number of doctor visits is nearly identical among those in urban vs rural areas but use of dental services over a 12-month period is 5 to 10 percentage points higher in urban areas for all age groups (U.S. Department of Health and Human Services, 2010c, Tables 79 and 93).
Geographical disparities have been a central health policy issue for decades in the United States. According to the HRSA, “Health Professional Shortage Areas (HPSAs) are designated by the Health Resources and Services Administration as having shortages of primary medical care, dental or mental health providers and may be geographic (a county or service area), demographic (low-income population) or institutional (comprehensive health center, federally qualified health center or other public facility). Medically Underserved Areas/Populations (MUAs) are areas or populations designated by HRSA as having: too few primary care providers, high infant mortality, high poverty and/or high elderly population”.
HPSA and MUA designations “are used by more than 30 federal programmes to identify areas, populations, or facilities eligible to receive federal aid and assistance related to medical underservice” (Salinsky, 2010, p.13). Examples include grants to support primary care services, support for recruitment and training of health-care personnel and higher provider payment under Medicare and Medicaid. For example, all Medicare physician services provided in HCPAs receive a 10% bonus payment.

Health systems in transition United States of America332
International comparisons Comparative international data used in this section are obtained from representative surveys of the general population, sicker adults and primary care physicians conducted by the Commonwealth Fund, a United States-based foundation.5
Compared to seven other developed nations included in the survey, access problems due to the cost of medical care are greater in the United States. Table 7.2 examines sicker adults 6 in 2011 with regard to those (a) not filling a prescription or skipping doses; (b) not visiting a doctor when having a medical problem; and (c) not getting recommended tests, treatments or follow-up visits – all due to costs. Among United States respondents, 42% reported having one of these problems over the past year, which was proportionally 40% higher than any other country and more than twice as high as 7 of the 10 countries.
Table 7.2Cost-related access problems in the past year
Percentage reported: Aust
ralia
Cana
da
Fran
ce
Ger
man
y
Net
herl
ands
New
Ze
alan
d
Nor
way
Swed
en
Swit
zerl
and
Uni
ted
King
dom
Uni
ted
Stat
es
Did not fill prescription or skipped doses
16 15 11 14 8 12 7 7 9 4 30
Had a medical problem but did not visit doctor
17 7 10 12 7 18 8 6 11 7 29
Skipped test, treatment, or follow-up
19 7 9 13 8 15 7 4 11 4 31
Yes to at least one of the above 30 20 19 22 15 26 14 11 18 11 42
Source: 2011 Commonwealth Fund International Health Policy Survey of Sicker Adults in Eleven Countries.
The United States respondents showed the lowest confidence that they would be able to afford care if they were seriously ill, at 58%, but some other countries were close, with three (Australia, Canada and Norway) having figures lower than 70% (Fig. 7.7). Not surprisingly, the United Kingdom, which generally does not charge for most services, had the highest confidence level. The results
5 Seven to eleven countries were included in the surveys, with total samples ranging from 7000 to 20 000. Methodology and results can be found in Davis et al., 2010. In reviewing the results, it should be kept in mind that telephone surveys such as this usually have relatively low response rates – in this case, averaging about 30% across countries. When a chosen sample member was not found to be available, another prospective respondent was chosen for replacement (Schoen et al., 2010).
6 This is defined as being in fair or poor health, having had surgery or been hospitalized in the past two years or having received care for serious or chronic illness, injury or disability in the past year.

Health systems in transition United States of America 333
for Canada may be somewhat surprising and are probably due to the relatively large proportion of expenses (e.g. prescriptions, dental) that is not covered by the provincial health plans.
Fig. 7.7Percentage confidence of being able to afford the necessary care should individuals become seriously ill, selected countries
Source: Schoen & Osborn, 2011.
7.2.3 Waiting times
Table 7.3 shows several indicators of waiting times in 11 high-income countries. It is based on the 2010 Commonwealth Fund survey of individuals aged 18 and over, described above (Schoen et al., 2010). Results are presented from three questions on how quickly respondents saw a doctor or nurse the last time they needed care, the length of waiting time to see a specialist and the length of waiting time for elective surgery.
Percentage
0
20
40
60
80
100
Unite
d St
ates
Unite
d Ki
ngdo
m
Switz
erla
nd
Swed
en
Norw
ay
New
Zea
land
Neth
erla
nds
Germ
any
Fran
ce
Cana
da
Aust
ralia
64%68%
73%70%
81%
75%
69% 70%
78%
90%
58%

Health systems in transition United States of America334
Table 7.3Adults’ experiences with access to health care in 11 high-income countries, 2010
Percentage of adults who:
Saw a doctor or nurse last time they needed care Waited to see a specialist Waited for elective surgery
Same or next day
Waited 6 or more days
Less than 4 weeks
2 months or more
Less than 1 month
4 months or more
Australia 65 14 54 28 53 18
Canada 45 33 41 41 35 25
France 62 17 53 28 46 7
Germany 66 16 83 7 78 0
Netherlands 72 5 70 16 59 5
New Zealand 78 5 61 22 54 8
Norway 45 28 50 34 44 21
Sweden 57 25 45 31 34 22
Switzerland 93 2 82 5 55 7
United Kingdom 70 8 72 19 59 21
United States 57 19 80 9 68 7
Source: Schoen et al., 2010.
The United States performed well internationally with regard to seeing a specialist and getting elective surgery, with waiting times either second or third lowest. Germany performed best on most of these measures and Canada worst. The picture is somewhat different for primary care. The United States ranked 8th out of the 11 countries. Switzerland performed best and Canada worst. The United States rankings are not surprising. Access to specialty care and surgery is relatively high because there are ample resources (of both specialists and equipment for performing procedures) and few restrictions on what and how much medical equipment hospitals, other health facilities and physicians can purchase and own. On the other hand, the United States puts less emphasis than most countries on primary care and has a greater proportion of specialists than general physicians.
7.2.4 Other access issues involving insurers and providers
Two other aspects of access are examined here: troubles with insurers, and access to providers. Beginning with the former, the 2010 Commonwealth Survey asked about two problems dealing with insurers or government payers: (1) spending a lot of time on paperwork or having disputes over medical bills, and (2) having payment denied or having the size of the payment less than expected. The results from 11 countries are shown in Table 7.4. For each of these issues, the United States had the highest level of dissatisfaction, although interestingly, Germany was almost as high on the first measure.

Health systems in transition United States of America 335
Table 7.4Problems with health insurance in the past year (%)
Percentage reported: Aust
ralia
Cana
da
Fran
ce
Ger
man
y
Net
herl
ands
New
Ze
alan
d
Nor
way
Swed
en
Swit
zerl
and
Uni
ted
King
dom
Uni
ted
Stat
es
Spent a lot of time on paperwork or disputes over medical bills
6 6 11 16 8 4 8 3 6 3 17
Health insurance denied payment or did not pay as much as expected
11 12 18 11 15 4 2 2 10 2 25
Yes to either 14 15 23 23 20 6 9 4 13 5 31
Yes to at least one of the above 30 20 19 22 15 26 14 11 18 11 42
Source: 2010 Commonwealth Fund International Health Policy Survey in Eleven Countries.
The poor United States performance is again not surprising. Insurance benefits vary by insurer and co-payments are normally required. Often there are in-network providers vs out-of-network providers, as well as benefit tiers in pharmaceuticals, that can be confusing and are often the source of disputes. Finally, most health insurers are for-profit so there is at least some economic incentive to deny or reduce payment, though such practices, if overbearing, will reduce satisfaction among enrollees and are likely to result in lower enrolment in subsequent years.
Access to providers was discussed in section 3.7 in the context of Medicaid. In short, because programme payments are so low in many states, it is often difficult for Medicaid enrollees to find a physician willing to treat them. In such instances, care is frequently sought from community clinics or hospital emergency departments or physicians who set up payment arrangements rather than dealing with Medicaid.
Thus far, most of the problems accessing privately practising physicians have been experienced by those on Medicaid and the uninsured. However, as already noted, there is concern about growing problems for Medicare beneficiaries. This concern stems, in large part, from the SGR formula for physician fees under Medicare’s FFS programme, which was discussed in section 3.7 and Box 3.4. If Congress does not continue to override the formula – as it has done annually since 2003 – or does not change the formula in a way that leads to higher reimbursements, aggregate Medicare physician payments would plummet, in the order of 30% in 2012, leaving them around the same level as Medicaid’s. While some specialties rely too heavily on Medicare to forgo treating its patients, others that are less dependent might do so. There is no
Health systems in transition United States of America336
obvious “fix” for the problem in the short run, particularly given a strong policy imperative to reduce federal budget deficits. In the long run it is best addressed by successfully containing health-care expenditure increases.
7.2.5 Progressivity of the financing system
The progressivity of a health-care financing system is often measured by whether people with higher incomes and wealth pay a greater proportion of their incomes or wealth towards the financing of health care than do people with less income and wealth. If so, the system is considered to be progressive. If those of lower means pay a higher fraction of their income or wealth to finance health care than do wealthier people, the system is viewed as regressive.
Since the United States does not have a single source of insurance, it is difficult to assess overall progressivity. Such an analysis needs to take into account several types of payment, including premiums for public and private coverage; OOP costs; taxes at the federal, state and local levels; and tax expenditures such as the deductibility of health insurance premiums from taxes. An effort to do so was undertaken by Patricia Ketsche and colleagues (2011).
Overall, it was found that the United States health-care financing system was mildly regressive. On average, Americans paid 15.5% of their incomes towards health care. Interestingly, the proportions of income spent in the four highest quintiles was about the same, varying from 14.8 to 16.0%. The poorest quintile, however, spent more – 22.7% of income.
7.2.6 How the ACA is intended to affect access and equity
There are three major ways in which the ACA is intended to improve access and/or equity. Firstly, private health insurance coverage is expected to increase as a result of the employer and individual insurance mandates, coupled with subsidies provided to purchase health insurance. Secondly, Medicaid coverage is expected to expand as programme eligibility rules are loosened in states that accept federal subsidies for expansion; in those states, all poor and near-poor persons with incomes up to 138% of the federal poverty level will be covered. Combined, the CBO estimated that between 27 and 32 million fewer Americans will be uninsured (Congressional Budget Office, 2012b).7 Thirdly, some of the financing is progressive: individuals with incomes over $200 000, and families with incomes above $250 000, will pay additional payroll taxes and income taxes on their investment incomes to help finance the insurance subsidies and Medicaid expansions.
7 Specifically, CBO estimates that 23–25 million more people will be covered by the exchanges and 10–11 million more by Medicaid, but employers will be covering 4–6 million fewer people.

Health systems in transition United States of America 337
The ACA is also intended to create more equity between people in similar circumstances. This is accomplished in three primary ways. Firstly, unlike the current situation, where about half the poor and near-poor adults (defined here as 138% of the federal poverty level) are ineligible for Medicaid, all such persons will be eligible for coverage in states that elect to accept federal funding for Medicaid expansion. Secondly, the great majority of those whose incomes are too high for Medicaid will be insured. Thirdly, individuals with pre-existing medical conditions or a history of illness will be eligible to purchase insurance and will be able to do so at the same price as others.
7.3 Health outcomes, health services outcomes and quality of care
High quality care and successful health outcomes are the main things that people want from their health-care system. While objective measures are generally viewed as most important, subjective measures are also valued. How people view the care they receive influences how the health-care system will evolve. As noted elsewhere in the book, the managed care “revolution” in the early to mid-1990s resulted in a “managed care backlash” just a few years later, which triggered more reliance on PPOs and less on HMOs, which sometimes employed heavy-handed tactics to manage care.
The United States performs well on some measures of quality and outcomes from an international perspective, while it does not perform so well on others. It is important to stress, however, that these measures are skewed by the access problems discussed in section 7.2. To illustrate, even though overall hospitalization rates are lower in the United States than in most OECD countries, the rate for asthma is the second highest, exceeded only by the Slovak Republic (OECD, 2011). The high United States asthma rate may be due to several factors, including air quality in urban areas or even genetics. A major part of the explanation is that it is probably the result of poor access to primary care, especially among the uninsured, rather than of poor quality of primary care received on a timely basis. This is not to say that quality is not a problem; rather, it shows how quality closely interacts with access to care.
7.3.1 Population health
This section examines both mortality and morbidity, as well as health risks and behaviours, the latter of which may be viewed as determinants of health status. Some of the material reviewed was presented earlier in section 1.4.

Health systems in transition United States of America338
As this book was going to press, a major study, commissioned by the federal government, was released (Woolf & Aron, 2013). Entitled Shorter Lives, Poorer Health, it summarizes and analyses how and why United States performance with regard to health outcomes often does not measure up to the performance of other high-income countries. Some of the study’s findings are summarized in Box 7.1.
Box 7.1Shorter Lives, Poorer Health
In March 2013, a major study of United States performance in the area of health, commissioned by the federal government, was released. Entitled, Shorter Lives, Poorer Health (Woolf & Aron, 2013), it was produced by a panel of experts assembled by the National Research Council and the Institute of Medicine, both part of the National Academy of Sciences, a private, non-profit society of distinguished scholars.
The report presented and analysed evidence on United States performance compared to 16 other high-income countries as well as the reasons explaining why the United States often performed more poorly. Some of the findings include:
• Life expectancy in the United States is lower than in other high-income countries, and this gap has increased over time, particularly for women.
• The gap affects all ages, and nearly all groups of the population, until Americans reach their senior citizen years.
• Nine particular areas of poor performance were identified: birth outcomes, injuries and homicides, early pregnancy and STDs, HIV / AIDS, substance abuse, obesity and diabetes, heart disease, lung disease and disability.
• Two-thirds of the gap in life expectancy is the result of deaths before the age of 50, and for the large majority who do reach that age, they are on average in poorer health than their counterparts in other countries.
• Even among the highest socioeconomic classes, average health outcomes are poorer. No single factor explains most of the differences. Partly it appears to be due to the health-care system, partly to individual behaviours, and partly to socioeconomic and environmental factors.
• With respect to the health system, the United States is strong with respect to cancer screening, and the control of blood pressure and cholesterol. Deficiencies include “systems to manage illnesses with ongoing, complex care needs” (p.132), with particular problems of fragmentation, poor coordination, and miscommunication that leads to medical errors. This is aggravated by the fact that a large portion of the population does not have financial access to primary care.
• Non-health system factors include poor diet, leading to obesity and diabetes, and socioeconomic and environmental factors, including a very high rate of violence-related deaths, particularly among younger cohorts.

Health systems in transition United States of America 339
Mortality United States life expectancy at birth was 77.9 years in 2007. It ranked 26th out of the 31 high-income OECD countries, about two years below the median (see Table 1.4). Since 1970, life expectancy at birth in the United States has increased about seven years. Other countries, however, have increased at a somewhat faster rate. In 1970, the United States figure was almost at the OECD median; it ranked 16th out of 26 countries that had data available for that year.
The reader is referred to section 1.4.1 for a more extensive discussion of United States infant mortality rates and how they compare to the rest of the world. United States rates have declined substantially over the past two decades but not as fast as other countries. As a result, it ranks highest among 31 OECD countries in infant mortality (see Table 1.6). As discussed in Chapter 1, part of the reason may relate to differences in how pre-term births are defined across countries.
There has been much publicity recently on amenable mortality, which is defined as “premature deaths from causes that should not occur in the presence of timely and effective health care” (Nolte & McKee, 2011). They used data from the World Health Organization’s mortality database to assess levels and changes in amenable mortality in 16 high-income countries between 1997/8 and 2006/7. Over 30 causes of death were defined as amenable to health-care interventions, which can be summarized as “childhood infections, treatable cancers, diabetes, cerebrovascular disease and hypertension, and complications of common surgical procedures”. In addition, the authors considered half the deaths from ischaemic heart disease as amenable. For most of these conditions, only deaths occurring before the age of 75 were considered, although in a few instances lower age thresholds were used (e.g. cervical cancer before the age of 45).
Fig. 7.8, adopted from Nolte and McKee by the Commonwealth Fund (2011), summarizes the findings. In the 2006 /7 period, the United States had the highest rate among all countries, which was 75% higher than France, the country with the lowest figure. The United States rate was 16% higher than the United Kingdom, which was 15th of the 16 countries. As was the case for other measures of mortality noted above, the United States rate had decreased over the previous nine years – by 20% – but other countries’ rates declined more quickly. Ireland, which had rates higher than the United States in 1997/8, had the greatest decline (42%) among all of the countries.
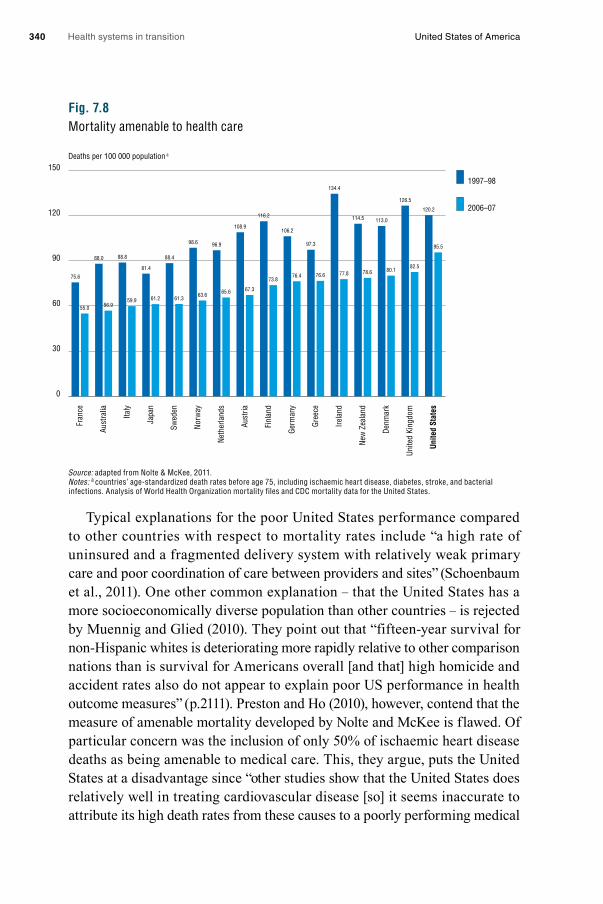
Health systems in transition United States of America340
Fig. 7.8Mortality amenable to health care
Source: adapted from Nolte & McKee, 2011.Notes: a countries’ age-standardized death rates before age 75, including ischaemic heart disease, diabetes, stroke, and bacterial infections. Analysis of World Health Organization mortality files and CDC mortality data for the United States.
Typical explanations for the poor United States performance compared to other countries with respect to mortality rates include “a high rate of uninsured and a fragmented delivery system with relatively weak primary care and poor coordination of care between providers and sites” (Schoenbaum et al., 2011). One other common explanation – that the United States has a more socioeconomically diverse population than other countries – is rejected by Muennig and Glied (2010). They point out that “fifteen-year survival for non-Hispanic whites is deteriorating more rapidly relative to other comparison nations than is survival for Americans overall [and that] high homicide and accident rates also do not appear to explain poor US performance in health outcome measures” (p.2111). Preston and Ho (2010), however, contend that the measure of amenable mortality developed by Nolte and McKee is flawed. Of particular concern was the inclusion of only 50% of ischaemic heart disease deaths as being amenable to medical care. This, they argue, puts the United States at a disadvantage since “other studies show that the United States does relatively well in treating cardiovascular disease [so] it seems inaccurate to attribute its high death rates from these causes to a poorly performing medical
Deaths per 100 000 population a
0
30
60
90
120
150
Unite
d St
ates
Unite
d Ki
ngdo
m
Denm
ark
New
Zea
land
Irela
nd
Gree
ce
Germ
any
Finl
and
Aust
ria
Neth
erla
nds
Norw
ay
Swed
en
Japa
n
Italy
Aust
ralia
Fran
ce
1997–98
2006–07
75.6
55.0
88.0
56.9
88.8
81.4
88.4
98.6 96.9
108.9
116.2
106.2
97.3
134.4
114.5 113.0
126.5
120.2
95.5
82.580.178.677.876.676.4
73.8
67.365.663.661.361.259.9
Health systems in transition United States of America 341
system”. Preston and Ho also question other inclusion criteria. For example, prostate cancer is not included as amenable even though survival rates in the United States are reportedly over 99%, higher than other countries.
The question of central importance to health policy analysts is the extent to which the United States health-care system, in and of itself, is responsible for the poor United States showing. Not surprisingly – especially in light of the difficulties in securing comparable cross-national data and disentangling causal relationships in the absence of randomized controlled studies – the question is difficult to resolve.
Part of the explanation for the poor United States performance is probably related to problems associated with access to health care. But once a person has access to the United States system, how well does it perform? There is a divergence of opinion on this as well. Docteur and Berenson (2009), reviewing a variety of diseases, find that United States performance compares well internationally in some areas (e.g. cancer screening and survival) and worse in others (e.g. asthma, medical errors), and conclude that the “overall evidence is mixed, indicating that the United States has neither the best nor the worst quality of health care for particular conditions among high-income countries” (p.4).
Research by Preston and colleagues reaches a more positive conclusion on the performance of the United States system. For the two leading chronic diseases – cancer and heart disease – United States performance rates are very high. For example, five-year survival rates for each of eight cancers are higher in the United States than in Europe, exceeding Europe on average by over 20 percentage points for prostate cancer and over 10% for breast cancer (Preston & Ho, 2010). For heart disease, the evidence is less definitive but more Americans use more cholesterol-lowering drugs and heart medications, and are more likely to obtain treatment when they have high blood pressure, than Europeans (Crimmins, Preston & Cohen, 2011).
In a book co-edited by Preston and released by the National Research Council of the National Academies of Science, a panel of experts examined the reasons for the low and declining performance of the United States system with respect to mortality rates (Crimmins, Preston & Cohen, 2011). Interestingly, it concluded that the major reason was smoking. While the United States is known for having among the world’s lowest smoking rates, this was not the case through the 1970s, when it “had the highest level of cigarette consumption rate per capita in the developed world over a 50-year period ending in the mid-1980s” … leaving “an imprint on mortality patterns that remains visible as heavy-smoking persons age” (Preston & Ho, 2010, p.2). This, the authors
Health systems in transition United States of America342
believe, is the main reason why mortality rates, especially among women, have diverged from those of other countries. Smoking, they conclude, constituted 78% of the differential changes in mortality for women and 41% for men. The second most important reason cited was differential obesity rates, accounting for 20–33% of the difference (Crimmins, Preston & Cohen, 2011).8
However, the more recent synthesis by the National Research Council and the Institute of Medicine, highlighted in Box 7.1, reaches a different conclusion (Woolf & Aron, 2013). While Preston and Ho’s smoking findings may explain
“shorter life expectancy of adults age 50 and older, … they do not explain the lower life expectancy observed in younger people. The U.S. health disadvantage before age 50 has worsened over the same time that smoking prevalence rates in this population have decreased” (p.143).
While researchers disagree, the overall conclusion of this latter synthesis of the evidence (Woolf & Aron, 2013) is that the United States performs worse than other countries, particularly for mortality among people under the age of 50, and does not compare favourably to other countries until about the age of 65. More research on the topic is necessary before definitive conclusions can be drawn.
Morbidity Since the 1990s, most measures of morbidity have improved or remained steady in the United States. Trends for selected diseases and other measures of health status are noted here. Unless otherwise stated, all data are from U.S. Department of Health and Human Services (2010c). The data include a combination of self-reported rates and those obtained through health examinations, as indicated below.
Heart disease: prevalence rates (self-reported) rose slightly for men between 1997 and 2008 but declined fairly considerably (by 11%) for women so overall rates declined somewhat. Rates are probably declining due to a combination of reduced risk factors (e.g. lower cholesterol, blood pressure and smoking) and improved medical treatments.
Stroke: rates (self-reported) showed an opposite pattern – men’s prevalence rates were fairly steady but women’s rose by about 30%, and thus, overall rates rose by about 17%. Increases in stroke are particularly noteworthy among younger people. Prevalence rates for those aged 18 – 44 increased by over 40% over this 11-year period; they doubled for women of this age. It is also reported
8 Muennig and Glied (2010) reject the hypothesis that obesity could be responsible for the increasing discrepancy between the United States and other OECD countries because the rate of growth in obesity in the United States is lower than in several other countries the authors examine.

Health systems in transition United States of America 343
that over a 20-year period, rates tripled for women aged 35–54 while men’s rates were steady (Towfighi, Zheng & Ovbiagele, 2010). A major cause of the increase appears to be increases in overweight and obesity. Rates are also increasing for children, mainly for the same reasons but also, most likely, due to advances in the accurate diagnosis of stroke (George et al., 2011).
Cancer: overall cancer prevalence rates (self-reported) increased by 20% between 1997 and 2008. The increase is concentrated among adults aged 45 and older, with rates steady for younger adults. One needs to interpret these trends with care for several reasons: trends vary considerably by site of cancer, trends are highly dependent on the time interval examined and whether incidence or prevalence is being reported, some of the increase is due to increased diagnosis rather than increases in cancer itself (for example, prostate cancer), and lower death rates from cardiovascular diseases make it more likely a person will develop cancer before they die. It is therefore difficult to make general statements about the prevalence trend, other than to say that in general, cancer death rates have been declining for most types of cancer in recent years. This will be discussed in greater detail in section 7.3.3.
Diabetes: rates rose by 20% between 1988/94 and 2005/08. Of the 10.9% of the population aged 20 and older who were estimated to have diabetes in the most recent period, only 7.9% reported to have received this diagnosis from a physician. Rather, they were found to have the disease through a health examination survey conducted by the United States government. Undiagnosed diabetes fell by 17% over this period, but diagnosed diabetes rose by 44%. Much of the increase is attributed to overweight and obesity, which usually stem from a high caloric diet and/or lack of physical activity.
Children’s health: children’s asthma rates have been steady over the last decade. One probable reason why they have not increased is that, unlike adults, children’s uninsurance rates have not increased, as a result of CHIP. Rates for attention deficit hyperactivity disorder rose almost 40% and autism rates are skyrocketing, as they are in many parts of the developed world. It is still unknown whether these increases in children’s developmental and psychological problems are entirely the result of more reporting of existing conditions or if there are environmental or other triggers. Dental health has improved, with a reduction in untreated dental caries among children of nearly 50% between 1988/94 and 2005/08.
It should not be concluded that children’s health in the United States is poor. In 2009, only 1.8% of children below the age of 18 were reported to be in fair or poor health, a decline from 2.6% in 1995.
Health systems in transition United States of America344
Self-reported health status: this has also been increasing among adults. The percentage of those reporting good health has declined slightly among those aged 25–54, but those who are older report improvement. Among those aged 65 and older, the proportion reporting fair or poor health declined from 28% to 24% between 1995 and 2009.
Overall, self-reported health status is very high in the United States compared to other countries, with 90% of the population reporting “good” or
“better” health in 2009. The only other OECD country with comparable rates is Canada (OECD, 2011). It is difficult to fully understand the meaning of these international comparisons since language and culture are likely to play a large part in people’s responses.
Health risks and behaviours Section 1.4 presented statistics on several health risks and behaviours, including smoking (Tables 1.10 and 1.12), diabetes, high cholesterol, overweight / obesity, untreated dental caries (Table 1.11) and alcohol use (Table 1.13). Compared to the other high-income OECD countries (N = 31), the United States ranks:
• 25th in alcohol consumption, a drop from around the median in 1970• among the four countries with the lowest percentage of the population
who smoke (reliable cross-national data over long periods of time are not available)
• first in overweight and obesity (cross-national data were not available before 2000).
Hypertension rates,9 defined either as having high blood pressure or taking antihypertensive medicine, rose from 26% to 31% from 1988/94 to 2005/08. Some of this increase may be due to increased awareness and diagnosis of existing hypertension, though increasing obesity is also a causal factor (Kotchen, 2007). Control of hypertension has improved, however, with 59% of hypertensives having uncontrolled blood pressure, compared to 77% in the earlier period.
High cholesterol,10 which includes either having a high reading or taking cholesterol-lowering medication, shows a similar pattern, having risen from 23% in 1988/94 to 28% in 2005/08. Again, both obesity and as increased diagnosis may be related to the increase.
9 Hypertension is defined as a systolic pressure of at least 140 mmHg, or diastolic pressure of at least 90 mmHg.
10 High cholesterol is defined as at least 240 mg/dL.

Health systems in transition United States of America 345
Finally, while Americans do not show high amounts of physical activity, the amount has risen over time. The United States has developed guidelines for what is considered adequate engagement in aerobic and muscle-strengthening activities.11 The percentage of adults who meet both the aerobic and strengthening guidelines rose from 14% to 19% between 1998 and 2009, while the percentage meeting neither fell from 57% to 49%.
7.3.2 Objective measures
Voluminous data exists on outcomes and quality of care in the United States. To keep the presentation and discussion manageable, the focus is on indicators where cross-national comparisons are available. The discussion is divided into three sections: prevention and screening, cancer-survival rates and asthma admissions. Unless otherwise noted, all data are from OECD (2011).
Prevention and screening Beginning with immunizations, Table 7.5 shows immunization rates among the high-income OECD countries for four diseases: diphtheria, tetanus and pertussis (DTP); measles, hepatitis B and influenza. The first three show the percentage of children immunized; for influenza it is the percentage of the population aged 65 and older. Rates shown are for the most recent year available (usually, 2009).
The United States rates are: DTP, 84%; measles, 90%; hepatitis B, 92% and influenza, 67%. The DTP rate is noteworthy in that it is the second lowest among all the countries. The United States is also among the lower half of countries for measles and hepatitis B. It is, however, among the countries with the highest rates for influenza.
Healthy People 2020 sets goals for these immunization rates. For each disease, the goal is 90% compliance. United States rates exceed the goal for hepatitis B; equal it for measles; and are somewhat lower for DTP. In the last few years, some American families have feared that childhood vaccinations could lead to autism, though there is no scientific support for this hypothesis. Public health officials worry that this will lead to reduced immunization rates, but any resulting downturn in the rates is small. From 2005 to 2009, DTP vaccination rates declined from 86% to 84%, although it is not possible to determine the cause (U.S. Department of Health and Human Services, 2010c).
11 For definitions, see Table 70, note 1, at: http://www.cdc.gov/nchs/data/hus/hus10.pdf#listtables
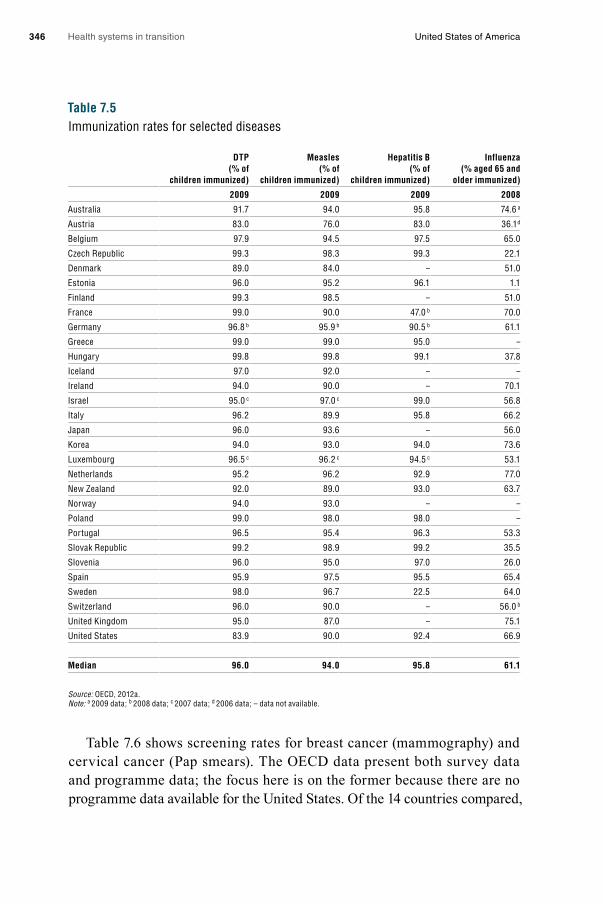
Health systems in transition United States of America346
Table 7.5Immunization rates for selected diseases
DTP (% of
children immunized)
Measles (% of
children immunized)
Hepatitis B (% of
children immunized)
Influenza (% aged 65 and
older immunized)
2009 2009 2009 2008
Australia 91.7 94.0 95.8 74.6 a
Austria 83.0 76.0 83.0 36.1 d
Belgium 97.9 94.5 97.5 65.0
Czech Republic 99.3 98.3 99.3 22.1
Denmark 89.0 84.0 – 51.0
Estonia 96.0 95.2 96.1 1.1
Finland 99.3 98.5 – 51.0
France 99.0 90.0 47.0 b 70.0
Germany 96.8 b 95.9 b 90.5 b 61.1
Greece 99.0 99.0 95.0 –
Hungary 99.8 99.8 99.1 37.8
Iceland 97.0 92.0 – –
Ireland 94.0 90.0 – 70.1
Israel 95.0 c 97.0 c 99.0 56.8
Italy 96.2 89.9 95.8 66.2
Japan 96.0 93.6 – 56.0
Korea 94.0 93.0 94.0 73.6
Luxembourg 96.5 c 96.2 c 94.5 c 53.1
Netherlands 95.2 96.2 92.9 77.0
New Zealand 92.0 89.0 93.0 63.7
Norway 94.0 93.0 – –
Poland 99.0 98.0 98.0 –
Portugal 96.5 95.4 96.3 53.3
Slovak Republic 99.2 98.9 99.2 35.5
Slovenia 96.0 95.0 97.0 26.0
Spain 95.9 97.5 95.5 65.4
Sweden 98.0 96.7 22.5 64.0
Switzerland 96.0 90.0 – 56.0 b
United Kingdom 95.0 87.0 – 75.1
United States 83.9 90.0 92.4 66.9
Median 96.0 94.0 95.8 61.1
Source: OECD, 2012a.Note: a 2009 data; b 2008 data; c 2007 data; d 2006 data; – data not available.
Table 7.6 shows screening rates for breast cancer (mammography) and cervical cancer (Pap smears). The OECD data present both survey data and programme data; the focus here is on the former because there are no programme data available for the United States. Of the 14 countries compared,

Health systems in transition United States of America 347
Table 7.6Cancer screening rates, 2008
Mammography screening survey data (% of females aged 50–69 screened)
Cervical cancer survey data (% of females aged 20–69 screened)
Austria 43.1 3a 81.5 3a
Canada 72.5 75.3
Czech Republic 57.8 43.0
France 76.7 72.4
Greece 53.8 59.4 3a
Israel 66.9 1b –
Italy 71.0 75.0
Japan 23.8 2c 24.5 2c
Korea 54.5 60.3
Netherlands 88.6 68.8
New Zealand 76.5 2c 79.6 2c
Slovenia 47.2 79.8 2c
Spain 71.8 73.0
United States 81.1 85.9
Median 71.4 72.7
Source: OECD, 2012a. Note: a 2006 data; b 2009 data; c 2007 data; – data not available.
the United States has the highest mammography (cancer screening) rate for women aged 50–69, at 81%, and (among 13 countries) the highest cervical cancer screening rate for women aged 20–69, at 86%.12
Cancer survivalCancer survival is often considered a good measure of the quality of a medical care system because high survival rates are related both to preventive (screening) care and to treatment success. Table 7.7 shows cancer survival rates for three types of cancer that are amenable to treatment when detected early: breast, cervical and colorectal cancers. The United States has been very successful with regard to breast cancer treatment, in part due to the high mammography screening rate shown in Table 7.6. The five-year survival rate, 77%, is highest (along with Iceland) of the 16 countries shown. It is noteworthy, though, that with the exception of Belgium, every country had a survival rate of 70% or higher.
12 Healthy People 2020 does not set out specific goals for mammography and Pap smear screening; instead it has goals for the percentage of women who are counselled about screening by their providers.

Health systems in transition United States of America348
Table 7.7Cancer survival rates, 2003
Breast cancer 5-year observed survival rate
(age-standardized)
Cervical cancer 5-year observed survival rate
(age-standardized)
Colorectal cancer 5-year observed survival rate
(age-sex standardized)
Austria 73.6 61.8 53.1
Czech Republic 65.8 58.3 40.0
Denmark 69.4 56.9 42.0
Finland 76.4 63.1 52.9
Germany 73.5 59.5 51.7
Iceland 77.4 50.9 53.4
Ireland 69.8 55.2 44.8
Israel 75.2 66.8 57.0
Korea 72.0 73.4 55.0
Netherlands 74.2 64.8 51.4
New Zealand 73.2 63.2 52.2
Norway 75.0 69.4 51.2
Slovenia 71.5 65.5 45.0
Sweden 75.9 62.5 51.8
United Kingdom 69.7 54.8 45.2
United States 77.4 60.1 54.6
Median 73.5 62.2 51.7
Source: OECD, 2012.
The United States survival rate for cervical cancer of 60% is near the median of the 16 countries. In contrast, for colorectal cancer, with a five-year survival rate of 55%, the United States ranks at the top of the list along with Austria, although most countries have percentage rates in the low 50s.
Asthma admissions Table 7.8 shows that the hospital admission rate for asthma in the United States is the second highest among the high-income OECD countries, at 121 per 100 000 population, with only the Slovak Republic higher. As noted earlier, this is probably the result of a high uninsurance rate and poor preventive care.
7.3.3 Subjective measures
Although objective measures of outcomes and quality might normally be considered the “gold standard”, there are two reasons why subjective measures need to be considered as well. Firstly, perceptions do matter. If a patient or a physician believes that the care provided or some other aspect of a health-

Health systems in transition United States of America 349
care system is below par, this is a legitimate indicator of quality.13 Secondly, for many measures of quality, objective data are not generally available. An example is medical errors. While studies of the prevalence of error rates have been conducted in some countries, they use different methodologies and time periods and generally are not comparable.
Table 7.8Asthma admission rates, 2009
Rate per 100 000 population (age–sex standardized)
Australia 66.6
Austria 52.8
Belgium 48.4
Canada 15.7
Czech Republic 37.0
Denmark 36.5
Finland 75.9
France 43.4
Germany 20.8
Hungary 35.1
Iceland 33.3
Ireland 43.5
Israel 68.4
Italy 19.2
Japan 58.3
Korea 101.5
Netherlands 27.5
New Zealand 80.7
Norway 47.6
Poland 68.9
Portugal 15.1
Slovak Republic 166.8
Slovenia 38.1
Spain 43.9
Sweden 19.3
Switzerland 30.9
United Kingdom 73.7
United States 120.6
Median 45.5
Source: OECD, 2012a.
13 Economists, for example, generally view societal welfare based on the sum of individuals’ “utilities”, which are subjective measures of well-being.

Health systems in transition United States of America350
The leading source of subjective data for international comparisons is the Commonwealth Fund, using annual surveys of patients or physicians that have been conducted in up to 11 countries since 2007. The surveys are described in greater detail in section 7.2.3. The 2011 survey focused on sicker adults (defined as being in fair or poor health, having had surgery or been hospitalized in the past two years, or having received care for serious or chronic illness, injury or disability in the past year). The 2011 survey examined four aspects of care quality: care coordination and transitions; patient safety; doctor–patient relationships and patient activation; and managing chronic conditions.
Table 7.9 examines three aspects of care coordination. Compared with the other countries, sicker adults in the United States had the highest rate of problems with test results or records not being available when they saw their doctor, or having duplicate tests ordered. The United States ranked in the bottom half with regard to providers not sharing important information with each other and it ranked around average on problems associated with miscommunication between primary care and specialist physicians. Switzerland and the United Kingdom ranked best in all three measures.
Table 7.9Coordination problems in the past two years
Percentage reported: Aust
ralia
Cana
da
Fran
ce
Ger
man
y
Net
herl
ands
New
Ze
alan
d
Nor
way
Swed
en
Swit
zerl
and
Uni
ted
King
dom
Uni
ted
Stat
es
Test results/records not available at appointment and/or duplicate tests ordered
19 25 20 16 18 15 22 16 11 13 27
Providers failed to share important information with each other
12 14 13 23 15 12 19 18 10 7 17
Specialist did not have information about medical history and/or regular doctor not informed about specialist care
19 18 37 35 17 12 25 20 9 6 18
Source: Schoen & Osborn, 2011.
Table 7.10 examines errors as a measure of patient safety. Four metrics are shown: patient believes that he or she received the wrong medication or dose, that there was a medical mistake made in treatment, that there were incorrect test results, or there were delays in obtaining abnormal test results. In all four measures, the United States ranked near the bottom among the 11 countries. Twenty-two per cent of sicker American adults experienced one of

Health systems in transition United States of America 351
these problems in the previous two years, a number exceeded only by Norway and tied with New Zealand. As before, Switzerland and the United Kingdom performed best, with fewer than 10% indicating that they experienced one of the problems.
Table 7.10Medical, medication or laboratory test errors in the past two years
Percentage reported: Aust
ralia
Cana
da
Fran
ce
Ger
man
y
Net
herl
ands
New
Ze
alan
d
Nor
way
Swed
en
Swit
zerl
and
Uni
ted
King
dom
Uni
ted
Stat
es
Wrong medication or dose 4 5 6 8 6 7 8 5 2 2 8
Medical mistake in treatment 10 11 6 8 11 13 17 11 4 4 11
Incorrect diagnostic/laboratory test results a
4 5 3 2 6 5 4 3 3 2 5
Delays in abnormal test results a 7 11 3 5 5 8 10 9 5 4 10
Any medical, medication, or laboratory errors
19 21 13 16 20 22 25 20 9 8 22
Source: Schoen & Osborn, 2011.
Doctor–patient relationships and communication are examined in Table 7.11. Figures did not vary much across countries with respect to whether doctors spent enough time with respondents, with the United States near the middle and the Scandinavian countries at the lower end. The United States performed well internationally on the other measure – doctors encouraging questions and doing a good job at explaining things – ranking third behind Switzerland and the United Kingdom.
Table 7.11Doctor–patient relationship and communication
Percentage reported regular doctor always/often: Au
stra
lia
Cana
da
Fran
ce
Ger
man
y
Net
herl
ands
New
Ze
alan
d
Nor
way
Swed
en
Swit
zerl
and
Uni
ted
King
dom
Uni
ted
Stat
es
Spends enough time with you 85 77 82 86 87 87 71 70 88 87 81
Encourages you to ask questions and explains things in a way that is easy to understand
69 59 53 64 54 67 31 41 77 77 71
Always/often to both 66 54 50 61 52 65 27 37 73 72 65
Source: Schoen & Osborn, 2011.
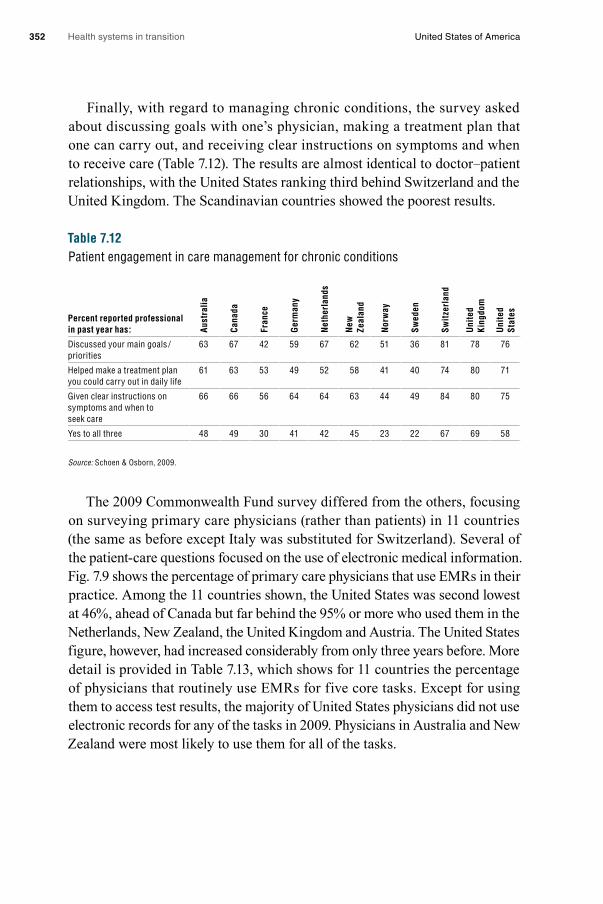
Health systems in transition United States of America352
Finally, with regard to managing chronic conditions, the survey asked about discussing goals with one’s physician, making a treatment plan that one can carry out, and receiving clear instructions on symptoms and when to receive care (Table 7.12). The results are almost identical to doctor–patient relationships, with the United States ranking third behind Switzerland and the United Kingdom. The Scandinavian countries showed the poorest results.
Table 7.12Patient engagement in care management for chronic conditions
Percent reported professional in past year has: Au
stra
lia
Cana
da
Fran
ce
Ger
man
y
Net
herl
ands
New
Ze
alan
d
Nor
way
Swed
en
Swit
zerl
and
Uni
ted
King
dom
Uni
ted
Stat
es
Discussed your main goals /priorities
63 67 42 59 67 62 51 36 81 78 76
Helped make a treatment plan you could carry out in daily life
61 63 53 49 52 58 41 40 74 80 71
Given clear instructions on symptoms and when to seek care
66 66 56 64 64 63 44 49 84 80 75
Yes to all three 48 49 30 41 42 45 23 22 67 69 58
Source: Schoen & Osborn, 2009.
The 2009 Commonwealth Fund survey differed from the others, focusing on surveying primary care physicians (rather than patients) in 11 countries (the same as before except Italy was substituted for Switzerland). Several of the patient-care questions focused on the use of electronic medical information. Fig. 7.9 shows the percentage of primary care physicians that use EMRs in their practice. Among the 11 countries shown, the United States was second lowest at 46%, ahead of Canada but far behind the 95% or more who used them in the Netherlands, New Zealand, the United Kingdom and Austria. The United States figure, however, had increased considerably from only three years before. More detail is provided in Table 7.13, which shows for 11 countries the percentage of physicians that routinely use EMRs for five core tasks. Except for using them to access test results, the majority of United States physicians did not use electronic records for any of the tasks in 2009. Physicians in Australia and New Zealand were most likely to use them for all of the tasks.

Health systems in transition United States of America 353
Fig. 7.9Doctors use electronic patient medical records a
Source: Commonwealth Fund, 2012. Note: a Not including billing systems.
Table 7.13Practice use of IT on a routine basis for core tasks
Percentage reporting routine: Aust
ralia
Cana
da
Fran
ce
Ger
man
y
Ital
y
Net
herl
ands
New
Ze
alan
d
Nor
way
Swed
en
Uni
ted
King
dom
Uni
ted
Stat
es
Electronic ordering of laboratory tests
86 18 40 62 91 6 64 45 81 35 38
Electronic access to patients’ test results
93 41 36 80 50 76 92 94 91 89 59
Electronic prescribing of medication
93 27 57 60 90 98 94 41 93 89 40
Electronic alerts/prompts about a potential problem with drug dose/interaction
92 20 43 24 74 95 90 10 58 93 37
Electronic entry of clinical notes 92 30 60 59 82 96 96 81 89 97 42
Source: Schoen & Osborn, 2009.
Percentage
0
20
40
60
80
100
Cana
da
Unite
d St
ates
Fran
ce
Germ
any
Swed
en
Italy
Aust
ria
Unite
d Ki
ngdo
m
Norw
ay
New
Zea
land
Neth
erla
nds
99% 97% 97% 96% 95%
72%
46%
68%
37%
94%94%
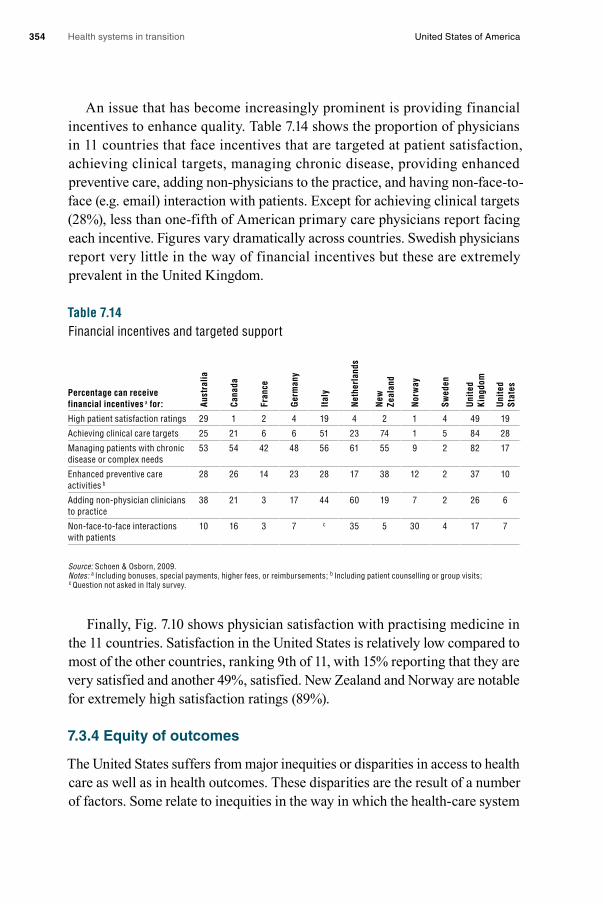
Health systems in transition United States of America354
An issue that has become increasingly prominent is providing financial incentives to enhance quality. Table 7.14 shows the proportion of physicians in 11 countries that face incentives that are targeted at patient satisfaction, achieving clinical targets, managing chronic disease, providing enhanced preventive care, adding non-physicians to the practice, and having non-face-to-face (e.g. email) interaction with patients. Except for achieving clinical targets (28%), less than one-fifth of American primary care physicians report facing each incentive. Figures vary dramatically across countries. Swedish physicians report very little in the way of financial incentives but these are extremely prevalent in the United Kingdom.
Table 7.14Financial incentives and targeted support
Percentage can receive financial incentives a for: Au
stra
lia
Cana
da
Fran
ce
Ger
man
y
Ital
y
Net
herl
ands
New
Ze
alan
d
Nor
way
Swed
en
Uni
ted
King
dom
Uni
ted
Stat
es
High patient satisfaction ratings 29 1 2 4 19 4 2 1 4 49 19
Achieving clinical care targets 25 21 6 6 51 23 74 1 5 84 28
Managing patients with chronic disease or complex needs
53 54 42 48 56 61 55 9 2 82 17
Enhanced preventive care activities b
28 26 14 23 28 17 38 12 2 37 10
Adding non-physician clinicians to practice
38 21 3 17 44 60 19 7 2 26 6
Non-face-to-face interactions with patients
10 16 3 7 c 35 5 30 4 17 7
Source: Schoen & Osborn, 2009.Notes: a Including bonuses, special payments, higher fees, or reimbursements; b Including patient counselling or group visits; c Question not asked in Italy survey.
Finally, Fig. 7.10 shows physician satisfaction with practising medicine in the 11 countries. Satisfaction in the United States is relatively low compared to most of the other countries, ranking 9th of 11, with 15% reporting that they are very satisfied and another 49%, satisfied. New Zealand and Norway are notable for extremely high satisfaction ratings (89%).
7.3.4 Equity of outcomes
The United States suffers from major inequities or disparities in access to health care as well as in health outcomes. These disparities are the result of a number of factors. Some relate to inequities in the way in which the health-care system
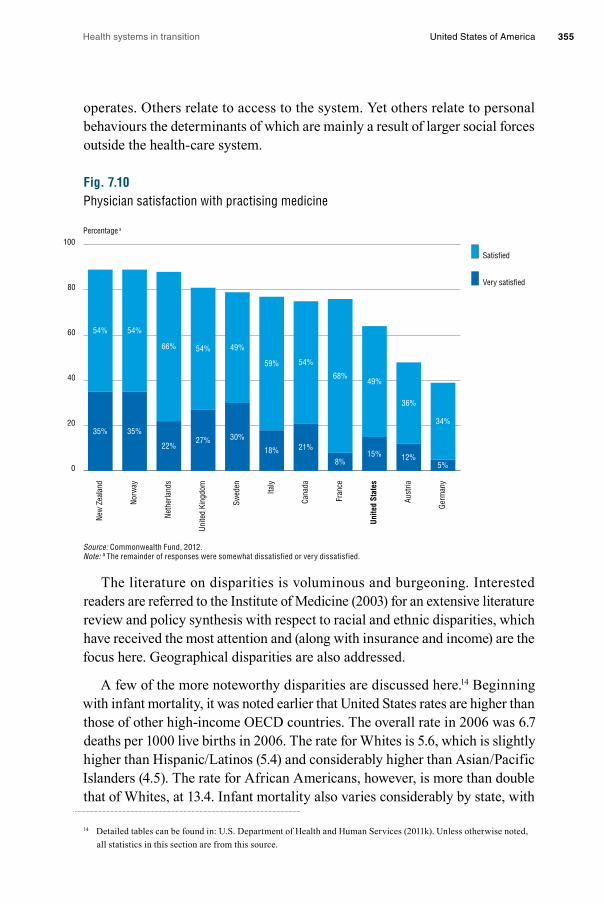
Health systems in transition United States of America 355
operates. Others relate to access to the system. Yet others relate to personal behaviours the determinants of which are mainly a result of larger social forces outside the health-care system.
Fig. 7.10Physician satisfaction with practising medicine
Source: Commonwealth Fund, 2012. Note: a The remainder of responses were somewhat dissatisfied or very dissatisfied.
The literature on disparities is voluminous and burgeoning. Interested readers are referred to the Institute of Medicine (2003) for an extensive literature review and policy synthesis with respect to racial and ethnic disparities, which have received the most attention and (along with insurance and income) are the focus here. Geographical disparities are also addressed.
A few of the more noteworthy disparities are discussed here.14 Beginning with infant mortality, it was noted earlier that United States rates are higher than those of other high-income OECD countries. The overall rate in 2006 was 6.7 deaths per 1000 live births in 2006. The rate for Whites is 5.6, which is slightly higher than Hispanic/Latinos (5.4) and considerably higher than Asian/Pacific Islanders (4.5). The rate for African Americans, however, is more than double that of Whites, at 13.4. Infant mortality also varies considerably by state, with
14 Detailed tables can be found in: U.S. Department of Health and Human Services (2011k). Unless otherwise noted, all statistics in this section are from this source.
0
20
40
60
80
100
Germ
any
Aust
ria
Unite
d St
ates
Fran
ce
Cana
da
Italy
Swed
en
Unite
d Ki
ngdo
m
Neth
erla
nds
Norw
ay
New
Zea
land
Satisfied
Very satisfied
Percentage a
49%
34%
36%
59% 54%
68%
49%54%
27% 30%
18% 21%
8%15% 12%
5%
54% 54%
66%
35%35%
22%

Health systems in transition United States of America356
the rate in Massachusetts (4.9) about half that in several states in the South. Given the racial differences just noted, it is not surprising that the states with the highest rates tend to have higher proportions of African American residents. Life expectancy at birth shows similar patterns: Whites have, on average, a five-year-longer life expectancy than African Americans.
This disparity between African Americans and other races also holds for certain diseases. Diabetes rates, for example, are 80% higher among African Americans than Whites. For end-stage renal disease, African American incidence and prevalence rates are about three times those of Whites. There are disparities by income as well. In the case of diabetes, rates for those below 200% of the FPL are twice those of people above 400% of the FPL – something that cannot be adequately explained by racial factors alone. While diet and genetic factors play a strong role in diabetes, disparities in treatment relate to both the medical care system itself and access to it.
One of the biggest racial disparities is for firearms-related deaths. Among males aged 25–34, the 2007 death rates per 100 000 were 89 for African Americans, 31 for Hispanic/Latinos, 18 for Whites and 11 for Asian/Pacific Islanders. Such disparities are the result of forces beyond the health-care system.
Similarly, there are different cancer survival rates according to race. Overall five-year survival rates in the 1999–2006 period were 69% for Whites compared to 59% for African Americans. Among 10 of the most common types of cancer, Whites had higher survival rates for nine of them (all but stomach cancer).
A final measure of disparities presented here is having a regular source of care, which takes into account both demand factors (e.g. affordability and quality of insurance coverage) and supply factors (availability of physicians near one’s residence). Here, Hispanics and Latinos are most disadvantaged, with nearly one-third reporting that they lack a usual source of care, compared to about 20% for African Americans, Whites and Asians. These figures mainly reflect high uninsurance rates among the Hispanic/Latino population but also language barriers.
Not surprisingly, there is considerable variation in access and outcomes as a result of geographical factors. The focus here is on states but it should be kept in mind that disparities are even greater when finer geographical distinctions are considered.

Health systems in transition United States of America 357
The Commonwealth Fund has rated each of the 50 states with respect to their performance in health. The research “assesses states’ performance relative to what is achievable, based on benchmarks for 38 indicators of access, quality, costs and health outcomes” (McCarthy et al., 2009, p.8). Many comparisons are presented between the highest or lowest scoring states.15 Beginning with mortality, Fig. 7.11 shows amenable mortality rates by state (see section 7.3.2 for a definition). In the most recent period shown, 2004–2005, the rates in the five worst performing states were twice those in the five best performers. The map shows a clear geographical pattern, with the worst performing states concentrated in the South. The best-performing states tend to cluster in the upper Midwest and Pacific Northwest. Again, these differences result from factors related to health care and its access as well as forces beyond the system such as education and personal behaviours.
Fig. 7.11Mortality amenable to health care by state
Source: Commonwealth Fund, 2012.
15 According to the report, the ten best performing states are Connecticut, Hawaii, Iowa, Maine, Massachusetts, Minnesota, New Hampshire, North Dakota, Vermont and Wisconsin. The ten states with the worst overall performance are Arkansas, Florida, Illinois, Kentucky, Louisiana, Mississippi, Nevada, New Mexico, Oklahoma and Texas.
Third (90.7–107.5)
Bottom (108.0–158.3)Worst: DC
Second (77.2–89.9)
First (63.9–76.8) Best: MN
Deaths per 100,000 population
Pacific Ocean
WASHINGTON DC
WA
OR
CA
NV
AZ NM
TX
AKHI
UT
ID
MT
WY
CO
NE
SD
NDMN
IA
WI MI
INIL
MOKS
OKAR
ALMSLA
GA
FL
SC
NCTN
KYWV VA
OHPA
NY
VTNH
ME
MA
CTNJDEMD
RI

Health systems in transition United States of America358
Fig. 7.11 – continuedMortality amenable to health care by state
Source: Commonwealth Fund, 2012. Note: a Age-standardized deaths before the age of 75 from select causes; including ischemic heart diseases. b Excludes District of Columbia.
Potentially undesirable hospital admissions and readmissions are shown in Fig. 7.12. Sharp geographical variation is observed in all four rates shown. The five worst performing states have admission rates that are between 50% and 200% higher than the best five performers.
Fig. 7.12State variations: Hospital admissions indicators
Top 5 states
1. Oregon 1. Minnesota 1. Utah 1. Utah
2. Utah 2. Arizona 2. Vermont 2. Washington
3. South Dakota 3. Oregon 3. Idaho 3. North Dakota
4. Nebraska 4. Utah 4. South Dakota 4. Oregon
5. Idaho 5. Colorado 5. Montana 5. South Dakota
Source: Commonwealth Fund, 2012.
Deaths a per 100,000 population
0
40
80
120
160
Worst states bBottom 5 state averageAll states medianTop 5 state averageBest state
96 90
144135
151142
7264
7868
2001–02
2004–05
Percentage
0
10
20
30
40
50
Home health patientsadmitted to hospital
Nursing home residentsreadmitted to hospital
within 30 days
Nursing home residentsadmitted to hospital
Medicare beneficiariesreadmitted to hospital
within 30 days
7%9%
19%
28%31%
13%15%
21%25%
27%
21% 22%
29%
40%43%
13% 14%18%
22% 23%
Best state
Top 5 states average
All states median
Bottom 5 states average
Worst state

Health systems in transition United States of America 359
Finally, Fig. 7.13 shows four measures of ambulatory quality related to preventive and diabetic care (adults), vaccines, medical, and dental preventive visits (children). The same pattern as in the other figures is seen. Perhaps most noteworthy is the difference in diabetes care quality between the low and high performing states, and the fact that there is a considerable difference in children’s vaccination rates by county – the vaccination rate in the top state, 93%, was over 25% percentage points higher than the worst performing state.
Fig. 7.13State variations: Ambulatory care quality indicators
Top 5 states
1. Delaware 1. Minnesota 1. New Hampshire 1. Rhode Island
2. Connecticut 2. Vermont 2. Maryland 2. Massachusetts
3. Minnesota 3. Maine 3. Connecticut 3. Connecticut
4. Rhode Island 4. Wisconsin 4. Hawaii 4. District of Columbia
5. Michigan 5. North Dakota 5. South Dakota 5. New Hampshire
5. Maryland
Source: Commonwealth Fund, 2012.
7.3.5 How the ACA is intended to affect outcomes and quality
One of the stated objectives of the ACA is to improve quality and outcomes. Firstly, preventive care is encouraged because such services will not be subject to patient co-payments under Medicare and Medicaid. Medicare will also cover one comprehensive risk assessment examination annually. Secondly, the legislation encourages the formation of ACOs by allowing them to share in Medicare savings. ACOs are defined and discussed in Box 3.3. ACOs, some believe, can increase quality by encouraging coordination of currently disparate providers and discouraging the provision of unnecessary services. Thirdly,
Percentage
0
20
40
60
80
100
Children with medicaland dental preventive
care visits
Children ages 19–35 monthsreceived five vaccines
Adult diabetics receivedthree recommended
diabetes services
Adults aged 50+ receivedrecommended preventive care
67%
57%
45%
35% 33%
93% 90%
80%73% 67%
85% 83%
71%62% 60%
53% 51%42%
36% 35%
Best state
Top 5 states average
All states median
Bottom 5 states average
Worst state

Health systems in transition United States of America360
additional comparative effectiveness research will be funded, and finally, a number of financial incentives based on quality and outcomes are initiated under the legislation. These include reimbursement incentives for hospital performance and value-based payments to providers.
7.4 Health system expenditures and out-of-pocket costs
7.4.1 Context
The United States spends far more on health care per person than any other country. There is little agreement on why the United States is an outlier in this regard. Those on the left often point to what they see as several contributing factors: lack of consolidated purchasing power among buyers of care, lack of universal insurance coverage, high marketing and administrative costs among private insurers, too many specialists and not enough primary care doctors, and direct-to-consumer advertising of prescription drugs. Those on the right point to a bloated government bureaucracy and a myriad of regulations that stif le competition, along with tax laws that encourage over-provision and over-utilization of services. Other factors that observers on both sides point out are high unit prices paid to providers, particularly in the FFS system; proliferation of medical technologies; and unhealthy behaviours.16
In 2008, per capita spending was more than double the median level for OECD countries and 65% more than the second most expensive country, Switzerland (see Table 3.5). OOP spending is the second highest, after Switzerland (see Table 3.12) but the Swiss are much more confident than Americans that they would be able to afford needed care if they became seriously ill (Fig. 7.7). This is most likely the case because there is a maximum limit on how much can be spent out-of-pocket in Switzerland (Schoen et al., 2010).
High spending is not necessarily problematic in itself. What matters most, of course, is what a country is getting in the way of better health for its money. But in many countries – and the United States is an example – controlling expenditures is often viewed as a goal in and of itself.
16 See Emanual et al., (2012) for a left-of-centre analysis of health-care cost containment, and Antos, Pauly and Wilensky, (2012) for a right-of-centre analysis.

Health systems in transition United States of America 361
Health-care expenses constitute over one-sixth of the United States economy – 17.9% of GDP during both 2009 and 2010 (Martin et al., 2012).17 The rate of growth in health-care spending exceeded the GDP growth rate every year from at least the 1960s until 2010, which has increasingly squeezed the finances of all levels of government, employers and individuals. Moreover, they reduce the amount of money that the country and its residents have available to spend on other priorities.
For example, on average, states spend 13% of their revenues on health care, which is usually second only to education. With recent increases in Medicaid enrolment and particularly growth in spending for “dual eligibles” – poor and near-poor aged and disabled beneficiaries – this figure has risen steeply in recent years, whereas the percentage of revenues devoted to education has stayed fairly constant since the 1980s (Center on Budget and Policy Priorities, 2011). One result is that states have not taken advantage of some large federal subsidies because they require that states spend more as well. This is one reason some states are not accepting the expansion in the ACA of Medicaid eligibility to all people with incomes below 138% FPL (a position supported by the 2012 decision of the United States Supreme Court). Some of the states with a large poor population fear that if they expand Medicaid, even with the large federal subsidies, they will be left with expenses they cannot afford (Kaiser Commission on Medicaid and the Uninsured, 2011).
Employers and employees have also seen large increases in their contributions to the health-care costs of employer-sponsored health insurance. Between 1999 and 2011, employers on average experienced more than a doubling of premiums. Employees have seen even greater increases in the order of 2.7-fold (Fig. 7.14). In contrast, wages rose by only 50% over this period. In 2011, total (employer and employee) annual premiums for single coverage exceeded $5400, and family coverage, $15 000 (Kaiser Family Foundation and Health Research and Educational Trust, 2011). While there is much debate about whether this has negatively affected the ability of United States business to compete in the international market, there is no question that it has markedly affected the amount of money that individuals have available to spend on non-health-related items.
17 Because of the recession in 2008 and 2009, the drop in GDP meant that there was a large increase in the percentage of GDP devoted to health in a single year, from 16.8% to 17.9% from 2008 to 2009 (Martin et al., 2012). It is too early to know whether this will decrease as the United States economy recovers.

Health systems in transition United States of America362
Fig. 7.14Cumulative increases in health insurance premiums, workers’ contributions to premiums, inflation and workers’ earnings, 1999–2011
Source: Kaiser Family Foundation, 2012c.
7.4.2 Current expenditures by sociodemographic group
Table 7.15 shows average (mean) expenditures for people in different sociodemographic groups in 2007.18 Several disparities stand out: Hispanics /Latinos under the age of 65, Asians, African Americans under the age of 65 (to a lesser extent), and most dramatic of all, the uninsured, have lower than average expenditures.
Spending for the uninsured is about 37% as high as it is for those with private or public insurance. Only 56% of the uninsured had any health-care expenses compared to about 85% of those with public or private insurance. Among those with expenditures, the uninsured spent a little more than half as much as the others. As shown earlier in the chapter, this reflects far lower service usage (Fig. 7.5). Some of the lower use may reflect the fact that 80% of the uninsured are younger than 45 years of age and relatively healthy. In addition, there has long been a suspicion that because medicine in the United States is largely paid for on a FFS basis, people with insurance may receive unnecessary care – so some of the lower use of health care among the uninsured may be beneficial.
18 The data are reported as the percentage of persons with expenses during the year, and the mean annual expense per person with expense. These were multiplied together to provide the figures shown in Table 7.15.
Percentage
0
20
40
60
80
100
120
140
160
180
Overall inflation
Workers’ earnings
Workers’ contribution to premiums
Health insurance premiums
2011201020092008200720062005200420032002200120001999
98%
93%
24%
21%
38%
50%
168%
160%

Health systems in transition United States of America 363
Table 7.15Expenses for health care by selected population characteristics, 2008
CharacteristicPopulation with
any expense (%)
Mean annual expense for person with any
expense ($)Mean annual expense
for all persons ($)
All ages 84.4 4 470 3 773
Under 65 years 82.6 3 571 2 950
Male 77.5 3 299 2 557
Female 87.6 3 811 3 338
Hispanic or Latino 69.9 2 472 1 728
White 87.6 3 936 3 448
Black or African American 75.7 3 268 2 474
Asian 78.1 1 871 1 461
American Indian, Alaska Native, Hawaiian Pacific Islander and Multiple Race
83.7 4 312 3 609
Any private insurance 88.1 3 613 3 183
Public insurance only 85.0 4 391 3 732
Uninsured all year 55.7 1 870 1 042
65 years and over 96.6 9 585 9 259
Male 95.7 9 433 9 027
Female 97.3 9 698 9 436
Hispanic or Latino 93.3 9 437 8 805
White 97.5 9 603 9 363
Black or African American 93.8 10 414 9 768
Asian 94.9 6 037 5 729
American Indian, Alaska Native, Hawaiian Pacific Islander and Multiple Race
N/A N/A N/A
Source: U.S. Department of Health and Human Services, 2011a. Notes: N/A, not available.
The figures for Hispanic /Latinos are also noteworthy.19 While expenditures for Hispanics aged 65 and older (almost all of whom have Medicare coverage) exceed those of Whites, the figures for the under-65 population are much lower: less than 50% of White expenditures. This points to consequences of access problems: high uninsurance rates and a lower ability to afford cost-sharing requirements. Blacks /African Americans show the same pattern but to a lesser degree; the expenditures for the under-65 population are 15% lower than for
19 A much discussed phenomenon is the so-called Hispanic Paradox, whereby Hispanic /Latinos appear to have lower mortality rates than Whites in spite of lower education and income levels. There continues to be much controversy around the topic (see Franzini, Ribble & Keddie, 2001; Smith & Bradshaw, 2006). Irrespective of the veracity of the hypothesis, the fact that Hispanic /Latinos aged 65 and older have higher expenditures than Whites suggests that the much lower expenditures for the under-65 Hispanic /Latino population compared to Whites may result from disparities in access.
Health systems in transition United States of America364
Whites in spite of poorer health status in most (but not all) measures. In addition, Asians have lower expenditures for both age groups – 21% and 27% lower than Whites for the younger and older populations, respectively. This last finding is curious since Asians, on average, have higher educational and income levels than Whites. It may be due to better health status or cultural factors that result in less use of health-care services compared to other race/ethnicity groups.
7.4.3 Changes in expenditures and OOP costs
This section focuses mainly on two issues: international trends in expenditure growth and growth in United States expenditures by sociodemographic characteristics.
Expenditures International trends in expenditure growth need to be considered cautiously for two reasons. First, increases in expenditures can be a sign of an improving health-care system. Second, ranking countries by rate of growth depends crucially on when one defines the baseline. United States spending rose faster than that of the United Kingdom between 1970 and 2008, but slower between 1990 and 2008.
Fig. 7.15 illustrates growth in national health expenditure per capita expressed in United States purchasing power parities (which is given in Table 3.5) for six countries – Canada, Germany, Japan, the Netherlands, the United Kingdom and the United States – from 1970 to 2008. Growth rates in the United States and United Kingdom exceed those of the other countries. Nevertheless, in 2008, United States spending was more than double that in the United Kingdom because the latter started at such a low level of spending. Thus, when one combines both level of spending and rate of growth, the United States is an international outlier.20
20 A summary of a number of international spending trends from OECD data can be found at: http://www.kff.org/insurance/snapshot/OECD042111.cfm

Health systems in transition United States of America 365
Fig. 7.15National health expenditures per capita in six countries, 1970–2008
Source: OECD, 2012a.
OOP costs Inflation-adjusted OOP costs have been rising in nearly all high-income countries, the United States being no exception. Since OOP does not include much larger premium increases paid by employees, it gives a narrow picture of the burden of health-care costs on individuals and families.
Distributional issues are of much interest. While OOP costs rose by 19% overall from 1996 to 2005, two vulnerable groups experienced much larger increases – the uninsured (46%) and the poor (35%). Such groups are particularly susceptible to rising health-care costs. The uninsured have to bear the costs directly as do many of the poor, since only about half are eligible for Medicaid.
7.4.4 How the ACA is intended to affect expenditures and OOP costs
Chapter 6 focused on the anticipated impact of the ACA but here we summarize some of the likely effects on expenditures and OOP costs. There are, in essence, two ways in which supporters of the ACA argue that it will contain expenditures. Firstly, it includes a number of initiatives that have the potential to change the financing and delivery system. These include encouraging the development and/or growth of: ACOs, which are consortia of providers who collaborate on patient care; bundled payment systems, which provide payment for a set of
Expenditures per capita (US$ 2 000 PPP)
0
1000
2000
3000
4000
5000
6000
7000
8000
United Kingdom
Netherlands
Japan
GermanyCanada
United States
20082007200620052000199019801970

Health systems in transition United States of America366
related services usually related to an episode of illness (as opposed to FFS); medical homes (a physician-directed organization that oversees the provision of access to comprehensive care across health-care facilities and over a patient’s life, discussed in section 5.3.3); EMRs; and the linking of reimbursement to performance outcomes (initially, for Medicare hospital stays).
In addition, the ACA includes a number of mechanisms that could control expenditures, including: large cuts in previously expected payment levels to Medicare Advantage (usually, managed care) plans, which in 2012 were estimated to have been paid 7% more than it would have cost for the same individuals to have been enrolled in the traditional FFS Medicare programme (Medicare Payment Advisory Commission, 2012); the tax on “Cadillac” or high-benefit health insurance plans; and the IPAB, which is to recommend ways to reduce Medicare costs if they exceed a certain threshold. If Congress does not come up with alternative means of meeting the budgetary gap, the IPAB recommendations will go into effect automatically.
The ACA does not include a number of cost-containment methods that have been employed in some other countries. These include: global budgets; coordinating provider-payment among public and private insurers (that is, an “all-payers” system); controlling the supply of resources (e.g. through expenditure targets or technology controls); and using cost-effectiveness research to determine which services should be reimbursed and if so, how much.
The extent to which the ACA effectively controls OOP expenditures will be determined, in large part, by its success in controlling total expenditures. In addition, various provisions are likely to affect the distribution of the economic burden caused by high health-care costs. These include: requiring that insurers cover all applicants and not charging them more if they have a history of illness; providing subsidies to lower and middle-class individuals and families to purchase coverage through exchanges; expanding Medicaid coverage to more of the poor and near-poor; and financing some of these features through new progressive taxes. Proponents argue that these provisions will redistribute resources from the healthy to the sick and/or the wealthy to those with lower incomes.

Health systems in transition United States of America 367
7.5 Health system efficiency
There is much interest in maximizing the value of health-care services in the United States. As discussed earlier in the chapter and throughout the book, a number of health processes in the United States are flawed and health outcomes low. At the same time expenditures are very high in comparison with other countries. On a number of measures, the United States does not compare well to many other high-income countries, which continue to have much lower expenditures, universal access and often better measures of quality. Moreover, there is considerable socioeconomic and geographical variation within the United States on these criteria.
The focus on value highlights an interest in learning from “best practices”. Box 7.2 discusses the VHA, an example from the United States that shows how a low-performing system can be transformed into a highly efficient one.
Box 7.2The Veterans Health Administration
Established in 1930, today the Veterans Health Administration (VHA) is the largest integrated health-care system in the United States and the second largest federal department with 278 000 employees. In 2009, it provided medical services to nearly 6 million veterans through a nationwide network of 153 hospitals, 959 outpatient clinics, 134 community living centres, 90 residential rehabilitation treatment programmes, 232 Veterans centres, and 57 Veterans benefits regional offices (U.S. Department of Veterans Affairs, 2010).
While viewed in the past as a provider of last resort, the VHA has received considerable attention for what many researchers view as a greatly improved system over the past 20 years (Jha et al., 2003; Oliver, 2007). The VHA has pioneered efforts to improve quality, predating the 2001 Institute of Medicine report (Committee on Quality of Health Care in America, 2001). Beginning with Kenneth Kizer’s Vision for Change in 1995, the VHA began to overhaul its health-care system. Only a decade later, the VHA system was known for often providing better quality service at lower costs to more satisfied patients than some private sector health systems. Each of these three achievements is discussed below followed by an assessment of three factors that contributed to system-wide improvement over a short period of time.
By 2004–2005, the VHA outperformed the private, Medicare, and Medicaid payers for the percentage of patients experiencing quality care in 13 of 15 indicators including preventive care (e.g. mammography, colorectal cancer screening, influenza vaccines), outpatient care (annual measurement of blood sugar, semiannual lipid screening, controlled cholesterol, controlled blood pressure, annual eye examination) and inpatient care (beta-blocker at discharge after acute myocardial infarction) (Oliver, 2007). However, 30-day follow-up after hospitalization for mental illness was poorer at VHA compared to non-VHA payers (Oliver, 2007). In 2005 VHA patients were found to be more satisfied than private sector patients with both inpatient (83 vs 73 out of 100) and outpatient (83 vs 75 out of 100) care (Congressional Budget Office, 2012c).
Health systems in transition United States of America368
Box 7.2 – continuedThe Veterans Health Administration
In addition to altering the course on quality and satisfaction, the VHA made a number of inroads in recent decades to contain costs. Research comparing costs at VHA medical centres to Medicare FFS payment for equivalent services found, on average, Medicare costs to be 20% higher. If the VHA were to purchase services in the private sector using Medicare FFS rates, estimates suggest inpatient expenditures would be 16% higher, nursing home expenditures 21% higher, outpatient pharmaceuticals 69% higher and rehabilitation services 70% higher (Nugent et al., 2004). As discussed next, many of these efficiencies are realized from the VHA’s integrated system. However, unlike Medicare, the VHA has the additional advantage of being allowed to leverage its purchasing power to drive down costs for, among other services, pharmaceuticals.
These improvements in cost containment, quality and satisfaction are attributed to the VHA’s efforts over the last 25 years in three areas (Oliver, 2007; Jha et al., 2003: Congressional Budget Office, nd):• Decentralization of the VHA system from four United States regions into more than 100
independent medical centres with 21 Veterans Integrated Service Networks (VISNs), each able to budget and plan care for their geographical region. This decentralization included budgeting at the network-level. VISNs are given a fixed amount per enrolled veteran (capitation) for “basic care” patients and an additional fixed sum for “complex care patients”.
• Focus on measurement and reporting of performance to improve quality. VISN managers are held accountable for the performance of their regional facilities in regard to providing preventive care and managing chronic conditions. Medical providers are given incentives to improve quality, access and patient satisfaction. For physicians, these incentives are financial bonuses linked to their performance.
• Use of health IT systems. Each VHA patient has an EHR in the Veterans Health Information Systems and Technology Architecture (VistA). Among other functions, VistA can generate reminders about tests and treatments according to clinical guidelines, has computerized order entry and electronic prescribing.
7.5.1 Technical efficiency
It is beyond the scope of this book to examine the precise relationships between inputs and outputs in the production of health services. Instead, the focus here is on one aspect of technical efficiency: the extent to which health-care spending is directed at patient care rather than administration. Everything else being equal, a health-care system is operating in a more technically efficient manner if resources expended go directly to patient care.
The issue is nuanced, however. Spending, say, by private insurers on activities such as utilization management is usually thought of as an administrative activity in which resources are being diverted from patient care. But insurers and managed care companies argue that these administrative costs

Health systems in transition United States of America 369
cut unnecessary utilization and expenditures. In fact, to implement the ACA it must be determined which of such costs are indeed counted towards patient care, which in itself creates an administrative burden on both the federal government and insurers. The ACA requires that 80 cents (individuals and small groups) or 85 cents (large groups) of each dollar of premiums be returned to policy-holders in the form of health services or quality improvement.
Administrative costs are considerably higher in the United States than in other countries. Private insurers usually operate on a for-profit basis and seek returns for investors. They market through advertising, determine whether a person or group should be eligible to purchase private coverage and process claims. Obtaining payment from insurers – both public and private – often involves considerable administrative effort. Hospitals and physician groups require substantial resources (labour and capital) for administration in dealing with multiple private insurers as well as government programmes, particularly Medicare and Medicaid.
Cutler and colleagues (Cutler & Ly, 2011; Pozen & Cutler, 2011) report the following in comparing administrative costs in the United States vs. Canada:
• Hospital and physician spending in the United States is $1589 per capita higher than in Canada (2002 data). Thirty-nine per cent of this is due to higher administrative costs, with 31% due to higher provider incomes and 14% a result of additional hospital procedures.
• On a per capita basis, the United States has 44% more administrative staff than does Canada, and United States physicians report that they spend 13% of their time on administration compared to 8% for Canadian physicians.
• The United States employs 1.5 administrators per hospital bed, compared to 1.1 in Canada.21
• The United States has 25%, 165% and 215% more administrators than the United Kingdom, the Netherlands and Germany, respectively.
The Commonwealth Fund, (2010) study discussed earlier reports on eight measures of efficiency among seven countries; the findings are shown in Table 7.16. These include measures of spending per capita, spending on administration, patient paperwork issues, medically unnecessary use of
21 To illustrate, the authors note Duke University Hospital, an academic medical centre in North Carolina, which employs 1300 billing clerks for 900 beds.

Health systems in transition United States of America370
an emergency department, problems in obtaining medical records or tests, duplicate tests and the use of IT. As shown in Table 7.16, the United States ranked last on four of these measures, and next-to-last on the remaining four.
7.5.2 Allocative efficiency
Allocative efficiency relates to whether a society’s resources are being spent in the manner that is most beneficial to that society. Relating this to health care, a health-care system is operating efficiently if its resources are being spent in a way that best benefits the overall health and well-being of the population. No health-care system, of course, operates efficiently by this definition, but a goal of public policy should be to move towards this ideal.
Allocative efficiency comprises three elements. The first is technical efficiency, which was discussed above. A second element is whether the right goods and services are being produced. Technically efficient production of the wrong goods obviously falls short of allocative efficiency. The third element concerns how the goods that are produced are distributed.
The second and third elements of allocative efficiency are discussed here, beginning with whether the right goods and services are being produced. Issues include site of services (e.g. inpatient vs outpatient), mix of inputs (e.g. equipment vs labour vs drugs), mix of labour (e.g. specialist physicians vs primary care vs nurses or psychologists) and mix of services.
Assessing whether the United States is using the “right” mix is extremely difficult. Compared to other countries, the United States: uses inpatient care less often; is highly capital and technology-intensive; employs specialists to a greater extent; and has a mix of services oriented in many ways towards less health promotion, more intensive treatment of illness and more intensive end-of-life care. To assess allocative efficiency in this regard, it is necessary to examine population desires but it is difficult to find reliable sources that examine these issues. Moreover, such data would need to be interpreted very carefully since, as stated in the case of soliciting Americans’ views on national health insurance,
“polling questions tend to disguise the more complex reality of the situation” (Blendon et al., 2006, p.640).
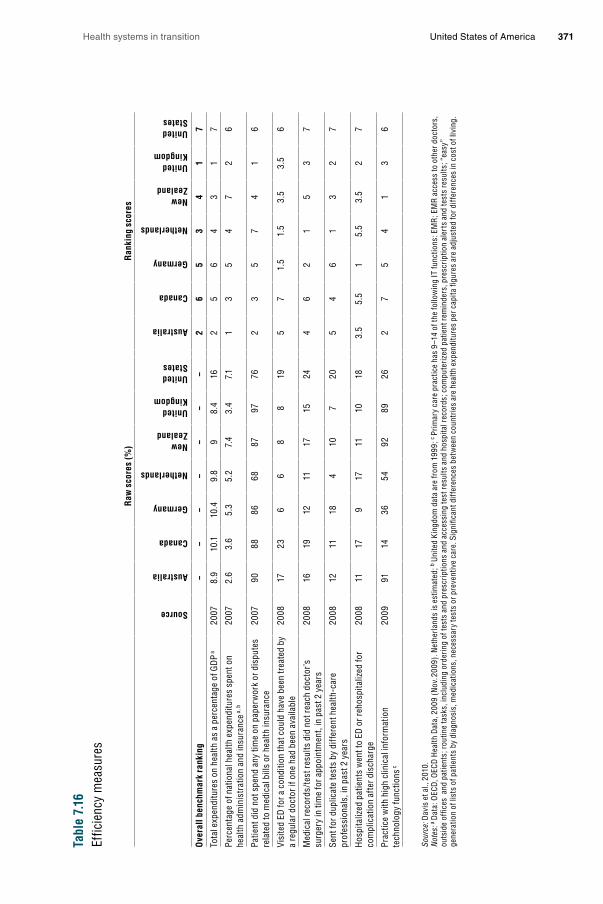
Health systems in transition United States of America 371
Tabl
e 7.
16Ef
ficie
ncy
mea
sure
s
Raw
sco
res
(%)
Ran
king
sco
res
Source
Australia
Canada
Germany
Netherlands
New Zealand
United Kingdom
United States
Australia
Canada
Germany
Netherlands
New Zealand
United Kingdom
United States
Ove
rall
benc
hmar
k ra
nkin
g–
––
––
––
26
53
41
7
Tota
l exp
endi
ture
s on
hea
lth a
s a
perc
enta
ge o
f GD
P a20
078.
910
.110
.49.
89
8.4
162
56
43
17
Perc
enta
ge o
f nat
iona
l hea
lth e
xpen
ditu
res
spen
t on
heal
th a
dmin
istr
atio
n an
d in
sura
nce a
, b20
072.
63.
65.
35.
27.
43.
47.
11
35
47
26
Patie
nt d
id n
ot s
pend
any
tim
e on
pap
erw
ork
or d
ispu
tes
rela
ted
to m
edic
al b
ills
or h
ealth
insu
ranc
e20
0790
8886
6887
9776
23
57
41
6
Visi
ted
ED fo
r a c
ondi
tion
that
cou
ld h
ave
been
trea
ted
by
a re
gula
r doc
tor i
f one
had
bee
n av
aila
ble
2008
1723
66
88
195
71.
51.
53.
53.
56
Med
ical
reco
rds/
test
resu
lts d
id n
ot re
ach
doct
or’s
su
rger
y in
tim
e fo
r app
oint
men
t, in
pas
t 2 y
ears
2008
1619
1211
1715
244
62
15
37
Sent
for d
uplic
ate
test
s by
diff
eren
t hea
lth-c
are
prof
essi
onal
s, in
pas
t 2 y
ears
2008
1211
184
107
205
46
13
27
Hos
pita
lized
pat
ient
s w
ent t
o ED
or r
ehos
pita
lized
for
com
plic
atio
n af
ter d
isch
arge
2008
1117
917
1110
183.
55.
51
5.5
3.5
27
Prac
tice
with
hig
h cl
inic
al in
form
atio
n te
chno
logy
func
tions
c20
0991
1436
5492
8926
27
54
13
6
Sour
ce: D
avis
et a
l., 2
010.
N
otes
: a D
ata:
OEC
D, O
ECD
Hea
lth D
ata,
200
9 (N
ov. 2
009)
. Net
herl
ands
is e
stim
ated
; b U
nite
d Ki
ngdo
m d
ata
are
from
199
9; c
Prim
ary
care
pra
ctic
e ha
s 9–
14 o
f the
follo
win
g IT
func
tions
: EM
R; E
MR
acce
ss to
oth
er d
octo
rs,
outs
ide
offic
es a
nd p
atie
nts;
rout
ine
task
s, in
clud
ing
orde
ring
of te
sts
and
pres
crip
tions
and
acc
essi
ng te
st re
sults
and
hos
pita
l rec
ords
; com
pute
rize
d pa
tient
rem
inde
rs, p
resc
riptio
n al
erts
and
test
s re
sults
; “ea
sy”
gene
ratio
n of
list
s of
pat
ient
s by
dia
gnos
is, m
edic
atio
ns, n
eces
sary
test
s or
pre
vent
ive
care
. Sig
nific
ant d
iffer
ence
s be
twee
n co
untr
ies
are
heal
th e
xpen
ditu
res
per c
apita
figu
res
are
adju
sted
for d
iffer
ence
s in
cos
t of l
ivin
g.

Health systems in transition United States of America372
The third part of allocative efficiency concerns whether health-care goods and services are being distributed in a way that is consistent with the desires of the population. Here it is useful to distinguish between issues of efficiency (the focus here) and those related to equity (discussed in section 7.2). In 2010, 53% of Americans stated that they wanted to see “more federal government involvement” in “ensuring access to health care”, vs 32% who wanted to see less and 15% who preferred the same amount (Washington Post, Kaiser Family Foundation/Harvard University, 2010). Since the United States has not ensured this access, this could be viewed as indicating that the system is not efficient from an allocative perspective. However, Americans tend to respond less favourably to such questions when told they have to pay more in taxes (Blendon et al., 2006).
Equity and distributional issues have been discussed throughout this chapter as well as in Chapter 5. Briefly, most of the concerns are related to disparities in access to insurance and care, as well as differences in health-care processes and outcomes, by socioeconomic characteristics. In section 7.2, it was shown (among other things) that those with low incomes and individuals and families of Latino origin are far more likely to lack health insurance, the consequence of which is lower use of services due to cost impediments and lack of access to a regular provider of care. The last of these produces its own deleterious consequences, including lack of receipt of many preventive services and initial treatment of chronic diseases such as cancer at a later stage. It was also shown that African Americans have much poorer outcomes than whites in indicators such as infant mortality, cancer survival, and diabetes.
8. Co
nclu
sion
s
8. Conclusions
It is difficult to generalize about the United States health-care system, and accordingly, hard to draw overall conclusions about its performance. In some respects, it is unquestionably among the best in the world, yet in other
respects there are significant shortcomings.
One factor that sets the United States apart from its counterparts is the more limited government involvement. Historically, there has been distaste for central planning, lack of control over the dissemination of medical technologies, reluctance to take advantage of the potential bargaining power afforded through large government insurers, the lack of a centralized prices and prospective budgeting and, most importantly, the absence of guaranteed insurance coverage.
There is general agreement among those on the left and the right that reforms are necessary to control spending. There is less agreement on whether there is a quality problem, nor much agreement on the need to provide coverage for the uninsured. In spite of these disagreements, and because of the adoption of the Affordable Care Act in 2010, the United States is facing a period of enormous potential change. Whether the ACA will indeed be effective in addressing the challenges identified above can only be determined over time.
Such changes in health-care delivery will take a great deal of time. The ACA addresses major challenging issues such as geographic variation in the use of services and a bias towards subspecialty rather than primary care services, but mainly through small programmes and pilot studies. The types of changes needed in health-care delivery are unlikely to result from legislation. Rather, they need to be innovated and supported by both the public and private sectors as each grapples with the cost, quality, and access issues they face. They also hinge on changing individual and provider behaviours.

Health systems in transition United States of America374
Americans face an even more fundamental challenge: the lack of effective dialogue, much less consensus, on how to improve their health-care system. There is very little agreement between the Democratic and Republican parties on the solutions to problems and, with a few exceptions, little in the way of working towards common solutions. Such a climate tends to result in stasis, slowing down the country’s ability to further innovate and improve the system. Solving the most vexing health-care financing, delivery, and policy issues depends as much on finding common ground as it does on medical, social, behavioural, and organizational sciences.
9. Ap
pen
dices
9. Appendices
9.1 References
AACN (2008). Nursing Shortage Fact Sheet. American Association of Colleges of Nursing (http://www.aacn.nche.edu/Media/FactSheets/NursingShortage.htm, accessed 19 April 2013).
AARP (2011). Medicare beneficiaries’ out-of-pocket spending for health care (http://assets.aarp.org/rgcenter/ppi/health-care/i48-oop.pdf, accessed 19 April 2013).
Abaluck JT, Gruber J (2009). Choice inconsistencies among the elderly: evidence from plan choice in the Medicare Part D Program. National Bureau of Economic Research (NBER). Working Paper no. 14759 (http://www.nber.org/papers/w14759, accessed 19 April 2013).
Abelson R (2009). Insured, but bankrupted by health crises. The New York Times, 1 July 2009.Abelson R (2010). In health care overhaul, boons for hospitals and drug makers. The New
York Times, 21 March 2010.Abelson R, Harris G, Pear R (2011). Whatever court rules, major changes in health care likely
to last. The New York Times, 14 November 2011.Abrams M et al., (2011). Realizing health reform’s potential: how the Affordable Care Act will
strengthen primary care and benefit patients, providers, and payers. The Commonwealth Fund (http://www.commonwealthfund.org/~/media/Files/Publications/Issue%20Brief/2011/Jan/1466_Abrams_how_ACA_will_strengthen_primary_care_reform_brief_v3.pdf, accessed 19 April 2013).
Academic Ranking of World Universities (2012) (http://www.arwu.org/ARWU2010.jsp, accessed 19 April 2013).
ACP (2010). The patient-centered medical home neighbour: the interface of the patient-centered medical home with specialty/subspecialty practices. American College of Physicians Position Paper (www.acponline.org/advocacy/where_we_stand/policy/pcmh_neighbors.pdf, accessed 19 April 2013).
Adams AS, Soumerai SB, Ross-Degnan D (2001). The case for a medicare drug coverage benefit: a critical review of empirical evidence. Annual Review of Public Health 22:49–61.
Adamy J (2011). Steep rises in health premiums scrutinized. Wall Street Journal, 30 August 2011 (http://online.wsj.com/article/SB10001424053111903352704576538873548366708.html, accessed 19 April 2013).
Adler-Milstein J, Bates D, Jha A (2011a). A survey of health information exchange organizations in the United States: implications for meaningful use. Annals of Internal Medicine, 154(10):666–672.
Adler-Milstein J, DesRoches CM, Jha A (2011b). Health information exchange among US hospitals. American Journal of Managed Care, 17(2):761–768.

Health systems in transition United States of America376
Advisory Board Company (2013). The Daily Briefing. Where each state stands on ACA’s Medicaid expansion (http://www.advisory.com/Daily-Briefing/2012/11/09/MedicaidMap, accessed 19 April 2013).
Advisory Board Company (2008). Experts testifying before senate panel Extol incentives, standardization as means to improve quality of care. Medical News Today, 11 September 2008.
Agency for Healthcare Research and Quality (2011). Principles for the National Quality Strategy (http://www.ahrq.gov/workingforquality/nqs/principles.pdf, accessed 19 April 2013).
AHA (2009a). Report on the capital crisis: impact on hospitals (http://www.aha.org/content/00-10/090122capitalcrisisreport.pdf, accessed 19 April 2013).
AHA (2009b). Hospital Statistics, 2009. Health Forum, LLC, an American Hospital Association Company.
AHA (2009c). Teaching hospitals. Trendwatch, American Hospital Association, September 2009 (http://www.aha.org/research/reports/tw/twsept2009teaching.pdf, accessed 19 April 2013).
AHA (2010a). Fast facts (http://www.aha.org/research/rc/stat-studies/fast-facts.shtml, accessed 19 April 2013).
AHA (2010b). Percentage of hospitals reporting time on ambulance diversion in last 12 months. In: Trend Watch Chart Book, Chart 3.10, March 2010 (http://www.aha.org/research/reports/tw/chartbook/2010/chart3-10.ppt, accessed 19 April 2013).
AHA (2012). Trends in hospital financing. In: TrendWatch 2012, Chartbook, Ch 4 (http://www.aha.org/search?q=trendwatch+2012&site=redesign_aha_org, accessed 19 April 2013).
Ahnquist J, Wamala SP, Lindstrom M (2012). Social determinants of health: a question of social or economic capital? Interaction effects of socioeconomic factors on health outcomes. Social Science & Medicine, 74:930–939.
AHRQ (2011). National health care disparities report 2010 (http://www.ahrq.gov/qual/qrdr10.htm, accessed 19 April 2013).
Aiken L (2007). US nurse labor market dynamics are key to global nurse sufficiency. Health Services Research, 42(3 Pt 2):1299–1320.
Aizenman NC (2011). New study shows health insurance premium spikes in every state. Washington Post (National) 16 November 2011 (http://www.washingtonpost.com/national/health-science/new-study-shows-health-insurance-premium-spikes-in-every-state/2011/11/16/gIQAhBl7SN_story.html).
Akamigbo A, Wolinsky F (2007). New evidence of racial differences in access and their effects on the use of nursing homes among older adults. Medical Care, 45(7):672–679.
Akl E et al., (2007). The United States physician workforce and international medical graduates: trends and characteristics. Journal of General Internal Medicine, 22(2):264–268.
Alexander J et al., (2007). Does quality improvement implementation affect hospital quality of care? Hospital Topics, 85(2):3–12.
ALFA (2009). Senior living options. Assisted Living Federation of America (http://www.alfa.org/alfa/Assisted_Living_Information.asp, accessed 19 April 2013).
Altman S, Shactman D (2011). Power, politics, and universal health care: the inside story of a century-long battle. Amherst, NY: Prometheus Books.
Health systems in transition United States of America 377
American Academy of Actuaries (2010). Issue brief: risk assessment and risk adjustment (http://www.actuary.org/pdf/health/Risk_Adjustment_Issue_Brief_Final_5-26-10.pdf, accessed 19 April 2013).
American Hospital Association (2010). Underpayment by Medicare and Medicaid: fact sheet. December. (www.aha.org/aha/content/2010/pdf/10medunderpayment.pdf, accessed 19 April 2013).
American Medical Association (2007). Competition in health insurance: 2007 update (http://www.ama-assn.org/ama1/pub/upload/mm/368/compstudy_52006.pdf, accessed 19 April 2013).
American Medical Association (2012). Overview of the RBRVS (http://www.ama-assn.org/ama/pub/physician-resources/solutions-managing-your-practice/coding-billing-insurance/medicare/the-resource-based-relative-value-scale/overview-of-rbrvs.page?, accessed 19 April 2013).
Anderson G (2007). From ‘soak the rich’ to ‘soak the poor’: recent trends in hospital pricing. Health Affairs 26(4):780–789.
Angell M (2004). Excess in the pharmaceutical industry. Canadian Medical Association Journal, 171(12):1451–1453.
Antos JR, Pauly MV, Wilensky GR (2012). Bending the cost curve through market-based incentives (http://www.nejm.org/doi/full/10.1056/NEJMsb1207996#t=article, accessed 19 April 2013).
AOA (2011). National Family Caregiver Support Program. Administration on Aging of the Health and Human Services Administration (http://www.aoa.gov/AoA_programs/HCLTC/Caregiver/index.aspx, accessed 19 April 2013).
Appleby J (2010). New rules spell out protections for consumers with ‘limited benefit’ insurance policies: Waffle House and McDonald’s are among the employers who have been granted waivers exempting their plans from part of the health law for a year. Kaiser Health News, December (http://www.kaiserhealthnews.org/Stories/2010/December/09/mini-med-health-insurance-plans.aspx, accessed 19 April 2013).
Arah OA, Ogbu UC, Okeke CE (2008). Too poor to leave, too rich to stay: developmental and global health correlates of physician migration to the United States, Canada, Australia, and the United Kingdom. American Journal of Public Health, 98(1):184–154.
Asplin B et al., (2005). Insurance status and access to urgent ambulatory care follow-up appointments. JAMA, 294(10):1248–1254.
Audet A, Davis K, Schoenbaum S (2006). Adoption of patient-centered care practices by physicians: results from a national survey. Archives of Internal Medicine, 166(7):754–759.
Ayanian JZ et al., (2000). Unmet health needs of uninsured adults in the United States. JAMA, 284:2061–2069.
Ayanian JZ et al., (2003). Undiagnosed hypertension and hypercholesterolemia among uninsured and insured adults in the Third National Health and Nutrition Examination Survey. American Journal of Public Health, 93:2051–2054.
Baicker K & Chandra A (2004). Medicare spending, the physician workforce, and beneficiaries’ quality of care. Health Affairs. Web exclusive. April 7:W4–184.
Baicker K, Dow WH (2009). Risk selection and risk adjustment: improving insurance in the individual and small group markets. Inquiry, 46:215–228.
Baicker K, Cutler D, Song Z (2010). Workplace wellness programs can generate savings. Health Affairs, 29(2):1–8.
Health systems in transition United States of America378
Bailit H, Beazoglou T (2008). Financing dental care: trends in public and private expenditures for dental services. Dental Clinics of North America, 52(2):281.
Baker BE (2007). What reconstruction meant: historical memory in the American South. Charlottesville: University of Virginia Press.
Baker DW et al., (2004). Health literacy and use of outpatient physician services by Medicare managed care enrollees, Journal of General Internal Medicine, 19:215–220.
Baker EA, Metzler MM, Galea S (2005). Addressing social determinants of health inequities: learning from doing. American Journal of Public Health, 95(4):553–555.
Baker EL et al., (2005). The public health infrastructure and our nation’s health. Annual Review of Public Health, 26:303–318.
Baker J (2011). Tradition and toxicity: evidential cultures in the kava safety debate. Social Studies of Science, 41(3):361–384.
Baker S (2011a). GAO: new rules leading to lower healthcare premiums, cuts to agents’ fees. The Hill, 29 August 2011 (http://thehill.com/blogs/healthwatch/health-reform-implementation/178633-gao-new-mlr-rules-leading-to-lower-premiums-cuts-in-agents-fees, accessed 19 April 2013).
Baker S (2011b). HealthWatch: supreme court surprise: court will also hear medicaid challenge. The Hill, 14 November 2011.
Baker S (2011c). HHS grants 106 new healthcare waivers. The Hill, 19 August 2011 (http://thehill.com/blogs/healthwatch/health-reform-implementation/177581-hhs-grants-106-new-healthcare-waivers, accessed 19 April 2013).
Baker T (2007). The medical malpractice myth. Chicago, IL, University of Chicago Press.Bardia A et al., (2006). Efficacy of complementary and alternative medicine therapies
in relieving cancer pain: a systematic review. Journal of Clinical Oncology, 24(34):457–5464.
Barie P (2010). Infection control practices in ambulatory surgical centers. JAMA, 303(22):2295–2297.
Barr J et al., (2006). Using public reports of patient satisfaction for hospital quality improvement. Health Services Research, 41(3 Pt 1):663–682.
Bauer MS (2002). A review of quantitative studies of adherence to mental health clinical practice guidelines. Harvard Review of Psychiatry, 10(3):138–153.
Bee P, Barnes P, Luker K (2009). A systematic review of informal caregivers’ needs in providing home-based end-of-life care to people with cancer. Journal of Clinical Nursing, 18(10):1379–1393.
Bellinger J et al., (2010). Specialty care use in US patients with chronic diseases. International Journal of Environmental Research and Public Health, 7(3):975–990.
Bercovitz A, Sengupta M, Jamison P (2010). Electronic medical record adoption and use in home health and hospice. NCHS Data Brief, (45):1–8.
Berman S et al., (2002). Factors that influence the willingness of private primary care pediatricians to accept more Medicaid patients. Pediatrics, 110(2):239–248.
Bernstein S (2011). Restaurants revamping menus in response to calorie count rules. Los Angeles Times. 22 June 2011.
Best RA Jr (2005). Military medical care services: questions and answers. Congressional Research Service Retrieved, 1-29-12 from: (http://www.fas.org/sgp/crs/misc/IB93103.pdf, accessed 19 April 2013).

Health systems in transition United States of America 379
BHPr (2002). Projected supply, demand, and shortages of registered nurses: 2000–2020. July 2002 BHPr, HRSA, U.S. DHHS (http://bhpr.hrsa.gov/healthworkforce/reports/rnproject/default.htm, accessed 19 April 2013).
BHPr (2006). The registered nurse population: findings from the 2004 National Sample Survey of Registered Nurses. BHPr, HRSA, U.S. DHHS (http://bhpr.hrsa.gov/healthworkforce/rnsurvey04/, accessed 19 April 2013).
BHPr (2008). The physician workforce: projections and research into current issues affecting supply and demand. BHPr, HRSA, U.S. DHHS December 2008 (http://bhpr.hrsa.gov/healthworkforce/reports/physwfissues.pdf, accessed 19 April 2013).
BHPr (2010). The registered nurse population: findings from the 2008 National Sample Survey of Registered Nurses. BHPr, HRSA, U.S. DHHS (http://bhpr.hrsa.gov/healthworkforce/rnsurvey2008.html, accessed 19 April 2013).
Bielaszka-DuVernay C (2011). Vermont’s blueprint for medical homes, community health teams, and better health at lower cost. Health Affairs, 30(3):383–386.
Biles B, Arnold G, Guterman S (2011). Medicare Advantage in the era of health reform: progress in leveling the playing field, Issue brief. The Commonwealth Fund.
Biles B et al., (2006). The cost of privatization: extra payments to Medicare Advantage Plans (updated and revised). New York: Commonwealth Fund (http://www.allhealth.org/briefingmaterials/CostofPrivatization-ExtrapaymentstoMedicareAdvantage-IssueBrief-CWF-664.pdf, accessed 19 April 2013).
Blackstone E, Fuhr J (2007). Specialty hospitals: the economics and policy issues they pose. Journal of Health Care Finance, 34(2):1–9.
Blendon RJ et al., (2006). Americans’ view on health care costs, access, and quality. Milbank Quarterly 84(4):623–657.
Bloche M (2004). Health care disparities – science, politics, and race. The New England Journal of Medicine, 350(15):1568–1570.
Bloomberg (2008). Spending doubled as Obama led first billion dollar race in 2008 (http://www.bloomberg.com/apps/news?pid=newsarchive&sid=aerix76GvmRM&refer=home, accessed 19 April 2013).
BLS (2011a). Current population survey. Bureau of Labor Statistics, Department of Labor (http://www.bls.gov/cps/home.htm, accessed 19 April 2013).
BLS (2011b). Occupational Outlook Handbook, 2010–11 edn. Bureau of Labor Statistics, Department of Labor (http://www.bls.gov/oco/, accessed 19 April 2013).
BLS (2011c). Outpatient prescription drug coverage: drug coverage options show broader availability. In: Program Perspectives, 3(6). U.S. Bureau of Labor Statistics (http://www.bls.gov/opub/perspectives/program_perspectives_vol3_issue6.pdf, accessed 19 April 2013).
BLS (2012). Dentists. In: Occupational outlook handbook, 2010–11 edn. Bureau of Labor Statistics (http://www.bls.gov/oco/ocos072.htm, accessed 19 April 2013).
Blumberg L (2010). How will the PPACA impact individual and small group premiums in the short and long term? Washington: Urban Institute (http://www.urban.org/uploadedpdf/412128-PPACA-impact.pdf, accessed 19 April 2013).
Blumenthal D (2004). New steam from an old cauldron: the physician-supply debate. New England Journal of Medicine, 350(17):1780–1787.
Blumenthal D, Glaser J (2007). Information technology comes to medicine. New England Journal of Medicine, 356(24):2527–2534.
Health systems in transition United States of America380
Blumenthal D, Morone JA (2009). The heart of power: health and politics in the Oval Office. Berkeley, CA, University of California Press.
Boards of Trustees, Federal Hospital Insurance and Federal Supplementary Medicare Insurance Trust Funds (2011). 2011 annual report (https://www.cms.gov/Research-Statistics-Data-and-Systems/Statistics-Trends-and-Reports/ReportsTrustFunds/downloads/tr2011.pdf, accessed 19 April 2013).
Boards of Trustees, Federal Hospital Insurance and Federal Supplementary Medicare Insurance Trust Funds (2012). 2012 annual report (http://www.cms.gov/research-statistics-data-and-systems/statistics-trends-and-reports/reportstrustfunds/downloads/tr2012.pdf, accessed 24 July 2013).
Bodenheimer B, Pham HH (2010). Primary care: current problems and proposed solutions. Health Affairs, 29(5):799–805.
Bodenheimer T (2005). Medicine and public issues. High and rising health care costs. Part 3: the role of health care providers. Annals of Internal Medicine, 142(12 Part 1):996–1002.
Bodenheimer T (2008). Coordinating care: a perilous journey through the health care system. New England Journal of Medicine, 358:1064–1071.
Bodenheimer TS, Grumbach K (2012). Understanding health policy, 6th edn, New York: Lange.
Born W et al., (2004). Knowledge, attitudes, and beliefs about end-of-life care among inner-city African Americans and Latinos. Journal of Palliative Medicine, 7(2):247–256.
Borrell Associates (2012). Political advertising: the flood of 2012 (http://www.borrellassociates.com/component/virtuemart/?page=shop.product_details&flypage=garden_flypage.tpl&product_id=1025, accessed 19 April 2013).
van de Bovenkamp HM, Trappenburg MJ (2009). Reconsidering patient participation in guideline analysis. Health Care analysis, 17:198–216.
Bravin J (2011). Supreme test for health law. Wall Street Journal 15 November 2011.Brodie M et al., (2011a). Kaiser tracking poll: public opinion on health care issues
(November) (http://www.kff.org/kaiserpolls/upload/8259-F.pdf, accessed 19 April 2013).Brodie M et al., (2011b) Kaiser tracking poll: public opinion and health care issues (February)
(http://www.kff.org/kaiserpolls/upload/8156-F.pdf, accessed 19 April 2013).Brooks RG et al., (2002). The roles of nature and nurture in the recruitment and retention of
primary care physicians in rural areas: a review of the literature. Academic Medicine, 77(8):790–798.
Brown LD (2011). The elements of surprise: how health reform happened. Journal of Health Politics, Policy and Law, 36(3):419–427.
Bruno LF (2011). Urgent care centers, a merging trend in health care. Physicians News Digest (http://www.physiciansnews.com/2011/06/17/urgent-care-centers-a-merging-trend-in-health-care/#_ftn4, accessed 19 April 2013).
Bryant LL et al., (2004). Measuring healthcare outcomes to improve quality of care across post-acute care provider settings. Journal of Nursing Care Quality, 19(4):368–376.
Buchmueller TC (1998). Does a fixed-dollar premium contribution lower spending? Health Affairs 17(6):228–235.
Bueno H et al., (2010). Trends in length of stay and short-term outcomes among Medicare patients hospitalized for heart failure, 1993–2006. JAMA, 303(21):2141–2147.
Buerhaus PI, Auerbach DI, Staiger DO (2007). Recent trends in the registered nurse labor market in the US: short-run swings on top of long-term trends. Nursing Economics, 25(2):59–66.

Health systems in transition United States of America 381
Buerhaus PI, Staiger DO, Auerbach DI (2008). The future of the nursing workforce in the United States: data, trends and implications. Burlington, VT, Jones and Bartlett Publishers.
Buerhaus PI et al., (2006). State of the registered nurse workforce in the United States. Nursing Economics, 24(10): 5–12.
Bureau of Labor Statistics (2011). Employment situation summary (http://www.bls.gov/news.release/empsit.nr0.htm, accessed 19 April 2013).
BusinessWeek (2010). Congressional lobbyist spending rose to $3.47 billion in 2009 (http://cdn.businessweek.com/pfizer/congressional-lobbyist-spending-rose-to-347-billion-in-2009/13590430764293689979-d3a3bbd99155eb97f05db752578cd143/, accessed 19 April 2013).
Bustamante AM et al., (2011). U.S.–Mexico cross-border health insurance efforts: Salud Migrante and Medicare in Mexico after Health Care Reform in the U.S. Revista Panamericana de Salud Pública/Pan American Journal of Public Health, 31(1):74–80.
Butler PA (2000). ERISA preemption manual for state health policy makers. State Coverage Initiatives (www.statecoverage.org/node/2089, accessed 19 April 2013).
Byck GR, Cooksey JA, Russinof H (2005). Safety-net dental clinics: a viable model for access to dental care. Journal of the American Dental Association, 136(7):1013–1021.
Byrne CM et al., (2010). The value from investments in health information technology at the U.S. Department of Veterans Affairs. Health Affairs, 29(4):629–638.
Caban-Martinez AJ et al., (2007). Dental care access and unmet dental care needs among U.S. workers. Journal of the American Dental Association, 138(2):227–230.
California Department of Insurance (2010). 2010 Guide on Medicare Supplement insurance. Sacramento: California Department of Insurance.
California HealthCare Foundation (2006). Overuse of emergency departments among insured Californians. Oakland: CHCF. Issue brief (http://www.chcf.org/publications/2006/10/overuse-of-emergency-departments-among-insured-californians, accessed 19 April 2013).
California HealthCare Foundation (2009). California health care almanac (http://www.chcf.org/~/media/MEDIA%20LIBRARY%20Files/PDF/E/PDF%20EmployerBenefitsSurvey09.pdf, accessed 19 April 2013).
Calmes J (2011). Report: cuts in federal funding put public health preparedness at risk. NPR’s Health Blog (http://www.npr.org/blogs/health/2011/12/20/144021173/report-cuts-in-federal-funding-put-public-health-preparedness-at-risk, accessed 19 April 2013).
Camarota SA, Jensenius K (2009). A shifting tide: recent trends in the illegal immigrant population. Center for Immigration Studies (http://www.cis.org/illegalimmigration-shiftingtide, accessed 19 April 2013).
Carey MA (2010). Health law’s 8 new changes to insurance – with 7 caveats. Kaiser Health News, 24 September 2009.
Castor M et al., (2006). A nationwide population-based study identifying health disparities between American Indians/Alaska Natives and the general populations living in select urban counties. American Journal of Public Health, 96(8):1478–1484.
CDC (2008). National hospital ambulatory medical care survey: 2008 Emergency Department summary tables. Centers for Disease Control and Prevention, US DHHS (http://www.cdc.gov/nchs/data/ahcd/nhamcs_emergency/nhamcsed2008.pdf, accessed 19 April 2013).
Health systems in transition United States of America382
CDC (2009). The national nursing home survey: 2004 overview. Vital and Health Statistics Report from the Centers for Medicare and Medicaid Services. Series 13, No. 137, June 2009 (http://www.cdc.gov/nchs/data/series/sr_13/sr13_167.pdf, accessed 19 April 2013).
CDC (2010). CDC web site (http://www.cdc.gov/).CDC (2011a). People with disabilities: living healthy (http://www.cdc.gov/Features/
Disabilities/, accessed 19 April 2013).CDC (2011b). Health, United States, 2010, Tables 108, 113, Centers for Disease Control and
Prevention (http://www.cdc.gov/nchs/data/hus/hus10.pdf, accessed 19 April 2013).CDC (2012). Health, United States, 2011, Table 116, Centers for Disease Control and
Prevention (http://www.cdc.gov/nchs/data/hus/hus11.pdf, accessed 19 April 2013). Center for American Progress (2004). Prescription drug reimportation: the law and its
problems (http://www.americanprogress.org/issues/kfiles/b34780.html#_edn3, accessed 19 April 2013).
Center on Budget and Policy Priorities (2011). Where do our state tax dollars go? Center on Budget and Policy Priorities (http://www.cbpp.org/cms/index.cfm?fa=view&id=2783, accessed 19 April 2013).
Centers for Disease Control and Prevention (2003). Health, United States, 2003 (http://www.cdc.gov/nchs/data/hus/hus03.pdf, accessed 19 April 2013).
Centers for Disease Control and Prevention (2004). Health, United States, 2004 (http://www.cdc.gov/nchs/data/hus/hus04.pdf, accessed 19 April 2013).
Centers for Disease Control and Prevention (2005). Health, United States, 2005 (http://www.cdc.gov/nchs/data/hus/hus05.pdf, accessed 19 April 2013).
Centers for Disease Control and Prevention (2006). Health, United States, 2006 (http://www.cdc.gov/nchs/data/hus/hus06.pdf, accessed 19 April 2013).
Centers for Disease Control and Prevention (2007). Health, United States, 2007 (http://www.cdc.gov/nchs/data/hus/hus07.pdf, accessed 19 April 2013).
Centers for Disease Control and Prevention (2008a). Health, United States, 2008 (http://www.cdc.gov/nchs/data/hus/hus08.pdf, accessed 19 April 2013).
Centers for Disease Control and Prevention (2008b). National hospital ambulatory medical care survey: 2008 Emergency Department summary tables (http://www.cdc.gov/nchs/data/ahcd/nhamcs_emergency/nhamcsed2008.pdf, accessed 19 April 2013).
Centers for Disease Control and Prevention (2009a). Health, United States, 2009 (http://www.cdc.gov/nchs/data/hus/hus09.pdf, accessed 19 April 2013).
Centers for Disease Control and Prevention (2009b). The national nursing home survey: 2004 overview. Vital and Health Statistics Report from the Centers for Medicare and Medicaid Services. Series 13, No. 137, June 2009 (http://www.cdc.gov/nchs/data/series/sr_13/sr13_167.pdf, accessed 19 April 2013).
Centers for Disease Control and Prevention (2010a). CDC awards $13 million for preparedness and response learning centers; funding to maintain and develop public health responders as part of national security. Press release, 14 September 2010 (http://www.cdc.gov.www5.sph.uth.tmc.edu:2048/media/pressrel/2010/r100914.htm accessed 19 April 2013).
Centers for Disease Control and Prevention (2010b) [CDC web site] (http://www.cdc.gov/, accessed 19 April 2013).
Health systems in transition United States of America 383
Centers for Disease Control and Prevention (2011a). Health, United States, 2011 (http://www.cdc.gov/nchs/data/hus/hus11.pdf, accessed 19 April 2013).
Centers for Disease Control and Prevention (2011b). People with disabilities: living healthy (http://www.cdc.gov/Features/Disabilities/, accessed 19 April 2013).
Center for Health Care Strategies (2010). Sound practices in Medicaid payment for hospital care (http://www.chcs.org/publications3960/publications_show.htm?doc_id=1261182, accessed 19 April 2013).
Centers for Medicare & Medicaid Services (CMS) (nd, a). Administrative simplification provisions in the Patient Protection and Affordable Care Act of 2010 (ACA) (http://www.cms.gov/Regulations-and-Guidance/HIPAA-Administrative-Simplification/Affordable-Care-Act/Downloads/Summary-of-ACA-provisions-for-Administrative-Simplification.pdf, accessed 19 April 2013).
Centers for Medicare & Medicaid Services (CMS) (nd, b). Deadlines and key dates: HIPAA administrative simplification compliance (http://www.cms.gov/Regulations-and-Guidance/HIPAA-Administrative-Simplification/Affordable-Care-Act/Downloads/Deadlines-and-Key.pdf, accessed 19 April 2013).
Centers for Medicare & Medicaid Services (CMS) (nd, c). Medicare FFS physician feedback program/value-based payment modifier (http://www.cms.gov/Medicare/Medicare-Fee-for-Service-Payment/PhysicianFeedbackProgram/index.html, accessed 19 April 2013).
Centers for Medicare & Medicaid Services (2005). Pay For Performance (P4P) initiatives (https://www.cms.gov/apps/media/press/release.asp?Counter=1343, accessed 19 April 2013).
Centers for Medicare & Medicaid Services (2006). Inpatient rehabilitation facilities (https://www.cms.gov/Medicare/Provider-Enrollment-and-Certification/CertificationandComplianc/InpatientRehab.html, accessed 19 April 2013).
Centers for Medicare & Medicaid Services (2008). Deficit Reduction Act: important facts for state policymakers (https://www.cms.gov/DeficitReductionAct/Downloads/Costsharing.pdf, accessed 19 April 2013).
Centers for Medicare & Medicaid Services (2010). Health expenditures by age (https://www.cms.gov/NationalHealthExpendData/downloads/2004-age-tables.pdf, accessed 19 April 2013).
Centers for Medicare & Medicaid Services (2011a). Medicare supplier/provider enrollment (http://www.cms.gov/Manuals/IOM/itemdetail.asp?itemID=CMS019033, accessed 19 April 2013).
Centers for Medicare & Medicaid Services (2011b). Physician self referral (http://www.cms.gov/PhysicianSelfReferral/, accessed 19 April 2013).
Centers for Medicare & Medicaid Services (2011c). EMTALA (http://www.cms.gov/EMTALA/, accessed 19 April 2013).
Centers for Medicare & Medicaid Services (2011d). CfCs and CoPs (http://www.cms.gov/CFCsAndCoPs/, accessed 19 April 2013).
Centers for Medicare & Medicaid Services (2011e). Medicaid drug rebate program (http://www.cms.gov/MedicaidDrugRebateProgram/, accessed 19 April 2013).
Centers for Medicare & Medicaid Services (2011f). Estimated sustainable growth rate and conversion factors, for Medicare Payments to Physicians in 2012 (https://www.cms.gov/SustainableGRatesConFact/Downloads/sgr2012p.pdf, accessed 19 April 2013).

Health systems in transition United States of America384
Centers for Medicare & Medicaid Services (2011g). Health expenditures by state of residence (http/www.cms.gov/NationalHealthExpendData/downloads/resident-state-estimates.zip, accessed 19 April 2013).
Centers for Medicare & Medicaid Services (2011h). Medicaid dental services: overview. Centers for Medicare and Medicaid Services web page (http://www.cms.gov/Medicare/Coverage/MedicareDentalCoverage/index.html?redirect=/MedicareDentalCoverage/, accessed 19 April 2013).
Centers for Medicare & Medicaid Services (2011i) Comprehensive outpatient rehabilitation facility fact sheet (http://www.cms.gov/MLNProducts/downloads/Comprehensive_Outpatient_Rehabilitation_Facility_Fact_Sheet_ICN904085.pdf, accessed 19 April 2013).
Centers for Medicare & Medicaid Services (2012a). National health expenditures tables (https://www.cms.gov/Research-Statistics-Data-and-Systems/Statistics-Trends-and-Reports/NationalHealthExpendData/index.html, accessed 19 April 2013).
Centers for Medicare & Medicaid Services (2012b). What’s an ACO? Centers for Medicare and Medicaid Services web page (https://www.cms.gov/ACO/, accessed 19 April 2013).
Center for Medicare & Medicaid Services Board of Trustees (2011). 2011 Annual report of the Boards of Trustees of the Federal Hospital Insurance and Federal Supplementary Medical Insurance Trust Funds (https://www.cms.gov/Research-Statistics-Data-and-Systems/Statistics-Trends-and-Reports/ReportsTrustFunds/downloads/tr2011.pdf, accessed 19 April 2013).
Center for Studying Health Systems Change (2010). Wide variation in hospital and physician payment rates evidence of provider market power (http://hschange.org/CONTENT/1162/#ib5, accessed 19 April 2013).
Chaudhry B et al., (2006). Systematic review: impact of health information technology on quality, efficiency, and costs of medical care. Annals of Internal Medicine, 144(10):E12–E22.
Chen A, Yee H (2009). Improving the primary care-specialty care interface: getting from here to there. Archives of Internal Medicine, 169(11):1024–1026.
Chen C et al., (2009). The Kaiser Permanente electronic health record: transforming and streamlining modalities of care. Health Affairs, 28(2):323–333.
Chen S, Weir M (2009). The long shadow of the past: risk pooling and the political development of health care reform in the States. Journal of Health Politics, Policy and Law, 34(5):679–716.
Cheng S, Chen C, Hou Y (2010). A longitudinal examination of continuity of care and avoidable hospitalization: evidence from a universal coverage health care system. Archives of Internal Medicine, 170(18):1671–1677.
Cheong P (2007). Health communication resources for uninsured and insured Hispanics. Health Communication, 21(2):153–163.
Cheong P, Feeley T, Servoss T (2007). Understanding health inequalities for uninsured Americans: a population-wide survey. Journal of Health Communication, 12(3):285–300.
Choudhry NK et al., (2009). Drug company-sponsored patient assistance programs: a viable safety net? Health Affairs, 28(3):827–834.
Choudhry NK et al., (2011). Full coverage for preventive medications after myocardial infarction. New England Journal of Medicine, 10:1056–1045.

Health systems in transition United States of America 385
Christensen M, Remler D (2009). Information and communications technology in U.S. health care: why is adoption so slow and is slower better? Journal of Health Politics, Policy & Law, 34(6): 1011–1034.
Chukmaitov A et al., (2008). A comparative study of quality outcomes in freestanding ambulatory surgery centers and hospital-based outpatient departments: 1997–2004. Health Services Research, 43(5 Pt 1):1485–1504.
Chung B et al., (2010). Using a community partnered participatory research approach to implement a randomized controlled trial: planning community partners in care. Journal of Health Care for the Poor & Underserved, 21(3):780–795.
CIA (2013). The world factbook (http://www.cia.gov/library/publications/the-world-factbook/, accessed 19 April 2013).
Clancy C, Andresen E (2002). Meeting the health care needs of persons with disabilities. The Milbank Quarterly, 80(2):381–391.
Classen DC et al., (2011). ‘Global trigger tool’ shows that adverse events in hospitals may be ten times greater than previously measured. Health Affairs, 30(4):581–589.
Claxton G et al., (2010). Health benefits in 2010: premiums rise modestly, workers pay more toward coverage. Health Affairs, 29(10):1942–1950.
Claxton G et al., (2012). Health benefits in 2012: moderate premium increases for employer-sponsored plans; young adults gained coverage under ACA. Health Affairs (web exclusive) (http://content.healthaffairs.org/content/early/2012/09/07/hlthaff.2012.0708.full.pdf+html, accessed 19 April 2013).
CMS (2006). Inpatient rehabilitation facilities. Centers for Medicare and Medicaid Services web page (https://www.cms.gov/CertificationandComplianc/16_InpatientRehab.asp, accessed 19 April 2013).
CMS (2011a). Medicaid dental services: overview. Centers for Medicare and Medicaid Services web page (https://www.cms.gov/MedicaidDentalCoverage/, accessed 19 April 2013).
CMS (2011b). Comprehensive outpatient rehabilitation facility fact sheet (http://www.cms.gov/MLNProducts/downloads/COmprehensive_Outpatient_Rehabilitation_Facility_Fact_Sheet_ICN904085.pdf, accessed 19 April 2013).
CMS (2012). What’s an ACO? Centers for Medicare and Medicaid Services web page (https://www.cms.gov/ACO/, accessed 19 April 2013).
CNN (2008). Election tracker: ad spending (http://www.cnn.com/ELECTION/2008/map/ad.spending/, accessed 19 April 2013).
COGME (2005). Physician workforce policy guidelines for the United States, 2000–2020. Washington: Committee on Graduate Medical Education (www.cogme.gov/16.pdf, accessed 19 April 2013).
Cohen HS (1980). On professional power and conflict of interest: state licensing boards on trial. Journal of Health Politics, Policy and Law, 5:291–308.
Cohen M, March J, Olsen J (1972). A garbage can model of organizational choice. Administrative Science Quarterly, 17(1):1–25.
Cohen RA, Martinez ME (2007). Health insurance coverage: early release of estimates from the National Health Interview Survey, January–September 2006 (http://www.cdc.gov/nchs/nhis.htm, accessed 19 April 2013).
Health systems in transition United States of America386
Commission on Social Determinants of Health (2008). Closing the gap in a generation; health equity through action on the social determinants of health. World Health Organization. p.11 (http://www.who.int/social_determinants/thecommission/finalreport/en/index.html, accessed 19 April 2013).
Committee on Quality of Health Care in America (2001). Crossing the quality chasm: a new health system for the 21st century. Institute of Medicine. Washington, DC, National Academies Press.
Commonwealth Fund (2007). State scorecard data tables: supplement to aiming higher: results from state scorecard on health system performance, http://www.commonwealthfund.org/usr_doc/State_data_tables.pdf
Commonwealth Fund (2010a). What will happen under health reform – and what’s next? Columbia Journalism Review. May/June 2010, supplement.
Commonwealth Fund (2010b). Timeline for health care reform implementation; health insurance provisions (http://www.commonwealthfund.org/~/media/Files/Publications/Other/2010/Timeline%20Coverage_040110_v4.pdf, accessed 19 April 2013).
Commonwealth Fund (2010c). Timeline for health care reform implementation; system and delivery reform provisions (http://www.commonwealthfund.org/~/media/Files/Publications/Other/2010/Timeline%20System%20Reform_040110_v5_rev%2051310.pdf, accessed 19 April 2013).
Commonwealth Fund (2012). ChartCart (http://www.commonwealthfund.org/Maps-and-Data/ChartCart.aspx, accessed 19 April 2013).
Conbeer G (2007). Making the right long-term prescription for medical equipment financing. hfm (Healthcare Financial Management), 61(6):88–93.
Congressional Budget Office (2006). The sustainable growth rate formula for setting Medicare’s physician payment rates. Economic and Budget Issue Brief 6 September (http://www.cbo.gov/sites/default/files/cbofiles/ftpdocs/75xx/doc7542/09-07-sgr-brief.pdf, accessed 19 April 2013).
Congressional Budget Office (2007). Statement of Peter R Orszag before the Committee on the Budget, U.S. House of Representatives, 28 June 2007 (http://www.cbo.gov/ftpdocs/82xx/doc8265/06-28-MedicareAdvantage.pdf, accessed 19 April 2013).
Congressional Budget Office (2008). Key issues in analyzing major health insurance proposals (http://www.cbo.gov/ftpdocs/99xx/doc9924/12-18-KeyIssues.pdf, accessed 19 April 2013).
Congressional Budget Office (2010a). Letter to Speaker of the House, Honorable Nancy Pelosi. Congressional Budget Office. 20 January 2010 (http://www.cbo.gov/ftpdocs/113xx/doc11379/amendreconProp.pdf, accessed 19 April 2013).
Congressional Budget Office (2010b). Congressional Budget Office, 2010, H.R. 4872, Reconciliation Act of 2010 (Final Health Care Legislation). 20 March 2010 (http://www.cbo.gov/ftpdocs/113xx/doc11379/AmendReconProp.pdf, accessed 19 April 2013).
Congressional Budget Office (2011). Letter to Speaker of the House, Honorable John Boehner. Congressional Budget Office. 18 February (http://www.cbo.gov/ftpdocs/120xx/doc12069/hr2.pdf).
Congressional Budget Office (2012a). The U.S. Federal Budget (http://www.cbo.gov/publication/42636, accessed 19 April 2013).

Health systems in transition United States of America 387
Congressional Budget Office (2012b). Congressional Budget Office estimates for the insurance coverage provisions of the Affordable Care Act updated for the recent Supreme Court Decision, 24 July 2012 (http://www.cbo.gov/sites/default/files/cbofiles/attachments/43472-07-24-2012-CoverageEstimates.pdf, accessed 19 April 2013).
Congressional Budget Office (2012c). The health care system for veterans: an interim report (http://www.cbo.gov/sites/default/files/cbofiles/ftpdocs/88xx/doc8892/maintext.3.1.shtml, accessed 19 April 2013).
Congressional Research Service (2009). The market structure for the health insurance Industry (http://www.fas.org/sgp/crs/misc/R40834.pdf, accessed 19 April 2013).
Congressional Research Service (2010). Medicare provisions in PPACA (P.L. 111-148) (http://assets.opencrs.com/rpts/11-148_20100421.pdf, accessed 19 April 2013).
Conlan TJ, Posner PL (2011). Inflection point? Federalism and the Obama Administration. Publius: the Journal of Federalism, 41(3):421–446.
Connors E, Gostin L (2010). Health care reform – a historic moment in U.S. social policy. JAMA, 303(24):2521–2522.
Conti R, Busch A, Cutler D (2011). Overuse of antidepressants in a nationally representative adult patient population in 2005. Psychiatric Services, 62(7):720–726.
Cook FL (2011). The need for public deliberation: giving the public a voice on affordable health insurance. Journal of Health Politics, Policy and Law, 36(5):879–885.
Cook N et al., (2007). Access to specialty care and medical services in community health centers. Health Affairs, 26(5):1459–1468.
Cooper RA (2005). Physician migration: a challenge for America, a challenge for the world. Journal of Continuing Education in the Health Professions, 25:8–14.
Cooper RA (2008). States with more health care spending have better quality health care: lessons about Medicare. Health Affairs, 28(1):W103–W114.
Copeland V (2005). African Americans: disparities in health care access and utilization. Health & Social Work, 30(3):265–270.
Copnell B et al., (2009). Measuring the quality of hospital care: an inventory of indicators. Internal Medicine Journal, 39(6):352–360.
Corrigan P (2004). How stigma interferes with mental health care. American Psychologist, 59(7):614–625.
Council for Affordable Health Insurance (2009). Health savings accounts and preventive care (http://www.cahi.org/cahi_contents/resources/pdf/n153HSAPreventiveCare.pdf, accessed 19 April 2013).
Cram P et al., (2010). Uncompensated care provided by for-profit, not-for-profit, and government-owned hospitals. BMC Health Services Research, 10:90.
Cramer M et al., (2006). Comparative analysis of urban and rural nursing workforce shortages in Nebraska hospitals. Policy, Politics & Nursing Practice, 7(4):248–260.
Crimmins EM, Preston SH, Cohen B, eds (2011). Explaining divergent levels of longevity in high-income countries. Washington, DC,: National Academies Press (http://www.nap.edu/catalog.php?record_id=13089, accessed 19 April 2013).
Cronenwet L et al., (2011). The doctor of nursing practice: a national workforce perspective. Nursing Outlook, 59:9–17.
CRS Report for Congress (2009). Summary of the Employee Retirement Income Security Act (ERISA) (http://aging.senate.gov/crs/pension7.pdf, accessed 19 April 2013).

Health systems in transition United States of America388
Cullen KA, Hall MJ, Golosinskiy A (2009). Ambulatory surgery in the United States, 2006. National Health Statistics Report No. 11, January 2009, for the Centers for Disease Control and Prevention U.S. DHHS (revised 4 September 2009).
Cunningham P (2011). State variation in primary care physician supply: implications for health reform Medicaid expansions. Center for Health System Change Research Brief http://www.rwjf.org/files/research/72046.pdf, accessed 19 April 2013).
Cunningham PJ (2009). Beyond parity: primary care physicians’ perspectives on access to mental health care. Health Affairs, 28:w490–w501.
Cunningham PJ, May JH (2006). Medicaid patients increasingly concentrated among physicians. Tracking Report No. 16, Center for Studying Health System Change (http://hschange.org/CONTENT/866/, accessed 19 April 2013).
Cunningham PJ, O’Malley AS (2008). Do reimbursement delays discourage Medicaid participation by physicians? Health Affairs, 28(1):W17–W28.
Cunningham R (2000). Letter to the editor. Health Affairs 19(3):285.Cutler DM, Ly DP (2011). The (paper)work of medicine: understanding international medical
costs. Journal of Economic Perspectives, 25(2):3–25.Cutler DM, McClellan M (2001). Is technological change in medicine worth it? Health Affairs,
20(5):11–29. Cutler DM, Davis K, Stremikis K (2009). Why health reform will bend the cost curve.
Issue brief. Center for American Progress and The Commonwealth Fund. 72, pub. 1351. December.
Danis M et al., (2006). How does lack of insurance affect use of intensive care? A population-based study. Critical Care Medicine, 34(8):2043–2048.
Danzon PM, Pauly MV (2001). Insurance and new technology: From hospital to drugstore. Health Affairs, 20(5):86–100.
Davis K, Schoen C, Stremikis K (2010). Mirror, mirror on the wall: the performance of the U.S. health care system compares internationally. New York City: Commonwealth Fund (http://www.commonwealthfund.org/~/media/Files/Publications/Fund%20Report/2010/Jun/1400_Davis_Mirror_Mirror_on_the_wall_2010.pdf, accessed 19 April 2013).
Davis K et al., (2010). Starting on the path to a high F health system: analysis of the payment and system reform provisions in the Patient Protection and Affordable Care Act of 2010. The Commonwealth Fund. September 2010 (http://www.commonwealthfund.org/Publications/Fund-Reports/2010/Sep/Analysis-of-the-Payment-and-System-Reform-Provisions.aspx?page=all, accessed 19 April 2013).
Daw C, Truong D, Rosenau P (2011). Health policy in the United States: consumers and citizens in a market polity. In: Lofgren H, de Leeuw E, Leahy M, eds. Democratizing health: consumer groups in the policy process. Cheltenham, Edward Elgar.
Deb P (2010). Trends in case mix in the Medicare population. Presented to: American Hospital Association, Federation of American Hospitals & Association of American Medical Colleges 15 July 2010 (http://www.aha.org/content/00-10/100715-CMItrends.pdf, accessed 19 April 2013).
DeBell M, Chapman C (2006). Computer and internet use by students in 2003 (NCES 2006–065). U.S. Department of Education. Washington, DC: National Center for Education Statistics (http://nces.ed.gov/pubs2006/2006065.pdf, accessed 19 April 2013).
Decker SL (2011). Medicaid payment levels to dentists and access to dental care among children and adolescents. Journal of the American Medical Association, 306(2):187–193.
Health systems in transition United States of America 389
DeLia D, Cantor J (2009). Emergency department utilization and capacity. Research Synthesis Report No. 17, July 2009 (http://www.rwjf.org/content/dam/farm/reports/reports/2009/rwjf43565, accessed 19 April 2013).
DeNavas-Walt C, Proctor BD, Smith JC (2011). Income, poverty, and health insurance coverage in the United States: 2010. Current Population Report for the Census Bureau (http://www.census.gov/prod/2011pubs/p60-239.pdf, accessed 19 April 2013).
Department of Health and Human Services Office of the Inspector General (2009). Comparing pharmacy reimbursement: Medicare Part D to Medicaid (http://oig.hhs.gov/oei/reports/oei-03-07-00350.pdf, accessed 19 April 2013).
DeSario J (1982). Demise of health planning in the United States: the politics of incremental health policy information. Journal of Public Health Policy, 3(2):164–177.
Deshpande SP, DeMello J (2011). A comparative analysis of factors that hinder primary care physicians’ and specialist physicians’ ability to provide high-quality care. Health Care Manager, 30(2):172–178.
Desmond KA et al., (2007). The burden of out-of-pocket health spending among older versus younger adults: analysis from the Consumer Expenditure Survey, 1998–2003. Kaiser Family Foundation. September (http://www.kff.org/medicare/upload/7686.pdf, accessed 19 April 2013).
DesRoches C et al., (2008). Electronic health records in ambulatory care – a national survey of physicians. New England Journal of Medicine, 359(1):50–60.
DesRoches CM et al., (2010). Electronic health records’ limited successes suggest more targeted uses. Health Affairs, 29(4):639–646.
Diller P (2007). Intrastate preemption. Boston University Law Review, 87:1113–1176.DiMasi JA, Hansen RW, Grabowski HG (2003). The price of innovation: new estimates of
Environmental Protection Agency (2011b). EPA History 1970–1985 (http://www.epa.gov/aboutepa/history/topics/epa/15b.html, accessed 19 April 2013).
Dimick J, Welch H, Birkmeyer J (2004). Surgical mortality as an indicator of hospital quality: the problem with small sample size. Journal of the American Medical Association, 292(7):847 –851.
Dixon A, Greene J, Hibbard J (2008). Do consumer-driven health plans drive enrollees’ health care behavior? Health Affairs, 27:1120–1131.
Docteur E, Berenson RA (2009). How does the quality of U.S. health care compare internationally? Washington, DC, The Urban Institute (http://www.urban.org/uploadedpdf/411947_ushealthcare_quality.pdf, accessed 19 April 2013).
Dolan PL (2011). After spate of closures, retail clinics may be on upswing. Amednews, 25 February (http://www.ama-assn.org/amednews/2011/02/21/bisf0225.htm, accessed 19 April 2013).
Dolan TA, Atchison K, Huynh TN (2005). Access to dental care among older adults in the United States, Journal of Dental Education, 69(9):961–974.
Donelan K et al., (2002). Challenged to care: informal caregivers in a changing health system. Health Affairs, 21(4):222–231.
Dor A, Encinosa W (2010). How does cost-sharing affect drug purchases? Insurance regimes in the private market for prescription drugs. Journal of Economics and Management Strategy, 19(3):545–574.

Health systems in transition United States of America390
Druss B et al., (2008). Trends in mental health and substance abuse services at the nation’s community health centers: 1998–2003. American Journal of Public Health, 96(10):1779–1784.
Dunn S, Wilson B, Esterman A (2005). Perceptions of working as a nurse in an acute care setting. Journal of Nursing Management, 13:22–31.
Dussault G, Francheschini MC (2006). Not enough there, too many here: Understanding geographical imbalances in the distribution of the health workforce. Human Resources and Health, 4(12):1–28.
Dwyer L et al., (2010). Polypharmacy in nursing home residents in the United States: results of the 2004 National Nursing Home Survey. American Journal of Geriatric Pharmacotherapy, 8(1):63–72.
Editorial (2005). Katrina reveals fatal weaknesses in US public health. The Lancet, 366(9489):86.
Egede L, (2006). Race, ethnicity, culture, and disparities in health care. Journal of General Internal Medicine, 21(6):667–669.
Ellis R, (2001). Formal risk adjustment by private employers. Inquiry, 38(3):299–309.Elrod C, DeJong G (2008). Determinants of utilization of physical rehabilitation services for
persons with chronic and disabling conditions: an exploratory study. Archives of Physical Medicine & Rehabilitation, 89(1):114–120.
Emanual E et al., (2012). A systematic approach to containing health care spending. New England Journal of Medicine (published online 1 August 2012) (http://www.nejm.org/doi/full/10.1056/NEJMsb1205901, accessed 19 April 2013).
Employee Benefit Research Institute (2009). Health plan differences: fully-insured vs. self-insured (http://www.ebri.org/pdf/FFE114.11Feb09.Final.pdf, accessed 19 April 2013).
Ennis SR, Ríos-Vargas M, Albert NG (2011). The Hispanic population 2010. U.S. Census Bureau 2010 Census Briefs (http://www.census.gov/prod/cen2010/briefs/c2010br-04.pdf, accessed 19 April 2013).
Enthoven A, Kronick R (1989). A consumer-choice health plan for the 1990s. New England Journal of Medicine, 320(1):29–37.
Enthoven E, (1980). Health plan: the only practice solution to the soaring cost of medical care. Reading, MA, Addison-Wesley.
Epstein R, Street R (2011). The values and value of patient-centered care. Annals of Family Medicine, 9(2):100–103.
Ervin M, (2004). Unequal access to hospice and palliative care. Journal of Palliative Medicine, 7(2):301–302.
Evans D, (2009). Pfizer broke the law by promoting drugs for unapproved uses. Bloomberg (http://www.bloomberg.com/apps/news?pid=newsarchive&sid=a4yV1nYxCGoA, accessed 19 April 2013).
Families USA (2011a). The Affordable Care Act: patients’ Bill of Rights and other protections (http://familiesusa2.org/assets/pdfs/health-reform/Patients-Bill-of-Rights.pdf, accessed 19 April 2013).
Families USA (2011b). Rate bands (http://www.familiesusa.org/issues/private-insurance/rate-regulation-41-rate.html, accessed 19 April 2013).
Feder JL, (2011). Can a federal health exchange work? Politico, 18 June 2011 (http://www.politico.com/news/stories/0711/59267.html, accessed 19 April 2013).
Health systems in transition United States of America 391
Feder JM, (1977). Medicare: the politics of federal hospital insurance. Lanham, MD, Lexington Books.
Federal Election Spending (2013). 2012 House and Senate campaign finance (http://www.fec.gov/disclosurehs/hsnational.do, accessed 19 April 2013).
Federation of American Scientists (2011). Office of Technology Assessment Act (http://www.fas.org/ota/technology_assessment_and_congress/otaact/, accessed 19 April 2013).
Felder TM et al., (2011). What is the evidence for pharmaceutical patient assistance programs? A systematic review. Journal of Health Care for the Poor and Underserved, 22:24–49.
Ferrier GD, Valdmanis VG (2008). Efficiency and productivity changes in large urban hospitals 1994–2002: ownership, markets, and the uninsured. In: Blank JT, Valdmanis VG, eds. Evaluating Hospital policy and performance: Contributions from hospital policy and productivity research. Amsterdam, Elsevier:157–176.
Field MJ, Cassel CK (1997). Approaching death: improving care at the end of life. Institute of Medicine. Washington DC, National Academies Press (http://www.nap.edu/catalog/5801.html, accessed 19 April 2013).
Field R, (2007). Health care regulation in America. Oxford, Oxford University Press.Finkelstein EA, (2005). The aggregate effects of health insurance evidence from the
introduction of Medicare. National Bureau of Econmic Research. Working paper 11619. (http://www.nber.org/papers/w11619.pdfPnew_window=1).
Finkelstein EA et al., (2009). Annual medical spending attributable to obesity: payer-and service-specific estimates. Health Affairs (web exclusive) 27 July:W822–W831.
Fisher E, Goodman D, Skinner J, Bronner K (2009). Health care spending, quality, and outcomes: More isn’t always better. Dartmouth Atlas Project Topic Brief. Accessed on 27 February, 2010, from: (http://www.dartmouthatlas.org/downloads/reports/Spending_Brief_022709.pdf, accessed February 27, 2013).
Fisher ES et al., (2003a). The implications of regional variations in Medicare spending Part 1: the content, quality, and accessibility of care. Ann Inn Med 138:273–287.
Fisher ES, et al.(2003b). The implications of regional variations in Medicare spending Part 2: health outcomes and satisfaction with care. Ann Inn Med 138:288 – 298.
Fisher E et al., (2009). Health care spending, quality, and outcomes: more isn’t always better. Dartmouth Atlas Project Topic Brief (http://www.dartmouthatlas.org/downloads/reports/Spending_Brief_022709.pdf, accessed 19 April 2013).
Fisher DE, James WD (2010). Indoor tanning – science, behavior, and policy. New England Journal of Medicine, 363:10.
Fleming S et al., (1995). Rural hospital closures and access to services. Hospital & Health Services Administration, 40(2):247–262.
Fleury A, (1981). Minor surgery in the office of the primary care physician. Medical Times, 109(9):31–37.
Flynn L, Aiken LH (2002). Does international nurse recruitment influence practice values in U.S. hospitals? Journal of Nursing Scholarship, 34(1):67–73.
Fogel LA, Gossman-Klim K (1995). Getting started with subacute care. Health Care Financial Management, 49(10):64–65,68.

Health systems in transition United States of America392
Foley DJ et al., (2004). Highlights of organized mental health services in 2002 and major national and state trends. In: Manderscheid RW, Berry JT, eds. Mental health, United States 2004. Rockville, MD, Substance Abuse and Mental Health Services Administration, p.203, Table 19.2 (http://store.samhsa.gov/shin/content/SMA06-4195/SMA06-4195.pdf, accessed 19 April 2013).
Food and Drug Administration (2011a). Overview of device regulation (http://www.fda.gov/MedicalDevices/DeviceRegulationandGuidance/Overview/default.htm, accessed 19 April 2013).
Food and Drug Administration (2011b). Medical device safety (http://www.fda.gov/MedicalDevices/Safety/default.htm, accessed 19 April 2013).
Food and Drug Administration (2012). Implementation of the Biologics Price Competition and Innovation Act of 2009 (http://www.fda.gov/Drugs/GuidanceComplianceRegulatoryInformation/ucm215089.htm, accessed 19 April 2013).
Formicola A et al., (2008). Strengthening the oral health safety net: delivery models that improve access to oral health care for uninsured and underserved populations. American Journal Of Public Health, 98:S86–8.
Forrest C, (2006). Strengthening primary care to bolster the health care safety net. JAMA, 295(9):1062–1064.
Forrest CB, (2009). A typology of specialists’ clinical roles. Archives of Internal Medicine, 169(11):1062–1068.
Forrest C et al., (2006). Primary care physician specialty referral decision making: patient, physician, and health care system determinants. Medical Decision Making, 26(1):76–85.
Fowler FJ et al., (2008). Relationship between regional per capita Medicare expenditures and patient perceptions of quality of care. JAMA 299:2406 – 12.
Fowler R et al., (2010). The association between health insurance status and access, care delivery, and outcomes for patients who are critically ill. American Journal of Respiratory & Critical Care Medicine, 181(9):1003–1011.
Fowler-Brown A et al., (2007). Risk of cardiovascular events and death – does insurance matter? Journal of General Internal Medicine, 22:502–507.
Fox S, (2011). The social life of health information. Pew Research Center’s Internet and American Life Project (http://pewinternet.org/~/media//Files/Reports/2011/PIP_Social_Life_of_Health_Info.pdf, accessed 19 April 2013).
Franzini L, Ribble JC, Keddie AM (2001). Understanding the Hispanic paradox. Ethnicity and Disease 11(3):496–518.
Friedberg MW, Hussey PS, Schneider EC (2010). Primary care: a critical review of the evidence on quality and costs of health care. Health Affairs, 29(5):766–772.
Friedman E, (2008). Surf, turf, and the future of primary care. Hospitals & Health Networks, 6 June 2008 (http://www.hhnmag.com/hhnmag_app/jsp/printer_friendly.jsp?dcrPath=HHNMAG/Article/data/06JUN2008/080603HHN_Online_Friedman&domain=HHNMAG, accessed 19 April 2013).
Friedman M, Friedman RD, (1990). Free to choose: a personal statement. New York, NY, Mariner Books.
Friedman MS et al., (2001). Impact of changes in transportation and commuting behaviors during the 1996 summer Olympic Games in Atlanta on air quality and childhood asthma. JAMA, 285(7):897–905.

Health systems in transition United States of America 393
Fujisawa R, Lafortune G (2008). The remuneration of general practitioners and specialists in 14 OECD countries: what are the factors influencing variations across countries? OECD Working Papers #41 (http://www.oecd.org/dataoecd/51/48/41925333.pdf, accessed 19 April 2013).
Gabel JR, (1999). Job-based health insurance, 1977–1988: the accidental system under scrutiny. Health Affairs, 18(6):62–74.
Gabel JR, Redisch MA (1979). Alternative physician payment methods: incentives, efficiency, and national health insurance. Milbank Memorial Fund Quarterly, 57(1):38 –59.
Gabel JR, Jensen GA, Hawkins S (2003). Self-insurance in times of growing and retreating managed care. Health Affairs, 22:202–210.
Gabow P, Halvorson G, Kaplan G (2012). Marshaling leadership for high-value health care: an Institute of Medicine discussion paper”, JAMA, 308(3):239–240 (http://jama.jamanetwork.com/article.aspx?articleid=1172505#ref-jvp120035-8, accessed 19 April 2013).
Galewitz P, (2011a). Administration scales back expansion of Community Health Centers. Kaiser Health News, 6 October 2011 (http://www.kaiserhealthnews.org/Stories/2011/October/06/community-health-centers-expansion-scaled-back.aspx?p=1, accessed 19 April 2013).
Galewitz P, (2011b). Some programs OK’d by health law lack funding. Kaiser Health News, 9 June 2011 (http://www.kaiserhealthnews.org/Stories/2011/June/09/unfunded-appropriations-health-law.aspx, accessed 19 April 2013).
Galewitz P (2013). States balk at enforcing health law’s insurance protections. Capsules, Kaiser Health News, 19 March 2013 (http://capsules.kaiserhealthnews.org/index.php/2013/03/some-states-balk-at-enforcing-health-laws-insurance-protections/?utm_source=intop&utm_medium=email&utm_campaign=032713, accessed 19 April 2013).
Galewitz P, Andrews M (2010). New rules guarantee patients’ right to appeal insurance claim denials. Kaiser Health News (http://www.kaiserhealthnews.org/Stories/2010/July/22/insurance-denials.aspx, accessed 19 April 2013).
Galston W (2010). Why a hyper-polarized party system weakens America’s democracy. The Hedgehog Review (Fall) (http://www.iasc-culture.org/THR/archives/Fall2010/Galston_lo.pdf, accessed 19 April 2013).
GAO (2009). Hospital emergency departments: crowding continues to occur, and some patients wait longer than recommended time frames. Washington, DC, US Government Accountability Office (http://www.gao.gov/new.items/d09347.pdf, accessed 19 April 2013).
Gardner TF et al., (2005). Patient anxiety and patient satisfaction in hospital-based and freestanding ambulatory surgery centers. Journal of Nursing Care Quality, 20(3):238–243.
Garets D, Davis M (2006). Electronic medical records vs. electronic health records: yes, there is a difference. HIMSS Analytics White Paper, updated 26 January 2006 (www.himssanalytics.org/docs/WP_EMR_EHR.pdf, accessed 19 April 2013).
Garfinkel D, Mangin D (2010). Feasibility study of a systematic approach for discontinuation of multiple medications in older adults: addressing polypharmacy. Archives of Internal Medicine, 170(18):1648–1654.
Health systems in transition United States of America394
Geiger K, Hamburger T (2009). Healthcare reform wins over doctors lobby; the American Medical Association, once opposed to any government overhaul, now has more to gain, including a proposal worth billions of dollars to physicians. Los Angeles Times, 15 September 2009 (http://articles.latimes.com/print/2009/sep/15/nation/na-lobbying-ama15, accessed 19 April 2013).
Geiger-Brown J et al., (2004). Nurses’ perception of their work environment, health, and well-being: a qualitative perspective. AAOHN Journal, 52(1):16–22.
Gencarelli D (2003). Medicaid prescription drug coverage: state efforts to control costs. NHPF Issue Brief/National Health Policy Forum, George Washington University, 790:1–17.
George MG et al., (2011). Trends in stroke hospitalizations and associated risk factors among children and young adults, 1995–2008. Annals of Neurology 70:713–721.
Georgetown University Long-Term Care Financing Project (2007). Medicare long-term care fact sheet (http://ltc.georgetown.edu/pdfs/medicare0207.pdf, accessed 19 April 2013).
Gitterman P, Scott JC (2011). Obama lies, grandma dies: the uncertain politics of Medicare and the Patient Protection and Affordable Care Act. Journal of Health Politics, Policy and Law 36(3):555–563.
Golann D (2011). Dropped medical malpractice claims: their surprising frequency, apparent causes, and potential remedies. Health Affairs, 30(7):1343–1349.
Gold J (2013). Poll: three years later, Americans still don’t understand Health Law. Capsule, Kaiser Health News, 20 March 2013 (http://capsules.kaiserhealthnews.org/index.php/2013/03/poll-three-years-later-americans-still-dont-understand-health-law/, accessed 19 April 2013).
Gold M et al., (2011). Medicare Advantage enrollment market update, September (http://www.kff.org/medicare/upload/8228.pdf, accessed 19 April 2013).
Goldzweig CL et al., (2009). Costs and benefits of health information technology: new trends from the literature. Health Affairs (web exclusive), 27 January, w282–w293.
Goodell S, Swartz K (2010). Cost-sharing: effects on spending and outcomes. Robert Wood Johnson Foundation, The Synthesis Project, Issue Brief, No. 20. December (http://www.rwjf.org/files/research/121710.policysynthesis.costsharing.brief.pdf, accessed 19 April 2013).
Goodman D, Fisher E (2008). Physician workforce crisis? Wrong diagnosis, wrong prescription. New England Journal of Medicine, 358(16):1658–1661.
Goodman D, Grumbach K (2008). Does having more physicians lead to better health system performance?” JAMA, 299(3):335,337.
Goodnough A (2012). Insurance rebates seen as selling point for health law. New York Times, 30 July 2012 (http://www.nytimes.com/2012/07/31/health/policy/insurance-rebates-seen-as-early-benefit-of-health-care-law.html?_r=1&nl=health&emc=edit_hh_20120731&pagewanted=print, accessed 19 April 2013).
Government Accountability Office (2005). Ultimate effects of McCarran-Ferguson federal antitrust exemption on insurer activity are unclear (http://www.gao.gov/assets/100/93507.html, accessed 19 April 2013).
Gradinscak D et al., (2004). Risks of outpatient angiography and interventional procedures: a prospective study. American Journal of Roentgenology, 183(2):377–381.
Grasso BC et al., (2003). Use of chart and record reviews to detect medication errors in a state psychiatric hospital. Psychiatric Services, 54(5):677–681.

Health systems in transition United States of America 395
Greenlee K (2011). Memorandum on the CLASS Program. Wall Street Journal. 14 October 2011 (http://online.wsj.com/public/resources/documents/Classdecision.pdf, accessed 19 April 2013).
Greer SL (2011). The states’ role under the Patient Protection and Affordable Care Act. Journal of Health Politics, Policy and Law 36(3):469–473.
Grogan CM (2011). You call it public, I call it private; let’s call the whole thing off. Journal of Health Politics, Policy and Law, 36(3):401–411.
Grossman JM, Zayas-Cabán T, Kemper N (2009). Information gap: can health insurer personal health records meet patients’ and physicians’ needs? Health Affairs, 28(2):177–189.
Gruber J (2010). The tax exclusion for employer-sponsored health insurance. National Bureau of Economic Research (http://www.nber.org/papers/w15766.pdf, accessed 19 April 2013).
Grumbach K, Mendoza R (2008). Disparities in human resources: addressing the lack of diversity in the health professions. Health Affairs, 27(2):413–422.
Guay AH (2004). Access to dental care. JAMA, 135(6):779–785. Gulley S, Rasch E, Chan L (2011). Ongoing coverage for ongoing care: access, utilization,
and out-of-pocket spending among uninsured working-aged adults with chronic health care needs. American Journal of Public Health, 101(2):368–375.
Guterman S (2006). Specialty hospitals: a problem or a symptom? Health Affairs, 25(1):95–105.
Haberkorn J (2010). Health care choices fall to states. Politico, 22 July 2010 (http://www.politico.com/news/stories/0710/40069.html, accessed 19 April 2013).
Haberkorn J (2012). Health policy brief; the prevention and public health fund. Health Affairs, 23 February 2012 (http://www.healthaffairs.org/healthpolicybriefs/brief.php?brief_id=63, accessed 19 April 2013).
Hacker JS (2011). Why reform happened. Journal of Health Politics, Policy and Law, 36(3):437–441.
Hadley J (2007). Insurance coverage, medical care use, and short-term health changes following an unintentional injury or the onset of a chronic condition. JAMA, 297(10):1073–1084.
Hadley J, Cunningham P (2004). Availability of safety net providers and access to care of uninsured persons. Health Services Research, 39(5):1527–1546.
Hadley J et al., (2008). Covering the uninsured in 2008: current costs, sources of payment, and incremental costs. Health Affairs, 27(5):399–415.
Hall MA (2011). Risk adjustment under the Affordable Care Act: a guide for federal and state regulators. Issue Brief, The Commonwealth Fund, May (http://www.commonwealthfund.org/~/media/Files/Publications/Issue%20Brief/2011/May/1501_Hall_risk_adjustment_ACA_guide_for_regulators_ib.pdf, accessed 19 April 2013).
Harrington C, Carrillo H, Blank BW (2010). Nursing facilities, staffing, residents and facility deficiencies, 2000 through 2009 (web report) http://www.theconsumervoice.org/sites/default/files/advocate/action-center/OSCAR-2010.pdf, accessed 19 April 2013).
Harrington C, Mukamel D, Rosenau P (2012). Exploring the concept of medical loss ratios (MLRs) for nursing homes. Issue Brief. Prepared for the Kaiser Family Foundation.
Harrington C et al., (2005). Trends in the supply of long-term-care facilities and beds in the United States. Journal of Applied Gerontology, 24(4):265–282.

Health systems in transition United States of America396
Harris G, (2009). Hawaii’s health system offers wide coverage and low costs. New York Times, 17 October 2009.
Harris G, (2011a). Family physician can’t give away solo practice. New York Times, 22 April 2011 (http://www.nytimes.com/2011/04/23/health/23doctor.html?_r=1&pagewanted=1&hp, accessed 19 April 2013).
Harris G, (2011b). Agency head outlines difficulties and risks of food and drug imports. New York Times, 21 June 2011.
Harrison TD, (2007). Consolidations and closures: an empirical analysis of exits from the hospital industry. Health Economics, 16(5):457–474.
Hartley DMI, Christianson J (1996). Mobile technology in rural hospitals: the case of the CT scanner. Health Services Research, 31 (2):213–34.
Hasan O, Orav E, Hicks L (2010). Insurance status and hospital care for myocardial infarction, stroke, and pneumonia. Journal of Hospital Medicine, 5(8):452–459.
Hauck K, Zhao X (2011). How dangerous is a day in hospital?: a model of adverse events and length of stay for medical inpatients. Medical Care, 49(12):1068–1075.
Hawkins D, Groves D (2011). The future role of community health centers in a changing health care landscape. Journal of Ambulatory Care Management, 34(1):90–99.
Health Affairs (2010). Accountable care organizations. 27 July 2010 (http://www.healthaffairs.org/healthpolicybriefs/brief.php?brief_id=20, accessed 19 April 2013).
Health Affairs (2011). Medicare Advantage Plans. 15 June 2011 (http://www.healthaffairs.org/healthpolicybriefs/brief.php?brief_id=48, accessed 19 April 2013) (http://www.healthcare.gov/news/factsheets/2011/08/bundling08232011a.html, accessed 19 April 2013).
HealthCare.gov (2010). Small employer tax credits (www.healthcare.gov/law/features/employers/small-employer-tax-credit/index.html, accessed 19 April 2013).
HealthCare.gov (2011). How does the Affordable Care Act impact American Indians and Alaska Natives? (http://www.healthcare.gov/news/factsheets/2011/03/americanindianhealth03212011a.html, accessed 19 April 2013).
Hellinger FJ (2009). Tax-exempt hospitals and community benefits: a review of state reporting requirements. Journal of Health Politics, Policy and Law, 34:37–61.
Helms RB (2008). Tax policy and the history of the health insurance industry. American Enterprise Institute (http://www.americantaxpolicyinstitute.org/pdf/health_conference/Helms.pdf, accessed 19 April 2013).
Helvin L (2008). Caring for the uninsured: are not-for-profit hospitals doing their share? Yale Journal of Health Policy, Law, and Ethics, 8(2):421–470.
Henderson J (1989). Physician office-based surgery: significant growth opportunity. Health Industry Today, 52(2):18.
Hersh W (2009). A stimulus to define informatics and health information technology. BMC Medical Informatics & Decision Making, 9:24.
Hesse BW et al., (2005). Trust and sources of health information; the impact of the internet and its implications for health care providers: findings from the first Health Information National Trends Survey. Archives of Internal Medicine, 165:2618–2624.
HFMA (2003). How are hospitals financing the future? Access to capital in health care today. Healthcare Financial Management, 57(11):51–53.
HFMA (2004). How are hospitals financing the future? Capital spending in health care today. Healthcare Financial Management, 58(1):43–47.

Health systems in transition United States of America 397
Hiller EH, Landenburger G, Natowicz MR (1997). Public participation in medical policy-making and the status of consumer autonomy; the example of newborn-screening programs in the US. American Journal of Public Health, 87(8):1280–1288.
Himmelstein D et al., (2005). Marketwatch: illness and injury as contributors to bankruptcy. Health Affairs, 10:63–67.
Himmelstein DU et al., (2009). Medical bankruptcy in the United States, 2007: results of a national study. American Journal of Medicine, 122(8):741–746.
Hing E, Hsiao C (2010). Electronic medical record use by office-based physicians and their practices: United States, 2007. National Health Statistics Reports, 23:1–11.
Hing E, Hooker R, Ashman J (2011). Primary health care in Community Health Centers and comparison with office-based practice. Journal of Community Health, 36(3):406–413.
Hoffman AK (2011). Three models of health insurance: the conceptual pluralism of the Patient Protection and Affordable Care Act. University of Pennsylvania Law Review, 159(6):1873–1954.
Hogan SO, Kissam SM (2010). Measuring meaningful use. Health Affairs, 29(4):601–606.Hollenbeck B et al., (2010). Ambulatory surgery center market share and rates of outpatient
surgery in the elderly. Surgical Innovation, 17(4):340–345.Hooker RS, McCaig LF (2001). Use of physician assistants and nurse practitioners in primary
care, 1995–1999. Health Affairs, 20(4):231–238.Horton S, Johnson R (2010). Improving access to health care for uninsured elderly patients.
Public Health Nursing, 27(4):362–370. Howard J et al., (2010). New legal protections for reporting patient errors under the patient
safety and quality improvement act: a review of the medical literature and analysis, Journal of Patient Safety, 6(3):147–152.
Howard Z (2011). Vermont moving toward single-payer health care. Reuters News Service, Brattleboro, Vermont, 26 May 2011 (http://www.reuters.com/article/2011/05/26/us-vermont-health-idUSTRE74P89420110526, accessed 19 April 2013).
HRSA (2007). Community health worker national Workforce Study. U.S. Department of Health and Human Services, Health Resources and Services Administration Bureau of Health Professions, March 2007 (http://bhpr.hrsa.gov/healthworkforce/reports/chwstudy2007.pdf, accessed 19 April 2013).
HRSA (2012). What is a health center? Health Resources & Services Administration web site (http://bphc.hrsa.gov/about/, accessed 19 April 2013).
Hsiao CJ et al., (2010). National Ambulatory Medical Care Survey: 2007 Summary. National Health Statistics Reports, No. 27, 3 November 2010.
Hsiao WC et al., (2011). What other states can learn from Vermont’s bold experiment: embracing a single-payer health care financing system. Health Affairs, 30(7):1232–1240.
Hsu J et al., (2006). Unintended consequences of caps on Medicare drug benefits. New England Journal of Medicine, 354(22):2349–2359.
Hughes R et al., (2011). State boards of health; governance and politics. Journal of Law, Medicine & Ethics, 39(1):37–41 (suppl).
Humes KR, Jones NA, Ramirez RR (2011). Overview of race and Hispanic origin: 2010. 2010 Census Bureau Briefs (http://www.census.gov/prod/cen2010/briefs/c2010br-02.pdf, accessed 19 April 2013).
Hurley RE, Strunk BC, White JS (2004). The puzzling popularity of the PPO, Health Affairs, 23(2):56–68.

Health systems in transition United States of America398
Hurley RE et al., (2009). Early experiences with consumer engagement initiatives to improve chronic care, Health Affairs, 28(1):277–283.
Hussey PS (2007). International migration patterns of physicians to the United States: a cross-national panel analysis. Health Policy, 84:298–307.
Hyman HH (1982). Health planning: a systematic approach. Rockville, MD, Aspen Publishing:69.
Iglehart JK (2008). Grassroots activism and the pursuit of an expanded physician supply. New England Journal of Medicine, 385(16):1741–1749.
Iglehart JK (2010). The political fight over comparative effectiveness research. Health Affairs, 29(10):1757–1760.
IHS (2011a). Indian health disparities. Indian Health Service web site fact sheet (http://www.ihs.gov/PublicAffairs/IHSBrochure/Disparities.asp, accessed 19 April 2013).
IHS (2011b). Urban Indian health programs. Indian Health Service web site (http://www.ihs.gov/nonmedicalprograms/urban/uihp.asp, accessed 19 April 2013).
Indian Health Service (2013). IHS fact sheets (http://info.ihs.gov/, accessed 19 April 2013).Institute of Medicine, Committee on Health Planning Goals and Standards (1981).
Health planning in the United States: selected policy issues, Vol I. Washington, DC, National Academies Press.
Institute of Medicine (2000). To err is human. Washington, DC, National Academies Press.Institute of Medicine (2003). Unequal treatment: confronting racial and ethnic disparities
in healthcare. Washington, DC, National Academies Press.Institute of Medicine (2005). Food marketing to children and youth: threat or opportunity?
(http://www.iom.edu/Reports/2005/Food-Marketing-to-Children-and-Youth-Threat-or-Opportunity.aspx, accessed 19 April 2013).
Institute of Medicine (2007). Rewarding provider performance: aligning incentives in Medicare (http://www.nap.edu/openbook.php?record_id=11723&page=3, accessed 19 April 2013).
Institute of Medicine (2009). America’s uninsured crisis: consequences for health and health care (http://www.iom.edu/Reports/2009/Americas-Uninsured-Crisis-Consequences-for-Health-and-Health-Care.aspx, accessed 19 April 2013).
Institute of Medicine (2010). The healthcare imperative: lowering costs and improving outcomes. Washington, DC, National Academies Press
IOM (1988). The future of public health. Washington, DC, National Academies Press.IOM (1994). Defining primary care: an interim report. Committee on the Future of Primary
Care. Washington, DC, National Academies Press.IOM (2003). The future of the public’s health in the 21st century. Washington, DC,
National Academies Press.IOM (2005). Complemetary and alternative medicine in the United States. Washington, DC,
National Academies Press.IOM (2006). Improving the quality of health care for mental and substance-use conditions.
Washington, DC, National Academies Press.Jacobs L (2008). 1994 all over again? Public opinions and health care. New England Journal
of Medicine, 358(18):1881–1883. Jacobs LR, Skocpol T (2010). Health care reform and American politics; what everyone
needs to know. New York, Oxford University Press.
Health systems in transition United States of America 399
JCAHO, (2011). Core measure sets. The Joint Commission (http://www.jointcommission.org/core_measure_sets.aspx, accessed 19 April 2013).
Jena AB et al., (2011). Malpractice risk according to physician specialty. New England Journal of Medicine, 365(7):629–636.
Jesson B, (2011). Minimising the risk of polypharmacy. Nursing Older People, 23(4):14–20. Jha A et al., (2009). Use of electronic health records in U.S. hospitals. New England Journal
of Medicine, 360(16):1628–1638. Jha A et al., (2010). A progress report on electronic health records in U.S. hospitals.
Health Affairs (Project Hope), 29(10):1951–1957.Jha AK et al., (2003). Effect of the transformation of the Veterans Affairs Health Care System
on the quality of care. New England Journal of Medicine, 348(22):2218–2227.Johnson A (2009). Tennessee experiment’s high costs fuels health-care debate.
Wall Street Journal, 17 August 2009. Johnson H, Broder DA (1996). The system: the American way of politics at the breaking point.
Boston, MA, Little, Brown.Johnson RW, Uccello CE (2005). Is private long-term care insurance the answer? An issue in
brief. Center for Retirement Research at Boston College. No. 29 (http://www.urban.org/uploadedpdf/1000795.pdf, accessed 19 April 2013).
Joint Commission (2011). Facts about the Joint Commission (http://www.jointcommission.org/facts_about_the_joint_commission/, accessed 19 April 2013).
Joseph KS et al., (2012). Influence of definition based versus pragmatic birth registration on international comparisons of perinatal and infant mortality: population based retrospective study. BMJ, 344:e746.
Jost TS (2007). Health care at risk: a critique of the consumer-driven movement. Durham, NC, Duke University Press.
Jost TS, Hall MA (2011). Not so fast – jurisdictional barriers to the ACA Litigation. New England Journal of Medicine, 365:e34 (http://www.nejm.org/doi/full/10.1056/NEJMp1111295, accessed 19 April 2013).
Jost, TS, Rosenbaum, S (2012). The Supreme Court and the future of Medicaid. New England Journal of Medicine, 367:983–985.
Journal of Health Politics, Policy and Law (1999). The managed care backlash. Special issue. Vol. 24.
Kahn JS, Aulakh V, Bosworth A (2009). What it takes: characteristics of the ideal personal health record. Health Affairs, 28(2):369–376.
Kaiser Commission on Medicaid and the Uninsured (2011). Holding steady, looking ahead: annual findings of a 50-state survey of eligibility rules, enrollment and renewal procedures, and cost sharing practices in Medicaid and CHIP, 2010–11 (http://www.kff.org/medicaid/upload/8130ES.pdf, accessed 19 April 2013).
Kaiser Family Foundation (2005). Medicaid: an overview of spending on “mandatory” vs. “optional” populations and services, June, http://www.kff.org/medicaid/upload/Medicaid-An-Overview-of-Spending-on.pdf
Kaiser Family Foundation (2008). Reducing medical errors (http://www.kaiseredu.org/Issue-Modules/Reducing-Medical-Errors/Background-Brief.aspx, accessed 19 April 2013).
Kaiser Family Foundation (2009). Medicaid and HIV/AIDS (http://www.kff.org/hivaids/upload/7172_04.pdf, accessed 19 April 2013).

Health systems in transition United States of America400
Kaiser Family Foundation (2010a). Explaining health reform: Medicare and the new Independent Payment Advisory Board (http://www.kff.org/healthreform/upload/7961-02.pdf, accessed 19 April 2013).
Kaiser Family Foundation (2010b). Medicaid and state funded coverage income eligibility limits for low-income adults, 2009 (http://www.statehealthfacts.org/comparereport.jsp?rep=54&cat=4, accessed 19 April 2013).
Kaiser Family Foundation (2010c). Births financed by Medicaid as a percent of total births, 2003 (http://www.statehealthfacts.org/comparemaptable.jsp?ind=223&cat=4, accessed 19 April 2013).
Kaiser Family Foundation (2010d). Medicare Advantage (http://www.kff.org/medicare/upload/2052-14.pdf, accessed 19 April 2013).
Kaiser Family Foundation (2010e). Medicare chartbook (http://www.kff.org/medicare/upload/8103.pdf, accessed 19 April 2013).
Kaiser Family Foundation (2010f). Medicaid and managed care: key data, trends, and issues (http://www.kff.org/medicaid/upload/8046.pdf, accessed 19 April 2013).
Kaiser Family Foundation (2010g). Prescription drug trends (http://www.kff.org/rxdrugs/upload/3057-08.pdf, accessed 19 April 2013).
Kaiser Family Foundation (2010h). State Health Facts, 2010, Kaiser Family Foundation web site (http://www.statehealthfacts.org/profileind.jsp?ind=383&cat=8&rgn=1, accessed 19 April 2013).
Kaiser Family Foundation (2011a). Summary of New Health Reform Law (http://www.kff.org/healthreform/upload/8061.pdf, accessed 19 April 2013).
Kaiser Family Foundation (2011b). Medicaid’s role in long term care: Q & A (http://www.kff.org/medicaid/upload/Medicaid-s-Role-in-Long-Term-Care-Q-A-Fact-Sheet.pdf, accessed 19 April 2013).
Kaiser Family Foundation (2011c). The Medicare prescription drug benefit (http://www.kff.org/medicare/upload/7044-12.pdf, accessed 19 April 2013).
Kaiser Family Foundation (2011d). Medicare advantage (http://www.kff.org/medicare/upload/2052-15.pdf, accessed 19 April 2013).
Kaiser Family Foundation (2011e). A profile of Medicaid managed care programs in 2010: findings from a 50-state survey (http://www.kff.org/medicaid/upload/8220-ES.pdf, accessed 19 April 2013).
Kaiser Family Foundation (2011f). Medicaid-to-Medicare fee index (http://www.statehealthfacts.org/comparetable.jsp?ind=196&cat=4, accessed 19 April 2013).
Kaiser Family Foundation (2011g). The uninsured: a primer (http://www.kff.org/uninsured/upload/7451-07.pdf, accessed 19 April 2013).
Kaiser Family Foundation (2011h). Primary care shortage. Kaiser Family Foundation Brief (http://www.kaiseredu.org/Issue-Modules/Primary-Care-Shortage/Background-Brief.aspx, accessed 19 April 2013).
Kaiser Family Foundation (2011i). Military and Veterans’ health care (http://www.kaiseredu.org/Issue-Modules/Military-and-Veterans-Health-Care/Background-Brief.aspx, accessed 19 April 2013).
Kaiser Family Foundation (2011j). Individual elements of the ACA popular with the public. Kaiser November Health Tracking Poll. Health Reform Source (http://healthreform.kff.org/public-opinion.aspx, accessed 19 April 2013).

Health systems in transition United States of America 401
Kaiser Family Foundation (2011k). Implementation timeline. Health Reform Source (http://healthreform.kff.org/Timeline.aspx, accessed 19 April 2013).
Kaiser Family Foundation (2011l). Grandfathering explained: health insurance and reform. Health Reform Source (http://healthreform.kff.org/notes-on-health-insurance-and-reform/2011/september/grandfathering-explained.aspx, accessed 19 April 2013).
Kaiser Family Foundation (2011m). State health facts (http://www.statehealthfacts.org/comparetable.jsp?ind=126&cat=3, accessed 19 April 2013).
Kaiser Family Foundation (2011n). Fast facts (http://facts.kff.org/, accessed 19 April 2013).Kaiser Family Foundation (2012a). Medicare Advantage 2012. Data spotlight: enrollment
market update (http://www.kff.org/medicare/8323.cfm, accessed 19 April 2013).Kaiser Family Foundation (2012b). Glossary (http://www.kaiserhealthnews.org/glossary.aspx,
accessed 19 April 2013). Kaiser Family Foundation (2012c). Kaiser slides (http:facts.kff.org/, accessed 19 April 2013).Kaiser Family Foundation (2013a). Health insurance coverage of the total population (http://
www.statehealthfacts.org/comparetable.jsp?typ=2&ind=125&cat=3&sub=39, accessed 19 April 2013).
Kaiser Family Foundation (2013b). Health insurance coverage of the nonelderly population (http://facts.kff.org/chart.aspx?ch=478, accessed 19 April 2013).
Kaiser Family Foundation (2013c). Medicaid: a primer (http://www.kff.org/medicaid/7334.cfm, accessed 19 April 2013).
Kaiser Family Foundation and Health Research & Educational Trust (2010). Employer health benefits: 2010 Annual Survey (http://ehbs.kff.org/pdf/2010/8085.pdf, accessed 19 April 2013).
Kaiser Family Foundation and Health Research and Educational Trust (2011). Employer health benefits: 2011 Annual Survey (http://ehbs.kff.org/pdf/2011/8225.pdf, accessed 19 April 2013).
Kaiser Family Foundation and Health Research and Educational Trust (2012). Employer health benefits: 2012 Annual Survey (http://ehbs.kff.org/pdf/2012/8345.pdf, accessed 19 April 2013).
Kaiser Poll (2012). Early reaction to Supreme Court decision on ACA (http://healthreform.kff.org/en/public-opinion.aspx?month=2012-07&tag=KFF+Tracking+Polls, accessed 19 April 2013).
Kanavos P, Gemmill-Toyama M (2010). Prescription drug coverage among elderly and disabled Americans: can Medicare Part D reduce inequities in access? International Journal of Health Care Finance & Economics, 10(3):203–218.
Kaplan T (2011). Lessons for Albany on Malpractice limits. New York Times, 24 March 2011 (http://www.nytimes.com/2011/03/25/nyregion/25malpractice.html, accessed 19 April 2013).
Kaptchuk T, Miller F (2005). Viewpoint: what is the best and most ethical model for the relationship between mainstream and alternative medicine: opposition, integration, or pluralism? Academic Medicine: Journal of The Association of American Medical Colleges, 80(3):286–290.
Kastor JA, Adashi EY (2011). Maryland’s hospital cost review commission at 40: a model for the country. Journal of the American Medical Association, 306(10):1137–1138.
Katz MH (2011). Safety-net providers and preparation for health reform; staff down, staff up, staff differently. Archive of Internal Medicine, 171(15):1319–1320.

Health systems in transition United States of America402
Kaye N (2005). Medicaid managed care: looking forward, looking back (http://www.nashp.org/publication/medicaid-managed-care-looking-forward-looking-back, accessed 19 April 2013).
Kazley A, Ozcan Y (2008). Do hospitals with electronic medical records (EMRs) provide higher quality care? Medical Care Research and Review, 65(4):496–513.
Keith K, Lucia KW (2013). New guidance: federal regulators allow “collaborative arrangements” for ACA enforcement. The Commonwealth Fund Blog, 5 April 2013 (http://www.commonwealthfund.org/Blog/2013/Apr/Federal-Regulators-Allow-Collaborative-Arrangements.aspx?omnicid=20, accessed 19 April 2013).
Kersh R, (2011). Health reform: the politics of implementation. Journal of Health Politics, Policy and Law, 36(3):613–623.
Ketsche P et al., (2011). Low-income families pay a higher share of income towards national health care spending than higher-income families do. Health Affairs, 30(9):1–10.
KFF (2010). State Health Facts, 2010, Kaiser Family Foundation web site (http://www.statehealthfacts.org/profileind.jsp?ind=383&cat=8&rgn=1, accessed 19 April 2013).
KFF (2011a). Primary care shortage. Kaiser Family Foundation Brief (http://www.kaiseredu.org/Issue-Modules/Primary-Care-Shortage/Background-Brief.aspx, accessed 19 April 2013).
KFF (2011b). Military and Veterans’ health care (http://www.kaiseredu.org/Issue-Modules/Military-and-Veterans-Health-Care/Background-Brief.aspx, accessed 19 April 2013).
Khowaja K, Merchant RJ, Hirani D (2005). Registered nurses perception of work satisfaction at a tertiary care university hospital. Journal of Nursing Management, 13:32–39.
Kirschner KL, Breslin ML, Iezzoni LI (2007). Structural impairments that limit access to health care with disabilities. JAMA, 297(10):1121–1125.
Kitzhaber JA (1993). Prioritising health services in an era of limits: the Oregon experience. BMJ, 307(6900):373.
Kliff S (2013). The fiscal cliff cuts $1.9 billion from Obamacare. Here’s how. The Washington Post, 2 January 2013 (http://www.washingtonpost. http://capsules.kaiserhealthnews.org/index.php/2013/03/some-states-balk-at-enforcing-health-laws-insurance protections/?utm_source=intop&utm_medium=email&utm_campaign=032713com/blogs/wonkblog/wp/2013/01/02/the-fiscal-cliff-cuts-1-9-billion-from-obamacare-heres-how/, accessed 19 April 2013).
Kochevar J et al., (2011). Electronic medical records: a survey of use and satisfaction in small dialysis organizations. Nephrology Nursing Journal, 38(3):273–281.
Kofman M, Pollitz K (2006). Health insurance regulation by states and the federal government: a review of current approaches and proposals for change. Washington, DC, Georgetown University Health Policy Institute (http://www.allhealth.org/briefingmaterials/HealthInsuranceReportKofmanandPollitz-95.pdf, accessed 19 April 2013).
Kohn LT et al., (eds) (2000). To err is human: building a safer health system. Washington, DC, National Academies Press.
Korobkin R (2003). The failed jurisprudence of managed care, and how to fix it: reinterpreting ERISA preemption. UCLA Law Review, 51:457–537.
Kotchen TA (2007). Hypertension control: trends, approaches, and goals. Hypertension, 49:19–20.
Health systems in transition United States of America 403
Kovner AR, Knickman JR (2011). Health care delivery in the United States, 9th edn. New York, Springer Publishers.
Kramer A, et al., (2010). Survey questions for EHR adoption and use in nursing homes. U.S. Department of Health and Human Services, Division of Health Care Policy & Research (http://aspe.hhs.gov/daltcp/reports/2010/EHRques.pdf, accessed 19 April 2013).
Kronick R, Gilmer T (1999). Explaining the decline in health insurance coverage, 1979–1995. Health Affairs, 18(2):30–47.
Krueger P, Tajudaullah B, Rosenau PV (2009). Health lifestyles in the United States and Canada: are we really so different? Social Science Quarterly, 90(5):1380–1402.
Kullgren JT, McLaughlin CG (2010). Beyond affordability: the impact of nonfinancial barriers on access for uninsured adults in three diverse communities. Journal of Community Health, 35:240–248.
Landon BE, Reschovsky J, Blumenthal D (2003). Changes in career satisfaction among primary care and specialist physicians, 1997–2001. JAMA, 289(4):442–449.
Law MR, Hansen ZK (2010). Medical licensing board characteristics and physician discipline: an empirical analysis, Journal of Health Politics, Policy and Law, 35(1):63–93.
Law SA (1974). Blue Cross: what went wrong? New Haven, CT, Yale University Press.Lee J et al., (2007). Utilization of the emergency room: impact of geographic distance.
Geospatial Health, 1(2):243–253. Lee MS, Ernst E (2011). Acupuncture for pain: an overview of Cochrane reviews. Chinese
Journal of Integrative Medicine, 17(3):187–189.Levey NN (2011). Obama Administration steps up oversight of health insurers. Los Angeles
Times, 1 September 2011 (http://articles.latimes.com/2011/sep/01/news/la-heb-health-insurance-20110901, accessed 19 April 2013).
Levine A, Oshel R, Wolfe S (2011). State medical boards fail to discipline doctors with hospital actions against them (http://www.citizen.org/documents/1937.pdf, accessed 19 April 2013).
Levinson DR (2011). Review of the Food and Drug Administration’s monitoring of imported food recalls. In: H.H.S. Office of Inspector General (ed). Washington, DC, Office of Inspector General:11 (http://oig.hhs.gov/oas/reports/region10/10901500.pdf, accessed 19 April 2013).
Lewin JC, Sybinsky PA (1993). Hawaii’s employer mandate and its contribution to universal access. JAMA, 269(19):2538–2543.
Lewin-VHI (1994). Subacute care: review of the literature. Report for the U.S. DHHS by Lewin-VHI, Inc (http://aspe.hhs.gov/daltcp/reports/scltrves.pdf, accessed 19 April 2013).
Lieberman T, Peppe E, Lundy J (2005). A consumer guide to handling disputes with your employer or private health plan; 2005 Update. Kaiser Family Foundation and Consumers Union (http://www.kff.org/consumerguide/upload/7350ConsumerGuidev4_080805.pdf, accessed 19 April 2013).
Liebhaber A, Grossman JM (2007). Physicians moving to mid-sized, single-specialty practices. Center for Studying Health System Change Tracking Report (http://hschange.org/CONTENT/941/941.pdf, accessed 19 April 2013).
Light DW, Warburton RN (2011). Demythologizing the high costs of pharmaceutical research. Biosocieties, 6:1–17.
Lindblom CE (1959). The science of “muddling through”. Public Administration Review, 19(2):79–88.

Health systems in transition United States of America404
Linehan K (2010). Self-insurance and the potential effects of health reform on the small-group market. National Health Policy Forum, Issue Brief, # 840. The George Washington University, Washington, DC (http://www.nhpf.org/library/issue-briefs/IB840_PPACASmallGroup_12-21-10.pdf, accessed 19 April 2013).
Ling DC, Berndt E R, Frank RG (2008). Economic incentives and contracts: the use of psychotropic medications. Contemporary Economic Policy, 26(1):49–72.
Liptak A (2011). Supreme court to hear case challenging health law. The New York Times, 14 November 2011 (http://www.nytimes.com/2011/11/15/us/supreme-court-to-hear-case-challenging-health-law.html?pagewanted=all, accessed 19 April 2013).
Liss D et al., (2011). Patient-reported care coordination: associations with primary care continuity and specialty care use. Annals of Family Medicine, 9(4):323–329.
Litow ME (2006). Medicare versus private health insurance: the cost of administration (http://www.cahi.org/cahi_contents/resources/pdf/CAHIMedicareTechnicalPaper.pdf, accessed 19 April 2013).
Localio AR et al., (1991). Relation between malpractice claims and adverse events due to negligence: results of the Harvard Medical Practice Study III. New England Journal of Medicine, 325:245–251.
Lopez N (2011). Update: Consumer Operated and Oriented Plan (CO OP) Program. HealthREformGPS; Navigating Implementation (http://www.healthreformgps.org/resources/update-consumer-operated-and-oriented-plan-co-op-program/, accessed 19 April 2013).
Lorenz K et al., (2003). Charity for the dying: who receives unreimbursed hospice care? Journal of Palliative Medicine, 6(4):585–591.
Lo Sasso AT, Shah M, Frogner BK (2010). Health savings accounts and health care spending. Health Services Research, 45(4):1041–1060.
Luo M (2011). Sway of N.R.A. stymies firearms research, scientists say. The New York Times, 25 January 2011 (http://www.nytimes.com/2011/01/26/us/26guns.html?pagewanted=all, accessed 19 April 2013).
Lynch JW et al., (1998). Income inequality and mortality in metropolitan areas of the United States. American Journal of Public Health, 88(7):1074–1080.
McCall N et al., (2003). Reforming Medicare payment: early effects of the 1997 Balanced Budget Act on postacute care. Milbank Quarterly, 81:172–273,277–303.
McCarthy D, Leatherman S (2006). Performance snapshots, 2006. New York, Commonwealth Fund.
McCarthy D et al., (2009). Aiming higher: results from a state scorecard on health system performance. New York: Commonwealth Fund (http://www.commonwealthfund.org/~/media/Files/Publications/Fund%20Report/2009/Oct/1326_McCarthy_aiming_higher_state_scorecard_2009_full_report_FINAL_v2.pdf).
McCarty N, Poole KT, Rosenthal H (2008). Polarized America. Cambridge, MA, MIT Press (online updates at http://voteview.com/Polarized_America.htm#POLITICALPOLARIZATION).
McCarty KL et al., (2009). Major components and themes of local public health laws in select U.S. jurisdictions. Public Health Reports, 124:458–462.

Health systems in transition United States of America 405
MacDorman MF, Mathews TJ (2010). Behind international rankings of infant mortality: How the United States compares with Europe. International Journal of Health Services, 40:577–588.
MacDowell M et al., (2010). A national view of rural health workforce issues in the USA. Rural and Remote Health, 10:1531 (http://www.rrh.org.au, accessed 19 April 2013).
McGlynn EA et al., (2003). The quality of health care delivered to adults in the United States. New England Journal of Medicine, 348:2635–2645.
McHugh MD et al., (2011). Nurses’ widespread job dissatisfaction, burnout, and frustration with health benefits signal problems for patient care. Health Affairs, 30(2):202–209.
McMenamin S et al., (2004). Health promotion in physician organizations: results from a national study. American Journal of Preventive Medicine, 26(4):259–264.
McNamara P (2006). Foreword: payment matters? The next chapter. Medical Care Research and Review, 63:5S–10S.
McWilliams JM et al., (2004). Health insurance coverage and mortality among the near-elderly. Health Affairs, 23:223–233.
McWilliams JM et al., (2007). Use of health services by previously uninsured Medicare beneficiaries. New England Journal of Medicine, 357:143–153.
Magrini N (2007). Direct to consumer advertising in Europe. BMJ, 335:526.Mara CM (2004). How politics makes health policy. In: Ziegenfuss JT, Sassani JW eds.
Portable health administration. Philadelphia, PA, Elsevier Publishing,39–48.Marcus AD (2006). Advocacy overload? Activists seek to unify efforts of groups targeting
diseases; a brain-tumor collaborative. Wall Street Journal, 10 October 2006.Marcus S, Olfson M (2010). National trends in the treatment for depression from
1998 to 2007. Archives of General Psychiatry, 67(12):1265–1273.Marmor TR (2000). The politics of Medicare. Hawthorne, NY, Aldine De Gruyter.Marmot MG, Bell R (2009). Action on health disparities in the United States; commission
on social determinants of health. JAMA, 3001(11):1169.Marsh B et al., (2012a). A new guide to the democratic herd. The New York Times,
30 August 2012 (http://www.nytimes.com/interactive/2012/09/02/sunday-review/a-new-guide-to-the-democratic-herd.html?_r=0, accessed 19 April 2013).
Marsh B et al., (2012b). A new guide to the republican herd. The New York Times, 26 August 2012 (http://www.nytimes.com/interactive/2012/08/26/sunday-review/a-new-guide-to-the-republican-herd.html, accessed 19 April 2013).
Martin AB et al., (2012). Growth In US health spending remained slow in 2010; health share of gross domestic product was unchanged from 2009. Health Affairs 31(1):208–219.
Matula S et al., (2009). Operation access: a proven model for providing volunteer surgical services to the uninsured in the United States. Journal of the American College of Surgeons, 209(6):769–776.
Mays G, Smith S (2009). Geographic variation in public health spending: correlates and consequences. Health Services Research, 44(5 Pt 2):1796–1817.
Mechanic D (2003). Physician discontent: challenges and opportunities. JAMA, 290(7):941–946.
Meddings JA, McMahon LF (2008). Measuring quality in Pay-for-Performance programs: from ‘one-size-fits-all’ measures to individual patient risk-reduction scores. Disease Management Health Outcomes, 16(4):205–216.
Health systems in transition United States of America406
Medicaid and CHIP Payment Access Commission (2011). Report to Congress: Medicaid and CHIP (http://healthreform.kff.org/~/media/Files/KHS/docfinder/MACPAC_March2011_web.pdf, accessed 19 April 2013).
Medical Expenditures Panel Survey (2012). [web site] (meps.ahrq.gov/mepsweb/data_stats/MEPS_topics.jsp?topicid=5Z-1, accessed 19 April 2013).
Medicare Payment Advisory Commission (2008a). Part D payment system (http://www.medpac.gov/documents/MedPAC_Payment_Basics_08_PartD.pdf, accessed 19 April 2013).
Medicare Payment Advisory Commission (2008b). Long-term care hospital payment system (http://www.medpac.gov/documents/MedPAC_Payment_Basics_08_LTCH.pdf, accessed 19 April 2013).
Medicare Payment Advisory Commission (2011a). Report to Congress: Medicare Payment Policy, March, http://medpac.gov/documents/Mar11_EntireReport.pdf
Medicare Payment Advisory Commission (2011b). Report to Congress: Medicare and the Health Care Delivery System, June, http://www.medpac.gov/documents/Jun11_EntireReport.pdf
Medicare Payment Advisory Commission (2011c). Report to Congress: Medicaid and CHIP. March, http://healthreform.kff.org/~/media/Files/KHS/docfinder/MACPAC_March2011_web.pdf
Medicare Payment Advisory Commission (2012). Health care spending and the Medicare program (http://www.medpac.gov/documents/Jun12DataBookEntireReport.pdf, accessed 19 April 2013).
MedPAC (2005). Report to the Congress: physician-owned specialty hospitals. Washington, DC, Medicare Payment Advisory Commission (http://www.medpac.gov/documents/Mar05_SpecHospitals.pdf, accessed 19 April 2013).
MedPAC (2009). Report to the Congress: Medicare payment policy. Washington, DC, Medicare Payment Advisory Commission.
Meeker W (2000). Public demand and the integration of complementary and alternative medicine in the US health care system. Journal of Manipulative and Physiological Therapeutics, 23(2):123–126.
Mehrotra A et al., (2008). Retail clinics, primary care physicians, and emergency departments: a comparison of patients’ visits. Health Affairs, 27(5);1272–1282.
Mehrotra A et al., (2009). Comparing costs and quality of care at retail clinics with that of other medical settings for 3 common illnesses. Annals of Internal Medicine, 151(5):321–328.
Mello MM et al., (2010). National costs of the medical liability system. Health Affairs, 29(9):1569–1577.
Mendez E (2012). More Americans uninsured in 2011. Gallop Poll (http://www.gallup.com/poll/152162/americans-uninsured-2011.aspx, accessed 19 April 2013).
Mercer (2010). National Survey of Employer-Sponsored Health Plans, 2010 (http://www.ehpco.com/documents/MercerNationalSurveyResults2010CentralOH.pdf, accessed 19 April 2013).
Mercer M (2013). Coming soon: health marketplaces; new exchanges prepare for October launch. AARP Bulletin, April, p.14 (http://pubs.aarp.org/aarpbulletin/201304?pg=15#pg15, accessed 19 April 2013).
Health systems in transition United States of America 407
Mertz E, O’Neil E (2002). The growing challenge of providing oral health care services to all Americans. Health Affairs, 21(5):65–77.
Miller ME (2007). Private fee-for-service plans in Medicare Advantage. Medicare Payment Advisory Commission. Testimony before the Subcommittee on Health, Committee on Ways and Means, U.S. House of Representatives, 22 May 2007 (http://www.medpac.gov/documents/052207_Testimony_WM_MedPAC_MA_PFFS.pdf, accessed 19 April 2013).
Milliman Inc (2006). Medicare versus private health insurance: the cost of administration (http://www.cahi.org/cahi_contents/resources/pdf/CAHIMedicareTechnicalPaper.pdf, accessed 19 April 2013).
Mills A, Engelhard CL, Tereskerz PM (2010). Truth and consequences – insurance-premium rate regulation and the ACA. New England Journal of Medicine, 353(10):899–901.
Mirvis DM et al., (1995). TennCare – health system reform for Tennessee. JAMA, 274(15):1235–1241.
Misurski DA, Lipson DA, Changolkar AK (2011). Inappropriate antibiotic prescribing in managed care subjects with influenza. American Journal of Managed Care, 17(9):601–609.
Mojtabai R, Olfson M (2008). National trends in psychotherapy by office-based psychiatrists. Archives of General Psychiatry, 65(8):962–970.
Monheit AC et al., (2004). Community rating and sustainable individual health insurance markets in New Jersey. Health Affairs, 23(4):167–175.
Morgan KJ, Campbell AL (2011). Delegated governance in the Affordable Care Act. Journal of Health Politics, Policy and Law, 36(3):387–391.
Morgan P, Hooker R (2010). Choice of specialties among physician assistants in the United States. Health Affairs, 29(5):887–892.
Morrisey M (2006). Not-for-profit survival in a competitive world. Frontiers of Health Services Management, 22(4):35–38.
Mortensen K (2010). Copayments did not reduce Medicaid enrollees’ nonemergency use of emergency departments. Health Affairs, 29(9):1643–1650.
Muennig PA, Glied SA (2010). What changes in survival rates tell us about US Health Care. Health Affairs, 29(11):2105–2113.
Mullen F (2005). The metrics of the physician brain drain. New England Journal of Medicine, 353(17):1810–1818.
Murphy J (2011). Patient as center of the health care universe: a closer look at patient-centered care. Nursing Economic$, 29(1):35–37.
Murray R (2012). The case for a coordinated system of provider payments in the United States. Journal of Health Politics, Policy and Law, 37(4):679–695.
Murray S, O’Connor P (2013). New congress face same partisan divisions. Wall Street Journal, 3 January 2013 (http://online.wsj.com/article/SB10001424127887324374004578219741894631734.html, accessed 19 April 2013).
Musumeci MB (2012). Implementing the ACA’s Medicaid-related health reform provisions after the Supreme Court’s decision. Kaiser Family Foundation, August (http://www.kff.org/healthreform/upload/8348.pdf, accessed 19 April 2013).
NAHC (2010). Home care and hospice facts and stats. National Association for Home Care & Hospice (http://www.nahc.org/advocacy-policy/home-care-hospice-facts-stats/, accessed 19 April 2013).
Health systems in transition United States of America408
NASMHPD (2006). State profile highlights: state psychiatric hospitals. Report for the National Association of State Mental Health Program Directors Research Institute, Inc., No. 06-4 (www.nriinc.org/projects/Profiles/Profiles05/2006StateHospital.pdf, accessed 19 April 2013).
Nasser HE (2007). Fewer seniors live in nursing homes. USA Today, 27 September 2007 (http://www.usatoday.com/news/nation/census/2007-09-27-nursing-homes_N.htm, accessed 19 April 2013).
Natal G (2007). Emergency department overcrowding: what is the answer? Journal of Emergency Nursing, 33(2):99–100.
National Care Planning Council (2012). About Medicaid long term care (http://www.longtermcarelink.net/eldercare/medicaid_long_term_care.htm, accessed 19 April 2013).
National Center for Health Statistics (2006). Health, United States, 2006 (http://www.cdc.gov/nchs/data/hus/hus06.pdf, accessed 25 July 2013).
National Center for Health Statistics (2010). Health, United States, 2009: with special feature on medical technology (http://www.ncbi.nlm.nih.gov/books/NBK44745/, accessed 19 April 2013).
National Center for Health Statistics (2011). Health, United States, 2010: with special feature on death and dying (http://www.cdc.gov/nchs/hus.htm, accessed 19 April 2013).
National Conference of State Legislators (2011). Coverage of uninsurable pre-existing conditions: state and federal high-risk pools (http://www.ncsl.org/?tabid=14329, accessed 19 April 2013).
National Consensus Project for Quality Palliative Care (2004). National Consensus Project for Quality Palliative Care: clinical practice guidelines for quality palliative care, Executive Summary. Journal of Palliative Medicine, 7(5):611–627.
National Health Policy Forum (2008). Medicaid financing: how the FMAP formula works and why it falls short. Washington, DC, George Washington University (http://www.nhpf.org/library/issue-briefs/IB828_FMAP_12-11-08.pdf, accessed 19 April 2013).
National Health Policy Forum (2011). Medicaid financing: the basics. Washington, DC, George Washington University (http://www.nhpf.org/library/the-basics/Basics_MedicaidFinancing_02-13-13.pdf, accessed 19 April 2013).
Naylor MD, Kurtzman ET (2010). The role of nurse practitioners in reinventing primary care. Health Affairs, 29(5):893–899.
NCCAM (2011a). NCCAM facts-at-a-glance and mission. National Center for Complementary and Alternative Medicines, National Institutes of Health (http://nccam.nih.gov/about/ataglance/, accessed 19 April 2013).
NCCAM (2011b). Traditional Chinese Medicine: an introduction. National Center for Complementary and Alternative Medicines, National Institutes of Health (http://nccam.nih.gov/health/whatiscam/chinesemed.htm, accessed 19 April 2013).
NCCAM (2011c). Paying for CAM treatment. National Center for Complementary and Alternative Medicines, National Institutes of Health (http://nccam.nih.gov/health/financial/, accessed 19 April 2013).
NCH (2009). Who is homeless? And how many people experience homelessness? (http://nationalhomeless.org/factsheets/who.html, accessed 19 April 2013).
NCSL (2011). [web site] Conference of state legislatures (http://www.ncsl.org/?tabid=14503, accessed 19 April 2013).

Health systems in transition United States of America 409
Netten A, Darton R, Williams J (2003). Nursing home closures: effects on capacity and reasons for closure. Age and Ageing, 32(3):332–337.
Neuman T (2012). Before and after; standard Medicare prescription drug benefit, 2020. Kaiser Family Foundation Illustration of Standard Medicare Drug Benefit in 2010 Under the Patient Protection and Affordable Care Act, as Amended by the Health Care and Education Reconciliation Act of 2010. Exhibit 7 in PowerPoint presentation Health reform and Medicare: overview by key provisions (http://www.kaiseredu.org/Tutorials-and-Presentations/Health-Reform-and-Medicare.aspx, accessed 19 April 2013).
Neumann PJ, Weinstein MC (2010). Legislating against use of cost–effectiveness information. New England Journal of Medicine, 363(16):1495–1496.
Neustadt R (1991). Presidential power and the modern presidents, rev edn. New York, Free Press.
New England Journal of Medicine (2004). Physician compensation models: the basics, the pros, and the cons (http://www.nejmcareercenter.org/article/2184/physician-compensation-models-the-basics-the-pros-and-the-cons/, accessed 19 April 2013).
Newport F, Saad L (2011). Gallup review: public opinion context of Tucson shootings. Phone survey, 10 January 2011 (http://www.gallup.com/poll/145526/gallup-review-public-opinion-context-tucson-shootings.aspx?version=print, accessed 19 April 2013).
New York Times (2009) Reinhardt U, http://economix.blogs.nytimes.com/2009/01/23/how-do-hospitals-get-paid-a-primer/
New York Times (2010). Seelye KQ., Administration Rejects Health Insurer’s Defense of Huge Rate Increases”. New York Times, February 11, http://www.nytimes.com/2010/02/12/health/policy/12insure.html
New York Times (2011). Health care reform, 17 October 2011 (http://topics.nytimes.com/top/news/health/diseasesconditionsandhealthtopics/health_insurance_and_managed_care/health_care_reform/index.html, accessed 19 April 2013).
Ng T, Harrington C, Kitchener M (2010). Medicare and Medicaid in long-term care. Health Affairs, 29(1):22–28.
NHCHC (2012). National Health Care for the Homeless Council [web site] (http://www.nhchc.org/, accessed 19 April 2013).
NHPCO (2010). NHPCO facts and figures: hospice care in America 2010. National Hospice and Palliative Care Organization (http://www.nhpco.org/files/public/Statistics_Research/Hospice_Facts_Figures_Oct-2010.pdf, accessed 19 April 2013).
Nirula R, Nirula G, Gentilello L (2009). Inequity of rehabilitation services after traumatic injury. Journal of Trauma, 66(1):255–259.
Nolte E, McKee CM (2008). Measuring the health of nations: updating an earlier analysis. Health Affairs, 27(1):58–71.
Nolte E, McKee M (2011). Variations in amenable mortality – trends in 16 high-income nations. Health Policy, 103:47–52.
Nolte E, McKee CM (2012). In amenable mortality – deaths avoidable through health care – progress in the US lags that of three European countries. Commonwealth Fund (http://www.commonwealthfund.org/Publications/In-the-Literature/2012/Aug/Variations-Amenable-Mortality.aspx, accessed 19 April 2013).
Nugent GN et al., (2004). Value for taxpayers’ dollars: what VA care would cost at Medicare prices. Medical Care Research and Review, 61(4):495–508.
Health systems in transition United States of America410
Nyman JA (2008). Health plan switching and attrition bias in the RAND health insurance experiment. Journal of Health Politics, Policy and Law, 33(2):309–317.
Oberlander J (2003). The political life of Medicare. Chicago, IL, University of Chicago Press.Oberlander J (2006). Health reform interrupted: the unraveling of the Oregon health plan.
Health Affairs, 19 December 2006.Oberlander J (2011). Throwing darts: Americans’ elusive search for health care cost control.
Journal of Health Politics, Policy and Law, 36(3):477–484. Oberlander J (2012a). The future of Obamacare. New England Journal of Medicine,
367(23):2165–2167.Oberlander J (2012b). Unfinished journal – a century of health care reform in the
United States. New England Journal of Medicine 367(7):585–590.O’Brien C (1994). The center of caring: adult day care and the VNA. Caring: National
Association for Home Care Magazine, 13(8):42–43.OECD (2009). Society at a glance 2009: OECD social indicators (http://www.oecd.org/
document/24/0,3343,en_2649_34637_2671576_1_1_1_1,00.html, accessed 19 April 2013).OECD (2010). International Comparison of Spending on Health, 1980–2008. In: Schoen C,
Osborn R, The Commonwealth Fund 2010 International Health Policy Survey in Eleven Countries, PowerPoint Presentation, The Commonwealth Fund, November 2010 (http://www.oecd.org/document/30/0,3746,en_2649_37407_12968734_1_1_1_37407,00.html, accessed 19 April 2013).
OECD (2011). OECD health data 2011: frequently requested data (http://www.oecd.org/document/16/0,3343,en_2649_34631_2085200_1_1_1_1,00.html, accessed 19 April 2013).
OECD (2012a). OECD.StatExtracts (http://stats.oecd.org/index.aspx?DataSetCode=HEALTH_STAT).
OECD (2012b). Households with access to a computer, and households with access to the Internet in selected OECD countries. OECD Key ICT Indicators (http://www.oecd.org/sti/interneteconomy/oecdkeyictindicators.htm, accessed 19 April 2013).
Office for Human Research Protections (2011). Regulations (http://www.hhs.gov/ohrp/humansubjects/index.html, accessed 19 April 2013).
Olfson M, Marcus S (2010). National trends in outpatient psychotherapy. American Journal of Psychiatry, 167(12):1456–1463.
Oliver A (2007). The Veterans Health Administration: an American success story? Milbank Quarterly, 85(1):5–35.
Ottenbacher K, Graham J (2007). The state-of-the-science: access to postacute care rehabilitation services. A review. Archives of Physical Medicine and Rehabilitation, 88(11):1513–1521.
Paasche-Orlow MK et al., (2009). National Survey of Patients’ Bill of Rights Statutes. Journal of General Internal Medicine, 24(4):489–494.
Paez KA, Zhao L, Hwang W (2009). Rising out-of-pocket spending for chronic conditions: a ten-year trend. Health Affairs, 28(1):15–25.
Pagan J, Pauly M (2005). Access to conventional medical care and the use of complementary and alternative medicine. Health Affairs, 24(1):255–262.
Page BI, Jacobs JR (2009). Class war? What Americans really think about economic inequality. Chicago, University of Chicago Press.
Health systems in transition United States of America 411
Paltrow SJ (2010). Wellpoint raising rates by double digits in at least 11 states. Center for American Progress Action Fund (http://www.americanprogressaction.org/issues/healthcare/report/2010/02/24/7254/wellpoint-raising-rates-by-double-digits-in-at-least-11-states/, accessed 19 April 2013).
Paskett E, Harrop J, Wells K (2011). Patient navigation: an update on the state of the science. CA: A Cancer Journal for Clinicians, 61(4):237–249.
Pasman HW et al., (2009). Quality Indicators for palliative care: a systematic review. Journal of Pain and Symptom Management, 38(1):145–156.e21.
Patel KK, Butler B, Wells KB (2006). What is necessary to transform the quality of mental health care? Health Affairs, 25(3):681–693.
Pauly M, Town R (2012). Maryland exceptionalism? All-payers regulation and health care system efficiency. Journal of Health Politics, Policy and Law, 37(4):697–707.
Pear R (2011a). Federal auditors will soon review health insurance rates in 10 states. The New York Times, 25 July 2012 (http://www.nytimes.com/2011/07/26/health/policy/26health.html, accessed 19 April 2013).
Pear R (2011b). Health care law will let states tailor benefits. The New York Times, 16 December 2011.
Pear R (2012). Court’s ruling may blunt reach of the health law. The New York Times, 24 July 2012.
Pecquet J, Baker S (2011). Healthwatch; overnight health: health budgets back in spotlight, The Hill, 3 November 2011 (http://thehill.com/blogs/healthwatch/other/191759-overnight-health-health-budgets-back-in-spotlight, accessed 19 April 2013).
Peikes D et al., (2012). Early evaluations of the medical home: building on a promising start. American Journal of Managed Care, 18(2):105–122.
Peterson MA (2011). It was a different time: Obama and the unique opportunity for health care reform. Journal of Health Politics, Policy and Law, 36(3):429–436.
Petterson S et al., (2009). Having a usual source of care reduces ED visits. Washington, DC, Robert Graham Center (http://www.aafp.org/afp/2009/0115/p94.html, accessed 19 April 2013).
Pew Hispanic Center (2010). Unauthorized immigrants and their U.S.-born children (http://pewhispanic.org/files/reports/125.pdf, accessed 19 April 2013).
Pew Research Center (2011). Unauthorized immigrant population: national and state trends (http://www.pewhispanic.org/2011/02/01/unauthorized-immigrant-population-brnational-and-state-trends-2010/, accessed 19 April 2013).
Phillips RL, Bazemore AW (2010). Primary care and why it matters for U.S. health system reform. Health Affairs, 29(5):806–810.
Pierron W, Fronstin P (2008). ERISA pre-emption: implications for health reform and coverage. Washington, DC, Employee Benefit Research Institute. Issue Brief 314.
Pietroburgo J (2006). Charity at the deathbed: impacts of public funding changes on hospice care. American Journal of Hospice and Palliative Medicine, 23(3):217–223.
Plotzke M, Courtemanche C (2011). Does procedure profitability impact whether an outpatient surgery is performed at an ambulatory surgery center or hospital? Health Economics, 20(7):817–830.
Poissant L et al., (2005). The impact of electronic health records on time efficiency of physicians and nurses: a systematic review. Journal of the American Medical Informatics Association, 12(5):505–516.

Health systems in transition United States of America412
Polinski JM et al., (2011a). Medicare Part D’s effect on the under- and overuse of medications: a systematic review. Journal of the American Geriatrics Society, 59(10):1922–1933.
Polinski J et al., (2011b). Changes in drug utilization during a gap in insurance coverage: an examination of the medicare Part D coverage gap. Plos Medicine, 8(8):e1001075 (http://www.plosmedicine.org/article/info%3Adoi%2F10.1371%2Fjournal.pmed.1001075, accessed 19 April 2013).
Pollack, H (2011). Political gridlock and the challenge of implementing health reform. Kaiser Health News February (http://www.kaiserhealthnews.org/Columns/2011/February/021111pollack.aspx, accessed 19 April 2013).
Pollack C, Gidengil C, Mehrotra A (2010). The growth of retail clinics and the medical home: two trends in concert or in conflict? Health Affairs, 29(5):998–1003.
Pozen A, Cutler DM (2011). Medical spending differences in the United States and Canada: the role of prices, procedures, and administrative expenses. Inquiry, 47(2):124–134.
Premier (2011). CMS/Premier Hospital Quality Incentive Demonstration (HQID) (http://www.premierinc.com/quality-safety/tools-services/p4p/hqi/index.jsp, accessed 19 April 2013).
President’s Council on Bioethics (2009). Council reports (www.bioethics.gov/reports, accessed 19 April 2013).
Press R (2009). Outpatient total and unicompartmental knee replacement possible, study finds. Orthopedics Today, 29(6):8–9.
Preston SH, Ho J (2010). Low life expectancy in the United States: is the health care system at fault? National Library of Medicine, National Institutes of Health (http://www.ncbi.nlm.nih.gov/books/nbk62584/, accessed 19 April 2013).
Princeton University (2012). The OTA legacy (http://www.princeton.edu/~ota/, accessed 19 April 2013).
Probst J, Laditka J, Laditka S (2009). Association between community health center and rural health clinic presence and county-level hospitalization rates for ambulatory care sensitive conditions: an analysis across eight US states. BMC Health Services Research, 9(134):1–11.
Qaseem A, Weech-Maldonado R, Mkanta W (2007). The Balanced Budget Act (1997) and the supply of nursing home subacute care. Journal of Health Care Finance, 34(2):38–47.
Quadagno J (2011). Interest group influence on the Patient Protection and Affordability Act of 2010: winners and losers in the health care reform debate. Journal of Health Politics, Policy and Law, 36(3):449–454.
Raab G (1981). National/state/local relationships in health planning: interest group reaction and lobbying. In: Health planning in the United States: selected policy issues, Vol II. Washington, DC, National Academies Press:114–142.
Rabinowitz HK et al., (2008). Medical school programs to increase the rural physician supply: A systematic review and projected impact of widespread replication. Academic Medicine, 83(3):235–243.
RAC (2012). CAH frequently asked questions. Rural Assistance Center web site (http://www.raconline.org/info_guides/hospitals/cahfaq.php#howmany, accessed 19 April 2013).
Radnofsky L (2011a). Long-term care gets the ax; White House decides one part of health-overhaul law would prove too costly. Wall Street Journal, 15 October 2011 (http://online.wsj.com/article/SB10001424052970204002304576631302927789920.html, accessed 19 April 2013).

Health systems in transition United States of America 413
Radnofsky L (2011b). Repeal health law? It won’t be easy. Wall Street Journal, 29 October 2011.
Radnofsky L (2012). Deloitte: one in 10 U.S. employers to drop health coverage. Wall Street Journal, 24 July 2012.
Ralston JD et al., (2010). Patient experience should be part of meaningful-use criteria. Health Affairs, 29(4):607–613.
RAND (2010). Health care on aisle 7: the growing phenomenon of retail clinics. RAND Health Research Highlights. Clinical Scholars Review, 3(1):10–13.
RAND Corporation (2010). Analysis of the Patient Protection and Affordable Care Act (H.R. 3590). Policy brief (http://www.rand.org/pubs/research_briefs/2010/RAND_RB9514.pdf, accessed 19 April 2013).
Raphael D (2007). Poverty and health. In: Poverty and policy in Canada: implications for health and quality of life. Toronto, Canadian Scholars’ Press:205–238.
Rauh SS et al., (2011). The savings illusion – why clinical quality improvement fails to deliver bottom-line results. New England Journal of Medicine, 365:e48.
Reinhardt U (2006). The pricing of U.S. hospital services: chaos behind a veil of secrecy. Health Affairs, (25)1:57–69.
Reinhardt U (2011). The many different prices paid to providers and the flawed theory of cost shifting: is it time for a more rational all-payer system? Health Affairs, 30(11):2125–2133.
Renzetti G et al., (2009). Less air pollution leads to rapid reduction of airway inflammation and improved airway function in asthmatic children. Pediatrics, 123(3):1051–1058.
Reuters (2010). Wellpoint targets breast cancer patients for rescission. The Medical News, 24 April 2010.
Reynolds D (2010). More Medicare, Medicaid patients turning to alternative therapies? EmaxHealth web site (http://www.emaxhealth.com/1506/more-medicare-medicaid-patients-turning-alternative-therapies.html, accessed 19 April 2013).
Rice T (2011). A progressive turn of events. Journal of Health Politics, Policy and Law, 36(3):491–494.
Rice T, Desmond K, Gabel J (1990). The Medicare Catastrophic Coverage Act: a post-mortem. Health Affairs, 9(3):75–87.
Rice TH, Kominski GF (2007). Containing health care costs. In: Andersen RM, Rice TH, Kominski GF, eds. Changing the U.S. health care system. San Francisco, CA, John Wiley & Sons.
Rice TH, Unruh L (2009). The economics of health reconsidered, 3rd edn. Chicago, Health Administration Press.
Richardson L, Norris M (2010). Access to health and health care: how race and ethnicity matter. The Mount Sinai Journal of Medicine, 77(2):166–177.
Richman I et al., (2007). National study of the relation of primary care shortages to emergency department utilization. Academic Emergency Medicine, 14(3):279–282.
Rittenhouse D et al., (2011). Small and medium-size physician practices use few patient-centered medical home processes. Health Affairs (Project Hope), 30(8):1575–1584.
Rivers P, Fottler M, Frimpong J (2010). The effects of certificate of need regulation on hospital costs. Journal of Health Care Finance, 36(4):1–16.
Robinson J (2008). Value-based purchasing for medical devices. Health Affairs, 27(6):1523–1531.

Health systems in transition United States of America414
Rodwin MA (2011). New standards for Medicare review organizations: holding them and health plans accountable for their decisions. Health Affairs, 30(3):519–524.
Rodwin MA, Chang HJ, Clausen J (2006). Malpractice premiums and physicians’ income: perceptions of a crisis conflict with empirical evidence. Health Affairs, 25(3):750–758.
Roemer R (2007). The continuing issue of medical malpractice liability. In: Andersen RM, Rice TH, Kominski GF, eds. Changing the U.S. health care system, San Francisco, CA, Jossey-Bass.
Rosenau PV (1994). The impact of political structures and informal political processes on health policy: comparison of the United States and Canada. Policy Studies Review, 13:293–314.
Rosenau PV (1997). Migration for medical care and pharmaceuticals: a research note on the NAFTA countries. Social Science Quarterly, 78(2):578–592.
Rosenau PV, Linder S (2003). Two decades of research comparing for-profit and nonprofit health provider performance. Social Science Quarterly 84(2):219–241.
Roser MA (2010). Texas doctors’ group against health bill, splits with AMA. Austin American-Statesman, 22 March 2010 (http://www.statesman.com/blogs/content/shared-gen/blogs/austin/health/entries/2010/03/22/texas_doctors_group_against_he.html/, accessed 19 April 2013).
Rosko (2004). The supply of uncompensated care in Pennsylvania hospitals: motives and financial consequences. Health Care Management Review, 29(3):229–239.
Ross JS, Detsky AS (2009). Health care choices and decisions in the United States and Canada. JAMA, 302(16):1803–1804.
Ryan AM (2009). Effects of the premier Hospital Quality Incentive Demonstration on Medicare patient mortality and cost. Health Services Research, 44(3):821–842.
Sachs BP et al., (1995). The impact of extreme prematurity and congenital anomalies on the interpretation of international comparisons of infant mortality. Obstetrics and Gynecology, 85:941–946.
Salinsky E (2010). Governmental public health: an overview of state and local public health agencies. National Health Policy Forum, Background paper No. 77. Washington, DC, George Washington University (http://www.nhpf.org/library/background-papers/BP77_GovPublicHealth_08-18-2010.pdf, accessed 19 April 2013).
Salinsky E, Loftis C (2007). Shrinking inpatient psychiatric capacity: cause for celebration or concern? National Health Policy Forum, Issue Brief No. 823 (http://www.signethealth.com/regulatory-updates/pdfs/ShrinkingIPC.pdf, accessed 19 April 2013).
Salkever DS, Bice TW (1976). The impact of certificate of need controls on hospital investment. Milbank Quarterly, 54:185–214.
SAMHSA (2004). Seclusion and restraint: statement of the problem and SAMHSA’s response (http://www.samhsa.gov/seclusion/sr_handout.aspx, accessed 19 April 2013).
Sanders AJ (2004). Nurses in adult day care centers. Geriatric Nursing, 25:227–232.Sarasohn-Kahn J (2010). How smart phones are changing health care for consumers and
providers. Report for the California Health Care Foundation, April 2010 (http://www.chcf.org/publications/2010/04/how-smartphones-are-changing-health-care-for-consumers-and-providers, accessed 19 April 2013).
Saultz JW, Lochner J (2005). Interpersonal continuity of care and care outcomes: a critical review. Annals of Family Medicine, 3:159–66.

Health systems in transition United States of America 415
Schaefer M et al., (2010). Infection control assessment of ambulatory surgical centers. JAMA, 303(22):2273–2279.
Scheffler R (2008). Is there a doctor in the house? Market signals and tomorrow’s supply of doctors. Palo Alto, CA, Stanford University Press.
Schlesinger M, Mitchell S, Gray B (2003). Measuring community benefits provided by nonprofit and for-profit HMOs. Inquiry, 40(2):114–132.
Schneider J et al., (2008). The economics of specialty hospitals. Medical Care Research and Review, 65(5):531–553.
Schoen C, Osborn R (2009). 2009 International Health Policy Survey of primary care physicians in eleven countries (http://www.commonwealthfund.org/~/media/Files/Publications/In%20the%20Literature/2009/Nov/PDF_Schoen_2009_Commonwealth_Fund_11country_intl_survey_chartpack_white_bkgd_PF.pdf, accessed 19 April 2013).
Schoen C, Osborn R (2011). 2011 International Health Policy Survey of sicker adults in eleven countries (http://www.commonwealthfund.org/~/media/Files/Publications/In%20the%20Literature/2011/Nov/IHP%20Survey/PDF_Schoen_2011_survey_ARTICLE_chartpack.pdf, accessed 19 April 2013).
Schoen C et al., (2008). How many are underinsured? Trends among U.S. adults, 2003 and 2007. Health Affairs, June 10.
Schoen C et al., (2010). How health insurance design affects access to care and costs, by income, in eleven countries. Health Affairs, 29(12):2323–2334.
Schoen C et al., (2011). Affordable Care Act reforms could reduce the number of underinsured U.S. adults by 70 percent. Health Affairs, 30(9):1762–1771.
Schoenbaum SC et al., (2011). Mortality amenable to health care in the United States: the roles of demographics and health systems performance. Journal of Public Health Policy, 1–23.
Schoenberg NE, Leach C, Edwards W (2009). “It’s a toss up between my hearing, my heart, and my hip’’: prioritization and accommodating multiple morbidities by vulnerable older adults. Journal of Health Care for the Poor and Underserved, 20:134–151.
Schor EL et al., (2011). Ensuring equity: a post-reform framework to achieve high performance health care for vulnerable populations. Report prepared for the Commonwealth Fund Commission on a High Performance Health System (http://www.commonwealthfund.org/Publications/Fund-Reports/2011/Oct/Ensuring-Equity.aspx, accessed 19 April 2013).
Schuhmann TM (2009). Hospital capital spending: shifting and slowing even before the financial meltdown. Healthcare Financial Management, November 2009.
Schweitzer S, Comanor W (2007). Controlling pharmaceutical prices and expenditures. In: Andersen RM, Rice TH, Kominski GF, eds. Changing the U.S. health care system. San Francisco, CA, Jossey-Bass, 157–182.
Scott D et al., (2009). Access and care issues in urban urgent care clinic patients. BMC Health Services Research, 9:222.
Scutchfield F, Mays G, Lurie N (2009). Applying health services research to public health practice: an emerging priority. Health Services Research, 44(5 Pt 2):1775–1787.
Seelye KQ (2010). Administration rejects health insurer’s defense of huge rate increases. The New York Times, 11 February 2010 (http://www.nytimes.com/2010/02/12/health/policy/12insure.html, accessed 19 April 2013).

Health systems in transition United States of America416
Seib GF (2009). Enduring partisan divide stokes skepticism of Washington (“Birds of a Feather” sidebar). Wall Street Journal, 2 November 2009 (http://online.wsj.com/article/SB125694556329419839.html, accessed 19 April 2013).
Sequist T (2011). Ensuring equal access to specialty care. New England Journal of Medicine, 364(23):2258–2259.
Sequist T et al., (2011). Trends in quality of care and barriers to improvement in the Indian Health Service. Journal of General Internal Medicine, 26(5):480–486.
Shen J, Washington E (2007). Disparities in outcomes among patients with stroke associated with insurance status. Stroke, 38(3):1010–1016.
Shen Y, Hsia R (2010). Changes in emergency department access between 2001 and 2005 among general and vulnerable populations. American Journal of Public Health, 100(8):1462–1469.
Shi L, Singh DA (2008). Delivering health care in America: a systems approach. Boston, MA, Jones & Bartlett.
Shi L, Singh DA (2012). Delivering health care in America: a systems approach, 5th edn. Boston, MA, Jones & Bartlett.
Shi L, Lebrun LA, Tsai J (2010). Access to medical care, dental care, and prescription drugs: the roles of race/ethnicity, health insurance, and income. Southern Medical Journal, 103(6):509–516.
Shi L et al., (2010). Characteristics of ambulatory care patients and services: a comparison of community health centers and physicians’ offices. Journal of Health Care for the Poor and Underserved, 21(4):1169–1183.
Short PF, Graefe DR (2003). Battery-powered health insurance? Stability in coverage of the uninsured. Health Affairs, 22(6):244–255.
Silow-Carroll S, Moody G (2011). Lessons from high- and low-performing states for raising overall health system performance. The Commonwealth Fund, May (http://www.commonwealthfund.org/~/media/Files/Publications/Issue%20Brief/2011/May/1497_SilowCarroll_lessons_from_highlow_states_ib.pdf, accessed 19 April 2013).
Silverstein B, Findley P, Bode R (2006). Usefulness of the nursing home quality measures and quality indicators for assessing skilled nursing facility rehabilitation outcomes. Archives of Physical Medicine and Rehabilitation, 87(8):1021–1025.
Sirovich BE et al., (2006). Regional variations in health care intensity and physician perceptions of quality of care. Ann Intern Med 144:641 – 9.
Sloan FA, Chepke LM (2008). Medical malpractice. Boston, MA, MIT Press.Sloan F, Ostermann J, Conover C (2003). Antecedents of hospital ownership conversions,
mergers, and closures. Inquiry, 40(1):39–56.Smedley BD, Stith AY, Nelson AR (2003). Unequal treatment: confronting racial and ethnic
disparities in health care. Institute of Medicine Committee on Understanding and Eliminating Racial and Ethnic Disparities in Health Care, Washington, DC, National Academies Press (http://www.nap.edu/catalog/12875.html, accessed 19 April 2013).
Smith DP, Bradshaw BS (2006). Rethinking the Hispanic paradox: death rates and life expectancy for US non-Hispanic White and Hispanic populations. American Journal of Public Health, 96(9):1686–1692.
Solomon J (2007). Cost sharing and premiums in Medicaid: what rules apply? Center on Budget and Policy Priorities (http://www.cbpp.org/cms/index.cfm?fa=view&id=1125, accessed 19 April 2013).

Health systems in transition United States of America 417
Solway E et al., (2010). Access barriers to mental health services for older adults from diverse populations: perspectives of leaders in mental health and aging. Journal of Aging and Social Policy, 22(4):360–378.
Sommers AS, Paradise J, Miller C (2011). Physician willingness and resources to serve more Medicaid patients: perspectives from primary care physicians. Medicare and Medicaid Research Review, 1(2).
Sommers B, Epstein AM (2010). Medicaid expansion – the soft underbelly of health care reform? New England Journal of Medicine, 363(2):2085–2087.
Somnath S, Coffman DD, Smits AK (2010). Giving teeth to comparative-effectiveness research – the Oregon experience. New England Journal of Medicine, 362(7):e18.
Song Y et al., (2010). Regional variations in diagnostic practices. New England Journal of Medicine, 363(1):45–53.
Sorensen T, Song J, Westberg S (2004). The limitation of good intentions: prescribing medications for the uninsured. Journal of Health Care for the Poor and Underserved, 15(2):152–160.
Sparer MS (2011). Federalism and the Patient Protection and Affordable Care Act of 2010; the founding fathers would not be surprised. Journal of Health Politics, Policy and Law, 36(3):461–468.
Squires DA (2011). The U.S. health system in perspective: a comparison of twelve industrialized nations. Commonwealth Fund Publication, 16:1–14.
Staiger DO, Auerbach DI, Buerhaus PI (2011). Health care reform and the health care workforce – the Massachusetts experience. New England Journal of Medicine, 365:e24 (http://www.nejm.org/doi/full/10.1056/NEJMp1106616, accessed 19 April 2013).
Starfield B (1998). Primary care: balancing health needs, services, and technology. New York, Oxford University Press.
Starfield B, Fryer G Jr (2007). The primary care physician workforce: ethical and policy implications. Annals of Family Medicine, 5(6):486–491.
Starfield B, Shi L, Macinko J (2005). Contribution of primary care to health systems and health. Milbank Quarterly, 83(3):457–502.
Starr P (1982). The social transformation of American medicine. New York, Basic Books.Starr P (2011). Remedy and reaction: the peculiar American struggle over health care reform.
New Haven, CT, Yale University Press.Steinberg CR (2010). Trends: even as health reform takes center stage, economic challenges
remain. AHA Hospital Statistics, Health Forum LLC, an affiliate of the American Hospital Association (http://www.aha.org/aha/trendwatch/2009/09nov-econimpacttrends.pdf, accessed 19 April 2013).
Steinhauer J (2012). Congress nearing end of session where partisan input impeded output. The New York Times, 18 September 2012.
Steinwald B (2008). Primary care professionals: recent supply trends, projections, and valuation of services. Statement in testimony before the Senate Committee on Health, Education, Labor, and Pensions. Washington, DC, Government Accounting Office (http://www.gao.gov/new.items/d08472t.pdf, accessed 19 April 2013).
Stewart K, Gostin LO (2011). Food and Drug Administration regulation of food safety. JAMA, 306(1):88–89.
Stewart WH (1982). Metaphors, models, and the development of federal theory. Publius, 12(2):5–24.

Health systems in transition United States of America418
Stone P et al., (2006). Organizational climate and intensive care unit nurse’ intention to leave. Critical Care Medicine, 34(7):1907–1912.
Stremikis K et al., (2011). Health care opinion leaders’ views on vulnerable populations in the U.S. health system. Commission on a High Performance Health System, Commonwealth Fund Data Brief, August 2011, Commonwealth Fund pub.1536, Vol. 17 (http://www.commonwealthfund.org/~/media/Files/Publications/Data%20Brief/2011/Aug/1536_Stremikis_HCOL_vulnerable_populations_data_brief.pdf, accessed 19 April 2013).
Studdert DM et al., (2006). Claims, errors, and compensation payments in medical malpractice litigation. New England Journal of Medicine, 354:2024–2033.
Su D, Li L (2011). Trends in the use of complementary and alternative medicine in the United States: 2002–2007. Journal of Health Care for the Poor and Underserved, 22(1):296–310.
Sullivan J, Stoll K (2010). Lower taxes, lower premiums: the new health insurance tax credit. Families USA (http://www.familiesusa.org/assets/pdfs/health-reform/Premium-Tax-Credits.pdf, accessed 19 April 2013).
Sullivan P (2011). Putting your doctor, or a whole team of them, on retainer. The New York Times, 29 April 2011 (http://www.nytimes.com/2011/04/30/your-money/30wealth.html?pagewanted=all, accessed 19 April 2013).
Sullivan S et al., (2009). Health technology assessment in health-care decisions in the United States. Value in Health: the Journal of the International Society for Pharmacoeconomics and Outcomes Research, 12(Suppl 2):S39–S44.
Supreme Court of the United States (2012). National Federation of Independent Business et al., v. Sebelius, Secretary of Health and Human Services et al., Certiorari to the United States Court of Appeals for the Eleventh Circuit. No 11-393. Argued 26–28 March 2012 – Decided 28 June 2012 (http://www.supremecourt.gov/opinions/11pdf/11-393c3a2.pdf, accessed 19 April 2013).
Swan J et al., (2003). National Health Interview Survey. Cancer, 98:1528–40.Swartz K (2006). Reinsuring health. New York, Russell Sage Foundation.Swartz K (2008). Uninsured in American: new realities, new risks. In: Hacker JS ed.
Health at risk: American’s ailing health system – and how to heal it. New York, NY, Columbia University Press.
Tang N et al., (2010). Trends and characteristics of US emergency department visits, 1997–2007. JAMA, 304(6):664–670.
Tappan J (2005). Medical-malpractice reform: is enterprise liability or no-fault a better reform? Boston College Law Review, 46:1095–1130.
Tax Policy Center (2010). Medicare tax as proposed in Senate Health Bill and Reconciliation Act of 2010. Distribution of federal tax change by cash income level, 2013 (http://www.taxpolicycenter.org/numbers/displayatab.cfm?Docid=2697&DocTypeID=1, accessed 19 April 2013).
Terry K (2009). Hospitals expect financial gains from reform. CBS News, 27 August 2009 (http://www.cbsnews.com/8301-505123_162-43840659/hospitals-expect-financial-gains-from-reform/, accessed 19 April 2013).
Thorpe KE (2004). The medical malpractice ‘crisis’: recent trends and the impact of state tort reforms. Health Affairs (web exclusive), January 21:W4-20–W4-30.
Health systems in transition United States of America 419
Tolbert J (2010). Health reform: an overview. Kaiser Commission on Medicaid and the Uninsured for KaiserEDU.org (http://www.kaiseredu.org/Tutorials-and-Presentations/Health-Reform-Overview.aspx?referrer=search, accessed 19 April 2013).
Torbati YJ (2010). Aging transit systems face budget crunch. The New York Times, 24 June 2010 (http://www.nytimes.com/2010/07/25/us/25transit.html?_r=0, accessed 19 April 2013).
Torrey EF et al., (2008). The shortage of public hospital beds for mentally ill persons. A report of the Treatment Advocacy Center (http://www.treatmentadvocacycenter.org/storage/documents/the_shortage_of_publichospital_beds.pdf, accessed 19 April 2013).
Torrey EF et al., (2012). No room at the inn: trends and consequences of closing public psychiatric hospitals 2005–2010. A report of the Treatment Advocacy Center (http://tacreports.org/storage/documents/no_room_at_the_inn-2012.pdf, accessed 19 April 2013).
Towfighi A, Zheng L, Ovbiagele B (2010). Weight of the obesity epidemic: rising stroke rates among middle-aged women in the United States. Stroke, 41:1371–1375.
Truffer CJ et al., (2010). Health spending projections through 2019: the recession’s impact continues. Health Affairs, 29(3):1–8.
Truman BI et al., (2000). Developing the guide to community preventive services – overview and rationale. American Journal of Preventive Medicine, 18(1S):18–26.
Trzeciak S, Rivers E (2003). Emergency department overcrowding in the United States: an emerging threat to patient safety and public health. Emergency Medicine Journal, 20(5):402–405.
Tu H, Ginsburg P (2006). Losing ground: physician income, 1995–2003. Tracking Report: Center For Studying Health System Change, 15:1–5.
Tunis SR, Kang JL (2001). Improvement in Medicare coverage of new technology: how Medicare has responded to the need to improve access to beneficial technologies. Health Affairs, 20(5):83–85.
UCLA (2007). Undocumented residents make up small share of California’s uninsured population. UCLA Center for Health Policy Research (http://healthpolicy.ucla.edu/publications/search/pages/detail.aspx?PubID=228, accessed 19 April 2013).
Unruh L (2010). Toward a sustainable nursing workforce. In: Futurescan 2010: Healthcare Trends and Implications. Chicago, Health Administration Press.
Unruh L, Fottler M (2005). Projections and trends in nursing supply: what do they tell us about the nursing shortage? Policy, Politics and Nursing Practice, 6(3):171–182.
U.S. Census Bureau (2009). Internet use in the United States (http://www.census.gov/population/www/socdemo/computer/2009.html, accessed 19 April 2013).
U.S. Census Bureau (2010a). Income, poverty and health insurance coverage in the United States: 2009 (http://www.census.gov/newsroom/releases/archives/income_wealth/cb10-144.html, accessed 19 April 2013).
U.S. Census Bureau (2010b). NAICS 6211, Offices of Physicians (http://www.census.gov/econ/census02/data/industry/E62111.HTM#bridge, accessed 19 April 2013).
U.S. Census Bureau (2011). Census bureau projects U.S. population of 312.8 million on New Year’s Day. Press release 29 December 2011 (http://www.census.gov/newsroom/releases/archives/population/cb11-219.html, accessed 19 April 2013).
U.S. Census Bureau (2012). Statistical abstract of the United States (http://www.census.gov/compendia/statab/2012/tables/12s0005.pdf, accessed 19 April 2013).
Health systems in transition United States of America420
U.S. Central Intelligence Agency (2010). The World Factbook (https://www.cia.gov/library/publications/the-world-factbook/fields/2172.html, accessed 19 April 2013).
U.S. Department of Food and Agriculture (2011). USDA mission areas (http://www.usda.gov/wps/portal/usda/usdahome?navid=USDA_MISSION_AREAS&navtype=RT&parentnav
=AGENCIES_OFFICES, accessed 19 April 2013).U.S. Department of Health and Human Services (1992). Medicaid hassle: state responses to
physician complaints. Office of Inspector General (http://oig.hhs.gov/oei/reports/oei-01-92-00100.pdf, accessed 19 April 2013).
U.S. Department of Health and Human Services (2000a). Medicaid: a program overview. In: A Profile of Medicaid: 2000 Chartbook, Section 1 (http://www.policyalmanac.org/health/archive/hhs_medicaid.shtml, accessed 19 April 2013).
U.S. Department of Health and Human Services (2000b). Oral health in America. A report of the Surgeon General. Executive summary. U.S. Department of Health and Human Services (http://www2.nidcr.nih.gov/sgr/execsumm.htm, accessed 19 April 2013).
U.S. Department of Health and Human Services (2004). National call to action to promote oral health: a public–private partnership. U.S. Department of Health and Human Services (http://www.surgeongeneral.gov/topics/oralhealth/nationalcalltoaction.html, accessed 19 April 2013).
U.S. Department of Health and Human Services (2010a). History of SSA during the Johnson administration 1963–1968 (http://www.ssa.gov/history/ssa/lbjmedicare1.html, accessed 19 April 2013).
U.S. Department of Health and Human Services (2010b). Hill-Burton reduced and reduced-cost health care (http://www.hrsa.gov/gethealthcare/affordable/hillburton/, accessed 19 April 2013).
U.S. Department of Health and Human Services (2010c). Health, U.S., 2010 (http://www.cdc.gov/nchs/data/hus/hus10.pdf, accessed 19 April 2013).
U.S. Department of Health and Human Services (2010d). Indian Health Care Improvement Act made permanent (http://www.hhs.gov/news/press/2010pres/03/20100326a.html, accessed 19 April 2013).
U.S. Department of Health and Human Services (2011a). Health, U.S., 2011 (http://www.cdc.gov/nchs/data/hus/hus11.pdf#listtables, accessed 19 April 2013).
U.S. Department of Health and Human Services (2011b). Report on prescription drug importation. HHS Task Force on Drug Importation (archive.hhs.gov/importtaskforce/Report1220.pdf, accessed 19 April 2013).
U.S. Department of Health and Human Services (2011c). Understanding health information privacy (http://www.hhs.gov/ocr/privacy/hipaa/understanding/index.html, accessed 19 April 2013).
U.S. Department of Health and Human Services (2011d). Selected medical benefits. A report from the Department of Labor to the Department of Health and Human Services (http://www.bls.gov/ncs/ebs/sp/selmedbensreport.pdf, accessed 19 April 2013).
U.S. Department of Health and Human Services (2011e). Affordable Care Act to help improve care for Medicare beneficiaries: 500 federally qualified health centers to receive funding, participate in a program to improve care. Press release, 24 October 2011.
U.S. Department of Health and Human Services (2011f). Improving care coordination and lowering costs by bundling payments (http://www.healthcare.gov/news/factsheets/2011/08/bundling08232011a.html, accessed 19 April 2013).
Health systems in transition United States of America 421
U.S. Department of Health and Human Services (2011g). HHS announces new incentives for providers to work together through accountable care organizations when caring for people with Medicare; new tools help doctors and other health care providers improve quality of care. Press release, 20 October 2011.
U.S. Department of Health and Human Services (2011h). More people using free preventive benefits provided by Affordable Care Act; number of people who received 50 percent discount on prescription drugs also rises. Press release, 6 October 2011.
U.S. Department of Health and Human Services (2011i). Unprecedented tool developed for small businesses to find and compare health insurance plans. Press release, 12 November 2011 (http://www.hhs.gov/news/press/2011pres/11/20111118a.html).
U.S. Department of Health and Human Services (2011j). Reducing costs, protecting consumers: the Affordable Care Act on the one year anniversary of the Patients’ Bill of Rights (http://www.healthcare.gov/law/resources/reports/patients-bill-of-rights09232011a.pdf, accessed 19 April 2013).
U.S. Department of Health and Human Services (2011k). Healthy People 2020. Centers for Disease Control and Prevention (http://www.cdc.gov/nchs/healthy_people/hp2020.htm, accessed 19 April 2013).
U.S. Department of Health and Human Services (2012). About HHS. U.S. Department of Health and Human Services (with information on the USPHS and links to each department within USPHS) (http://www.hhs.gov/about/, accessed 19 April 2013).
U.S. Department of Health and Human Services Office of the Inspector General (2009). Comparing pharmacy reimbursement: Medicare Part D to Medicaid (http://oig.hhs.gov/oei/reports/oei-03-07-00350.pdf, accessed 19 April 2013).
U.S. Department of Labor (2011). Health plans & benefits: Employee Retirement Income Security Act – ERISA (http://www.dol.gov/dol/topic/health-plans/erisa.htm, accessed 19 April 2013).
U.S. Department of State (2011). The budget reconciliation process. InfoUSA (http://infousa.state.gov/government/overview/bud_rec_proc.html, accessed 19 April 2013).
U.S. Department of Veterans Affairs (2010). 2010 Organizational Briefing Book (http://www4.va.gov/ofcadmin/docs/vaorgbb.pdf, accessed 19 April 2013).
U.S. Environmental Protection Agency (2011). EPA History 1970–1985 (http://www.epa.gov/aboutepa/history/topics/epa/15b.html, accessed 3 July 2013).
U.S. General Accounting Office (2003). Medical malpractice insurance (http://www.gao.gov/new.items/d03702.pdf, accessed 19 April 2013).
U.S. Government Accountability Office (2009). Letter from John E Dicken to The Honorable Olympia Snow (http://www.gao.gov/new.items/d09363r.pdf, accessed 19 April 2013).
U.S. Government Accountability Office (2011). Medicare Advantage; enrollment increased from 2010 to 2011 while premiums decreased and benefit packages were stable (http://www.gao.gov/new.items/d1293.pdf, accessed 19 April 2013).
U.S. National Center for Education Statistics (2009). Highlights from TIMSS 2007 (http://nces.ed.gov/pubs2009/2009001.pdf, accessed 19 April 2013).
Van der Hooft C et al., (2005). Inappropriate drug prescribing in older adults: the updated 2002 Beers criteria–a population-based cohort study. British Journal of Clinical Pharmacology, 60(2):137–144.
Van Loon R, Borkin J, Steffen J (2002). Health care experiences and preferences of uninsured workers. Health & Social Work, 27(1):17–26.

Health systems in transition United States of America422
Vega W, Rodriquez MA, Gruskin E (2009). Health disparities in the Latino population. Epidemiology Review, 31:99–112.
Vermont Department of Health–Barre (2007). Healthy babies, kids & families: menu of benefits (http://humanservices.vermont.gov/departments/ahs-fs-folder/barre-district-office/vermont-department-of-health/, accessed 19 April 2013).
Vestal C (2011). One state’s hospital cost solution: regulated prices. Stateline: State Policy and Politics (http://www.stateline.org/live/details/story?contentId=562689, accessed 19 April 2013).
VHA (2012). About VHA (http://www.va.gov/health/aboutVHA.asp).Vogeli C et al., (2007). Multiple chronic conditions: prevalence, health consequences, and
implications for quality, care management, and costs. Journal of General Internal Medicine, 22:391–395.
Volden C, Wiseman AE (2011). Breaking gridlock: the determinants of health policy change in Congress. Journal of Health Politics, Policy and Law, 36(2):227–264.
Wallack AR (2011). Single payer ahead – cost control and the evolving Vermont model. New England Journal of Medicine, 365:584–585.
Wang E et al., (2004). Inequality of access to surgical specialty health care: why children with government-funded insurance have less access than those with private insurance in Southern California. Pediatrics, 114(5):e584–90.
Wang H, Norton EC, Rozier R (2007). Effects of the State Children’s Health Insurance Program on access to dental care and use of dental services. Health Services Research, 42(4):1544–1563.
Washington Post/Kaiser Family Foundation/Harvard University (2010). Role of government survey (http://www.kff.org/kaiserpolls/upload/8112.pdf, accessed 19 April 2013).
Watson M, Dannenberg AL (2008). Investment in safe routes to school projects: public health benefits for the larger community. Preventing Chronic Disease, 5(3):1–7.
Weaver C, Whalen J, Faucon B (2012). Drug distributor is tied to imports of fake Avastin. Wall Street Journal, 7 March 2012.
Weech-Maldonado R, Qaseem A, Mkanta W (2009). Operating environment and USA nursing homes’ participation in the subacute care market: a longitudinal analysis. Health Services Management Research, 22(1):1–7.
Weeks WB, Wallace AE (2002). The more things change: revisiting a comparison of educational costs and incomes of physicians and other professionals. Academic Medicine, 77(4):312–319.
Weiner J (2007). Expanding the US medical workforce: global perspectives and parallels. BMJ, 335(7613):236–238.
Weiner S et al., (2008). Managing the unmanaged: a case study of intra-institutional determinants of uncompensated care at health care institutions with differing ownership models. Medical Care, 46(8):821–828.
Weinick RM, Betancourt, RM (2007). No appointment needed: the resurgence of urgent care centers in the United States. Oakland, CA, California Health care Foundation (http://www.chcf.org/~/media/MEDIA%20LIBRARY%20Files/PDF/N/PDF%20NoAppointmentNecessaryUrgentCareCenters.pdf, accessed 19 April 2013).
Weinick R, Bristol S, DesRoches C (2009a). Urgent care centers in the U.S.: findings from a national survey. BMC Health Services Research, 979 (http://www.ncbi.nlm.nih.gov/pmc/articles/PMC2685126/, accessed 19 April 2013).

Health systems in transition United States of America 423
Weinick RM, Bristol SJ, DesRoches CM (2009b). The quality of care at urgent care centers, Journal of Urgent Care Medicine, 27–30 (http://jucm.com/pdf/The_Quality_of_Care_at_Urgent_Care_Centers.pdf, accessed 19 April 2013).
Weinick R, Burns R, Mehrotra A (2010). Many emergency department visits could be managed at urgent care centers and retail clinics. Health Affairs, 29(9):1630–1636.
Weissert CS, Weissert WG (2006). Governing health: the politics of health policy, 3rd edn. Baltimore, MD, The Johns Hopkins University Press.
Weissman J (2005). The trouble with uncompensated hospital care. New England Journal of Medicine, 352(12):1171 –1173.
Weissman J, Bigby J (2009). Massachusetts health care reform – near-universal coverage at what cost? New England Journal of Medicine, 361(21):2012–2015.
Weissman J, Gaskin DJ, Reuter J (2003). Hospitals’ care of uninsured patients during the 1990s: the relation of teaching status and managed care to changes in market share and market concentration. Inquiry, 40(1):84–93.
Weissman J et al., (2003). Limits to the safety net: teaching hospital faculty report on their patients’ access to care. Health Affairs, 22(6):156–166.
Wennberg J, Fisher E, Skinner J (2002). Geography and the debate over Medicare reform. Health Affairs (web exclusive), W96–W114.
Wennberg JE et al., (2009). Inpatient care intensity and patients’ ratings of their hospital experiences. Health Affairs 28 (1):103–112.
Werner RM et al., (2011). The effect of Pay-For-Performance in hospitals: lessons for quality improvement. Health Affairs, 30(4):690–698.
Wetzel MA, Eisenberg DM, Kaptchuk TJ (1998). Courses involving complementary and alternative medicine at US medical schools. JAMA, 280:784–787.
Whitcomb M (2006). The shortage of physicians and the future role of nurses. Academic Medicine: Journal of the Association of American Medical Colleges, 81(9):779–780.
Whitmore H et al., (2011). The individual insurance market before reform: low premiums and low benefits. Medical Care Research and Review, 68(5):594–606.
WHO (2006). The World Health Report 2006: working together for health. Geneva, WHO Press.
WHO (2007). The right to health – fact sheet (http://www.who.int/mediacentre/factsheets/fs323_en.pdf, accessed 19 April 2013).
WHO (2012). Disabilities (http://www.who.int/topics/disabilities/en/, accessed 19 April 2013).Wildavsky A (1973). If planning is everything, maybe it’s nothing. Policy Sciences,
4(3):277–295.Wilkin D (2002). Restructuring primary and community health services in four countries:
from cottage industry to integrated provider? Health and Social Care in The Community, 10(5):309–312.
Wilkinson R (1996). Unhealthy societies: the afflictions of inequality. New York, Routledge.Wilkinson RG, Marmot M (2003). Social determinants of health: the solid facts.
World Health Organization.Wilper A et al., (2008). A national study of chronic disease prevalence and access to care
in uninsured U.S. adults. Annals of Internal Medicine, 149(3):170–176.Wilson J (2005). U.S. needs more physicians soon, but how many more is debatable.
Annals of Internal Medicine, 143(6):469–472.
Health systems in transition United States of America424
Wintemute GJ, Braga AA, Kennedy DM (2010). Private-party gun sales, regulation, and public safety. New England Journal of Medicine, 363(6):508–511.
Winter A (2003). Comparing the mix of patients in various outpatient surgery settings: which type of facility treats the most costly patients: hospital outpatient departments or freestanding surgery centers? Health Affairs, 22(6):68–75.
Winters J et al., (2008). Coordinating eye and primary medical care in a low-income and uninsured population: the experience of the Vision of Hope Health Alliance. Optometry – Journal of the American Optometric Association, 79(12):730–736.
Woolf SH, Aron L, eds. (2013). Shorter lives, poorer health. Washington, DC, National Academies Press.
WWAMI (2006). Registered nurse vacancies in federally funded health centers. WWAMI Rural Health Research Center, Seattle, WA (http://depts.washington.edu/uwrhrc/uploads/RHRC_RNHCs_2Pgr.pdf, accessed 19 April 2013).
Yee H (2011). The patient-centered medical home neighbor: a subspecialty physician’s view. Annals of Internal Medicine, 154(1):63–64.
Yee T et al., (2011). Health care certificate-of-need laws: policy or politics? National Institute for Healthcare Reform, Research brief, No. 4 (http://www.nihcr.org/news_CON_Laws, accessed 19 April 2013).
Yordy KD (2006). The nursing faculty shortage: a crisis for health care. Robert Wood Johnson Foundation sponsored report (www.rwjf.org/files/publications/other/NursingFacultyShortage071006.pdf, accessed 19 April 2013).
Zeber J et al., (2010). Family perceptions of post-deployment health care needs of Iraq/Afghanistan military personnel. Mental Health in Family Medicine, 7(3):135–143.
Zezza M, Abrams M, Guterman S (2011). The Innovation Center at one year: much progress, more to be done. Commonwealth Fund Blog, 29 November 2011.
Zhang J (2009). Maryland reins in hospital costs by setting rates. Wall Street Journal, 14 September 2009.
Zhang W et al., (2006). The role of rural health clinics in hospitalization due to ambulatory care sensitive conditions: a study in Nebraska. Journal of Rural Health, 22(3):220–223.
Zigmond J (2007). Remote possibilities. Rural communities seek creative solutions as they grapple with a nurse shortage that’s particularly acute outside metro areas. Modern Healthcare, 37(15):26–28.
Zuckerman S, Waldmann TA, Lawton E (2011). Undocumented immigrants, left out of health Reform, likely to continue to grow as a share of the uninsured. Health Affairs, 30(10):1997–2004.
Zuckerman S et al., (2004a). Changes in Medicaid physician fees, 1998–2003: implications for physician participation. Health Affairs (web exclusive), W4-374–W4-384.
Zuckerman S et al., (2004b). Health service access, use, and insurance coverage among American Indians/Alaska Natives and whites: what role does the Indian Health Service play? American Journal of Public Health, 94(1):53–59.
Zuger A (2004). Dissatisfaction with medical practice. New England Journal of Medicine, 350(1):69–75.

Health systems in transition United States of America 425
9.2 Useful web sites
Choosing health insurance http://www.consumerreports.org/health/insurance/health-insurance/how-to-pick-health-insurance/health-care-plans.htm
Community Preventive Services http://www.thecommunityguide.org/index.html
Consumer information about vaccines www.vaccines.gov
Consumer Reports www.consumerreports.org
Designing and Building Healthy Places http://www.cdc.gov/healthyplaces/
Essential health benefits http://www.healthcare.gov/glossary/e/essential.html
Federal poverty guidelines http://www.familiesusa.org/resources/tools-for-advocates/guides/federal-poverty-guidelines.html
Health Profession Shortage Areas by state and county http://hpsafind.hrsa.gov/
Health Reform Implementation Timeline http://healthreform.kff.org/Timeline.aspx
Healthy People programme http://www.healthypeople.gov/2020
HEDIS and performance management http://www.ncqa.org/tabid/59/Default.aspx
Home Health Compare http://www.medicare.gov/HomeHealthCompare/search.aspx
Hospital Compare http://hospitalcompare.hhs.gov/
Hospital Quality Alliance http://www.hospitalqualityalliance.org/hospitalqualityalliance/index.html

Health systems in transition United States of America426
How do hospitals get paid? A primer http://economix.blogs.nytimes.com/2009/01/23/how-do-hospitals-get-paid-a-primer
Kaiser Family Foundation’s Medicaid Online Database http://medicaidbenefits.kff.org/
Kaiser Family Foundation U.S. Global Health Policy http://globalhealth.kff.org/
Mayo Clinic’s patient information http://www.mayoclinic.com/health-information/
Medicaid http://www.medicaid.gov/
Microsoft HealthVault http://www.microsoft.com/en-us/healthvault/
Military Health System http://www.health.mil/About_MHS/Organizations/Index.aspx
National Hospice and Palliative Care Organization http://www.caringinfo.org/i4a/pages/index.cfm?pageid=3354
Nursing Home Compare http://www.medicare.gov/NHCompare/
Nursing home quality initiative http://www.cms.gov/NursingHomeQualityInits/10_NHQIQualityMeasures.asp#TopOfPage
Office of Science Coordination and Policy http://www.epa.gov/scipoly/
Physicians for a National Health Program http://www.pnhp.org
Public and private health insurance www.healthcare.gov/compare/index.html
Scientific Advisory Panel Formation Process http://www.epa.gov/scipoly/sap/panel.htm
United States Access Board http://www.access-board.gov/about.htm

Health systems in transition United States of America 427
United States Code of Federal Regulations (Section 160.103) http://cfr.vlex.com/vid/160-103-definitions-19933565
United States government prevention, wellness and comparing providers www.healthcare.gov/compare/index.html
USAID www.usaid.gov
U. S. Global Health Initiative www.ghi.gov
U.S. President’s Emergency Plan for AIDS Relief www.pepfar.gov
9.3 HiT methodology and production process
HiTs are produced by country experts in collaboration with the Observatory’s research directors and staff. They are based on a template that, revised periodically, provides detailed guidelines and specific questions, definitions, suggestions for data sources and examples needed to compile reviews. While the template offers a comprehensive set of questions, it is intended to be used in a flexible way to allow authors and editors to adapt it to their particular national context. The most recent template is available online at:
http://www.euro.who.int/en/home/projects/observatory/publications/health-system-profiles-hits/hit-template-2010.
Authors draw on multiple data sources for the compilation of HiTs, ranging from national statistics, national and regional policy documents to published literature. Furthermore, international data sources may be incorporated, such as those of the OECD and the World Bank. The OECD Health Data contain over 1200 indicators for the 34 OECD countries. Data are drawn from information collected by national statistical bureaux and health ministries. The World Bank provides World Development Indicators, which also rely on official sources.
In addition to the information and data provided by the country experts, the Observatory supplies quantitative data in the form of a set of standard comparative figures for each country, drawing on the European Health for All database. The Health for All database contains more than 600 indicators defined by the WHO Regional Office for Europe for the purpose of monitoring Health in All Policies in Europe. It is updated for distribution twice a year from various

Health systems in transition United States of America428
sources, relying largely upon official figures provided by governments, as well as health statistics collected by the technical units of the WHO Regional Office for Europe. The standard Health for All data have been officially approved by national governments. With its summer 2007 edition, the Health for All database started to take account of the enlarged EU of 27 Member States.
HiT authors are encouraged to discuss the data in the text in detail, including the standard figures prepared by the Observatory staff, especially if there are concerns about discrepancies between the data available from different sources.
A typical HiT consists of nine chapters.
1. Introduction: outlines the broader context of the health system, including geography and sociodemography, economic and political context, and population health.
2. Organization and governance: provides an overview of how the health system in the country is organized, governed, planned and regulated, as well as the historical background of the system; outlines the main actors and their decision-making powers; and describes the level of patient empowerment in the areas of information, choice, rights, complaints procedures, public participation and cross-border health care.
3. Financing: provides information on the level of expenditure and the distribution of health spending across different service areas, sources of revenue, how resources are pooled and allocated, who is covered, what benefits are covered, the extent of user charges and other out-of-pocket payments, voluntary health insurance and how providers are paid.
4. Physical and human resources: deals with the planning and distribution of capital stock and investments, infrastructure and medical equipment; the context in which IT systems operate; and human resource input into the health system, including information on workforce trends, professional mobility, training and career paths.
5. Provision of services: concentrates on the organization and delivery of services and patient flows, addressing public health, primary care, secondary and tertiary care, day care, emergency care, pharmaceutical care, rehabilitation, long-term care, services for informal carers, palliative care, mental health care, dental care, complementary and alternative medicine, and health services for specific populations.
6. Principal health reforms: reviews reforms, policies and organizational changes; and provides an overview of future developments.

Health systems in transition United States of America 429
7. Assessment of the health system: provides an assessment based on the stated objectives of the health system, financial protection and equity in financing; user experience and equity of access to health care; health outcomes, health service outcomes and quality of care; health system efficiency; and transparency and accountability.
8. Conclusions: identifies key findings, highlights the lessons learned from health system changes; and summarizes remaining challenges and future prospects.
9. Appendices: includes references, useful web sites and legislation.
The quality of HiTs is of real importance since they inform policy-making and meta-analysis. HiTs are the subject of wide consultation throughout the writing and editing process, which involves multiple iterations. They are then subject to the following.
• A rigorous review process (see the following section).• There are further efforts to ensure quality while the report is finalized that
focus on copy-editing and proofreading.• HiTs are disseminated (hard copies, electronic publication, translations
and launches). The editor supports the authors throughout the production process and in close consultation with the authors ensures that all stages of the process are taken forward as effectively as possible.
One of the authors is also a member of the Observatory staff team and they are responsible for supporting the other authors throughout the writing and production process. They consult closely with each other to ensure that all stages of the process are as effective as possible and that HiTs meet the series standard and can support both national decision-making and comparisons across countries.
9.4 The review process
This consists of three stages. Initially the text of the HiT is checked, reviewed and approved by the series editors of the European Observatory. It is then sent for review to two independent academic experts, and their comments and amendments are incorporated into the text, and modifications are made
Health systems in transition United States of America430
accordingly. The text is then submitted to the relevant ministry of health, or appropriate authority, and policy-makers within those bodies are restricted to checking for factual errors within the HiT.
9.5 About the authors
Thomas Rice PhD is Professor of Health Policy and Management in the Fielding School of Public Health, University of California, Los Angeles. A health economist, he received his Doctorate in Economics from the University of California, Berkeley. Previously he was on the faculty of the University of North Carolina, Chapel Hill School of Public Health. His research interests include markets and regulation, health insurance, physicians’ economic behaviour, the U.S. Medicare programme and the behavioural economics of health.
Pauline Rosenau PhD is Professor of Management, Policy and Community Health at the School of Public Health, Health Science Center, University of Texas-Houston. She received her Doctorate in Political Science from the University of California, Berkeley and her Master’s in Public Health from UCLA. Previously she was a professor at the University of Quebec-Montreal. Her research interests include long-term residential care, comparative international health policy, U.S. health policy, pay-for-performance, competition in the health sector, public/private policy partnerships, the implications of investor status for the provision of health services, pharmacy policy and post-modernism.
Lynn Y. Unruh is Professor of Health Services Administration in the Department of Health Management and Informatics at the University of Central Florida. A nurse and health economist, Dr Unruh received her Bachelor’s in Nursing at the University of Illinois and her Doctorate in Economics at the University of Notre Dame. Her research focuses on workforce issues at the micro and macro level.
Andrew J. Barnes PhD is Assistant Professor of Healthcare Policy and Research in the Virginia Commonwealth University School of Medicine. A health economist, he received his Doctorate in Health Services from the University of California, Los Angeles. His research focuses on understanding the psychology and economics of health insurance choices.

Health systems in transition United States of America 431
Editors:
Richard B. Saltman is Associate Head of Research Policy at the European Observatory on Health systems and Policies, and Professor of Health Policy and Management at the Rollins School of Public Health, Emory University in Atlanta.
Ewout van Ginneken is a Senior Researcher in the Department of Health Care Management at the Berlin University of Technology and the Berlin hub of the European Observatory on Health Systems and Policies. He holds a Master of Health Sciences, Health Policy and Administration degree from Maastricht University, and a PhD in Public Health from the Berlin University of Technology. During large parts of the writing and editing of this HiT, he was a 2011–2012 Commonwealth Harkness Fund Fellow in Health Care Policy and Practice at the Harvard School of Public Health.


The Health Systems in Transition profiles
A series of the European Observatory on Health Systems and Policies
The Health Systems in Transition (HiT) country profiles provide an analytical description of each health care system and of reform initiatives in progress or under development. They aim to provide relevant comparative information to support policy-makers and analysts in the development of health systems and reforms in the countries of the WHO European Region and beyond. The HiT profiles are building blocks that can be used:
• to learn in detail about different approaches to the financing, organization and delivery of health services;
• to describe accurately the process, content and implementation of health reform programmes;
• to highlight common challenges and areas that require more in-depth analysis; and
• to provide a tool for the dissemination of information on health systems and the exchange of experiences of reform strategies between policy-makers and analysts in countries of the WHO European Region.
How to obtain a HiT
All HiTs are available as PDF files at www.healthobservatory.eu, where you can also join our listserve for monthly updates of the activities of the European Observatory on Health Systems and Policies, including new HiTs, books in our co-published series with Open University Press, Policy briefs, Policy summaries, and the Eurohealth journal.
If you would like to order a paper copy of a HiT, please write to:
The publications of the
European Observatory on Health Systems and Policies
are available atwww.healthobservatory.eu

HiT country profiles published to date:
Albania (1999, 2002ag)Andorra (2004)Armenia (2001g, 2006, 2013)Australia (2002, 2006)Austria (2001e, 2006e)Azerbaijan (2004g, 2010g)Belarus (2008g)Belgium (2000, 2007, 2010)Bosnia and Herzegovina (2002g)Bulgaria (1999, 2003b, 2007g, 2012b)Canada (2005, 2013c)Croatia (1999, 2006)Cyprus (2004, 2012)Czech Republic (2000, 2005g, 2009)Denmark (2001, 2007g, 2012)Estonia (2000, 2004gj, 2008)Finland (2002, 2008)France (2004cg, 2010)Georgia (2002dg, 2009)Germany (2000e, 2004eg)Greece (2010)Hungary (1999, 2004, 2011)Iceland (2003)Ireland (2009)Israel (2003, 2009)Italy (2001, 2009)Japan (2009)Kazakhstan (1999g, 2007g, 2012g)Kyrgyzstan (2000g, 2005g, 2011g)Latvia (2001, 2008, 2012)Lithuania (2000, 2013)Luxembourg (1999)Malta (1999) Mongolia (2007)Netherlands (2004g, 2010)New Zealand (2001)Norway (2000, 2006)Poland (1999, 2005k, 2012)Portugal (1999, 2004, 2007, 2011)
Republic of Korea (2009)Republic of Moldova (2002g, 2008g, 2012)Romania (2000f, 2008)Russian Federation (2003g, 2011g)Slovakia (2000, 2004, 2011)Slovenia (2002, 2009)Spain (2000h, 2006, 2010)Sweden (2001, 2005, 2012)Switzerland (2000)Tajikistan (2000, 2010gl)The former Yugoslav Republic of
Macedonia (2000, 2006)Turkey (2002gi, 2011)Turkmenistan (2000)Ukraine (2004g, 2010g)United Kingdom of Great Britain and
Northern Ireland (1999g)United Kingdom (England) (2011)United Kingdom (Northern Ireland) (2012)United Kingdom (Scotland) (2012)United Kingdom (Wales) (2012)United States of America (2013)Uzbekistan (2001g, 2007g)Veneto Region, Italy (2012)
Key
All HiTs are available in English.When noted, they are also available in other languages:
a Albanian
b Bulgarian
c French
d Georgian
e German
f Romanian
g Russian
h Spanish
i Turkish
j Estonian
k Polish
l Tajik

ISSN
18
17-6
127
The
Euro
pean
Obs
erva
tory
on
Heal
th S
yste
ms a
nd P
olic
ies i
s a p
artn
ersh
ip, h
oste
d by
the
WH
O R
egio
nal O
ffice
for E
urop
e, w
hich
incl
udes
the
Gove
rnm
ents
of B
elgi
um, F
inla
nd, I
rela
nd,
the
Net
herla
nds,
Nor
way
, Slo
veni
a, S
pain
, Sw
eden
, the
Uni
ted
King
dom
and
the
Vene
to R
egio
n of
Ital
y; th
e Eu
rope
an C
omm
issi
on; t
he E
urop
ean
Inve
stm
ent B
ank;
the
Wor
ld B
ank;
U
NCA
M (F
renc
h Na
tiona
l Uni
on o
f Hea
lth In
sura
nce
Fund
s); t
he L
ondo
n Sc
hool
of E
cono
mic
s and
Pol
itica
l Sci
ence
; and
the
Lond
on S
choo
l of H
ygie
ne &
Tro
pica
l Med
icin
e.
HiTs
are
in-d
epth
pro
files
of h
ealth
syst
ems a
nd p
olic
ies,
prod
uced
usi
ng a
stan
dard
ized
app
roac
h th
at a
llow
s com
paris
on a
cros
s cou
ntrie
s. Th
ey p
rovi
de fa
cts,
figur
es a
nd a
naly
sis a
nd
high
light
refo
rm in
itiat
ives
in p
rogr
ess.