
Fracture property correlation of Rheocast (EMS) and Thixocast 6061 Aluminium alloy

Materials Science and Engineering A327 (2002) 144–154
An analysis of hot formability of the 6061+20% Al2O3 compositeby means of different stability criteria
S. Spigarelli a,*, E. Cerri b, P. Cavaliere a, E. Evangelista b
a INFM/Department of Mechanics, Uni�ersity of Ancona, I-60131 Ancona, Italyb INFM/Department of Ingegneria dell’Inno�azione, Uni�ersity of Lecce, I-73100 Lecce, Italy
Received 3 November 2000; received in revised form 1 June 2001
Abstract
The hot workability of a 6061 alloy reinforced with 20% Al2O3 particulate was investigated by means of torsion andcompression tests in the temperature range between 350 and 500 °C. Different stability criteria were used to identify the‘processing window’. Gegel’s approach, based on the use of the Liapunov function, resulted in instability areas larger than thoseidentified with the other criteria. The conventional approach of the maximisation of the strain-rate sensitivity and the criterionbased on Ziegler’s plastic flow theory, in its more general form, valid for any type of stress vs. strain-rate curve, gave substantiallysimilar indications for the determination of the processing window. © 2002 Elsevier Science B.V. All rights reserved.
Keywords: Hot formability; Torsion test; Compression test; Stability criteria; Composite
www.elsevier.com/locate/msea
1. Introduction
Particle-reinforced aluminium matrix composites arepromising candidates for automotive applications.However, these high-strength structural materials arecharacterised by particularly low ductility, and aredifficult to deform even at high temperature withoutproducing extensive damage in the component [1,2].Proper heat treatment, multistage processing and thecorrect identification of the ‘processing window’ (i.e.the combination of the temperature and strain-rateconditions that guarantee defect-free components) thusstrongly affect their workability.
In several studies, the hot workability of aluminiummatrix composites has been investigated; in many cases,the constitutive equations relating flow-stress, tempera-ture and strain-rates, have been analysed with the aimto correlate the mechanical response (e.g. ductility ortemperature-normalised strain-rate) to the microstruc-ture (subgrain size, grain size, dislocation distribution)[2–10]. The mechanical response has generally been
investigated by means of hot torsion or compressiontests. Both techniques present advantages as well asdrawbacks: for instance, compression tests allow one toobtain a constant strain-rate, sample geometry is sim-ple, and the state of stress is relatively similar to thecompressive state of stress typical of the forging pro-cess. Whereas in compression, barrelling severely limitsthe maximum strain, in torsion a high degree of defor-mation is normally obtained before fracture; for thisreason, torsion tests have been extensively used tosimulate the rolling response of metallic materials [11].
Frost and Ashby [12] were the first to represent theconstitutive behaviour of the materials in the form ofdeformation-mechanism maps. These maps identify thetemperature and applied stress regimes in which thedifferent mechanisms control high-temperature defor-mation at low strain-rates, i.e. they primarily considercreep response. A development of the map concept wasobtained by Raj [13], who examined two importantdamage mechanisms, cavity nucleation at the interfacebetween the ductile matrix and hard particles, andwedge cracking at triple grain boundary joints. Cavita-tion, which results in ductile fracture, is characteristicof high strain-rates and low homologous temperatures,as at high temperature, the rate of void formation
* Corresponding author. Tel.: +39-07-1220-4794; fax: +39-07-1220-4799.
E-mail address: [email protected] (S. Spigarelli).
0921-5093/02/$ - see front matter © 2002 Elsevier Science B.V. All rights reserved.PII: S0 9 21 -5093 (01 )01647 -1

S. Spigarelli et al. / Materials Science and Engineering A327 (2002) 144–154 145
decreases due to the lower work hardening rate—aneffect of recovery—whereas at low strain-rates diffu-sional transport promotes stress relief at the particleinterfaces [13]. Wedge cracking is typically observedwhen strain-rate is sufficiently low for the effect ofgrain boundary sliding, compared with matrix defor-mation, to be no longer negligible. In a temperaturevs. strain-rate map, the intermediate region betweenthe upper bound condition of wedge cracking and thelower bound condition for ductile fracture should beconsidered ‘safe’. In the high strain-rate regime, thissafe region is nevertheless limited by a zone whereadiabatic shear, results in flow localisation. The Rajmaps are thus useful in principle to define the pro-cessing window with a view to obtaining defect-freecomponents, even though they are difficult to con-struct for complex alloys, since they require a detailedknowledge of the models describing damage mecha-nisms.
The ‘dynamic material model’ [11,14] considers theworkpiece as a power dissipator. According to thismodel, the system consists of a source of power, astore of power (tools) and a dissipator (the work-piece), which dissipates the energy while deforming.The total power dissipated, P, being � the instanta-neous flow-stress that is the material response to theapplied strain-rate (�� ) to reach a given strain �, canbe calculated as
P=��� =� ��
0
� d�� +� �
0
�� d�. (1)
The first integral is defined as G content and repre-sents the major power input dissipated in the form ofa temperature rise; the second integral, defined as Jco-content, represents the power dissipated by metal-lurgical processes [11], such as recovery, recrystallisa-tion, cavity formation, phase transformation etc. Onthis basis, a new parameter, the efficiency of powerdissipation � [14], defined as
�=2m
m+1��,T
(2)
has been directly calculated by interpolating the dataobtained by mechanical testing (usually compressiondata, even though torsion results should, in theory,give equivalent results). This parameter has been usedto construct the ‘power dissipation maps’ [14–21],which, in principle, allow the region of optimumworkability to be identified, defined as a region ofhigh power dissipation. However, since damage mech-anisms, such as wedge cracking usually also corre-spond to high values of power-dissipation efficiency,the validation of the results obtained by analysing themaps requires a detailed microstructural investigation.
A further development has been the introduction ofstability maps. These are based on the principles of
irreversible thermodynamics of large plastic flows,which consider the variation in entropy produced bya change in strain. The stability criteria formulatedon this basis define new temperature vs. strain-ratemaps that identify the regions of unstable flow; typi-cal manifestations of unstable flow are adiabatic shearbands, localised shear, Luders bands etc. [11–21].
The use of power-dissipation efficiency and stabilitymaps is a promising tool to predict the optimum pro-cessing condition, and they have been employed toanalyse the response of several aluminium matrixcomposites [19]. The aim of this paper was to investi-gate the hot workability of a 6061 matrix compositereinforced with 20% Al2O3 particles. In particular,both torsion and compression tests were used to ob-tain processing maps, which were constructed alsotaking into account the largely accepted conclusionson the form of the constitutive equations that corre-late flow-stress, strain-rate and temperature in thesematerials.
2. Experimental procedure
The particle-reinforced aluminium–alloy matrixcomposite considered in the present investigation wasproduced by Duralcan, USA. It was fabricated bymixing 20% Al2O3 particles into a molten 6061 alloy.After casting, the billets were pre-homogenised at570 °C for 4 h and cooled at 200 K h−1; the mate-rial was subsequently hot-extruded (extrusion ratio1:13), into rods 80 mm in diameter.
The hot-deformation behaviour of the compositewas investigated by compression and torsion tests.Compression tests were carried out at 350, 400, 450and 500 °C while torsion tests were carried out at375, 400, 425, 450, 475 and 500 °C. Equivalent stressand equivalent strain were calculated by the conven-tional equations for compression and torsion [22]tests.
Light and scanning electron microscopy (LM andSEM) were used to evaluate microstructural be-haviour during hot deformation. A statistical distribu-tion of particle size was performed in order tocharacterise particle damage and fracture during hotstraining. Grain evolution was followed by LM inseveral experimental conditions to establish the occur-rence of dynamic phenomena, such as dynamic re-crystallisation. Samples for LM and SEM wereground to 4000 grit papers and polished by diamondpaste to 0.25 �m. No chemical etching was performedon samples devoted to statistical particle analysis toavoid preferential etching in the presence of holes atthe interface between matrix and reinforcement.Keller’s reagent was used for grain observations.

S. Spigarelli et al. / Materials Science and Engineering A327 (2002) 144–154146
3. Experimental results
The microstructure of the composite in the as-ex-truded condition consists of fine equiaxed recrystallisedgrains (grain size of 10 �m) and of a relatively high
Fig. 4. Microstructure of the samples tested at 500 °C up to �=0.6:(a) 10−1 s−1; (b) 3×10⁻³ s−1.
Fig. 1. Typical true stress vs. true strain curves for compression testsat 0.03 s−1.
Fig. 2. Typical true stress vs. true strain curves for torsion tests at 0.1s−1.
fraction of precipitates, located both at grain boundariesand in the grain interior.
Typical stress vs. strain curves obtained by compres-sion tests are shown in Fig. 1; they are characterised byan initial rapid increase in flow-stress to a broad peak,followed by a very limited flow softening; curves ofsimilar shape were obtained in torsion (Fig. 2). Asexpected, flow-stress decreased with increasing tempera-ture and with decreasing strain-rate. Predictably, too,flow-stress in compression tended to be higher (10–15%)than in torsion [22]. Fig. 3 plots the strain to fracture asa function of strain-rate and temperature. In the investi-gated range of conditions, ductility tended to increasewith increasing temperature and decreasing strain-rate.
The microstructure of samples tested at 500 °C incompression (at strain=0.6) is presented in Fig. 4. Theuniform and fine size of the equiaxed grains was inter-preted as an indication of dynamic recrystallisation.Indeed, even the most heavily deformed zone of theFig. 3. Strain to fracture in torsion.
S. Spigarelli et al. / Materials Science and Engineering A327 (2002) 144–154 147
samples revealed chains of particles (intermetallicphases or fragmented reinforcements) aligned in thedirection of flow, but separated by equiaxed and appar-ently undeformed grains. A similar microstructure wasobserved in the samples tested at 450 °C. The size ofthe equiaxed grains at 500 °C is slightly larger than at450 °C, while a reduction in strain-rate at a giventemperature results in a moderate increase in grain size.
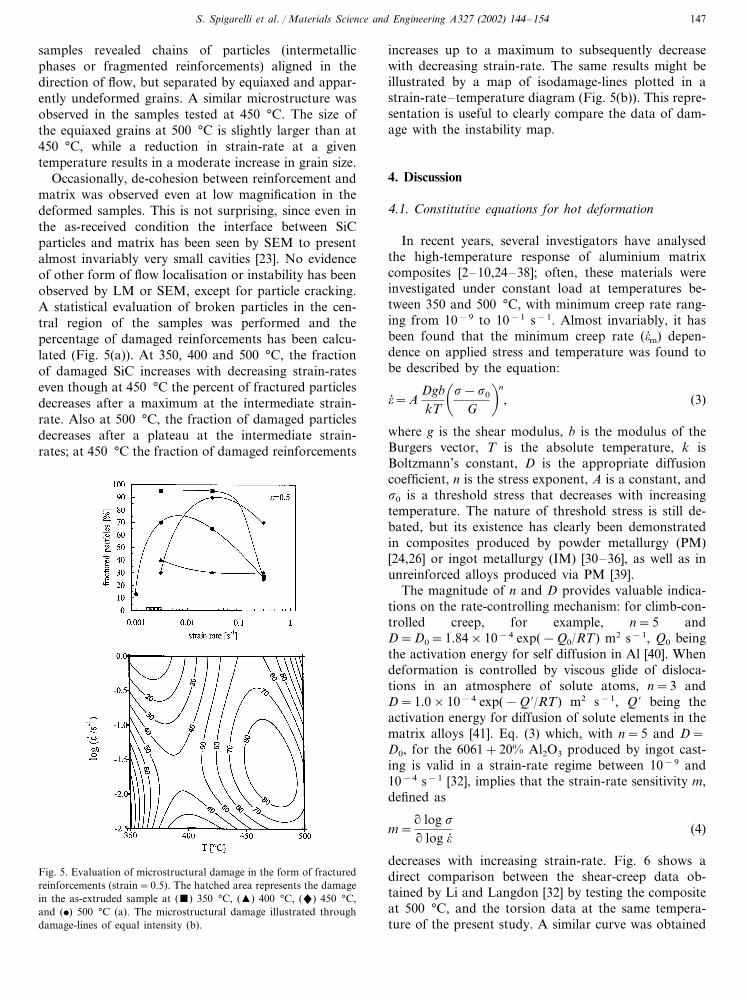
Occasionally, de-cohesion between reinforcement andmatrix was observed even at low magnification in thedeformed samples. This is not surprising, since even inthe as-received condition the interface between SiCparticles and matrix has been seen by SEM to presentalmost invariably very small cavities [23]. No evidenceof other form of flow localisation or instability has beenobserved by LM or SEM, except for particle cracking.A statistical evaluation of broken particles in the cen-tral region of the samples was performed and thepercentage of damaged reinforcements has been calcu-lated (Fig. 5(a)). At 350, 400 and 500 °C, the fractionof damaged SiC increases with decreasing strain-rateseven though at 450 °C the percent of fractured particlesdecreases after a maximum at the intermediate strain-rate. Also at 500 °C, the fraction of damaged particlesdecreases after a plateau at the intermediate strain-rates; at 450 °C the fraction of damaged reinforcements
increases up to a maximum to subsequently decreasewith decreasing strain-rate. The same results might beillustrated by a map of isodamage-lines plotted in astrain-rate– temperature diagram (Fig. 5(b)). This repre-sentation is useful to clearly compare the data of dam-age with the instability map.
4. Discussion
4.1. Constituti�e equations for hot deformation
In recent years, several investigators have analysedthe high-temperature response of aluminium matrixcomposites [2–10,24–38]; often, these materials wereinvestigated under constant load at temperatures be-tween 350 and 500 °C, with minimum creep rate rang-ing from 10−9 to 10−1 s−1. Almost invariably, it hasbeen found that the minimum creep rate (�� m) depen-dence on applied stress and temperature was found tobe described by the equation:
�� =ADgbkT
��−�0
G�n
, (3)
where g is the shear modulus, b is the modulus of theBurgers vector, T is the absolute temperature, k isBoltzmann’s constant, D is the appropriate diffusioncoefficient, n is the stress exponent, A is a constant, and�0 is a threshold stress that decreases with increasingtemperature. The nature of threshold stress is still de-bated, but its existence has clearly been demonstratedin composites produced by powder metallurgy (PM)[24,26] or ingot metallurgy (IM) [30–36], as well as inunreinforced alloys produced via PM [39].
The magnitude of n and D provides valuable indica-tions on the rate-controlling mechanism: for climb-con-trolled creep, for example, n=5 andD=D0=1.84×10⁻⁴ exp(−Q0/RT) m2 s−1, Q0 beingthe activation energy for self diffusion in Al [40]. Whendeformation is controlled by viscous glide of disloca-tions in an atmosphere of solute atoms, n=3 andD=1.0×10⁻⁴ exp(−Q �/RT) m2 s−1, Q � being theactivation energy for diffusion of solute elements in thematrix alloys [41]. Eq. (3) which, with n=5 and D=D0, for the 6061+20% Al2O3 produced by ingot cast-ing is valid in a strain-rate regime between 10−9 and10−4 s−1 [32], implies that the strain-rate sensitivity m,defined as
m=� log �
� log �� (4)
decreases with increasing strain-rate. Fig. 6 shows adirect comparison between the shear-creep data ob-tained by Li and Langdon [32] by testing the compositeat 500 °C, and the torsion data at the same tempera-ture of the present study. A similar curve was obtained
Fig. 5. Evaluation of microstructural damage in the form of fracturedreinforcements (strain=0.5). The hatched area represents the damagein the as-extruded sample at (�) 350 °C, (�) 400 °C, (�) 450 °C,and (�) 500 °C (a). The microstructural damage illustrated throughdamage-lines of equal intensity (b).

S. Spigarelli et al. / Materials Science and Engineering A327 (2002) 144–154148
Fig. 6. True stress vs. strain-rate at 500 °C for the composite; (�)represent minimum creep-rate data obtained in shear by Li andLangdon [32]; (�) represents the peak flow-stress in torsion obtainedin the present study.
Eq. (3) can be used to describe the strain-rate depen-dence on applied stress up to a limiting strain-rate (�� pb)above which the power law breakdown results in aprogressive decrease in m. A similar behaviour has beenobserved at lower temperatures, the main differencebeing a transition of �� pb towards lower strain-rates. Inparticular, Sherby and Burke [42] proposed a relation-ship between �� pb and temperature in the form:
�� pb
D=1013 m−2. (5)
At high temperatures, in some composites a change inthe particle by-passing mechanism [38] results in theapparent disappearance of the threshold stress; in thesecases, in the low stress regime, m decreases or is almostconstant and close to 1/n (i.e. is close to 1/5 or 1/3).
The analysis reported above provides substantial in-dications on how the general shape of the flow-stress vs.strain-rate curve should appear. Accordingly, the de-scription of the flow-stress data obtained in the presentstudy, was based on the assumption that, in Eq. (2), thestrain-rate sensitivity parameter m increases with risingstrain-rate up to a limiting value, then decreases in theregion of power law breakdown. Fig. 7 shows theflow-stress vs. strain-rate curves obtained, on the basisof this assumption, at strain=0.5 for torsion and com-pression data. All the curves were interpolated by acubic spline. As a result of the experimental scatter, thecubic spline tends to underestimate the value of m atvery low strain-rates (compare Figs. 6 and 7).
4.2. Power dissipation maps
The workpiece material dissipates the power, trans-mitted by the tooling, by metallurgical processes, suchas dynamic recovery, dynamic recrystallisation, super-plastic flow and phase transformation, or in the form ofdamage. The power-dissipation capacity of metals dur-ing deformation can be estimated by the efficiency ofdissipation � which, according to Prasad et al. [14], isdefined as
�=2m
m+1��,T
. (6)
Figs. 8 and 9 illustrate the power-dissipation mapscalculated for torsion and compression data at strain=0.5. The two maps differ only in some details, sincethey are both characterised by the presence of a regionof high efficiency of dissipation at high temperature forstrain-rates between 3×10⁻² and 3×10⁻¹ s−1. Aregion of low efficiency of power dissipation can beobserved at temperatures between 375 and 400 °C, forhigh strain-rates (0.6–1 s−1).
Fig. 7. Flow-stress vs. strain-rate data for �=0.5 and interpolatingcurves: (a) �, 375 °C; �, 400 °C; �, 425 °C; �, 450 °C; �,475 °C; and �, 500 °C in torsion; (b) �, 350 °C; �, 400 °C; �,450 °C; �, 500 °C in compression.
by Pickens et al. [10] in a 6061 composite reinforcedwith 20% SiC tested at 457 °C under strain-rates rang-ing from 10−3 to 101 s−1. It can easily be observed that
S. Spigarelli et al. / Materials Science and Engineering A327 (2002) 144–154 149
Fig. 8. Power efficiency dissipation map at �=0.5 obtained fromtorsion data; the shaded area represents the zone of unstable flow aspredicted by Eq. (7).
Fig. 11. Stability map at true strain=0.5 according to Eqs. (7)– (9)(torsion). Shaded areas correspond to unstable flow; areas marked by�, in particular, correspond to the instability region as given by Eq.(8).
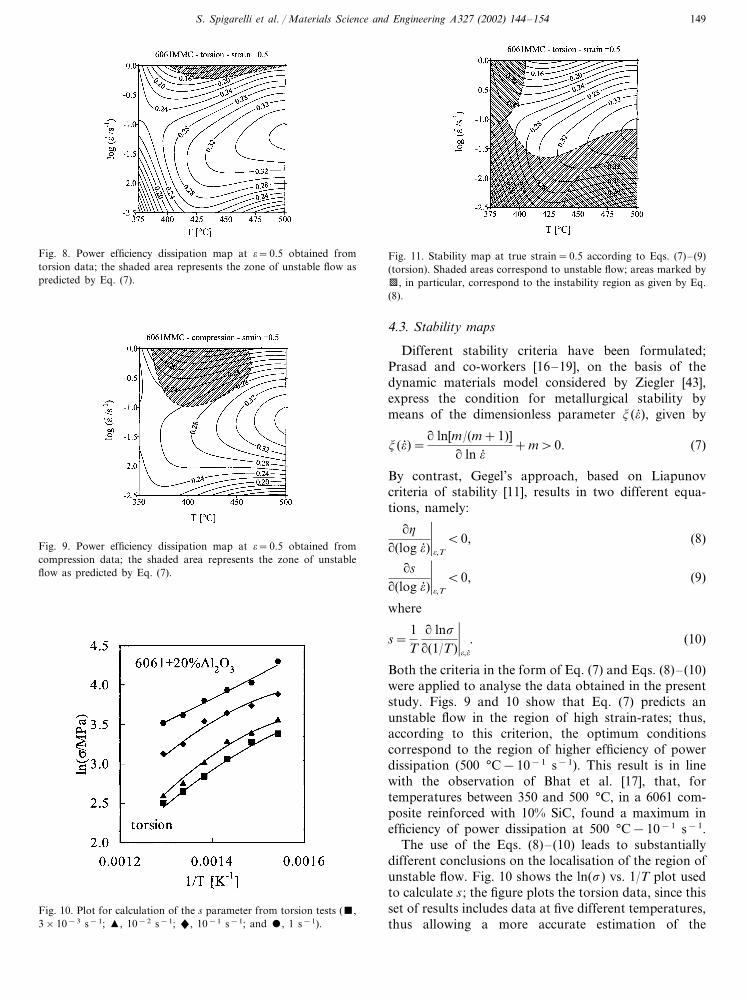
4.3. Stability maps
Different stability criteria have been formulated;Prasad and co-workers [16–19], on the basis of thedynamic materials model considered by Ziegler [43],express the condition for metallurgical stability bymeans of the dimensionless parameter �(�� ), given by
�(�� )=� ln[m/(m+1)]� ln �� +m�0. (7)
By contrast, Gegel’s approach, based on Liapunovcriteria of stability [11], results in two different equa-tions, namely:
��
�(log �� )��,T
�0, (8)
�s�(log �� )
��,T
�0, (9)
where
s=1T
� ln�
�(1/T)��,��
. (10)
Both the criteria in the form of Eq. (7) and Eqs. (8)– (10)were applied to analyse the data obtained in the presentstudy. Figs. 9 and 10 show that Eq. (7) predicts anunstable flow in the region of high strain-rates; thus,according to this criterion, the optimum conditionscorrespond to the region of higher efficiency of powerdissipation (500 °C−10−1 s−1). This result is in linewith the observation of Bhat et al. [17], that, fortemperatures between 350 and 500 °C, in a 6061 com-posite reinforced with 10% SiC, found a maximum inefficiency of power dissipation at 500 °C−10−1 s−1.
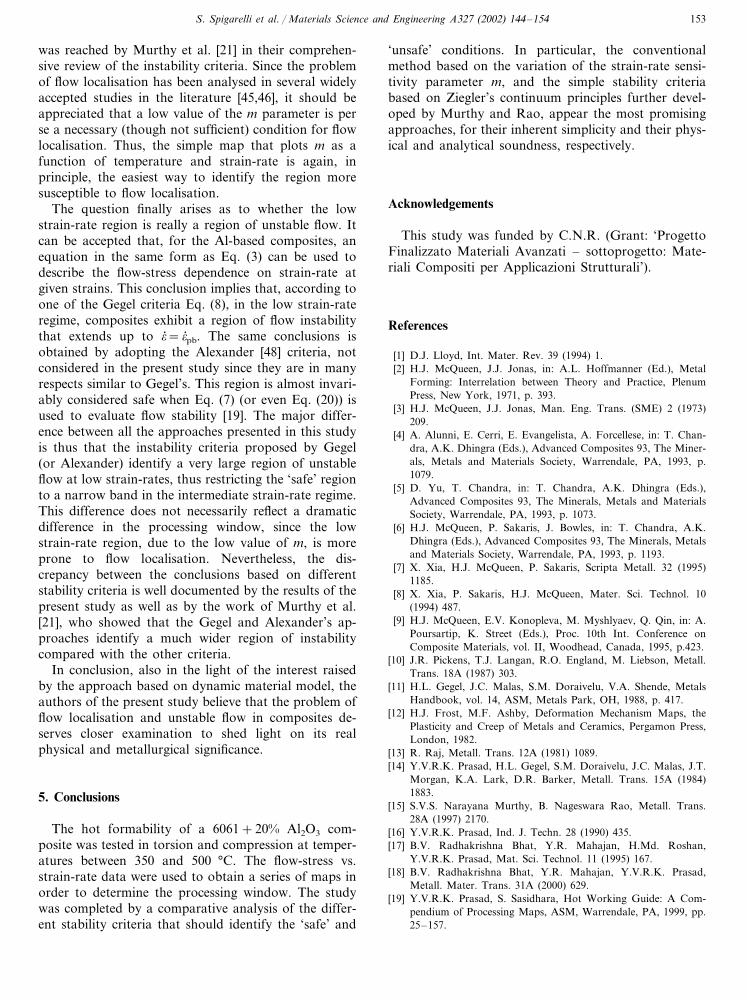
The use of the Eqs. (8)– (10) leads to substantiallydifferent conclusions on the localisation of the region ofunstable flow. Fig. 10 shows the ln(�) vs. 1/T plot usedto calculate s ; the figure plots the torsion data, since thisset of results includes data at five different temperatures,thus allowing a more accurate estimation of the
Fig. 9. Power efficiency dissipation map at �=0.5 obtained fromcompression data; the shaded area represents the zone of unstableflow as predicted by Eq. (7).
Fig. 10. Plot for calculation of the s parameter from torsion tests (�,3×10−3 s−1; �, 10−2 s−1; �, 10−1 s−1; and �, 1 s−1).

S. Spigarelli et al. / Materials Science and Engineering A327 (2002) 144–154150
s entropy parameter by means of Eq. (10). Fig. 11shows the zones of unstable flow according to Eqs. (8)and (9) for the torsion data; a similar figure is obtainedwhen the same procedure is applied to the data ob-tained in compression. The map exhibits a very ex-tended region of instability for strain-rates lower than3×10−2 s−1, and a second region of unstable flow atlow temperature. Thus, according to the Liapunovcriteria elaborated by Gegel, the processing window isquite narrow, since the safe region, for the temperaturesof 450–500 °C, is between 3×10⁻² and 3×10⁻¹ s−1.
4.4. Alternati�e stability criteria
In their paper on the hot working response of a IN718 alloy [20,21], Murthy and Rao developed a newseries of relationships for the calculation of power
efficiency and the determination of stability conditions.The authors observed that the efficiency of power dissi-pation given in Eq. (6) is strictly valid only when m isstrain-rate independent. Indeed, Eq. (6) is derived di-rectly by substituting the relationship
�=K�� m, (11)
where K and m are constant, into Eq. (1). It is thusclear that the efficiency of power dissipation (�=J/Jmax, where Jmax=��� /2) takes the form of Eq. (6) onlywhen m does not depend on strain-rate. This is not thecase of the present composite, as clearly shown in Figs.6 and 7. Murthy et al. developed a new expression forthe efficiency of power dissipation by simply consider-ing that
J=P−G (12)
being P=��� . Thus
�=J
Jmax
=P−GJmax
=2−G
Jmax
. (13)
The authors then calculated the G term by the means ofthe two integrals
G=� �� 0
0
� d�� +� ��
�� 0� d�� , (14)
where �� 0 is the lowest strain-rate used in the experi-ments. The first term on the right side of Eq. (14)(hereafter indicated as G0) was calculated in Refs.[20,21] by assuming that, below �� 0, the flow-stress de-pendence on strain-rate is a true power law (i.e. that mdoes not depend on strain-rate and is equal to the valuecalculated in correspondence of �� 0). This assumption isclearly unrealistic in composites [24–36], even though itresults in an error that is probably negligible. In thepresent instance, the value of G0 was calculated byintegrating the curves that interpolate the �� m vs. � creepdata obtained by Li and Langdon by testing the samematerial in shear at 350, 400 and 500 °C (Fig. 12).Then, the resulting curves were extrapolated up to thelimiting strain-rate of 3×10⁻³ s−1. The values of G0
thus calculated are plotted as a function of the recipro-cal absolute temperature in Fig. 13; the data are closelyaligned on a straight line, permitting one to calculatethe value of G0 at intermediate temperatures (375, 425,450 and 475 °C). Obviously, the calculation of G0 isbased on the minimum creep-rate value at given stressesrather than on flow-stress vs. strain-rate data at �=0.5.The error is, however, negligible since the stress–straincurves exhibit a limited softening; the range of strainbetween �=0.3 and 0.6 can consequently be consideredsimilar to a steady state.
The second term on the right side (hereafter indicatedas G*) of Eq. (14) was calculated following the sameprocedure reported in Ref. [21], i.e. by directly integrat-ing, with �� 0=3×10⁻³ s−1, the flow-stress data in tor-
Fig. 12. Creep data obtained by testing the composite by Li andLangdon [32] (�, 350 °C; �, 400 °C; and �, 500 °C).
Fig. 13. Variation of the G0 integral (obtained by integration of datain Fig. 12) as a function of reciprocal absolute temperature.

S. Spigarelli et al. / Materials Science and Engineering A327 (2002) 144–154 151
Fig. 14. Power efficiency dissipation map at �=0.5, obtained fromtorsion data, by means of Eq. (13); the shaded area represents thezone of unstable flow as predicted by Eq. (20).
The criterion developed by Prasad [16] to evaluatethe regimes of stability (Eq. (7)) is based on therelationship
dJd�� �
J�� . (15)
Eq. (15) was derived from Ziegler’s [43] applicationof the continuum principles to large plastic flows; thesubstitution of Eq. (11) into Eq. (15) yields the stabilitycriterion expressed by Eq. (7). Thus, also in this casethe model is strictly valid only when the flow-stressdepends on strain-rate by means of a true power law;then Eq. (7) should reduce to m�0. On this basisMurthy and Rao [20,21], developed a new and simplecriterion to evaluate stability for the more general casein which m is strain-rate dependent. Since
dJ=�d�� , (16)
then
�J��� =
��
��� �� =�� ln �
� ln �� =m�. (17)
Moreover,
�=J
Jmax
=2J��� (18)
or
J�� =
12
��. (19)
The substitution of Eqs. (17) and (19) into Eq. (15)yields the proposed criterion for stable flow:
2m�
�1. (20)
Fig. 14 illustrates the instability region as identified byEq. (20). It can easily be observed that the high strain-rate region of unstable flow is larger than in Figs. 8 and9; on the other hand, the presence of a region ofunstable flow in the low strain region is probably anartefact due to the overestimation of m produced by thecubic spline used to interpolate the experimental data.Thus, if this region of instability exists, it should lie ina region of lower strain-rates.
The last criterion considered in this paper is thatproposed by Montheillet et al. [44], who harshly criti-cised the approaches based on the calculation of theefficiency of power-dissipation. In particular, the au-thors argue that G does not represent the plastic workand J does not represent dynamic metallurgical pro-cesses. Accordingly, they deny any physical significanceto the efficiency of power dissipation [44]. Rather, theseauthors prefer to maximise m based on the observationthat higher values of m are responsible for lower ratesof flow concentration [45]. Thus, Fig. 15 should repre-sent the guide for the selection of hot-deformation
Fig. 15. Map of the variation of m with temperature and strain-rate.(a) Torsion; (b) compression.
sion. Indeed, the torsion data obtained in the presentstudy are more similar to the shear-creep data of Li andLangdon, since in both equivalent stress and strainwere calculated by the same relationships, whereas inthe case of the compression data the flow-stresses wereinvariably higher.
Once G0 and G* have been calculated, the efficiencyof power dissipation is easily obtained. Fig. 14 reportsthe power-efficiency map derived from the above proce-dure; the general configuration of the map is similar tothat represented in Figs. 8 and 9, even though thefigures differ in several details.

S. Spigarelli et al. / Materials Science and Engineering A327 (2002) 144–154152
conditions that avoid flow localisation. The analysis ofthe figure suggests that even this last, very simple,approach results in a processing window that does notdiffer appreciably from those obtained by means ofmore sophisticated methods. Again, optimum workabil-ity is obtained for temperatures between 450 and500 °C for strain-rates ranging from 3×10⁻² to 3×10⁻¹ s−1.
4.5. Analysis of damage in the reinforcements andcomparison with processing maps
The deformation behaviour of an alloy under a dif-ferent set of experimental conditions of temperature,strain-rate and strain, depends on its current mi-crostructure and its prior thermomechanical history.Therefore, the locations of the boundaries on a process-ing map may vary according to its metallurgical path.On the other hand, no unique instability theory exists,leading the designer to establish the most suitable crite-ria on the basis of microstructural observations on flowlocalisation.
The flow response of particle-reinforced metal matrixcomposites is mainly governed by two processes; thefirst involves load transfer from the matrix to theparticles, leading to an increase in flow-stress. Thesecond process involves the development of microstruc-tural damage, usually in the form of particle crackingor de-cohesion of the particle–matrix interface. Theseprocesses are not independent, but are strictly related toeach other; for example, particle cracking occurs whenhard particles are subjected to a very high stress, i.e.when high loads are transferred from the soft matrix tothe reinforcements. This process, in turn, is possibleonly when the interface between particles and matrix is
largely undamaged. On the other hand, particle crack-ing could lead to the macroscopic crack initiation andto the fracture; yet, the same could be said for crackinitiation at the interface between particles and matrix.Finally, also the nature of the load affects the materialresponse: compressive stresses normal to the crackplane, in principle, should in fact retard crackpropagation.
The evaluation of the microstructure of the deformedsamples, in the case of the present study, did not permitreaching any firm conclusion about the relationshipbetween processing maps and microstructural damage.None of the instability processes normally consideredfor monolithic alloys (shear or Luders band formations,localised shear, adiabatic heating) has been observed.The only form of microstructural damage was particlebreaking and de-cohesion at the interfaces. Fig. 16shows one deformation condition illustrating particledamage and interface de-cohesion.
4.6. Some final considerations on hot workability ofAluminium–matrix composites
For the present 6061+20% Al2O3 composite, themore sophisticated approaches, based on the determi-nation of the highest efficiency of power dissipation, donot seem to provide significant advantages over theconventional method of maximising m, even though—in the opinion of the authors— the procedure ofMurthy and co-workers [20,21] does deserve particularattention. Indeed, the position of the ‘safe’ region ofhighest efficiency of power dissipation or of maximumm does not change appreciably in any of the figurespresented. This analysis is particularly interesting in thelight of the severe criticisms raised against some of thestudies that employed the dynamic material model toevaluate the hot workability of Al alloys [47]. As men-tioned above, the intrinsic validity of the assumptionsunderpinning the development of efficiency maps hasbeen questioned [44]; on the other hand, the interpreta-tion of the efficiency maps obtained for Aluminium hasalso been criticised, especially for its claim of the occur-rence of dynamic recrystallisation in the high-tempera-ture and intermediate strain-rate regime [19]. On thebasis of several studies and extensive TEM and SEManalyses, it has been demonstrated that in the majorityof Al alloys dynamic recrystallisation does not normallyoccur [47]. By contrast, dynamic recrystallisation hasbeen observed, at least in certain conditions, in com-posites, where the presence of particles stimulates thenucleation of new grains [7]. This appears to be the caseof the 6061+20% Al2O3.
A last problem that should be addressed is that theapproaches based on stability maps can give conflictingresults, at least in term of the identification of theregion of unstable flow. Exactly the same conclusion
Fig. 16. LM of a sample severely deformed showing particle damage(400 °C, 0.003 s−1).
S. Spigarelli et al. / Materials Science and Engineering A327 (2002) 144–154 153
was reached by Murthy et al. [21] in their comprehen-sive review of the instability criteria. Since the problemof flow localisation has been analysed in several widelyaccepted studies in the literature [45,46], it should beappreciated that a low value of the m parameter is perse a necessary (though not sufficient) condition for flowlocalisation. Thus, the simple map that plots m as afunction of temperature and strain-rate is again, inprinciple, the easiest way to identify the region moresusceptible to flow localisation.
The question finally arises as to whether the lowstrain-rate region is really a region of unstable flow. Itcan be accepted that, for the Al-based composites, anequation in the same form as Eq. (3) can be used todescribe the flow-stress dependence on strain-rate atgiven strains. This conclusion implies that, according toone of the Gegel criteria Eq. (8), in the low strain-rateregime, composites exhibit a region of flow instabilitythat extends up to �� =�� pb. The same conclusions isobtained by adopting the Alexander [48] criteria, notconsidered in the present study since they are in manyrespects similar to Gegel’s. This region is almost invari-ably considered safe when Eq. (7) (or even Eq. (20)) isused to evaluate flow stability [19]. The major differ-ence between all the approaches presented in this studyis thus that the instability criteria proposed by Gegel(or Alexander) identify a very large region of unstableflow at low strain-rates, thus restricting the ‘safe’ regionto a narrow band in the intermediate strain-rate regime.This difference does not necessarily reflect a dramaticdifference in the processing window, since the lowstrain-rate region, due to the low value of m, is moreprone to flow localisation. Nevertheless, the dis-crepancy between the conclusions based on differentstability criteria is well documented by the results of thepresent study as well as by the work of Murthy et al.[21], who showed that the Gegel and Alexander’s ap-proaches identify a much wider region of instabilitycompared with the other criteria.
In conclusion, also in the light of the interest raisedby the approach based on dynamic material model, theauthors of the present study believe that the problem offlow localisation and unstable flow in composites de-serves closer examination to shed light on its realphysical and metallurgical significance.
5. Conclusions
The hot formability of a 6061+20% Al2O3 com-posite was tested in torsion and compression at temper-atures between 350 and 500 °C. The flow-stress vs.strain-rate data were used to obtain a series of maps inorder to determine the processing window. The studywas completed by a comparative analysis of the differ-ent stability criteria that should identify the ‘safe’ and
‘unsafe’ conditions. In particular, the conventionalmethod based on the variation of the strain-rate sensi-tivity parameter m, and the simple stability criteriabased on Ziegler’s continuum principles further devel-oped by Murthy and Rao, appear the most promisingapproaches, for their inherent simplicity and their phys-ical and analytical soundness, respectively.
Acknowledgements
This study was funded by C.N.R. (Grant: ‘ProgettoFinalizzato Materiali Avanzati – sottoprogetto: Mate-riali Compositi per Applicazioni Strutturali’).
References
[1] D.J. Lloyd, Int. Mater. Rev. 39 (1994) 1.[2] H.J. McQueen, J.J. Jonas, in: A.L. Hoffmanner (Ed.), Metal
Forming: Interrelation between Theory and Practice, PlenumPress, New York, 1971, p. 393.
[3] H.J. McQueen, J.J. Jonas, Man. Eng. Trans. (SME) 2 (1973)209.
[4] A. Alunni, E. Cerri, E. Evangelista, A. Forcellese, in: T. Chan-dra, A.K. Dhingra (Eds.), Advanced Composites 93, The Miner-als, Metals and Materials Society, Warrendale, PA, 1993, p.1079.
[5] D. Yu, T. Chandra, in: T. Chandra, A.K. Dhingra (Eds.),Advanced Composites 93, The Minerals, Metals and MaterialsSociety, Warrendale, PA, 1993, p. 1073.
[6] H.J. McQueen, P. Sakaris, J. Bowles, in: T. Chandra, A.K.Dhingra (Eds.), Advanced Composites 93, The Minerals, Metalsand Materials Society, Warrendale, PA, 1993, p. 1193.
[7] X. Xia, H.J. McQueen, P. Sakaris, Scripta Metall. 32 (1995)1185.
[8] X. Xia, P. Sakaris, H.J. McQueen, Mater. Sci. Technol. 10(1994) 487.
[9] H.J. McQueen, E.V. Konopleva, M. Myshlyaev, Q. Qin, in: A.Poursartip, K. Street (Eds.), Proc. 10th Int. Conference onComposite Materials, vol. II, Woodhead, Canada, 1995, p.423.
[10] J.R. Pickens, T.J. Langan, R.O. England, M. Liebson, Metall.Trans. 18A (1987) 303.
[11] H.L. Gegel, J.C. Malas, S.M. Doraivelu, V.A. Shende, MetalsHandbook, vol. 14, ASM, Metals Park, OH, 1988, p. 417.
[12] H.J. Frost, M.F. Ashby, Deformation Mechanism Maps, thePlasticity and Creep of Metals and Ceramics, Pergamon Press,London, 1982.
[13] R. Raj, Metall. Trans. 12A (1981) 1089.[14] Y.V.R.K. Prasad, H.L. Gegel, S.M. Doraivelu, J.C. Malas, J.T.
Morgan, K.A. Lark, D.R. Barker, Metall. Trans. 15A (1984)1883.
[15] S.V.S. Narayana Murthy, B. Nageswara Rao, Metall. Trans.28A (1997) 2170.
[16] Y.V.R.K. Prasad, Ind. J. Techn. 28 (1990) 435.[17] B.V. Radhakrishna Bhat, Y.R. Mahajan, H.Md. Roshan,
Y.V.R.K. Prasad, Mat. Sci. Technol. 11 (1995) 167.[18] B.V. Radhakrishna Bhat, Y.R. Mahajan, Y.V.R.K. Prasad,
Metall. Mater. Trans. 31A (2000) 629.[19] Y.V.R.K. Prasad, S. Sasidhara, Hot Working Guide: A Com-
pendium of Processing Maps, ASM, Warrendale, PA, 1999, pp.25–157.

S. Spigarelli et al. / Materials Science and Engineering A327 (2002) 144–154154
[20] S.V.S. Narayana Murthy, B. Nageswara Rao, Mater. Sci. Eng.A254 (1998) 76.
[21] S.V.S. Narayana Murthy, B. Nageswara Rao, B.P. Kashyap, Int.Mater. Rev. 45 (2000) 15.
[22] G.E. Dieter, Metals Handbook, vol. 14, ASM, Metals Park, OH,1988, p. 373.
[23] S. Spigarelli, E. Evangelista, E. Cerri, T.G. Langdon, Mater. Sci.Eng. A319–321 (2001) 721–725.
[24] K.-T. Park, E.J. Lavernia, F.A. Mohamed, Acta Metall. Mater.38 (1990) 2149.
[25] A.B. Pandey, R.S. Mishra, Y.R. Mahajan, Acta Metall. Mater.8 (1992) 2045.
[26] F.A. Mohamed, K.-T. Park, E. Lavernia, Mater. Sci. Eng. A150(1992) 21.
[27] G. Gonzalez-Doncel, O.D. Sherby, Acta Metall. Mater. 41(1993) 2797.
[28] J. Cadek, V. Sustek, M. Pahutova, Mater. Sci. Eng. A174 (1994)141.
[29] J. Cadek, H. Oikawa, V. Sustek, Mater. Sci. Eng. A190 (1995) 9.[30] Y. Li, F.A. Mohamed, Acta Mater. 45 (1997) 4775.[31] Y. Li, T.G. Lagdon, Scripta Mater. 12 (1997) 1457.[32] Y. Li, T.G. Langdon, Acta Mater. 45 (1997) 4797.[33] Y. Ma, T.G. Langdon, Mater. Sci. Eng. A230 (1997) 183.[34] Y. Li, T.G. Langdon, Mater. Sci. Eng. A245 (1998) 1.
[35] Y. Li, T.G. Langdon, Acta Mater. 46 (1998) 1143.[36] Y. Li, T.G. Langdon, Metall. Trans. 29A (1998) 2523.[37] J. Cadek, M. Pahutova, V. Sustek, Mater. Sci. Eng. A246 (1998)
252.[38] J. Cadek, K. Kucharova, V. Sustek, Scripta Mater. 40 (1999)
1269.[39] K.-T. Park, E.J. Lavernia, F.A. Mohamed, Acta Metall. Mater.
42 (1994) 667.[40] F.A. Mohamed, T.G. Langdon, Metall. Trans. 5 (1974) 2339.[41] S.J. Rothman, N.L. Peterson, L.J. Nowicki, L.C. Robinson,
Phys. Stat. Solid. (b) 63 (1974) K29.[42] O.D. Sherby, P.M. Burke, Progr. Mater. Sci. 13 (1967) 325.[43] H. Ziegler, Progress in Solid Mechanics, vol. 4, Wiley, New
York, 1963, p. 93.[44] F. Montheillet, J.J. Jonas, K.W. Neale, Metall. Mater. Trans.
27A (1996) 232.[45] S.L. Semiatin, J.J. Jonas, Formability and Workability of
Metals: Plastic Instability and Flow Localisation, ASM, MetalsPark, OH, 1984, p. 156.
[46] U.F. Kocks, J.J. Jonas, H. Mecking, Acta Metall. 27 (1979) 419.[47] H.J. McQueen, E. Evangelista, N. Jin, M.E. Kassner, Metall.
Mater. Trans. 26A (1995) 1757.[48] J.M. Alexander, in: J.G. Lenard (Ed.), Modeling of Hot Defor-
mation of Steels, Springer, Berlin, 1989, p. 101.
Copyright © 2022 FDOKUMEN