Amplification of surface temperature trends and variability in the tropical atmosphere
38
eScholarship provides open access, scholarly publishing services to the University of California and delivers a dynamic research platform to scholars worldwide. Lawrence Berkeley National Laboratory Title: Amplification of surface temperature trends and variability in the tropical atmosphere Author: Santer, B.D. Wigley, T.M.L. Mears, C. Wentz, F.J. Klein, S.A. Seidel, D.J. Taylor, K.E. Thorne, P.W. Wehner, M.F. Gleckler, P.J. Boyle, J.S. Collins, W.D. Dixon, K.W. Doutriaux, C. Free, M. Fu, Q. Hansen, J.E. Jones, G.S. Ruedy, R. Karl, T.R. Lanzante, J.R. Meehl, G.A. Ramaswamy, V. Russell, G. Schmidt, G.A. Publication Date: 08-11-2005 Publication Info: Lawrence Berkeley National Laboratory Permalink: http://escholarship.org/uc/item/050980tk
-
Upload
independent -
Category
Documents
-
view
2 -
download
0
Transcript of Amplification of surface temperature trends and variability in the tropical atmosphere

eScholarship provides open access, scholarly publishingservices to the University of California and delivers a dynamicresearch platform to scholars worldwide.
Lawrence Berkeley National Laboratory
Title:Amplification of surface temperature trends and variability in the tropical atmosphere
Author:Santer, B.D.Wigley, T.M.L.Mears, C.Wentz, F.J.Klein, S.A.Seidel, D.J.Taylor, K.E.Thorne, P.W.Wehner, M.F.Gleckler, P.J.Boyle, J.S.Collins, W.D.Dixon, K.W.Doutriaux, C.Free, M.Fu, Q.Hansen, J.E.Jones, G.S.Ruedy, R.Karl, T.R.Lanzante, J.R.Meehl, G.A.Ramaswamy, V.Russell, G.Schmidt, G.A.
Publication Date:08-11-2005
Publication Info:Lawrence Berkeley National Laboratory
Permalink:http://escholarship.org/uc/item/050980tk

1
Amplification of Surface Temperature Trends and
Variability in the Tropical Atmosphere
B.D. Santer,1 ∗ T.M.L. Wigley,2 C. Mears,3 F.J. Wentz,3 S.A. Klein,1 D.J.
Seidel,4 K.E. Taylor,1 P.W. Thorne,5 M.F. Wehner,6 P.J. Gleckler,1 J.S.
Boyle,1 W.D. Collins,2 K.W. Dixon,7 C. Doutriaux,1 M. Free,4 Q. Fu,8
J.E. Hansen,9 G.S. Jones,5 R. Ruedy,9 T.R. Karl,10 J.R. Lanzante,7 G.A.
Meehl,2 V. Ramaswamy,7 G. Russell,9 and G.A. Schmidt9
1 Program for Climate Model Diagnosis and Intercomparison, Lawrence Livermore National
Laboratory, Livermore, CA 94550, USA; 2 National Center for Atmospheric Research, Boul-
der, CO 80303, USA; 3 Remote Sensing Systems, Santa Rosa, CA 95401, USA; 4 NOAA/Air
Resources Laboratory, Silver Spring, MD 20910, USA; 5 Hadley Centre for Climate Predic-
tion and Research, U.K. Met. Office, Exeter, EX1 3PB, UK; 6 Lawrence Berkeley National
Laboratory, Berkeley, CA 94720, USA; 7 NOAA/Geophysical Fluid Dynamics Laboratory,
Princeton, NJ 08542, USA; 8 Department of Atmospheric Sciences, University of Washing-
ton, Seattle, WA 98195, USA; 9 NASA/Goddard Institute for Space Studies, New York, NY
10025, USA; 10 NOAA/National Climatic Data Center, Asheville, NC 28801, USA.
Submitted to Science, May 13, 2005. Revised: July 19, 2005
∗ To whom correspondence should be addressed. Email: [email protected]

B. D. Santer et al. 2
The month-to-month variability of tropical temperatures is larger in
the troposphere than at the Earth’s surface. This amplification behavior
is similar in a range of observations and climate model simulations, and
is consistent with basic theory. On multi-decadal timescales, tropospheric
amplification of surface warming is a robust feature of model simulations,
but occurs in only one observational dataset. Other observations show
weak or even negative amplification. These results suggest that either
different physical mechanisms control amplification processes on monthly
and decadal timescales, and models fail to capture such behavior, or (more
plausibly) that residual errors in several observational datasets used here
affect their representation of long-term trends.

B. D. Santer et al. 3
Tropospheric warming is a robust feature of climate model simulations driven
by historical increases in greenhouse gases (1–3). Maximum warming is predicted
to occur in the middle and upper tropical troposphere. Atmospheric temperature
measurements from radiosondes also show warming of the tropical troposphere since
the early 1960s (4–7), consistent with model results (8). The observed tropical warming
arises in part from a step-like change in the late 1970s (5, 6).
Considerable attention has focused on the shorter record of satellite-based atmo-
spheric temperature measurements (1979 to present). In both models and obser-
vations, the tropical surface warms over this period. Simulated surface warming is
amplified in the tropical troposphere, corresponding to a decrease in lapse rate (2,
3, 9). In contrast, a number of radiosonde and satellite datasets suggest that the
tropical troposphere has warmed less than the surface, or even cooled, which would
correspond to an increase in lapse rate (4–12).
This discrepancy may be an artifact of residual inhomogeneities in the observa-
tions (13–19). Creating homogeneous climate records requires the identification and
removal of non-climatic influences from data that were primarily collected for weather
forecasting purposes. Different analysts have followed very different data adjustment
pathways (4–7, 12, 14, 17). The resulting ‘structural uncertainties’ in observed esti-
mates of tropospheric temperature change (20) are as large as the model-predicted
climate-change signal that should have occurred in response to combined human and

B. D. Santer et al. 4
natural forcings (16).
Alternately, there may be a real disparity between modeled and observed lapse-
rate changes over the satellite era (9–11, 21). This would point towards the existence of
fundamental deficiencies in current climate models (and/or in the forcings employed in
model experiments), thus diminishing our confidence in model predictions of climate
change.
This scientific puzzle provides considerable motivation for revisiting comparisons
of simulated and observed tropical lapse-rate changes (10, 13, 21, 22) using more
comprehensive estimates of observational uncertainty and a wide range of recently-
completed model simulations. The latter were performed in support of the Fourth
Assessment Report of the Intergovernmental Panel on Climate Change (IPCC), and
involve 19 coupled atmosphere-ocean models developed in nine different countries.
Unlike previous model intercomparison exercises involving idealized climate change
experiments (23), these new simulations incorporate estimated historical changes in a
variety of natural and anthropogenic forcings (24) (see Supporting Online Material;
“SOM”).
Our focus is on the amplification of surface temperature variability and trends in
the free troposphere. We study this amplification behavior in several different ways.
The first is to compare atmospheric profiles of “scaling ratios” in the IPCC simulations
and in two new radiosonde datasets: HadAT2 (Hadley Centre Atmospheric Temper-

B. D. Santer et al. 5
atures, version 2) and RATPAC (Radiosonde Atmospheric Temperature Products
for Assessing Climate). These were compiled (respectively) by the United Kingdom
Met. Office (UKMO) (6) and the National Oceanic and Atmospheric Administration
(NOAA) (7). The scaling factor is simply the ratio between the temperature variabil-
ity (or trend) at discrete atmospheric pressure levels and the same quantity at the
surface (25). Observed trends and variability in tropical surface temperatures (TS)
were obtained from the NOAA (26) and HadCRUT2v datasets (27).
Our second method for estimating scaling ratios uses the weighted-average temper-
atures of deep atmospheric layers (12, 17). These are available from the satellite-based
Microwave Sounding Unit (MSU), which monitors atmospheric microwave emissions
from the lower stratosphere (T4) and the troposphere (T2). MSU T2 data have also
been used to retrieve lower tropospheric temperatures (T2LT). We calculate synthetic
MSU temperatures from the IPCC simulations, and then compare these with ac-
tual MSU temperatures produced by research groups at the University of Alabama
in Huntsville (UAH) (12) and Remote Sensing Systems (RSS) in California (14, 17).
Synthetic T4, T2, and T2LT data are also computed from the HadAT2 and RATPAC
radiosonde datasets (see SOM).
T2 receives a contribution from the cooling stratosphere (28). This hampers its
use for estimating the amplification of surface temperature changes in the free tropo-
sphere. We therefore focus on T2LT, which is relatively unaffected by the stratosphere

B. D. Santer et al. 6
(15). Until recently, only UAH provided a satellite-based T2LT product (12). The RSS
group has now independently derived a second T2LT dataset (14).
Another strategy for removing stratospheric influences on T2 relies on a linear
combination of T4 and T2 (15) (see SOM). This procedure yields TFu, which is repre-
sentative of temperatures in the bulk troposphere (1000 to 100 hPa). Relative to T2LT,
TFu receives more of its signal from higher regions of the troposphere (15). Based on
simple moist adiabatic lapse rate (MALR) theory (29), we expect scaling ratios in
the deep tropics to increase with increasing height, and to peak at roughly 200 hPa.
Comparison of the amplification factors estimated with T2LT and TFu data allows us
to verify whether models and observations confirm this theoretical expectation.
Before discussing the scaling ratio results, it is instructive to examine the vari-
ability and trends in layer-averaged atmospheric temperatures and TS. Our analysis
period (January 1979 through December 1999) is constrained by the start date of
observed satellite data and the end date of the IPCC historical forcing experiment.
A total of 49 realizations of this experiment were available (24).
Time series of tropical T4 changes in UAH, RSS, and the IPCC simulations are
characterized by overall cooling trends and volcanically-induced stratospheric warm-
ing signals (Fig. 1A). High-frequency variability associated with the Quasi-Biennial
Oscillation (QBO) is evident in the observations, but not in the model simulations
(5) (see SOM). Satellite T4 trends lie within the range of model results, but the larger

B. D. Santer et al. 7
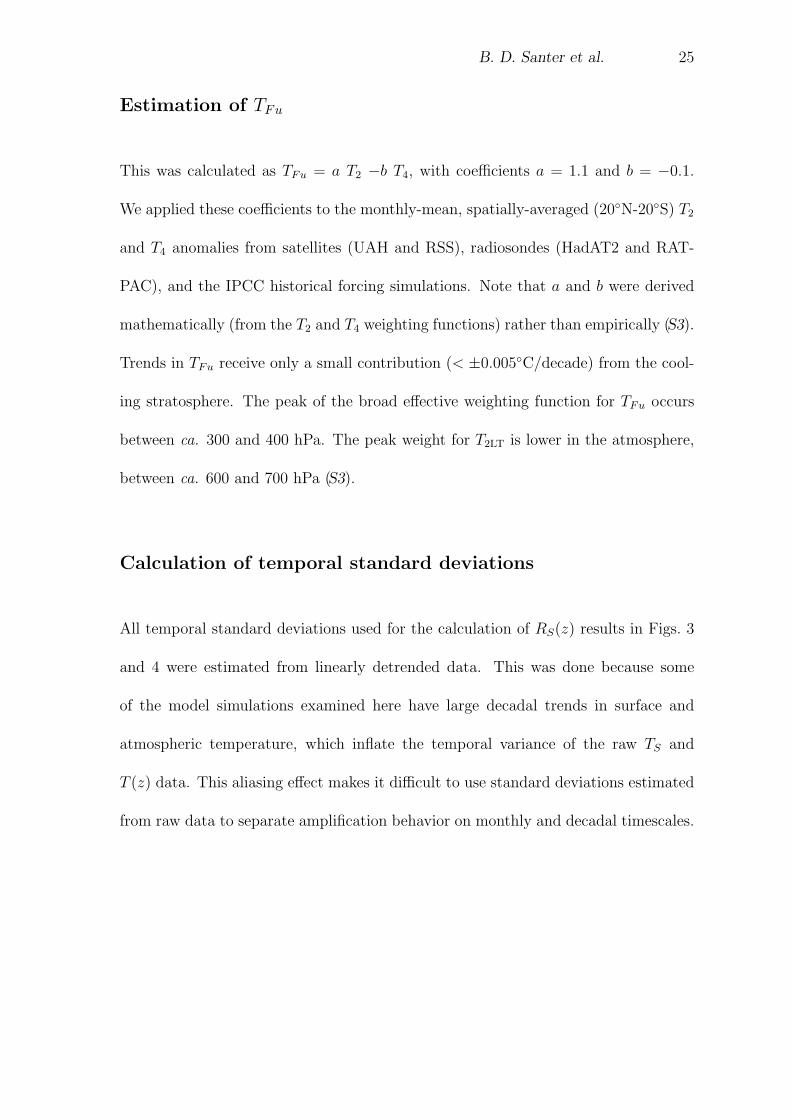
cooling trends estimated from radiosondes do not (Fig. 2A). Part of this discrepancy
may be due to residual stratospheric and upper tropospheric cooling biases in the
tropical radiosonde data (18, 19).
In observations, the tropical variability of tropospheric and surface temperatures is
dominated by the large El Nino events in 1982/83, 1987/88, and 1997/98 (Figs. 1B,C).
Since the IPCC runs are coupled model simulations, they cannot reproduce the time
sequence of observed El Nino and La Nina events, except by chance (2, 16). The
range of simulated El Nino/Southern Oscillation (ENSO) variability spans an order
of magnitude. Models with very strong ENSO variability have fluctuations in surface
and tropospheric temperatures that are noticeably larger than observed.
The observed tropical TS trends in the NOAA and HadCRUT2v datasets (0.12
and 0.14◦C/decade, respectively) are very similar to X, the average warming over
all model simulations (Fig. 2E) (30). In the troposphere, however, model-observed
trend agreement is sensitive to the atmospheric layer examined and the choice of
observational dataset. In both radiosonde datasets used here, T2 cools over 1979 to
1999, and trends are outside the spread of model results (Fig. 2B). Large stratospheric
cooling biases in the radiosonde data probably contribute to this disparity (18, 19).
Use of TFu removes most of the stratospheric influence on T2, and yields positive
temperature trends in all observed datasets (Fig. 2C) (5, 15, 28). All observed TFu
trends are within the envelope of model values.

B. D. Santer et al. 8
In the tropical lower troposphere, all datasets except UAH have positive T2LT
trends (Fig. 2D). The difference between the UAH and RSS trends (ca. 0.13◦C/decade)
is a factor of two larger than the claimed 95% confidence interval for the UAH global
T2LT trend (12). This difference is primarily attributable to the different ways in
which the two groups account for the effects of orbital drift on the sampling of the
diurnal temperature cycle (14). The UAH T2LT trend lies outside the range of model
solutions. The disparate behavior of T2LT and TFu in the UAH data (the former cools,
while the latter warms) is not evident in any other dataset (14, 15, 28).
Both model and satellite data indicate that variability in TS is amplified in the
tropical troposphere (Figs. 1B,C). Amplification of surface warming is a direct re-
sult of moist thermodynamic processes (29). We examine two different amplification
metrics: RS(z), the ratio between the temporal standard deviations of monthly-mean
tropospheric and TS anomalies, and Rβ(z), the ratio between the multi-decadal trends
in these quantities. Since most of the monthly-timescale variability in tropical surface
and tropospheric temperatures is driven by interannual fluctuations in ENSO, RS(z)
largely reflects amplification processes acting on annual timescales (31) (see Fig. S1).
Figure 3A shows RS(z) values in models and radiosondes. The theoretically-
expected profile is also displayed (32). In all cases, RS(z) increases above the boundary
layer, with maximum amplification at roughly 200 hPa. Below roughly 400 hPa,
there is close agreement between the scaling ratios in models, radiosondes and theory.

B. D. Santer et al. 9
Between 400 and 150 hPa, the theoretical scaling ratios are consistently larger than in
either the radiosondes or the IPCC simulations. Such departures may be due to the
fact that MALR theory is applicable to regions of the tropical ocean experiencing deep
convection. In contrast, the model and radiosonde temperature data used to calculate
RS(z) include many convectively-inactive areas, where the surface air temperature
change is not constrained by the moist adiabat set by the convectively-active regions.
Furthermore, active moist convection does not always penetrate above 400 hPa, which
would weaken the connection to a moist adiabat above this level.
When scaling ratios are calculated for multi-decadal linear trends, both radiosonde
datasets are clear outliers. HadAT2 and RATPAC Rβ(z) values never exceed 0.82,
indicating damping of the surface warming trend in the free atmosphere (Fig. 3B).
None of the 49 model realizations demonstrate such behavior. The shapes of the
radiosonde-based scaling ratio profiles also differ from model and theoretical results,
with peak values at generally lower atmospheric levels. Note that subsampling the
HadCRUT2v TS data at the locations of the HadAT2 radiosonde stations has little
impact on the observed RS(z) or Rβ(z) values (see SOM).
In the low- to mid-troposphere, model Rβ(z) results are in good agreement with
theoretical expectations. Model scaling ratios are therefore consistent with theory
on both monthly and multi-decadal timescales, while the radiosonde data are only
consistent with theory on monthly timescales.

B. D. Santer et al. 10
A qualitatively similar picture emerges from scatter plots of the individual compo-
nents of RS(z) and Rβ(z) (Fig. 4). These display scaling behavior for layer-averaged
atmospheric temperatures rather than for temperatures at discrete atmospheric levels.
Figure 4A shows s{TS} and s{T2LT}, the temporal standard deviations of monthly-
mean tropical TS and T2LT data. Both vary by a factor of ≥ 5 over the 19 IPCC
models. Values of s{TFu} span a comparable range (Fig. 4B). These large ranges
are primarily dictated by model differences in the amplitude of El Nino/Southern
Oscillation (ENSO) variability.
Despite this large spread of model variability estimates, the tropospheric ampli-
fication of s{TS} is internally consistent across a wide range of models and observed
data (Figs. 4A,B). The regression between the model s{TS} and s{T2LT} values has a
slope of 1.3, in accord with the theoretically-expected scaling ratio at the peak of the
T2LT weighting function. The regression line for s{TS} and s{TFu} is steeper (1.5).
This is because the TFu weighting function peaks higher in the atmosphere, where
scaling ratios are larger (Fig. 3A) (see SOM). All model and observational results
in Figs. 4A,B are tightly clustered around the fitted (red) regression lines, consis-
tent with the close model-observed agreement in lower tropospheric values of RS(z)
(Fig. 3A).
Amplification factors estimated from multi-decadal trends in TS, T2LT, and TFu
also display considerable internal consistency in the 19 IPCC models (Figs. 4C,D).

B. D. Santer et al. 11
This consistency occurs despite large inter-model differences in convective parameter-
izations, boundary layer formulation, and resolution, all of which affect the simulation
of tropical convection and tropospheric lapse rates. Furthermore, the model-model
consistency in Rβ(z) ratios is robust to differences in the natural and anthropogenic
forcings applied by each group (24) (see SOM). Many of these forcings are heteroge-
neous in space and time (2, 3, 33). These differences in forcings and physics do not
cause significant displacement of model results from the regression line in Figs. 4C
and 4D. The regression slopes in Figs. 4C and D are similar to those estimated from
monthly-timescale variability, with TFu results again yielding a steeper slope than
T2LT (c.f. Figs. 4A,B).
The real conundrum in Fig. 4 is the complex behavior of the observations. On
monthly timescales, the amplification behavior of models and observations is con-
sistent. On decadal timescales, however, only the RSS-based T2LT and TFu trends
have scaling factors that are in reasonable accord with model results (Figs. 4C,D)
(see SOM). Despite sustained warming of the tropical land and ocean surfaces, the
UAH T2LT trend is negative – i.e., Rβ(z) < 0. The UAH Rβ(z) value seems physically
implausible (14, 15). Prolonged surface warming should destabilize tropical temper-
ature profiles, thus enhancing conditions for moist convection and readjustment of
atmospheric temperatures to a MALR.
In contrast to the model results and theoretical expectations, both radiosonde

B. D. Santer et al. 12
datasets used here have Rβ(z) ratios � 1.0 (Figs. 4C,D). As in the case of the
satellite datasets, there are large structural uncertainties in radiosonde estimates of
tropospheric temperature change (4–7). Comparisons of tropical temperature data
from day- and night-time radiosonde ascents suggest that the error arising from solar
heating of temperature sensors has decreased over time (18, 19). Inadequate correction
for this effect may account for a residual cooling bias in tropospheric temperature
changes.
The existence of residual inhomogeneities in the observational data is entirely
likely. Current atmospheric observing systems were designed for real-time monitor-
ing of weather rather than long-term monitoring of climate. The construction of
reliable climate records from radiosondes is hampered by the above-noted changes
in instrumentation (18, 19), along with changes in observing practices and network
density (4–7, 11, 13). Similar concerns apply to satellite data, which are influenced
by intersatellite biases, orbital drift and decay, and uncertainties in instrument cali-
bration coefficients (11–14, 17).
Adjustments for these and other effects are applied at discrete points in an ob-
servational time series, such as times of transition to a new satellite. None of these
corrections is precisely known. Small errors in adjustments can introduce systematic
errors in the time series. These errors have little impact on monthly and interan-
nual variability, which accounts for most of the variance of tropospheric temperature

B. D. Santer et al. 13
fluctuations in the deep tropics (Fig. 1B). However, systematic errors can have a
significant effect on interdecadal variability. This helps to explain why model/data
comparisons of Rβ(z) ratios are sensitive to observational uncertainty, while RS(z)
ratios are not.
In summary, we have demonstrated that all observed datasets and model results
are remarkably consistent in terms of their relationship between monthly- and annual-
timescale temperature variations at the surface and in the free troposphere. This is
a strong verification of the model physics that governs the amplification of tropical
surface temperature changes. On decadal timescales, however, only one observed
dataset (RSS) shows amplification behavior that is generally consistent with model
results. The correspondence between models and observations on monthly and an-
nual timescales does not guarantee that model scaling ratios are valid on decadal
timescales. However, given the very basic nature of the physics involved, this high-
frequency agreement is suggestive of more general validity of model scaling ratios
across a range of timescales.
The RSS T2LT, T2, and TFu trends are physically consistent (all three layers warm
as the surface warms), while the UAH data show trends of different sign in the lower-
and mid-troposphere. These results support the contention that the tropical warm-
ing trend in RSS T2LT data is more reliable than T2LT trends in other observational
datasets. This conclusion does not rest solely on comparisons with climate models.

B. D. Santer et al. 14
It is independently supported by the empirical evidence of recent increases in tropo-
spheric water vapor and tropopause height (25, 34), which are accord with warming
but not cooling of the free troposphere.
We have employed basic physical principles, as represented in current climate
models, for interpreting and evaluating observational data. Our work illustrates
that progress toward an improved understanding of the climate system can best
be achieved by combined use of observations, theory, and models. The availabil-
ity of a large range of model and observational surface and atmospheric temperature
datasets has been of great benefit to this research, and highlights the dangers in-
herent in drawing inferences on agreement between models and observations without
adequately accounting for uncertainties in both.

B. D. Santer et al. 15
References and Notes
1. B. D. Santer et al., Nature 382, 39 (1996).
2. J. E. Hansen et al., J. Geophys. Res. 107, ACL-2, doi:10.1029/2001JD001143
(2002).
3. S. F. B. Tett et al., J. Geophys. Res. 107, doi 10.1029/2000JD000028 (2002).
4. J. R. Lanzante, S. A. Klein, D. J. Seidel, J. Climate 16, 241 (2003).
5. D. J. Seidel et al., J. Clim. 17, 2225 (2004).
6. P. W. Thorne et al., J. Geophys. Res. (accepted).
7. M. Free, D. J. Seidel, J. K. Angell, J. Lanzante, I. Durre, T. C. Peterson, Ra-
diosonde Atmospheric Temperature Products for Assessing Climate (RATPAC):
A new dataset of large-area anomaly time series. J. Geophys. Res. (submitted).
8. P. W. Thorne et al., Geophys. Res. Lett. 29, doi 10.1029/2002GL015717
(2002).
9. B. D. Santer et al., Science 287, 1227 (2000).
10. D. J. Gaffen et al., Science 287, 1242 (2000).
11. J. M. Wallace et al., National Research Council, Board on Atmospheric Sciences
and Climate, Reconciling Observations of Global Temperature Change, National
Academy Press, Washington D.C., 85 pp. (2000).

B. D. Santer et al. 16
12. J. R. Christy, R. W. Spencer, W. B. Norris, W. D. Braswell, J. Atmos. Ocean.
Tech. 20, 613 (2003).
13. J. W. Hurrell, K. E. Trenberth, J. Clim. 11, 945 (1998).
14. C. A. Mears, F. J. Wentz, The effect of diurnal correction on satellite-derived
lower tropospheric temperature. Science (submitted).
15. Q. Fu and C. M. Johanson, Geophys. Res. Lett. 32, L10703, doi:10.1029/2004GL022266
(2005).
16. B. D. Santer et al., Science 300, 1280 (2003).
17. C. A. Mears, M. C. Schabel, F. W. Wentz, J. Clim. 16, 3650 (2003).
18. S. C. Sherwood, J. Lanzante, C. Meyer, Radiosonde daytime biases and late
20th century warming. Science (submitted).
19. W. J. Randel, F. Wu, Biases in stratospheric temperature trends derived from
historical radiosonde data. J. Climate (submitted).
20. P. W. Thorne, D. E. Parker, J. R. Christy, C. A. Mears, Uncertainties in climate
trends: Lessons from upper-air temperature records. Bull. Amer. Met. Soc.
(in press).
21. G. C. Hegerl, J. M. Wallace, J. Clim. 15, 2412 (2002).
22. N. P. Gillett, M. R. Allen, S. F. B. Tett, Clim. Dyn. 16, 49 (2000).

B. D. Santer et al. 17
23. G. A. Meehl, G. J. Boer, C. Covey, M. Latif, R. J. Stouffer, Bull. Amer. Met.
Soc. 81, 313 (2000).
24. While all 19 modeling groups used very similar changes in well-mixed green-
house gases, the changes in other forcings were not prescribed as part of the
experimental design. In practice, each group employed different combinations
of 20th century forcings, and often used different datasets for specifying individ-
ual forcings. Ends dates for the experiment varied between groups, and ranged
from 1999 to 2003. Some modeling centers performed ensembles of the histor-
ical forcing simulation (see SOM). An ensemble contains multiple realizations
of the same experiment, each initiated from slightly different initial conditions,
but with identical changes in external forcings (2). This yields many differ-
ent realizations of the climate “signal” (the response to the imposed forcing
changes) plus climate noise. Averaging over multiple realizations reduces noise
and facilitates signal estimation.
25. F. J. Wentz, M. Schabel, Nature 403, 414 (2000).
26. T. M. Smith, R. W. Reynolds, J. Clim., in press (2005).
27. P. D. Jones, A. Moberg, J. Clim. 16, 206 (2003). HadCRUT2v is the designa-
tion for version 2 of the (variance-corrected) Hadley Centre/Climatic Research
Unit surface temperature dataset.
28. Q. Fu, C. M. Johanson, S. G. Warren, D. J. Seidel, Nature 429, 55 (2004).

B. D. Santer et al. 18
29. P. H. Stone, J. H. Carlson, J. Atmos. Sci. 36, 415 (1979).
30. Here, we define X as the arithmetic mean of the ensemble means, i.e., X =
1N
∑Nj=1 Xj, where N is the total number of models in the IPCC archive, and
Xj is the ensemble mean signal of the jth model. This weighting avoids undue
emphasis on results from a single model with a large number of realizations.
31. One measure of ENSO variability is s{TNINO-3.4}, the standard deviation of sea-
surface temperatures in the Nino 3.4 region of the equatorial Pacific. Values
of s{TS} in the 49 IPCC realizations are closely correlated with s{TNINO-3.4}
(r = 0.92).
32. The theoretical expectation plotted in Fig. 3 was computed by taking the dif-
ference of two pseudo-adiabats calculated from surface air parcels with tem-
peratures of 28.0 and 28.2◦C and 80% relative humidity. These are conditions
typical of deep convective regions over the tropical oceans. The pseudo-adiabats
correspond to equivalent potential temperatures of 353.2 and 354.1 K. The as-
sumed temperature difference of 0.2◦C corresponds approximately to the total
change in tropical ocean temperature over 1979 to 1999. Theoretical scaling
ratios are relatively insensitive to reasonable variations in the baseline values of
surface air temperature and relative humidity, as well as to the magnitude of
the surface air temperature increase.
33. V. Ramaswamy et al., in Climate Change 2001: The Scientific Basis, J. T.

B. D. Santer et al. 19
Houghton et al., Eds. (Cambridge Univ. Press, Cambridge, 2001), pp. 349-
416.
34. B. D. Santer et al., Science 301, 479 (2003).
35. Work at Lawrence Livermore National Laboratory (LLNL) was performed un-
der the auspices of the U.S. Dept. of Energy, Environmental Sciences Divi-
sion, contract W-7405-ENG-48. A portion of this study was supported by the
U.S. Dept. of Energy, Office of Biological and Environmental Research, as
part of its Climate Change Prediction Program. TMLW was supported by
NOAA Office of Climate Programs (“Climate Change Data and Detection”)
grant NA87GP0105. PWT and GJ were funded by the U.K. Dept. of the Envi-
ronment, Food, and Rural Affairs. The authors acknowledge the international
modeling groups for providing their data for analysis, the JSC/CLIVAR Work-
ing Group on Coupled Modelling (WGCM) and their Coupled Model Intercom-
parison Project (CMIP) and Climate Simulation Panel for organizing the model
data analysis activity, and the IPCC WG1 TSU for technical support. The
IPCC Data Archive at Lawrence Livermore National Laboratory is supported
by the Office of Science, U.S. Department of Energy. The static MSU weighting
functions and UAH MSU data were provided by John Christy (UAH). The au-
thors thank Isaac Held, Tom Delworth (both GFDL), Dave Easterling (NCDC),
Bruce Hicks (NOAA ARL), and two anonymous reviewers for useful comments.
Olivier Boucher (Hadley Centre), Greg Flato (Canadian Climate Centre) and

B. D. Santer et al. 20
Erich Roeckner (Max-Planck Institute for Meteorology) supplied information
on the historical forcings used by CNRM-CM3, CCCma-CGCM3.1(T47), and
ECHAM5/MPI-OM.

B. D. Santer et al. 21
Figure 1: Time series of monthly-mean tropical temperature anomalies in T4 (A),
T2 (B), and TS (C). Observed T4 and T2 data are from UAH (12) and RSS (17).
Observed TS results are from the NOAA (26) and HadCRUT2v datasets (27). The
latter were subsampled at the locations of HadAT2 radiosonde data (6). Model TS
results and synthetic MSU temperatures are from the IPCC historical forcing runs
(see SOM). Results shown are restricted to those models that included forcing by
both stratospheric ozone depletion and volcanic aerosols. All data were spatially-
averaged over 20◦N-20◦S, expressed as anomalies relative to climatological monthly
means over 1979 to 1999, and low-pass filtered. To facilitate model-data and model-
model variability comparisons involving models with different ensemble sizes, only
the first realization is plotted from each model.
Figure 2: Simulated and observed least-squares linear trends in tropical T4 (A), T2
(B), TFu (C), T2LT (D), and TS (E). Red bars represent X, the mean of the model
results (30). The black lines that encompass X are the maximum and minumum values
from 49 realizations of the IPCC historical forcing experiment (see SOM). Asterisks
identify observational trends outside the range of model results. All trends were
calculated from spatially-averaged (20◦N-20◦S) anomaly data over the 252-month
period January 1979 to December 1999. For anomaly definition and data sources, see
Fig. 1. The orange bar in panel E is the TS trend based on HadCRUT2v TS data
that were subsampled at the locations of HadAT2 radiosonde data (6).

B. D. Santer et al. 22
Figure 3: Atmospheric profiles of temperature scaling ratios in models, theory, and
radiosonde data. RS(z) is the ratio between the temporal standard deviations of T (z),
the temperature at discrete pressure levels, and the surface temperature T (s) (A).
Rβ(z) is similarly defined, but for trends over 1979 to 1999 (B). Model results are
from 49 realizations of the IPCC historical forcing experiment. Radiosonde scaling
ratios were calculated with HadAT2 and RATPAC T (z) data (6, 7). Scaling ratios
for HadAT2 are based on unsubsampled HadCRUT2v T (s) data. HadCRUT2v T (s)
data subsampled with HadAT2 coverage yield virtually identical scaling ratios (not
shown). RATPAC-derived scaling ratios use spatially-complete NOAA T (s) data.
Theoretically-expected values of RS(z) and Rβ(z) are also shown (32). All standard
deviations in panel A were calculated with linearly detrended data. Rβ(z) results
in panel B are not plotted for three model realizations with surface warming close
to zero (see SOM). All results are for spatial averages over 20◦N-20◦S. For anomaly
definition, data sources, and further processing details, see Fig. 1 and SOM.
Figure 4: Scatter plots of the individual components of the RS(z) and Rβ(z) scaling
ratios. Results are for the deep tropics (20◦N-20◦S). The two upper panels provide
information on amplification of the monthly-timescale TS variability in T2LT (A) and
TFu (B). The two bottom panels show the relationship between decadal-timescale
trends in TS and T2LT (C) and in TS and TFu (D). Each scatter plot has 49 pairs
of model results. The fitted regression lines (in red) are based on model data only.
The black lines denote a slope of 1. Values above (below) the black lines indicate

B. D. Santer et al. 23
tropospheric enhancement (damping) of surface temperature changes. There are two
columns of observational results in C and D. These are based on the NOAA and
HadCRUT2v TS trends (0.12 and 0.14◦C/decade, respectively). Since s{TS} (the
temporal standard deviation of TS) is very similar in the NOAA and HadCRUT2v
datasets, observed results in A and B use NOAA s{TS} values only. The blue shading
in the two bottom panels defines the region of simultaneous surface warming and
tropospheric cooling. For anomaly definition, analysis period, and data sources, refer
to Fig. 1 and SOM.

B. D. Santer et al. 24
Supporting Online Material
Calculation of synthetic MSU temperatures
We employed a static vertical weighting function to calculate synthetic satellite tem-
peratures from model and radiosonde data. For large area averages, this approach
yields decadal-timescale temperature changes similar to those obtained with a full
radiative transfer code (S1). The static weighting function was applied to vertical
profiles of monthly-mean, zonally-averaged atmospheric temperature anomalies (for
radiosonde data) and to temperature profiles at individual grid-points (for model
data). Results were then spatially averaged over the deep tropics (20◦N-20◦S).
Actual MSU temperatures
We used version 5.1 of the UAH MSU T4, T2, and T2LT data and version 1.3 of the
RSS MSU data. A T2 product independently produced by a group at the University
of Maryland (UM) shows tropospheric warming exceeding that in RSS and UAH (S2).
The UM dataset is currently available in global mean form only, and so could not be
used in our investigation of tropical temperature changes.
B. D. Santer et al. 25
Estimation of TFu
This was calculated as TFu = a T2 −b T4, with coefficients a = 1.1 and b = −0.1.
We applied these coefficients to the monthly-mean, spatially-averaged (20◦N-20◦S) T2
and T4 anomalies from satellites (UAH and RSS), radiosondes (HadAT2 and RAT-
PAC), and the IPCC historical forcing simulations. Note that a and b were derived
mathematically (from the T2 and T4 weighting functions) rather than empirically (S3).
Trends in TFu receive only a small contribution (< ±0.005◦C/decade) from the cool-
ing stratosphere. The peak of the broad effective weighting function for TFu occurs
between ca. 300 and 400 hPa. The peak weight for T2LT is lower in the atmosphere,
between ca. 600 and 700 hPa (S3).
Calculation of temporal standard deviations
All temporal standard deviations used for the calculation of RS(z) results in Figs. 3
and 4 were estimated from linearly detrended data. This was done because some
of the model simulations examined here have large decadal trends in surface and
atmospheric temperature, which inflate the temporal variance of the raw TS and
T (z) data. This aliasing effect makes it difficult to use standard deviations estimated
from raw data to separate amplification behavior on monthly and decadal timescales.

B. D. Santer et al. 26
Subsampling observed Ts data with radiosonde coverage
Subsampling surface temperature data at radiosonde locations actually degrades r,
the correlation between time series of monthly-mean T2LT and TS anomalies. For
example, r = 0.82 for tropical average anomalies calculated from the unsubsampled
HadCRUT2v TS data and the HadAT2 radiosonde T2LT data. The correlation is
decreased (r = 0.73) if the same radiosonde data are correlated with the HadCRUT2v
TS data subsampled at the radiosonde locations. This result must be related to the
fact that surface temperature fluctuations have smaller correlation length scales than
temperature fluctuations in the free troposphere (S4).
Modeling groups contributing to IPCC database
At the time this research was conducted, 19 modeling groups had performed a wide
range of simulations in support of the IPCC Fourth Assessment Report. Climate data
from these simulations were made available to the scientific community through the
U.S. Dept. of Energy’s Program for Climate Model Diagnosis and Intercomparion
(PCMDI).
One of the simulations (the so-called “20c3m” run) involved historical changes in
a number of anthropogenic and natural forcings. The following modeling groups
provided multiple realizations of the 20c3m run (the text in parentheses gives the

B. D. Santer et al. 27
official model designation): the National Center for Atmospheric Research in Boul-
der (CCSM3, five; PCM, four); the Max-Planck Institute for Meteorology in Ger-
many (ECHAM5/MPI-OM, three); the Institute for Atmospheric Physics in China
(FGOALS-g1.0, three), the Geophysical Fluid Dynamics Laboratory in Princeton
(GFDL-CM2.0, three; GFDL-CM2.1, three), the Goddard Institute for Space Studies
in New York (GISS-AOM, two; GISS-EH, five; GISS-ER, five); the Center for Climate
System Research, National Institute for Environmental Studies, and Frontier Research
Center for Global Change in Japan (MIROC-CGCM2.3.2(medres), three; MIROC-
CGCM2.3.2(hires), one); and the Meteorological Research Institute in Japan (MRI-
CGCM2.3.2, five). Individual realizations were supplied by the Canadian Centre
for Climate Modelling and Analysis (CCCma-CGCM3.1(T47)); Meteo-France/Centre
National de Recherches Meteorologiques (CNRM-CM3); the Institute for Numerical
Mathematics in Russia (INM-CM3.0); the Institute Pierre Simon Laplace in France
(IPSL-CM4); and the Hadley Centre for Climate Prediction and Research in the U.K.
(UKMO-HadCM3 and UKMO-HadGEM1). Some groups provided results for several
different model configurations.
Forcings used in 20c3m runs
Details of the natural and anthropogenic forcings used by differing modeling groups in
their IPCC “historical forcing” simulations are given in Table 1. This Table was com-

B. D. Santer et al. 28
piled using information that participating modeling centers provided to the PCMDI
(see http://www-pcmdi.llnl.gov/ipcc/model documentation). Model acronyms are
defined in the previous section.
A total of 11 different forcings are listed in Table 1. A letter ‘Y’ denotes inclusion of
a specific forcing. As used here, ‘inclusion’ signifies the specification of time-varying
forcings, with changes on interannual and longer timescales. Forcings that were varied
over the seasonal cycle only, or not at all, are identified with a dash. A question mark
indicates a case where there is uncertainty regarding inclusion of the forcing.
Stratification of 20c3m simulations
In Fig. 3, simulations were stratified according to model groups that included both
stratospheric ozone depletion and volcanic aerosols (O+V) and groups that omitted
these forcings. Only 9 (12) of the 19 IPCC models included forcing by volcanic aerosols
(stratospheric ozone). There is no indication that the RS(z) results in Fig. 3A reflect
this stratification. However, some of the largest Rβ(z) values in the lower troposphere
occur in realizations performed with CCSM3, GFDL-CM2.1, and GISS-EH (Fig. 3B).
All three of these models included changes in carbonaceous aerosols, which may act
to warm the lower troposphere relative to the surface, thus increasing Rβ(z) (S5).

B. D. Santer et al. 29
Simulated and observed changes in T4
The overall stratospheric cooling during the satellite era is related to stratospheric
ozone depletion (S6). The warming of T4 after the eruptions of El Chichon in April
1982 and Pinatubo in June 1991 is due to the absorption of incoming solar radiation
and upwelling terrestrial radiation by volcanic aerosols (S6, S7). A change in the phase
of the QBO during the Pinatubo eruption induced cooling of the equatorial strato-
sphere (S8), thus damping the stratospheric warming response to Pinatubo. QBO
variability is not well-simulated by most models in the IPCC archive, which partly
explains why the simulated T4 response to Pinatubo is larger and less attenuated in
the model simulations.
Anomalous Rβ(z) results
Two of the 49 model realizations (INM-CM3.0) and (ECHAM5/MPI-OM, run 2)
have Rβ(z) values < 1.0 for trends in T2LT and TFu. These anomalous results are
due to either very weak surface warming (INM-CM3.0) or very weak surface cooling
(ECHAM5/MPI-OM, run 2). Neither case is analogous to the radiosonde- or UAH-
based Rβ(z) � 1.0 results, which occur in conjunction with pronounced surface
warming. The ECHAM result arises from the chance occurrence of a large La Nina
event near the end of the 1979-1999 period. Run 1 of MRI-CGCM2.3.2 has very large
Rβ(z) values, which are associated with TS, T2LT, and TFu trends that are all close to

B. D. Santer et al. 30
zero (Figs. 4C,D).
Caption for Figure S1
Figure S1: Scatter plots of the individual components of the RS(z) scaling ratio.
Results are for the deep tropics (20◦N-20◦S). Panel A is identical to Fig. 4A, and
provides information on the monthly-timescale variability in TS and T2LT in a wide
range of model and observational datasets. The standard deviations of TS and T2LT in
panel B are based on annual-mean rather than monthly-mean anomalies. All standard
deviations were calculated from linearly detrended data. Observed s{TS} values are
from NOAA (S9). The fitted regression lines (in red) are based on model data only.
The black lines denote a slope of 1. For further details of datasets and analysis
periods, refer to Fig. 4. Note the close correspondence between the monthly-mean
and annual-mean results, which is due to the fact that monthly-timescale variability
in TS and T2LT is dominated by interannual fluctuations in ENSO.

B. D. Santer et al. 31
Supporting References and Notes
1.S B. D. Santer et al., J. Geophys. Res. 104, 6305 (1999).
2.S K. Y. Vinnikov, N. C. Grody, Science 302, 269 (2003).
3.S Q. Fu and C. M. Johanson, Geophys. Res. Lett. 32, L10703, doi:10.1029/2004GL022266
(2005).
4.S J. W. Hurrell, K. E. Trenberth, J. Clim. 11, 945 (1998).
5.S V. Ramanathan et al., Proc. Nat. Acad. Sci. 102, doi: 10.1073/pnas.0500656102
(2005).
6.S V. Ramaswamy et al., Rev. Geophys. 39, 71 (2001).
7.S J. E. Hansen et al., J. Geophys. Res. 107, ACL-2, doi:10.1029/2001JD001143
(2002).
8.S L. Bengtsson, E. Roeckner, M. Stendel, J. Geophys. Res. 104, 3865 (1999).
9.S T. M. Smith, R. W. Reynolds, J. Clim., in press (2005).

B. D. Santer et al. 32
Table 1: Forcings used in IPCC simulations of 20th century climate change
Model G O SD SI BC OC MD SS LU SO VL
1 CCCma-CGCM3.1(T47) Y - Y - - - - - - - -
2 CCSM3 Y Y Y - Y - - - - Y Y
3 CNRM-CM3 Y Y Y - Y ? - - - - -
4 CSIRO-Mk3.0 Y - Y - ? ? ? ? ? ? ?
5 ECHAM5/MPI-OM Y Y Y Y - - - - - - -
6 FGOALS-g1.0 Y - Y ? - - - - - - -
7 GFDL-CM2.0 Y Y Y - Y Y - - Y Y Y
8 GFDL-CM2.1 Y Y Y - Y Y - - Y Y Y
9 GISS-AOM Y - Y - - - - Y - - -
10 GISS-EH Y Y Y Y Y Y Y Y Y Y Y
11 GISS-ER Y Y Y Y Y Y Y Y Y Y Y
12 INM-CM3.0 Y - Y - - - - - - Y a
13 IPSL-CM4 Y - Y ? - - - - - - -
14 MIROC3.2(medres) Y Y Y ? Y Y Y Y Y Y Y
15 MIROC3.2(hires) Y Y Y ? Y Y Y Y Y Y Y
16 MRI-CGCM2.3.2 Y - Y - - - - - - Y a
17 PCM Y Y Y - - - - - - Y Y
18 UKMO-HadCM3 Y Y Y Y - - - - - - -
19 UKMO-HadGEM1 Y Y Y Y Y Y - - Y Y Y
G = Well-mixed greenhouse gases O = Tropospheric and stratospheric ozone
SD = Sulfate aerosol direct effects SI = Sulfate aerosol indirect effects
BC = Black carbon OC = Organic carbon
MD = Mineral dust SS = Sea salt
LU = Land use change SO = Solar irradiance
VL = Volcanic aerosols.
a = Documentation claims inclusion of volcanic aerosols, but there are no stratospheric warming responses in T4.

-1
0
1
2
3
Ano
mal
y (o C
) CCSM3GFDL-CM2.0GFDL-CM2.1GISS-EHGISS-ERMIROC3.2(medres)
MIROC3.2(hires)
PCMUKMO-HadGEM1
-1
0
1
Ano
mal
y (o C
)
Satellites (RSS)
Satellites (UAH)
1980 1985 1990 1995 2000
-1
0
1
Ano
mal
y (o C
)
NOAAHadCRUT2v
A T4
B T2
C TS
MODELS (with O, V)Satellites (RSS)
Satellites (UAH)
Santer et al. Figure 1
-0.8
-0.6
-0.4
-0.2
0
0.2
Ano
mal
y (o
C)
-0.1
0
0.1
0.2
0.3
0.4
0.5
Ano
mal
y (o
C)
ModelsRadiosondes (RATPAC)
Radiosondes (HadAT2)
Satellites (UAH)
Satellites (RSS)
-0.1
0
0.1
0.2
0.3
0.4
0.5
Ano
mal
y (o
C)
-0.1
0
0.1
0.2
0.3
0.4
0.5
Ano
mal
y (o
C)
-0.1
0
0.1
0.2
0.3
0.4
0.5
Ano
mal
y (o
C)
Surface (NOAA)
Surface (HadCRUT2v)
Surface (HadCRUT2v; subsampled)
B T2 C TFuA T4
D T2LT E TSFC
Santer et al. Figure 2
**
* *
*

-1 0 1 2 3 4Scaling ratio Rs(z): s{T(z)} / s{TS}
150
200
300
500
700
1000
Pre
ssur
e (m
b)
CCCma-CGCM3.1(T47)
CNRM-CM3
CSIRO-Mk3.0
ECHAM5/MPI-OM
FGOALS-g1.0
GISS-AOM
INM-CM3.0
IPSL-CM4
MRI-CGCM2.3.2
UKMO-HadCM3
-1 0 1 2 3 4Scaling ratio Rβ(z): Trend in T(z) / trend in TS
150
200
300
500
700
1000
Pre
ssur
e (m
b)
CCSM3
GFDL-CM2.0
GFDL-CM2.1
GISS-EH
GISS-ER
MIROC3.2(medres)
MIROC3.2(hires)
PCM
UKMO-HadGEM1
Observations and Theory
Theory
Radiosondes (RATPAC)
BA
Radiosondes (HadAT2)
Models (with O, V) Models (without O, V)
Santer et al. Figure 3

0.1 0.2 0.3 0.4 0.5s{TS} (
oC)
0.1
0.2
0.3
0.4
0.5
0.6
0.7
0.8s{
T2L
T}
(o C)
CCCma-CGCM3.1(T47)
CCSM3
CNRM-CM3
CSIRO-Mk3.0
ECHAM5/MPI-OM
FGOALS-g1.0
GFDL-CM2.0
GFDL-CM2.1
GISS-AOM
GISS-EH
GISS-ER
INM-CM3.0
IPSL-CM4
MIROC3.2(medres)
MIROC3.2(hires)
MRI-CGCM2.3.2
PCM
UKMO-HadCM3
UKMO-HadGEM1
0.1 0.2 0.3 0.4 0.5s{TS} (
oC)
0.1
0.2
0.3
0.4
0.5
0.6
0.7
0.8
s{T
Fu}
(o C
)
0 0.1 0.2 0.3 0.4Trend in TS (
oC/decade)
-0.1
0
0.1
0.2
0.3
0.4
0.5
0.6
Tre
nd in
T2L
T (
o C/d
ecad
e)
Radiosondes (RATPAC)
Radiosondes (HadAT2)
Satellites (UAH)
Satellites (RSS)
0 0.1 0.2 0.3 0.4Trend in TS (
oC/decade)
-0.1
0
0.1
0.2
0.3
0.4
0.5
0.6
Tre
nd in
TF
u (o C
/dec
ade)
y = 0.009 + 1.300 x
C
r = 0.984
BA
D
y = 0.021 + 1.403 x
r = 0.986
y = -0.003 + 1.499 x
MODELS
OBSERVATIONS
Santer et al. Figure 4
r = 0.986
y = 0.018 + 1.272 x
r = 0.989

0.1 0.2 0.3 0.4 0.5s{TS} (
oC)
0.1
0.2
0.3
0.4
0.5
0.6
0.7s{
T2L
T}
(o C)
CCCma-CGCM3.1(T47)
CCSM3
CNRM-CM3
CSIRO-Mk3.0
ECHAM5/MPI-OM
FGOALS-g1.0
GFDL-CM2.0
GFDL-CM2.1
GISS-AOM
GISS-EH
GISS-ER
INM-CM3.0
IPSL-CM4
MIROC3.2(medres)
MIROC3.2(hires)
MRI-CGCM2.3.2
PCM
UKMO-HadCM3
UKMO-HadGEM1
0.1 0.2 0.3 0.4 0.5s{TS} (
oC)
0.1
0.2
0.3
0.4
0.5
0.6
0.7
s{T
2LT}
(o C)
Radiosondes (RATPAC)
Radiosondes (HadAT2)
Satellites (UAH)
Satellites (RSS)
y = 0.009 + 1.300 x
r = 0.984
B AnnualA Monthly
y = 0.001 + 1.330 x
MODELS OBSERVATIONS
Santer et al. Figure S1
r = 0.984