Ammonia Emissions from a U.S. Broiler House—Comparison of Concurrent Measurements Using Three...
11
IMPORTANT COPYRIGHT INFORMATION The following PDF article was originally published in the Journal of the Air & Waste Management Association and is fully protected under the copyright laws of the United States of America. The author of this article alone has been granted permission to copy and distribute this PDF. Additional uses of the PDF/article by the author(s) or recipients, including posting it on a Web site, are prohibited without the express consent of the Air & Waste Management Association. If you are interested in reusing, redistributing, or posting online all or parts of the enclosed article, please contact the offices of the Journal of the Air & Waste Management Association at Phone: +1-412-232-3444, ext. 6027 E-mail: [email protected] Web: www.awma.org You may also contact the Copyright Clearance Center for all permissions related to the Journal of the Air & Waste Management Association: www.copyright.com. Copyright © 2006 Air & Waste Management Association
-
Upload
independent -
Category
Documents
-
view
0 -
download
0
Transcript of Ammonia Emissions from a U.S. Broiler House—Comparison of Concurrent Measurements Using Three...
IMPORTANT COPYRIGHT INFORMATION The following PDF article was originally published in the Journal of the Air & Waste Management Association and is fully protected under the copyright laws of the United States of America. The author of this article alone has been granted permission to copy and distribute this PDF. Additional uses of the PDF/article by the author(s) or recipients, including posting it on a Web site, are prohibited without the express consent of the Air & Waste Management Association. If you are interested in reusing, redistributing, or posting online all or parts of the enclosed article, please contact the offices of the Journal of the Air & Waste Management Association at Phone: +1-412-232-3444, ext. 6027 E-mail: [email protected] Web: www.awma.org You may also contact the Copyright Clearance Center for all permissions related to the Journal of the Air & Waste Management Association: www.copyright.com.
Copyright © 2006 Air & Waste Management Association
Ammonia Emissions from a U.S. Broiler House—Comparisonof Concurrent Measurements Using Three DifferentTechnologies
Kenneth D. CaseyTexas AgriLife Research, Texas A&M System, Amarillo, TX
Richard S. GatesDepartment of Agricultural and Biological Engineering, University of Illinois at Urbana-Champaign,Urbana, IL
Richard C. Shores, Eben D. Thoma, and D. Bruce HarrisU.S. Environmental Protection Agency, Research Triangle Park, NC
ABSTRACTThere is a need for robust and accurate techniques for themeasurement of ammonia (NH3) and other atmosphericpollutant emissions from poultry production facilities.Reasonable estimates of NH3 emission rate (ER) frompoultry facilities are needed to guide discussions aboutthe industry’s impact on local and regional air quality.The design of these facilities features numerous emissionpoints and results in emission characteristics of relativelylow concentrations and exhaust flow rates that vary diur-nally, seasonally, and with bird age over a considerablerange. These factors combine to render conventionalemissions monitoring approaches difficult to apply. Ac-cess to these facilities is also often restricted for biosecu-rity reasons. The three objectives of this study were (1) tocompare three methods for measuring exhaust NH3 con-centrations and thus ERs, (2) to compare ventilation ratesusing in situ measured fan characteristics versus usingmanufacturer sourced fan curves, and (3) to examine lim-itations of the alternative measurement technologies. Inthis study, two open-path monitoring systems operatingoutside of the buildings were compared with a portable
monitoring system sampling upstream of a primary ex-haust fan. The position of the open-path systems relativeto the exhaust fans, measurement strategy adopted, andweather conditions significantly influenced the quality ofdata collected when compared with the internally lo-cated, portable monitoring system. Calculation of ex-haust airflow from the facility had a large effect on calcu-lated emissions and assuming that the installed fansperformed as per published performance characteristicspotentially overestimated emissions by 13.6–26.8%. Theopen-path measurement systems showed promise for be-ing able to obtain ER measurements with minimal accessto the house, although the availability of individual fancharacteristics markedly improved the calculated ER ac-curacy. However, substantial operator skill and experi-ence and favorable weather conditions were required toobtain good quality results.
INTRODUCTIONReasonable estimates of ammonia (NH3) emission rate(ER) from poultry facilities are needed to guide discus-sions about the industry’s impact on local and regional airquality. Quantitative estimates are also required of theeffectiveness of the various major abatement strategies forreducing NH3 emission from facilities to provide guidanceto the industry on the most effective strategies for man-aging NH3 emissions. A large multistate poultry NH3
emissions project has monitored emissions from layer andbroiler houses in three states over a period of 12months.1–3
In this study, a series of concurrent measurementswere conducted using different measurement technolo-gies (i.e., open-path technologies versus the portablemonitoring unit technique used in the multistate poultryNH3 emissions project) during the growout phase of a latespring and a late fall flock at a broiler house in centralKentucky. Monitoring technologies such as the portablemonitoring units (PMUs) used in the multistate poultryNH3 emissions project and conventional continuous
IMPLICATIONSEmissions of atmospheric pollutants from poultry produc-tion facilities are a growing concern for regulators, industryrepresentatives, and the surrounding community. Thesefacilities with numerous emission points, widely varyingexhaust ventilation rates, and relatively low exhaust con-centrations do not conform well with conventional emis-sions monitoring strategies. Open-path monitoring systemspositioned outside of the buildings potentially addressedbiosecurity and access concerns; however, they requiredfavorable weather conditions and considerable operatorskill and experience to obtain good quality data. The avail-ability of individual rather than generic published fan char-acteristics markedly improved the accuracy of the calcu-lated ER.
TECHNICAL PAPER ISSN:1047-3289 J. Air & Waste Manage. Assoc. 60:939–948DOI:10.3155/1047-3289.60.8.939Copyright 2010 Air & Waste Management Association
Volume 60 August 2010 Journal of the Air & Waste Management Association 939
emissions monitoring (CEM) systems mounted in instru-ment shelters require access to the broiler houses for in-stallation and ongoing maintenance.4–6 This access maypresent a biosecurity issue. The use of open-path measure-ment systems may potentially considerably reduce therequirement for house or even site access. The study alsoaimed to explore the issues involved in using open-pathmeasurement techniques to determine broiler house ERwith intermittently operating exhaust ventilation fans.
EXPERIMENTAL METHODSOverview
The broiler production facility monitored as part of themultistate poultry NH3 emissions project had four housesduring the period of the project. An individual farmerwho grows chickens under contract to an integrator com-pany owned the farm. The site was located in south-central Kentucky, which is considered a “mixed humid”climate.7 Monitoring commenced in late September 2002with a total of nine flocks of birds during the total mon-itoring period. Results from only the periods during flocks6 and 9 when the colocated open-path measurementswere undertaken are reported here.
The four houses on this farm were each 12.2 � 152.5m (except house 4, which was 12.2 � 157.4 m) andhoused a nominal 25,000 birds. These houses were con-structed in 2000 (except house 4, which was built in1995). The long axis of all of the houses was orientedapproximately east-west. All houses had a 1.2-m curtainalong the full length of both sidewalls for emergencyventilation. There were dropped, tri-ply ceilings withblown-in insulation in all houses. Each house had eight1220-mm diameter fans (Chore-Time 38233-2 Turbo Fan[BD]) and three 915-mm diameter fans (Chore-Time38232-2 Turbo Fan). Box inlets were located along bothsidewalls and were automatically controlled based onstatic pressure difference. The ventilation system at this
site was controlled by an electronic controller (Chore-Tronics, Chore-Time Brock, Inc.). A single 1220-mm fanin a nonbrood section of each house was used for mini-mum ventilation.
Data from late spring and late fall weather conditionsat a single mechanically ventilated broiler house werecollected. The data comprise 4 days of measurement fromone of four houses. For much of these two flocks, thebroiler houses were being ventilated to maintain desiredhouse temperature. The U.S. broiler industry typicallyprovides minimum ventilation through timer-controlledfan operation. Timer “on time” is increased as the birdsgrow in size to coincide with increased respiratory andexcreted moisture levels. As the birds grow, the optimumtemperature decreases and more fans are staged on undertemperature control to maintain the desired house envi-ronment. All houses are “tunnel ventilated,” transition-ing from crossflow ventilation mode above a fixed tem-perature set point. This hot weather ventilation strategywas in use during part of each of the study periods re-ported here, namely during the daytime, and minimumventilation was provided during the nights.
Litter in U.S. broiler houses is typically reused for atleast 1 year. This type of litter reuse is referred to as“built-up” litter in the industry. All houses at this sitereused litter with one annual cleanout and practiced half-house brooding. For this site, these flocks represented thefirst and fourth flocks grown on the litter in house 1.Caked litter was removed after each flock, and a smalllayer of new wood shavings was added. The houses werecompletely cleaned out with removal of all built-up litterand placement of fresh bedding (wood shavings) after thecompletion of flock 5 (house 1) and flock 6 (houses 2, 3,and 4).
The birds of flock 6 were placed on March 26, 2003and picked up on May 18, 2003 at 53 days of age, whereasthe birds of flock 9 were placed on September 22, 2003and picked up on November 14, 2003 at 53 days of age.On the first monitoring day of this study, the birds offlock 6 were 49 days old and weighed approximately 2.6kg whereas the birds of flock 9 were 51 days old andweighed approximately 2.8 kg. At pickup, average birdweight was approximately 3.2 kg.
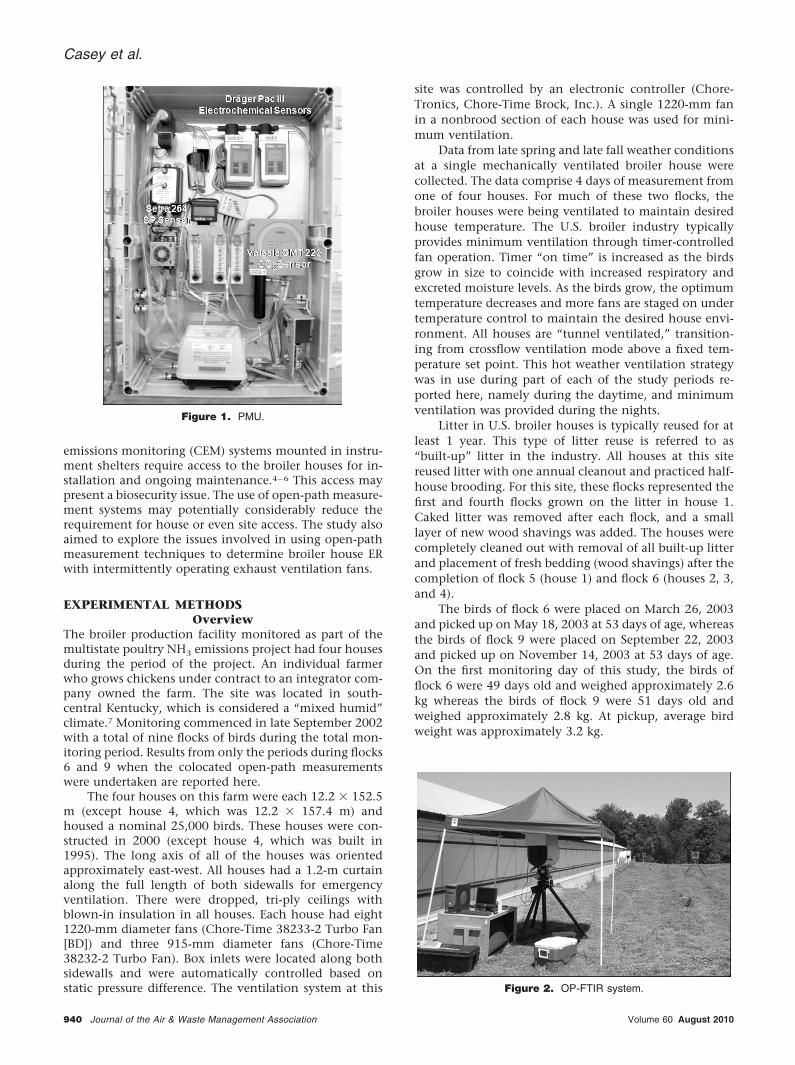
Figure 1. PMU.
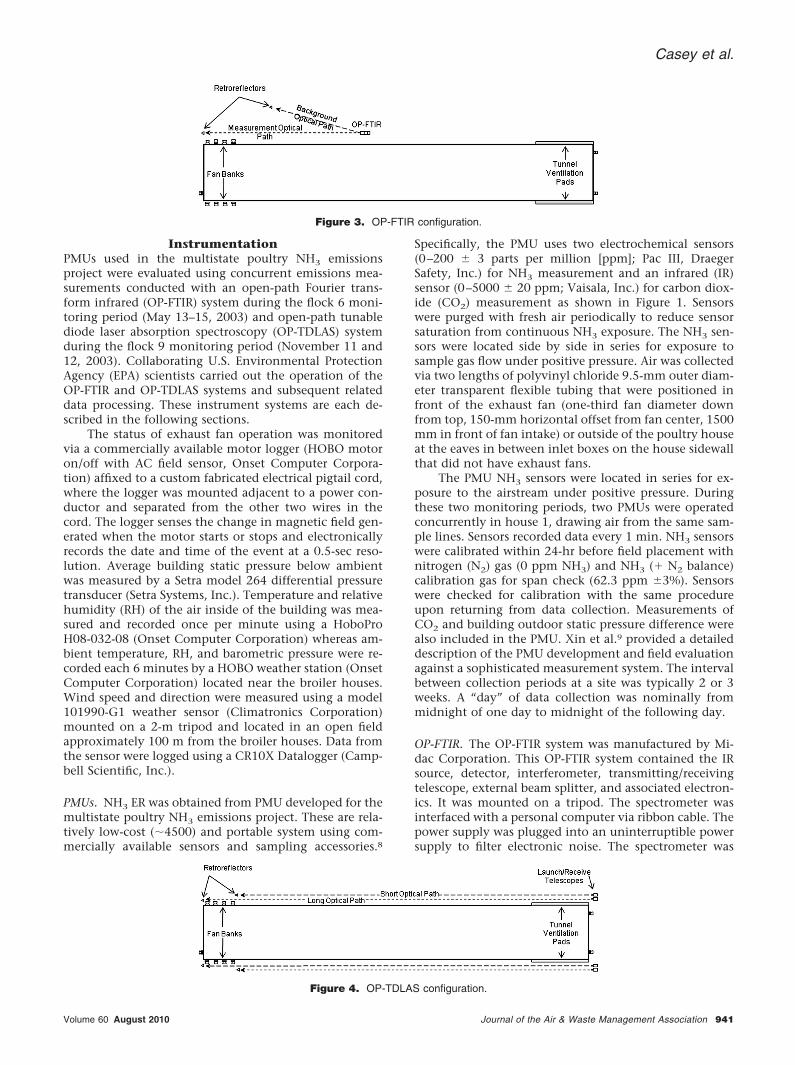
Figure 2. OP-FTIR system.
Casey et al.
940 Journal of the Air & Waste Management Association Volume 60 August 2010
InstrumentationPMUs used in the multistate poultry NH3 emissionsproject were evaluated using concurrent emissions mea-surements conducted with an open-path Fourier trans-form infrared (OP-FTIR) system during the flock 6 moni-toring period (May 13–15, 2003) and open-path tunablediode laser absorption spectroscopy (OP-TDLAS) systemduring the flock 9 monitoring period (November 11 and12, 2003). Collaborating U.S. Environmental ProtectionAgency (EPA) scientists carried out the operation of theOP-FTIR and OP-TDLAS systems and subsequent relateddata processing. These instrument systems are each de-scribed in the following sections.
The status of exhaust fan operation was monitoredvia a commercially available motor logger (HOBO motoron/off with AC field sensor, Onset Computer Corpora-tion) affixed to a custom fabricated electrical pigtail cord,where the logger was mounted adjacent to a power con-ductor and separated from the other two wires in thecord. The logger senses the change in magnetic field gen-erated when the motor starts or stops and electronicallyrecords the date and time of the event at a 0.5-sec reso-lution. Average building static pressure below ambientwas measured by a Setra model 264 differential pressuretransducer (Setra Systems, Inc.). Temperature and relativehumidity (RH) of the air inside of the building was mea-sured and recorded once per minute using a HoboProH08-032-08 (Onset Computer Corporation) whereas am-bient temperature, RH, and barometric pressure were re-corded each 6 minutes by a HOBO weather station (OnsetComputer Corporation) located near the broiler houses.Wind speed and direction were measured using a model101990-G1 weather sensor (Climatronics Corporation)mounted on a 2-m tripod and located in an open fieldapproximately 100 m from the broiler houses. Data fromthe sensor were logged using a CR10X Datalogger (Camp-bell Scientific, Inc.).
PMUs. NH3 ER was obtained from PMU developed for themultistate poultry NH3 emissions project. These are rela-tively low-cost (�4500) and portable system using com-mercially available sensors and sampling accessories.8
Specifically, the PMU uses two electrochemical sensors(0–200 � 3 parts per million [ppm]; Pac III, DraegerSafety, Inc.) for NH3 measurement and an infrared (IR)sensor (0–5000 � 20 ppm; Vaisala, Inc.) for carbon diox-ide (CO2) measurement as shown in Figure 1. Sensorswere purged with fresh air periodically to reduce sensorsaturation from continuous NH3 exposure. The NH3 sen-sors were located side by side in series for exposure tosample gas flow under positive pressure. Air was collectedvia two lengths of polyvinyl chloride 9.5-mm outer diam-eter transparent flexible tubing that were positioned infront of the exhaust fan (one-third fan diameter downfrom top, 150-mm horizontal offset from fan center, 1500mm in front of fan intake) or outside of the poultry houseat the eaves in between inlet boxes on the house sidewallthat did not have exhaust fans.
The PMU NH3 sensors were located in series for ex-posure to the airstream under positive pressure. Duringthese two monitoring periods, two PMUs were operatedconcurrently in house 1, drawing air from the same sam-ple lines. Sensors recorded data every 1 min. NH3 sensorswere calibrated within 24-hr before field placement withnitrogen (N2) gas (0 ppm NH3) and NH3 (� N2 balance)calibration gas for span check (62.3 ppm �3%). Sensorswere checked for calibration with the same procedureupon returning from data collection. Measurements ofCO2 and building outdoor static pressure difference werealso included in the PMU. Xin et al.9 provided a detaileddescription of the PMU development and field evaluationagainst a sophisticated measurement system. The intervalbetween collection periods at a site was typically 2 or 3weeks. A “day” of data collection was nominally frommidnight of one day to midnight of the following day.
OP-FTIR. The OP-FTIR system was manufactured by Mi-dac Corporation. This OP-FTIR system contained the IRsource, detector, interferometer, transmitting/receivingtelescope, external beam splitter, and associated electron-ics. It was mounted on a tripod. The spectrometer wasinterfaced with a personal computer via ribbon cable. Thepower supply was plugged into an uninterruptible powersupply to filter electronic noise. The spectrometer was
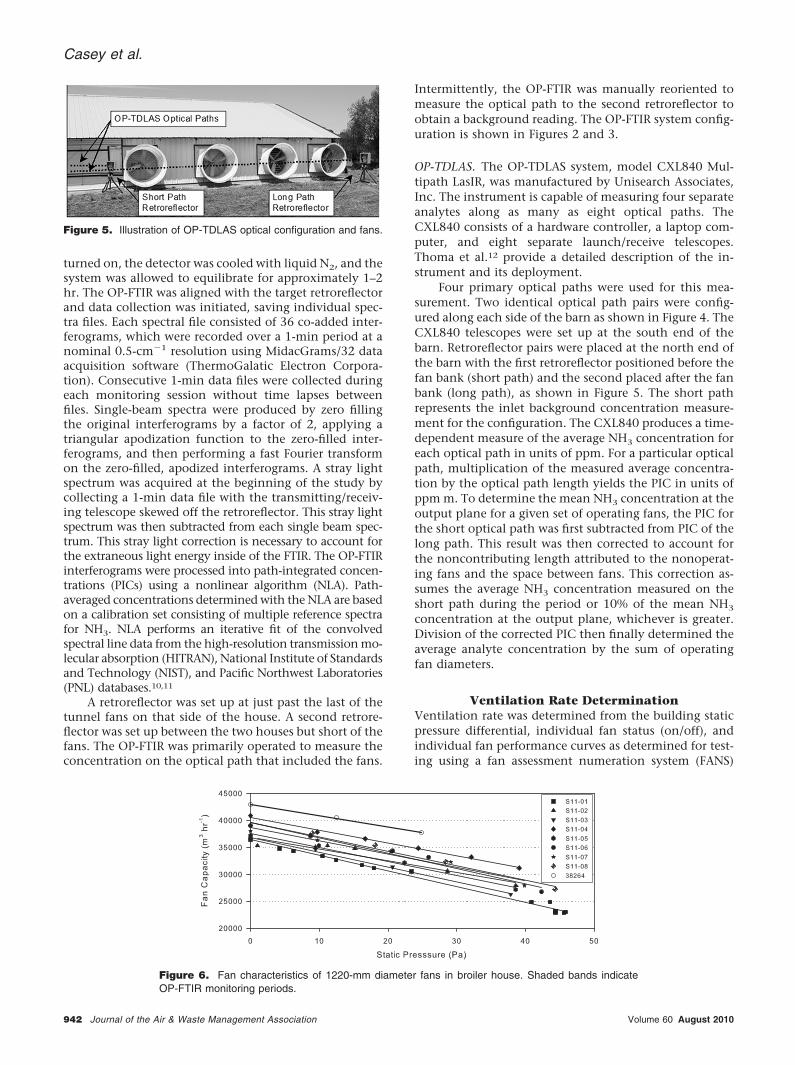
Figure 3. OP-FTIR configuration.
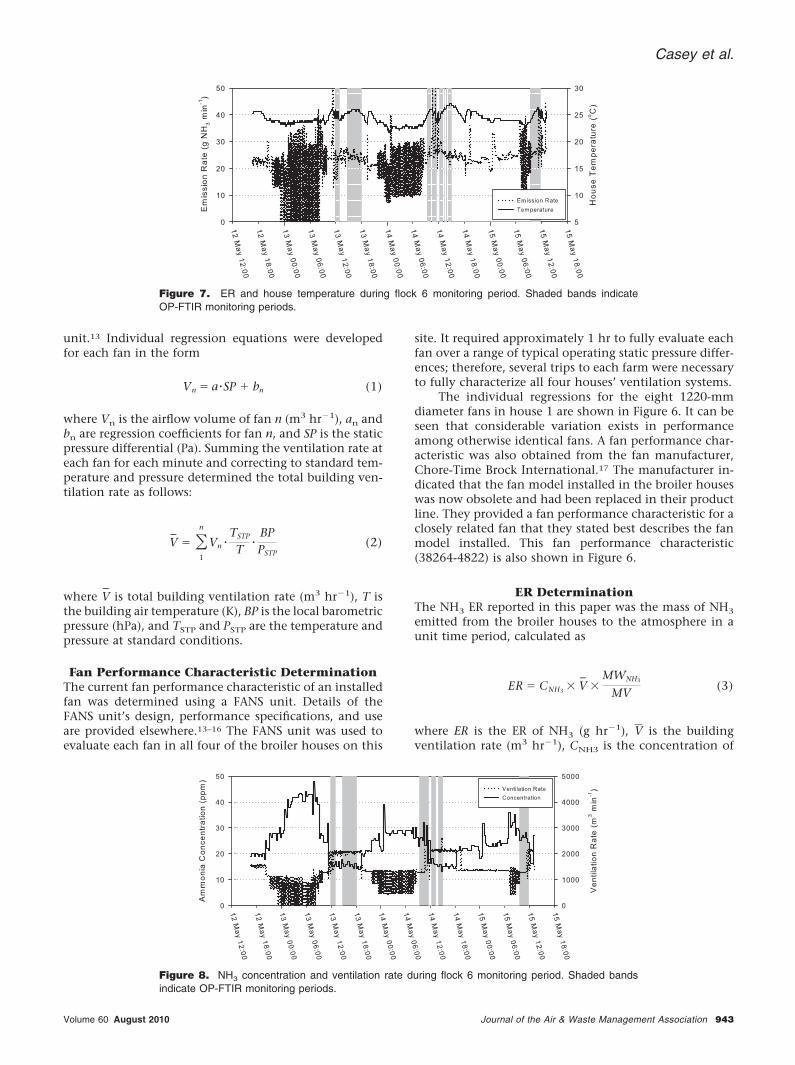
Figure 4. OP-TDLAS configuration.
Casey et al.
Volume 60 August 2010 Journal of the Air & Waste Management Association 941
turned on, the detector was cooled with liquid N2, and thesystem was allowed to equilibrate for approximately 1–2hr. The OP-FTIR was aligned with the target retroreflectorand data collection was initiated, saving individual spec-tra files. Each spectral file consisted of 36 co-added inter-ferograms, which were recorded over a 1-min period at anominal 0.5-cm�1 resolution using MidacGrams/32 dataacquisition software (ThermoGalatic Electron Corpora-tion). Consecutive 1-min data files were collected duringeach monitoring session without time lapses betweenfiles. Single-beam spectra were produced by zero fillingthe original interferograms by a factor of 2, applying atriangular apodization function to the zero-filled inter-ferograms, and then performing a fast Fourier transformon the zero-filled, apodized interferograms. A stray lightspectrum was acquired at the beginning of the study bycollecting a 1-min data file with the transmitting/receiv-ing telescope skewed off the retroreflector. This stray lightspectrum was then subtracted from each single beam spec-trum. This stray light correction is necessary to account forthe extraneous light energy inside of the FTIR. The OP-FTIRinterferograms were processed into path-integrated concen-trations (PICs) using a nonlinear algorithm (NLA). Path-averaged concentrations determined with the NLA are basedon a calibration set consisting of multiple reference spectrafor NH3. NLA performs an iterative fit of the convolvedspectral line data from the high-resolution transmission mo-lecular absorption (HITRAN), National Institute of Standardsand Technology (NIST), and Pacific Northwest Laboratories(PNL) databases.10,11
A retroreflector was set up at just past the last of thetunnel fans on that side of the house. A second retrore-flector was set up between the two houses but short of thefans. The OP-FTIR was primarily operated to measure theconcentration on the optical path that included the fans.
Intermittently, the OP-FTIR was manually reoriented tomeasure the optical path to the second retroreflector toobtain a background reading. The OP-FTIR system config-uration is shown in Figures 2 and 3.
OP-TDLAS. The OP-TDLAS system, model CXL840 Mul-tipath LasIR, was manufactured by Unisearch Associates,Inc. The instrument is capable of measuring four separateanalytes along as many as eight optical paths. TheCXL840 consists of a hardware controller, a laptop com-puter, and eight separate launch/receive telescopes.Thoma et al.12 provide a detailed description of the in-strument and its deployment.
Four primary optical paths were used for this mea-surement. Two identical optical path pairs were config-ured along each side of the barn as shown in Figure 4. TheCXL840 telescopes were set up at the south end of thebarn. Retroreflector pairs were placed at the north end ofthe barn with the first retroreflector positioned before thefan bank (short path) and the second placed after the fanbank (long path), as shown in Figure 5. The short pathrepresents the inlet background concentration measure-ment for the configuration. The CXL840 produces a time-dependent measure of the average NH3 concentration foreach optical path in units of ppm. For a particular opticalpath, multiplication of the measured average concentra-tion by the optical path length yields the PIC in units ofppm m. To determine the mean NH3 concentration at theoutput plane for a given set of operating fans, the PIC forthe short optical path was first subtracted from PIC of thelong path. This result was then corrected to account forthe noncontributing length attributed to the nonoperat-ing fans and the space between fans. This correction as-sumes the average NH3 concentration measured on theshort path during the period or 10% of the mean NH3
concentration at the output plane, whichever is greater.Division of the corrected PIC then finally determined theaverage analyte concentration by the sum of operatingfan diameters.
Ventilation Rate DeterminationVentilation rate was determined from the building staticpressure differential, individual fan status (on/off), andindividual fan performance curves as determined for test-ing using a fan assessment numeration system (FANS)
Figure 5. Illustration of OP-TDLAS optical configuration and fans.
Figure 6. Fan characteristics of 1220-mm diameter fans in broiler house. Shaded bands indicateOP-FTIR monitoring periods.
Casey et al.
942 Journal of the Air & Waste Management Association Volume 60 August 2010
unit.13 Individual regression equations were developedfor each fan in the form
Vn � a �SP � bn (1)
where Vn is the airflow volume of fan n (m3 hr�1), an andbn are regression coefficients for fan n, and SP is the staticpressure differential (Pa). Summing the ventilation rate ateach fan for each minute and correcting to standard tem-perature and pressure determined the total building ven-tilation rate as follows:
V–
� �1
n
Vn �TSTP
T�
BPPSTP
(2)
where V–
is total building ventilation rate (m3 hr�1), T isthe building air temperature (K), BP is the local barometricpressure (hPa), and TSTP and PSTP are the temperature andpressure at standard conditions.
Fan Performance Characteristic DeterminationThe current fan performance characteristic of an installedfan was determined using a FANS unit. Details of theFANS unit’s design, performance specifications, and useare provided elsewhere.13–16 The FANS unit was used toevaluate each fan in all four of the broiler houses on this
site. It required approximately 1 hr to fully evaluate eachfan over a range of typical operating static pressure differ-ences; therefore, several trips to each farm were necessaryto fully characterize all four houses’ ventilation systems.
The individual regressions for the eight 1220-mmdiameter fans in house 1 are shown in Figure 6. It can beseen that considerable variation exists in performanceamong otherwise identical fans. A fan performance char-acteristic was also obtained from the fan manufacturer,Chore-Time Brock International.17 The manufacturer in-dicated that the fan model installed in the broiler houseswas now obsolete and had been replaced in their productline. They provided a fan performance characteristic for aclosely related fan that they stated best describes the fanmodel installed. This fan performance characteristic(38264-4822) is also shown in Figure 6.
ER DeterminationThe NH3 ER reported in this paper was the mass of NH3
emitted from the broiler houses to the atmosphere in aunit time period, calculated as
ER � CNH3 � V–
�MWNH3
MV(3)
where ER is the ER of NH3 (g hr�1), V is the buildingventilation rate (m3 hr�1), CNH3 is the concentration of
Figure 7. ER and house temperature during flock 6 monitoring period. Shaded bands indicateOP-FTIR monitoring periods.
Figure 8. NH3 concentration and ventilation rate during flock 6 monitoring period. Shaded bandsindicate OP-FTIR monitoring periods.
Casey et al.
Volume 60 August 2010 Journal of the Air & Waste Management Association 943
NH3 at the exhaust fan (ppm), MWNH3 is the molar massof NH3 (g mol�1), and MV is molar volume (m3 mol�1).
RESULTSFlock 6 Monitoring Period
In checking the zero and span of each of the four DragerPac III NH3 sensors after the experiment, it was noted thatthe span of one of the Pac III units when exposed tocalibration gas was outside of the quality assurance levelsset for the project. The data from this PMU were not usedin the analysis.
During this monitoring period in flock 6, the NH3 ERis shown in Figure 7, and the NH3 concentration in theexhaust air is shown in Figure 8. It can be seen that theNH3 concentration varied between 48 and 13 ppm duringthe total monitoring period, averaging 25 ppm. NH3 con-centrations were higher during the night when the ambi-ent temperature fell and hence the ventilation rate re-duced. Overall, the ER was similar or decreased slightlyfrom day to night.
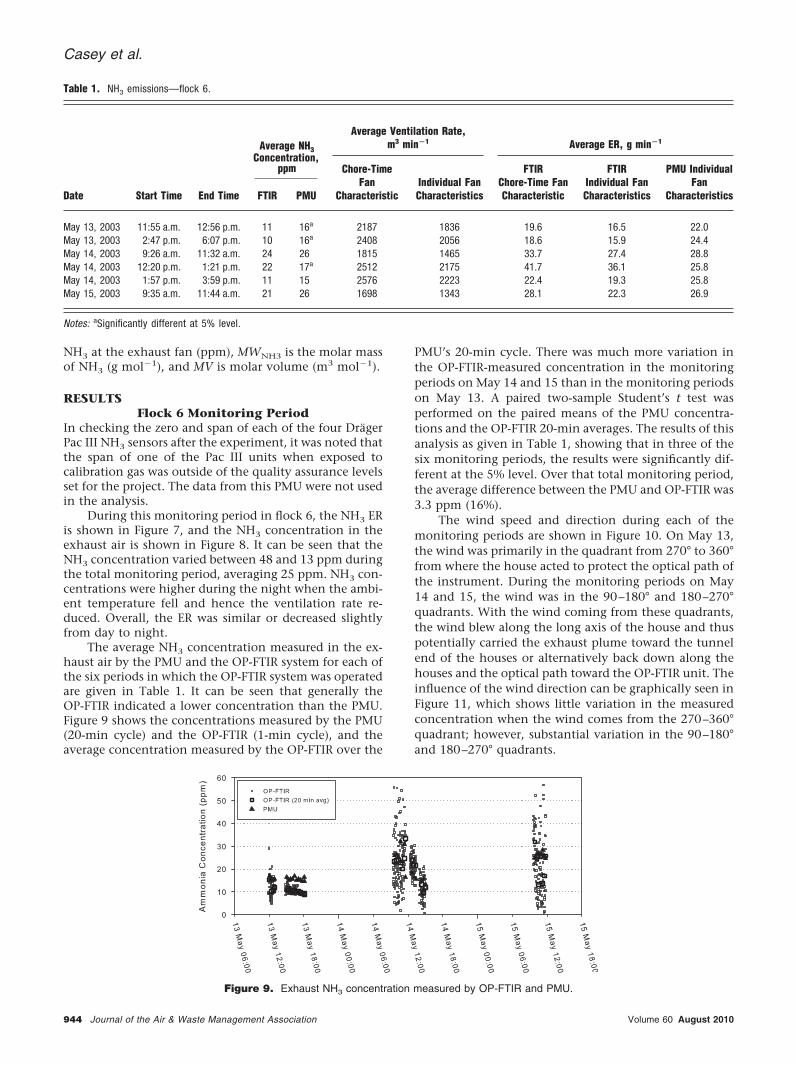
The average NH3 concentration measured in the ex-haust air by the PMU and the OP-FTIR system for each ofthe six periods in which the OP-FTIR system was operatedare given in Table 1. It can be seen that generally theOP-FTIR indicated a lower concentration than the PMU.Figure 9 shows the concentrations measured by the PMU(20-min cycle) and the OP-FTIR (1-min cycle), and theaverage concentration measured by the OP-FTIR over the
PMU’s 20-min cycle. There was much more variation inthe OP-FTIR-measured concentration in the monitoringperiods on May 14 and 15 than in the monitoring periodson May 13. A paired two-sample Student’s t test wasperformed on the paired means of the PMU concentra-tions and the OP-FTIR 20-min averages. The results of thisanalysis as given in Table 1, showing that in three of thesix monitoring periods, the results were significantly dif-ferent at the 5% level. Over that total monitoring period,the average difference between the PMU and OP-FTIR was3.3 ppm (16%).
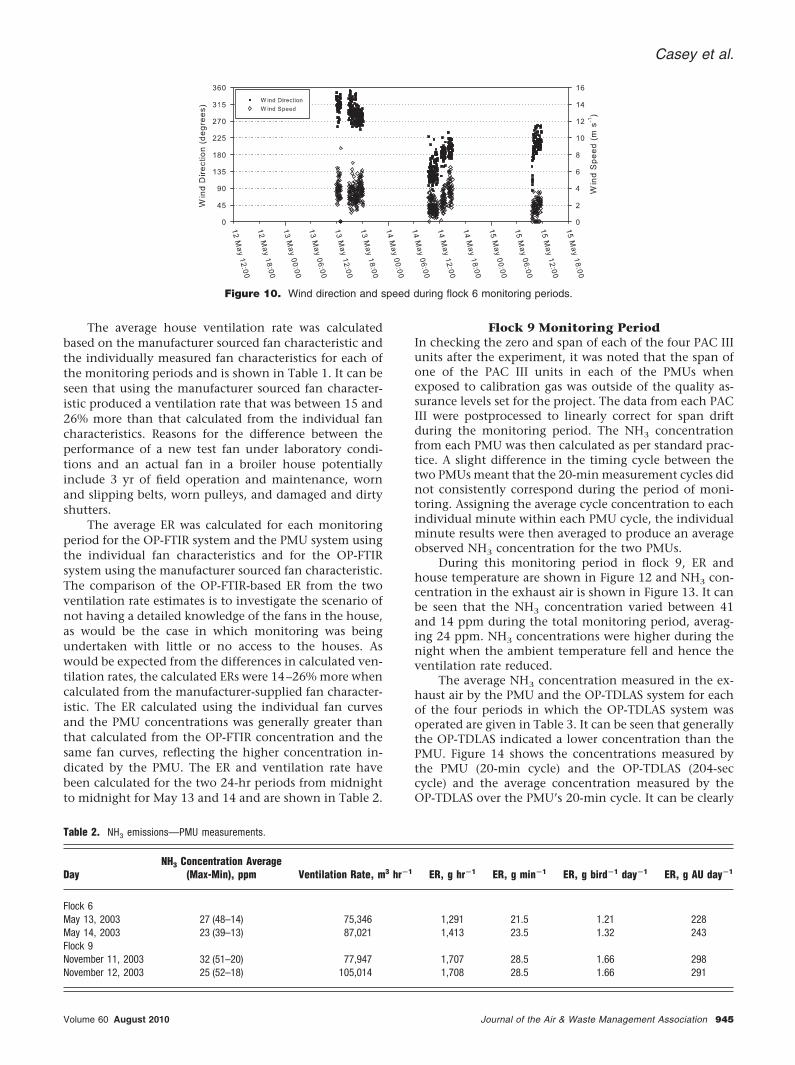
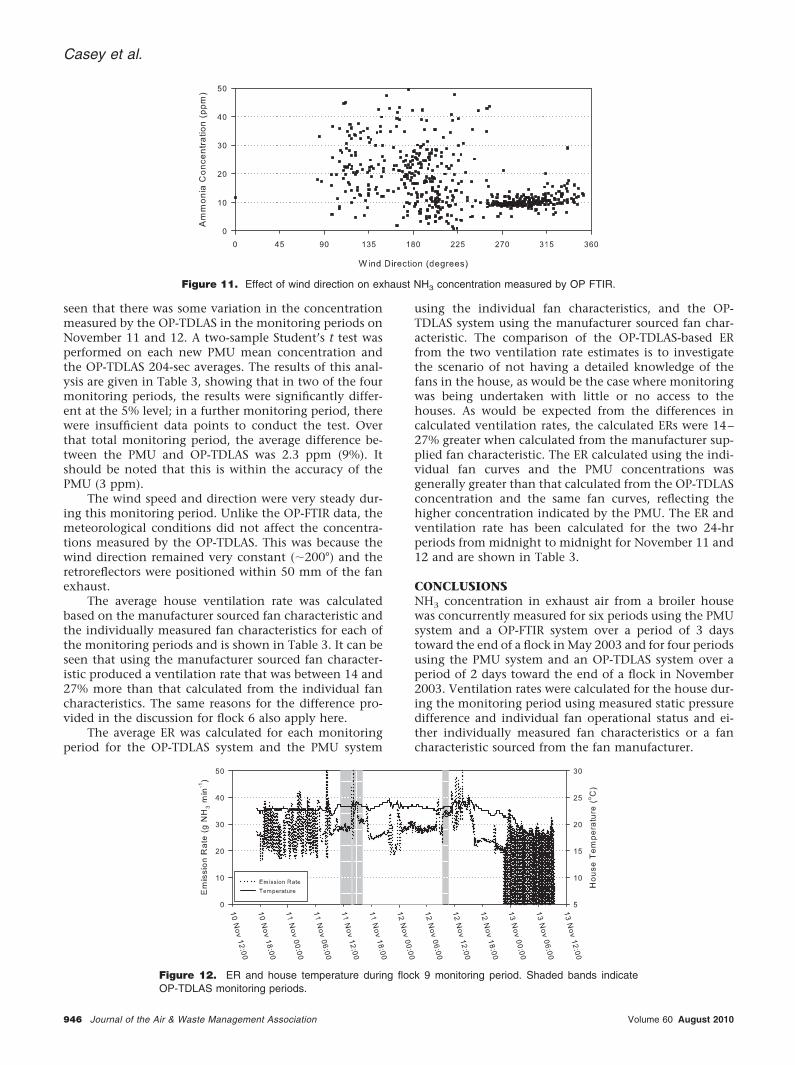
The wind speed and direction during each of themonitoring periods are shown in Figure 10. On May 13,the wind was primarily in the quadrant from 270° to 360°from where the house acted to protect the optical path ofthe instrument. During the monitoring periods on May14 and 15, the wind was in the 90–180° and 180–270°quadrants. With the wind coming from these quadrants,the wind blew along the long axis of the house and thuspotentially carried the exhaust plume toward the tunnelend of the houses or alternatively back down along thehouses and the optical path toward the OP-FTIR unit. Theinfluence of the wind direction can be graphically seen inFigure 11, which shows little variation in the measuredconcentration when the wind comes from the 270–360°quadrant; however, substantial variation in the 90–180°and 180–270° quadrants.
Figure 9. Exhaust NH3 concentration measured by OP-FTIR and PMU.
Table 1. NH3 emissions—flock 6.
Date Start Time End Time
Average NH3Concentration,
ppm
Average Ventilation Rate,m3 min�1 Average ER, g min�1
FTIR PMU
Chore-TimeFan
CharacteristicIndividual FanCharacteristics
FTIRChore-Time FanCharacteristic
FTIRIndividual FanCharacteristics
PMU IndividualFan
Characteristics
May 13, 2003 11:55 a.m. 12:56 p.m. 11 16a 2187 1836 19.6 16.5 22.0May 13, 2003 2:47 p.m. 6:07 p.m. 10 16a 2408 2056 18.6 15.9 24.4May 14, 2003 9:26 a.m. 11:32 a.m. 24 26 1815 1465 33.7 27.4 28.8May 14, 2003 12:20 p.m. 1:21 p.m. 22 17a 2512 2175 41.7 36.1 25.8May 14, 2003 1:57 p.m. 3:59 p.m. 11 15 2576 2223 22.4 19.3 25.8May 15, 2003 9:35 a.m. 11:44 a.m. 21 26 1698 1343 28.1 22.3 26.9
Notes: aSignificantly different at 5% level.
Casey et al.
944 Journal of the Air & Waste Management Association Volume 60 August 2010
The average house ventilation rate was calculatedbased on the manufacturer sourced fan characteristic andthe individually measured fan characteristics for each ofthe monitoring periods and is shown in Table 1. It can beseen that using the manufacturer sourced fan character-istic produced a ventilation rate that was between 15 and26% more than that calculated from the individual fancharacteristics. Reasons for the difference between theperformance of a new test fan under laboratory condi-tions and an actual fan in a broiler house potentiallyinclude 3 yr of field operation and maintenance, wornand slipping belts, worn pulleys, and damaged and dirtyshutters.
The average ER was calculated for each monitoringperiod for the OP-FTIR system and the PMU system usingthe individual fan characteristics and for the OP-FTIRsystem using the manufacturer sourced fan characteristic.The comparison of the OP-FTIR-based ER from the twoventilation rate estimates is to investigate the scenario ofnot having a detailed knowledge of the fans in the house,as would be the case in which monitoring was beingundertaken with little or no access to the houses. Aswould be expected from the differences in calculated ven-tilation rates, the calculated ERs were 14–26% more whencalculated from the manufacturer-supplied fan character-istic. The ER calculated using the individual fan curvesand the PMU concentrations was generally greater thanthat calculated from the OP-FTIR concentration and thesame fan curves, reflecting the higher concentration in-dicated by the PMU. The ER and ventilation rate havebeen calculated for the two 24-hr periods from midnightto midnight for May 13 and 14 and are shown in Table 2.
Flock 9 Monitoring PeriodIn checking the zero and span of each of the four PAC IIIunits after the experiment, it was noted that the span ofone of the PAC III units in each of the PMUs whenexposed to calibration gas was outside of the quality as-surance levels set for the project. The data from each PACIII were postprocessed to linearly correct for span driftduring the monitoring period. The NH3 concentrationfrom each PMU was then calculated as per standard prac-tice. A slight difference in the timing cycle between thetwo PMUs meant that the 20-min measurement cycles didnot consistently correspond during the period of moni-toring. Assigning the average cycle concentration to eachindividual minute within each PMU cycle, the individualminute results were then averaged to produce an averageobserved NH3 concentration for the two PMUs.
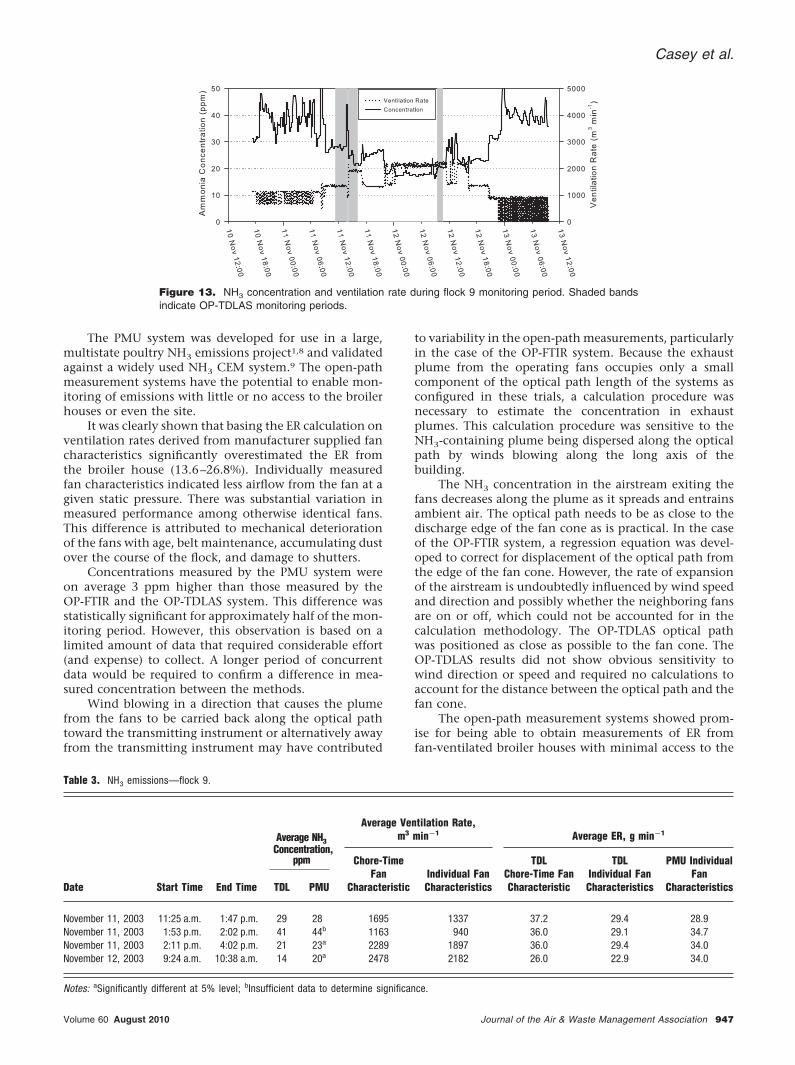
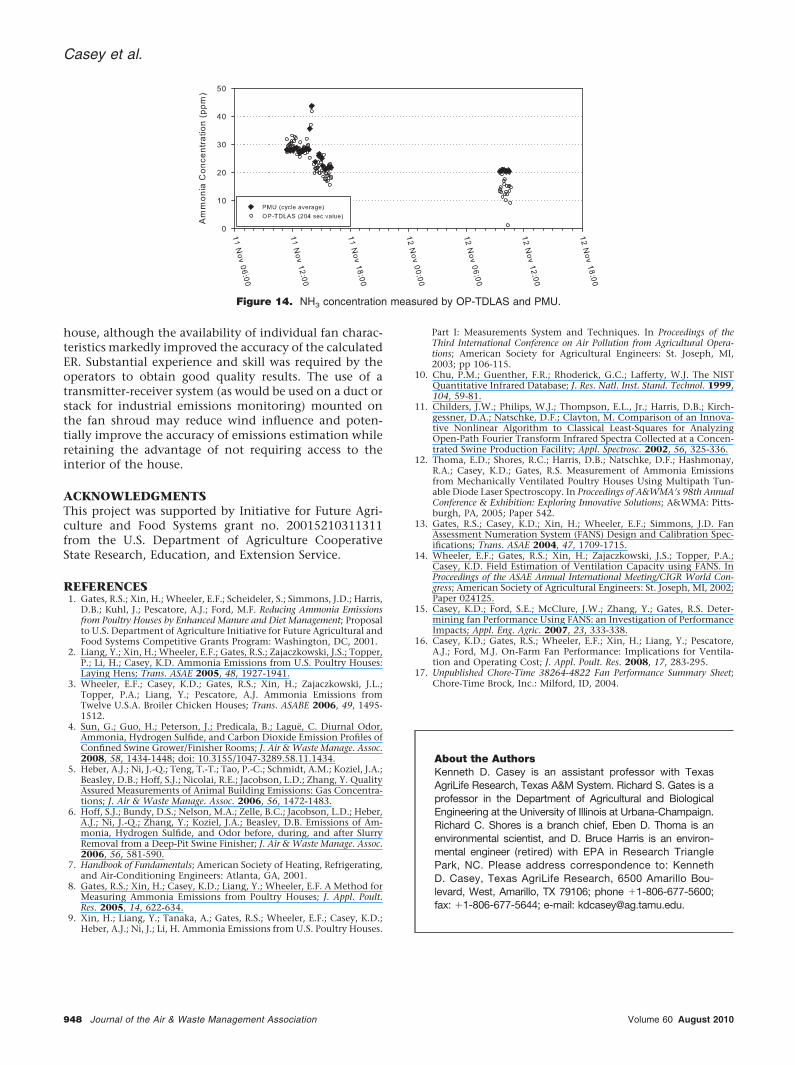
During this monitoring period in flock 9, ER andhouse temperature are shown in Figure 12 and NH3 con-centration in the exhaust air is shown in Figure 13. It canbe seen that the NH3 concentration varied between 41and 14 ppm during the total monitoring period, averag-ing 24 ppm. NH3 concentrations were higher during thenight when the ambient temperature fell and hence theventilation rate reduced.
The average NH3 concentration measured in the ex-haust air by the PMU and the OP-TDLAS system for eachof the four periods in which the OP-TDLAS system wasoperated are given in Table 3. It can be seen that generallythe OP-TDLAS indicated a lower concentration than thePMU. Figure 14 shows the concentrations measured bythe PMU (20-min cycle) and the OP-TDLAS (204-seccycle) and the average concentration measured by theOP-TDLAS over the PMU’s 20-min cycle. It can be clearly
Figure 10. Wind direction and speed during flock 6 monitoring periods.
Table 2. NH3 emissions—PMU measurements.
DayNH3 Concentration Average
(Max-Min), ppm Ventilation Rate, m3 hr�1 ER, g hr�1 ER, g min�1 ER, g bird�1 day�1 ER, g AU day�1
Flock 6May 13, 2003 27 (48–14) 75,346 1,291 21.5 1.21 228May 14, 2003 23 (39–13) 87,021 1,413 23.5 1.32 243Flock 9November 11, 2003 32 (51–20) 77,947 1,707 28.5 1.66 298November 12, 2003 25 (52–18) 105,014 1,708 28.5 1.66 291
Casey et al.
Volume 60 August 2010 Journal of the Air & Waste Management Association 945
seen that there was some variation in the concentrationmeasured by the OP-TDLAS in the monitoring periods onNovember 11 and 12. A two-sample Student’s t test wasperformed on each new PMU mean concentration andthe OP-TDLAS 204-sec averages. The results of this anal-ysis are given in Table 3, showing that in two of the fourmonitoring periods, the results were significantly differ-ent at the 5% level; in a further monitoring period, therewere insufficient data points to conduct the test. Overthat total monitoring period, the average difference be-tween the PMU and OP-TDLAS was 2.3 ppm (9%). Itshould be noted that this is within the accuracy of thePMU (3 ppm).
The wind speed and direction were very steady dur-ing this monitoring period. Unlike the OP-FTIR data, themeteorological conditions did not affect the concentra-tions measured by the OP-TDLAS. This was because thewind direction remained very constant (�200°) and theretroreflectors were positioned within 50 mm of the fanexhaust.
The average house ventilation rate was calculatedbased on the manufacturer sourced fan characteristic andthe individually measured fan characteristics for each ofthe monitoring periods and is shown in Table 3. It can beseen that using the manufacturer sourced fan character-istic produced a ventilation rate that was between 14 and27% more than that calculated from the individual fancharacteristics. The same reasons for the difference pro-vided in the discussion for flock 6 also apply here.
The average ER was calculated for each monitoringperiod for the OP-TDLAS system and the PMU system
using the individual fan characteristics, and the OP-TDLAS system using the manufacturer sourced fan char-acteristic. The comparison of the OP-TDLAS-based ERfrom the two ventilation rate estimates is to investigatethe scenario of not having a detailed knowledge of thefans in the house, as would be the case where monitoringwas being undertaken with little or no access to thehouses. As would be expected from the differences incalculated ventilation rates, the calculated ERs were 14–27% greater when calculated from the manufacturer sup-plied fan characteristic. The ER calculated using the indi-vidual fan curves and the PMU concentrations wasgenerally greater than that calculated from the OP-TDLASconcentration and the same fan curves, reflecting thehigher concentration indicated by the PMU. The ER andventilation rate has been calculated for the two 24-hrperiods from midnight to midnight for November 11 and12 and are shown in Table 3.
CONCLUSIONSNH3 concentration in exhaust air from a broiler housewas concurrently measured for six periods using the PMUsystem and a OP-FTIR system over a period of 3 daystoward the end of a flock in May 2003 and for four periodsusing the PMU system and an OP-TDLAS system over aperiod of 2 days toward the end of a flock in November2003. Ventilation rates were calculated for the house dur-ing the monitoring period using measured static pressuredifference and individual fan operational status and ei-ther individually measured fan characteristics or a fancharacteristic sourced from the fan manufacturer.
Figure 11. Effect of wind direction on exhaust NH3 concentration measured by OP FTIR.
Figure 12. ER and house temperature during flock 9 monitoring period. Shaded bands indicateOP-TDLAS monitoring periods.
Casey et al.
946 Journal of the Air & Waste Management Association Volume 60 August 2010
The PMU system was developed for use in a large,multistate poultry NH3 emissions project1,8 and validatedagainst a widely used NH3 CEM system.9 The open-pathmeasurement systems have the potential to enable mon-itoring of emissions with little or no access to the broilerhouses or even the site.
It was clearly shown that basing the ER calculation onventilation rates derived from manufacturer supplied fancharacteristics significantly overestimated the ER fromthe broiler house (13.6–26.8%). Individually measuredfan characteristics indicated less airflow from the fan at agiven static pressure. There was substantial variation inmeasured performance among otherwise identical fans.This difference is attributed to mechanical deteriorationof the fans with age, belt maintenance, accumulating dustover the course of the flock, and damage to shutters.
Concentrations measured by the PMU system wereon average 3 ppm higher than those measured by theOP-FTIR and the OP-TDLAS system. This difference wasstatistically significant for approximately half of the mon-itoring period. However, this observation is based on alimited amount of data that required considerable effort(and expense) to collect. A longer period of concurrentdata would be required to confirm a difference in mea-sured concentration between the methods.
Wind blowing in a direction that causes the plumefrom the fans to be carried back along the optical pathtoward the transmitting instrument or alternatively awayfrom the transmitting instrument may have contributed
to variability in the open-path measurements, particularlyin the case of the OP-FTIR system. Because the exhaustplume from the operating fans occupies only a smallcomponent of the optical path length of the systems asconfigured in these trials, a calculation procedure wasnecessary to estimate the concentration in exhaustplumes. This calculation procedure was sensitive to theNH3-containing plume being dispersed along the opticalpath by winds blowing along the long axis of thebuilding.
The NH3 concentration in the airstream exiting thefans decreases along the plume as it spreads and entrainsambient air. The optical path needs to be as close to thedischarge edge of the fan cone as is practical. In the caseof the OP-FTIR system, a regression equation was devel-oped to correct for displacement of the optical path fromthe edge of the fan cone. However, the rate of expansionof the airstream is undoubtedly influenced by wind speedand direction and possibly whether the neighboring fansare on or off, which could not be accounted for in thecalculation methodology. The OP-TDLAS optical pathwas positioned as close as possible to the fan cone. TheOP-TDLAS results did not show obvious sensitivity towind direction or speed and required no calculations toaccount for the distance between the optical path and thefan cone.
The open-path measurement systems showed prom-ise for being able to obtain measurements of ER fromfan-ventilated broiler houses with minimal access to the
Figure 13. NH3 concentration and ventilation rate during flock 9 monitoring period. Shaded bandsindicate OP-TDLAS monitoring periods.
Table 3. NH3 emissions—flock 9.
Date Start Time End Time
Average NH3Concentration,
ppm
Average Ventilation Rate,m3 min�1 Average ER, g min�1
TDL PMU
Chore-TimeFan
CharacteristicIndividual FanCharacteristics
TDLChore-Time FanCharacteristic
TDLIndividual FanCharacteristics
PMU IndividualFan
Characteristics
November 11, 2003 11:25 a.m. 1:47 p.m. 29 28 1695 1337 37.2 29.4 28.9November 11, 2003 1:53 p.m. 2:02 p.m. 41 44b 1163 940 36.0 29.1 34.7November 11, 2003 2:11 p.m. 4:02 p.m. 21 23a 2289 1897 36.0 29.4 34.0November 12, 2003 9:24 a.m. 10:38 a.m. 14 20a 2478 2182 26.0 22.9 34.0
Notes: aSignificantly different at 5% level; bInsufficient data to determine significance.
Casey et al.
Volume 60 August 2010 Journal of the Air & Waste Management Association 947
house, although the availability of individual fan charac-teristics markedly improved the accuracy of the calculatedER. Substantial experience and skill was required by theoperators to obtain good quality results. The use of atransmitter-receiver system (as would be used on a duct orstack for industrial emissions monitoring) mounted onthe fan shroud may reduce wind influence and poten-tially improve the accuracy of emissions estimation whileretaining the advantage of not requiring access to theinterior of the house.
ACKNOWLEDGMENTSThis project was supported by Initiative for Future Agri-culture and Food Systems grant no. 20015210311311from the U.S. Department of Agriculture CooperativeState Research, Education, and Extension Service.
REFERENCES1. Gates, R.S.; Xin, H.; Wheeler, E.F.; Scheideler, S.; Simmons, J.D.; Harris,
D.B.; Kuhl, J.; Pescatore, A.J.; Ford, M.F. Reducing Ammonia Emissionsfrom Poultry Houses by Enhanced Manure and Diet Management; Proposalto U.S. Department of Agriculture Initiative for Future Agricultural andFood Systems Competitive Grants Program: Washington, DC, 2001.
2. Liang, Y.; Xin, H.; Wheeler, E.F.; Gates, R.S.; Zajaczkowski, J.S.; Topper,P.; Li, H.; Casey, K.D. Ammonia Emissions from U.S. Poultry Houses:Laying Hens; Trans. ASAE 2005, 48, 1927-1941.
3. Wheeler, E.F.; Casey, K.D.; Gates, R.S.; Xin, H.; Zajaczkowski, J.L.;Topper, P.A.; Liang, Y.; Pescatore, A.J. Ammonia Emissions fromTwelve U.S.A. Broiler Chicken Houses; Trans. ASABE 2006, 49, 1495-1512.
4. Sun, G.; Guo, H.; Peterson, J.; Predicala, B.; Lague, C. Diurnal Odor,Ammonia, Hydrogen Sulfide, and Carbon Dioxide Emission Profiles ofConfined Swine Grower/Finisher Rooms; J. Air & Waste Manage. Assoc.2008, 58, 1434-1448; doi: 10.3155/1047-3289.58.11.1434.
5. Heber, A.J.; Ni, J.-Q.; Teng, T.-T.; Tao, P.-C.; Schmidt, A.M.; Koziel, J.A.;Beasley, D.B.; Hoff, S.J.; Nicolai, R.E.; Jacobson, L.D.; Zhang, Y. QualityAssured Measurements of Animal Building Emissions: Gas Concentra-tions; J. Air & Waste Manage. Assoc. 2006, 56, 1472-1483.
6. Hoff, S.J.; Bundy, D.S.; Nelson, M.A.; Zelle, B.C.; Jacobson, L.D.; Heber,A.J.; Ni, J.-Q.; Zhang, Y.; Koziel, J.A.; Beasley, D.B. Emissions of Am-monia, Hydrogen Sulfide, and Odor before, during, and after SlurryRemoval from a Deep-Pit Swine Finisher; J. Air & Waste Manage. Assoc.2006, 56, 581-590.
7. Handbook of Fundamentals; American Society of Heating, Refrigerating,and Air-Conditioning Engineers: Atlanta, GA, 2001.
8. Gates, R.S.; Xin, H.; Casey, K.D.; Liang, Y.; Wheeler, E.F. A Method forMeasuring Ammonia Emissions from Poultry Houses; J. Appl. Poult.Res. 2005, 14, 622-634.
9. Xin, H.; Liang, Y.; Tanaka, A.; Gates, R.S.; Wheeler, E.F.; Casey, K.D.;Heber, A.J.; Ni, J.; Li, H. Ammonia Emissions from U.S. Poultry Houses.
Part I: Measurements System and Techniques. In Proceedings of theThird International Conference on Air Pollution from Agricultural Opera-tions; American Society for Agricultural Engineers: St. Joseph, MI,2003; pp 106-115.
10. Chu, P.M.; Guenther, F.R.; Rhoderick, G.C.; Lafferty, W.J. The NISTQuantitative Infrared Database; J. Res. Natl. Inst. Stand. Technol. 1999,104, 59-81.
11. Childers, J.W.; Philips, W.J.; Thompson, E.L., Jr.; Harris, D.B.; Kirch-gessner, D.A.; Natschke, D.F.; Clayton, M. Comparison of an Innova-tive Nonlinear Algorithm to Classical Least-Squares for AnalyzingOpen-Path Fourier Transform Infrared Spectra Collected at a Concen-trated Swine Production Facility; Appl. Spectrosc. 2002, 56, 325-336.
12. Thoma, E.D.; Shores, R.C.; Harris, D.B.; Natschke, D.F.; Hashmonay,R.A.; Casey, K.D.; Gates, R.S. Measurement of Ammonia Emissionsfrom Mechanically Ventilated Poultry Houses Using Multipath Tun-able Diode Laser Spectroscopy. In Proceedings of A&WMA’s 98th AnnualConference & Exhibition: Exploring Innovative Solutions; A&WMA: Pitts-burgh, PA, 2005; Paper 542.
13. Gates, R.S.; Casey, K.D.; Xin, H.; Wheeler, E.F.; Simmons, J.D. FanAssessment Numeration System (FANS) Design and Calibration Spec-ifications; Trans. ASAE 2004, 47, 1709-1715.
14. Wheeler, E.F.; Gates, R.S.; Xin, H.; Zajaczkowski, J.S.; Topper, P.A.;Casey, K.D. Field Estimation of Ventilation Capacity using FANS. InProceedings of the ASAE Annual International Meeting/CIGR World Con-gress; American Society of Agricultural Engineers: St. Joseph, MI, 2002;Paper 024125.
15. Casey, K.D.; Ford, S.E.; McClure, J.W.; Zhang, Y.; Gates, R.S. Deter-mining fan Performance Using FANS: an Investigation of PerformanceImpacts; Appl. Eng. Agric. 2007, 23, 333-338.
16. Casey, K.D.; Gates, R.S.; Wheeler, E.F.; Xin, H.; Liang, Y.; Pescatore,A.J.; Ford, M.J. On-Farm Fan Performance: Implications for Ventila-tion and Operating Cost; J. Appl. Poult. Res. 2008, 17, 283-295.
17. Unpublished Chore-Time 38264-4822 Fan Performance Summary Sheet;Chore-Time Brock, Inc.: Milford, ID, 2004.
About the AuthorsKenneth D. Casey is an assistant professor with TexasAgriLife Research, Texas A&M System. Richard S. Gates is aprofessor in the Department of Agricultural and BiologicalEngineering at the University of Illinois at Urbana-Champaign.Richard C. Shores is a branch chief, Eben D. Thoma is anenvironmental scientist, and D. Bruce Harris is an environ-mental engineer (retired) with EPA in Research TrianglePark, NC. Please address correspondence to: KennethD. Casey, Texas AgriLife Research, 6500 Amarillo Bou-levard, West, Amarillo, TX 79106; phone �1-806-677-5600;fax: �1-806-677-5644; e-mail: [email protected].
Figure 14. NH3 concentration measured by OP-TDLAS and PMU.
Casey et al.
948 Journal of the Air & Waste Management Association Volume 60 August 2010