Application Notes for configuring AMC Technology's Contact ...
Upload
kanpuruniversityCategory
view
0download
0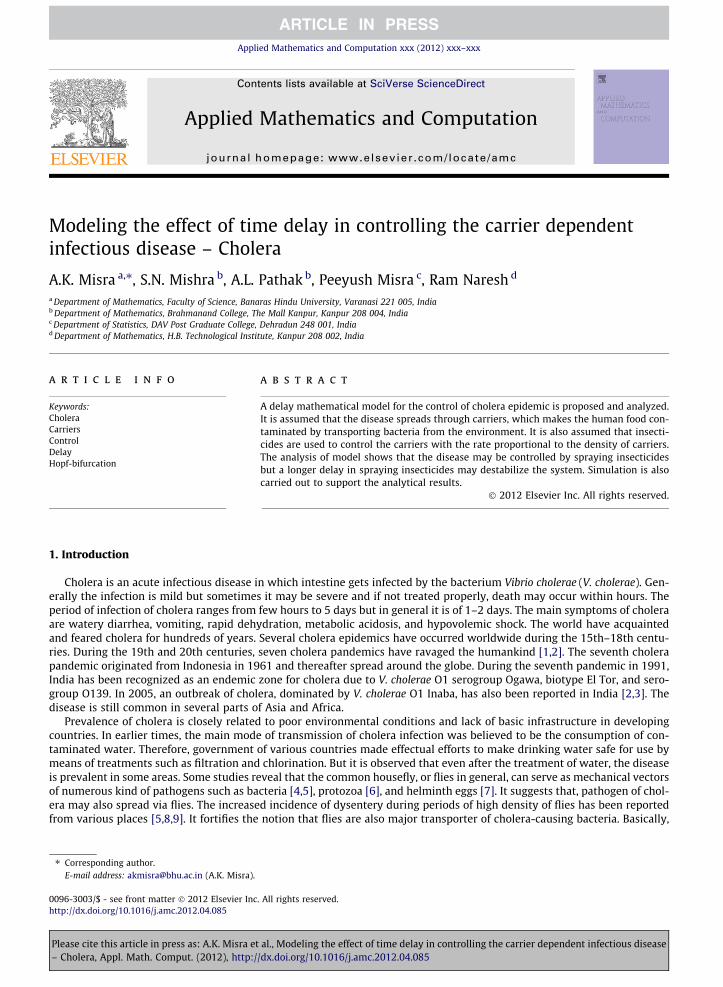
Applied Mathematics and Computation xxx (2012) xxx–xxx
Contents lists available at SciVerse ScienceDirect
Applied Mathematics and Computation
journal homepage: www.elsevier .com/ locate/amc
Modeling the effect of time delay in controlling the carrier dependentinfectious disease – Cholera
A.K. Misra a,⇑, S.N. Mishra b, A.L. Pathak b, Peeyush Misra c, Ram Naresh d
a Department of Mathematics, Faculty of Science, Banaras Hindu University, Varanasi 221 005, Indiab Department of Mathematics, Brahmanand College, The Mall Kanpur, Kanpur 208 004, Indiac Department of Statistics, DAV Post Graduate College, Dehradun 248 001, Indiad Department of Mathematics, H.B. Technological Institute, Kanpur 208 002, India
a r t i c l e i n f o a b s t r a c t
Keywords:CholeraCarriersControlDelayHopf-bifurcation
0096-3003/$ - see front matter � 2012 Elsevier Inchttp://dx.doi.org/10.1016/j.amc.2012.04.085
⇑ Corresponding author.E-mail address: [email protected] (A.K. Misra).
Please cite this article in press as: A.K. Misra et– Cholera, Appl. Math. Comput. (2012), http:/
A delay mathematical model for the control of cholera epidemic is proposed and analyzed.It is assumed that the disease spreads through carriers, which makes the human food con-taminated by transporting bacteria from the environment. It is also assumed that insecti-cides are used to control the carriers with the rate proportional to the density of carriers.The analysis of model shows that the disease may be controlled by spraying insecticidesbut a longer delay in spraying insecticides may destabilize the system. Simulation is alsocarried out to support the analytical results.
� 2012 Elsevier Inc. All rights reserved.
1. Introduction
Cholera is an acute infectious disease in which intestine gets infected by the bacterium Vibrio cholerae (V. cholerae). Gen-erally the infection is mild but sometimes it may be severe and if not treated properly, death may occur within hours. Theperiod of infection of cholera ranges from few hours to 5 days but in general it is of 1–2 days. The main symptoms of choleraare watery diarrhea, vomiting, rapid dehydration, metabolic acidosis, and hypovolemic shock. The world have acquaintedand feared cholera for hundreds of years. Several cholera epidemics have occurred worldwide during the 15th–18th centu-ries. During the 19th and 20th centuries, seven cholera pandemics have ravaged the humankind [1,2]. The seventh cholerapandemic originated from Indonesia in 1961 and thereafter spread around the globe. During the seventh pandemic in 1991,India has been recognized as an endemic zone for cholera due to V. cholerae O1 serogroup Ogawa, biotype El Tor, and sero-group O139. In 2005, an outbreak of cholera, dominated by V. cholerae O1 Inaba, has also been reported in India [2,3]. Thedisease is still common in several parts of Asia and Africa.
Prevalence of cholera is closely related to poor environmental conditions and lack of basic infrastructure in developingcountries. In earlier times, the main mode of transmission of cholera infection was believed to be the consumption of con-taminated water. Therefore, government of various countries made effectual efforts to make drinking water safe for use bymeans of treatments such as filtration and chlorination. But it is observed that even after the treatment of water, the diseaseis prevalent in some areas. Some studies reveal that the common housefly, or flies in general, can serve as mechanical vectorsof numerous kind of pathogens such as bacteria [4,5], protozoa [6], and helminth eggs [7]. It suggests that, pathogen of chol-era may also spread via flies. The increased incidence of dysentery during periods of high density of flies has been reportedfrom various places [5,8,9]. It fortifies the notion that flies are also major transporter of cholera-causing bacteria. Basically,
. All rights reserved.
al., Modeling the effect of time delay in controlling the carrier dependent infectious disease/dx.doi.org/10.1016/j.amc.2012.04.085

2 A.K. Misra et al. / Applied Mathematics and Computation xxx (2012) xxx–xxx
the flies transport the bacteria responsible for cholera disease to the human food and make it contaminated [10,11]. Due tothe uptake of this contaminated food, people acquire cholera infection [1,12].
In addition to cholera, there are diseases like typhoid fever and other enteric diseases, which spread in human populationthrough carriers. Most of the developing countries are affected by such diseases due to lack of sanitation and wide occur-rence of carriers. Various studies have been conducted to understand the role of carriers (e.g., flies, ticks, mites, etc.) and bac-teria in the spread of infectious diseases [12–27]. In particular, Hethcote [19] studied a nonlinear mathematical model forcommunicable diseases by assuming that the carrier population is constant. But, in general the carrier population is not con-stant and it depends on various environmental factors, like humidity, temperature, etc. Some human-related activities likedischarge of household wastes, open sewage drainage, industrial effluents in residential areas, open water storage tanks,ponds, etc., also enhance the growth of carriers. The role of human-related activities on the growth of carrier populationhas been studied explicitly by some modelers [20–23,25]. Singh et al. [23] proposed and analyzed SIS and SIRS mathematicalmodels for the spread of carrier dependent infectious diseases by assuming that the growth rate and carrying capacity ofcarrier population are increasing function of total human population density. They have shown that the number of infectivesincreases as the human-related activities, which makes the environment more conducive for the growth of carriers, increase.Codeco [24] also studied a mathematical model for cholera epidemic by incorporating the role of environmental reservoirs.In this study, the minimum number of conditions for the development of endemicity of cholera have been derived and thepersistence of cholera is also discussed. For cholera epidemic it is found that by controlling the environmental fluctuationsthe severity of the disease can be managed [25].
Although commendable studies have been conducted to explore the role of carriers in the spread of infectious diseases, alittle attention is paid to their control. An efficient way to control the spread of carrier dependent infectious diseases may bevaccination of susceptibles [27]. As the spread of diarrheal diseases is closely related to the seasonal increase in abundance offlies, their control helps in declining the cases of enteric diseases. Therefore, generally government uses insecticides, in par-ticular DDT, to control the flies in the environment during cholera outbreaks. But the excessive use of insecticides is harmfulfor plants and human health, so some people called ‘trained squads’ are especially trained to perform the fly control in a re-gion. These trained squads are employed by the government to spray DDT in houses as well as in other relevant areas and theamount of insecticides used in fly control depends on the density of carriers [28].
As discussed above, the control of carrier population may be an effective tool for controlling the spread of carrier depen-dent infectious diseases, especially cholera. So we have concentrated our study on spread of cholera disease due to consump-tion of food contaminated by carriers present in the environment. Therefore, in this paper, we propose and analyze amathematical model for the control of cholera disease by controlling the density of carrier population using insecticides.The density of carrier population known to the trained squads may be few days old, thus the rate of change of concentrationof insecticides is assumed to be proportional to that density of carrier population, which leads for incorporation of time delayin the rate of spray of insecticides. Furthermore, some amount of insecticides may washout with the passage of time and somemay be consumed by the carriers. Hence, the depletion of insecticides has also been considered in the modeling process.
2. Mathematical model
Cholera does not spread directly from one person to another, therefore the casual contacts with an infected person is not arisk for getting infection [29]. Hence, in the modeling process, it is assumed that susceptibles get infected due to the presenceof carriers, which contaminate the food. It is also assumed that the carriers grow logistically in their natural environment andhuman-related activities further enhance their growth rate. We consider that the growth rate of carriers is controlled byspraying insecticides with a rate proportional to the density of carriers, s time before.
Let NðtÞ be the total human population at any time t, which is divided into two subclasses, namely (i) susceptible classXðtÞ and (ii) infective class YðtÞ. Let CðtÞ and ChðtÞ represent the density of carrier population and the concentration of insec-ticides respectively at time t. It is assumed that the rate of introduction of insecticides is proportional to Cðt � sÞ and its nat-ural depletion rate is proportional to its concentration. It is also assumed that the depletion rate of insecticides due to itsuptake by carriers is proportional to the density of carriers as well as the concentration of insecticides. The decline rateof carrier population due to uptake of insecticides is also taken to be proportional to the density of carriers and the concen-tration of insecticides.
With the above considerations, the model dynamics is governed by the following system of nonlinear delay differentialequations:
Please– Cho
dXðtÞdt¼ A� kXðtÞCðtÞ � dXðtÞ þ mYðtÞ;
dYðtÞdt¼ kXðtÞCðtÞ � ðmþ aþ dÞYðtÞ;
dCðtÞdt¼ rCðtÞ 1� CðtÞ
K
� �� s1CðtÞ þ r1NðtÞCðtÞ � h2CðtÞChðtÞ;
dChðtÞdt
¼ hCðt � sÞ � h0ChðtÞ � h1CðtÞChðtÞ;
ð1Þ
cite this article in press as: A.K. Misra et al., Modeling the effect of time delay in controlling the carrier dependent infectious diseaselera, Appl. Math. Comput. (2012), http://dx.doi.org/10.1016/j.amc.2012.04.085

A.K. Misra et al. / Applied Mathematics and Computation xxx (2012) xxx–xxx 3
where XðtÞ þ YðtÞ ¼ NðtÞ and the initial conditions are given as follows:Xð0Þ ¼ X0 > 0; Yð0Þ ¼ Y0 P 0; CðcÞ ¼ C0 > 0 for c 2 ½�s;0�; Chð0Þ ¼ Ch0 P 0 and Xð0Þ þ Yð0Þ ¼ Nð0Þ ¼ N0 > 0.In the above model system (1), A is a constant immigration rate of human population in the region under consideration
and constant k represents the transmission rate of infection due to the presence of carriers in the environment. The constantsd, a and m represent the natural mortality rate, the disease-induced death rate and the recovery rate of human population,respectively. The constants r and K represent the intrinsic growth rate and carrying capacity of carrier population respec-tively in absence of human-related activities. The constant r1 represents the growth rate coefficient of carriers due to hu-man-related activities. Constants s1 and h2 represent decline rates of carrier population density due to natural causes andinsecticides respectively. The proportionality constants h; h0 and h1 represent the spraying rate, natural decay rate and decayrate due to uptake by carriers of the insecticides respectively. All the above constants are assumed to be positive.
Using the fact that XðtÞ þ YðtÞ ¼ NðtÞ, the above model system (1) reduces to the following system:
Please– Cho
dYðtÞdt¼ kðNðtÞ � YðtÞÞCðtÞ � ðmþ aþ dÞYðtÞ;
dNðtÞdt¼ A� dNðtÞ � aYðtÞ;
dCðtÞdt¼ rCðtÞ 1� CðtÞ
K
� �� s1CðtÞ þ r1NðtÞCðtÞ � h2CðtÞChðtÞ;
dChðtÞdt
¼ hCðt � sÞ � h0ChðtÞ � h1CðtÞChðtÞ:
ð2Þ
As the study of model system (1) is equivalent to the study of model system (2), thus we study model system (2). In thefollowing, we analyze the model system (2) using stability theory of delay differential equations. For the solutions of modelsystem (2), the region of attraction [23,30] is given by the set:
X ¼ ðY;N;C;ChÞ : 0 6 Y 6 N 6Ad; 0 6 C 6 Rd; 0 6 Ch 6
hh0
Rd
� �; ð3Þ
where Rd ¼ Kr r þ r1
Ad
� �and attracts all solutions initiating in the interior of the positive orthant.
3. Equilibrium analysis
The model system (2) has the following two non-negative equilibria, as follows:
(i) The disease-free equilibrium E0ð0;A=d;0;0Þ, which always exist, and(ii) The endemic equilibrium E1ðY�;N�;C�;C�hÞ, exists under a condition.
The existence of E0 is obvious. In the following, we show the existence of endemic equilibrium E1. The endemic equilib-rium E1 may be obtained by solving the following set of algebraic equations:
kðN � YÞC � ðmþ aþ dÞY ¼ 0; ð4Þ
A� dN � aY ¼ 0; ð5Þ
r 1� CK
� �� s1 þ r1N � h2Ch ¼ 0; ð6Þ
hC � h0Ch � h1CCh ¼ 0: ð7Þ
Now using Eq. (5) in Eq. (4), we get the following equation in Y and C
ðA� ðaþ dÞYÞkC � dðmþ aþ dÞY ¼ 0: ð8Þ
From Eq. (8) we have
Y ¼ kACkðaþ dÞC þ dðmþ aþ dÞ : ð9Þ
Again using Eqs. (5) and (7) in Eq. (6), we get another equation in Y and C as follows:
r 1� CK
� �� s1 þ r1
A� aYd
� �� hh2C
h0 þ h1C¼ 0: ð10Þ
Now using the value of Y from Eq. (9) in Eq. (10), we get the following equation in C
cite this article in press as: A.K. Misra et al., Modeling the effect of time delay in controlling the carrier dependent infectious diseaselera, Appl. Math. Comput. (2012), http://dx.doi.org/10.1016/j.amc.2012.04.085
4 A.K. Misra et al. / Applied Mathematics and Computation xxx (2012) xxx–xxx
Please– Cho
f ðCÞ ¼ r 1� CK
� �� s1 þ
r1Ad� r1a
dkAC
kðaþ dÞC þ dðmþ aþ dÞ �hh2C
h0 þ h1C¼ 0; ð11Þ
From the above Eq. (11), we may easily note that
(i) f ð0Þ ¼ r � s1 þ r1Ad , which is positive provided
r þ r1Ad
> s1; ð12Þ
(ii) f ðRdÞ is negative, and(iii) f 0ðCÞ is negative.
The above points (i), (ii) and (iii) imply that there exits a unique positive root (say, C�) of Eq. (11) in the interval ð0;RdÞ pro-vided condition (12) is satisfied.Thus, using this positive value of Cð¼ C�Þ in Eq. (9), we get positive value of Yð¼ Y�Þ. Finally using these values of Y� and C� inEqs. (5) and (7) respectively, we get the positive values of N� and C�h. Thus the equilibrium E1ðY�;N�;C�;C�hÞ exists providedcondition (12) is satisfied.
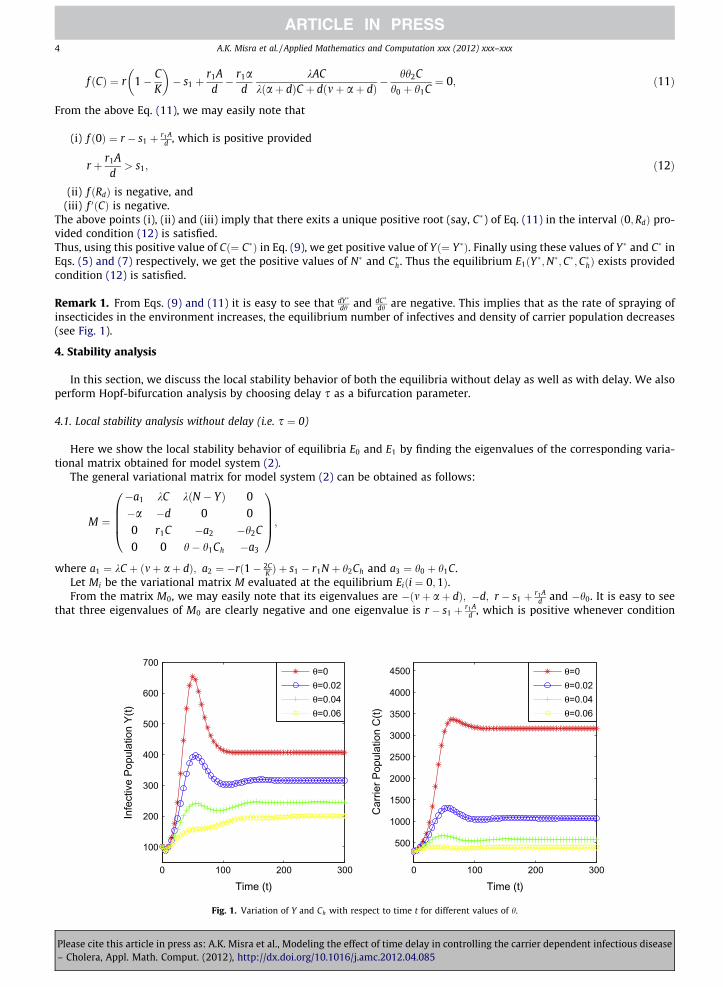
Remark 1. From Eqs. (9) and (11) it is easy to see that dY�
dh and dC�
dh are negative. This implies that as the rate of spraying ofinsecticides in the environment increases, the equilibrium number of infectives and density of carrier population decreases(see Fig. 1).
4. Stability analysis
In this section, we discuss the local stability behavior of both the equilibria without delay as well as with delay. We alsoperform Hopf-bifurcation analysis by choosing delay s as a bifurcation parameter.
4.1. Local stability analysis without delay (i.e. s ¼ 0)
Here we show the local stability behavior of equilibria E0 and E1 by finding the eigenvalues of the corresponding varia-tional matrix obtained for model system (2).
The general variational matrix for model system (2) can be obtained as follows:
M ¼
�a1 kC kðN � YÞ 0�a �d 0 00 r1C �a2 �h2C
0 0 h� h1Ch �a3
0BBB@
1CCCA;
where a1 ¼ kC þ ðmþ aþ dÞ; a2 ¼ �rð1� 2CK Þ þ s1 � r1N þ h2Ch and a3 ¼ h0 þ h1C.
Let Mi be the variational matrix M evaluated at the equilibrium Eiði ¼ 0;1Þ.From the matrix M0, we may easily note that its eigenvalues are �ðmþ aþ dÞ; �d; r � s1 þ r1A
d and �h0. It is easy to seethat three eigenvalues of M0 are clearly negative and one eigenvalue is r � s1 þ r1A
d , which is positive whenever condition
0 100 200 300
100
200
300
400
500
600
700
Time (t)
Infe
ctiv
e Po
pula
tion
Y(t)
0 100 200 300
500
1000
1500
2000
2500
3000
3500
4000
4500
Time (t)
Car
rier P
opul
atio
n C
(t)
θ=0θ=0.02θ=0.04θ=0.06
θ=0θ=0.02θ=0.04θ=0.06
Fig. 1. Variation of Y and Ch with respect to time t for different values of h.
cite this article in press as: A.K. Misra et al., Modeling the effect of time delay in controlling the carrier dependent infectious diseaselera, Appl. Math. Comput. (2012), http://dx.doi.org/10.1016/j.amc.2012.04.085

A.K. Misra et al. / Applied Mathematics and Computation xxx (2012) xxx–xxx 5
(12) is satisfied. Thus the equilibrium E0 has always stable manifold locally in Y � N � Ch space and unstable manifold locallyin C-direction whenever endemic equilibrium E1 exists.
Now we study the local stability behavior of endemic equilibrium E1 by using Routh–Hurwitz criterion.The characteristic equation for the matrix M1 is given by the following equation
Please– Cho
U4 þ p1U3 þ p2U
2 þ p3Uþ p4 ¼ 0; ð13Þ
where
p1 ¼ a�1 þ dþ a�2 þ a�3;
p2 ¼ ða�1 þ dÞða�2 þ a�3Þ þ a�1dþ a�2a�3 þ akC� þ h0h2C�h;
p3 ¼ akC�ða�2 þ a�3Þ þ a�1dða�2 þ a�3Þ þ kr1aC�ðN� � Y�Þ þ ða�1 þ dÞða�2a�3 þ h0h2C�hÞ
and p4 ¼ ða�1dþ akC�Þða�2a�3 þ h0h2C�hÞ þ kr1aa�3C�ðN� � Y�Þ.In writing the above values of pi’s, we have used the fact that h� h1C�h ¼
h0C�hC� . Now here we note that
a�1 ¼kN�
Y�> 0; a�2 ¼
rC�
K> 0 and a�3 ¼ h0 þ h1C� > 0:
Thus, it is clear that all pi’s are positive. Now for the local stability of endemic equilibrium E1ðY�;N�;C�;C�hÞ of model system(2) without delay, we have the following result.
Theorem 1. The equilibrium E1ðY�;N�;C�;C�hÞ if exists, is locally asymptotically stable for s ¼ 0 iff the following condition issatisfied:
p3ðp1p2 � p3Þ � p21p4 > 0; ð14Þ
where p1; p2; p3 and p4 are defined as above.
Remark 2. Here we can easily show that for r1 ¼ 0, the local stability condition, given in (14) is automatically satisfied. Thisimplies that the growth rate of carriers due to human-related activities has destabilizing effect on the system. This result issimilar as obtained by Singh et al. [23].
4.2. Local stability analysis with delay (i.e. s – 0)
In this section, we analyze our model system (2) with delay, i.e., we assume that s – 0. We also derive the stability con-ditions for the equilibrium E1 and explore the possibility of Hopf-bifurcation.
Now linearizing the model system (2) about E1ðY�;N�;C�;C�hÞ by using the following transformations:Y ¼ Y� þ y;N ¼ N� þ n; C ¼ C� þ c; Ch ¼ C�h þ ch, where y, n; c and ch are small perturbations.The linearized system around the equilibrium E1ðY�;N�;C�;C�hÞ is given by:
dyðtÞdt¼ �ðkC� þ mþ aþ dÞyðtÞ þ kC�nðtÞ þ kðN� � Y�ÞcðtÞ;
dnðtÞdt¼ �ayðtÞ � dnðtÞ;
dcðtÞdt¼ r1C�nðtÞ � rC�
KcðtÞ � h2C�chðtÞ; ð15Þ
dchðtÞdt
¼ �h1C�hcðtÞ � ðh0 þ h1C�ÞchðtÞ þ hcðt � sÞ:
The characteristic equation for the system (15) is given by the following equation
PðwÞ þ QðwÞe�ws ¼ 0; ð16Þ
where PðwÞ ¼ w4 þ A1w3 þ A2w
2 þ A3wþ A4 and QðwÞ ¼ B1w2 þ B2wþ B3.
In the above expressions of PðwÞ and QðwÞ; Ai’s and Bi’s are given as follows:
A1 ¼ a�1 þ dþ a�2 þ a�3;
A2 ¼ ða�1 þ dÞða�2 þ a�3Þ þ a�1dþ a�2a�3 � h1h2C�C�h þ akC�;
A3 ¼ akC�ða�2 þ a�3Þ þ a�1dða�2 þ a�3Þ þ kr1aC�ðN� � Y�Þ þ ða�1 þ dÞða�2a�3 � h1h2C�C�hÞ;A4 ¼ ða�1dþ akC�Þða�2a�3 � h1h2C�C�hÞ þ a�3r1kaC�ðN� � Y�Þ;B1 ¼ hh2C�;B2 ¼ hh2C�ða�1 þ dÞ;B3 ¼ hh2C�ða�1dþ akC�Þ:
cite this article in press as: A.K. Misra et al., Modeling the effect of time delay in controlling the carrier dependent infectious diseaselera, Appl. Math. Comput. (2012), http://dx.doi.org/10.1016/j.amc.2012.04.085

6 A.K. Misra et al. / Applied Mathematics and Computation xxx (2012) xxx–xxx
To show the Hopf-bifurcation, we must have a pair of purely imaginary roots of characteristic Eq. (16). For this substitutingw ¼ ixðx > 0Þ into Eq. (16) and separating real and imaginary parts, we get the following transcendental equations
Please– Cho
x4 � A2x2 þ A4 ¼ �½ðB3 � B1x2Þ cos xsþ B2x sin xs� ð17Þ
and
�A3xþ A1x3 ¼ B2x cos xs� ðB3 � B1x2Þ sin xs: ð18Þ
Now squaring and adding Eqs. (17) and (18) we get the following equation in x,
ðx4 � A2x2 þ A4Þ2 þ ð�A3xþ A1x3Þ2 ¼ ðB3 � B1x2Þ2 þ ðB2xÞ2: ð19Þ
Substituting x2 ¼ g in above Eq. (19), we get the following equation in g
ðg2 � A2gþ A4Þ2 þ gðA1g� A3Þ2 ¼ ðB3 � B1gÞ2 þ B22g: ð20Þ
The above equation may be rewritten as follows
hðgÞ ¼ g4 þ D1g3 þ D2g2 þ D3gþ D4 ¼ 0; ð21Þ
where
D1 ¼ A21 � 2A2; D2 ¼ A2
2 þ 2A4 � 2A1A3 � B21;
D3 ¼ A23 � 2A2A4 þ 2B1B2 � B2
2 and D4 ¼ A24 � B2
3:
Now if the coefficients in hðgÞ satisfy the conditions of Routh–Hurwitz criterion, then Eq. (21) will not have any positive realroot, thus we may not get any positive value of x, which satisfy the transcendental Eqs. (17) and (18). In this case the resultmay be written in the form of following theorem:
Theorem 2. If the coefficients in hðgÞ (i.e. Di’s) satisfy the conditions ofRouth–Hurwitz criterion, then the endemic equilibrium E1
of model system (2) is locally asymptotically stable for all delay s > 0 provided it is locally asymptotically stable in absence ofdelay.
Assuming contrary that the values of Di’s; ði ¼ 1;2;3;4Þ in Eq. (21) do not satisfy the Routh–Hurwitz criterion. In this casea simple assumption for the existence of a positive root of Eq. (21) is D4 < 0, which gives
A4 � B3 < 0: ð22Þ
Now if condition (22) holds, then Eq. (21) has a positive root g0, and Eq. (16) has a pair of purely imaginary roots of the form�ix0. From transcendental Eqs. (17) and (18), we may obtain
tan xs ¼ B2x0ðx40 � A2x2
0 þ A4Þ þx0ðA1x20 � A3ÞðB3 � B1x2
0ÞðB3 � B1x2
0Þðx40 � A2x2
0 þ A4Þ � B2x20ðA1x2
0 � A3Þ: ð23Þ
Now sk corresponding to this positive value of x0 is given as follows
sk ¼kpx0þ 1
x0arctan
B2x0ðx40 � A2x2
0 þ A4Þ þx0ðA1x20 � A3ÞðB3 � B1x2
0ÞðB3 � B1x2
0Þðx40 � A2x2
0 þ A4Þ � B2x20ðA1x2
0 � A3Þ; ð24Þ
where k ¼ 0;1;2;3; . . .
By using Butler’s lemma [31], we can say that the endemic equilibrium of model system (2) remains stable for s < s0.Now we investigate whether there is a phenomenon of Hopf-bifurcation as s increases through s0. For this we will make
use of the following lemma.
Lemma 1. The following transversality condition is satisfied:
sgndðReðwÞÞ
ds
� s¼s0
> 0: ð25Þ
Proof. Differentiating Eq. (16) with respect to s, we get
dwds
� ��1
¼ ð4w3 þ 3A1w2 þ 2A2wþ A3Þ þ ð2B1wþ B2Þe�ws
wðB1w2 þ B2wþ B3Þe�ws
� sw
¼ 4w3 þ 3A1w2 þ 2A2wþ A3
wðB1w2 þ B2wþ B3Þe�ws
þ 2B1wþ B2
wðB1w2 þ B2wþ B3Þ
� sw: ð26Þ
cite this article in press as: A.K. Misra et al., Modeling the effect of time delay in controlling the carrier dependent infectious diseaselera, Appl. Math. Comput. (2012), http://dx.doi.org/10.1016/j.amc.2012.04.085

A.K. Misra et al. / Applied Mathematics and Computation xxx (2012) xxx–xxx 7
Now using Eqs. (16)–(18) in above Eq. (26) and after a simple algebraic manipulation, we get
Please– Cho
dðReðwÞÞds
� �1
w¼ix0
¼ Redwds
� ��1" #
w¼ix0
¼ 4x60 þ 3D1x4
0 þ 2D2x20 þ D3
K¼ h0ðx2
0ÞK
: ð27Þ
where K ¼ B2x20 þ ðB3 � B1x2
0Þ2 ¼ ðA3 � A1x2
0Þx20 þ ðx4
0 � A2x20 þ A4Þ2. Here it may be noted that h0ðx2
0Þ > 0, if the condition(22) is satisfied. This proves the Lemma 1. Thus the results obtained are stated in the form of following theorem. h
Theorem 3. If the condition (22) is satisfied then the endemic equilibrium E1 of model system (2) is locally asymptotically stablefor s < s0 and becomes unstable for s > s0. The condition for Hopf-bifurcation is also satisfied yielding the required periodic solu-tions from the endemic equilibrium E1 as s passes through s0, i.e. Hopf-bifurcation occurs at s ¼ s0 [32].
5. Numerical simulation
In the previous sections, we have presented qualitative analysis of the model system (2) and obtained some results aboutthe stability of disease-free equilibrium and endemic equilibrium of the system. In this section, we present a numerical sim-ulation of the model system (2) using MATLAB 7.0.1. For numerical simulation, we choose the following set of parametervalues in model system (2).
A ¼ 100; k ¼ 0:00002; m ¼ 0:02; a ¼ 0:2; d ¼ 0:01; r ¼ 0:065; s1 ¼ 0:00001;r1 ¼ 0:00002; K ¼ 2000; h ¼ 0:04; h0 ¼ 0:02; h1 ¼ 0:00002; h2 ¼ 0:0002:
We have chosen above parameter values to illustrate the validity of theoretical results for Hopf-bifurcation rather than asan application to a specific region of cholera disease.
0 200 400 600100
150
200
250
300
Time (t)
Infe
ctiv
e Po
pula
tion
Y(t)
0 200 400 6003000
4000
5000
6000
Time (t)
Tota
l Pop
ulat
ion
N(t)
0 200 400 600300
400
500
600
700
Time (t)
Car
rier P
opul
atio
n C
(t)
0 200 400 600400
500
600
700
800
Time (t)
Con
cent
ratio
n of
Inse
ctic
ide
Ch(
t)
Fig. 2. Variation of Y ;N;C and Ch with respect to time t in absence of delay.
cite this article in press as: A.K. Misra et al., Modeling the effect of time delay in controlling the carrier dependent infectious diseaselera, Appl. Math. Comput. (2012), http://dx.doi.org/10.1016/j.amc.2012.04.085

8 A.K. Misra et al. / Applied Mathematics and Computation xxx (2012) xxx–xxx
The equilibrium values in the endemic equilibrium E1 for this data are obtained as
Please– Cho
Y� ¼ 245:93; N� ¼ 5081:50; C� ¼ 584:86; C�h ¼ 738:06:
For s ¼ 0, the eigenvalues of the variational matrix corresponding to the equilibrium E1 for the model system (2) are�0.0236, �0.2356, �0.0215 �0.0621 i and �0.0215 +0.0621 i. We note that two eigenvalues of variational matrix M1 arenegative whereas the remaining two eigenvalues are with negative real part. Hence, the endemic equilibrium E1 is locallyasymptotically stable in absence of delay (i.e. s ¼ 0).
For non-delay model, the variation of infective population YðtÞ, total population NðtÞ, density of carrier population CðtÞand concentration of insecticides ChðtÞ with respect to time t is presented in Fig. 2. From this figure, it is clear that all thevariables are approaching to their equilibrium values as time approaches infinity, which shows the stability of endemic equi-librium E1 of model system (2).
Further, it may be noted that for the above set of parameter values, the condition (22) for existence of a pair of purelyimaginary roots of characteristic Eq. (16) is also satisfied. The numerical value of s0, computed using Eq. (24), is found tobe 10.
Now applying Theorem 3, we can say that the endemic equilibrium E1 of model system (2) is stable for s < 10 and unsta-ble for s > 10. This result has been shown in Figs. 3 and 4, for s ¼ 8 and s ¼ 13 respectively. From Fig. 3, it is clear that all thevariables are approaching to their equilibrium values, showing the stability of endemic equilibrium E1 for s < s0. However,from Fig. 4, we may note that the behavior of all the variables is oscillatory, this implies that the endemic equilibrium E1 isunstable for s > s0.
The nonlinear stability results for the above set of data in Y � Ch plane and C � Ch plane of model system (2) for s ¼ 8 ands ¼ 13 are presented in Figs. 5 and 6 respectively. In Fig. 5, we can see that solution trajectories are reaching to their equi-librium values, which shows that the endemic equilibria E1 is nonlinearly stable in Y � Ch plane and C � Ch plane for s ¼ 8.However, in Fig. 6, it can be seen that the solution trajectories are moving away from the equilibrium values and forming alimit cycle. This implies that the endemic equilibrium is unstable for s ¼ 13.
0 1000 2000 3000100
200
300
400
Time (t)
Infe
ctiv
e Po
pula
tion
Y(t)
0 1000 2000 30003500
4000
4500
5000
5500
Time (t)
Tota
l Pop
ulat
ion
N(t)
0 1000 2000 3000200
400
600
800
1000
Time (t)
Car
rier P
opul
atio
n C
(t)
0 1000 2000 3000400
600
800
1000
Time (t)
Con
cent
ratio
n of
Inse
ctic
ide
Ch(
t)
Fig. 3. Variation of Y;N;C and Ch with respect to time t for s ¼ 8.
cite this article in press as: A.K. Misra et al., Modeling the effect of time delay in controlling the carrier dependent infectious diseaselera, Appl. Math. Comput. (2012), http://dx.doi.org/10.1016/j.amc.2012.04.085

0 1000 2000 30000
500
1000
1500
Time (t)
Infe
ctiv
e Po
pula
tion
Y(t)
0 1000 2000 30002000
4000
6000
8000
Time (t)
Tota
l Pop
ulat
ion
N(t)
0 1000 2000 30000
1000
2000
3000
4000
Time (t)
Car
rier P
opul
atio
n C
(t)
0 1000 2000 30000
500
1000
1500
2000
Time (t)
Con
cent
ratio
n of
Inse
ctic
ide
Ch(
t)
Fig. 4. Variation of Y ;N;C and Ch with respect to time t for s ¼ 13.
0 100 200 300 400 500450
500
550
600
650
700
750
800
850
900
950
Infective Population Y(t)
Con
cent
ratio
n of
Inse
ctic
ide
Ch(
t)
0 500 1000450
500
550
600
650
700
750
800
850
900
950
Carrier Population C(t)
Con
cent
ratio
n of
Inse
ctic
ide
Ch(
t)
Fig. 5. Nonlinear stability in Y � Ch plane and C � Ch plane for s ¼ 8.
A.K. Misra et al. / Applied Mathematics and Computation xxx (2012) xxx–xxx 9
Please cite this article in press as: A.K. Misra et al., Modeling the effect of time delay in controlling the carrier dependent infectious disease– Cholera, Appl. Math. Comput. (2012), http://dx.doi.org/10.1016/j.amc.2012.04.085

0 500 1000 1500200
400
600
800
1000
1200
1400
1600
1800
Infective Population Y(t)
Con
cent
ratio
n of
Inse
ctic
ide
Ch(
t)
0 2000 4000200
400
600
800
1000
1200
1400
1600
1800
Carrier Population C(t)C
once
ntra
tion
of In
sect
icid
e C
h(t)
Fig. 6. Limit cycle in Y � Ch plane and C � Ch plane for s ¼ 13.
10 A.K. Misra et al. / Applied Mathematics and Computation xxx (2012) xxx–xxx
The epidemiological meaning of the above discussion is that if the measured data for the density of carriers is older thans0 time then the number of infective will fluctuate and in this case one cannot predict the size and severity of cholera epi-demic. If one wants to predict the size of cholera epidemic then the measured density of carrier population should not beolder than s0 time.
6. Conclusions
In this paper, a nonlinear delay mathematical model for the control of cholera disease, using insecticides to control thegrowth of carriers in the environment, is proposed and analyzed. The model exhibits two equilibria, namely disease-freeequilibrium (DFE) and endemic equilibrium. The DFE exists without any condition however the endemic equilibrium existswhenever DFE is unstable. In the absence of delay (i.e. s ¼ 0), the endemic equilibrium, if exists, is locally asymptoticallystable under condition stated in Theorem 1. It is found that the growth rate of carrier population due to human-related activ-ities has destabilizing effect on the system. The analysis of the model shows that the density of carrier population decreasesas the rate of spray of insecticides increases, which leads to reduction in the number of cholera infectives. We have deter-mined the conditions for Hopf-bifurcation using time delay as a bifurcation parameter. It is shown that stability of endemicequilibrium does not change when time delay is suitably small, while a loss of stability by a Hopf-bifurcation can occur as thedelay crosses some critical value s0. This critical value of s0 has been obtained analytically and is given by Eq. (24). In termsof epidemiology, Hopf-bifurcation analysis suggests that cholera disease may be controlled by spraying insecticides in theenvironment but a longer delay (more than s0) in spraying it may lead to difficulty in controlling the disease. In the lattercase, sometimes the number of infectives will be low and sometimes their number may be higher. These fluctuations in thenumber of infectives will make it difficult to predict the future course of epidemic.
Acknowledgments
Authors are thankful to the reviewer for his/her comments which have improved the presentation of the manuscript. Thefirst author is also thankful to the DST Centre for Interdisciplinary Mathematical Sciences B.H.U. Varanasi and research schol-ars Anupama Sharma and Vishal Singh, Department of Mathematics, B.H.U. Varanasi for their help and support. AKM andSNM are also thankful to Prof. Peeyush Chandra, IIT Kanpur for his valuable discussion on this research.
References
[1] R. Suzita, A.S. Abdulamir, F.A. Bakar, R. Son, A mini review: cholera outbreak via Shellfish, Am. J. Infect. Dis. 5 (1) (2009) 40–47.[2] J. Sepulveda, J.L. Valdespino, L. Garcia-Garci, Cholera in Mexico: the paradoxical benefits of the last pandemic, Int. J. Infect. Dis. 10 (2006) 4–13.[3] H.K. Khuntia, S.K. Samal, S.K. Kar, B.B. Pal, An Ogawa cholera outbreak 6 months after the Inaba cholera outbreaks in India, 2006, J. Microbiol. Immunol.
Infect. 43 (2) (2010) 133–137.[4] D. Cohen, M. Green, C. Block, R. Dlepon, R. Ambar, S.S. Wasserman, M.M. Levine, Reduction of transmission of shigellosis by control of houseflies (Musca
domestica), Lancet 337 (1991) 993–997.
Please cite this article in press as: A.K. Misra et al., Modeling the effect of time delay in controlling the carrier dependent infectious disease– Cholera, Appl. Math. Comput. (2012), http://dx.doi.org/10.1016/j.amc.2012.04.085
A.K. Misra et al. / Applied Mathematics and Computation xxx (2012) xxx–xxx 11
[5] O.S. Levine, M.M. Levine, Houseflies (Musca domestica) as mechanical vectors of shigellosis, Rev. Infect. Dis. 13 (4) (1990) 688–696.[6] R. Fotedar, U. Banerjee, J.C. Samantray, Shriniwas, Vector potential of hospital houseflies with special reference to Klebsiella species, Epidemiol. Infect.
109 (1992) 143–147.[7] S. Sulaiman, A.R. Sohadi, H. Yunus, R. Iberahim, The role of some cyclorrhaphan flies as carriers of human helminthes in Malaysia, Med. Vet. Entomol. 2
(1988) 1–6.[8] A.R. Olsen, Regulatory action criteria for filth and other extraneous materials. III. Review of flies and foodborne enteric diseases, Regulatory Toxicol.
Pharmacol. 28 (1998) 199–211.[9] F.B. Osei, A.A. Duker, Spatial dependency of V. cholera prevalence on open space refuse dumps in Kumasi, Ghana: a spatial statistical modelling, Int. J.
Health Geogr. 7 (2008) 62–79.[10] T.K. Graczyk, R. Knight, R.H. Gilman, M.R. Cranfield, The role of non-biting flies in the epidemiology of human infectious diseases, Int. J. Health Geogr. 3
(2001) 231–235.[11] B. Greenberg, Flies and Disease. II., Biology and Disease Transmission, 15, Princeton University Press, Princeton, NJ, 1973.[12] P. Das, D. Mukherjee, A.K. Sarkar, Study of carrier dependent infectious disease-cholera, J. Biol. Sys. 13 (3) (2005) 233–244.[13] A. Shangbing, Global stability of equilibria in a tick-borne disease model, Math. Biosc. Eng. 4 (4) (2007) 567–572.[14] S. Cairncross, R.G. Feachem, Environmental Health Engineering with Tropics, John Wiley, New York, 1983.[15] K.L. Cooke, Stability analysis for a vector disease model, Rocky Mt. J. Math. 9 (1979) 31–42.[16] L. Esteva, M. Matias, A model for vector transmitted diseases with saturation incidence, J. Biol. Sys. 9 (4) (2001) 235–245.[17] M. Ghosh, P. Chandra, P. Sinha, J.B. Shukla, Modeling the spread of bacterial disease: effect of service providers from an environmentally degraded
region, Appl. Math. Comput. 160 (2005) 615–647.[18] S. Singh, J.B. Shukla, P. Chandra, Modeling and analysis of the spread of malaria: environmental and ecological effects, J. Biol. Sys. 13 (1) (2005) 1–11.[19] H.W. Hethcote, Qualitative analysis of communicable disease models, Math. Biosci. 28 (1976) 335–356.[20] J.B. Shukla, V. Singh, A.K. Misra, Modeling the spread of an infectious disease with bacteria and carriers in the environment, Nonlinear Anal. RWA. 12
(5) (2011) 2541–2551.[21] M. Ghosh, J.B. Shukla, P. Chandra, P. Sinha, An epidemiological model for carrier dependent infectious diseases with environmental effect, Int. J. Appl.
Sci. Comput. 7 (2000) 188–204.[22] M. Ghosh, P. Chandra, P. Sinha, J.B. Shukla, Modeling the spread of carrier-dependent infectious diseases with environmental effect, Appl. Math.
Comput. 152 (2004) 385–402.[23] S. Singh, P. Chandra, J.B. Shukla, Modeling and analysis of the spread of carrier dependent infectious diseases with environmental effects, J. Biol. Sys. 11
(3) (2003) 325–335.[24] C.T. Codeco, Endemic and epidemic dynamics of cholera: the role of the aquatic reservoir, BMC Infect. Dis. 1 (1), (2001) 1–14.[25] N.H. Gazi, K. Das, Z. Mukandavire, C. Chiyaka, P. Das, A study of cholera model with environmental fluctuations, Int. J. Math. Model Methods Appl. Sci. 4
(3) (2010) 150–155.[26] A.K. Misra, V. Singh, A delay mathematical model for the spread and control of water borne diseases, J. Theor. Biol. 301 (2012) 49–56.[27] R. Naresh, S. Pandey, A.K. Misra, Analysis of a vaccination model for carrier dependent infectious diseases with environmental effects, Nonlinear Anal.
Model. Control 13 (3) (2008) 331–350.[28] R. Pollitzer, Cholera studies: prevention and control, Bull. Wld. Hlth. Org. 17 (1957) 67–162.[29] Cholera symptoms, causes, and treatment, <http://www.medicinenet.com/cholera/article.htm>[30] H.I. Freedman, J.W.H. So, Global stability and persistence of simple food chains, Math. Biosci. 76 (1985) 69–86.[31] H.I. Freedman, V.S.H. Rao, The trade-off between mutual interference and time lags in predator–prey systems, Bull. Math. Biol. 45 (1983) 991–1004.[32] K. Gopalsamy, Stability and Oscillations in Delay Differential Equations of Population Dynamics, Mathematics and its Applications, 74, Kluwer
Academic Pub., Dordrecht, 1992.
Please cite this article in press as: A.K. Misra et al., Modeling the effect of time delay in controlling the carrier dependent infectious disease– Cholera, Appl. Math. Comput. (2012), http://dx.doi.org/10.1016/j.amc.2012.04.085
Copyright © 2022 FDOKUMEN