"Ottoman Ambitions on Tripoli and Lybia in the First Half of the XVI Century", 3. Cilt, s. 217-228.
Upload
khangminh22Category
view
3download
0
KONGSBERG PROPRIETARY: This document contains KONGSBERG information which is proprietary and confidential. Any disclosure, copying, distribution or
use is prohibited if not otherwise explicitly agreed with KONGSBERG in writing. Any authorised reproduction in whole or in pa rt, must include this legend.
© 2019 KONGSBERG – All rights reserved.
Gyrid Skalleberg Ingerø,
Group CFO KONGSBERG GRUPPEN ASA
24/09/2019
AMBITIONS

KONGSBERG PROPRIETARY - See Statement of Proprietary informationWORLD CLASS – Through people, technology and dedication
DISCLAIMER
This presentation contains certain forward-looking information and statements. Such forward-looking information and statements are based on the current, estimates and projections of the Company or assumptions based on information currently available to the Company. Such forward-looking information and statements reflect current views with respect to future events and are subject to risks, uncertainties and assumptions. The Company cannot give assurance to the correctness of such information and statements. These forward-looking information and statements can generally be identified by the fact that they do not relate only to historical or current facts. Forward-looking statements sometimes use terminology such as "targets", "believes", "expects", "aims", "assumes", "intends", "plans", "seeks", "will", "may", "anticipates", "would", "could", "continues", "estimate", "milestone" or other words of similar meaning and similar expressions or the negatives thereof.
By their nature, forward-looking information and statements involve known and unknown risks, uncertainties and other important factors that could cause the actual results, performance or achievements of the Company to differ materially from any future results, performance or achievements that may be expressed or implied by the forward-looking information and statements in this presentation. Should one or more of these risks or uncertainties materialize, or should any underlying assumptions prove to be incorrect, the Company's actual financial condition or results of operations could differ materially from that or those described herein as anticipated, believed, estimated or expected.
Any forward-looking information or statements in this presentation speak only as at the date of this presentation. Except as required by the Oslo Stock Exchange rules or applicable law, the Company does not intend, and expressly disclaims any obligation or undertaking, to publicly update, correct or revise any of the information included in this presentation, including forward-looking information and statements, whether to reflect changes in the Company's expectations with regard thereto or as a result of new information, future events, changes in conditions or circumstances or otherwise on which any statement in this presentation is based.
Given the aforementioned uncertainties, prospective investors are cautioned not to place undue reliance on any of these forward-looking statements.
2

KONGSBERG PROPRIETARY - See Statement of Proprietary informationWORLD CLASS – Through people, technology and dedication
Key drivers for value creation
3
ONE KONGSBERG TECHNOLOGY
POWER HOUSE
CAPITAL ALLOCATION
SUSTAINABLEGROWTH
IMPROVE PROFITABILITY
HARVEST TECHNOLOGY SYNERGIES ACROSS
GROUP
SOLID BALANCE SHEET.INVEST FOR ORGANIC
GROWTH
SHAREHOLDER RETURN
GROW AT OR ABOVE MARKET
BNOK >30 IN 2022
INCREASED PROFITABILITY
EBITDA-MARGIN>12 %* IN 2022
*) Excluding IFRS 16

KONGSBERG PROPRIETARY - See Statement of Proprietary informationWORLD CLASS – Through people, technology and dedication
Revenues (MNOK)
Improving revenue trend
7 2798 148
9 568 10 1978 597
7 429 7 544 8 102
7 3476 834
5 7425 798
6 316
6 333 6 1046 276
2 029
20132012
15 601
17 032
2014 20172015
722
20182016
690 637754
LTM Q2 2019
16 323 16 61315 845
14 490 14 380
17 171
-11% +5%
Commercial Marine*
Kongsberg Defence & Aerospace
Kongsberg Digital
Other / Elim.
Kongsberg Maritime
Growth excl. CM*▪ 2012-2014
‒ Strong growth from overheated offshore market
‒ Declining defence revenues due to falling CROWS volumes
▪ 2015-2018
‒ Stop in offshore contracting led to 25+ % decline in KM
‒ Defence relatively stable
▪ 2019➔
‒ Added revenues from Commercial Marine
‒ Some growth in “old” KM
‒ Ramp up from recent order intake in KDA
4

KONGSBERG PROPRIETARY - See Statement of Proprietary informationWORLD CLASS – Through people, technology and dedication
Commercial Marine weighing on improving margins
▪ 2012-2014
‒ Hot offshore market founding strong profitability
‒ Drop in defence margins due to decline in Remote Weapon Station (CROWS) volumes
▪ 2015-2018
‒ KM margins challenged by declining volumes and price pressure
‒ Defence impacted by restructuring in 2017
▪ 2019➔
‒ Integration of Commercial Marine affects margins
‒ Improvement in “old” KM
‒ Defence relatively stable
5
EBITDA-Margin*
9,2 %
6,5 %
14,0 %
0%
2%
4%
6%
8%
10%
12%
14%
16%
18%
2012 2013 2014 2015 2016 2017 2018 LTM Q22019
KONGSBERG Kongsberg Maritime Kongsberg Defence & Aerospace
*) Excluding IFRS 16

KONGSBERG PROPRIETARY - See Statement of Proprietary informationWORLD CLASS – Through people, technology and dedication
Steady EPS-contribution from KDA, KM fluctuates
▪ KDA proving a stable foundation
▪ KM market more cyclical
▪ Equity rights issue in 2018 diluting EPS until Commercial Marine turn-around materialize
*The graph illustrates each business unit’s contribution to EPS. Actual contribution may deviate.
EPS
Earnings Per Share (NOK)*
6
-6
-1
4
9
14
2012 2013 2014 2015 2016 2017 2018 LTM Q22019
Kongsberg Maritime Kongsberg Defence & Aerospace
Other / Elim. KONGSBERG

KONGSBERG PROPRIETARY - See Statement of Proprietary informationWORLD CLASS – Through people, technology and dedication
Key drivers for value creation
7
ONE KONGSBERG TECHNOLOGY
POWER HOUSE
CAPITAL ALLOCATION
SUSTAINABLEGROWTH
IMPROVE PROFITABILITY
HARVEST TECHNOLOGY SYNERGIES ACROSS
GROUP
SOLID BALANCE SHEET.INVEST FOR ORGANIC
GROWTH
SHAREHOLDER RETURN
GROW AT OR ABOVE MARKET
BNOK >30 IN 2022
INCREASED PROFITABILITY
EBITDA-MARGIN>12 %* IN 2022
*) Excluding IFRS 16

KONGSBERG PROPRIETARY - See Statement of Proprietary informationWORLD CLASS – Through people, technology and dedication
1. Solid balance sheet
CAPITAL ALLOCATION
SOLID BALANCE SHEET.INVEST FOR ORGANIC
GROWTH
SHAREHOLDER RETURN
Our capital allocation priorities
8
2. Invest for organic growth
3. Shareholder remuneration
4. Portfolio management

KONGSBERG PROPRIETARY - See Statement of Proprietary informationWORLD CLASS – Through people, technology and dedication
Leverage ratio*
-0,5-0,9
-1,7
-0,5
1,8
0,3
-0,5 -0,1
-4,1
-4,2
-3,2
-2,2
-1,2
-0,2
0,8
1,8
2,8
2012 2013 2014 2015 2016 2017 2018 LTMQ2
2019
▪ Medium term target of Net debt/EBITDA of 1.0x +/- 1.0x▪ Securing investment grade credit rating equivalent and access to debt capital markets▪ Committed credit facility acting as a back-stop
Rationale for having a solid balance sheet
▪ Long-term view in strategy and execution ▪ Fluctuating working capital▪ Financial currency hedging policy
1. Access to funding
2. Customer confidence
3. Integration of recent acquisition
▪ The Commercial Marine business has been cash consuming▪ Uncertainty regarding timing of recovery in the offshore market
*Net Interest Bearing Debt / EBITDA, 2018 inclusive and exclusive BNOK 5 rights issue.
1. Solid balance sheet
9

KONGSBERG PROPRIETARY - See Statement of Proprietary informationWORLD CLASS – Through people, technology and dedication
Technology development securing our positionsSelf-funded R&D
▪ R&D - investing to secure #1 positions
‒ Self-funded R&D 5-6% of revenues
‒ In addition we benefit from customer funded R&D
▪ Prioritisation of R&D projects
*Sum of expensed and capitalized R&D (i.e. excluding product maintenance).
2. Invest for organic growth
R&D spending (MNOK)*
KM (in % of Rev.)*
R&D in % of Rev.*
KDA (in % of Rev.)*
10
496 514 550 556 602513 517 575
264 178208 195
328
200 140144
71115
136 97
126
136139
131
832 807894
849
1 056
849796
850
4,9 %
5,7 %
2,3 %
0%
1%
2%
3%
4%
5%
6%
7%
0
200
400
600
800
1 000
1 200
1 400
1 600
2012 2013 2014 2015 2016 2017 2018 LTM Q2 2019
Kongsberg Maritime* Kongsberg Defence & Aerospace* Other*

KONGSBERG PROPRIETARY - See Statement of Proprietary informationWORLD CLASS – Through people, technology and dedication
Capital expenditures (MNOK)
535
361 339373
641
346
230
312
3,4 %
2,2 %2,0 %
2,2 %
4,0 %
2,4 %
1,6 %
1,8 %
0%
1%
1%
2%
2%
3%
3%
4%
4%
5%
-
100
200
300
400
500
600
700
2012 2013 2014 2015 2016 2017 2018 LTM Q2 2019
Capex Capex in % of Revenue
InvestmentsCapital expenditures 2012-2018
▪ Investments ex. R&D averaging 2.6% of revenues
‒ Few production facilities requiring high investments
‒ Low level of machinery and equipment related to operations
‒ Production mainly performed by sub contractors
▪ Capex expected at 2-3% of revenues going forward
▪ Depreciation & amortisation going forward expected to be at ~same level as in Q2 2019
2. Invest for organic growth
11

KONGSBERG PROPRIETARY - See Statement of Proprietary informationWORLD CLASS – Through people, technology and dedication
Fluctuating working capital
▪ Net working capital has fluctuated significantly
‒ KDA: Mainly related to payment structure and project timeline within large projects
‒ KM: historically more stable at 15-20% of revenues. Targeting a lower range going forward
▪ Average historical negative working capital within KDA. Expected to fluctuate also going forward
2. Invest for organic growth
12
Net Working Capital – Kongsberg Maritime (MNOK)
Net Working Capital – Kongsberg Defence & Aerospace (MNOK)
1 415 1 562 1 665
2 263
1 6741 202
880
1 430
19,4 % 19,2 %17,4 %
22,2 %
19,5 %
16,2 %
11,7 %
8,7 %
0%
5%
10%
15%
20%
25%
0
500
1 000
1 500
2 000
2 500
2012 2013 2014 2015 2016 2017 2018 LTM Q2 2019
-349 -717-1 440
460 904
-97-726 -643
-4,8 % -10,5 %
-25,1 %
7,9 %14,3 %
-1,5 %
-11,9 % -10,2 %
-30%
-20%
-10%
0%
10%
20%
-1 800
-1 300
-800
-300
200
700
1 200
2012 2013 2014 2015 2016 2017 2018 LTM Q2 2019
Net Working Capital NWC in % of Revenues
*) Including pro forma CM
*

KONGSBERG PROPRIETARY - See Statement of Proprietary informationWORLD CLASS – Through people, technology and dedication
Dividends
Healthy shareholder remuneration
▪ Dividend policy of 40-50% of net income
‒ Actual pay-outs from 2013 above interval
‒ Evaluate special dividends or share buybacks as a supplement on a case-by-case basis
1 320
1 225
880
755
651
559
704
450
630
1 110
510450 450 45034%
51%
126%
68% 69%
81%
64%
0%
20%
40%
60%
80%
100%
120%
-
200
400
600
800
1 000
1 200
1 400
1 600
2012 2013 2014 2015 2016 2017 2018
Net Income Dividends Dividends in % of Net Income
DPS 3,75 5,25 9,25 4,25 3,75 3,75 2,50
13
3. Shareholder remuneration

KONGSBERG PROPRIETARY - See Statement of Proprietary informationWORLD CLASS – Through people, technology and dedication 14
▪ Support & develop Patria
▪ IntegrateCommercial Marine
▪ Integrate Kongsberg Aviation MaintenanceServices
Active management of business portfolio- Investments of 8 billion last 4 years
COMMERCIAL MARINE
KONGSBERG AVIATION
MAINTENANCE SERVICES
PATRIA
4. Portfolio management

KONGSBERG PROPRIETARY - See Statement of Proprietary informationWORLD CLASS – Through people, technology and dedication
Key drivers for value creation
15
ONE KONGSBERG TECHNOLOGY
POWER HOUSE
CAPITAL ALLOCATION
SUSTAINABLEGROWTH
IMPROVE PROFITABILITY
HARVEST TECHNOLOGY SYNERGIES ACROSS
GROUP
SOLID BALANCE SHEET.INVEST FOR ORGANIC
GROWTH
SHAREHOLDER RETURN
GROW AT OR ABOVE MARKET
BNOK >30 IN 2022
INCREASED PROFITABILITY
EBITDA-MARGIN>12 % IN 2022

KONGSBERG PROPRIETARY - See Statement of Proprietary informationWORLD CLASS – Through people, technology and dedication
Order intake and Revenues (MNOK)
Recent pick up in order intake founds growth
10.000
30.000
15.000
10.000
20.000
0
5.000
15.000
30.000
25.000
20.000
0
5.000
25.000
18.23815.845 14.380
15.238
16.613
15.04314.605
15.601
2012
16.323
20142013
22.097
17.032
2015 LTM JUL 2019
14.319
2016
13.430
14.490
2017
16.574
2018
27.807
RevenuesOrder intake
(2019)
(2020)
2020
JULY 2019
36%
29%
2021->
2019
33.095
34%
29%
2019
2020->
37%
JULY 2018
16.805
2018
BNOK 7 aftermarket in KM by large not reflected in backlog (annual basis)
16
Order backlog
35%
36%
29%

KONGSBERG PROPRIETARY - See Statement of Proprietary informationWORLD CLASS – Through people, technology and dedication
Order intake and Revenues - KM (MNOK)
Short- and long-term backlog improved in KM
17
Order backlog (KM)
0
5.000
10.000
15.000
11.140
8.4388.884
7.485
2012
7.3368.455
8.264
2013
9.804
9.568
2014 LTM JUL 2019
9.441
10.197
2015
7.940
8.597
2016
7.429
2017
7.545
2018
12.786*)
2.827
8.313
Order intake CMRevenues*)KM excl. CM: 9.575 MNOK
2021->
2020
15%
42%
43%
13.168
JULY 2019
2019 46%
2019
14% 2020->
40%
JULY 20182018
5.395
xCM: 6.973 MNOKxKM: 6.195 MNOK
▪ 7 BNOK aftermarket in KM by large not reflected in backlog (annual basis)
▪ Average lead-time from contract to revenues typically ranges from 3-15 months

KONGSBERG PROPRIETARY - See Statement of Proprietary informationWORLD CLASS – Through people, technology and dedication
Order intake and Revenues - KDA (MNOK)
KDA: Solid pick up in order intake, major improvement in backlog
18
Order backlog (KDA)
10.000
15.000
0
5.000
6.292
2018
9.018
LTM JUL 2019
3.514
4.654
2012
3.232
2016
4.554 4.276
2013 2014
6.333
4.754
5.798
2015
5.426
6.316
5.376
2017
6.885
6.104
14.110
Order intake Revenues
32%
50% 2021->
18%
JULY 2019
2020
2019
19.078
37%
36%
27% 2018
2019
JULY 2018
2020->
10.664
0%
10%
20%
30%
Average distribution (+/- 3 years) of revenues in major KDA contracts
30 1 2 54 6 7 8
Year
KONGSBERG PROPRIETARY - See Statement of Proprietary informationWORLD CLASS – Through people, technology and dedication
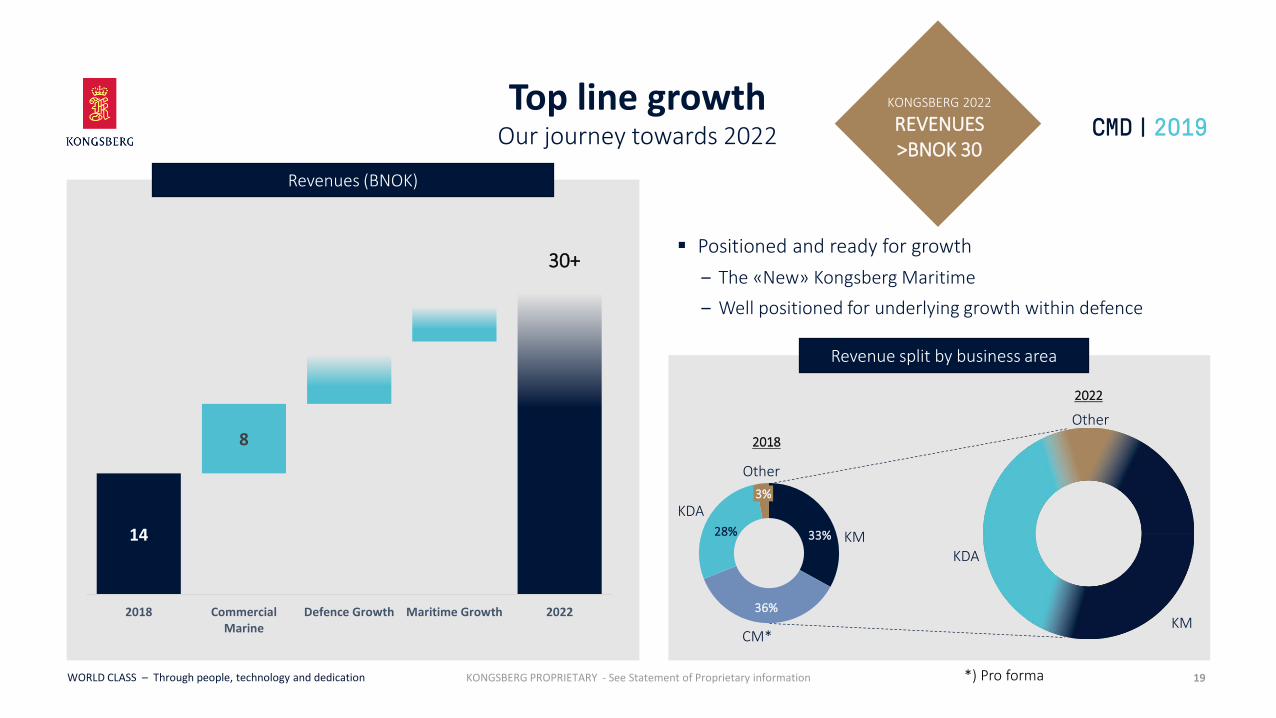
Revenues (BNOK)
Top line growth
19
Revenue split by business area
▪ Positioned and ready for growth
‒ The «New» Kongsberg Maritime
‒ Well positioned for underlying growth within defence
Our journey towards 2022
14
8
2018 CommercialMarine
Defence Growth Maritime Growth 2022
30+
KDA
KM
Other
33%
36%
28%
Other
KM
3%
CM*
KDA
2018
2022
KONGSBERG 2022
REVENUES>BNOK 30
*) Pro forma

KONGSBERG PROPRIETARY - See Statement of Proprietary informationWORLD CLASS – Through people, technology and dedication
Key drivers for value creation
20
ONE KONGSBERG TECHNOLOGY
POWER HOUSE
CAPITAL ALLOCATION
SUSTAINABLEGROWTH
IMPROVE PROFITABILITY
HARVEST TECHNOLOGY SYNERGIES ACROSS
GROUP
SOLID BALANCE SHEET.INVEST FOR ORGANIC
GROWTH
SHAREHOLDER RETURN
GROW AT OR ABOVE MARKET
BNOK >30 IN 2022
INCREASED PROFITABILITY
EBITDA-MARGIN>12 %* IN 2022
*) Excluding IFRS 16

KONGSBERG PROPRIETARY - See Statement of Proprietary informationWORLD CLASS – Through people, technology and dedication
KONGSBERG MARITIME
KONGSBERG DEFENCE & AEROSPACE
KONGSBERG DIGITAL
1. Deliver synergies
Deliver Commercial Marine
synergies
Capitalise on Kongsberg Aviation & Maintenance
Services and Patria in the Maintenance, Repairs and
Overhaul market
Capitalise on cross business
synergies
2. Increase profitability
Efficiency focus and
product harmonisationBenefits of scale Capitalise on innovations
3. GrowthIncrease market share and position for new markets
Secure new markets Turn recent investments into growing sales
Increased profitabilityOur journey towards 2022
21
KONGSBERG 2022
EBITDA-margin>12%*
*) Excluding IFRS 16

KONGSBERG PROPRIETARY - See Statement of Proprietary informationWORLD CLASS – Through people, technology and dedication
Profitability ambitions (excluding IFRS16)Our journey towards 2022
KONGSBERG MARITIME
EBITDA-margin
>11%KONGSBERG DEFENCE & AEROSPACE
EBITDA-margin
>14% KONGSBERG DIGITAL & OTHER
EBITDA-margin
>12%
KONGSBERG
EBITDA-margin
>12%
22
KONGSBERG 2022
EBITDA-margin>12%

KONGSBERG PROPRIETARY - See Statement of Proprietary informationWORLD CLASS – Through people, technology and dedication
IFRS16 adjustments
23
~450
~100
-~50
~350
~150
Depreciation leasing
EBITDA effect EBIT effect Interest leasing EBT effect
Est. full year effects from IFRS16 adjustments (MNOK)▪ EBITDA -and depreciation effects estimated
to be ~equal in the period towards 2022
▪ Effects from interest leasing will gradually decrease in the period, hence long term effect on EBT will be ~0 towards 2022

KONGSBERG PROPRIETARY - See Statement of Proprietary informationWORLD CLASS – Through people, technology and dedication
IFRS16 adjustments continueDepreciation per business area
24
~450
~100
~270
~120
~40
Other/EliminationsEBITDA effect Depreciation KM Depreciation KDA EBIT
Est. full year effects from IFRS16 adjustments (MNOK)
*Other includes Group, KDI, property and eliminations

KONGSBERG PROPRIETARY - See Statement of Proprietary informationWORLD CLASS – Through people, technology and dedication
Estimated tax impactEffective and payable tax rate until 2022
25
▪ Increased profits → Increased taxes → Accelerated use of tax positions
▪ KONGSBERG carries approx. BNOK 3.5 of losses carry forward
▪ Offshore taxes will not be impacted
Tax positions
▪ Improved cash flow as deferred tax assets are utilised
▪ Improvement to correlate with losses utilised multiplied by statutory rate.
Payabletaxes
▪ Approx. BNOK 2 of losses have not been capitalised in KONGSBERG
▪ Upon utilisation effective tax rate should come lower than statutory rate
Effectivetaxes

KONGSBERG PROPRIETARY - See Statement of Proprietary informationWORLD CLASS – Through people, technology and dedication
Average Capital Employed (MNOK) and ROACE (%)
Approaching turning point on ROACE
▪ Patria investment and Commercial Marine (CM) acquisition increasing capital employed.
‒ The turnaround of CM is in the early stages
26
4 7285 118
3 7504 010
7 821
8 565
7 567
9 240
39,2 %
32,4 %33,6 %
23,5 %
8,8 % 9,0 %
12,5 %11,0 %
0%
5%
10%
15%
20%
25%
30%
35%
40%
0
1 000
2 000
3 000
4 000
5 000
6 000
7 000
8 000
9 000
10 000
2012 2013 2014 2015 2016 2017 2018 LTM Q22019
Average Capital Employed ROACE

KONGSBERG PROPRIETARY - See Statement of Proprietary informationWORLD CLASS – Through people, technology and dedication
Roadmap 2019-2022
1. Solid balance sheet
2. Invest for organic growth
3. Shareholder remuneration
Man
age
the
curr
ent
&
inve
st fo
r th
e fu
ture
Improved profitabilitySolid growth
4. Portfolio management
Improved ROACE
39,2 %
32,4 %33,6 %
23,5 %
8,8 % 9,0 %
12,5 %11,0 %
0%
5%
10%
15%
20%
25%
30%
35%
40%
45%
2012 2013 2014 2015 2016 2017 2018 LTM Q22019
2019 2020 2021 2022
27

KONGSBERG PROPRIETARY - See Statement of Proprietary informationWORLD CLASS – Through people, technology and dedication
KONGSBERG has a solid basis for growth going forward
KONGSBERG 2022
KONGSBERG 2022
EBITDA-margin>12%*
KONGSBERG 2019-2022
40-50% of net profit
Revenues
Scale, synergies and improved efficiency ➔ improved profitability
Dividend policy 40-50%, special dividends and /or buy backs to be considered
Profitability
Shareholder return
>BNOK 30 revenues with solid improvement in profitability
KONGSBERG 2022
REVENUES>BNOK 30
28*) Excluding IFRS 16

KONGSBERG PROPRIETARY - See Statement of Proprietary information
Copyright © 2022 FDOKUMEN